taking the easy way out: how the ged testing program...
TRANSCRIPT
Taking the Easy Way Out: How the GED Testing
Program Induces Students to Drop Out
James J. Heckman1, Paul A. LaFontaine2 and Pedro L. Rodrıguez3
First draft, December 2007
Revised, May 12, 2008
1This research was supported by the American Bar Foundation, NIH R01-HD043411, theSpencer Foundation, the Mellon Foundation, the JB and MK Pritzker Family Foundation, andthe Buffett Early Childhood Fund at the Susan T. Buffett Foundation. We would like to thank theCalifornia Demographic Research unit for helpful assistance. The views expressed in this paper arethose of the authors and not necessarily those of the funders listed here. A web appendix is avail-able at http://jenni.uchicago.edu/GED_dropout/GED_incentives/. Contact: Department ofEconomics, University of Chicago, 1126 E. 59th Street, Chicago IL 60637. Tel: 773-702-0634; fax:773-702-8490. Email: [email protected].
2Contact: American Bar Foundation, 1155 E. 60th Street, Chicago IL 60637. Tel: (773) 702-3478. Email: [email protected].
3Contact: Center for Social Program Evaluation, Irving B. Harris School of Public Policy, 1155E. 60th Street, Chicago IL 60637. Phone: (773) 702-3478. Email: [email protected].
Abstract
We exploit an exogenous increase in General Educational Development (GED) testingrequirements to determine whether raising the difficulty of the test causes students to finishhigh school rather than drop out and GED certify. We find that a six point decrease inGED pass rates induces a 1.3 point decline in overall dropout rates. The effect size is alsomuch larger for older students and minorities. Finally, a natural experiment based on thelate introduction of the GED in California reveals, that adopting the program increased thedropout rate by 3 points more relative to other states during the mid-1970s.
JEL Code: C61
1

1 Introduction
Since the publication of A Nation at Risk in 1983, educational policy has shifted towards
establishing minimum competency tests and elevated high school graduation requirements.
One often-expressed fear is that higher requirements might cause more students to drop out
rather than graduate. Facing rising costs for obtaining a formal high school diploma, many
students may search for alternative methods to complete their secondary schooling.
One widely used alternative to graduation is General Educational Development (GED)
certification. GED credentials accounted for as many as 15-18% of all high school credentials
issued in the U.S. until the test was made harder in 2002 (see Figure 1). Table 1 describes
the five GED sub-tests. As currently configured, the GED is a 7 1/2 hour multiple choice
test that high school dropouts take to certify that they are the academic “equivalents” of
students who remain in high school and graduate. Obtaining a GED is much easier than
staying in school and graduating in the traditional fashion. The median preparation time
for the exam is only 20-30 hours and the focus is on general knowledge and not specific facts
learned in school (Malizio and Whitney, 1981). The test measures concepts at or below the
ninth grade level and, for many years, GED minimum passing scores on each sub-test were
set only slightly above what could be achieved by chance (Quinn, 2008).
This paper examines the effect of variation in GED passing standards on high school
dropping out and GED certification rates. Conditional on meeting certain age requirements,
GED certification offers the option of dropping out of high school and exam certifying rather
than graduating. In our main analysis, we exploit the timing of an exogenously mandated
change in GED passing standards in 1997 to explore the relationship between high school
continuation decisions and the relative cost of GED certification.
A large literature documents the low labor market returns to GED certification.1 Rela-
tively few papers have addressed whether the availability of the GED option might induce
some students to drop out of school rather than graduate. Only two papers provide empir-
1See, e.g., Cameron and Heckman (1993) and Heckman and LaFontaine (2006).
2

ical evidence on this question. Both Chaplin (1999) and Lillard (2001) estimate the effect
of the GED option on high school continuation and dropout rates by exploiting cross-state
variation in GED testing policies over time. Controlling for state, year and age fixed effects,
both authors find that many state GED policies are statistically significant predictors of
high school continuation rates. Policies that provide exemptions to age restrictions for GED
testing or that make the GED relatively more easy to pass are generally found to lower high
school continuation rates. States with lower GED requirements are also found to have higher
GED test-taking rates.
One potential problem with the identification strategies employed in previous studies is
that they assume that variation in the GED requirements are exogenously determined by
states. If states change GED requirements in response to changes in state-level dropout
rates, estimates will be biased.
We avoid this potential endogeneity problem by exploiting a natural experiment. In
1997, the GED Testing Service mandated that all states meet new minimum and mean
score requirements. The new passing requirement was set so that all GED candidates were
required to score a minimum of 40 on each test and a mean of 45 across all five tests in order
to obtain the credential. This national mandate forced some states to raise passing standards
while other states were unaffected. We exploit this variation in our estimation strategy. In
states that were required to raise standards, acquiring a GED credential suddenly became
more difficult. This change may cause some students at the margin of dropping out to stay
in school and graduate rather than pursue the now more costly GED option.
We find that students react strongly to changes in GED requirements. Difference-in-
difference estimates show that a 6 percentage point decrease in the probability of passing
the GED causes a statistically significant 1.3 percentage point decline in the overall dropout
rate. This translates into roughly 40,000 fewer dropouts per year for these cohorts. We
find even stronger effects for older students who are less restricted in their GED testing
and school leaving decisions. The percentage of students enrolled in 12th grade who do not
3
graduate declines by 3 points more in states that were required to raise GED requirements
relative to those that were not required to. As expected, students enrolled in lower grade
levels are largely unaffected due to age restrictions on GED testing and school leaving.
GED policy changes also have larger effects on minorities because at any grade they tend
to be older and hence less subject to minimum age requirements and further behind major-
ity students in meeting graduation requirements. The percentage of blacks and Hispanics
enrolled in 12th grade who fail to graduate decreases by 4.8 and 6.2 points respectively. By
comparison, the white dropout rate declines by 1.3 percentage points. This explains part of
the higher GED certification rates among minorities documented in Cameron and Heckman
(1993).
A natural experiment based on the introduction of the GED program in California pro-
duces an estimate of how much abolishing the GED program would raise graduation rates.
In 1974, California became the last state to award a high school equivalency diploma to
civilians who successfully passed the GED.2 Prior to establishing the GED, California had
statistically significantly higher graduation rates than the rest of the U.S. After adopting
the GED program, California graduation rate levels immediately fell to match those in other
states. While graduation rates also fell in the rest of the country, difference-in-difference
estimates show that high school graduation fell by 3 percentage points more in California
compared to the rest of the U.S. during this time.
Our overall findings agree qualitatively with those of previous studies in showing that the
GED induces youth out of school, but our estimated effect sizes are generally smaller. For
example, Lillard (2001) estimates that a change in requirements of the magnitude analyzed
in this paper would lower dropout rates by 1.9 points compared to our estimate of 1.3. This
suggests that previous estimates may be biased by potential endogeneity in the timing of
GED policy changes. Our finding that minorities and males are more strongly affected by
GED policy changes is new to the literature. We also provide the first empirical estimates
2Prior to 1974, the GED program in California was restricted to veterans and military personnel.
4

of the effect of completely eliminating the GED program on high school graduation rates.
This paper proceeds as follows. Section two presents evidence on the relationship between
GED policies and dropout rates. Section three discusses the 1997 GED policy change we
analyze and motivates our empirical analysis by examining GED testing and dropout trends
before and after the change. Section four presents a state level fixed effect model that
refines the difference-in-difference estimates of Section three. Section five presents empirical
estimates of the impact of the 1997 changes on dropout rates based on this model. Section six
estimates the effect of eliminating the GED program on dropout rates using the introduction
of the GED program in California as a natural experiment. Section seven concludes with a
discussion of our main findings and their implications for policy.
2 Preliminary Evidence on the Effects of GED Policies
and Incentives
Despite the lower level of academic preparation required, the GED Testing Service (GEDTS)
heavily promotes its credential as the equivalent of a traditional high school diploma (Quinn,
2008). As a result, GED credentials are perceived as an attractive alternative to graduating
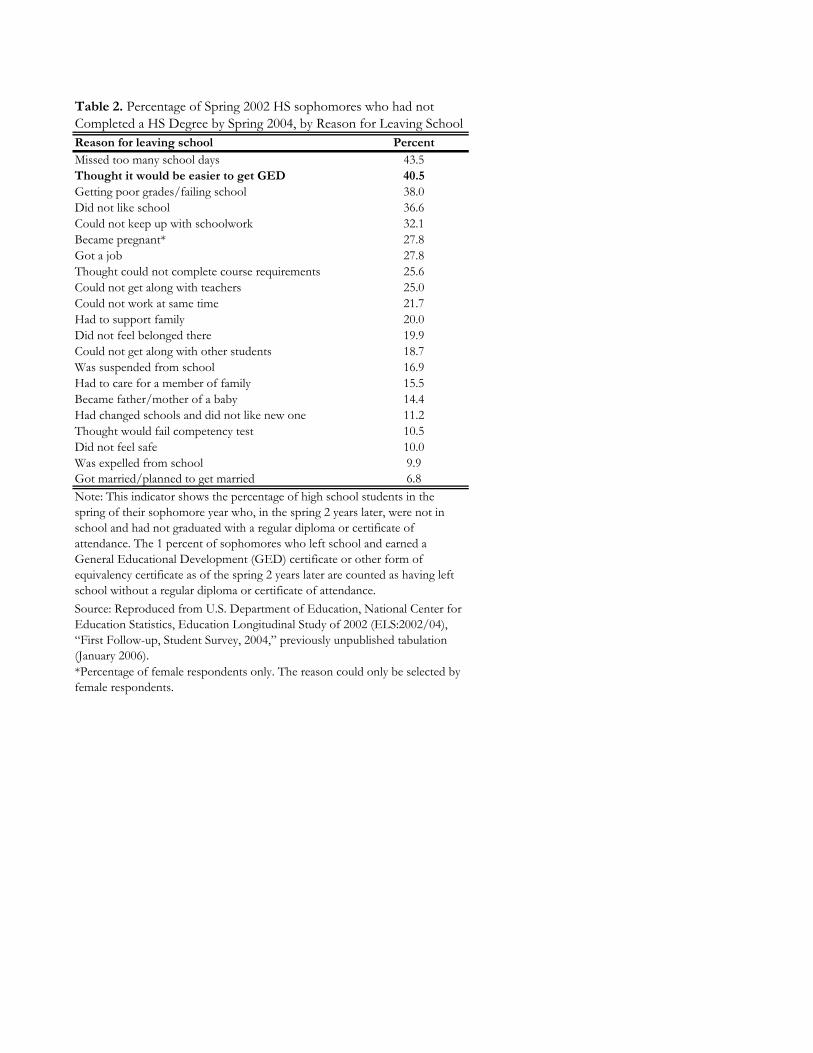
from high school by many students. Evidence on this point is provided by a recent NCES
study. The Education Longitudinal Study (ELS) follows a representative sample of 10th
graders enrolled in the spring of 2002 through graduation and beyond. In the spring of 2004,
the study asked those not enrolled in school who had not received a regular high school
diploma why they decided to drop out. See Table 2. Over 40% of dropouts stated that
they did not complete high school because they “thought it would be easier to get a GED.”
This was the second most cited reason behind “missed too many school days” (43.5%). It
also placed far above what are commonly believed to be primary reasons for dropping out
of school such as pregnancy (27.8%), work (27.8%) and marriage (6.8%).3
3Answers are not necessarily mutually exclusive and therefore percentages do not sum to one hundred.
5
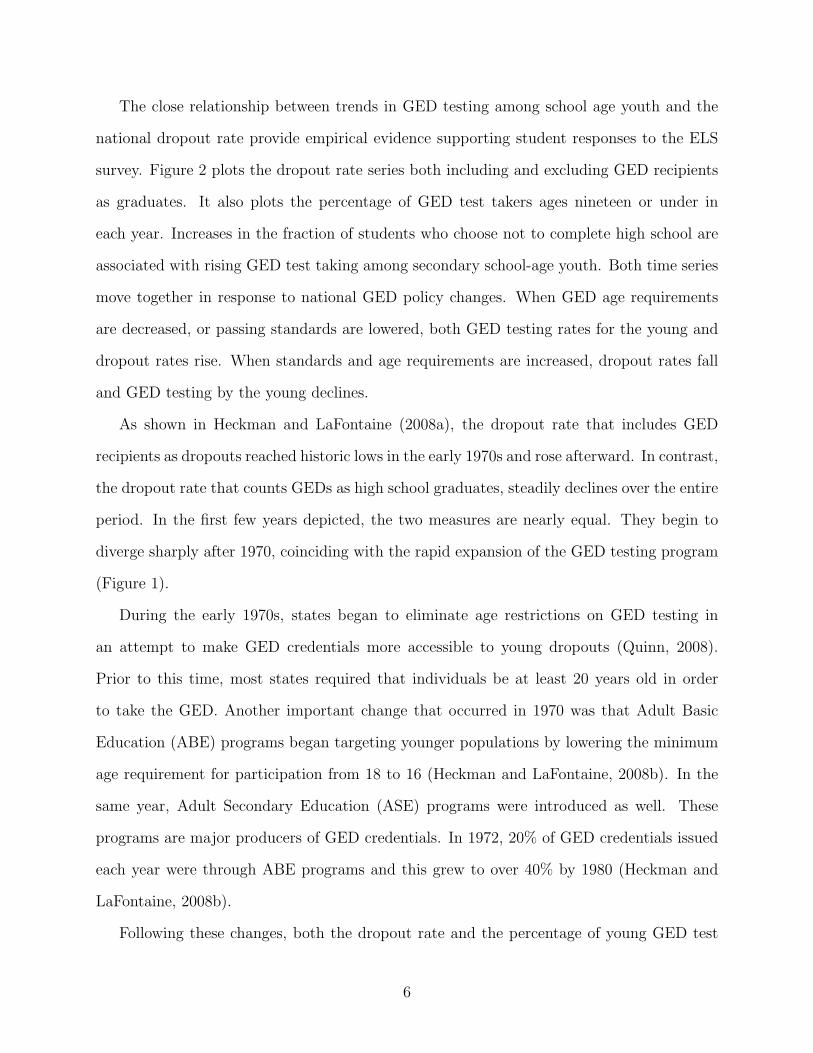
The close relationship between trends in GED testing among school age youth and the
national dropout rate provide empirical evidence supporting student responses to the ELS
survey. Figure 2 plots the dropout rate series both including and excluding GED recipients
as graduates. It also plots the percentage of GED test takers ages nineteen or under in
each year. Increases in the fraction of students who choose not to complete high school are
associated with rising GED test taking among secondary school-age youth. Both time series
move together in response to national GED policy changes. When GED age requirements
are decreased, or passing standards are lowered, both GED testing rates for the young and
dropout rates rise. When standards and age requirements are increased, dropout rates fall
and GED testing by the young declines.
As shown in Heckman and LaFontaine (2008a), the dropout rate that includes GED
recipients as dropouts reached historic lows in the early 1970s and rose afterward. In contrast,
the dropout rate that counts GEDs as high school graduates, steadily declines over the entire
period. In the first few years depicted, the two measures are nearly equal. They begin to
diverge sharply after 1970, coinciding with the rapid expansion of the GED testing program
(Figure 1).
During the early 1970s, states began to eliminate age restrictions on GED testing in
an attempt to make GED credentials more accessible to young dropouts (Quinn, 2008).
Prior to this time, most states required that individuals be at least 20 years old in order
to take the GED. Another important change that occurred in 1970 was that Adult Basic
Education (ABE) programs began targeting younger populations by lowering the minimum
age requirement for participation from 18 to 16 (Heckman and LaFontaine, 2008b). In the
same year, Adult Secondary Education (ASE) programs were introduced as well. These
programs are major producers of GED credentials. In 1972, 20% of GED credentials issued
each year were through ABE programs and this grew to over 40% by 1980 (Heckman and
LaFontaine, 2008b).
Following these changes, both the dropout rate and the percentage of young GED test
6

takers began to rise. While data on the percentage of test takers nineteen and under is not
available until 1974, Figure 3 shows that the average age of GED testing dropped precip-
itously in the early 70s. In 1970, the average GED test taker was 29 years old while only
three years later the average age declined to only 25.4 The average age has remained low
since then except for a sharp increase in 1974 that coincides with the introduction of Pell
grants financing higher education, which initially required at least a GED to qualify.5
Lowering age requirements made the GED an attractive option for dropouts. This evi-
dence does not answer the question of whether or not the GED induces students to drop out
of school. However, it is interesting to note that dropout rates increased the most during the
early 1970s and have never been as low as they were before age restrictions on GED testing
were removed.
3 1997 GED Policy Changes
Although the survey and time series evidence on the relationship between GED testing and
youth dropout behavior is strongly suggestive, it does not determine whether the observed
relationships are causal. To obtain parameter estimates with a causal interpretation, we
exploit exogenous variation in the difficulty of passing the GED arising from a nationally
mandated toughening of GED passing score requirements in 1997. Prior to that year, states
fell into one of three groups: (1) 19 states with a requirement of a minimum score of 40 on
each sub-test and a mean score of 45 across all sub-tests; (2) 26 states with a 35 minimum
and 45 mean requirement and; (3) a group of 5 states where GED candidates had to achieve
a 40 minimum on each test and/or a mean score of 45 across all tests.
Starting January 1st 1997, all states had to meet the new standard of a minimum score
4Heckman and LaFontaine (2008a) show that the baby boom and the subsequent baby bust only accountfor a small portion of the variation in average age of GED test takers.
5The Federal Pell Grant Program provides need-based grants to low-income undergraduate and certainpost-baccalaureate students to promote access to postsecondary education. (U.S. Department of EducationWebsite, http://www.ed.gov/programs/fpg/index.html). The sharp rise in the average age in 1974 waspossibly due to a pent up demand for college among older dropouts.
7
of 40 on each test and a mean score of 45. This standard forced the second group of states
to raise their minimum score requirement on each test from 35 to 40 and the third group of
states to eliminate the and/or scoring option. The first group of states that previously met
the new standards did not change requirements. Figure 4 shows the geographic distribution
of the states by type.
According to a norming study conducted by the American Council on Education, only
67% of graduating high school seniors are able to meet a minimum score requirement of 40
and a mean score requirement of 45. A minimum of 35 and a mean of 40 was obtained by
69% and 73% scored at the 40 and/or mean of 45 threshold. See Table 3. Therefore, the
change in difficulty of passing the GED was far greater in the third group relative to the
other two. This is also evident from the actual observed changes in pass rates in the three
types of states before and after 1997. See the far right-hand column of Table 3.
Due to the much larger change in difficulty of obtaining the GED, we will use this third
group of 5 states as our “treatment” group. The “control” group is the set of states that
were not required to raise their GED passing requirements.6 In our analysis, we compare
GED testing and dropout rates in treatment and control states in the years 1994-1996 to the
same rates measured in 1998-2000. We exclude 1997 from our empirical analysis because the
change in GED requirements occurred in the middle of the school year. The reform could
cause some students to drop out and take the GED early in the year and others to stay in
school after the requirements were changed later in the same year.
For this analysis, we compute three measures of annual dropout rates using the Common
Core of Data (CCD) and a methodology similar to that developed by Kominski (1990).7 The
measures are: (1) the overall dropout rate, defined as the percentage of students enrolled in
6In the appendix to this paper, we use the group of states that were required to minimally raise thedifficulty of obtaining a GED to test the exogeneity assumption. The results from this analysis are consistentwith the results reported in the text.
7The Common Core of Data (CCD) are collected from state departments of education and contain thenumber of students enrolled in each grade level in a given year in each state, as well as the number of highschool diplomas issued in that year. From these annual counts, approximate annual exit rates from eachgrade can be computed. See the appendix for more details on the construction of these measures.
8
the 10th, 11th and 12th grades in year t who are not enrolled and have not graduated in
year t + 1; (2) the lower level dropout rate, defined as the percentage of students enrolled
in 10th and 11th grades in year t who are not enrolled in year t + 1; and (3) the upper
level dropout rate, given by the percentage of students enrolled in 12th grade in year t who
did not graduate in year t + 1.8 These rates are yearly exit rates from school and therefore
differ in levels from more commonly reported cohort dropout rates (See e.g. Heckman and
LaFontaine, 2008a). All dropout rate calculations are then weighted by the fraction of the
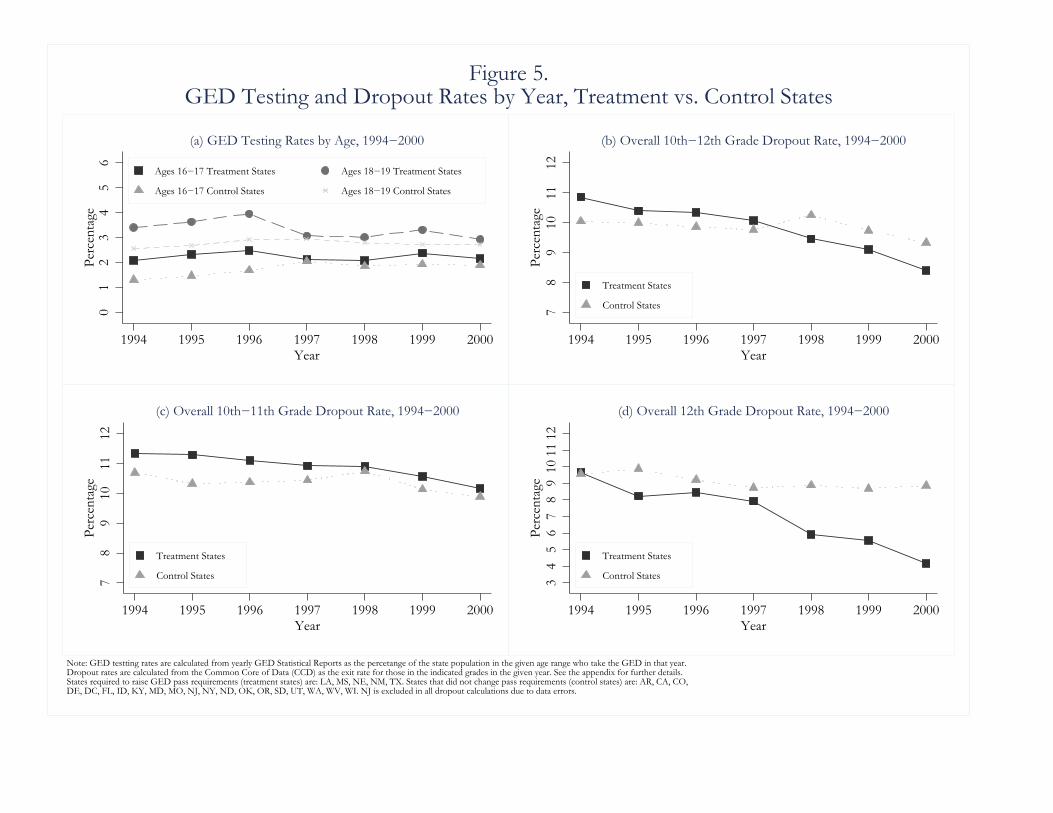
U.S. 15-17 year old population that resides in each state for our sample period. Figure 5
plots our measures of GED test taking and dropout rates by year in treatment and control
states during our sample period.9
We define dropout rates in this manner for the following reasons. First, we need to
compute yearly exit rates from schooling to capture the timing of the school leaving decision
before and after the GED policy change. Second, we seek to examine whether there are
differential effects by grade and age.10 If students are dropping out to take the GED, we
would expect to find larger effects for students enrolled in upper grade levels since they
are older and less restricted by school leaving and GED testing age requirements. Third,
these measures are less sensitive to migration than estimated cohort rates at the state level.
Cohort dropout and graduation rates are generally calculated on the basis of up to 5 year
lags of enrollment and diploma counts (e.g. diplomas issued in the spring of year t over fall
8th grade enrollment in year t-5). Our exit rates are only lagged one year and therefore
less sensitive to migration.11 Finally, high rates of 9th grade retention make it difficult to
8The labels “overall”, “lower” and “upper” are our own and are not based on any official definitions. Allformulas used to compute each of the dropout rate measures are included in the appendix.
9The plots by race are available in the web appendix. Data on GED testing by age is from the 1994-2000GED Statistical reports (See GED Testing Service, Various). Population totals by age are obtained fromthe Census bureau.
10The age of students is not available in CCD data so we use the grade level as a proxy measure.11A 1997 immigration reform generally made it more difficult to legally emigrate and reside in the U.S.
To test the sensitivity of our Hispanic estimates to this reform, we compare Hispanic dropout rates in highimmigration control states to the large estimates we find in treatment states. We find no significant declinesin dropout rates in these control states suggesting that bias due to migration is minimal. See the appendixfor these results.
9

calculate yearly exit rates between that grade and 10th grade. Students enrolled in 9th grade
are also almost universally younger than 16 and therefore not allowed to take the GED test
in all states.
If high school students respond to changes in GED score requirements, we would expect
to find an increase in GED testing in states facing a tough reform in the period just prior
to implementation of the requirements. We would also expect lower levels of GED test
taking in the years following the adoption of the new requirements. Figure 6 presents the
average GED test taking rate by age pre- and post-1997. The unadjusted mean difference-
in-difference estimates and standard errors are also reported for each age group at the top of
the figure. For the control group, average GED testing rates remained essentially flat over
the two periods for all age groups. In contrast, treatment group states exhibit a sharp decline
in GED testing post-1997. This decline is particularly marked for the older cohorts (ages
18-19) since they face fewer legal restrictions in both leaving school and taking the GED test.
The estimated change in the treatment group GED test taking rate for the older cohorts
relative to that of the control group is about 0.74 points and is statistically significant at the
1% level.12 This is a 20% decline relative to the average GED test taking rate in treatment
states prior to the change. Also, before raising passing requirements, treatment group states
had much higher GED testing rates than did states in the control group. This difference in
GED testing levels is nearly eliminated following the toughening of GED requirements in
treatment states.
The overall dropout rates pre- and post-1997 across all races in both control and treatment
states are presented in Figure 7. Unadjusted difference-in-difference estimates and standard
errors are again reported at the top of each set of figures. The overall dropout rate declines
sharply across all race groups in the treatment states, with the largest declines occurring for
blacks and Hispanics.13 The estimated change in the 10th-12th grade dropout rate across
12All standard errors are Huber-White robust standard errors clustered by state.13The estimates by race are not directly comparable with the ’all races’ category since the former include
fewer states as a result of missing enrollment data by race. All estimates by race are restricted to the samesub-sample of states.
10

all races combined is -1.3% and is statistically significant at the 1% level. The equivalent
effect for whites is -0.5 percentage points whereas for blacks and Hispanics it is -0.9 and -1.7
percentage points respectively, although only statistically significant for Hispanics.
In contrast to the overall effect, the lower level dropout rate in treatment states does
not show any significant declines. See Figure 8. Lower level dropout rates decline in both
treatment and control states for whites, blacks and Hispanics and none of the difference-in-
difference estimates are statistically significantly different from zero.
As we saw for GED test taking rates, the estimated effect of the GED reform on dropout
rates is the largest for older students. See Figure 9. The estimated change in the 12th grade
dropout rate across all race groups combined is 3.1 points and is statistically significant at
the 1% level. As with the overall dropout rate, minorities show the largest effects. Whereas
the 12th grade dropout for whites decreases by 1.4 points, black and Hispanic dropout rates
decline by 4.4 and 7 points more in treatment states, respectively. Nearly all of the decline
in dropout rates following the toughening of GED standards in treatment states is being
driven by students enrolled in 12th grade deciding to remain in school rather than pursue
the now more costly GED.
Students enrolled in lower grade levels in treatment states provide a second control group
in our analysis. Most of this group is not affected by changes in GED requirements because
they are too young to take the GED test without obtaining a special exemption.14 The
finding that the lower level dropout rate declines only slightly while upper level rates drop
sharply in response to the reform is further evidence that we have isolated a causal estimate
of the effect of mandated changes in GED passing standards on dropping out and not a
spurious relationship driven by changes in educational inputs that affect all students (e.g.
increased spending per pupil or number of teachers per pupil).
Figure 10 shows one reason to expect that the estimated effect of the reform is stronger
14Special exemptions to age requirements vary by state and include such conditions as teenage pregnancy,residence in a juvenile detention facility and enrollment in Job Corps programs. The 2006 GED StatisticalReport contains additional information on this topic. (See GED Testing Service, Various).
11

for minority students. For whites, 25.6% of the students are 18 and above in the fall of 12th
grade. The corresponding figures for blacks and Hispanics are 37.7% and 38.7%. Far more
minority students are in the age group that is not restricted by mandatory school leaving age
requirements or GED minimum age requirements. Thus more minority students are at risk
of being induced out of school by the GED at any given grade level. In addition, minority
students are farther behind than white students at each grade level, making the GED a more
attractive option for them. See Agodini and Dynarski (1998).
4 State Level Fixed Effect Model
One difficulty in isolating the effect of changes in GED passing standards on dropout rates
is that both minimum school leaving age requirements and GED testing age requirements
changed in the sample period under study. See Table 5. During our sample period, three
of the five states in our treatment group both raised and lowered their GED minimum age
requirement. Two of these three states also raised the minimum age at which students can
drop out of school. States included in our control group also made changes in their age
requirements.
To control for these potentially confounding changes in age requirements and other
sources of unobservables across states, we estimate a state fixed-effect regression. The model
is
Yi,t = γ(Dtreat ·Dpost 97) + πDpost 97 + θi + ψXi,t + εi,t
where Yi,t is the dropout rate for state i in year t and Dtreat and Dpost 97 are defined as
Dtreat = {1 if the state eliminated the and/or GED score option in 19970 if the state was not required to raise GED standards in 1997
Dpost 97 = {1 if 1998 ≤ year ≤ 20000 otherwise .
The θi are time-invariant state level fixed effects and the Xi,t are control variables that
12

vary by states over time. These include, dummy indicators for both the minimum age
required to take the GED and the minimum age required to drop out of school, as well as
measures of state level unemployment rates and per capita income to control for changes in
labor market conditions during the sample period.15 The parameter of interest is γ, which
is the conditional difference-in-difference estimate of the treatment effect of the reform in
GED standards on the high school dropout rate.
5 Fixed Effect Estimates
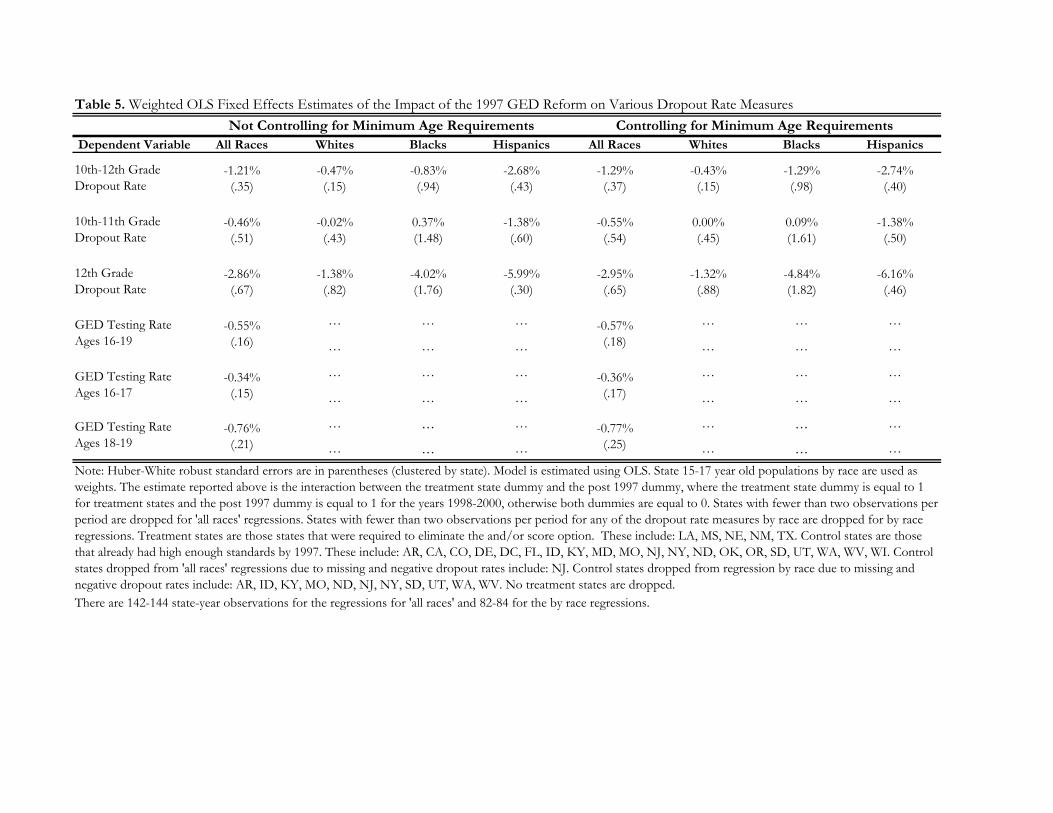
Weighted OLS estimates of γ from the full model both controlling and not controlling for
changes in minimum age requirements are summarized in Table 5.16 All other parameter
estimates are available at our web appendix. Using the full specification, the overall effect
of the reform is a 1.3 percentage point reduction in the dropout rate in treatment states.
The estimated effect on the upper level dropout rate remains large (-3%) after adjustment
(see the fifth column of numbers in Table 5). The estimated effect on the overall lower level
dropout rate is still small and insignificant. In general, the estimates including state level
fixed effects but not controlling for changes in minimum age requirements are smaller than
estimates based on the full specification. The regression-adjusted dropout and GED testing
rate estimates are for the most part smaller but in close agreement with the unadjusted
difference-in-difference estimates reported in the previous section.
The fixed effects estimates by race are consistent with the unadjusted estimates as well.
Again, the estimated treatment effect is greater for minorities compared to whites. The
estimates for whites are very similar in both the simple unadjusted difference-in-difference
models and the fixed effect models. As with our previous estimates, the largest effect is on
the upper level dropout rate. Increasing GED passing requirements decreased the upper level
15See Table A-1 in the appendix for the summary statistics of all variables used in these models. We donot control for high stakes testing because no treatment or control states implemented or changed testingrequirements during the sample period.
16GLS estimates of the model are also available in the appendix and match those reported in the text.The results hold up even after controlling for serial correlation in the residuals.
13

dropout rate in treatment states by 1.3 percentage points for whites, 4.8 percentage points
for blacks and 6.2 percentage points for Hispanics. The estimate for blacks is statistically
significant at the 5% level and that for Hispanics at the 1% level.
6 Eliminating the GED Option
The evidence just presented shows that raising the difficulty of passing the GED test lowers
dropout rates. A related question of policy interest is what the change in the dropout rate
would be if the GED program were eliminated entirely. While no states have ever banned
GED testing, the timing of the introduction of the GED across states provides a valuable
natural experiment to help answer this question.
Throughout the early 1970s, many states began to lower GED age requirements and make
the certificate more accessible to school-age youth (Quinn, 2008). As previously discussed,
GED testing in these states rose dramatically during this time and high school graduation
rates fell.
Until 1974, the one exception to this trend was California. In that year, California became
the last state to adopt the GED testing program for civilians. See Allen and Jones (1992).
The previous year, the California legislature amended the state education code to include
provisions for the issuance of the California High School Equivalency Certificate to be given
out on the basis of GED test scores (California Legislature, 1973). According to the new law,
this certificate would be “deemed to be a high school diploma for the purpose of meeting
the requirements of employment by all state and local public agencies.”
In 1974, the GED testing program was neither as large as it is today nor as popular
among school age youth. However, it was still a substantial social program that accounted
for nearly 9% of all high school credentials issued and 34% of the test takers were ages 16 to
19. See Figures 1 and 2.
In order to gauge the impact of the introduction of the GED program we compare the
14
high school graduation rate in California to that of all other states in the three years before
and after 1974. Since enrollment counts by grade are not available on a state by state basis
for these years, we use an estimate of the 14 year old population four years prior as a proxy
for the entering 9th grade enrollment size.17
Figure 11 displays the overall, male and female mean high school graduation rates pre- and
post-1974 in both California and the rest of the country.18 Difference-in-difference estimates
are also reported. Prior to the introduction of the GED program, California had a high
school graduation rate that was statistically significantly higher than the rest of the United
States. This changed dramatically once the GED was introduced. California graduation
rates immediately fell to the levels of all other states. While graduation rates fell both in
California and the rest of the U.S. during this time, difference-in-difference estimates show
that introducing the GED program resulted in a 3 percentage point greater drop in California
relative to other states from 1975-1977.
The adverse effect of introducing the GED program on graduation rates was larger for
males than females. Male graduation rates fell by 3.6 percentage points while the graduation
rate for females declined by 2.6 points. One possible explanation for this is that males have
better immediate employment opportunities and would, therefore, find an early exit from
high school through GED certification a more attractive offer. A second explanation is
that males are farther behind in school than females at any given age. This finding is also
consistent with the evidence reported in Heckman and LaFontaine (2008a) who show that
male graduation rates have declined more than female rates since the early 1970s.
While estimates for California are not available by race, on the basis of the results of the
previous section, it is likely that expanding the national GED program to school age youth in
17Population estimates for California were obtained from the California Demographic Research Unit. Theyprovide estimates of the state population by age for the resident population on July 1st of each year. Weuse the July 1st 15 year old population in the next year to proxy for the previous years fall 14 year oldpopulation. U.S. population estimates by age are from the Census Bureau and are also estimates of theresident population on July 1st.
18Figure A-1 in the appendix displays completion rates by year for California and the rest of the countryfor the years 1971-1977.
15

the 1970s had a more adverse impact on minority graduation rates than on white rates. This
could explain part of the stagnation in minority graduation and lack of convergence in white
and minority rates since the mid-1970s that is documented in Heckman and LaFontaine
(2008a).
The late introduction of the GED program in California provides further empirical ev-
idence that the GED induces youth to drop out of school. This natural experiment shows
that eliminating the GED option would substantially raise high school graduation rates.
Arguably, estimates based on 1974 data understate the effect we would observe today if the
GED were unavailable to students. Since 1974, the GED program has greatly expanded
and become more popular with adolescents and young adults. Additionally, high school
standards, as measured by mandatory courses and high-stakes testing requirements, have
increased substantially since the mid-1980s. See Lillard and DeCicca (2001). These changes
increase the cost of graduating from high school and the attractiveness of the GED option.
For all of these reasons, it is plausible that our estimates based on California in the mid-1970s
understate the potential impact of enacting this reform under current conditions.
7 Conclusion
This paper investigates the extent to which students enrolled in high school substitute be-
tween traditional graduation and alternative exam-based GED credentials. We find that
raising the difficulty of obtaining the GED, either through increasing passing requirements
or restricting access to young adults, substantially reduces estimated dropout rates. We
estimate that a nationally mandated increase in GED passing standards in 1997 resulted
in a 1.3 percentage point drop in the overall dropout rate in states that were required to
change relative to those who did not. The observed reduction in dropout rates was stronger
for older students enrolled in upper grade levels since these individuals are less restricted in
both school leaving and GED testing. The twelfth grade high school dropout rate fell by 3
16
percentage points following the reform.
Minorities are more sensitive to the availability of less costly GED credentials than are
whites. At a given grade level, minority students tend to be older and further behind
than majority students. These factors make obtaining a GED credential a more attractive
alternative to high school graduation for minorities. As a result, we find that minority
dropout rates exhibit the sharpest declines following the increase in GED passing standards.
Black 12th grade dropout rates declined by 4.8 percentage points, those for Hispanics by
6.2 points and those for whites by 1.3 percentage points. The GED program hurts those
students at the greatest risk of dropping out the most.
One additional control group in our analysis is students enrolled in lower grade levels
(10th-11th) in treatment states before and after the 1997 change. The smaller observed
changes in dropout behavior for this group before and after the policy change lends further
support to our claim that we have isolated a causal effect. Most students enrolled in these
grades are too young to drop out and take the GED without special exceptions. Whereas
the estimated effect on the 12th grade dropout rate is 3 points, the effect on the 10-11th
grade dropout rate is only .55 points and not statistically different from zero.
Introducing or eliminating the GED option produces even larger changes in graduation
rates. Prior to the introduction of the GED program in 1974, California had significantly
higher graduation rates compared to those in the rest of the country. Difference-in-difference
estimates show that as soon as the California legislature established the GED program,
graduation rates fell by 3 points in California relative to the rest of the U.S., and graduation
levels dropped to those of the other states. We argue that eliminating the GED option today
would likely have much larger effects than we find for California since the GED program is
now larger and more popular among youth than it was in 1974.
The GED program has the unintended negative consequence of causing many marginal
students to drop out of school rather than graduate. It has changed from its original intention
of providing a second chance to adults to becoming a primary vehicle for obtaining high
17

school completion status among many adolescent youth. This is a source of concern because
the return to GED exam certification is very small and GED recipients perform in the
labor market, post-secondary schooling and society at large at a level very close to that
of dropouts and far below that of high school graduates. See Heckman and LaFontaine
(2008b). Given the poor performance of GED recipients relative to high school graduates,
the findings reported in this paper provide clear evidence that states should adopt policies
to eliminate the GED option for school age persons. Such a change in policy would not only
raise high school graduation rates, but may also improve the prospective futures of many
disadvantaged students.
18

References
Agodini, Roberto and Mark Dynarski. 1998. “Understanding the Trend Toward Al-
ternative Certification for High School Graduates.” Document PR98-39, 37, Mathematica
Policy Research, Inc., Princeton, NJ.
Allen, Colleen A. and Edward V. Jones. 1992. GED Testing Program: The First Fifty
Years. Washington, D.C.: American Council on Education.
California Legislature. 1973. “Chapter 6 of Division 6 of the Education Code, Article 9.”
State of California, West’s Education Code, Chapter 872, pg. 1594.
Cameron, Stephen V. and James J. Heckman. 1993. “The Nonequivalence of High
School Equivalents.” Journal of Labor Economics, 11(1, Part 1):1–47.
Chaplin, Duncan. 1999. “GEDs for Teenagers: Are There Unintended Consequences?”
Tech. rep., The Urban Institute.
GED Testing Service. Various. Who Took the GED?: GED Statistical Report. Washington,
DC: American Council on Higher Education.
Heckman, James J. and Paul A. LaFontaine. 2006. “Bias Corrected Estimates of GED
Returns.” Journal of Labor Economics, 24(3):661–700.
Heckman, James J. and Paul A. LaFontaine. 2008a. “The American High School
Graduation Rate: Trends and Levels.”, unpublished manuscript, University of Chicago,
Department of Economics.
Heckman, James J. and Paul A. LaFontaine. 2008b. “Testing the Test: What the GED
Reveals and Conceals.”, unpublished book manuscript, University of Chicago, Department
of Economics.
Kominski, Robert. 1990. “Estimating the National High School Dropout Rate.” Demog-
raphy, 27(2):303–311.
19

Lane Community College. 2008. “Online GED Preparation, GED 2002 Changes.”,
https://teach.lanecc.edu/ged/ged2002.htm (accessed May 9, 2008).
Lillard, Dean R. 2001. “Do General Educational Development Certificate Policies Induce
Youth Out of High School?”, unpublished manuscript, Cornell University.
Lillard, Dean R. and Philip DeCicca. 2001. “Higher Standards, More Dropouts? Evi-
dence Within and Across Time.” Economics of Education Review, 20(5):459–473.
Malizio, Andrew G. and Douglas R. Whitney. 1981. Who Takes the GED Tests?:
A National Survey of Spring 1980 Examinees. Washington, DC: American Council on
Education.
National Center for Education Statistics. 2006. Education Longitudinal Study of 2002
(ELS:2002/04), First Follow-up, Student Survey, 2004. Washington, DC: U.S. Department
of Education, National Center for Education Statistics.
National Commission on Excellence in Education. 1983. A Nation at Risk: The Im-
perative for Educational Reform: A Report to the Nation and the Secretary of Education,
United States Department of Education. Washington, D.C.: National Commission on Ex-
cellence in Education.
Quinn, Lois M. 2008. “An Institutional History of the GED.”, unpublished manuscript.
Van Slyke, Caren. 2005. GED 2005-2006 (Kaplan). New York: Simon and Schuster.
20
A Appendix
A.1 Data Sources
This article uses the Common Core of Data (CCD) to construct annual exit rates from
secondary schooling. The CCD data are collected each year by the National Center for Edu-
cation Statistics from state and local departments of education. The data provide aggregate
annual counts of enrollments and diplomas issued (excluding GED certificates, certificates of
completion and other alternative credentials) at the state, district and even school level. We
use the aggregate state counts to construct various dropout measures using the methodology
summarized in the next section. Many states do not report estimates by race for all years.
These tend to be states that do not have large minority populations and therefore our esti-
mates should not be overly biased due to their exclusion. In a very small number of cases,
the estimated dropout rate was negative and these were set to missing. We experimented
with a number of imputation procedures to correct for missing values. These were found
not to affect our results in any substantial manner. The final measures used in the paper
do not contain imputations and all estimates by race are restricted to the same sample of
states to make the estimates comparable across groups. To be included in the analysis, states
needed to have at least two observations for each dropout measure in both the pre and post
treatment periods. It was not necessary to drop any treatment states in the analysis by race.
The estimates by race should be considered more cautiously than the overall estimates due
to these data limitations. For the analysis not by race only a few state-year observations are
missing for the treatment and control states.
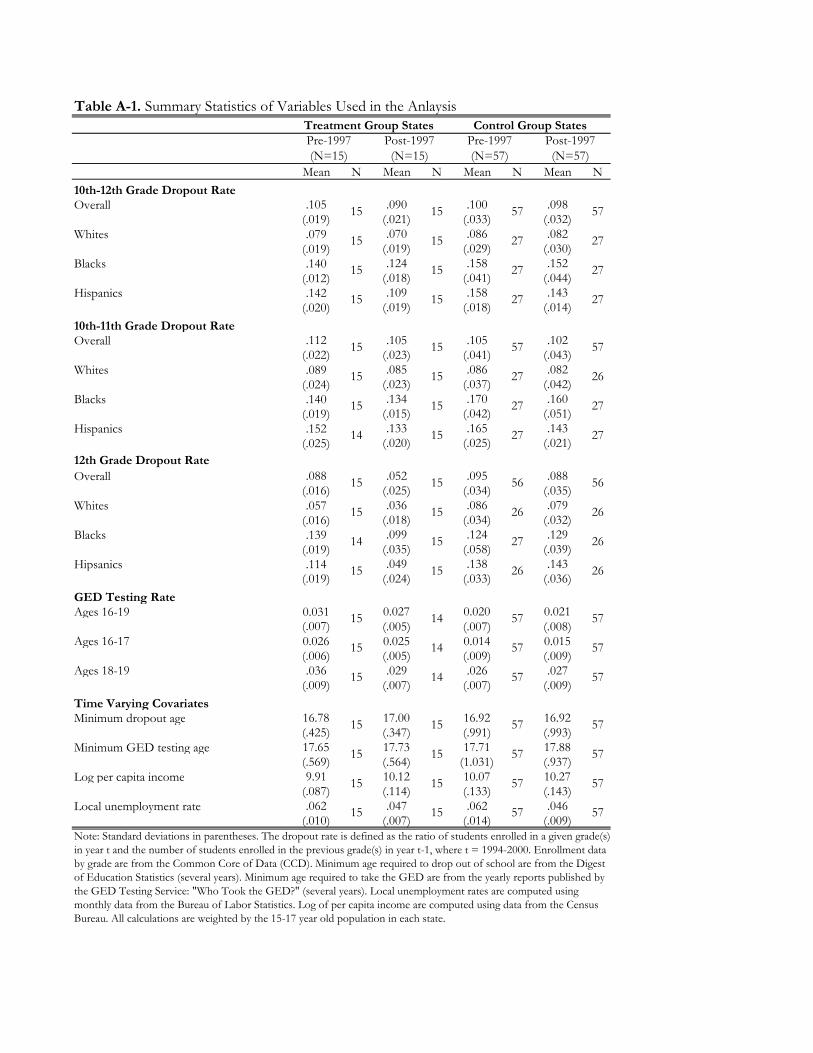
A summary of all the variables used in our analysis broken down by treatment status
and time period are listed in table A-1. GED testing rates by age at the individual state
level are obtained from multiple years of the annual GED statistical reports published by the
American Council on Education (ACE). GED age requirements by state are also from this
source. Mandatory school leaving age for each state was obtained from various years of the
21
Digest of Education Statistics. Annual measures at the state level of unemployment rates
and per capita income were obtained from the Bureau of Labor Statistics and the Census
Bureau, respectively. Population estimates at the state level for each age are obtained from
the U.S. Census Bureau. For the California analysis, population estimates were obtained
from the California Demographic Research Unit due to a lack of data available on the state
level from the Census Bureau. Diplomas issued in California and the U.S. were obtained
from various years of the Digest of Education Statistics.
A.2 Definitions
Weighted GED Test Taking Rate Across Groups:
Let i denote state and t denote years. The rate is
51∑i=1
G(a)i,t
P (a)i,t
,
with i = 1, ..., 51 and t = 1994, ..., 2000, where
G(a)i,t = Number of GED Test Takers Age a in state i in year t.
P (a)i,t = Population Age a in state i in year t.
The number of states included in each sum is the number of states in groups 1 and 3 as
defined in the text, dropping any states with fewer than two observations per period.
Overall Dropout Rate (10th-12th Grade) in state i in year t:
DOi,t =
P (15− 17)i,t
51∑i=1
P (15− 17)i,t
·(E(10)i,t−1 + E(11)i,t−1 + E(12)i,t−1)− (E(11)i,t + E(12)i,t +Hi,t)
(E(10)i,t−1 + E(11)i,t−1 + E(12)i,t−1),
22
with i = 1, ..., 51 and t = 1994, ..., 2000, where
P (15− 17)i,t = Population Age 15-17 for i, t.
E(10)i,t = Enrollment in Grade 10 for i, t.
E(11)i,t = Enrollment in Grade 10 for i, t.
E(12)i,t = Enrollment in Grade 10 for i, t.
Hi,t is the number who graduate in state i at time t. These are people who were enrolled in
school in the previous year.
Upper Level Dropout Rate (12th Grade) in state i in year t:
DUi,t =
P (15− 17)i,t
51∑i=1
P (15− 17)i,t
· E(12)i,t−1 −Hi,t
E(12)i,t−1
,
with i = 1, ..., 51 and t = 1994, ..., 2000.
Lower Level Dropout Rate (10th-11th Grade) in state i in year t:
DLi,t =
P (15− 17)i,t
51∑i=1
P (15− 17)i,t
· (E(10)i,t−1 + E(11)i,t−1)− (E(11)i,t + E(12)i,t)
(E(10)i,t−1 + E(11)i,t−1),
with i = 1, ..., 51 and t = 1994, ..., 2000.
Weighted dropout rates by group are obtained by summing across the states in each group.
A.3 Robustness Checks
This section reports seven alternative specifications of our model in the main text to test the
robustness of the results. See Table A-2. As in the main text, we only report the γ estimates
for each check. For the full set of parameter estimates please refer to the web appendix.
23
A.3.1 Alternate Control Group
As one check of the exogeneity of the policy change assumption, we re-estimate the model
using states that were required to raise the GED minimum score requirement rather than
states that did not change. These are the lightly shaded states in Figure 4. These states
were also required to change GED policies but the increase in difficulty was much smaller.
The first row of table A-2 summarizes our overall results and results by race using this
alternate control group. The estimated effect on the upper level dropout rate is in general
larger than the effect obtained from our main control group. On the other hand, the effect
on the lower level dropout rate is in general smaller except for whites. However, these results
are generally consistent with the results reported in the text.
A.3.2 Southern States Only
With the exception of Nebraska, all treatment group states are located in the South. This
suggests that while the timing of the score requirement change was exogenous, the states
that were required to change were not a random sample of states. States likely set GED
standards endogenously to reflect conditions in the state, i.e. states with traditionally higher
dropout rates have lower GED testing standards. As a further robustness check of our main
results, we estimate the model using only treatment and control states located in the South.
The estimates, shown in the second row of table A-1, are very similar to those reported
in the text for nearly all groups. The one exception is that the white upper level dropout
estimate is now very small and statistically insignificant.
A.3.3 Excluding States that Changed Minimum Age Requirements
A number of states in both our treatment and control groups either raised or lowered the
minimum age for GED testing or the minimum age for school leaving during the period
under study. Our fixed effect model controls for these changes. Alternatively, we estimate
the model excluding these states to be sure that these changes are not driving our results.
24
In row 3 of table A-1, we drop all states that changed the minimum school leaving age and
in row 4 we estimate the model dropping all states that changed either school leaving age or
minimum GED testing ages after 1997. Our estimates are robust to these specifications.
A.3.4 GLS Estimation
The fifth row in table A-2 reports estimates our full specification using Generalized Least
Squares (GLS) instead of OLS. Except for the slightly larger estimates on the 10th-11th
grade dropout rate measures, the estimates are very similar to those reported in the text.
A.3.5 GLS with AR-1 Auto-Correlation Error Structure
As an alternative specification we include a panel specific AR-1 autocorrelation error struc-
ture in the GLS specification. The fifth row of table A-2 reports our estimates. The results
across all races and dropout rate measures are consistent with those reported in the main
text.
A.3.6 High Immigrant Control States
In 1997, a minor immigration reform was passed that made it generally more difficult to em-
igrate and reside legally in the U.S. Given the large estimated effects we found for Hispanics,
we would like to verify that this is not due to unaccounted for changes in immigration that
may bias the estimates. In the final row of table A-2, we use only states with high rates of
immigration in the control group. The control group is now California and Florida while the
treatment group remains unchanged. Since we only have two control states, we estimate the
unadjusted difference-in-difference model rather than the full state fixed effect specification.
If changing immigration patterns are responsible for the declines in Hispanic dropout rates
rather than the increase in GED standards, we would expect to find significantly reduced
effect sizes from this analysis. This is not the case. While the overall estimated Hispanic
effect declines, the estimates for the upper level Hispanic dropout rate remain large.
25

Test Area Topics Covered Question Type and Time Limit
Language Arts, Writing Sentence Structure, Organization, Usage, Mechanics Essay Writing
Part I: 50 multiple-choice questions in 75 minutes Part II: 1 essay in 45 minutes
Social Studies U.S. History, World History, Geography, Economics, Civics and Government 50 multiple-choice questions in 70 minutes
Science Life Science, Physical Science, Earth and Space Science 50 questions in 80 minutes
Language Arts, Reading Fiction, Nonfiction, Drama Poetry 40 questions in 65 minutes
MathematicsNumber Operations and Number Sense, Measurement and Geometry, Data Analysis, Statistics and Probability, Algebra, Functions and Patterns
Part I: 25 questions in 45 minutes with a calculator Part II: 25 questions in 45 minutes without a calculator
Source: Kaplan 2005-2006 GED Preparation Book.
Table 1. Description of the Five GED Subject Tests (2002 GED Test Series)
Note: Since its inception in 1942 the GED has undergone three major revisions. The most notable changes in 2002 relative to the 1988 GED Test Series are: (1) More graphic materials. (2) Longer reading passages. (3) Edit/correct written documents. (4) Use of scientific calculator on part of the mathematics section. (5) More business and real life context related readings. (Lane Community College: Online GED Preparation Website).
Reason for leaving school PercentMissed too many school days 43.5Thought it would be easier to get GED 40.5Getting poor grades/failing school 38.0Did not like school 36.6Could not keep up with schoolwork 32.1Became pregnant* 27.8Got a job 27.8Thought could not complete course requirements 25.6Could not get along with teachers 25.0Could not work at same time 21.7Had to support family 20.0Did not feel belonged there 19.9Could not get along with other students 18.7Was suspended from school 16.9Had to care for a member of family 15.5Became father/mother of a baby 14.4Had changed schools and did not like new one 11.2Thought would fail competency test 10.5Did not feel safe 10.0Was expelled from school 9.9Got married/planned to get married 6.8
Table 2. Percentage of Spring 2002 HS sophomores who had not Completed a HS Degree by Spring 2004, by Reason for Leaving School
Note: This indicator shows the percentage of high school students in the spring of their sophomore year who, in the spring 2 years later, were not in school and had not graduated with a regular diploma or certificate of attendance. The 1 percent of sophomores who left school and earned a General Educational Development (GED) certificate or other form of equivalency certificate as of the spring 2 years later are counted as having left school without a regular diploma or certificate of attendance.Source: Reproduced from U.S. Department of Education, National Center for Education Statistics, Education Longitudinal Study of 2002 (ELS:2002/04), “First Follow-up, Student Survey, 2004,” previously unpublished tabulation (January 2006).*Percentage of female respondents only. The reason could only be selected by female respondents.
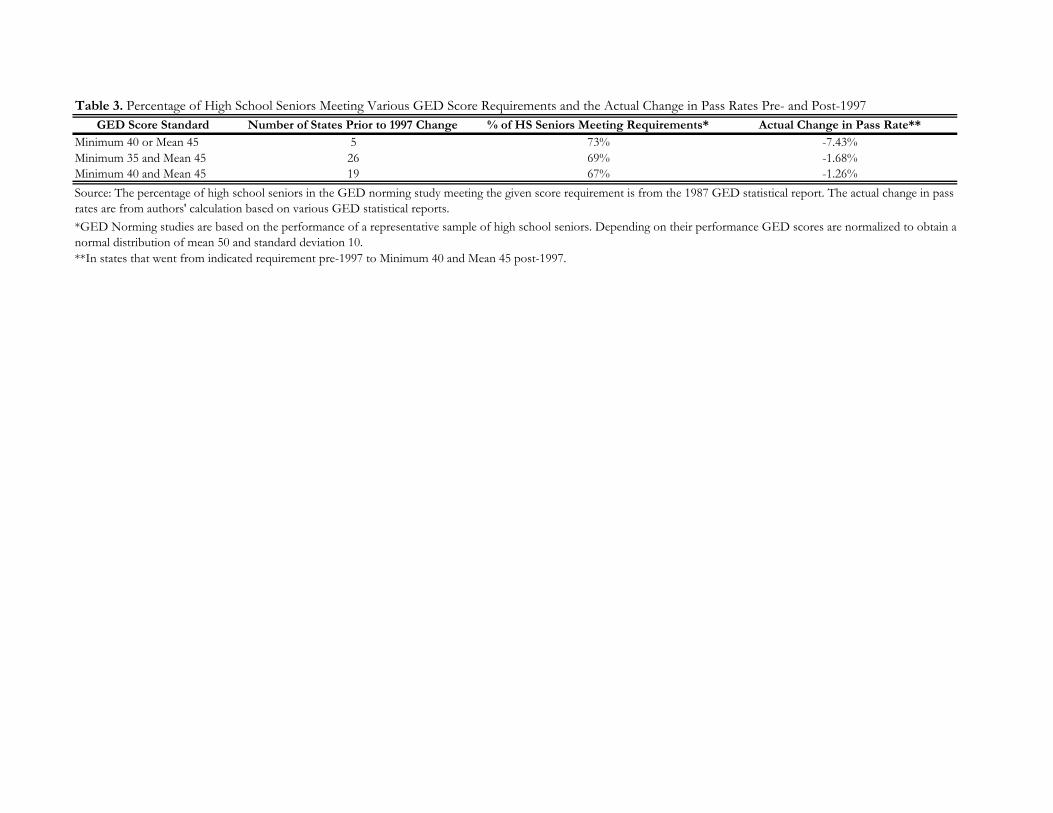
GED Score Standard Number of States Prior to 1997 Change % of HS Seniors Meeting Requirements* Actual Change in Pass Rate**Minimum 40 or Mean 45 5 73% -7.43%Minimum 35 and Mean 45 26 69% -1.68%Minimum 40 and Mean 45 19 67% -1.26%
**In states that went from indicated requirement pre-1997 to Minimum 40 and Mean 45 post-1997.
Table 3. Percentage of High School Seniors Meeting Various GED Score Requirements and the Actual Change in Pass Rates Pre- and Post-1997
*GED Norming studies are based on the performance of a representative sample of high school seniors. Depending on their performance GED scores are normalized to obtain a normal distribution of mean 50 and standard deviation 10.
Source: The percentage of high school seniors in the GED norming study meeting the given score requirement is from the 1987 GED statistical report. The actual change in pass rates are from authors' calculation based on various GED statistical reports.
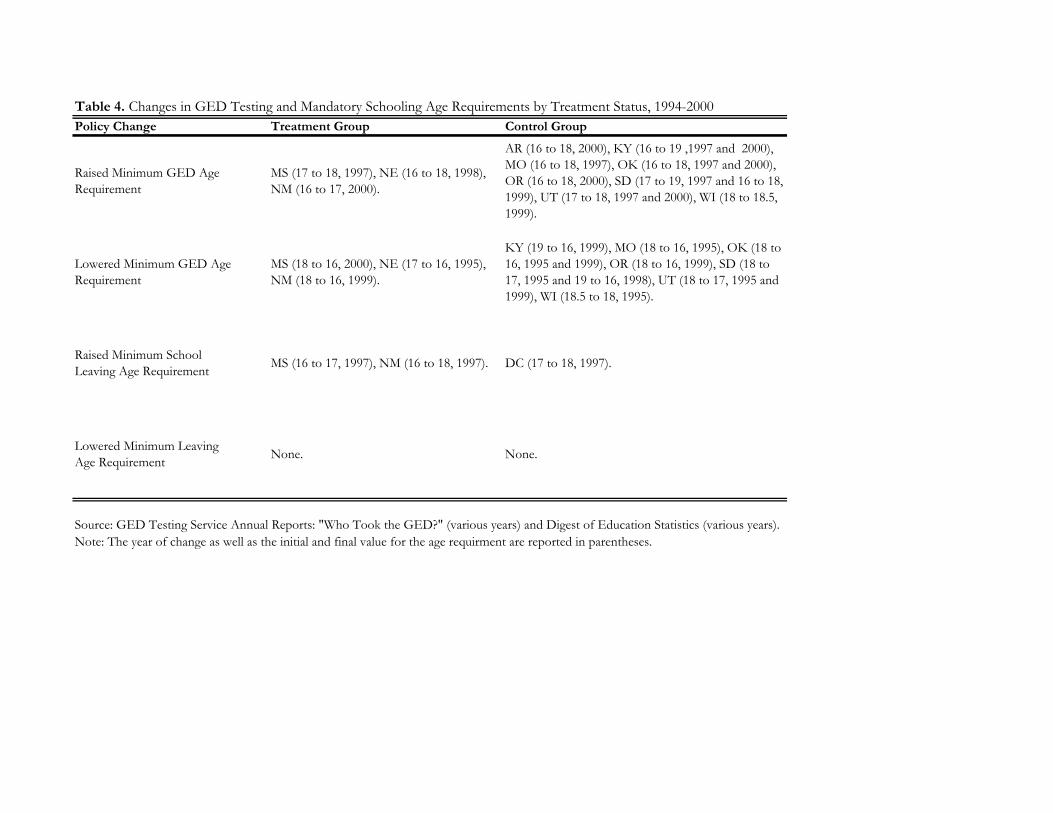
Policy Change Treatment Group Control Group
Raised Minimum GED Age Requirement
MS (17 to 18, 1997), NE (16 to 18, 1998), NM (16 to 17, 2000).
AR (16 to 18, 2000), KY (16 to 19 ,1997 and 2000), MO (16 to 18, 1997), OK (16 to 18, 1997 and 2000), OR (16 to 18, 2000), SD (17 to 19, 1997 and 16 to 18, 1999), UT (17 to 18, 1997 and 2000), WI (18 to 18.5, 1999).
Lowered Minimum GED Age Requirement
MS (18 to 16, 2000), NE (17 to 16, 1995), NM (18 to 16, 1999).
KY (19 to 16, 1999), MO (18 to 16, 1995), OK (18 to 16, 1995 and 1999), OR (18 to 16, 1999), SD (18 to 17, 1995 and 19 to 16, 1998), UT (18 to 17, 1995 and 1999), WI (18.5 to 18, 1995).
Raised Minimum School Leaving Age Requirement MS (16 to 17, 1997), NM (16 to 18, 1997). DC (17 to 18, 1997).
Lowered Minimum Leaving Age Requirement None. None.
Note: The year of change as well as the initial and final value for the age requirment are reported in parentheses.
Table 4. Changes in GED Testing and Mandatory Schooling Age Requirements by Treatment Status, 1994-2000
Source: GED Testing Service Annual Reports: "Who Took the GED?" (various years) and Digest of Education Statistics (various years).
Dependent Variable All Races Whites Blacks Hispanics All Races Whites Blacks Hispanics
-1.21% -0.47% -0.83% -2.68% -1.29% -0.43% -1.29% -2.74%(.35) (.15) (.94) (.43) (.37) (.15) (.98) (.40)
-0.46% -0.02% 0.37% -1.38% -0.55% 0.00% 0.09% -1.38%(.51) (.43) (1.48) (.60) (.54) (.45) (1.61) (.50)
-2.86% -1.38% -4.02% -5.99% -2.95% -1.32% -4.84% -6.16%(.67) (.82) (1.76) (.30) (.65) (.88) (1.82) (.46)
-0.55% … … … -0.57% … … …(.16) … … … (.18) … … …
-0.34% … … … -0.36% … … …(.15) … … … (.17) … … …
-0.76% … … … -0.77% … … …(.21) … … … (.25) … … …
GED Testing Rate Ages 16-19
Controlling for Minimum Age Requirements
Table 5. Weighted OLS Fixed Effects Estimates of the Impact of the 1997 GED Reform on Various Dropout Rate Measures
10th-11th Grade Dropout Rate
12th Grade Dropout Rate
10th-12th Grade Dropout Rate
Not Controlling for Minimum Age Requirements
GED Testing Rate Ages 16-17
GED Testing Rate Ages 18-19
Note: Huber-White robust standard errors are in parentheses (clustered by state). Model is estimated using OLS. State 15-17 year old populations by race are used as weights. The estimate reported above is the interaction between the treatment state dummy and the post 1997 dummy, where the treatment state dummy is equal to 1 for treatment states and the post 1997 dummy is equal to 1 for the years 1998-2000, otherwise both dummies are equal to 0. States with fewer than two observations per period are dropped for 'all races' regressions. States with fewer than two observations per period for any of the dropout rate measures by race are dropped for by race regressions. Treatment states are those states that were required to eliminate the and/or score option. These include: LA, MS, NE, NM, TX. Control states are those that already had high enough standards by 1997. These include: AR, CA, CO, DE, DC, FL, ID, KY, MD, MO, NJ, NY, ND, OK, OR, SD, UT, WA, WV, WI. Control states dropped from 'all races' regressions due to missing and negative dropout rates include: NJ. Control states dropped from regression by race due to missing and negative dropout rates include: AR, ID, KY, MO, ND, NJ, NY, SD, UT, WA, WV. No treatment states are dropped. There are 142-144 state-year observations for the regressions for 'all races' and 82-84 for the by race regressions.
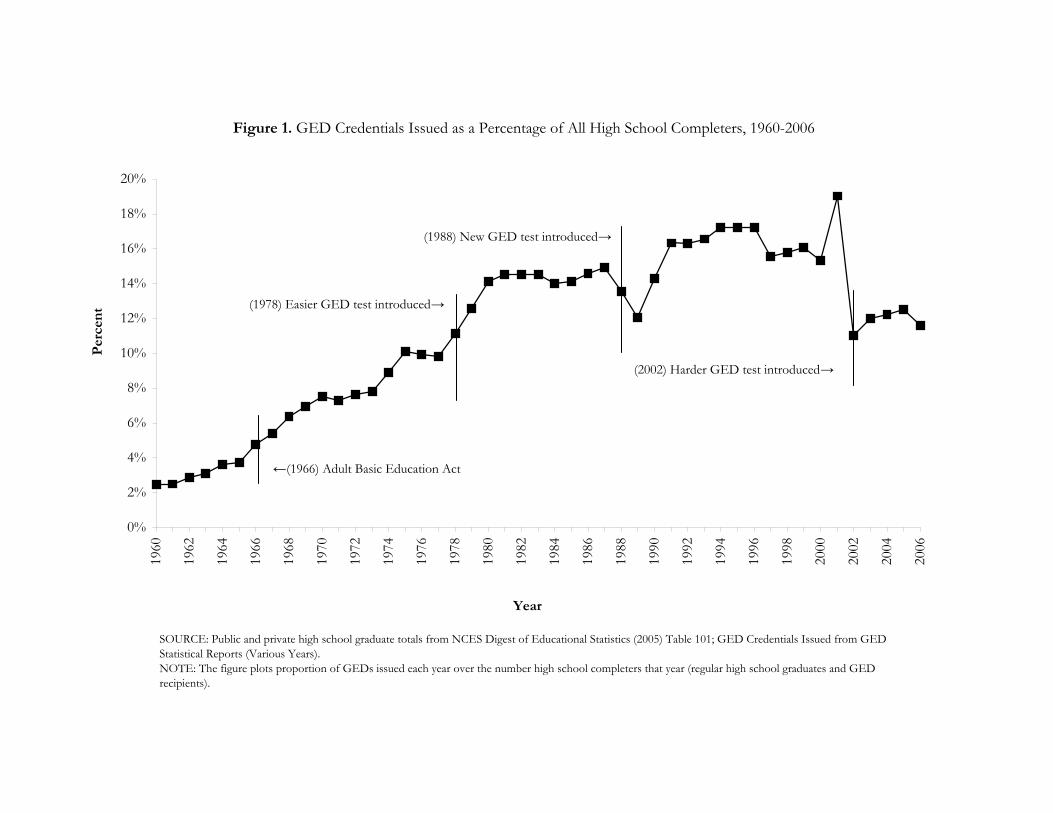
Figure 1. GED Credentials Issued as a Percentage of All High School Completers, 1960-2006
0%
2%
4%
6%
8%
10%
12%
14%
16%
18%
20%19
60
1962
1964
1966
1968
1970
1972
1974
1976
1978
1980
1982
1984
1986
1988
1990
1992
1994
1996
1998
2000
2002
2004
2006
Year
Per
cen
t
←(1966) Adult Basic Education Act
(2002) Harder GED test introduced→
SOURCE: Public and private high school graduate totals from NCES Digest of Educational Statistics (2005) Table 101; GED Credentials Issued from GED Statistical Reports (Various Years).NOTE: The figure plots proportion of GEDs issued each year over the number high school completers that year (regular high school graduates and GED recipients).
(1978) Easier GED test introduced→
(1988) New GED test introduced→

Figure 2. U.S. High School Dropout Rate Including and Excluding GED Recipients, 1968-2005
10%
12%
14%
16%
18%
20%
22%
24%
26%
28%
30%
1968
1970
1972
1974
1976
1978
1980
1982
1984
1986
1988
1990
1992
1994
1996
1998
2000
2002
2004
Year
Dro
pout
Rat
e
5%
10%
15%
20%
25%
30%
35%
40%
45%
50%
% G
ED
Testers L
ess Than 20
Dropout Rate (Inc. GEDs as Dropouts) Dropout Rate (Exc. GEDs as Dropouts) % of GED Testers <=19
Note: The true dropout rate is calculated from NCES and CPS data as the fraction of public and private school 8th graders who do not obtain a regular high school diploma. The NCES dropout rate is one minus the status completion rate. The status completion rate is computed as the percentage of 18- through 24-year-olds who are not enrolled in high school and who have any type of high school credential. High school credential includes a high school diploma or equivalent credential such as a General Educational Development (GED) certificate. The status completion rate is calculated from CPS October 1968-2000 data.
← (1970) States begin to reduce GED age restrictions. Adult Basic Education lowers participation age from 18 to 16.
(1994) Age restrictions reduced→
(2000) Age restrictions raised→
(2002) Harder GED test introduced→
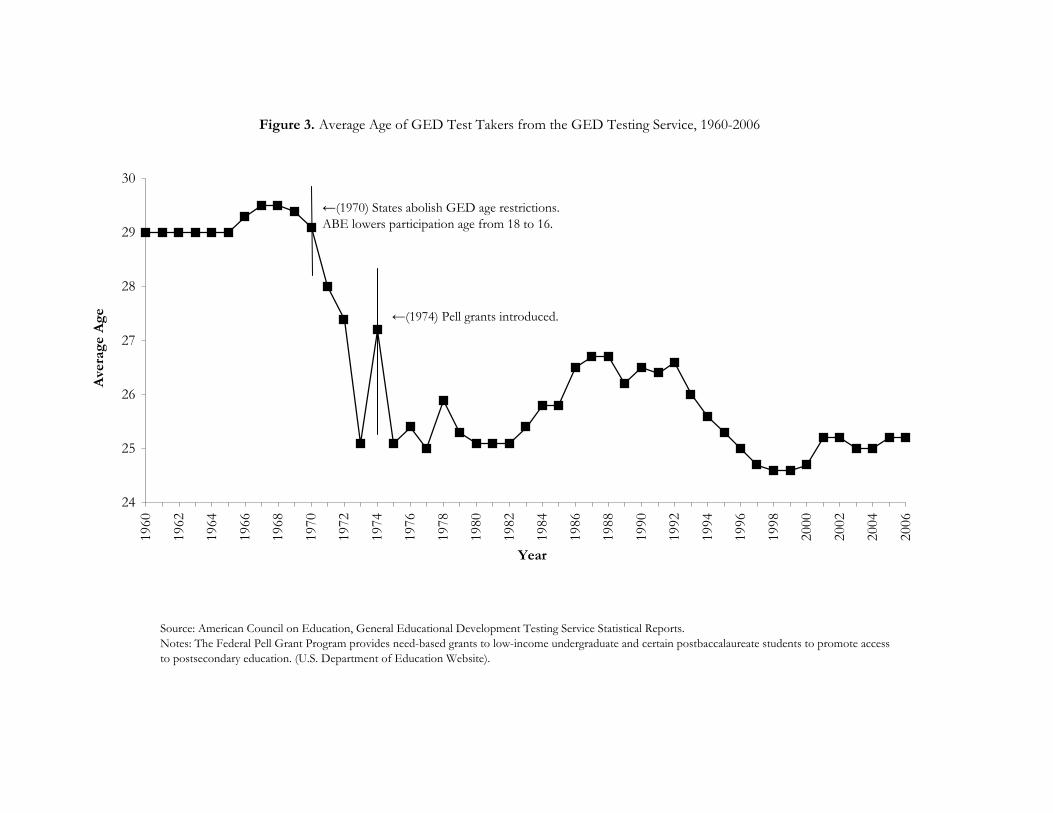
Figure 3. Average Age of GED Test Takers from the GED Testing Service, 1960-2006
24
25
26
27
28
29
30
1960
1962
1964
1966
1968
1970
1972
1974
1976
1978
1980
1982
1984
1986
1988
1990
1992
1994
1996
1998
2000
2002
2004
2006
Year
Ave
rage
Age
←(1970) States abolish GED age restrictions. ABE lowers participation age from 18 to 16.
←(1974) Pell grants introduced.
Source: American Council on Education, General Educational Development Testing Service Statistical Reports.Notes: The Federal Pell Grant Program provides need-based grants to low-income undergraduate and certain postbaccalaureate students to promote access to postsecondary education. (U.S. Department of Education Website).

States that were required to eliminate the and/or score option (treatment group).States that were required to raise the GED minimum score requirement from 35 to 40.States that were not required to raise standards in 1997 (control group).
Source: GED Testing Service: 2001 GED Statistical Report.
Figure 4. States That Were Required to Raise GED Passing Standards in 1997
01
23
45
6Pe
rcen
tage
1994 1995 1996 1997 1998 1999 2000Year
Ages 16−17 Treatment States Ages 18−19 Treatment States
Ages 16−17 Control States Ages 18−19 Control States
(a) GED Testing Rates by Age, 1994−2000
78
910
1112
Perc
enta
ge
1994 1995 1996 1997 1998 1999 2000Year
Treatment States
Control States
(b) Overall 10th−12th Grade Dropout Rate, 1994−2000
78
910
1112
Perc
enta
ge
1994 1995 1996 1997 1998 1999 2000Year
Treatment States
Control States
(c) Overall 10th−11th Grade Dropout Rate, 1994−2000
34
56
78
910
1112
Perc
enta
ge
1994 1995 1996 1997 1998 1999 2000Year
Treatment States
Control States
(d) Overall 12th Grade Dropout Rate, 1994−2000
Note: GED testting rates are calculated from yearly GED Statistical Reports as the percetange of the state population in the given age range who take the GED in that year.Dropout rates are calculated from the Common Core of Data (CCD) as the exit rate for those in the indicated grades in the given year. See the appendix for further details.States required to raise GED pass requirements (treatment states) are: LA, MS, NE, NM, TX. States that did not change pass requirements (control states) are: AR, CA, CO,DE, DC, FL, ID, KY, MD, MO, NJ, NY, ND, OK, OR, SD, UT, WA, WV, WI. NJ is excluded in all dropout calculations due to data errors.
Figure 5.GED Testing and Dropout Rates by Year, Treatment vs. Control States

Figure 6. Average Pre- and Post-1997 GED Test Taking Rate by Age Group
2.0%
1.4%
2.6%
3.1%
2.6%
3.6%
2.1%
1.5%
2.7%2.7%
2.5%
2.9%
0%
1%
2%
3%
4%
5%
GED Test Taking Ages 16-19 GED Test Taking Ages 16-17 GED Test Taking Ages 18-19
GE
D T
est
Tak
ing
Rat
e
Control Group Pre-97 Treatment Group Pre-97 Control Group Post-97 Treatment Group Post-97
DiD Estimate -0.53% (0.13)
Note: GED test taking rates are defined as the ratio between total number of test takers of a given age and total population of that age. The plot above shows the average GED test taking rate for the period pre-1997 (i.e. 1994-1996) and post-1997 (i.e. 1998-2000). All estimates are weighted by the 15-17 year old population by state. Huber-White robust standard errors are in parentheses (clustered within state). The treatment group consists of states that were required to eliminate the and/or score option. These include: LA, MS, NE, NM, TX. The control group consists of states that already had high enough standards by 1997. These include: AR, CA, CO, DE, DC, FL, ID, KY, MD,MO, NJ, NY, ND, OK, OR, SD, UT, WA, WV, WI. The state of NJ is dropped in order for test taking rates to be consistent with dropout rate regressions. Source: GED Testing Service Annual Reports: "Who Took the GED?" (1994-2000).
DiD Estimate - 0.31% (0.14)
DiD Estimate - 0.74% (0.18)
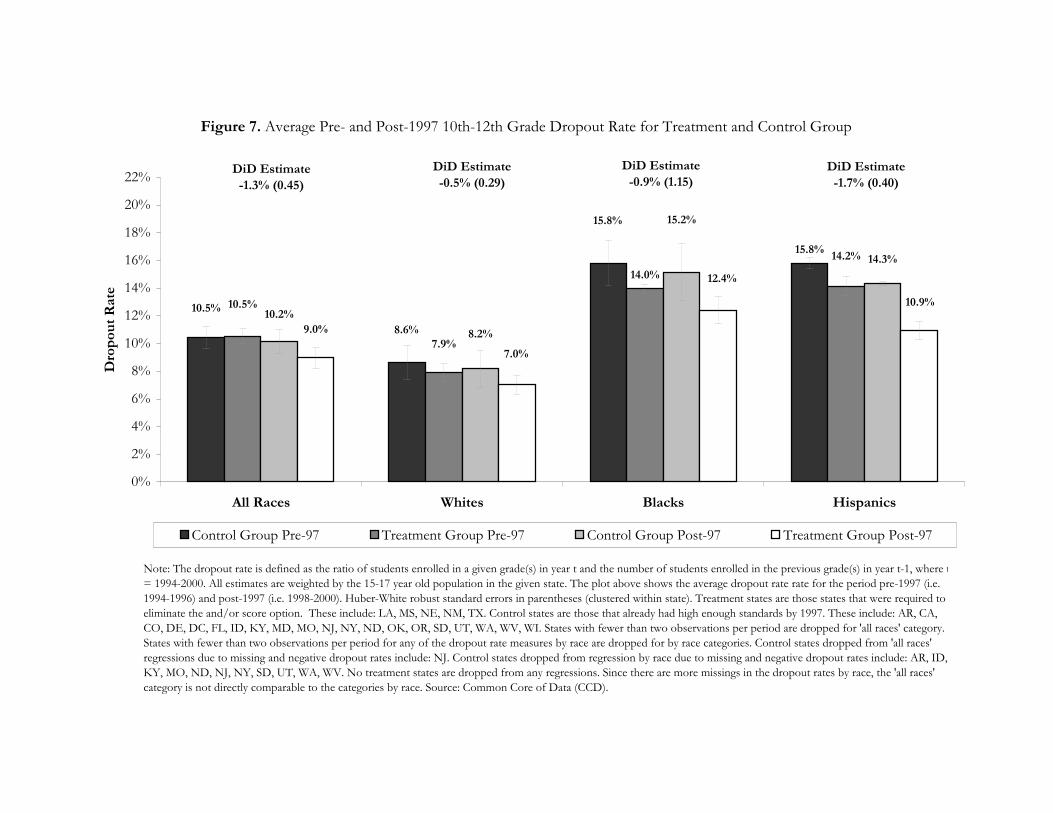
Figure 7. Average Pre- and Post-1997 10th-12th Grade Dropout Rate for Treatment and Control Group
15.8%
14.0%
15.8%
8.6%
10.5%
14.2%
7.9%
10.5%
14.3%
15.2%
8.2%
10.2%10.9%
12.4%
7.0%
9.0%
0%
2%
4%
6%
8%
10%
12%
14%
16%
18%
20%
22%
All Races Whites Blacks Hispanics
Dro
pou
t R
ate
Control Group Pre-97 Treatment Group Pre-97 Control Group Post-97 Treatment Group Post-97
Note: The dropout rate is defined as the ratio of students enrolled in a given grade(s) in year t and the number of students enrolled in the previous grade(s) in year t-1, where t= 1994-2000. All estimates are weighted by the 15-17 year old population in the given state. The plot above shows the average dropout rate rate for the period pre-1997 (i.e. 1994-1996) and post-1997 (i.e. 1998-2000). Huber-White robust standard errors in parentheses (clustered within state). Treatment states are those states that were required to eliminate the and/or score option. These include: LA, MS, NE, NM, TX. Control states are those that already had high enough standards by 1997. These include: AR, CA, CO, DE, DC, FL, ID, KY, MD, MO, NJ, NY, ND, OK, OR, SD, UT, WA, WV, WI. States with fewer than two observations per period are dropped for 'all races' category. States with fewer than two observations per period for any of the dropout rate measures by race are dropped for by race categories. Control states dropped from 'all races' regressions due to missing and negative dropout rates include: NJ. Control states dropped from regression by race due to missing and negative dropout rates include: AR, ID, KY, MO, ND, NJ, NY, SD, UT, WA, WV. No treatment states are dropped from any regressions. Since there are more missings in the dropout rates by race, the 'all races' category is not directly comparable to the categories by race. Source: Common Core of Data (CCD).
DiD Estimate -1.3% (0.45)
DiD Estimate -0.5% (0.29)
DiD Estimate -0.9% (1.15)
DiD Estimate -1.7% (0.40)

Figure 8. Average Pre- and Post-1997 10th-11th Grade Dropout Rate for Treatment and Control Group
16.5%
17.0%
8.6%
10.8%
15.2%
14.0%
8.9%
11.2%
14.3%
16.0%
8.2%
10.5%
13.3%13.4%
8.5%
10.5%
0%
2%
4%
6%
8%
10%
12%
14%
16%
18%
20%
22%
All Races Whites Blacks Hispanics
Dro
pou
t R
ate
Control Group Pre-97 Treatment Group Pre-97 Control Group Post-97 Treatment Group Post-97
Note: The dropout rate is defined as the ratio of students enrolled in a given grade(s) in year t and the number of students enrolled in the previous grade(s) in year t-1, where t = 1994-2000. All estimates are weighted by the 15-17 year old population in the given state. The plot above shows the average dropout rate rate for the period pre-1997 (i.e. 1994-1996) and post-1997 (i.e. 1998-2000). Huber-White robust standard errors in parentheses (clustered within state). Treatment states are those states that wererequired to eliminate the and/or score option. These include: LA, MS, NE, NM, TX. Control states are those that already had high enough standards by 1997. These include: AR, CA, CO, DE, DC, FL, ID, KY, MD, MO, NJ, NY, ND, OK, OR, SD, UT, WA, WV, WI. States with fewer than two observations per period are dropped for 'all races' category. States with fewer than two observations per period for any of the dropout rate measures by race are dropped for by race categories. Control states dropped from 'all races' regressions due to missing and negative dropout rates include: NJ. Control states dropped from regression by race due to missing and negative dropout rates include: AR, ID, KY, MO, ND, NJ, NY, SD, UT, WA, WV. No treatment states are dropped from any regressions. Since there are more missings in the dropout rates by race, the 'all races' category is not directly comparable to the categories by race. Source: Common Core of Data (CCD).
DiD Estimate -0.42% (0.71)
DiD Estimate 0.02% (0.67)
DiD Estimate 0.36% (1.72)
DiD Estimate 0.27% (0.74)
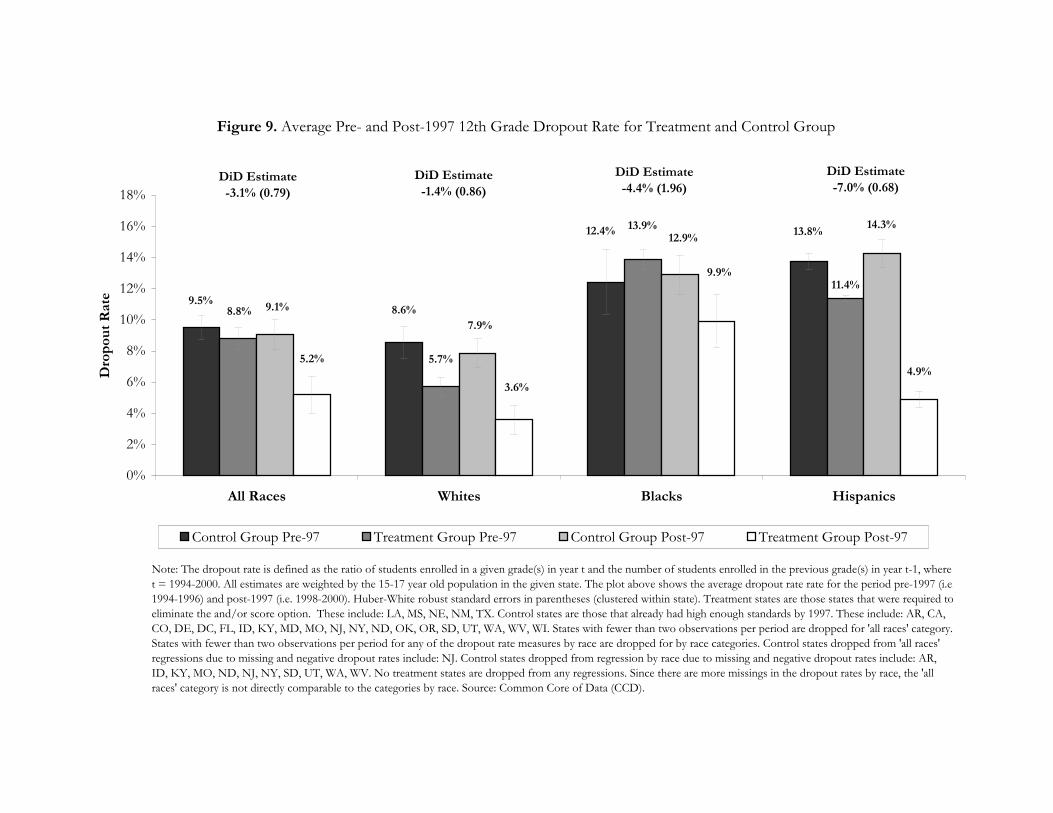
Figure 9. Average Pre- and Post-1997 12th Grade Dropout Rate for Treatment and Control Group
11.4%9.5%
8.6%
12.4% 13.8%
8.8%
5.7%
13.9%
9.1%
7.9%
12.9%14.3%
5.2%
3.6%
9.9%
4.9%
0%
2%
4%
6%
8%
10%
12%
14%
16%
18%
All Races Whites Blacks Hispanics
Dro
pou
t R
ate
Control Group Pre-97 Treatment Group Pre-97 Control Group Post-97 Treatment Group Post-97
Note: The dropout rate is defined as the ratio of students enrolled in a given grade(s) in year t and the number of students enrolled in the previous grade(s) in year t-1, where t = 1994-2000. All estimates are weighted by the 15-17 year old population in the given state. The plot above shows the average dropout rate rate for the period pre-1997 (i.e.1994-1996) and post-1997 (i.e. 1998-2000). Huber-White robust standard errors in parentheses (clustered within state). Treatment states are those states that were required toeliminate the and/or score option. These include: LA, MS, NE, NM, TX. Control states are those that already had high enough standards by 1997. These include: AR, CA, CO, DE, DC, FL, ID, KY, MD, MO, NJ, NY, ND, OK, OR, SD, UT, WA, WV, WI. States with fewer than two observations per period are dropped for 'all races' category.States with fewer than two observations per period for any of the dropout rate measures by race are dropped for by race categories. Control states dropped from 'all races' regressions due to missing and negative dropout rates include: NJ. Control states dropped from regression by race due to missing and negative dropout rates include: AR, ID, KY, MO, ND, NJ, NY, SD, UT, WA, WV. No treatment states are dropped from any regressions. Since there are more missings in the dropout rates by race, the 'all races' category is not directly comparable to the categories by race. Source: Common Core of Data (CCD).
DiD Estimate -3.1% (0.79)
DiD Estimate -1.4% (0.86)
DiD Estimate -4.4% (1.96)
DiD Estimate -7.0% (0.68)
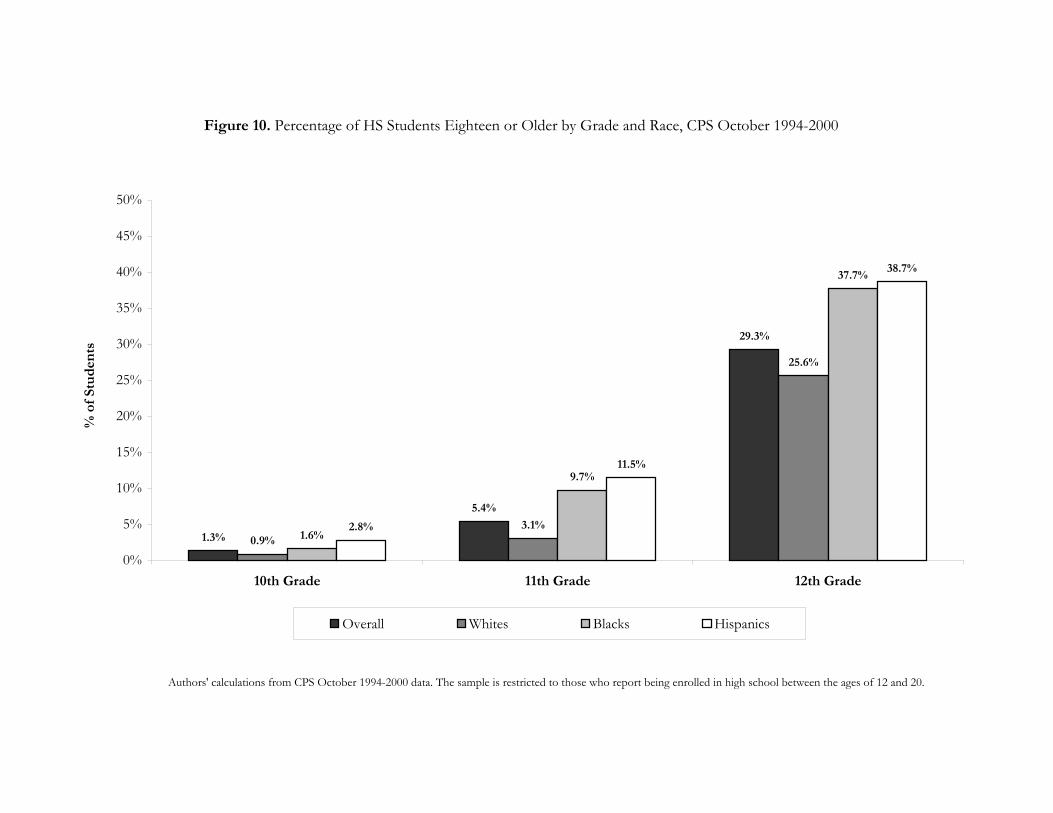
Figure 10. Percentage of HS Students Eighteen or Older by Grade and Race, CPS October 1994-2000
1.3%
5.4%
29.3%
0.9%3.1%
25.6%
1.6%
9.7%
37.7%
2.8%
11.5%
38.7%
0%
5%
10%
15%
20%
25%
30%
35%
40%
45%
50%
10th Grade 11th Grade 12th Grade
% o
f St
ud
ents
Overall Whites Blacks Hispanics
Authors' calculations from CPS October 1994-2000 data. The sample is restricted to those who report being enrolled in high school between the ages of 12 and 20.
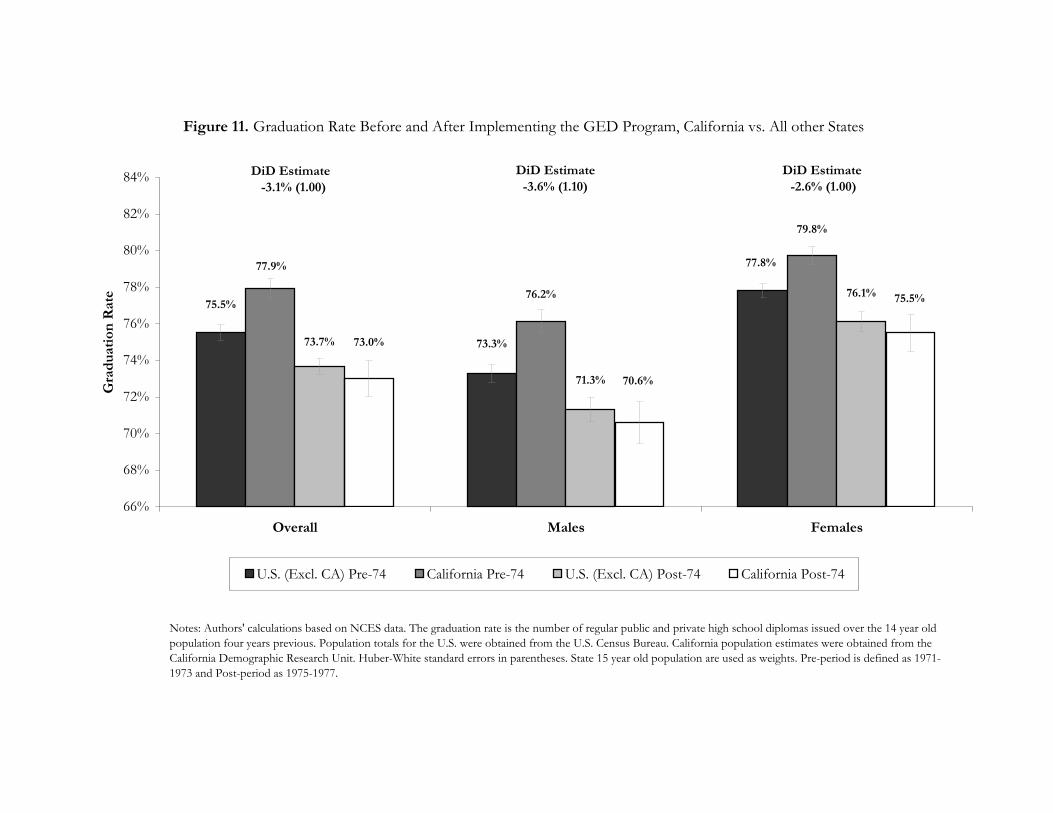
Figure 11. Graduation Rate Before and After Implementing the GED Program, California vs. All other States
77.8%
73.3%
75.5%
79.8%
76.2%
77.9%
76.1%
71.3%
73.7%
75.5%
70.6%
73.0%
66%
68%
70%
72%
74%
76%
78%
80%
82%
84%
Overall Males Females
Gra
duat
ion
Rat
e
U.S. (Excl. CA) Pre-74 California Pre-74 U.S. (Excl. CA) Post-74 California Post-74
DiD Estimate -3.1% (1.00)
Notes: Authors' calculations based on NCES data. The graduation rate is the number of regular public and private high school diplomas issued over the 14 year old population four years previous. Population totals for the U.S. were obtained from the U.S. Census Bureau. California population estimates were obtained from the California Demographic Research Unit. Huber-White standard errors in parentheses. State 15 year old population are used as weights. Pre-period is defined as 1971-1973 and Post-period as 1975-1977.
DiD Estimate-3.6% (1.10)
DiD Estimate -2.6% (1.00)
Mean N Mean N Mean N Mean N10th-12th Grade Dropout RateOverall .105 .090 .100 .098
(.019) (.021) (.033) (.032)Whites .079 .070 .086 .082
(.019) (.019) (.029) (.030)Blacks .140 .124 .158 .152
(.012) (.018) (.041) (.044)Hispanics .142 .109 .158 .143
(.020) (.019) (.018) (.014)10th-11th Grade Dropout RateOverall .112 .105 .105 .102
(.022) (.023) (.041) (.043)Whites .089 .085 .086 .082
(.024) (.023) (.037) (.042)Blacks .140 .134 .170 .160
(.019) (.015) (.042) (.051)Hispanics .152 .133 .165 .143
(.025) (.020) (.025) (.021)12th Grade Dropout RateOverall .088 .052 .095 .088
(.016) (.025) (.034) (.035)Whites .057 .036 .086 .079
(.016) (.018) (.034) (.032)Blacks .139 .099 .124 .129
(.019) (.035) (.058) (.039)Hipsanics .114 .049 .138 .143
(.019) (.024) (.033) (.036)GED Testing RateAges 16-19 0.031 0.027 0.020 0.021
(.007) (.005) (.007) (.008)Ages 16-17 0.026 0.025 0.014 0.015
(.006) (.005) (.009) (.009)Ages 18-19 .036 .029 .026 .027
(.009) (.007) (.007) (.009)Time Varying CovariatesMinimum dropout age 16.78 17.00 16.92 16.92
(.425) (.347) (.991) (.993)Minimum GED testing age 17.65 17.73 17.71 17.88
(.569) (.564) (1.031) (.937)Log per capita income 9.91 10.12 10.07 10.27
(.087) (.114) (.133) (.143)Local unemployment rate .062 .047 .062 .046
(.010) (.007) (.014) (.009)Note: Standard deviations in parentheses. The dropout rate is defined as the ratio of students enrolled in a given grade(s) in year t and the number of students enrolled in the previous grade(s) in year t-1, where t = 1994-2000. Enrollment data by grade are from the Common Core of Data (CCD). Minimum age required to drop out of school are from the Digest of Education Statistics (several years). Minimum age required to take the GED are from the yearly reports published by the GED Testing Service: "Who Took the GED?" (several years). Local unemployment rates are computed using monthly data from the Bureau of Labor Statistics. Log of per capita income are computed using data from the Census Bureau. All calculations are weighted by the 15-17 year old population in each state.
Table A-1. Summary Statistics of Variables Used in the AnlaysisTreatment Group States Control Group StatesPre-1997 (N=15)
Post-1997 (N=15)
Pre-1997 (N=57)
Post-1997 (N=57)
57
15
15
15
15
15
15
15
15
15
27
27
27
57
27
27
27
57 57
15 15
15 15
27 26
14 15 27 27
15 15 27 27
15 15 56 56
15 15 26 26
14 15 27 26
15 26 26
57
57
15
15
15
57
57
57
14
14
14
57
15
15
15
15
15
15
15
15
57
57
57
57
57
57
57
57
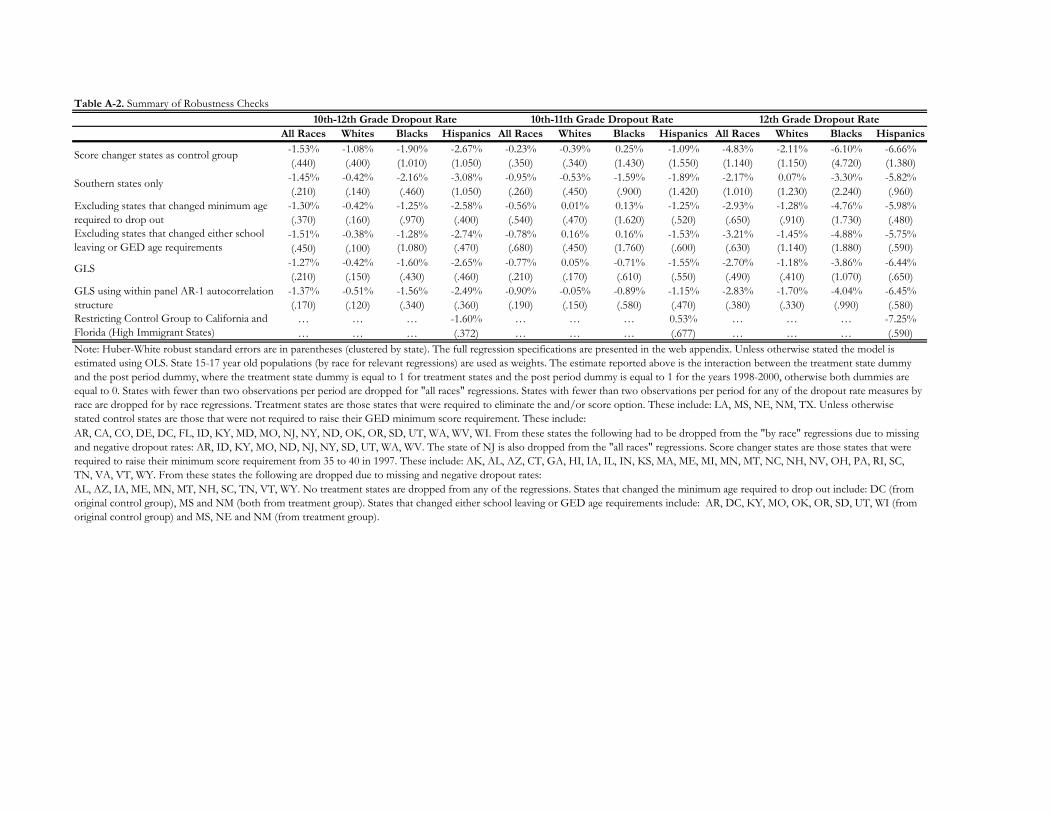
All Races Whites Blacks Hispanics All Races Whites Blacks Hispanics All Races Whites Blacks Hispanics-1.53% -1.08% -1.90% -2.67% -0.23% -0.39% 0.25% -1.09% -4.83% -2.11% -6.10% -6.66%(.440) (.400) (1.010) (1.050) (.350) (.340) (1.430) (1.550) (1.140) (1.150) (4.720) (1.380)
-1.45% -0.42% -2.16% -3.08% -0.95% -0.53% -1.59% -1.89% -2.17% 0.07% -3.30% -5.82%(.210) (.140) (.460) (1.050) (.260) (.450) (.900) (1.420) (1.010) (1.230) (2.240) (.960)
-1.30% -0.42% -1.25% -2.58% -0.56% 0.01% 0.13% -1.25% -2.93% -1.28% -4.76% -5.98%(.370) (.160) (.970) (.400) (.540) (.470) (1.620) (.520) (.650) (.910) (1.730) (.480)
-1.51% -0.38% -1.28% -2.74% -0.78% 0.16% 0.16% -1.53% -3.21% -1.45% -4.88% -5.75%(.450) (.100) (1.080) (.470) (.680) (.450) (1.760) (.600) (.630) (1.140) (1.880) (.590)
-1.27% -0.42% -1.60% -2.65% -0.77% 0.05% -0.71% -1.55% -2.70% -1.18% -3.86% -6.44%(.210) (.150) (.430) (.460) (.210) (.170) (.610) (.550) (.490) (.410) (1.070) (.650)
-1.37% -0.51% -1.56% -2.49% -0.90% -0.05% -0.89% -1.15% -2.83% -1.70% -4.04% -6.45%(.170) (.120) (.340) (.360) (.190) (.150) (.580) (.470) (.380) (.330) (.990) (.580)
… … … -1.60% … … … 0.53% … … … -7.25%… … … (.372) … … … (.677) … … … (.590)
Note: Huber-White robust standard errors are in parentheses (clustered by state). The full regression specifications are presented in the web appendix. Unless otherwise stated the model is estimated using OLS. State 15-17 year old populations (by race for relevant regressions) are used as weights. The estimate reported above is the interaction between the treatment state dummy and the post period dummy, where the treatment state dummy is equal to 1 for treatment states and the post period dummy is equal to 1 for the years 1998-2000, otherwise both dummies are equal to 0. States with fewer than two observations per period are dropped for "all races" regressions. States with fewer than two observations per period for any of the dropout rate measures by race are dropped for by race regressions. Treatment states are those states that were required to eliminate the and/or score option. These include: LA, MS, NE, NM, TX. Unless otherwise stated control states are those that were not required to raise their GED minimum score requirement. These include:
AL, AZ, IA, ME, MN, MT, NH, SC, TN, VT, WY. No treatment states are dropped from any of the regressions. States that changed the minimum age required to drop out include: DC (from original control group), MS and NM (both from treatment group). States that changed either school leaving or GED age requirements include: AR, DC, KY, MO, OK, OR, SD, UT, WI (from original control group) and MS, NE and NM (from treatment group).
AR, CA, CO, DE, DC, FL, ID, KY, MD, MO, NJ, NY, ND, OK, OR, SD, UT, WA, WV, WI. From these states the following had to be dropped from the "by race" regressions due to missing and negative dropout rates: AR, ID, KY, MO, ND, NJ, NY, SD, UT, WA, WV. The state of NJ is also dropped from the "all races" regressions. Score changer states are those states that were required to raise their minimum score requirement from 35 to 40 in 1997. These include: AK, AL, AZ, CT, GA, HI, IA, IL, IN, KS, MA, ME, MI, MN, MT, NC, NH, NV, OH, PA, RI, SC, TN, VA, VT, WY. From these states the following are dropped due to missing and negative dropout rates:
GLS
GLS using within panel AR-1 autocorrelation structureRestricting Control Group to California and Florida (High Immigrant States)
Score changer states as control group
Southern states only
Excluding states that changed minimum age required to drop outExcluding states that changed either school leaving or GED age requirements
Table A-2. Summary of Robustness Checks10th-12th Grade Dropout Rate 10th-11th Grade Dropout Rate 12th Grade Dropout Rate
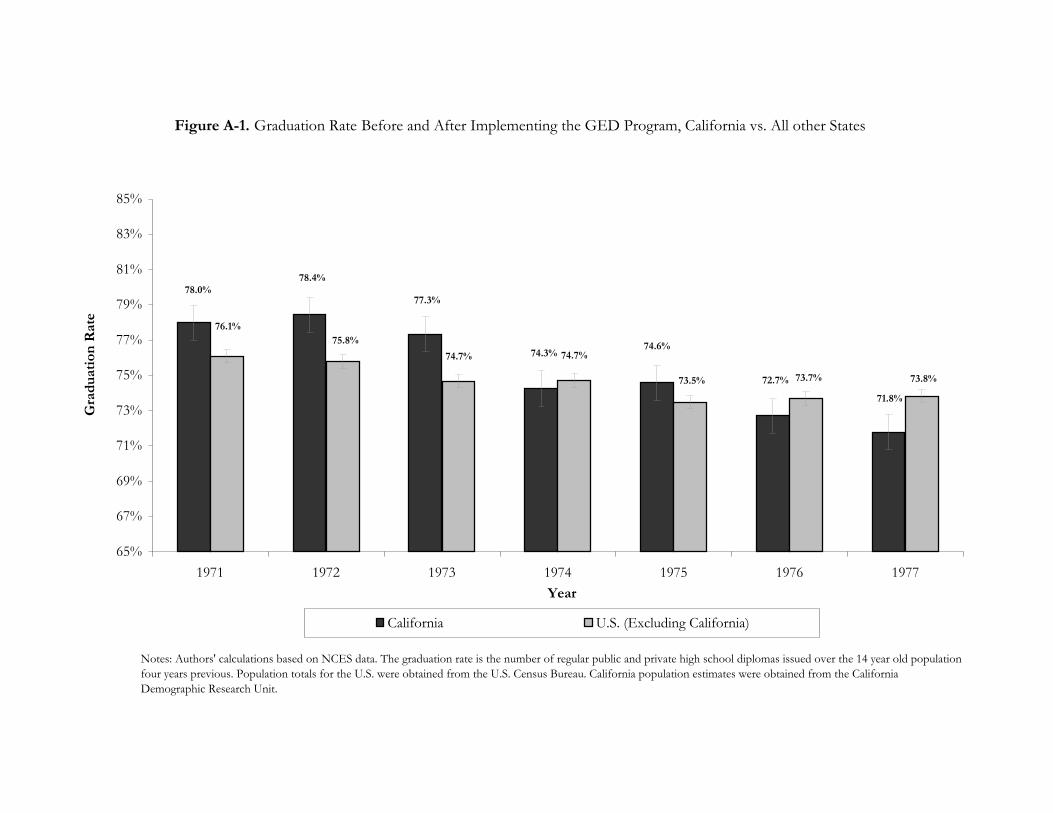
Figure A-1. Graduation Rate Before and After Implementing the GED Program, California vs. All other States
78.0%78.4%
77.3%
74.3%74.6%
72.7%
71.8%
76.1%75.8%
74.7% 74.7%
73.5% 73.7% 73.8%
65%
67%
69%
71%
73%
75%
77%
79%
81%
83%
85%
1971 1972 1973 1974 1975 1976 1977Year
Gra
duat
ion
Rat
e
California U.S. (Excluding California)
Notes: Authors' calculations based on NCES data. The graduation rate is the number of regular public and private high school diplomas issued over the 14 year old population four years previous. Population totals for the U.S. were obtained from the U.S. Census Bureau. California population estimates were obtained from the California Demographic Research Unit.