table of contents35-6a sharp-crested weir (no-end contractions) 35-6b sharp-crested weir (two-end...
TRANSCRIPT
TABLE OF CONTENTS
Table of Contents ............................................................................................................................ 1
List of Figures ................................................................................................................................. 4
35-3A Symbols and Definitions .............................................................................................. 4
35-5A Example Stage-Storage Curve ...................................................................................... 4
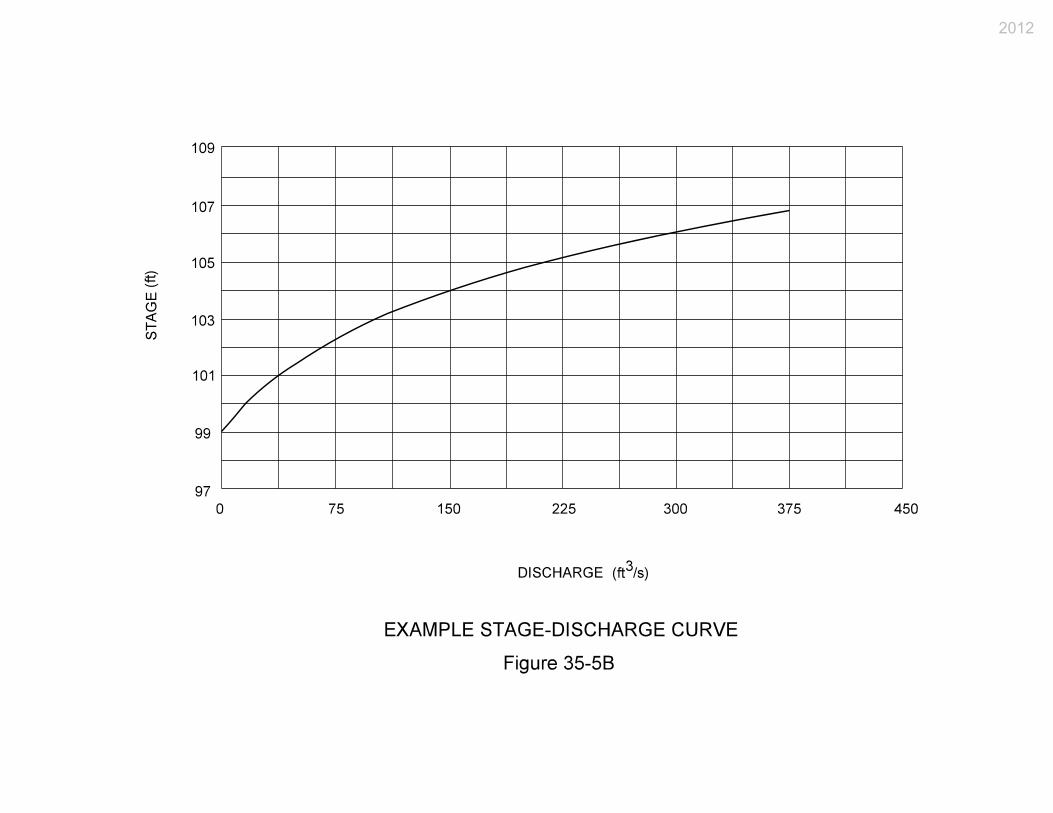
35-5B Example Stage-Discharge Curve .................................................................................. 4
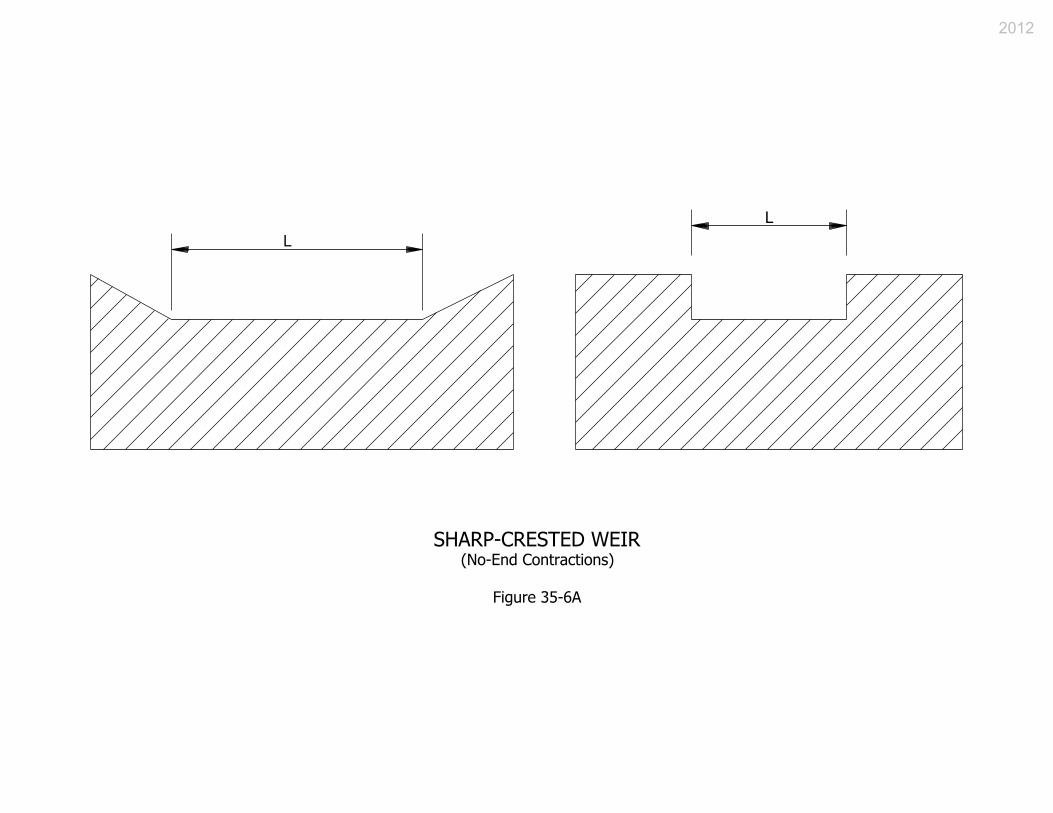
35-6A Sharp-Crested Weir (No-End Contractions) ................................................................. 4
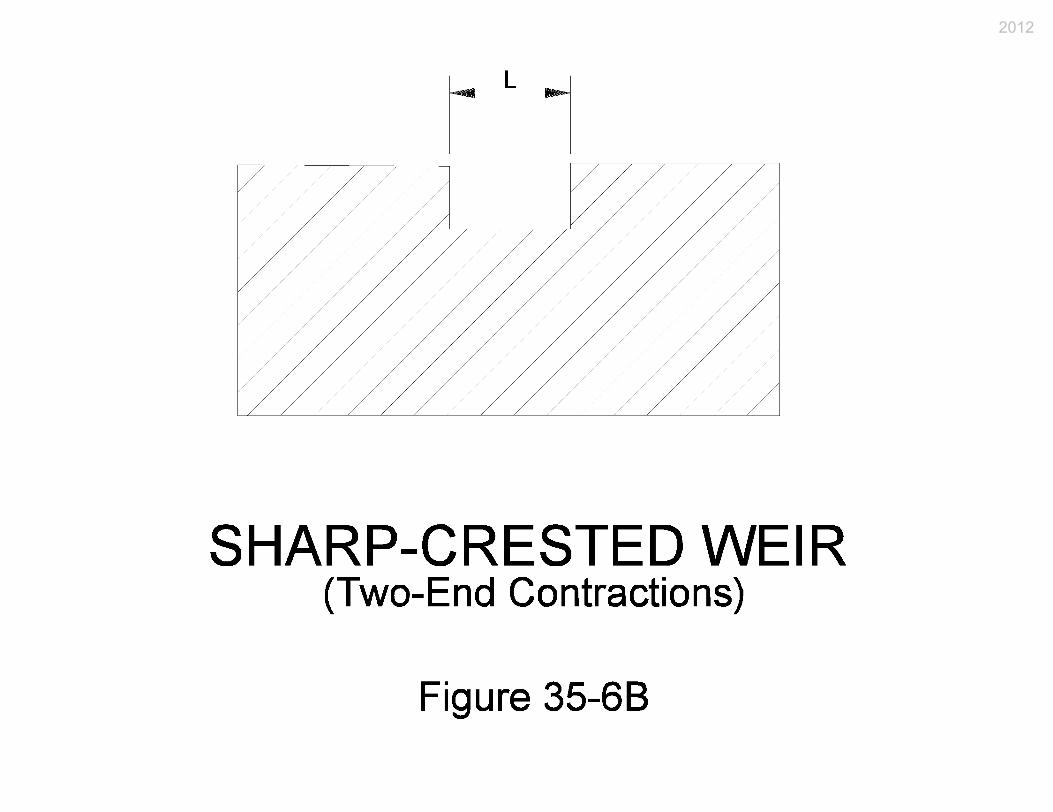
35-6B Sharp-Crested Weir (Two-End Contractions) .............................................................. 4
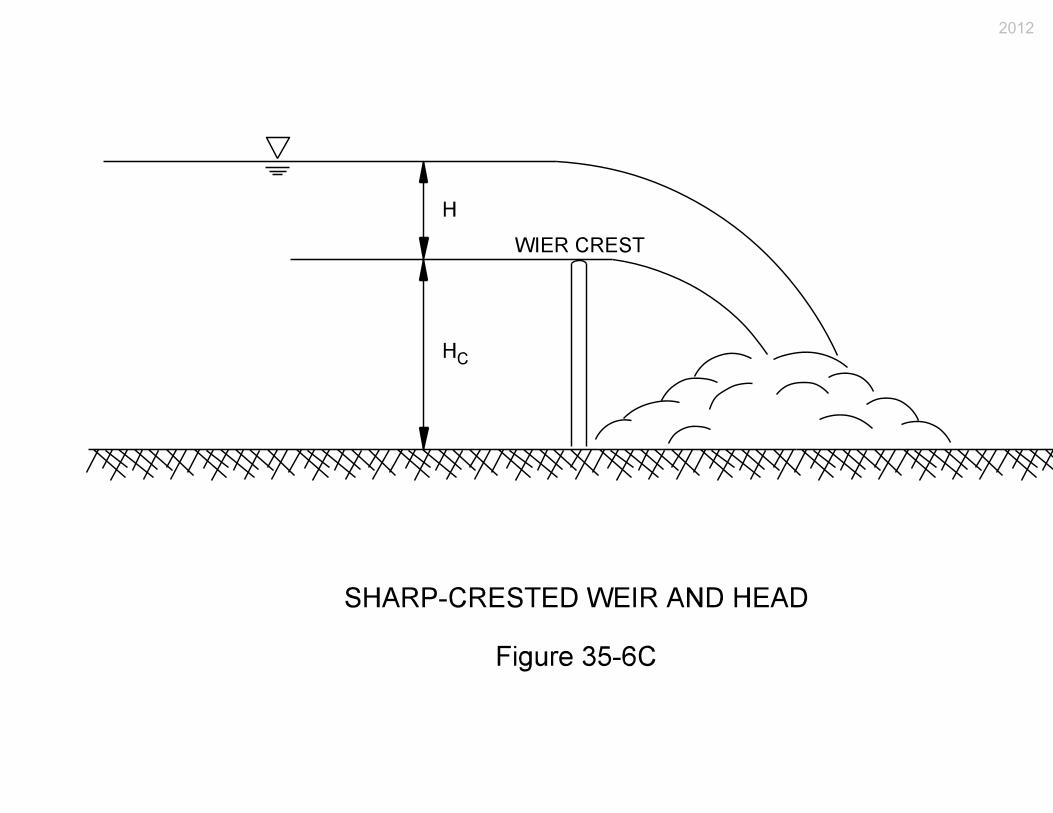
35-6C Sharp-Crested Weir and Head ...................................................................................... 4
35-6D Broad-Crested Weir Coefficient C Values as a Function of Weir Crest Breadth and
Head Weir Crest Breadth (ft) .................................................................................................. 4
35-6E Proportional Weir Dimensions ..................................................................................... 4
35-7A Triangular-Shaped Hydrographs (For Preliminary Estimate of Required Storage
Volume) .................................................................................................................................. 4
35-8A Example Stage-Storage Curve ...................................................................................... 4
35-8B Example Stage-Discharge Curve .................................................................................. 4
35-8C Storage Characteristics ................................................................................................. 4
35-8D Storage Characteristic Curve ........................................................................................ 4
35-9A Example Runoff Hydrographs ...................................................................................... 4
35-9B Stage-Discharge-Storage Data ...................................................................................... 4
35-9C Storage Routing for the 50-Year Storm ........................................................................ 4
35-11A Wet Pond (After Schueler, 1987).............................................................................. 4
Chapter Thirty-five ......................................................................................................................... 5
35-1.0 INTRODUCTION .............................................................................................................. 5
35-1.01 Overview ...................................................................................................................... 5
35-1.02 Safety Considerations ................................................................................................... 5
35-1.03 Detention and Retention ............................................................................................... 5
35-1.04 Computer Programs ...................................................................................................... 6
35-2.0 USES .................................................................................................................................. 6
35-2.01 Introduction [Rev. Jan. 2011] ....................................................................................... 6
35-2.02 Objectives ..................................................................................................................... 7
35-3.0 SYMBOLS AND DEFINITIONS ...................................................................................... 7
35-4.0 DESIGN CRITERIA .......................................................................................................... 7
35-4.01 General Criteria [Rev. Jan. 2011[ ................................................................................. 7
35-4.02 Release Rate ................................................................................................................. 8
35-4.03 Storage .......................................................................................................................... 8
35-4.04 Grading and Depth........................................................................................................ 8
35-4.04(01) General ............................................................................................................... 8
2012
35-4.04(02) Dry-Bottom Detention ....................................................................................... 9
35-4.04(03) Wet-Bottom Detention ....................................................................................... 9
35-4.05 Outlet Works................................................................................................................. 9
35-5.0 GENERAL PROCEDURE ................................................................................................. 9
35-5.01 Data Needs .................................................................................................................. 10
35-5.02 Stage-Storage Curve ................................................................................................... 10
35-5.03 Stage-Discharge Curve ............................................................................................... 11
35-5.04 Procedure .................................................................................................................... 11
35-5.05 Computer Procedures ................................................................................................. 12
35-6.0 OUTLET HYDRAULICS ................................................................................................ 12
35-6.01 Outlets ......................................................................................................................... 12
35-6.02 Sharp-Crested Weir .................................................................................................... 13
35-6.03 Broad-Crested Weir .................................................................................................... 13
35-6.04 V-Notch Weir ............................................................................................................. 14
35-6.05 Proportional Weir ....................................................................................................... 14
35-6.06 Orifice ......................................................................................................................... 15
35-7.0 PRELIMINARY DETENTION CALCULATIONS ....................................................... 15
35-7.01 Storage Volume .......................................................................................................... 15
35-7.02 Alternative Method ..................................................................................................... 15
35-7.03 Peak-Flow Reduction ................................................................................................. 16
35-7.04 Preliminary Basin Dimensions ................................................................................... 17
35-8.0 ROUTING CALCULATIONS......................................................................................... 17
35-9.0 EXAMPLE PROBLEM ................................................................................................... 19
35-9.01 Example ...................................................................................................................... 19
35-9.02 Design Discharge and Hydrographs ........................................................................... 19
35-9.03 Preliminary Volume Calculations .............................................................................. 19
35-9.04 Design and Routing Calculations ............................................................................... 19
35-10.0 DRY-BOTTOM DETENTION BASIN ........................................................................ 20
35-10.01 Introduction .............................................................................................................. 20
35-10.02 Design ....................................................................................................................... 20
35-10.03 Other Considerations ................................................................................................ 21
35-11.0 WET-BOTTOM DETENTION BASIN ........................................................................ 21
35-11.01 Introduction .............................................................................................................. 21
35-11.02 Design ....................................................................................................................... 21
35-11.03 Other Considerations ................................................................................................ 22
35-11.04 Illustration ................................................................................................................. 22
35-12.0 LANDLOCKED RETENTION [Rev. Jan. 2011] .......................................................... 22
35-13.0 CONSTRUCTION AND MAINTENANCE CONSIDERATIONS .............................. 22
2012

35-14.0 PROTECTIVE TREATMENT....................................................................................... 23
35-15.0 REFERENCES ............................................................................................................... 24
2012

LIST OF FIGURES
Figure Title
35-3A Symbols and Definitions
35-5A Example Stage-Storage Curve
35-5B Example Stage-Discharge Curve
35-6A Sharp-Crested Weir (No-End Contractions)
35-6B Sharp-Crested Weir (Two-End Contractions)
35-6C Sharp-Crested Weir and Head
35-6D Broad-Crested Weir Coefficient C Values as a Function of Weir Crest Breadth
and Head Weir Crest Breadth (ft)
35-6E Proportional Weir Dimensions
35-7A Triangular-Shaped Hydrographs (For Preliminary Estimate of Required Storage
Volume)
35-8A Example Stage-Storage Curve
35-8B Example Stage-Discharge Curve
35-8C Storage Characteristics
35-8D Storage Characteristic Curve
35-9A Example Runoff Hydrographs
35-9B Stage-Discharge-Storage Data
35-9C Storage Routing for the 50-Year Storm
35-11A Wet Pond (After Schueler, 1987)
2012
CHAPTER THIRTY-FIVE
STORAGE FACILITIES
35-1.0 INTRODUCTION
35-1.01 Overview
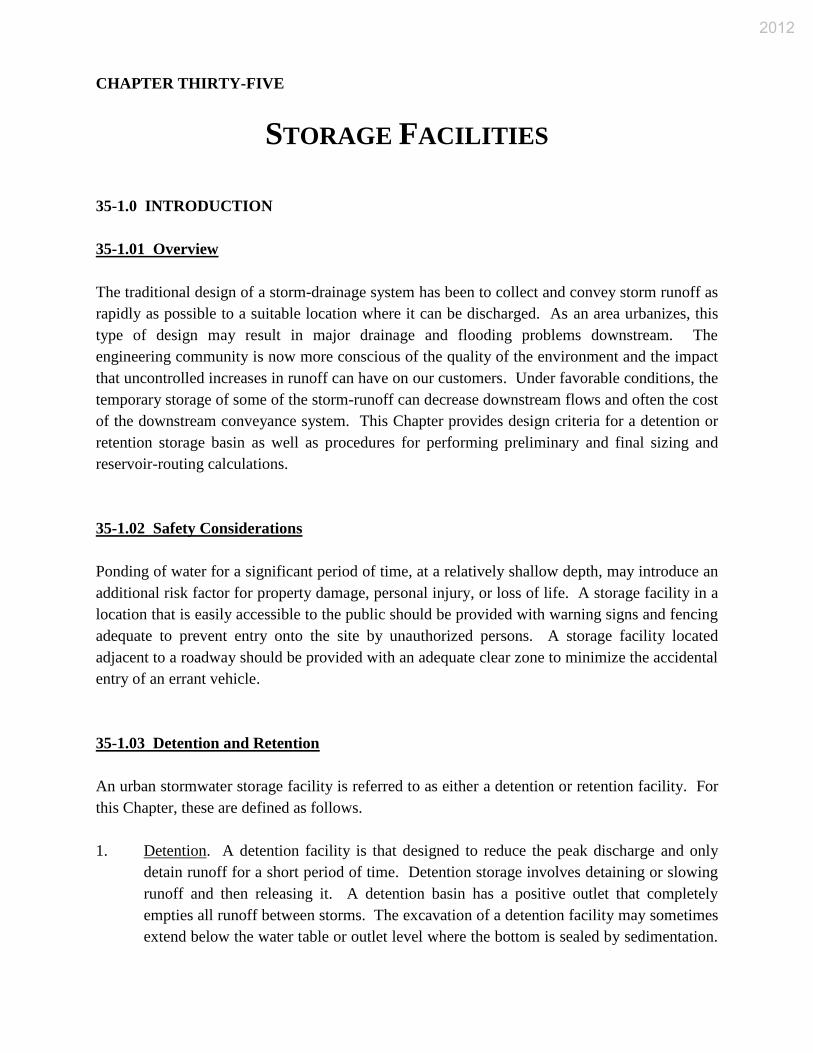
The traditional design of a storm-drainage system has been to collect and convey storm runoff as
rapidly as possible to a suitable location where it can be discharged. As an area urbanizes, this
type of design may result in major drainage and flooding problems downstream. The
engineering community is now more conscious of the quality of the environment and the impact
that uncontrolled increases in runoff can have on our customers. Under favorable conditions, the
temporary storage of some of the storm-runoff can decrease downstream flows and often the cost
of the downstream conveyance system. This Chapter provides design criteria for a detention or
retention storage basin as well as procedures for performing preliminary and final sizing and
reservoir-routing calculations.
35-1.02 Safety Considerations
Ponding of water for a significant period of time, at a relatively shallow depth, may introduce an
additional risk factor for property damage, personal injury, or loss of life. A storage facility in a
location that is easily accessible to the public should be provided with warning signs and fencing
adequate to prevent entry onto the site by unauthorized persons. A storage facility located
adjacent to a roadway should be provided with an adequate clear zone to minimize the accidental
entry of an errant vehicle.
35-1.03 Detention and Retention
An urban stormwater storage facility is referred to as either a detention or retention facility. For
this Chapter, these are defined as follows.
1. Detention. A detention facility is that designed to reduce the peak discharge and only
detain runoff for a short period of time. Detention storage involves detaining or slowing
runoff and then releasing it. A detention basin has a positive outlet that completely
empties all runoff between storms. The excavation of a detention facility may sometimes
extend below the water table or outlet level where the bottom is sealed by sedimentation.
2012

This is referred to as a detention pond or wet-bottom detention basin. The detention pond
also has a positive outlet and releases all temporary storage.
A detention facility may be designed to contain a permanent pool of water. The use of a
dry-bottom detention pond is recommended for an INDOT project. Because most of the
design procedures are the same for a wet- or a dry-bottom detention facility, the term
storage facility will be used in this Chapter to mean either.
2. Retention. A retention facility retains runoff for an indefinite amount of time and has no
positive outlet. Runoff is removed only by infiltration through a porous bottom or by
evaporation. A retention pond or lake is an example of a retention facility that may be
built in a development, and, may enhance the overall project. A retention basin is
designed to drain into the groundwater table. This is not addressed herein.
A storage facility is most often small in terms of storage capacity and dam height, and will serve
a single outfall from a watershed of a few acres. A very small facility may be contained in a
parking lot or other on-site facility. Although the same principles apply to each storage facility,
Section 35-10.0 more-specifically relates to a smaller installation.
If other procedures are needed for the design of a detention or retention facility, these will be
specified.
35-1.04 Computer Programs
Routing calculations needed to design a storage facility, although not extremely complex, are
time-consuming and repetitive. To assist with these calculations, there are many available
reservoir-routing computer programs. If the watershed draining into a storage facility is greater
than 2 acres, design should be based upon reservoir-routing methods which develop hydrographs
for both inflow and outflow. A smaller basin may be analyzed using the storage-indication
method or the Rational Method.
35-2.0 USES
35-2.01 Introduction [Rev. Jan. 2011]
The use of a storage facility for stormwater management has increased in recent years.
Controlling the quantity of stormwater using a storage facility can provide the potential benefits
as follows:
1. prevention or reduction of peak runoff rate increases caused by urban development;
2012

2. mitigation of downstream drainage capacity problems;
3. reduction or elimination of the need for downstream outfall improvements; and
4. maintenance of historically low flow rates by controlled discharge from storage.
5. improvement of downstream water quality through stormwater-pollution-prevention
BMP design features.
35-2.02 Objectives
The objectives for managing stormwater quantity by a storage facility are based on limiting peak
runoff rates to match either or both of the values as follows:
1. historic rates for specific design conditions (i.e., post-development peak equals pre-
development peak for a particular frequency of occurrence); or
2. non-hazardous discharge capacity of the downstream drainage system.
For a watershed without an adequate outfall, the total volume of runoff is critical. A storage
facility is used to store the stormwater due to increases in volume and control-discharge rates.
35-3.0 SYMBOLS AND DEFINITIONS
To provide consistency within this Chapter and throughout this Manual, the symbols in Figure
35-3A will be used. These symbols were selected because of their wide use in technical
publications. The same symbol may be used in existing publications for more than one
definition. Where this occurs in this Chapter, the symbol will be defined where it occurs in the
text or equations.
35-4.0 DESIGN CRITERIA
35-4.01 General Criteria [Rev. Jan. 2011[
Storage may be developed in a depressed area in a parking lot, road embankment, freeway
interchange, or a small lake, pond, or depression within an urban development. The utility of a
storage facility depends on the amount of storage, its location within the system, and its
operational characteristics. An analysis of such a storage facility should consist of comparing
the design flow at a point or points downstream of the proposed storage site, with or without
storage. Other flows in excess of the design flow that may be expected to pass through the
storage facility may be required in the analysis (i.e., 100-year flood). The design criteria for a
storage facility should include the following:
2012

1. release rate;
2. storage volume;
3. grading and depth requirements;
4. outlet works;
5. location; and
6. water-quality design requirements.
35-4.02 Release Rate
At a minimum, a storage facility should be designed to detain the 50-year, post-development
peak runoff and release it at the 10-year, pre-developed peak runoff rate. If applicable, it should
also satisfy the more-restrictive requirements that may be imposed by a local jurisdiction. An
emergency overflow capable of accommodating the 100-year discharge may be required in a
facility using a dam.
35-4.03 Storage
Routing calculations must be used to demonstrate that the facility-storage volume is adequate to
provide the required detention. If sedimentation during construction causes loss of detention
volume, design dimensions should be restored before completion of the project. For a detention
basin, all detention volume should be drained within the average period between storm events, or
72 h.
35-4.04 Grading and Depth
35-4.04(01) General
The construction of a storage facility requires excavation or placement of an earthen
embankment to obtain sufficient storage volume. The embankment should be of less than 6.5 ft
height. A vegetated embankment should have side slopes not steeper than 3H:1V. A riprap-
protected embankment should not be steeper than 2H:1V. An excavated storage facility should
not have an operating design pool depth of greater than 5 ft unless specifically approved by the
Hydraulics Team.
A minimum freeboard of 1 ft above the 100-year-storm high-water elevation should be provided.
Other considerations in setting the depth include flood-elevation requirements, public safety,
land availability, land value, present and future land use, water-table fluctuations, soil
2012
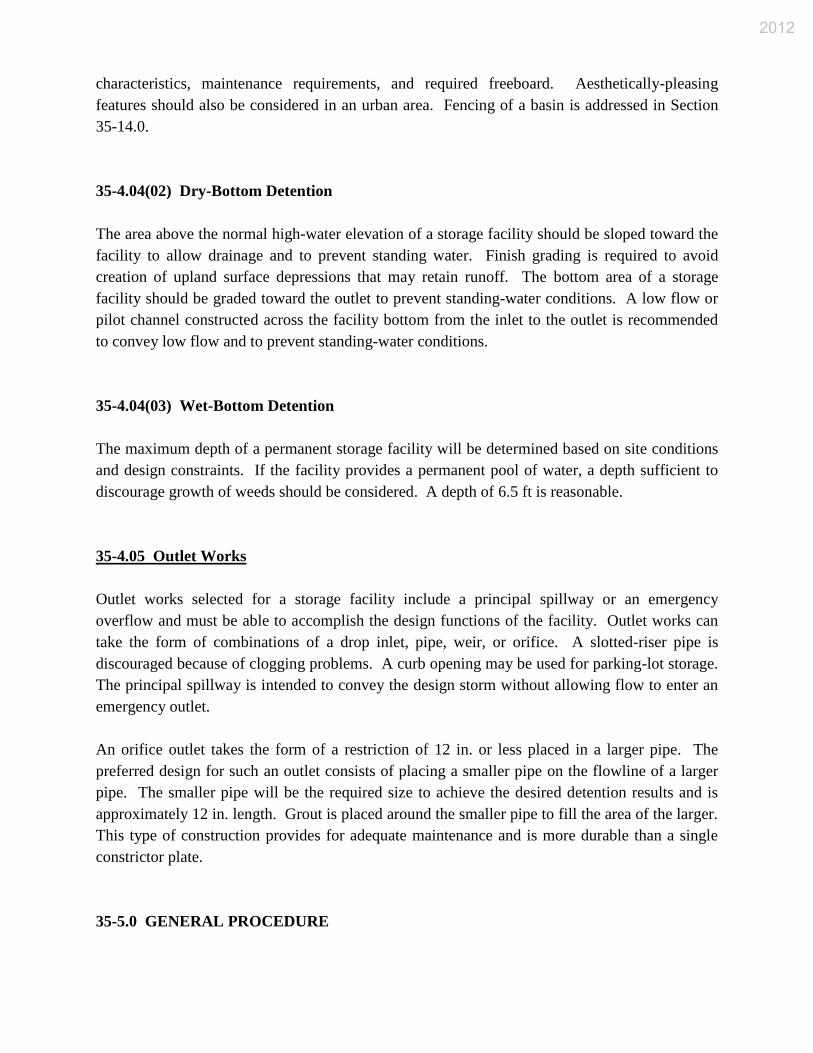
characteristics, maintenance requirements, and required freeboard. Aesthetically-pleasing
features should also be considered in an urban area. Fencing of a basin is addressed in Section
35-14.0.
35-4.04(02) Dry-Bottom Detention
The area above the normal high-water elevation of a storage facility should be sloped toward the
facility to allow drainage and to prevent standing water. Finish grading is required to avoid
creation of upland surface depressions that may retain runoff. The bottom area of a storage
facility should be graded toward the outlet to prevent standing-water conditions. A low flow or
pilot channel constructed across the facility bottom from the inlet to the outlet is recommended
to convey low flow and to prevent standing-water conditions.
35-4.04(03) Wet-Bottom Detention
The maximum depth of a permanent storage facility will be determined based on site conditions
and design constraints. If the facility provides a permanent pool of water, a depth sufficient to
discourage growth of weeds should be considered. A depth of 6.5 ft is reasonable.
35-4.05 Outlet Works
Outlet works selected for a storage facility include a principal spillway or an emergency
overflow and must be able to accomplish the design functions of the facility. Outlet works can
take the form of combinations of a drop inlet, pipe, weir, or orifice. A slotted-riser pipe is
discouraged because of clogging problems. A curb opening may be used for parking-lot storage.
The principal spillway is intended to convey the design storm without allowing flow to enter an
emergency outlet.
An orifice outlet takes the form of a restriction of 12 in. or less placed in a larger pipe. The
preferred design for such an outlet consists of placing a smaller pipe on the flowline of a larger
pipe. The smaller pipe will be the required size to achieve the desired detention results and is
approximately 12 in. length. Grout is placed around the smaller pipe to fill the area of the larger.
This type of construction provides for adequate maintenance and is more durable than a single
constrictor plate.
35-5.0 GENERAL PROCEDURE
2012
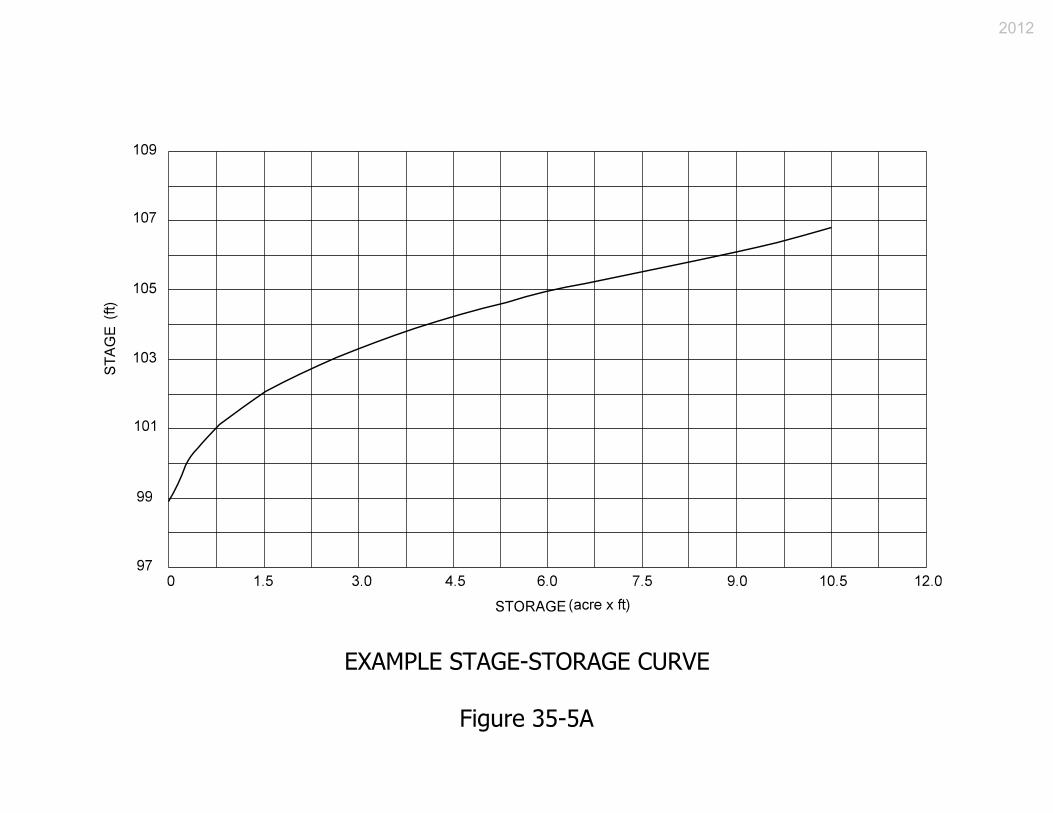
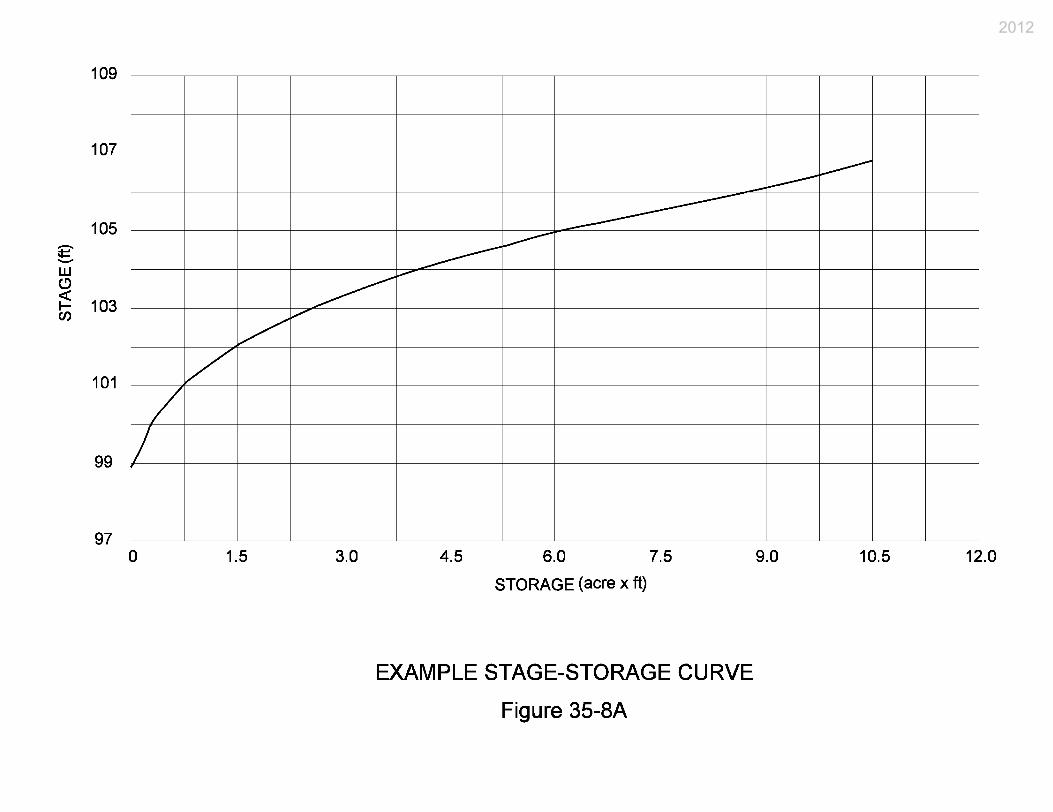
35-5.01 Data Needs The data required to complete the storage design and routing calculations are as follows: 1. inflow hydrograph for each selected design storm; 2. stage-storage curve for the proposed storage facility (see Figure 35-5A for an example).
For a large storage volume, use acre/feet, otherwise use cubic feet; and 3. stage-discharge curve for each outlet-control structure (see Figure 35-5B for an example). Using these data, a design procedure is used to route the inflow hydrograph through the storage facility with different basin and outlet configurations until the desired outflow hydrograph is achieved. See the example problem in Section 35-8.0. 35-5.02 Stage-Storage Curve A stage-storage curve defines the relationship between the depth of water and storage volume in a reservoir. The data for this type of curve are developed using a topographic map and one of the following formulas, the average-end area, frustum of a pyramid, or prismoidal. A storage basin may be irregular in shape to blend well with the surrounding terrain and to improve aesthetics. Therefore, the average-end-area formula is preferred as the method to be used for a non-geometric area. The double-end-area formula is expressed as follows:
221
2,1
AAdV
(Equation 35-5.1)
Where: V1,2 = storage volume, ft3, between elevations 1 and 2
A1 = surface area at elevation 1, ft2 A2 = surface area at elevation 2, ft2 d = change in elevation between points 1 and 2, ft
The frustum of a pyramid is expressed as follows:
32
5.0211 AAAAdV
(Equation 35-5.2)
Where: V = volume of frustum of a pyramid, ft3
d = change in elevation between points 1 and 2, ft A1 = surface area at elevation 1, ft2 A2 = surface area at elevation 2, ft2
2012

The prismoidal formula for a trapezoidal basin is expressed as follows:
2
32
3
4
ZD
ZWLDLWDV
(Equation 35-5.3)
Where: V = volume of trapezoidal basin, ft3
L = length of basin at base, ft W = width of basin at base, ft D = depth of basin, ft Z = side slope factor, ratio of horizontal to vertical
35-5.03 Stage-Discharge Curve A stage-discharge curve defines the relationship between the depth of water and the discharge or outflow from a storage facility. A storage facility has two spillways: principal and emergency. The principal spillway is designed with a capacity sufficient to convey the design flood without allowing flow to enter the emergency spillway. A pipe culvert, weir, or other appropriate outlet can be used for the principal spillway or outlet. Tailwater influences and structure losses must be considered in developing discharge curves. The emergency spillway, when needed, is sized to provide a bypass for floodwater during a flood that exceeds the design capacity of the principal spillway. This spillway should be designed taking into account the potential threat to downstream life and property if the storage facility were to fail. The stage-discharge curve should take into account the discharge characteristics of both the principal and emergency spillways. 35-5.04 Procedure The procedure for using the above data in the design of a storage facility is described below. 1. Compute inflow hydrographs for runoff from the design storm using the procedure
outlined in Chapter Twenty-nine. 2. Perform preliminary calculations to evaluate detention-storage requirements for the
hydrographs from Step 1 (see Section 35-7.0 for recommended methods). 3. Determine the physical dimensions necessary to hold the estimated volume from Step 2,
including freeboard. The maximum storage requirement calculated from Step 2 should be used.
2012
4. Size the outlet structure. The estimated peak stage will occur for the estimated volume
from Step 2. The outlet structure should be sized to convey the allowable discharge at this stage. Ascertain that tailwater effects have been considered.
5. Perform routing calculations using inflow hydrographs from Step 1 to check the
preliminary design using the storage-routing equations. If the routed post-development peak discharge from the 50-year design storm exceeds the pre-development 10-year peak discharge, or if the peak stage varies significantly from the estimated peak stage from Step 4, revise the estimated volume and return to Step 3.
6. Where required, consider emergency overflow from runoff due to the 100-year design
storm and established freeboard requirements. 7. Evaluate the control structure outlet velocity and provide channel and bank stabilization
if the velocity will cause erosion problems downstream. This procedure can involve a significant number of reservoir-routing calculations to obtain the desired results. 35-5.05 Computer Procedures A number of commercial computer software packages exist which automate a number of the steps described above. Although these programs can greatly accelerate the design process, they should be used with caution. The output from these programs should be reviewed considering sound engineering judgment. Except in modeling a drainage area of less than 2 acres, the programs must be capable of developing hydrographs for both inflow and outflow. For an area of less than 2 acres, the Rational Method is acceptable for generating the inflow hydrographs. 35-6.0 OUTLET HYDRAULICS 35-6.01 Outlets Sharp-crested-weir flow equations for a no-end contraction, a two-end contraction, and submerged discharge conditions are provided below, followed by equations for a broad-crested weir, V-notch weir, proportional weir, orifice, or a combination of these facilities. If a culvert is used as an outlet works, the procedure described in Chapter Thirty-one should be used to develop stage-discharge data. In analyzing release rates, tailwater influences must be considered to determine the effective head on each outlet. A slotted riser-pipe outlet facility should be avoided.
2012
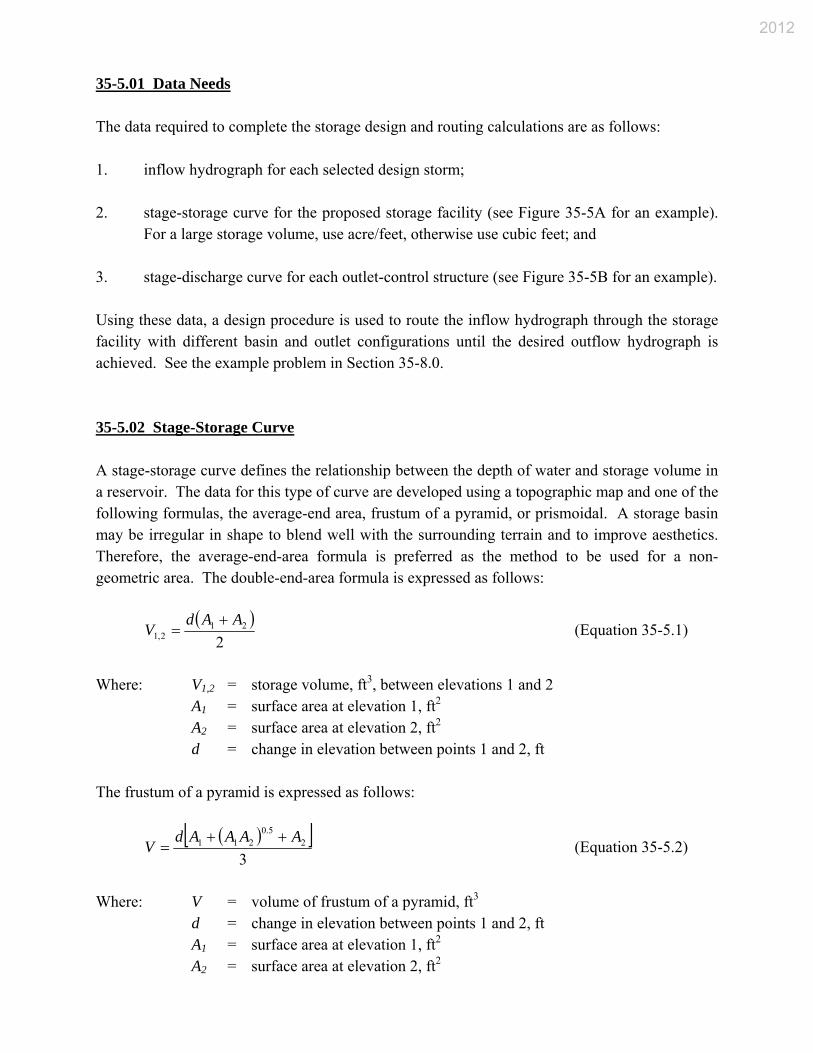
35-6.02 Sharp-Crested Weir A sharp-crested weir with no-end contractions is illustrated in Figure 35-6A. The discharge equation for this configuration is as follows (Chow, 1959):
cHHLHQ 4.027.35.1 (Equation 35-6.1)
Where: Q = discharge, ft3/s
H = head above weir crest excluding velocity head, ft Hc = height of weir crest above channel bottom, ft L = horizontal weir length, ft
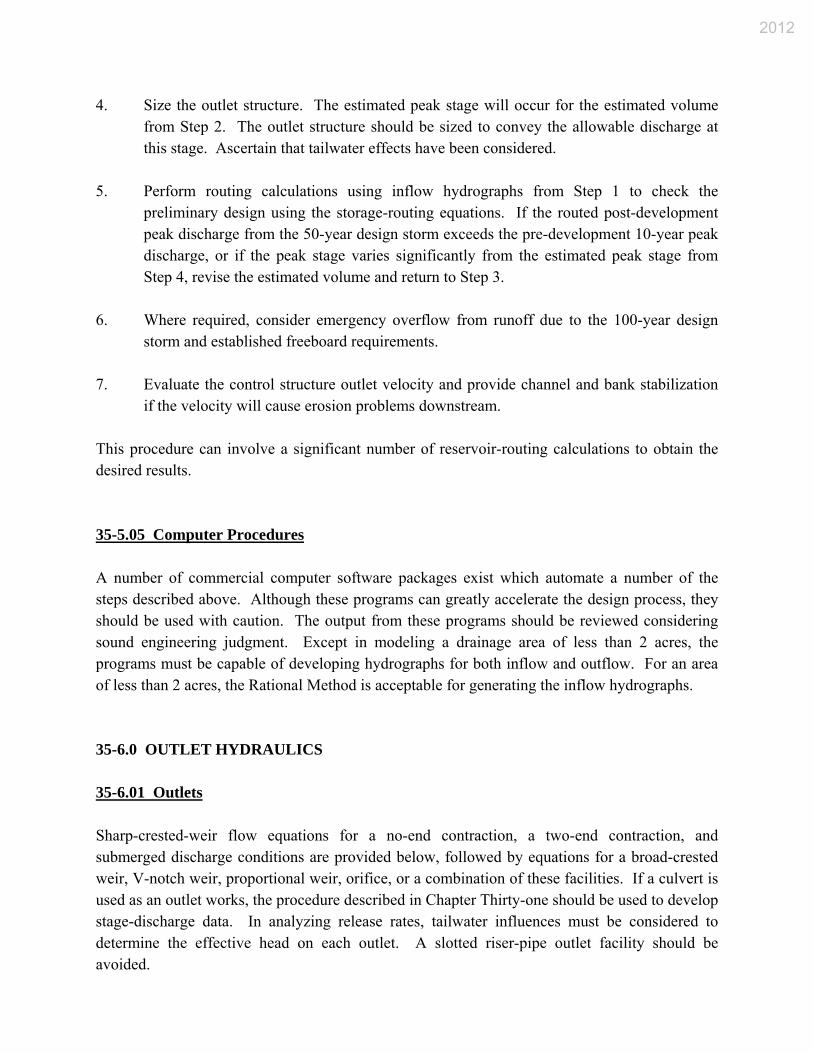
A sharp-crested weir with two-end contractions is illustrated in Figure 35-6B. The discharge equation for this configuration is as follows (Chow, 1959):
cHHHHLQ 4.027.32.0 5.1 (Equation 35-6.2)
Where the variables are the same as for Equation 35-6.4. Figure 35-6C illustrates a sharp-crested weir and head. A sharp-crested weir will be affected by submergence if the tailwater rises above the weir-crest elevation. The result will be that the discharge over the weir will be reduced. The discharge equation for a sharp-crested submerged weir is as follows (Brater and King, 1976):
385.05.1
1
21
HHQQ fS (Equation 35-6.3)
Where: QS = submergence flow, ft3/s
Qf = free flow, ft3/s H1 = upstream head above crest, ft H2 = downstream head above crest, ft
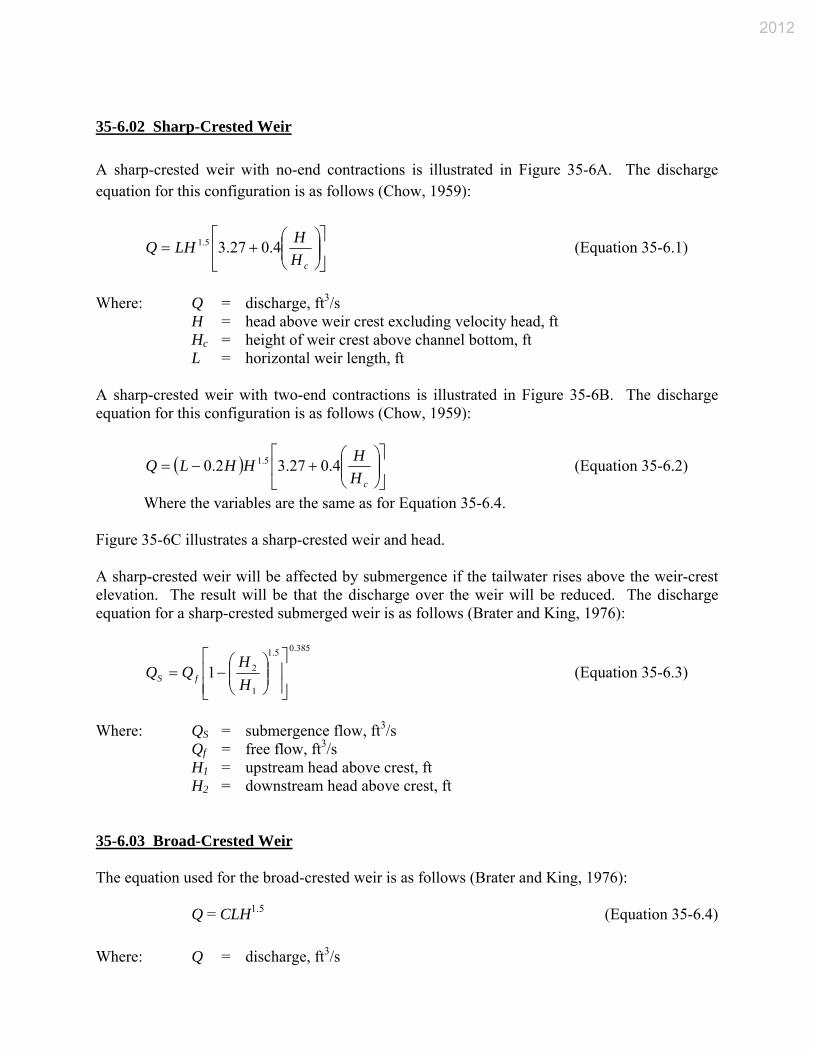
35-6.03 Broad-Crested Weir The equation used for the broad-crested weir is as follows (Brater and King, 1976):
Q = CLH1.5 (Equation 35-6.4) Where: Q = discharge, ft3/s
2012
C = broad-crested weir coefficient L = broad-crested weir length, ft H = head above weir crest, ft
If the upstream edge of a broad-crested weir is so rounded as to prevent contraction, and if the slope of the crest is as great as the loss of head due to friction, flow will pass through critical depth at the weir crest. This yields the maximum C value of 1.704. For sharp corners on the broad-crested weir, a minimum C value of 1.435 should be used. Additional information on C value as a function of weir-crest breadth and head is shown in Figure 35-6D. 35-6.04 V-Notch Weir The discharge through a V-notch weir can be calculated from the equation as follows (Brater and King, 1976):
Q = 2.5 tan(φ/2)H2.5 (Equation 35-6.5) Where: Q = discharge, ft3/s
φ = angle of V-notch, deg H = head on apex of notch, ft
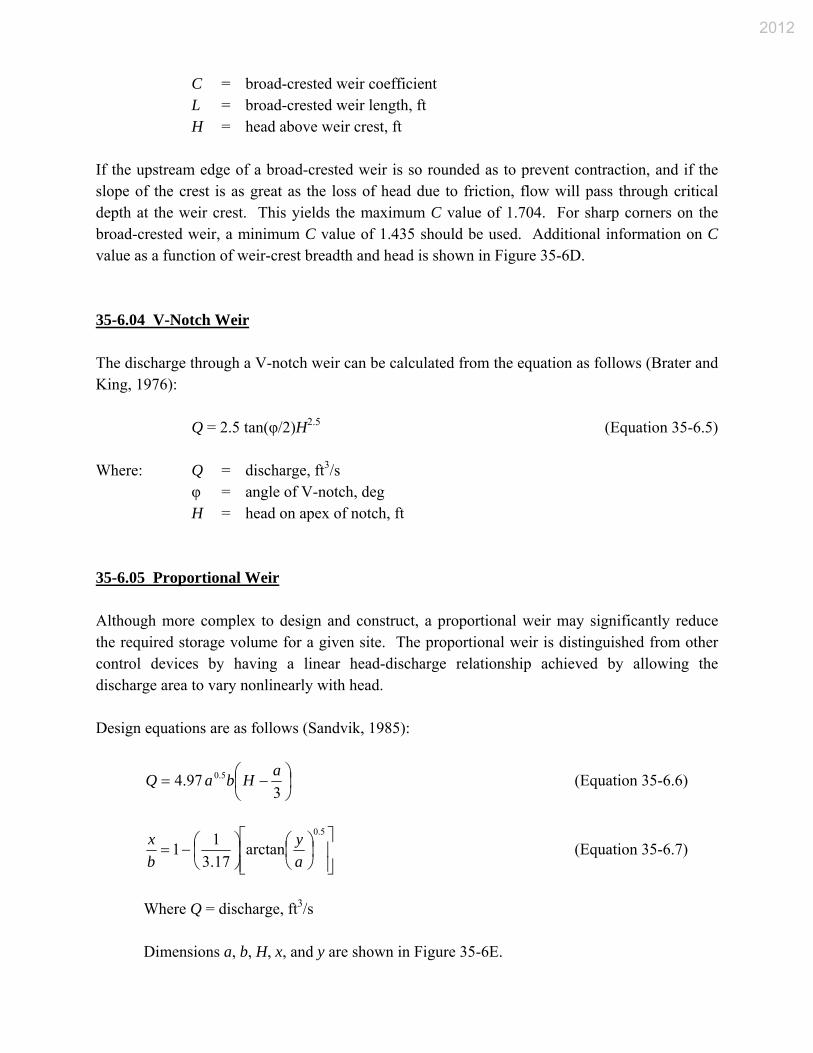
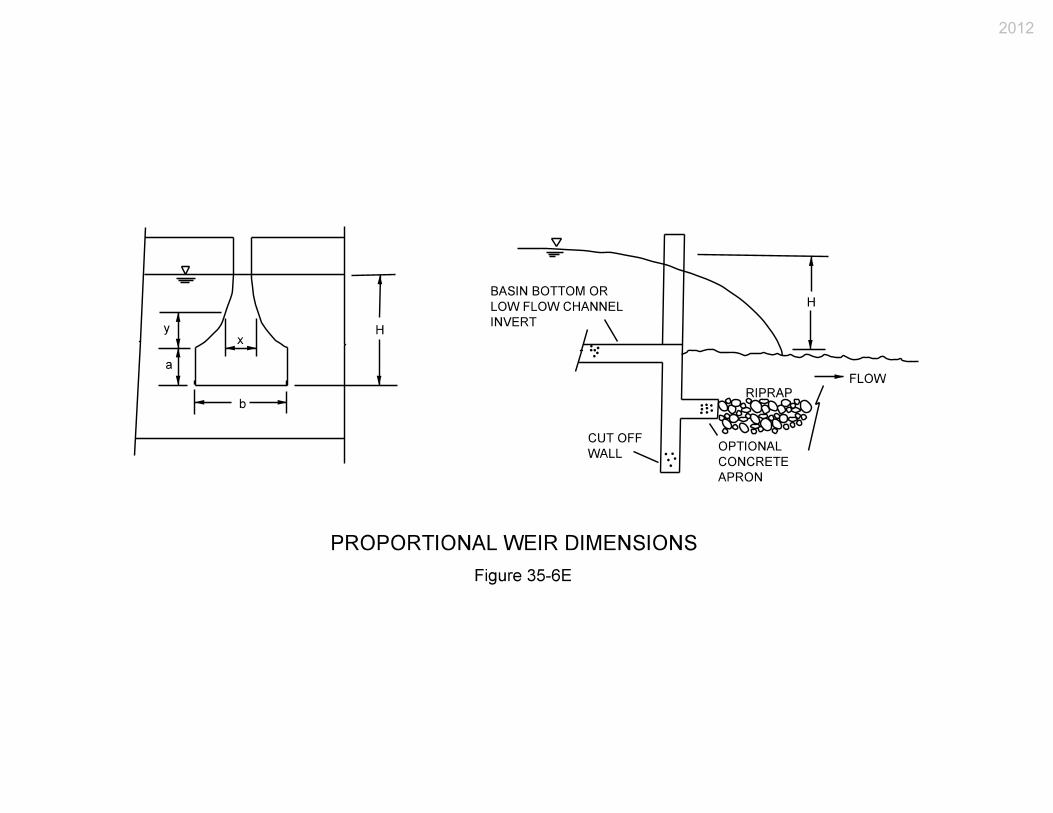
35-6.05 Proportional Weir Although more complex to design and construct, a proportional weir may significantly reduce the required storage volume for a given site. The proportional weir is distinguished from other control devices by having a linear head-discharge relationship achieved by allowing the discharge area to vary nonlinearly with head. Design equations are as follows (Sandvik, 1985):
397.4 5.0 aHbaQ (Equation 35-6.6)
5.0
arctan17.3
11
ay
bx
(Equation 35-6.7)
Where Q = discharge, ft3/s
Dimensions a, b, H, x, and y are shown in Figure 35-6E.
2012
35-6.06 Orifice A pipe smaller than 12 in. diameter may be analyzed as a submerged orifice if H/D is greater than 1.5. For square-edged entrance conditions, the formula that applies is as follows:
Q = 0.6A(2gH)0.5 (Equation 35-6.8) Where: Q = discharge, ft3/s
A = cross-section area of pipe, ft2 g = acceleration due to gravity, 32.2 ft/s2 D = diameter of pipe, ft H = head on pipe, from the center of pipe to the water surface, ft
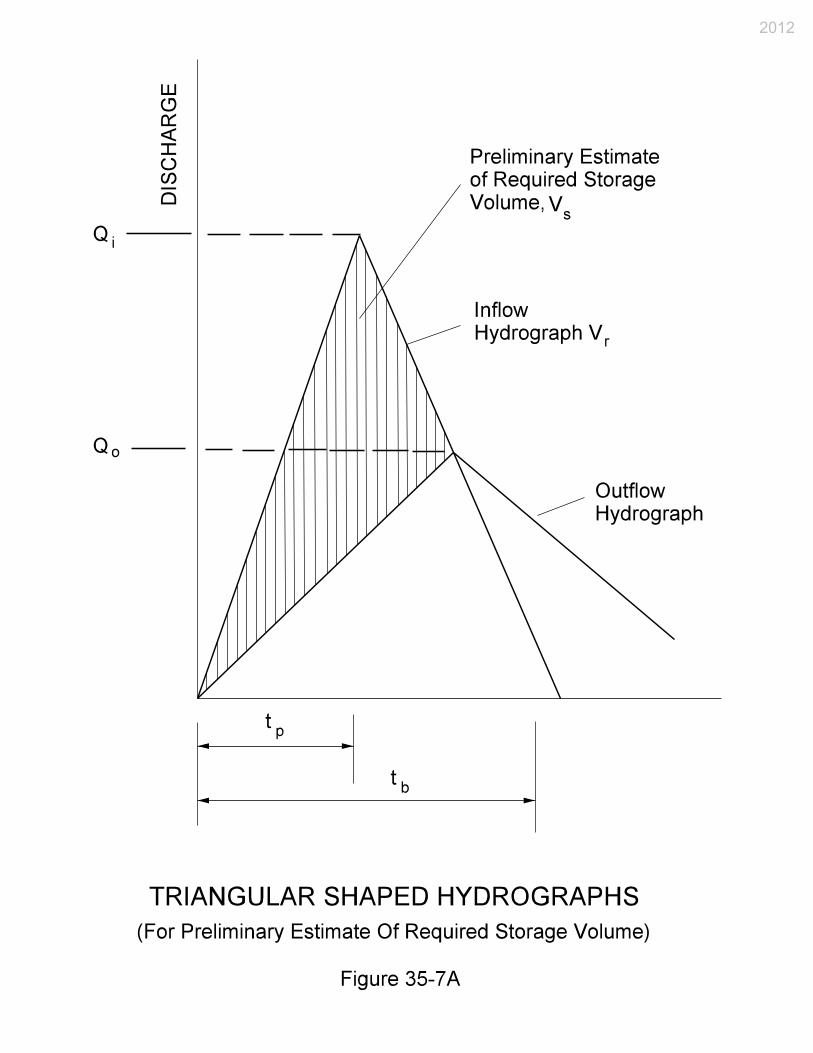
Where the tailwater is higher than the center of the opening, the head is calculated as the difference in water-surface elevations. 35-7.0 PRELIMINARY DETENTION CALCULATIONS 35-7.01 Storage Volume A preliminary estimate of the storage volume required for peak flow attenuation may be obtained from a simplified design procedure that replaces the actual inflow and outflow hydrographs with the standard triangular shapes shown in Figure 35-7A. The required storage volume may be estimated from the area above the outflow hydrograph and inside the inflow hydrograph, expressed as follows:
VS = 0.5Ti(Qi – Qo) (Equation 35-7.1) Where: VS = storage-volume estimate, ft3
Qi = peak inflow rate, ft3/s Qo = peak outflow rate, ft3/s Ti = duration of basin inflow, s
Consistent units may be used for Equation 35-7.1. 35-7.02 Alternative Method
2012
An alternative preliminary estimate of the storage volume required for a specified peak flow reduction can be obtained through the following regression-equation procedure (Wycoff & Singh, 1986). 1. Determine input data, including the allowable peak outflow rate, Qo, the peak flow rate
of the inflow hydrograph, Qi, the time base of the inflow hydrograph, tb, and the time to peak of the inflow hydrograph, tp.
2. Calculate a preliminary estimate of the ratio VS/Vr using the input data from Step 1 and
the equation as follows:
411.0
753.0
1291.1
tptb
VV i
o
r
S (Equation 35-7.2)
Where: VS = volume of storage, ft3
Vr = volume of runoff, ft3 Qo = outflow peak flow, ft3/s Qi = inflow peak flow, ft3/s tb = time base of the inflow hydrograph, h
(Determined as the time from the beginning of rise to a point on the recession limb where the flow is 5% of the peak.)
tp = time to peak of the inflow hydrograph, h 35-7.03 Peak-Flow Reduction A preliminary estimate of the potential peak-flow reduction for a selected storage volume can be obtained by the following procedure. 1. Determine the following.
a. volume of runoff, Vr b. peak flow rate of the inflow hydrograph, Qi c. time base of the inflow hydrograph, tb d. time to peak of the inflow hydrograph, tp e. storage volume, VS
2012
2. Calculate a preliminary estimate of the potential peak-flow reduction for the selected storage volume using the equation as follows (Singh, 1976).
546.0328.1
712.01
p
b
r
S
i
o
tt
VV
(Equation 35-7.3)
Where: Qo = outflow peak flow, ft3/s Qi = inflow peak flow, ft3/s VS = volume of storage, ft3 Vr = volume of runoff, ft3 tb = time base of the inflow hydrograph, h
(Determined as the time from the beginning of rise to a point on the recession limb where the flow is 5% of the peak.)
tp = time to peak of the inflow hydrograph, h 3. Multiply the peak flow rate of the inflow hydrograph, Qi, times the potential peak-flow
reduction calculated from Step 2 to obtain the estimated peak outflow rate, Qo, for the selected storage volume.
35-7.04 Preliminary Basin Dimensions The following applies. 1. Plot the control-structure location on a contour map. 2. Select a desired depth of ponding for the design storm. 3. Divide the estimated storage volume needed by the desired depth to obtain the surface
area required of the reservoir. 4. Based on site conditions and contours, estimate the geometric shapes required to provide
the estimated reservoir surface area. 35-8.0 ROUTING CALCULATIONS The following procedure is used to perform routing through a reservoir or storage facility (Puls Method of storage routing).
2012
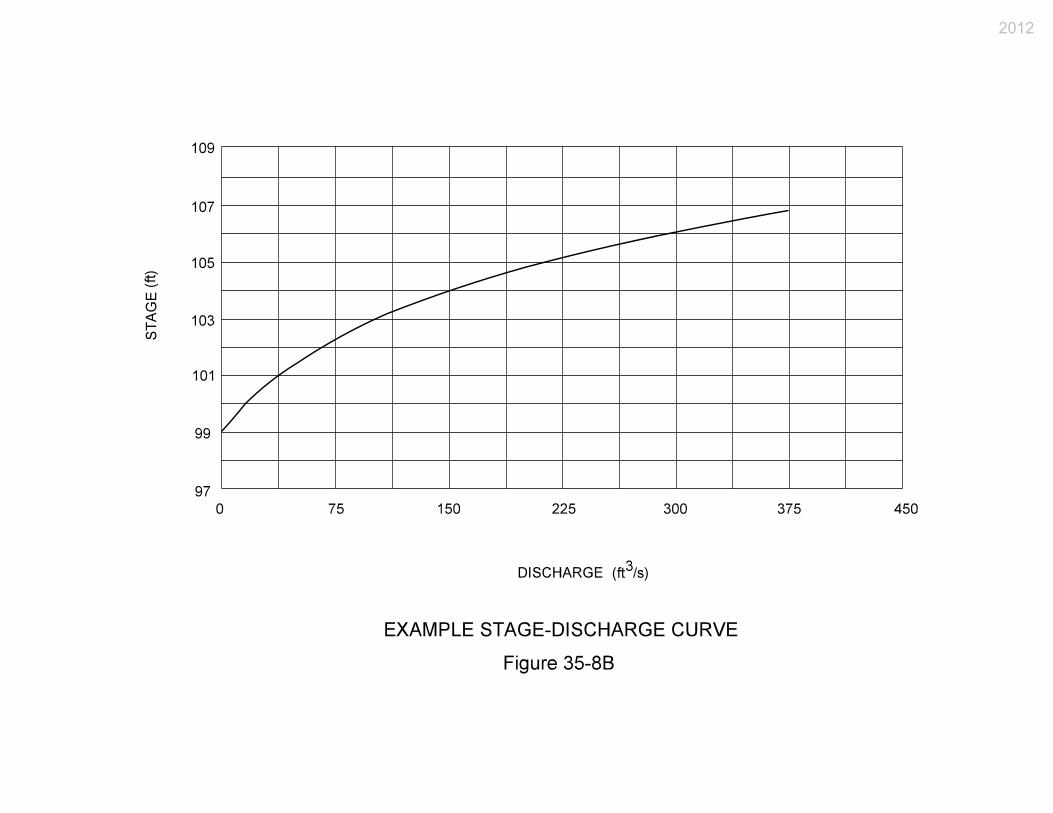
1. Develop an inflow hydrograph, stage-discharge curve, and stage-storage curve for the proposed storage facility. Example stage-storage and stage-discharge curves are shown in Figures 35-8A and 35-8B, respectively.
2. Select a routing time period, Δt, to provide at least five points on the rising limb of the
inflow hydrograph (Δt < Tc/5). 3. Use the storage-discharge data from Step 1 to develop storage characteristics curves that
provide values of S(O1/2)Δt versus stage. An example tabulation of storage-characteristics curve data is shown in Figure 35-8C.
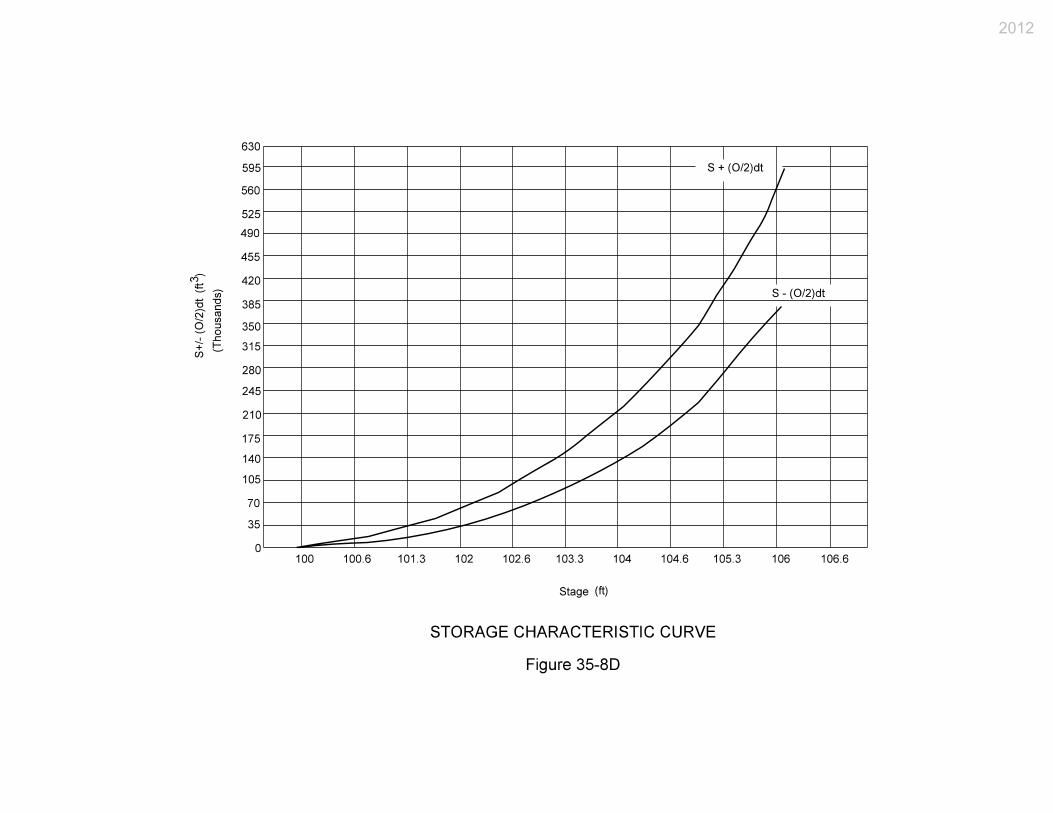
4. For a given time interval, I1 and I2 are known. Given the depth of storage or stage, H1, at
the beginning of that time interval, S1 – (O1/2)Δt, can be determined from the appropriate storage-characteristics curve (example shown in Figure 35-8D).
5. Determine the value of S2 + (O2/2)Δt from the equation as follows:
222211
12
2
tIItOStOS
(Equation 35-8.1)
Where: S2 = storage volume at time 2, ft3
O2 = outflow rate at time 2, ft3/s Δt = routing time period, s S1 = storage volume at time 1, ft3 O1 = outflow rate at time 1, ft3/s I1 = inflow rate at time 1, ft3/s I2 = inflow rate at time 2, ft3/s
Other consistent units are equally appropriate.
6. Enter the storage-characteristics curve at the calculated value of S2 + (O2/2)Δt determined
in Step 5 and read off a new depth of water, H2. 7. Determine the value of O2 which corresponds to a stage of H2 determined in Step 6, using
the stage-discharge curve. 8. Repeat Steps 1 through 7 by setting new values of I1, O1, S1, and H1 equal to the previous
I2, O2, S2, and H2, and using a new I2 value. This process is continued until the entire inflow hydrograph has been routed through the storage basin.
2012
35-9.0 EXAMPLE PROBLEM
35-9.01 Example
This example demonstrates the application of the methodology provided herein for the design of
a detention-storage facility. Example inflow hydrographs and associated peak discharges for
both pre- and post-development conditions are assumed to have been developed using hydrologic
methods from Chapter Twenty-nine.
35-9.02 Design Discharge and Hydrographs
A storage facility is to be designed for runoff from both the 10-year and 50-year design storms.
INDOT requires that the 50-year post-development peak discharge attains or does not exceed the
10-year pre-development peak discharge. Example peak discharges from the 10-year and 50-
year design storm events are as follows:
1. pre-development 10-year peak discharge = 5.66 ft3/s; and
2. post-development 50-year peak discharge = 7.08 ft3/s.
Because the post-development 50-year peak discharge must not exceed the pre-development 10-
year peak discharge, the allowable outflow discharge cannot exceed 5.66 ft3/s.
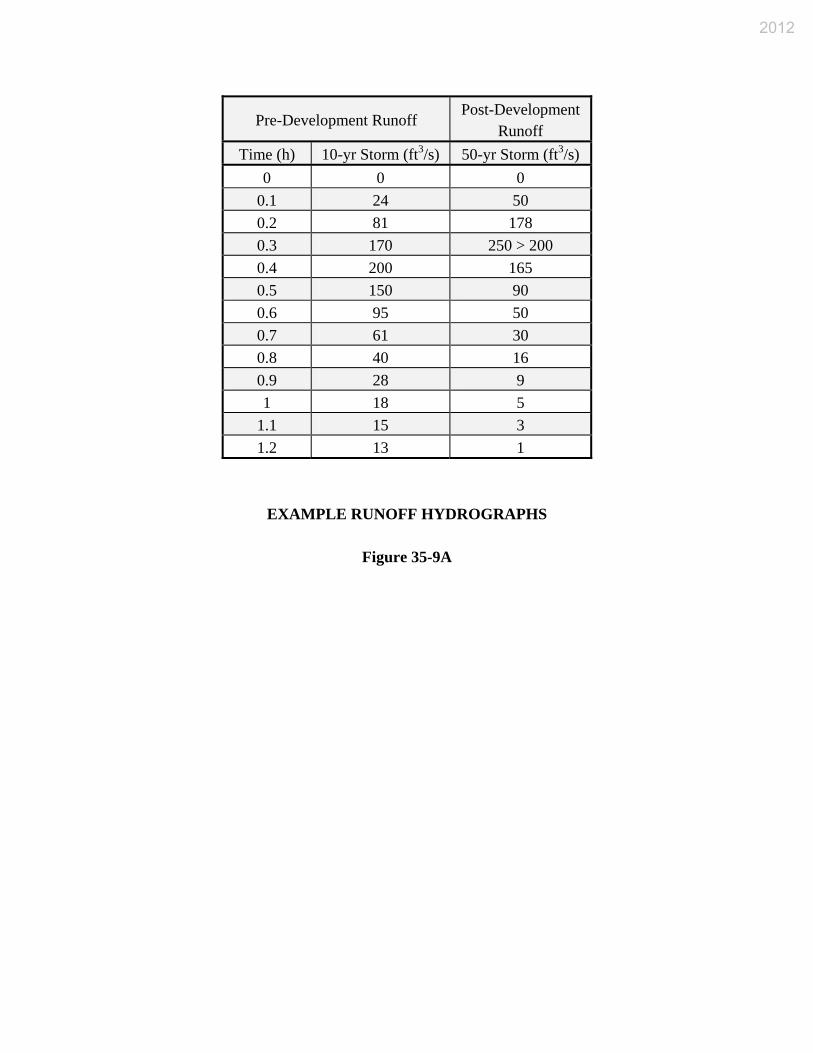
Example runoff hydrographs are shown in Figure 35-9A. Inflow durations from the post-
development hydrographs are approximately 1.2 and 1.25 h, respectively, for runoff from the 10-
year and 50-year storms.
35-9.03 Preliminary Volume Calculations
Preliminary estimates of required storage volume are obtained using the simplified method
outlined in Section 35-7.0. The required storage volume, VS, to contain the difference between
Q50 (POST) and Q10 (PRE) is computed using Equation 35-7.1.
VS = 0.5Ti(Qi – Qo) = 0.5Ti (Q50 (POST) – Q10 (PRE))
VS = 0.5 (1.25) (3600) (250 – 200) = 112500 ft3
35-9.04 Design and Routing Calculations
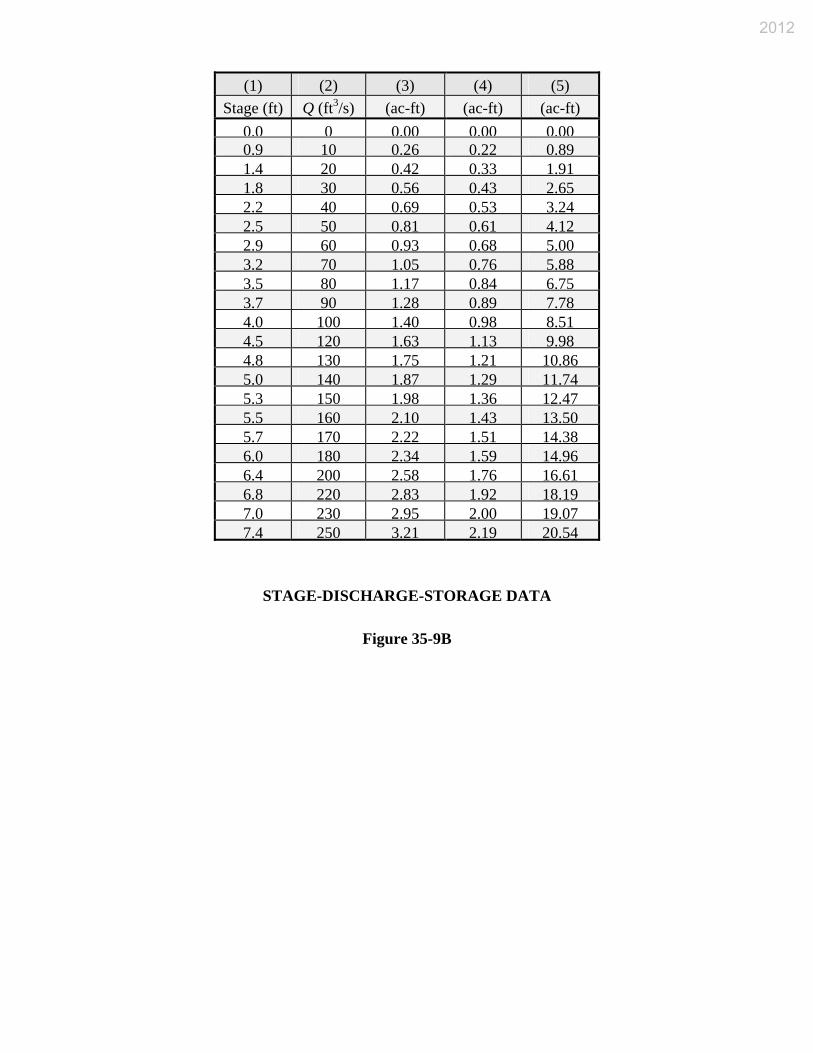
Stage-discharge and stage-storage characteristics of a storage facility that should provide
adequate peak flow attenuation for runoff from the 50-year design storm is provided in Figure
2012
35-9B. The storage-discharge relationship is developed by requiring the preliminary storage
volume estimates of runoff for the 50-year design storm to be provided once the corresponding
allowable peak discharge occurred. Discharge values are computed by solving the broad-
crested-weir equation for head, H, assuming a constant discharge coefficient of 1.71, a weir
length of 4.00 ft and no tailwater submergence. The capacity of the storage-relief structure is
assumed to be negligible.
Storage routing is conducted for runoff from the 50-year design storm to confirm the preliminary
storage-volume estimates and to establish design-water surface elevations. Routing results using
the Stage-Discharge-Storage data shown in Figure 35-9B and the Storage Characteristics Curves
shown in Figures 35-8A and 35-8B, and 0.1-h time steps are shown in Figure 35-9C for runoff
from the 50-year design storm. The preliminary design provides adequate peak discharge
attenuation.
For the routing calculations, Equation 35-8.1 should be used.
The value in Column 6 should equal that in Column 3 plus that in Column 5.
Because the routed peak discharge is lower than the maximum allowable peak discharges for the
50-year design storm event, the weir length can be increased or the storage decreased. If
revisions are desired, routing calculations must be repeated.
Although not shown for this example, runoff from the 100-year storm should be routed through
the storage facility to establish freeboard requirements and to evaluate emergency overflow and
stability requirements. The preliminary design provides hydraulic details only. The final design
should consider site constraints such as depth of water, side slope stability and maintenance,
grading to prevent standing water, and provisions for public safety.
35-10.0 DRY-BOTTOM DETENTION BASIN
35-10.01 Introduction
A dry-bottom detention basin is a depressed area that stores runoff during wet weather and is dry
the rest of the time. It is popular because of its comparatively low cost; few design limitations;
and ability to serve a large or small watershed.
35-10.02 Design
The following applies.
2012
1. Quantity. The pond should be designed to provide the required detention. It should be
able to safely pass a 100-year storm. It should be designed using the procedures
described in Sections 35-5.4 and 35-5.5. A 100-year storm should be routed through the
facility to ensure that the embankment will not be damaged or fail during the passage of
the storm. To improve the efficiency of the outlet, it may be necessary to include an
antivortex device.
2. Outlet. The outlet for a dry basin can be designed in a variety of configurations.
However, INDOT discourages the use of a riser pipe. A larger flow is accommodated by
an emergency spillway.
35-10.03 Other Considerations
The sideslopes of the pond should not be steeper than 3H:1V to facilitate maintenance activities.
The floor of the pond should be sloped at 2% toward the outlet to prevent ponding. The
maximum operating pool depth should not exceed 6.5 ft without approval of the INDOT
Hydraulics Team.
Routine maintenance activities include an annual inspection, preferably during wet weather, and
mowing, as needed.
35-11.0 WET-BOTTOM DETENTION BASIN
35-11.01 Introduction
A wet-bottom detention basin is similar to a dry-bottom detention basin in that it detains
stormwater. However, it is different in that it retains a permanent pool during dry weather. A
wet-bottom detention basin is more expensive than a dry-bottom detention basin.
35-11.02 Design
The following applies.
1. Quantity. A wet-bottom detention basin should provide the required detention and be
able to safely pass a 100-year storm.
2. Outlet. The outlet can be designed in a variety of configurations. However, INDOT
discourages the use of a riser pipe.
2012
35-11.03 Other Considerations
The sideslopes of the pond should not be steeper than 3H:1V both above and below water for
both safety and maintenance. Normal pool depth should not exceed 5 ft. The maximum
operating-pool depth should not exceed 8.25 ft.
Routine maintenance includes annual inspections, preferably during wet weather, and mowing as
needed.
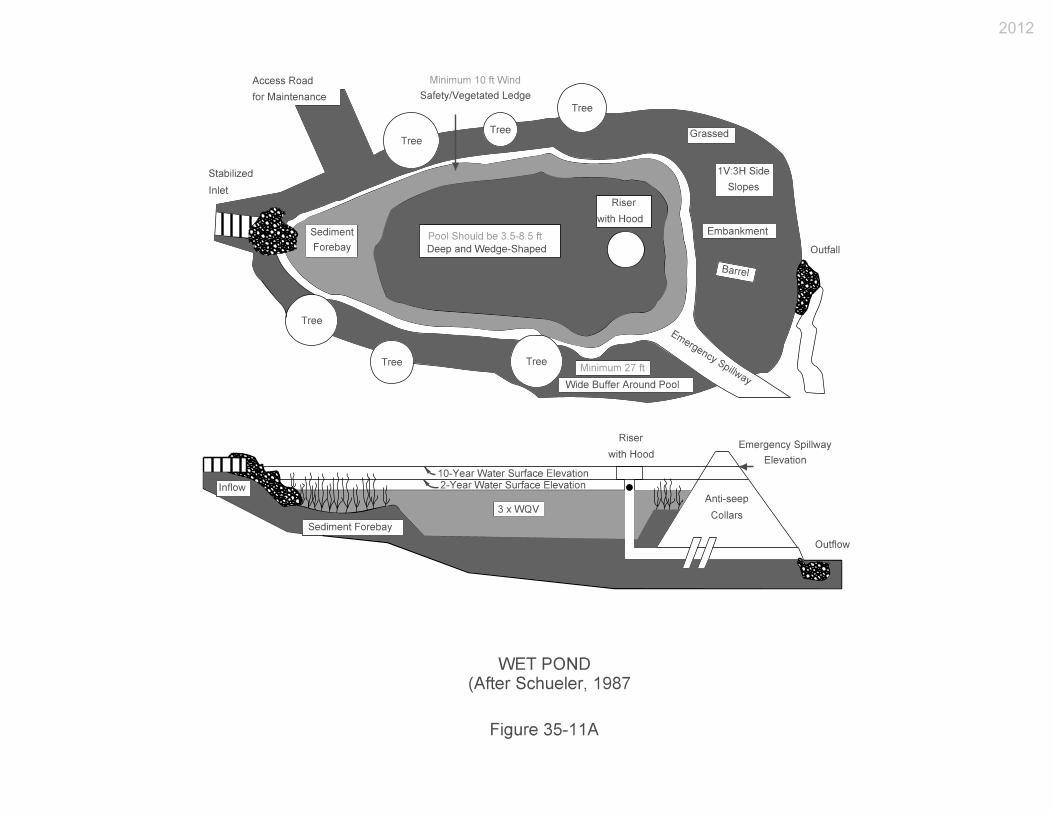
35-11.04 Illustration
See Figure 35-11A for an illustration of a wet-bottom detention basin.
35-12.0 LANDLOCKED RETENTION [REV. JAN. 2011]
A watershed area that drains to a central depression without a positive outlet is typical of an area
including karst topography. It can be evaluated using a mass-flow-routing procedure to estimate
flood elevations. Although the procedure is straightforward, the evaluation of basin outflow is a
complex hydrogeologic phenomenon that requires quality field measurements and a thorough
understanding of local conditions. Because the outflow rate for a flooded condition is difficult to
calculate, field measurements are desirable. See the AASHTO Model Drainage Manual for
more-detailed information.
Directing a significant amount of treated or untreated stormwater toward a karst feature is an
allowable practice if the following can be satisfied.
1. The project karst evaluator has previously indicated to the project engineer that no
adverse reactions are expected.
2. The practice is consistent with the karst MOU of 1993.
35-13.0 CONSTRUCTION AND MAINTENANCE CONSIDERATIONS
To ensure acceptable performance and function, a storage facility that requires extensive
maintenance is discouraged. The maintenance problems that are typical of an urban detention
facility are as follows:
1. weed growth;
2. grass and vegetation maintenance;
3. bank deterioration;
2012
4. standing water or soggy surfaces;
5. mosquito control;
6. blockage of outlet structures;
7. litter accumulation; and
8. maintenance of fences and perimeter plantings.
A proper design should focus on the elimination or reduction of maintenance requirements by
addressing the potential for problems as follows.
1. Both weed growth and grass maintenance may be addressed by constructing sideslopes
that can be maintained using available power-driven equipment, such as a tractor mower.
2. Bank deterioration can be controlled with protective lining or by limiting bank slopes.
3. Standing water or soggy surfaces may be eliminated by sloping the basin bottom toward
the outlet, or constructing a low-flow pilot channel across the basin bottom from the inlet
to the outlet.
4. Once the problems listed above are addressed, mosquito control will not be a major
problem.
5. An outlet structure should be selected to minimize the possibility of blockage. Small
pipes tend to block easily and should be avoided).
6. The facility should be located for easy access where the maintenance associated with
litter and damage to fences or perimeter plantings can be conducted regularly.
35-14.0 PROTECTIVE TREATMENT
Safety considerations include reducing the chance of drowning by fencing the basin, reducing the
maximum depth, or including ledges or mild slopes to prevent a person from falling in and
facilitate his or her escape from the basin. Protective treatment may be required to prevent entry
to a facility that poses a hazard to children, and, to a lesser extent, all persons. Fences and signs
will be required for a detention area where the following conditions exist.
1. Rapid stage increases make escape difficult.
2. Water depth either exceeds 3.3 ft for more than 24 h or the area is permanently wet.
3. Sideslopes equal or exceed 1.5H:1V.
2012
Where a storage facility is located near a roadway, the road should be provided with an adequate
clear zone. The maximum operating-pool depth will be limited to 6.5 ft unless approved by the
Hydraulics Team.
35-15.0 REFERENCES
1. Brater, E. F. and H. W. King, 1976, Handbook of Hydraulics, 6th ed., New York:
McGraw Hill Book Company.
2. Chow, C. N., 1959, Open Channel Hydraulics, New York: McGraw Hill Book Company.
3. McBridge, M. C., and Sternberg, Y. M., 1983, Stormwater Management Infiltration
Structures, Publication No. FHWA-MS-83/04, Baltimore, Md.
4. Sandvik, A., March 1985, Proportional Weirs for Stormwater Pond Outlets, Civil
Engineering, ASCE, pp. 54-56.
5. Schueler, T. R., 1987, Controlling Urban Runoff: A Practical Manual for Planning and
Designing Urban BMPs, Washington, D.C., Metropolitan Washington Council of
Governments.
6. Sowers, G. B. and G. F. Sowers, 1970, Introductory Soil Mechanics and Foundations,
3rd ed., New York: MacMillan Publishing Company.
7. Spangler, M. G. and R. L. Handy, 1982, Soils Engineering, 4th ed., New York: Harper &
Row.
8. Stormwater Management Manual - Volume 2 Procedures, July 1988, Metropolitan
Government of Nashville and Davidson County. The EDGE Group, Inc., and CH2M
Hill.
9. Wong, S. L., and McCuen, R. H., 1982, The Design of Vegetative Buffer Strips for Runoff
and Sediment Control in Stormwater Management in Coastal Areas, Annapolis,
Maryland, Department of Natural Resources.
10. Wycuff, R. L. and U. P. Singh, 1976, Preliminary Hydrologic Design of Small Flood
Detention Reservoirs, Water Resources Bulletin, Vol. 12, No. 2, pp. 337-49.
11. Yim, C.S., and Sternberg, U.M., 1987, Development and Testing of Granular Filter
Design Criteria for Stormwater Management Infiltration Structures, Baltimore,
Maryland, Department of Transportation.
2012

12. Yu, S. L., Norris, W. K., and Wyant, D. C., 1987, Urban BMP Demonstration Project of
the Albemarle/Charlottesville Area, Report No. UDA/530358/CZ88/102, Charlottesville,
University of Virginia.
2012
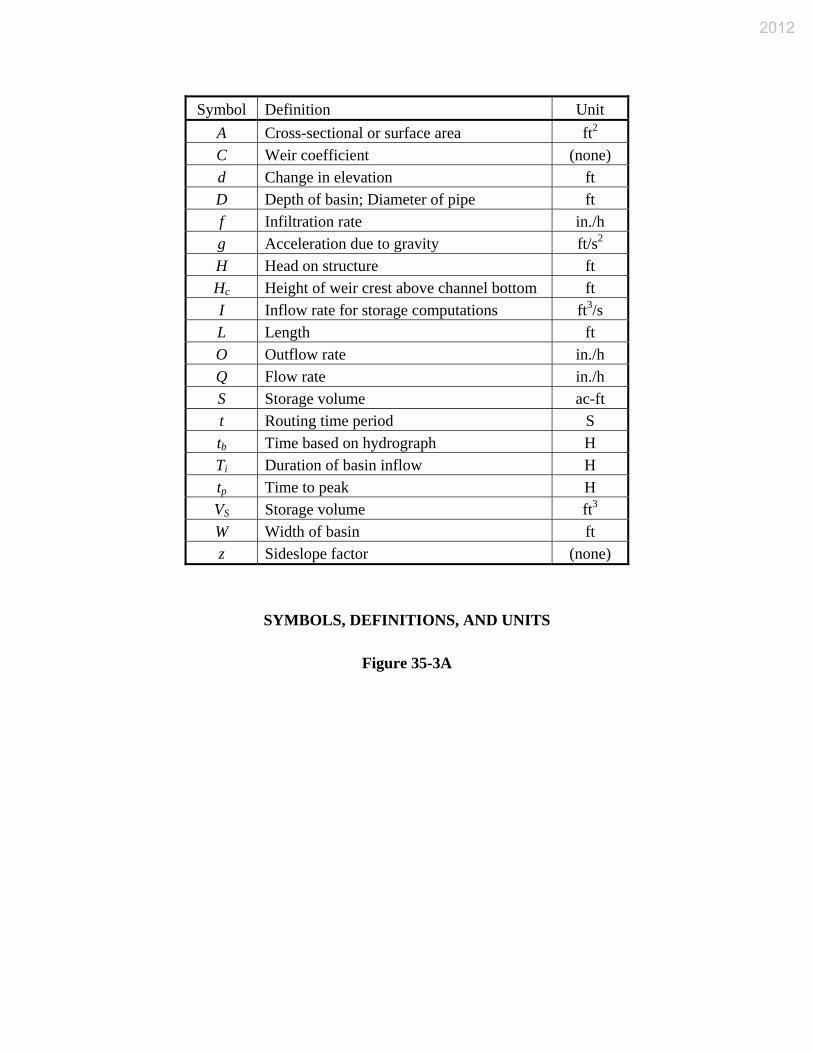
Symbol Definition Unit A Cross-sectional or surface area ft2
C Weir coefficient (none) d Change in elevation ft D Depth of basin; Diameter of pipe ft f Infiltration rate in./h g Acceleration due to gravity ft/s2
H Head on structure ft Hc Height of weir crest above channel bottom ft I Inflow rate for storage computations ft3/s L Length ft O Outflow rate in./h Q Flow rate in./h S Storage volume ac-ft t Routing time period S tb Time based on hydrograph H Ti Duration of basin inflow H tp Time to peak H VS Storage volume ft3
W Width of basin ft z Sideslope factor (none)
SYMBOLS, DEFINITIONS, AND UNITS
Figure 35-3A
2012
2012
2012
2012
2012
2012
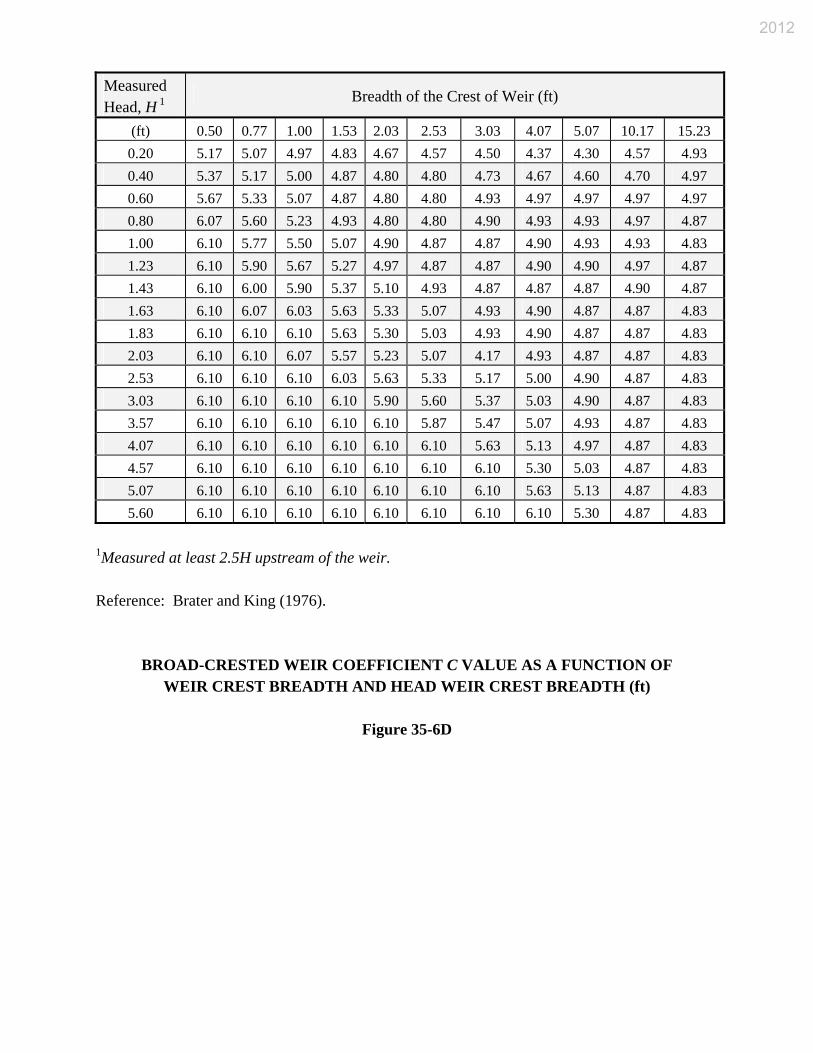
Measured Head, H 1
Breadth of the Crest of Weir (ft)
(ft) 0.50 0.77 1.00 1.53 2.03 2.53 3.03 4.07 5.07 10.17 15.23 0.20 5.17 5.07 4.97 4.83 4.67 4.57 4.50 4.37 4.30 4.57 4.93 0.40 5.37 5.17 5.00 4.87 4.80 4.80 4.73 4.67 4.60 4.70 4.97 0.60 5.67 5.33 5.07 4.87 4.80 4.80 4.93 4.97 4.97 4.97 4.97 0.80 6.07 5.60 5.23 4.93 4.80 4.80 4.90 4.93 4.93 4.97 4.87 1.00 6.10 5.77 5.50 5.07 4.90 4.87 4.87 4.90 4.93 4.93 4.83 1.23 6.10 5.90 5.67 5.27 4.97 4.87 4.87 4.90 4.90 4.97 4.87 1.43 6.10 6.00 5.90 5.37 5.10 4.93 4.87 4.87 4.87 4.90 4.87 1.63 6.10 6.07 6.03 5.63 5.33 5.07 4.93 4.90 4.87 4.87 4.83 1.83 6.10 6.10 6.10 5.63 5.30 5.03 4.93 4.90 4.87 4.87 4.83 2.03 6.10 6.10 6.07 5.57 5.23 5.07 4.17 4.93 4.87 4.87 4.83 2.53 6.10 6.10 6.10 6.03 5.63 5.33 5.17 5.00 4.90 4.87 4.83 3.03 6.10 6.10 6.10 6.10 5.90 5.60 5.37 5.03 4.90 4.87 4.83 3.57 6.10 6.10 6.10 6.10 6.10 5.87 5.47 5.07 4.93 4.87 4.83 4.07 6.10 6.10 6.10 6.10 6.10 6.10 5.63 5.13 4.97 4.87 4.83 4.57 6.10 6.10 6.10 6.10 6.10 6.10 6.10 5.30 5.03 4.87 4.83 5.07 6.10 6.10 6.10 6.10 6.10 6.10 6.10 5.63 5.13 4.87 4.83 5.60 6.10 6.10 6.10 6.10 6.10 6.10 6.10 6.10 5.30 4.87 4.83
1Measured at least 2.5H upstream of the weir. Reference: Brater and King (1976).
BROAD-CRESTED WEIR COEFFICIENT C VALUE AS A FUNCTION OF WEIR CREST BREADTH AND HEAD WEIR CREST BREADTH (ft)
Figure 35-6D
2012
2012
2012
2012
2012

(1) Stage (ft)
(2) Storage 1
(ac-ft)
(3) Discharge 2
(ft3/s)
(4) S − (O/2)Δt
(ac-ft)
(5) S + (O/2)Δt
(ac-ft) 98.4 0.05 0 0.05 0.05 99.3 0.3 15 0.20 0.40 100.0 0.8 35 0.56 1.04 100.9 1.6 63 1.17 2.03 101.7 2.8 95 2.15 3.45 102.5 4.4 143 3.41 5.39 103.4 6.6 200 5.22 7.98 104.2 10.0 275 8.11 11.89
1 Obtained from the Stage-Storage Curve. 2 Obtained from the Stage-Discharge Curve. Note: t = 10 min = 0.167 h
STORAGE CHARACTERISTICS
Figure 35-8C
2012
2012
Pre-Development Runoff Post-Development
Runoff Time (h) 10-yr Storm (ft3/s) 50-yr Storm (ft3/s)
0 0 0 0.1 24 50 0.2 81 178 0.3 170 250 > 200 0.4 200 165 0.5 150 90 0.6 95 50 0.7 61 30 0.8 40 16 0.9 28 9 1 18 5
1.1 15 3 1.2 13 1
EXAMPLE RUNOFF HYDROGRAPHS
Figure 35-9A
2012
(1) (2) (3) (4) (5) Stage (ft) Q (ft3/s) (ac-ft) (ac-ft) (ac-ft)
0.0 0 0.00 0.00 0.000.9 10 0.26 0.22 0.89 1.4 20 0.42 0.33 1.91 1.8 30 0.56 0.43 2.65 2.2 40 0.69 0.53 3.24 2.5 50 0.81 0.61 4.12 2.9 60 0.93 0.68 5.00 3.2 70 1.05 0.76 5.88 3.5 80 1.17 0.84 6.75 3.7 90 1.28 0.89 7.78 4.0 100 1.40 0.98 8.51 4.5 120 1.63 1.13 9.98 4.8 130 1.75 1.21 10.86 5.0 140 1.87 1.29 11.74 5.3 150 1.98 1.36 12.47 5.5 160 2.10 1.43 13.50 5.7 170 2.22 1.51 14.38 6.0 180 2.34 1.59 14.96 6.4 200 2.58 1.76 16.61 6.8 220 2.83 1.92 18.19 7.0 230 2.95 2.00 19.07 7.4 250 3.21 2.19 20.54
STAGE-DISCHARGE-STORAGE DATA
Figure 35-9B
2012
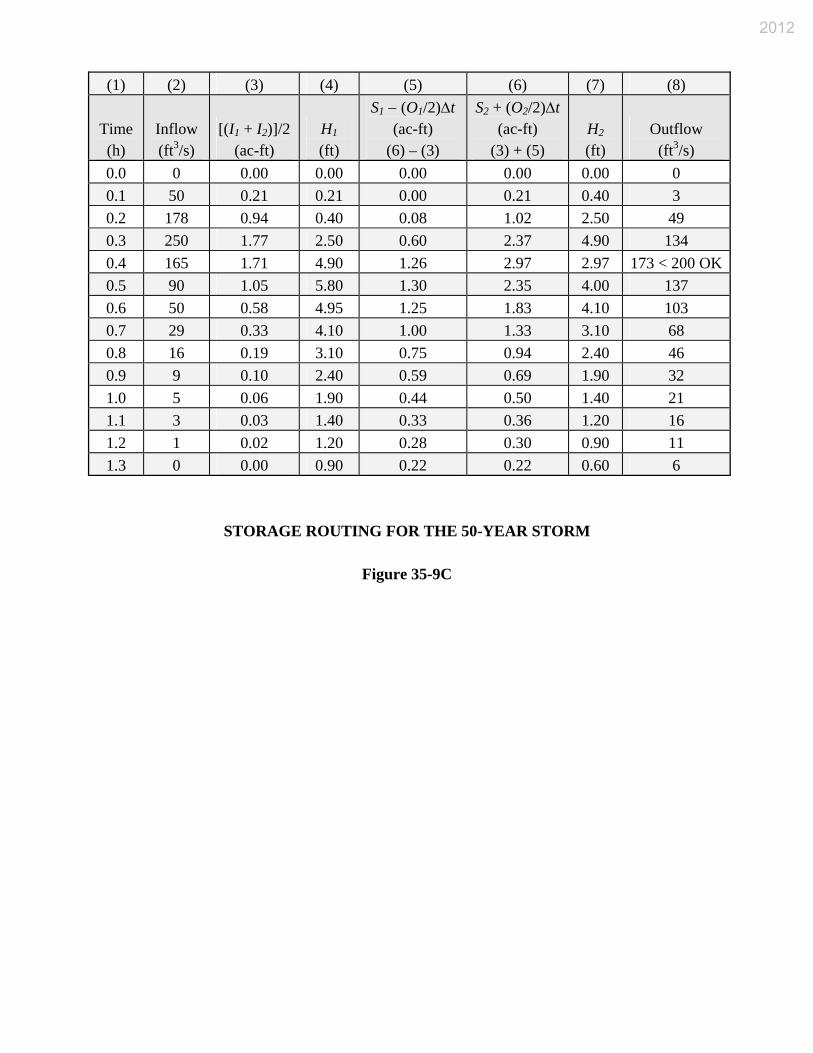
(1) (2) (3) (4) (5) (6) (7) (8)
Time (h)
Inflow (ft3/s)
[(I1 + I2)]/2 (ac-ft)
H1 (ft)
S1 − (O1/2)Δt (ac-ft)
(6) – (3)
S2 + (O2/2)Δt (ac-ft)
(3) + (5) H2 (ft)
Outflow (ft3/s)
0.0 0 0.00 0.00 0.00 0.00 0.00 0 0.1 50 0.21 0.21 0.00 0.21 0.40 3 0.2 178 0.94 0.40 0.08 1.02 2.50 49 0.3 250 1.77 2.50 0.60 2.37 4.90 134 0.4 165 1.71 4.90 1.26 2.97 2.97 173 < 200 OK0.5 90 1.05 5.80 1.30 2.35 4.00 137 0.6 50 0.58 4.95 1.25 1.83 4.10 103 0.7 29 0.33 4.10 1.00 1.33 3.10 68 0.8 16 0.19 3.10 0.75 0.94 2.40 46 0.9 9 0.10 2.40 0.59 0.69 1.90 32 1.0 5 0.06 1.90 0.44 0.50 1.40 21 1.1 3 0.03 1.40 0.33 0.36 1.20 16 1.2 1 0.02 1.20 0.28 0.30 0.90 11 1.3 0 0.00 0.90 0.22 0.22 0.60 6
STORAGE ROUTING FOR THE 50-YEAR STORM
Figure 35-9C
2012
2012