t he qquuesstt - iujharkhand.edu.iniujharkhand.edu.in/magazine-final_iu_jharkhand.pdft he qquuesstt...
TRANSCRIPT
Grand Em
T
ICmerald Bu
Ra
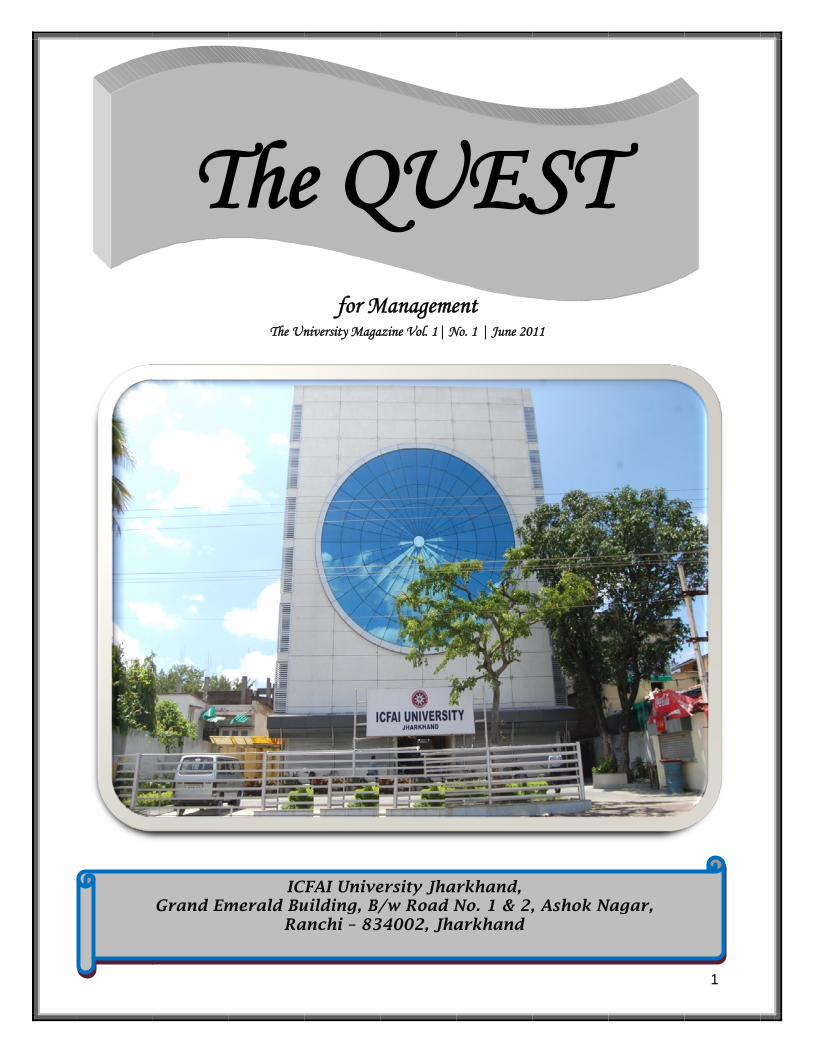
The Un
The
CFAI Univeuilding, B/anchi – 83
for
for Mniversity Maga
e Q
ersity Jha/w Road N
34002, Jha
r Management
Managemeazine Vol. 1| N
QU
rkhand, No. 1 & 2,arkhand
ent No. 1 | June 20
UES
, Ashok N
011
STT
Nagar,
1
Th
Regi
Dean,
ICF
All rights whole o
withou
he Q
ABrig. S.
strar, ICFAI
Dr. B, FMS, ICFA
EMs. Ch
Faculty Me
EditoriaProf. D
Prof. PriProf. M
Prof. Sa
FAI UniversitUGC appr
reserved. Reor part, in Engut the publish
QUE The IUJ
Advisor K. Deb, VSMUniversity, J
& B. M. Singh AI University,
Editor hetna Sinha,ember, FMS
al CommitteD. K. Shuklaya Srivastav
Md. Murtuzanjoy Banerje
ty Jharkhandroved Univers
production inglish or any oters consent is
ESTJ Magazine
M Jharkhand
, Jharkhand
, , IUJ
ee va ee
d, Ranchi sity
any manner,ther languages prohibited.
EdDea
WarmWe aIUJ M‘The Qtwo thyear, TechnWhileclearlyby thUniveand mfrom EarthProduOrganthe toMarke& ‘NeFacilityet nasubjecdeepewouldOur stime appreRight have items goal.I hopwhichbringiupcominterematteWe loon an Join u
T
, in e
ditorar Frien
m greetings tare happy toMagazine ‘TQuest for Mhat have bee
the othernology’.
e going thry notice tha
he academicersity are wmore rigorousomething ’ to as
uctivity Imprnizational Propics like ‘Tet: From Baeed for the ties in Jharative concects that wouer and pondd make you students con
for reasoneciable.
from the firsensured opput forth in
e you’ll forgh may have ong out this
ming issues esting and ers. ook forward td let us know
us in our new
rial nds,
o you all!! o bring out tThe Quest’ wManagemenen decided tr one bein
rough the t the range cians from
wider and thus. One canas basic acomplex a
rovement Troductivity’. The Dynamirings Bank t
Developmekhand’ spearn. There auld certainlyer. Then thefeel lighter
ntribution, thns more th
st issue of thptimism to b
the issue ve
give us for occurred becissue. But wof ‘The Qusplashing
to hearing yow what you
w world and
l
the first issuwhich is, oft’ of the serito be publishng ‘The Q
Magazine oof subjects in and out
heir analysisn find topicsas ‘Water ofas ‘ApplicaTools for Im Space procs of the Dto Lehman Bent of Infraak of our wre many mo
y force you ere are poem
and yet tohough not mhan one, a
he IUJ Magabe our goal. ery well spea
some humacause of thewe promiseuest’ would
with conte
our thoughtsthink on this
read throug
Chetna Si2
ue of the f course, ies of the hed each uest for
one can explored
tside the s deeper s ranging f Mother ation of mproving ovided to
Derivative Brothers’ structure
wider and ore such to delve
ms which uch you.
much this are also
azine we And the
ak of this
an errors e haste in that the be more
emporary
s so read s issue.
gh!
inha
CONTENT:
Items Page
1. Articles 1 – 45 a. Is Social Responsibility of Business becoming Responsibility 6
of Business for its Own Sustainability? – Sulekha Purnima
b. The Water of Mother Earth – Dr. S. Sarangi 8
c. The Dynamics of the Derivative Market: From Barings Bank to Lehman Brothers – K. K. Patra 10
d. Evaluating and Restructuring the Induction Program –
C. Shalu, Dr. B. M. Singh & Anupriya Singh 13
e. Impact of Globalization on Macroeconomic Aggregate – Rajkumar M. Sharma & T. G. Mirge 17
f. Marketing: As it is Today – Dr. Saurabh Srivastava 22
g. Application of Productivity Improvement Tools for
Improving Organizational Productivity – Prof. A. S. Prasad 24
h. Need for the Development of Infrastructure Facilities in Jharkhand – Sandeep Kumar 27
i. Role of Leadership for Excellence in Education – Rumna Bhattacharya 30
a. Jumping on the Brand Wagon – Priya Srivastava 32
b. Virtual international Business : An Overview – Prof. Yogita Dwivedi 34
c. Authoritarian vs. Lenient Leadership and Capitalizing the Efficiency of Employees – Dr. Sukanta Chandra Swain 37
d. Effects of IT on Pedagogical Practicess – Prof. Rakesh Kumar Pathak 40
e. The Performance Appraisal System at NTPC – Prof. Abhay Sinha 41
2. Short Stories 46 a. How the Demand, Supply and Price Mechanism Works in an
Imperfect Market Scenario – Prof. Pritha Dutta Roy 44 b. Insured Life – Prof. Md. Murtuza 44
3. Poems 47 a. A Party of Famous Physicists – Dr. K. Mamta 45 b. ADIEU! My Trusted Friend – Dr Bijoya Ganguly 45
4. Students’ Corner 48 - 49 a. How Companies are Using the Words in their
Advertisements – Priyanka Mishra 46 b. Twins in English Language – Saema Firdous 46 c. The Ant & the Grasshopper – Kislaya Kumar 47
3
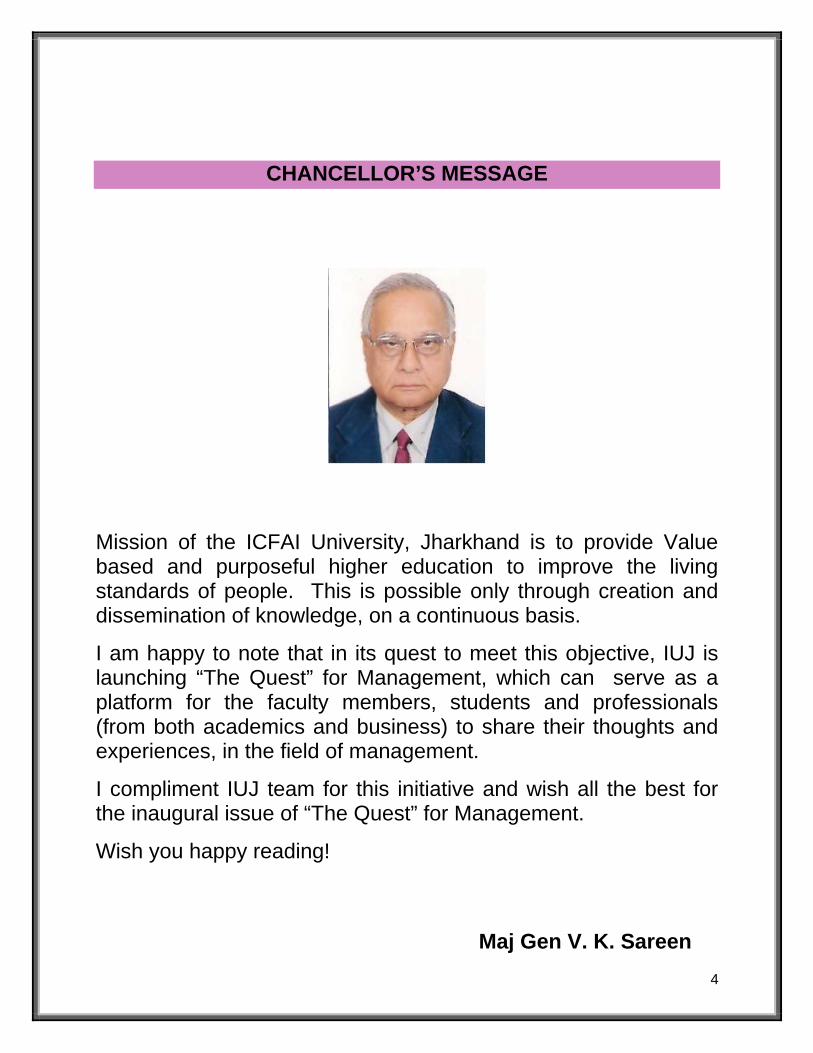
CHANCELLOR’S MESSAGE
Mission of the ICFAI University, Jharkhand is to provide Value based and purposeful higher education to improve the living standards of people. This is possible only through creation and dissemination of knowledge, on a continuous basis.
I am happy to note that in its quest to meet this objective, IUJ is launching “The Quest” for Management, which can serve as a platform for the faculty members, students and professionals (from both academics and business) to share their thoughts and experiences, in the field of management.
I compliment IUJ team for this initiative and wish all the best for the inaugural issue of “The Quest” for Management.
Wish you happy reading!
Maj Gen V. K. Sareen4
Business, by its very definition, needs to be profitable. But the manner in which it uses natural resources and the extent to which it is sensitive to the needs and aspirations of the common man is also critical to its own long-term survival and growth. The objective of business has undergone a profound change during the last decade. The raising voice to save planet has put forth challenges for the business houses, the major shareholder of pollution of several types. The cycle of business is very clear: human being is merely changing its role sometimes as consumer, entrepreneur, government, regulator, workforce, portfolio manager, investor etc. For example as a customer if you are using tobacco, you may suffer from some health problem, for which you need some extra provision to safeguard your life in terms of medical insurance or medical expenses, you are also contributing certain impurity to the environment and force innumerable innocent human beings for passive smoke. In turn they are forced to make special provision for their own health, as an employee you are definitely contributing little less as compared to a person who is not smoking, the hiring cost as well as training cost of company have little less return for you, so the company profitability, as a stakeholder you are getting less return in the similar company and as an employee your company should make more provision for your health also, less return of your company contribute less tax to the government departments, risk profile for the investors is high in turn the rate of interest is high for you as your creditability is in question as per your long term sustainable profitability. The cycle is long enough and it is difficult to visualize immediate effect. But the effect is certainly like global warming and now frequently occurring environmental causalities. Don’t forget we all are sharing common environment and every business of ours do
have certain contribution to our common environment either positive or negative for which every one is taxing directly or indirectly irrespective of his/her own net contribution count. We can’t escape the cycle, but can change only the role. Any sustainable business do have customer, customer a part of society for which it is and within which it is working. Mere reporting of social responsibility towards society as a testimony at the year end can only differentiate any corporate house as more responsible corporate citizen among business world and it hardly changes ground reality and their own sustainability. Some of the big corporate houses are among best corporate citizens in India. Many of the Indian corporate houses are discharging their social responsibilities as a good corporate citizen and have brand value internationally for positive contribution towards respective societies in which they are operating. But now their loyalty is in question, the culture they adopt is it contributing positively to the society? The last year was featured by some big scams in which involvement of big corporate houses are under critical scrutiny by the government official as well as common public. This is like cooperating a corrupt corporate culture for smooth operation of business and getting maximum contribution towards own profit and revert back a small piece of that to the true owners, the society. The deficit corporate culture is critically noticed and the intensity of cultural corruption conjunctivitis is call for a proper assessment. The concept of triple bottom line- planet, people and profit is equally important for sustainable business architecture. Today a company’s market capitalization depends on how they take care of the social and environmental issues. In this scenario a company that focuses on profit alone is certain to make no profit. Companies that wish to create sustainable wealth have to look after 3 things - people, profit and planet.
5
Is Social Responsibility of Business becoming Responsibility of Business for its Own Sustainability? Sulekha Purnima
CWA & Research Scholar

A fourth dimension of Culture is also a major pillar of sustainability due to continuous incidence of cultural deficit of business houses. The whole issue is not confined only to business house only; non- profit making government is also unable to discharge its responsibility in this direction. The recent scams and involvement of government is also subject to criticism in these days. The question is: Did the corporate practice any means which was hidden by the government? It has become quite apparent now: whatever scam has come to surface till date, in most of the cases one party is government itself, whether government official or the politicians irrespective of the political party they belonged. Then it is useless to shout for a good corporate culture of our corporate houses without having good governance by government itself. In fact they poised challenge for the government for their own poor regulatory architecture. The system should be more transparent and this can not be achieved without cultured implementers, with ethics and accountability for
the common mass. Otherwise, as of now, the result hardly makes any difference because we are enough experts in the art of cooking books and sponsored shortsightedness. It is sad to listen about global record of our corruption. As per the Corruption Perception Index 2010 score, India got 3.3 as per the report released by TI (Transparency International), India ranked 87 among 178 countries.
6
The positive as well as negative contribution of any business should be reported and quantified in the financial reporting. This is time for voluntarily honest role play. I am looking this phase as cultural metamorphosis. It depends upon us (roles), what we want to do with this piece of paper, a historical sustainable cultural architecture or falling cultural mega structure. This is time to learn from our past experience and make corrective measures, to have control over our future. Otherwise it is futile to run fast in a wrong road.
Water, water; everywhere, And all the boards did shrink; Water, water; everywhere Nor a drop to drink! … Quoted from “Rhymes of the Ancient Mariner, Part-II” By Samuel Taylor Coleridge Among all TV channels, the ones like Discovery, Nat Geo are the most soothing and enriching. And among the programs telecast by these channels, I find those filmed and featured on oceans to be the most fascinating. The vast blue fathomless reservoirs of water -- now serene and tranquil, now ferocious and menacing; home to countless numbers of myriad species, and source and medium of all life on Earth -- fill one’s mind with awe and admiration of Mother Nature. Once while watching such a program, a question occurred to me: “How much water is there on the Earth?” I did a Google search. Before me, many had already thought, researched and wrote about it. So I got the answer. But before I attempt to answer this question, let us look at some more associated and, perhaps, more interesting questions. Where did all this water come from? Is this amount constant? Or does it change? Is there water only on the Earth; and now, post-Chandrayaan, on our Moon? Or is it there on other planets of our Solar System and their moons as well? Is there water in only our Solar System or is it there in other solar systems and their planets too? Where and how is this water created in the first place? Once one starts wondering on these lines, such questions make a beeline to the mind. Questions are many; answers few and sketchy. Let me attempt here to give some of these sketchy answers. How much water..?: The amount of water on Earth’s surface is estimated to be more than one thousand billion liters (to be more precise 1.4×10²¹ liters!!). This is a fantastically huge number. Let us try to get a perspective of this large number. The surface area of India is approximately 3.3 million square kilometers. For simplicity of calculation, let us assume that this area is
rectangular in shape, flat, horizontal and is entirely at sea level. If we construct the storage tank to store all of Earth’s water on this area, the height of this tank will be 424 kilometers. This height is approximately 48 times the height of Mount Everest from sea level. The entire country will be covered with water whose depth will be about 48 times the height of Mount Everest!! How much Fresh Water?: However, as Samuel Taylor Coleridge laments in the lines quoted above, there is really a miniscule fraction of this vast quantity of water that is fit for consumption as drinking water. Let us have a look at some more figures. More than 97% of the total water content of the Earth is in the oceans, totally unfit for consumption! Only about 2.6% is fresh water. Out of this fresh water content, nearly 2% is trapped in ice caps and glaciers at the poles and high rise mountain ranges, 0.6% as ground water and 0.014% in lakes, streams and rivers etc. Thus, from a hygienic point of view, less than 1% of the total water supply on the Earth is potable. We can now appreciate Coleridge’s sentiments. Unfortunately, the world is getting increasingly divided into haves and have-nots of water. So much so that experts predict the next World War would be fought on the issue of which country controls how much of the water on Earth. Such a pity!! How is water created? We shall answer the question “from where did the Earth get its water” a little later. Let us first see how water is created in the Universe in the first place. In fact, it may be astounding to know that water is a by product of star formation. Ever since the birth of the Universe about 14 billion years ago, birth and death of stars have been ever present processes. Stars are born in regions of space containing mostly hydrogen and smaller quantities of heavier elements like carbon, nitrogen, oxygen etc. created in and dispersed from earlier stars. Initially this cloud of gases is dense and cold. When a star is formed in this region, a vast quantity of this cloud undergoes gravitational collapse for onset of nuclear fusion that powers the star. This collapse sends shock waves through the cold gas cloud that surrounds the newborn star, compresses
7
The Water of Mother Earth S. Sarangi
Dean, FST, IUJ
it, raises its temperature and creates the condition for chemical reactions. Such chemical reactions produce water, carbon monoxide, ammonia and other molecules by suitably combining the different available atoms in this cloud. Thus a “Molecular Cloud” is created wherein more lumps form over time to give birth to more stars, planets, comets etc. Since the process stated above is universal, the presence of water, other molecules and elements like gold, silver and platinum etc. is universal too. Experimental observations conducted by earth- and space-based telescopes are bearing testimony to these theoretical results. Water on Earth; but from where? Two clear sources have emerged, although we do not know yet which one has contributed how much of the above mentioned total amount. The two sources are: (1) Earth’s own water content since its creation, and (2) water that has been brought in by the comets which have rained on the Earth; mostly during its early years after creation. Our Solar System including the Sun, Earth and other planets, comets and asteroids etc. formed about 4.6 billion years ago through a process outlined above. Thus, our Earth got a portion of its water and all its reserves of minerals during its birth. Comets are fascinating small cold objects containing mostly water ice (85% of their mass or more), dust and other compounds. During its early years, the Solar System was a hot, violent and gravitationally active region of space. Comets pulled gravitationally by the Earth, rained (or bombarded) on Earth as they did on other planets and moons a lot more frequently than they do today. A lot of water content of the Earth has come from these comet strikes of the past.
Is the Amount of Water on Earth Same Always? The total amount of water on the surface of the Earth is constant; well, almost! As the Earth cooled from a hot ball of fluid, water vapor trapped in its interior traveled to its surface by a process called “out gassing”. It is expected that almost all the water which was trapped in the interior of the planet during its creation and early life has already come to the surface or the crust (which we call ground water). The quantity of water on Earth would not vary too much unless more comets strike the Earth! And whatever amount is already there on Earth is cycled through the “Water Cycle” taught at school level. In the absence of the Water Cycle, all of this water would have become very stale and putrid. Mother Nature takes care of herself in numerous ways, Water Cycle being one of them. One final word: We need not bother about the quantity of water on Earth. But we certainly need to bother about its quality. We all know that the quality of potable fresh water on Earth is being degraded by unscrupulous human activities. It is only us, the Homo sapiens, who have been able to harness the Nature’s laws and resources; to manipulate Nature to our advantage. It is, therefore, also our solemn duty and responsibility to do everything to protect the Nature and its resources from degradation beyond repair. Otherwise, not only our own descendants, but life on Earth as a whole, stands to suffer. We shall be the only ones to blame.
8
Introduction An efficient capital market is necessary to ensure optimal allocation of capital in an economy. An efficient market is one in which the market operations ensure that the price of securities are quickly adjusted to new information and reflect their true value. A developed capital market is held responsible for the mobilization of national savings for economic development and productive utilization of resources in order to maintain a balanced and diversified industrialization in the country. Risk management is an integral part of financial services in India. In a first changing dynamic environment, the risk manager must remain alert to take the responsibility for periodic evaluation of risk as well as techniques for tackling various loss situations. Risk is the life blood of business and the test of the entrepreneurs and managers. It is the answer for developing our ability to anticipate the unexpected. It should not be seen as another task for today’s business players to fit into an already overcrowded business schedule. Risk Manager has to adopt ways of prioritizing the working day and developing people and capital most productively. Business environment has changed dramatically over the last two decades. The world is witnessing an era of increasing globalization, consolidation, competition and technological changes. The regulated and controlled environment has given way to the open market and lead policies. With growing competitions and fast changing in the operating environment impacting the business, risk management is occupying an integral part. The business environment in which companies operate is becoming increasingly complex and uncertain. The typical consumer is assumed to be interested in consumption, with more being preferred to less. The key constraint is a budget limitation, which identifies the problem as essentially an economic one where choices have to be made. Capital market is the barometer of the economic progress of any country. A good capital market is an essential
and pre-requisite for industrial and commercial development of the country. It has to play a vital role in channelizing savings of the public in order to bring out an overall prosperity. An efficient capital market is necessary to ensure optimal allocation of capital in an economy. Literature Review With the opening of the economy to multinationals and the adoption of the liberalized economic policies, the economy is driven more towards the free market economy. The complex nature of financial structuring itself involves the utilization of multi currency transactions. It exposes the clients, particularly corporate clients to various risks such as exchange rate risk, interest rate risk, economic risk and political risk. With the integration of the financial markets and free mobility of capital, risks also multiplied. For instance, when countries adopt floating exchange rates, they have to face risks due to fluctuations in the exchange rates. Deregulation of interest rate cause interest risks. Again, securitization has brought with it the risk of default or counter party risk. Apart from this every asset, whether commodity or metal, share or currency is subject to depreciation in its value. It may be due to certain inherent factors and external factors like the market condition, Government’s policy, economic and political condition prevailing in the country and so on. In the present state of the economy, there is an imperative need of the corporate clients to protect their operating profits by shifting some of the uncontrollable financial risks to those who are able to bear and manage them. Thus, risk management becomes a must for survival since there is a high volatility in the present financial markets. The Collapse of Barings The Barings Bank was founded in 1762. In February, 1995, England’s Barings Bank, a venerable institution with a centuries-long history, collapsed as a result of massive losses
9
The Dynamics of the Derivative Market: From Barings Bank to Lehman Brothers K. K. Patra
Professor of Finance and Dean (Administration) Rourkela Institute of Management Studies, Rourkila
created by Nicholas Leeson, a lone ‘rogue trader’ in its Singapore office, Leeson was the manager in charge of the settlements process in Barings Singapore, but he was also authorized to engage in a limited set of trading activities involving the arbitrage of Nikkei index futures between the Tokyo and Singapore exchanges. To understand calamities such as today’s subprime crisis, a more thorough description of options and other financial derivatives would be necessary, but a churabnail description is useful here. Basically, Leeson was permitted to engage in a very limited set of speculative investments associated with exploiting the varying values of the same financial instruments between two separate exchanges. Just as legendary U.S. robber baron Jay Gould profited by differences in the value of gold between London and New York, Leeson was permitted to profit from small differences between Tokyo and Singapore values of securities linked to the Japanese stock market Nikkei index. Organizationally, this arrangement was highly unorthodox, since trading and settlement are, by convention, under separate managements for financial control purposes. Ignoring this basic risk control tenet allowed a relatively small accidental loss to grow into one that eventually destroyed the 233 year-old institutions. Lesson’s dual role allowed him to engage in unauthorized and highly speculative trading activities, and then to cover his losses through ‘fiddling the books’ with the help of an outside computer contractor. In Leeson’s version, the initial manipulation was done to cover a costly administrative mistake made by an inexperienced subordinate and subsequent trading was directed towards attempts to ‘make it good’. Leeson directed a systems consultant to remove an error account known within the company as the ‘five 8s account’ from inclusion in various Barings consolidated reports, and he then used this account to accumulate trading losses. Profitable trades were reported in regular accounts and not surprisingly, this allowed Leeson to become a trading superstar and a major contributor to Baring’s overall profits. Ironically, Leeson did not steal from the firm; rather he was paid gladly and generously for his apparent success as an arbitrage whiz-kid. Baring’s obvious organization design error was a failure to separate trading from settlement, but there were other mistakes that were equally important. Leeson was not closely supervised, and it appears that none of his local
managers audited his trading activities, or attempted to understand the source of his success. In addition, nowhere up the line within Barings, or with its outside auditor, did Leeson’s extraordinary success set off alarm bells, although internal audit reports condemned the financial control risks of his dual responsibilities. In addition, there was inadequate investigation of an anomalous request for a large cash payment from one of the Asian exchanges that would have likely revealed Leeson’s activities, as well as other unusual requests for funds from Baring’s London headquarters. Organizational culture also significantly contributed to the failure of Barings defensive systems. As noted by the bank of England, Barings controls were generally informal rather than procedurally rigorous. In spite of this, they were regarded as effective. However, Barings senior management was not generally detail-oriented, and thus not prone to close supervision, careful analysis and fast follow-up. As a result, they were not fully aware of the activities far down in the organization, and far a-field from London. The Collapse of Lehman Brothers Lehman Brothers had humble origins, trading its roots back to a small general store that was founded by German immigrant Henry Lehman in Montgomery, Alabama, in 1844. In 1950, Henry Lehman and his brothers, Emanuel and Mayer, founded Lehman Brothers. While the firm prospered over the following decades as the U.S. economy grew into an international powerhouse, Lehman had to contend with plenty of challenges over the years. Lehman survived them all-the railroad bankruptcies of the 1800s, the Great Depression of 1930s, two world wars, a capital shortage when it was spun off by American Express in 1994, and the Long-term Capital Management collapse and Russian debt default of 1998. However, despite its ability to survive past disasters, the collapse of the U.S. housing market ultimately brought Lehman Brothers to its knees, as its headlong rush into the subprime mortgage market proved to be a disastrous step.
10
On September 15, 2008, Lehman Brothers filed for bankruptcy. With $639 billion in assets and $619 billion in debt, Lehman’s bankruptcy filing was the largest in history, as its assets far surpassed those of previous bankrupt giants such as WorldCom and Enron. Lehman was the fourth-largest U.S. investment bank at the time
11
of its collapse, with 25,000 employees worldwide. Lehman’s demise also made it the largest victim; of the U.S. subprime mortgage induced financial markets in 2008. Lehman’s collapse was a seminal event that greatly intensified the 2008 crisis and contributed to the erosion of close to $10 trillion in market capitalization from global enquiry markets in October 2008, the biggest monthly decline on record at the time. Brother’s collapse was probably the darkest hour of US financial crisis. Other companies engulfed in the crisis were still allowed to carry on their business with a bailout mask. Many CEOs, analysts, industry experts and observers questioned vehemently why was Lehman Brothers let go? The mighty investment bank, which weathered many storms, surrendered like a lame duck and quit the businesses in a week’s time when it was caught in the financial crisis in mid-2008. After the strenuous efforts, the firm put through the 158 years from its origin as a small dry-goods store to become the fourth-largest investment bank in US, Lehman Brothers was choked to death by losses on financial derivatives. The case study focuses on the involvement of Lehman Brothers in the subprime mortgage business. It exposes the mistakes committed by the investment bank and following repercussions that led the firm to its final demise. The case also explores various reasons behind the fall of Lehman Brothers and helps understand strategies that might sometime produce negative effects.
Result Thus, derivatives are becoming increasingly important in world markets as a tool for risk management. Derivative instruments can be used to minimize risk. Derivatives are used to separate the risks and transfer them to parties willing to bear these risks. The kind of hedging that can be obtained by using derivatives is cheaper and more convenient than what could be obtained by using cash instruments; it is so because, when we use derivatives for hedging, actual delivery of the underlying asset is not at all essential for settlement purposes. The profit or loss on derivative deal alone is adjusted in the derivative market. Moreover, derivatives do not create any new risk. They simply manipulate risks and transfer them to those who are willing to bear these risks. There is a wrong feeling that derivatives would bring in financial collapse.
There is an enormous negative publicity in the wake of incidents of financial misadventure. For instance, Baring had its entire net worth wiped out as a result of its trading and options writing on the Nikkei index futures. Discussion There is a wrong feeling that derivatives would bring in financial collapse. There is an enormous negative publicity in the wake of incidents of financial misadventure. For instance, Baring had its entire net worth wiped out as a result of its trading and options writing on the Nikkei index futures. It shows how an institution which is 233 year-old collapsed. It is also seen that how it led to the collapse of 158 year old Lehman Brothers also. But the improper handling of these instruments is the main cause for this and one cannot simply blame derivatives for all these miss happenings. From the close analysis it reveals that the collapse was due to misuse of derivatives. Conclusion The introduction of derivatives was delayed for some more time as the infrastructure for it had to be set up. Derivatives trading required a computer based trading system, a depository and a clearing house facility. In addition, problems such as low market capitalization of the Indian stock markets, the small number of institutional players and the absence of a regulatory framework caused further delays. Derivatives are not a laboratory curiosity. They are not an ephemeral fad. They have arrived in the real world and they are here to stay, because they have a real value to real-world applications. The landscape of the financial markets changes rapidly. Decisions that were high art 10 years ago are now programmed into hand-held calculators. That is the nature of progress. Processes that were innovative 25 years ago are now at best quaint, if not completely obsolete. Twenty-five years from now we will be approaching the year 2020, and the risk management revolution that we began in the 1990s will seem no more novel than the revolution in the '70s that brought increasing numbers of women into the workplace. From the above analysis it is concluded that derivative is a double-edged sword which should be used carefully.
An induwithin memployefor theirchance InductioInductioemployethe rightbe lookito reinfocompan An inducfor bringdesignedimpressculture providesenvironmwithin torganizaprocess starter toof the tedeep entheir jobthe com
Most nework fulinitial intor destroNew emneed nofact whetime in inductionto learnconsumwill lack incorrecinductionconsiderthe wheclear asnew emcorrectlyto begin
uction progrmany businees to the cor new role. O
to make n is the timen is a greaee to confirmt employmenng for assuraorce to the y as the plac
ction prograging staff intod as suchion about thand policies
s an introdment and ththe organization’s kn
and is inteo become a
eam, rather thnd" without
b or how theipany.
ew employeell of enthusiterest can eitoyed depend
mployee induot consume aen done prothe long run program, nn on their ing and ineffsome essen
ct or mislean program israble time weel. When gssignment a
mployee is my and will be training
C
am is the nesses to wompany andOne never ga first goo
e to roll out tat way to a
m that he or nt choice. Anance from thdecision of
ce to work.
m is an impo an organizah to creahe companys among neduction to e set-up of
zation. It isnowledge ended to enuseful, integhan being "thunderstandir role fits in w
es arrive for tasm and exther be put tding on howuction is noa large amooperly, inducn. Without anew employeown. This ficient. Oftenntial informaading informs lacking or pwill be wastegiven propend specific more likely e receptive w
EvaluC. Shalu (HR
process uswelcome ne prepare thegets a secod impressiothe red carpallow the neshe has ma
n employee whe organizati
choosing t
ortant proceation. They ate just rigy, its missioew recruits.
the workithe employ
s part of manageme
nable the negrated membhrown in at tng how to with the rest
the first day xcitement. Tto positive us
w it is nurtureot difficult aount of time. ction will saa well-plannees are forccan be tim
n an employtion or receimation. If poorly planned reinventi
er direction, information,to get startwhen it is tim
ating and RManager, TA
Anupriya S
ed ew em nd on. et. ew de will on he
ess are ght on,
It ng ee an ent ew ber he do of
of he se, ed. nd In ve ed ed me ee ve an ed ng
a a ed me
Thneonsuvainanprsopeco
Tr
InthorwD
Intomdeprpecosmdene
RestructuringATA Mators)
& Singh (Stude
he goal of inew employeence the wouccessful, aalued assenduction prognd reduce shrograms canocialization terformance, ommitment.
raining and
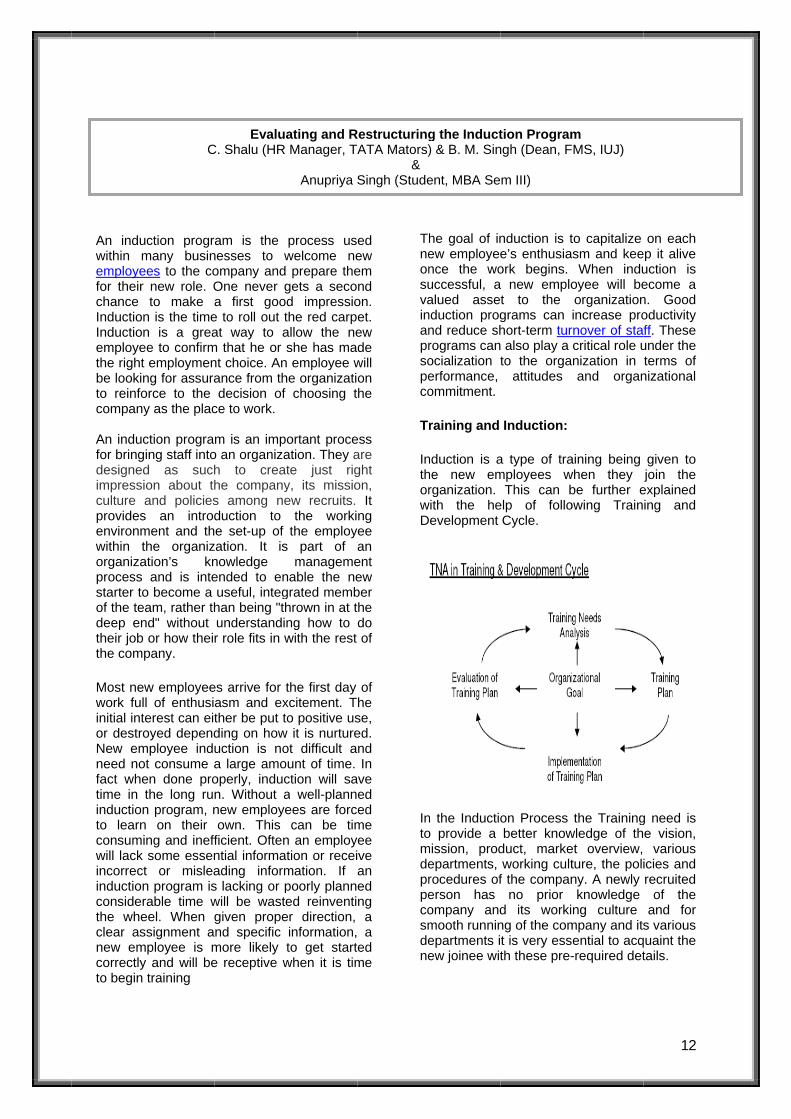
nduction is ahe new emrganization.
with the heevelopment
n the Inductioo provide a mission, prod
epartments, rocedures oferson has ompany andmooth runninepartments iew joinee wit
g the Induct) & B. M. Sin
ent, MBA Se
nduction is te’s enthusiaork begins. new emplot to the grams can hort-term tur also play a to the orga
attitudes
Induction:
a type of tramployees w
This can belp of folloCycle.
tion Programngh (Dean, F
m III)
on Process better know
duct, markeworking cult
f the companno prior
d its working of the comt is very essth these pre-
to capitalize sm and keeWhen indu
oyee will beorganizationincrease pro
rnover of stacritical role unization in and organ
aining being when they be further eowing Train
m MS, IUJ)
the Trainingwledge of thet overview, ture, the poliny. A newly knowledge
ng culture mpany and itsential to acq-required det
on each ep it alive uction is ecome a n. Good oductivity ff. These
under the terms of
nizational
given to join the
explained ing and
12
g need is e vision,
various icies and recruited
of the and for
s various quaint the tails.
As we are aware of the needs and requirements of any new joinee, adequate planning of training them has to be done. After which care has to be taken for proper implementation of the training program. Once the training or the Induction Program is done with the next step is to evaluate the same; measure the effectiveness of the Induction Program.
Now it is very clear that the Induction Process abides by the same cycle of Training and Development. Hence the evaluation of the Induction Program will follow the same model as is used in assessing the effectiveness of any other training program but of course with a few alterations.
Evaluation of Induction Program
The purpose of evaluation is to determine whether or not the training achieved the desired objective. Evaluating training will help show how effective it was in meeting the objective. The benefits of evaluating training can be summarized as follows:
• Helps employees to monitor their own improvement.
• Builds morale, by demonstrating an interest in staff development.
• Maximizing training ROI (return on investment).
• Helps to determine the form of future training programs.
• Assists with identifying the effectiveness of different forms of teaching (such as classroom based or web based).
Measuring training effectiveness (MTE) is the process of identifying the areas where both individuals and groups in an organization would benefit from training in order to become more effective at achieving their own objectives and the objectives of the organization.
The evaluation of training starts with the identification of training needs, establishing objectives and continues through to the design and delivery of the training course itself. It is the function of evaluation to assess whether the learning objectives originally identified have been satisfied and any deficiency rectified. Evaluation is the analysis and comparison of actual progress versus prior plans, oriented toward improving plans for future implementation. It is part of a continuing
management process consisting of planning, implementation and evaluation; ideally with each following the other in a continuous cycle until successful completion of the activity.
There are basically four parties involved in evaluating the result of any training:
1) Trainer 2) Trainee 3) Training and Development Department 4) The Respective Line Manager.
The Trainee wants to confirm that the course has met personal expectations and satisfied any learning objectives set by the Training & Development Department at the beginning of the program.
The Trainer concerned is to ensure that the training that has been provided is effective or not.
Training and Development Department wants to know whether the course has made the best use of the resources available.
The respective Line Manager will be seeking reassurance that the time that a trainee has spent in attending training results in to value and how deficiency in knowledge and skill redressed. Framework of Evaluation
1. A Kirkpatrick Model Donald Kirkpatrick’s four-level evaluation model remains as the most well-known and used model today. The Kirkpatrick model is now considered to be the industry standard and is frequently used by HR departments when determining their own systems. Kirkpatrick developed his model in the late 1950s and the model has since been adapted and modified by a number of writers. However, the model’s basic structure has well stood the test of time.
The primary purpose of conducting an evaluation at a particular level is to answer the question posed at that level. Conducting an evaluation at one level is not meant to be better or more useful than conducting an evaluation at another level – it just provides different information.
13
The levels are related, though, as each levelprovides a diagnostic checkpoint for problems at the succeeding level. So, if participants did not learn (Level 2), participant reactions gathered at Level 1 (Reaction) will reveal the barriers to learning. Now moving up to the next level, if participants did not use the skills once back in the workplace (Level 3), perhaps they did not learn the required skills in the first place (Level 2).
needs identified above. Obtaining and using information about possible training resources in order to choose between alternative inputs to training.
At Reaction Level the participants’ reaction
to the training activity is measured. The benefit of Reaction level evaluation is to improve Training and Development activity efficiency and effectiveness.
At Learning Level the basic purpose is to measure the learning transfer achieved by the training and development activity. Another purpose is to determine to what extent the individual increased their knowledge, skills and changed their attitudes by applying quantitative or qualitative assessment methods.
In the Behavior Level the changes in behavior of the individual as a result of the training and development activity is measured including how well the enhancement of knowledge, skill, attitudes has prepared than for their role.
In the Result Level the purpose is to measure the contribution of training and development to the achievement of the business/operational goals.
2. CIRO: CIRO scheme enlarges somewhat on the usual concept of evaluation. It particularly emphasizes on the trainer’s need for information. The fundamental purpose of acquiring this evaluation method is to help the trainer decide how he can best use his resources to increase the effectiveness of the training process. To explain it further:
C - Context: What needs to be changed? Identify target audience & determine needs to be met. Obtaining and using information about the current operational context in order to determine the training needs and objectives. I - Input: What procedures are most likely to bring about change?
Determine available resources, possible alternative strategies, and how best to meet
R - Reaction: Trainee’s expressed reactions Examine how well plan was implemented. Obtaining and using information about trainees’ expectation or their expressed reactions in order to improve training. O - Outcome: What evidence is there that change has occurred? Examine results obtained, whether needs were met, what planning for future required. Obtaining and using information about the outcomes of training in order to improve subsequent training. At Tata Motors, The CIRO Model is used to
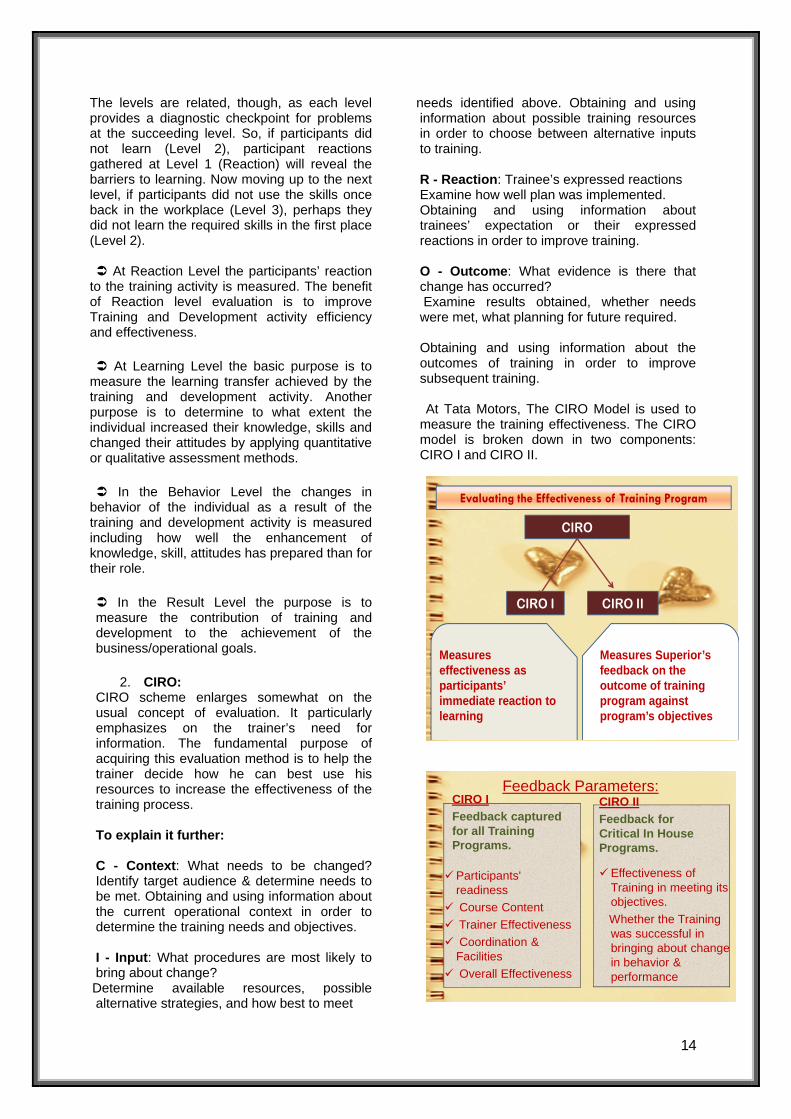
measure the training effectiveness. The CIRO model is broken down in two components: CIRO I and CIRO II.
CIRO
CIRO I CIRO II
Evaluating the Effectiveness of Training Program
Measures effectiveness as participants’ immediate reaction to learning
Measures Superior’s feedback on the outcome of training program against program’s objectives
Feedback Parameters:CIRO IFeedback captured for all Training Programs.
Participants' readinessCourse ContentTrainer EffectivenessCoordination & FacilitiesOverall Effectiveness
CIRO IIFeedback for Critical In House Programs.
Effectiveness of Training in meeting its objectives.Whether the Training was successful in bringing about change in behavior & performance
14
15
However in the case of Induction Program things become a little different than in any other training program. In the Induction Program the inputs of only CIRO I is used to assess the effectiveness of the Program. The sole intention of the Induction Program is to provide a better insight of the organization: vision & mission, its product, business process, the organization structure, various departments and its working, HR policies and practices to its new employees. Learning, Enhancing Skills and Expertise or Developing Competence is never the objective of the Induction Program. Hence the Induction Program is assessed only at the Reaction Level of Kirkpatrick’s Model which includes the following:
Participants' readiness Course Content Trainer Effectiveness Coordination & Facilities Overall Effectiveness
CIRO II focuses on:
Whether the Training was successful in bringing about change in behavior of the participants at the shop floor while doing the job
Whether the performance of the participants has increased or not which in turn would increase the effectiveness of the participant himself and the company.
The above two are never the objective of any Induction Program. Hence there is no role of CIRO II in measuring the effectiveness of Induction Program.
3. The Working of CIRO
After the training program is conducted in order to capture the immediate feedback of the participants CIRO I feedback form is made use of. The CIRO I form captures the feedback of the participants in respect of the course content, the facilitator, the methodology, the coordination and the administration at the training venue. If the score of CIRO I happens to be equal to or more than the threshold the programme is continued in future too. In any case the score happens to be less than the threshold the programme content, design and faculty is reviewed and reformed.
After the training program is completed in order to check the learning of the participants and the implementation of the same CIRO II feedback form is made use of. This feedback is taken in two levels – the response of the participants and their immediate superiors after 45 days and within 3 months of the completion of the training. A separate CIRO II feedback form is available for the participants and their superiors. Here also the score is checked as against the threshold score. If the score happens to be equal to or more the threshold score the programme is continued in the future also and in other case where the score is less than the threshold the programme content, design and faculty is reviewed.
After the programme has been re-viewed the reassessed data is used to improve the training coordination and modify the programme content and faculty.
Introduction • Concept of LPG Indian economy had experienced major policy changes in early 1990s. The new economic reform, popularly known as, Liberalization, Privatization and Globalization (LPG model) aimed at making the Indian economy as fastest growing economy and globally competitive. The series of reforms undertaken with respect to industrial sector, trade as well as financial sector aimed at making the economy more efficient. • Meaning of Globalization ‘Globalization’ is a word that has come to be used with increasing frequency over the last few years. Words and phrases have a way of dominating our thinking, despite conveying different meanings to different people, at various times. The breaching of political barriers led flawlessly to an integration of economic activity; trade restrictions were suddenly undesirable. Open markets and free trade became the pillars of globalization. Broadly speaking, the term ‘globalization’ means integration of economies and societies through cross country flows of information, ideas, technologies, goods, services, capital, finance and people. Cross border integration can have several dimensions – cultural, social, political and economic. In fact, some people fear cultural and social integration even more than economic integration. The fear of “cultural hegemony” haunts many. Limiting ourselves to economic integration, one can see this happen through the three channels of (a) trade in goods and services, (b) movement of capital and (c) flow of finance. Besides, there is also the channel through movement of people. • Meaning of Macroeconomic Aggregates –
Macroeconomics is a branch of economics that deals with the performance, structure, and behavior of a national or regional
economy as a whole. Along with microeconomics, macroeconomics is one of the two most general fields in economics. Macroeconomists study aggregated indicators such as GDP, unemployment rates, and price indices to understand how the whole economy functions. Macroeconomists develop models that explain the relationship between such factors as national income, output, consumption, unemployment, inflation, savings, investment, international trade and international finance. In contrast, microeconomics is primarily focused on the actions of individual agents, such as firms and consumers, and how their behavior determines prices and quantities in specific markets. While macroeconomics is a broad field of study, there are two areas of research that are emblematic of the discipline: the attempt to understand the causes and consequences of short-run fluctuations in national income (the business cycle), and the attempt to understand the determinants of long-run economic growth (increases in national income).Macroeconomic models and their forecasts are used by both governments and large corporations to assist in the development and evaluation of economic policy and business strategy.
• National Income : Some accounting definitions –
a) Accounting Identities at Market Price
• GNP = GNI (Gross National Income) • GDP = GNP less Net Income From Abroad • NNP = GNP less Depreciation • NDP (Net Domestic Product) = NNP less net
income from abroad
16
Impact of Globalization on Macroeconomic Aggregate Rajkumar M. Sharma & T. G. Mirge
Faculty Members Smt. L. R. T. College of Commerce, Akola
b) Accounting Identities at Factor Cost • GNP at factor cost = GNP at market price
less net indirect taxes • NNP at factor cost = NNP at market price
less net indirect taxes • NDP at factor cost = NNP at market price
less net income from abroad • NDP at factor cost = NDP at market price
less net indirect taxes • NDP at factor cost = GDP at market price
less depreciation
Data presentation and analysis
Impact of Globalization on Macroeconomic Aggregates and its analysis from 1991 to 2008 –
GraphNo1.Macro-economic aggregates (At current Price)
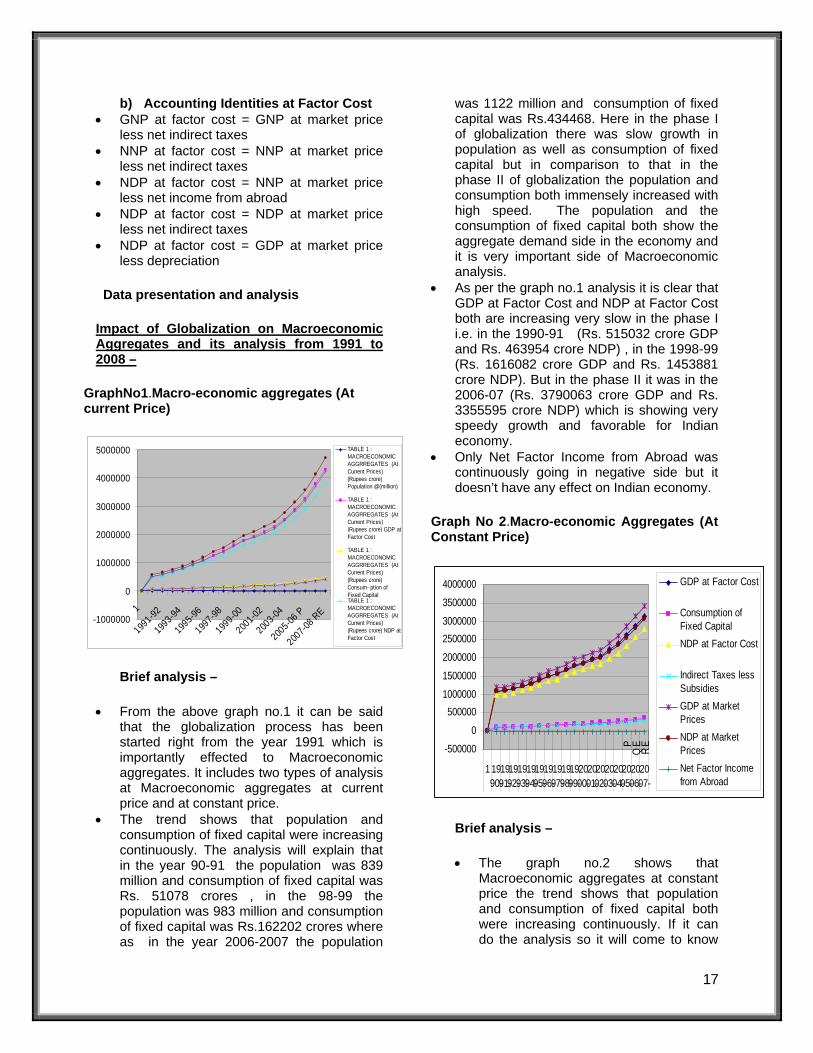
Brief analysis –
• From the above graph no.1 it can be said that the globalization process has been started right from the year 1991 which is importantly effected to Macroeconomic aggregates. It includes two types of analysis at Macroeconomic aggregates at current price and at constant price.
• The trend shows that population and consumption of fixed capital were increasing continuously. The analysis will explain that in the year 90-91 the population was 839 million and consumption of fixed capital was Rs. 51078 crores , in the 98-99 the population was 983 million and consumption of fixed capital was Rs.162202 crores where as in the year 2006-2007 the population
was 1122 million and consumption of fixed capital was Rs.434468. Here in the phase I of globalization there was slow growth in population as well as consumption of fixed capital but in comparison to that in the phase II of globalization the population and consumption both immensely increased with high speed. The population and the consumption of fixed capital both show the aggregate demand side in the economy and it is very important side of Macroeconomic analysis.
• As per the graph no.1 analysis it is clear that GDP at Factor Cost and NDP at Factor Cost both are increasing very slow in the phase I i.e. in the 1990-91 (Rs. 515032 crore GDP and Rs. 463954 crore NDP) , in the 1998-99 (Rs. 1616082 crore GDP and Rs. 1453881 crore NDP). But in the phase II it was in the 2006-07 (Rs. 3790063 crore GDP and Rs. 3355595 crore NDP) which is showing very speedy growth and favorable for Indian economy.
• Only Net Factor Income from Abroad was continuously going in negative side but it doesn’t have any effect on Indian economy.
Graph No 2.Macro-economic Aggregates (At Constant Price)
Brief analysis –
• The graph no.2 shows that Macroeconomic aggregates at constant price the trend shows that population and consumption of fixed capital both were increasing continuously. If it can do the analysis so it will come to know
-1000000
0
1000000
2000000
3000000
4000000
5000000
1
1991-92
1993-94
1995-96
1997-98
1999-00
2001-02
2003-04
2005-06
P
2007-08
RE
TABLE 1 :MACROECONOMICAGGRREGATES (AtCurrent Prices)(Rupees crore)Population @(million)
TABLE 1 :MACROECONOMICAGGRREGATES (AtCurrent Prices)(Rupees crore) GDP atFactor Cost
TABLE 1 :MACROECONOMICAGGRREGATES (AtCurrent Prices)(Rupees crore)Consum- ption ofFixed CapitalTABLE 1 :MACROECONOMICAGGRREGATES (AtCurrent Prices)(Rupees crore) NDP atFactor Cost
17
-500000
0
5000001000000
1500000
2000000
25000003000000
3500000
4000000
PQ
ER
E
1 1990-
1991-
1992-
1993-
1994-
1995-
1996-
1997-
1998-
1999-
2000-
2001-
2002-
2003-
2004-
2005-
2006-
2007-
GDP at Factor Cost
Consumption ofFixed CapitalNDP at Factor Cost
Indirect Taxes lessSubsidiesGDP at MarketPricesNDP at MarketPricesNet Factor Incomefrom Abroad
that in the year 90-91 the population was 839 million and consumption of fixed capital was Rs. 99921 crores, in the 98-99 the population was 983 million and consumption of fixed capital was Rs. 167375 crores where as in the year 2006-2007 the population was 1122 million and consumption of fixed capital was Rs. 314661. Here in the phase I of globalization slow growth in population as well as consumption of fixed capital but in comparison to that in the IInd phase of globalization where the population and consumption both were immensely increased with high speed. The population and the consumption of fixed capital both show the aggregate demand side in the economy and it is very important side of Macroeconomic analysis.
• As per the graph no.2 of Macroeconomic aggregates at constant price analysis it is clear that GDP at Factor Cost and NDP at Factor Cost both are increasing very slow in the phase I i.e. in the 1990-91 Rs. 1083572 crore GDP and Rs. 983651 crore NDP) , in the 1998-99 (Rs. 1678410 crore GDP and Rs. 1511035 crore NDP). But in the IInd phase it was in the 2006-07 (Rs. 2864310 crore GDP and Rs. 2549649 crore NDP) which is showing very speedy growth and favorable for Indian economy.
• Only Net Factor Income from Abroad was continuously going in negative side but it doesn’t have any effect on Indian economy.
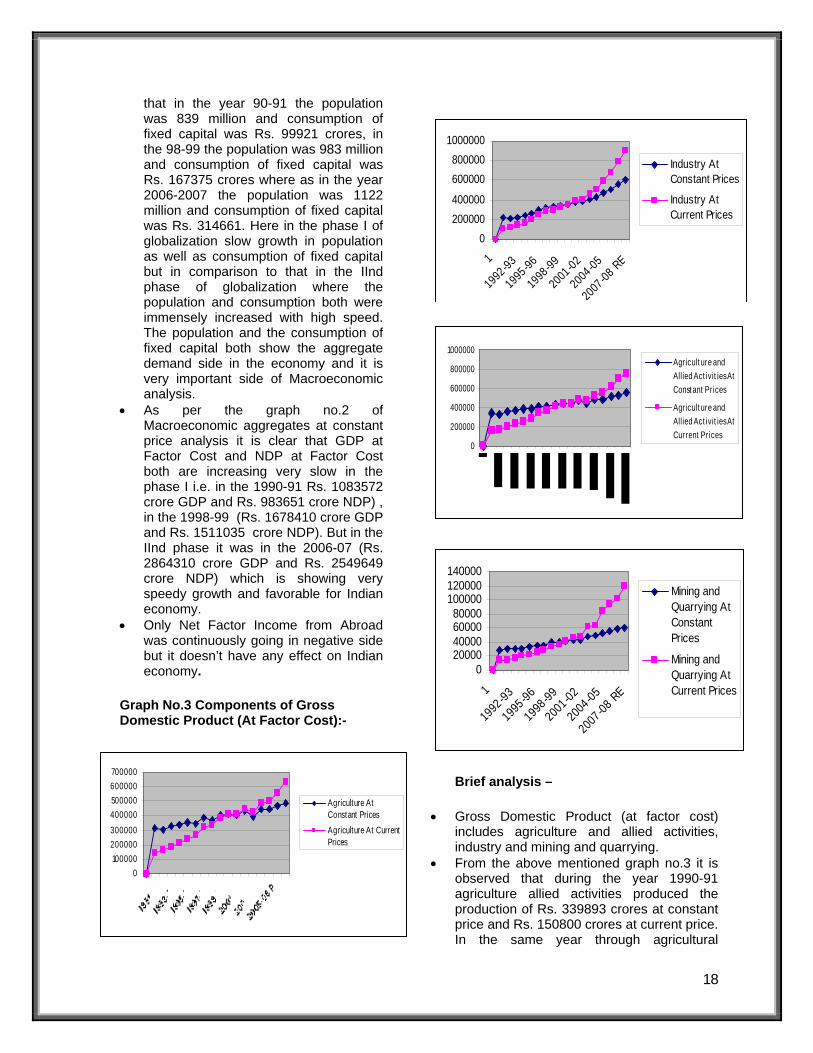
Graph No.3 Components of Gross Domestic Product (At Factor Cost):-
Brief analysis –
• Gross Domestic Product (at factor cost) includes agriculture and allied activities, industry and mining and quarrying.
• From the above mentioned graph no.3 it is observed that during the year 1990-91 agriculture allied activities produced the production of Rs. 339893 crores at constant price and Rs. 150800 crores at current price. In the same year through agricultural
0100000200000300000400000500000600000700000
Agriculture AtConstant PricesAgriculture At CurrentPrices
0200000400000
600000800000
1000000
1
1992
-93
1995 -96
1998
-99
2001
-02
2004 -05
2007
-08 RE
Industry AtConstant Prices
Industry AtCurrent Prices
0
200000
400000
600000
800000
1000000Agricult ure andAllied Act ivit ies AtConst ant Prices
Agricult ure andAllied Act ivit ies AtCurrent Prices
18
020000400006000080000
100000120000140000
1
1992
-93
1995
-96
1998
-99
2001-02
2004-05
2007-08
RE
Mining andQuarrying AtConstantPrices
Mining andQuarrying AtCurrent Prices
production the amount of Rs. 311500 crores at constant price and Rs. 137925 crores. As per industrial production trend at current price the production was produced worth Rs. 214552 crores at constant price and Rs. 110760 crores at current price. The production produced by Mining and Quarrying was of Rs. 29014 crores at constant price and Rs. 13775 crores at current price. This showed complementary to each other.
• As per the graph of agriculture allied activities production showed consistent growth had been as constant price in phase I and phase II. The analysis of current price shows that there is drastic production growth in I as well as II phase of globalization.
• Agriculture production as per constant price in the year 1990-91 produced Rs. 311500 crores but in the year 1998-99 it had gone up to Rs. 400030 crores where as in the year 2006-07again it had made good growth up to Rs. 485937 crores. So it will give a speedy growth in both phase 1st and 2nd or globalization. In comparison to that it state drastic improvement in an agriculture production as per current prices which showed direct impact of globalization. So it was a good growth and contribution from the year 1990-91 to 2006-07.
• Industry as per constant price in the year 1990-91 produced Rs. 214552 crores of production but in the year 1998-99 it had gone up to Rs. 338369 crores where as in the year 2006-07again it had made good growth up to Rs. 559801 crores. So it will give a speedy growth in both phase I and II or globalization. In comparison to that it state drastic improvement in an agriculture production as per current prices it showed direct impact of globalization. But as per Current price it showed the very slow growth in industrial production during Is phase of globalization and very speedy growth in the 2nd phase which is very good sign for Indian economy.
• With a growing production of agriculture allied activities ,agriculture production, industrial production and the production mining and quarrying business proved the remarkable growth if one goes through figures explained here so it will come to know that there was double growth from year 1990-91to 1998-99 and same change took place from year 1999-2000 to 2006-07.
So it shows excellent contribution to National GDP.
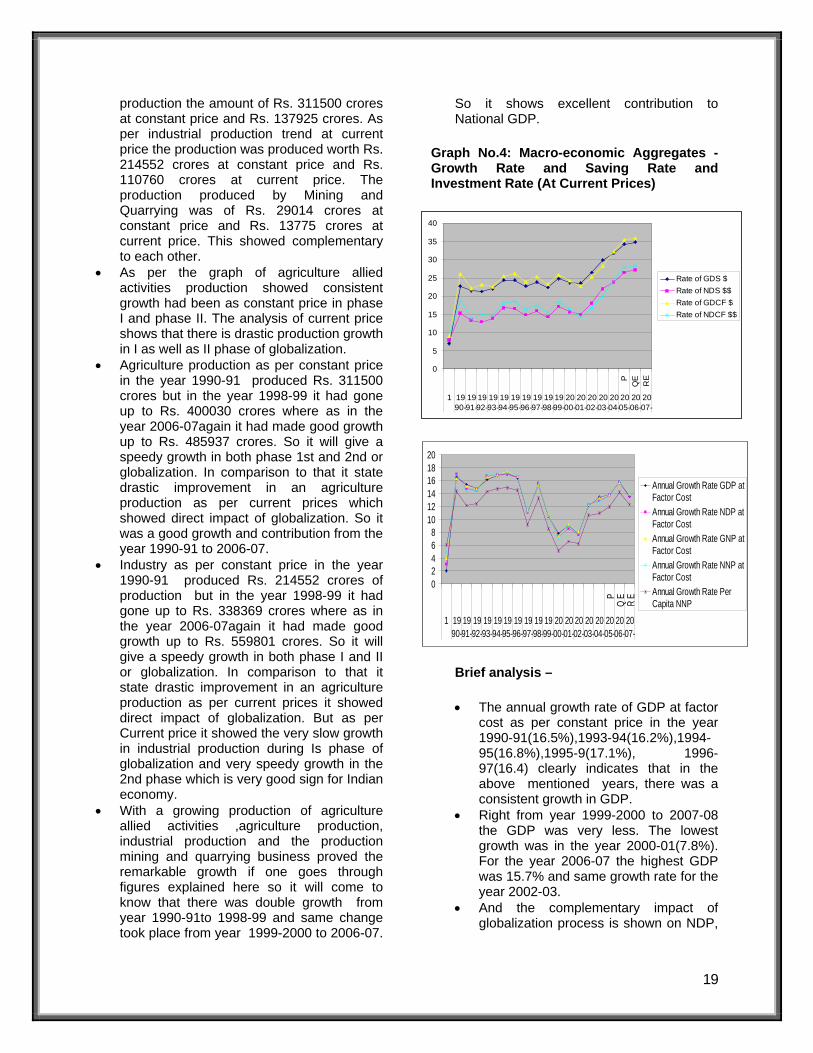
Graph No.4: Macro-economic Aggregates - Growth Rate and Saving Rate and Investment Rate (At Current Prices)
Brief analysis –
• The annual growth rate of GDP at factor cost as per constant price in the year 1990-91(16.5%),1993-94(16.2%),1994-95(16.8%),1995-9(17.1%), 1996-97(16.4) clearly indicates that in the above mentioned years, there was a consistent growth in GDP.
• Right from year 1999-2000 to 2007-08 the GDP was very less. The lowest growth was in the year 2000-01(7.8%). For the year 2006-07 the highest GDP was 15.7% and same growth rate for the year 2002-03.
• And the complementary impact of globalization process is shown on NDP,
0
5
10
15
20
25
30
35
40
PQ
ER
E
1 1990-
1991-
1992-
1993-
1994-
1995-
1996-
1997-
1998-
1999-
2000-
2001-
2002-
2003-
2004-
2005-
2006-
2007-
Rate of GDS $Rate of NDS $$Rate of GDCF $Rate of NDCF $$
19
02468
101214161820
PQ
ER
E1 19
90-1991-
1992-
1993-
1994-
1995-
1996-
1997-
1998-
1999-
2000-
2001-
2002-
2003-
2004-
2005-
2006-
2007-
Annual Growth Rate GDP atFactor CostAnnual Growth Rate NDP atFactor CostAnnual Growth Rate GNP atFactor CostAnnual Growth Rate NNP atFactor CostAnnual Growth Rate PerCapita NNP
GNP and per capital formation as constant price.
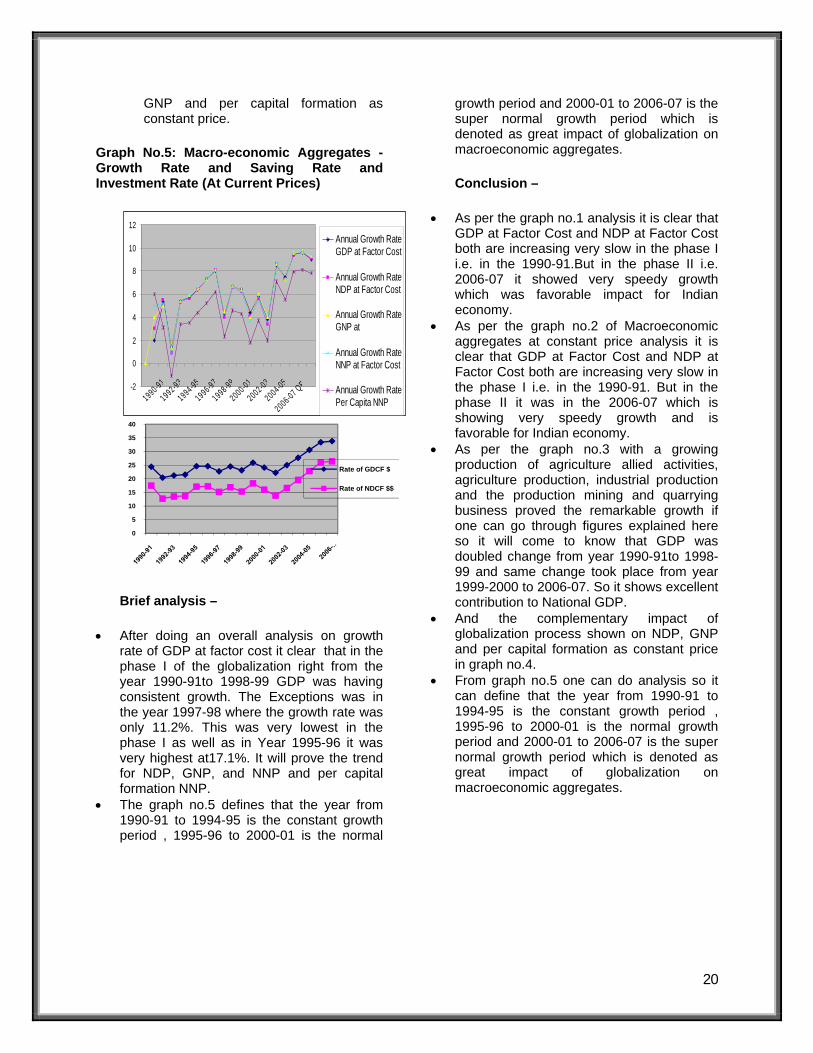
Graph No.5: Macro-economic Aggregates - Growth Rate and Saving Rate and Investment Rate (At Current Prices)
20
Brief analysis –
• After doing an overall analysis on growth rate of GDP at factor cost it clear that in the phase I of the globalization right from the year 1990-91to 1998-99 GDP was having consistent growth. The Exceptions was in the year 1997-98 where the growth rate was only 11.2%. This was very lowest in the phase I as well as in Year 1995-96 it was very highest at17.1%. It will prove the trend for NDP, GNP, and NNP and per capital formation NNP.
• The graph no.5 defines that the year from 1990-91 to 1994-95 is the constant growth period , 1995-96 to 2000-01 is the normal
growth period and 2000-01 to 2006-07 is the super normal growth period which is denoted as great impact of globalization on macroeconomic aggregates.
Conclusion –
• As per the graph no.1 analysis it is clear that GDP at Factor Cost and NDP at Factor Cost both are increasing very slow in the phase I i.e. in the 1990-91.But in the phase II i.e. 2006-07 it showed very speedy growth which was favorable impact for Indian economy.
• As per the graph no.2 of Macroeconomic aggregates at constant price analysis it is clear that GDP at Factor Cost and NDP at Factor Cost both are increasing very slow in the phase I i.e. in the 1990-91. But in the phase II it was in the 2006-07 which is showing very speedy growth and is favorable for Indian economy.
• As per the graph no.3 with a growing production of agriculture allied activities, agriculture production, industrial production and the production mining and quarrying business proved the remarkable growth if one can go through figures explained here so it will come to know that GDP was doubled change from year 1990-91to 1998-99 and same change took place from year 1999-2000 to 2006-07. So it shows excellent contribution to National GDP.
• And the complementary impact of globalization process shown on NDP, GNP and per capital formation as constant price in graph no.4.
• From graph no.5 one can do analysis so it can define that the year from 1990-91 to 1994-95 is the constant growth period , 1995-96 to 2000-01 is the normal growth period and 2000-01 to 2006-07 is the super normal growth period which is denoted as great impact of globalization on macroeconomic aggregates.
-2
0
2
4
6
8
10
12
1990-91
1992-93
1994-95
1996-97
1998-99
2000-01
2002-03
2004-05
2006-07 QE
Annual Growth RateGDP at Factor Cost
Annual Growth RateNDP at Factor Cost
Annual Growth RateGNP at
Annual Growth RateNNP at Factor Cost
Annual Growth RatePer Capita NNP
0
5
10
15
20
25
30
35
40
Rate of GDCF $
Rate of NDCF $$
Introduction The field of marketing is highly unpredictable and challenging. A continuous monitoring is inevitable. By the time a report is analyzed the markets may have changed drastically. The trend that may seem to be up coming may suddenly fade. This can be attributed to recent development in technology and communications and awakening of the consumers. However the success recipe does not depend upon en-cashing the communication and technology revolution only. Organizations cannot afford to leave any aspect for promoting or marking them as a prospective segment. Marketing Approaches Earlier the efforts of organizations revolved around the philosophies related with Production, Sales, Product and Marketing. 90s saw social dimension playing important role. Innovative organizations were quick enough to realize the potential of social networking sites. Orkut, Face book and twitter have become hot spots of social activities. Teenagers and adults are flocking and socializing, thereby creating a huge segment for marketers.
This can be ascertained by the survey conducted by The Nielsen Company in collaboration with Absolute Data. They forecast that almost 45,000 Indians are likely to join social networking sites every day over next six months. Study concludes that social media in India is becoming growing bigger than email with Indians spending more time on social networking sites and that nearly 40 million Indians are taking help online reviews to make informed purchase decisions. One third of India’s online consumers are aware of brands that have an online presence; over 50 percent of social media users perceive brands that have a social - media presence as being “innovative”.
\ Today we are in the era of holistic approach in marketing. It underlines that everything is important for the organization. Organizations cannot afford to miss out on any aspect if they want to succeed with their offerings. The means of communication and promotion are not restricted to just hoardings, print media and electronic media. SMS marketing is happening. Right now telecom companies are basically marketing their services and products through SMS marketing. But now companies are tying up for marketing of their products and services like mutual funds, insurance and real estates. Apart from this creativity and innovation plays a major role in building the image of any organization in the minds of consumers. The study notes: “60 percent Indians who are social media users are open to being approached by brands indicating that social media has the ability to change the dynamic between brands and consumers who are typically time-starved and may consider traditional forms of advertising obtrusive and undesirable”. Sony, Phillips and Microsoft are known for their strong innovation and R&D and they have managed to stay at the top. Rural India: An upcoming Market So when everything is important and matters for the organizations, rural market cannot be ignored. Top Companies are now concentrating on rural markets. Around 700 million populations is scattered in rural India in more than 6 Lakhs villages. Almost 60% of Indian population lies in rural India. The table below provides an insight into urban and rural distribution.
Item Year Number No. of towns 2001 5,161
No. of villages
2001 6,40,000 (Approx.)
Table 1 - According to Census of India 2001
21
Marketing: As it is Today Saurabh Srivastava
HOD, BBSIMT, Allahabad
Rural electrification has given lights to 88% (approx) i.e. around 5, 09, 620 villages. A study conducted by NCAER National Council for Applied Economic Research reveals that number of middle / high income household in rural India is expected to grow from 130 million to 172 million by the end of 2012 as compared to 71 million of rural India. Nielson has predicted that by 2025 Indian rural FMCG market will grow to 100 billion. Rural India has shown liking for such products as lipstick, skin care, deodorants, fabric softener, and noodles DTH cable connections. Their study also reveals that in comparison to urban markets rural purchasing power frequency of consumption has risen. Car companies like Maruti Hyundai GM and Mahindra are moving towards rural India to boost sales. GM witnessed 60% sales from emerging markets. Maruti claims to have sold 63.5% of rural buyers in cash Hyundai claims to have 30% sales coming from rural markets. According to reports published by Gfk Nielson rural India is quite tech savvy 7% of rural market possess touch screen handsets in comparison to 10% in urban areas. 40% of rural market goes for multiple SIM handsets in comparison to 22% sold in metros. The average selling price of touch screen phones in rural India was Rs. 2800 against Rs. 6200 in urban areas thereby showing price sensitivity of rural market. Research done by RNCOS reveals mobile handsets in rural market will grow at a compound annual growth rate of around 19% from 2011-12 to 2013-14. The initiatives of ITC’s e-chaupal, Tata’s Jaaguar have reaped success. Similarly HLL’s ‘all in one shop’ has been a huge success in rural India. BPL is launching BPL Chirag for rural market which is LED Lantern through which it hopes to make rural consumers switch from kerosene and crude oils. They have tied up with local NGOs and Self Help Groups (SHG) for distribution of products.
Conclusions Organizations need to follow totally different 4ps approach. Income, education and aspiration levels of rural India are high driving it towards new era. Rural markets now prefer durability and brands. Big brands and names attract them. But rural consumers are budget seeking consumers, highly price conscious and look for the affordability of the products. Marketers here should try to satisfy the basic needs of the products rather than offering additional features. Rural India wants value for money. They aspire to meet their basic needs with the products. The packaging needs to be smaller. Help of NGOs and social service organizations are being sought after for distribution. As financial institutions started realizing the importance of rural markets, Micro finance has gained momentum. Postman becomes a favorable and intelligent consideration for offering financial products and insurance schemes. The customer is the ultimate king. He may return from shops without finalizing any purchase, although he may be having a lot of cash. On the other hand, customer may have no plans to purchase but at the Point of Sales (POS) he may finalize purchase by taking loans. So marketing is not just about 4Ps. One needs to understand that for being successful one has to be a visionary and ready to accept whatever comes and follow the mantra of innovate, adapt and upgrade.
22
According to Webster the term organization is used for “Executive Structure” of a business. The organization is one of the functions of the management consisting of determination and enumeration of activities to achieve the objectives of the business and to take several steps so that they are efficiently achieved. The management has to decide what is called “Organization Structure”. Jasper 1 has very clearly given the ten principles which should govern an organization.
resume on management control and decision making techniques is also included.
1. Method study: Method study consists of technique of analyzing the methods used in performing a job or in a process so as to achieve most effective utilization of men, machines and materials. It aims at eliminating any work that is not essential to the main task by a detailed study of all the elements which make up a work or process. It is a very powerful tool for achieving higher productivity and is very widely used.
1. The structure of an organization depends on its objectives.
2. Every organization should have one single headman. Method study is the systematic recording and
critical examination of existing and proposed ways of doing work. It is a means of developing and applying easier and more effective methods and reducing costs.
3. Since, the headman cannot do all the work himself; he must assign work to others.
4. The headman must give others authority to carry out various responsibilities.
Method study does not set out to make radical changes in techniques used, but is like a fact finding or investigating service, to the management and should always be carrying out in an open manner and in full understanding with the labor.
5. The headman cannot decide every matter himself; he must let subordinates to decide some things.
6. The headman ought to occasionally consult with his subordinates.
7. The headman must check up on what his subordinates do.
2. Statistics: 8. The headman cannot directly supervise work of many subordinates. The science of statistics helps to provide the
management the information required to measure efficiency and progress in concise form. However, many managers are unaware of power and versatility of this science. A lot of data is collected in industry for use of the managers in decision making and control. However, often much of it is unnecessary or a duplication. Proper advice from a statistician can help in collection of the least amount of data to give maximum information.
9. The headman must set up sub-divisions or departments and choose their heads.
10. Specialization pays dividends.
The need for organization is due to the fact that individuals have to co-operate and work together to achieve objectives of a business. That organization is effective which achieves these objectives with minimum unsought consequences, or costs.
In this article attempt has been made to discuss some of the tools like method study, statistics, critical path method and value analysis used for improving organizational productivity. A short
The use of statistical techniques in quality control and in designing and analysis of research investigations is quite well known. Statistical sampling techniques can be very well used in industry in order to collect certain data
23
Application of Productivity Improvement Tools for Improving Organizational Productivity A. S. Prasad, Senior Faculty Member
FMS, IUJ
which otherwise would involve considerable costs and effort. The technique of operational research makes use of the science of statistics to a very great extent. The use of statistics, in case of much industrial decision, reduces the guess work. The statistics can also be used to synthesize the data for the higher management levels. However, it is often said that the statistics can be made to prove anything and as such it should be used with caution. The first part of the statement is only true in case the managers do not know the basic concepts of statistical methods. In today’s industrial management, I feel it is very essential that a manager has to be equipped with the basic concepts of statistical techniques..
3. Critical path method and/or pert:
Pert (Project evaluation and review technique) is essentially a planning and controlling technique which was first developed in 1958, by national aeronautic and space agency of U.S.A. for poloris missile project. It is claimed that with the use of Pert it was possible to complete the project two years ahead of schedule. In last quarter century several techniques have been developed to increase efficiency and reduce waste. However, there was no technique available to control the activities during the execution of the project. A project consists of a number of activities, each having its own estimated time of completion, which are interdependent and can only be completed in a particular sequence. In these circumstances, the time is usually lost between the activities. The Pert helps in reducing this loss of time to minimum so that project in completed in best possible time. Critical path method is basically same as Pert. The only difference is that with CPM the activities are deterministic that is its duration can be evaluated fairly accurately with Pert, we mainly deal with “Probabilistic” activities i.e. the duration of activities cannot be determined accurately. Each estimate has a probability attached with it.
4. Value analysis: The value analysis aims at reducing the cost of a product by reducing the costs of its components without reducing the quality of the product. It defines the value of a component as a function of its use so that latter can be
achieved at a lower cost. A definition of value analysis is that optimum relationship of performance, reliability and cost in equipment which combine to furnish essential function, adequate dependability and lowest total cost. The method of the technique is to study the features which contribute to the costs, so as to find out if they are fulfilling their functions at the lowest costs. The steps involved are:
1. Defining the problem. 2. Collection of data or information. 3. Analysis 4. Speculation. 5. Investigation. 6. Reporting. 7. Investigation.
The technique as such can be applied from the designing stage of a product so that lowest costs are achieved while specifying for a component itself.
5. Management control and decision making:
The manager of any enterprise or business is perpetually involved in choice-making activity. He has always to choose from a number of courses of action while making a decision (when there is only one course of action there is no decision to make). Any decision making process can be divided into five steps:
1. Defining the problem 2. Collection and analysis of facts 3. To find alternate course of action 4. Decide on the best course of action 5. Implement the decision
24
While taking a decision the manager has to consider several things like risk involved, economy of effort, timing, external effects (like competition), limitation of resources and the policy of company. After considering all this aspects the decision is taken which then is to be translated into effective action. Since the results obtained are criteria for any decision, it is essential the manager must compare the results from the decision. The decision making most common to the managerial field involves uncertainty in various degrees. It is greatest when the decision is purely guess work and is least when information available, enables us to predict the outcome with certain confidence. It is in this field that the recent advances of management science are made. Control is another field of management where rapid advances are being made. With the size of
25
business organization becoming larger, it has become essential to decentralize the decisions. However, top managers have to know whether these decisions are \taken within the frame work of company policy and are beneficial to the organization. For many years now, the technical developments have been moving ahead more rapidly than there utilization by industrial management. One of the reasons for this is slow development of management control techniques which act as tools of integration in the increasing specialization. The uses of computers have solved this problem to some extent; however, need for more advanced control techniques are emerging every day. However, when we come to lower management levels, the controls required are different and are more detailed. It is very essential that these factors are clearly visualized and identified so that proper
information can be supplied to various levels of management in order that proper controls achieved.
Conclusion
The business environment for corporate organizations is becoming increasingly challenging. The opening up of the Indian economy to global competition has increased the level of competition that domestic companies have to face. Under these circumstances, the need for organization is to reduce manufacturing cost, optimized productivity and improve product quality are necessary to stay in the market. It is therefore essential to adopt and implement the productivity improvement and value analysis techniques as discussed in this article.
The new State of Jharkhand was carved out from the State of Bihar on 15 November 2000 with fairly sound financial health. The environment for private investment is congenial since the State does not have the required tremendous potential for emerging as a forerunner in industrial development in the country. Rich mineral resources, large industrial base, efficient and hard working human resources and presence of some leading educational institutions of the country are only some of the distinct comparative advantages of Jharkhand that needs to be capitalized for the benefit of the State. The State is bestowed with 38%of the country’s mineral resources which will continue to be its biggest assets for the future. A look at the share of National Reserve is indeed remarkable with coal (33%), copper (34%), Iron ore (34%), Prites (57%), Quartzite (87%), & Graphite (18%) respectively. There exist extensive mineral reserves in areas like Singhbhum, Palamu, Lohardaga, Ranchi, Gumla, Hazaribagh & Dhanbad. Presently, one of the country’s best steel plant, automotive manufacturers and a number of mineral base industries provide a culture of industrial development .The State is also blessed with some of the finest institutions related to mining and metallurgical facilities having experts with years of experience to harness its potential. The small provision of sound infrastructure facilities ensures easy movement of goods & services within the district in particular and outside the district to other regions in other States in general. As such these facilities are vital for accelerating the process of economic development and growth. Jharkhand State is endowed with a good number of educational institutions .These educational institutions are efficient and capable. They do meet the national standards of education and the students taught and trained in these institutions occupy prestigious positions in different spheres of activities.
The important infrastructure facilities include transport and communication, electric power and water supply, developed industrial plots and ready made industrial sheds, technical and educational institutions, availability of trained & skilled manpower, credit facilities, organized market, consultancy and other support services which are available in a particular region. In fact all industrial and commercial transactions involve time lag and the shorter this time lag involved, the better it would be for the industrial enterprise. So an adequate level of such facilities is imperative for rapid growth of the industries. Moreover an improved infrastructure helps & attracts entrepreneur from other areas /regions and brightens the investment opportunities by reducing the investment risks. While identifying the product line and planning the project, it is very important that availability of infrastructure must be analyzed in detail so as to avoid bottlenecks at later stages. The infrastructure development and management is perhaps one of the greatest challenges our country is facing today. While the Govt. of India and State government across the country works towards resolving the myriad sets of issues including resource crunch for improved infrastructure .States in Eastern India in particular too have a lot of catching up to do. Growth of East Asian economies, including that of China’s and a major boom in the infrastructure sector resulting in creation of huge demand for steel products present an opportunity for Eastern India in particular .Anticipated opening up of trade routes to China, the SAARC economic trading block and GOIs ‘Look East’ policy provides the apt context for examining development in East India with renewed focus. However the Eastern region needs to build and upgrade its physical infrastructure, as the mineral rich State in the region are now receiving considerable interest from industries which are particularly relevant to this part of the country, like steel .mining, food
26
Need for the Development of Infrastructure Facilities in Jharkhand Sandeep Kumar
Production Officer in Waxpol Industries Ltd Academic Head, Vinayaka Institute of Management & Science, Ranchi
processing, tourism and the newly emerging areas of auto components. Growth in economic activity of any size and scale cannot be supported without a commensurate development in the physical infrastructure. Connectivity infrastructures (Air connectivity, roads, rails and a well planned urban transport system), economic infrastructure (Industrial infrastructure, power and energy etc) Urban and social infrastructure (Water supply, sanitation housing, health and education) all need adequate investment and focus to spread the economic benefits across the region. Infrastructure development and management has till recently been considered the exclusive domain of Government. The recent stride made in telecom connectivity has made it apparent even to the common man as to the benefits of private sector role in delivery of public utilities. The private sector in East India is seeking to play significant role in infrastructure development, while there is also enhanced interest from national and international players for opportunities in this region .It is thus an appropriate time for State governments to reflect on the requirements of an enabling environment for private participation in infrastructure development. Vibrancy of local economy and ability to pay by citizen has direct impact on project viability and in turn the projects ability to attract private capital. The growing urban agglomerations across Eastern India and emerging cities with access to huge mineral wealth, thus directly impact the scale economics for large project investments. The challenge in attracting private capital for infrastructure development in Eastern India therefore merit a more detail analysis. Urban centers as engine of economic growth provide the base for new services and products and provide scale economic for most economic activities. While State may create enabling environment for private investment, it is cities in effect that compete for inward investment. Improvement in urban governance and urban infrastructure, both require urgent action. States such as Jharkhand need development strategies to balance immediate and long term priorities together with approaches /solutions specific to local contexts and providing an enabling environment for private participation and for infrastructure financing.
Generally speaking, a, 1% increase in annual GDP growth in India would require an equivalent investment in infrastructure. This means that a GDP growth of 8% annually in real terms for the country would necessitate an investment of at least 8% GDP in infrastructure creation else this level of GDP growth may not be attainable. Against this, the approximate annual investment in India in infrastructure is about 4% of GDP leaving a deficit of 4% of GDP for infrastructure financing after adjusting for FDI inflows into the infrastructure sector. This suggests that private sector spending in India on infrastructure asset creation or its operations is low at present level. The other way to view this would be to say, that, private investment in infrastructure has the potential to increase from current levels of 1% of GDP to 4% GDP. Achieving this leap requires us to provide an enabling environment for private participation and for infrastructure financing. Initiative towards infrastructure Development in Jharkhand The Government of Jharkhand provided a major thrust to its initiatives towards development of infrastructure through three projects in the industrial areas of Adityapur in 2005.In all these projects namely-second Adityapur Toll Bridge over the river Karkalla, Adityapur water supply scheme and Automobile and Auto component SEZ in Adityapur, the model of project development through Public Private Partnership was adopted. Subsequently, several major mandates like the development of the National Games Housing complex in Ranchi, city centre in Adityapur, Integrated State Bus Terminus of International standards in Ranchi and others were successfully structured through private participation. These projects are currently under implementation. In order to provide an additional fillip to its infrastructure development plans through private participation, the Government of Jharkhand entered into an equally owned. Joint Venture with one of the leading financial institutions and project development firms in the country i.e. Infrastructure Leasing & Financial Services (IL & FS) to form the Jharkhand Infrastructure Development Corporation Limited (JINFRA) which would act as a vehicle for development of mega infrastructure projects through public –private partnership.
27
28
JINFRA is currently developing a number of landmark projects across the State including two integrated industrial parks, augmentation of water supply schemes, a horticulture market and food processing zone, creation of tourism infrastructure etc. Along with such development initiatives, the Government of Jharkhand is actively working towards creating an enabling environment in the administrative and regulatory space for attracting private investment. The re-drafting of the State Industrial Policy and creation of a
Special Economic Zone Act is specific initiatives in this direction. Conclusion This note seeks to lay agenda for a policy debate amongst stakeholders concerned with infrastructure development in the State of Jharkhand during the course of a series of Interactive Sessions organized. The deliberations by various participants in these sessions is indeed going to be the ‘food for thought’ for policy makers, advisors, investors and all other stakeholders in Jharkhand’s path of progress.
A leader, at the center, holds, so that the ‘things do not fall apart “. He at the center emits rays of inspiration and influences the movement of each planet in the orbit. The leaner the knowledge-worker, the high the community, the technology, the spirit of social changes all over around him. The administrator should undergo a process of self exploration and renewal for time and change both. Towards Self-Empowerment (According to Behavioral Scientists) A Person who occupies position of leadership should exceed the average per in intelligence in scholarship, in the exercise of responsibility, in enthusiasm and in capacity to bear the burden of the office patiently. Mind if trained and harnessed will transform in administrator to a leader with a vision. A leader has to be just with a sense of fair play .He is expected to be caring, dutiful with an ability to decide, initiate and drive. For effective leadership, the man at the helm will have to take change of him. He has to exhibit a consistent matured behavior professing his institutional and educational philosophy. He has to strive continually to improve the various skills. He has to upgrade himself with principles and techniques of personal management. He may have to be aggressive, autocratic sometimes (but temper has to be kept in check) or can be directive or guiding. Douglas McGregor’s two interesting theories of management: Theory X starts with the assumption that the average human being has an inherent dislike for work and will avoid it if he can. Therefore, if the management is to achieve its objectives, it must control, direct and in cases use punitive measures. The theory upholds that workers are mainly inert, shrink work and responsibility and have little ambition. Theory Y is just the opposite, It holds the human as a energized force which needs to expand physical and mental effort in work there management has to handle people cautiously. Handling people becomes a
creative art because humans here prefer self-direction and self control and mere guidelines from authority. It becomes imperative, for the principal, to work out priorities for himself and others and assign responsibility .He has to build a bridge between the ancient methods of mind –mastery and the modern psychological needs. Towards empowerment of the Faculty A leader with a vision is a direction setters a change agent, a guide and a guardian of institutional interests. The right leadership creates meaning in the lives of the teachers and the students and establishes a standard of excellence by setting new trends ,of valuing hard work and brilliance .He always lifts the followers from ‘routine’ culture and keeps the School and its programmes going growing and glowing. All his efforts are directed towards improving and facilitating the teaching learning process. The faculty development program includes the following areas: 1 Selection on merit and promotion on performance 2. Arousing consciousness for self development. 3. Creating a sense of belongingness by involving them in defining institutional image and goals. 4. Cooperative planning, group discussion and designating power by giving them charge of steering committees. 5. Inviting consultants and experts for orientation and updating. Promoting cordial interpersonal relationship Quality Consciousness The head can encourage their students and faculty to create quality circles to the tune of the following advantage
• Boost team work • Developing new techniques and
methods • Improve performance by simplifying
the complex • Create a ‘no-problem’ cultures
29
Role of Leadership for Excellence in Education Rumna Bhattacharya, Senior Faculty Member
FMS, IUJ
• Develop harmonious interpersonal relative
The Quality circles approach would entail three ‘F’s –Find the Problem, Fix the Problem. Finish the Problem Learners Improvement Programme Coursework is by no means an end in itself but means to achieve higher goals Learning is a multifaceted system which includes habits formation, developing positive attitudes boosting creativity and learning skills fulfill learners’ needs and interest providing thrill and excitement through adventurous program. Assimilation of outside class activities and experience of outside the campus project would be beneficial for the togetherness of the student body and community The leader has to take care of the surrounding bushes of the tree for the social conservation. The tree or the in class course design is strengthened by the variety of bushes growing around it.
The Macro-micro Factors Managerial leadership of an educational enterprise ought to give due consideration to macro and micro factors alike. So far the leaders have over emphasized the micro factors –the focus on superior’s subordinates and students they have neglected the macro aspects in the process. Macro factors comprise the cultural background and the resultant work ethos. Culture denotes the shared values, the cultural differences the philosophical principles ethical concepts the mores and the patterns of learning behaviors. The role of the leader thus stretches out to a comprehension of the on-campus heterogeneity of culture in the Indian set up and work towards a harmonized ethos that can turn out to be generative and creative The leader, the manager who meets the challenges of his profession in the manner most consonant with the essential essence of rightful life will emerge victorious and will pass on an enriched posterity.
30
Introduction It seems that nothing is un-brandable these days. From soft drinks, cars & clothing to financial services, telephones and even health cares. There is not much product differentiation among colas or beers or computers Yet the makers and providers of these products and services would be fools not to claim that their products or the companies themselves are truly special. Otherwise, a company’s product or service is dismissed as a commodity, which is typically bought at the lowest price as globalization increases consumer choice and product availability, commodities and services can often only be differentiated by one thing: brand. Branding, or imbuing a product, service or entire company with special qualities, helps to insulate a company from the downward spiral of price competition. The brands have to do much more than protect the price of a product. The growth of internet commerce has only intensified the view that a strong brand may be all that stands between profit and loss between corporate identity and obscurity. Whilst brand may be bigger and bolder than before, more is expected of them as the marketplace buckles under the weight of product overload. Does brand loyalty really exist in the New Economy? Many analysts are predicting the death of the brand and of customer loyalty, arguing that sales are less a result of great branding and more about accessibility and affordability. The time has come for many brand owners and managers to step back and reassess what their brands and their companies really stand for. Brands must deftly transcend international boarders, they must help consumer’s navigate the consumption landscape and they must convey a sense of prestige, power, appeal or friendliness. Its enormously expensive & a complex process. Branding is not without its risks. Successful brands must be ready to accept the socio-cultural consequences and obligations that go with that enormous power. Brand in the balance explores the issue of the anti-brand backlash and takes a close look at the future of the global brand and what e-commerce companies must do to make sure
their brand names stand out and make a lasting impression. Main Thrust Brands are every where today. The world is under brand bombardment because brands-the ideas, words, graphic designs and sounds that symbolize products, services and the companies behind them are the hot ideas in business today. The world is speeding into the information age. Style is taking a seat next to substance and the language of commerce is shifting to images and perceptions from nuts and bolts. As a result every one is jumping on the brand wagon. Not just the usual consumer goods companies, but banks, brokers, insurance, utilities, publishers, athletes, accountants, lawyers, artists, musicians, governments, charities-all see a strong brand as vital to success in the post industrial economy. Brands are bigger than ever, but as a result it is also true that more than ever is expected of them. From the boardroom and the supermarket to the internet and the city streets, new challenges are confronting brands and pushing the booming field of brand management toward a critical juncture. Consumers and citizens want brands that are more helpful and trustworthy. Businesses want brands to be more accountable and coherent, while the web presents an entirely new array of demand. Brand in the balance is divided into four sections - in the Company, in the market place, on the internet and finally in the society. In the Company Inside the firm, brands are increasingly seen as important and measurable assets involved in real economic growth. As a result performance targets are ratcheting upwards. Marketing departments are being held more accountable. Corporate structures are shifting to make brands more central, with direct responsibility for them held all the way up the chain of command. In some firms, brands are coming to be seen as organizational ideals
31
Jumping on the Brand Wagon Priya Srivastava, Faculty Member
FMS, IUJ
that embody the best of the business, demanding careful handling and rigorous protection. The days when the brand was just a catchy slogan and a clever logo cooked up by some suede-shoe creative’s in marketing are over. In the Market Place In consumers markets, brands face unprecedented difficulty in winning and keeping public attention. Amid a rising flood of media and messages, brands have to work harder than ever to stand out with meaningful messages that are unique and appealing. As transportation, communication and entertainment continues to unify the planet, international brand owners are struggling to balance global efficiencies with respect for local tastes and habits. Underlying these challenges, of course, is the constant imperative of keeping focused on the basics. In trying to deal with new problems, brand managers too often lose sight of the fundamental keys to branding. A company that can keep the basic tenants’ in mind, while balancing the global local issues, and breaking through the ever growing brand clutter with a unique, useful and trustworthy message, is the company that can succeed in today’s branding Market place. On the Internet The e-brand revolution is accelerating the speed with which brands can be introduced and brought to the awareness of the consuming public. For a time it looked as if e-brands would destroy other old notions about branding. But such revolutionary talk has eased as some high –flying e-brands have crashed to earth, vindicating time-honored notions about brand perception. For the e-brands, the new challenge is to differentiate and make them better understood. In the society With traditional institutions such as family and community declining in some part of the world
growing number of people look to commercial brands to help them define their personal identities. Some consumers especially the youngsters unconsciously gauge their worth by the branded material goods they are able to amass. The right brands bespeak wealth and wealth bespeaks success. At the same time, some young people in developed societies are rejecting major brands as emblematic of established power. Some brands are being targeted as can be seen in Uttar Pradesh and Jharkhand in Reliance Fresh. At either end of these two extremes from materialistic status seeker to the idealist vandal the picture is one of individuals reacting to commercial identities with strong emotions and seeking to define themselves through them. Conclusion A further consequence of the social brand backlash is that some brands are being targeted by a new class of social and environmental activists. Web-savvy and brand smart, these gadflies cunningly promote their own agendas by piggy backing on the notoriety of top brands through boycotts, pickets and physical attacks. These activists know they can gain maximum publicity by targeting brands because big brands win big headlines. The most effective strategy for dealing with growing social challenge in front of branding is not an easy one and involves nothing less than changing the culture of the business. Taken together, these four fundamental challenges are sorely testing the vision and skill of brand managers. But they are also having the indirectly beneficial impact of forcing brand owners and managers to step back and reassess what their brands and their companies really stand for.
32
Introduction The surplus of production in the industrialized countries and low production in developing countries is the main factor for international business. The advantages of the virtual organization in increasing global competitiveness show how information technology can be deployed effectively. The use of computers increased the pace of business, globalization & competition. Using the Internet to lower communications costs and reduce time-to-market for goods and services exports makes it a very valuable medium for firms engaged in international trade. The intensity of Internet use roughly reflects levels of economic development. Review of Literature There are various studies that has been done in the respective areas and tools of information technology. Some previous studies explain the role of IT tools in International business and some factors which are the constraints of adopting virtual international business by the industries. Ardhaldjian and Fahner [1994] consider that BPR is a methodology based on processes and directed by top management who wants better performance from the organization through radical changes. BPR is a methodology that promotes change and introduces new processes and new styles of working. So certain elements will be required to make change possible. These elements are known as enablers and may be defined as elements that act as vehicles for processes to change. IT promotes changes in organizations, mainly changes in the nature of the work, the integration of business functions, and the transformation of competitive forces [Scott-Morton, 1991]. Virtual International Business Virtual teams are a great way to enable teamwork in situations where people are not sitting in the same physical office at the same time. E-business enables domestic companies to enter in global market very easily without physical existence. Thus, the concept of virtual
international business emerged. Future state of international business would tend to be e- business. A number of companies across the global market have started carrying out their business through e-business. For example: Apollo hospital created virtual data bank by which Apollo doctors can look up their patient’s records anywhere in the world and be able to deal with the emergency also. Another example of virtual international business is Max health care which created an internet websites by using an ERP (Enterprise Resource Planning) system. The site includes all the information as well as provides virtual health care to a large extent. Hence, through internet, health facilities can be provided to the patient even from the international hospitals. In International business logistics management can be through internet as logistics firms are getting on to the net to offer better inventory management services. Objective The objective of the paper is to seek the role of information technology in the working of virtual international business and to study the constraints of virtual international business processes. Research Methodology The paper is based on secondary data which is collected from various secondary sources as books, journals, articles, internet sites etc. The nature of the research is descriptive and conceptual which focus on the role of information technology in international business. I t tries to describe various IT tools in the international business on the other hand it tries to explore a new concept of International business in globalised era. Information technology tools and its role in virtual international business: Information technology has been developed in India at a fast rate. The information technology has brought significant and dramatic changes though various tools and techniques as supply chain management, Enterprise resource planning, business process re-engineering,
33
Virtual international Business: an Overview Yogita Dwivedi, Faculty Member
BBS Institute of Management & Technology, Allahabad
electronic fund transfer etc. Some IT tools and its role are: E-business: E-business is about using the convenience availability and worldwide reach to enhance existing business or creating new virtual business. E-business is used mainly in three areas: a) Intranet: Within the organization e-
business uses as intranet for electronic communication. Intranets promote communication and information sharing across global boundaries. The rapid access to crucial internal information that intranets allow can increase learning by transnational firms because intranets may be accessed from anywhere in the world.
b) Extranet: Inter-organizational systems (IOS) are types of information systems that permit the coupling of transactions between organizations, making them more efficient and responsive. In business to business dealing e-business takes place over extranet which consist of two intranets connected via internet. Use of Virtual Private Network (VPN) keeps the costs low at the same time keeping the business transaction private. Example: Insurance carriers also use IOS links with independent agents.
c) Internet: The Internet, the largest network
of computer networks, is the medium usually favored for electronic commerce because it allows an organization to cut service costs while increasing the speed of service delivery. It provides virtual shops offering goods and services to whosoever visits their websites.
Electronic Data Interchange (EDI): It facilitates the transfer of business documents stored in structured format through mutually agreed messaging protocol from one computer application to another. EDI is becoming the norm in many inter-company transactions, particularly in ordering, distribution, and payables and receivables. In the retailing industry, EDI systems have enabled firms to reduce to a few days their logistics cycle for ordering and stocking. Language Translation Software:
Language translation software allows the translation from one language to another, and therefore may be used to increase the speed and local responsiveness of an enterprise. While allowing a foreign written or verbal communication to be translated into the language of the recipient, such software also reduces cultural gaps between countries. Electronic fund transfer: E-banking includes familiar and relatively mature electronically-based products in developing markets, such as telephone banking, credit cards, ATMs, and direct deposit. In Singapore, more than 28% of Internet users visited e-banking sites in May 2001. It includes Fund transfer and payment systems; Integrated B2B e-commerce product, involving product selection, purchase order, invoice generation and payment; Securities placement and underwriting and capital market activities; Securities trading; and Retail banking. Business Process Re-engineering: The emerging of International business needs special attention multifaceted deeper structure of multinational corporations. Business process re-engineering is continuous improvement at radical innovation in order to reduce cost and time and enhance organizational flexibility and customer satisfaction. Total quality management and just in time concept help in enhancing efficiency of separate processes. Constraints of Virtual International Business: All the tools above show the significant role in the international business activities virtually. It indicates that with lower cost and accuracy virtual business works successfully in globalised and competitive era. It not only enhances the competitiveness but also gives a wide market to the industry. But the failure of various online shopping sites arise doubt regarding future scope of e-business and its role in international business. The first and foremost problem faced by e-business is cultural differences in countries as the buyer physically sees the product before purchasing. Due to different environment customer need may not be served appropriately, as well as pre or post sales services may also fail. In general, the main issues of concern that acts as barriers to the increased uptake of
34

35
information technology in developing countries are as follows: 1. Lack of awareness and understanding of
the value of e-commerce. Many SME think e-commerce is suited only to big companies and that it is an additional cost that will not bring any major returns on investment.
2. People play a vital role in the development of e-commerce. However, technology literacy is still very limited in most developing countries.
3. The initial investment for the adoption of a new technology is proportionately heavier for small than for large firms. The high cost of computers and Internet access is a barrier to the uptake of e-commerce.
Conclusion The role of information technology gives a wide scope for the businesses to grab the world wide opportunity. In spite of various constraints that are working as threat for the organization Information technology is still expected to play a vital role in international business in the years to come.
Performance of any organization is a direct function of efficiency of the stakeholders involved in it. Employees, being one of the most important stakeholders of any organization, have been identified as the crucial factor for the success of the organization. Since a person to become an employee of an organization comes through different levels of screening, it is hence inferred that an employee must have possessed sufficient volume of efficiency to be-fit to the organizational need. If this inference goes wrong, then the efficiency of the persons dealing in recruitment process gets tagged with question marks. But generally, due to steep competition in the supply side of the labor market, the organizations follow the best possible ways to recruit the best talents and hence the above mentioned inference stands for ever. Now the paradox is ‘how come an organization with having best talents in hand performs dismal?’ Probably the silver lining for this paradox is the gap between the potential talent of the employee and the talent in-use. And the emergence of this gap is attributed to the person leading the show. In fact, the leader of a team is supposed to identify the efficiency inherent with the employee and devise the strategies to make best use of that. Since all organizations do recruit efficient leaders as well, why don’t the organizations perform uniformly the best? It’s most importantly because of the nature of the leadership. This article does not emphasize the theoretical aspect of Leadership but focuses on the practical facet of managing the show in an organization by the so-called leaders. Leader here does not mean to the number one person or the proprietor of the organization who is not answerable to anybody. In fact, leader here means persons holding the managerial or administrative positions who work between two tiers: the lower tier – the subordinates who s/he controls or supervises and the upper tier – the proprietor or the ultimate Boss who directs him/her and to whom the leader is answerable.
Types of Leaders: Considering the ways the leaders are now working in different organizations, leadership can be categorized into three broad heads; i) Authoritarian, ii) Lenient and iii) Cross.
i) Authoritarian:
Leaders of dictatorial nature practice this type of leadership. The approach of such type of leaders is very strict and straight but uniform across the tiers. Neither they change their stand before the Boss in the fear of getting punished nor do they submit their voice in the apprehension of non-cooperation from the subordinates. Generally they are workaholic type and their ultimate aim is constrained optimality. The passion of this type of leaders is to identify the inherent efficiency within the employees working under them and make the best use of that for organizational growth. At the same time, for due recognition of the efficiency in-use, they propose before the Boss for commensurable reward to those employees. Although this type of leaders seems to be very harsh, for the sake of organizational betterment only they generally become so. The limitation of this type of leaders is that they don’t weigh anything on humanitarian ground. They believe in two things – a) ‘Perform or Perish” in the context of subordinates and b) ‘Recognize or Shutdown’ in the context of the Proprietor. Because of this type of straight forward attitude, sustenance for them in an organization becomes very difficult. In fact, they don’t compromise anything for the sake of saving their position in the organization.
ii) Lenient:
Leaders with soft approach, who believe in performance without imposition, put into practice this type of leadership. The good thing with this is that the leaders become easily accessible and approachable by the subordinates and the bad thing is that the leaders fail to establish and defend their view point (even constructive) before the Boss. In fact, this type of leaders believes in two things – a) ‘Performing amidst no professional cob-
36
Authoritarian vs. Lenient Leadership and Capitalizing the Efficiency of Employees Sukanta Chandra Swain, Faculty Member
FMS, IUJ
web’ for the subordinates and b) ‘Yes Boss Approach’ for the Boss. Although this type of leaders seems to create harmless and conducive atmosphere for the people in both upper and lower tiers, in reality they cause ir-repairable damage for both the parties and the organization as a whole. Their first approach of ‘Performing amidst no professional cob-web’ is alright for the self-disciplined employees. In fact, this approach will induce the self-disciplined employees to perform at their optimal potential level. But in an organization, the percentage of this type of employees is very small. For others those who by default like not to work suo motto, this approach caters a great deal for their under performance. In fact, in the midst of this atmosphere, not only they like not to perform but also they keep on insisting other performers not to act upon. As a result, the gap between the potential and the achievements gets widened and the performers may get de-motivated for the merriment of the non-performers and not being identified and recognized properly. The second approach of this type of leaders, i.e., ‘Yes Boss Approach’ may from the exterior look good from the proprietor’s point of view as s/he can easily rule out the leader’s stand point and impose his/her view point. By doing so, the proprietor will get rid of the problem temporarily without approaching the issue. But the unsolved issue may in due course crop up again with greater momentum the solution of which will either require plenty of time, labor and money or will be unsolved for ever leading to deadlock in organizational activities. If one puts intuitive view on the performance of this type of leaders, s/he will obviously find something which is harmful for both the tiers.
iii) Cross: Some leaders are there who are not completely authoritarian or lenient. They change their approach as per the situation. As they inherent both the extremes (authoritarian and lenient) in them, they can rightly be called as Cross leaders. Under this head, the following three categories of leaders will come; a) Authoritarian for subordinates uniformly but lenient for the Boss, b) Lenient for selective subordinates but authoritarian to the Boss, and c) Authoritarian to subordinates selectively but lenient to the Boss. Under the first category, the leaders become harsh upon the subordinates and impose upon them ruthlessly so as to get things done. Consequently, in fear of any disciplinary action
or threat of losing the job, the employees often under compulsion land themselves into uncomfortable zone causing imbalance in their professional and personal fronts. Sometimes they perform as per their potential and some other times they distort their potential. In this situation, one good thing is that the leader treats all the employees equally. The worst part of this type of leadership is that well deeds don’t get due recognition. It happens because the leader changes his/her approach before the Boss and does not raise any point in favor of the employees. But the leader appropriates a great deal of advantages as the Boss becomes happy for the things getting done without any extra cost or demand for cost. In fact, in this type of leadership, the leader gets reward for the performance of the employees but the level of dissatisfaction of the employees towards the management happens to be exceedingly high. The second category of Cross leadership is rarely found in the real world. If the leader has bit monopoly power with very high opportunity cost and the proprietor is unable to find a better or even at par alternative of the leader, then the leader can be authoritarian to the Boss. Under this type of leadership, the leader, with his advantageous situation in term of rapport with the Boss, can be lenient to the employees. But generally, this type of leaders misuses their advantageous position in favor of a class of employees who are close to them and pamper them on regular basis. As the workaholic employees do not prefer to visit to the leader or pamper him/her unnecessarily, the leader becomes authoritarian for them but exhibits leniency to the cheaters among the employees who keep on managing him through one way or other. Very often these non-performing employees, to keep the leader in good term, forgetting their main job they suppose to do, just try to please the leader at any cost. For this, at times, they speak against somebody who the leader does not like. In return, the leader promotes them going out of the way and hence creates a sense of de-motivation among the well-performers. It hampers the productivity of the organization leading to a gap between the potential and the achievements.
37
There is a very peculiar but very common category of leaders who are completely lenient to the Boss but purely authoritarian to some of the employees. In fact, these leaders are leaders by default. They don’t have guts to speak before the Boss and the Boss does not give even slightest weight to their words. The

38
employees those who know about the status of the leader in the eyes of the ultimate Boss don’t care for the leader and hence in apprehension of getting misbehavior or retaliation from them, the leader becomes very much lenient to them. But the employees those who don’t prefer to get closer with the leader but whole heartedly concentrate on their job generally receive ill treatment from the leader. In fact, the leader shows his authority before this type of employees. As a result, those who know the weak point of the leader don’t wish to perform and those who are ill-treated by the leader get de-motivated to perform. It ultimately causes damage to all concerned. Because of a wide gap in efficiency management, the organization suffers. Consequently, the Boss hates the leader for the damages. The employees for whom the leader becomes lenient also don’t get any benefit as the leader himself is not in the good book of the ultimate Boss. As such, the well-performers not being so close neither to the Boss nor to the leader don’t get any reward for their good deeds. Thus this type of leadership kills talents of non-performers and performers as well leading to a sluggish performance of the organization. Unfortunately, the last category of Cross leaders are mostly prevalent in all the sectors of Indian economy but if we talk about service sector, it is just an indispensable part. Just to keep their chairs safe, the leader become
exceedingly submissive before the Boss and to take the credit for some good innovations they keep on pressurizing the well-performers mercilessly leaving the non-performers on their own track. This type of leaders may manage to play safe in the short run but ultimately they will be caught by the Boss and answerable for everything. In fact, in the long run, neither will they get appreciation from the Boss nor will they be liked by the employees – irrespective of whether they are close to the leader or not. Conclusion: The leadership that will sustain with win-win situation is one which is authoritarian uniformly in all tiers with a little bit of leniency and that leniency should be situations which are beneficial to the organization and employees but not to self. If one argues to incorporate this variety in Cross leadership, probably s/he won’t be wrong. But this variety is unlike the three cross varieties mentioned above, where in the situations that make the leaders lenient were only for leaders’ self interest. But here leniency should come for others’ interest. For example, if a persistent excellent performer did a mistake unknowingly or accidentally for which s/he is repenting a lot, there is no harm if the leader reveals leniency for him/her. Above all a little push in the right direction can make a BIG difference.
Computers and Information Technology are touching every nook and corner of our life. Every activity associated with mankind has been affected by this technological advancement in one way or the other. Our education system and teaching practices are not exceptional to it. As we all know students and teachers form such a combination of people that not only covers a great fraction of population but also their relationship plays a vital role in the formation of social values and conventions. Therefore it becomes very necessary to have a close look on the way the need of new technology is being inculcated in our mind. According to the conventions and beliefs pedagogy embodies teacher-focused education. A teacher is supposed to possess all information and knowledge relevant to the subject. And he can incorporate his own style in teaching methodology in an authoritative manner. In the process a teacher may use various teaching aids technical support to deliver his ideas more effectively. The use of IT and computers has emerged as a very powerful tool supporting the pedagogical practices in the recent past.
Since, computers, software and IT tools have become the integral part of the whole teaching process and its utilization is involved in all activities from basic classroom teaching to research work, there is a need to develop an understanding among both the teacher and the taught about the effective and optimized use of technology so that benefits can be extracted from the technology without affecting the existing social values and culture. This is important because teaching in our society is not just a give and take phenomenon. Rather it is a relationship which is formed and strengthened by existing social values, ecology and culture. Also, human beings were learning for many millennia before computers and Internet, and it would be shortsighted to abandon this wealth of experience in favor of a combination of technologies that has been available to institutions for only about few years. Therefore, before adopting the IT in its entirety, the training structures in education
would need to be reformed and restructured to provide teachers with the opportunity to develop basic technological skills, subject knowledge and collaborative ways of working in order to integrate IT in curriculum. Adopting new IT tools is the need of the time. But, actually we have been hurriedly willing to shape our lives to fit the requirement of the technology and not the very requirement of the education. As this is an age of rapid technological change, if we will go on implementing frequent changes in pedagogical practices and values just for the sake of availability of the technology, it will merely help strengthening the teaching. As an example, many teachers use PowerPoint presentations in their classrooms for explaining the topics. But in most of the cases PPTs are just digital replica of the content that they would have written on the black/white board. In such cases teaching becomes less effective as such running presentation does not have the dynamism and flexibility that is available with the marker & board. Mostly, the themes used in such presentations are there only because they are available in the list. Moreover, the nature of such teaching practices is more informative and less illustrative and they lack in the formation of teacher-taught circuit. These aspects are important to understand and to be considered because education is basically a human enterprise. Revelations’ certainly occur while sitting at a computer, the bulk of academic understanding is best acquired in a class room, where a community of fellow learners is formed. Students also learn essential life skills in a class room, including how to interpret meaning – not just in word, but also in voice, eyes and body language. Shy students emerge from their shells and aggressive one acquires gentleness and gets polished. So, IT implementation in education should be a strategic process and needs to be monitored continuously. It is true that we are blessed with fantastic availability of IT & other technology, but the transition in teaching methodology should be sought by a judicious perspective considering pedagogy.
39
Effects of IT on Pedagogical Practices Rakesh Kumar Pathak, Faculty Member
FST, IUJ
The Performance Appraisal Process The Performance Appraisal Process involves evaluation of actual performance of an employee against desired performance of the employee. It reviews various factors which influence performance of the employee. It needs that the management should plan strategies in a structure manner to improve performance of each employee in the organization. It takes care of goals of the organization and gets optimum utilization of human resources. Following are the stages of Performance Appraisal Process 1. Establishing standards and measures
It identifies and establishes the measures which would used to differentiate between successful and unsuccessful performances.
2. Communicating job expectations There is a communication form employer to all employees about the measures and the standards which going to be used in the appraisal process. It clarifies the expectation of the employer form all employees and creates a feeling of involvement.
3. Planning The management plans for the realization of performance expectations, arranging resources to be available which are required for attaining the goals set.
4. Monitoring performance It is a continuous process and involves ongoing feedback. It is managed each day, all year long, involves providing assistance as necessary and removing obstacles.
5. Appraising Performance of each employee is documented through observing, recalling, evaluating, written communication, judgment and analysis of data into an appraisal record.
6. Feedback A feedback session is taken after formal appraisal. This stage involves verbal communication, listening, problem solving, negotiating, compromising, conflict resolution and reaching consensus.
7. Decision making On the basis of formal appraisal and feedback results, various decisions are made about giving rewards and punishments.
8. Development of performance It is the last stage of the performance appraisal process. It provides an opportunity to develop performance by providing opportunities for upgrading skills and professional interactions.
The Performance Appraisal System at NTPC Old Performance Appraisal System at NTPC Till 2004, The NTPC Ltd was using Grading System for performance appraisal system for its employees. In this system employees were categorized into grades like Outstanding, Good, Average, Poor and Very Poor and represented by a letter like A, B, C, D, E. The grading was done by reporting officer for each financial year and more weightage was given to the special achievements like reducing expanse, effective handling of a group. A format was used and the same format is applicable to all level of employees. The format of the performance appraisal report was as follows-
Name of the candidate Designation Area of responsibility Job accomplishment Special achievement Obstruction encountered Comment of the reporting officer without
discussion with the candidate Overall rating assigned
40
The Performance Appraisal System at NTPC Abhay Sinha, Faculty Member
Namita Kumari (Student, MBA Sem III) FMS, IUJ
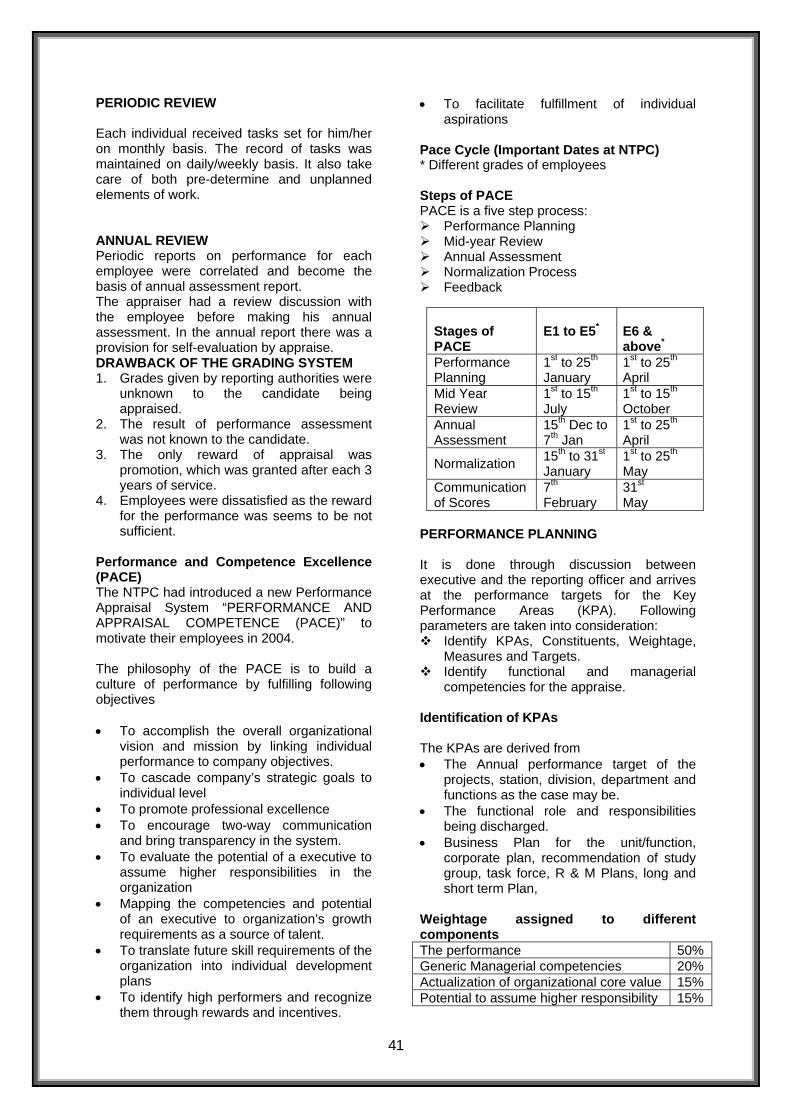
PERIODIC REVIEW Each individual received tasks set for him/her on monthly basis. The record of tasks was maintained on daily/weekly basis. It also take care of both pre-determine and unplanned elements of work. ANNUAL REVIEW Periodic reports on performance for each employee were correlated and become the basis of annual assessment report. The appraiser had a review discussion with the employee before making his annual assessment. In the annual report there was a provision for self-evaluation by appraise. DRAWBACK OF THE GRADING SYSTEM 1. Grades given by reporting authorities were
unknown to the candidate being appraised.
2. The result of performance assessment was not known to the candidate.
3. The only reward of appraisal was promotion, which was granted after each 3 years of service.
4. Employees were dissatisfied as the reward for the performance was seems to be not sufficient.
Performance and Competence Excellence (PACE) The NTPC had introduced a new Performance Appraisal System “PERFORMANCE AND APPRAISAL COMPETENCE (PACE)” to motivate their employees in 2004. The philosophy of the PACE is to build a culture of performance by fulfilling following objectives • To accomplish the overall organizational
vision and mission by linking individual performance to company objectives.
• To cascade company’s strategic goals to individual level
• To promote professional excellence • To encourage two-way communication
and bring transparency in the system. • To evaluate the potential of a executive to
assume higher responsibilities in the organization
• Mapping the competencies and potential of an executive to organization’s growth requirements as a source of talent.
• To translate future skill requirements of the organization into individual development plans
• To identify high performers and recognize them through rewards and incentives.
• To facilitate fulfillment of individual aspirations
Pace Cycle (Important Dates at NTPC)
* Different grades of employees Steps of PACE PACE is a five step process:
Performance Planning Mid-year Review Annual Assessment Normalization Process Feedback
PERFORMANCE PLANNING It is done through discussion between executive and the reporting officer and arrives at the performance targets for the Key Performance Areas (KPA). Following parameters are taken into consideration:
Identify KPAs, Constituents, Weightage, Measures and Targets.
Identify functional and managerial competencies for the appraise.
Identification of KPAs The KPAs are derived from • The Annual performance target of the
projects, station, division, department and functions as the case may be.
• The functional role and responsibilities being discharged.
• Business Plan for the unit/function, corporate plan, recommendation of study group, task force, R & M Plans, long and short term Plan,
Weightage assigned to different components The performance 50% Generic Managerial competencies 20% Actualization of organizational core value 15% Potential to assume higher responsibility 15%
Stages of PACE
E1 to E5*
E6 & above*
Performance Planning
1st to 25th January
1st to 25th April
Mid Year Review
1st to 15th July
1st to 15th October
Annual Assessment
15th Dec to 7th Jan
1st to 25th April
Normalization 15th to 31st January
1st to 25th May
Communication of Scores
7th February
31st
41
May
Measures and Targets KPA-Measure is fixed on a reasonable range of performance target instead of fixed target. Other factors affecting performance can be accounted for and a reasonable assessment is made. MID-YEAR REVIEW / ANNUAL ASSESSMENT At the beginning of 2nd half-year, the KPAs and measures are assessed and marks allotted for the 1st half-year and a new set of KPAs, measure and marks are arrived at for 2nd half-year performance. Components of performance review The following components are implemented through ‘Performance Appraisal Form’. PART I- Performance • Part 1A: first half year performance • Part 1B: second half-year performance
Review of KPAs for 2nd half year • Part 1C: annual performance • Part 1D: comments on performance
PART ll - Competencies PART lll – Values PART lV - Potential appraisal PART V - Performance and potential profile − Part l A: FIRST HALF YEAR
PERFORMANCE PART IA is jointly reviewed and evaluated performance at the beginning of 2nd half year and allocated marks for each KPA defined at the beginning of first half-year. Actual achievement has briefly recorded against each KPA and marks obtained with respect to each KPA are indicated in relevant column. The aggregate of marks obtained for different KPAs is worked out and indicated as aggregate of PART 1A. − PART I B: -SECOND HALF YEAR
PERFORMANCE It reviews the key performance area targets for the second half-year based on the evaluation of 1st half year KPAs depending on actual achievements. The reworked KPA targets are briefly recorded, ‘Measures’ for each KPA defined marks allocated. KPAs which extend beyond the 1st half year may be re-recorded in the targets of the 2nd half-year. The KPAs may under change owing to target accomplished, new targets coming up, change of role etc. During the performance evaluation, the actual achievement is assessed against each KPA and marks obtained against each KPA are
indicated. The marks obtained are aggregated at the bottom out of 50 marks as aggregate. − PART 1C: ANNUAL PERFORMANCE The 1st half-year “Part 1A” and 2nd half-year “Part 1B” performance marks of appraise are used to get marks out of 50 marks as aggregate. This mark is for “Annual Performance” in the achievement of KPAs. The Appraise and the reporting officer would jointly endorse the annual performance by signatures. − PART 1D: COMMENTS ON
PERFORMANCE In PART 1D the reporting officer offers comments w.r.t. KPAs, Measures, Achievements and sums up in brief the performance profile of the appraise in writing. Normalization Process There are normal standard of performance expected an employee of the NTPC Ltd. It is known as “Norm”. The KPA should be ‘SMART’ i.e. Specific, Measurable, Agreed, Realistic and Time-Bound. The KPAs reflect ‘stretch standard’ which is in excess of “Norm”. Thus Norm is used to normalization KPAs for an employee. FEEDBACK: The feedback is focused on the specific performance actions and on the personality of the appraise. Similarly, feedback is a regular feature of performance review and is taken during each half year. The continuous feedback based on the facts gathered during the period would provide adequate opportunity to the appraise to take corrective steps during the remaining part of the performance period. Feedback should be aimed more at improving and developing the person and should be provided with sufficient descriptive way based on data collected in a non-hurting manner. Conclusion
42
A grading system was used at The NTPC Ltd for appraisal of its employees. In this system an employee got a grade from his/her superior based on his/her performance. The grade allocated to an employee become parameter for appraisal of an employee. This system suffers from certain drawbacks like lack of transparency, biasness etc. The NTPC has adopted PACE for appraisal of its employee which not only benefits the employees but also the NTPC to get its employees focus on key performance areas.
How the Demand, Supply and Price Mechanism Works in an Imperfect Market
Scenario Pritha Dutta Roy, Faculty Member
FMS, IUJ
Once upon a time in a village, a man appeared and announced to the villagers that he would buy monkeys for Rs10. The villagers seeing that there were many monkeys around, went out to the forest and started catching them. The man bought thousands at Rs10 and as supply started to diminish, the villagers stopped their effort. He further announced that he would now buy at Rs20. This renewed the efforts of the villagers and they started catching monkeys again. Soon the supply diminished even further and people started going back to their farms. The offer rate increased to Rs25 and the supply of monkeys became so little that it was an effort to even see a monkey, let alone catch it! The man now announced that he would buy monkeys at Rs50! However, since he had to go to the city on some business, his assistant would now buy on behalf of him. In the absence of the man, the assistant told the villagers. Look at all these monkeys in the big cage that the man has collected. I will sell them to you at Rs35 and when the man returns from the city, you can sell it to him for Rs50." The villagers squeezed up with all their savings and bought all the monkeys. Then they never saw the man nor his assistant, only monkeys everywhere!!!
Insured Life Md. Murtuza, Faculty Member
FMS, IUJ
“You don’t need to pray to God any more when there are storms in the sky, but you do have to be insured.” – Bertolt Brecht
Life is full of uncertainties and one has to accept whatever it offers to him/her. It may be the best thing that has ever happened to you or financial losses or the loss of the dear one. The emotional loss may or may not be recovered but the financial losses can be recovered to a great extent. One such tool ever devised by human being is “insurance.” It provides enough financial protection to every individual at the time of ill health, accident and even in case of death. These risks either
increases or may get worst with the passage of time. At such time it is insurance that can act as saving grace. As one grows, needs also grows. An individual’s have to protect himself against unforeseen events and what better way than insurance? As need arises changes have to be taken in that step. Inadequate insurance is as bad as no insurance at all.
For example the demands of a child may not be the same after 5 years. The child’s education and marriage is of great concern now a day as they involve a huge amount of financial expenses. These expenses require long planning and saving. For instance your child is 4 years old, and if you purchase LIC’s Marriage Endowment/Education Annuity Plan., it will take care of your child’s education as well as marriage. The two main responsibilities are taken over by the policy purchased.
Life insurance needs reanalyzing and reconsideration, as the needs are different at different stages of life. Some people even make a huge mistake by surrendering their policy in order to substitute the growing financial needs. In such case current financial needs should be overlooked and verified properly and should be minimized. It shouldn’t be accepted at the cost of surrendering the policy.
In India it is of great concern that for most of the individual’s insurance cover occupies the last number on the priority list. In fact the insurance cover should grow with the growing income but some people do a mistake of surrendering their policy when they feel the pressure for the money. Such a gesture would mean giving up the insurance cover completely and unable to meet one of its objective for which insurance policy was taken. It should also be remembered that the amount of premium increases with the increase in the age of individuals. Hence it will be a grave mistake to surrender the policy and think of purchasing it again after few years. More over it may be so that the same policy may not be available in the future when you are in need of it later. If the financial strains are heavy, a loan against insurance policy can help greatly to the needy. Insurance is a blessing, it provides protection, mental security, and it shouldn’t be looked upon as burden.
One cannot afford to keep insurance stake. Wake up! If you are making such mistake, it’s never too late to correct it.
43

ADIEU! My Trusted Friend A PARTY OF FAMOUS PHYSICISTS Bijoya Ganguly, Faculty Member K. Mamta, Faculty Member
FST, IUJ FST, IUJ
ittle did I know that night God
ne day, some of the world’s famous Physicists decided to get together for a tea luncheon.
Fortunately
44
the doorman was a grad student and was able to observe some of the guests.
O Was going to call your name
In life we loved you dearly;
In death too we did the same!
You did not go alone, Every one gravitated towards Newton, but he just kept moving around at a constant velocity and showed no reaction.
“Cause” part of us went with “YOU”
The day God called you Home, Einstein thought it was a relatively good time. You left us peaceful memories, Colombo got a real charge out of the whole thing.
Your love is still our guide;
Though we cannot see you aside, Pascal was under too much pressure to enjoy himself.
Family chain broken, nothing seems the same again,
Ohm spent most of the time resisting But as God shall call us one by one
Ampere’s opinions on current events I am sure the chain will link again.
Volt thought the social gathering had a lot of potential. With tearful eyes we watched you suffer,
The Curies were there and just glowed the whole time.
Saw you to oblivion and fade away
Although we loved you dearly! Everyone was attracted to Tesla’s magnetic personality.
We could not urge you to stay!
A golden heart stopped beating! Bohr ate too much and got atomic ache. Busy little hands to rest, Watt turned out to be a powerful speaker. God, broke our hearts too to prove THAT, Hertz went back to the buffer table several
times a minute. He only takes the Best.
Faraday was very much induced and had a capacity for food. It’s lonesome here without you,
We miss you since each day, Our lives are not the same again,
Cause grief has made its permanent Stay
L

STUDENTS’ CORNER
How Companies are using the Words in their Advertisements:
Priyanka Mishra BBA – III (2009-11)
(Read carefully and find there meaning what it is actually telling!!) Illiterate??? Write today for free help. (How an illiterate person can write man.) We do not tear your clothes with machinery; we will do it carefully by hands. (OK…… nice work- you’ll tear that by hands? Why?) Used cars: why go somewhere else to be cheated? Come here first. (We will not leave you for going anywhere else.) Dogs for sale: Eats anything and is fond of children. (Howww sweeeeeeet…..) Tried of cleaning yourself? Let me do. (Don’t tickle me……)
Twins in English Language Saema Firdous
B. Tech, Computer Science
We have all heard of Siamese twin-babies joined together for life. Have you come across twins in any language! Yes! There are twins in English language.
They are “hook or crook”, “Null and void”, “hull and Cry”, “Rank and file”. These words always go together. Some Siamese twins are joined head to head and they see opposite sides. Here are similar twins in English language “up and down”, “hot and cold” ,”now and then” and so on, where the words have opposite meaning but concur only one idea. Don’t we have Siamese twins who are alike? Yes see this in English too! “On and on”, “by and by”, “out and out”, “through and through”, “bag and baggage etc. Have you heard of three babies joined together in Siamese twins? No! See them in English language - “lock stock and barrel”, “stop, look and proceed”, “Tom, Dick and Harry”. Is it not interesting? Another point we have palindromes in numbers where they are similar in both ways e.g.: 20-02-2002, 30-03-3003. Are there palindromes in English? Yes. “MALAYALAM”,”DID”,”NOON”,”LEVEL",”CIVIC”. Are there palindrome sentences in English? Yes “pull up if I pull up”, “No lemon on melon”, “was it a car or a cat I saw”. What did Napoleon say “Able was I ere I saw Elba “ Ha! Ha!! Ha!!! Hats off to English.
45

The Ant & the Grasshopper
Kislaya Kumar BBA – III (2009-11)
US Version: The Ant works hard in the withering heat all summer building its house and laying up supplies for the winter. The Grasshopper thinks the Ant is a fool and laughs & dances & plays the summer away. Come winter, the Ant is warm and well fed. The Grasshopper has no food or shelter so he dies out in the cold. INDIAN VERSION: The Ant works hard in the withering heat all summer building its house and laying up supplies for the winter. The Grasshopper thinks the Ant's a fool and laughs & dances & plays the summer away. Come winter, the shivering Grasshopper calls a press conference and demands to know why the Ant should be allowed to be warm and well fed, while others are cold and starving. NDTV, BBC, CNN show up to provide pictures of the shivering Grasshopper next to a video of the Ant in his comfortable home with a table filled with food. The World is stunned by the sharp contrast. How can this be that this poor Grasshopper is allowed to suffer so? Arundhati Roy stages a demonstration in front of the Ant's house. Medha Patkar goes on a hunger strike along with other Grasshoppers demanding that Grasshoppers be relocated to warmer climates during winter. Amnesty International criticizes the Indian Government for not upholding the fundamental rights of the Grasshopper. The Internet is flooded with online petitions seeking support to the Grasshopper.
The opposition stages a walkout in Parliament and demands an apology from Sonia Gandhi. Left parties call for a "Bharat Bandh" in West Bengal and Kerala demanding a Judicial Enquiry. CPM in West Bengal immediately passes a law preventing Ants from working hard in the heat so as to bring about equality of poverty among Ants and Grasshoppers. Mamata Banerjee allocates one free coach to Grasshoppers on all Indian Railway Trains, aptly named as the 'Grasshopper Rath'. Finally, the Judicial Committee drafts the 'Prevention of Terrorism against Grasshoppers Act' [POTAGA], with effect from the beginning of the winter. Arjun Singh makes 'Special Reservation' for Grasshoppers in Educational Institutions & in Government Services. The Ant is fined for failing to comply with POTAGA and having nothing left to pay his retroactive taxes, it's home is confiscated by the Government and handed over to the Grasshopper in a ceremony covered by NDTV. Arundhati Roy calls it "A Triumph of Justice." Lalu-Mulayam calls it "Socialistic Justice." CPM calls it the "Revolutionary Resurgence of the Downtrodden." The Grasshopper is invited to address the UN General Assembly. Many years later... The Ant has since migrated to the US and set up a multi-billion dollar company in Silicon Valley. 100s of Grasshoppers still die of starvation despite reservation somewhere in India. As a result of loosing lot of hard working Ants and feeding the Grasshoppers, India is still a developing country!!
46
About the ICFAI University Jharkhand, Ranchi The Institute of Chartered Financial Analysts of India University, Jharkhand (hereinafter referred to as the University) was established under the provisions of the Institute of Chartered Financial Analysts of India University Act, 2006 (Jharkhand Act No. 08 of 2007), vide Notification dated June 17,2008 of the Government of Jharkhand. The University is sponsored by the Institute of Chartered Financial Analysts of India (Icfai), a not-for-profit educational society established in 1984 under the Andhra Pradesh (Telangana Area) Public Societies Registration Act, 1350 F (Act No.1 of 1350F) with the objective of imparting training in finance and management to students, working executives and professionals in India.
The ICFAI University, Jharkhand is included in the list of universities maintained by University Grants Commission (UGC) under section 2(f) of the UGC Act, 1956 vide their letter no F.8-17/2009(CPP-I) dated 01 Dec 2009.
The University believes in creating and disseminating knowledge and skills in core and frontier areas through innovative educational programs, research, consulting and publishing, and developing a new cadre of professionals with a high level of competence and deep sense of ethics and commitment to the code of professional conduct.
A number of educational programs are offered in management, finance, banking, insurance, accounting, law, information technology, arts, commerce, education and science & technology at bachelor's and master's levels on full-time campus. The University is also launching shortly part time PhD program in Management.
47
Programmes Offered by the University
The University offers following full time programs at Ranchi. Jharkhand -
UG Programs
• B.Tech. Program o Civil Engineering. o Computer Science & Engineering. o Electronics & Communication Engineering. o Mechanical Engineering.
• BBA Program • BCA Program • BHTM Program
PG Programs
• MBA Program • MCA Program
Part time PhD Program
• In Management
Contact:
The ICFAI University, Jharkhand Grand Emerald Building, Between Road No. 1 & 2, Ashok Nagar, Ranchi - 834002, Jharkhand Phone: +919204064600 Fax: 0651-2245178 E-mail: [email protected] Website: www.iujharkhand.edu.in
48
Patna Information Center 206, 3rd Floor, Pandey Mall, Above Vishal Megamart, Frazer Road, Patna – 800001 Phone No: 9386591194, 9308709618

49