t environmental impact department of assessment … - subthem… · assessment and management...
TRANSCRIPT
04/06/2011
SUBTHEME 6: Representative demographics within service providers and civil society:
The Green Connection Christy Bragg, Roshan Stanford, Liz Mcdaid, Basier Dramat,
Lynette Munro
THE DEPARTMENT OF ENVIRONMENTAL AFFAIRS
ENVIRONMENTAL IMPACT ASSESSMENT AND MANAGEMENT STRATEGY
�
������������ ��������������� ���� ������ �������������� ���������������������������
1
TABLE OF CONTENTS
ACRONYMS: .............................................................................................................................. 4
1. PROBLEM STATEMENT .......................................................................................................... 6
2. OBJECTIVES ............................................................................................................................ 6
2.1 GOALS .................................................................................................................................. 6
3. BACKGROUND ......................................................................................................................... 6
3.1 Legislation and policy context ............................................................................................... 6
3.1.1 Context for community involvement in sustainable development: .................................. 6
3.1.2 Context of the transformation of private sector: .............................................................. 7
3.1.3 Context of the transformation of government: ................................................................. 9
3.1.4 Context of transformation of women ............................................................................... 9
3.1.5 Context of the transformation of education: .................................................................. 10
3.1.6 Context for transformation in the environmental NGO sector. ...................................... 11
3.2 On the ground ..................................................................................................................... 11
3.2.1 Inequality ....................................................................................................................... 11
3.2.2 Gender: .......................................................................................................................... 12
3.2.3 Current demographic profile of South Africa: ................................................................ 12
4. METHODOLOGICAL APPROACH ......................................................................................... 14
4.1 Methods: demographic profile analysis of sectors within EIA&M. ...................................... 14
4.2 Methods: Reasons for demographic distribution of EIA&M ................................................ 15
4.3 Methods: representivity of sampling ................................................................................... 15
4.4 Limitations: .......................................................................................................................... 17
5. STATUS QUO AND ANALYSIS: Demographic analysis of sectors within EIA&M. ................ 18
5.1 Institutional or registered EIA bodies’ membership databases: .......................................... 18
5.2 Other Professional bodies: .................................................................................................. 21
5.2.1 SACNASP database:..................................................................................................... 22
5.2.2 Engineering Council of South Africa (ECSA) ................................................................ 24
5.2.3 South African Council for Landscape Architects and Planners (SACLAP) ................... 25
������������ ��������������� ���� ������ �������������� ���������������������������
2
5.3 IAIA “Ten Years of EIA in South Africa” 2008 Conference attendance: ............................. 25
5.4 Educational sector: ............................................................................................................. 28
5.4.1 Universities: ................................................................................................................... 28
5.4.2 Education institution transformation policies and development programmes: .............. 33
5.4.4 University Projects supporting integration: .................................................................... 34
5.4.5 Student transformation: ................................................................................................. 35
5.4.6 Staff retention: ............................................................................................................... 37
5.4.7 Financial needs of staff and students: ........................................................................... 37
5.4.8 Gender and tertiary institutes: ....................................................................................... 38
5.5 Training organizations: ........................................................................................................ 40
5.6 Private sector: EAPs ........................................................................................................... 45
5.6.1 EAP demographic profile: .............................................................................................. 45
5.6.2 Town planners (private) profile: ..................................................................................... 45
5.6.3 EAP sector interview analysis: ...................................................................................... 46
5.7 Government: ....................................................................................................................... 53
5.8 Civil society: NGOs and CBOs ........................................................................................... 56
5.8.1 Perceptions from the NGO sector: ................................................................................ 57
5.9 Empowerment of communities to engage in EIAs .............................................................. 59
5.11 Summarized results from Demographic Status Quo analysis: ......................................... 62
6. Reasons and recommendations: ............................................................................................. 64
6.1 To BEE or not to BEE: ........................................................................................................ 64
6.2 Building the skills base and capacity of HDIs: .................................................................... 66
6.2.1. How do HDIs choose the environmental sector to work and study in? ........................ 67
6.2.2. Flower-power: promoting awareness of the sector: ..................................................... 67
6.2.3 Mentoring, interns and learnerships .............................................................................. 69
6.2.4 Qualifications and skills from School and Higher Education: ........................................ 70
6.3 Breaking into the Inner circle: ............................................................................................. 71
6.4 Staff turnover and retention ................................................................................................ 72
6.5 Shattering misconceptions: The Glass Ceiling ................................................................... 74
7. Risks: ....................................................................................................................................... 75
������������ ��������������� ���� ������ �������������� ���������������������������
3
8. Conclusions: ............................................................................................................................ 75
Bibliography ................................................................................................................................. 76
������������ ��������������� ���� ������ �������������� ���������������������������
4
��������
BBBEE Broad-based Black Economic Empowerment
BEE Black Economic Empowerment
CBO Community based organization
CES Coastal and Environmental Services
CEM Centre for Environmental Management
CSIR Council for Scientific and Industrial Research
CoCT City of Cape Town
CPUT Cape Peninsula University of Technology
DEA Department of Environmental Affairs
DEADP Department of Environmental Affairs Development and Planning
DST Department of Science and Technology
EAP Environmental Assessment Practitioner
EAPSA Environmental Assessment Practitioners of South Africa
ECSA Engineering Council of South Africa
EE Employment Equity
EEU Environmental Education Unit
EIA&M Environmental Impact Assessment and Management
HDI Historically Disadvantaged Individual
HET Higher education & training
IAIA International Association for Impact Assessment (South Africa)
IDP Integrated Development Plan
IWM SA Institute of Waste Management of Southern Africa
JIPSA Joint Initiative on Priority Skills Acquisition
NEMA National Environmental Management Act
NGO Non governmental organization
NWU North West University
PDI Previously Disadvantaged Individual
PRA Public Relations and Advertising
PSC Provincial Steering Committee
SACNSP South African Council for Natural Scientific Professions
SADC Southern African Development Community
������������ ��������������� ���� ������ �������������� ���������������������������
5
SAIEES Southern African Institute of Ecologists and Environmental Scientists
SEIA Social and Environmental Impact Assessment
SET Science, Engineering & Technology
SETA Sector Education & Training Authority
UCT University of Cape Town
UFS University of Free State
UJ University of Johannesburg
UP University of Pretoria
UWC University of Western Cape
WESSA Wildlife and Environment Society of South Africa
������������ ��������������� ���� ������ �������������� ���������������������������
6
�� ���������������
The EIA&M sector is not adequately representative of the demographics across service providers and civil society.
������������
Objective: To ensure that the EIA&M sector represents all the demographics across service providers and civil society
��������
• Goal 1: To determine the existing demographic representivity in the service provider sector and civil society
• Goal 2: To determine the reasons for the demographic representivity within the Sector
• Goal 3: To determine how the representivity within the sector can be improved.
������� �����
Chapter 5 of NEMA provides for integrated environmental management. The EIA regulations were one tool, drafted and
revised over a number of iterations, that attempted to regulate developmental activities with an impact on the environment.
While NEMA envisaged a number of tools to assess the full range of policies, programmes and activities, the EIA has
been inappropriately used as a “one size fits all” approach.
For this subtheme, the challenge is to provide for a strategy that recognises the environmental management sector needs
to transform in line with the country’s demographic profile, and that the sector needs to reflect the diversity and gender
equity of the country, in order to ensure biases of the past are rectified and that the sector supports the environmental
development of all population groups.
This subtheme report focuses particularly on demographic representivity and gender representivity within EIA&M and was
aimed at developing recommendations to promote the meaningful participation of previously disadvantaged population
groups.
��������� !�"# #$%"��&'&"#!�(!
This section provides a short summary of some of the legal and policy context for the transformation of the country.
������"#!�(!)"*&"+ + ,#�!'�#-"�-�+ �#!�#�,�! �# .��$�-��"%+ �#!
The National Environmental Management Act (NEMA) chapter1 section 2 has the following principles that are legally
binding on all EIAs or other environmental management processes. Principles relating specifically to transformation are:
2 Principles
������������ ��������������� ���� ������ �������������� ���������������������������
7
(1) The principles set out in this section apply throughout the Republic to the actions of all organs of state that may
significantly affect the environment and-
(a) shall apply alongside all other appropriate and relevant considerations, including the State's responsibility to respect,
protect, promote and fulfil the social and economic rights in Chapter 2 of the Constitution and in particular the basic needs
of categories of persons disadvantaged by unfair discrimination;
(c) Environmental justice must be pursued so that adverse environmental impacts shall not be distributed in such a
manner as to unfairly discriminate against any person, particularly vulnerable and disadvantaged persons.
(d) Equitable access to environmental resources, benefits and services to meet basic human needs and ensure human
well-being must be pursued and special measures may be taken to ensure access thereto by categories of persons
disadvantaged by unfair discrimination.
(f) The participation of all interested and affected parties in environmental governance must be promoted, and all people
must have the opportunity to develop the understanding, skills and capacity necessary for achieving equitable and
effective participation, and participation by vulnerable and disadvantaged persons must be ensured.
(h) Community wellbeing and empowerment must be promoted through environmental education, the raising of
environmental awareness, the sharing of knowledge and experience and other appropriate means.
This Act came into force in 1998, and it is clear that the intention of the law was to ensure the participation of all citizens,
including disadvantaged individuals.
������"#!�(!")!/�!* #�)"*+ !�"#")%*�- !���&!"*
Section 9 of the Constitution deals with equality:
• 9(1) Everyone is equal before the law and has the right to equal protection and benefit of the law
• 9(2) Equality includes the full and equal enjoyment of all rights and freedoms. To promote the achievement of
equality, legislative and other measures designed to protect or advance persons, or categories of persons,
disadvantaged by unfair discrimination may be taken.
The relevant policy and legislation in terms of economic equality is:
• the Strategy for Broad-Based Black Economic Empowerment (Strategy) in March 2003;
• the Code of Good Practice (Code), which is an explanation of the approach to be adopted by government in the
measurement of BEE compliance; and
• the Broad-Based Black Economic Empowerment Act 2003 (Act No. 53 of 2003) (the BEE Act) which was passed
into law on 6 January 2004
• the final Codes of Good Practice on Broad Based Black Economic Empowerment which were promulgamated on
9 February 2007.
������������ ��������������� ���� ������ �������������� ���������������������������
8
The Strategy and Code are not legally binding documents but give a clear indication of government's current policy in
relation to BEE. Government defines BEE as having three separate, but integrated, contexts:
• Direct empowerment - the promotion of ownership and control by black persons over the South African economy,
measured by ownership and management
• Human resource development
• Indirect empowerment - criteria relating to procurement sourced from black-empowered or black-owned
businesses, as well as enterprise development through investment in, and joint ventures with, black-empowered
or black-owned businesses.
• The BEE Act empowers the Minister of Trade and Industry to issue codes of good practice to be applied in
determining the qualification criteria for granting licences, concessions and other authorizations under any law, in
developing preferential procurement policies for government and the public sector, and in defining the
qualification criteria for the sale of state-owned enterprises and the establishment of public private partnerships1.
They are also intended to establish targets and weightings for the purpose of measuring BEE compliance.
A black-owned enterprise is defined as being a business that is ‘50.1% owned by black persons and where there is
substantial management control’. These strategies are focused mainly on state interventions in the economy and are
aimed at transforming the ownership of business2, however the Codes of Good Practice require that all entities operating
in the South African economy make a contribution towards the objectives of Broad - Based Black Economic
Empowerment (BBBEE).3
The BEE legislation is supported and functions in conjunction with various other forms of Legislation, including the
Employment Equity Act, Skills Development Act, Preferential Procurement Framework and others.The Employment Equity
Act, 1998 (Act No 55 of 1998 ) identifies three areas of discrimination: gender, race and disability and provides for the
implementation of affirmative action measures designed to address the disadvantages in employment faced by particular
categories of employees in order to ensure their equitable representation at all job levels in designated workplaces.
Implementing employment equity involves two key initiatives:
• Eliminating unfair discrimination in human resource policies and practices in the workplace; and
• Designing and implementing affirmative action measures to achieve equitable representation of designated
groups in all occupational categories and levels in the workplace
“The law states that in determining whether an employer is implementing employment equity in compliance with this Act,
the Director-General or any person or body applying this Act must amongst other factors, take into account the
'demographic profile of the national and regional economically active population (EAP),”(President Jacob Zuma, clarifying
1 http://www.bwasa.co.za/Portals/4/docs/archive/BEE-%20notes%20.pdf 2 http://www.bertelsmann-transformation-index.de/fileadmin/pdf/Gutachten_BTI2010/ESA/South_Africa.pdf 3 http://www.dti.gov.za/bee/EE_guidlines.pdf
������������ ��������������� ���� ������ �������������� ���������������������������
9
the intention of the Employment Equity Amendment Bill, which will allow employers to be free to choose whether to target
regional or national demographics but this is still in the process of amendment).4
������"#!�(!")!/�!* #�)"*+ !�"#")�"-�*#+ �#!
The legislation and policy context for government transformation is as follows:
1. According to the White Paper on the Transformation of the Public Service (WPTPS), 1995:
• Within four years all departmental establishments must endeavour to be at least 50% black at management level
• During the same period at least 30% of new recruits to the middle and senior management echelons should be
women
• Within ten years, people with disabilities should comprise 2% of public service personnel
2. White Paper on Affirmative Action in the Public Service, 1998 re-emphasises the meeting of targets as outlined in the
WPTPS
����0�"#!�(!")!* #�)"*+ !�"#")1 "+ �#
Gender equality is one of the cornerstones of the South African Bill of Rights (Chapter 2) as encapsulated mainly in
Clause 9(1),(3), Chapter 2 which state that everyone is equal before the law and has the right to equal protection and
benefit of the law; the state may not discriminate against anyone on the grounds of race, age, gender sex, pregnancy,
marital status…”.
South Africa’s National Policy Framework on Women’s Empowerment and Gender Equality (NPFGW) was drawn up by
The Office on the Status of Women and was adopted by Cabinet in December 2000. The NPFGW develops the values
and principles which underpin the National Gender Programme and calls upon all national Departments to develop
sectoral gender policy guidelines to translate the national imperatives for women’s empowerment and gender equality into
their sector policies, programmes and activities.
South Africa is a signatory to the UN Convention on the Elimination of All Forms of Discrimination against Women
(CEDAW) 1979, the Protocol to the African Charter on Human and Peoples' Rights on the Rights of Women in Africa; the
Beijing Platform of Action; Millennium Development Goals – Goal 7, Target 9. These conventions and agreements commit
South Africa to end discrimination against women in all forms and to incorporate the principle of equality of men and
women in their legal system.
The Department of Science and Technology addresses gender equality in its founding document - The S&T White Paper.
The Business Women’s Association (BWASA) 2009 census of women leaders in government, state-owned enterprises
and JSE-listed companies shows that government is ahead when it comes to gender representivity in the workplace.
South Africa has in fact one of the highest rates worldwide of women in public office at all levels of government and
4 http://www.timeslive.co.za/Politics/article972931.ece/Zuma-clarifies-employment-equity-bill
������������ ��������������� ���� ������ �������������� ���������������������������
10
administration (BWASA 2009). But despite the progressive policies and strategies, some serious obstacles to realize
gender and race equality remain (Bertelsmann Stiftung & CAP 2010).5
����2�"#!�(!")!/�!* #�)"*+ !�"#")�$,& !�"#
The Constitution of South Africa, adopted in 1996, recognises the need to heal the divisions of the past and, through the
Bill of Rights, invokes the notion of redress for past inequities. The White Paper on Higher Education (1997), the Higher
Education Act (1997) and the National Plan on Higher Education (2001) require higher education institutions to address
past inequities through various processes of redress and development and to address the country’s high-level human
resource needs.
Despite strong efforts at reform and improvement, South African schools and universities still have discrepancies in quality
(HSRC 2009). Dropout rates in schools and universities are high, due to under-qualified teachers to capacity problems to
poverty and hunger of children (Bertelsmann & Cap 2010, HSRC 2009) and thus there are few people adequately
prepared for university. “In a labour market where there is an oversupply of unskilled labor and a shortage of skilled labor,
the education system (primary, secondary and tertiary) is not producing the skills that the economy requires.”
(Bertelsmann & CAP 2010).
The World Economic Forum found that whilst South African universities rated strongly on research and development
spending accompanied by strong collaboration between universities and the business sector in innovation (both ranked
28th), the report cautioned that the country’s innovative potential could be at risk with a university enrollment rate of only
15 percent, or 93rd overall. (Global Competitiveness Report 2008-2009 of the World Economic Forum (WEF)).
In terms of gender transformation, female enrollments in all higher education institutions have increased considerably
(National Innovation for Science Council 2010). However, female students remain underrepresented in the fields of
science, engineering and technology6. The National Strategy for Mathematics, Science and Technology Education is the
flagship strategy of the Department of Education to increase the number of mathematics, science, and technology
graduates in response to the socioeconomic needs of South Africa and to build human resources. It aims to increase the
skills and enrolment of students in South Africa in these disciplines.
The Biodiversity Human Capital Development Programme (BHCDP) has received R8.5 million from the Lewis foundation
to:
• to increase the number of talented black South Africans attracted to working in this sector
• to improve the quality, levels and relevance of skills for the sector
• to improve retention and effective deployment of suitable individuals in the sector and
• to create enabling macro-conditions for skills planning, development and evaluation.
They focus on unraveling the “hardships of graduates in life sciences who want to have a masters or higher degree” and
how trained students on leaving tertiary institutions find “a lack of opportunities, mentorship, vacation work or even
internships. With no experience, it is difficult to find a job in the environmental sector.”
5 http://www.bertelsmann-transformation-index.de/fileadmin/pdf/Gutachten_BTI2010/ESA/South_Africa.pdf
������������ ��������������� ���� ������ �������������� ���������������������������
11
An important initiative to keep talent within the biodiversity sector is to find resources to upskill professionals who are
already in this sector. The Green Paper on Skills Development defined learnerships as a mechanism to facilitate linkages
between a structured learning environment and the place of work, so that graduates who obtain a qualification, are ready
to enter the world of work. While it was argued in the Green Paper that the establishment of learnerships had to be
demand driven, there was nothing to prevent the creation of incentives to set the process into motion. As was indicated in
the Green Paper, the Act reaffirms the need to incorporate structured learning with practical work experience. The key
vehicles identified to drive the process are the Sector Education and Training Authorities (SETAs). The Skills
Development Levy is a levy that each employer has to pay over to SARS. It is compulsory if their wage bill is more than
R500000 for the year and voluntary if their wage bill is less for the year. The levy is 1% of the total wage bill and it does
not get deducted from the employee.
����3�"#!�(!)"*!* #�)"*+ !�"#�#!/��#-�*"#+ �#! ������&!"*�
Under Apartheid South Africa, Conservation organisations tended to be white managed and owned and largely concerned
with biodiversity conservation issues. Most of these historically white conservation style organisations have been around
for more than 50 years. Examples include WESSA, WWF and EWT.
During the 1980’s, issues of environmental justice came to the fore, with marginalised communities protesting at the
pollution burden they had to bear. This era was the beginning of organisations such as Earthlife Africa, and GroundWork
that focused on the pollution and human issues, rather than the traditional conservation issues.
Twenty years later, WESSA now has a black woman CEO – Mumsie Gumede, while WWF is headed by white males and
EWT by white females but the focus of these organizations has shifted and their programmes do focus on broader
conservation/human development questions.
The 1990’s saw the birth of environmental networks focused on marginalised communities. The Environmental Justice
Networking Forum (EJNF) started during this time. In 2011, there are a number of environmental issue based networks
that bring NGOs and CBOs together: the Fynbos Forum, the Adaptation network, the Climate Justice Now Network and
the Energy Caucus and Water Caucus (the last two are national caucuses that meet regularly to exchange views on
different current environmental topics) and a few of the national civil society networks. Most of the networks are
dominated by community activists drawn from marginalised communities.
However, in terms of influence in policy or project decisions, the larger traditional organisations dominate.
����#!/��*",#$
������#�4, ��!'
In the South African context, the majority of the population is considered historically disadvantaged, for example, the so-called ‘Blacks’
only gained the vote in 1994. The majority of South Africa’s poor and vulnerable population is still “black” (under the old apartheid
6 http://www.nacinnovation.biz/wp-content/uploads/Taking-Stock-Policy-Interventions-and-Impact-in-the-STI-Dr-Romilla-Maharaj.pdf
������������ ��������������� ���� ������ �������������� ���������������������������
12
classification), with “black” women being particularly affected, and there is a wealth of literature to support this. South Africa’s National
Party government developed the Apartheid system of legal racial segregation between 1943 and 1993, and this classified the country’s
inhabitants as “Black”, “White”, “Coloured” or “Indian”. The Coloured group included people of Khoisan, Malaysian, Griqua, Indian and
Chinese origin (Health and Demographic survey ref).The level of public sector service and infrastructure provided to white people and
that offered to the black/non-white population is widely disparate.7
Although this report agrees in principle with the principle of human dignity, or as UCT’s EE policy8 specifically states: “In advancing
employment equity, we recognize and respect the right to both dignity and self-determined identity. Accordingly, and where possible
given the requirements of prevailing legislation, we will uphold the rights of individuals not to be publicly categorized by race, gender or
disability against their will”, it was not possible within the ToR of this study not to use these terms. Unfortunately in order to understand
the demographic representivity within the EIA&M field we will need to use these classifications (repealed in 1991) within the
methodology, in order to fully determine whether the industry has transformed or not. It is necessary to use the classification of these
population groups in order to monitor whether progress has been made in reducing the historic socio-economic inequalities between
population groups.
Currently the effects of Apartheid still influence education and poverty levels within the country. According to Statistics SA9 22.3% of
Blacks aged 20 and over have received no schooling, 18.5% have had some primary school, 6.9% have completed only primary
school, 30.4% have had some high school education, 16.8% have finished only high school, and 5.2% have an education higher than
the high school level. The unemployment rate of the economically able Black population (aged 15–65 years) is high at 28.1% and
those employed typically earn R12,073/year. Black females get less income than Black males.
In contrast, Statistics South Africa estimates that 1.4% of Whites aged 20 and over have received no schooling, 1.2% have had no
more than some primary schooling, 0.8% have completed only primary school, 40.9% have finished only high school, and 29.8% have
an education higher than the high-school level. The unemployment rate of the White population aged 15–65 is 4.1%. The median
annual income of White working adults aged 15–65 is ZAR 65,405. White males have a median annual income of ZAR 81,701 versus
ZAR 52,392 for White females.
Population distribution is also uneven in a spatial dimension. In 1995 black South Africans formed a majority in all
provinces except the Western Cape, (where they made up 20 percent of the population). Cities were predominantly white,
and the townships and squatter areas that ringed the cities were predominantly black.
������ �#$�*
There are many gender based inequalities in South African society as a result of political history, forced removals, migrant
workers and cultural identities (SADHS 2008).
The gender ratio of South Africa population between 15-64 years is 1.02 male(s)/female (StatsSA 2007).
������,**�#!$�+ "�* %/�&%*")���")�",!/�)*�& :
7 http://www.fanews.co.za/article.asp?Front_Page_Features;25,Stokes_Stage;1145,Demographeid_Reengineering_South_Africas_population_demographics;9155 8 http://www.uct.ac.za/downloads/uct.ac.za/about/policies/eepolicy.pdf 9 http://www.statssa.gov.za
������������ ��������������� ���� ������ �������������� ���������������������������
13
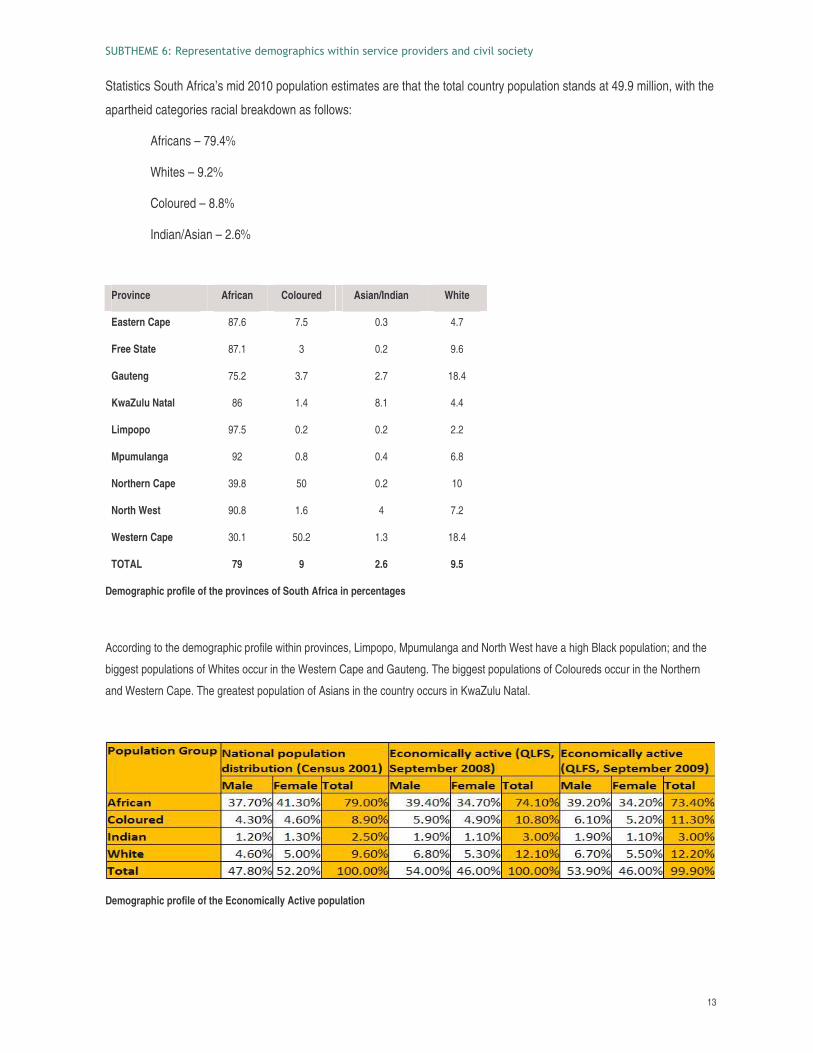
Statistics South Africa’s mid 2010 population estimates are that the total country population stands at 49.9 million, with the
apartheid categories racial breakdown as follows:
Africans – 79.4%
Whites – 9.2%
Coloured – 8.8%
Indian/Asian – 2.6%
Province African Coloured Asian/Indian White
Eastern Cape 87.6 7.5 0.3 4.7
Free State 87.1 3 0.2 9.6
Gauteng 75.2 3.7 2.7 18.4
KwaZulu Natal 86 1.4 8.1 4.4
Limpopo 97.5 0.2 0.2 2.2
Mpumulanga 92 0.8 0.4 6.8
Northern Cape 39.8 50 0.2 10
North West 90.8 1.6 4 7.2
Western Cape 30.1 50.2 1.3 18.4
TOTAL 79 9 2.6 9.5
Demographic profile of the provinces of South Africa in percentages
According to the demographic profile within provinces, Limpopo, Mpumulanga and North West have a high Black population; and the
biggest populations of Whites occur in the Western Cape and Gauteng. The biggest populations of Coloureds occur in the Northern
and Western Cape. The greatest population of Asians in the country occurs in KwaZulu Natal.
Demographic profile of the Economically Active population
������������ ��������������� ���� ������ �������������� ���������������������������
14
According to the Employment Equity Commission representivity must equate to the Economically Active portion of the population
(currently it refers to both regional and national demography but the Amendment Act stipulates that will in the future just the term
Economically active population will be used for a reference), which is represented in the Table above.
0����5������ ����� ����5
0����!/"$�$�+ "�* %/�&%*")��� # �'���")��&!"*�1 �!/�#���6 ��
In order to determine the demographic representivity of the EIA industry, it was first necessary to determine which sectors
were involved in EIA, and to some extent this was informed by interviews, PSC subtheme notes and by Subtheme 8 (skills
in the EIA field). We analysed demographic data from:
• Civil society:
o Registration bodies for natural scientists and EAPs (including SACNASP, IAIA, EAP SA, IWM SA,
ECSA)
o Educational institutes (universities, technikons)
o Training organizations (short course programs)
o NGOs involved in EIAs (including CBOs)
• Service providers:
o EAPS (small and large consulting companies)
• Government:
o Provincial and national departments of environment
Due to time and resource constraints, only selected representative organizations’ profiles were analysed, according to
geographical and urban/rural spread.
Employee/staff/student demographic profiles in terms of numbers of population group and gender were requested from
these sectors. Several databases of memberships from various institutions and government departments involved in the
EIA sector were asked for and examined in terms of demographic distribution. These included Waste, Environmental
Science, Environmental Management, and Engineering.
In order to bulk up samples, a very simple survey form for demographic statistics of educational institutes, EAPs, NGOs,
CBOs was sent to 638 of the delegates that attended the 2008 IAIA “Ten years of EIA in South Africa” conference. Of
these 638, 93 emails were found to be not working anymore and of the remainder, only 13 responses were returned, but
the time frame for response was unavoidably short (2 weeks) and it is unlikely there would have been a high return even if
these surveys were sent out at the beginning of the project.
During our research, we found that many institutions were unwilling to give demographic data (“colour”) for employees and
thus on occasion we had to identify race using the name and surname of employees. There is obviously some inaccuracy
������������ ��������������� ���� ������ �������������� ���������������������������
15
in this method, but when uncertain we formulated an objective rule of putting names into demographic groups at a 50/50
probability. This probably resulted in a very small overestimation of people in the so-called “Coloured” race class, as the
main uncertainties were between the “White” and “Coloured” surname categories. Where possible, we asked for
verification from key people who had been in the EIA&M field for a long time and had a wide acquaintance in this industry,
but we could not do so in all cases due to resource constraints.
The results of the demographic distribution in each database were compared to South Africa’s current population
demographic distribution, (mid-2010 Statistics South Africa study – see Section 3.2.3).
0����!/"$��� �"#�)"*$�+ "�* %/�&$��!*�.,!�"#")���6 �
The key to improving transformation rates is to understand the reasons for the demographic imbalance. The methodology
used to determine this was a qualitative one. A questionnaire was compiled that sought to understand, amongst many
other issues, how “black” or HDI environmental professionals entered the environmental sector, the challenges they faced
in large “white” dominated companies and organizations, and for those professionals that decided to start their own
environmental organisations or consultancies, to determine how they fared, and any particular challenges they faced in
getting work. As far as possible, questionnaires were done telephonically as people tend to say a lot more than when
writing. The questionnaire was also not prescriptive, if there were interesting points, the interviewee was asked to go into
more depth so as to improve information quality. We also conducted mini-interviews asking people in the industry and
sector about their perceptions and observations for the reasons behind the poor demographic representivity.
0����!/"$�*�%*���#!�-�!'")� + %��#�
Interviewees were selected based on their context within the industry and how they could provide input into the skews and
reasons we were detecting. So interviewees were selected from all sectors and career paths within EIA, including:
• Students currently studying environmental management
• Interns who have just left educational institutes and are being trained in the work place
• Junior and senior HDI consultants
• Junior and Senior White consultants
• CEOs of EAPs, including large, small firms and from different degrees of black ownership
• Government EAP officials (even though this was not included in the ToR but is particularly relevant to this
SubTheme)
• Training institutions
• Civil society organizations, including CBOs and NGOs (to determine current EIA skills and demographic
representivity within the EIA sector and representivity within the public participation process too)
• A focus group session of young black environmentalists and their perceptions on barriers and retention
������������ ��������������� ���� ������ �������������� ���������������������������
16
This study could not be conducted as a fully quantitive survey due to time and budget constraints, but more importantly
the status quo was examined statistically and the main trends were identified during a collation of interview results and
followed up in more informal interviews with experienced people in each regard. Thus the survey drew on both quantitative
and qualitative methodology in order to acquire the most relevant information in the most cost- and time-effective manner.
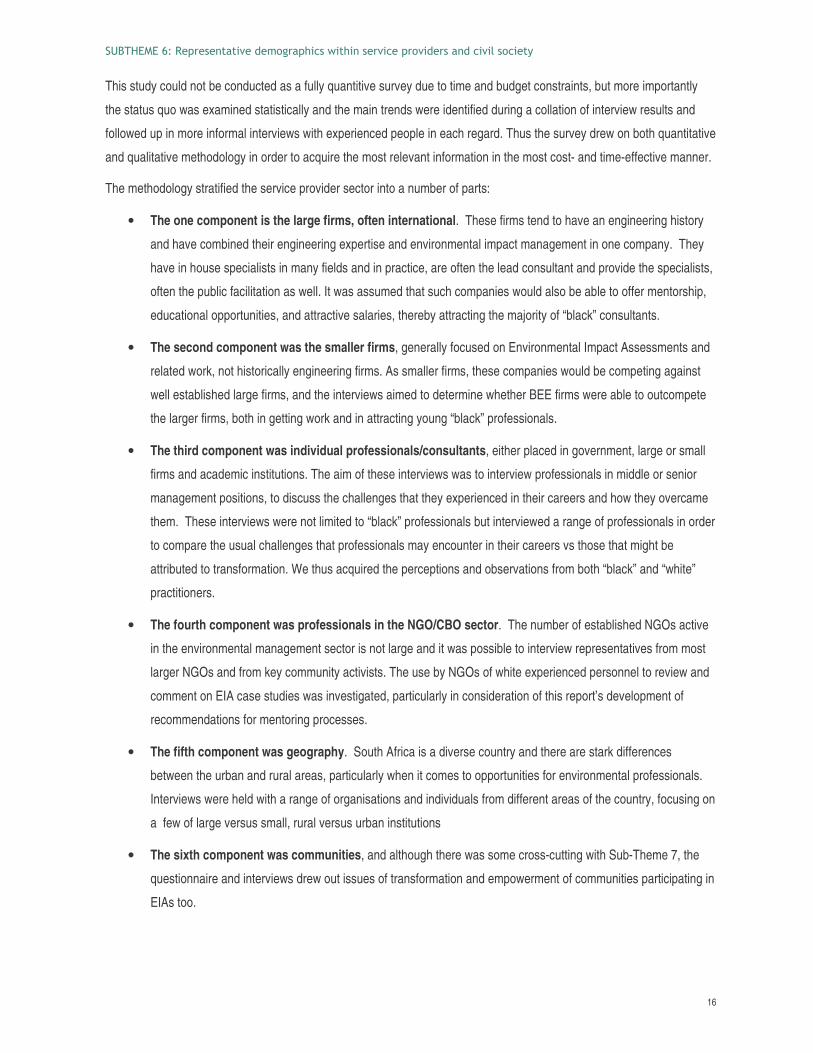
The methodology stratified the service provider sector into a number of parts:
• The one component is the large firms, often international. These firms tend to have an engineering history
and have combined their engineering expertise and environmental impact management in one company. They
have in house specialists in many fields and in practice, are often the lead consultant and provide the specialists,
often the public facilitation as well. It was assumed that such companies would also be able to offer mentorship,
educational opportunities, and attractive salaries, thereby attracting the majority of “black” consultants.
• The second component was the smaller firms, generally focused on Environmental Impact Assessments and
related work, not historically engineering firms. As smaller firms, these companies would be competing against
well established large firms, and the interviews aimed to determine whether BEE firms were able to outcompete
the larger firms, both in getting work and in attracting young “black” professionals.
• The third component was individual professionals/consultants, either placed in government, large or small
firms and academic institutions. The aim of these interviews was to interview professionals in middle or senior
management positions, to discuss the challenges that they experienced in their careers and how they overcame
them. These interviews were not limited to “black” professionals but interviewed a range of professionals in order
to compare the usual challenges that professionals may encounter in their careers vs those that might be
attributed to transformation. We thus acquired the perceptions and observations from both “black” and “white”
practitioners.
• The fourth component was professionals in the NGO/CBO sector. The number of established NGOs active
in the environmental management sector is not large and it was possible to interview representatives from most
larger NGOs and from key community activists. The use by NGOs of white experienced personnel to review and
comment on EIA case studies was investigated, particularly in consideration of this report’s development of
recommendations for mentoring processes.
• The fifth component was geography. South Africa is a diverse country and there are stark differences
between the urban and rural areas, particularly when it comes to opportunities for environmental professionals.
Interviews were held with a range of organisations and individuals from different areas of the country, focusing on
a few of large versus small, rural versus urban institutions
• The sixth component was communities, and although there was some cross-cutting with Sub-Theme 7, the
questionnaire and interviews drew out issues of transformation and empowerment of communities participating in
EIAs too.

������������ ��������������� ���� ������ �������������� ���������������������������
17
• The seventh component was training institutions, including organizations offering short environmental
courses and university environmental management programs, to determine whether there is transformation
occurring in the skills development side.
• The eighth component was government demographics. Although government demographics were not part of
the terms of reference, it is clear that government has transformed at a faster pace than the other sectors.
Interviews with government officials were therefore also held in order to add to the information base.
Government demographic statistics were also researched.
Some research was carried out to determine how other sectors of the economy have transformed and whether there were
specific lessons that could be applied to the environmental sector. Interviews were backed up by a limited desktop study
of transformation issues in other sectors and best practice guidelines evaluated for their applicability in the EIA&M sector.
It became clear that the demographic datasets, the policies, the issues constitute a formidable body of data that would
require much more time to analyse. As a consequence, this report can only provide an overview of the issues and
challenges facing the sector and this report is therefore a first attempt at defining the issues and providing feedback for
developing an agenda for future work on transformation. Please refer to Appendix One for a database of interviewees and
organizations.
0�0��+ �! !�"#�
Collection of data: The short time frame of the project did not allow for adequate time to acquire all the relevant statistics
from all the different sectors. Interviewees and survey respondents did not see such statistics as a priority on their limited
time, necessitating a huge volume of follow-up telecommunication to encourage people to fill in the surveys or send the
data. People were also reluctant to give out this data based on the fact it would be changing shortly in the new financial
year. The tight schedule has not been conducive to the long process of getting this sort of data from big institutions. We
were thus unable to collect all the institutional data we would have liked to.
Sectors requiring further review: There seems to be a paucity of Black/Coloured/Indian specialists, such as botanists,
hydrologists, etc, and thus our study could not get an adequate representation of this sector. It is worth further research to
see what the path of new graduates is and where these graduates end up in the industry.
Emotive and controversial nature of the statistics: Furthermore the nature of the statistics (racial profile) was of
concern to many people, for what reason we were not told in the majority of cases, though some people said outright the
new South Africa was not about colour.
Demographic representivity of skills development: As the skills required for EIA&M are broad-ranging and cross-
cutting (see SubTheme 8 report), we could not get demographic statistics for population groups for the EIA&M field alone,
we often had to resort to comparing broad environmental and engineering statistics from universities and institutions in
order to understand why there was a lack of skilled PDI and female graduates in the EIA&M field.
������������ ��������������� ���� ������ �������������� ���������������������������
18
2������ �7 � �������������8��+ "�* %/�& # �'���")��&!"*�1 �!/�#���6 ��
2���#�!�!,!�"# �"**����!�*�$���."$���9+ �+ .�*�/�%$ ! . ���
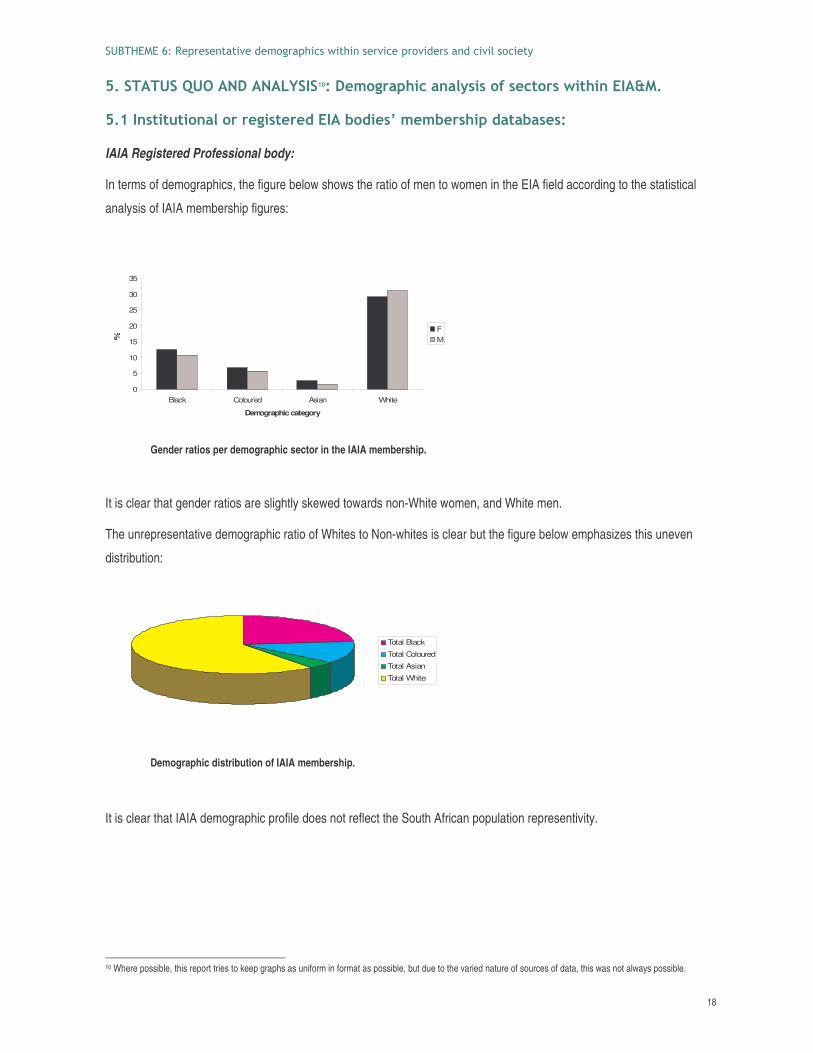
IAIA Registered Professional body:
In terms of demographics, the figure below shows the ratio of men to women in the EIA field according to the statistical
analysis of IAIA membership figures:
0
5
10
15
20
25
30
35
Black Coloured Asian White
Demographic category
%
FM
Gender ratios per demographic sector in the IAIA membership.
It is clear that gender ratios are slightly skewed towards non-White women, and White men.
The unrepresentative demographic ratio of Whites to Non-whites is clear but the figure below emphasizes this uneven
distribution:
Total Black
Total Coloured
Total Asian
Total White
Demographic distribution of IAIA membership.
It is clear that IAIA demographic profile does not reflect the South African population representivity.
10 Where possible, this report tries to keep graphs as uniform in format as possible, but due to the varied nature of sources of data, this was not always possible.
������������ ��������������� ���� ������ �������������� ���������������������������
19
05
101520253035404550
Eas
tern
Pro
vinc
e
Free
Sta
te
Gau
teng
Kw
aZul
u-N
atal
Lim
popo
Mpu
mal
anga
Nor
thw
est
Pro
vinc
e
Sou
ther
nC
ape
Wes
tern
Pro
vinc
e
Total BlackTotal ColouredTotal AsianTotal White
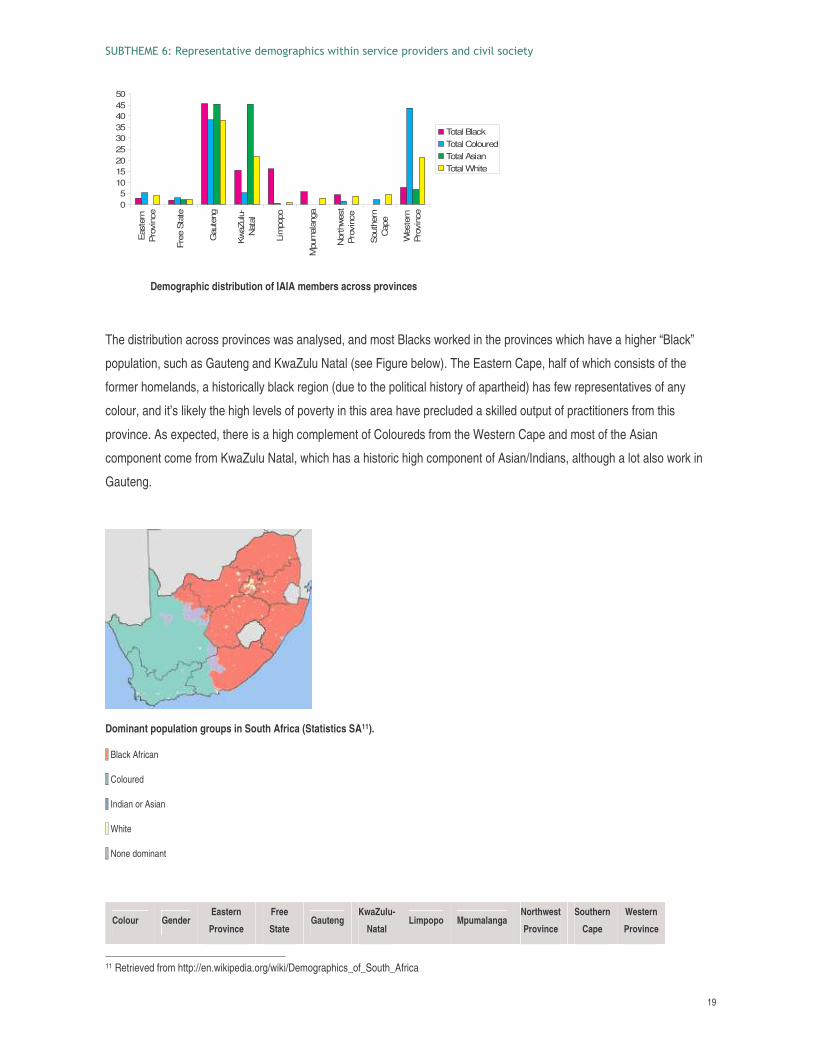
Demographic distribution of IAIA members across provinces
The distribution across provinces was analysed, and most Blacks worked in the provinces which have a higher “Black”
population, such as Gauteng and KwaZulu Natal (see Figure below). The Eastern Cape, half of which consists of the
former homelands, a historically black region (due to the political history of apartheid) has few representatives of any
colour, and it’s likely the high levels of poverty in this area have precluded a skilled output of practitioners from this
province. As expected, there is a high complement of Coloureds from the Western Cape and most of the Asian
component come from KwaZulu Natal, which has a historic high component of Asian/Indians, although a lot also work in
Gauteng.
Dominant population groups in South Africa (Statistics SA11).
Black African
Coloured
Indian or Asian
White
None dominant
Colour Gender Eastern
Province
Free
State Gauteng
KwaZulu-
Natal Limpopo Mpumalanga
Northwest
Province
Southern
Cape
Western
Province
11 Retrieved from http://en.wikipedia.org/wiki/Demographics_of_South_Africa
������������ ��������������� ���� ������ �������������� ���������������������������
20
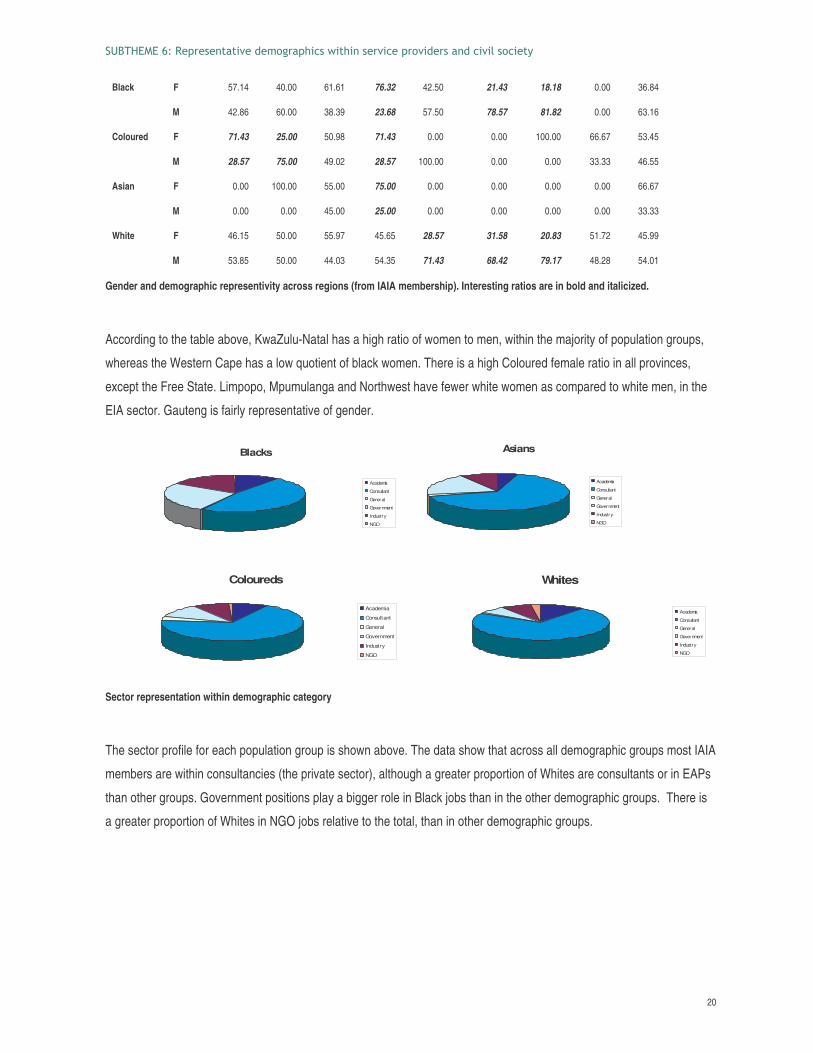
Black F 57.14 40.00 61.61 76.32 42.50 21.43 18.18 0.00 36.84
M 42.86 60.00 38.39 23.68 57.50 78.57 81.82 0.00 63.16
Coloured F 71.43 25.00 50.98 71.43 0.00 0.00 100.00 66.67 53.45
M 28.57 75.00 49.02 28.57 100.00 0.00 0.00 33.33 46.55
Asian F 0.00 100.00 55.00 75.00 0.00 0.00 0.00 0.00 66.67
M 0.00 0.00 45.00 25.00 0.00 0.00 0.00 0.00 33.33
White F 46.15 50.00 55.97 45.65 28.57 31.58 20.83 51.72 45.99
M 53.85 50.00 44.03 54.35 71.43 68.42 79.17 48.28 54.01
Gender and demographic representivity across regions (from IAIA membership). Interesting ratios are in bold and italicized.
According to the table above, KwaZulu-Natal has a high ratio of women to men, within the majority of population groups,
whereas the Western Cape has a low quotient of black women. There is a high Coloured female ratio in all provinces,
except the Free State. Limpopo, Mpumulanga and Northwest have fewer white women as compared to white men, in the
EIA sector. Gauteng is fairly representative of gender.
Blacks
Academia
Consultant
General
Government
Industry
NGO
Asians
Academia
Consultant
General
Government
Industry
NGO
Coloureds
Academia
Consultant
General
Government
Industry
NGO
Whites
Academia
Consultant
General
Government
Industry
NGO
Sector representation within demographic category
The sector profile for each population group is shown above. The data show that across all demographic groups most IAIA
members are within consultancies (the private sector), although a greater proportion of Whites are consultants or in EAPs
than other groups. Government positions play a bigger role in Black jobs than in the other demographic groups. There is
a greater proportion of Whites in NGO jobs relative to the total, than in other demographic groups.
������������ ��������������� ���� ������ �������������� ���������������������������
21
0102030405060708090
100
Academia Consultant General Government Industry NGO
Black
Coloured
Asian
White
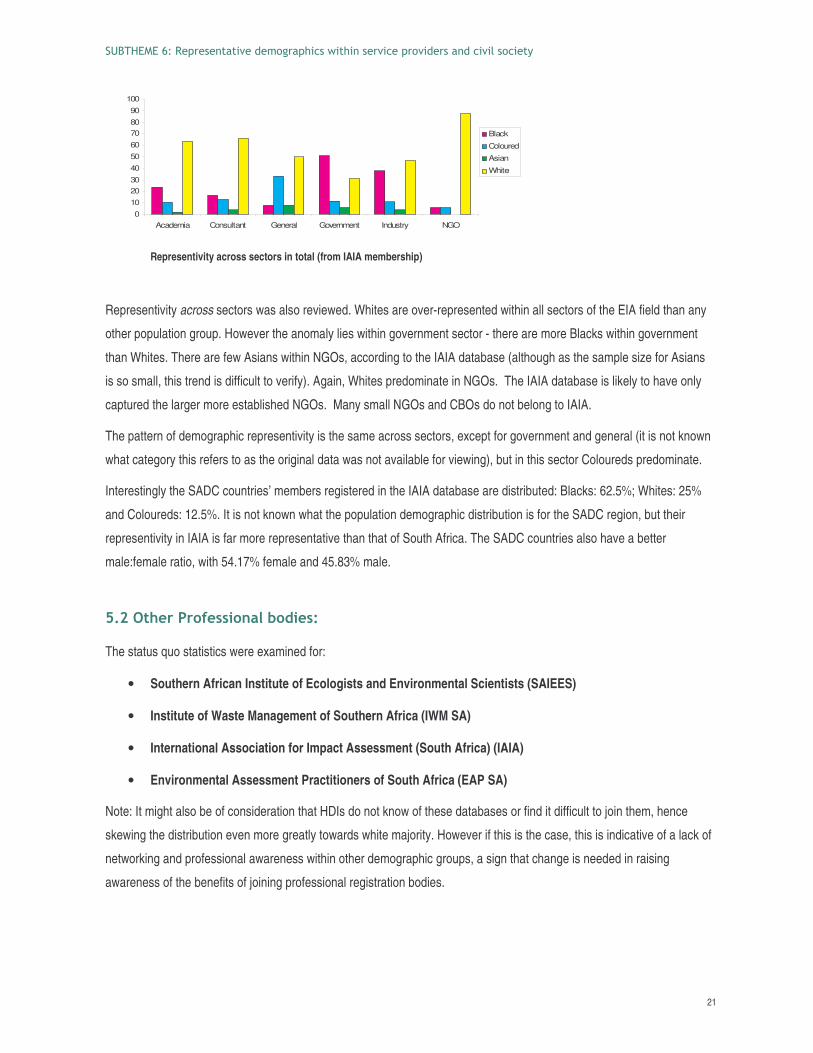
Representivity across sectors in total (from IAIA membership)
Representivity across sectors was also reviewed. Whites are over-represented within all sectors of the EIA field than any
other population group. However the anomaly lies within government sector - there are more Blacks within government
than Whites. There are few Asians within NGOs, according to the IAIA database (although as the sample size for Asians
is so small, this trend is difficult to verify). Again, Whites predominate in NGOs. The IAIA database is likely to have only
captured the larger more established NGOs. Many small NGOs and CBOs do not belong to IAIA.
The pattern of demographic representivity is the same across sectors, except for government and general (it is not known
what category this refers to as the original data was not available for viewing), but in this sector Coloureds predominate.
Interestingly the SADC countries’ members registered in the IAIA database are distributed: Blacks: 62.5%; Whites: 25%
and Coloureds: 12.5%. It is not known what the population demographic distribution is for the SADC region, but their
representivity in IAIA is far more representative than that of South Africa. The SADC countries also have a better
male:female ratio, with 54.17% female and 45.83% male.
2���!/�* *")����"# �."$���
The status quo statistics were examined for:
• Southern African Institute of Ecologists and Environmental Scientists (SAIEES)
• Institute of Waste Management of Southern Africa (IWM SA)
• International Association for Impact Assessment (South Africa) (IAIA)
• Environmental Assessment Practitioners of South Africa (EAP SA)
Note: It might also be of consideration that HDIs do not know of these databases or find it difficult to join them, hence
skewing the distribution even more greatly towards white majority. However if this is the case, this is indicative of a lack of
networking and professional awareness within other demographic groups, a sign that change is needed in raising
awareness of the benefits of joining professional registration bodies.
������������ ��������������� ���� ������ �������������� ���������������������������
22
Category IWM SA IAIA EAPSA SAIEES
Demographics
Asian 4.45 4.14 5.26 1.83
Black 25.91 23.14 2.63 7.31
Coloured 11.34 12.51 19.30 5.02
White 58.30 60.11 72.81 85.84
Gender Male 70.45 51.18 64.04 75.34
Female 29.55 48.73 35.96 24.66
Gender ratio
(male:female)
Asian 2.67 0.52 2.00 0.33
Black 2.05 0.85 2.00 1.67
Coloured 8.33 0.85 0.83 2.67
White 2.13 1.06 2.19 3.48
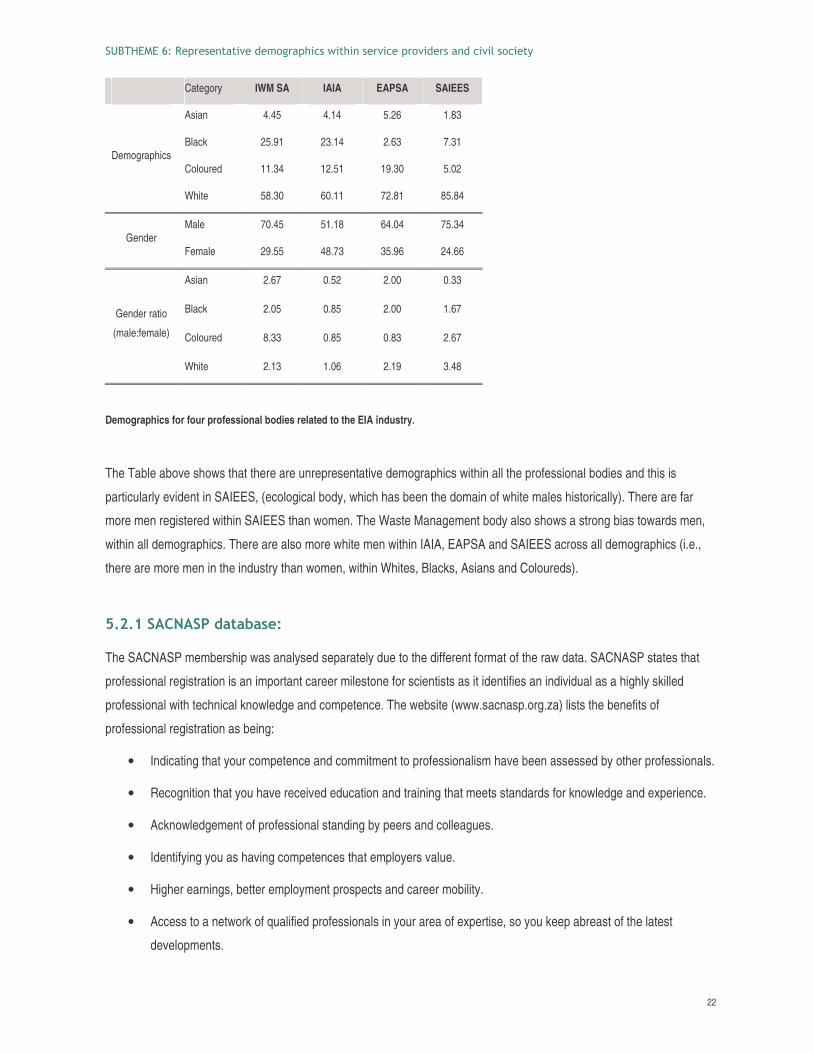
Demographics for four professional bodies related to the EIA industry.
The Table above shows that there are unrepresentative demographics within all the professional bodies and this is
particularly evident in SAIEES, (ecological body, which has been the domain of white males historically). There are far
more men registered within SAIEES than women. The Waste Management body also shows a strong bias towards men,
within all demographics. There are also more white men within IAIA, EAPSA and SAIEES across all demographics (i.e.,
there are more men in the industry than women, within Whites, Blacks, Asians and Coloureds).
2���������� $ ! . ��
The SACNASP membership was analysed separately due to the different format of the raw data. SACNASP states that
professional registration is an important career milestone for scientists as it identifies an individual as a highly skilled
professional with technical knowledge and competence. The website (www.sacnasp.org.za) lists the benefits of
professional registration as being:
• Indicating that your competence and commitment to professionalism have been assessed by other professionals.
• Recognition that you have received education and training that meets standards for knowledge and experience.
• Acknowledgement of professional standing by peers and colleagues.
• Identifying you as having competences that employers value.
• Higher earnings, better employment prospects and career mobility.
• Access to a network of qualified professionals in your area of expertise, so you keep abreast of the latest
developments.
������������ ��������������� ���� ������ �������������� ���������������������������
23
In order to qualify for their various categories (see Table below) one’s qualifications and experience and proven
competence are reviewed, and several mentors need to vouch for the standard of your work. Fees are fairly high with
registration fees ranging from R420-R740 and annual fees costing from R260-R680 depending on the category of the
scientist. In fact, one of the main reasons for cancellation of registration was an overdue account, probably an indication of
an inability to pay the annual fee (this reason was by far the most common reason for cancellation - 34%).
Many EAPs require their consultants to be registered on this database, and it is now part of the Natural Scientific
Professions Act, 2003 (Act No 27 of 2003): whereupon “The purpose of the Act is … to provide for the establishment of
the South African Council for Natural Scientific Professions; and for the registration of professional, candidate and
certificated natural scientists… A person may not practise in any of the fields of practice listed in Schedule I unless he or
she is registered in a category mentioned in subsection 1, including Environmental Science… Only a registered person
may practise in a consulting capacity.” The criteria are fairly strict.
Candidate Natural
Scientist
Certified Natural
Scientist
Professional Natural
Scientist Pending registration
M 48.53 59.85 78.07 57.89
F 51.47 40.15 21.93 42.11
Age 60-plus 0.49 1.52 19.14 1.83
Age 50-59 0.00 12.88 23.59 6.18
Age 40-49 3.92 28.03 28.12 17.39
Age 30-39 37.75 41.67 26.28 43.02
Age 20-29 57.84 15.91 2.85 31.35
Age 19-minus 0.00 0.00 0.03 0.23
White 48.53 29.55 81.80 33.41
Black 44.12 58.33 12.66 61.10
Asian 4.90 5.30 3.60 3.89
Coloured 2.45 6.82 1.94 1.60
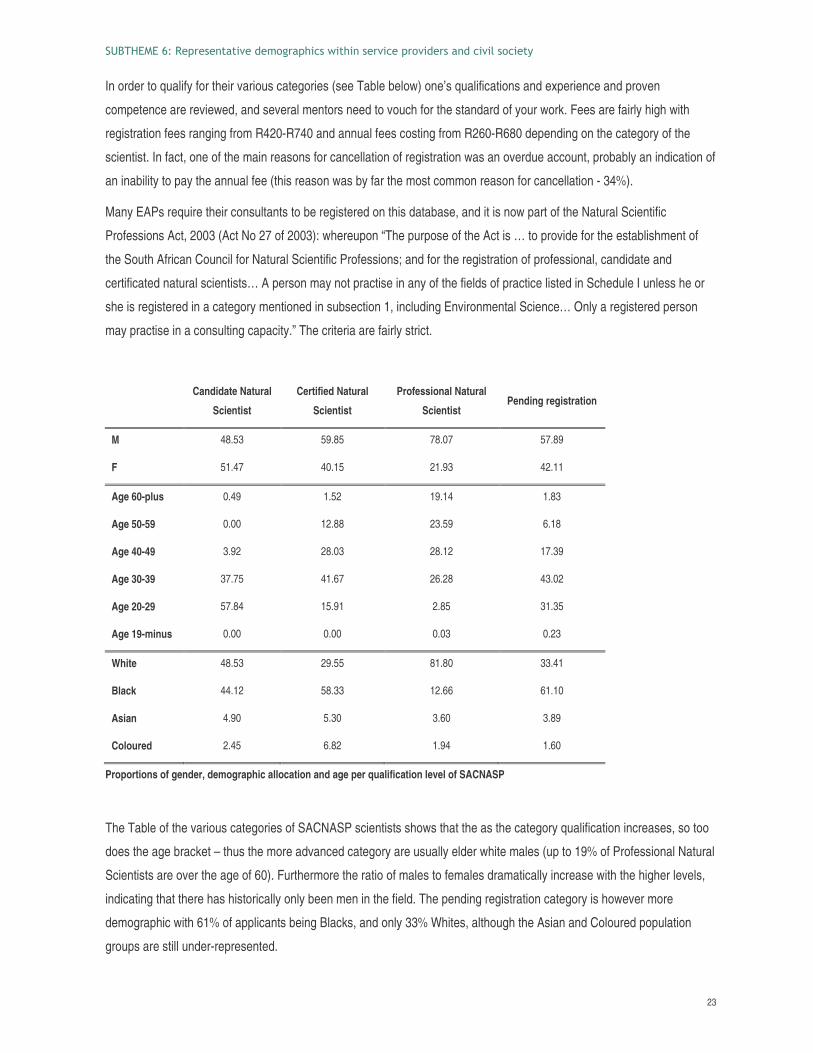
Proportions of gender, demographic allocation and age per qualification level of SACNASP
The Table of the various categories of SACNASP scientists shows that the as the category qualification increases, so too
does the age bracket – thus the more advanced category are usually elder white males (up to 19% of Professional Natural
Scientists are over the age of 60). Furthermore the ratio of males to females dramatically increase with the higher levels,
indicating that there has historically only been men in the field. The pending registration category is however more
demographic with 61% of applicants being Blacks, and only 33% Whites, although the Asian and Coloured population
groups are still under-represented.
������������ ��������������� ���� ������ �������������� ���������������������������
24
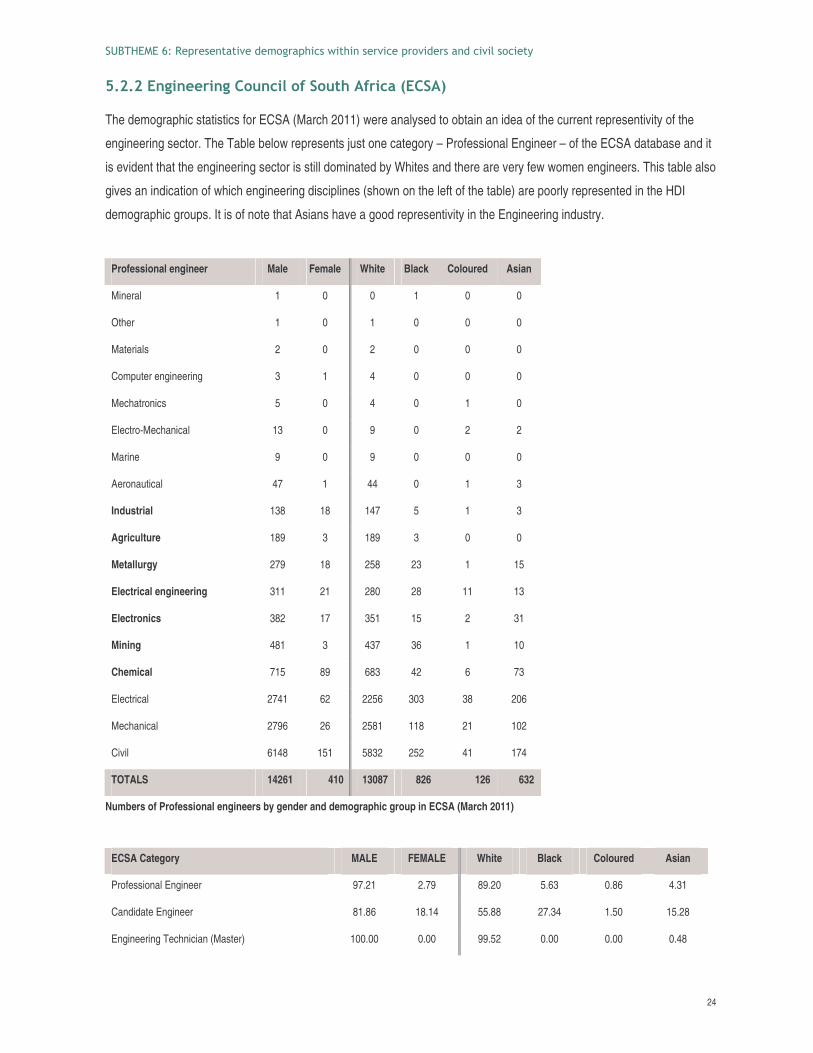
2�����#��#��*�#��",#&��")�",!/�)*�& :����;
The demographic statistics for ECSA (March 2011) were analysed to obtain an idea of the current representivity of the
engineering sector. The Table below represents just one category – Professional Engineer – of the ECSA database and it
is evident that the engineering sector is still dominated by Whites and there are very few women engineers. This table also
gives an indication of which engineering disciplines (shown on the left of the table) are poorly represented in the HDI
demographic groups. It is of note that Asians have a good representivity in the Engineering industry.
Professional engineer Male Female White Black Coloured Asian
Mineral 1 0 0 1 0 0
Other 1 0 1 0 0 0
Materials 2 0 2 0 0 0
Computer engineering 3 1 4 0 0 0
Mechatronics 5 0 4 0 1 0
Electro-Mechanical 13 0 9 0 2 2
Marine 9 0 9 0 0 0
Aeronautical 47 1 44 0 1 3
Industrial 138 18 147 5 1 3
Agriculture 189 3 189 3 0 0
Metallurgy 279 18 258 23 1 15
Electrical engineering 311 21 280 28 11 13
Electronics 382 17 351 15 2 31
Mining 481 3 437 36 1 10
Chemical 715 89 683 42 6 73
Electrical 2741 62 2256 303 38 206
Mechanical 2796 26 2581 118 21 102
Civil 6148 151 5832 252 41 174
TOTALS 14261 410 13087 826 126 632
Numbers of Professional engineers by gender and demographic group in ECSA (March 2011)
ECSA Category MALE FEMALE White Black Coloured Asian
Professional Engineer 97.21 2.79 89.20 5.63 0.86 4.31
Candidate Engineer 81.86 18.14 55.88 27.34 1.50 15.28
Engineering Technician (Master) 100.00 0.00 99.52 0.00 0.00 0.48
������������ ��������������� ���� ������ �������������� ���������������������������
25
Registered Engineering Technician 98.95 1.05 88.20 4.79 2.45 4.56
Candidate Engineering Technician 75.14 24.86 15.75 75.62 1.66 6.98
Proportion of engineers per demographic group and gender in some of the Categories of engineers in ECSA (March 2011)
In the established engineering categories (professional, registered and master), there is a high proportion of Whites, and
very high representation of males. However there is indication that through the Candidate categories Blacks and Asians
are increasing in this profession. However the highest proportion of Blacks (75.62%) is in the Candidate Technician field, a
lower level job. The proportion of Coloured engineers of all categories is very low in the Engineering Council data.
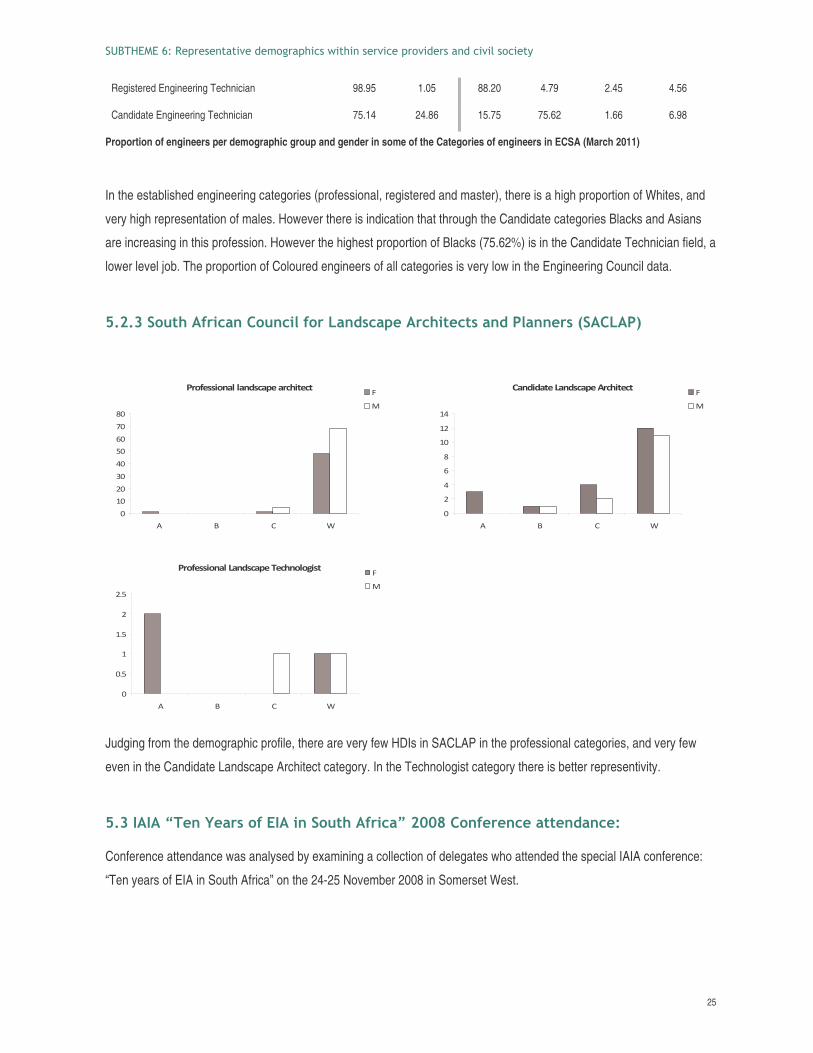
2�����",!/�)*�& #�",#&��)"*� #$�& %��*&/�!�&!� #$ � ##�*�:����� ;
Judging from the demographic profile, there are very few HDIs in SACLAP in the professional categories, and very few
even in the Candidate Landscape Architect category. In the Technologist category there is better representivity.
2������<��#�� *�")����#�",!/�)*�& =�88>�"#)�*�#&� !!�#$ #&�
Conference attendance was analysed by examining a collection of delegates who attended the special IAIA conference:
“Ten years of EIA in South Africa” on the 24-25 November 2008 in Somerset West.
�������������� ���� ���� �
�
��
��
��
��
��
��
�
�
� � �
�
�
������������ ����� ���� �
�
�
�
�
��
��
��
� � �
�
�
��������������� ����� ��������
�
���
�
���
�
���
� � �
�
�
������������ ��������������� ���� ������ �������������� ���������������������������
26
0
1020
30
4050
60
7080
90
Asian Black Coloured White
Demographic Distribution atconference
Demographic Distribtuion in SouthAfrican population
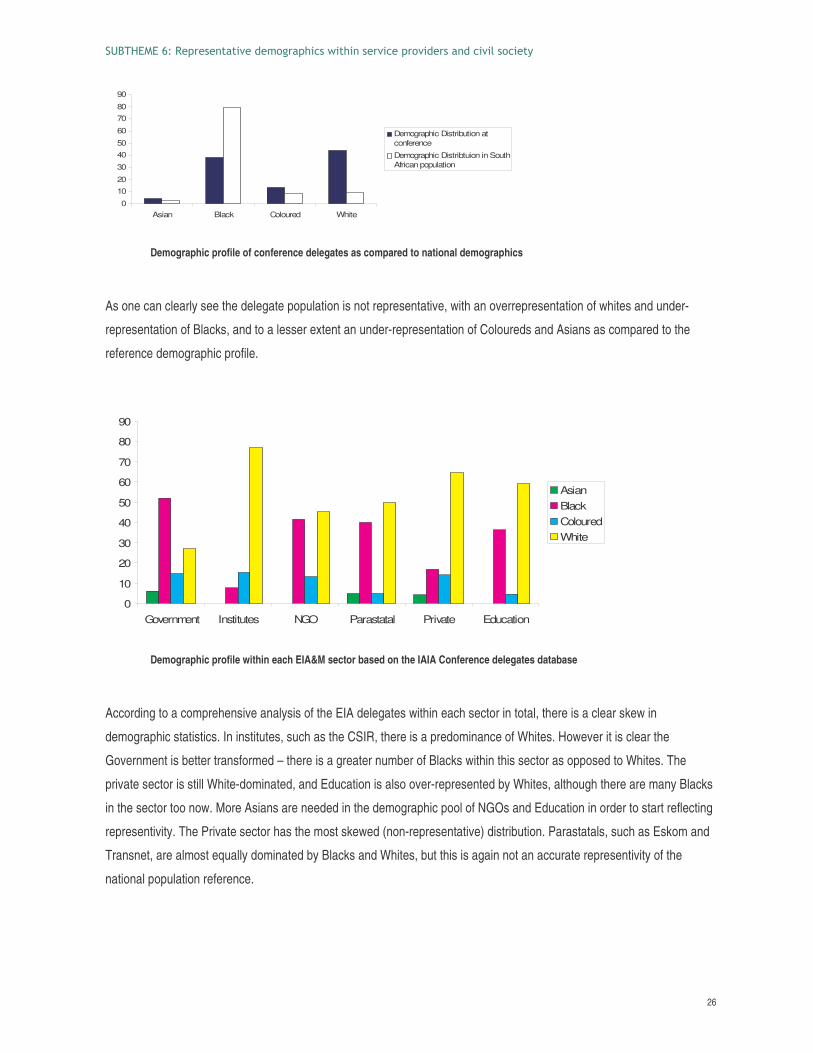
Demographic profile of conference delegates as compared to national demographics
As one can clearly see the delegate population is not representative, with an overrepresentation of whites and under-
representation of Blacks, and to a lesser extent an under-representation of Coloureds and Asians as compared to the
reference demographic profile.
0
10
20
30
40
50
60
70
80
90
Government Institutes NGO Parastatal Private Education
AsianBlackColouredWhite
Demographic profile within each EIA&M sector based on the IAIA Conference delegates database
According to a comprehensive analysis of the EIA delegates within each sector in total, there is a clear skew in
demographic statistics. In institutes, such as the CSIR, there is a predominance of Whites. However it is clear the
Government is better transformed – there is a greater number of Blacks within this sector as opposed to Whites. The
private sector is still White-dominated, and Education is also over-represented by Whites, although there are many Blacks
in the sector too now. More Asians are needed in the demographic pool of NGOs and Education in order to start reflecting
representivity. The Private sector has the most skewed (non-representative) distribution. Parastatals, such as Eskom and
Transnet, are almost equally dominated by Blacks and Whites, but this is again not an accurate representivity of the
national population reference.
������������ ��������������� ���� ������ �������������� ���������������������������
27
0
10
20
30
40
50
60
70
Bank
Governm
ent
Institu
te
Media
NGO
Parasta
tal
Priva
te
Educ
ation
Unkn
own
ABCWtOTAL
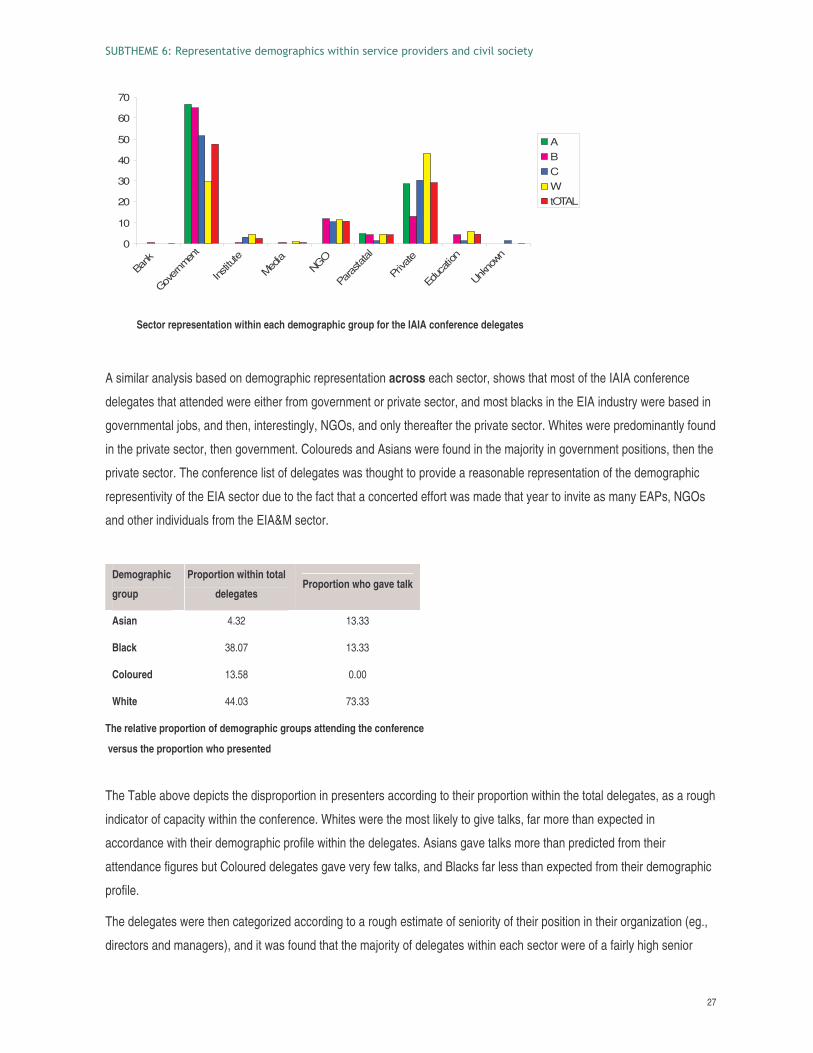
Sector representation within each demographic group for the IAIA conference delegates
A similar analysis based on demographic representation across each sector, shows that most of the IAIA conference
delegates that attended were either from government or private sector, and most blacks in the EIA industry were based in
governmental jobs, and then, interestingly, NGOs, and only thereafter the private sector. Whites were predominantly found
in the private sector, then government. Coloureds and Asians were found in the majority in government positions, then the
private sector. The conference list of delegates was thought to provide a reasonable representation of the demographic
representivity of the EIA sector due to the fact that a concerted effort was made that year to invite as many EAPs, NGOs
and other individuals from the EIA&M sector.
Demographic
group
Proportion within total
delegates Proportion who gave talk
Asian 4.32 13.33
Black 38.07 13.33
Coloured 13.58 0.00
White 44.03 73.33
The relative proportion of demographic groups attending the conference
versus the proportion who presented
The Table above depicts the disproportion in presenters according to their proportion within the total delegates, as a rough
indicator of capacity within the conference. Whites were the most likely to give talks, far more than expected in
accordance with their demographic profile within the delegates. Asians gave talks more than predicted from their
attendance figures but Coloured delegates gave very few talks, and Blacks far less than expected from their demographic
profile.
The delegates were then categorized according to a rough estimate of seniority of their position in their organization (eg.,
directors and managers), and it was found that the majority of delegates within each sector were of a fairly high senior
������������ ��������������� ���� ������ �������������� ���������������������������
28
level (Asians: 61% senior; Black: 55% senior; Coloured: 39% senior; Whites: 41% senior), indicating that it is likely only
higher positions attend conferences. Thus the results need to be considered in the light that this conference profile
represents a slightly more qualified subset of the current EIA demographic profile of South Africa. It is however interesting
that there were only 41% upper management positions in the Whites profile, considering they presented by far the
greatest attendance at the conference, and this might be due to the greater awareness of the benefits of conferences and
networking amongst the white sector, resulting in both junior and senior individuals attending.
2�0�$,& !�"# ���&!"*
2�0��� #�-�*��!���
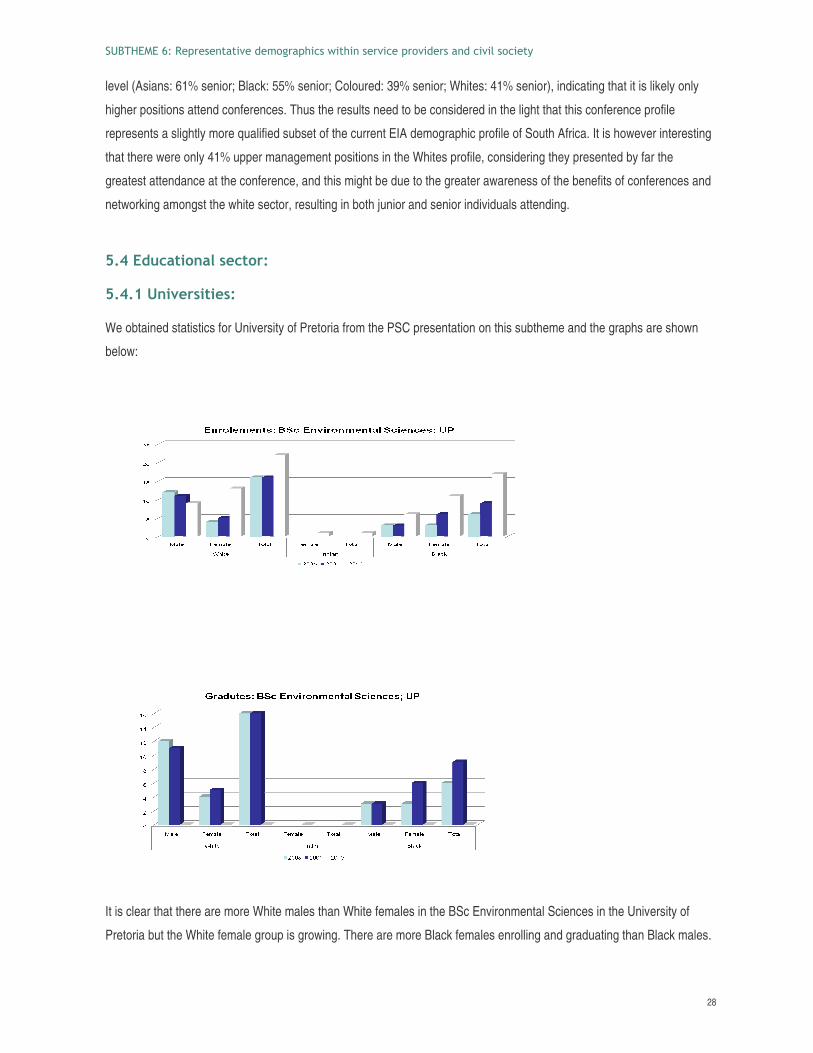
We obtained statistics for University of Pretoria from the PSC presentation on this subtheme and the graphs are shown
below:
It is clear that there are more White males than White females in the BSc Environmental Sciences in the University of
Pretoria but the White female group is growing. There are more Black females enrolling and graduating than Black males.
������������ ��������������� ���� ������ �������������� ���������������������������
29
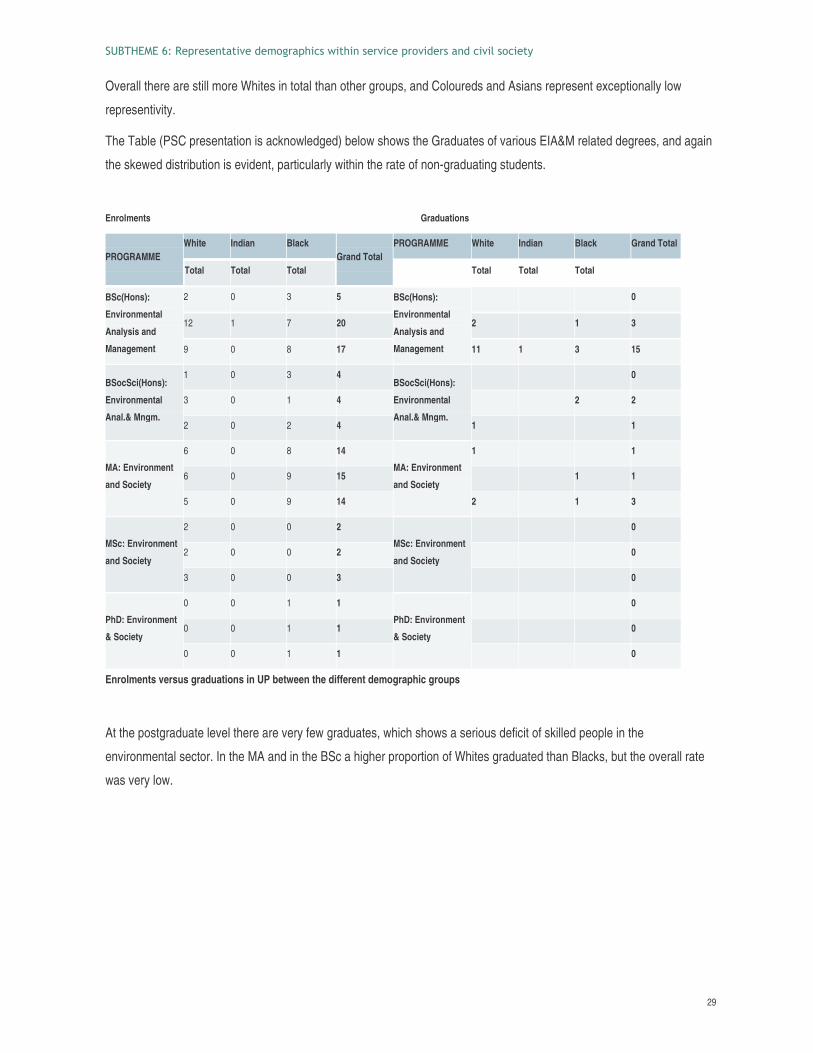
Overall there are still more Whites in total than other groups, and Coloureds and Asians represent exceptionally low
representivity.
The Table (PSC presentation is acknowledged) below shows the Graduates of various EIA&M related degrees, and again
the skewed distribution is evident, particularly within the rate of non-graduating students.
Enrolments Graduations
PROGRAMME White Indian Black
Grand Total PROGRAMME White Indian Black Grand Total
Total Total Total Total Total Total
BSc(Hons):
Environmental
Analysis and
Management
2 0 3 5 BSc(Hons):
Environmental
Analysis and
Management
0
12 1 7 20 2 1 3
9 0 8 17 11 1 3 15
BSocSci(Hons):
Environmental
Anal.& Mngm.
1 0 3 4 BSocSci(Hons):
Environmental
Anal.& Mngm.
0
3 0 1 4 2 2
2 0 2 4 1 1
MA: Environment
and Society
6 0 8 14
MA: Environment
and Society
1 1
6 0 9 15 1 1
5 0 9 14 2 1 3
MSc: Environment
and Society
2 0 0 2
MSc: Environment
and Society
0
2 0 0 2 0
3 0 0 3 0
PhD: Environment
& Society
0 0 1 1
PhD: Environment
& Society
0
0 0 1 1 0
0 0 1 1 0
Enrolments versus graduations in UP between the different demographic groups
At the postgraduate level there are very few graduates, which shows a serious deficit of skilled people in the
environmental sector. In the MA and in the BSc a higher proportion of Whites graduated than Blacks, but the overall rate
was very low.
������������ ��������������� ���� ������ �������������� ���������������������������
30
�
�
��
��
��
��
��
��
�����
������
�������
������
�� ���� �����
!����"�
��� �
���
���#
����
����
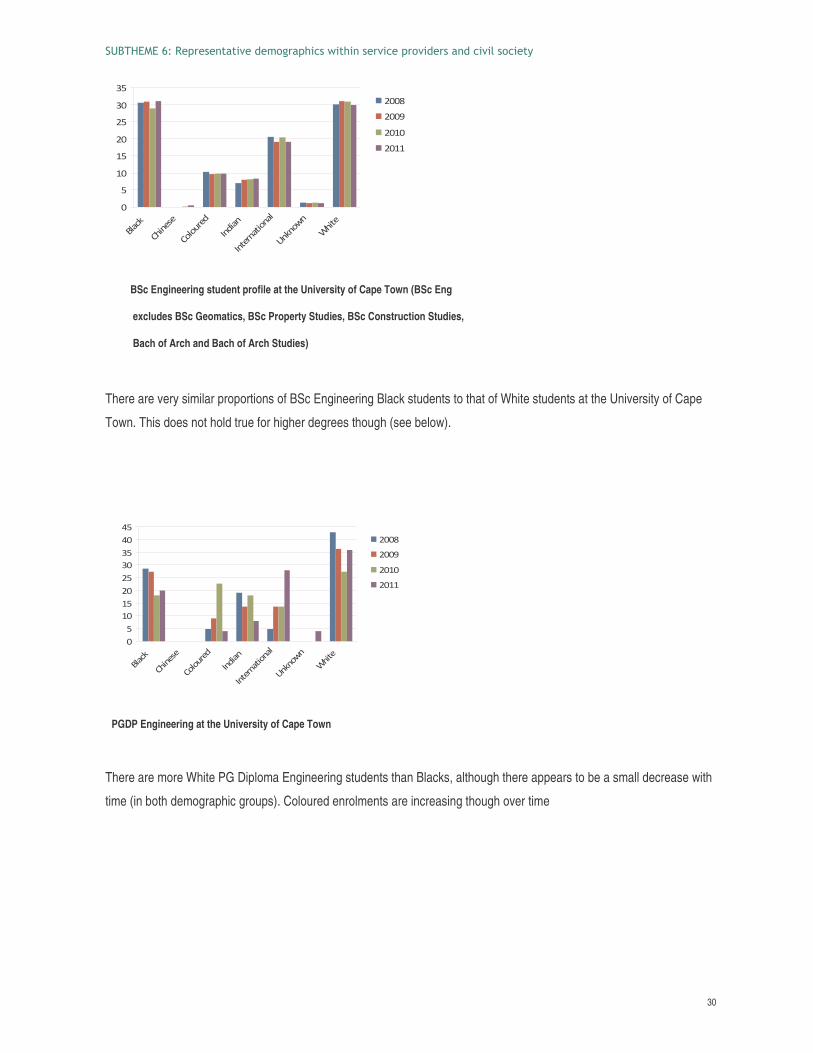
BSc Engineering student profile at the University of Cape Town (BSc Eng
excludes BSc Geomatics, BSc Property Studies, BSc Construction Studies,
Bach of Arch and Bach of Arch Studies)
There are very similar proportions of BSc Engineering Black students to that of White students at the University of Cape
Town. This does not hold true for higher degrees though (see below).
PGDP Engineering at the University of Cape Town
There are more White PG Diploma Engineering students than Blacks, although there appears to be a small decrease with
time (in both demographic groups). Coloured enrolments are increasing though over time
�
�
��
��
��
��
��
��
��
��
�����
������
�������
������
�� ���� �����
!����"�
��� �
���
���#
����
����
������������ ��������������� ���� ������ �������������� ���������������������������
31
�
�
��
��
��
��
��
��
��
��
��
�����
������
�������
������
�� ���� �����
!����"�
��� �
���
���#
����
����
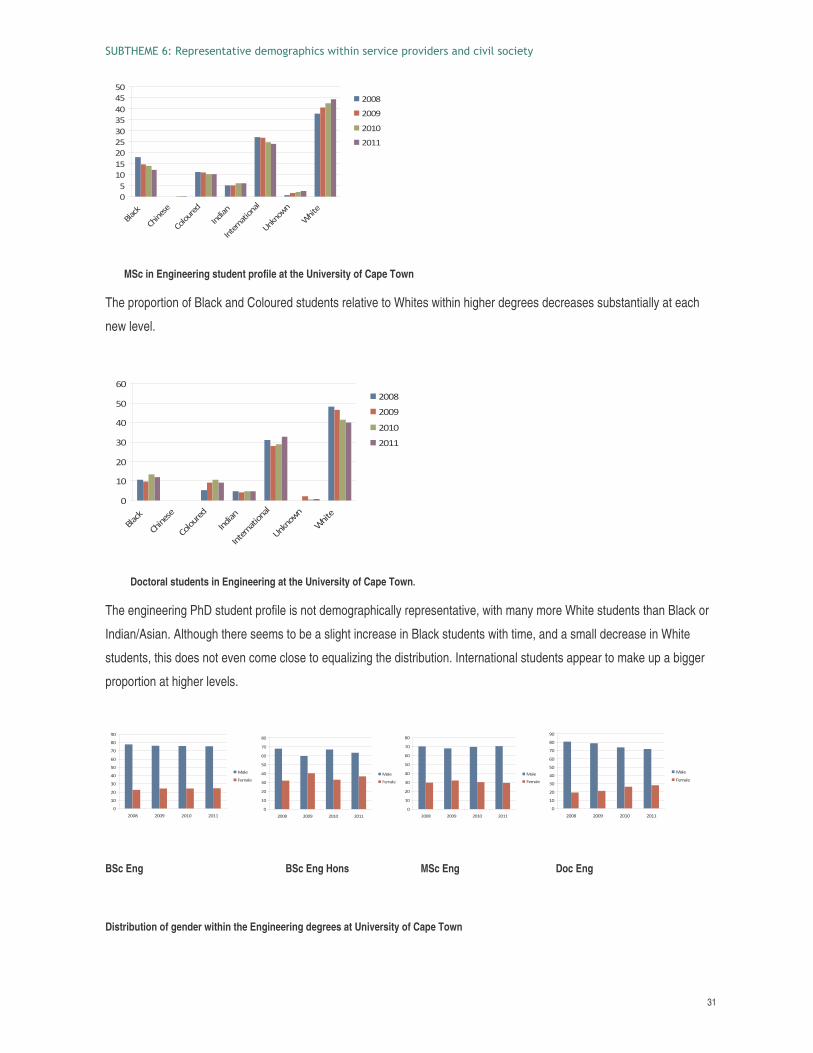
MSc in Engineering student profile at the University of Cape Town
The proportion of Black and Coloured students relative to Whites within higher degrees decreases substantially at each
new level.
�
��
��
��
��
��
��
�����
������
�������
������
�� ���� �����
!����"�
��� �
���
���#
����
����
Doctoral students in Engineering at the University of Cape Town.
The engineering PhD student profile is not demographically representative, with many more White students than Black or
Indian/Asian. Although there seems to be a slight increase in Black students with time, and a small decrease in White
students, this does not even come close to equalizing the distribution. International students appear to make up a bigger
proportion at higher levels.
�
��
��
��
��
��
��
�
�
#�
��� ���# ���� ����
����
��$ ���
�
��
��
��
��
��
��
�
�
��� ���# ���� ����
����
��$ ���
�
��
��
��
��
��
��
�
�
��� ���# ���� ����
����
��$ ���
�
��
��
��
��
��
��
�
�
#�
��� ���# ���� ����
����
��$ ���
BSc Eng BSc Eng Hons MSc Eng Doc Eng
Distribution of gender within the Engineering degrees at University of Cape Town
������������ ��������������� ���� ������ �������������� ���������������������������
32
The four graphs show a very skewed gender inequality in the Engineering discipline, with far fewer women than men in
every level, although the proportion seems higher within the Hons and Masters programmes.
NW University Law Postgrad
0
10
20
30
40
50
60
70
White M White F Black M Black F ColouredM
ColouredF
Indian M Indian F
HonsPhD
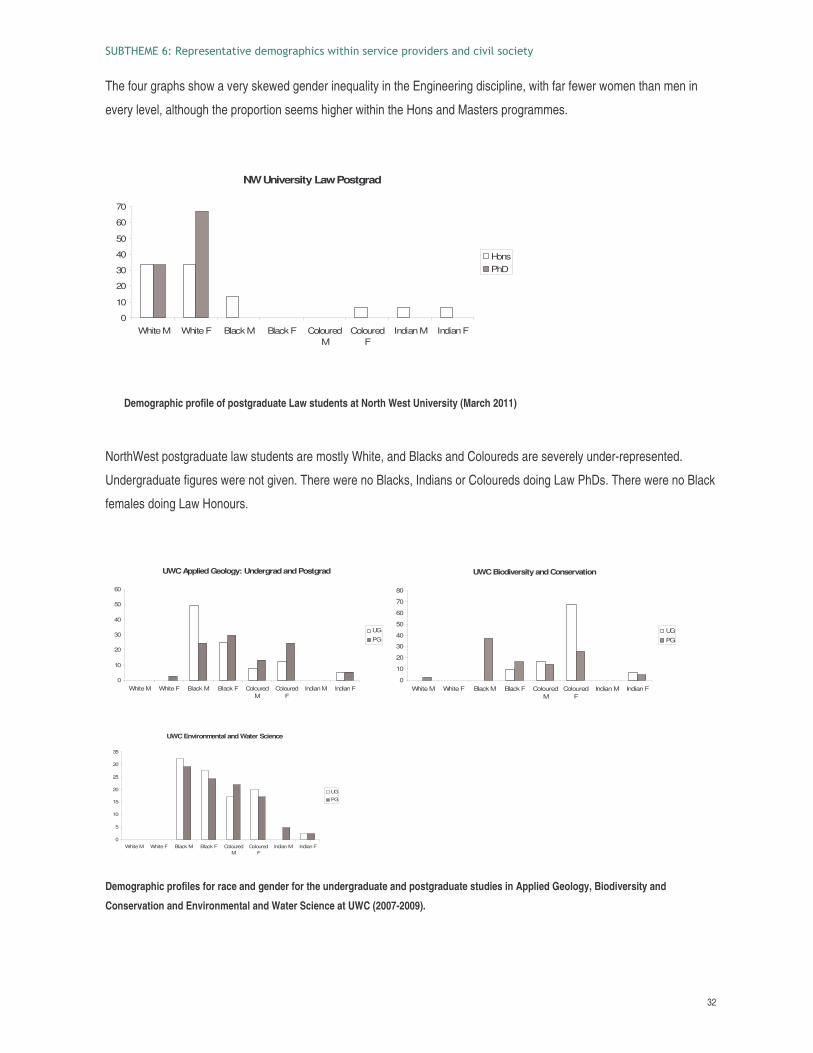
Demographic profile of postgraduate Law students at North West University (March 2011)
NorthWest postgraduate law students are mostly White, and Blacks and Coloureds are severely under-represented.
Undergraduate figures were not given. There were no Blacks, Indians or Coloureds doing Law PhDs. There were no Black
females doing Law Honours.
UWC Applied Geology: Undergrad and Postgrad
0
10
20
30
40
50
60
White M White F Black M Black F ColouredM
ColouredF
Indian M Indian F
UG
PG
UWC Biodiversity and Conservation
0
10
20
30
40
50
60
70
80
White M White F Black M Black F ColouredM
ColouredF
Indian M Indian F
UG
PG
UWC Environmental and Water Science
0
5
10
15
20
25
30
35
White M White F Black M Black F ColouredM
ColouredF
Indian M Indian F
UG
PG
Demographic profiles for race and gender for the undergraduate and postgraduate studies in Applied Geology, Biodiversity and
Conservation and Environmental and Water Science at UWC (2007-2009).
������������ ��������������� ���� ������ �������������� ���������������������������
33
UWC, the University of the Western Cape, has a far better representivity than any other university profiled in this report.
Black students are in the majority, and Coloureds follow closely, for the years 2007 to 2009 for Applied Geology,
Biodiversity and Conservation and Environmental and Water Science degrees, including both undergraduate and
postgraduate students.
2�0���$,& !�"#�#�!�!,!�"#!* #�)"*+ !�"#%"��&��� #$$�-��"%+ �#!%*"�* + + ��
Student graduation disparities:
Student graduations are still not reflective of national demographics for two reasons: “Firstly, there is the poor quality of
black schooling, including the fact that for the majority of black students, English and Afrikaans, the two main languages of
instruction in higher education, constitute at best their second and at worst their third or fourth language. Secondly, there
is the fact that the large majority of black students come from poor families who do not have the wherewithal to finance
their studies.”(Department of Education, Ministerial Report on Discrimination 2008). In response to the challenges
described above, since the 1980s, institutions have developed academic development and support programmes to bridge
the gap between school and university. These take the form of foundation and extended curriculum programmes in which
the basic three-to-four-year undergraduate degree programme is extended by a year, as well as other interventions, such
as language and writing skills programmes.12
UCT (University of Cape Town) has a Student Equity policy13 which states that “The University recognises past inequities
and will strive to achieve equity of access as well as equal opportunity for all students to succeed through appropriate
empowerment measures.” In addition, UCT has apparently vigorously pursued external funding (www.uct.ac.za) to assist
transformation, including:
• The Mellon Mays Undergraduate Fellowship Programme (MMUF) aim is to identify exceptionally promising
black students at a very early stage and, through the provision of financial support, mentoring and stimulating
academic activities, to establish them on an academic career track that will lead to their becoming scholars in
their field in South Africa, and appointees to academic positions.
• The Academic Development Programme (ADP)14 aims to develop and run a range of programmes and
courses designed to foster the access, retention and success of students from disadvantaged educational
backgrounds. ADP has placed increasing emphasis on working with departments and faculties to design curricula
and approaches that enhance the effectiveness and quality of mainstream provision.
• Alternative Admissions Research Project (AARP): One of the most successful of the ADP's projects, AARP's
main goal is to provide a means of access for educationally disadvantaged students whose school results do not
necessarily reveal their potential to succeed in higher education. Over the past few years, their graduation rate is
substantially higher than that of comparable students who were accepted on the strength of their school results.
12 http://edulibpretoria.files.wordpress.com/2009/05/racismreportnov2008.pdf. Report of the Ministerial Committee on Transformation and Social Cohesion and the Elimination of Discrimination in Public Higher Education Institutions 30 November 2008 • FINAL REPORT 13 http://www.uct.ac.za/downloads/uct.ac.za/about/policies/eepolicy.pdf 14 http://www.ched.uct.ac.za/departments/adp/interfac_proj/ldg/
������������ ��������������� ���� ������ �������������� ���������������������������
34
• Language Development Group (LDG): The Language Development Group (LDG) is an inter-faculty unit in the
Academic Development Programme, CHED offering specialised stand-alone or "adjunct" courses for students
whose mother tongue is not English.
• Writing Centre: The Writing Centre, part of the Language Development group, provides a service to students
through individual writing consultations. In addition to providing assistance to students, these consultations
perform a crucial diagnostic function
• Postgraduate Writing Project: The Postgraduate Writing Project was initiated in 2005 to support postgraduates
in their writing of research, and it is based in the Language Development Group.
UCT also has a Racism and Racial Harassment Policy, and a Discrimination and Harassment Office will annually
publicize, through appropriate campus media and publications, the names of mediators who will be available to students
and staff. 15
Rhodes University has comprehensive Equity and Harrassment policies16. North West University has an employment
equity policy but it was not possible to find a student antidiscrimination policy or the like. Judging from the NorthWest
University website, student support programmes are not as developed as compared to UCT.
The University of Pretoria transformation policy document states that “The first transformation domain centres around
increased participation by certain designated groups in the country’s higher education system – black, female and
physically challenged persons – so as to overcome the racial and ethnic fragmentation of the past. However, access on its
own is insufficient. Therefore, the University of Pretoria will pay attention to the success and retention rates of students
from historically disadvantaged groups and the influence of institutional culture on these.”17 The University will address this
in a variety of ways, for example, by emphasizing the importance of service learning and the integration of community
service in curriculum development.18 The University has a Protection Officer to help with unfair discrimination.
The Department of Education report on racism in higher education (2008) notes that “racial and gender harassment
policies were not always in place in South African universities and were not receiving sufficient attention” but a number of
institutions have adopted Transformation Charters, such as UNISA, UJ and the UFS.
2�0�0� #�-�*��!' *"?�&!��,%%"*!�#��#!��* !�"#:
Some of the projects in the past which aim to support integration are (from Department of Education, 2008):
• The Respect Project at UCT, which focuses on the value of the “right of individual dignity, concern for others and
appreciation of diversity” through a range of seminars and workshops on race, gender and related themes. (UCT
2008)
15 http://www.uct.ac.za/downloads/uct.ac.za/about/policies/race_harassment_policy.pdf 16 http://www.ru.ac.za/institutionalplanning/rupolicies 17 http://web.up.ac.za/default.asp?ipkCategoryID=2995#transformation 18 http://web.up.ac.za/sitefiles/file/1/Policy%20on%20UnfairDiscrimination%20-%20Race.pdf
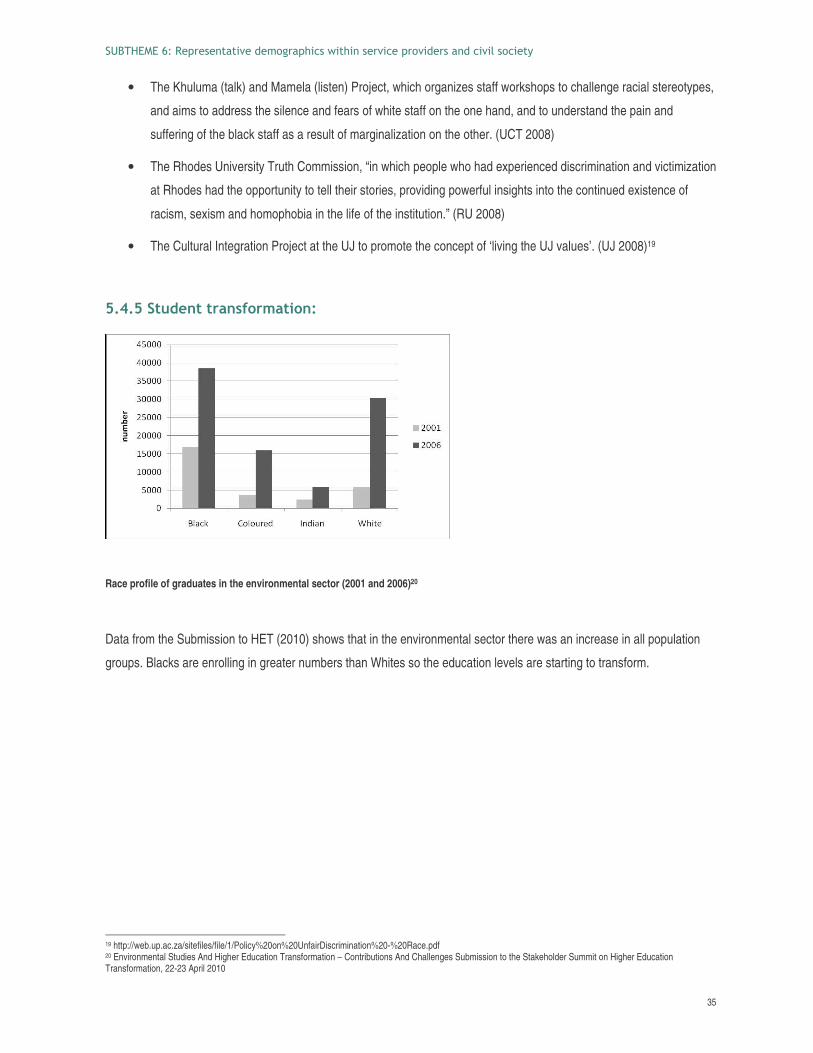
������������ ��������������� ���� ������ �������������� ���������������������������
35
• The Khuluma (talk) and Mamela (listen) Project, which organizes staff workshops to challenge racial stereotypes,
and aims to address the silence and fears of white staff on the one hand, and to understand the pain and
suffering of the black staff as a result of marginalization on the other. (UCT 2008)
• The Rhodes University Truth Commission, “in which people who had experienced discrimination and victimization
at Rhodes had the opportunity to tell their stories, providing powerful insights into the continued existence of
racism, sexism and homophobia in the life of the institution.” (RU 2008)
• The Cultural Integration Project at the UJ to promote the concept of ‘living the UJ values’. (UJ 2008)19
2�0�2�!,$�#!!* #�)"*+ !�"#
Race profile of graduates in the environmental sector (2001 and 2006)20
Data from the Submission to HET (2010) shows that in the environmental sector there was an increase in all population
groups. Blacks are enrolling in greater numbers than Whites so the education levels are starting to transform.
19 http://web.up.ac.za/sitefiles/file/1/Policy%20on%20UnfairDiscrimination%20-%20Race.pdf 20 Environmental Studies And Higher Education Transformation – Contributions And Challenges Submission to the Stakeholder Summit on Higher Education Transformation, 22-23 April 2010
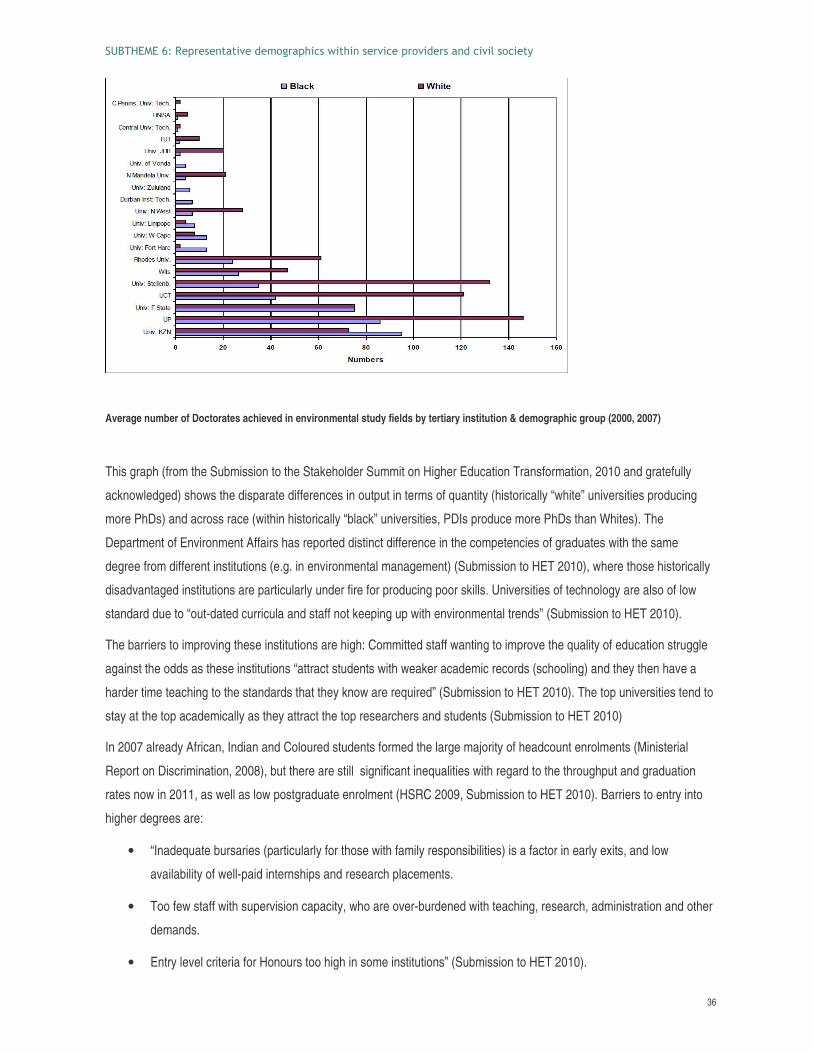
������������ ��������������� ���� ������ �������������� ���������������������������
36
Average number of Doctorates achieved in environmental study fields by tertiary institution & demographic group (2000, 2007)
This graph (from the Submission to the Stakeholder Summit on Higher Education Transformation, 2010 and gratefully
acknowledged) shows the disparate differences in output in terms of quantity (historically “white” universities producing
more PhDs) and across race (within historically “black” universities, PDIs produce more PhDs than Whites). The
Department of Environment Affairs has reported distinct difference in the competencies of graduates with the same
degree from different institutions (e.g. in environmental management) (Submission to HET 2010), where those historically
disadvantaged institutions are particularly under fire for producing poor skills. Universities of technology are also of low
standard due to “out-dated curricula and staff not keeping up with environmental trends” (Submission to HET 2010).
The barriers to improving these institutions are high: Committed staff wanting to improve the quality of education struggle
against the odds as these institutions “attract students with weaker academic records (schooling) and they then have a
harder time teaching to the standards that they know are required” (Submission to HET 2010). The top universities tend to
stay at the top academically as they attract the top researchers and students (Submission to HET 2010)
In 2007 already African, Indian and Coloured students formed the large majority of headcount enrolments (Ministerial
Report on Discrimination, 2008), but there are still significant inequalities with regard to the throughput and graduation
rates now in 2011, as well as low postgraduate enrolment (HSRC 2009, Submission to HET 2010). Barriers to entry into
higher degrees are:
• “Inadequate bursaries (particularly for those with family responsibilities) is a factor in early exits, and low
availability of well-paid internships and research placements.
• Too few staff with supervision capacity, who are over-burdened with teaching, research, administration and other
demands.
• Entry level criteria for Honours too high in some institutions” (Submission to HET 2010).
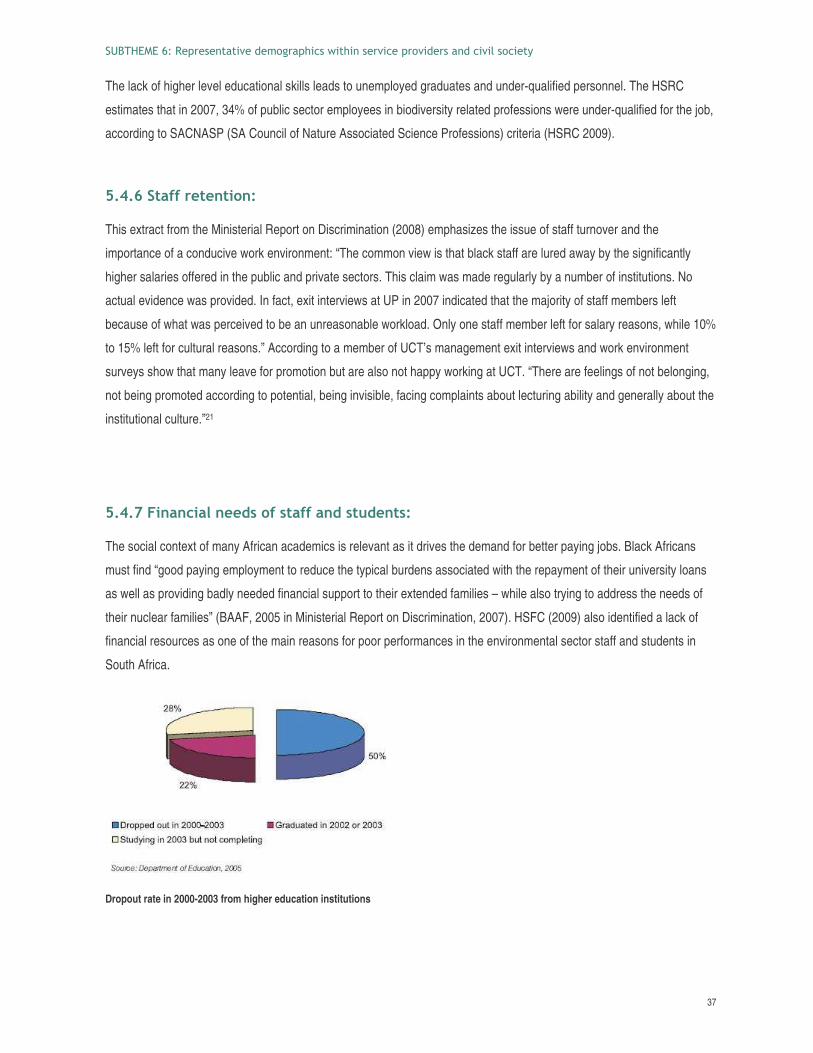
������������ ��������������� ���� ������ �������������� ���������������������������
37
The lack of higher level educational skills leads to unemployed graduates and under-qualified personnel. The HSRC
estimates that in 2007, 34% of public sector employees in biodiversity related professions were under-qualified for the job,
according to SACNASP (SA Council of Nature Associated Science Professions) criteria (HSRC 2009).
2�0�3�! ))*�!�#!�"#
This extract from the Ministerial Report on Discrimination (2008) emphasizes the issue of staff turnover and the
importance of a conducive work environment: “The common view is that black staff are lured away by the significantly
higher salaries offered in the public and private sectors. This claim was made regularly by a number of institutions. No
actual evidence was provided. In fact, exit interviews at UP in 2007 indicated that the majority of staff members left
because of what was perceived to be an unreasonable workload. Only one staff member left for salary reasons, while 10%
to 15% left for cultural reasons.” According to a member of UCT’s management exit interviews and work environment
surveys show that many leave for promotion but are also not happy working at UCT. “There are feelings of not belonging,
not being promoted according to potential, being invisible, facing complaints about lecturing ability and generally about the
institutional culture.”21
2�0�@A�# #&� �#��$�")�! )) #$�!,$�#!�
The social context of many African academics is relevant as it drives the demand for better paying jobs. Black Africans
must find “good paying employment to reduce the typical burdens associated with the repayment of their university loans
as well as providing badly needed financial support to their extended families – while also trying to address the needs of
their nuclear families” (BAAF, 2005 in Ministerial Report on Discrimination, 2007). HSFC (2009) also identified a lack of
financial resources as one of the main reasons for poor performances in the environmental sector staff and students in
South Africa.
Dropout rate in 2000-2003 from higher education institutions
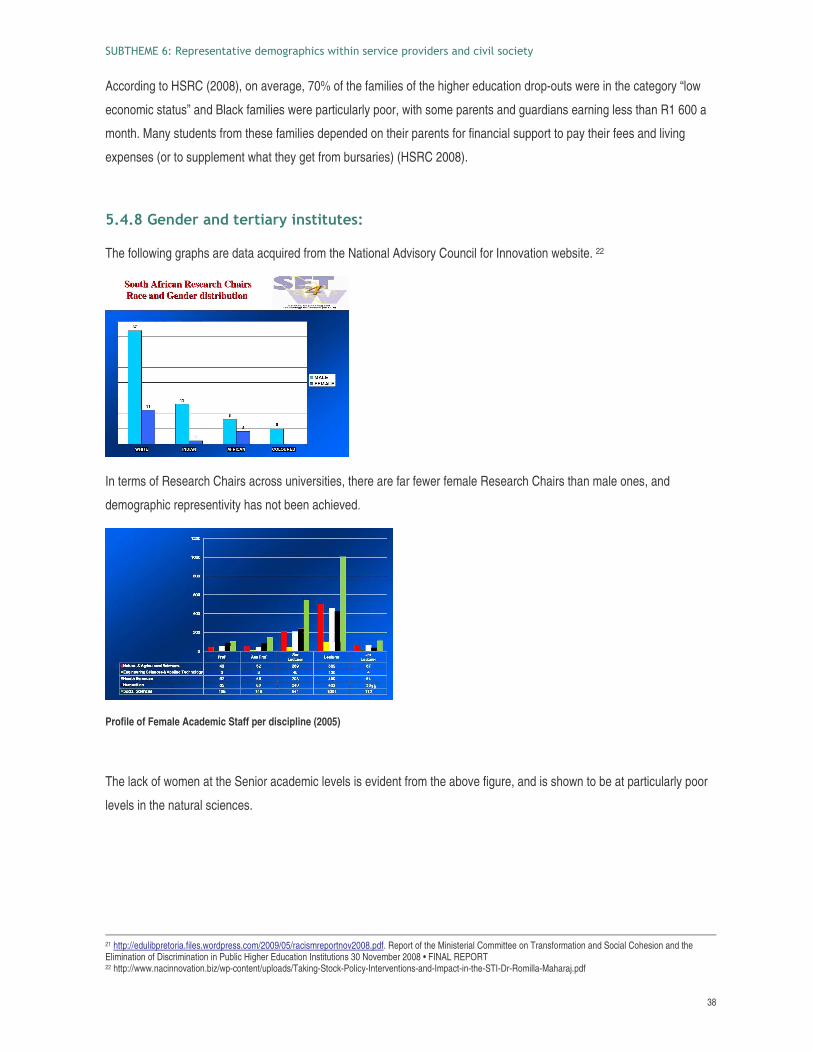
������������ ��������������� ���� ������ �������������� ���������������������������
38
According to HSRC (2008), on average, 70% of the families of the higher education drop-outs were in the category “low
economic status” and Black families were particularly poor, with some parents and guardians earning less than R1 600 a
month. Many students from these families depended on their parents for financial support to pay their fees and living
expenses (or to supplement what they get from bursaries) (HSRC 2008).
2�0�>� �#$�* #$!�*!� *'�#�!�!,!��
The following graphs are data acquired from the National Advisory Council for Innovation website. 22
In terms of Research Chairs across universities, there are far fewer female Research Chairs than male ones, and
demographic representivity has not been achieved.
Profile of Female Academic Staff per discipline (2005)
The lack of women at the Senior academic levels is evident from the above figure, and is shown to be at particularly poor
levels in the natural sciences.
21 http://edulibpretoria.files.wordpress.com/2009/05/racismreportnov2008.pdf. Report of the Ministerial Committee on Transformation and Social Cohesion and the Elimination of Discrimination in Public Higher Education Institutions 30 November 2008 • FINAL REPORT 22 http://www.nacinnovation.biz/wp-content/uploads/Taking-Stock-Policy-Interventions-and-Impact-in-the-STI-Dr-Romilla-Maharaj.pdf
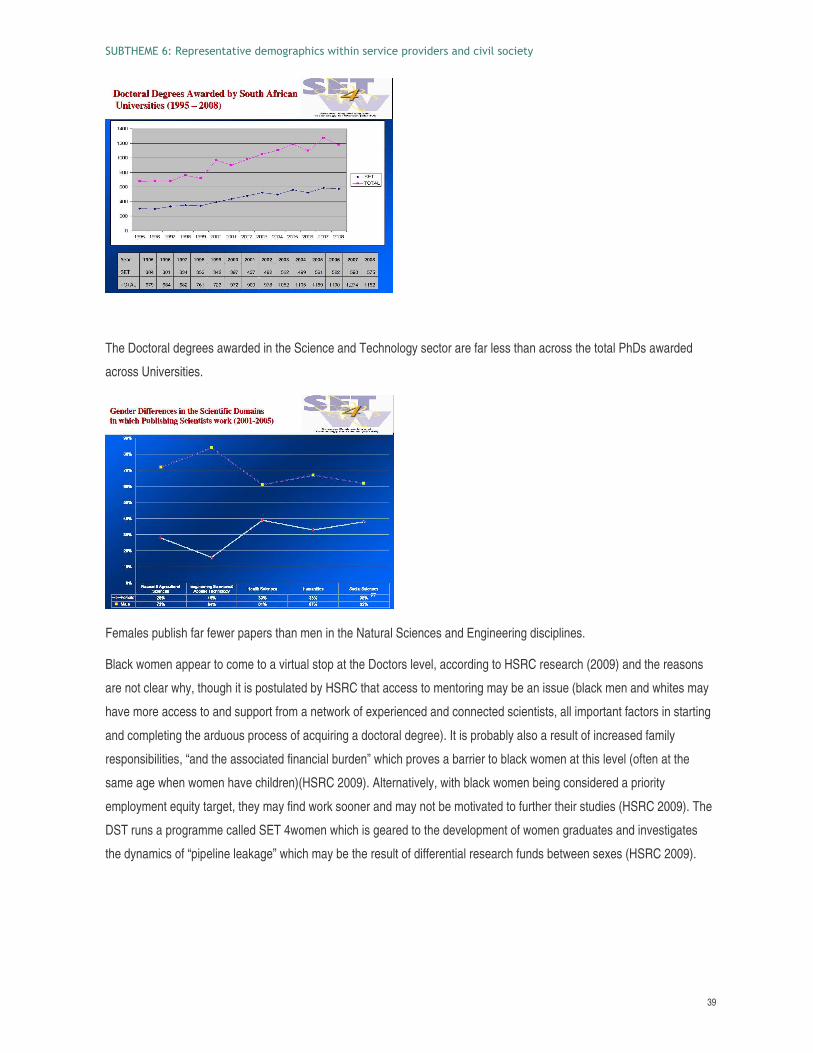
������������ ��������������� ���� ������ �������������� ���������������������������
39
The Doctoral degrees awarded in the Science and Technology sector are far less than across the total PhDs awarded
across Universities.
Females publish far fewer papers than men in the Natural Sciences and Engineering disciplines.
Black women appear to come to a virtual stop at the Doctors level, according to HSRC research (2009) and the reasons
are not clear why, though it is postulated by HSRC that access to mentoring may be an issue (black men and whites may
have more access to and support from a network of experienced and connected scientists, all important factors in starting
and completing the arduous process of acquiring a doctoral degree). It is probably also a result of increased family
responsibilities, “and the associated financial burden” which proves a barrier to black women at this level (often at the
same age when women have children)(HSRC 2009). Alternatively, with black women being considered a priority
employment equity target, they may find work sooner and may not be motivated to further their studies (HSRC 2009). The
DST runs a programme called SET 4women which is geared to the development of women graduates and investigates
the dynamics of “pipeline leakage” which may be the result of differential research funds between sexes (HSRC 2009).
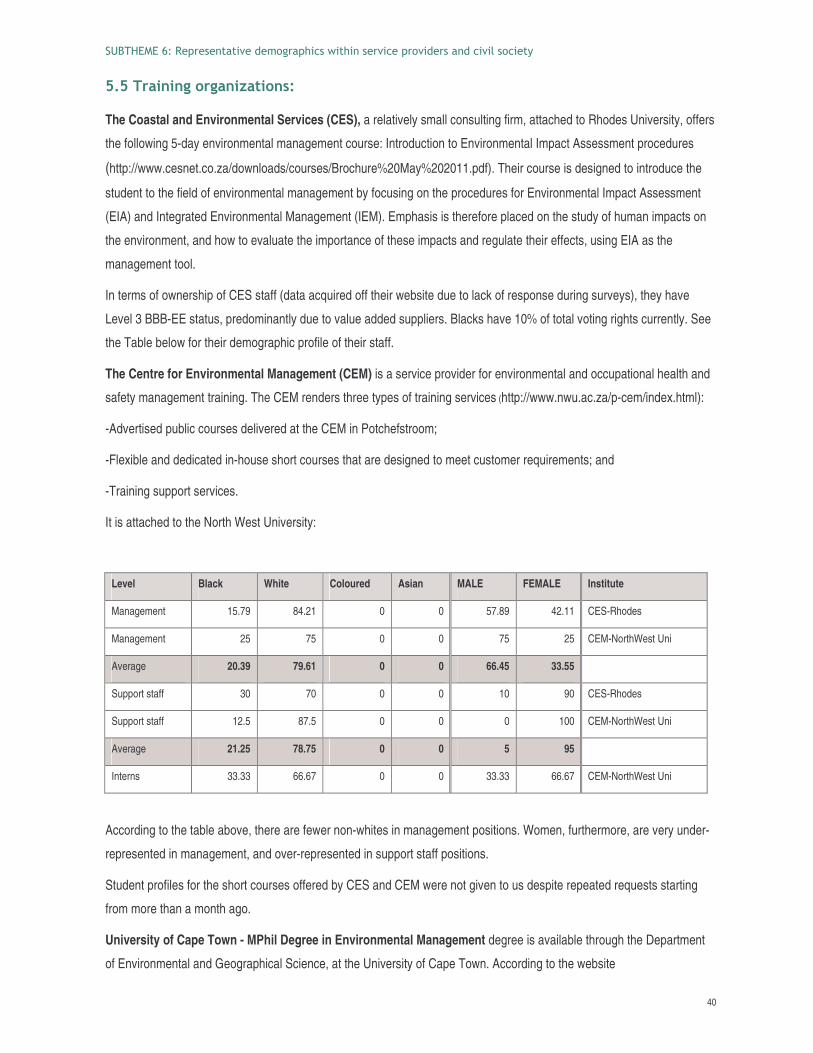
������������ ��������������� ���� ������ �������������� ���������������������������
40
2�2�* �#�#�"*� #�B !�"#�
The Coastal and Environmental Services (CES), a relatively small consulting firm, attached to Rhodes University, offers
the following 5-day environmental management course: Introduction to Environmental Impact Assessment procedures
(http://www.cesnet.co.za/downloads/courses/Brochure%20May%202011.pdf). Their course is designed to introduce the
student to the field of environmental management by focusing on the procedures for Environmental Impact Assessment
(EIA) and Integrated Environmental Management (IEM). Emphasis is therefore placed on the study of human impacts on
the environment, and how to evaluate the importance of these impacts and regulate their effects, using EIA as the
management tool.
In terms of ownership of CES staff (data acquired off their website due to lack of response during surveys), they have
Level 3 BBB-EE status, predominantly due to value added suppliers. Blacks have 10% of total voting rights currently. See
the Table below for their demographic profile of their staff.
The Centre for Environmental Management (CEM) is a service provider for environmental and occupational health and
safety management training. The CEM renders three types of training services (http://www.nwu.ac.za/p-cem/index.html):
-Advertised public courses delivered at the CEM in Potchefstroom;
-Flexible and dedicated in-house short courses that are designed to meet customer requirements; and
-Training support services.
It is attached to the North West University:
Level Black White Coloured Asian MALE FEMALE Institute
Management 15.79 84.21 0 0 57.89 42.11 CES-Rhodes
Management 25 75 0 0 75 25 CEM-NorthWest Uni
Average 20.39 79.61 0 0 66.45 33.55
Support staff 30 70 0 0 10 90 CES-Rhodes
Support staff 12.5 87.5 0 0 0 100 CEM-NorthWest Uni
Average 21.25 78.75 0 0 5 95
Interns 33.33 66.67 0 0 33.33 66.67 CEM-NorthWest Uni
According to the table above, there are fewer non-whites in management positions. Women, furthermore, are very under-
represented in management, and over-represented in support staff positions.
Student profiles for the short courses offered by CES and CEM were not given to us despite repeated requests starting
from more than a month ago.
University of Cape Town - MPhil Degree in Environmental Management degree is available through the Department
of Environmental and Geographical Science, at the University of Cape Town. According to the website
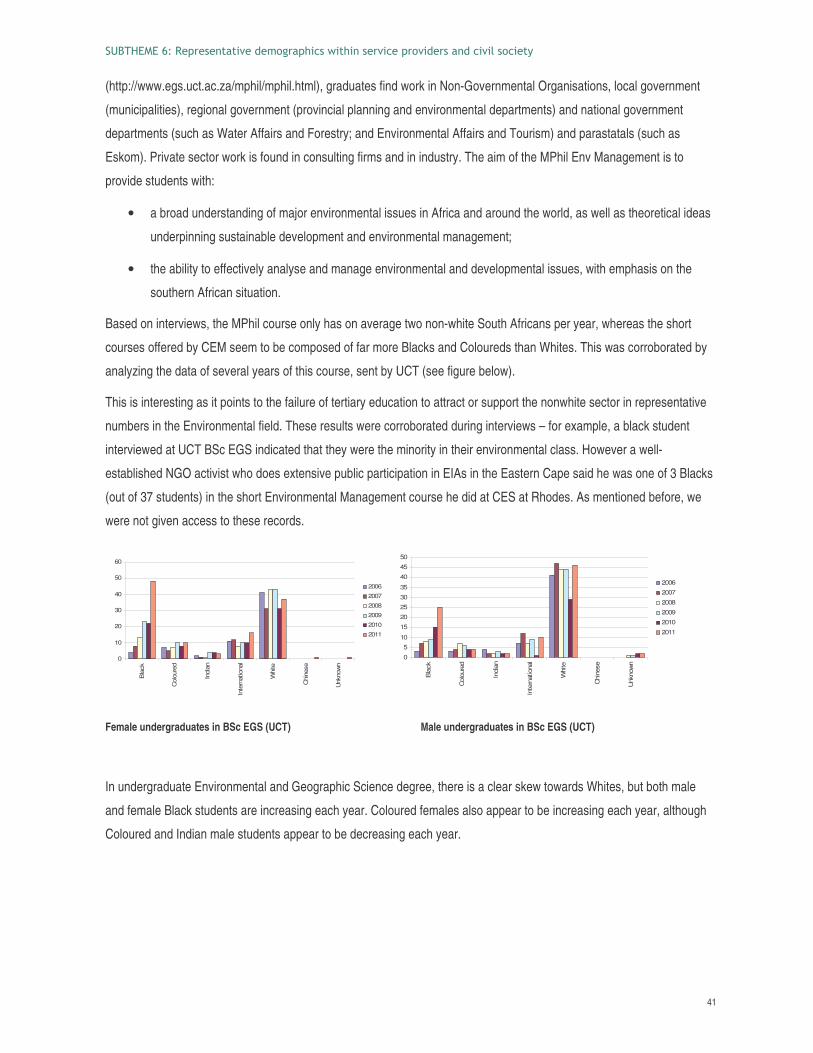
������������ ��������������� ���� ������ �������������� ���������������������������
41
(http://www.egs.uct.ac.za/mphil/mphil.html), graduates find work in Non-Governmental Organisations, local government
(municipalities), regional government (provincial planning and environmental departments) and national government
departments (such as Water Affairs and Forestry; and Environmental Affairs and Tourism) and parastatals (such as
Eskom). Private sector work is found in consulting firms and in industry. The aim of the MPhil Env Management is to
provide students with:
• a broad understanding of major environmental issues in Africa and around the world, as well as theoretical ideas
underpinning sustainable development and environmental management;
• the ability to effectively analyse and manage environmental and developmental issues, with emphasis on the
southern African situation.
Based on interviews, the MPhil course only has on average two non-white South Africans per year, whereas the short
courses offered by CEM seem to be composed of far more Blacks and Coloureds than Whites. This was corroborated by
analyzing the data of several years of this course, sent by UCT (see figure below).
This is interesting as it points to the failure of tertiary education to attract or support the nonwhite sector in representative
numbers in the Environmental field. These results were corroborated during interviews – for example, a black student
interviewed at UCT BSc EGS indicated that they were the minority in their environmental class. However a well-
established NGO activist who does extensive public participation in EIAs in the Eastern Cape said he was one of 3 Blacks
(out of 37 students) in the short Environmental Management course he did at CES at Rhodes. As mentioned before, we
were not given access to these records.
0
10
20
30
40
50
60
Bla
ck
Col
oure
d
Indi
an
Inte
rnat
iona
l
Whi
te
Chi
nese
Unk
now
n
2006
2007
2008
2009
2010
2011
0
5
10
15
20
25
30
35
40
45
50
Bla
ck
Col
oure
d
Indi
an
Inte
rnat
iona
l
Whi
te
Chi
nese
Unk
now
n
2006
2007
2008
2009
2010
2011
Female undergraduates in BSc EGS (UCT) Male undergraduates in BSc EGS (UCT)
In undergraduate Environmental and Geographic Science degree, there is a clear skew towards Whites, but both male
and female Black students are increasing each year. Coloured females also appear to be increasing each year, although
Coloured and Indian male students appear to be decreasing each year.
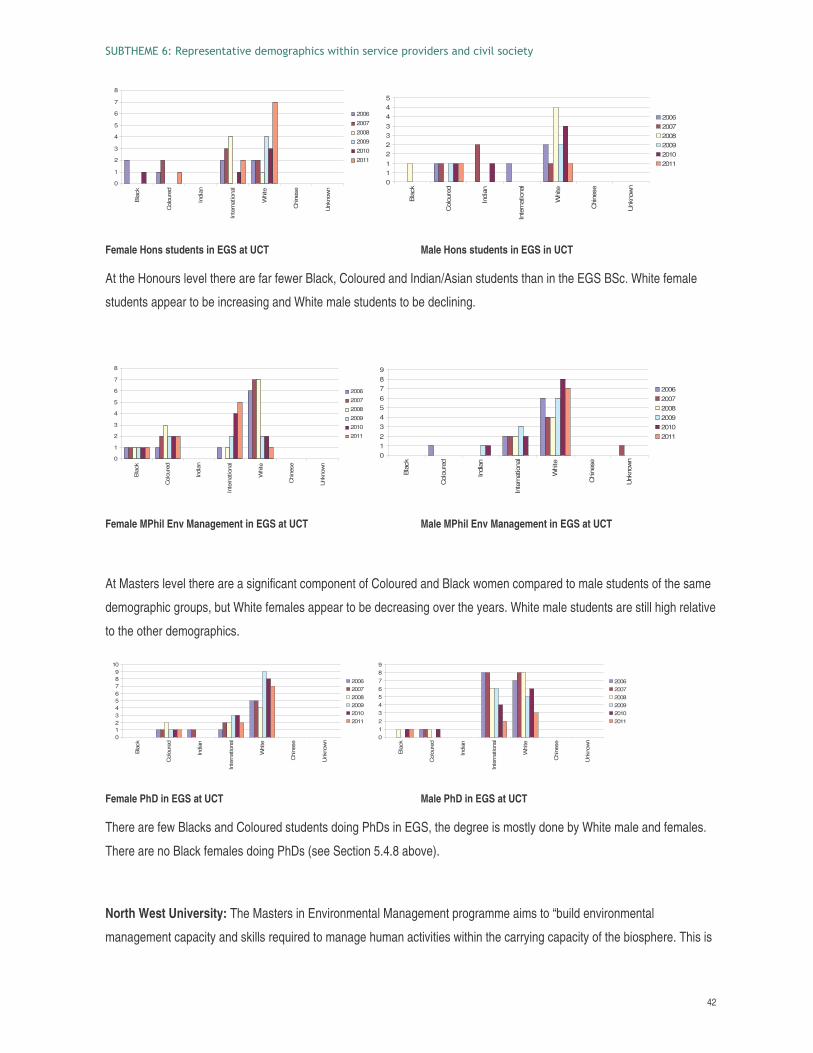
������������ ��������������� ���� ������ �������������� ���������������������������
42
0
1
2
3
4
5
6
7
8
Bla
ck
Col
oure
d
Indi
an
Inte
rnat
iona
l
Whi
te
Chi
nese
Unk
now
n
2006
2007
2008
2009
2010
2011
0112233445
Bla
ck
Col
oure
d
Indi
an
Inte
rnat
iona
l
Whi
te
Chi
nese
Unk
now
n
200620072008200920102011
Female Hons students in EGS at UCT Male Hons students in EGS in UCT
At the Honours level there are far fewer Black, Coloured and Indian/Asian students than in the EGS BSc. White female
students appear to be increasing and White male students to be declining.
0
1
2
3
4
5
6
7
8
Bla
ck
Col
oure
d
Indi
an
Inte
rnat
iona
l
Whi
te
Chi
nese
Unk
now
n
2006
2007
2008
2009
2010
2011
0123456789
Bla
ck
Col
oure
d
Indi
an
Inte
rnat
iona
l
Whi
te
Chi
nese
Unk
now
n
200620072008200920102011
Female MPhil Env Management in EGS at UCT Male MPhil Env Management in EGS at UCT
At Masters level there are a significant component of Coloured and Black women compared to male students of the same
demographic groups, but White females appear to be decreasing over the years. White male students are still high relative
to the other demographics.
0123456789
10
Bla
ck
Col
oure
d
Indi
an
Inte
rnat
iona
l
Whi
te
Chi
nese
Unk
now
n
200620072008200920102011
0123456789
Bla
ck
Col
oure
d
Indi
an
Inte
rnat
iona
l
Whi
te
Chi
nese
Unk
now
n
200620072008200920102011
Female PhD in EGS at UCT Male PhD in EGS at UCT
There are few Blacks and Coloured students doing PhDs in EGS, the degree is mostly done by White male and females.
There are no Black females doing PhDs (see Section 5.4.8 above).
North West University: The Masters in Environmental Management programme aims to “build environmental
management capacity and skills required to manage human activities within the carrying capacity of the biosphere. This is
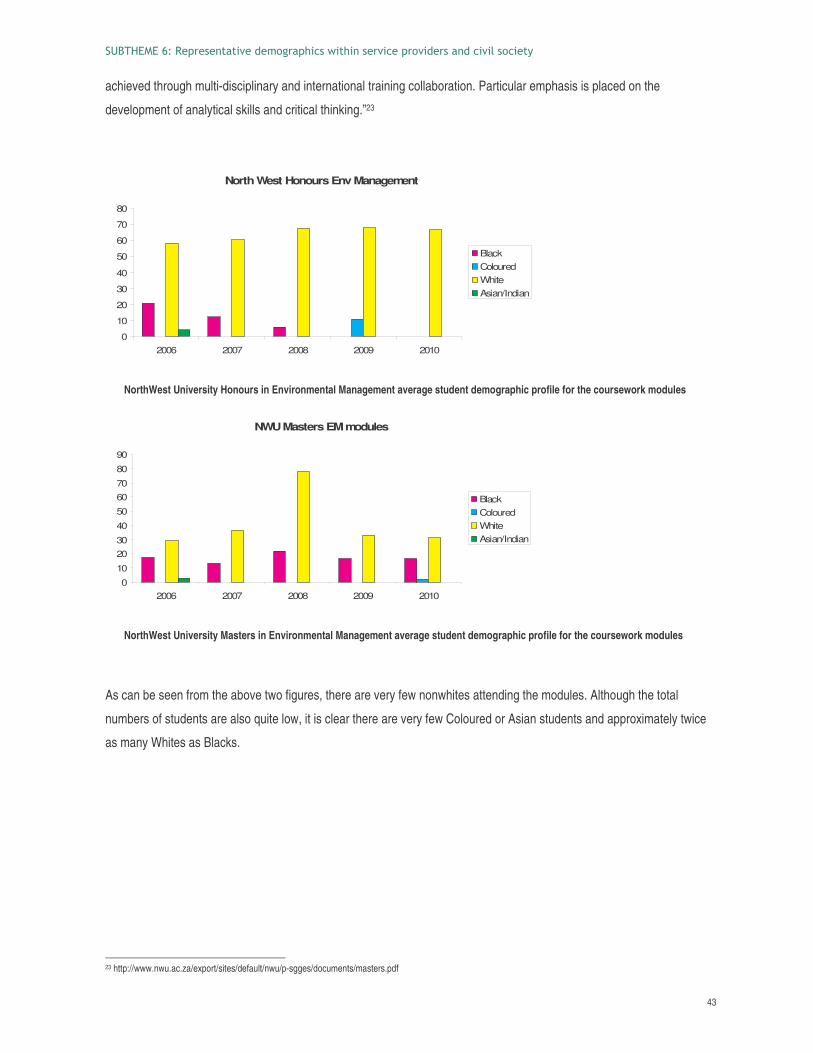
������������ ��������������� ���� ������ �������������� ���������������������������
43
achieved through multi-disciplinary and international training collaboration. Particular emphasis is placed on the
development of analytical skills and critical thinking.”23
North West Honours Env Management
0
10
20
30
40
50
60
70
80
2006 2007 2008 2009 2010
BlackColouredWhiteAsian/Indian
NorthWest University Honours in Environmental Management average student demographic profile for the coursework modules
NWU Masters EM modules
0
10
2030
40
50
6070
80
90
2006 2007 2008 2009 2010
BlackColouredWhiteAsian/Indian
NorthWest University Masters in Environmental Management average student demographic profile for the coursework modules
As can be seen from the above two figures, there are very few nonwhites attending the modules. Although the total
numbers of students are also quite low, it is clear there are very few Coloured or Asian students and approximately twice
as many Whites as Blacks.
23 http://www.nwu.ac.za/export/sites/default/nwu/p-sgges/documents/masters.pdf
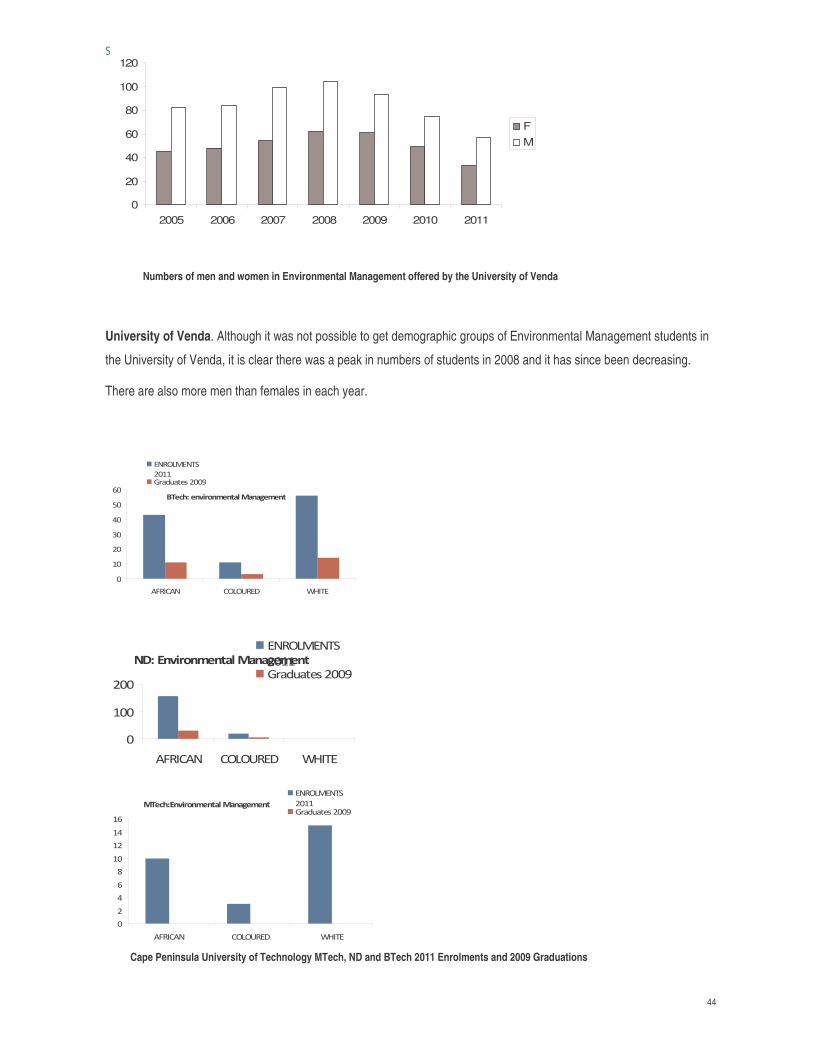
������������ ��������������� ���� ������ �������������� ���������������������������
44
Numbers of men and women in Environmental Management offered by the University of Venda
University of Venda. Although it was not possible to get demographic groups of Environmental Management students in
the University of Venda, it is clear there was a peak in numbers of students in 2008 and it has since been decreasing.
There are also more men than females in each year.
��� ���������� ��������� ���
�
�
�
�
��
��
��
��
��%� �& '('!%)* �+�,)
)&%'(�)&,-
����.����� ������#
Cape Peninsula University of Technology MTech, ND and BTech 2011 Enrolments and 2009 Graduations
��� ����������� ��������� ���
�
��
��
��
��
��
��
��%� �& '('!%)* �+�,)
)&%'(�)&,-
����.����� ������#
������������ ��������� ���
�
���
���
��%� �& '('!%)* �+�,)
)&%'(�)&,-
����.����� ������#
Numbers of men and women in bachelor Environmental Management Venda University
0
20
40
60
80
100
120
2005 2006 2007 2008 2009 2010 2011
FM
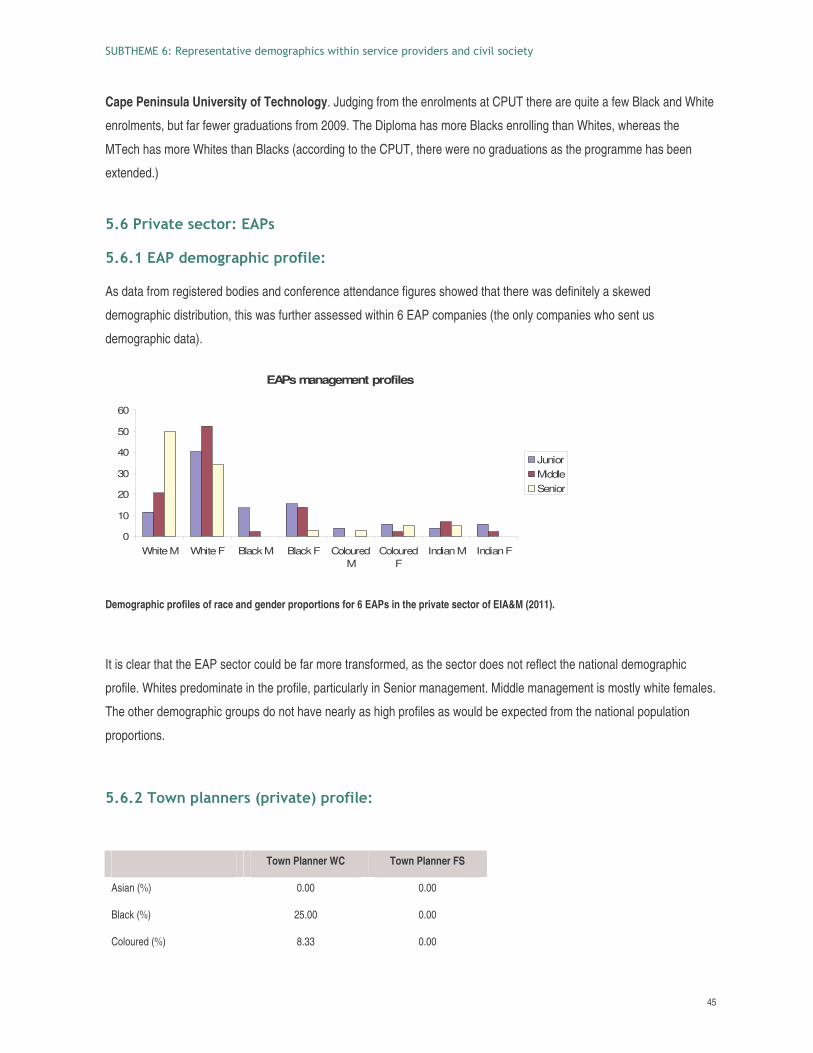
������������ ��������������� ���� ������ �������������� ���������������������������
45
Cape Peninsula University of Technology. Judging from the enrolments at CPUT there are quite a few Black and White
enrolments, but far fewer graduations from 2009. The Diploma has more Blacks enrolling than Whites, whereas the
MTech has more Whites than Blacks (according to the CPUT, there were no graduations as the programme has been
extended.)
2�3 *�- !���&!"*�� �
2�3���� $�+ "�* %/�&%*")���
As data from registered bodies and conference attendance figures showed that there was definitely a skewed
demographic distribution, this was further assessed within 6 EAP companies (the only companies who sent us
demographic data).
EAPs management profiles
0
10
20
30
40
50
60
White M White F Black M Black F ColouredM
ColouredF
Indian M Indian F
JuniorMiddleSenior
Demographic profiles of race and gender proportions for 6 EAPs in the private sector of EIA&M (2011).
It is clear that the EAP sector could be far more transformed, as the sector does not reflect the national demographic
profile. Whites predominate in the profile, particularly in Senior management. Middle management is mostly white females.
The other demographic groups do not have nearly as high profiles as would be expected from the national population
proportions.
2�3���"1 #%� ##�*�:%*�- !�;%*")���
Town Planner WC Town Planner FS
Asian (%) 0.00 0.00
Black (%) 25.00 0.00
Coloured (%) 8.33 0.00
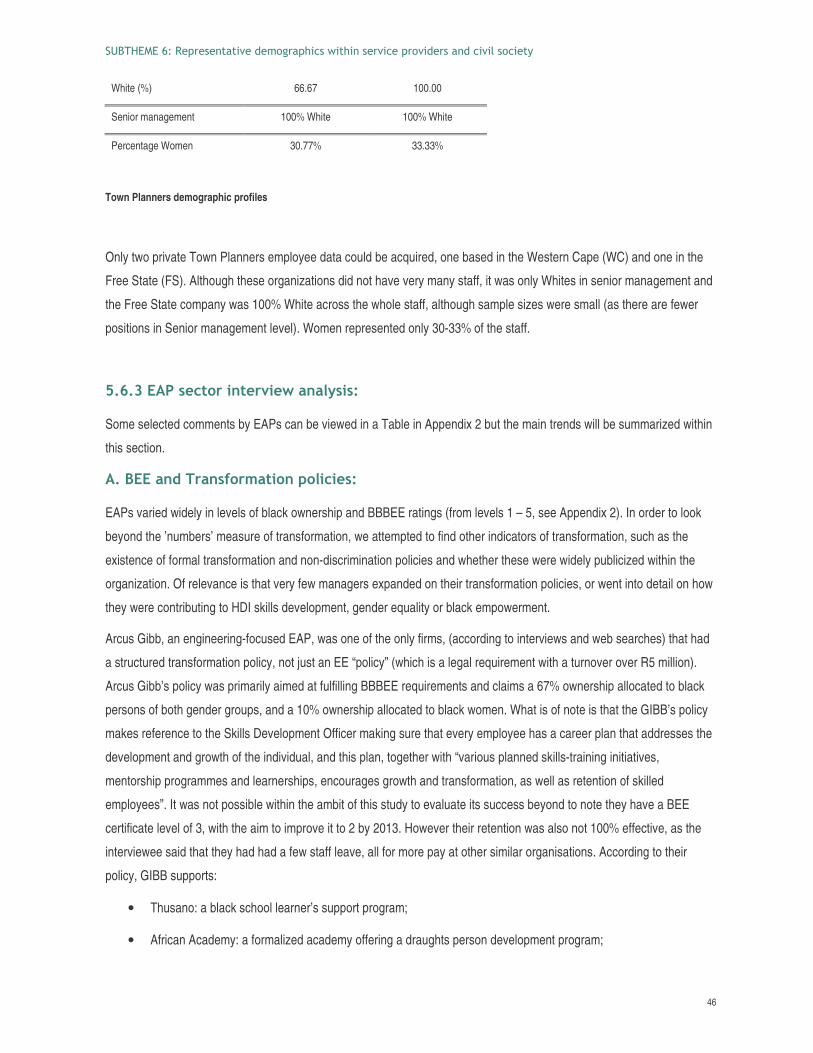
������������ ��������������� ���� ������ �������������� ���������������������������
46
White (%) 66.67 100.00
Senior management 100% White 100% White
Percentage Women 30.77% 33.33%
Town Planners demographic profiles
Only two private Town Planners employee data could be acquired, one based in the Western Cape (WC) and one in the
Free State (FS). Although these organizations did not have very many staff, it was only Whites in senior management and
the Free State company was 100% White across the whole staff, although sample sizes were small (as there are fewer
positions in Senior management level). Women represented only 30-33% of the staff.
2�3���� ��&!"*�#!�*-��1 # �'���
Some selected comments by EAPs can be viewed in a Table in Appendix 2 but the main trends will be summarized within
this section.
����� #$�* #�)"*+ !�"#%"��&���
EAPs varied widely in levels of black ownership and BBBEE ratings (from levels 1 – 5, see Appendix 2). In order to look
beyond the ’numbers’ measure of transformation, we attempted to find other indicators of transformation, such as the
existence of formal transformation and non-discrimination policies and whether these were widely publicized within the
organization. Of relevance is that very few managers expanded on their transformation policies, or went into detail on how
they were contributing to HDI skills development, gender equality or black empowerment.
Arcus Gibb, an engineering-focused EAP, was one of the only firms, (according to interviews and web searches) that had
a structured transformation policy, not just an EE “policy” (which is a legal requirement with a turnover over R5 million).
Arcus Gibb’s policy was primarily aimed at fulfilling BBBEE requirements and claims a 67% ownership allocated to black
persons of both gender groups, and a 10% ownership allocated to black women. What is of note is that the GIBB’s policy
makes reference to the Skills Development Officer making sure that every employee has a career plan that addresses the
development and growth of the individual, and this plan, together with “various planned skills-training initiatives,
mentorship programmes and learnerships, encourages growth and transformation, as well as retention of skilled
employees”. It was not possible within the ambit of this study to evaluate its success beyond to note they have a BEE
certificate level of 3, with the aim to improve it to 2 by 2013. However their retention was also not 100% effective, as the
interviewee said that they had had a few staff leave, all for more pay at other similar organisations. According to their
policy, GIBB supports:
• Thusano: a black school learner’s support program;
• African Academy: a formalized academy offering a draughts person development program;
������������ ��������������� ���� ������ �������������� ���������������������������
47
• GIBB Bursaries: for students to enroll at tertiary institutions;
• Young Professional Forum: initiatives undertaken by the Young Professional Forum in the engineering industry
are supported by GIBB;
• Job Shadow Project: annual support for activities that expose learners to the engineering environment;
• SA Women in Engineering focuses on the advancement and education of female engineers and aims to increase
gender equality, by addressing skill shortages and promoting progressive thinking.
It is difficult to measure the success of such policies as these initiatives will only show results in the long term. As several
black environmentalists pointed out in our focus group session, “transformation will be slow”. On paper these types of
policies are doing the right thing and should be encouraged and monitored.
Another indicator of transformation would be how to assess how socially integrated the work environment and the
employees are, and how widely known and enforced the policies are. This proved difficult to measure within EAPs due to
the emotive issues implicit in these policies and the lack of time to spend interviewing personnel and tracking down each
EAPs individual policies. There was also the difficulty of getting people to open up in the workplace. What could be
discerned was that those employees in small HDI-owned or women-owned EAPs were “very happy” and felt they had a
conducive working environment. Furthermore no companies said they had experienced any conflict between staff, even
though one Coloured EAP-owner said there must be such incidences and one White woman also mentioned that she was
sure there was but not in her department. There appears to be no anti- racial/sexist discrimination policies or officers, a
different story to the universities (see Section 5.4.2). The big companies have Codes of Conduct (Golder, whose policy
only touches upon anti-discrimination in an indirect way) or transformation mission statements (Aurecon) but there seems
little formal framework within which to transform. A source at Golder, who wished to remain anonymous, said the
transformation policy could be “beefed up.”
Aurecon, another engineering and environmental services EAP, has a BBBEE level of 4, with a procurement preference
level of 100%. According to their website they were adjudicated as one of South Africa’s top empowered companies by
the Impumelelo Research Department in 2009, who classify companies as being “top empowered” according to the criteria
of being compliant with BBBEE, on financial criteria, and having a triple bottom line and only for companies with a turnover
more than R10 million. The Aurecon website shows no transformation policy per se, however, simply the usual reference
to BBBEE certification. Aurecon spends the legal amount of turnover that must be spent on skills development, but it is not
clear if they have additional HDI educational and transformation programmes.
Very few companies gave clear indications of how they invest in skills development or if there was any additional training
for HDI advancement. Most said they had induction programmes, but not HDI-specific induction. In terms of staff retention
four of the companies interviewed offered ownership incentives, two mentioned that the EAP “paid their staff well”, one
said it was the biggest engineering firm in the country (this was seen as an incentive in itself). Both the 100% black-owned
and 100% women-owned EAPs said they did not have a big problem with staff retention. In fact, although people had
been headhunted in their firms, they had chosen to stay with the company.
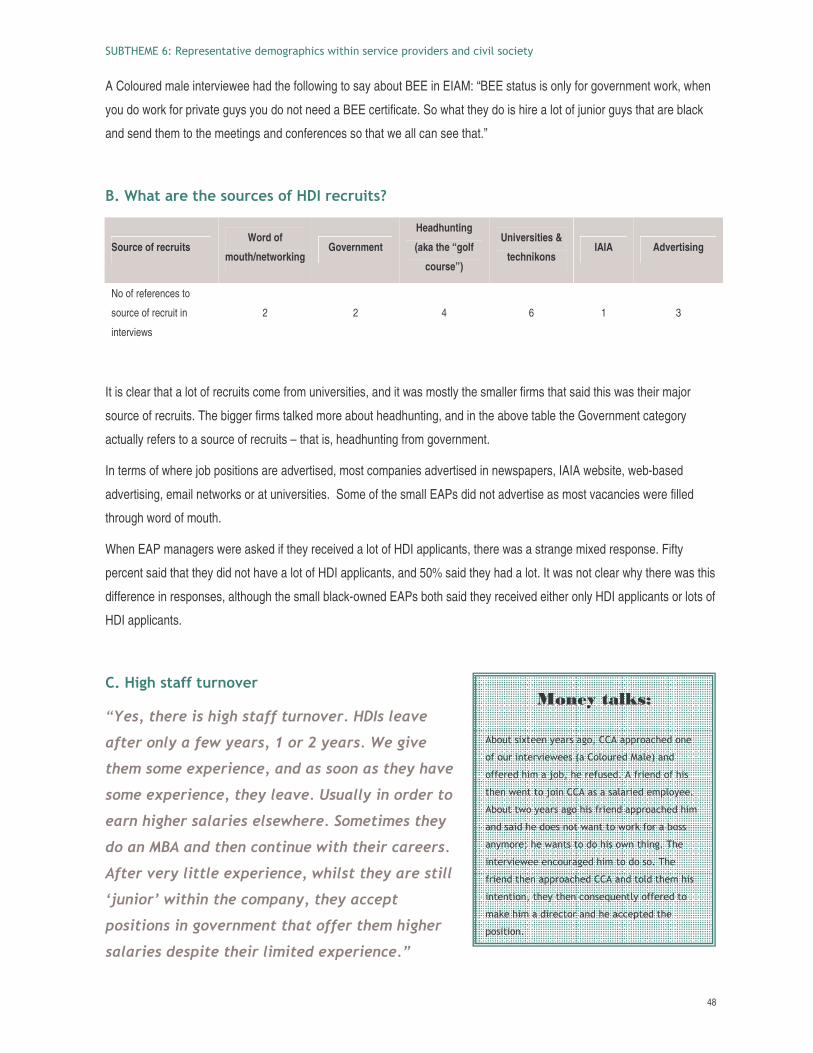
������������ ��������������� ���� ������ �������������� ���������������������������
48
�����������
��� ����!��������������"�##��� ������������
�$�� ����������� ����%��#��� ��������&�����
�$$�������� ���'��"������$ ���(���$�������$�����
������ �������'����##������������������ �����(�
��� ���� ����������������$������� ����������� �
���������������������� �������� ��)�$����������
���� ���*����� ����������������� �������(�����
��������� ������� ��������� ���������(�����
$������������ ��������##��������������� �����
���������"����������������+ �������$$��������
� �)����� ����������������������� ��������
�������(�
A Coloured male interviewee had the following to say about BEE in EIAM: “BEE status is only for government work, when
you do work for private guys you do not need a BEE certificate. So what they do is hire a lot of junior guys that are black
and send them to the meetings and conferences so that we all can see that.”
��C / ! *�!/��",*&��")5 ��*�&*,�!�D
Source of recruits Word of
mouth/networking Government
Headhunting
(aka the “golf
course”)
Universities &
technikons IAIA Advertising
No of references to
source of recruit in
interviews
2 2 4 6 1 3
It is clear that a lot of recruits come from universities, and it was mostly the smaller firms that said this was their major
source of recruits. The bigger firms talked more about headhunting, and in the above table the Government category
actually refers to a source of recruits – that is, headhunting from government.
In terms of where job positions are advertised, most companies advertised in newspapers, IAIA website, web-based
advertising, email networks or at universities. Some of the small EAPs did not advertise as most vacancies were filled
through word of mouth.
When EAP managers were asked if they received a lot of HDI applicants, there was a strange mixed response. Fifty
percent said that they did not have a lot of HDI applicants, and 50% said they had a lot. It was not clear why there was this
difference in responses, although the small black-owned EAPs both said they received either only HDI applicants or lots of
HDI applicants.
��5 ��/�! ))!,*#"-�*
������������������������ �������������������
���������������� ����������������������� �����
���� ���� ��������������������������������������
��� ������������������������� � ����������������
����������������������� ������!�� ��� ��������
������" #$��������������� ��� ����������������
$���������������������������� �������������������
%& ���'�� ����������� ������������������
���������������� ������������������� ������
���������������������� ��������������(�
������������ ��������������� ���� ������ �������������� ���������������������������
49
)$ ������������� ��*�
It is not known to what extent the above situation regarding competency in government departments is accurate. An intern
(Coloured Male) at BotSoc stated:
<� #'")+ '%��*��# ��+ �� *��!, !�"#/ -� !!��!�$!")����#�!/ !!/�'/ -���!/�*
.��#E�#�))�&!E,��$.'!/�&"+ % #'E1 /"/ ���-�#!/�+ ?".1 �!/��!!��!"#"
$�*�&!*�� !�"#!"!/��*4, ��)�& !�"# #$/ �#"�#!�*��!�#�#-"�-�#�!/�+ .�'"#$
1 / !��#�&��� *'!"� *#<���&*�$�!�=��/�'/ -�.��#%,!�#!"+ # ��+ �#!
%"��!�"#�.�'"#$!/��*&,**�#!& % .���!'E"#&� � �#)"*���%,*%"����=
It has also been said during interviews that EAPs headhunt from government and place HDIs in positions higher than they
are qualified for, in order to fulfil BEE quotas. This controversial perception has implications for the competence of the
environmental sector at large. Are HDIs being put into senior positions without the adequate levels of skills and
qualifications, to the expense of management at large? It was not possible to evaluate the accuracy of this without a wider
study on management efficacy over time since BEE. Looking in the literature for answers, the HSRC survey (2007) on
biodiversity qualifications, which has very close ties with the EIA&M skills set and is probably the same labour market,
mentioned that due to the skills shortage there is a trend shown by analysis of employment data at the national level for
lower qualification being hired. The reasons behind this were not known definitively.
It was noted that in many EE policies, there was an emphasis on hiring HDIs under the strict criteria of skills and ability to
perform the job. Interviewees within EAPs all claimed that they selected candidates based on skills alone but if there were
two individuals with the same set of skills and one was Black and one White, they would preferentially pick the Black
candidate for improving BEE targets.
<�� &F�! ))!,*#"-�*�� .",!�'� *�G .� &F%�"%����!/� $/,#!�$)"*.���! !,��=
Every single EAP, from every gender and race, who were asked if they had had staff leaving their organization and why,
answered that they had had people leave, and it was for better pay at a different organization, except one. One
respondent said that the employee left for a “better position” (which could mean that it was a career path development
move that was made by that particular employee).
The finance company included as a comparative point showed that there are similar issues in the Finance sector,
including headhunting and high staff turnover.
The HSRC study (2009) pointed out an interesting perception that job-hopping in South Africa may not be related to BEE
as perceived by the South Africa culture, but may be indicative of a global trend on “job-shopping” (searching for higher
salaries and status) within the younger generation (Kotze & Roodt, 2005, cited in HSRC 2009). However interviews done
during the HSRC study (2009) also referred to Blacks as being regarded as more mobile; and that companies report that
they leave as soon as they get recruited, with associated loss of returns on training (HSRC 2009). Although the
biodiversity pipeline in 2007 had just under 1 000 honours graduates (54% black) and 500 master’s (46% black) available
������������ ��������������� ���� ������ �������������� ���������������������������
50
to the entire economy (in terms of Biodiversity degrees), the limited supply patterns suggest that there is competition from
other sectors and that “those blacks who are acquiring biodiversity related master’s and honours degrees are either not
attracted to the sector for a range of reasons, or the sector present barriers to their entry.” (HSRC 2009).
��C "+ �#�#�� �
Five out of the 8 EAPs interviewed had no gender policy, and others just referred to their Employment Equity plan as their
gender policy. Five of the 10 EAPs, when asked about their gender ratios, estimated a high proportion of women in the
company but we did not have demographic profiles of these EAPs to test these estimations. The Engineering-focused
EAPs had far fewer women in their companies due to the male-dominated nature of this profession. Only one EAP, when
asked about their policy for young mothers’ needs in the work place, gave some indication of what the company offered as
a solution for the difficulties face by young mothers – “Legally they are not allowed to be excluded. The company does
offer flexible working hours and tries to accommodate staff who take maternity leave and subsequently wish to restructure
their working hours.” The other managers simply indicated they did not discriminate against mothers.
A female white senior consultant at a females-only EAP said there was a serious challenge for women “dealing with a
male-dominated industry.”
Limitations:
One of the crucial elements missing from this study is a set of private and confidential interviews with EAP employees to
determine the actual reality within the work place and how effectively policies filter down to the ground level. Some
interviewees expressed that their work environment was conducive “to a certain extent” but could not be drawn out as to
the room for improvement.
���F�����& *&�!'
<� #�, ��&"#)�$�#&� #$1 *�!�#��F����")#"#H�#����/�%� F�#�%*")����"# ���#!�*�#�
!/�����+ *F�!��+ �!!/��*$���* .���!'�#!/����&!"*�=:�,*�&"#�#!�*-��1 ��;
<7 , ��)�& !�"#�)*"+ #"!�"%"%,� *,#�-�*��!������+ !".� . **��* �*�%*���#!
� &F")�(%�*��#&�=:�� &F� ��&"#�,�! #!;�
<A"*+ �4, ��)�& !�"#� *��& *&��#?". %%��& #!��=:C /�!�� ���� + # ��*;
The qualifications most EAPs needed in their staff were: tertiary qualification, people skills and writing skills. EAPs all
indicated that these skills were missing, however it is worth noting that many EIA&M skills, such as holistic thinking and
integrated decision-making, come only on the job, with experience, and graduates fresh from an academic environment
could hardly be expected to have developed these skills yet. It remains to be determined to what extent senior level HDIs
have skill deficits. Many of the successful consultants had received training and mentoring, through a variety of channels
(including on the job training).
������������ ��������������� ���� ������ �������������� ���������������������������
51
Interestingly, again the HSRC survey (2009) showed the same parallels. It is worth noting here that the HSRC survey
(2009) was only read after this report’s study had been completed, and thus this report had no pre-conceived ideas, so the
parallels between the studies show good triangulation of the issues. In terms of skills, employers wanted “soft skills” like
people skills and writing skills, but graduates did not have these, indicating “an unreasonable expectation on the part of
employers” (HSRC 2009).
This report refers to SubTheme 8 for further details on scarce skills required for the EIA&M sector.
A���!1 "*F�#� #$C /"�",�#"1 �0
The majority of interviewees referred to networking as one of the main drivers of work, recruiting, and referrals. Of the 9
EAPs interviewed about how they got work or how they found recruits, most (5) mentioned contacts, networking or
referrals in their answers. Although many of the larger companies get work through tenders, all of them referred to work
also being acquired through networking, and the smaller companies seem to emphasize this. As one small EAP said:
“Planners (private planners) who know us would use us, and recommend us. So when someone comes to get a
development plan, they get referred to us.”
The importance of networks for jobs and study, and the exclusion of these networks to some demographic groups was
also noted in the HSRC study (2009). Please see the Section 5.8.1 Section C Networking too.
� ��/�*"��")�&/""��#$�-��"%�#�!/�������&!"*
A Coloured female from the Finance company interviewed mentioned that “Every young person in our community, either
wants to be a lawyer, doctor or accountant, as in our community the people that are most respected are those people and
we get encouraged by our parents.” This viewpoint was picked up in several sectors, including NGOs and from informal
interviews with Coloured communities. It is thus likely that the family perceptions might provide a barrier to the entry of
young students into the Environmental Sector.
All the EAPs mentioned that there was a great lack of promotion of the industry in school and universities. When asked
what could be done to increase representivity in the sector, most EAPs pointed out promoting it in the school environment,
but didn’t mention if their companies were doing this or not. One EAP said EAPs had to <� �!",!!/�*�E+ F�
!/�F�$�1 #!!"$"�!�=
5 ������!* !�"#1 �!/%*")����"# �."$���
Certification for specialists (like SACNASP and EAP SA) involve a two year process and one needs an existing EAP to
sponsor the applicant (as one EAP said, “to the old boys club!”) There is a need to help new EAPs and new companies
that are not part of “inner club” get registered.
������������ ��������������� ���� ������ �������������� ���������������������������
52
Black EAPs have also expressed concern that “they will make it 3 times harder for us to be accredited, I have done 134
EIA's in 16 years, yet it will be very difficult for me to get board accreditation, especially without a PhD.”
The high emphasis on qualifications for EAP and specialist registration for bodies like EAPSA and SACNASP means that
transformation will be forced to an even slower pace as it is clear from the data that Blacks do not have higher level
degrees at tertiary level. Many environmentalists say they did not get the chance to go to university but still are qualified to
engage in EIAs due to their great experience and provision of mentorship by colleagues.
���%�&� ���!�
Small firms call upon a network of a range of specialists that they contract to provide advice on their EIAs, mostly White
individuals whom they know. The current criteria used in sourcing specialists are (according to one interviewee):
• Qualifications
• Know them – know their work and reputation
• Experience and quality of work
• Certification of specialists – need a sponsor to be on this body
EAPs were unwilling to share their specialist lists.
One black specialist interviewed in the Eastern Cape is involved in free lance work, particularly working with communities
and says he gets most of his work through contacts in the NGO sector. He is in fact one of the most well-connected
people to speak to regarding rural community empowerment in the Eastern Cape. He is very committed, even to the
extent of refusing well-remunerated job offers to do alternative work in order to continue doing the work he believes in,
even though he has a family to support. He has been involved in EIAs as a public participation specialist, involving
communities in EIA processes around waste management.
24 In terms of the value of networking and developing contacts, it is noteworthy that in the collection of statistical data from organizations, those organizations which provided the stats most quickly and efficiently, were those the Green Connection had contacts in!
�������������������������������������������
������,���������-�������� ����� ���,��������-��� ��������������. ����������� ������� ������� ������/�� ������(�0�������������������
����������������,��� �����(���� ������������������$$���������$��� �����"�������� ������������������� �����������������������$�����
���$$�1�2�$�� �����3�#��� ��������4�. ����(������������� ����������� ���$ �����"������ ������������ ������������������ ���(�
�! ��������������������������� ����������$$���)��������� ������$��5����������������������'����������� �������������������)���������
���! ��������� ����������5������ ���������������������$�� �������������������������������������'��(����$$������ ��������� ����������
������6�����(�����#�� �������������� ����������������� �� �������� �����"��������� ��������������� ����������������� "��� �������)��
���������� ������� �������������������������! �������(��
������,������������������ �������� ��)��������������)������������ ���������������5��"������������� ������$��������� ������
� ������ ����1��(�("������$�������������� ��)��� ����������������$��5���$���7� ���$����������������������� ������� ���������������-�*�
�����������������������������$��� ��� �������$������������ ���������������� �����������$������������� ��������� �%�� ������� ����$��� �
���� �������������8�� ������������������������$����5��"����&(�
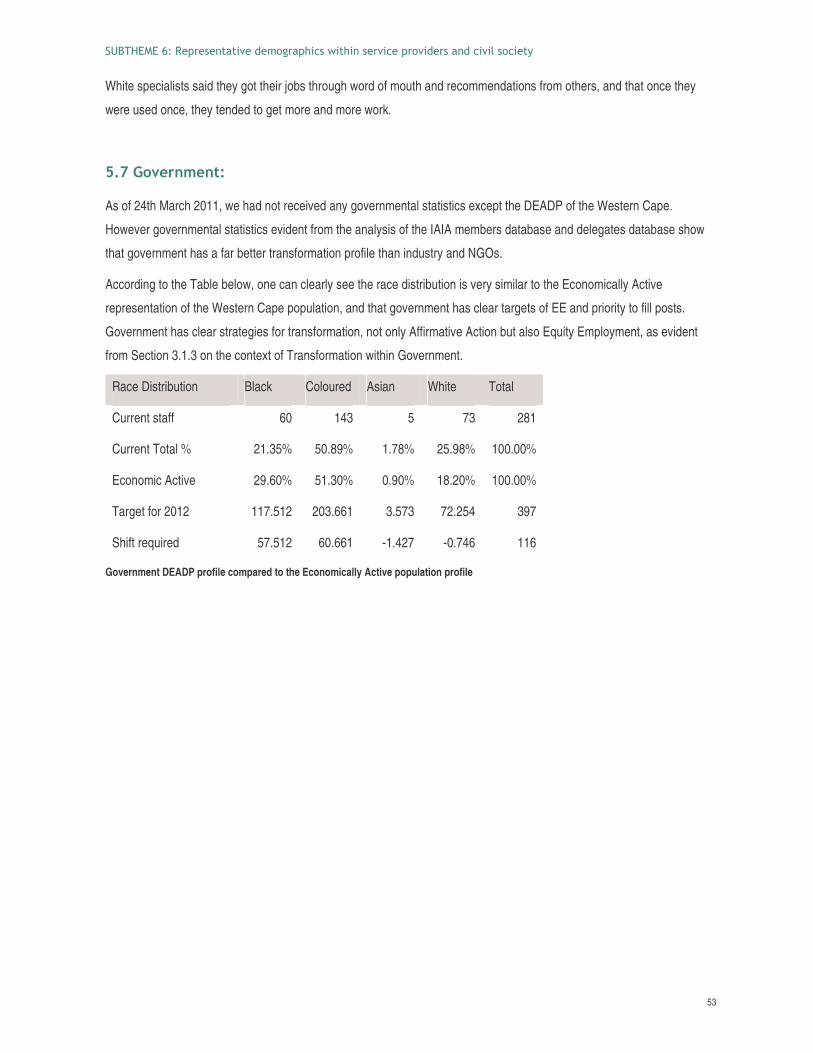
������������ ��������������� ���� ������ �������������� ���������������������������
53
White specialists said they got their jobs through word of mouth and recommendations from others, and that once they
were used once, they tended to get more and more work.
2�@� "-�*#+ �#!
As of 24th March 2011, we had not received any governmental statistics except the DEADP of the Western Cape.
However governmental statistics evident from the analysis of the IAIA members database and delegates database show
that government has a far better transformation profile than industry and NGOs.
According to the Table below, one can clearly see the race distribution is very similar to the Economically Active
representation of the Western Cape population, and that government has clear targets of EE and priority to fill posts.
Government has clear strategies for transformation, not only Affirmative Action but also Equity Employment, as evident
from Section 3.1.3 on the context of Transformation within Government.
Race Distribution Black Coloured Asian White Total
Current staff 60 143 5 73 281
Current Total % 21.35% 50.89% 1.78% 25.98% 100.00%
Economic Active 29.60% 51.30% 0.90% 18.20% 100.00%
Target for 2012 117.512 203.661 3.573 72.254 397
Shift required 57.512 60.661 -1.427 -0.746 116
Government DEADP profile compared to the Economically Active population profile
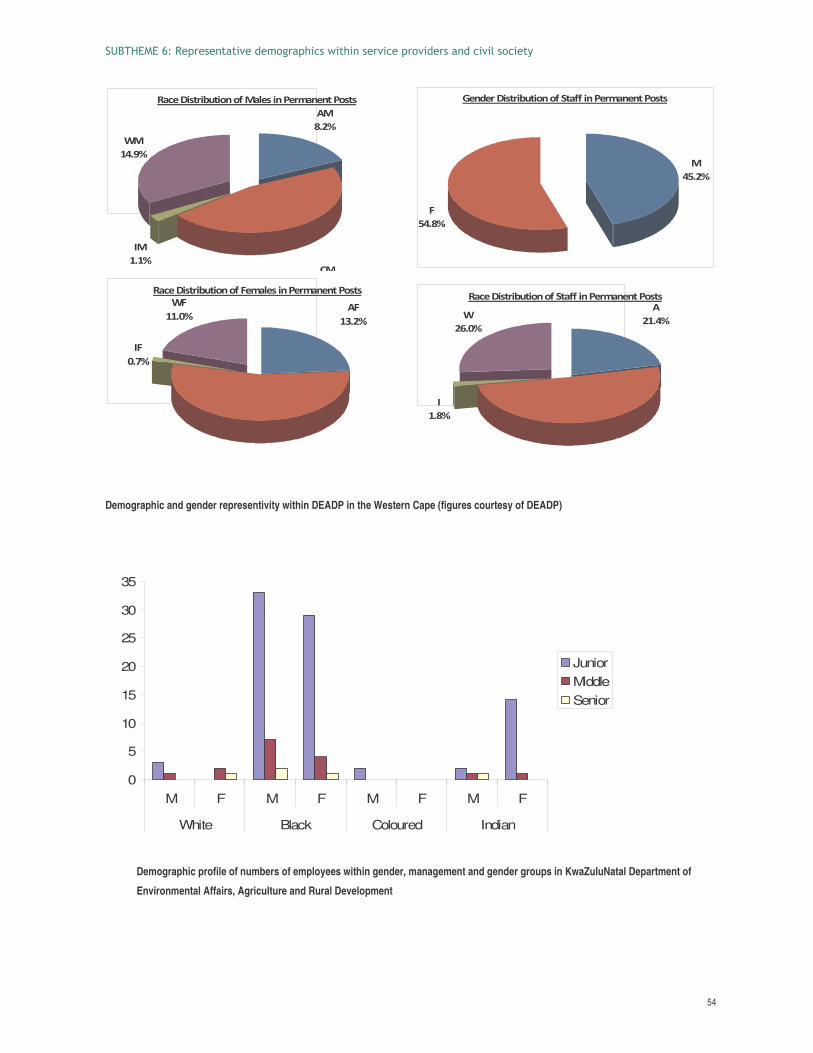
������������ ��������������� ���� ������ �������������� ���������������������������
54
Demographic and gender representivity within DEADP in the Western Cape (figures courtesy of DEADP)
0
5
10
15
20
25
30
35
M F M F M F M F
White Black Coloured Indian
JuniorMiddleSenior
Demographic profile of numbers of employees within gender, management and gender groups in KwaZuluNatal Department of
Environmental Affairs, Agriculture and Rural Development
�������������� ��������!����������� ����������
�
"#$%&
'
#"$(&
) ��������� ��������!����������� �����������
%*$"&
+
*$(&
,
%-$.&
) ��������� ������������������� ����������
��
($%&
��
+�
*$*&
,�
*"$/&
) ��������� ��������'�� ���������� ����������
�'
*0$%&
�'
+'
.$1&
,'
**$.&
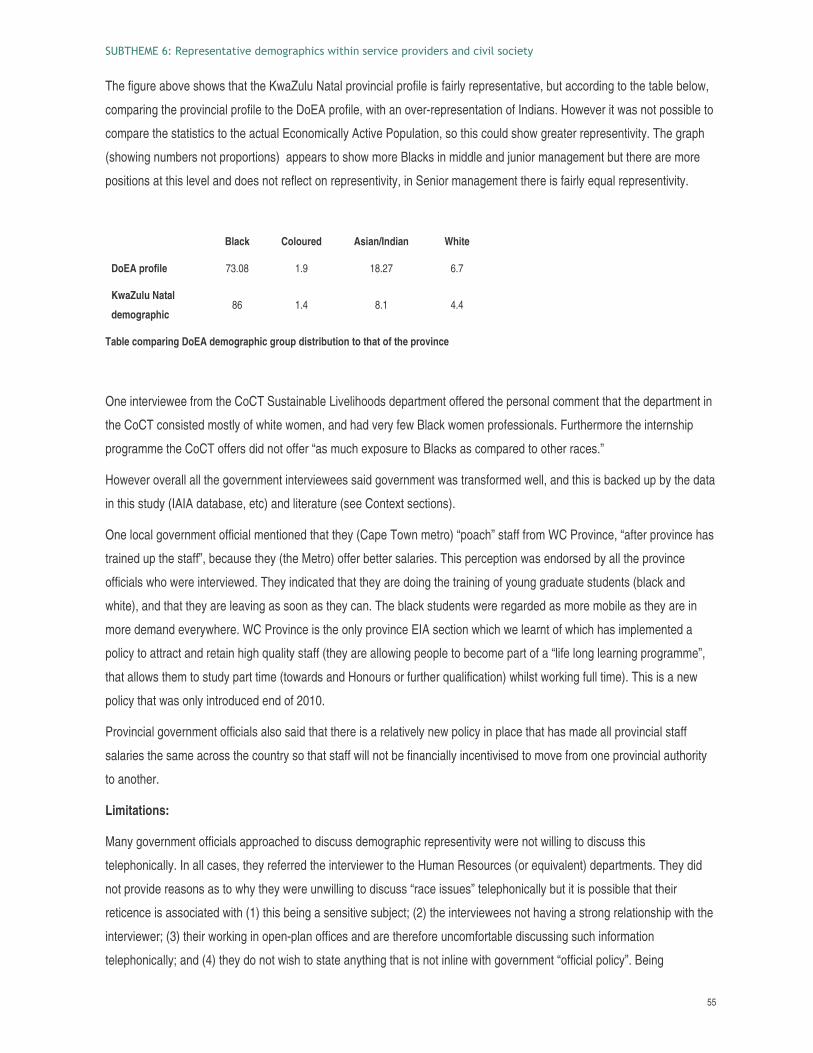
������������ ��������������� ���� ������ �������������� ���������������������������
55
The figure above shows that the KwaZulu Natal provincial profile is fairly representative, but according to the table below,
comparing the provincial profile to the DoEA profile, with an over-representation of Indians. However it was not possible to
compare the statistics to the actual Economically Active Population, so this could show greater representivity. The graph
(showing numbers not proportions) appears to show more Blacks in middle and junior management but there are more
positions at this level and does not reflect on representivity, in Senior management there is fairly equal representivity.
Black Coloured Asian/Indian White
DoEA profile 73.08 1.9 18.27 6.7
KwaZulu Natal
demographic 86 1.4 8.1 4.4
Table comparing DoEA demographic group distribution to that of the province
One interviewee from the CoCT Sustainable Livelihoods department offered the personal comment that the department in
the CoCT consisted mostly of white women, and had very few Black women professionals. Furthermore the internship
programme the CoCT offers did not offer “as much exposure to Blacks as compared to other races.”
However overall all the government interviewees said government was transformed well, and this is backed up by the data
in this study (IAIA database, etc) and literature (see Context sections).
One local government official mentioned that they (Cape Town metro) “poach” staff from WC Province, “after province has
trained up the staff”, because they (the Metro) offer better salaries. This perception was endorsed by all the province
officials who were interviewed. They indicated that they are doing the training of young graduate students (black and
white), and that they are leaving as soon as they can. The black students were regarded as more mobile as they are in
more demand everywhere. WC Province is the only province EIA section which we learnt of which has implemented a
policy to attract and retain high quality staff (they are allowing people to become part of a “life long learning programme”,
that allows them to study part time (towards and Honours or further qualification) whilst working full time). This is a new
policy that was only introduced end of 2010.
Provincial government officials also said that there is a relatively new policy in place that has made all provincial staff
salaries the same across the country so that staff will not be financially incentivised to move from one provincial authority
to another.
Limitations:
Many government officials approached to discuss demographic representivity were not willing to discuss this
telephonically. In all cases, they referred the interviewer to the Human Resources (or equivalent) departments. They did
not provide reasons as to why they were unwilling to discuss “race issues” telephonically but it is possible that their
reticence is associated with (1) this being a sensitive subject; (2) the interviewees not having a strong relationship with the
interviewer; (3) their working in open-plan offices and are therefore uncomfortable discussing such information
telephonically; and (4) they do not wish to state anything that is not inline with government “official policy”. Being
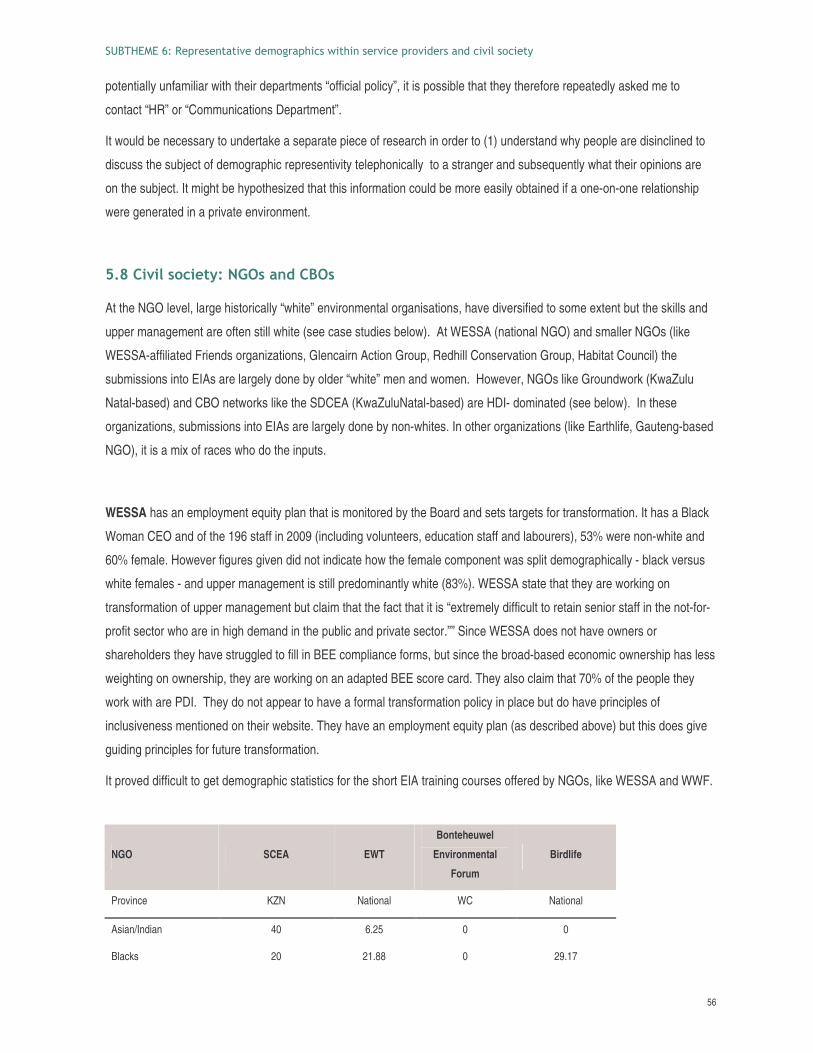
������������ ��������������� ���� ������ �������������� ���������������������������
56
potentially unfamiliar with their departments “official policy”, it is possible that they therefore repeatedly asked me to
contact “HR” or “Communications Department”.
It would be necessary to undertake a separate piece of research in order to (1) understand why people are disinclined to
discuss the subject of demographic representivity telephonically to a stranger and subsequently what their opinions are
on the subject. It might be hypothesized that this information could be more easily obtained if a one-on-one relationship
were generated in a private environment.
2�>��-���"&��!'���� #$����
At the NGO level, large historically “white” environmental organisations, have diversified to some extent but the skills and
upper management are often still white (see case studies below). At WESSA (national NGO) and smaller NGOs (like
WESSA-affiliated Friends organizations, Glencairn Action Group, Redhill Conservation Group, Habitat Council) the
submissions into EIAs are largely done by older “white” men and women. However, NGOs like Groundwork (KwaZulu
Natal-based) and CBO networks like the SDCEA (KwaZuluNatal-based) are HDI- dominated (see below). In these
organizations, submissions into EIAs are largely done by non-whites. In other organizations (like Earthlife, Gauteng-based
NGO), it is a mix of races who do the inputs.
WESSA has an employment equity plan that is monitored by the Board and sets targets for transformation. It has a Black
Woman CEO and of the 196 staff in 2009 (including volunteers, education staff and labourers), 53% were non-white and
60% female. However figures given did not indicate how the female component was split demographically - black versus
white females - and upper management is still predominantly white (83%). WESSA state that they are working on
transformation of upper management but claim that the fact that it is “extremely difficult to retain senior staff in the not-for-
profit sector who are in high demand in the public and private sector.”” Since WESSA does not have owners or
shareholders they have struggled to fill in BEE compliance forms, but since the broad-based economic ownership has less
weighting on ownership, they are working on an adapted BEE score card. They also claim that 70% of the people they
work with are PDI. They do not appear to have a formal transformation policy in place but do have principles of
inclusiveness mentioned on their website. They have an employment equity plan (as described above) but this does give
guiding principles for future transformation.
It proved difficult to get demographic statistics for the short EIA training courses offered by NGOs, like WESSA and WWF.
NGO SCEA EWT
Bonteheuwel
Environmental
Forum
Birdlife
Province KZN National WC National
Asian/Indian 40 6.25 0 0
Blacks 20 21.88 0 29.17
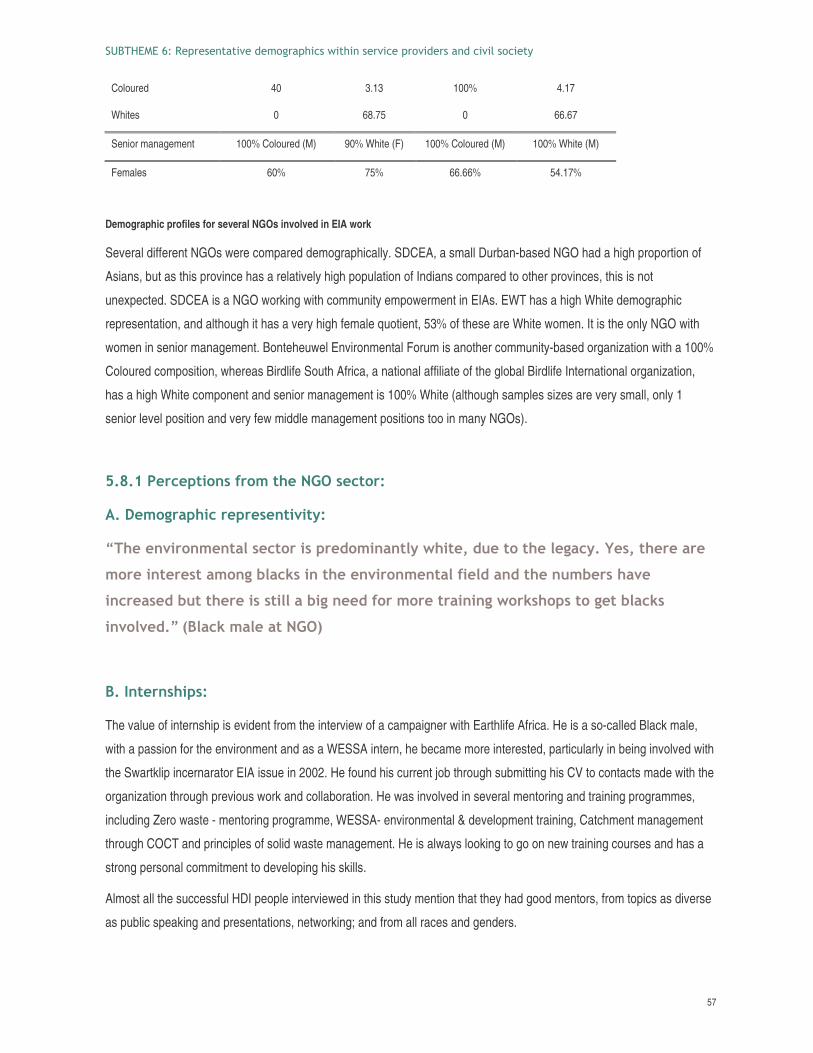
������������ ��������������� ���� ������ �������������� ���������������������������
57
Coloured 40 3.13 100% 4.17
Whites 0 68.75 0 66.67
Senior management 100% Coloured (M) 90% White (F) 100% Coloured (M) 100% White (M)
Females 60% 75% 66.66% 54.17%
Demographic profiles for several NGOs involved in EIA work
Several different NGOs were compared demographically. SDCEA, a small Durban-based NGO had a high proportion of
Asians, but as this province has a relatively high population of Indians compared to other provinces, this is not
unexpected. SDCEA is a NGO working with community empowerment in EIAs. EWT has a high White demographic
representation, and although it has a very high female quotient, 53% of these are White women. It is the only NGO with
women in senior management. Bonteheuwel Environmental Forum is another community-based organization with a 100%
Coloured composition, whereas Birdlife South Africa, a national affiliate of the global Birdlife International organization,
has a high White component and senior management is 100% White (although samples sizes are very small, only 1
senior level position and very few middle management positions too in many NGOs).
2�>�� �*&�%!�"#�)*"+ !/������&!"*
����+ "�* %/�&*�%*���#!�-�!'
<�/��#-�*"#+ �#! ���&!"*��%*�$"+ �# #!�'1 /�!�E$,�!"!/���� &'����E!/�*� *�
+ "*��#!�*��! + "#�.� &F��#!/��#-�*"#+ �#! �)���$ #$!/�#,+ .�*�/ -�
�#&*� ��$.,!!/�*����!��� .��#��$)"*+ "*�!* �#�#�1 "*F�/"%�!"��!.� &F�
�#-"�-�$�= :�� &F+ �� !���;
���#!�*#�/�%�
The value of internship is evident from the interview of a campaigner with Earthlife Africa. He is a so-called Black male,
with a passion for the environment and as a WESSA intern, he became more interested, particularly in being involved with
the Swartklip incernarator EIA issue in 2002. He found his current job through submitting his CV to contacts made with the
organization through previous work and collaboration. He was involved in several mentoring and training programmes,
including Zero waste - mentoring programme, WESSA- environmental & development training, Catchment management
through COCT and principles of solid waste management. He is always looking to go on new training courses and has a
strong personal commitment to developing his skills.
Almost all the successful HDI people interviewed in this study mention that they had good mentors, from topics as diverse
as public speaking and presentations, networking; and from all races and genders.
������������ ��������������� ���� ������ �������������� ���������������������������
58
“Consultants in general have to take on the role of mentoring - have to change their mindset about it being a job, it must
be a vocation.” (NGO White female Director).
����!1 "*F�#�
A senior manager of an environmental NGO also maintains that:
<��"!!/�?"..�& ,��")1 /"�F#"1 ��"+ + ,#�!'1 "*F #$#�!1 "*F�#�1 �#��$�$�#
!/��%"��!�"#.,! � .� &F1 "+ #�$�&�$�$#"!!".� 1 �#$"1 $*����*�=
The majority of interviewees said that they got their work through networking, referrals, contacts, some found work through
tenders, others through adverts in newspapers or web-based advertising (often through email networks).
One interviewee said 9�!�� .",!1 /"'",F#"1 �=
“Blacks [HDIs] do not get the same opportunities.” […in terms of networking and attending workshops and conferences.]”
Out of all the interviews who mentioned how they got their own jobs, two thirds said it was through who they knew, or
contacts. Six interviewees out of the 9 who referred to networking or were asked, said networking was important, three
said HDIs had less contacts and three said they had more, but this discrepancy was likely a result of which sector
interviewees were referring to. Black professionals, according to interviewees, tended to have more contacts in
government, whereas it is likely that young HDIs fresh out university, or in junior positions with limited access to networks,
and resources for attending workshops and conferences, have less chance to develop contacts.
���! ))!,*#"-�*
9�/�*����"!�").���! ))!,*#"-�*�#!/��#�*�' #$&��+ !���&!"*H% *!�&,� *�'
.�& ,��!/�*���#"% ���"#)"*!/��#-�*"#+ �#!�=�%����)�� ������������������ ������
: ; < &�
WESSA, as pointed out before, mentions the loss of Black experienced personnel to higher paying salaries in the private
sector.
���F�����& *&�!'
NGO personnel said that the skills needed for EIA&M were experience, passion, drive, commitment, and EIA knowledge.
Interestingly, four of the successful EIA HDI interviewees were not originally trained in the environmental sector but
through exposure to it became passionate and wanted to further theirs career in it. A local authority Environmental
Assistant Officer became more interested in the EIA sector after doing the EE Learnership course at WESSA in 2008.
������������ ��������������� ���� ������ �������������� ���������������������������
59
Another case study is that of a Black male working in a government Compliance department who was initially in the
chemical industry before being headhunted to government. As he did a Chemistry degree (in University of KZN), this
specifically involves compulsory experiential training in a company and after graduating one gets a 2 year contract. (a
similar process happens in technikons). He makes reference to a mentor and exchange training programmes in facilitating
his career development. He is enthusiastic about getting new training and innovative.
Environmental NGOs said they struggled to find people with the right skills for some posts.
One Black woman was involved in the environmental club at High School and was passionate about the environment. All
of the interviewees expressed in one way or another, their passion for their environment and that this was a major
requirement for bringing people into the environmental sector.
A� *"+ "!�#� 1 *�#���")���6 �
The majority of interviewees across disciplines in the NGO sector said school did not do enough to raise awareness of
environmental issues, sustainability, environmental rights or the career marketing.
+, �����������������������������������& �����-������� ��������� ������� �������
������&������. ������ ����� �����-�������� �� ������������������������������ ��/ ���
��� ���������������������������0�������� ���������� �������� �����������������
�������&�1����������������� ����������(�(Freelance black male with multifaceted environmental
experience, including EIAs)
“Black people must be interested in information and the environment. Don’t push people specifically in the environmental
sector.” One comment from a Black male in the environmental sector is very thought-provoking. It is backed up by the
focus group conclusions, which suggest that incentives are not the way to retain employees (see Reasons Section).
<C � *�+ ����#�/"1 ",*$�+ "&* &'��1 "*F�#���)%�"%�� *� 1 *�")$�))�*�#!
������ !�"#E�!1 ",�$�% *F�#!�*��! #$+ F�!/�+ &!�-�� �"%��$"#9!F#"1 !/��*
*��/!��=:�� &F)�+ ���# ���;
2�I�+ %"1 �*+ �#!")&"+ + ,#�!���!"�#� ���#����
Historically there has been an unequal distribution of education and resources between the different races of South Africa.
This has meant that when EIAs are done, there is far more need for effective public participation for non-white
communities than that needed for white communities. Most of the marginalized communities in South Africa are not white.
Subtheme 7 deals with effective participation and the barriers and recommendations, but it is of relevance within this
report to note what stakeholders in public participation have been saying during interviews and draw upon some
preliminary recommendations:
������������ ��������������� ���� ������ �������������� ���������������������������
60
• “The community's level of understanding is based on people’s social and economic positions. With regard to EIAs
they do not look at long-term impacts - only jobs.” (At least 5 interviewees noted this trend)
This means that the public will not be focused on sustainability but due to the nature of their circumstances
(many unemployed, poverty levels high), they will be focused on supporting the development and its usually
short-term jobs. A case study is that of the fracking proposal in the Karoo which is currently stirring up many
Karoo inhabitants. According to an anonymous source in the white farming community, public meetings were
held which turned out to be “gatherings”, not meetings, and held no apparent purpose. No questions were posed
or answered, the consultants just “stood there”. It then turned into political gathering with no attempt on behalf of
the consultants to stop this. The HDI community, who are poor and see no long term benefit to themselves of
preserving groundwater integrity in the water-scarce Karoo, were concerned that the Whites were stopping them
from getting employment by stopping the development and formed a toyi-toyi chain in the gathering.
Recommendation: There is a vital need for holistically thinking consultants and EAPs. We cannot externalize the
source of jobs developments bring but there is a vital need to empower communities with knowledge, so they can
weigh up long term impacts (such as losing permanent jobs when farmers leave the area due to water
contamination by fracking – as has been shown to have happened in the US) compared to short-term jobs (many
of which, in this case, would need skilled people, not local labour). All marginalized communities need to have
access to facilitators who can work within established social techniques (such as PRA) to build their capacity to
respond to EIAs. All communities need some educational activities, including raising their awareness of
environmental rights and the crosscutting nature of environmental issues in their daily lives.
• Judging from our searches for specialists to interview, there are few black specialists though we could not
acquire statistics on this fact due to several factors (see Limitation). However many of the white specialists
tended to come from a strongly scientific and academic background, which is not a conducive qualification for
engaging with local stakeholders. There is a shortage of communication skills within the scientific sector (pers.
obs., and from interviews with social development organizations), which would mean the need to capacitate
specialists to be able to share results and ideas with communities (even before assessments are done), to
ensure meaningful public participation and stakeholder engagement.
• It can even be concluded that the current poor public participation process is not based on transformation
principles or Batho pele principles, as very little attempt is made by EAPs and government to use the right
processes to include communities or to empower them to be able to act for themselves (based on assessment of
interviews conducted in ST7). “SEIA is a complex form of impact assessment, and the role of the community in
the assessment should never be under-estimated. All communities should be treated with respect and from the
basis that the said community is a unique social structure with characteristics similar, but not identical, to other
communities made up from similar social fabric.” (Integrated environmental management information series,
Socio-Economic Impact Assessment, DEAT 2006).
• In order to ensure demographic representivity within marginalized communities participating in EIAS, there needs
to be an empowerment program, where local NGOs, experienced organizations and other CBOs who are
������������ ��������������� ���� ������ �������������� ���������������������������
61
acquainted with the issues can engage local municipalities and development officers, and empower communities
with the knowledge they need to effectively engage and make decisions. The organizations and individuals can
be chosen by the communities to do the detail work, including reviewing specialist studies and informing them of
the issues. Although this would require funding from government or a central EAP-sponsored fund (as part of the
public participation budget from the particular EIA contract), it is an essential transformation strategy needing
serious attention. There should also be a budget set aside in the IDP fund for engagement with EIAs (interviews
with NGOs).
• SubTheme 7 (Green Connection 2011) provides effective recommendations to engage with communities,
including using educated champions from within the community, developing better channels of communication
and restructuring the participation process.
• One potential resource tool could be a database set up of all the NGOs, private individuals and government
officials who are available to do work on helping communities participate in EIAs. A community can apply and
based on resources, will be subsidized on their organization of choice. But relatively well-off communities need to
have access to this dataset too, so that they too can engage NGOs to help them participate meaningfully. Many
well-off communities also do not have the capacity, but they do have the resources to hire one of these
companies. For example, Green Connection has helped Riebeek West to review EIA reports and assessments
and build their capacity to engage effectively in the PPC EIA conducted there.
2��8A�"1 ")�+ %�"'��� &*"����&!"*�
According to a researcher who worked in UCT’s Career Development Programme, close to graduation companies come
to the university to talk to students. They also set up a stand at the campus, like an exhibition, and interested students will
ask questions, etc, and give out their CVs. This is verified by several EAPs saying they went to universities and technikons
to source student graduates. Other students receive bursaries and scholarships to study further, and the rest go out and
apply for jobs, sending out their CVs.
Graduates however said that it was very hard to find work, as employers wanted experience ad they did not have any yet.
The two interns interviewed said working at their respective organizations in their internship was an opportunity to get
work experience and the one intern said once he had experience, he would look for a better job elsewhere. A number of
government departments and NGOs (see Education Development Programs Appendix 3) offer internships within their
organizations or internship placement within small NGOs, and it is likely that these organizations thus spend resources (or
donor funding) on training up the graduate labour force.
Several interviewees pointed to the fact that small EAPS “don’t have recruitment drive to take on lots of inexperienced
HDIs and train/mentor them - larger firms can do this.” Government also takes on young graduates and gives them jobs.
“Government also does this – takes officials directly out of ‘tertiary training’” (EAP interviewee). However the reality is that
larger EAPs can afford to make a play for smaller EAP’s and government’s ready-trained staff, and smaller EAPs could
only afford people from university with no experience and thus not expecting high salaries. Thus the burden of training
������������ ��������������� ���� ������ �������������� ���������������������������
62
non-intern recruits appears to fall on smaller companies. However big EAPs (with turnovers of over R5million) also can
afford to, and do, take on training and skills development of blacks across all levels, they have the capacity to absorb the
costs of training. Within the middle management sector government seems to be one of the sources of trained personnel
for the EAP market – government offers young graduates fresh from university with no experience jobs, they are trained
and then big EAPs offer them higher salaries to work for them. Several EAPs claim to headhunt trained people from
government, which in effect results in a “brain drain” from government, causing loss in institutional memory and the need
to retrain new recruits from scratch. It might suit the environmental industry as a whole for government to be a training
ground for Blacks, but it causes an unstable EIA&M sector in government, with repercussions for sustainable development
in this country.
2����,+ + *�B�$*��,�!�)*"+ ��+ "�* %/�&�! !,�7 ," # �'���
Demographic profile across sectors in time and space:
These results are informed by the data analysis and interviews and are thus confined to the limitations discussed in the
methodology. However due to the many parallels drawn across from this study to others of very similar nature and the
high correspondence between many different databases, we can develop these conclusions with a fairly high degree of
confidence
1. EIA&M (as represented by IAIA and other organizations) is not demographically representative and there remains a disproportionate number of Whites in the sector relative to the national population demography profile.
2. There is not uniform distribution of EIA&M service providers and civil society across provinces, in terms of demographic group and gender:
• Within areas with a higher provincial demographic population of Blacks, IAIA had more Black members as compared to Black membership proportions in other provinces
• Gender representivity differed widely within provinces and demographic groups: the Eastern Cape membership had more Coloured Females than Coloured males, Free State has poor Coloured and Black female representivity, KwaZuluNatal has high women representivity in all demographic groups except Whites, Limpopo and Mpumulanga have limited White female representivity, Southern Cape has no Black representative of either gender but a very good female Coloured representivity
3. There is unequal demographic representivity across EIA&M sectors: • Most individuals within demographic groups are working within consultancies (the private sector), although a
greater proportion of Whites are consultants (or in EAPs) than other groups. Government positions play a bigger role in Black jobs than in the other demographic groups.
• There is a greater proportion of Whites in NGO jobs relative to the total, than in other demographic groups. • Whites are over-represented in all sectors except government • Asians are under-represented in NGOs , Coloured and Asians are often under-represented in the sectors
4. Within the EIA&M professional registration bodies, there is non-representative demographics in terms of HDI and gender ratios, but candidate categories indicate an increasing HDI membership:
• Whites dominate, especially in the natural sciences bodies (eg SAIEES is 85% White). • Males also dominate except in IAIA (but this is likely because it includes more government representatives) • Coloured males are over-represented compared to Coloured women in Integrated Waste Management and there
are many more White men than White women in SAIEES • Professional categories are White-dominated but Candidate Categories are dominated by Blacks. • Asians are well represented in ECSA but Coloureds need more representivity and Blacks. • The highest proportion of Blacks occurred in a low category level Candidate Engineering Technician, indicating
skills shortages
������������ ��������������� ���� ������ �������������� ���������������������������
63
• IAIA conference delegates showed Blacks representivity is slowly catching up across sectors, except in private sector where whites are highly over-represented.
5. Government involved in EIA&M shows high transformation and gender representivity due to well-structured and commitment to policies and legislation:
• In IAIA conference delegate and membership representivity analyses, in government profiles and from censuses from the literature
6. HDI Education levels relating to EIA&M are improving at the overall undergraduate level but are lacking at postgraduate level and vary widely across universities and disciplines:
• UP – BSc Environmental Science – Greater numbers of Whites, No Coloureds • Few Blacks, especially females, in higher tertiary levels • Engineering – equal Blacks and Whites, more males • Law at NWU - very few Blacks, Coloureds or Asians • UWC - more Blacks and Coloureds than Whites in Applied Geology, Environment and Water Sciences and
Biodiversity and Conservation degrees • Across Environmental Sciences there are increasing Black graduates (more than Whites) and there is an
increase in enrolments • Historically advantaged universities like UCT, produce more PhDs and more White PhDs, whereas historically
disadvantage universities produce more Black Phds but less overall 7. Women are under-represented in environmental higher education relating to EIA&M:
• There are far fewer females in scientific and environmental disciplines in university staff and research chairs • Women produce far fewer doctorates and papers than men in SET • Few women, particularly Black women, in postgraduate levels
8. Demographic representivity in the EIA&M private sector is skewed and transformation is slowed by lack of formal policies or skills development:
• At conferences Whites were far more likely to give talks in disproportion to their representation at the conference, whereas Blacks gave far fewer talks than expected from their representation in numbers at the conference
• Interviews showed lack of skilled applicants (with qualifications and “soft” skills like report-writing, language, people skills)
• There remains a dominance of white males in EAPs, especially senior management, and a predominance of white women in middle management
• There are few structured or formal transformation policies within EAPs but there is an emphasis on BEE strategies and there is an emphasis by management on ownership incentives for retention of BEE targets
• There are few gender policies in place or incentives for women • Little emphasis is placed on skills development of HDIs within EIA&M private sector (but see Arcus Gibbs).
HSRC (2009) says budgets on training have decreased in recent years! 9. Networking is perceived as a crucial skill in EIA&M for gaining work and recognition (high proportion of
interviewees received jobs through this channel as opposed to conventional job vacancy advertising channels) 10. There is perceived high staff turnover of HDIs within the whole EIA&M
• Staff retention strategies are needed. • Perceptions are that passion is needed in environmental career, which is normally a result of exposure to the
environment through mentors or school • Perception is that people leave for better pay • Perception that government is losing institutional memory due to high staff turnover and low salaries (poached by
higher-paying EAPs). This is backed up by data from HSRC 2009. • Perception that NGOs lose HDI staff to private sector as they don’t have resources for high salaries
11. Paucity of information on EIA&M graduate output compared to skills scarcity • Might be a function of unreasonably high expectations of graduates by employers • Might be because graduates are leaving the sector
12. Paucity of information on cultural tension within the EIA&M work environment 13. Soft skills are lacking in education and training programs of EIA&M applicants
• Report-writing, people and language skills needed for EIA&M 14. Little is being done to raise awareness of EIA&M as a career
• Secondary schools have very little environmental information 15. Need for more entrepreneurial skills within EIA&M
• Few black specialists or HDI-owned EAPs in EIA&M
������������ ��������������� ���� ������ �������������� ���������������������������
64
16. NGOs involved in EIA&M show uneven transformation • Big well-established NGOs, like WWF and WESSA still White-dominated in senior management; EWT White-
female majority in senior management • Small CBOs and sustainable development NGOs more representative
3��� �"#� #$*�&"+ + �#$ !�"#�
3���"���"*#"!!"���
Based on the analysis of demographic statistics and interview responses, the private sector is still not representative of
the country’s demographics and within the interviews few of the EAPs were truly black-owned, most had started off as
White-owned and been ‘transformed’ reactively through BEE.
It appears that BBBEE has resulted in HDIs being slotted into quotas in white-owned companies rather than the
development of HDI-originated functional black-owned EAPs which would be a true measure of real transformation in the
sector, (as it would reflect that the capacity and skills were there). One black-owned EAP mentioned he was the only
100% Black EAP in the Western Cape and in fact, in one of the questions asked in all sector interviews, approximately
95% of the interviewees did not know of any black-owned organizations in EIA, and when they did it was often one of the
three interviewed in this study, or were NGOs and CBOs not technically EIA&M. This lack of real transformation is not
likely to improve whilst big firms headhunt with high salaries for the limited pool of skilled black applicants, as there is too
much benefit in a high permanent salary rather than the risks of starting on ones own. However, despite the drive for BEE
and ownership incentives, it appears that there is little effective black-ownership overall.
BBBEE in the EIA&M sector has tended to result in reactive number-representivity, rather than proactive transformation.
“�"+ % #���$"#J! &!, ��'!* #�)"*+ E!/�'��!!/��*#,+ .�*�*��/!)"*!/�����! !,�E
.,!$�$!/�'*� ��'!* #�)"*+ D�"! ! #'")!/�.��&"+ % #�����/�',��*�&*,�!+ �#!
�&/�+ ��!"��!!/��*#,+ .�*�*��/!EK*�#! $ *F��K%/��"�"%/'��%*"+ �#�#! + "#��!
!/���&"+ % #���1 �!/!/����&�*!�)�& !���!��$,�!"!/��"-�*#+ �#!!/ !
!* #�)"*+ !�"#��#"!.��#�),�)����$E!/�����'�!�+ ��%*"H1 /�!�H�!+ F���!-�*'
$�))�&,�!)"*,�!"��!1 "*F)*"+ �"-�*#+ �#!�=:�"�",*�$�� + # ��*;�
According to this interviewee the BBBEE system is advantageous to white firms, as government tenders favour the bigger
firms, and once they have any level of BEE certificate, they are well-placed to get a tender - true HDI ownership is not
weighted enough to compete with the bigger firms’ advantages of being able to quote better prices and with their weight of
expertise and experience. Thus the emerging companies really in need of transformation and work are outquoted and
never get a chance to grow, as BBBEE has meant that they are competing on the same level as much bigger firms with
longer work records and favoured by the past inequalities in the education system and within the economy.
Also BEE cannot be the whole answer to transformation as “BEE status is only of relevance for government work, or for
adding to BEE companies BEE status in terms of value-added suppliers. For private contracting work, it is not relevant.”
Therefore transformation needs to be driven by companies themselves in the private sector.
������������ ��������������� ���� ������ �������������� ���������������������������
65
One of the key emotive issues in BEE and demographic representivity can be summed up by an intern’s words:
<�� #"#H1 /�!��#$�-�$, �E!/�4,��!�"#�#!/�. &F")'",*+ �#$.���!"F#"1 1 /�!/�*'",
/ -�.��#�+ %�"'�$. ��$"#!/�&"�",*")'",*�F�#E"*. ��$"#'",* .���!'��#+ '& ��E�
& #4,�!�&"+ )"*! .�'!��!�)'!/ !� ��,+ ��!��."!/�� #'")+ '%��*��# ��+ �� *��!, !�"#
/ -� !!��!�$!")����#�!/ !!/�'/ -���!/�*.��#E�#�))�&!E,��$.'!/�&"+ % #'E1 /"/ �
��-�#!/�+ ?".1 �!/��!!��!"#"$�*�&!*�� !�"#!"!/��*4, ��)�& !�"# #$/ �#"�#!�*��!�#
�#-"�-�#�!/�+ .�'"#$1 / !��#�&��� *'!"� *#<���&*�$�!�=��/�'/ -�.��#%,!�#!"
+ # ��+ �#!%"��!�"#�.�'"#$!/��*&,**�#!& % .���!'E"#&� � �#)"*���%,*%"����C /���!
+ #'$"#"!/ -� %*".��+ 1 �!/!/��E!/��*&"+ %� �#!��!/ !!/�&"+ % #'$"��#"!.,��$
!/��*& % &�!'�#"*$�*!"�# .��!/�+ !".�&"+ ��))�&!�-�+ # ��*�E #$!/�'!/�#.�&"+ �
�+ %�"'���1 �!/ <%""*%�*)"*+ #&�*�&"*$=�=
It is not transformation to disempower people. It is not transformation to put people in a place where they cannot perform
efficiently and end up being burdened with a bad performance record for life. It is thus the imperative of private EAPs to
maintain strict codes of ethics in appointing HDIs and this can be informed by better internal policies. Very few
organizations actually have a proper transformation policy and some state that they are “too small” to have one. This
implies that a transformation policy is only viewed as an instrument for developing into a bigger business with access to
government tenders. It is not considered a vital and inclusive part of any organization, no matter how big or small and
shows the poor level of commitment to transformation in this country. Even 100% HDI-owned EAPs do not have a policy.
Singh (2007) notes that although there are diversity programmes in the science sector that are “genuinely committed to
educating employees about understanding themselves and others different to themselves, most programmes are “quick-
fix” solutions with short-term sustainability. Programmes of AA and programmes of understanding differences are not
sufficient as standalone programs”.
RECOMMENDATION 1:
EAPs develop structured, formalized transformation policies and strategies that harmonize EE with skills development and
represent a concerted and committed effort to build capacity within the company and enhance the work environment to
promote cultural integration. There needs to be a holistic developmental approach that encourages their staff to further
their qualifications, provide bursaries and gives staff incremental experience in handling EIAs, with oversight to ensure
quality.
RECOMMENDATION 2:
Government and civil society develop a Transformation Charter for the EIA&M sector in order to:
• develop best practice guidelines
• foster the environment for promoting skills development, learnerships and mentoring to integrate all sectors and
disciplines
������������ ��������������� ���� ������ �������������� ���������������������������
66
• to develop a vehicle to monitor transformation in indicators other than BEE
• to build capacity using partnerships to develop HDI ownership and engagement with EIA&M
• Address the lack of communication between government and EAPs and NGOs. (One example of poor
communication was that according to several NGOs, they submitted transformation proposals to government
after being requested to do so, and never heard back about these.) Facilitate a forum for industry-education-
government to address lack of capacity and skills and develop placement programmes.
However BBBEE is in the hands of the user - it can be as powerful or as mismanaged as one makes it. One can use it as
a ladder for building one’s own business, or one can use it as a channel for true transformation. SAFCEC, the South
African Federation of Civil Engineering Contractors, offers a unique programme for Enterprise Development in the
construction industry which has valuable ideas for the EIAM sector. It is a company-to-company mentoring program based
on the ED requirements as described in the Construction Codes. “The objective of this programme is to transfer
knowledge and skills to the Business owner and personnel of a sub contractor or JV partner, via mentoring, coaching and
training. An Established Contractor must coach/guide/mentor a Developing Contractor (Protégé Company) through a
structured development programme. The objective is to help the protégé company reach independence and to address all
the development areas as mentioned in the Construction Scorecard. The ideal mentoring period is between 3-5 years.” A
facilitator (SAFCEC or internal) then guides the interaction (program of transfer) at regular intervals over time, until the
desired outcomes have been reached. The SAFCEC involvement in the programme includes assisting with the launch of
the program on relevant site, and supplying a Facilitator who evaluates the protégé and develops a unique development
plan for this protégé and mentor.25 (See Appendix 3 for more details)
Entrepreneurial skills development through partner EAP mentoring
A study done at CPUT found that the entrepreneurial flair for new graduates seeking opportunities in small scale and
venture enterprises has not been adequately instilled (Hendricks 2005).
RECOMMENDATION 3: Create opportunities for HDIs to develop their own businesses if such is their ambition. Well-
established companies can allocate resources in terms of (ED – enterprise development) towards researching, negotiating
and mentoring working relationships with small emerging enterprises. Small businesses often battle and these can be
matched with larger companies who have shared interests (Nancy Richards, Untapped development potential, p 22
Impumelelo Volume 11 2010). The beneficiary strengthens and grows to become a valuable player in the economy and
the benefactor grows its understanding and awareness of challenges facing emerging businesses and together they grow”
Richards 2010)
3���,��$�#�!/��F����. �� #$& % &�!'")5 ���
In order for the skills base to increase and thus increase the supply of skilled/qualified EIA&M recruits, we need to address
various entry points in the education and work environment:

������������ ��������������� ���� ������ �������������� ���������������������������
67
The following diagram illustrates where the weak links need to be addressed, which are places where HDIs need support
or else we lose potential EIA&M practitioners and professionals as they fall away out the sector.
6.2.1. How do HDIs choose the environmental sector to work and study in?
Exposure to environmental issues during youth plays a major role in people’s decision to study environmental subjects in
tertiary education. Often a mentor or support person plays a major role. School currently plays a poor role, according to
the majority of interviewees. The only interviewee who claimed school as a driver was a manager who went to school in
Canada, where the environment is very topical and provides a good future career option. Schools here, by common
consensus, do not promote environmental careers or issues. Currently the top career intentions expressed by school
students are: accounting and commerce fields (37%); engineering (31%); medicine (11%) and science 5%. Of those
registered at tertiary institutions, the courses they are registered for are: 63% commerce; 14% sciences; 12% engineering;
4% IT; 3% medicine; 2% arts; and 2% law (HSRC 2009).
6.2.2. Flower-power: promoting awareness of the sector:
The focus group of HDI environmentalists were asked why do young HDIs not go into the environmental sector? They said
there were three reasons: Firstly, the young people want to be doctors, lawyers, and accountants as this is what their
family wants them to be (this was verified during the formal interviews of EIA&M HDIs). These have been the professions
particularly respected and are familiar to communities for generations. Secondly, if in your family or friends, you know a
doctor, it is likely you too will study this. Thirdly, political leadership in government is often a role model, for example,
Madiba (Nelson Mandela) was a lawyer, and it is seen as something to inspire to. Education – the environmentalists
pointed out that even though it has been more than 10 years since the end of apartheid - is shifting very slowly. Those that
benefited in past are still benefiting now. One of the problems is that parents in poor communities (mostly black) are poor
and servile to principals. They are not academics, and believe in the principal unconditionally so they don’t challenge
him/her to make changes. Working class parents don’t have the influence or knowledge to say what career guidance
should happen. Also once people move into the middle class, parents put their kids into the best schools possible, which
then means more effort, to get the kids to schools far away, and to pay for the extra school requirements. It then provides
even more of a barrier for parents to challenge principals on including issues like the environment. One environmentalist’s
mother put him into a better school outside the township, and when he compared his school work to his friends in the
township schools, he found their level of work in the township schools was often two years behind even though they were
in the same grade.
25 http://www.safcec.org.za/index.php?q=con,118,Enterprise%20Development%20Programme
��������������������������������
����������������������������
��� ������� ������� ������� ��������
� ��������� ��������� ��������� ��������
� � ������ � ������ � ������ � �����
��������������������������������
�� ������� ������� ������� �����
����������������������������������������
�� �� ����� �� ����� �� ����� �� ���
��������������������������������
����������������������������������������
��������������������
��������������������������������
����������������������������
�������� �������� �������� ��������
�� ���� �������� ���� �������� ���� �������� ���� ������
�������� �������� �������� ������������
������������ ��������������� ���� ������ �������������� ���������������������������
68
Environmentalists also said a major obstacle was that parents would often not support their children financially if they
wanted to follow an alternative career to that familiar to parents. If they want you to be a lawyer, but you want to go into
the environmental sector, then they will let you do your own thing but wont give you resources to pay for your career. This
means then that only the very passionate and those with parents with resources and awareness will make it into the
environmental sector.
One EAP commented that she found it difficult to explain to school learners what she did. There was a general conclusion
that environmental careers are not publicized in career guidance, however this takes place - in schools etc.
Takalani Sesame Street, the award-winning television and radio program that premiered in 2000 is one of the most
successful education innovations in South Africa. USAID supported development of a South African version of an
American educational TV success, with an objective of reaching out to vulnerable children. In 2002, a five-year-old Muppet
named Ka i became South Africa’s most popular AIDS orphan. Children from three to six years old improved their life skills
grasp, such as positive self-esteem and self-image. Research found that older children and caregivers also increased their
knowledge about HIV and AIDS.26
The DST/Thuthuka student camps run by the South African Institute of Chartered Accountants target the top-performing
Grade 11 and 12 students in both mathematics and science nationally. These are mostly African (except in the Western
Cape Province where coloured students dominate the camps), and 55% of the participants are girls from previously
disadvantaged backgrounds. (HSRC 2009) The camps have been very successful and reached 12% of schools, as well
as facilitating entry into the workplace as students were approached during camps and offered bursaries (HSRC 2009).
Findings from the evaluation of the 2007 National Science Week (Reddy et al, 2008, cited in HSRC 2009), show that a
number of students admitted to having their interest in science careers raised by their interactions and engagements with
scientists.
RECOMMENDATION 4:
• Encourage teachers to instil the cross-cutting issues of environment across disciplines.
• Work with schools in forums to enhance the syllabus with more environment-driven practicals and field trips
• DEA and EAPA can run similar camps to the Thuthuka Camps, targeting top achievers in biology, science and
geography
• Develop job-shadowing days within all large EAPs and IAIA
• Develop an EIA stall at National Science Week Exhibitions and Biodiversity Expos
26 http://sa.usaid.gov/south_africa/sites/south_africa/files/US-SA%20Education%20Partnership-ExSum_0.pdf
���������������������� ���������������
����������������������� ������������������������������������ ���� ����� �� ����������������������� ������������������������ ����������������� ���� ��������� �������������������� ������ !�������� ��� �������"������������ ������������������ ����� � �������� ����� �����# �������$�
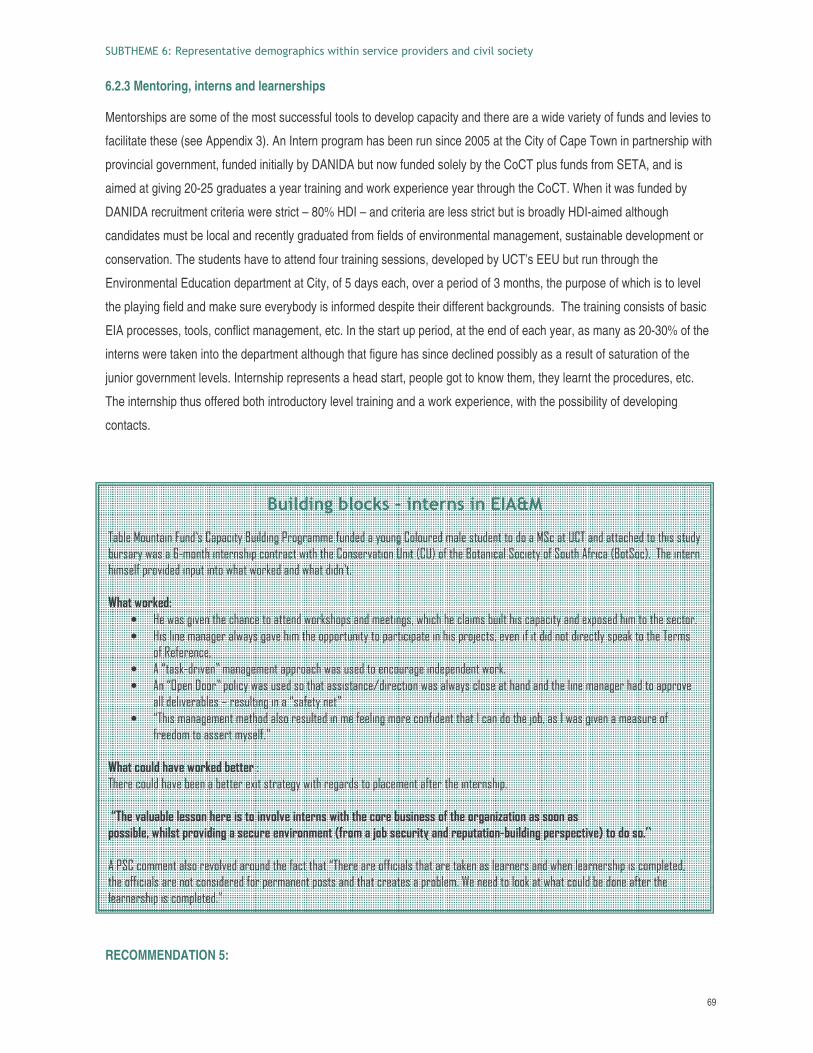
������������ ��������������� ���� ������ �������������� ���������������������������
69
6.2.3 Mentoring, interns and learnerships
Mentorships are some of the most successful tools to develop capacity and there are a wide variety of funds and levies to
facilitate these (see Appendix 3). An Intern program has been run since 2005 at the City of Cape Town in partnership with
provincial government, funded initially by DANIDA but now funded solely by the CoCT plus funds from SETA, and is
aimed at giving 20-25 graduates a year training and work experience year through the CoCT. When it was funded by
DANIDA recruitment criteria were strict – 80% HDI – and criteria are less strict but is broadly HDI-aimed although
candidates must be local and recently graduated from fields of environmental management, sustainable development or
conservation. The students have to attend four training sessions, developed by UCT’s EEU but run through the
Environmental Education department at City, of 5 days each, over a period of 3 months, the purpose of which is to level
the playing field and make sure everybody is informed despite their different backgrounds. The training consists of basic
EIA processes, tools, conflict management, etc. In the start up period, at the end of each year, as many as 20-30% of the
interns were taken into the department although that figure has since declined possibly as a result of saturation of the
junior government levels. Internship represents a head start, people got to know them, they learnt the procedures, etc.
The internship thus offered both introductory level training and a work experience, with the possibility of developing
contacts.
RECOMMENDATION 5:
�,��$�#�.�"&F�L�#!�*#��#���6 �
%�����&��� ����'���(������� !����������)����������������!������������������ ���� � �������&���� �*�%������ ������ �� ��� ��!����!������+,��� ���� ��������� �� ��� �� ��������� ����*�� �-�*.���� ����� ������������ !������� ��������-�� ���.���%����� ���������������������� ��� ����� ��� ���������� �����( ������������������
• /����������� ���������� ��� ������ ����������� ������������������������ ���������� !������#��������� �� ����� ����• /������������������!���������� ������� ��� !� ���� ����� ����������0�� ����������� ������� ����� �!���� � �� ���%���
���1����������• ��2 � ,�����3���������� ���������������� ��������������������� ��� ���• ���24�������3������!���������� �� ��� ����5���� �����������!������� ���������� ������������������� ���������
���������������6���� ���������2��� !��� 3��• 2%������������ ��� ����������� ����������������������������� � �� ���������� ���0����������������������������
������� ���� ��!����3��������������������������������7�%������������������������ ���#� � � ��!��� ������� ���������� ��� �� ����� ��������������������������������������������������������������������������������������������������������������� �������!�������� ������������������������������"���� ���#����������$������� ���������������� ��� ������%���������&'����)��������� ������������������� ������ � �� �2%���������������� �� ���� � ������������������������������������� ���� ����������������� �������������������� ��� ����� �� ���� ������������8������� ����� �� ���� ����������������� �� �������������������� ���3�
������������ ��������������� ���� ������ �������������� ���������������������������
70
• Promote public-private partnerships to develop learnerships and support programmes, such as internships, for
HDIs and women; use existing programmes such as those recommended in Appendix 3.
• Inside the sector itself, however, a special mentoring project can be set up, coordinated at a senior level, where
those about to retire may be dedicated to conducting mentoring in research projects with younger professionals
and associate professionals (HSRC 2009). Special care must be taken to set up the right socio-cultural context of
mentoring though.
6.2.4 Qualifications and skills from School and Higher Education:
HSRC (2009) recorded a worrying decline in biodiversity-skilled employee qualifications between 2000 and 2007 where
postgraduate degrees declined by 6% and increasingly, professionals with qualifications of Diploma and lower were being
employed in the sector. “The employment of professionals with lower level qualifications implies that these individuals may
be required to operate at levels of responsibility that they are not necessarily qualified for. The result of this disjuncture in
qualifications and responsibility is echoed in other research indicating that the levels of enforcement competence are often
low.” Although there have been improvements in the number of black postgraduates (HSRC 2009), the biggest bottleneck
exists for black women to move from masters into a doctoral programme and the second bottleneck for blacks in general
is to move from honours into masters and this trend was noticed in this study too.
HSRC (2009) note that one third of biodiversity professionals (34%) in 2007 were taking on responsibilities that should
ideally be done by someone with an honours degree or higher. This partly explains why respondents in the fieldwork raise
question marks about, for instance, the competence of biodiversity conservation 27 at all government levels.
During 2009-2010 a number of stakeholder-based skills planning processes have taken place in the environmental sector,
including the Global Change Grand Challenge initiative of the Department of Science and Technology, an Environmental
Sector Skills Plan being developed by the Department of Environment, and associated Human Capital Development
Strategies, for the Environment, Biodiversity, and Natural Resource Management (among others)(Submission to HET
2010). Transformation of social inequality based on race is the key concern and four dimensions of transformation
require attention:
• “New areas of learning to better support the developmental needs of society.
• Eradicating inequality of access to higher education.
• Eradicating inequalities in the quality of higher education provisioning.
• Improving epistemological access and methods of teaching to meet wider needs.”
• Research indicates teachers need to be trained about the environmental content of the subjects they teach.
Success factors for increasing numbers of black South Africans reaching postgraduate level are cited as:
• Strong academic development programmes, both general and discipline specific
27 Guidelines for an HCD Strategy in the Biodiversity Conservation Sector, HSRC 2009
������������ ��������������� ���� ������ �������������� ���������������������������
71
• Adequate opportunities for staff-student interaction
• A lowering of entry criteria for Honours (but not Masters) programmes, to give students with disadvantaged
schooling an additional opportunity to ‘catch up’
• A range of course specialisations, particularly courses which combine the technical environmental content with
social relevance
• Staff with a good understanding of the world of work in the environmental sector.
(Submission into HET 2010)
“Many South African students are ‘switched on’ to the environmental sciences when technical content is presented in the
context of social relevance. And working from context (such as experience, or situated case study) to concept unlocks a
vast potential for learning” (Submission to HET, 2010).
The failure of many universities of technology students to find experiential workplace placements often results in their
failure to complete qualifications (HSRC 2009). The reasons why there are so few qualified Blacks and Coloureds often
relate to high financial needs and lack of support. It is difficult for learners to finish theses without access to financial
resources, particularly if their family is not well-resourced.
6.3 Breaking into the Inner circle:
Registration on professional bodies is considered an essential way to standardize skills. However there is a concern that
this will exclude and limit the opportunities of HDIs who have had unequal access to education resources but might have
good experience. HDI companies starting out could join IAIA and get to know “established” consultants in order to find
mentors for sponsorship.
At the moment, we understand that the certification process for registration with professional bodies depends on being
sponsored by a reputable EAP who is already part of the inner circle/ or who the new consultant has worked with in the
past. Such a process would tend to make it exceedingly difficult for “outsiders” or new potential EAPs to become certified.
It has been therefore suggested by EAPs that a two year mentoring process be instituted, with mentors that could become
sponsors but track their experience. There was also a suggestion that some of the older, retired experienced individuals
who have commented to EIAs for NGOs could provide mentorship within NGOs and small EAPs and be funded to do so
by government in a structured manner.
A recommendation from a NGO manager was that although any newcomer into the sector will have difficulties, “they have
to work hard. It’s worth doing voluntary stuff – to get known.”
RECOMMENDATION 6: Provide more opportunities, through funding and encouragement, during education and in the
work place, to allow HDIs to participate in social-network building and the development of contacts through:
• Attendance at conferences
• Attendance at workshops and meetings
������������ ��������������� ���� ������ �������������� ���������������������������
72
• Increased exposure to EIA&M interfaces – so as to increase awareness of integration and provide
communication channels with other related sectors (e.g., consultants, communities, engineers, water affairs)
• Develop the Grab-an-intern IAIA project
• Facilitation (through financial and training support) of registration on professional EIA bodies
Mentoring plays a vital role in development of skills in the EIA&M and during interviews mentors said that it was important
to develop writing and communication skills as a key limiting skill. Even within short courses students could be asked to
prepare and help present a paper at IAIA conference, as has been done in the past. This not only builds the capacity to
work in a team but also helps hone writing skills and promotes attendance at a network-building conference.
According to comments into the development of EAPA, the registration authority for EAPs, there is widespread support of
the principle that the body must be an inclusive one that is representative of the full spectrum of practitioners operating in
South Africa and that it must be a body that facilitates the entrance of new practitioners into the field. This needs to be
ensured right form the start and represents a very good opportunity for SA to develop transformation in the industry.
RECOMMENDATION 7: there is a need to fast-track registration of Black EIA&M professionals, allowing some leeway
of registration criteria in favour of experience or emphasis on mentorship.
3�0�! ))!,*#"-�* #$*�!�#!�"#
Without access to exit interviews it is not possible to truly identify the reasons for staff turnover. However the perceptions
were firstly that BEE is driving higher salaries and hence higher HDI mobility. HSRC (2009) listed some reasons for
departure being:
• lack of career opportunities,
• lack of job variety and challenges
• low salaries.
There was also a view that “organizational and management culture may play a role in the high turnover” in the sector as
white males dominate at the senior level which was “not welcoming for new recruits” (HSRC 2009).
Small firms appear to have more staff loyalty, even though they cannot offer as high salaries. This might be due to what
seems to be more effective management-staff interface, an open door policy and close training and mentoring of junior
staff by senior staff.
One way to effect a conducive work environment is through an “open door” policy, encouraging communication and
interaction. Furthermore to offer alternative perks might be a strategy to encourage retention, such as Chand Consulting, a
woman-only EAP, who offer spa breaks and readily acknowledge staff who have gone the extra mile. As a result they
have a “very low staff turnover”. Chand do not headhunt their staff or acquire from universities/technikons but acquire new
employees from CVs sent to them. They also are prepared to take on new graduates from universities and train them. If
one views the Chand Consulting services website, one can see that Chand embraces their womanhood and provide an
offbeat ambience to their company, which engenders a close-knit work relationship between staff.
������������ ��������������� ���� ������ �������������� ���������������������������
73
It is important to develop effective communication between management and staff within transformation and staff
development, and the open door policy is often mentioned as being successful (BotSoc intern interview, for example).
Chand Consulting, for example asks staff to fill in questionnaires about the work environment in order to work on
weaknesses and thus grow. An interview with a Chand employee verified that their environment was relaxed and efficient
with good team work.
HSRC (2009) suggest that addressing “unique and individual value systems rather than focusing on generic motivators
may be more useful” to retaining employees and building commitment.
The evidence suggests that salaries have become a factor in the retention of midcareer professionals and do not just
HSRC (2009) also suggest that salary becomes a concern to young professionals in midcareer stage, just at the time they
are having families and suddenly needing more financial resources. Finally, “the expenditure on consultants by the DEAT
has created another labour market and may also add an incentive for experienced staff to resign and do consultancy
work.” (HSRC 2009).
The Review of EIA in South Africa report also mentions high turnover: “The high turnover in personnel of departments and
even in consultancies and the corporate sector is very disruptive to the development of capacity of both organisations and
individuals and contributes significantly to both ineffectiveness and inefficiency. A concerted effort that involves all role
players is required to create a sustainable flow of environmental managers in a way that creates capacity at all levels and
also ensure career paths for employees. The EIM strategy would fail to address efficiency and effectiveness adequately if
an actionable plan in this regard does not form part thereof.” (Mosakong Management et al. 2008).
There is an urgent need to change the work environment, particularly within government to prevent high staff turnover and
loss of institutional memory. In order to retain staff, alternative perks need to be offered. This might mean government
needs to be more flexible in offering benefits, allowing staff the choice of increased income rather than pensions and
medical aid (several interviewees pointed out they would rather have the money than these long-term benefits). However
of crucial importance is the fact that some interviewees said they went to other jobs, not for better pay but for the need to
get a wider variety of skills and build their career paths. Thus an attraction to stay in a post in government could be
facilitated by offering diverse and ongoing opportunities for going on training courses and diversifying skills.
The HDI environmentalist focus group were asked what they thought would be good incentives to attract employees to
stay in a company and their consensus was that as a professional, one must know one’s personal career plan and if one
is passionate about the field one is in, one won’t need incentives to stay. “If you need incentives, you don’t know your
personal plan and are not passionate about your career. If you jump from job to job, you don’t know what you want. If you
know what plan is, you will take offers to advance your development plan, not for external incentives.” They even claim
that offering incentives is actually counter-productive and the example they give is of local councillors who go into the job
for incentives’ sake (long-term prospect of high-paying jobs with companies once the term is over), not because they are
passionate about serving people. They wait their term out, and it doesn’t benefit community. Because of incentives, there
is no effective governance.
The long-term approach is for organizations to accept that “turnover among young black staff is inevitable, but also reflects
a global phenomenon among young people. Cappelli (2004) cited in HSRC (2009), argues that “… you [the organisations]
������������ ��������������� ���� ������ �������������� ���������������������������
74
are managing a river, not a dam”” It would be more useful to develop systems that “go with the flow” such as providing
“challenging work, career development opportunities … [and] rewards based on individual performance” (HSRC 2009).
RECOMMENDATION 8:
• Practice an open door effective management communication system
• Develop exciting career opportunities in the work place (see ICT company Altrons Young Presidents Forum
initiative on their website - http://www.altron.co.za/vision2012/transformFuture.htm)
• Develop a conducive work place, including developing protocols to integrate socio-cultural differences
• Accept the global job-shopping culture and work with it, not against it
3�2�/ !!�*�#�+ ��&"#&�%!�"#��/�� � �������#�
Chand consulting, an all-women company, have specific incentives for women, including offering flexibility at the office.
“When kids are sick, and have to be collected, provisions are made”. Their perks for hard work are also women-orientated
and break the glass ceiling in terms of being innovative and not typical of the male-owned company incentives.
Many EAPs don’t have specific strategies for gender equity or including women, and consequently do not have gender
representative staff.
The Ombuds of UCT, Ms Zethu Mguqulwa, whose role it is to oversee transformation and race relations in the university,
claims that,
<C "+ �#$"#"!/ -��#",�/&"#)�$�#&� #$&",* �� #$!/�*� *��#�,))�&��#!
%�"%��1 /"+ !/�'& #�""F,%!"�=
RECOMMENDATION 9: Through the channel of women forums, find and showcase role models of successful women
within the environmental work field. Success does not necessarily refer to high-achievement awards and big salary levels,
but simply can refer to women who have achieved multiple goals, like getting a PhD and supporting children, or women
who are fulfilled and self-confident in a supportive and flexible work environment. These women can be role models for
inspiring others to enter the profession. They are role models whose achievements are attainable. There needs to be a
voice for women, and such role models could provide it within the context of specially-developed women forums or
associations.
Business Unity South Africa (Busa)28 say that, besides the awarding of BBBEE points, there are other compelling business
reasons for including women in a business:
• Women can provide a competitive advantage by influencing and providing insight into the female role in the
economy;
• Women see business from a different angle to men and, as a result, are a strategic resource; and
28 http://www.mg.co.za/article/2010-07-30-more-women-in-business-makes-good-sense
������������ ��������������� ���� ������ �������������� ���������������������������
75
• In a largely male-dominated world a company run by women or one that reflects the important role that women
play in business by including them in management stands a better chance of attracting young, professional
women graduates.
“There’s a lack of commitment on the part of our male counterparts to ensure adequate mentorship and many women
choose not to go the managerial route because the environment is hostile.” (BUSA cited in Mataboge 2010) Particular
attention should be paid, to flexible working hours, part-time working, tele-working and sabbatical leave, as well as to the
necessary financial and administrative provisions governing such arrangements. 29
One of the women in the HDI environmentalist focus group, an activist, said that in 20 years’ time she would like to see the
country having a women -agenda, the “women-driven revolution”, such that issues are not driven by men, but by women.
She emphasized that in the initial development of an organization there must be a balance of gender included right from
the start, as opposed to the present where the organization is men-driven and women must fit in.
RECOMMENDATION 10: In order to attract women into the EAP work environment, there needs to be some
accommodation for women needs which are unique and should not be under-valued. Provision of child-caring services,
flexibility of work schedules and fostering skills development are essential.
@����F�:
Larger firms are currently taking the risk of investing in black engineers and specialist, only holding them for about 2 years
and then losing them to better paying jobs in firms that want their experience gained from their stint in one firm.
As it has been clearly articulated that black EAPs/specialists are in short supply, EAPs and NGOs could interact with
schools programmes and include modules on careers in the EIA sector in their training for empowering communities.
Offering more bursaries to increase the pool of black EAPs/specialists to draw on would reduce the risk of investment in
single individuals, that then leave the government/large companies for higher paying jobs.
>��"#&�,��"#�
The EIA&M sector is currently not representative of the sector and needs a formalized system to direct transformation in a
more holistic and integrative capacity. There has to be commitment on the part of all sectors to build HDI capacity and
integrate HDIs into the work place.
There is the serious concern that the lack of transformation has led to deficits of capacity and institutional memory and
therefore transformation is in the country’s best interest, especially in terms of the mandate of the industry to facilitate
sustainable development.
29 http://www.nacinnovation.biz/wp-content/uploads/International-Perspective-of-Womens-Involvement-in-STI-Leadership-Prof-Inmaculada-Garcia-Fernandez.pdf Annual NACI Symposium on Leadership Roles of Women in Science, Technology and Innovation. The NACI symposium entitled, Enhancing the leadership roles of women in science, technology and innovation was held on Friday 13 August 2010 at Premier Hotel, Pretoria. The symposium, which was an initiative of Science, Engineering and Technology (SET4W), sub-committee of NACI, was attended by about 100 leaders and aspiring leaders (predominantly women) from a wide variety of institutions and organisations.
������������ ��������������� ���� ������ �������������� ���������������������������
76
This report clarifies the weak links on the process of HDI integration into the EIA&M sector and provides recommendations
to foster capacity, develop partnerships and learnerships, access existing funds, programs for development and to
promote leadership and skills within HDIs and gender.
In order to fully effect transformation, exposure needs to start at schools, students need to provided with support through
their studies and then there must be placement at the end of their studies – it needs to be a proactive program, not a
reactive one and cannot be sustained by BBBEE alone.
Finally policies must be put in place that allow monitoring and learning from the process.
��.��"�* %/'
Bertelsmann Stiftung and the Center for Applied Policy Research (CAP). 2010. BTI 2010 – South African Country Report.
Munich University. Retrieved 1 March 2011 from http://www.bertelsmann-transformation-
index.de/fileadmin/pdf/Gutachten_BTI2010/ESA/South_Africa.pdf
Boyle, B. 2011. Zuma clarifies employment equity bill. Times Live article: 17 March 2011. PoliticsLIVE. Retrieved 20
March 2011 from http://www.timeslive.co.za/Politics/article972931.ece/Zuma-clarifies-employment-equity-bill
Cliff Dekker Attorneys. 2004.The way to BEE – A guide to broad based black economic empowerment in South Africa.
Retrieved 13th March 2011 from http://www.bwasa.co.za/Portals/4/docs/archive/BEE-%20notes%20.pdf
DEAT. 2006. Socio-Economic Impact Assessment, Integrated Environmental Management Information Series 22,
Department of Environmental Affairs and Tourism (DEAT), Pretoria.
Department of Education. 2008. Report of the Ministerial Committee on Transformation and Social Cohesion and the
Elimination of Discrimination in Public Higher Education Institutions 30 November 2008. Final Report, Department of
Education. Retrieved 10 March 2011 from http://edulibpretoria.files.wordpress.com/2009/05/racismreportnov2008.pdf
Department of Health. 2008. South African Demographic Health Survey: 2008. www.doh.gov.za
Department of Trade and Industry. (nd). Guidelines: equity equivalent investment programme for multinationals. Retrieved
1 March 2011 from http://www.dti.gov.za/bee/EE_guidlines.pdf
Fernandez, I.G. 2010. Report on International Perspective of Women’s Involvement in STI Leadership. Department of
Computer Architecture at the University of Malaga. Retrieved 20 March 2011 from http://www.nacinnovation.biz/wp-
content/uploads/International-Perspective-of-Womens-Involvement-in-STI-Leadership-Prof-Inmaculada-Garcia-
Fernandez.pdf
Hendricks, S.B. 2005. The Cape Technikon: A Study of its Human Resource Management Training and Development
Policy and Practices. MA thesis submitted to the School of Government of the University of the Western Cape.
HSRC 2008. Compiled by Letseka, M & Maile, S. High university drop-out rates:a threat to South Africa’s future. HSRC.
������������ ��������������� ���� ������ �������������� ���������������������������
77
Maharaj, Dr R. 2010. Taking stock: policy interventions and impact in the STI (SET4W projects). National Advisory Council
of Innovation. Retrieved 2 March 2011 from http://www.nacinnovation.biz/wp-content/uploads/Taking-Stock-Policy-
Interventions-and-Impact-in-the-STI-Dr-Romilla-Maharaj.pdf
Mataboge, M. 2010. More women in business makes good sense. Mail and Guardian online article.30 July 2010.
Retrieved 20 March 2011 from http://www.mg.co.za/article/2010-07-30-more-women-in-business-makes-good-sense
Mosakong Management cc, in association with Environomics cc, Savannah Pty Ltd and Environmental Counsel cc. 2008.
Review The Effectiveness And Efficiency Of The Environmental Impact Assessment (EIA) System In South Africa: 20
November 2008.
Northwest University, Potchestroom Campus, Masters Programme in Environmental Management (M.Env.Man.), 20 May
2009. Retrieved 7 March 2011 from http://www.nwu.ac.za/export/sites/default/nwu/p-sgges/documents/masters.pdf
Richards, N. 2010. Untapped development potential. Impumelelo Volume 11 2010:p22.
Rosenberg, Dr E. 2010. Environmental Studies And Higher Education Transformation – Contributions And Challenges
Submission to the Stakeholder Summit on Higher Education Transformation, 22-23 April 2010. Human Capital
Development Strategy for the Biodiversity Sector (www.skillsforbiodiversity.org.za), on behalf of the South African
National Biodiversity Institute (SANBI) and the Lewis Foundation.
SAFCEC (nd). Enterprise Development Programme. SAFCEC. Retrieved 20 March 2011 from
http://www.safcec.org.za/index.php?q=con,118,Enterprise%20Development%20Programme
Singh, V. 2007. The Structuring Of Diversity Programmes At Science Councils In South Africa Case Study – Mintek: A
Research Report Presented To The Graduate School Of Business Leadership, University Of South Africa.
Statistics South Africa – Stats online. Retrieved 2 March 2011 from http://www.statssa.gov.za
Stokes, G. 2011.Demographeid: re-engineering South Africa’s population demographics, 28 February 2011 FAnews.
Retrieved 18 March 2011 from
http://www.fanews.co.za/article.asp?Front_Page_Features;25,Stokes_Stage;1145,Demographeid_Reengineering_So
uth_Africas_population_demographics;9155
University of Cape Town. (nd). Racism And Racial Harassment Policy. Retrieved 6 March 2011 from
http://www.uct.ac.za/downloads/uct.ac.za/about/policies/race_harassment_policy.pdf
University of Cape Town. 2006. Employment Equity Policy - as approved by Council, December 2006. Retrieved 5 March
2011 from http://www.uct.ac.za/downloads/uct.ac.za/about/policies/eepolicy.pdf
University of Cape Town.(nd). UCT – Centre for Higher Education Development (Academic Development Programme).
Retrieved 6 March 2011 from http://www.ched.uct.ac.za/departments/adp/interfac_proj/ldg/
University of Pretoria (nd). Strategic Plan of the University of Pretoria, Innovation Generation: Creating the future 2007 –
2011 (transformation). Retrieved 6 March 2011 from
http://web.up.ac.za/default.asp?ipkCategoryID=2995#transformation
������������ ��������������� ���� ������ �������������� ���������������������������
78
University of Pretoria: policy on unfair discrimination on the basis of race (amended 19 November 2008). Retrived 6 March
2011 from http://web.up.ac.za/sitefiles/file/1/Policy%20on%20UnfairDiscrimination%20-%20Race.pdf
US AID. 2009. Compiled by Cook-Mohajane, G. Partnership to transform South African education: American Support
1986–2009 (September 2009 publication), prepared under Purchase Order 674-0-00-09-00020-00. Retrieved 12
March 2011 from http://sa.usaid.gov/south_africa/sites/south_africa/files/US-SA%20Education%20Partnership-
ExSum_0.pdf
WEF (World Economic Forum). 2009. Global Competitiveness Report 2008-2009 of the World Economic Forum (WEF).
Retrieved 25th February 2011 from http://www.weforum.org/reports-
results?fq=report^report_type%3A%22Competitiveness%22
Wikipedia – the free encyclopedia (nd). Demographics of South Africa (statistics from StatsSA). Retrieved 3 March 2011
from http://en.wikipedia.org/wiki/Demographics_of_South_Africa
��� ���������� ��������� ���
��
��
)&%'(�)&,-
����.����� ������#