systematic voltage surveys — procedure and application to distribution design
TRANSCRIPT
Systematic Voltage Surveys—Procedure
and Application to Distribution Design
By R. W. BURRELL W. E. APPLETON ASSOCIATE AIEE ASSOCIATE AIEE
WITH the development of systems of distribution supplying light,
heat, and power from common mains, the problem of maintaining proper voltage at consumers' services has become extremely difficult. The efforts of distribution engineers in solving system voltage regulation problems have extended in many directions. To facilitate these solutions, a need has been felt by many distribution engineers for some means of clarifying the approach to the voltage-regulation problem. The systematic voltage survey, by presenting a comprehensive view of service voltage conditions, has been found, by utilities which make such surveys periodically, to serve this purpose effectively. This paper presents a procedure for conducting systematic voltage surveys, based on the practice of various electric utilities, and a brief discussion of the application of voltage-survey data.
Distribution systems are not static, but are in a continual process of development. In the course of rearrangements occasioned by load growth, some primary and secondary mains become too long, or overloaded, or distribution transformers become overloaded, with resultant adverse effect on regulation standards. To maintain voltage within system regulation standards under these conditions, the distribution engineer must have some method of ascertaining the status of service voltage conditions over the entire system. Because of the variable factors involved, it is impractical, if not impossible, to calculate with any degree of accuracy the value of voltage at consumers' services, involving as this may,
approximations of load on primary laterals, distribution transformers, secondaries, and services. The systematic voltage survey is an effective means of obtaining this information, and has proved to be a material aid to the distribution engineer in providing good voltage service.
The procedure involved in making a voltage survey necessarily varies among different utility systems in accordance with individual system requirements. Data received from various companies regarding voltage survey practice indicate, however, that there is considerable uniformity in the consideration of certain fundamental aspects.
In considering plans for making a voltage survey for the first time, engineers are concerned with certain phases which may be divided into the following categories, namely,
( a ) Preliminary engineering considerations. (b) Preparation of data for field test forces. (c) Procedure for field testers. (d) Recording of tests, classification and tabulation of results. (e) Analysis and application of data.
Preliminary Engineering Considerations The value of a voltage survey is pri
marily dependent on the relative accuracy and the completeness with which the information obtained presents an indication of the true status of voltage conditions on the system. To insure the effectiveness of the survey from the standpoint of the final engineering use to be made of the data obtained, careful consideration must be given to the type of
and breakdown value can be made practically equal. At any rate, the ratio between corona voltages, impulse and 60 cycle, can be made the same as the ratio between breakdown voltages, impulse and 60 cycle. It is easily seen that if there is a definite ratio, that voltage values for impulse tests can be established from the present 60-cycle test values and should be consistent. The value of 80 per cent as applied to the ratio between corona and single-shot kilovolt strength is not representative of "proper design."
The comparison of concentric types of winding with interleaved types is unfor
tunate, since the number of square corners is just the same (four) on the usual core type as in the shell-type winding with two high-voltage groups. However, no merit is seen in the number or lack of number of such corners since one or 20 can be insulated in the same way. Theoretically, some reduction in space between high-voltage and low-voltage windings can be made where the high-voltage lead is brought out at the center of the coil stack, but the outside shield and its insulation required to obtain a satisfactory voltage distribution also takes space and offers difficulties avoided by other types of design.
readings desired, location and number of readings to be taken, time of taking readings, etc.
TYPES OF READINGS
There are two basically different types of voltage surveys—those taken by means of graphic instruments, and those taken by means of indicating instruments. Although the cost of a voltage survey is on the whole increased by the use of graphic instruments, the added cost is offset by the fact that a complete record of voltage variations and fluctuations over a 24-hour period is available, which in many cases adds greatly to the understanding of the regulation problem. On the other hand, the use of indicating instruments speeds up a voltage survey and allows the use of a less highly trained personnel. The element of completeness is taken care of by increasing the number of readings taken. In this connection it may develop that a large number of indicating readings thoroughly covering an area will prove of greater value than a limited number of graphic records taken at a few points only, as the few graphic records may fail to disclose the extent of the poor voltage conditions. As a rule, a large number of indicating readings taken in an area should not fail to disclose low spots and high spots; and where conditions are suspicious, they may be supplemented by the more thorough graphic charts. This is usually the practice of companies which standardize on indicating readings.
The use of graphic instruments permits a check on the average voltage supplied to a consumer, which is important as it is desirable that the average voltage supplied by a system shall match the rated voltage of equipment for best service to the consumer. Nevertheless, most systems have set up limits of voltage service and their experience has been that if the greater part of the service voltages are kept within these limits, as indicated by spot readings, the average voltage supplied to the services will not deviate greatly from the system nominal voltage.
LOCATION AND NUMBER OF READINGS
In arranging the details of survey procedure, a most important point to be de-
Paper number 38-43, recommended by the AIEE committee on power transmission and distribution, and presented at the AIEE North Eastern District meeting, Lenox, Mass., May 18-20, 1938. Manuscript submitted February 19, 1938; made available for preprinting April 26, 1938. R. W. BURRELL is assistant engineer, Consolidated Edison Company of New York, Inc.; W. E. APPLETON is division engineer, New York and Queens Electric Light and Power Company, Flushing, Í . Y.
SEPTEMBER 1938, V O L . 57 Burrell, Appleton—Voltage Surveys TRANSACTIONS 535
tided is the location at which readings should be taken. The voltage which influences the operation of equipment is that which is directly supplied to the terminals of the equipment; however, it is not practical, for example, to measure the voltage at the lamp sockets. The next best point, therefore, is considered to be at the consumer's service switch.
Practical considerations preclude taking voltage readings at all services. The number of readings taken should be sufficient, however, to represent a fair sampling in order that the results may be indicative of the conditions existing. To facilitate subsequent corrective measures, readings should be taken at a sufficient number of service points to disclose whether subnormal voltages are caused by primary circuits, secondary mains, or services. On radial systems readings should be taken at the consumer nearest each transformer and at a consumer at the end of at least the longest secondary branch. Where a secondary has several branches of unequal loading or a complicated configuration, judgment may dictate that more than one branch reading be taken. Special conditions may warrant taking additional readings at various points along the secondary.
A careful analysis of secondary layouts, in establishing a voltage-survey procedure, will do much to eliminate unnecessary readings. Where considerable growth is taking place on a secondary system, a certain amount of secondary rearrangement is made from year to year and successive voltage surveys must be made to conform. On the other hand, it has been found good policy in making successive surveys to choose locations in a consistent manner, and where no rearrangement has been made, to choose approximately the same locations as before in order that yearly comparisons of results may be more closely indicative of actual change.
On network systems many of the same points hold. As network secondary grids are fairly uniform in arrangement, a reading at the first consumer off the transformer and at one or two intermediate points between transformers generally suffices. Where the network grid is incomplete, additional readings on long spurs may be desirable.
NUMBER OF READINGS AT INDIVIDUAL LOCATIONS
The decision must be made as to whether or not all possible line-to-neutral readings should be taken at each location. Practice naturally differs, but with indicating instruments, particularly,
536 TRANSACTIONS
the additional time and expense involved in taking more than a single line-to-neutral voltage would appear to be justified by the information obtained regarding voltage unbalance. For this reason, where a choice of consumer locations is available, three-wire services are to be preferred to two-wire services. In the case of three-phase secondaries the readings should be taken, wherever possible, on a three-phase service. It may be desirable to read the line-to-line voltages as well as the line-to-neutral values—the former for reference and check purposes, the latter for comparative records.
TIME AT WHICH READINGS ARE TAKEN
In a district which is predominantly residential, the peak load will usually occur at some hour during the evening in the winter. If a district is on the average an industrial district, the peak load will usually occur at some hour during the day and may be either in the summer or in the winter. There may be some residential load in an industrial district and some industrial or commercial load in a residential district, but if these loads make up only a small portion of the entire area, the expense of surveying them separately may not be justifiable. In general, the readings should be taken at the time the peak load is occurring in the district.
The time of the year and the extent of time over which the survey will be conducted will be determined ordinarily by the load characteristics of the system and the personnel available for carrying on the field work. Common practice is to schedule the ordinary lighting-load survey over the winter months and the survey on industrial loads and summer resorts over the summer period. This allows a year-round distribution of work on the field test forces. I t has been found convenient by some systems to schedule daytime industrial-load readings as well as night lighting-load readings over the "winter peak" period to fit in better with the routine work of the field forces and relieve special personnel requirements.
Where seasonal variation of load over the "winter peak" period is limited, it may be feasible to schedule the voltage survey for any time during the period from October to April. If the load variation is considerable, it still may be desirable to take readings over a long period and correct voltage readings for variation of system demand. Such voltage readings can be corrected to allow for the difference between the feeder load
Burr ell y Appleton—Voltage Surveys
at the time the readings were taken and at the time of feeder peak.
Generally speaking, readings in resi-dental areas will be taken on week-day nights from 6:00 to 10:00 p.m. It may be desirable to take readings in store-load districts on Saturday nights. In industrial districts readings may be taken between 9:00 a.m. and 4:30 p.m. with allowance for the noon-day load dip. Where there is any doubt, an analysis of feeder load characteristics will indicate the desirable time for a particular area. Corrections for "off time" readings are not generally made, unless they are found on the ' 'border line. ' '
Preparation of Data for Field Test Forces
With the question of type of data decided, thought must next be given to the procedure for obtaining the data.
Prior to the beginning of field operations a certain amount of engineering study will generally be found necessary. The territory should be divided into the districts by which it is desired to keep records. Whether the territory consists of a closely built up urban area or an extended system with natural divisions, it will usually be found advantageous to proceed with the survey in terms of such districts as best fit the system, such as by towns, substation districts, or arbitrary divisions used in connection with existing operating records. For convenience it may prove advantageous to subdivide the major divisions to correspond to the grouping of secondary circuit maps. Tabulation of the readings by districts, adopted on this basis, will facilitate the analysis of voltage conditions and help in the consideration of plans for system reinforcements. Further tabulations can be made according to types of load, for example, residential-commercial and industrial readings.
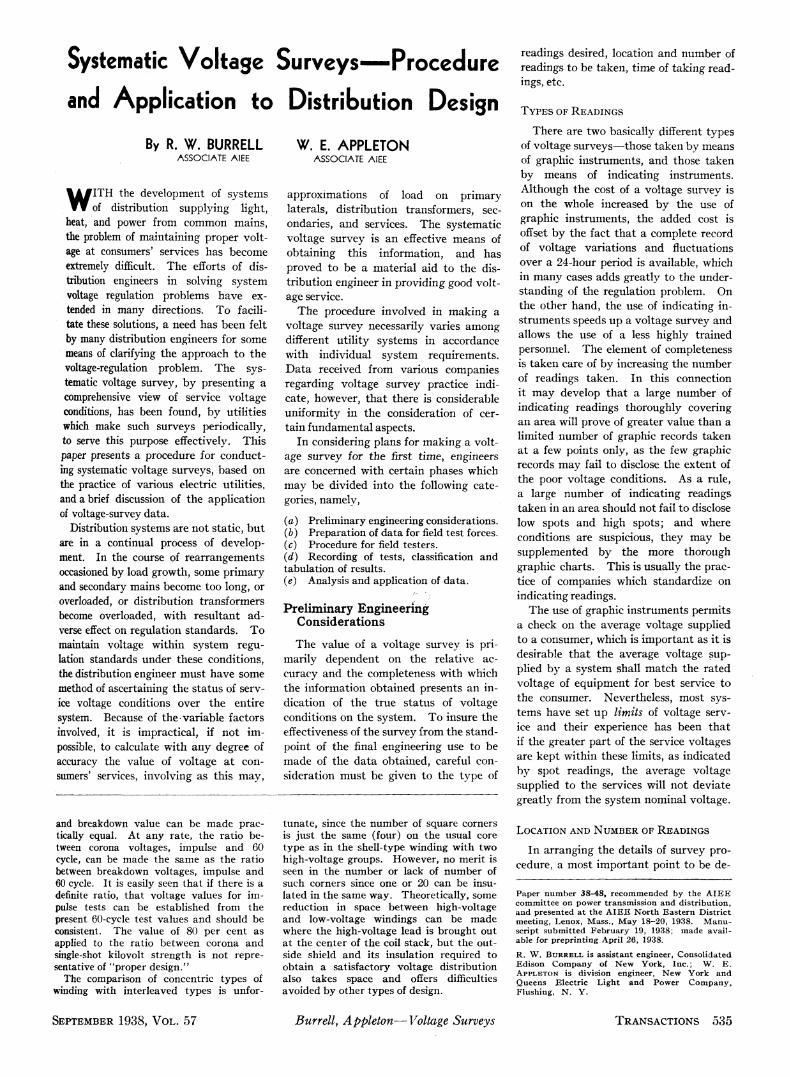
Some form of indication must be devised to indicate to the field forces where and when readings are to be taken. This can be done by using secondary maps as the direct medium of designating the locations at which readings are to be taken, as illustrated in figure 1. These secondary plates are designated by plate numbers to which the survey records are indexed.
A procedure for using these plates in connection with indicating readings is as follows: A volume, consisting perhaps of approximately 100 blueprint plates covering a district, can be inspected by one or more engineers familiar with the secondary system to determine the lo-
ELECTRICAL ENGINEERING
lRgSNOI~~VSNV"HLs",~aJns~~vlloA-uo1~144V'll~JJnfl19"'lOA'8f:61"H3aW3J.d3S
ooooo
~......N
-..J~
(J'lI
'-JW
-r===-
•NJ~ZJPI
~I~I~z
~NINI' II",
WZ~
~
~~
CilI
<,
~ "J
482,f:)?It:'zit:'
ST
~I~rn°->
ll~~~.'"~ rriN-zPI
~
NI' I~
Z'4
(j)fTI()
0Z0»:0
/49ST~\~r~~'fJ-<()
;0()c=i~»-0
MURRAY
t\c;)~~~ •wz)l
lJ~(),.,w.....~
~~~~r'l
-ncii"c;~
en~n0:::IQ.sa.~n~.
~a...'1J.,.... Q.... '1Jit0..
r-e0l' CiQ,.,. c<~~
c.,.!9
.... (9
=- 0- n!:.crI~I
'\) :::I .,.~.,. ::T0~I2/0T4/i/48},f:):::I
Gf:::IQ..
II~II;~III.~. :re,t.'" ;i"~;"
CiQ
(;GfQ.;"CiQ.,.«; n0a. (9Q.
e: «;!l:<0:I.-(9n0:::IQ.sa.~
2: c(9'1J;0r;r
25
20
8
g
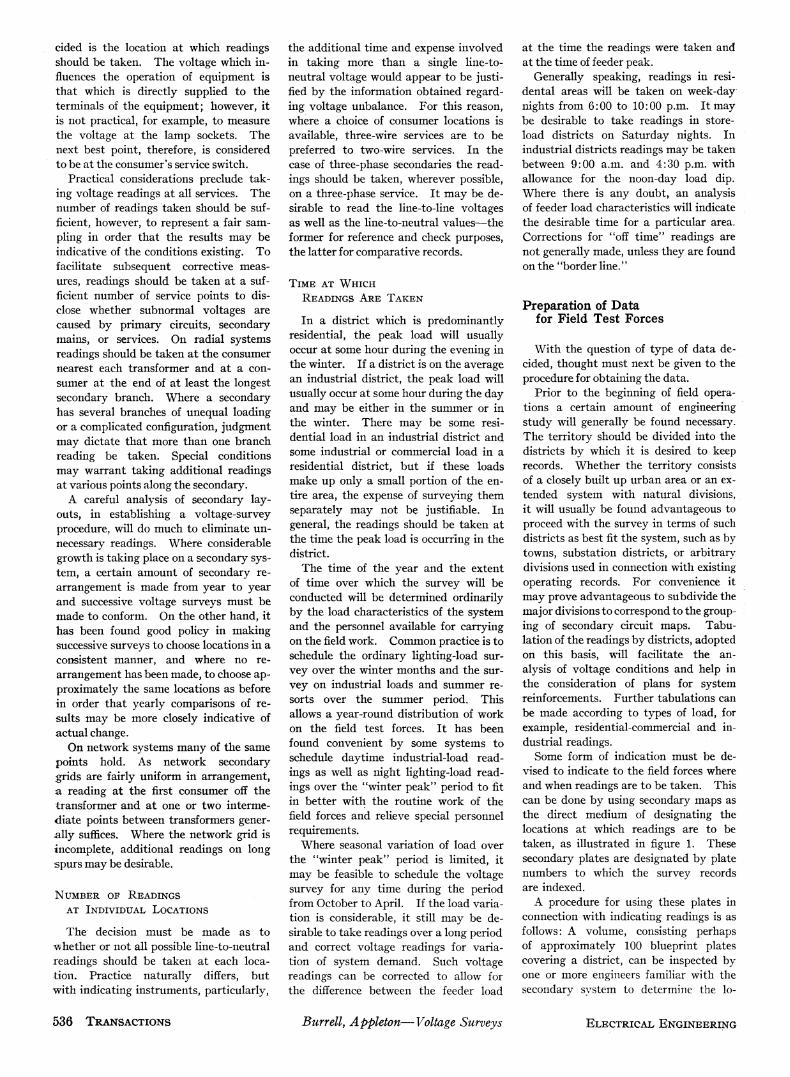
SURVEYS LOW j—CURRENT 1.2% —PREVIOUS 11.2%
NORMAL 97.8% 75.8%
L^rrTTlll
HIGH 1.0%
13.0%
UlL 108 110 112 114 116 118 120 122 124 126 128
SECONDARY VOLTAGE
Figure 2 a . A - c radial-system v o l t a s e survey, Verona district. Night readings
LOW 0.4% ] NORMAL 99.5% JHIGHOIS
ß pi
AVERAGE ! Ð I I 122.5 VOLTS
1 ' n 1II1 ^ «in 1111.1 II1
ri 1 1
HlllnL 1 SECONDARY VOLTAGE
Figure 2b. A - c network-system voltage survey Night readings. Summary of all districts
i £ +4 +2 0 -2 -4 -6 i d DEVIATIONS FROM NOMINAL VOLTAGE aim
Figure 2c. Service entrance voltages during principal lighting hours, district A
cations at which readings should be taken. These locations can be indicated by arrows on the secondary plates as shown in figure 1, using a color code for the arrows, for example, as follows:
Network System Night readings (lighting load)—yellow Day readings (industrial load)—green
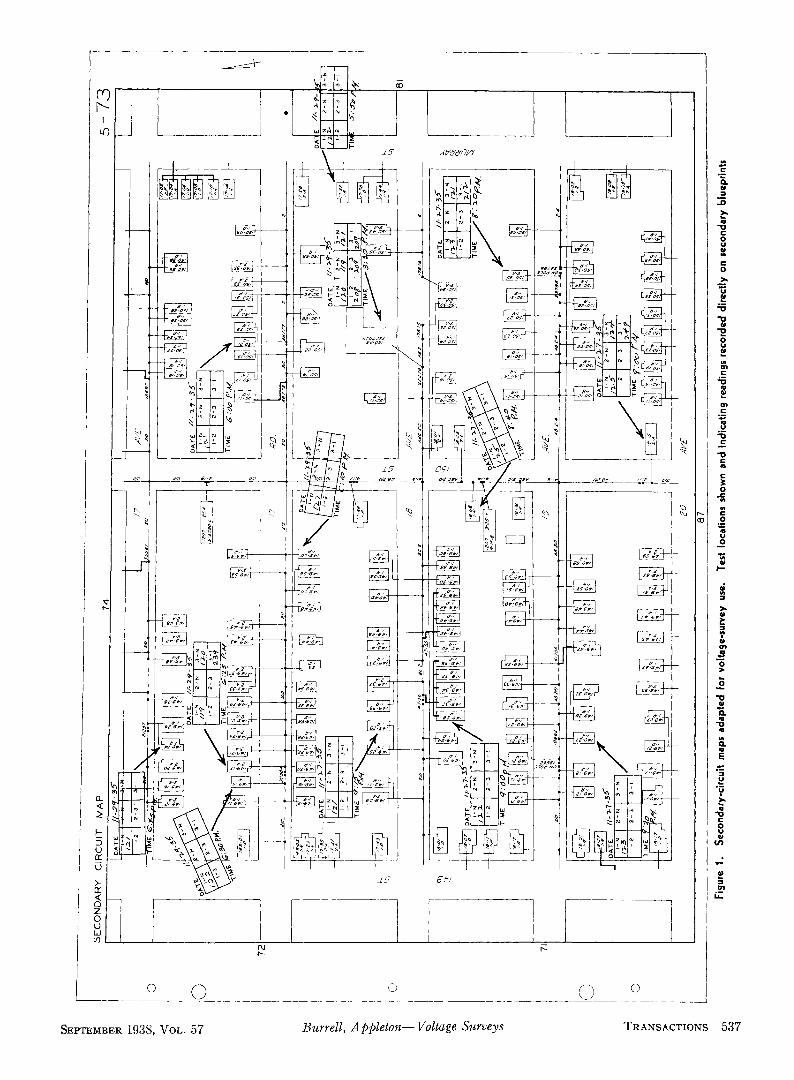
Figure 3. A -c radial-system voltage survey Readings outside normal range
Summary of all districts
Figures 2 (left) and 3 (above). Typical charts summarizing service voltage conditions on the distribution system as disclosed by the voltage
survey
Radial System Night readings (lighting load)—red Day readings (industrial load)—white
The differentiation by colors between network and radial systems will aid in the final classification of readings for tabulation purposes. The field forces are interested only in the distinction between day and night readings.
After a volume has been "marked up" for locations, box forms should be stamped on the blueprints, using contrasting indelible ink, adjacent to the arrows, as shown in figure 1. The box forms should be large enough to contain the readings recorded by the testers. After a sufficient area has been covered, the marked up plates should be sent out for field readings.
The plates should be marked up and forwarded to the field forces in the order in which it is desired to cover the system. The variation between peak loads in different districts can be considered and in some cases certain districts can be reserved for the later part of the survey to allow for the completion of certain system arrangements, substation cut-ins, feeder changes, etc.
Procedure for Field Test Forces
Voltage surveys covering large systems involve a considerable amount of field work. Although the test procedure is no different from that of routine tests, the personnel requirements are not so readily solved and may have a material influence on the specific form of procedure adopted.
The number of field men required depends mainly on whether graphic or in-indicating instruments are used and the length of time over which the survey is extended. Graphic instruments require the use of more experienced testers to
set up the instruments, see that the pens are inking properly, and to check the calibration of the graphic instruments. Where several graphic instruments are to be set up at a location, a crew of two men may not average more than one location per hour. Although locations may be farther apart on radial systems than on network systems, the time factor is partially balanced by the preponderance of three-phase locations on the network, which require more instruments.
In using graphic instruments, the peak-hour limitations are avoided, as the instruments are generally set for 24 hours and can be installed at any convenient time. Test crews therefore are able to spend a greater proportion of time in the field than is possible with indicating instruments, especially when readings are confined to the hours of 6:00 to 10:00 p.m.
Transportation of instruments by truck is desirable in connection with a graphic instrument survey. A light delivery truck can be used to deliver instruments at a dozen or so locations, with the field crews following by foot, trolley, or bus. A routing sheet will indicate to delivery crews and installation crews the locations to be covered by each.
The use of indicating instruments requires less time per location. The number of locations covered per man may average four or more per hour. The equipment carried by these men should be as light in weight as possible, consisting of not more than a voltmeter, leads, a small tool bag, and maps. A temperature correction curve for the voltmeter should be included as considerable variation in temperature may take place during an entire survey period, affecting readings as much as one or two volts. Indicating voltmeters should be tested daily for accuracy.
Each tester can be given a new set of maps daily, leaving the unfinished readings of several testers from the previous day to be completed by testers traveling in trucks. During severe winter weather or when taking readings in remote or scattered areas, the work can be expedited by operating multiman crews from trucks.
Each tester should make out a route record in duplicate, indicating the district in which the days work is to be done and the number of prints taken out. One copy of this should be kept for office record purposes and the other forwarded to the company's night service force to inform them of the work being done, as consumers may telephone to verify the authenticity of the tester. At the end of
538 TRANSACTIONS Burr ell, Appleton—Voltage Surveys ELECTRICAL ENGINEERING
the day the tester should check off on the office record copy the number of plates covered, the number of readings taken on each plate, total number of readings taken, and any irregularities, however slight.
The readings recorded on the prints should be rechecked by a clerical force to see if the readings appear normal. Unusual readings should be called to the attention of the engineer in charge of the voltage survey so that an investigation of conditions can be made without delay.
Where the scale of the secondary circuit maps is such that readings cannot be entered directly thereon, this procedure can be modified to specify addresses and to record test readings on standard test forms.
Recording of Tests, Classification and Tabulation of Results
TABULATION OF READINGS
The readings obtained by the field forces, whether indicating or graphic, will usually be referred to distribution engineers for analysis. The data must be tabulated before they can be classified. In the case of graphic voltage charts, it is desirable to record the low and high readings for each location together with the average voltage. It is desirable that transformer readings and end-of-secondary readings be tabulated separately so that the results may be weighted according to the number of readings of each type. A number of different classifications, for each district, may be necessary, as follows:
Network, radial, or d-c system
Transformer Secondary-locations locations
Day Night Day Night readings readings readings readings
PLOTTING READINGS ON MAPS
A useful summarized record of the results of a voltage survey may be obtained by plotting the readings on a map of the territory, drawn to some small scale. Where locations are too close together to permit plotting each reading, the average may be shown, particularly if the variation is not great. Such a map is of interest to executives and to the distribution engineers in obtaining a general view of system voltage conditions. Voltage-regulation conditions on individual feeders are advantageously revealed by plotting on detailed maps of each feeder the first consumer readings of each trans
former on the feeder. These maps assist the distribution engineers in studying regulation on individual feeders and on the system as a whole.
VOLTAGE SURVEY REPORTS
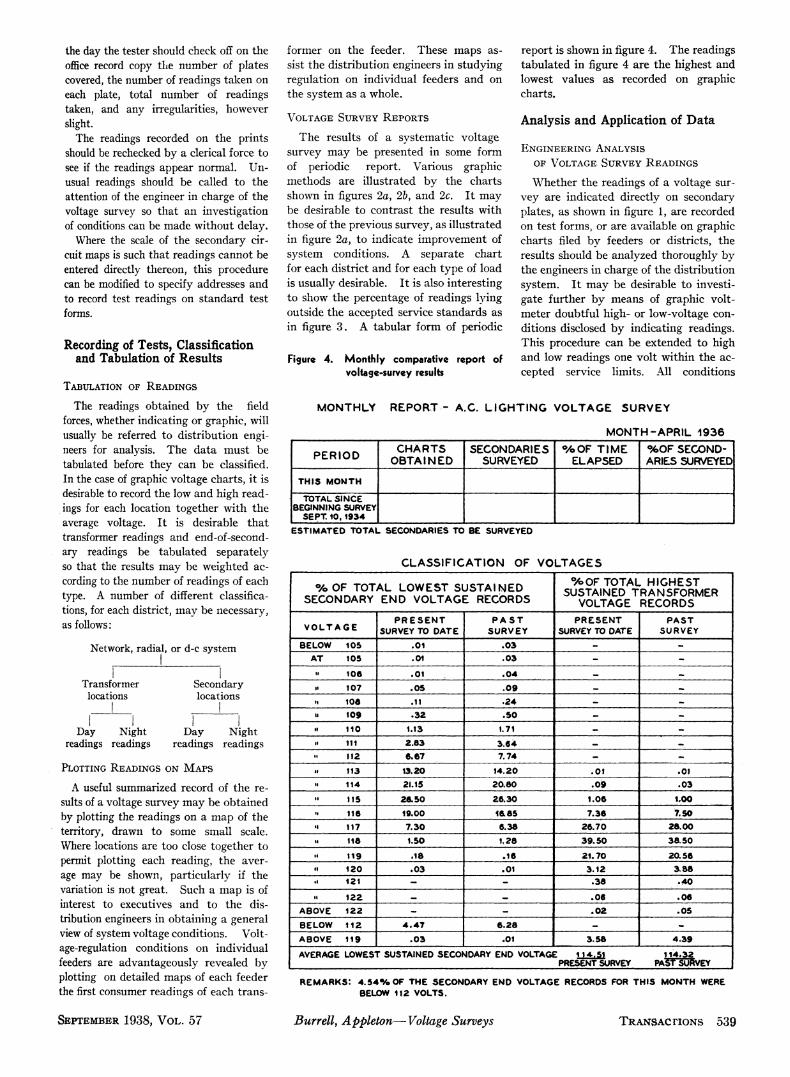
The results of a systematic voltage survey may be presented in some form of periodic report. Various graphic methods are illustrated by the charts shown in figures 2a, 2b, and 2c. I t may be desirable to contrast the results with those of the previous survey, as illustrated in figure 2a, to indicate improvement of system conditions. A separate chart for each district and for each type of load is usually desirable. It is also interesting to show the percentage of readings lying outside the accepted service standards as in figure 3 . A tabular form of periodic
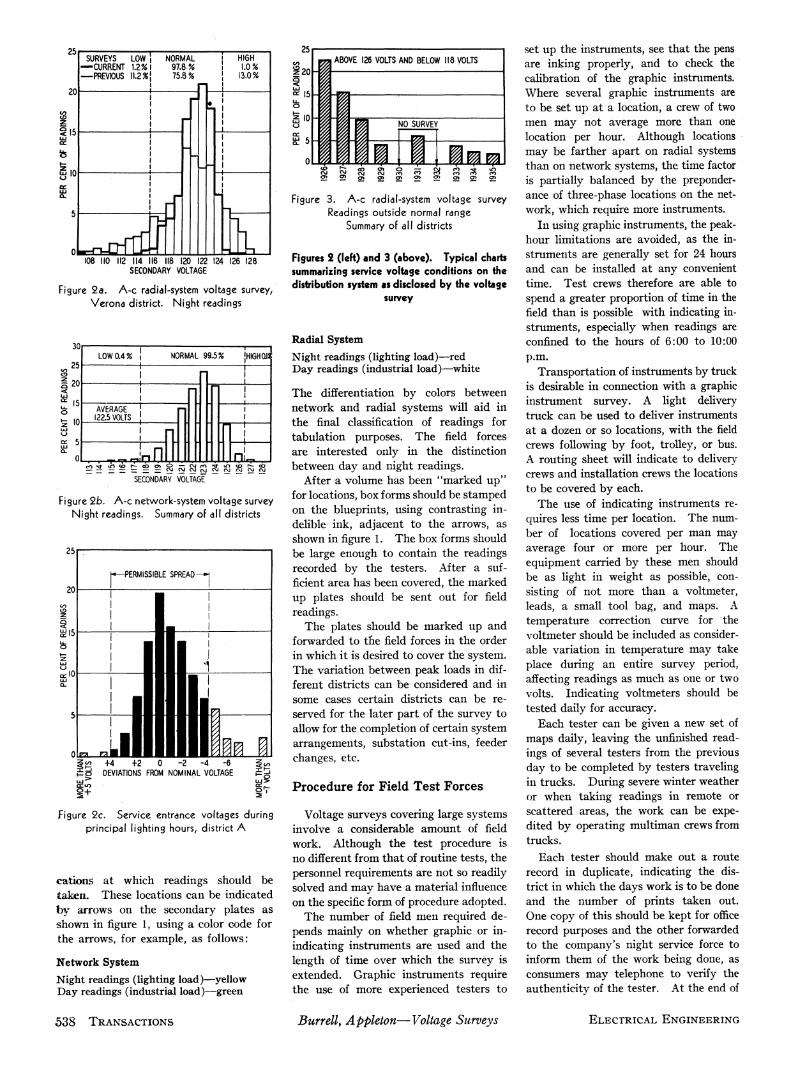
Figure 4. Monthly comparative report of voltage-survey results
report is shown in figure 4. The readings tabulated in figure 4 are the highest and lowest values as recorded on graphic charts.
Analysis and Application of Data
ENGINEERING ANALYSIS OF VOLTAGE SURVEY READINGS
Whether the readings of a voltage survey are indicated directly on secondary plates, as shown in figure 1, are recorded on test forms, or are available on graphic charts filed by feeders or districts, the results should be analyzed thoroughly by the engineers in charge of the distribution system. I t may be desirable to investigate further by means of graphic voltmeter doubtful high- or low-voltage conditions disclosed by indicating readings. This procedure can be extended to high and low readings one volt within the accepted service limits. All conditions
MONTHLY REPORT-- A.C. L IGHTING VOLTAGE SURVEY
MONTH-APRIL 1936
PERIOD
THIS M O N T H
TOTAL SINCE BEGINNING SURVEY
SEPT. 10,1934
CHARTS OBTAINED
SECONDARIES SURVEYED
% O F T IME ELAPSED
%OF SECOND-"] ARIES SURVEYED
ESTIMATED TOTAL SECONDARIES TO BE SURVEYED
CLASSIFICATION OF VOLTAGES
% O F TOTAL LOWEST SUSTAINED SECONDARY END VOLTAGE RECORDS
V O L T A G E
BELOW 105 I AT 105
" 106 M 107
1 M 106 u 109
| « 110 I M 111
112
1 ·· 113 M 114
115
1 " 116
I " . n7
I H 116
119 ·> 120
I ·· 121
1 2 2 ABOVE 1 2 2
BELOW 112
ABOVE 119
P R E S E N T SURVEY TO DATE
.01
.01
.01
. 0 5 .11 . 3 2
1.13 2.63 6.67
13.20 21.15
26.50
19.00 7.30 1.50
.16 . 0 3
-— -
4 . 4 7
. 0 3
P A S T SURVEY
. 0 3
. 03
. 0 4
. 0 9
.24
. 5 0
1.71
3.64 7.74
14.20 20.80
26.30
1665 6.38
1.28
.16 .01
---
6 .28
.01
°/oOF TOTAL HIGHEST l SUSTAINED TRANSFORMER
VOLTAGE RECORDS | P R E S E N T
SURVEY TO DATE
----
. ----. 01 . 0 9
1.06
7.36 26 .70
3 9 . 5 0
21.70 3.12
.38
. 0 6
. 0 2
-3.58
P A S T I SURVEY I
--. | - I
I I |
-. I -.01 1 . 03
1.00
7.50 26 .00
38.50
20.56 1 3.38
.40 1
.06 1
. 0 5
1 4.39 1
AVERAGE LOWEST SUSTAINED SECONDARY END VOLTAGE 114..51 114.32 1 1 PRESENT SURVEY PAST SURVEY |
REMARKS: 4 . 5 4 · * OF THE SECONDARY END VOLTAGE RECORDS FOR THIS MONTH WERE BELOW 112 VOLTS.
SEPTEMBER 1938, VOL. 57 Burrell, Appleton—Voltage Surveys TRANSACTIONS 539
finally determined to be above or below the accepted standards should be studied carefully to determine whether the subnormal condition is due to primary circuits, secondary mains, or service wires.
SYSTEM REINFORCEMENTS BASED ON SURVEY RESULTS
A voltage survey will disclose cases of low voltage due merely to inadequate service wires. These facilities may have been installed in accordance with old standards, inadequate for present-day loads. Such conditions are easily corrected.
Cases of unbalanced voltage will be revealed if all line-to-neutral readings are taken at each location. Some of these conditions can be corrected with little trouble by rebalancing secondary load.
Experience indicates that a high percentage of poor voltage conditions is due to the secondary mains. These conditions are indicated by analysis of the voltage survey data and may be remedied by replacing existing secondary with larger wire, by hanging additional transformers to cut down the length of second
ary feed, or in some cases merely by rearrangement of existing secondaries.
In some cases low-voltage conditions can be improved by raising feeder substation voltage, provided this does not lead to overvoltage conditions elsewhere. In other cases high voltage may require lowering substation voltage.
Low-voltage conditions may be found to be due to inadequate primary circuits. Where this occurs, redesign of primary circuits may be necessary. Additional voltage readings and load readings at various points on the circuit may be necessary in such cases to provide engineers with full information. The results of the voltage survey may justify the introduction of new feeders or new substation capacity.
Where general low-voltage conditions exist over an area of relatively high load density, engineering and economic considerations may warrant changeover to underground network supply. The extension of underground network on a step-by-step basis in urban territories where all distribution is planned ultimately to be underground, is facilitated by periodic voltage surveys to disclose which areas
first exceed the regulation limits of existing overhead facilities.
Conclusion
The readings of the systematic voltage survey, appropriately taken and carefully analyzed, provide the engineering justification for redesign of the distribution system to correct existing unsatisfactory voltage conditions. The periodic survey data, by revealing trends of regulation, make it possible, in planning system changes, to anticipate unsatisfactory conditions before service voltages actually fall outside the accepted standards of good service. The broad view obtained of system voltage conditions facilitates the consideration of various plans proposed, and is a helpful guide in considering the necessity for general system reinforcement and improvement projects.
It is not anticipated that a survey such as outlined in this paper need be made every year. As voltage conditions are improved, it may be found that a complete survey made every other year, or a policy of surveying a half or a third of the system each year may suffice.
540 TRANSACTIONS Burr ell, Appleton—Voltage Surveys ELECTRICAL ENGINEERING