systematic evaluation of run off road …drakopoa/web_documents/run-off-road_crashes...systematic...
TRANSCRIPT

SYSTEMATIC EVALUATION OF RUN OFF ROAD CRASH LOCATIONS IN WISCONSIN
FINAL REPORT
DECEMBER 2004

DISCLAIMER This research was funded by the Wisconsin Department of Transportation. The contents of this report reflect the views of the authors who are responsible for the facts and the accuracy of the data presented herein. The contents do not necessarily reflect the official views of the Wisconsin Department of Transportation at the time of publication. This document is disseminated under the sponsorship of the Department of Transportation in the interest of information exchange. The United States Government assumes no liability for its contents or use thereof. This report does not constitute a standard, specification, or regulation. The United States Government does not endorse products or manufacturers. Trade and manufacturers’ names appear in this report only because they are considered essential to the object of the document.

Technical Report Documentation Page
1. Report No.
2. Government Accession No
3. Recipient’s Catalog No
4. Title and Subtitle Systematic Evaluation Run-off-Road Crash Locations in Wisconsin
5. Report Date December 2004 6. Performing Organization Code
7. Authors Alex Drakopoulos and Ertan Ornek
8. Performing Organization Report No.
9. Performing Organization Name and Address Marquette University Department of Civil and Environmental Engineering P.O. Box 1881, Milwaukee, WI 53201-1881 and DAAR Engineering, Inc. 200 N. Jefferson Street, Suite 200 Milwaukee WI 53202-1791
10. Work Unit No. (TRAIS) 11. Contract or Grant No. WisDOT 0072-40-05
12. Sponsoring Agency Name and Address Wisconsin Department of Transportation (WisDOT) Hill Farms State Transportation Building 4802 Sheboygan Avenue Madion, WI 53707-7910
13. Type of Report and Period Covered Final: June 2002-December 2004 14. Sponsoring Agency Code
15. Supplementary Notes Research performed in cooperation with the Wisconsin Department of Transportation and the U.S. Department of Transportation, Federal Highway Administration.
Research Study Title: Systematic Evaluation of Intersection and Run-off-the-Road Crash Locations
16. Abstract In 2000 the Wisconsin Department of Transportation put forth a Strategic Highway Safety Plan, aligned with AASHTO-recommended safety actions aiming to reduce nation-wide fatalities by 5-7 thousand per year. The present effort was conceived within a state-wide action plan to keep vehicles on the roadway and minimize the consequences of leaving the roadway; it also aimed to improve state-wide data and decision support systems. A method to systematically identify crashes on undivided State Trunk Highways (STH) was developed; crash rates, crash densities (crashes/mile) and other safety statistics were developed; a floating highway segment algorithm (PRÈCIS) that can identify crash rates at any given point along any undivided STH was also developed. Statistics were produced for two- three- and four-lane urban and rural STH, with an emphasis on two-lane two-way rural undivided highways. 335,666 non-deer crashes were reported in the state of Wisconsin between 1998 and 2000. 143,117 of those crashes occurred on STH, 60,345 of which occurred on 9,474 miles of undivided STH. Most of this mileage is rural (8900 miles), with the majority being two-lane highways (8820 miles). Crash rates, crash densities and other statistics were developed for the undivided parts of each STH, and each number of lanes/population density (urban or rural) cohort. State-wide statistics were developed as well. Crash rates and crash densities were developed for all, non-intersection, and Run-off-Road crashes. Similar crash statistics for Run-off-Road crashes were calculated for injury & fatal, wet & snow, darkness, horizontal or vertical curve and fixed object crashes. For Run-off-Road crashes on two-lane rural STH, statistics were developed for overturn, fixed object, ditch, tree, guardrail, utility pole embankment and sign post crashes. Results of the floating highway segment algorithm PRÈCIS were plotted on a GIS-based map; color-coded continuous lines parallel to a given STH alignment indicated crash the crash rate at any given point along the STH; colored line charts accompanying the GIS map indicated crash rates at any mile point. The ability to produce special tables listing highway features and crash information (Interleaf tables) sorted by mile point was also provided. Two strategies for the identification of highway segments in need of safety improvements were provided.
17. Key Words Run off road crashes, undivided highway, crash rate, crash density, crashes per mile, state-wide safety evaluation, system wide safety evaluation, GIS safety tool, highway segment safety, floating highway segment, hazardous segment identification, fixed object crash rate
18. Distribution Statement No restriction. This document is available to the public through the National Technical Information Service, 5285 Port Royal Road, Springfield, VA 22161
18. Security Classif.(of this report) Unclassified
19. Security Classif. (of this page) Unclassified
20. No. of Pages
21. Price
Form DOT F 1700.7 (8-72) Reproduction of completed page authorized
iv
TABLE OF CONTENTS
EXECUTIVE SUMMARY………………………………………………………. viii INTRODUCTION………………………………………………………………… 1 REPORT ORGANIZATION …………………………………………………….. 2 PROJECT MOTIVATION………………………………………………………… 2 PROJECT OBJECTIVES…………………………………………………………. 3 CHALLENGES……………………………………………………………………. 4 METHODOLOGY……………………………………………………………… 4 PRODUCTS and their USES …………………………………………………….. 8 CRASH STATISTICS…………………………………………………………… 16 CONCLUSIONS………………………………………………………………….. 25 DISCUSSION……………………………………………………………………… 26 RECOMMENDATIONS………………………………………………………….. 27 ACKNOWLEDGMENTS………………………………………………………… 28

v
LIST OF TABLES Table 1. Highway Miles and Travel Comparisons: Metamanager and BHO Statistics………………………………………………… 5 Table 2. Metamanager Highway Miles and Travel Data for Other
Rural and Urban STH………………………………………… 6 Table 3. 2000 Fixed Objects Struck by Crash Severity and
Urban/Rural Location………………………………………… 7 Table 4. Quick reference to Aggregate (column Tbl) and
Disaggregate (column Appx) Statistics………………………… 20 Table 5. Undivided STH state-wide statistics: All, Non-Intersection,
Run-off-Road Crashes…………………………………………… 21 Table 6. Undivided STH State-Wide Crash Rates for Select
Run-off-Road Crash Categories………………………………… 22 Table 7. Undivided STH State-Wide Crash Densities for Select
Run-off-Road Crash Categories…………………………………. 23 Table 8. Two-lane Rural STH Crash Rates for Select
Run-off-Road Crash Categories…………………………………. 24 Table 9. Two-lane Rural STH Crash Densities for Select
Run-off-Road Crash Categories…………………………………. 24 Table 10. BHO State-wide Average Crash Rates-Deer Crashes Excluded… 25

vi
LIST OF FIGURES
Figure 1. Sample PRÈCIS map: STH 14 Minnesota Border to
Illinois Border (198.43 miles)…………………………………. 12
Figure 2. Detail of Figure 1 PRÈCIS map………………………………. 13

vii
LIST OF APPENDICES Appendix A Crash Rates and Crash Densities for 2- 3- and 4-Lane
Urban and Rural Undivided STH Appendix B ROR Crash Rates for Serious Outcome, Slippery Pavement,
Dark Conditions, Horizontal or Vertical Curve, and Fixed Object Crashes on 2- 3- and 4-Lane Urban and Rural Undivided STH
Appendix C ROR Crash Densities for Serious Outcome, Slippery Pavement,
Dark Conditions, Horizontal or Vertical Curve, and Fixed Object Crashes on 2- 3- and 4-Lane Urban and Rural Undivided STH
Appendix D ROR Crash Rates for Overturn, Fixed Object, Ditch, Tree, Guardrail,
Utility Pole, Embankment and Sign Post Crashes on Two-Lane Rural Undivided STH
Appendix E ROR Crash Densities for Overturn, Fixed Object, Ditch, Tree,
Guardrail, Utility Pole, Embankment and Sign Post Crashes on Two-Lane Rural Undivided STH
Appendix F ROR Crash/State Trunk Highway Log Interleaf Table for STH 14 Appendix G Two-Lane Rural Undivided STH Rank-Ordered by Various
Crash Rates, Crash Densities and Ratios of Select Crash Types Appendix H ROR Crash Statistics for Rural Undivided Two-Lane Two-Way STH Appendix I PRÈCIS Intelligent Map-Based Highway-Wide Safety Review Tool
Description

viii
EXECUTIVE SUMMARY
The project focused on developing a methodology to identify Run-off-Road (ROR), non-intersection crashes that occurred on the two-lane undivided portions of State Trunk Highways (STH) in the State of Wisconsin. The objectives of this project were to calculate crash statistics and identify locations requiring safety improvements using a state-wide systematic methodology. The project addressed two of the seven action plans listed in the 2000 Wisconsin Department of Transportation (WisDOT) Strategic Highway Safety Plan, namely:
• Improve data and decision support systems; and • Keep vehicles on the roadway/minimize the consequences of leaving the
roadway.
Project objectives were met by developing state-wide and highway-specific statistics (crash rates, crash densities and other statistics) for a variety of Run-off-Road crash characteristics, and proposing strategies to evaluate the safety performance of all STH based on these statistics.
Two strategies for the systematic identification, stratification and analysis of crash locations were proposed. The first strategy required two sequential steps:
1. Multiple rankings of all State Trunk Highways based on selected crash characteristics are used to select a limited number of STH for examination.
2. Particular segments of the selected highways that require further examination for potential treatment are determined with the help of the “floating highway segment” algorithm PRÈCIS. (Details in Appendix I.)
The second strategy required processing all undivided STH through the PRÈCIS algorithm and selecting segments with high crash rates for treatment. In meeting project objectives major emphasis was placed on producing a user-friendly methodology, using existing databases in an automated manner. The proposed strategies were based on a simple tabular format, using a locational reference in wide use within WisDOT. GIS-based maps presenting PRÈCIS results provided simple locational references, and crash rates at any point along a STH were presented by color-coded continuous lines parallel to the centerline with additional line charts providing more detailed crash rates at any mile point. The three databases used in the project (crash, Metamanager, and State Trunk Highway Log) preexisted and were consistently updated each year. The developed methodology to produce tabular state-wide statistics is automated to a great extent, requiring minimal labor for annual table updates. With some additional work on automating the state-wide application of PRÈCIS tables and the GIS maps displaying the information they contain, a set of maps could be created annually with minimal labor expenditure.

ix
A wide array of crash statistics were produced for Run-off-Road crashes on the 9,471 miles of undivided STH in the state of Wisconsin. A quick reference to appropriate tables is provided in Table 4. Between 1998 and 2000 a total of 60,345 crashes occurred on the 9,471 miles of undivided STH. Most (34,604) took place on rural highways (8,901 miles), where most crashes (21,947) occurred at non-intersection locations. Among those, 11,803 were Run-off-Road crashes including 207 fatal and 4,972 injury crashes. Relationships between two-lane rural highway Run-off-Road crash characteristics and severity were examined in detail in Appendix H. A high percentage of fatal crashes (62.2%) occurred during nighttime—only 44% of all ROR crashes occurred during nighttime. Most fatal crashes (74.8%) occurred on dry pavements with a relatively small percentage (9.4%) occurring on pavements covered with snow, slush or ice. Statistics for all ROR crashes were 53.8% and 33.3% respectively. A large percentage of fatal crashes involved overturning vehicles (40.5%)-the overall percentage was 26.4% for ROR crashes. A disproportionate number of crashes involving motorcyclists were fatal (6.5% of all fatal crashes) given that motorcyclists were involved in 1.9% of all crashes. The state-wide crash rate for undivided STH was 144 crashes/ 100MVM; the rate was 99 crashes/100MVM for rural highways and 368 crashes/100MVM for urban highways. Two-lane rural highways had a rate of 96 crashes/100MVM; the non-intersection rate was 62 crashes/100MVM and the ROR rate was 34 crashes/100MVM. The state-wide crash density for undivided STH was 2 crashes/mile/year (crashes/mi/yr); urban density was 15 crashes/mi/yr; rural was 1.3 crashes/mi/yr. Two-lane rural was 1.2 crashes/mi/yr. On the same highways, the non-intersection crash density was 0.8 crashes/mi/yr and ROR density was 0.4 crashes/mi/yr. It is recommended to include additional years of crash experience in ROR crash statistics calculations. A systematic review of results produced in the course of the present effort would be desirable; highway segments selected for safety upgrades should be documented and available through a WisDOT safety clearinghouse. It is recommended to generate a set of maps, one for each STH, to display crash rates generated through the PRÈCIS algorithm, and make them available through the safety clearinghouse.

1
INTRODUCTION The project focused on developing a methodology to identify Run-off-Road (ROR), non-intersection crashes that occurred on the two-lane undivided portions of State Trunk Highways (STH) in the State of Wisconsin. The objectives of this project were to calculate crash statistics and identify locations requiring safety improvements using a state-wide systematic methodology. The objectives were met by developing state-wide statistics (crash rates and crash densities) for a variety of Run-off-Road crash characteristics, at three levels of aggregation:
i. State-wide ii. Each highway (e.g., STH 014)
iii. Specific highway segments (between mile point A and mile point B)
Two strategies for the systematic identification, stratification and analysis of crash locations are proposed, based on the above-mentioned statistics. The first strategy is based on two sequential steps:
1. Multiple rankings of all State Trunk Highways based on selected crash characteristics are used to select a limited number of highways for examination.
2. Particular segments of the selected highways that require further examination for potential treatment are determined with the help of the “floating highway segment” algorithm PRÈCIS.
The second strategy relied solely on a “floating highway segment” algorithm (PRÈCIS), developed to produce crash rates at each point of each State Trunk Highway (STH): after all State Trunk Highways have been processed through PRÈCIS, locations with particularly high crash rates are identified for closer examination and potential treatment. The initial scope of this project was limited to two-lane undivided rural highways with two-way traffic, but this scope was expanded where possible to include three- and four-lane undivided highways both in the urban and the rural environment. Collisions with deer were excluded from the analysis. Crash characteristics for which statistics were developed were chosen based on two criteria: prominent crash characteristics that emerged through an analysis of three years (1998-2000) of state-wide ROR, non-intersection crashes on undivided STH, and crash characteristics for which corrective treatment is readily available (e.g., unusually high proportion of nighttime crashes for which corrective treatment includes reflectors, reflective lane and edge of pavement lines, chevron signs on curves etc.) Statistics for each STH are presented in lists, organized by STH number, or rank-ordered according to a specific statistic. Crash rates, calculated using the floating segment algorithm PRÈCIS are presented in maps (one map per highway), and special tables. PRÈCIS maps include color-coded lines parallel to the highway centerline, indicating crash rate ranges. Line charts at the bottom of each map indicate the crash rate at each

2
mile point along the highway. All major and many minor intersecting facilities are plotted and identified by name on each map. Special Interleaf tables present information about each crash and descriptions of features along a given highway, organized by increasing mile point. Crash and highway features are positioned at exact mile points. The developed products and proposed strategies for their use provide systematic ways to examine all STH and identify a set of highway segments which may be in the greatest need of safety improvements. Safety Engineers are expected to examine each identified segment in much finer detail, using as-built plans, photolog records, individual crash report hard copies and field visits; this finer detail examination is beyond the scope of the current project. REPORT ORGANIZATION The body of the report provides a description of the Project Motivation, the Project Objectives and a brief description of the main Challenges that had to be overcome. The Methodology section provides a brief overview of crash and Metamanager data validations performed at the outset of the project, and a summary of the produced types of statistics. The Products and their Uses section describes the four types of produced tabular products and the GIS maps produced using the PRÈCIS algorithm. A table use example is provided as well as suggestions for the use of the GIS maps. Extensive tables are provided in Appendices A through G. More details about the GIS maps and PRÈCIS output are presented in Appendix I. Two product use strategies are described. The Crash Statistics section provides general state-wide statistics. The analysis focus progressively narrows down from state-wide frequencies, to Run-off-Road crashes on two-lane rural undivided STH, that are supported by Appendix H. Crash rates and densities are presented next. Table 4 provides a quick reference to aggregate statistics (Tables 5-9) and disaggregate statistics (Appendices A through E). The Conclusions section describes the accomplishments of this effort. The difficulty of addressing the widely scattered ROR crashes is addressed in the brief Discussion section. Five Recommendations conclude the body of the report. PROJECT MOTIVATION In 1999, the Wisconsin Department of Transportation (WisDOT) identified safety as a priority area for the agency. The next year, representatives from WisDOT, AAA, Academia, NHTSA, FHWA, AARP, the courts, the media and the legislature, reviewed a list of 22 AASHTO-recommended safety actions that could save 5,000-7,000 lives nationwide each year and arrived at seven action plans to improve traffic safety. These action plans, found in the WisDOT Strategic Highway Safety Plan were:
3
1. Institute Graduated Driver Licensing. 2. Improve the design and operation of intersections. 3. Increase seat belt use. 4. Increase driver safety awareness. 5. Improve data and decision support systems. 6. Keep vehicles on the roadway/minimize the consequences of leaving the
roadway. 7. Reduce impaired driving.
The first part of this research effort (systematic evaluation of intersection crashes) addressed action plan number 2; the present part of the effort (systematic evaluation of run-off-road crashes) addressed action plan number 6; both parts addressed action plan number 5. PROJECT OBJECTIVES It was desired to develop a state-wide methodology to evaluate ROR crashes on undivided two-lane two-way rural STH. The methodology was to be developed within a tight time frame; had to be simple, not requiring special skills to use it; had to require minimal maintenance labor. To achieve the short development time frame, the methodology would have to rely on existing databases as much as possible. An automated procedure would be desirable in order to save future maintenance labor costs. Because non-intersection run-off-road crashes were expected to be scattered along highways, it was necessary to develop a sense of “crash density” (crashes per mile), in order to identify highway segments with particularly high crash densities. Although crash rates for some Run-off-Road crashes had already been identified by WisDOT, these rates were based on sequential highway segments of widely unequal lengths. A crash analysis using sequential highway segments may miss crash concentrations, if such concentrations happen to be split across two consecutive segments (crash rates for each segment will be based on a fraction of the crash concentration). The presence of short highway sections can lead to wide crash rate fluctuations, since relatively little travel will occur on short segments, thus even a few crashes will lead to high crash rates. Longer highway segments would be desired to provide crash rate stability, and ideally, all segments should be of equal length, if crash rate comparisons are to be performed between different parts of a highway. The floating highway segment algorithm (PRÈCIS), adopted in the present effort successfully addressed the problems associated with the use of sequential and unequal length segments mentioned above. PRÈCIS uses a standard length of highway--e.g., a one-mile segment; calculates a crash rate, then the segment moves downstream by a small distance--e.g., 1/100th of a mile—and a new crash rate is calculated, and so-on-and-so-forth, until the entire length of a highway is examined. This method guarantees that no crash concentration is missed along the entire length of the highway. Furthermore, use of a uniform segment length allows fair comparisons between any parts of the analyzed highway.

4
CHALLENGES Calculation of crash densities and the application of the floating highway segment method required that:
1. Crashes along an entire highway could be identified. 2. Distances between crashes could be readily determined, along the entire length of
a highway. 3. Findings could be reported based on a linear referencing system that WisDOT
Engineers were familiar with. As simple as these three requirements appear to be, no single database existed that could satisfy all three. The first item presented a challenge because many highway segments are concurrent between different routes. For example, STH 014 is concurrent with STH 012 between mile point 122.55 and mile point 132.23. Selecting crashes along the entire 200-mile length of STH 014 required manual intervention to properly identify crashes along the concurrent segment. Given that there are approximately 300 STH, and many concurrent segments, identification of all crashes along all STH would require a significant amount of labor, unless the process of matching crashes to highways (including all concurrent segments) was automated. The second item presented a challenge because the crash location referencing system used by WisDOT is based on “Reference Points,” that is, the distance of a crash from a highway feature. Because highway features are not evenly spaced, and because each crash is referenced only to the closest upstream highway feature, calculating distances between crashes is not a straight-forward task. The third item presented a challenge because, even if distances between crashes could be calculated, what would be important to the Engineer reviewing the safety of a given highway would be the location of a crash on a commonly used continuous linear mile point referencing system. In other words, it would not be enough to be able to identify crash concentrations, but the limits of these concentrations would have to be identified precisely on a highway log that could be related to the locations of highway features in the field, as-built plans, new construction plans, and/or photolog records. METHODOLOGY Development of crash rates and crash densities (crashes per mile) for two-lane rural highways required the identification of the subset of crashes of interest; travel information (ADT and the length of highway on which this travel was observed) was also necessary. Crash records could not readily be associated with travel, number of lanes, urban/rural, divided/undivided etc. information which would have allowed the selection of crashes of interest. This critical information was extracted from the Metamanager WisDOT database, validated, and merged with crash records for the purposes of this project.

5
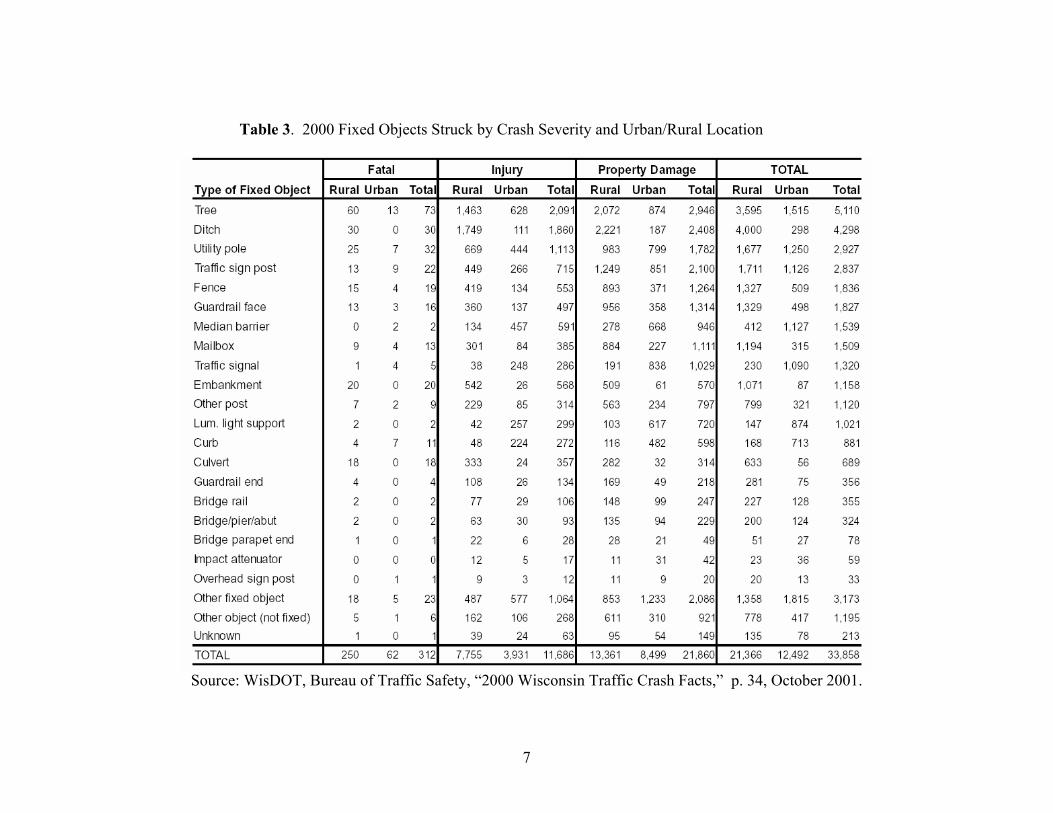
Travel information from the Metamanager database was validated against published WisDOT travel statistics. State-wide STH crash data were validated against annual Bureau of Traffic Safety (BOTS) statistics in order to establish the reliability of the analyzed database. Metamanager and crash data were merged; non-deer crashes on undivided STH were selected; definitions of non-intersection and run-off-road crashes were applied. Crash locations were categorized into rural and urban and further classified into two- three- and four-lane highways; crash rates and crash densities were calculated; crash statistics tabulations and maps were produced. Database validation Travel information from the Metamanager database was validated against published WisDOT travel statistics. Table 1 presents comparisons between the two sources of information. Highway length information matched to within 3% for the 11, 753 miles of the STH system; travel information matched to within 5%. Metamanager information reflected 2002 statistics; published WisDOT statistics were for 2000. The higher travel figures in Metamanager were reasonable, given the increasing travel trends in Wisconsin. Categories “Other Rural STH” and “Other Urban STH” were subdivided into statistics for Divided, Undivided and One-Way highways in the Metamanager database (Table 2). Fixed object collision information presented in the “2000 Wisconsin Traffic Crash Facts1” publication (Table 3) was validated against the state-wide year 2000 crash database used in this project; statistics were exactly matched for each type of fixed object; however, urban/rural definitions used by BOTS differed from those used in Metamanager. The BOTS table2 presents each object hit in a crash; multiple entries are counted when multiple objects were hit (e.g., one crash involved nine objects: 3 mailboxes, 4 sign posts, 1 tree, 1 “other” object).
Table 1. Highway Miles and Travel Comparisons: Metamanager and BHO Statistics.
Meta (2002)
BHO (2000) % Diff
Meta (2002)
BHO (2000) % Diff
Rural Interstate 585 580 -1 67.81 64.41 -5Urban Interstate 158 163 3 39.86 38.05 -5Other Rural STH 9732 9729 0 157.18 157.38 0Other Urban STH 1260 1281 2 91.62 86.73 -5Total STH 11735 11753 0 356.47 346.57 -3
Miles Travel (100 MVM)
1 WisDOT, Bureau of Traffic Safety (BOTS) 2 Table “2000 Fixed Objects Struck by Crash Severity and Urban/Rural Location” p. 34 Wisconsin Traffic Crash Facts, WisDOT, BOTS, 2000.

6
Table 2. Metamanager Highway Miles and Travel Data for Other Rural and Urban STH.
Other Rural STH Miles 100 MVMUndivided 8904 116.27Divided 819 40.66One-way 9 0.25Subtotal 9732 157.18
Other Urban STH Miles 100 MVMUndivided 570 23.31Divided 644 66.71One-way 46 1.6Subtotal 1260 91.62
Calculated crash statistics Once crash and Metamanager records were merged, it was possible to identify crashes of interest (run-off-road, non-intersection) on highways with specific characteristics (number of lanes, urban or rural, undivided). State-wide statistics (crash rates and crash densities) were developed for a variety of crash characteristics (listed below), at three levels of aggregation:
i. State-wide ii. Each highway (e.g., STH 014)
iii. Specific highway segments (between mile point A and mile point B) The following statistics were calculated for the Undivided parts of each STH, and aggregated at the state-wide level by number of lanes and by urban or rural locations:
• Analyzed Length, • Annual Travel (100 MVM), • Number of Crashes in three years • Crash Densities (Crashes per Mile per Year), and • Crash Rates (Crashes per 100 MVM) for:
o All Crashes o Non-Intersection Crashes o Run-off-Road Crashes
7
Table 3. 2000 Fixed Objects Struck by Crash Severity and Urban/Rural Location
Source: WisDOT, Bureau of Traffic Safety, “2000 Wisconsin Traffic Crash Facts,” p. 34, October 2001.

8
In addition, the following ratios were calculated: • Non-Intersection to Total crashes • Run-off-Road to Non-Intersection crashes • Run-off-Road to Total crashes
A closer examination of Run-off-Road crashes on two-lane undivided STH was based on the:
• Total Number of Crashes in three years • Crash Rate • Crash Density, for crashes involving:
o Run-off-Road o Overturned Vehicles o Fixed Objects o Ditches o Trees o Guardrails o Utility Poles o Embankments o Sign Posts
The following ratios, focusing on Run-off-Road crashes were calculated:
• Injury + Fatal to Run-off-Road • Wet + Snow pavement to Run-off-Road • Dark to Run-off-Road • Horizontal or Vertical Curve to Run-off-Road • Fixed Object to Run-off-Road
In addition to the above statistics, an algorithm (PRÈCIS) was developed to produce crash rates at each point along an analyzed STH. PRÈCIS produced results based on the floating segment method (described in the previous section). A one-mile floating segment, progressing along a highway at 1/10 mile increments was used to produce crash rates for all and Run-off-Road crashes along the entire length of two-lane, non-divided sections of STH 014. PRÈCIS’s flexible architecture allows any floating segment length and any amount of downstream increment that a user may desire. PRÈCIS is capable of producing crash rates (e.g., crash rate for total and run-off-road crashes) and number of crashes at each point along the entire length of a highway. PRODUCTS and their USES Introduction Emphasis was placed from the outset on creating an effective user interface for result dissemination. It was envisioned that the developed methodology would produce highway segments in need of safety enhancements; Engineers would need to precisely identify the termini of these segments on a map or an engineering drawing. Results would be presented in tabular form; wherever location references were necessary, it was

9
desired to use a system in broad use within WisDOT, such as the Reference Point system, or the cumulative mile point system used in the State Trunk Highway Log (STHL) listings. Because of the need to refer to a STLH printout in order to determine the cumulative mile points of locations identified by Reference Point and their offsets from those Reference Points, using the cumulative mile point directly was the preferred result presentation method. PRÈCIS results were best presented in a graphic form: crash rate ranges were identified by the color of continuous strips placed parallel to the highway alignment; crash rates along a highway were presented in continuous line graphs providing crash rates at any mile point. Tabular products Four types of tables were produced for undivided parts of STH; their contents are briefly described in items 1.- 4. below. Table listings are presented in Appendices A-G.
1. Crash rates and crash densities for all, non-intersection and ROR crashes.
2. Crash rates and crash densities for ROR crashes: with serious outcomes (injury and fatal); on wet pavement; under darkness conditions; on horizontal or vertical curves; or involving fixed objects.
3. Crash rates and crash densities for ROR crash subcategories: involving overturned
vehicles, fixed objects, ditches, trees, guardrails, utility poles, embankments, and sign posts.
4. Interleaved STH Log and crash record listing for the entire length of 198.43
miles of STH 014 including the concurrency with STH 12 between mile points 122.55 and 132.23.
Table types 1.- 3. present statistics for each undivided STH, as well as cumulative statistics for each number of lanes/population density cohort, individual population density categories and state-wide statistics. Records were sorted by STH number within each analyzed cohort. Table type 4. summarized one STH at a time. Records were sorted by the cumulative mile listed in the STH Log. A number of derivative tables, based on the first two table types were produced. Selected variables from the original tables were listed and additional statistics were calculated (for example the ratio of non-intersection to total crashes, the ratio of ROR to non-intersection crashes, or the ratio of ROR to total crashes). Derivative tables were sorted by a crash rate, a crash density, a particular ratio, or a sum of ratios. One-page sample pages of derivative tables are presented in Appendix G. A summary of the variables included in each table, the undivided STH categories included in each table and the variable used for sorting each table is presented in introduction of Appendix G.

10
Table use Crash rate/ crash density tables: Rank-ordered derivative tables provide Safety Engineers with the necessary tools to choose STH with poor safety performance for treatment. It is proposed that a number of STH tables rank-ordered by crash rate or other safety statistics are consulted simultaneously. For example Tables G1, G3 and G7 could be used to select a small number of STH that have the highest crash rates for total, non-intersection and run-off-road crashes. The Safety Engineer will consult Table G1 to identify STH with high crash rates, making sure that there is a large enough set of crashes to be treated. Table G3 will then be consulted to identify which of these highways are also at the top of the injury and fatal crash rate listing. Identified STH will then be checked to see if they are also high-ranking in Tables G7 indicating high crash rates for fixed-object crashes. STH found to be near the top positions of all three tables would be chosen for closer examination through PRÈCIS maps and sources of information outside the scope of this project (photolog pictures, crash record hard copies, field visits etc.) Example STH 171 has the highest ROR crash rate (rank #1 Table G1). Its undivided length is 33.25 miles with 42 crashes in three years. Given the substantial analysis length and number of crashes, the investigation proceeds with the examination of Table G3 (injury + fatal crash rate) in which STH 171 also ranks near the top (#2). Thus Table G7 (fixed object crash rate) is consulted. Again, STH 171 is at the top of the list (#1). (In fact, STH 171 ranks high in terms of all crash rates presented in Appendix G tables). Thus, STH 171 is a good candidate for further analysis using the PRÈCIS algorithm, the STH Log Interleaf table and additional sources of information, outside the scope of this project. A safety review of undivided STH could be broadened by including an examination of crash rates for all crashes, all non-intersection crashes (statistics provided in Appendix A) etc., depending on the issue at hand. Ratios of ROR to non-intersection, ROR to all crashes etc. can also be included in the calculated statistics, in order to identify locations with particularly pronounced ROR crash problems. Interleaved STH Log and crash record tables: Provide State Trunk Highway Log (STH Log) information (county, reference point number, cumulative mile point and associated highway feature), and crash information along a selected STH. Records are listed by increasing cumulative mile point. The Safety Engineer can readily identify crash locations and associate various crash characteristics (e.g., object hit, pavement condition) with crash patterns at these locations. Identified crash patterns, together with information from other sources (photolog pictures, as-built plans, field visits) will lead to specific safety countermeasures.

11
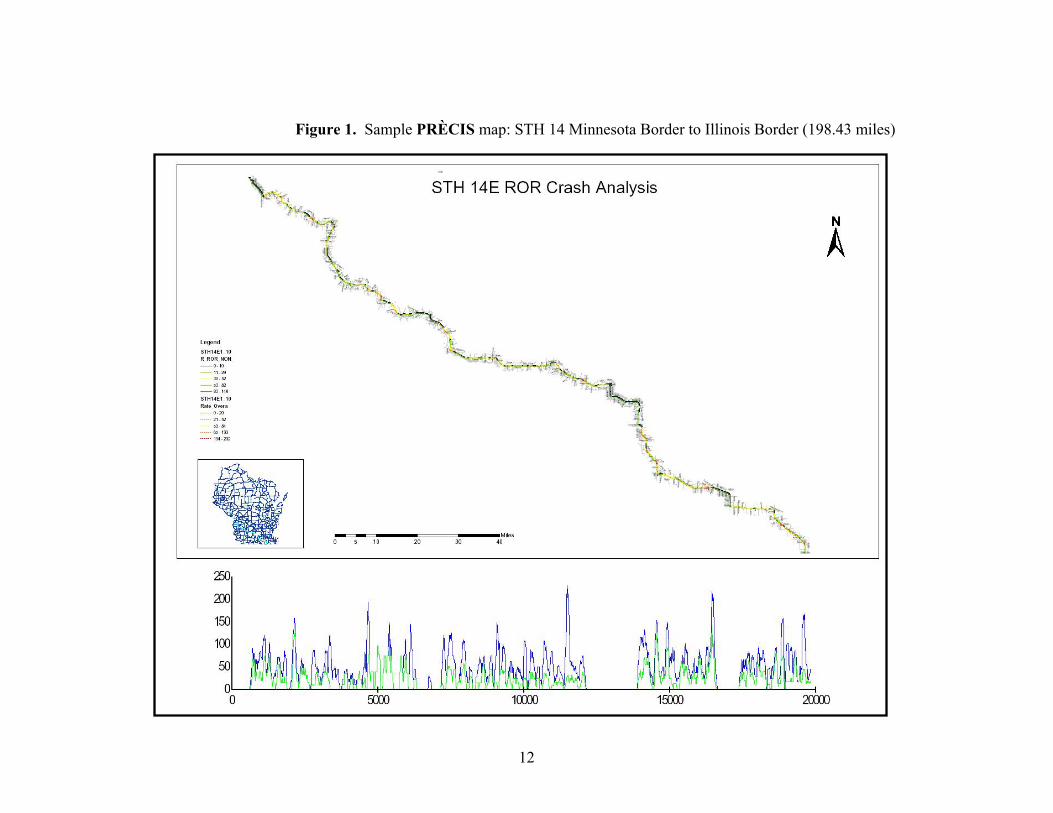
PRÈCIS Maps Crash rates produced with the PRÈCIS algorithm are presented in maps similar to the one in Figure 1. The map is created using the existing WisDOT Metamanager database, on which additional information, the PRÈCIS output, is displayed in color-coded graphical form. Figure 1 presents the entire length of STH 014 (198.43 miles) from the Minnesota border to the Illinois border (the location of STH 014 in Wisconsin is demonstrated on the small insert map near the bottom left of Figure 1). Locations of all intersecting streets are shown on the map (Figure 2); the names of all major intersecting streets are printed, along with many names of minor intersecting streets. Cities, Towns and Villages can be identified visually. Crash rates for non-intersection and run-off-road crashes are presented with lines parallel to the alignment of STH 014; the thin line represents crash rate range for non-intersection crashes; the thick line represents ROR crash rate; color meaning is indicated on the map legend. The line graph at the bottom of Figure 1 presents crash rates along the entire length of STH 014. Crash rates (in crashes per 100 MVM) are measured along the y-axis. The horizontal axis presents cumulative mile point (from the STH Log) along STH 014. The crash rate for non-intersection crashes at any point along the highway is presented in a blue line. The green line presents the crash rate for ROR crashes. Only non-intersection crashes on two-lane undivided sections of STH 014 are presented, thus no crashes are shown on divided sections. Detailed information about PRÈCIS and the underlying database are presented in Appendix I. PRÈCIS Map use Produced graphics provide Safety Engineers with the ability to quickly identify high crash rate locations within a given highway. The map indicates whether a high-crash location is on a tangent segment or a segment containing curves, whether the segment is close or away from city/town/village limits, whether there are many or few cross-streets. Names of intersecting streets provide a good general orientation. Additional information overlaid with the map, such as aerial photos and land use maps can provide supporting information (such information is routinely integrated with WisDOT GIS maps). The line graph at the bottom of the figure can be used in a variety of ways: parts of the graph that exceed the average crash rate for the entire STH (information available from tabular listings) can be targeted for a closer safety scrutiny; the ratio of run-off-road crashes to non-intersection crashes can be used to identify highway segments that would benefit from ROR-focused safety treatments. Because the horizontal axis is the cumulative mile point used in the STH Log, segments can be identified precisely. It should be noted here that the user should consult the number of crashes in order to decide whether a high crash rate is based on an adequate number of crashes, or not.
12
Figure 1. Sample PRÈCIS map: STH 14 Minnesota Border to Illinois Border (198.43 miles)

13
Figure 2. Detail of Figure 1 PRÈCIS map.

14
Map information can be correlated with the STH Log Interleaf tabular information for segments where closer scrutiny is desired: the STH Log will provide the exact locations of driveways, cross-streets, bridges, and other roadway features; because the Interleaf table can include any information from the Metamanager database, ADT, number of lanes, roadway width, shoulder width, pavement construction dates and a whole host of additional information can be reviewed for targeted segments. Similarly, any crash record information can be included in the Interleaf table, creating a very powerful tool applicable to a wide variety of applications. Thus PRÈCIS-basedmaps provide a tool to quickly identify the precise limits of highway segments in need of treatment, and an interface with a variety of databases. Interfaces with other databases can help address a wide range of traffic safety issues and link these issues with traffic safety and highway planning/design project development. Within the narrow scope of the present project, targeted highway segments can include those with high crash rates in collisions with utility and sign posts, those with high ROR crash rates on narrow lanes etc. Proposed product use strategies Two strategies for using the produced databases to sort through state-wide crash data and identify highway segments in need of safety improvements are proposed here:
1. Until all STH are processed through PRÈCIS, the already available tabular listings of all STH can be used to select a number of STH, those with the highest crash rates for closer examination. PRÈCIS maps will then be created for the selected STH, and segments within those STH will be chosen for treatment.
2. When all STH have been processed through PRÈCIS, it will be possible to select
the highway segments with the highest crash rates state-wide, without the need to identify a specific STH first.
The first strategy is a short-term strategy with the benefit that highway-specific crash statistics have already been produced in an automated way. STH have been rank-ordered based on these statistics. Choosing a limited number of STH for treatment can be accomplished with minimal labor expenditure, in the manner described in a previous section. The more labor-intensive PRÈCIS map production part will be limited to the chosen highways. A PRÈCIS map will be produced for each, and segments with high crash rates will be chosen for treatment. The disadvantage of this strategy is that it is based on average crash statistics for the entire undivided length of each STH. Thus, segments with particularly high crash rates will be “masked” among the average values of the STH being analyzed. However, the strategy is valid in that run-off-road crashes are not expected to be related so much to

15
spot locations, but more likely to highway segment characteristics (lane width, shoulder width, poor delineation etc.) The preferable strategy to identify state-wide high crash rate locations would be to have a listing of floating segment3-based crash rates recorded at evenly-spaced locations (every 1/10th of a mile, for example) covering the entire length of each STH. Highway segments exceeding average (80th , 85th or other practical percentile, or other statistic of choice based for example on the classic statistical, the rate quality control, or the Bayesian method) state-wide crash rates would then be chosen for treatment. This method would avoid the pitfall of missing isolated high crash rate segments within STH with otherwise average crash rates. The total state-wide highway lengths chosen for treatment can be fine-tuned by judicious use of the crash rate cutoff percentile (a 95th cutoff percentile crash rate value will identify fewer/shorter highway segments for treatment than an 85th percentile value would). This strategy requires considerable labor and computer time to run PRÈCIS on each STH and considerable computer memory space to store the state-wide crash rate database (a crash rate value each for 1/10 of a mile along each STH). Additional software will then need to be developed to allow Safety Engineers to sort through the developed database, and identify a cutoff crash rate percentile in order to create a listing of all highway segments in need of treatment. In summary The first strategy assumes that the STH with the highest overall crash rates is the one where the most hazardous segments are located; the “worst” segments within this highway are identified for treatment. The strategy is currently ready for application requiring minimal labor. The second strategy identifies and ranks all highway segments, regardless of which highway they belong to. It is perfectly possible that the highest ranking segment will belong to highway A, the next highest to highway B, the third highest to highway A again and so on and so forth. It is also possible that highway A is not the one with the highest overall crash rate among all STH. This strategy can identify the “absolutely worst” highway segments in the entire STH system; however, compiling the necessary database requires significant labor, computer time, computer storage space and some additional database sorting software. Thus this strategy should be deferred to a point in time when the necessary resources will be available. Both strategies use a floating highway segment algorithm which is a significant improvement over methods using consecutive highway segments. Both strategies rely on already existing databases that are maintained on a continuous basis (crash database, Metamanager, and State Trunk Highway Log), using developed automated processes that minimize labor expenditures. Highway segments selected for safety improvements can
3 A mile-long floating segment was used in processing STH 14.
16
be readily identified by their termini cumulative mile points on maps, engineering plans and/or the State Trunk Highway Log. CRASH STATISTICS This section of the report contains crash frequencies for all crashes reported in the state of Wisconsin between 1998 and 2000. The analysis focus progressively narrows down from state-wide frequencies, to the State Trunk Highway (STH) System, the undivided part of the STH System, rural undivided STH, and finally the Run-off-Road crashes on these highways. Separate statistics are presented for non-intersection crashes. Frequencies for Run-off-Road crashes on two-lane undivided rural STH, the focus of the present effort are provided in Appendix H; a summary of findings is presented here. State-wide crash rates for highway jurisdictional classifications, produced by WisDOT are presented in Table 10; crash rates for two- three- and four-lane urban and rural undivided STH produced as a part of the present effort are presented in Tables 5-9. Crash frequencies and crash rates for individual STH are presented in Appendices A, B, C, D and E. CRASH FREQUENCIES The analyzed crash database consisted of state-wide reported crashes between 1998 and 2000. There were a total of 396,290 crashes, 60,624 of which (15.3%) involved deer. Among the 335,666 non-deer crashes: There were a total of 2,013 fatal crashes (0.6%), in which 2,249 people died. A total of 124,307 injury crashes occurred (37.0%), in which 185,667 people were injured. Most crashes occurred on dry pavement (64.3%); 15.1% occurred on wet pavement, 11.7% on pavement covered with snow or slush, and 4.6% on ice-covered pavement. The majority of the crashes occurred in daylight (66.6%); 12.9% occurred under dark conditions, and 15.3% occurred under lighted conditions during nighttime. Crashes during dusk and dawn accounted for 4.2% of all crashes. The majority of crashes (57.6%) occurred at non-intersection locations. Among crashes at non-intersection locations, almost half (48.8% ) involved collisions with another motor vehicle in operation, and 8.2% involved parked vehicles. Overturning vehicles accounted for 7.6% of the crashes, vehicles hitting trees for 5.5%, vehicles in ditches for 4.1%, utility poles for 2.6%, guardrails for 2.2%, and other fixed objects for 1.9%. STH Crash Statistics All STH crashes: During the period from 1998 to 2000, there were a total of 174,613 STH crashes, 30,496 of which (17.5%) involved collisions with deer.
17
Among the 143,117 non-deer crashes (42.6% of state-wide non-deer crashes): There were a total of 1,039 fatal crashes (0.7%) in which 1,184 people died. A total of 54,885 injury crashes (38.1%) resulted in 84,912 persons being injured. The majority of the crashes (63.5%) occurred on dry pavement, 16.6% occurred on wet pavement, 11.0% on pavement covered with snow or slush, and 5.6% on ice-covered pavement. Most crashes occurred during daylight hours (69.2%), with 12.1% occurring under dark conditions and 14.0% occurring under lighted conditions during nighttime hours. Dawn and dusk crashes accounted for 4.2% of all crashes. Most crashes (57.0%) occurred at non-intersection locations. Among those crashes, 737 (0.9%) were fatal with 849 fatalities , and 29,318 (35.7%) caused injuries to 43,779 persons. Most crashes involved collisions with another motor vehicle (56.7%). Fatalities were mostly caused by collisions with other motor vehicles (46.7%), overturning vehicles (19.1%), collisions involving pedestrians (6.5%), trees (5.3%), ditches (3.0%), embankments and guardrails (2.6% each). Collisions with median barriers were involved in 0.7% of fatal, and 3.2% of injury crashes. The above-listed types of crashes were also responsible for most injuries and were, in general, the most frequent types of crashes. Undivided STH: There were a total of 81,103 crashes on undivided STH, 20,757 of which (25.6%) involved collisions with deer. Among the 60,345 non-deer crashes (42% of STH non-deer crashes): A total of 689 fatal crashes (1.1%) resulted in 780 fatalities, and 24,101 injury crashes (39.9%) resulted in injuries to 37,862 persons. The majority of the crashes (64.3%) were on dry pavement, 15.5% occurred on wet pavement, 11.5% on pavement covered with snow or slush, and 4.5% on ice-covered pavement. The majority of crashes occurred during daylight hours (68.9%); 14.3% occurred under dark conditions, 11.8% under lighted conditions during nighttime and 4.2% during dawn or dusk. There were 31,980 non-intersection crashes (53.0%) among which were 508 fatal crashes with 511 fatalities (1.6%), and 12,443 injury crashes (38.9%) with 18,667 injuries. Most crashes involved collisions with other motor vehicles (51.1%). Fatalities were mostly caused by collisions with other motor vehicles (50.1%), overturning vehicles (17.2%), collisions with trees (6.7%), collisions involving pedestrians (6.5%), ditches and embankments (3.1% each). The same types of crashes were also responsible for most injuries and were, in general the most frequent types of crashes. Rural Undivided STH: A total of 54,474 crashes occurred on undivided rural STH, 19,870 of which (36.5%) involved deer.

18
Among the 34,604 non-deer crashes (24.2% of non-deer STH crashes): There were 615 fatal (1.8%) and 14,248 injury (41.2%) crashes, resulting in 703 fatalities and 23,284 injuries, respectively. The majority of the crashes (62.2%) occurred on dry pavement, 13.2% occurred on wet pavement, 13.1% on pavement covered with snow or slush, and 6.4% on pavement covered with ice. Most crashes (65.3%) occurred during daylight; 23.0% occurred under dark conditions, 6.2% occurred in lighted areas during nighttime, and 4.7% occurred during dawn or dusk. There were 21,947 non-intersection crashes (63.4%) among which were 468 fatal crashes (2.1%) resulting in 538 fatalities and 8,905 injury crashes (40.6%) resulting in 13,598 injuries. Fatalities were mostly caused by collisions with other vehicles (40.6%), overturning vehicles (18.2%), collisions with trees (6.4%), pedestrians (5.3%), ditches and embankments (3.4% each), culverts (2.4%) and guardrails (2.0%). The same types of crashes were also responsible for most injuries and were, in general, the most frequent types of crashes. The majority of the crashes (58.0%) were on dry pavements, 12.0% were on wet pavements, 15.9% were on pavements covered by snow or slush, and 8.6% were on ice-covered pavements. Most crashes occurred during daytime hours (59.3%), 29.9% occurred under darkness conditions, 4.8% occurred in illuminated areas during nighttime, 5.0% occurred during dawn or dusk. A total of 11,803 run-off-road crashes accounted 53.8 % of all non-intersection crashes. There were 207 fatal (1.8%) and 4,972 injury (42.1%) crashes, resulting in 228 fatalities and 6,450 injuries. The most common type of fatal crash involved an overturning vehicle (40.1%), a vehicle hitting a tree (14.0%), an embankment (7.7%), a ditch (7.2%), a culvert (5.3%), a guardrail or a utility pole (4.3% each). The same types of crashes were also responsible for most injuries and were, in general, the most frequent types of crashes. Most crashes (51.2%) occurred on dry pavement; 11.2% occurred on wet pavement, 19.6% occurred on pavement covered with snow or slush, and 12.3% occurred when ice was present on the pavement. Almost half of the crashes occurred during daylight hours (48.8%), 40.8% occurred in darkness, 3.7% in lighted areas during nighttime, and 5.6% occurred during dawn or dusk.
19
Run-off-Road Crashes on Two-Lane Rural STH The focus of the present effort was Run-off-Road crashes on two-lane rural STH. Detailed statistics about these crashes are presented in Appendix H, where crash severity relationships with other crash characteristics are presented, given the emphasis of the current project on identifying ways to minimize the consequences of vehicles leaving the roadway. The following presentation focuses on the most pronounced characteristics of fatal ROR crashes. Unless otherwise stated, this section refers to the universe of ROR crashes on targeted highways. Special emphasis is placed on fatal crash characteristics. Almost the entirety of undivided STH mileage (8819.81 out of a total of 8900.85 miles) is two-lane highways, where 98.6% of all crashes on undivided STH occurred. It is interesting to note that 62.6% of all fatal crashes occurred during nighttime; this is a distinct characteristic, given that, overall, only 44.8% of ROR crashes occurred during nighttime. This percentage of nighttime crashes was higher than the average 35% of nighttime crashes on undivided STH. Another distinct characteristic for ROR crashes is that most fatal crashes (74.8%) occurred on dry pavements with a relatively small percentage (9.4%) occurring on pavements covered with snow, slush or ice. Statistics for all ROR crashes were 53.9% and 33.3%, respectively. ROR crashes on curves were 35.4% of the total, but 45.9% of fatal crashes occurred on curves. It is important to note that ROR crashes involving overturning vehicles were 26.4% of the total, but 40.5% of fatal ROR crashes. Collisions with trees were 9.8% of the total, but accounted for 13.7% of fatal crashes. Although the highest monthly crash totals occurred in the months of December and January (13.4% each month), the highest numbers of fatal crashes occurred in July and September (12.6% and 12.1%, respectively). Crashes were quite evenly spread throughout the days of the week with a peak on Sundays (15.7% of all crashes). Most fatal crashes occurred on Saturdays (19.9%) followed by Thursdays (18.0%). There was an even distribution of crashes throughout the hours of the day, with non-pronounced peaking between 7:00 and 9:00 hrs (avg. 5.5%) and 15:00 and 17:00 hrs (5.3%); however, fatal crashes picked up at 21:00 hrs (6.3%), peaked at 23:00 hrs (9.2%) and remained high between 1:00 and 4:00 hrs (avg. 6.8%). A disproportionate number of crashes involving motorcyclists were fatal (6.5% of all fatal crashes) given that motorcyclists were involved in 1.9% of all crashes. A disproportionate number of drivers involved in fatal crashes had been consuming alcohol (52.9%) compared to 16.7% of all drivers involved in crashes.
20
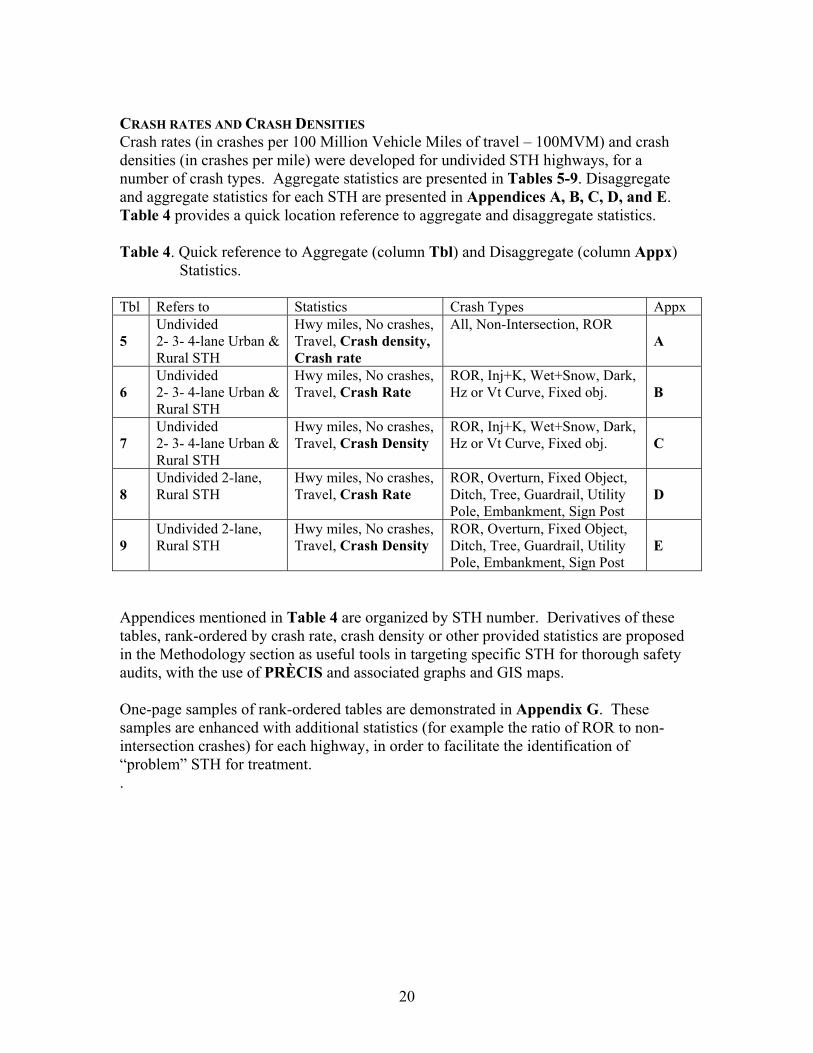
CRASH RATES AND CRASH DENSITIES Crash rates (in crashes per 100 Million Vehicle Miles of travel – 100MVM) and crash densities (in crashes per mile) were developed for undivided STH highways, for a number of crash types. Aggregate statistics are presented in Tables 5-9. Disaggregate and aggregate statistics for each STH are presented in Appendices A, B, C, D, and E. Table 4 provides a quick location reference to aggregate and disaggregate statistics. Table 4. Quick reference to Aggregate (column Tbl) and Disaggregate (column Appx)
Statistics. Tbl Refers to Statistics Crash Types Appx
5 Undivided 2- 3- 4-lane Urban & Rural STH
Hwy miles, No crashes, Travel, Crash density, Crash rate
All, Non-Intersection, ROR A
6 Undivided 2- 3- 4-lane Urban & Rural STH
Hwy miles, No crashes, Travel, Crash Rate
ROR, Inj+K, Wet+Snow, Dark, Hz or Vt Curve, Fixed obj. B
7 Undivided 2- 3- 4-lane Urban & Rural STH
Hwy miles, No crashes, Travel, Crash Density
ROR, Inj+K, Wet+Snow, Dark, Hz or Vt Curve, Fixed obj. C
8 Undivided 2-lane, Rural STH
Hwy miles, No crashes, Travel, Crash Rate
ROR, Overturn, Fixed Object, Ditch, Tree, Guardrail, Utility Pole, Embankment, Sign Post
D
9 Undivided 2-lane, Rural STH
Hwy miles, No crashes, Travel, Crash Density
ROR, Overturn, Fixed Object, Ditch, Tree, Guardrail, Utility Pole, Embankment, Sign Post
E
Appendices mentioned in Table 4 are organized by STH number. Derivatives of these tables, rank-ordered by crash rate, crash density or other provided statistics are proposed in the Methodology section as useful tools in targeting specific STH for thorough safety audits, with the use of PRÈCIS and associated graphs and GIS maps. One-page samples of rank-ordered tables are demonstrated in Appendix G. These samples are enhanced with additional statistics (for example the ratio of ROR to non-intersection crashes) for each highway, in order to facilitate the identification of “problem” STH for treatment. .

21
Table 5. Undivided STH state-wide statistics: All, Non-Intersection, Run-off-Road Crashes. No of Annual Crashes Non-inters Crashes Non-inters ROR Crashes ROR Population No of Crashes Travel per mile Crashes Crashes per mile Crashes Crashes per mile Crashes Density Lanes Miles (3 Yrs) 100MVM per year per 100MVM (3 Yrs) per year per 100MVM (3 Yrs) per year per 100MVM __________ _____ _________ __________ __________ __________ __________ __________ __________ __________ __________ __________ __________ Rural 2 8819.81 32519.00 113.38 1.23 95.61 20925.00 .79 61.52 11629.00 .44 34.19 3 15.76 162.00 .43 3.43 126.42 99.00 2.09 77.26 45.00 .95 35.12 4 65.28 1890.00 2.43 9.65 259.40 913.00 4.66 125.31 122.00 .62 16.74 Overall 8900.85 34571.00 116.23 1.29 99.14 21937.00 .82 62.91 11796.00 .44 33.83 Urban 2 402.72 13332.00 13.74 11.03 323.46 5371.00 4.45 130.31 1036.00 .86 25.14 3 12.53 975.00 .65 25.94 499.79 340.00 9.04 174.29 60.00 1.60 30.76 4 154.69 11432.00 8.92 24.63 427.26 4320.00 9.31 161.45 569.00 1.23 21.27 Overall 569.94 25739.00 23.31 15.05 368.10 10031.00 5.87 143.46 1665.00 .97 23.81 All Undivided 9470.79 60310.00 139.54 2.12 144.07 31968.00 1.13 76.36 13461.00 .47 32.16 Notes: • 100MVM = 100 Million Vehicle Miles of travel • ROR = Run-off-Road
22
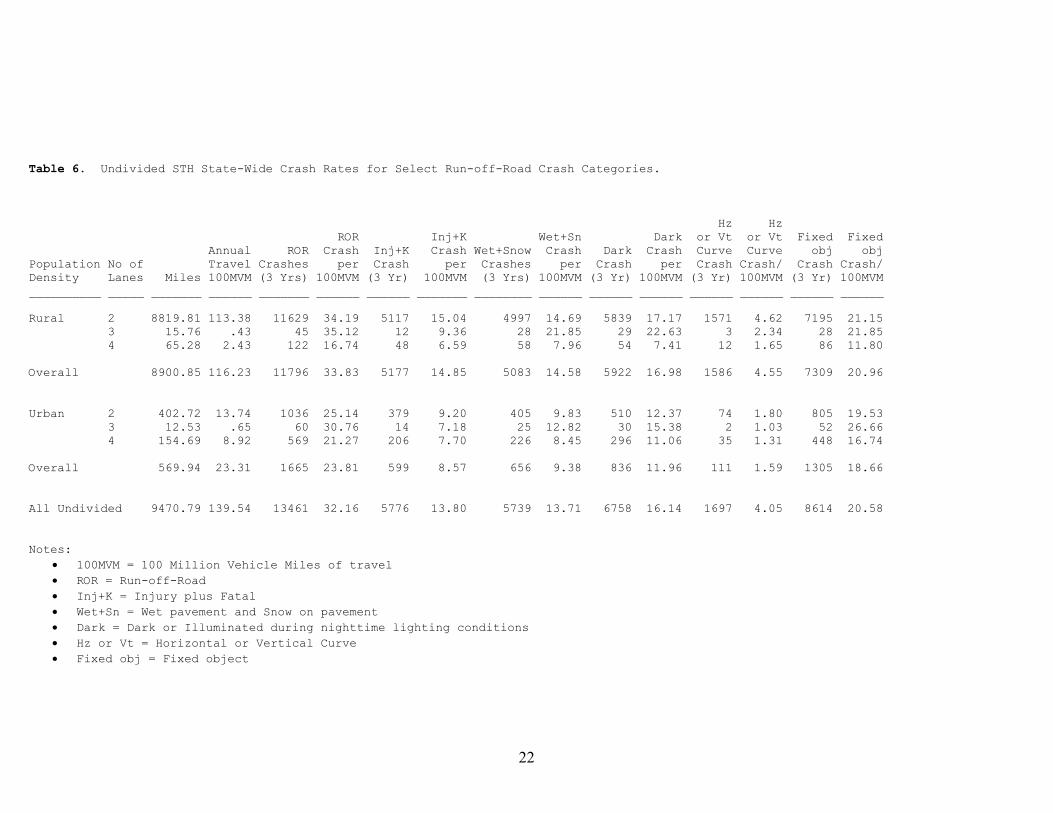
Table 6. Undivided STH State-Wide Crash Rates for Select Run-off-Road Crash Categories. Hz Hz ROR Inj+K Wet+Sn Dark or Vt or Vt Fixed Fixed Annual ROR Crash Inj+K Crash Wet+Snow Crash Dark Crash Curve Curve obj obj Population No of Travel Crashes per Crash per Crashes per Crash per Crash Crash/ Crash Crash/ Density Lanes Miles 100MVM (3 Yrs) 100MVM (3 Yr) 100MVM (3 Yrs) 100MVM (3 Yr) 100MVM (3 Yr) 100MVM (3 Yr) 100MVM __________ _____ _______ ______ _______ ______ ______ _______ ________ ______ ______ ______ ______ ______ ______ ______ Rural 2 8819.81 113.38 11629 34.19 5117 15.04 4997 14.69 5839 17.17 1571 4.62 7195 21.15 3 15.76 .43 45 35.12 12 9.36 28 21.85 29 22.63 3 2.34 28 21.85 4 65.28 2.43 122 16.74 48 6.59 58 7.96 54 7.41 12 1.65 86 11.80 Overall 8900.85 116.23 11796 33.83 5177 14.85 5083 14.58 5922 16.98 1586 4.55 7309 20.96 Urban 2 402.72 13.74 1036 25.14 379 9.20 405 9.83 510 12.37 74 1.80 805 19.53 3 12.53 .65 60 30.76 14 7.18 25 12.82 30 15.38 2 1.03 52 26.66 4 154.69 8.92 569 21.27 206 7.70 226 8.45 296 11.06 35 1.31 448 16.74 Overall 569.94 23.31 1665 23.81 599 8.57 656 9.38 836 11.96 111 1.59 1305 18.66 All Undivided 9470.79 139.54 13461 32.16 5776 13.80 5739 13.71 6758 16.14 1697 4.05 8614 20.58 Notes:
• 100MVM = 100 Million Vehicle Miles of travel • ROR = Run-off-Road • Inj+K = Injury plus Fatal • Wet+Sn = Wet pavement and Snow on pavement • Dark = Dark or Illuminated during nighttime lighting conditions • Hz or Vt = Horizontal or Vertical Curve • Fixed obj = Fixed object

23
Table 7. Undivided STH State-Wide Crash Densities for Select Run-off-Road Crash Categories. Hz Hz or Vt Fixed ROR Inj+K Wet+Snow Dark or Vt Curve Fixed obj Annual ROR Crashes Inj+K Crash/ Wet+Snow Crash/ Dark Crash/ Curve Crash/ obj Crash/ Population No of Travel Crashes per mile Crash mile/ Crashes mile/ Crash mile/ Crashes mile/ Crash mile/ Density Lanes Miles 100MVM (3 Yrs) per year (3 Yr) year (3 Yrs) year (3 Yr) year (3 Yrs) year (3 Yr) year __________ _____ ______ ______ _______ ________ ______ _______ ________ ________ ______ ________ _______ ________ ______ _______ Rural 2 8819.8 113.38 11629 .44 5117 .19 4997 .19 5839 .22 1571 .06 7195 .27 3 15.76 .43 45 .95 12 .25 28 .59 29 .61 3 .06 28 .59 4 65.28 2.43 122 .62 48 .25 58 .30 54 .28 12 .06 86 .44 Overall 8900.8 116.23 11796 .44 5177 .19 5083 .19 5922 .22 1586 .06 7309 .27 Urban 2 402.72 13.74 1036 .86 379 .31 405 .34 510 .42 74 .06 805 .67 3 12.53 .65 60 1.60 14 .37 25 .67 30 .80 2 .05 52 1.38 4 154.69 8.92 569 1.23 206 .44 226 .49 296 .64 35 .08 448 .97 Overall 569.94 23.31 1665 .97 599 .35 656 .38 836 .49 111 .06 1305 .76 All Undivided 9470.8 139.54 13461 .47 5776 .20 5739 .20 6758 .24 1697 .06 8614 .30 Notes:
• 100MVM = 100 Million Vehicle Miles of travel • Crash/mile/year = Crashes per Mile per Year • ROR = Run-off-Road • Inj+K = Injury plus Fatal • Wet+Sn = Wet pavement and Snow on pavement • Dark = Dark or Illuminated during nighttime lighting conditions • Hz or Vt = Horizontal or Vertical Curve • Fixed obj = Fixed object

24
Table 8. Two-lane Rural STH Crash Rates for Select Run-off-Road Crash Categories. Util Sign ROR F/O Ditch Tree G/R Util Pole Embnk Sign Post Annual ROR Crash/ ROR O/T F/O Crsh/ Ditch Crsh/ Tree Crsh/ G/R Crsh/ pole Crsh/ Embnk Crsh/ Post Crsh/ Travel Crashes mile/ Crash/ O/T per Crsh per Crash per Crash per Crash per Crash per Crash per Crash per Miles 100MVM (3 Yrs) year 100MVM 3 Yr 100MVM 3 Yr 100MVM 3 Yr 100MVM 3 Yr 100MVM 3 Yr 100MVM 3 Yr 100MVM 3 Yr 100MVM 3 Yr 100MVM _______ ______ _______ ________ ______ ____ ______ ____ ______ _____ ______ _____ ______ _____ ______ _____ ______ _____ ______ _____ ______ 8819.81 113.38 11629 .44 34.19 3060 9.00 7195 21.15 1593 4.68 1133 3.33 802 2.36 661 1.94 613 1.80 453 1.33 Table 9. Two-lane Rural STH Crash Densities for Select Run-off-Road Crash Categories. Util Sign ROR F/O Ditch Tree G/R Util Pole Embnk Sign Post Annual ROR Crash/ ROR O/T F/O Crsh/ Ditch Crsh/ Tree Crsh/ G/R Crsh/ pole Crsh/ Embnk Crsh/ Post Crsh/ Travel Crashes mile/ Crash/ O/T mile/ Crsh mile/ Crash mile/ Crash mile/ Crash mile/ Crash mile/ Crash mile/ Crash mile/ Miles 100MVM (3 Yrs) year 100MVM 3 Yr year 3 Yr year 3 Yr year 3 Yr year 3 Yr year 3 Yr year 3 Yr year 3 Yr year _______ ______ _______ ________ ______ ____ ______ ____ _____ _____ _____ _____ _____ _____ _____ _____ _____ _____ _____ _____ _____ 8819.81 113.38 11629 .44 34.19 3060 .12 7195 .27 1593 .06 1133 .04 802 .03 661 .02 613 .02 453 .02 Notes: • 100MVM = 100 Million Vehicle Miles of travel • 3 Yr = Total Number of Crashes in three years (1998-2000) • Crash/mile/year = Crashes per Mile per Year • ROR = Run-off-Road • O/T = Overturned Vehicle • F/O = Fixed Object • G/R = Guardrail Face or Guardrail End • Util Pole = Utility Pole • Embnk = Embankment
25
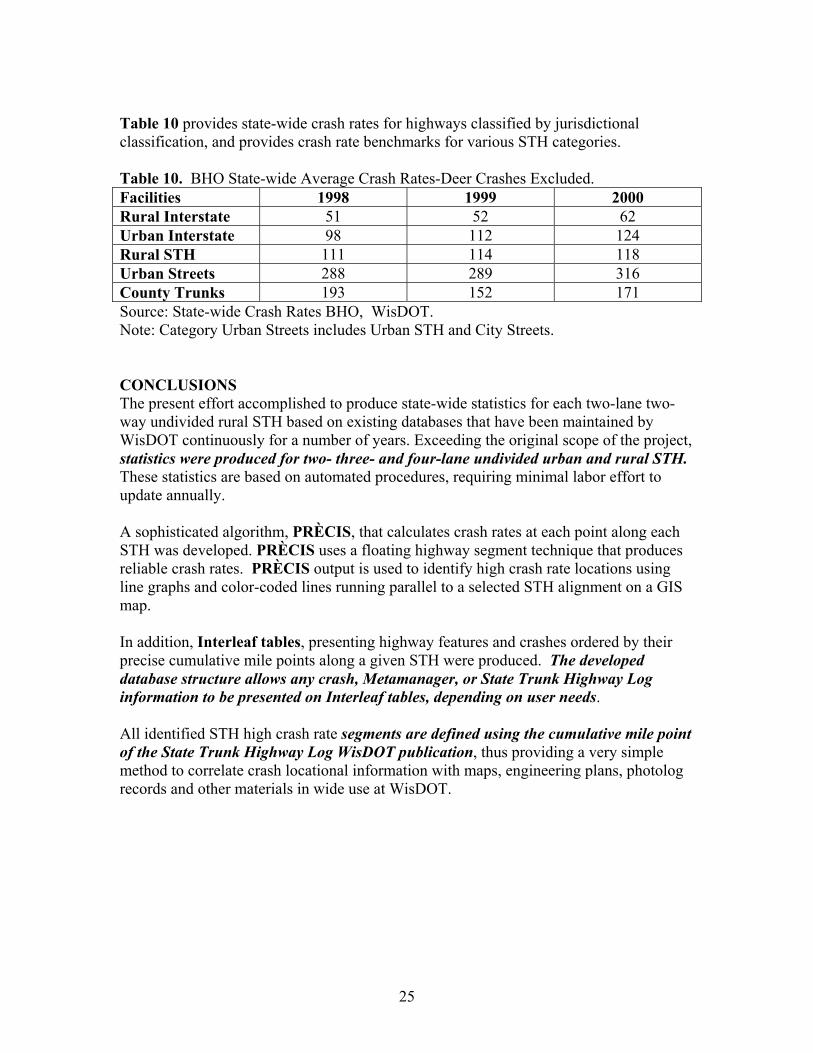
Table 10 provides state-wide crash rates for highways classified by jurisdictional classification, and provides crash rate benchmarks for various STH categories. Table 10. BHO State-wide Average Crash Rates-Deer Crashes Excluded. Facilities 1998 1999 2000 Rural Interstate 51 52 62 Urban Interstate 98 112 124 Rural STH 111 114 118 Urban Streets 288 289 316 County Trunks 193 152 171 Source: State-wide Crash Rates BHO, WisDOT. Note: Category Urban Streets includes Urban STH and City Streets. CONCLUSIONS The present effort accomplished to produce state-wide statistics for each two-lane two-way undivided rural STH based on existing databases that have been maintained by WisDOT continuously for a number of years. Exceeding the original scope of the project, statistics were produced for two- three- and four-lane undivided urban and rural STH. These statistics are based on automated procedures, requiring minimal labor effort to update annually. A sophisticated algorithm, PRÈCIS, that calculates crash rates at each point along each STH was developed. PRÈCIS uses a floating highway segment technique that produces reliable crash rates. PRÈCIS output is used to identify high crash rate locations using line graphs and color-coded lines running parallel to a selected STH alignment on a GIS map. In addition, Interleaf tables, presenting highway features and crashes ordered by their precise cumulative mile points along a given STH were produced. The developed database structure allows any crash, Metamanager, or State Trunk Highway Log information to be presented on Interleaf tables, depending on user needs. All identified STH high crash rate segments are defined using the cumulative mile point of the State Trunk Highway Log WisDOT publication, thus providing a very simple method to correlate crash locational information with maps, engineering plans, photolog records and other materials in wide use at WisDOT.

26
Two methods to identify highway segments with unusually high crash statistics have been identified. The first one can be applied immediately and with minimal labor costs, based on products developed during this effort. It is based on a two-step process whereby:
i. A limited number of STH with unusually high crash statistics are selected for further review; and
ii. Segments of these STH with unusually high crash rates are identified for further scrutiny.
The second, more comprehensive method will require state-wide PRÈCIS and Interleaf table production runs and some limited additional software development is recommended for a time when the required resources are available. Tables and maps developed herein are simple to use and do not require specialized technical (computer) skills. The user should be familiar with the use of the STH Log, the meaning of information contained in crash records and general safety problem countermeasures; no specialized knowledge about PRÈCIS or other parts of the developed methodology is needed. New runs matching the necessary data will be required every year, as new crash data become available and Metamanager and STH Log files are updated, in order to keep the database current. DISCUSSION Given the wide scatter of ROR crashes and especially those with serious outcomes (injury and fatal crashes), it does not seem reasonable to anticipate that treating particular highway segments will have an immediate impact in significantly reducing state-wide numbers of injury and fatal crashes. Crash reductions will, in all likelihood, be gradual as more and more highway segments are upgraded piecemeal. However, the provided methodology allows WisDOT to identify corridors in need of certain upgrades (for example corridors with unusually high numbers of crashes with utility poles can be identified). This information, maintained in a universally accessible database, can be consulted by Districts and used in program and project development, safety grant proposal preparation, or in conjunction with reconstruction projects etc.
27
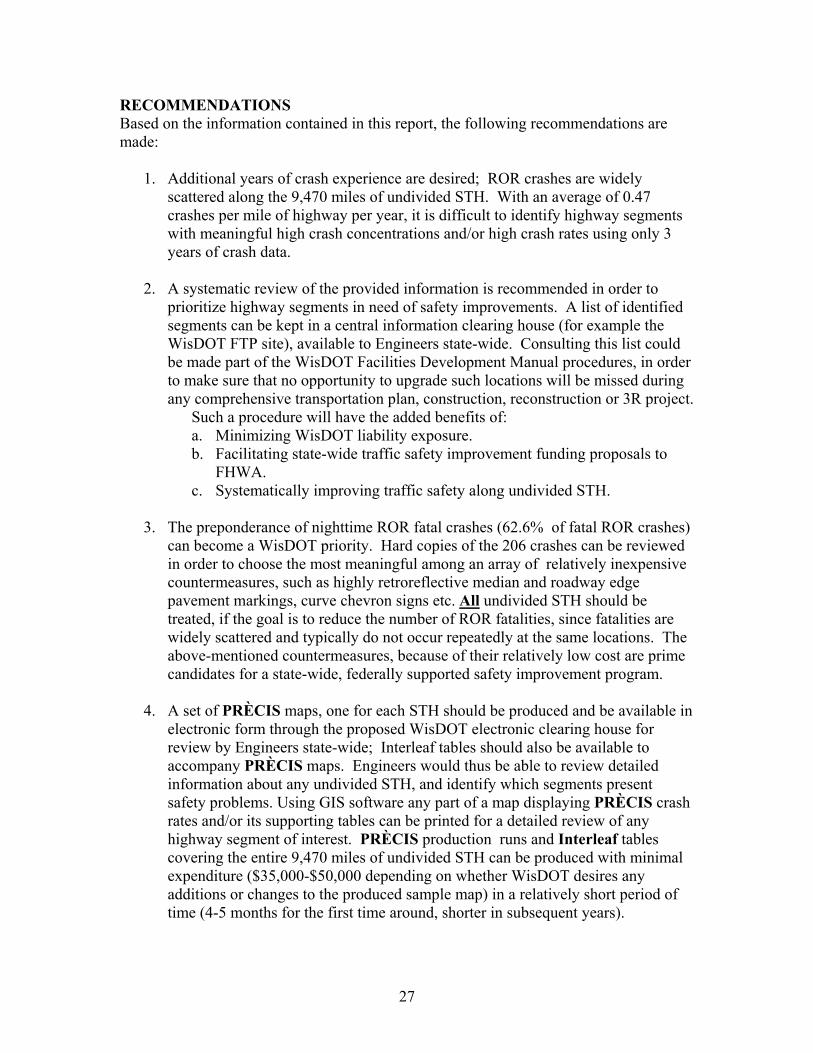
RECOMMENDATIONS Based on the information contained in this report, the following recommendations are made:
1. Additional years of crash experience are desired; ROR crashes are widely scattered along the 9,470 miles of undivided STH. With an average of 0.47 crashes per mile of highway per year, it is difficult to identify highway segments with meaningful high crash concentrations and/or high crash rates using only 3 years of crash data.
2. A systematic review of the provided information is recommended in order to
prioritize highway segments in need of safety improvements. A list of identified segments can be kept in a central information clearing house (for example the WisDOT FTP site), available to Engineers state-wide. Consulting this list could be made part of the WisDOT Facilities Development Manual procedures, in order to make sure that no opportunity to upgrade such locations will be missed during any comprehensive transportation plan, construction, reconstruction or 3R project.
Such a procedure will have the added benefits of: a. Minimizing WisDOT liability exposure. b. Facilitating state-wide traffic safety improvement funding proposals to
FHWA. c. Systematically improving traffic safety along undivided STH.
3. The preponderance of nighttime ROR fatal crashes (62.6% of fatal ROR crashes) can become a WisDOT priority. Hard copies of the 206 crashes can be reviewed in order to choose the most meaningful among an array of relatively inexpensive countermeasures, such as highly retroreflective median and roadway edge pavement markings, curve chevron signs etc. All undivided STH should be treated, if the goal is to reduce the number of ROR fatalities, since fatalities are widely scattered and typically do not occur repeatedly at the same locations. The above-mentioned countermeasures, because of their relatively low cost are prime candidates for a state-wide, federally supported safety improvement program.
4. A set of PRÈCIS maps, one for each STH should be produced and be available in
electronic form through the proposed WisDOT electronic clearing house for review by Engineers state-wide; Interleaf tables should also be available to accompany PRÈCIS maps. Engineers would thus be able to review detailed information about any undivided STH, and identify which segments present safety problems. Using GIS software any part of a map displaying PRÈCIS crash rates and/or its supporting tables can be printed for a detailed review of any highway segment of interest. PRÈCIS production runs and Interleaf tables covering the entire 9,470 miles of undivided STH can be produced with minimal expenditure ($35,000-$50,000 depending on whether WisDOT desires any additions or changes to the produced sample map) in a relatively short period of time (4-5 months for the first time around, shorter in subsequent years).

28
5. If the necessary resources are in place, an assigned Safety Engineer should review the entire set of undivided STH maps and tables (see 4. above), prioritize highway segments for treatment, maintain a list of prioritized locations stored on the electronic clearing house, and produce guidelines for undivided STH safety audits, to be adhered to in program and project planning, and highway upgrade projects. These tasks will ensure that the developed tools are used in a systematic and consistent manner.
ACKNOWLEDGMENTS The authors wish to acknowledge the valuable help of many Wisconsin DOT employees, without which this effort would have not born fruits: Dick Lange, who provided the crash data, and valuable insights for their proper use and who oversaw the project each step of the way; John Corbin for his encouragement; Brad Javenkoski who provided his professional wisdom, invaluable data and many hours of his labor to this effort; Carrie Cooper for cheerfully guiding us through the labyrinths of many procedures; and the many more people who built and maintained the good quality databases we came to know so well.