synthesis of china's land use in the past 300years
TRANSCRIPT

Global and Planetary Change 100 (2013) 224–233
Contents lists available at SciVerse ScienceDirect
Global and Planetary Change
j ourna l homepage: www.e lsev ie r .com/ locate /g lop lacha
Review paper
Synthesis of China's land use in the past 300 years
Lijuan Miao a, Feng Zhu a, Bin He a, Marion Ferrat a, Qiang Liu a, Xue Cao b, Xuefeng Cui a,⁎a State Key Laboratory of Earth Surface Processes and Resource Ecology, College of Global Change and Earth System Science, Beijing Normal University, 100875, Chinab College of Geographic and Oceanographic Sciences, Nanjing University, 210093, China
⁎ Corresponding author. Tel.: +86 10 58802701; fax:E-mail address: [email protected] (X. Cui).
0921-8181/$ – see front matter © 2012 Elsevier B.V. Allhttp://dx.doi.org/10.1016/j.gloplacha.2012.10.021
a b s t r a c t
a r t i c l e i n f oArticle history:Received 15 June 2012Accepted 25 October 2012Available online 1 November 2012
Keywords:China300 yearsspatial reconstructioncroplandforesturbangrassland
China's land use has undergone many changes over the past 300 years due to the significant transformationscaused by natural and human factors and their impact on regional climate and the environment. This com-prehensive review of recent state-of-the-art studies of China's land-use changes during that period concen-trates on cropland, forest, grassland and urban areas. While most small-scale studies have reconstructedinformation from historical archive data and focused on a specific time period, large-scale studieshave tended to rely on inverse modeling techniques to interpret land-use change dynamics based onremote-sensing data for example, the global land-use products of the History Database of the Global Environ-ment (HYDE) and Center for Sustainability and the Global Environment (SAGE) datasets. All studies haveshown that the cropland areas in China increased between 1700 and 1950, although they indicate differentmagnitudes and rates. A decrease in forest coverage was also reported in all studies. Little information wasavailable on urban and grassland areas over the same period. Rapid urbanization in China has been particu-larly evident in the past 50 years. Meanwhile, spatially explicit reconstructions of historical land-use changein China since 1700 remain highly uncertain due to the lack of reliable data. Extensive work on primary datacollection is required, including land-use records and drivers for future change.
© 2012 Elsevier B.V. All rights reserved.
Contents
1. Introduction . . . . . . . . . . . . . . . . . . . . . . . . . . . . . . . . . . . . . . . . . . . . . . . . . . . . . . . . . . . . . . 2242. Data sources . . . . . . . . . . . . . . . . . . . . . . . . . . . . . . . . . . . . . . . . . . . . . . . . . . . . . . . . . . . . . . 2253. Results . . . . . . . . . . . . . . . . . . . . . . . . . . . . . . . . . . . . . . . . . . . . . . . . . . . . . . . . . . . . . . . . 225
3.1. Cropland . . . . . . . . . . . . . . . . . . . . . . . . . . . . . . . . . . . . . . . . . . . . . . . . . . . . . . . . . . . . 2253.2. Forest . . . . . . . . . . . . . . . . . . . . . . . . . . . . . . . . . . . . . . . . . . . . . . . . . . . . . . . . . . . . . 2293.3. Urban . . . . . . . . . . . . . . . . . . . . . . . . . . . . . . . . . . . . . . . . . . . . . . . . . . . . . . . . . . . . . 2303.4. Grassland . . . . . . . . . . . . . . . . . . . . . . . . . . . . . . . . . . . . . . . . . . . . . . . . . . . . . . . . . . . . 231
4. Discussion . . . . . . . . . . . . . . . . . . . . . . . . . . . . . . . . . . . . . . . . . . . . . . . . . . . . . . . . . . . . . . . 2315. Summary and conclusions . . . . . . . . . . . . . . . . . . . . . . . . . . . . . . . . . . . . . . . . . . . . . . . . . . . . . . . 232Acknowledgments . . . . . . . . . . . . . . . . . . . . . . . . . . . . . . . . . . . . . . . . . . . . . . . . . . . . . . . . . . . . . 232References . . . . . . . . . . . . . . . . . . . . . . . . . . . . . . . . . . . . . . . . . . . . . . . . . . . . . . . . . . . . . . . . . 232
1. Introduction
Global land use and land cover change (LUCC) (Godfray et al.,2010) includes deforestation to allow for increased cropland orpasture (Aide and Grau, 2004), and for urban expansion (Foley etal., 2005). LUCC generally occurs at the local scale but may have a sig-nificant global impact (Pitman and Hesse, 2007; Malhi et al., 2008;Ruddiman and Ellis, 2009). The Intergovernmental Panel on Climate
+86 10 58802165.
rights reserved.
Change (IPCC) Fourth Assessment Report pointed out in 2007 thatLUCC is significantly correlated with climate change through biophys-ical and biogeochemical processes (Feddema et al., 2005) and hasinfluenced the terrestrial carbon cycle by affecting carbon sourcesand sinks (Houghton, 1995; Wu et al., 2003; Piao et al., 2009).
Research on LUCC has attractedmuch attention from the internation-al scientific community. The LUCC International Project (1994–2004)and Global Land Project (GLP, from 2005) have promoted significantimprovements in our understanding of the overall process of LUCC,particularly the role of human activity. In order to better understandand predict current and future changes in land cover and their
225L. Miao et al. / Global and Planetary Change 100 (2013) 224–233
potential impact on the environment and human society, it is crucialto be aware of past trends. Understanding past human–climate–en-vironment interactions is essential for assessing the vulnerability oflandscapes and ecosystems to the effects of future climate change(McGregor et al., 2009). A key question for investigation in LUCC re-search has therefore been: how has land use changed in the past, andwhat were the mechanisms that led to these changes?
Reconstruction of historical LUCC relies on historical archives or in-verse modeling, or a combination of the two, briefly described below:
(1) Historical archives. Using historical archives to reconstruct LUCCrelies on the extraction of LUCC information from historicaldocuments and writings (Ge et al., 2008a; Ye et al., 2009a). Thedifficulty of this method lies in indirectly obtaining LUCC infor-mation fromawide range of documents that have been compiledusing different resources during different historical periods.Furthermore, the available data does not relate to large areas,and is focused on specific time periods. For example, the valuablerecords of federal land taxes have commonly been used to inter-pret historical cropland areas, but they vary with geographicallocation, political administration, land quality, accounting meth-od and economic background.
(2) Inverse modeling. Inverse (mathematical) models are mainly de-veloped from known mechanisms of LUCC and known relation-ships between population and land use, and therefore relyheavily on the quality of the historical data, the precision ofthe remote-sensing data and the accuracy of the algorithm(s)used. This technique generally provides long-term data onland-use change, but only on a large scale. An example is theglobal historical land-use SAGE database (Ramankutty andFoley, 1999), which has been widely applied in global LUCCstudies (Brovkin et al., 2004; Pongratz et al., 2008).
(3) Combined techniques. Recent attempts at understanding histori-cal LUCC have focused on combining the results from theabove two methods, thereby engaging global datasets in region-al studies (Li et al., 2010; Klein Goldewijk et al., 2011).Ramankutty and Foley (1999) calibrated the InternationalGeosphere-Biosphere Programme (IGBP) 1 km-resolution GlobalLand Cover Characterization (GLCC) dataset against cropland in-ventory data from 1992 to create a continuous global data setfor cultivated land. The data was then extrapolated backwardsin time using hindcast modeling by combining it with a compila-tion of historical cropland inventory data to create a dataset ofcroplands for the period 1700 to 1992 (Klein Goldewijk et al.,2010). The HYDE dataset has been continually updated (latestversion 3.1) by incorporating more detailed and reliable invento-ry data of population and land-use data from various sources(Klein Goldewijk et al., 2011).
China occupies the third-largest land area in theworld and supportsabout 22% of theworld's populationwith only 7% of theworld's total ar-able land (Yu et al., 2012). China was one of the world's first cultivatedareas. It has responded to the rapid population growth of the past300 years by an unprecedented expansion of its agricultural land(Klein Goldewijk, 2005). The significance is that, in pre-industrialtimes, the expansion of agriculture was probably the dominant processby which humankind altered the Earth's systems, although little isknown about the extent, timing or spatial patterns of these changes(Pongratz et al., 2008). Fortunately, a significant store of valuable docu-ments survives, helping us to characterize and understand thesechanges (Houghton and Hackler, 2003; Liu et al., 2005a; Ye et al.,2006; Ge et al., 2008a).
Although great progress has been made, large gaps remain inhigh-resolution temporal and spatial historical land use reconstruc-tions for China. In the present study, we have collected all availablehistorical land-use datasets, including cropland, forest, grasslandand urban area, to provide the first comprehensive overview of
historical land use changes in China. Unused land, shrublands or graz-ing land is not included due to the lack of information data. One of thekey objectives of the study was to identify gaps in the research andpropose priorities for future studies.
2. Data sources
The datasets used in this study listed in Table 1 include all theavailable land-use datasets covering the past 300 years (approxi-mately 1700–2000) for all spatial units in China (province, regionand county). These were obtained fromWeb of Science, Google Schol-ar and the Chinese literature-search database Chinese NationalKnowledge Infrastructure (CNKI), using a combination of keywordsincluding China, land use, history, 300 years, cropland, forest, urbanand grassland. In this study, most of the datasets, except the globaldatasets, are denoted by the author's name; the references are listedin Table 1 along with the number allocated to them in the referencelist (D1–D34). Most of the data concerns crops and forest; little infor-mation is available for urban and grassland areas. The spatial cover-age of the regional datasets is presented in Fig. 1. A number ofregions are covered by several studies at various resolutions, whilesome regions, such as north-western China, have a limited coverage.Notably, the definitions of land-use classes are also unclear or impre-cise in most datasets and direct comparisons between them may beproblematic.
3. Results
3.1. Cropland
Fig. 2 shows the historical changes in cropland areas that occurredin China from 1700 to 2009, taken from various data sources. Allstudies show that cropland areas increased from 1700 to 1950,but the SAGE and ZHOU datasets stand out from the others, withthe former showing an extremely rapid increase in cropland areasof up to 230 Mha from 1700 to 1950, followed by a steep decreaseafter 1950.
Whereas the magnitude of the increase in cropland areas from1700 to 1950 is significantly higher in SAGE than elsewhere, as men-tioned above, the rates of the cropland increase given by the otherthree long-term datasets, HYDE, LIU and GE2 are smaller and alsosimilar, averaging 0.188 Mha/yr. LIANG and ZHANG seem to presentsimilar changes throughout the studied periods. Despite the similarrates, the total magnitude of the cropland areas reconstructed fromLIU is consistently larger than GE1 by 30 Mha.
Cropland areas peaked in about 1890 and again in 1955 according toLIU and GE2, but not according to HYDE. Historical records revealed theoccurrence of serious droughts in 1928–1931 and waterlogging in1933–1934, which both led to a decrease in cropland areas (Gao,1994). Population was recognized as the most important driver ofland-use change (Bilsborrow and Ogendo, 1992; Klein Goldewijk,2001; Liu and Tian, 2010). Events that occurred between themid-19th century and 1949 (the year of the foundation of the People'sRepublic of China), especially China's war of resistance against Japan(1937–1945), caused both social unrest and population fluctuationswhichwere the leading causes of land-use change during those periods.Nevertheless, cropland areas were not significantly reduced duringthose two periods, which suggests that disasters and wars were notthe main cause of land-use change at that time.
Since 1912, more datasets have become available (FAO, GE1, DANG,FENG, ZHOU, CPRI, CARI, and XU, Fig. 3 inset). GE, FENG and CARI indi-cate similar trends and quantities; CPR and XU were the largest after1912. All datasets except GE display a consistent increase in croplandareas from 1949 until 1956, which may have reflected the “Land tothe Tiller!” land reform program that encouraged laborers' enthusiasmand was related to the input of chemical fertilizer, farm machinery

Table 1China land-use databases for the period 1700–2000.
ID Dataset name LUCC types Resolution Temporalcoverage
Methods and data resources References
D1 SAGE Cropland Forest 5′ global scale 1700–1992 AVHRR-based land cover, historical croplandinventory data with a simple model
Ramankutty and Foley (1999)www.sage.wisc.edu/iamdata
D2 HYDE Cropland Pasture 5′ global scale 10,000 BC–AD 2000
Historical population, cropland and pasture statistics,satellite information and specific allocation algorithms
Klein Goldewijk et al. (2011)
D3 KAUPP Forest National or regionalforest global scale
1500–2000 Forest type from FAO Kauppi et al. (2006)
D4 TREE COVER Forest 1 km global scale 1992, 1993 AVHRR-based satellite information Defries et al. (2000)D5 HE Forest Province in China 1700–1949 Historical documents, modern survey and statistics He et al. (2008)D6 LIU Forest Cropland
Urban10 km China 1700–2005 Historical gridded data sets from high-resolution
satellite data and long-term historical survey dataLiu and Tian (2010)
D7 CNEC Cropland County scale, China Three NEprovinces(Heilongjiang, Jilin, Liaoning)
1683–2002 Historical data and correction Ye et al. (2009a)
D8 GE 1 Cropland Forest Provincial scale, China 18provinces
1661–2000 Historical data and correction Ge et al. (2003, 2008b)
D9 GE 2 Cropland Forest Region in China 1913–1980 Historical data Ge and Dai (2005)D10 LING Forest China 1770, 1977 Historical data Ling (1983)D11 LIANG Cropland China 1661–1887 Historical official data Liang (2008)D12 ZHANG Cropland China 1812,
1851, 1887Historical data Zhang (1991)
D13 ZHOU Cropland China 1661–1840 Historical data Zhou (2001)D14 SHI Cropland China 1661–1887 Historical data Shi (1993)D15 HE and GE Urban 18 provinces in China 1820, 1999 Historical data He et al. (2002)D16 TIAN and LI Cropland Loess Plateau in China 1700–2000 From HYDE and historical data Tian et al. (2012)D17 ZHANG and
CHENCropland 0.5° Eastern China 1724–1995 From Chinese natural resource database Zhang and Chen (2007)
D18 ZHAO Cropland Jiangsu and Anhui counties inChina
1735, 1932,1953
Historical data Zao (2005)
D19 FU Cropland Henan Province in China 1368–1953 Historical data Fu (2005)D20 LIU SHILING Cropland Henan Province in China 1935,
1940, 1946Historical data Liu (2009)
D21 ZHAOHAIXIAO Cropland Four counties above the FenheRiver (in Shanxi Province)
1781, 1892 Historical data Zhao (2007)
D22 YAN Cropland Western Liaohe River County 1900–1990 Historical data Yan and Han (2004)D23 LU Urban Beijing in China 1911–1997 Historical data Lu et al. (2001)D24 MAO Cropland Forest
Urban etc.White City in Jilin Province 1890–1950 Historical data Remote-sensing data model Mao (2010)
D25 TIAN Cropland ForestGrassland
Re cha sui in China County 1724–1996 Historical data correction Population data Tian (2005)
D26 LIU andZHANG
Cropland ForestGrassland Urban
China 1990,1995, 2000
Based on Landsat TM Liu et al. (2003)
D27 GE Cropland ForestGrassland Urban
China 1927–1997 Historical data Ge et al. (2000)
D28 DANG Cropland China 1949–2000 Historical data and prediction Dang and Yan (1998)D29 FENG Cropland China 1949–2003 Inversion based on statistical data Feng et al. (2005)D30 FAN Forest China 2069 BC–
1998 ADHistorical data Fan and Dong (2001)
D31 CPR Cropland China 1949–1986 Historical data Fu et al. (2007)D32 CARI Cropland China 1953–1989 Historical data Bi and Zheng (2000)D33 XU Cropland China 1913–1949 Historical data Xu (1998)D34 ZHENG Cropland China 1651–1910 Historical data Zheng et al. (1998)
226 L. Miao et al. / Global and Planetary Change 100 (2013) 224–233
and government financial support. The datasets display unexpecteddiscrepancies after 1949, based on different state statistics. FAO, DANGand CPR datasets show a decreasing trend after 1956. FAO data showsa dramatic jump from 1981 to 1992, contrary to the trend indicatedby FENG. All datasets show a decreasing trend after 1990. It is difficultto determine which dataset provides the most accurate information,as all studies used quite different data sources and probably useddifferent accounting methods.
On the left is displayed the data for China as a whole in 1735, 1933and 2000, using a modern-day baseline map (also for forest, urbanand grassland). The right-hand panels show county-scale informationfor Jiangsu and Anhui Provinces (highlighted in red in left-hand-sidemaps) for the same years. The gray sections observed in the 1735 and1933 datasets are for Mengxin and Qingzang Provinces, for whichreliable reconstructed data is not available. Upper left: both figuresare from D7 and D8. Upper right: both figures are from D18. Othersare from D26 after calculation (see Table 1 for details).
Fig. 4 shows the spatial pattern of historical changes of croplandareas as percentages of cropland for a given area. The increasing trendobserved in Figs. 2 and 3 is mirrored in the cropland spatial distribution,with the greatest increase occurring in eastern China—specifically, crop-lands in the three north-eastern provinces of Heilongjiang, Jilin andLiaoning, and in Henan, Jiangsu and Anhui, which experienced a rela-tively larger expansion. As Fig. 3c shows, themajor agricultural produc-tion provinces are Shandong, Henan, Anhui, Hunan, Hebei and Jiangsu(locations in Fig. 1). In 2000 (Fig. 4c) a regional pattern similar to thatof the other two years is evident (Fig. 4a, b).
In the three north-eastern provinces, the area of cultivated land hasgrown almost exponentially over the last 300 years, most markedly inthe past 100 years. The rate of reclamation (cropland as a proportionof total land use) has jumped from 10% to more than 20% (Ye et al.,2006). The reclamation changes were due to population increase(Zhao et al., 2002), wars, policy, natural environmental changes (Ge etal., 2003) and human activity (Zeng et al., 2011), but it has been argued

Fig. 1. Spatial coverage of regional historical land-use reconstruction datasets.
Fig. 2. Historical changes in cropland areas in China in the past 300 years, 1700–2009. LIUfrom D6; GE 1 from D8; SAGE from bwww.sage.wisc.edu/iamdata>; HYDE from bhttp://themasites.pbl.nl/en/themasites>; ZHOU from D13; ZHANG from D12; SHI from D14;LIANG from D11; and ZHENG from D34.
Fig. 3. Historical changes in cropland areas in China in the past 100 years. [Inset: de-tailed description for 1912–2009 from more data resources.] GE from D27; FAO frombhttp://www.fao.org>; DANG from D28; FENG from D29; CPR from D31; CARI fromD32; and XU from D33.
227L. Miao et al. / Global and Planetary Change 100 (2013) 224–233

Fig. 4. Spatial distribution of cropland in 1735, 1933 and 2000. Data for 1735 from D7; data for 1933 from D8; and data for 2000 from D26.
228 L. Miao et al. / Global and Planetary Change 100 (2013) 224–233

Fig. 5. Quantitative changes in China's forested areas in the past 300 years. Left axis:SAGE from D1; LING from D10; LIU from D6. Right axis: HE from D5; and FAN fromD30 (see Table 1 for details).
Fig. 7. Changes of urban area in the past 300 years. HYDE: D2; LIU: D6; and GE: D28.
229L. Miao et al. / Global and Planetary Change 100 (2013) 224–233
that theyweremainly the response of the populace to economic oppor-tunity (Lambin et al., 2001). The areas in eastern and western Jiangsuand Anhui Provinces (right-hand panels, Fig. 4) evidently experienceda huge expansion.
Fig. 6. Spatial distribution of forested land in 1700, 1800, 1900 and 20
3.2. Forest
The areal extent of China's forest coverage has seen dramatic changesover the past few millennia, dropping from 60% about 4000 years ago to17% by 1840, then to 12.5% before the foundation of the People's Republicof China in 1949 (Fan and Dong, 2001). Fig. 6 shows the spatial
00. Data for 1700, 1800 and 1900 from D5; and 2000 from D26.

Fig. 9. Changes of grassland area in China in the past 300 years. HYDE: D2.
230 L. Miao et al. / Global and Planetary Change 100 (2013) 224–233
distribution of forests in China in the years 1700, 1800, 1940 and 2000. In-deed, GE1 (Ge et al., 2008b) estimated that the forest areawasmore thanhalved, from 248.13 Mha to 109.01 Mha, between 1700 and 1949. Mostof China's deforestation in modern times took place between 1840 and1949 (Fan and Dong, 2001) notably as a result of the large Chinese popu-lation increase over the past 300 years, which caused large food and fueldemands and stresses on natural resources.
Based on the dataset D10, LING estimated the forest area and cov-erage rate in terms of provincial units in the 1990s (Ling, 1983). TheHE results from 1750 to 1900 are based on the historical statisticaldata from the Qing Dynasty, and current research results and LIU for-est data from 1949 to 1990 is derived from six forest censuses. All da-tabases indicate that China's forest cover decreased from 1700 to1950, then increased until 2000 (Fig. 5).
Both the time series and spatial distribution reflect a significant de-crease in forest cover area, notably in the southern and north-easternareas. For instance, LIU suggested that forests shrank rapidly whilecropland expanded in NE and SW China between 1700 and 2005. It isworth noting that forest coverage in those areas is larger than in otherprovinces. The forested areas in the three north-eastern provinces(Heilongjiang, Jilin and Liaoning) did not change appreciably between1700 and 1800, but significant deforestation took place in the next200 years to 2000. In western and eastern Liaoning Province, andalong the Yalu River and Changbai Mountains, the natural vegetationwas completely destroyed (Ye et al., 2009b). Since the foundation ofNew China in 1949 there has been a substantial increase in forestedareas, particularly in southern China.
Although it has been possible to gain important information re-garding forest coverage, there remain many discrepancies betweendata at the province scale (He et al., 2008) and county scale (Ye etal., 2009b), highlighting the need for further work on the collectionand re-analysis of historical forest data at the county scale.
3.3. Urban
Reconstruction of historical changes in urban areas is complicatedby the lack of reliable historical information. Only two datasets con-tain information on long-term changes in urban land cover (Fig. 7),often with the aid of more, and better, subnational (population)data to improve the historical (urban and rural) population maps asone of the major driving forces for allocation of land cover (Klein
Fig. 8. Spatial distribution of urban land use. Le
Goldewijk, 2005). The LIU data shows a constant increase in urbanareas from less than 2 Mha in 1700 to approximately 6 Mha by1950, followed by a rapid growth to more than 18 Mha in the subse-quent 50 years to 2000. The HYDE reconstruction, however, indicatesmore-or-less constant urban land use area until 1950, followed by aslow increase to 4 Mha in 2000. The GE database includes changesonly from 1950 onwards, divided into four development phases: aninitial stage (1949–1957), a “rolling” phase (1958–1965), a stagna-tion phase (1966–1977) and a continued development phase(1978–present) (Ge et al., 2008a) (Fig. 8).
HE (D5) was the only dataset showing the spatial pattern of urbanareas in the 18 provinces in 1820 during the Qing Dynasty. At thattime, urban areas covered a total area of 1987.44 km2, mostly concen-trated in the Zhili Province (incorporating the present Beijing, Tianjing,and Hebei Provinces), Shandong Province, Shanxi Province, HenanProvince, Jiangsu Province, Zhejiang Province and Fujian Province.Lower population densities were characteristic of the southern prov-inces of Guangxi and Guangdong. The pattern of urban developmentat that time was consistent with the modern 21st-century pattern,wherein coastal cities develop more rapidly than inland areas. Drivingforces related to the dependency on urban areas include geographicalpattern differences (Yan and Lin, 2004), the availability of natural re-sources, economic development and population growth (Zhang et al.,2011), demographic change, and changes in land-use policies and regu-lations (Liu et al., 2005b).
ft: from D15; right: reclassified from D26.
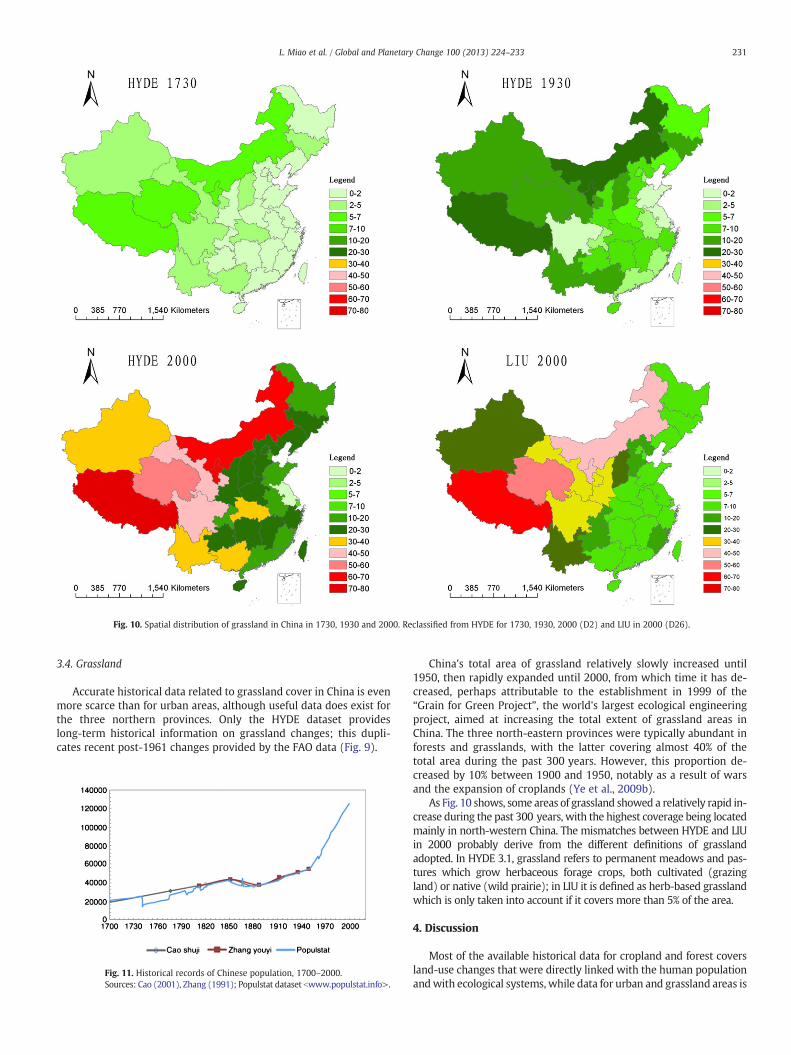
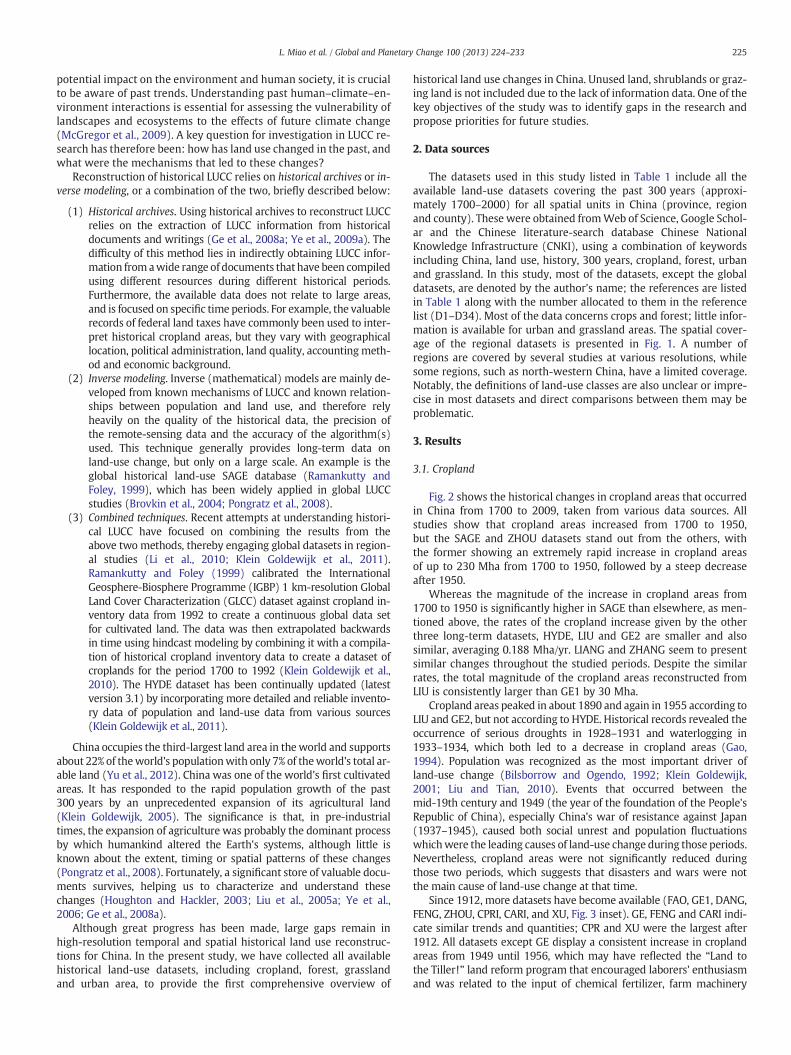
Fig. 10. Spatial distribution of grassland in China in 1730, 1930 and 2000. Reclassified from HYDE for 1730, 1930, 2000 (D2) and LIU in 2000 (D26).
231L. Miao et al. / Global and Planetary Change 100 (2013) 224–233
3.4. Grassland
Accurate historical data related to grassland cover in China is evenmore scarce than for urban areas, although useful data does exist forthe three northern provinces. Only the HYDE dataset provideslong-term historical information on grassland changes; this dupli-cates recent post-1961 changes provided by the FAO data (Fig. 9).
Fig. 11. Historical records of Chinese population, 1700–2000.Sources: Cao (2001), Zhang (1991); Populstat dataset bwww.populstat.info>.
China's total area of grassland relatively slowly increased until1950, then rapidly expanded until 2000, from which time it has de-creased, perhaps attributable to the establishment in 1999 of the“Grain for Green Project”, the world's largest ecological engineeringproject, aimed at increasing the total extent of grassland areas inChina. The three north-eastern provinces were typically abundant inforests and grasslands, with the latter covering almost 40% of thetotal area during the past 300 years. However, this proportion de-creased by 10% between 1900 and 1950, notably as a result of warsand the expansion of croplands (Ye et al., 2009b).
As Fig. 10 shows, some areas of grassland showed a relatively rapid in-crease during the past 300 years, with the highest coverage being locatedmainly in north-western China. The mismatches between HYDE and LIUin 2000 probably derive from the different definitions of grasslandadopted. In HYDE 3.1, grassland refers to permanent meadows and pas-tures which grow herbaceous forage crops, both cultivated (grazingland) or native (wild prairie); in LIU it is defined as herb-based grasslandwhich is only taken into account if it covers more than 5% of the area.
4. Discussion
Most of the available historical data for cropland and forest coversland-use changes that were directly linked with the human populationandwith ecological systems, while data for urban and grassland areas is

232 L. Miao et al. / Global and Planetary Change 100 (2013) 224–233
relatively scarce except in global datasets. Even for cropland, the spatialcoverage of the historical archives is not evenly distributed. Detailedspatial information at the county level is available for certain time pe-riods for several provinces (Shangdong, Henan, Jiangsu and NE China),while very little information is available for NWChina. It is also of inter-est to point out that the definition of land-use classifications varies be-tween datasets to the extent that it is difficult, if not impossible, tocombine the information satisfactorily. Therefore, the uncertaintiesand gaps in knowledge of the spatial and temporal changes pose thegreatest challenge to an accurate estimation of historical land use.
Both SAGE and HYDE 3.1 provide continuous information onland-use changes in China, but they show significant differences intotal quantities and spatial distribution of cropland areas in NEChina, despite the abundant data available for carrying out historicalreconstruction of land use change (Li et al., 2010). Regional databased on historical archives provides better explicit information onspatial patterns, but the time-resolution of these datasets is generallylow and inconsistent, and gathering and translating it into land useinformation are not a straightforward matter. Combining varioustechniques and input resources to provide better information of re-construction would be the best solution.
Although cropland, forest, urban and grassland changes have hadtheir own driving factors, the analysis of large numbers of historicaldocuments revealed that there are also internal relationships betweenthe four kinds of land use patterns, both in spatial distribution andtotal area (Klein Goldewijk, 2001). The GE data (Ge et al., 2008b) indi-cated that certain periods were characterized by an “anti-correction”between forest and cropland areal extent. For example, the QingDynas-ty (1644–1911) was a time of rapid increase in cropland and a corre-spondingly rapid decrease in forest.
Lambin et al. (2001) argued that land-use policies and projectionsof the future role of land-use change in the Earth system dynamicsmust not only capture the complex socioeconomic and biophysicaldrivers of land-use change but must also account for the specifichuman and environmental conditions under which the drivers ofchange operate. Fig. 11 illustrates the historical population trends inChina. It shows parallel trends of urban expansion and cropland in-crease until 1950, indicating their close interrelationship. An accurateestimation of historical population data is crucial for the reconstruc-tion of historical land use change, since most inverse models relyheavily on the mechanisms of human–environment interactionswhich still require intensive research.
5. Summary and conclusions
The reconstruction of historical land use in China is relevant to re-search into climate change, biogeochemical evolution and ecologicalevolution, and has attracted considerable attention in recent years.This study aimed to review all available land-use datasets relevantto China over the past 300 years, focusing on changes in cropland,forest, urban and grassland areas. However, accurate estimates of his-torical LUCC are still challenged by much uncertainty and gaps in theknowledge of spatial and temporal changes. Most of the available in-formation, both historical and contemporary, relates to cropland andforested land. Further research is encouraged to develop ways ofcombining the various methods and data sources, particularly for in-corporating global data into regional studies, in order to provide abetter understanding of the relationship between human activityand environmental conditions.
Acknowledgments
The authors are grateful for the constructive comments from theeditor and two anonymous reviewers. This work was supported bythe National Basic Research Development Program of China (grant
no. 2011CB952001 and 2010CB428502), National Science Foundationof China (grant no. 41271542), Program for New Century ExcellentTalents in University (grant no. NCET-09-0227), National High Tech-nology Research and Development Program of China (grant no.2010AA012305) and the Fundamental Research Funds for the CentralUniversities.
References
Aide, T.M., Grau, H.R., 2004. Globalization, migration, and Latin American ecosystems.Science 305 (5692), 1915–1916.
Bi, Y.Y., Zheng, Z.Y., 2000. Analyse of changing trend of the real cultivated area after thefoundation of new China. Resources Science 22 (02), 8–12.
Bilsborrow, R.E., Ogendo, H.W.O.O., 1992. Population-driven changes in land-use indeveloping-countries. Ambio 21 (1), 37–45.
Brovkin, V., et al., 2004. Role of land cover changes for atmospheric CO2 increase andclimate change during the last 150 years. Global Change Biology 10 (8), 1253–1266.
Cao, S.J., 2001. History of Chinese Population. Shanghai Press.Dang, A.R., Yan, S.Y., 1998. A study on the temporal variation of China's farmland area
and grain-crop sown area. Progress in Geography 17 (01), 36–43.Defries, R.S., Hansen, M.C., Townshend, J.R.G., Janetos, A.C., Loveland, T.R., 2000. A new
global 1-km dataset of percentage tree cover derived from remote sensing. GlobalChange Biology 6 (2), 247–254.
Fan, B.M., Dong, Y., 2001. Discussion of the Chinese ancient forest coverage. Journal ofBeijing Forestry University 23 (04), 60–65.
Feddema, J.J., et al., 2005. The importance of land-cover change in simulating futureclimates. Science 310 (5754), 1674–1678.
Feng, Z.M., Liu, B.Q., Yang, Y.Z., 2005. A study of the changing trend of Chinese cultivatedland amount and data reconstructing: 1949–2003. Journal of Natural Resources 20(01), 35–43.
Foley, J.A., et al., 2005. Global consequences of land use. Science 309 (5734), 570–574.Fu, C., Zheng, J.E., Wu, C.F., 2007. Investigation and revelation of quantity change of
cultivated land resour ce in China since 1949. Scientific and Technological Manage-ment of Land and Resources 6 (06), 68–72.
Fu, H., 2005. The preliminary study on land area date in Henan—A discussion basedmainly on cultural data from 1368 to 1953. Journal of Chinese Historical Geogra-phy 20 (01), 106–115.
Gao, J.G., 1994. Research on the parameters of natural disasters. Journal of Catastropholgy9 (4), 65–73.
Ge, Q.S., Dai, J.H., 2005. 20 centuries ago, the mid-Chinese agriculture, forestry, land-usechange and driving factors. Science in China Series D 35 (01), 54–63.
Ge, Q.S., Dai, J.H., He, F.N., 2008a. Land Use Changes and Terrestrial Carbon Budgets inChina During the Last 300 years, 125. Science Press, Beijing (270 pp.).
Ge, Q.S., Dai, J.H., He, F.N., Pan, Y., Wang, M.M., 2008b. Land use changes and their re-lations with carbon cycles over the past 300 a in China. Science in China SeriesD-Earth Sciences 51 (6), 871–884.
Ge, Q.S., Dai, J.H., He, F.N., Zheng, J.Y., 2003. Cultivated land amount change and drivingforces analysis of some provinces of China in past 300 years. Progress in NaturalScience 13 (08), 825–832.
Ge, Q.S., Zhao, M.C., Zheng, J.Y., 2000. Land use change of China during the 20th century.Acta Geographica Sinica 55 (06), 698–706.
Godfray, H.C.J., et al., 2010. Food security: the challenge of feeding 9 billion people.Science 327 (5967), 812–818.
He, F.N., Ge, Q.S., Dai, J.H., Rao, Y.J., 2008. Forest change of China in recent 300 years.Journal of Geographical Sciences 18 (1), 59–72.
He, F.N., Ge, Q.S., Zheng, J.Y., 2002. Reckoning the areas of urban land use and their com-parison in the Qing Dynasty in China. Acta Geographica Sinica 57 (06), 709–716.
Houghton, R.A., 1995. Land-use change and the carbon cycle. Global Change Biology 1(4), 275–287.
Houghton, R.A., Hackler, J.L., 2003. Sources and sinks of carbon from land-use change inChina. Global Biogeochemical Cycles 17 (2), 1034.
Kauppi, P.E., et al., 2006. Returning forests analyzed with the forest identity. Proceed-ings of the National Academy of Sciences of the United States of America 103(46), 17574–17579.
Klein Goldewijk, K., 2001. Estimating global land use change over the past 300 years:the HYDE database. Global Biogeochemical Cycles 15 (2), 417–433.
Klein Goldewijk, K., 2005. Three centuries of global population growth: a spatialreferenced population (density) database for 1700–2000. Population and Environ-ment 26 (4), 343–367.
Klein Goldewijk, K., Beruen, A., Gerard Drecht, V., Martine Vos, D., 2011. The HYDE 3.1spatially explicit database of human-induced global land-use change over the past12,000 years. Global Ecology and Biogeography 20 (1), 73–86.
Klein Goldewijk, K., Beusen, A., Janssen, P., 2010. Long-term dynamic modeling of globalpopulation and built-up area in a spatially explicit way: HYDE 3.1. The Holocene 20(4), 565–573.
Lambin, E.F., et al., 2001. The causes of land-use and land-cover change: moving be-yond the myths. Global Environmental Change-Human and Policy Dimensions 11(4), 261–269.
Li, B.B., Fang, X.Q., Ye, Y., Zhang, X.Z., 2010. Regional accuracy evaluation of global landuse datasets on northeastern parts of China. Science in China Series D: Earth Sci-ences 40 (08), 1048–1059.
Liang, F.Z., 2008. Historical Statistics of Registered Permanent Residence, Farm Landand Feudal Land Tax of China. Zhonghua Book Company, Beijing, pp. 6–16.
233L. Miao et al. / Global and Planetary Change 100 (2013) 224–233
Ling, D.X., 1983. The changes of the forest resources in our country. Agricultural Historyof China (02), 26–36.
Liu, J.Y., et al., 2005a. Spatial and temporal patterns of China's cropland during1990–2000: an analysis based on Landsat TM data. Remote Sensing of Environ-ment 98 (4), 442–456.
Liu, J.Y., Zhan, J.Y., Deng, X.Z., 2005b. Spatio-temporal patterns and driving forces of urbanland expansion in china during the economic reform era. Ambio 34 (6), 450–455.
Liu, J.Y., Zhang, Z.X., Zhuang, D.F., Wang, Y.M., Zhou, W.C., 2003. A study on the spatial–temporal dynamic changes of land-use and driving forces analyses of China in the1990s. Geographical Research 22 (01), 1–12.
Liu, M.L., Tian, H.Q., 2010. China's land cover and land use change from 1700 to 2005:estimations from high-resolution satellite data and historical archives. Global Bio-geochemical Cycles 24.
Liu, S.L., 2009. North and South of Huanghe: Population and Land of Historical Periodsof Henan from 1368 to 1953. Fudan university.
Lu, Q., Zhan, J.Y., Ren, G.Z., 2001. A primary study on urbanization, land use/coverchange and the related social–human factors in Beijing in the past 100 years.Geographical Research 20 (06), 688–696 (+773).
Malhi, Y., et al., 2008. Climate change, deforestation, and the fate of the Amazon.Science 319 (5860), 169–172.
Mao, Z.L., 2010. The research on land use/land cover change and soil organic carbonpool in Baicheng City during 1890–2029. PHD Thesis, Jilin University.
McGregor, H.V., Dupont, L., Stuut, J.-B.W., Kuhlmann, H., 2009. Vegetation change,goats, and religion: a 2000-year history of land use in southern Morocco. Quater-nary Science Reviews 28 (15–16), 1434–1448.
Piao, S.L., et al., 2009. The carbon balance of terrestrial ecosystems in China. Nature 458(7241), 1009–1013.
Pitman, A.J., Hesse, P.P., 2007. The significance of large-scale land cover change on theAustralian palaeomonsoon. Quaternary Science Reviews 26 (1–2), 189–200.
Pongratz, J., Reick, C., Raddatz, T., Claussen, M., 2008. A reconstruction of global agriculturalareas and land cover for the last millennium. Global Biogeochemical Cycles 22 (3).
Ramankutty, N., Foley, J.A., 1999. Estimating historical changes in global land cover:croplands from 1700 to 1992. Global Biogeochemical Cycles 13 (4), 997–1027.
Ruddiman, W.F., Ellis, E.C., 2009. Effect of per-capita land use changes on Holocene forestclearance and CO2 emissions. Quaternary Science Reviews 28 (27–28), 3011–3015.
Shi, Z.H., 1993. Agricultural labor productivity in the early Qing Dynasty. Researches inChinese Economic History 4 (01), 49–53.
Tian, Y.C., Li, J., Ren, Z.Y., 2012. The crop land change and spatial pattern in Loess Plateauover past 300 years. Journal of Arid Land Resources and Environment 26 (02), 94–101.
Tian, Y.Y., 2005. Land cover and land use change in Rezhasui in the past 300 years. MasterThesis, Institute of Geographic Sciences and Natural Resources Research, CAS.
Wu, H., Guo, Z., Peng, C., 2003. Land use induced changes of organic carbon storage insoils of China. Global Change Biology 9 (3), 305–315.
Xu, D.F., 1998. Chinese Modern Agricultural Production and Trade Statistics. ShanghaiAgricultural Production and Trade Press, pp. 7–8.
Yan, T.Z., Han, G.H., 2004. Development of the relationship between human and envi-ronment in West Liaohe Basin since Qing Dynasty. Collection of Essays on ChineseHistorical Geography 19 (01), 17–26 (+157).
Yan, X.P., Lin, Z.P., 2004. The change of spatial disparities of urban development inChina, 1990s. Acta Geographica Sinica 59 (03), 437–445.
Ye, Y., Fang, X.Q., Dai, Y.J., Zen, Z.Z., Zhang, X.Z., 2006. Assimilation of cultivated landdata and rebuilding of reclamation ratio in the three provinces of Northeast areaduring the Republic of China. Progress in Natural Science 16 (11), 1419–1427.
Ye, Y., Fang, X.Q., Ren, Y.Y., Zhang, X.Z., Chen, L., 2009a. Cropland changes in northeastregion of China in the past 300 years. Science in China Series D 39 (03), 340–350.
Ye, Y., Fang, X.Q., Zhang, X.Z., Zeng, Z.Z., 2009b. Coverage changes of forestland andgrassland in northeastern China during the past 300 years. Journal of BeijingForestry University 31 (05), 137–144.
Yu, Y.Q., Huang, Y., Zhang, W., 2012. Modeling soil organic carbon change in croplandsof China, 1980–2009. Global and Planetary Change 82–83, 115–128.
Zao, Y., 2005. Land use and its driving force mechanism in Jiangsu and Anhui provincesfrom 1500 to 1937. PHD Thesis, Fudan University.
Zeng, Z.Z., Fang, X.Q., Ye, Y., 2011. The pattern evolution of settlements in Jilin Provinceover the past 300 years. Scientia Geographica Sinica 31 (01), 87–94.
Zhang, J., Chen, X., 2007. The historical land use and vegetation cover change in easternChina. Journal of Nanjing University (Natural Sciences) 43 (05), 544–555.
Zhang, L., Lei, J., Li, X.M., Gao, C., 2011. The features and influencing factors of urbanexpansion in China during 1997–2007. Progress in Geography 30 (05), 607–614.
Zhang, Y.Y., 1991. Modern Chinese population and cropland to estimate. Researches InChinese Economic History (01), 20–30.
Zhao, H.X., 2007. Effect of the Land Use on Environment on the Upper Reaches of FenheRiver during Qing Dynasty. Shanxi university.
Zhao, Y., Man, Z.M., Ge, Q.S., 2002. An analysis of driving forces of land use change inHuizhou area (1500—1900). Fudan Journal (Social Sciences) 5 (05), 67–74.
Zheng, Z., Ma, L., Wang, X.P., 1998. Real cultivated area in Qing Dynasty. JianghaiAcademic Journal 4 (04), 129–135.
Zhou, R., 2001. Comprehensive survey and re-estimate of the early Qing Dynasty ofarable land. Jianghan Tribune (09), 57–61.