synthesis, growth, structural, spectral, thermal and dielectric … · synthesis, growth,...
TRANSCRIPT
Digest Journal of Nanomaterials and Biostructures Vol. 10, No. 4, October - December 2015, p. 1139 - 1151
SYNTHESIS, GROWTH, STRUCTURAL, SPECTRAL, THERMAL AND
DIELECTRIC STUDIES OF A NEW ORGANIC SALT CRYSTAL:2- AMINO - 5-
CHLOROPYRIDINIUM PYRIDINE- 2- CARBOXYLATE MONOHYDRATE
T. JAYANALINA*, G. RAJARAJAN, K. BOOPATHI
Department of Physics, K.S.R.College of Engineering, Tiruchengode 637215,
Tamil Nadu, India
Department of Physics, Vidhya Mandhir Institute of Technology, Erode 638052,
Tamil Nadu, India
Centre for Crystal Growth, SSN College of Engineering, Kalavakkam,
Chennai 603110, Tamil Nadu, India
Single crystals of 2- amino - 5- chloropyridinium pyridine- 2- carboxylate monohydrate
[abbreviated as 2A5CPC ] were grown using slow solvent evaporation method. The
structure of the grown crystals was confirmed by single crystal X- ray diffraction
(SCXRD) technique. The H1 NMR and C
13 NMR spectra were recorded to elucidate the
molecular structure of the grown crystal. The presence of functional groups was
ascertained by Fourier transform infrared analysis. The optical properties of the crystals
were investigated by UV-Vis-NIR transmission spectra and the band gap of the grown
crystal was determined as 5.25 eV.The dielectric measurements of the grown crystal were
carried out with different frequencies and temperatures.Vickers micro hardness
measurement was carried out to study the mechanical behavior of the grown crystal.The
surface morphology and elemental prediction of the grown crystal were analyzed using
SEM and EDAX analysis. (Received August 4, 2015; Accepted October 9, 2015)
Keywords: Crystal growth, Molecular structure, X- ray technique, Thermal behavior and
Surface morphology
1. Introduction
In recent years, search for organic single crystal in the application of telecommunication,
frequency doubling and optoelectronics had been increased considerably [1-5]. This is because of
their efficient physiochemical properties such as molecular nonlinearity over abroad frequency
range, low cost, inherent synthetic flexibility, high optical damage threshold (> 10GW/ cm2),
ultrafast response with better process ability, ease of fabrication and possible integration into
devices.Researchers are giving an appreciable attention to grow organic single crystals for
technological applications. The crystalline organic materials allow one to fine tune their optical
properties through molecular engineering and chemical synthesis [6].More than 70% of organic
compounds crystalline in centrosymmetric space group due to the predominant anti- parallel π-
stacking between the aromatic rings as a consequence of dipolar interactions [7, 8].Organic
crystals offer flexibility in molecular design [9].Pyridine is a heterocyclic organic compound with
the chemical formula C5H5N. Intensive studies on pyridine and pyridine derivatives have been
made in the past, keeping in the view of their industrial importance both as fundamental building
block and reagent in organic synthesis.Some of the reported promising 2- amino pyridine
derivatives are 2-amino-5-chloropyridinium-L-tartarate (2A5CPLTA)[10],2-amino-5-
nitropyridinium dihydrogen phosphate, 2-amino-5-nitropyridinium dihydrogen arsenate, 2-amino-
5-nitropyridinium acetophosphate, 2-amino-5-nitropyridinium chloride (2A5NPCl), 2-amino-5-
nitropyridinium bromide (2A5NPBr) and 2-amino-5-nitropyridinium- L-monohydratetartrate
*Corresponding author: [email protected]
1140
(2A5NPLT)[11- 13]. Picolinic acid, an isomer of nicotinic acid is used as an intermediate to
produce pharmaceuticals (especially local anesthetics) and metal salts for the application of
nutritional supplements.This organic material crystallizes in the monoclinic crystal system with
centrosymmetric space group P 21/c, and the unit cell parameters are a = 9.1868(7)A˚ , b =
19.3639(13)A˚, c = 14.6336(11)A˚ .The crystal structure consists of 2-amino-5-chloropyridinium
and picolinic acid molecules held together by a network of hydrogen bonds resulting in two-
dimensional hydrogen bond framework.
Single crystals of 2A5CPC in reasonable size are grown from solution of 2A5CPC by
slow evaporation technique. In the present investigation, structural, crystal growth, spectral,
optical, thermal, mechanical, dielectric, surface morphology and elemental prediction have been
reported for the first time.
2. Experimental procedure
2.1 Synthesis, Solubility and crystal growth
The title compound was synthesized by taking 2-amino-5-chloropyridine (Sigma-Aldrich
99 %) and 2- picolinic acid (Merck 99 %) in an equimolar ratio. The calculated amount of 2-
amino- 5- chloropyridine was first dissolved in methanol. 2- picolinic acid was dissolved in double
distilled water and then added to the solution slowly by stirring. To obtain the homogenous
solution it was continuously stirred for 6 hours and filtered using Whatman filter paper. This
filtered solution was allowed to dry at room temperature and the salts were obtained. The dried salt
was collected and used for the further growth of 2A5CPC crystal.The purity of the synthesized salt
was further improved by successive recrystallization process.
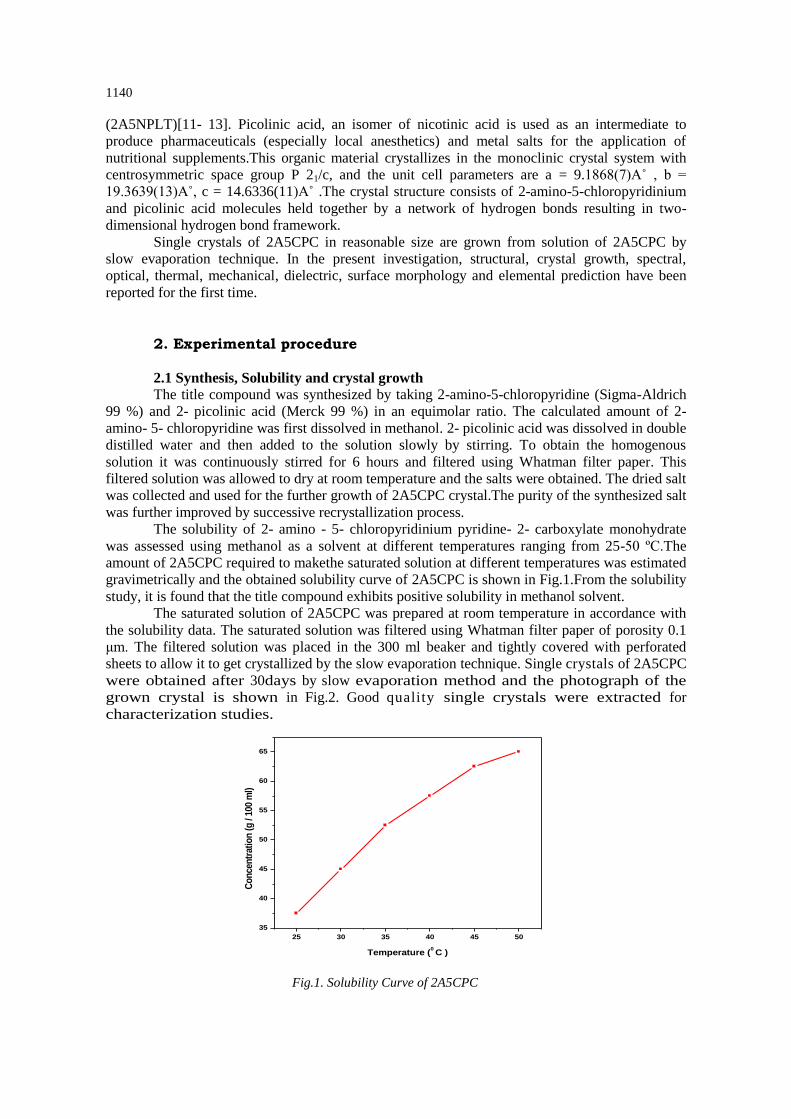
The solubility of 2- amino - 5- chloropyridinium pyridine- 2- carboxylate monohydrate
was assessed using methanol as a solvent at different temperatures ranging from 25-50 ºC.The
amount of 2A5CPC required to makethe saturated solution at different temperatures was estimated
gravimetrically and the obtained solubility curve of 2A5CPC is shown in Fig.1.From the solubility
study, it is found that the title compound exhibits positive solubility in methanol solvent.
The saturated solution of 2A5CPC was prepared at room temperature in accordance with
the solubility data. The saturated solution was filtered using Whatman filter paper of porosity 0.1
μm. The filtered solution was placed in the 300 ml beaker and tightly covered with perforated
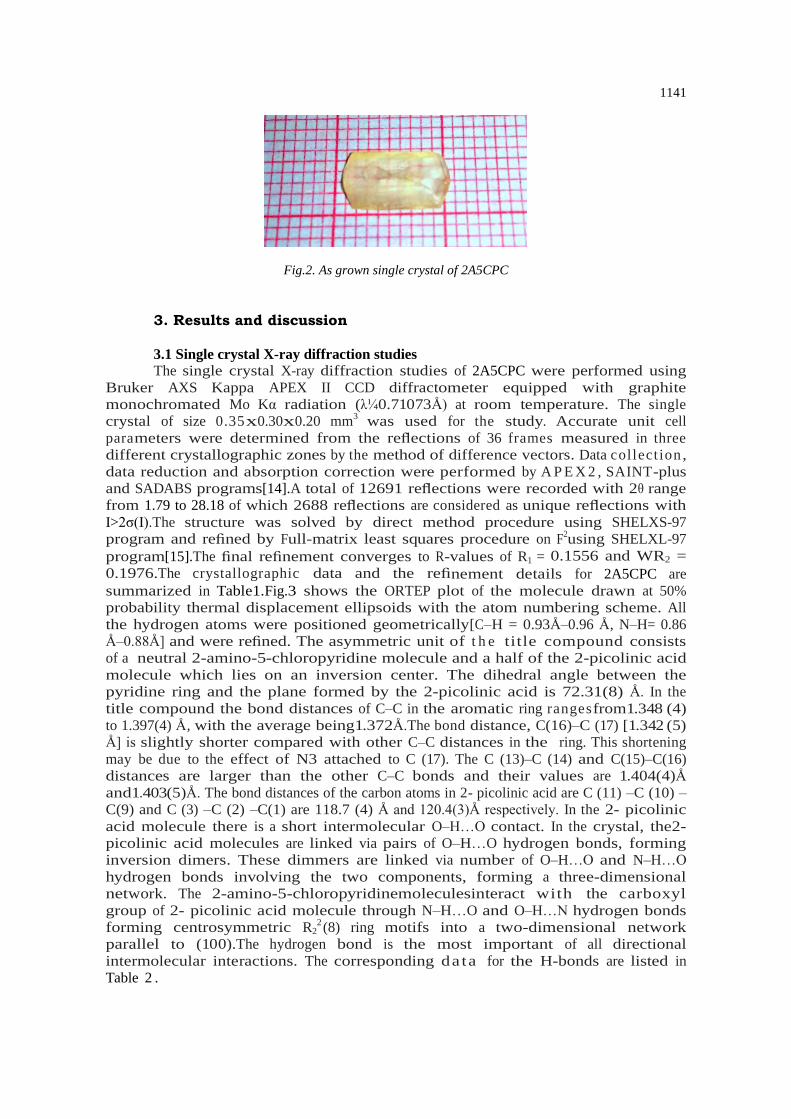
sheets to allow it to get crystallized by the slow evaporation technique. Single crystals of 2A5CPC
were obtained after 30days by slow evaporation method and the photograph of the
grown crystal is shown in Fig.2. Good quality single crystals were extracted for
characterization studies.
Fig.1. Solubility Curve of 2A5CPC
25 30 35 40 45 50
35
40
45
50
55
60
65
Co
nce
ntr
atio
n (
g /
100
ml)
Temperature (0 C )
1141
Fig.2. As grown single crystal of 2A5CPC
3. Results and discussion
3.1 Single crystal X-ray diffraction studies
The single crystal X-ray diffraction studies of 2A5CPC were performed using
Bruker AXS Kappa APEX II CCD diffractometer equipped with graphite
monochromated Mo Kα radiation (λ¼0.71073Å) at room temperature. The single
crystal of size 0.35x0.30x0.20 mm3
was used for the study. Accurate unit cell
parameters were determined from the reflections of 36 frames measured in three
different crystallographic zones by the method of difference vectors. Data collect ion,
data reduction and absorption correction were performed by A P E X 2 , SAINT-plus
and SADABS programs[14].A total of 12691 reflections were recorded with 2θ range
from 1.79 to 28.18 of which 2688 reflections are considered as unique reflections with
I>2σ(I).The structure was solved by direct method procedure using SHELXS-97
program and refined by Full-matrix least squares procedure on F2using SHELXL-97
program[15].The final refinement converges to R-values of R1 = 0.1556 and WR2 =
0.1976.The crystallographic data and the refinement details for 2A5CPC are
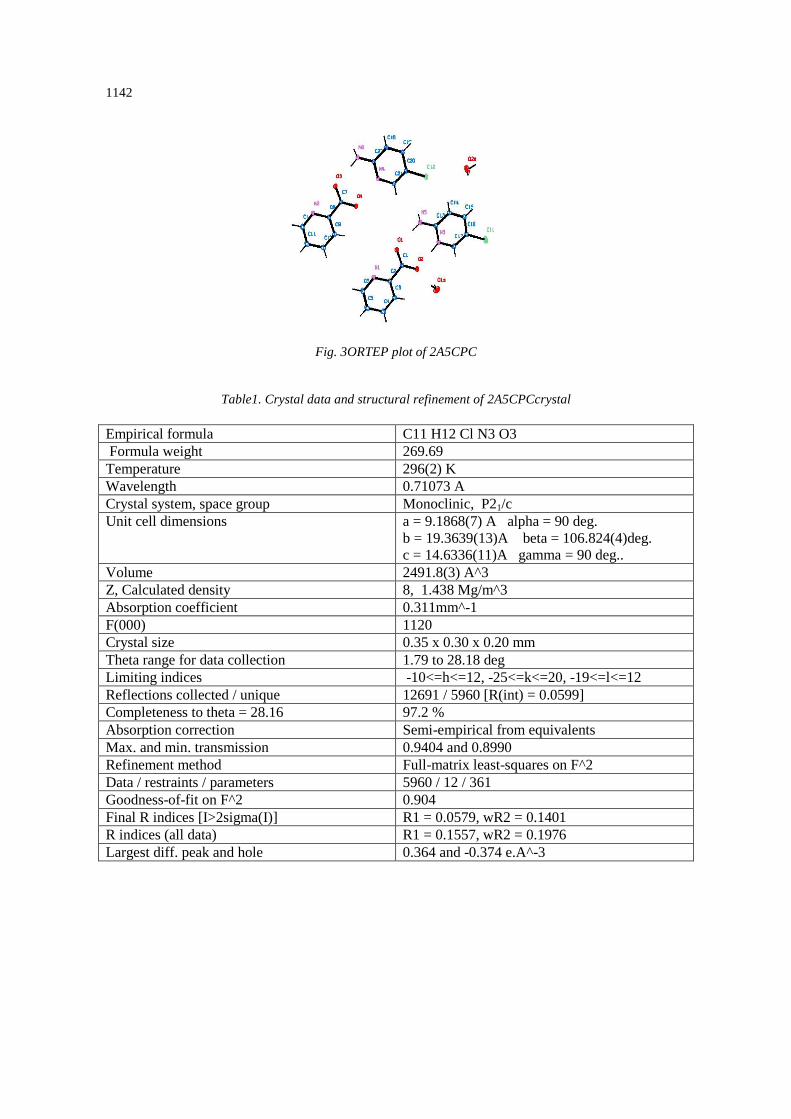
summarized in Table1.Fig.3 shows the ORTEP plot of the molecule drawn at 50%
probability thermal displacement ellipsoids with the atom numbering scheme. All
the hydrogen atoms were positioned geometrically[C–H = 0.93Å–0.96 Å, N–H= 0.86
Å–0.88Å] and were refined. The asymmetric unit of t h e title compound consists
of a neutral 2-amino-5-chloropyridine molecule and a half of the 2-picolinic acid
molecule which lies on an inversion center. The dihedral angle between the
pyridine ring and the plane formed by the 2-picolinic acid is 72.31(8) Å. In the
title compound the bond distances of C–C in the aromatic ring rangesfrom1.348 (4)
to 1.397(4) Å, with the average being1.372Å.The bond distance, C(16)–C (17) [1.342 (5)
Å] is slightly shorter compared with other C–C distances in the ring. This shortening
may be due to the effect of N3 attached to C (17). The C (13)–C (14) and C(15)–C(16)
distances are larger than the other C–C bonds and their values are 1.404(4)Å
and1.403(5)Å. The bond distances of the carbon atoms in 2- picolinic acid are C (11) –C (10) –
C(9) and C (3) –C (2) –C(1) are 118.7 (4) Å and 120.4(3)Å respectively. In the 2- picolinic
acid molecule there is a short intermolecular O–H…O contact. In the crystal, the2-
picolinic acid molecules are linked via pairs of O–H…O hydrogen bonds, forming
inversion dimers. These dimmers are linked via number of O–H…O and N–H…O
hydrogen bonds involving the two components, forming a three-dimensional
network. The 2-amino-5-chloropyridinemoleculesinteract with the carboxyl
group of 2- picolinic acid molecule through N–H…O and O–H…N hydrogen bonds
forming centrosymmetric R22(8) ring motifs into a two-dimensional network
parallel to (100).The hydrogen bond is the most important of all directional
intermolecular interactions. The corresponding da ta for the H-bonds are listed in
Table 2 .
1142
Fig. 3ORTEP plot of 2A5CPC
Table1. Crystal data and structural refinement of 2A5CPCcrystal
Empirical formula C11 H12 Cl N3 O3
Formula weight 269.69
Temperature 296(2) K
Wavelength 0.71073 A
Crystal system, space group Monoclinic, P21/c
Unit cell dimensions a = 9.1868(7) A alpha = 90 deg.
b = 19.3639(13)A beta = 106.824(4)deg.
c = 14.6336(11)A gamma = 90 deg..
Volume 2491.8(3) A^3
Z, Calculated density 8, 1.438 Mg/m^3
Absorption coefficient 0.311mm^-1
F(000) 1120
Crystal size 0.35 x 0.30 x 0.20 mm
Theta range for data collection 1.79 to 28.18 deg
Limiting indices -10<=h<=12, -25<=k<=20, -19<=l<=12
Reflections collected / unique 12691 / 5960 [R(int) = 0.0599]
Completeness to theta = 28.16 97.2 %
Absorption correction Semi-empirical from equivalents
Max. and min. transmission 0.9404 and 0.8990
Refinement method Full-matrix least-squares on F^2
Data / restraints / parameters 5960 / 12 / 361
Goodness-of-fit on F^2 0.904
Final R indices [I>2sigma(I)] R1 = 0.0579, wR2 = 0.1401
R indices (all data) R1 = 0.1557, wR2 = 0.1976
Largest diff. peak and hole 0.364 and -0.374 e.A^-3
1143
Table.2. Hydrogen bond geometry of 2A5CPC crystal
D-H d(D-H) d(H..A) <DHA d(D..A) A
N4-H4A 0.860 1.833 174.82 2.691 O4
O1S-H2S 0.873 1.991 169.32 2.853 O2
O2S-H2O2 0.847 1.974 167.10 2.807 O4
O2S-H1O2 0.851 2.012 161.52 2.832 O1
O1S-H1S 0.852 2.138 154.27 2.929 O3
N3-H3N3 0.963 1.666 173.92 2.626 O2
N6-H6A 0.874 1.976 166.12 2.832 O3
N6-H6B 0.858 2.211 161.05 3.036 N1
N6-H6B 0.858 2.353 124.02 2.922 O1
N5-H5A 0.880 1.970 166.26 2.832 O1
N5-H5B 0.845 2.224 168.28 3.056 N2
N5-H5B 0.845 2.465 112.37 2.894 O3
Symmetry code: (i) x, -y+1/2, z-1/2; (ii) x, -y+1/2, z-1/2; (iii) -x+1, y+1/2, -z+1/2;
(iv) -x+1, -y, -z; (v) -x+1, -y, -z; (vi) -x+1, -y, -z; (vii) -x+1, -y, -z.
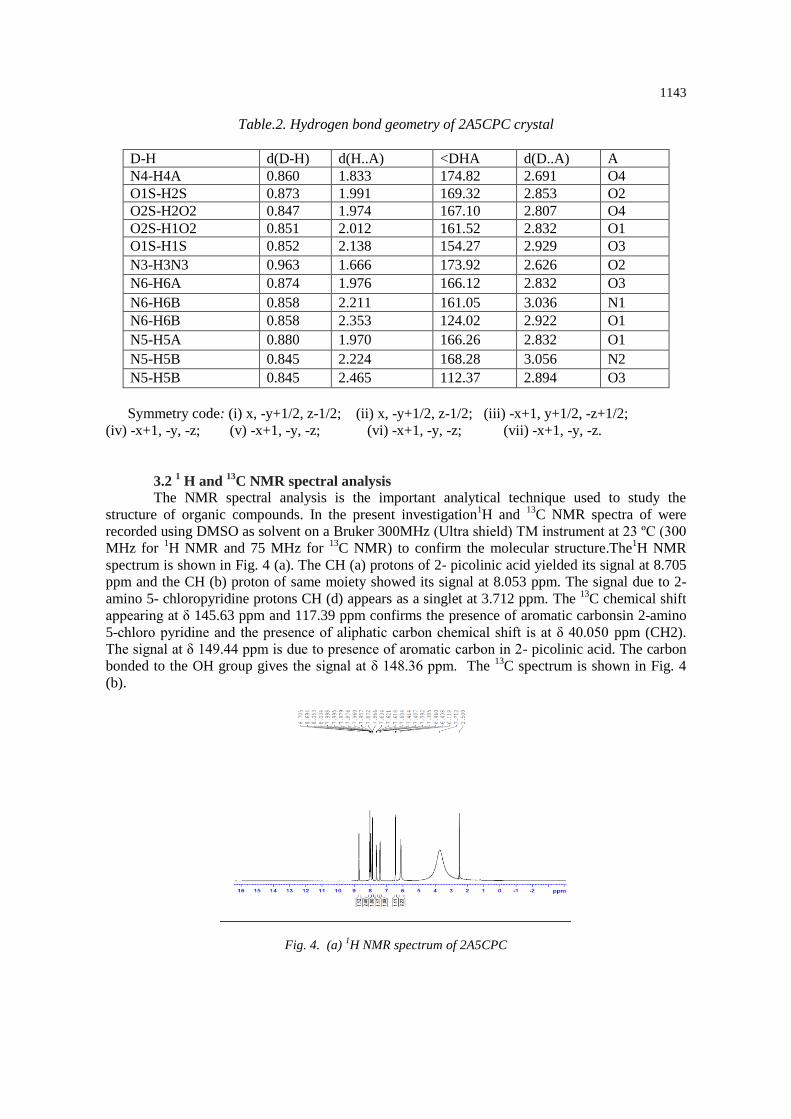
3.2 1 H and
13C NMR spectral analysis
The NMR spectral analysis is the important analytical technique used to study the
structure of organic compounds. In the present investigation1H and
13C NMR spectra of were
recorded using DMSO as solvent on a Bruker 300MHz (Ultra shield) TM instrument at 23 ºC (300
MHz for 1H NMR and 75 MHz for
13C NMR) to confirm the molecular structure.The
1H NMR
spectrum is shown in Fig. 4 (a). The CH (a) protons of 2- picolinic acid yielded its signal at 8.705
ppm and the CH (b) proton of same moiety showed its signal at 8.053 ppm. The signal due to 2-
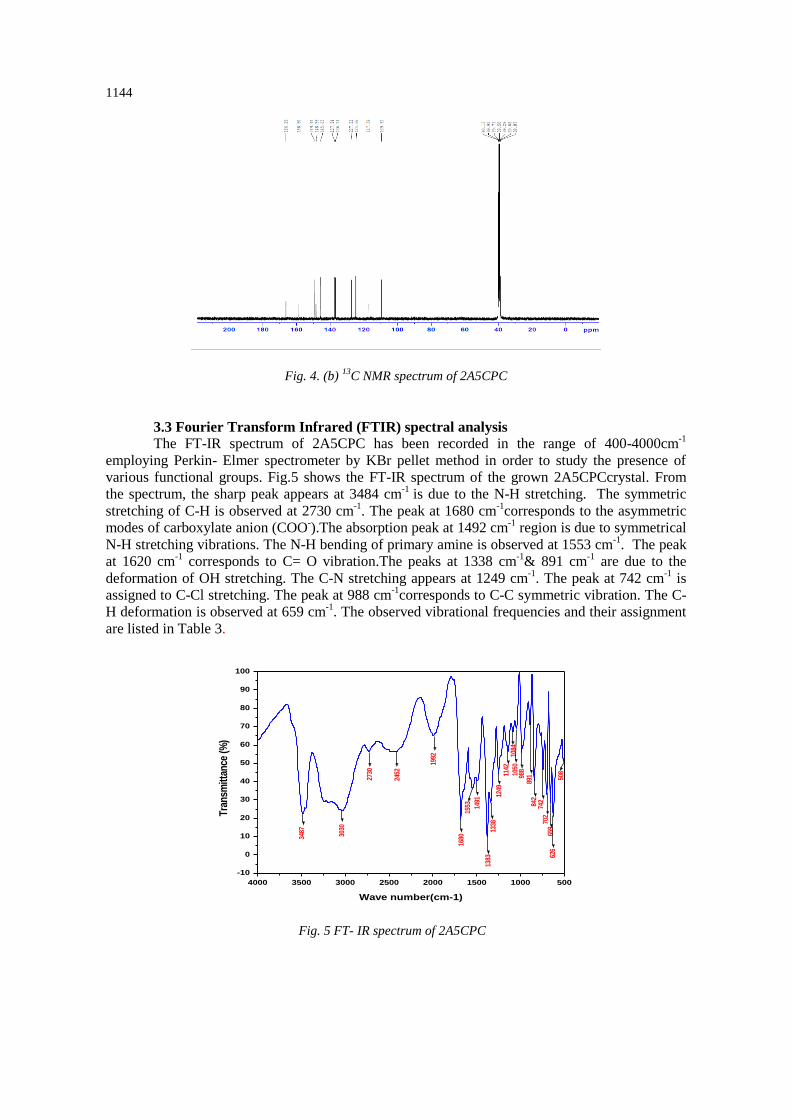
amino 5- chloropyridine protons CH (d) appears as a singlet at 3.712 ppm. The 13
C chemical shift
appearing at δ 145.63 ppm and 117.39 ppm confirms the presence of aromatic carbonsin 2-amino
5-chloro pyridine and the presence of aliphatic carbon chemical shift is at δ 40.050 ppm (CH2).
The signal at δ 149.44 ppm is due to presence of aromatic carbon in 2- picolinic acid. The carbon
bonded to the OH group gives the signal at δ 148.36 ppm. The 13
C spectrum is shown in Fig. 4
(b).
Fig. 4. (a) 1H NMR spectrum of 2A5CPC
1144
Fig. 4. (b) 13
C NMR spectrum of 2A5CPC
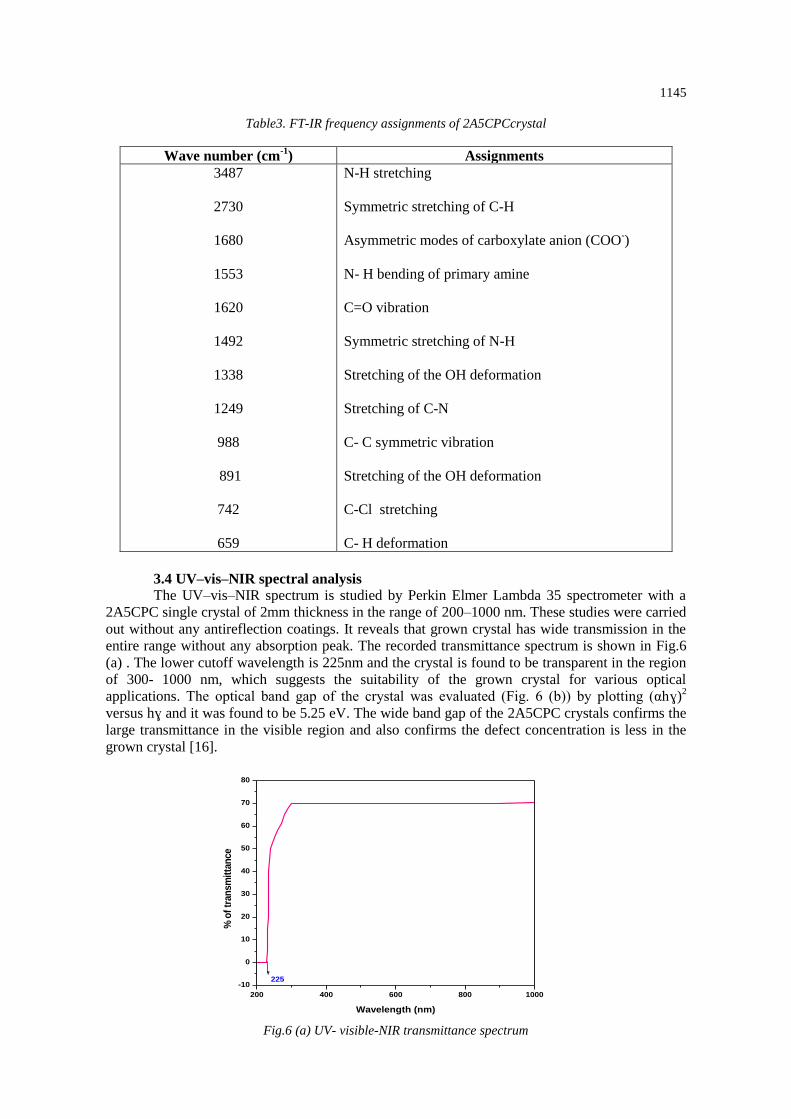
3.3 Fourier Transform Infrared (FTIR) spectral analysis
The FT-IR spectrum of 2A5CPC has been recorded in the range of 400-4000cm-1
employing Perkin- Elmer spectrometer by KBr pellet method in order to study the presence of
various functional groups. Fig.5 shows the FT-IR spectrum of the grown 2A5CPCcrystal. From
the spectrum, the sharp peak appears at 3484 cm-1
is due to the N-H stretching. The symmetric
stretching of C-H is observed at 2730 cm-1
. The peak at 1680 cm-1
corresponds to the asymmetric
modes of carboxylate anion (COO-).The absorption peak at 1492 cm
-1 region is due to symmetrical
N-H stretching vibrations. The N-H bending of primary amine is observed at 1553 cm-1
. The peak
at 1620 cm-1
corresponds to C= O vibration.The peaks at 1338 cm-1
& 891 cm-1
are due to the
deformation of OH stretching. The C-N stretching appears at 1249 cm-1
. The peak at 742 cm-1
is
assigned to C-Cl stretching. The peak at 988 cm-1
corresponds to C-C symmetric vibration. The C-
H deformation is observed at 659 cm-1
. The observed vibrational frequencies and their assignment
are listed in Table 3.
Fig. 5 FT- IR spectrum of 2A5CPC
4000 3500 3000 2500 2000 1500 1000 500
-10
0
10
20
30
40
50
60
70
80
90
100
508
626
659
702
742
842
89198
810
5010
8411
4212
4913
3813
83
1491
1553
1680
1992
2452
2730
3030
3487
Tra
nsm
itta
nce
(%
)
Wave number(cm-1)
1145
Table3. FT-IR frequency assignments of 2A5CPCcrystal
Wave number (cm-1
) Assignments
3487
2730
1680
1553
1620
1492
1338
1249
988
891
742
659
N-H stretching
Symmetric stretching of C-H
Asymmetric modes of carboxylate anion (COO-)
N- H bending of primary amine
C=O vibration
Symmetric stretching of N-H
Stretching of the OH deformation
Stretching of C-N
C- C symmetric vibration
Stretching of the OH deformation
C-Cl stretching
C- H deformation
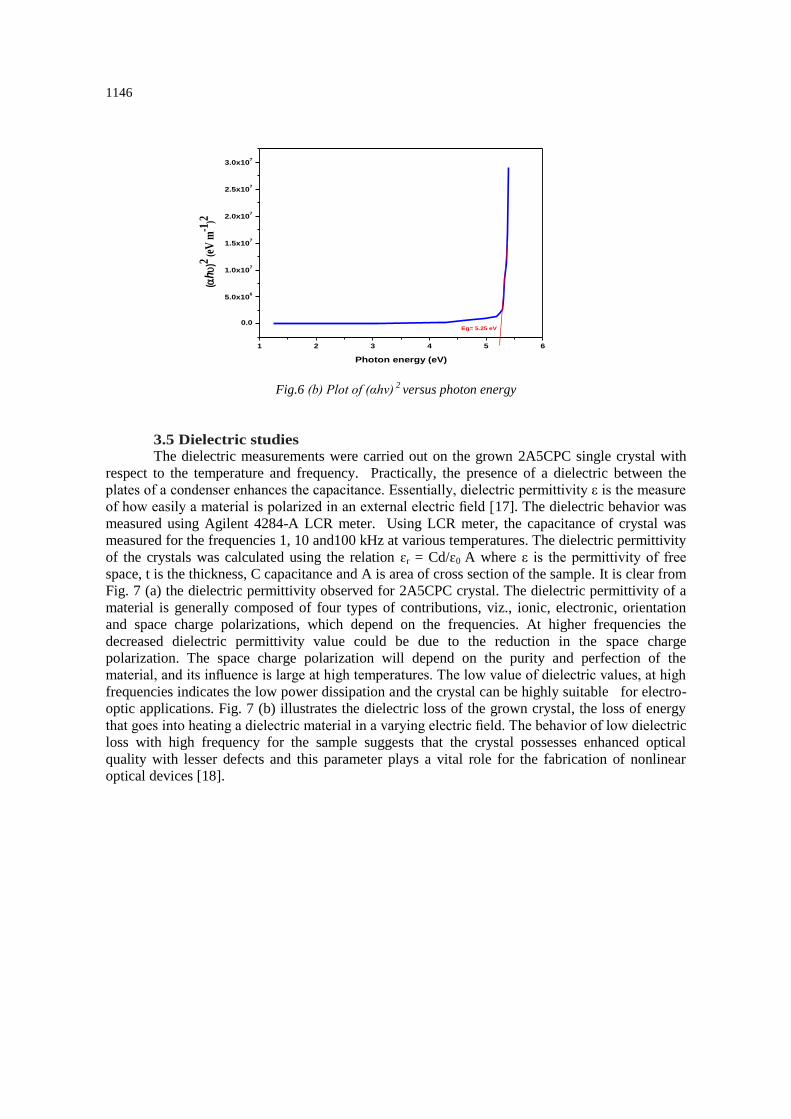
3.4 UV–vis–NIR spectral analysis
The UV–vis–NIR spectrum is studied by Perkin Elmer Lambda 35 spectrometer with a
2A5CPC single crystal of 2mm thickness in the range of 200–1000 nm. These studies were carried
out without any antireflection coatings. It reveals that grown crystal has wide transmission in the
entire range without any absorption peak. The recorded transmittance spectrum is shown in Fig.6
(a) . The lower cutoff wavelength is 225nm and the crystal is found to be transparent in the region
of 300- 1000 nm, which suggests the suitability of the grown crystal for various optical
applications. The optical band gap of the crystal was evaluated (Fig. 6 (b)) by plotting (αhɣ)2
versus hɣ and it was found to be 5.25 eV. The wide band gap of the 2A5CPC crystals confirms the
large transmittance in the visible region and also confirms the defect concentration is less in the
grown crystal [16].
Fig.6 (a) UV- visible-NIR transmittance spectrum
200 400 600 800 1000
-10
0
10
20
30
40
50
60
70
80
225
% o
f tr
an
sm
itta
nce
Wavelength (nm)
1146
Fig.6 (b) Plot of (αhv) 2
versus photon energy
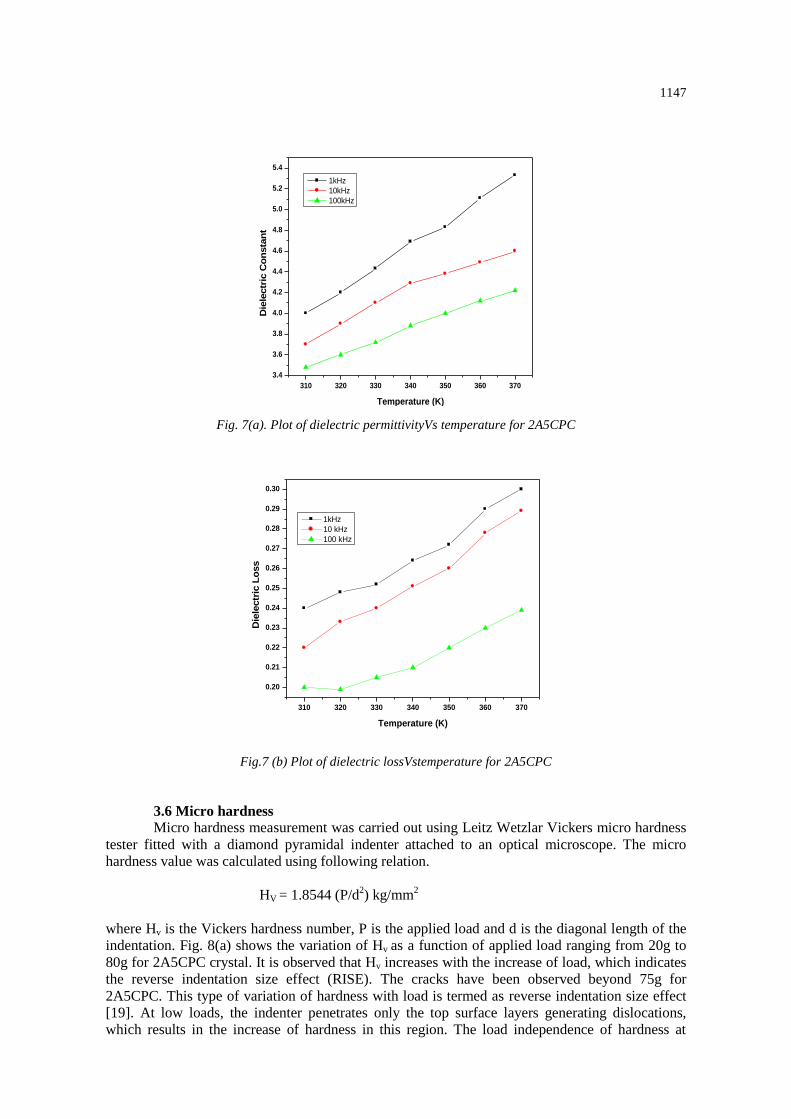
3.5 Dielectric studies
The dielectric measurements were carried out on the grown 2A5CPC single crystal with
respect to the temperature and frequency. Practically, the presence of a dielectric between the
plates of a condenser enhances the capacitance. Essentially, dielectric permittivity ε is the measure
of how easily a material is polarized in an external electric field [17]. The dielectric behavior was
measured using Agilent 4284-A LCR meter. Using LCR meter, the capacitance of crystal was
measured for the frequencies 1, 10 and100 kHz at various temperatures. The dielectric permittivity
of the crystals was calculated using the relation ɛr = Cd/ɛ0 A where ε is the permittivity of free
space, t is the thickness, C capacitance and A is area of cross section of the sample. It is clear from
Fig. 7 (a) the dielectric permittivity observed for 2A5CPC crystal. The dielectric permittivity of a
material is generally composed of four types of contributions, viz., ionic, electronic, orientation
and space charge polarizations, which depend on the frequencies. At higher frequencies the
decreased dielectric permittivity value could be due to the reduction in the space charge
polarization. The space charge polarization will depend on the purity and perfection of the
material, and its influence is large at high temperatures. The low value of dielectric values, at high
frequencies indicates the low power dissipation and the crystal can be highly suitable for electro-
optic applications. Fig. 7 (b) illustrates the dielectric loss of the grown crystal, the loss of energy
that goes into heating a dielectric material in a varying electric field. The behavior of low dielectric
loss with high frequency for the sample suggests that the crystal possesses enhanced optical
quality with lesser defects and this parameter plays a vital role for the fabrication of nonlinear
optical devices [18].
1 2 3 4 5 6
0.0
5.0x10⁶
1.0x10⁷
1.5x10⁷
2.0x10⁷
2.5x10⁷
3.0x10⁷
Eg= 5.25 eV
(h
)2 (eV
m-1
)2
Photon energy (eV)
1147
Fig. 7(a). Plot of dielectric permittivityVs temperature for 2A5CPC
Fig.7 (b) Plot of dielectric lossVstemperature for 2A5CPC
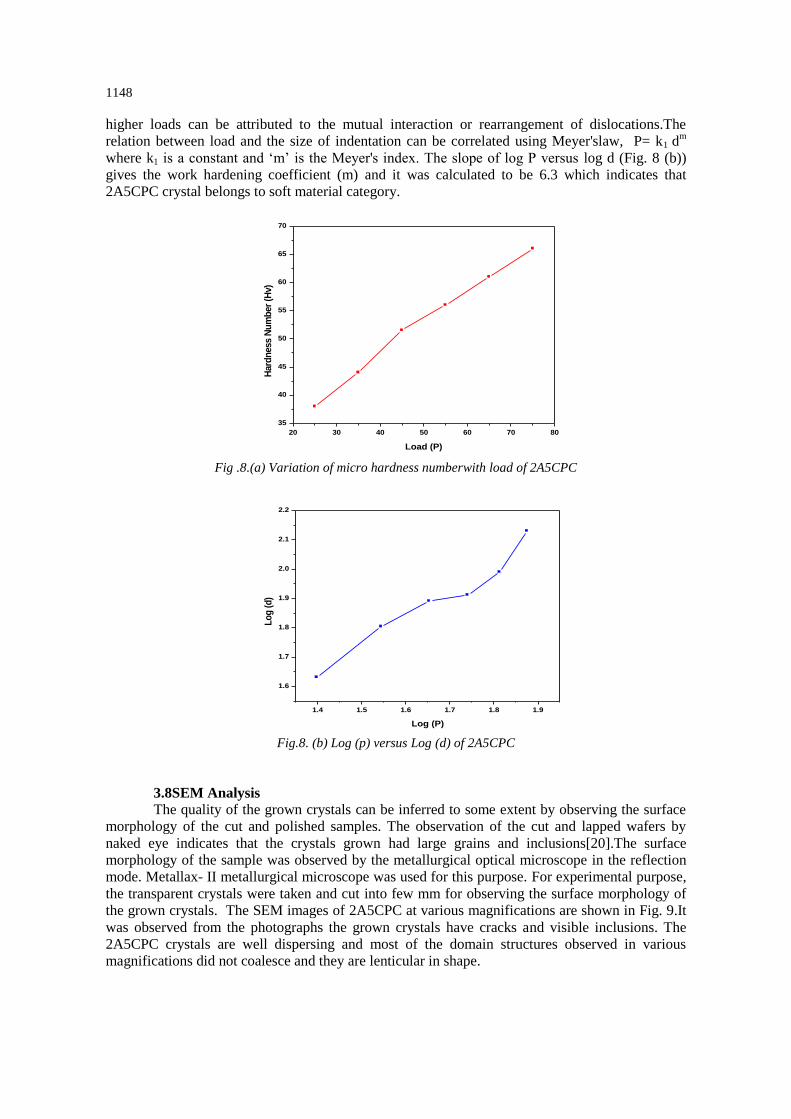
3.6 Micro hardness
Micro hardness measurement was carried out using Leitz Wetzlar Vickers micro hardness
tester fitted with a diamond pyramidal indenter attached to an optical microscope. The micro
hardness value was calculated using following relation.
HV = 1.8544 (P/d2) kg/mm
2
where Hv is the Vickers hardness number, P is the applied load and d is the diagonal length of the
indentation. Fig. 8(a) shows the variation of Hv as a function of applied load ranging from 20g to
80g for 2A5CPC crystal. It is observed that Hv increases with the increase of load, which indicates
the reverse indentation size effect (RISE). The cracks have been observed beyond 75g for
2A5CPC. This type of variation of hardness with load is termed as reverse indentation size effect
[19]. At low loads, the indenter penetrates only the top surface layers generating dislocations,
which results in the increase of hardness in this region. The load independence of hardness at
310 320 330 340 350 360 370
3.4
3.6
3.8
4.0
4.2
4.4
4.6
4.8
5.0
5.2
5.4
Die
lectr
ic C
on
sta
nt
Temperature (K)
1kHz
10kHz
100kHz
310 320 330 340 350 360 370
0.20
0.21
0.22
0.23
0.24
0.25
0.26
0.27
0.28
0.29
0.30
Die
lectr
ic L
oss
Temperature (K)
1kHz
10 kHz
100 kHz
1148
higher loads can be attributed to the mutual interaction or rearrangement of dislocations.The
relation between load and the size of indentation can be correlated using Meyer'slaw, P= k1 dm
where k1 is a constant and ‘m’ is the Meyer's index. The slope of log P versus log d (Fig. 8 (b))
gives the work hardening coefficient (m) and it was calculated to be 6.3 which indicates that
2A5CPC crystal belongs to soft material category.
Fig .8.(a) Variation of micro hardness numberwith load of 2A5CPC
Fig.8. (b) Log (p) versus Log (d) of 2A5CPC
3.8SEM Analysis
The quality of the grown crystals can be inferred to some extent by observing the surface
morphology of the cut and polished samples. The observation of the cut and lapped wafers by
naked eye indicates that the crystals grown had large grains and inclusions[20].The surface
morphology of the sample was observed by the metallurgical optical microscope in the reflection
mode. Metallax- II metallurgical microscope was used for this purpose. For experimental purpose,
the transparent crystals were taken and cut into few mm for observing the surface morphology of
the grown crystals. The SEM images of 2A5CPC at various magnifications are shown in Fig. 9.It
was observed from the photographs the grown crystals have cracks and visible inclusions. The
2A5CPC crystals are well dispersing and most of the domain structures observed in various
magnifications did not coalesce and they are lenticular in shape.
20 30 40 50 60 70 80
35
40
45
50
55
60
65
70
Hard
ness N
um
ber
(Hv)
Load (P)
1.4 1.5 1.6 1.7 1.8 1.9
1.6
1.7
1.8
1.9
2.0
2.1
2.2
Lo
g (
d)
Log (P)

1149
Fig. 9SEMimagesof 2A5CPC atvariousmagnifications
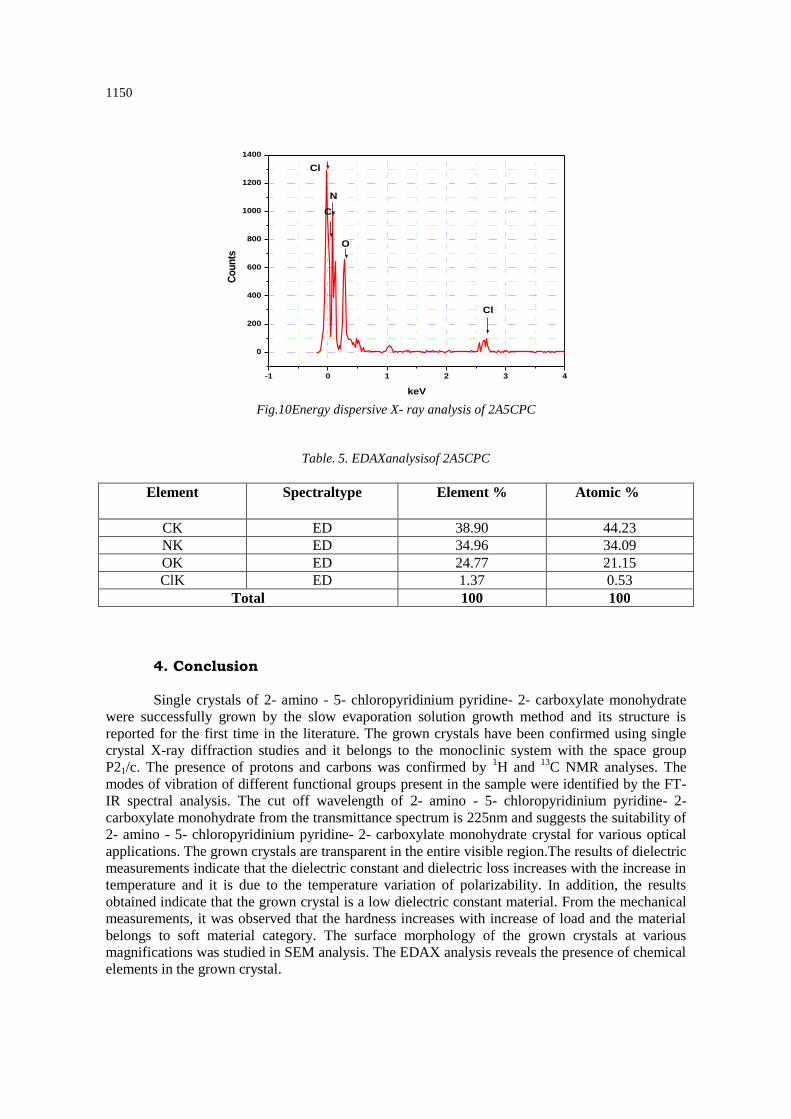
3.9Energy dispersive analysis of X-ray
“The Energy Dispersive Analysis of X-rays” is an inevitable tool to estimate the semi
quantitative chemical composition of crystals. The EDAX spectrum gives information about the
chemical elements present in the sample, irrespective of their state of chemical combination of
phases in which they exist, unlike the x-ray diffraction which discloses various compounds and
phases present in the sample. Hence the EDAX is a much more rapid method of chemical analysis
and is nondestructive. In the present investigation ‘Philips’ EM400 scanning electron microscope
with an EDS attachment is used for the purpose of an elemental analysis by energy dispersion
method. The energy spectrum of the grown crystal is shown in Fig. 10. The energy spectrum
confirms the presence of 2- amino 5- chloropyridine and 2- picolinic acid.The elemental
composition of the grown crystal is given in Table. 5.
1150
Fig.10Energy dispersive X- ray analysis of 2A5CPC
Table. 5. EDAXanalysisof 2A5CPC
Element Spectraltype Element % Atomic %
CK ED 38.90 44.23
NK ED 34.96 34.09
OK ED 24.77 21.15
ClK ED 1.37 0.53
Total 100 100
4. Conclusion
Single crystals of 2- amino - 5- chloropyridinium pyridine- 2- carboxylate monohydrate
were successfully grown by the slow evaporation solution growth method and its structure is
reported for the first time in the literature. The grown crystals have been confirmed using single
crystal X-ray diffraction studies and it belongs to the monoclinic system with the space group
P21/c. The presence of protons and carbons was confirmed by 1H and
13C NMR analyses. The
modes of vibration of different functional groups present in the sample were identified by the FT-
IR spectral analysis. The cut off wavelength of 2- amino - 5- chloropyridinium pyridine- 2-
carboxylate monohydrate from the transmittance spectrum is 225nm and suggests the suitability of
2- amino - 5- chloropyridinium pyridine- 2- carboxylate monohydrate crystal for various optical
applications. The grown crystals are transparent in the entire visible region.The results of dielectric
measurements indicate that the dielectric constant and dielectric loss increases with the increase in
temperature and it is due to the temperature variation of polarizability. In addition, the results
obtained indicate that the grown crystal is a low dielectric constant material. From the mechanical
measurements, it was observed that the hardness increases with increase of load and the material
belongs to soft material category. The surface morphology of the grown crystals at various
magnifications was studied in SEM analysis. The EDAX analysis reveals the presence of chemical
elements in the grown crystal.
-1 0 1 2 3 4
0
200
400
600
800
1000
1200
1400
Cl
Cl
N
C
O
Co
un
ts
keV
1151
Supplementary information
The crystallographic data of C11H12ClN3O3 has been deposited with the Cambridge
Crystallographic Data Centre [CCDC No. 1036880]. Copies of the data can be obtained free of
charge at www.ccdc.cam.ac.uk/conts/retrieving.html [or from the Cambridge Crystallographic
Data Centre (CCDC), 12 Union Road, Cambridge CB2 1EZ, UK; fax: +44 0 1223 336 033; email:
References
[1] N. Ramamurthy, S. Dhanuskodi, M.V. Manjusha, J. Philip, Opt. Mater. 33, 607 (2011).
[2] G. Venkatesan, G. Anandha Babu, P. Ramasamy, A. Chandramohan, J. Mol.Struct.
1033,121(2013).
[3] R.W. Munn, C.N. Ironside, Principles and Applications of Nonlinear Optical Materials,
Chapman & Hall, London, 1993.
[4] M. Jose, R. Uthrakumar, A. Jeya Rajendran, S. Jerome Das, Spectrochim. Acta A: Mol. N
Biomol.Spectrosc.86, 495 (2012).
[5] S. Lin, L. Li, J. Chen, Y. Chen, J. Cryst. Growth 249, 341 (2003).
[6] A.Datta, S.K. Pati, J.Chem. Phys. 118, 8420 (2003).
[7] S. C. Abrahams, J. M. Robertson ActaCryst. 1,252 (1948).
[8] J. Donhue, K .N. TruebloodActaCryst. 9, 960 (1956).
[9] W. Yang, L. Chen, S. Wang, Inorg. Chem. 40, 507 (2001).
[10] T.Jayanalina, G.Rajarajan, K.Boopathi, K.Sreevani, J.Cryst.Growth 426, 9 (2015).
[11] J. Zyss, R. Masse, M. Bagieu-Beucher, J.P. Levy, Adv. Mater. 5, 120 (1993).
[12] J. Zaccaro, B. Capelle, A. Ibanez, J. Cryst. Growth 180, 229 (1997).
[13] J. Pecaut, J.P. Levy, R. Masse, J. Mater. Chem. 3, 999 (1993).
[14] Bruker, APEX2 and SAINT-Plus, Bruker AXS Inc., Madison, Wisconsin, USA,2004.
[15] G.M. Sheldrick, ActaCrystallogr., Sec. A: Found. Crystallography 64, 122 (2008).
[16] F. Perron – Sierra, S.D. Dizier, M. Bertrand, A. Genton, G.C. Tucker, P. Casasra, Bioorg
Med.Chem.Lett12, 3291 (2002).
[17] D. Xue,K.Kitamura,SolidState.Commun.122, 541(2002).
[18] C. Balarew,R.Duhlev,J.SolidState.Chem.55, 1 (1984).
[19] N.Sundaraganesan, S. Ilakiamani, B. Anand, H. Saleem, B. Dominic Joshua, Spectrochima
Acta Part A 64, 586 (2006).
[20] S.Janarthanan, T.Kishore Kumar, S.Pandi, D.Prem Anand, Indian J Pure &Appl Phys.
47,332 (2009).