symposium data-driven marketing: rogier van nieuwenhuizen - powering growth with big data analytics
TRANSCRIPT
powered by
Powering GROWTH with BIG DATA
November 2014
| 1
#1 Big Data
The Big Data storm is real – but not easy to
navigate
| 2
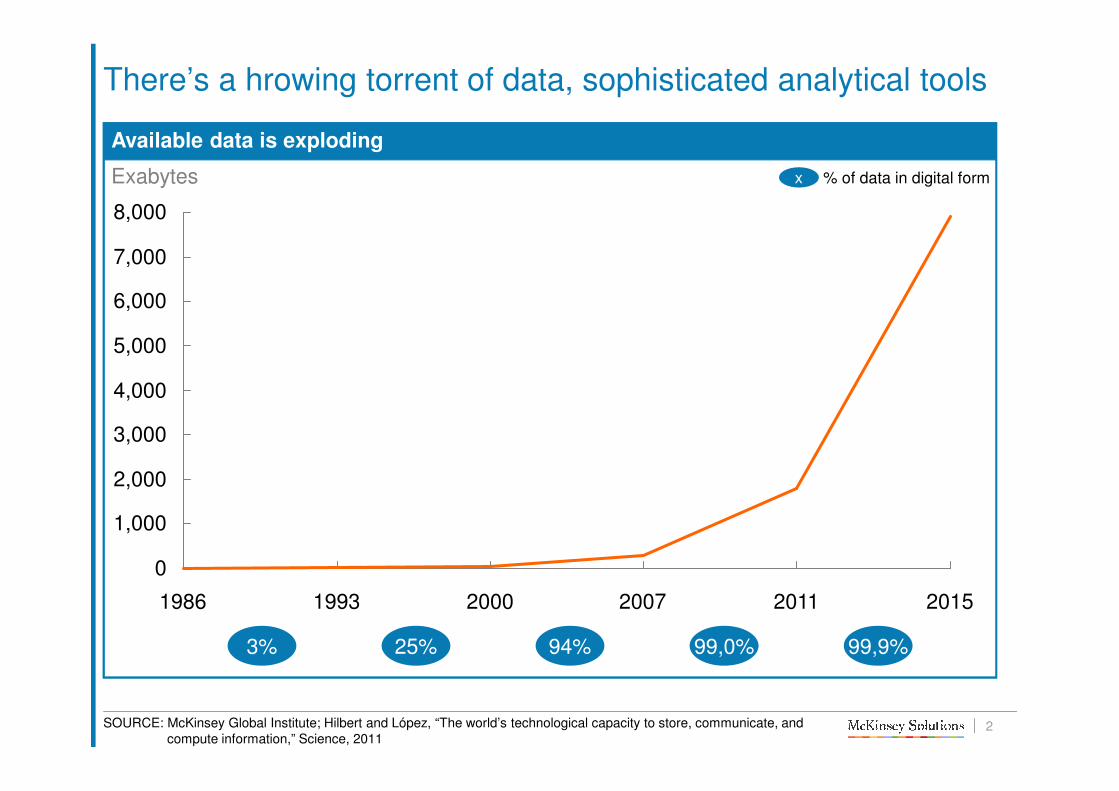
Available data is exploding
There’s a hrowing torrent of data, sophisticated analytical tools
SOURCE: McKinsey Global Institute; Hilbert and López, “The world’s technological capacity to store, communicate, and compute information,” Science, 2011
Exabytes
8,000
7,000
6,000
5,000
4,000
3,000
2,000
1,000
0
201520112007200019931986
3% 25% 94% 99,0% 99,9%
x % of data in digital form
| 3
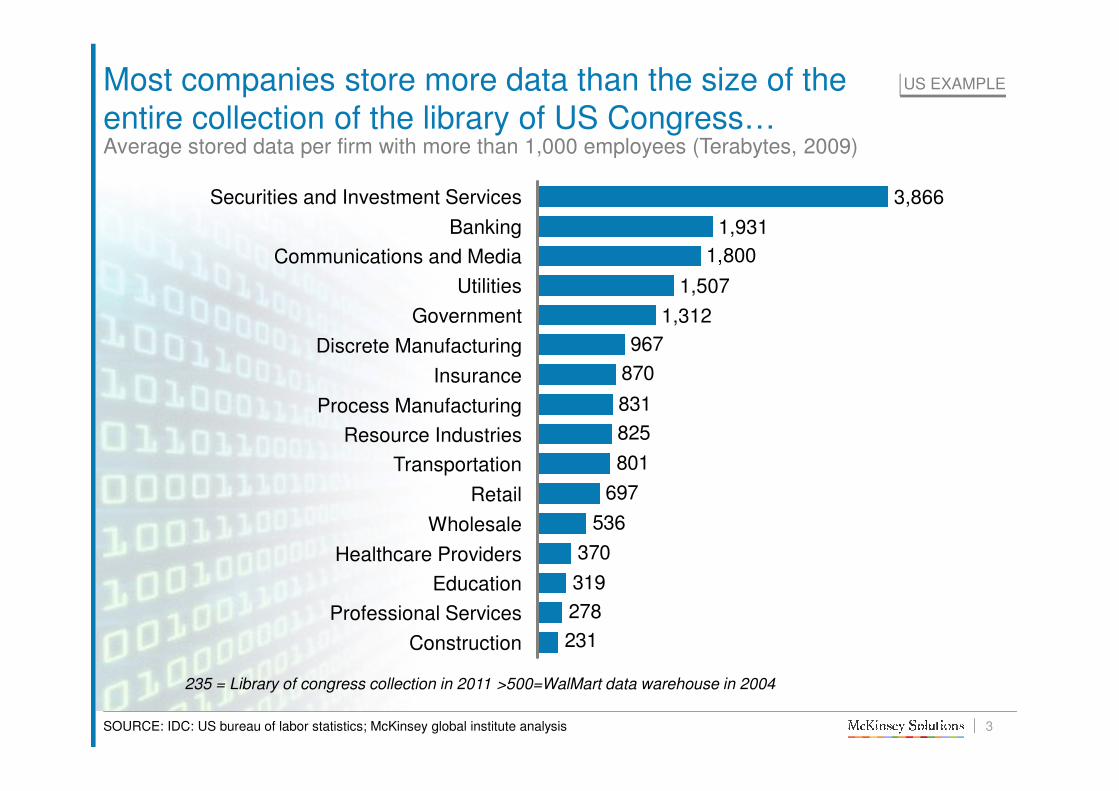
Most companies store more data than the size of theentire collection of the library of US Congress…
>500=WalMart data warehouse in 2004
US EXAMPLE
235 = Library of congress collection in 2011
Average stored data per firm with more than 1,000 employees (Terabytes, 2009)
SOURCE: IDC: US bureau of labor statistics; McKinsey global institute analysis
1,800
231
278
319
370
536
697
801
825
831
870
967Discrete Manufacturing
Utilities
Healthcare Providers
Securities and Investment Services
Banking
1,312
1,507
1,931
3,866
Education
Retail
Wholesale
Construction
Resource Industries
Process Manufacturing
Insurance
Communications and Media
Transportation
Professional Services
Government
| 4
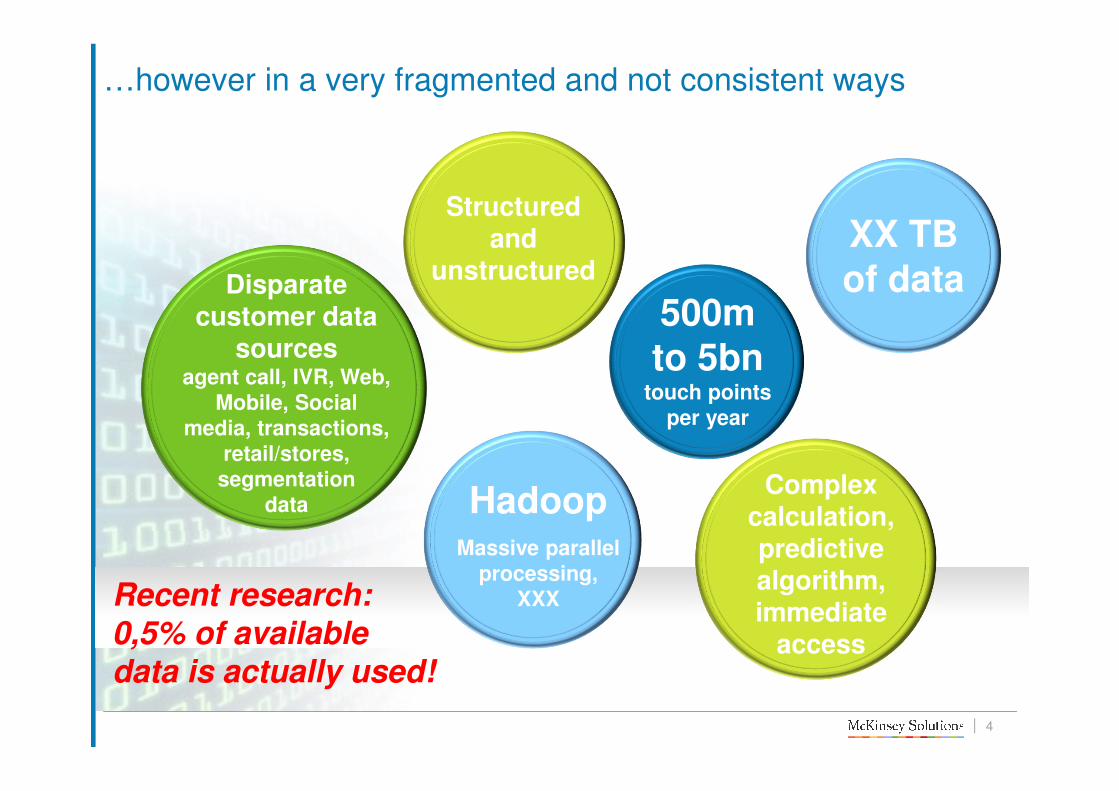
…however in a very fragmented and not consistent ways
Structured and
unstructured
HadoopMassive parallel
processing,
XXX
500m
to 5bn touch points
per year
Disparate customer data
sourcesagent call, IVR, Web,
Mobile, Social
media, transactions,
retail/stores,
segmentation
data
XX TB
of data
Complex calculation, predictive algorithm, immediate
access
Recent research:
0,5% of available
data is actually used!
| 5
#2 Big Data
There’s tremendous value in applying big data
technology to drive business impact
| 6
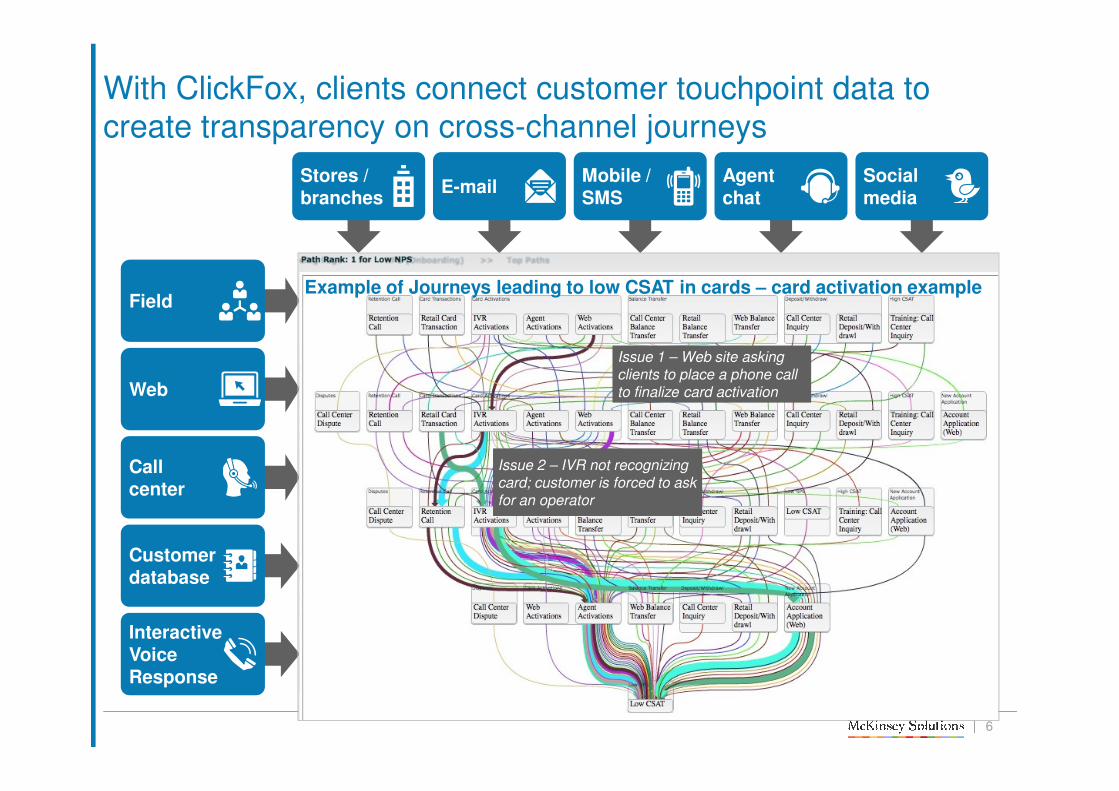
With ClickFox, clients connect customer touchpoint data to create transparency on cross-channel journeys
E-mailAgent chat
Stores / branches
Mobile /SMS
Social media
Field
Web
Callcenter
Customer database
Interactive Voice Response
SOLVING THE “DATA CHALLENGE”
▪ Quick set-up, no need for major IT investments
▪ Aggregating Bns of touchpoints sitting in 20+ systems — and proliferating quickly
▪ Managing structured and unstructured / messy data
▪ Refreshing data on a daily basis to follow the market pace
▪ Built-in algorithms to visualize Journeys, navigate through hundreds of millions of data points and surface opportunities quickly
Example of Journeys leading to low CSAT in cards – card activation example
Issue 2 – IVR not recognizing card; customer is forced to ask for an operator
Issue 2 – IVR not recognizing card; customer is forced to ask for an operator
Issue 1 – Web site asking clients to place a phone call to finalize card activation
Issue 1 – Web site asking clients to place a phone call to finalize card activation
| 7
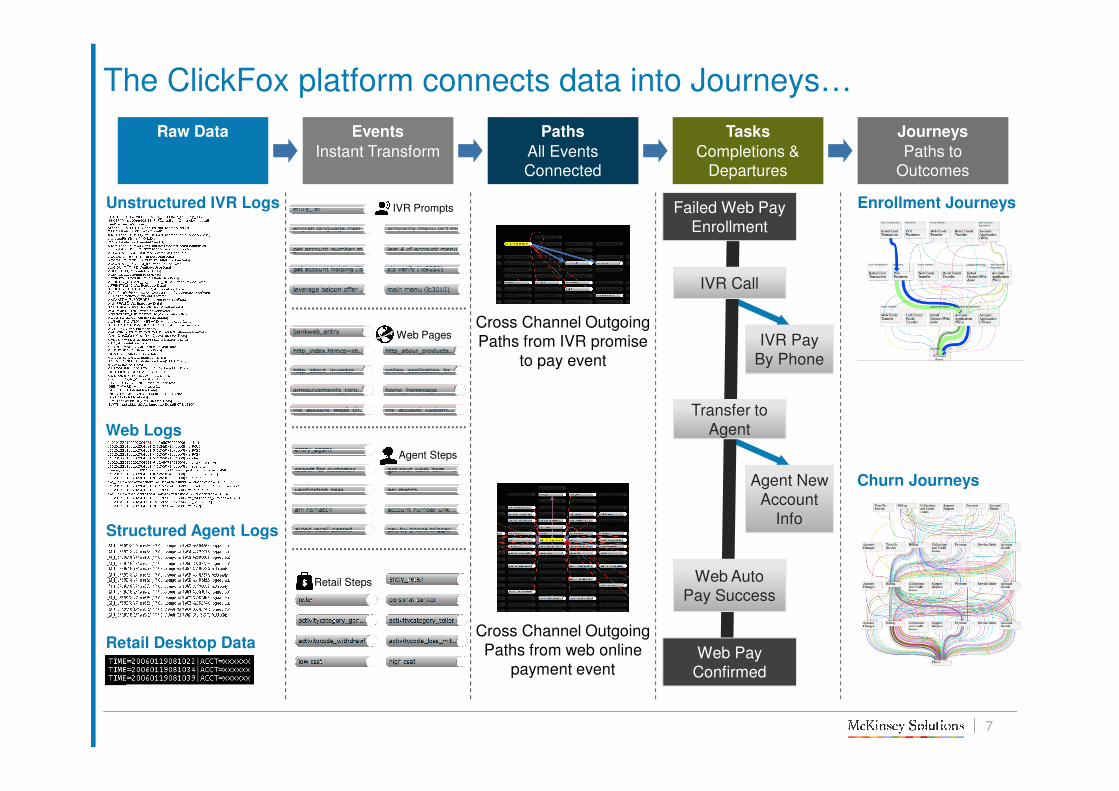
The ClickFox platform connects data into Journeys…
TasksRaw Data Events Paths Journeys
Completions & Departures
Instant Transform All Events Connected
Paths to Outcomes
Failed Web Pay Enrollment
Web Pay Confirmed
IVR Call
Transfer to Agent
Web Auto Pay Success
IVR Pay By Phone
Agent New Account
Info
Unstructured IVR Logs
Structured Agent Logs
Retail Desktop Data
Web Logs
Cross Channel Outgoing Paths from IVR promise
to pay event
Cross Channel Outgoing Paths from web online
payment event
Enrollment Journeys
Churn Journeys
Agent Steps
Retail Steps
IVR Prompts
Web Pages
| 8
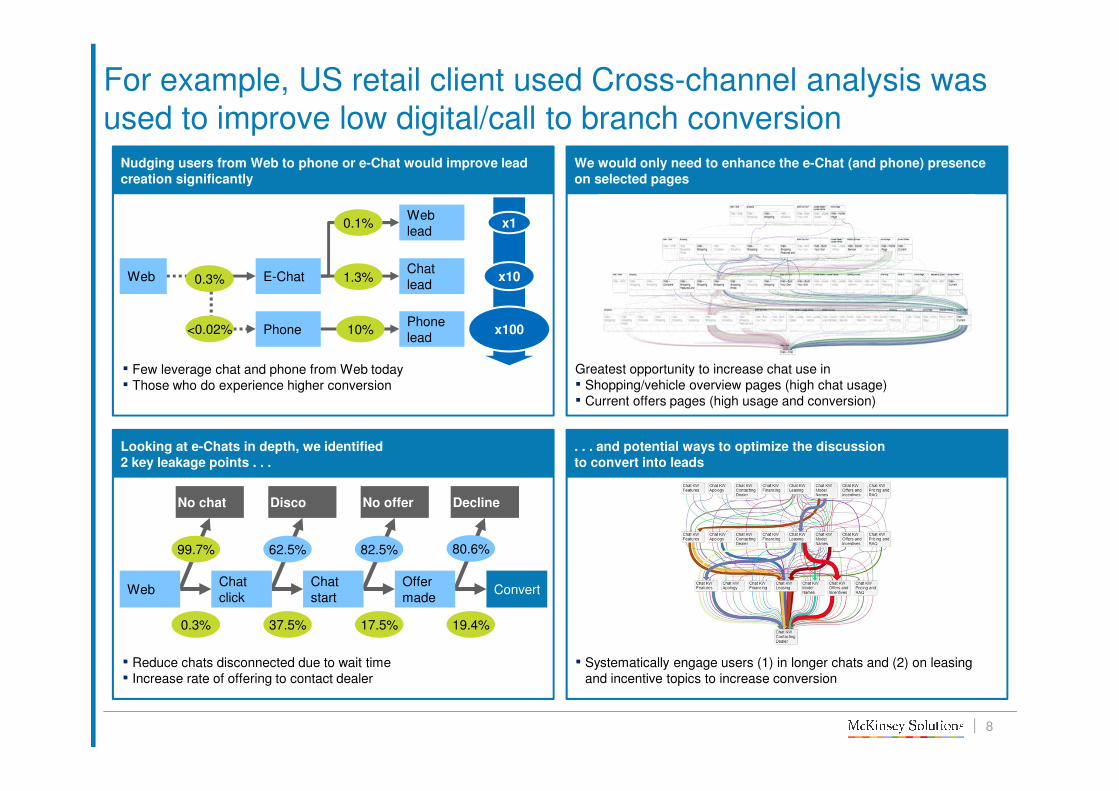
For example, US retail client used Cross-channel analysis was used to improve low digital/call to branch conversion
We would only need to enhance the e-Chat (and phone) presence
on selected pages
. . . and potential ways to optimize the discussion
to convert into leads
Looking at e-Chats in depth, we identified
2 key leakage points . . .
37.5% 19.4%0.3% 17.5%
62.5% 80.6%99.7% 82.5%
DeclineNo offerDiscoNo chat
Chat click
Chat start
Offer made
ConvertWeb
Web
Phone
Chat lead
Phone lead
<0.02%
Web lead
Nudging users from Web to phone or e-Chat would improve lead
creation significantly
1.3%
10%
0.1%
▪ Few leverage chat and phone from Web today▪ Those who do experience higher conversion
Greatest opportunity to increase chat use in▪ Shopping/vehicle overview pages (high chat usage)▪ Current offers pages (high usage and conversion)
▪ Reduce chats disconnected due to wait time▪ Increase rate of offering to contact dealer
▪ Systematically engage users (1) in longer chats and (2) on leasing and incentive topics to increase conversion
x10
x100
x1
E-Chat0.3%
| 9
#3 Continuous flow
With Big data, companies can uncover never
ending flow of highly specific opportunities
| 10
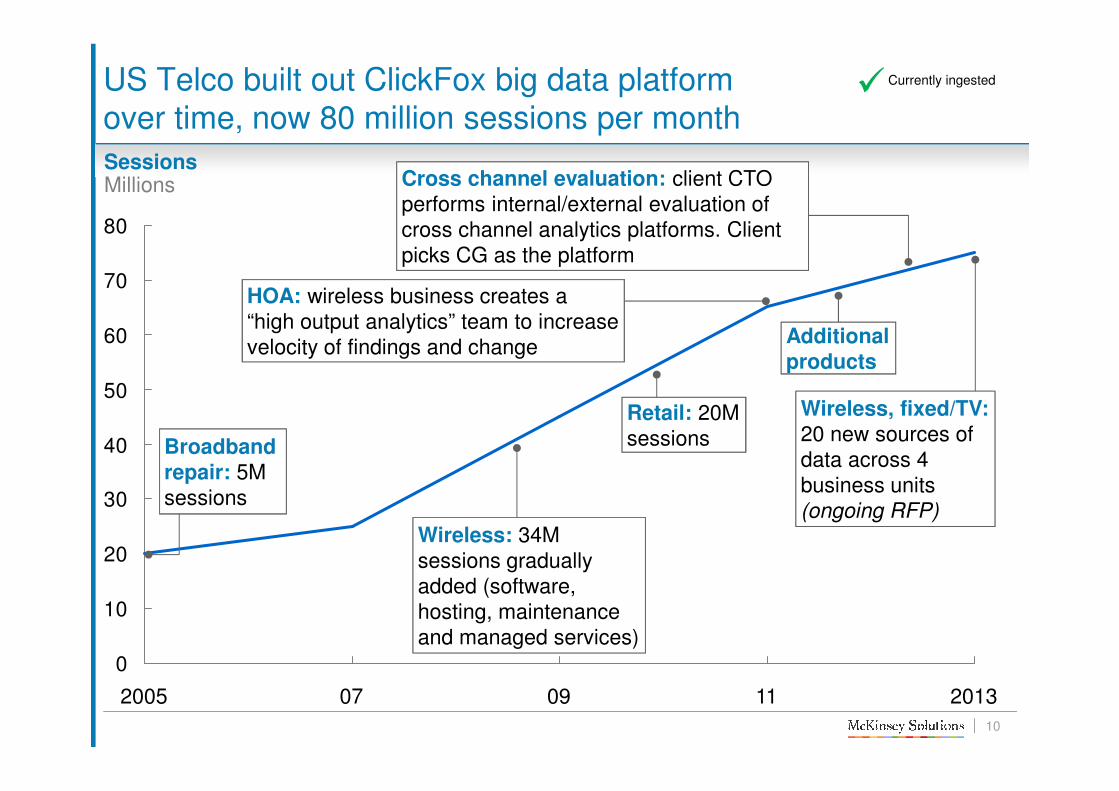
US Telco built out ClickFox big data platform over time, now 80 million sessions per month
0
10
20
30
40
50
60
70
80
SessionsMillions
20131109072005
Cross channel evaluation: client CTO performs internal/external evaluation of cross channel analytics platforms. Client picks CG as the platform
Broadband
repair: 5M sessions
Retail: 20M sessions
Additional Additional
products
Wireless, fixed/TV:
20 new sources of data across 4 business units (ongoing RFP)
Wireless: 34M sessions gradually added (software, hosting, maintenance and managed services)
output analytics” team to increase HOA: wireless business creates a “high output analytics” team to increase velocity of findings and change
Currently ingested
| 11
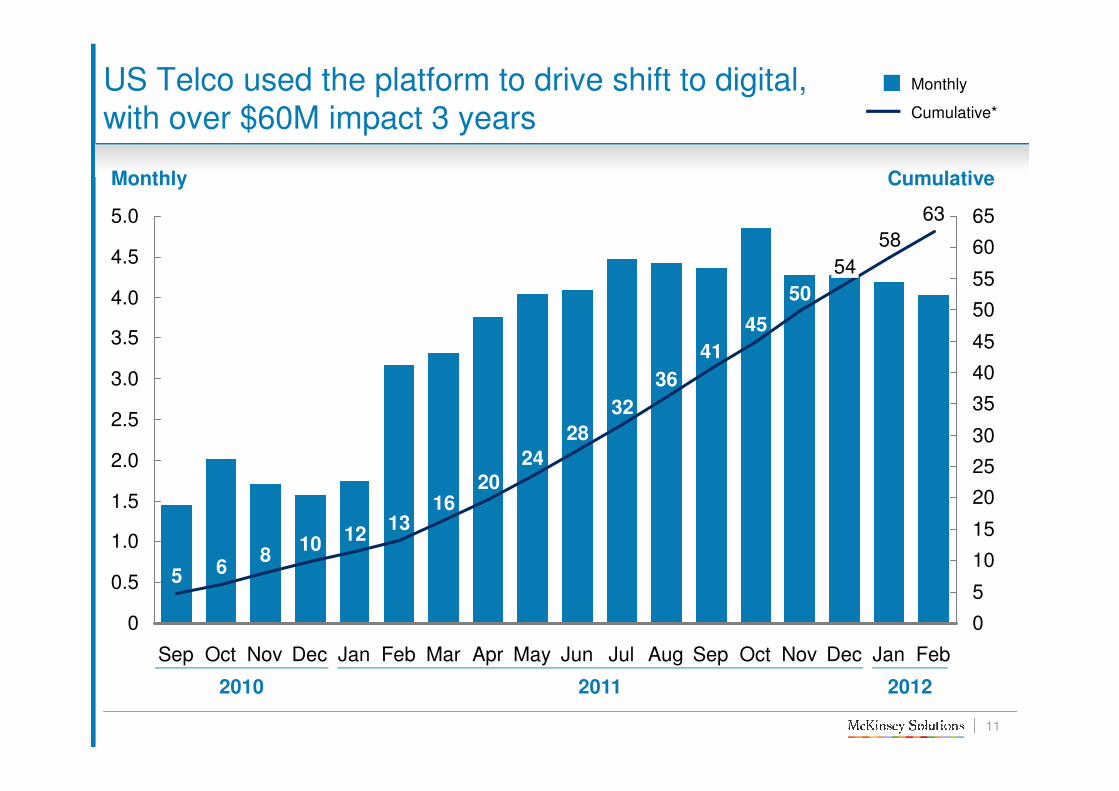
US Telco used the platform to drive shift to digital, with over $60M impact 3 years
4.0
0.5
3.5
3.0
2.5
2.0
1.5
0
40
35
10
5
0
1.0
5.0
4.5
30
25
20
15
65
60
55
50
45
Dec Feb
13
Feb
63
JanJan
6
Sep
5
20
Mar
58
Dec
54
Nov
50
Oct
16
12
Cumulative
10
Monthly
Nov
8
Oct
45
Sep
41
Aug
36
Jul
32
Jun
28
May
24
Apr
Cumulative*
Monthly
2010 2011 2012
| 12
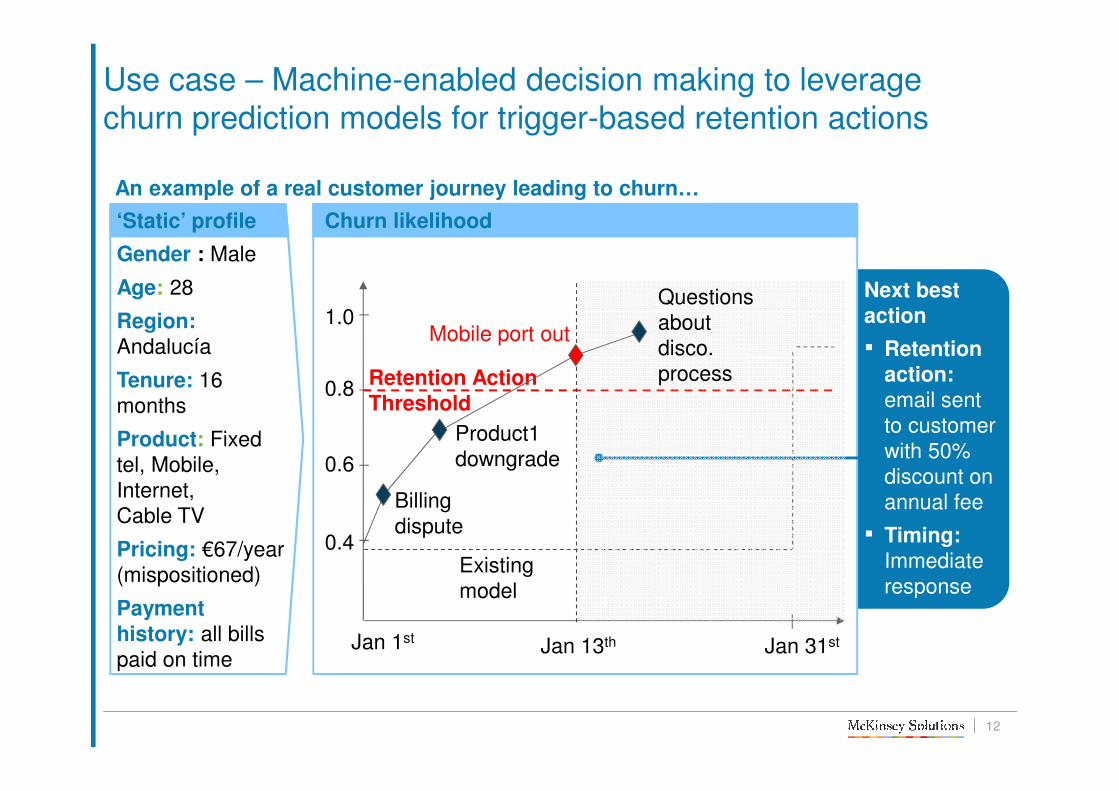
Next best
action
▪ Retention
action:
email sent to customer with 50% discount on annual fee
▪ Timing:
Immediate response
Use case – Machine-enabled decision making to leverage churn prediction models for trigger-based retention actions
‘Static’ profile
Gender : Male
Age: 28
Region:
Andalucía
Tenure: 16 months
Product: Fixed tel, Mobile, Internet, Cable TV
Pricing: €67/year (mispositioned)
Payment
history: all bills paid on time
Churn likelihood
An example of a real customer journey leading to churn…
Jan 1st Jan 31st
Existing model
1.0
0.8Retention Action
Threshold
0.6
0.4
Billing dispute
Product1 downgrade
Jan 13th
Mobile port out
Questions about disco. process
| 13
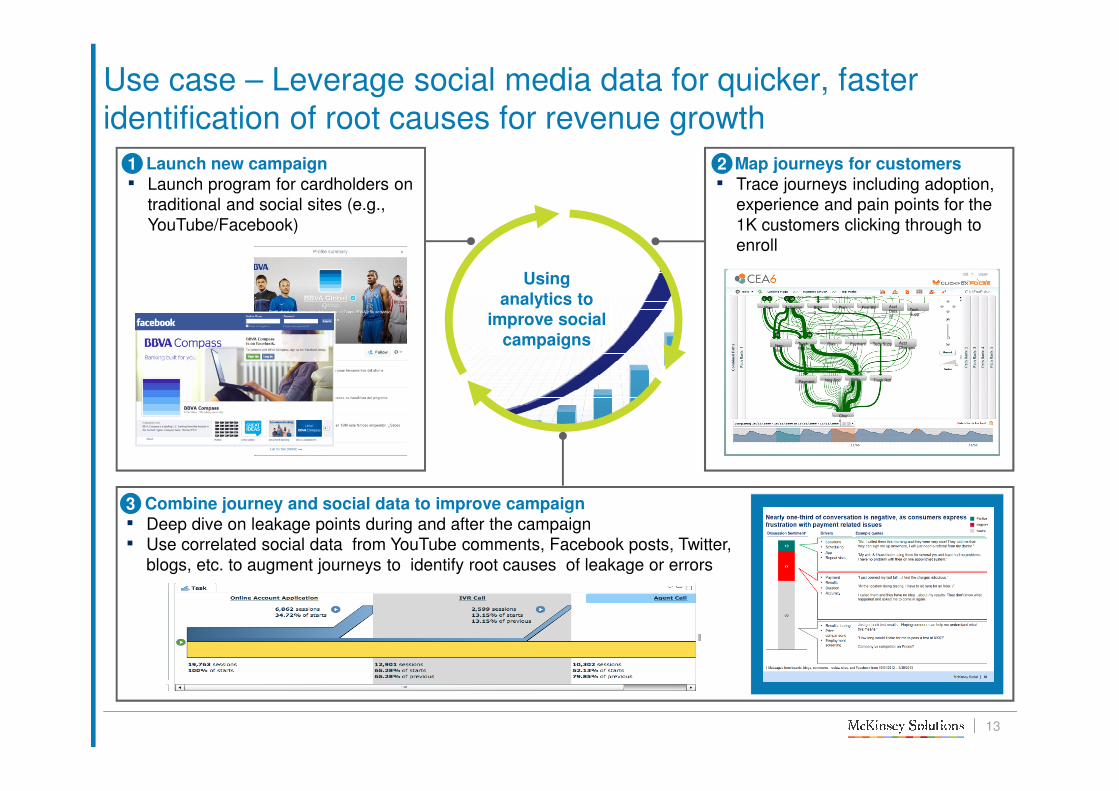
Use case – Leverage social media data for quicker, faster identification of root causes for revenue growth
Using
analytics to improve social
campaigns
3. Combine journey and social data to improve campaign
▪ Deep dive on leakage points during and after the campaign ▪ Use correlated social data from YouTube comments, Facebook posts, Twitter,
blogs, etc. to augment journeys to identify root causes of leakage or errors
3
1. Launch new campaign
▪ Launch program for cardholders on traditional and social sites (e.g., YouTube/Facebook)
1 2. Map journeys for customers
▪ Trace journeys including adoption, experience and pain points for the 1K customers clicking through to enroll
Churn
Billing
Truck RollNeg-SocPayment
Acct Changes
PaymentTruck Roll
Neg-Soc
Activation Billing
Plan First Bill Acct Details
PlanTech Supp
Tech SuppPlan
2
| 14
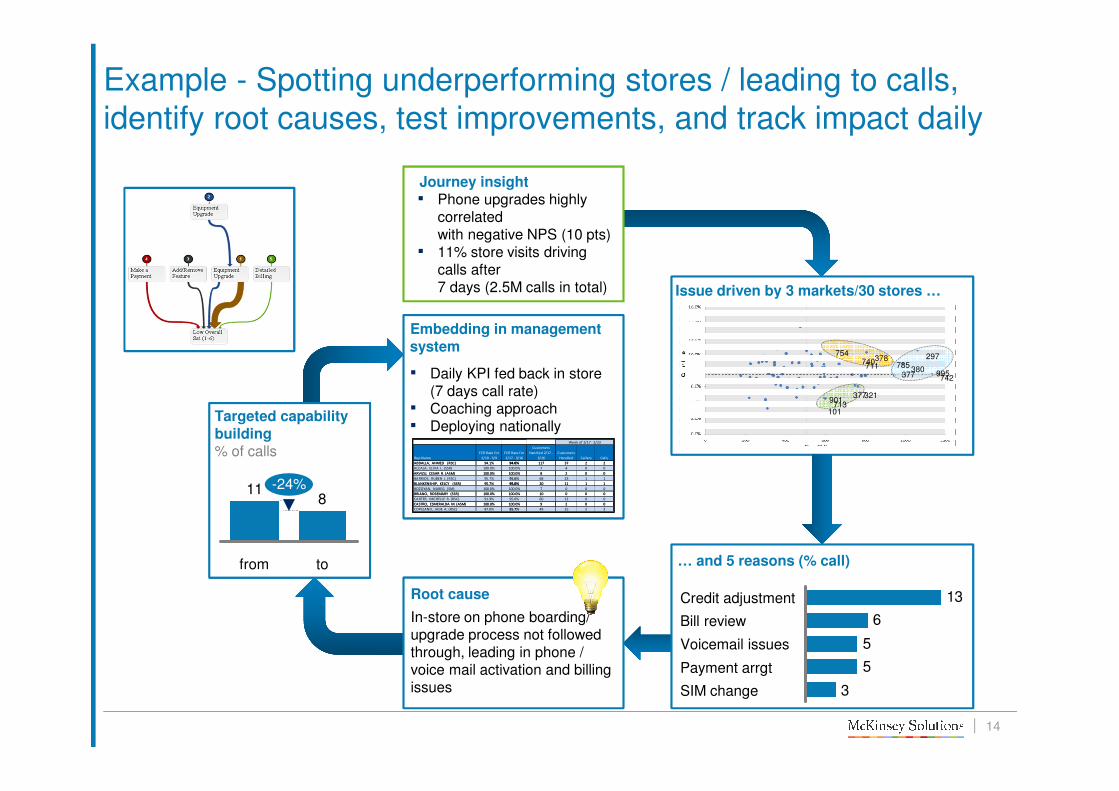
811 -24%
tofrom
Targeted capability building% of calls
Example - Spotting underperforming stores / leading to calls, identify root causes, test improvements, and track impact daily
3
5
5
6
13
Payment arrgt
SIM change
Bill review
Voicemail issues
Credit adjustment
… and 5 reasons (% call)
Root cause
In-store on phone boarding/upgrade process not followed through, leading in phone / voice mail activation and billing issues
Issue driven by 3 markets/30 stores …
378740711
754
321377713
901
101
742995
297
380377
785
Embedding in management system
▪ Daily KPI fed back in store (7 days call rate)
▪ Coaching approach▪ Deploying nationally
Journey insight▪ Phone upgrades highly
correlatedwith negative NPS (10 pts)
▪ 11% store visits driving calls after 7 days (2.5M calls in total)
Rep Name
FCR Rate for
2/10 - 3/9
FCR Rate for
2/17 - 3/16
Customers
Handled 2/17 -
3/16
Customers
Handled Callers Calls
ABDALLA, AHMED (RSC) 94.1% 94.0% 117 37 2 2
ALCALA, ELVIA L. (SSR) 100.0% 100.0% 7 4 0 0
ARVIZU, CESAR R. (ASM) 100.0% 100.0% 8 2 0 0
BARRIOS, RUBEN J. (RSC) 95.7% 95.6% 68 23 1 1
BLANKENSHIP, KELCY (SSR) 95.7% 95.0% 20 11 1 1
BOZOYAN, NAREG (SM) 100.0% 100.0% 7 0 0 0
BRIANO, ROSEMARY (SSR) 100.0% 100.0% 10 0 0 0
CARTER, MICHELLE R. (RSC) 91.9% 95.0% 60 12 0 0
CASTRO, ESMERALDA M. (ASM) 100.0% 100.0% 9 2 0 0
COPELAND, JADE A. (RSC) 87.0% 85.7% 49 15 2 3
Week of 2/17 - 2/23
| 15
#4 Management shift
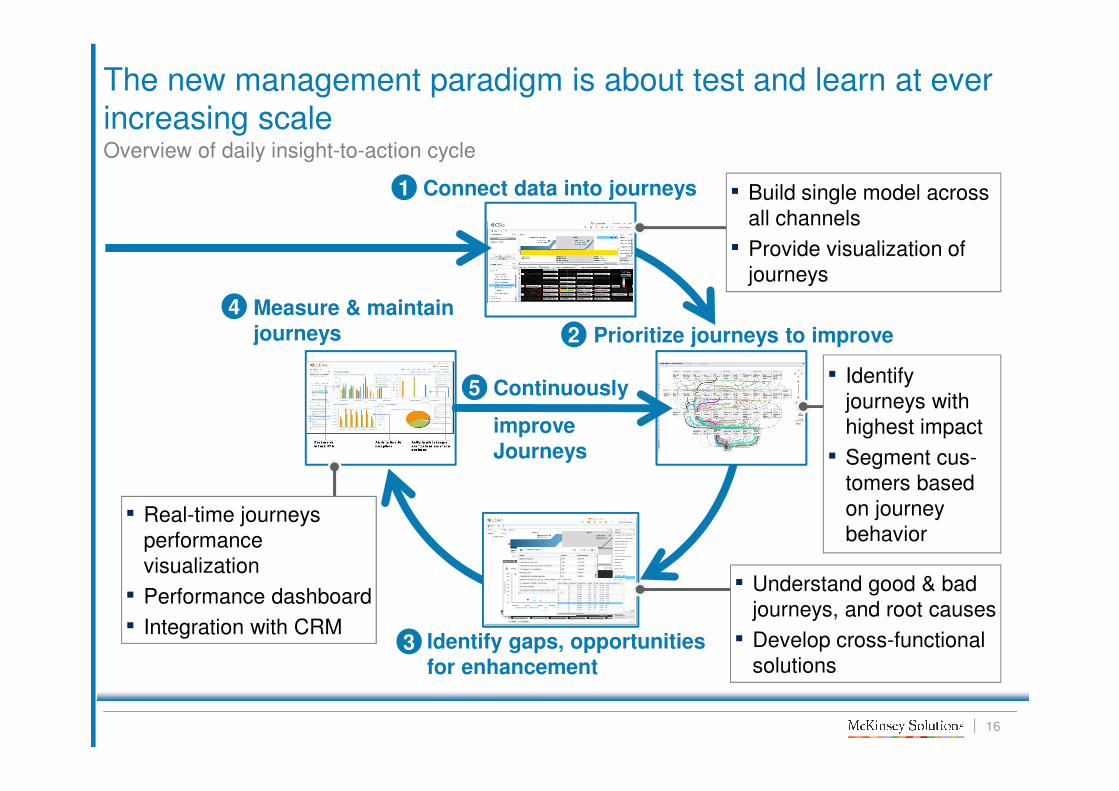
The new management paradigm is about test
and learn at ever increasing scale, where
details matter
| 16
Connect data into journeys
Identify gaps, opportunities
for enhancement
Continuously
improve
Journeys
1
3
▪ Understand good & bad journeys, and root causes
▪ Develop cross-functional solutions
Prioritize journeys to improve2
▪ Identify journeys with highest impact
▪ Segment cus-tomers based on journey behavior
▪ Build single model across all channels
▪ Provide visualization of journeys
4
▪ Real-time journeys performance visualization
▪ Performance dashboard
▪ Integration with CRM
Measure & maintain
journeys
5
The new management paradigm is about test and learn at ever increasing scaleOverview of daily insight-to-action cycle
| 17
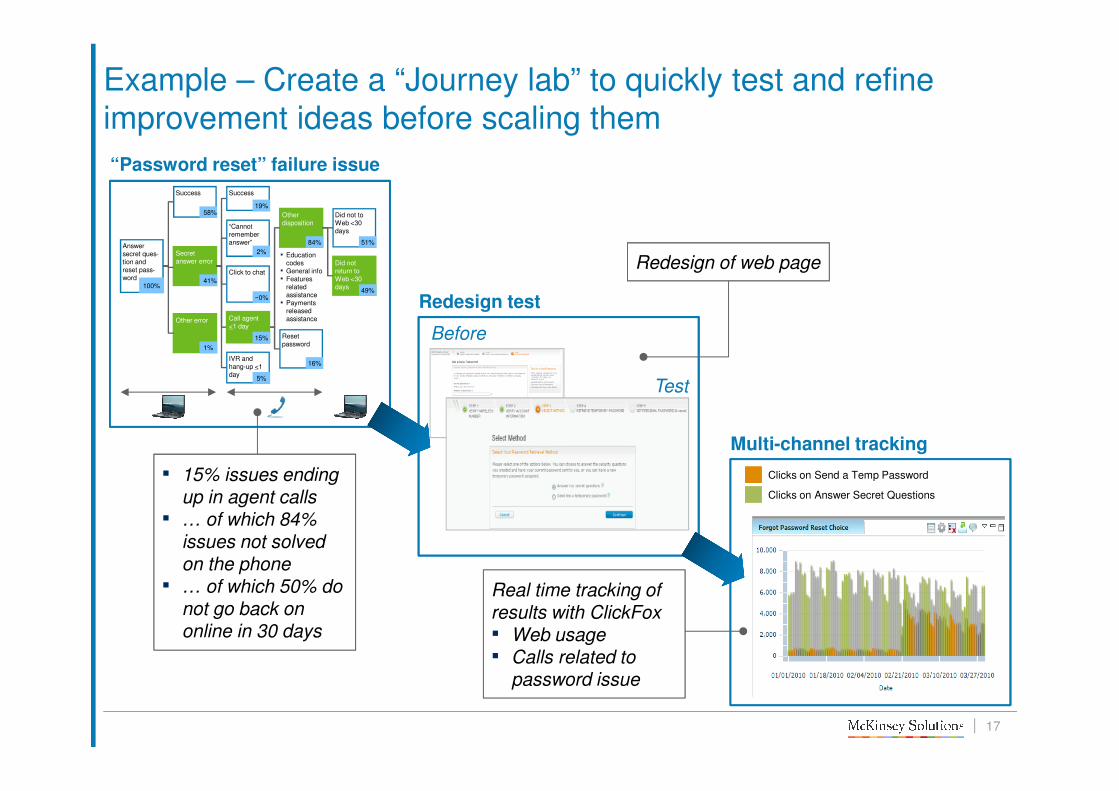
Example – Create a “Journey lab” to quickly test and refine improvement ideas before scaling them
Redesign test
BEFORE
Before
Test
Multi-channel tracking
Clicks on Send a Temp Password
Clicks on Answer Secret Questions
Success
58%
Answer secret ques-tion and reset pass-word
Secret answer error
41%
Other error
1%
Other disposition
84%
Reset password
16%
▪ Education codes▪ General info▪ Features
related assistance▪ Payments
released assistance
Did not to Web <30 days
51%
Did not return to Web <30 days
49%
Success
19%
“Cannot remember answer”
2%
Call agent <1 day
15%
Click to chat
~0%
IVR and hang-up <1 day
5%
“Password reset” failure issue
100%
▪ 15% issues ending up in agent calls
▪ … of which 84% issues not solved on the phone
▪ … of which 50% do not go back on online in 30 days
Redesign of web page
Real time tracking of results with ClickFox▪ Web usage▪ Calls related to
password issue

| 18
#5 Maybe …
| 1919
01/01/08 01/07/08 01/01/09 01/07/09 01/01/10 01/07/10 01/01/11
Positive SM GRP
Negative SM GRP
Neutral SM GRP
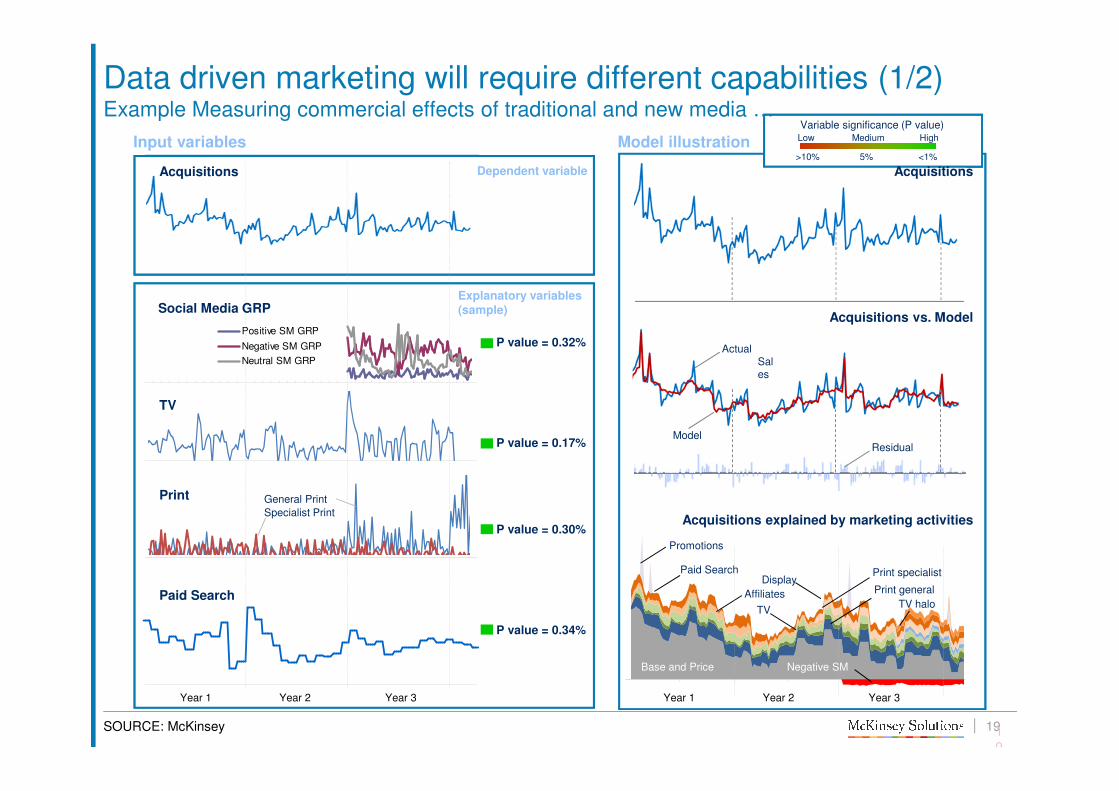
SOURCE: McKinsey
Actual Sales
Model
Promotions
Paid Search
Affiliates
Display
TV
Print specialist
Print general
Base and Price
TV halo
Input variables
Acquisitions vs. Model
Residual
Acquisitions explained by marketing activities
P value = 0.32%
P value = 0.17%
P value = 0.30%
P value = 0.34%
PZ
Computer
Year 1 Year 2 Year 3
Acquisitions
Social Media GRP
TV
Paid Search
General Print
Specialist Print
Dependent variable
Explanatory variables(sample)
Acquisitions
Model illustration>10% 5% <1%
Variable significance (P value)Low Medium High
Year 1 Year 2 Year 3
Negative SM
Data driven marketing will require different capabilities (1/2)Example Measuring commercial effects of traditional and new media …
| 20
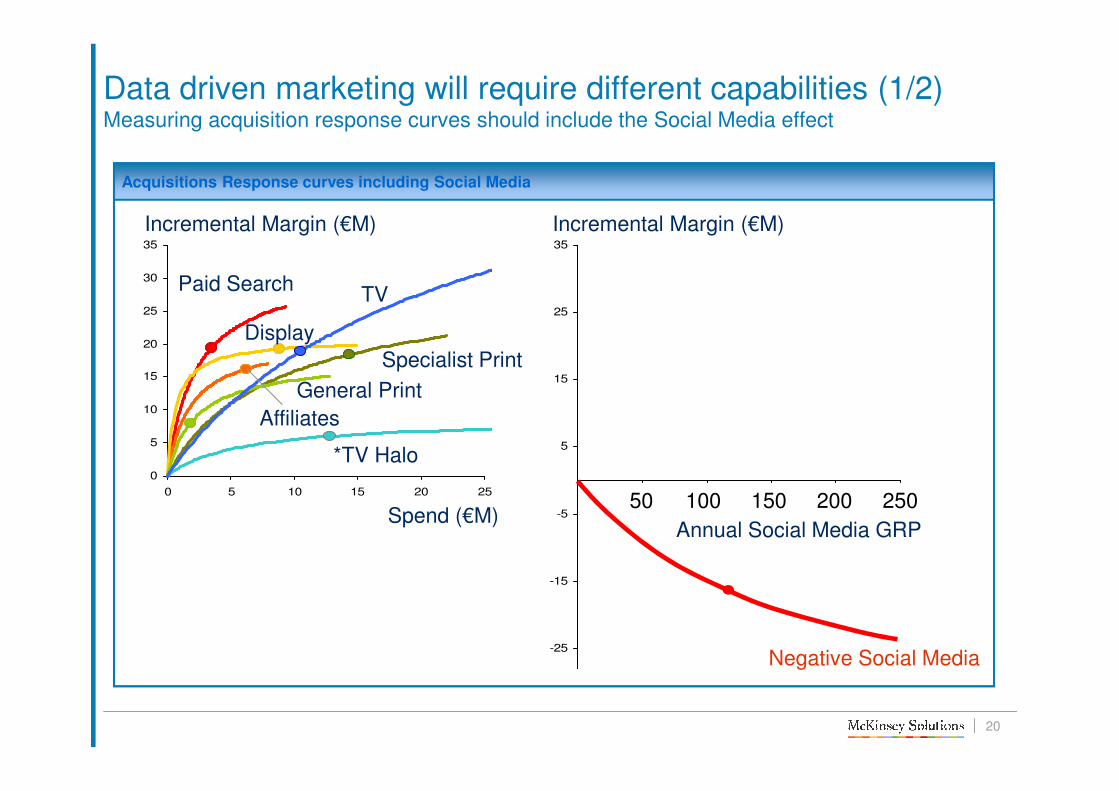
Acquisitions Response curves including Social Media
0
5
10
15
20
25
30
35
0 5 10 15 20 25
-25
-15
-5
5
15
25
35
TV
*TV Halo
Specialist Print
Paid Search
Affiliates
Display
General Print
Spend (€M)
Incremental Margin (€M)
Annual Social Media GRP
Incremental Margin (€M)
25020015010050
Negative Social Media
Data driven marketing will require different capabilities (1/2)Measuring acquisition response curves should include the Social Media effect
| 21SOURCE: McKinsey
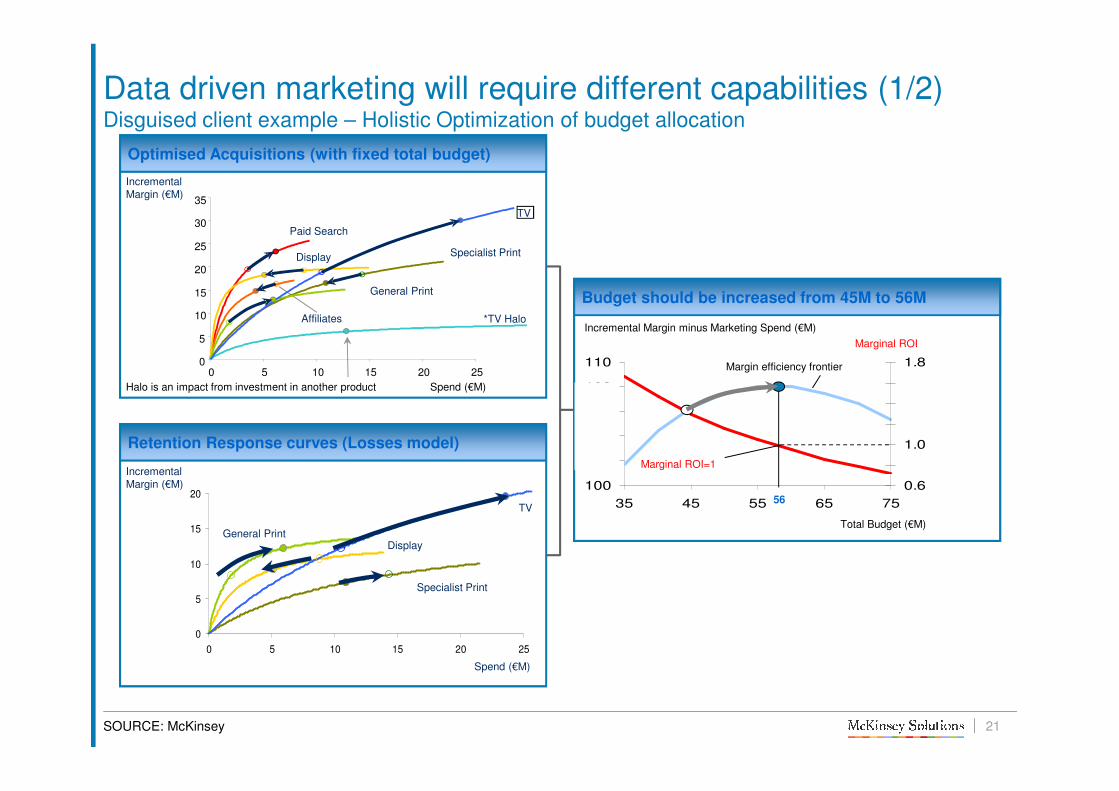
Data driven marketing will require different capabilities (1/2)Disguised client example – Holistic Optimization of budget allocation
Optimised Acquisitions (with fixed total budget)
Retention Response curves (Losses model)
Spend (€M)Halo is an impact from investment in another product
Budget should be increased from 45M to 56M
100
102
104
106
108
110
35 45 55 65 75
0.6
0.8
1.0
1.2
1.4
1.6
1.8
Incremental Margin minus Marketing Spend (€M)
Marginal ROI
Margin efficiency frontier
Marginal ROI=1
56
Total Budget (€M)
TV
*TV Halo
Specialist Print
Paid Search
Affiliates
Display
General Print
0
5
10
15
20
25
30
35
0 5 10 15 20 25
IncrementalMargin (€M)
TV
Spend (€M)
Specialist Print
General PrintDisplay
0
5
10
15
20
0 5 10 15 20 25
IncrementalMargin (€M)