sw—soil and water: improvement of whitish oasis soil, part 1: field experiments with a four-stage...
TRANSCRIPT
Biosystems Engineering (2002) 83 (4), 481–493doi:10.1006/bioe.2002.0137, available online at http://www.idealibrary.com onSW}Soil and Water
Improvement of Whitish Oasis Soil, Part 1: Field Experiments with a Four-stageSubsoil Mixing Plough
G. Guo1; K. Araya1; H. Jia2; M. Kudoh1; W. Wang3; F. Liu4; L. Zhang5; W. Li5; T. Li6
1Environmental Science Laboratory, Senshu University, Bibai, Hokkaido 079-0197, Japan; e-mail of corresponding author: [email protected] Agricultural Research Institute, Jiamusi, Black Dragon, People’s Republic of China; e-mail: [email protected]
3The Foreign Expert Bureau of North of River Province Government, No. 286, Huai Zhong Road, Shijiazhuang, North of River, People’sRepublic of China; e-mail: [email protected]
4The Foreign Expert Bureau of Inner Mongolia Province Government, Xilinhaote, Inner Mongolia, People’s Republic of China5Xilinhaote Agricultural Experimental Station, Xilinhaote, Inner Mongolia, People’s Republic of China
6Shangyi Agricultural Experimental Station, Shangyi, North of River, People’s Republic of China
(Received 27 November 2001; received in revised form 6 September 2002)
A prototype four-stage subsoil mixing plough was designed in Japan and built in China for the improvementof whitish oasis soil. The machine was transported to two places in China for field tests where the whitish oasissoil is found. This paper presents the trash mixing rate into mixed layer of Bca and C horizons, the invertingrate of the Bca and C horizons and the draught of the plough in the whitish oasis soil.The results show that the rolling resistance of the tracked vehicle (T802), on which the plough was mounted,was about 8 kN and the draught of the first plough body which tilled the Ap horizon was about 4 kN with aworking depth of 200mm and a working width of 500mm. The draught of the second plough body, whichtilled the surface of the Ap horizon, was about 2 kN with a working depth of 50mm. The draught of the thirdplough body increased steeply with greater working depths. The draughts were about 8, 14 and 24 kN,respectively, for working depths of 117, 239 and 300mm. The draught of the fourth plough body alsoincreased steeply with greater working depth. The draughts were about 7, 14 and 18 kN, respectively, forworking depths of 117, 178 and 239mm. When the whitish oasis soil was disturbed by the plough bodies, itwas observed that the whitish oasis soil was very hard but comparatively brittle and easily broken up. Thisproperty explains the smaller draught requirements in the whitish oasis soil despite a greater soil strength. Thevalues of the soil-inverting rate ranged between 0�45 and 0�6, and the average value was 0�5. Perfect inversionof the Bca and C horizons was not possible, but good mixing was achieved by the plough. The average trashmixing rate in Inner Mongolia was 0�85, and that in North of River was 0�95. These data show that even inInner Mongolia where the trash material is long, a fairly uniform trash mixing was possible. # 2002 Silsoe
Research Institute. Published by Elsevier Science Ltd. All rights reserved
1. Introduction
Poor crop yield is obtained from whitish oasis soilwhich is widely distributed on the North of River andInner Mongolia provinces (about 130Gm2, about twicethe area of the Hokkaido island, Japan) of the People’sRepublic of China.
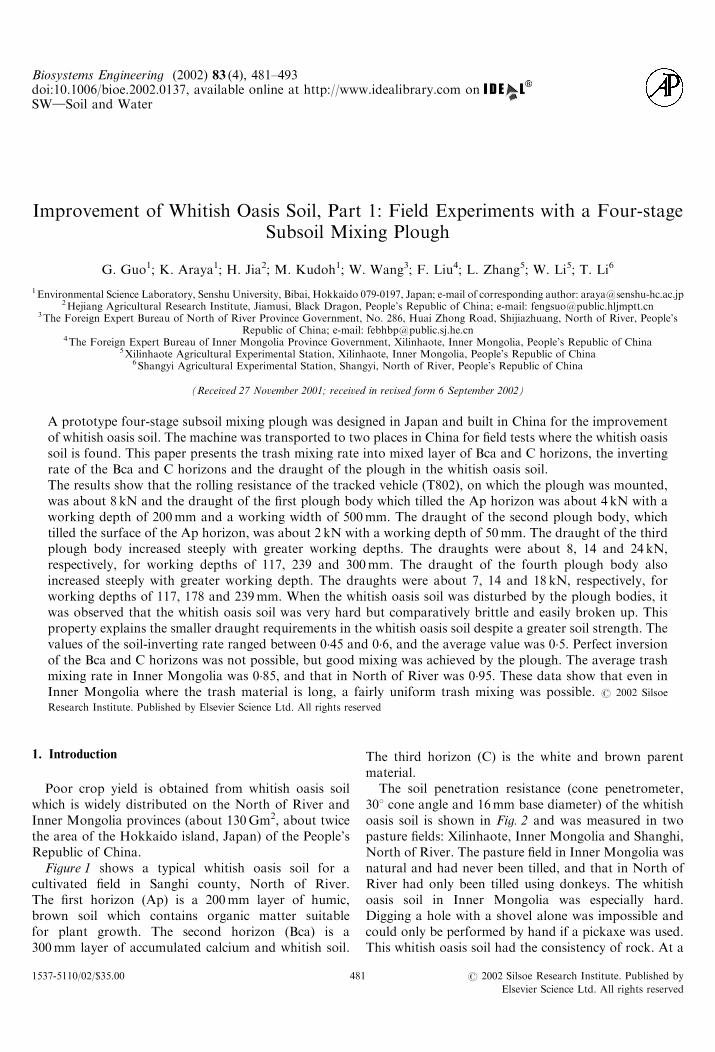
Figure 1 shows a typical whitish oasis soil for acultivated field in Sanghi county, North of River.The first horizon (Ap) is a 200mm layer of humic,brown soil which contains organic matter suitablefor plant growth. The second horizon (Bca) is a300mm layer of accumulated calcium and whitish soil.
1537-5110/02/$35.00 48
The third horizon (C) is the white and brown parentmaterial.
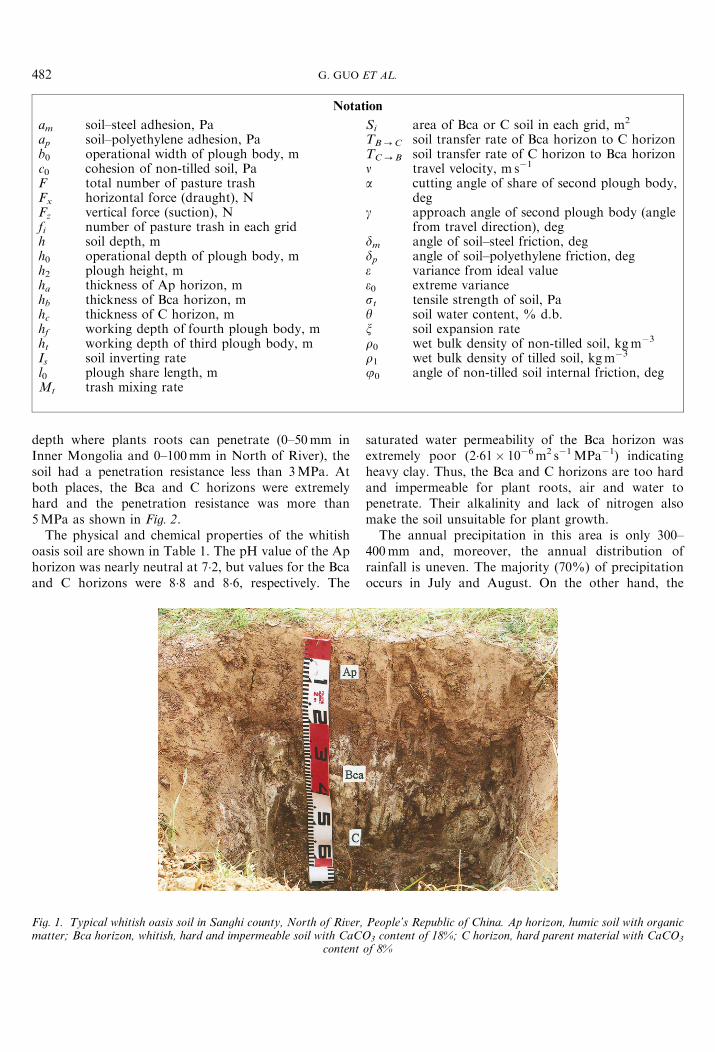
The soil penetration resistance (cone penetrometer,308 cone angle and 16mm base diameter) of the whitishoasis soil is shown in Fig. 2 and was measured in twopasture fields: Xilinhaote, Inner Mongolia and Shanghi,North of River. The pasture field in Inner Mongolia wasnatural and had never been tilled, and that in North ofRiver had only been tilled using donkeys. The whitishoasis soil in Inner Mongolia was especially hard.Digging a hole with a shovel alone was impossible andcould only be performed by hand if a pickaxe was used.This whitish oasis soil had the consistency of rock. At a
1 # 2002 Silsoe Research Institute. Published by
Elsevier Science Ltd. All rights reserved
G. GUO ET AL.482
am soil–steel adhesion, Paap soil–polyethylene adhesion, Pab0 operational width of plough body, mc0 cohesion of non-tilled soil, PaF total number of pasture trashFx horizontal force (draught), NFz vertical force (suction), Nfi number of pasture trash in each gridh soil depth, mh0 operational depth of plough body, mh2 plough height, mha thickness of Ap horizon, mhb thickness of Bca horizon, mhc thickness of C horizon, mhf working depth of fourth plough body, mht working depth of third plough body, mIs soil inverting ratel0 plough share length, mMt trash mixing rate
Si area of Bca or C soil in each grid, m2
TB!C soil transfer rate of Bca horizon to C horizonTC!B soil transfer rate of C horizon to Bca horizonn travel velocity, m s�1
a cutting angle of share of second plough body,deg
g approach angle of second plough body (anglefrom travel direction), deg
dm angle of soil–steel friction, degdp angle of soil–polyethylene friction, dege variance from ideal valuee0 extreme variancest tensile strength of soil, Pay soil water content, % d.b.x soil expansion rater0 wet bulk density of non-tilled soil, kgm�3
r1 wet bulk density of tilled soil, kgm�3
j0 angle of non-tilled soil internal friction, deg
Notation
depth where plants roots can penetrate (0–50mm inInner Mongolia and 0–100mm in North of River), thesoil had a penetration resistance less than 3MPa. Atboth places, the Bca and C horizons were extremelyhard and the penetration resistance was more than5MPa as shown in Fig. 2.
The physical and chemical properties of the whitishoasis soil are shown in Table 1. The pH value of the Aphorizon was nearly neutral at 7�2, but values for the Bcaand C horizons were 8�8 and 8�6, respectively. The
Fig. 1. Typical whitish oasis soil in Sanghi county, North of River,matter; Bca horizon, whitish, hard and impermeable soil with CaC
content
saturated water permeability of the Bca horizon wasextremely poor (2�61� 10�6m2 s�1MPa�1) indicatingheavy clay. Thus, the Bca and C horizons are too hardand impermeable for plant roots, air and water topenetrate. Their alkalinity and lack of nitrogen alsomake the soil unsuitable for plant growth.
The annual precipitation in this area is only 300–400mm and, moreover, the annual distribution ofrainfall is uneven. The majority (70%) of precipitationoccurs in July and August. On the other hand, the
People’s Republic of China. Ap horizon, humic soil with organicO3 content of 18%; C horizon, hard parent material with CaCO3
of 8%
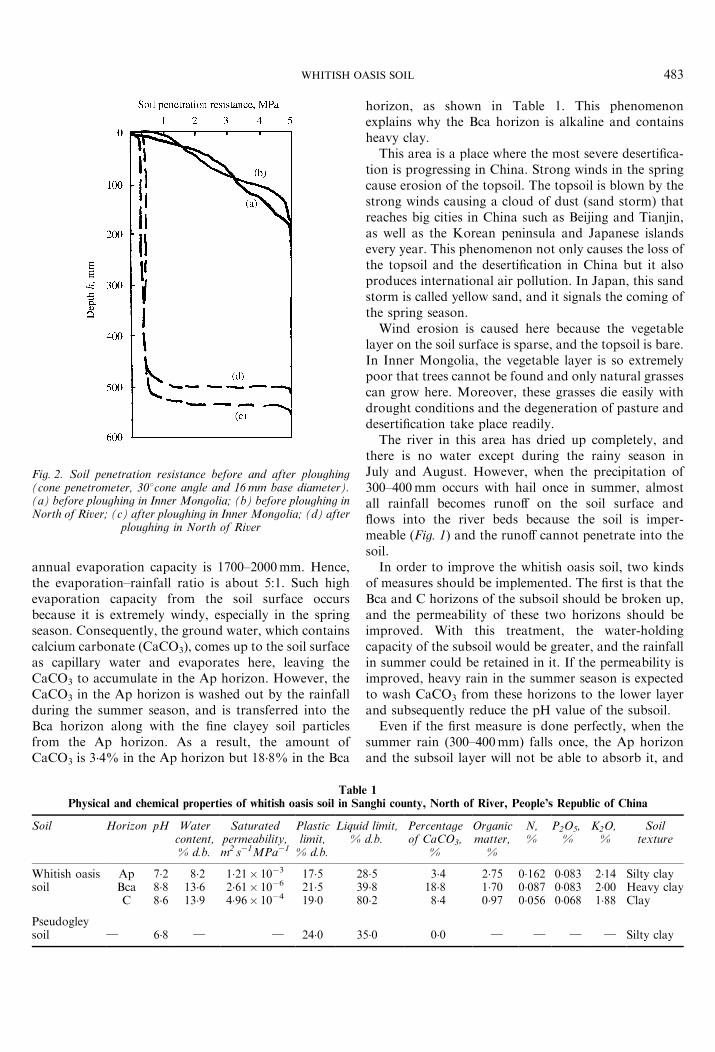
Fig. 2. Soil penetration resistance before and after ploughing(cone penetrometer, 308cone angle and 16 mm base diameter).(a) before ploughing in Inner Mongolia; (b) before ploughing inNorth of River; (c) after ploughing in Inner Mongolia; (d) after
ploughing in North of River
WHITISH OASIS SOIL 483
annual evaporation capacity is 1700–2000mm. Hence,the evaporation–rainfall ratio is about 5:1. Such highevaporation capacity from the soil surface occursbecause it is extremely windy, especially in the springseason. Consequently, the ground water, which containscalcium carbonate (CaCO3), comes up to the soil surfaceas capillary water and evaporates here, leaving theCaCO3 to accumulate in the Ap horizon. However, theCaCO3 in the Ap horizon is washed out by the rainfallduring the summer season, and is transferred into theBca horizon along with the fine clayey soil particlesfrom the Ap horizon. As a result, the amount ofCaCO3 is 3�4% in the Ap horizon but 18�8% in the Bca
Tabl
Physical and chemical properties of whitish oasis soil in Sa
Soil Horizon pH Watercontent,% d.b.
Saturatedpermeability,m2 s�1MPa�1
Plasticlimit,
% d.b.
Liqui%
Whitish oasis Ap 7�2 8�2 1�21� 10�3 17�5 2soil Bca 8�8 13�6 2�61� 10�6 21�5 3
C 8�6 13�9 4�96� 10�4 19�0 8
Pseudogleysoil } 6�8 } } 24�0 3
horizon, as shown in Table 1. This phenomenonexplains why the Bca horizon is alkaline and containsheavy clay.
This area is a place where the most severe desertifica-tion is progressing in China. Strong winds in the springcause erosion of the topsoil. The topsoil is blown by thestrong winds causing a cloud of dust (sand storm) thatreaches big cities in China such as Beijing and Tianjin,as well as the Korean peninsula and Japanese islandsevery year. This phenomenon not only causes the loss ofthe topsoil and the desertification in China but it alsoproduces international air pollution. In Japan, this sandstorm is called yellow sand, and it signals the coming ofthe spring season.
Wind erosion is caused here because the vegetablelayer on the soil surface is sparse, and the topsoil is bare.In Inner Mongolia, the vegetable layer is so extremelypoor that trees cannot be found and only natural grassescan grow here. Moreover, these grasses die easily withdrought conditions and the degeneration of pasture anddesertification take place readily.
The river in this area has dried up completely, andthere is no water except during the rainy season inJuly and August. However, when the precipitation of300–400mm occurs with hail once in summer, almostall rainfall becomes runoff on the soil surface andflows into the river beds because the soil is imper-meable (Fig. 1) and the runoff cannot penetrate into thesoil.
In order to improve the whitish oasis soil, two kindsof measures should be implemented. The first is that theBca and C horizons of the subsoil should be broken up,and the permeability of these two horizons should beimproved. With this treatment, the water-holdingcapacity of the subsoil would be greater, and the rainfallin summer could be retained in it. If the permeability isimproved, heavy rain in the summer season is expectedto wash CaCO3 from these horizons to the lower layerand subsequently reduce the pH value of the subsoil.
Even if the first measure is done perfectly, when thesummer rain (300–400mm) falls once, the Ap horizonand the subsoil layer will not be able to absorb it, and
e 1
nghi county, North of River, People’s Republic of China
d limit,d.b.
Percentageof CaCO3,
%
Organicmatter,
%
N,%
P2O5,%
K2O,%
Soiltexture
8�5 3�4 2�75 0�162 0�083 2�14 Silty clay9�8 18�8 1�70 0�087 0�083 2�00 Heavy clay0�2 8�4 0�97 0�056 0�068 1�88 Clay
5�0 0�0 } } } } Silty clay
Fig. 3. Prototype four-stage subsoil mixing plough
G. GUO ET AL.484
the water would be lost to runoff anyway. Therefore, asa second measure, it is envisaged to construct anartificial perched watertable at about 1m depth fromthe soil surface in the whitish oasis soil fields to catchand hold the runoff caused in the summer and preventexcess moisture loss. The water in the artificiallypermeable layer could be used for grasses as capillarywater in the dry season in the spring.
In this paper, the first measure is firstly considered.Hence, it was envisaged that if trash such as weed, wheatstraw and maize stalks on the soil surface of the Aphorizon (Fig. 1) could be mixed into the Bca and Chorizons of the subsoil, the permeability of these twohorizons would be improved by mixing with the trash tocreate greater pore spaces. Redistributing trash into thesubsoil would also isolate it from the atmosphere andslow its decay. In addition, it is proposed to mix or toinvert the Bca and C horizons in order to lower theamount of CaCO3 in the second horizon and to reducethe ionic damage on plants. A suitable subsoil for plantgrowth would, therefore, be obtained, sustainable forseveral decades until CaCO3 accumulated again in thesecond horizon.
In order to realize these objectives, a four-stagesubsoil mixing plough which consists of four ploughbodies (Fig. 3) was designed in Japan based on thephysical properties of soils (Guo & Araya, 2002). Thisplough cannot invert the Bca and C horizons but canmix them together. Preliminary experiments used thismixing method and combined the Ap horizon (contain-ing weed, wheat straw and maize stalks) with the mixedsubsoils of the Bca and C horizons. The field experi-
ments were conducted at the whitish oasis soil fields intwo places: Xilinhaote, Inner Mongolia and Shanghi,North of River, People’s Republic of China. This paperpresents the trash mixing rate of the Ap horizonmaterial into the mixed subsoils of the Bca and Chorizons, the mixing rate (inverting rate) of the Bca andC soils and the draught of the plough in the whitishoasis soil.
2. Principle of mixing the soil surface trash layer with thesubsoil
Figure 4 shows the schematic diagram of the experi-mental plough shares. In Figs 3 and 4, the first ploughbody is a conventional mouldboard plough which tillsand inverts the Ap horizon at a depth of 0–200mm. Thesecond plough body was developed for improvement ofmeadow soil (Zhang & Araya, 2001a; 2001b). Thisplough body skims an adjacent furrow on the land sidewhich runs next to the first, third and fourth ploughbodies, as shown in Fig. 4, precisely 50mm deep belowthe surface of the Ap horizon and transfers this thin soilslice to the preceding furrow onto the third ploughbody. The third and fourth plough bodies are speciallyshaped and were developed for improvement of theplanosol by mixing the second and third horizons of theplanosol (Araya et al., 1996a; 1996b).
The 90mm height of the third plough body wasdetermined as the optimum to till the second horizonand to transfer it onto the fourth plough body.The 240mm height of the fourth plough body was
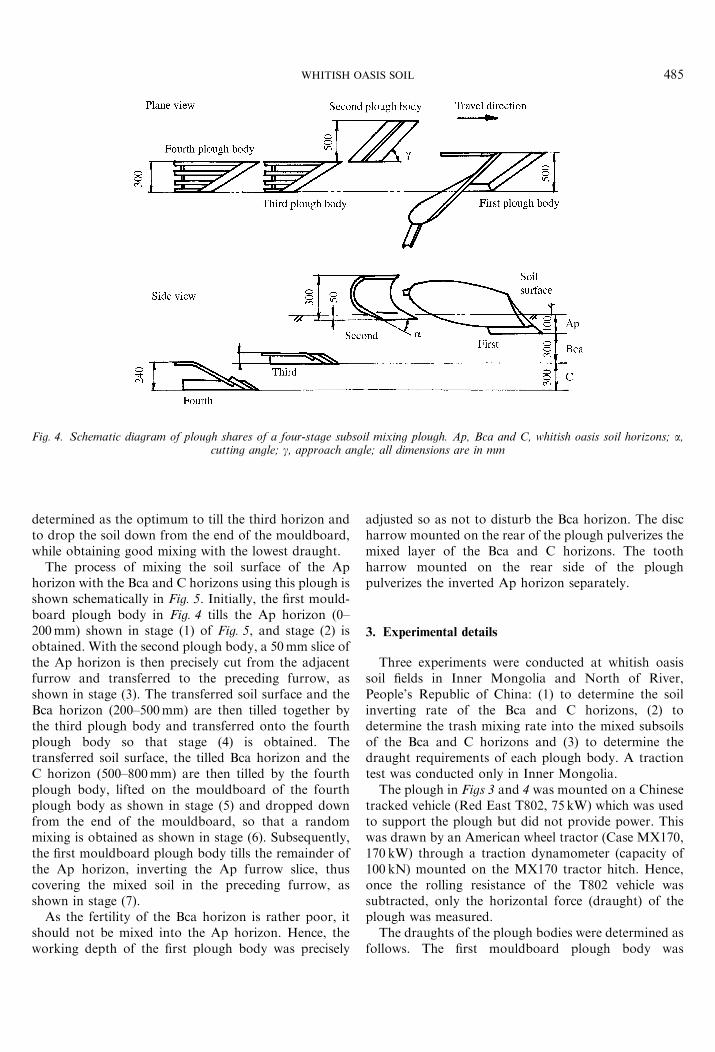
Fig. 4. Schematic diagram of plough shares of a four-stage subsoil mixing plough. Ap, Bca and C, whitish oasis soil horizons; a,cutting angle; g, approach angle; all dimensions are in mm
WHITISH OASIS SOIL 485
determined as the optimum to till the third horizon andto drop the soil down from the end of the mouldboard,while obtaining good mixing with the lowest draught.
The process of mixing the soil surface of the Aphorizon with the Bca and C horizons using this plough isshown schematically in Fig. 5. Initially, the first mould-board plough body in Fig. 4 tills the Ap horizon (0–200mm) shown in stage (1) of Fig. 5, and stage (2) isobtained. With the second plough body, a 50mm slice ofthe Ap horizon is then precisely cut from the adjacentfurrow and transferred to the preceding furrow, asshown in stage (3). The transferred soil surface and theBca horizon (200–500mm) are then tilled together bythe third plough body and transferred onto the fourthplough body so that stage (4) is obtained. Thetransferred soil surface, the tilled Bca horizon and theC horizon (500–800mm) are then tilled by the fourthplough body, lifted on the mouldboard of the fourthplough body as shown in stage (5) and dropped downfrom the end of the mouldboard, so that a randommixing is obtained as shown in stage (6). Subsequently,the first mouldboard plough body tills the remainder ofthe Ap horizon, inverting the Ap furrow slice, thuscovering the mixed soil in the preceding furrow, asshown in stage (7).
As the fertility of the Bca horizon is rather poor, itshould not be mixed into the Ap horizon. Hence, theworking depth of the first plough body was precisely
adjusted so as not to disturb the Bca horizon. The discharrow mounted on the rear of the plough pulverizes themixed layer of the Bca and C horizons. The toothharrow mounted on the rear side of the ploughpulverizes the inverted Ap horizon separately.
3. Experimental details
Three experiments were conducted at whitish oasissoil fields in Inner Mongolia and North of River,People’s Republic of China: (1) to determine the soilinverting rate of the Bca and C horizons, (2) todetermine the trash mixing rate into the mixed subsoilsof the Bca and C horizons and (3) to determine thedraught requirements of each plough body. A tractiontest was conducted only in Inner Mongolia.
The plough in Figs 3 and 4 was mounted on a Chinesetracked vehicle (Red East T802, 75 kW) which was usedto support the plough but did not provide power. Thiswas drawn by an American wheel tractor (Case MX170,170 kW) through a traction dynamometer (capacity of100 kN) mounted on the MX170 tractor hitch. Hence,once the rolling resistance of the T802 vehicle wassubtracted, only the horizontal force (draught) of theplough was measured.
The draughts of the plough bodies were determined asfollows. The first mouldboard plough body was
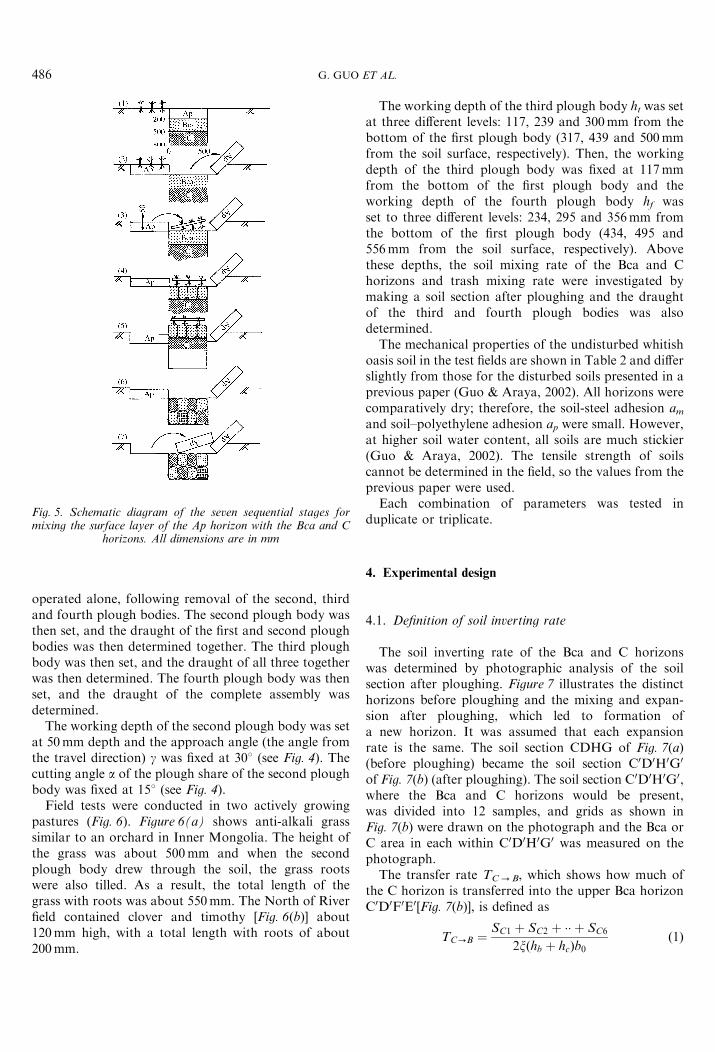
Fig. 5. Schematic diagram of the seven sequential stages formixing the surface layer of the Ap horizon with the Bca and C
horizons. All dimensions are in mm
G. GUO ET AL.486
operated alone, following removal of the second, thirdand fourth plough bodies. The second plough body wasthen set, and the draught of the first and second ploughbodies was then determined together. The third ploughbody was then set, and the draught of all three togetherwas then determined. The fourth plough body was thenset, and the draught of the complete assembly wasdetermined.
The working depth of the second plough body was setat 50mm depth and the approach angle (the angle fromthe travel direction) g was fixed at 308 (see Fig. 4). Thecutting angle a of the plough share of the second ploughbody was fixed at 158 (see Fig. 4).
Field tests were conducted in two actively growingpastures (Fig. 6). Figure 6(a) shows anti-alkali grasssimilar to an orchard in Inner Mongolia. The height ofthe grass was about 500mm and when the secondplough body drew through the soil, the grass rootswere also tilled. As a result, the total length of thegrass with roots was about 550mm. The North of Riverfield contained clover and timothy [Fig. 6(b)] about120mm high, with a total length with roots of about200mm.
The working depth of the third plough body ht was setat three different levels: 117, 239 and 300mm from thebottom of the first plough body (317, 439 and 500mmfrom the soil surface, respectively). Then, the workingdepth of the third plough body was fixed at 117mmfrom the bottom of the first plough body and theworking depth of the fourth plough body hf wasset to three different levels: 234, 295 and 356mm fromthe bottom of the first plough body (434, 495 and556mm from the soil surface, respectively). Abovethese depths, the soil mixing rate of the Bca and Chorizons and trash mixing rate were investigated bymaking a soil section after ploughing and the draughtof the third and fourth plough bodies was alsodetermined.
The mechanical properties of the undisturbed whitishoasis soil in the test fields are shown in Table 2 and differslightly from those for the disturbed soils presented in aprevious paper (Guo & Araya, 2002). All horizons werecomparatively dry; therefore, the soil-steel adhesion am
and soil–polyethylene adhesion ap were small. However,at higher soil water content, all soils are much stickier(Guo & Araya, 2002). The tensile strength of soilscannot be determined in the field, so the values from theprevious paper were used.
Each combination of parameters was tested induplicate or triplicate.
4. Experimental design
4.1. Definition of soil inverting rate
The soil inverting rate of the Bca and C horizonswas determined by photographic analysis of the soilsection after ploughing. Figure 7 illustrates the distincthorizons before ploughing and the mixing and expan-sion after ploughing, which led to formation ofa new horizon. It was assumed that each expansionrate is the same. The soil section CDHG of Fig. 7(a)(before ploughing) became the soil section C0D0H0G0
of Fig. 7(b) (after ploughing). The soil section C0D0H0G0,where the Bca and C horizons would be present,was divided into 12 samples, and grids as shown inFig. 7(b) were drawn on the photograph and the Bca orC area in each within C0D0H0G0 was measured on thephotograph.
The transfer rate TC!B, which shows how much ofthe C horizon is transferred into the upper Bca horizonC0D0F0E0[Fig. 7(b)], is defined as
TC!B ¼SC1 þ SC2 þ �� þ SC6
2x hb þ hcð Þb0ð1Þ
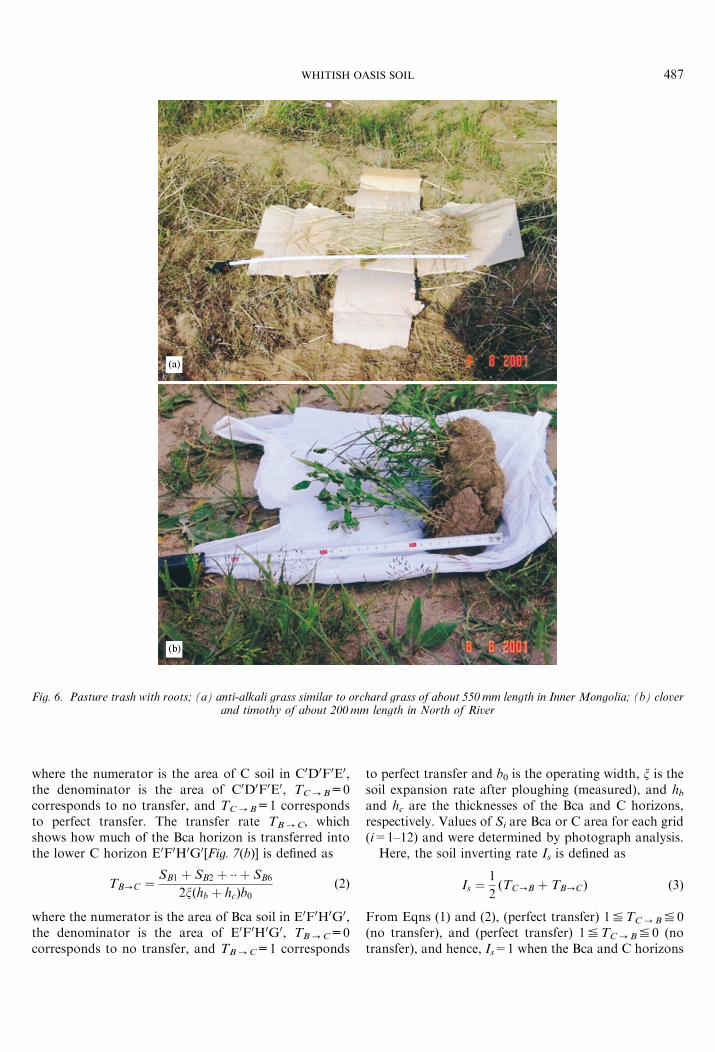
Fig. 6. Pasture trash with roots; (a) anti-alkali grass similar to orchard grass of about 550 mm length in Inner Mongolia; (b) cloverand timothy of about 200 mm length in North of River
WHITISH OASIS SOIL 487
where the numerator is the area of C soil in C0D0F0E0,the denominator is the area of C0D0F0E0, TC!B=0corresponds to no transfer, and TC!B=1 correspondsto perfect transfer. The transfer rate TB!C, whichshows how much of the Bca horizon is transferred intothe lower C horizon E0F0H0G0[Fig. 7(b)] is defined as
TB!C ¼SB1 þ SB2 þ �� þ SB6
2x hb þ hcð Þb0ð2Þ
where the numerator is the area of Bca soil in E0F0H0G0,the denominator is the area of E0F0H0G0, TB!C=0corresponds to no transfer, and TB!C=1 corresponds
to perfect transfer and b0 is the operating width, x is thesoil expansion rate after ploughing (measured), and hb
and hc are the thicknesses of the Bca and C horizons,respectively. Values of Si are Bca or C area for each grid(i=1–12) and were determined by photograph analysis.
Here, the soil inverting rate Is is defined as
Is ¼1
2TC!B þ TB!Cð Þ ð3Þ
From Eqns (1) and (2), (perfect transfer) 1%TC!B % 0(no transfer), and (perfect transfer) 1%TC!B% 0 (notransfer), and hence, Is=1 when the Bca and C horizons
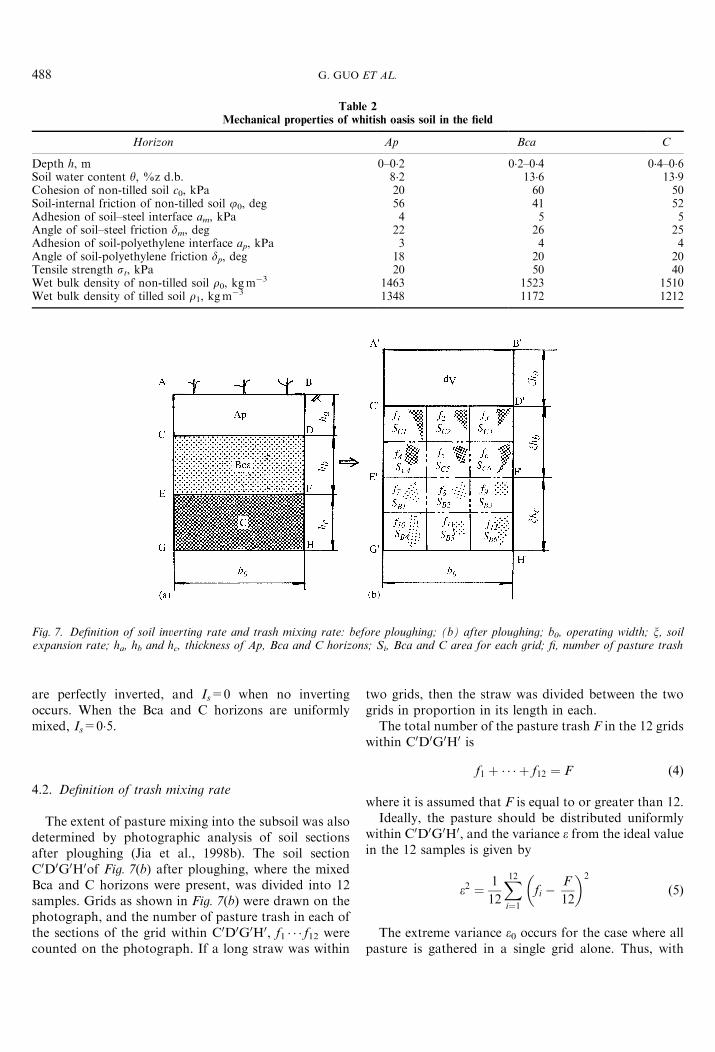
Fig. 7. Definition of soil inverting rate and trash mixing rate: before ploughing; (b) after ploughing; b0, operating width; x, soilexpansion rate; ha, hb and hc, thickness of Ap, Bca and C horizons; Si, Bca and C area for each grid; fi, number of pasture trash
Table 2Mechanical properties of whitish oasis soil in the field
Horizon Ap Bca C
Depth h, m 0–0�2 0�2–0�4 0�4–0�6Soil water content y, %z d.b. 8�2 13�6 13�9Cohesion of non-tilled soil c0, kPa 20 60 50Soil-internal friction of non-tilled soil j0, deg 56 41 52Adhesion of soil–steel interface am, kPa 4 5 5Angle of soil–steel friction dm, deg 22 26 25Adhesion of soil-polyethylene interface ap, kPa 3 4 4Angle of soil-polyethylene friction dp, deg 18 20 20Tensile strength st, kPa 20 50 40Wet bulk density of non-tilled soil r0, kgm�3 1463 1523 1510Wet bulk density of tilled soil r1, kgm�3 1348 1172 1212
G. GUO ET AL.488
are perfectly inverted, and Is=0 when no invertingoccurs. When the Bca and C horizons are uniformlymixed, Is=0�5.
4.2. Definition of trash mixing rate
The extent of pasture mixing into the subsoil was alsodetermined by photographic analysis of soil sectionsafter ploughing (Jia et al., 1998b). The soil sectionC0D0G0H0of Fig. 7(b) after ploughing, where the mixedBca and C horizons were present, was divided into 12samples. Grids as shown in Fig. 7(b) were drawn on thephotograph, and the number of pasture trash in each ofthe sections of the grid within C0D0G0H0, f1 � � � f12 werecounted on the photograph. If a long straw was within
two grids, then the straw was divided between the twogrids in proportion in its length in each.
The total number of the pasture trash F in the 12 gridswithin C0D0G0H0 is
f1 þ � � � þ f12 ¼ F ð4Þ
where it is assumed that F is equal to or greater than 12.Ideally, the pasture should be distributed uniformly
within C0D0G0H0, and the variance e from the ideal valuein the 12 samples is given by
e2 ¼1
12
X12i¼1
fi �F
12
� �2
ð5Þ
The extreme variance e0 occurs for the case where allpasture is gathered in a single grid alone. Thus, with
WHITISH OASIS SOIL 489
f1=F, f2 � � � f12=0, it is
e20 ¼1
12F �
F
12
� �2
þ11 0�F
12
� �2( )
¼11
122F2 ð6Þ
Here, the trash mixing rate Mt is defined as
Mt ¼ 1�ee0
� �2
ð7Þ
where Mt=0 corresponds to no mixing (all pasture arein a single grid alone and e=e0), and where Mt=1corresponds to uniform mixing (e=0).
5. Results and discussions
5.1. Draught
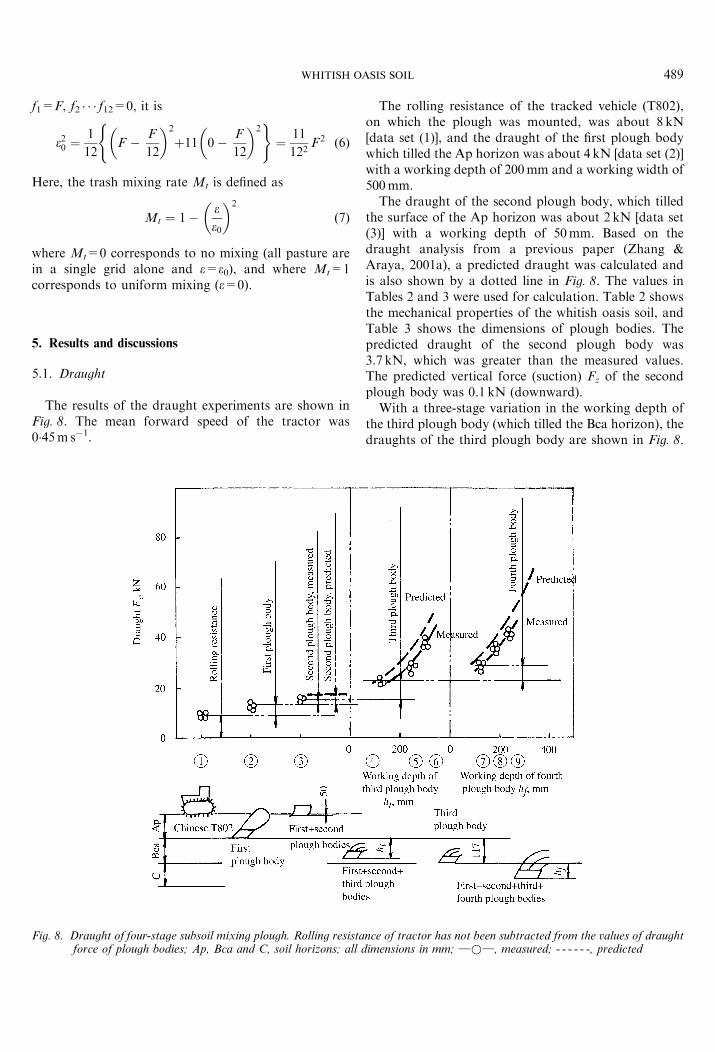
The results of the draught experiments are shown inFig. 8. The mean forward speed of the tractor was0�45m s�1.
Fig. 8. Draught of four-stage subsoil mixing plough. Rolling resistaforce of plough bodies; Ap, Bca and C, soil horizons; all
The rolling resistance of the tracked vehicle (T802),on which the plough was mounted, was about 8 kN[data set (1)], and the draught of the first plough bodywhich tilled the Ap horizon was about 4 kN [data set (2)]with a working depth of 200mm and a working width of500mm.
The draught of the second plough body, which tilledthe surface of the Ap horizon was about 2 kN [data set(3)] with a working depth of 50mm. Based on thedraught analysis from a previous paper (Zhang &Araya, 2001a), a predicted draught was calculated andis also shown by a dotted line in Fig. 8. The values inTables 2 and 3 were used for calculation. Table 2 showsthe mechanical properties of the whitish oasis soil, andTable 3 shows the dimensions of plough bodies. Thepredicted draught of the second plough body was3.7 kN, which was greater than the measured values.The predicted vertical force (suction) Fz of the secondplough body was 0.1 kN (downward).
With a three-stage variation in the working depth ofthe third plough body (which tilled the Bca horizon), thedraughts of the third plough body are shown in Fig. 8.
nce of tractor has not been subtracted from the values of draughtdimensions in mm; }*}, measured; - - - - - -, predicted
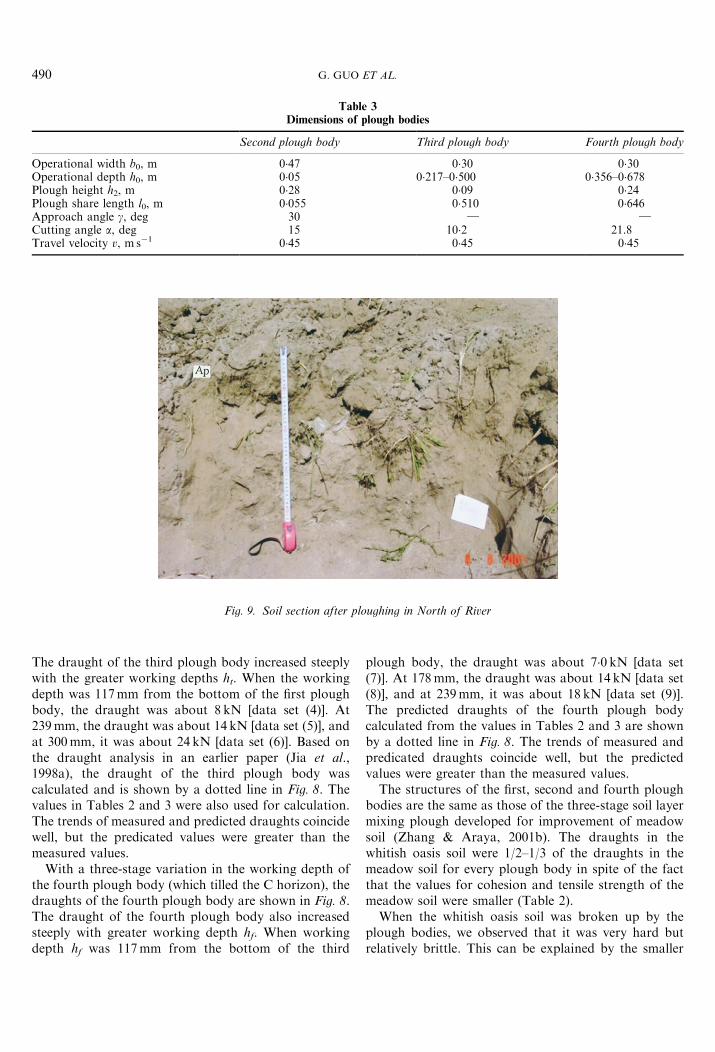
Fig. 9. Soil section after ploughing in North of River
Table 3Dimensions of plough bodies
Second plough body Third plough body Fourth plough body
Operational width b0, m 0�47 0�30 0�30Operational depth h0, m 0�05 0�217–0�500 0�356–0�678Plough height h2, m 0�28 0�09 0�24Plough share length l0, m 0�055 0�510 0�646Approach angle g, deg 30 } }Cutting angle a, deg 15 10�2 21.8Travel velocity v, m s�1 0�45 0�45 0�45
G. GUO ET AL.490
The draught of the third plough body increased steeplywith the greater working depths ht. When the workingdepth was 117mm from the bottom of the first ploughbody, the draught was about 8 kN [data set (4)]. At239mm, the draught was about 14 kN [data set (5)], andat 300mm, it was about 24 kN [data set (6)]. Based onthe draught analysis in an earlier paper (Jia et al.,1998a), the draught of the third plough body wascalculated and is shown by a dotted line in Fig. 8. Thevalues in Tables 2 and 3 were also used for calculation.The trends of measured and predicted draughts coincidewell, but the predicated values were greater than themeasured values.
With a three-stage variation in the working depth ofthe fourth plough body (which tilled the C horizon), thedraughts of the fourth plough body are shown in Fig. 8.The draught of the fourth plough body also increasedsteeply with greater working depth hf. When workingdepth hf was 117mm from the bottom of the third
plough body, the draught was about 7�0 kN [data set(7)]. At 178mm, the draught was about 14 kN [data set(8)], and at 239mm, it was about 18 kN [data set (9)].The predicted draughts of the fourth plough bodycalculated from the values in Tables 2 and 3 are shownby a dotted line in Fig. 8. The trends of measured andpredicated draughts coincide well, but the predictedvalues were greater than the measured values.
The structures of the first, second and fourth ploughbodies are the same as those of the three-stage soil layermixing plough developed for improvement of meadowsoil (Zhang & Araya, 2001b). The draughts in thewhitish oasis soil were 1/2–1/3 of the draughts in themeadow soil for every plough body in spite of the factthat the values for cohesion and tensile strength of themeadow soil were smaller (Table 2).
When the whitish oasis soil was broken up by theplough bodies, we observed that it was very hard butrelatively brittle. This can be explained by the smaller
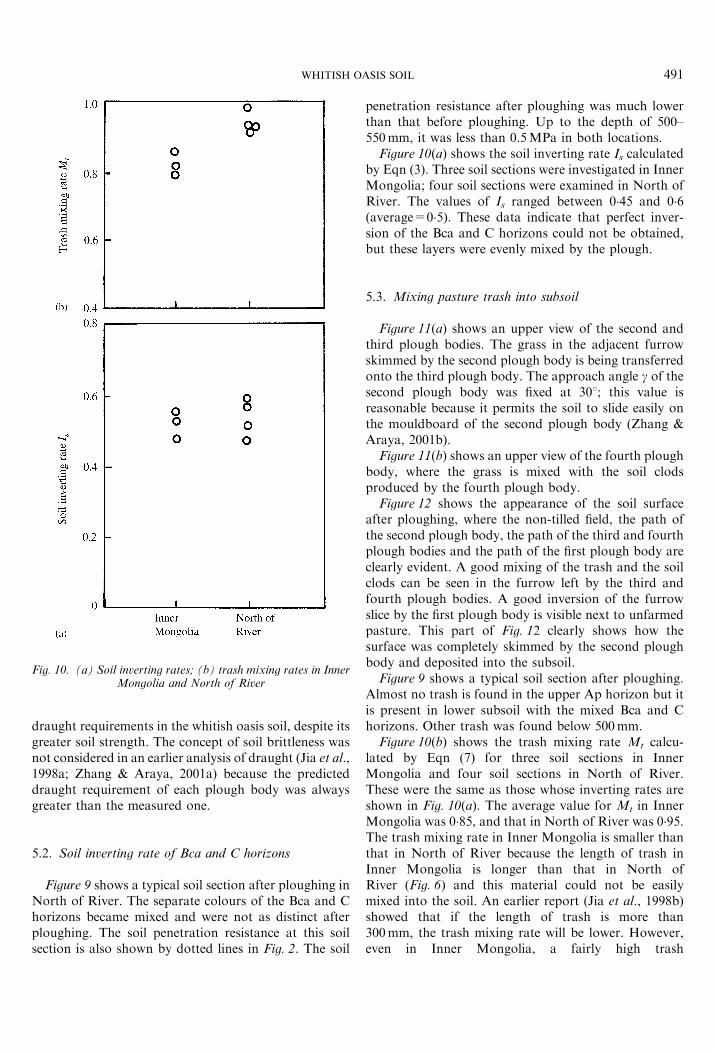
Fig. 10. (a) Soil inverting rates; (b) trash mixing rates in InnerMongolia and North of River
WHITISH OASIS SOIL 491
draught requirements in the whitish oasis soil, despite itsgreater soil strength. The concept of soil brittleness wasnot considered in an earlier analysis of draught (Jia et al.,1998a; Zhang & Araya, 2001a) because the predicteddraught requirement of each plough body was alwaysgreater than the measured one.
5.2. Soil inverting rate of Bca and C horizons
Figure 9 shows a typical soil section after ploughing inNorth of River. The separate colours of the Bca and Chorizons became mixed and were not as distinct afterploughing. The soil penetration resistance at this soilsection is also shown by dotted lines in Fig. 2. The soil
penetration resistance after ploughing was much lowerthan that before ploughing. Up to the depth of 500–550mm, it was less than 0.5MPa in both locations.
Figure 10(a) shows the soil inverting rate Is calculatedby Eqn (3). Three soil sections were investigated in InnerMongolia; four soil sections were examined in North ofRiver. The values of Is ranged between 0�45 and 0�6(average=0�5). These data indicate that perfect inver-sion of the Bca and C horizons could not be obtained,but these layers were evenly mixed by the plough.
5.3. Mixing pasture trash into subsoil
Figure 11(a) shows an upper view of the second andthird plough bodies. The grass in the adjacent furrowskimmed by the second plough body is being transferredonto the third plough body. The approach angle g of thesecond plough body was fixed at 308; this value isreasonable because it permits the soil to slide easily onthe mouldboard of the second plough body (Zhang &Araya, 2001b).
Figure 11(b) shows an upper view of the fourth ploughbody, where the grass is mixed with the soil clodsproduced by the fourth plough body.
Figure 12 shows the appearance of the soil surfaceafter ploughing, where the non-tilled field, the path ofthe second plough body, the path of the third and fourthplough bodies and the path of the first plough body areclearly evident. A good mixing of the trash and the soilclods can be seen in the furrow left by the third andfourth plough bodies. A good inversion of the furrowslice by the first plough body is visible next to unfarmedpasture. This part of Fig. 12 clearly shows how thesurface was completely skimmed by the second ploughbody and deposited into the subsoil.
Figure 9 shows a typical soil section after ploughing.Almost no trash is found in the upper Ap horizon but itis present in lower subsoil with the mixed Bca and Chorizons. Other trash was found below 500mm.
Figure 10(b) shows the trash mixing rate Mt calcu-lated by Eqn (7) for three soil sections in InnerMongolia and four soil sections in North of River.These were the same as those whose inverting rates areshown in Fig. 10(a). The average value for Mt in InnerMongolia was 0�85, and that in North of River was 0�95.The trash mixing rate in Inner Mongolia is smaller thanthat in North of River because the length of trash inInner Mongolia is longer than that in North ofRiver (Fig. 6) and this material could not be easilymixed into the soil. An earlier report (Jia et al., 1998b)showed that if the length of trash is more than300mm, the trash mixing rate will be lower. However,even in Inner Mongolia, a fairly high trash
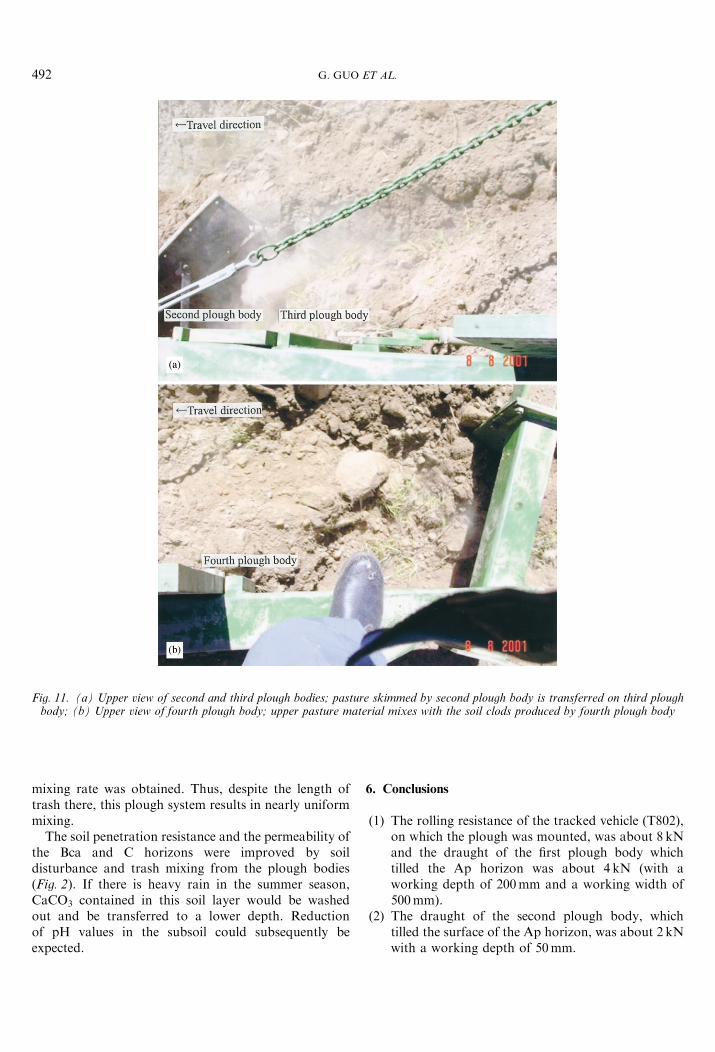
Fig. 11. (a) Upper view of second and third plough bodies; pasture skimmed by second plough body is transferred on third ploughbody; (b) Upper view of fourth plough body; upper pasture material mixes with the soil clods produced by fourth plough body
G. GUO ET AL.492
mixing rate was obtained. Thus, despite the length oftrash there, this plough system results in nearly uniformmixing.
The soil penetration resistance and the permeability ofthe Bca and C horizons were improved by soildisturbance and trash mixing from the plough bodies(Fig. 2). If there is heavy rain in the summer season,CaCO3 contained in this soil layer would be washedout and be transferred to a lower depth. Reductionof pH values in the subsoil could subsequently beexpected.
6. Conclusions
(1) The rolling resistance of the tracked vehicle (T802),on which the plough was mounted, was about 8 kNand the draught of the first plough body whichtilled the Ap horizon was about 4 kN (with aworking depth of 200mm and a working width of500mm).
(2) The draught of the second plough body, whichtilled the surface of the Ap horizon, was about 2 kNwith a working depth of 50mm.
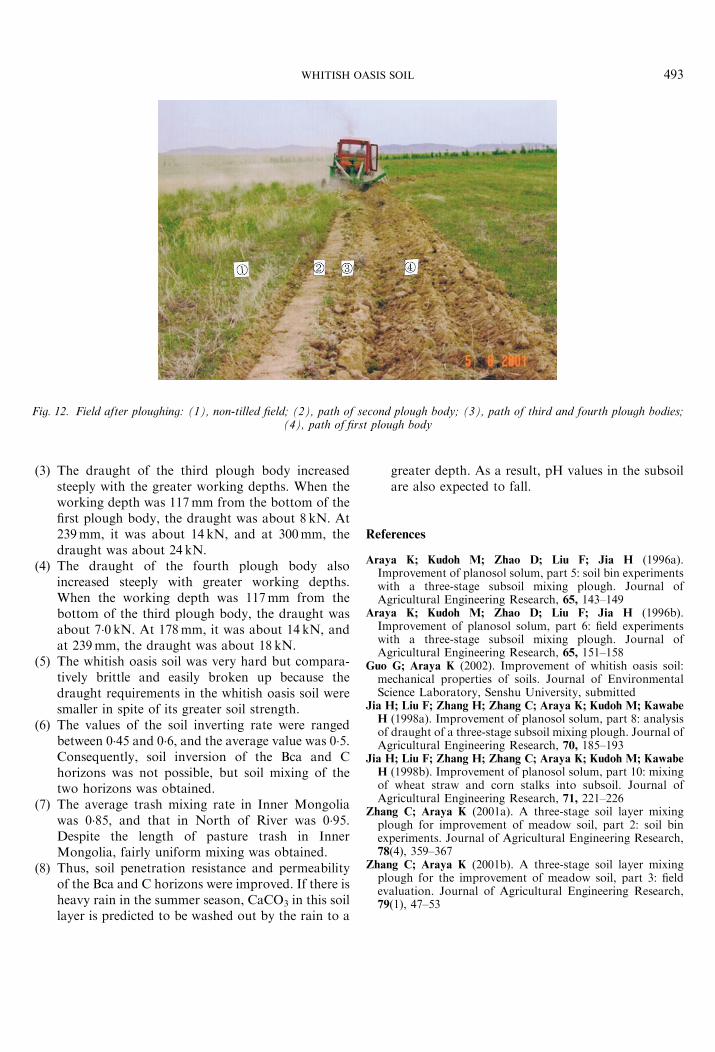
Fig. 12. Field after ploughing: (1), non-tilled field; (2), path of second plough body; (3), path of third and fourth plough bodies;(4), path of first plough body
WHITISH OASIS SOIL 493
(3) The draught of the third plough body increasedsteeply with the greater working depths. When theworking depth was 117mm from the bottom of thefirst plough body, the draught was about 8 kN. At239mm, it was about 14 kN, and at 300mm, thedraught was about 24 kN.
(4) The draught of the fourth plough body alsoincreased steeply with greater working depths.When the working depth was 117mm from thebottom of the third plough body, the draught wasabout 7�0 kN. At 178mm, it was about 14 kN, andat 239mm, the draught was about 18 kN.
(5) The whitish oasis soil was very hard but compara-tively brittle and easily broken up because thedraught requirements in the whitish oasis soil weresmaller in spite of its greater soil strength.
(6) The values of the soil inverting rate were rangedbetween 0�45 and 0�6, and the average value was 0�5.Consequently, soil inversion of the Bca and Chorizons was not possible, but soil mixing of thetwo horizons was obtained.
(7) The average trash mixing rate in Inner Mongoliawas 0�85, and that in North of River was 0�95.Despite the length of pasture trash in InnerMongolia, fairly uniform mixing was obtained.
(8) Thus, soil penetration resistance and permeabilityof the Bca and C horizons were improved. If there isheavy rain in the summer season, CaCO3 in this soillayer is predicted to be washed out by the rain to a
greater depth. As a result, pH values in the subsoilare also expected to fall.
References
Araya K; Kudoh M; Zhao D; Liu F; Jia H (1996a).Improvement of planosol solum, part 5: soil bin experimentswith a three-stage subsoil mixing plough. Journal ofAgricultural Engineering Research, 65, 143–149
Araya K; Kudoh M; Zhao D; Liu F; Jia H (1996b).Improvement of planosol solum, part 6: field experimentswith a three-stage subsoil mixing plough. Journal ofAgricultural Engineering Research, 65, 151–158
Guo G; Araya K (2002). Improvement of whitish oasis soil:mechanical properties of soils. Journal of EnvironmentalScience Laboratory, Senshu University, submitted
Jia H; Liu F; Zhang H; Zhang C; Araya K; Kudoh M; Kawabe
H (1998a). Improvement of planosol solum, part 8: analysisof draught of a three-stage subsoil mixing plough. Journal ofAgricultural Engineering Research, 70, 185–193
Jia H; Liu F; Zhang H; Zhang C; Araya K; Kudoh M; Kawabe
H (1998b). Improvement of planosol solum, part 10: mixingof wheat straw and corn stalks into subsoil. Journal ofAgricultural Engineering Research, 71, 221–226
Zhang C; Araya K (2001a). A three-stage soil layer mixingplough for improvement of meadow soil, part 2: soil binexperiments. Journal of Agricultural Engineering Research,78(4), 359–367
Zhang C; Araya K (2001b). A three-stage soil layer mixingplough for the improvement of meadow soil, part 3: fieldevaluation. Journal of Agricultural Engineering Research,79(1), 47–53