swapnil sem2
TRANSCRIPT

1
Development and validation ofa stability-indicating RP-LC method for famciclovir
PRESENTED BYMR. Nitin P. KanwaleM.PHARM. 2nd SEM.DEPARTMENT OF QUALITY ASSURANCE TECHNIQUES
GUIDED BYDR.D.V.DERLEM.PHARM, Ph. D PRINCIPAL OF CPN-2
M. V. P. SAMAJ’S COLLEGE OF PHARMACY, GANGAPUR ROAD, NASHIK- 422002.
2
A b s t r a c tKeywords1. Introduction2. Experimental2.1. Chemicals and reagents 2.2. HPLC conditions2.3. LC–MS/MS conditions2.4. Preparation of stock and standard solutions2.5. Forced degradation conditions (O,A,B,T,H,P)3. Results and discussion3.1. HPLC method development3.2. Method validation4. Conclusions5. References
Contents
3
A novel stability-indicating gradient reverse phase liquid chromatographic (RP-LC) method was developed for the determination of purity of famciclovir (FCV) in presence of its impurities and degradation products. The method was developed using Inertsil ODS 3V (250×4.6mm, 5m) column with mobile phase containing a gradient mixture of solvent A and B. 0.01M potassium dihydrogen orthophosphate buffer, pH adjusted to 6.0 with 1% potassium hydroxide was used as buffer. Buffer and methanol in 80:20(v/v) ratio was used as solvent A and buffer and methanol in 20:80 (v/v) ratio was used as solvent B. The gradient program (T/%B) was set. The eluted compounds were monitored at 215 nm. FCV was subjected to the stress conditions of oxidative, acid, base, hydrolytic, thermal and photolytic degradation. FCV was found to degrade significantly in oxidative, acid and base degradation conditions and mildly in hydrolytic degradation conditions and stable in thermal and photolytic degradation conditions. The degradation products were well resolved from main peak and its impurities thus proved the stability-indicating power of the method. The developed method was validated as per (ICH) guidelines with respect to specificity, LOD,LOQ, precision, linearity, accuracy, robustness and system suitability. This method is also suitable for the assay of FCV which ranged from 99.9% to 100.2%.
A b s t r a c t
4
Keywords
DevelopmentValidationStability-indicating methodFamciclovir (FCV)Impurities
1. Introduction
It is to be developed either to determine only the parent constituent or only the impurity or degradation product or to separate and determine the parent compound in presence of its impurities and degradation products. It is a prodrug of penciclovir with improved oral bioavailability. Three RP-LC methods were found in literature for the determination of famciclovir in pharmaceutical formulations, but forced degradation details were not presented in these articles.

5
2. Experimental2.1. Chemicals and reagents
Potassium dihydrogen orthophosphate monohydrare, potassium hydroxide, methanol, hydrochloric acid, sodium hydroxide and hydrogen peroxide (30%) were obtained from Merck, India.
Fig. 1. Structures of FCV and its six impurities.
6
2.2. HPLC conditions
Waters Alliance e2695 separation module equipped with 2489 UV/vis detector or 2998 PDA detector with empower2 software. Inertsil ODS 3V column anda gradient mixture of solvent A and B were used. 0.01MPotassium dihydrogen orthophosphate buffer, pH adjusted to 6.0 with 1% potassium hydroxide was used as buffer. Buffer and methanol in 80:20 (v/v) ratio was used as solvent A and buffer and methanol in 20:80 (v/v) ratio was used as solvent B. The gradient program (T/%B)was set. Solvent A was used as diluent.0.8 ml/min flow rate was maintained. The eluted compounds were monitored at 215 nm. The column oven and auto sampler temperatures were maintained at 27◦C and 5 ◦C, respectively. An injection volume of 10 ul was used.
7
2.3. LC–MS/MS conditions
A gradient mixture of solvent A and B were used as stationary and mobile phases, respectively. 0.01M ammonium formate was used as buffer.Source and dissolvation temperatures are 120 ◦C and 350 ◦C, respectively. Dissolvation gas flow is 650 l/h.
2.4. Preparation of stock and standard solutions
Solvent Awas used as diluent. 1 and 0.1mg/ml stock solutions of FCVwere prepared in diluent for purity and assay methods, respectively.0.15% of six impurities blend with respect to 1 mg/ml FCVwas prepared in diluent.
8
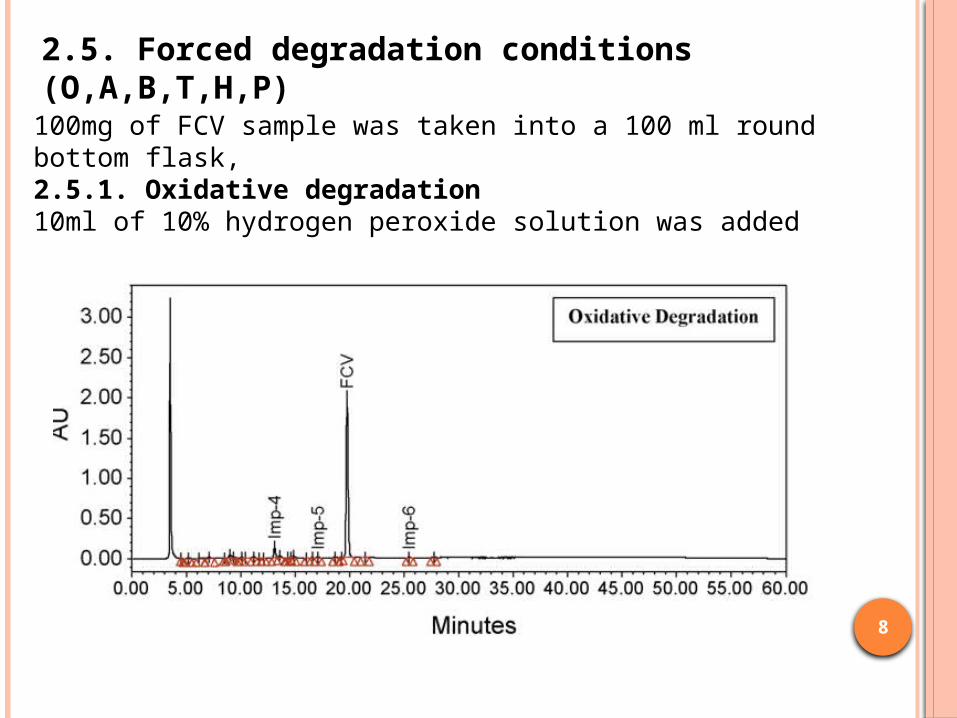
2.5. Forced degradation conditions (O,A,B,T,H,P)
100mg of FCV sample was taken into a 100 ml round bottom flask,2.5.1. Oxidative degradation10ml of 10% hydrogen peroxide solution was added
9
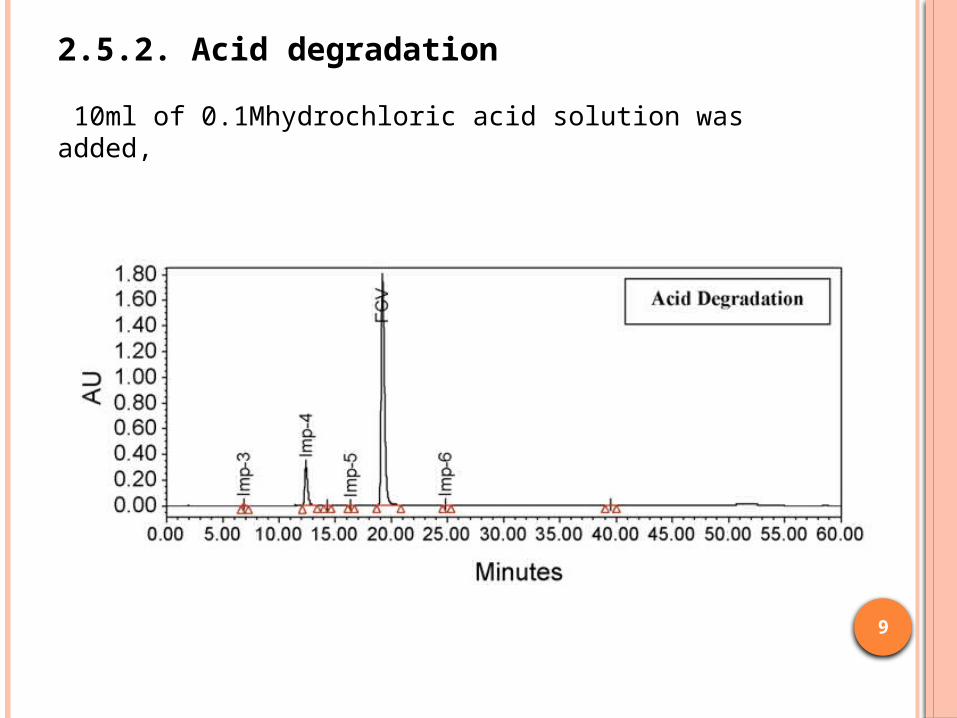
2.5.2. Acid degradation
10ml of 0.1Mhydrochloric acid solution was added,
10
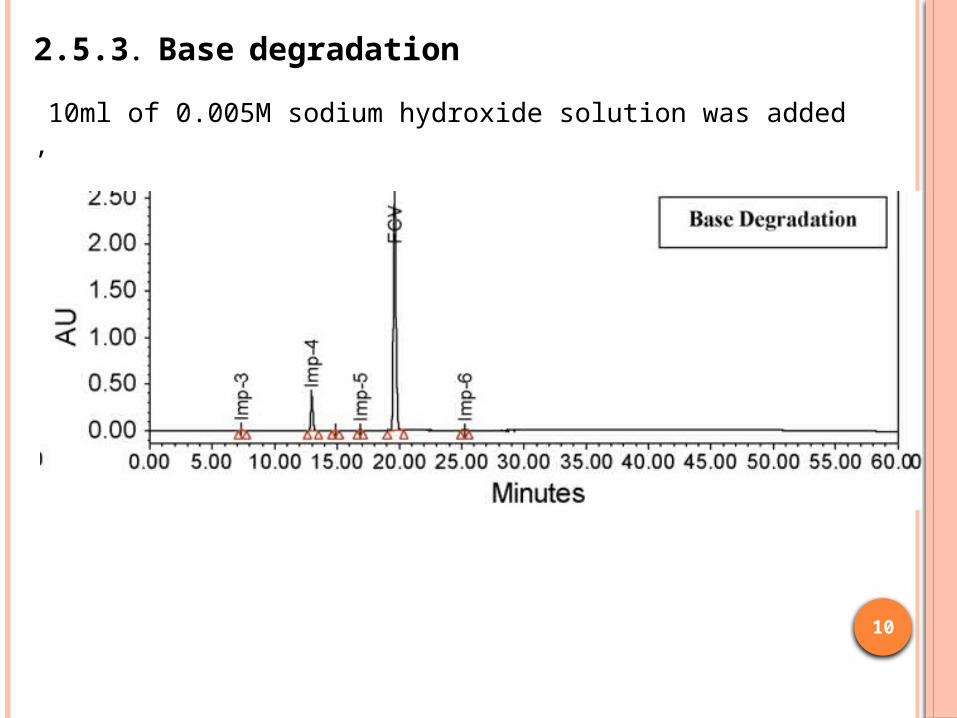
2.5.3. Base degradation
10ml of 0.005M sodium hydroxide solution was added ,
11
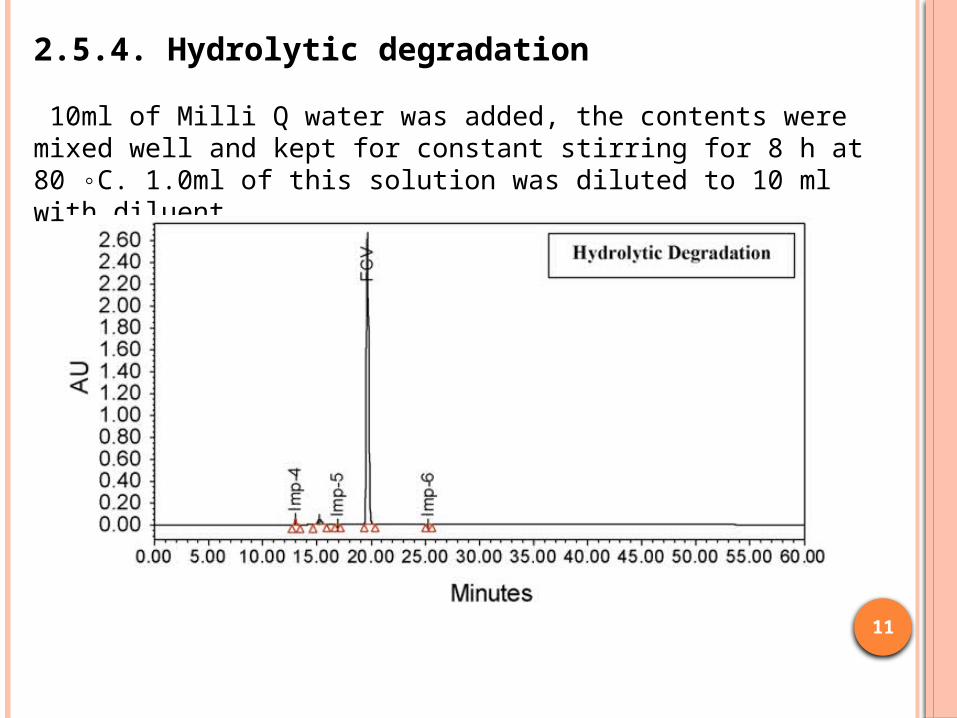
2.5.4. Hydrolytic degradation
10ml of Milli Q water was added, the contents were mixed well and kept for constant stirring for 8 h at 80 ◦C. 1.0ml of this solution was diluted to 10 ml with diluent.
12
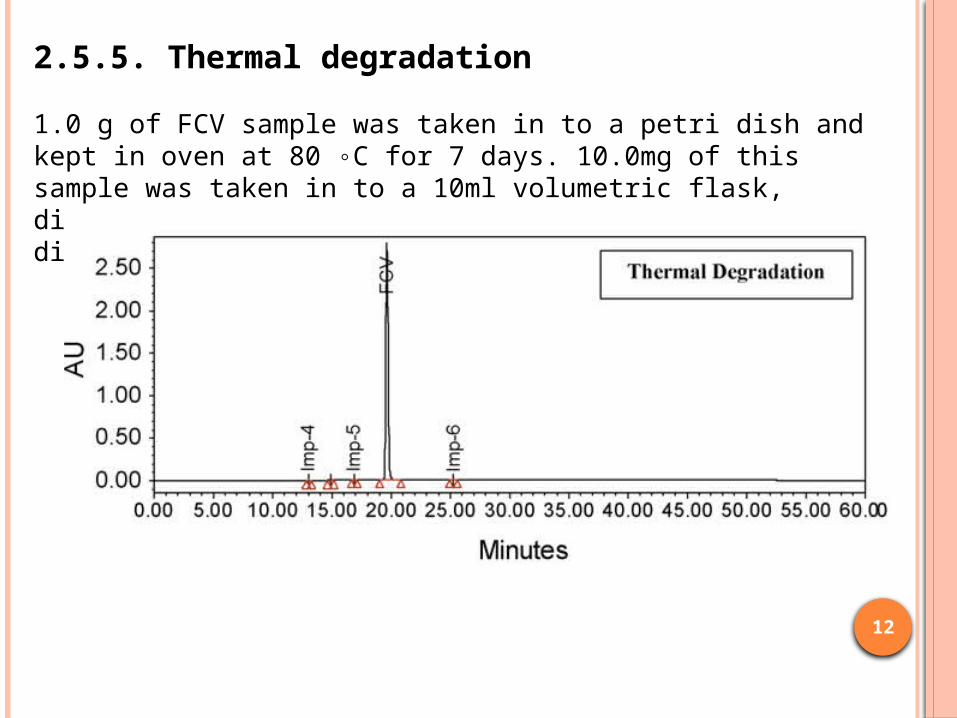
2.5.5. Thermal degradation
1.0 g of FCV sample was taken in to a petri dish and kept in oven at 80 ◦C for 7 days. 10.0mg of this sample was taken in to a 10ml volumetric flask, dissolved in diluent and diluted to volume with diluent.
13
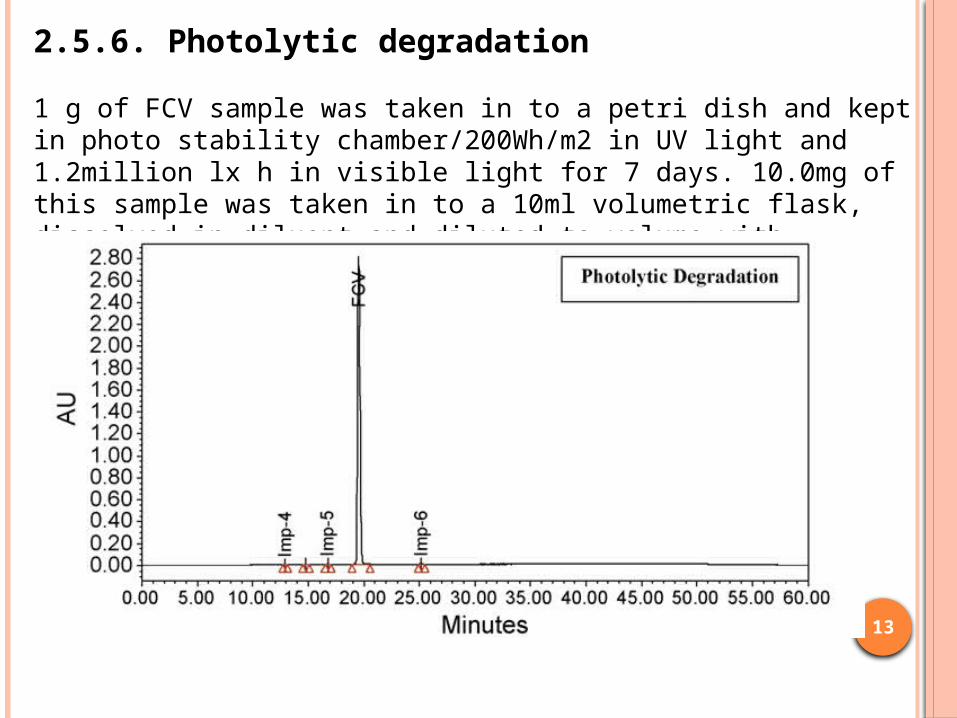
2.5.6. Photolytic degradation
1 g of FCV sample was taken in to a petri dish and kept in photo stability chamber/200Wh/m2 in UV light and 1.2million lx h in visible light for 7 days. 10.0mg of this sample was taken in to a 10ml volumetric flask, dissolved in diluent and diluted to volume with diluent.
14
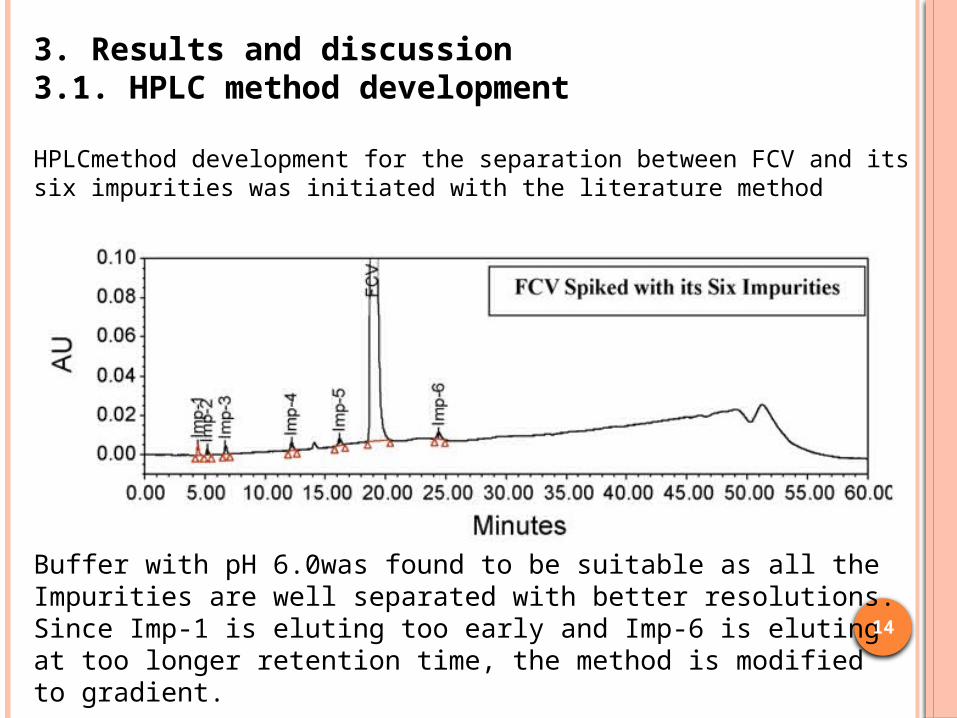
3. Results and discussion3.1. HPLC method development
HPLCmethod development for the separation between FCV and its six impurities was initiated with the literature method
Buffer with pH 6.0was found to be suitable as all the Impurities are well separated with better resolutions. Since Imp-1 is eluting too early and Imp-6 is eluting at too longer retention time, the method is modified to gradient.
15
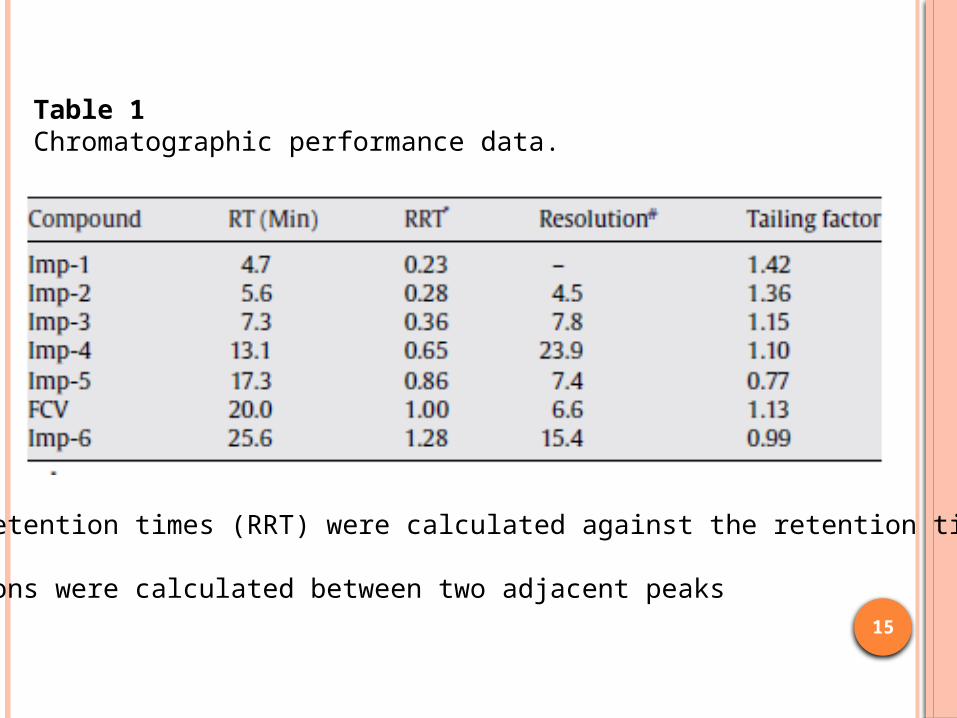
Table 1Chromatographic performance data.
Relative retention times (RRT) were calculated against the retention time (RT)of FCV.# Resolutions were calculated between two adjacent peaks

16
3.2. Method validation
3.2.1. Specificity
Specificity is the ability of the method to measure the analyte response in the presence of its potential impurities and degradation products. The specificity of the developed LC method was checked in the presence of its impurities and forced degradation products.
3.2.2. Limit of detection limit and quantitation
Initially, 0.15% of FCV impurities blend with respect to 1mg/mlFCV was injected. This solution was further diluted to achieve thesignal-to-noise (S/N) ratio of 3:1 and 10:1 for determining limitof detection (LOD) and limit of quantitation (LOQ), respectively.
17
3.2.3. Precision
The precision of the method was checked by injecting six individual preparations of FCV spiked with 0.15% of its six impurities (0.15% of impurities with respect to 1mg/ml FCV). %RSD of area for each impurity was calculated. The intermediate precision of the method was also verified on six different days in the same laboratory using the specification and LOQ spiked FCV solutions prepared as above.3.2.4. LinearityThe linearity of an analytical procedure is its ability (within a given range) to obtain test results, which are directly proportional to the concentration of the analyte in the sample. Linearity test solutions for impurities were prepared individually at six concentration levels (each triplicate) in the range of LOQ to 200% of the specificationlevel, viz. 0.15%.
18
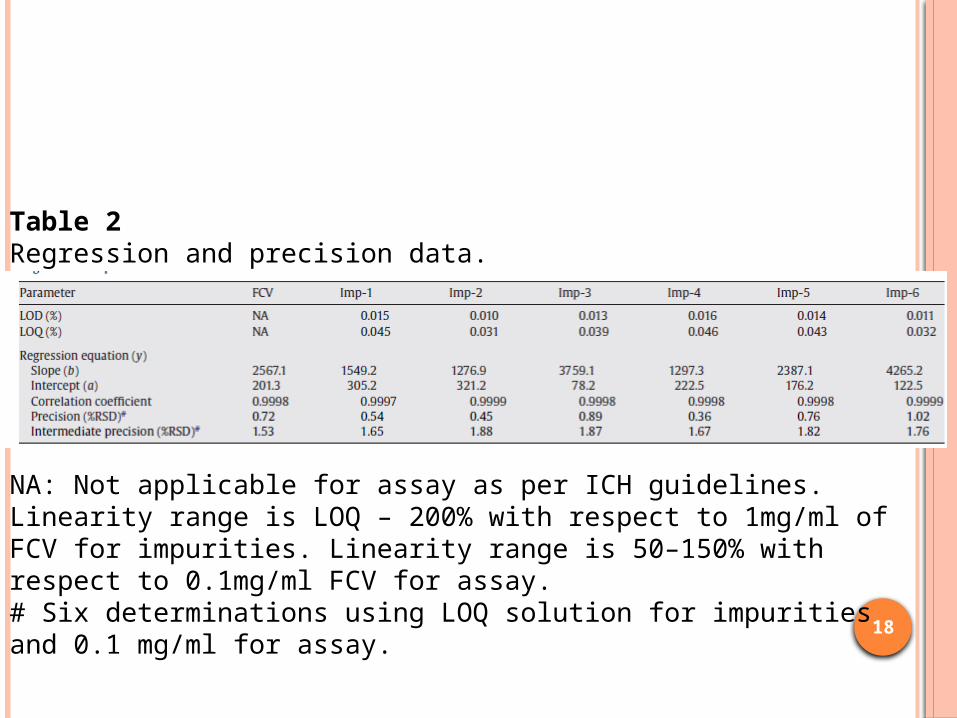
Table 2Regression and precision data.
NA: Not applicable for assay as per ICH guidelines. Linearity range is LOQ – 200% with respect to 1mg/ml of FCV for impurities. Linearity range is 50–150% with respect to 0.1mg/ml FCV for assay.# Six determinations using LOQ solution for impurities and 0.1 mg/ml for assay.
19
3.2.5. Accuracy
The accuracy of an analytical procedure expresses the closenessof agreement between the value, which is accepted eitheras a conventional true value or an accepted reference value andthe value found. Standard addition and recovery experiments wereconducted to determine accuracy of the impurities of FCV for theirquantification. The study was carried out in triplicate at LOQ, 100% and 150% with respect to specification level, viz. 0.15%. The percentage recoveries are presented.3.2.6. Robustness
The robustness was illustrated by getting the resolution between any two compounds to be greater than 2.0, when mobile phase flow rate (±0.2 ml/min), pH (±0.2), organic solvent ratio (±5%) and column temperature (±2 ◦C) were deliberately varied.
20
3.2.7. Solution stability
4. Conclusions
A stability-indicating HPLC method has been developed and validated for the determination of FCV and its six impurities. Thebehavior of FCV under various stress conditions was studied. Since the method is able to separate the FCV from its impurities and degradation products, it can be used for checking the quality of FCV in its bulk and stability samples.
21
5. References
1) N.V.V.S.S. Ramana, K.A. Harikrishnaa, A.V.S.S. Prasada, K. Ratnakar Reddya, K. Ramakrishnab,∗ Development and validation of a stability-indicating RP-LC method for famciclovirJournal of Pharmaceutical and Biomedical Analysisjournal homepage: www.elsevier.com/locate/jpbaContents lists available at ScienceDirect 2) Blessy Mn, Ruchi D. Patel, Prajesh N. Prajapati, Y. K. Agrawal Development of forced degradation and stability indicating studies of drugs—A review Journal of Pharmaceutical Analysis www.elsevier.com/locate/jpa www.sciencedirect.com 3)Monika Bakshi, Saranjit Singh *Development of validated stability-indicating assay methods—critical reviewJournal of Pharmaceutical and Biomedical Analysis28 (2002) 1011–1040