swanson hydrology & geomorphology study/slr_proj.pdfswanson hydrology & geomorphology lower...
TRANSCRIPT

Swanson Hydrology & Geomorphology Lower San Lorenzo River & Lagoon Management Plan
Page i
Hydrology / Geomorphology / Restoration / Water Resources / Construction Planning & Supervision
TABLE OF CONTENTS Page Executive Summary iv 1.0 Project Setting and Plan Purpose
1.1 Historical Context 1-1 1.2 Project Need 1-8 1.3 Plan Purpose and Goals 1-9 1.4 Methods 1-10
2.0 Lower River & Lagoon Existing Conditions 2.1 Project Area 2-1 2.2 Hydrologic Overview 2-1 2.3 Geologic Overview 2-3 2.4 Ecological Resources 2-3 2.5 Flood Control Constraints 2-4 2.6 River Reaches – Existing Conditions 2-4 2.7 Riverine Reach (Highway 1 to Water Street Bridge) 2-4 2.8 Transitional Reach (Water Street Bridge to Laurel Street Bridge) 2-10 2.9 Estuarine Reach (Laurel Street Bridge to Pacific Ocean) 2-16
3.0 Findings, Opportunities & Constraints, and Restoration & Management Goals & Objectives
3.1 Findings 3-1 3.2 Opportunities and Constraints 3-3 3.3 Management and Restoration Goals and Objectives 3-5
4.0 Management and Restoration Recommendations 4.1 Criteria for Recommendations 4-1 4.2 Management Recommendations 4-1 4.3 Restoration Recommendations 4-8
5.0 Implementation Plan 5.1 Implementation Responsibilities 5-1 5.2 Schedule of Implementation 5-2 5.3 Projected Costs 5-3
6.0 Monitoring Plan 6.1 Purpose of Monitoring Plan 6-1 6.2 Restoration Goals and Objectives 6-1 6.3 Baseline Conditions 6-1 6.4 Monitoring Parameters 6-4
7.0 References Cited
Swanson Hydrology & Geomorphology Lower San Lorenzo River & Lagoon Management Plan
Page ii
Hydrology / Geomorphology / Restoration / Water Resources / Construction Planning & Supervision
APPENDICES
Appendix A-1: Vascular Plant Checklist
Appendix A-2: Fish Species List
Appendix A-3: Birds Detected along the San Lorenzo River during PRBO point counts, 1999 and 2000
Appendix B: Hydrologic Assessment
Appendix C: Elevation ranges for occurrences of riparian vegetation species from surveys at the San Lorenzo River and Scott Creek, Santa Cruz County, California.
Appendix D: Estimated Costs for Restoration Structures
LIST OF FIGURES Figure 1: Santa Cruz, CA circa 1850 1-2
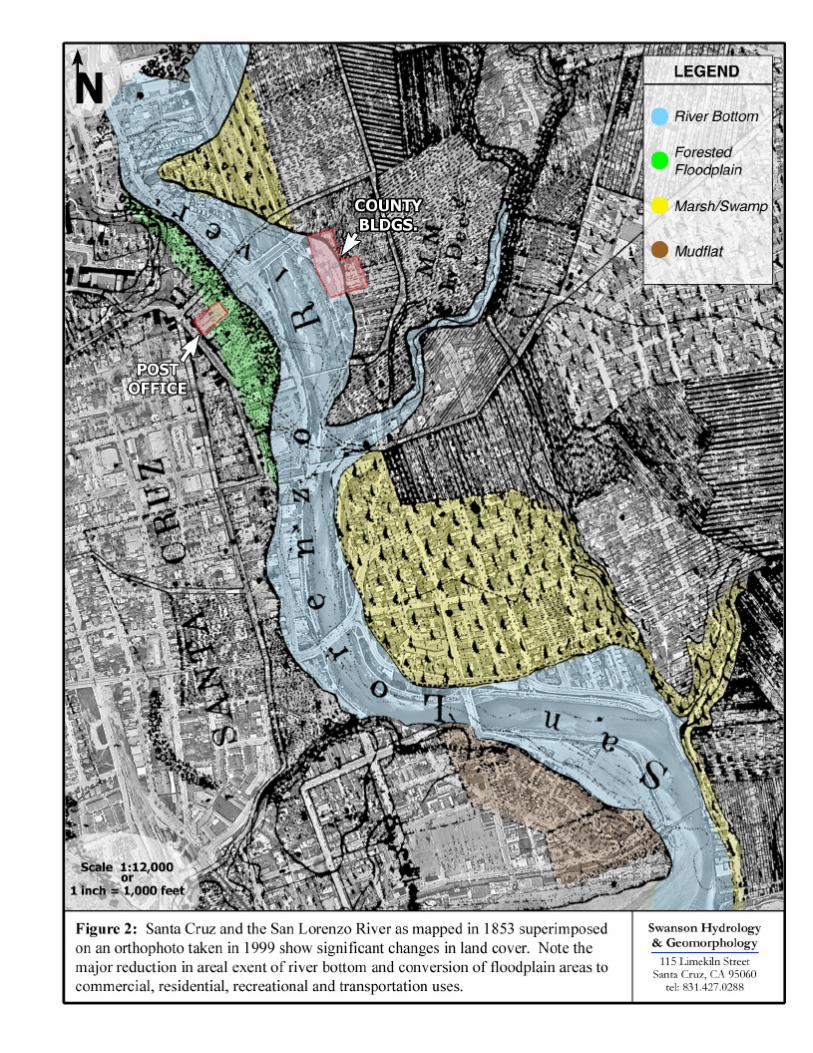
Figure 2: 1853 map over 1999 aerial photo showing historic and current land uses. 1-3
Figure 3: The San Lorenzo River flooding Santa Cruz in 1955. 1-2
Figure 4: San Lorenzo River following the 1958 levee project. 1-2
Figure 5: San Lorenzo River in 1968 looking downstream between Water Street and Soquel Avenue. Lack of vegetation and braided channel show the degraded habitat condition.
1-2
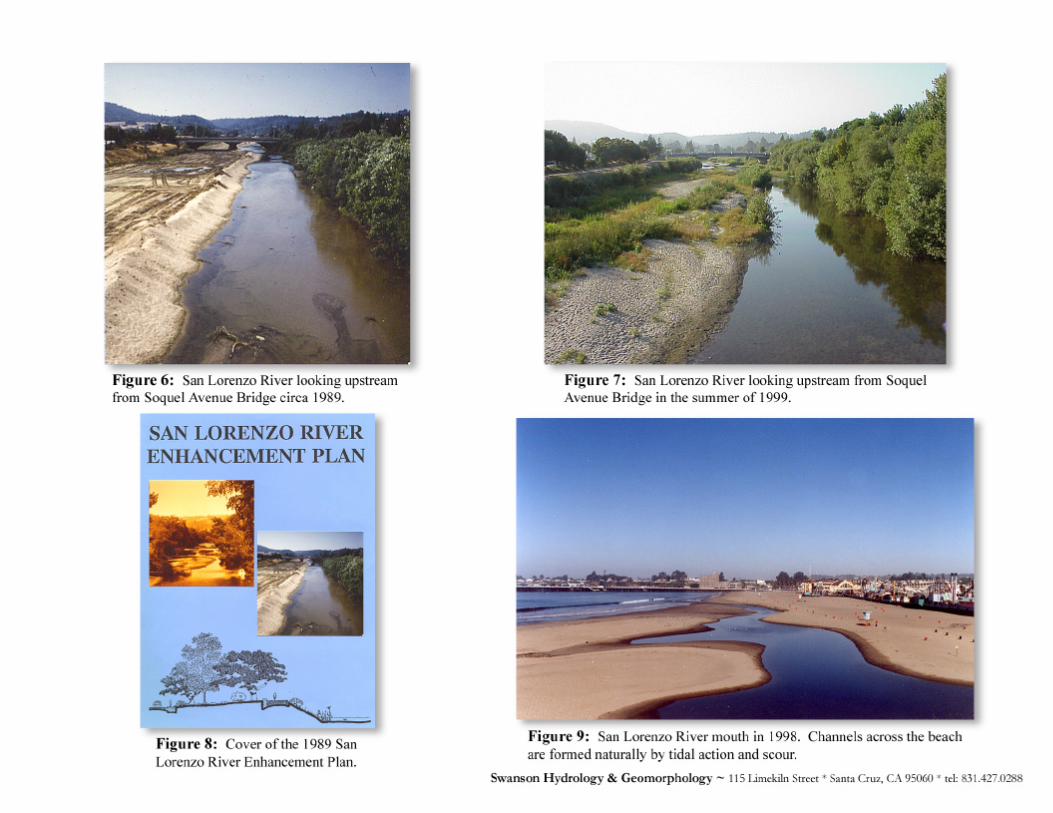
Figure 6: San Lorenzo River looking upstream from Soquel Avenue Bridge circa 1989. 1-4
Figure 7: San Lorenzo River looking upstream from Soquel Avenue Bridge in the summer of 1999. 1-4
Figure 8: Cover of the 1989 San Lorenzo River Enhancement Plan. 1-4
Figure 9: San Lorenzo River mouth in 1998. Channels across the beach are formed naturally by tidal action and scour. 1-4
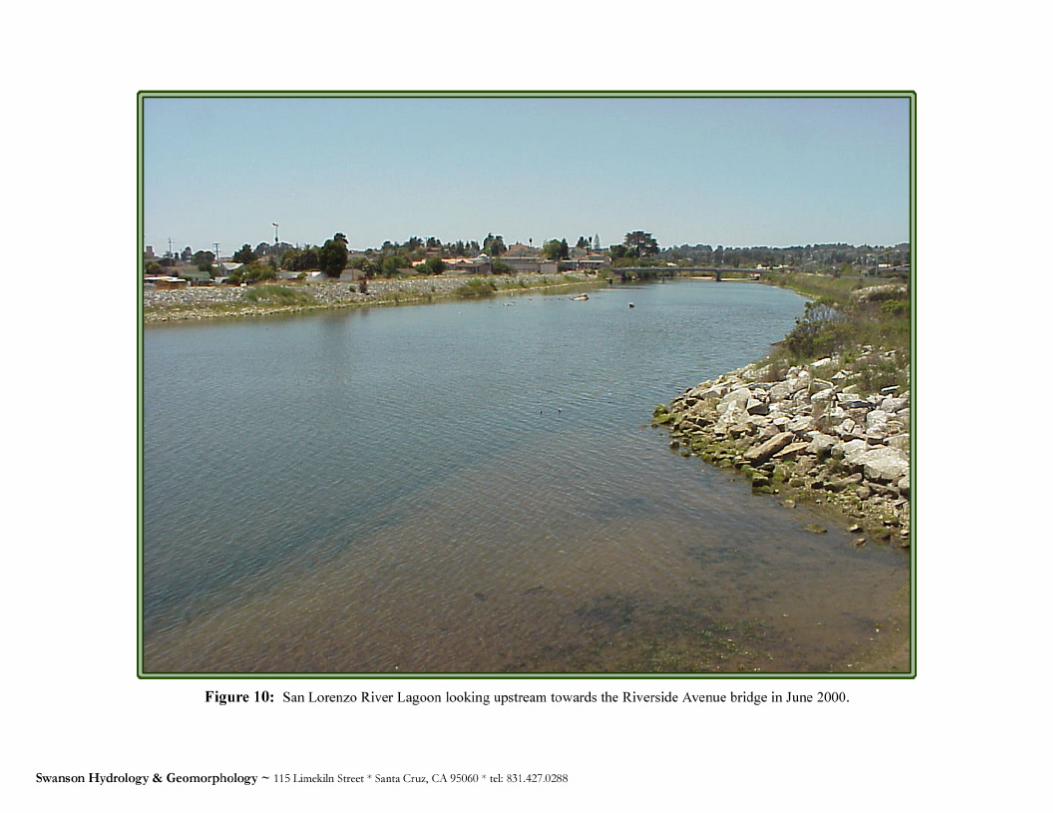
Figure 10: San Lorenzo River Lagoon looking upstream towards the Riverside Avenue bridge in June 2000. 1-7
Figure 11: Hydrograph for the San Lorenzo River at Santa Cruz (USGS #11161000). 2-2
Figure 12: San Lorenzo River reach delineations 2-5
Figure 13: Vegetation community types – Riverine reach 2-6
Figure 14: Vegetation community types – Transitional reach 2-11
Swanson Hydrology & Geomorphology Lower San Lorenzo River & Lagoon Management Plan
Page iii
Hydrology / Geomorphology / Restoration / Water Resources / Construction Planning & Supervision
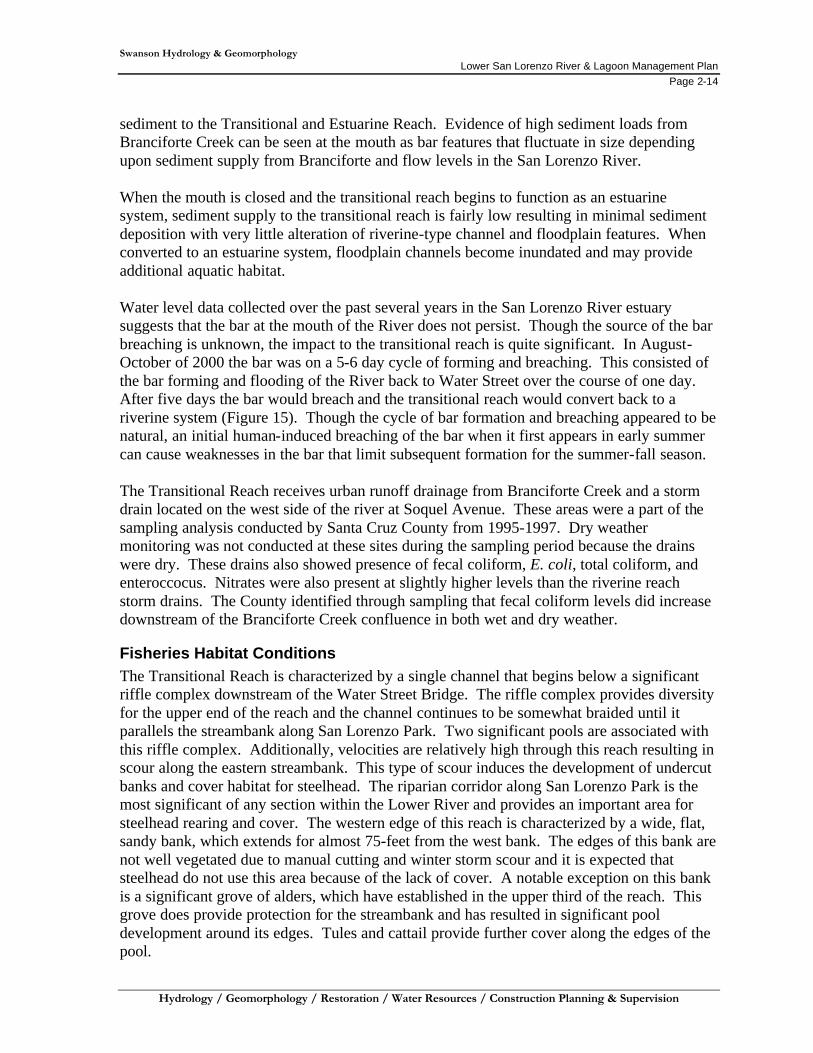
Figure 15: Records of water surface stage on the San Lorenzo River Lagoon at the Jessie Street Marsh outlet through August and September 2000 show a pattern of lagoon filling and breaching.
2-15
Figure 16: Vegetation community types – Estuarine reach 2-17
Figure 17: Plan and profile depictions of log and boulder large roughness objects placed on streambed to induce bed scour and enhance instream habitat.
4-10
Figure 18: Plan and profile depictions of tule / cattail placed on streambed to induce bed scour and enhance instream habitat. 4-12
Figure 19: Plan and profile depictions of log / boulder structures placed along shoreline to induce bed scour and enhance instream habitat.
4-14
LIST OF TABLES
Table 1: San Lorenzo River Watershed-Wide Planning Efforts. 1-11
Table 2: Problems, Opportunities, and Constraints for Riverine Reach 3-3
Table 3: Problems, Opportunities, and Constraints for Transitional Reach 3-4
Table 4: Problems, Opportunities, and Constraints for Estuarine Reach 3-4
Table 5: Recommended Vegetation Thinning Prescriptions by Reach 4-3
Table 6: Recommended Sediment Management Prescriptions by Reach 4-3
Table 7: Existing Invasive, Non-Native Plants Observed in the Urban San Lorenzo River Riparian Corridor 4-17
Table 8: Species List for Revegetation in the Riverine Reach 4-20
Table 9: Species List for Revegetation in the Transitional Reach 4-21
Table 10: Species List for Revegetation in the Estuarine Reach 4-22
Table 11: Projected Costs for Management and Restoration Recommendations 5-3
Table 12: Management and Restoration Actions (Years 1-5) 5-4
Table 13: Management and Restoration Actions (Years 6-10) 5-5
Table 14: Management and Restoration Actions (Years 11-15) 5-6
Swanson Hydrology & Geomorphology Lower San Lorenzo River & Lagoon Management Plan
Page iv
Hydrology / Geomorphology / Restoration / Water Resources / Construction Planning & Supervision
EXECUTIVE SUMMARY The Lower San Lorenzo River and Lagoon Management Plan (Management Plan) provides an update to the 1989 San Lorenzo River Enhancement Plan. The 1989 San Lorenzo River Enhancement Plan was developed by the City of Santa Cruz to enhance and restore riparian habitat in the river within the constraints of providing flood protection. The 1989 plan provided recommendations for maintaining better habitat values for the San Lorenzo River lagoon and provided restoration recommendations for Jessie Street Marsh. Since the adoption of the 1989 plan there have been a number of changes that have significantly altered both the landscape and the management needs of the San Lorenzo River and Lagoon:
• The 1989 Loma Prieta earthquake damaged much of the City of Santa Cruz (the City), including the Riverside Avenue Bridge. Some of the reconstruction alleviated long-standing problems along the river by increasing flood capacity by raising four of the City’s bridges and eliminating the summer lagoon flooding problems by filling in the adjacent basements in connection with the Lower Ocean Street / Barson Street Storm Drain project. Other repairs created new problems, such as the destruction of much of the vegetation on the banks of the lagoon when the levee was reinforced with riprap.
• In 1996, the National Marine Fisheries Service (NMFS) listed coho salmon in the
Central California Coast Evolutionary Significant Unit (ESU) as threatened. Coho south of San Francisco Bay are considered endangered by the State of California. In 1997, NMFS also listed steelhead trout in the Central California Coast ESU as threatened, as did the State of California. The San Lorenzo River downstream of Newell Dam at Loch Lomond is considered critical habitat for the survival of both species as well as other special status species. These designations significantly affect management decisions and give more impetus to restoring salmonid habitat.
• The U.S. Army Corps of Engineers San Lorenzo River Flood Control Improvement
Project (1999-2003) improves flood capacity but also affects the riparian vegetation in those areas. Part of the project includes revegetating the outer slopes of the levees, but the potential of allowing vegetation on the inner slope needs to be assessed in terms of impact on flood capacity.
• While vegetation management in and along the channel has been irregular between
1989 and 2000, the riparian corridor successfully recolonized the upper and middle reaches of the lower river to the extent possible in the flood control channel. With new flood capacity provided by raising the bridges and the levees, the original 1989 hydraulic analyses needed to be re-evaluated to assess the current effect on flood capacity with existing and potential vegetation throughout the project area.
Due to these changes, the City and the San Lorenzo River Urban River Plan Task Force called for an updated plan. This new Management Plan was developed by Swanson Hydrology & Geomorphology and City staff, with funding provided by the State Coastal
Swanson Hydrology & Geomorphology Lower San Lorenzo River & Lagoon Management Plan
Page v
Hydrology / Geomorphology / Restoration / Water Resources / Construction Planning & Supervision
Conservancy and the City. The project area covers the lower 2.2 miles of the river, from Highway 1 to the mouth of the river at Monterey Bay. Working within the constraints of maintaining flood capacity for a 100-year storm event, the Management Plan seeks to identify recommendations to restore the biological and physical processes of a healthy and diverse ecosystem that can respond to the dynamic changes that occur on the San Lorenzo River. As outlined in its purpose statement, the Management Plan provides for “the enhancement and management of the lower San Lorenzo River as a functioning riparian corridor to increase abundance and diversity of all native species, with added focus on anadromous fish (steelhead and coho salmon) and other special status species.” Besides documenting existing conditions and performing new hydraulic analyses, the Management Plan makes specific management and restoration recommendations for a 15-year implementation period beginning in 2002. This will require coordination of several City departments and may entail the formation of a permanent River Commission, pending City Council approval in early 2002. Restoration goals and measurable objectives have been identified (see Chapter 3) and a monitoring plan has been developed to track the habitat response to management and restoration efforts. The monitoring plan, together with management and restoration actions, will guide the adaptive management of the river corridor. This Management Plan has been developed in collaboration with the County of Santa Cruz and federal and state planning efforts and activities throughout the watershed to improve habitat for steelhead, improve water quality and quantity, reduce sediment, and improve riparian habitat.
SUMMARY OF MAJOR FINDINGS AND RECOMMENDATIONS
1. Degraded Estuary - Of the three river reaches studied, the Estuarine Reach – from the Laurel Street Bridge to the Pacific Ocean – is the most degraded due to the presence of riprap along the slopes eliminating much of the native vegetation, the spread of invasive non-native plant species, and inconsistent management practices in the past. Estuaries are normally some of the most biologically productive habitats. Restoring this reach is considered one of the highest priorities.
2. Lagoon Level Management – A key factor to supporting healthy salmonid
populations is maintaining a lagoon with sufficient water depth and water quality in the summer and fall seasons. In the case of the San Lorenzo River Lagoon, there are several pressing issues concerning liability and water quality that need to be addressed as soon as possible. With the completion of the State Water Resources Control Board-funded lagoon water quality study by the end of 2002, more information will be available on levels of dissolved oxygen, temperature, pH, and salinity under open and closed lagoon conditions. Potential risks of eutrophication and anoxic events that may lead to fish kills
Swanson Hydrology & Geomorphology Lower San Lorenzo River & Lagoon Management Plan
Page vi
Hydrology / Geomorphology / Restoration / Water Resources / Construction Planning & Supervision
need to be evaluated prior to making management decisions regarding lagoon closures. As these studies and decisions are being developed, the City should pursue State legislation to address the liability issues of lagoon level management procedures.
3. Stream flow – One obvious critical factor in salmonid survival is the amount of
water present in the river. Due to water diversions, this becomes a concern particularly during drought years when flow has reached as low as 0.01 cubic feet per second (cfs). The Management Plan recommends a minimum flow requirement of 6.5 cfs beyond the Tait Street water diversion be maintained with negotiations with all appropriated users in the watershed necessary to achieve such a level of streamflow. Consideration of alternative sources of water such as reclaimed wastewater if water quality standards are acceptable should also be examined. A protocol should be developed to adaptively manage the low flow channels based on May projections of late summer and fall stream flows (see Appendix B). When there is sufficient projected stream flow, the multiple naturally braided channels should be maintained in order to provide the maximum extent of habitat. However, if low flow conditions are predicted, then a multidisciplinary team that includes staff from the City, the California Department of Fish and Game, and the National Marine Fisheries Service may decide to concentrate the flow into one channel so that there is sufficient water depth and flow to support the fishery.
4. Vegetation Management – A hydraulic analysis performed by Philip Williams
& Associates found that the current amount of vegetation (as surveyed in 2000) upstream of the pedestrian bridge is consistent with the Corps of Engineers original design assumptions to provide for 100-year flow capacity as long as vegetation maintenance prescriptions are followed annually. Therefore, as long as overall density does not increase in this stretch to change predicted Manning’s “n” roughness values, the vegetation can be managed for additional species diversity and native plant composition. Downstream of the pedestrian bridge, particularly in the Estuarine Reach, there are many opportunities for increasing riparian vegetation without impacting flood capacity. Given the successful plant recolonization that has occurred naturally in the upper reaches, initial focus should be on controlling invasive non-natives and encouraging diversity, followed by a more active program of revegetation if necessary. The Management Plan provides detailed management and restoration guidelines for revegetation.
5. Riverbank Shoreline and Streambed Habitat Restoration Projects – A
limiting factor identified for salmonids is the lack of habitat diversity along the riverbank shoreline and in the streambed. The proposed restoration enhancements are designed to improve existing natural geomorphic processes of scour and sediment deposition. They will aid in diversifying small-scale hydraulic conditions that have already proven successful through vegetation management and will provide additional habitat elements including deeper pools and cover areas for fish to hide under.
Swanson Hydrology & Geomorphology Lower San Lorenzo River & Lagoon Management Plan
Page vii
Hydrology / Geomorphology / Restoration / Water Resources / Construction Planning & Supervision
Log and boulder structures both instream and on the inside toe of the levee would increase habitat diversity and escape cover and assist with plant colonization. They would be designed so that the boulder segments would likely sink into the sandy bed during flood events while the cabled logs would remain buoyant and align in the direction of the flow.
Cobble and cattail bulrush structures also provide for scouring holes in the riverbed, are hosts for primary productivity (i.e. organic carbon input, insect growth and aquatic macro invertebrates), and offer escape cover for fish. They are neutral in terms of impact on flood capacity since they would be flattened or uprooted during a flood event.
The Implementation Schedule (see Chapter 5) calls for an initial pilot project of a number of these structures to test for effectiveness and impacts on flood capacity. If successful, more can be added in future phases.
6. Monitoring – Despite the recommendations in the 1989 Enhancement Plan,
there has never been any consistent monitoring to determine the effect of management and restoration actions. This information is critical in terms of making future decisions. The monitoring plan is provided in Chapter 6 and is designed to measure how effectively the restoration goals and objectives are being met, as well as the overall health of the ecosystem. The monitoring plan provides for both implementation and effectiveness monitoring. This is necessary for all habitat restoration efforts as well as management actions and will require dedicated funding annually. A technical advisory committee should be formed within the first year to develop a comprehensive monitoring program.
7. Special Planning Areas – Completing enhancement projects within confining
levees has limitations where the available width is less than that required to sustain a channel and adjacent flood plain surfaces. The greatest opportunity to expand habitat acreage and restore geomorphic and hydrologic function important to a self-sustaining ecosystem along the San Lorenzo River is to set levees back and restore low floodplain surfaces. This would develop the proper hydrology, flood inundation frequency, scour and fine mineral soil deposition to promote native vegetation and primary biological productivity.
A reconnaissance assessment determined that two locations, the Seaside Company/Santa Cruz Boardwalk Third Street Parking Lot and the San Lorenzo Park between the Branciforte Creek confluence and Water Street, should be investigated as special planning areas to weigh the benefits of habitat restoration against the loss of their current uses. The area on the north bank of the river between Riverside Avenue and the Broadway/Laurel Bridges was also assessed but the restoration benefits were limited compared to the overall cost.

Swanson Hydrology & Geomorphology Lower San Lorenzo River & Lagoon Management Plan
Page 1-1
Hydrology / Geomorphology / Restoration / Water Resources / Construction Planning & Supervision
1.0 PROJECT SETTING AND PLAN PURPOSE
1.1 HISTORICAL CONTEXT
It is important to place present environmental conditions into the context of land use history to gain the perspective required for restoring the natural processes that create and sustain habitat. Fortunately, records for the Lower San Lorenzo River in Santa Cruz are available and insightful.
Early History Like a majority of rivers throughout California, the San Lorenzo River has experienced remarkable changes since European settlement beginning in the early 1800’s (Figure 1). The early history of European-style land use involved the establishment of the City and the gradual encroachment on the active channel area with fill and structures beginning in the 1840s. Early maps show that the width of original riverbed and flood plain extended from the present site of the Post Office on Front Street across to the site of the Santa Cruz County Government Center. An 1853 map of Santa Cruz shows a mosaic of active riverbed, forested floodplain, marsh and intertidal mudflat (Figure 2). The entire area now known as the City of Santa Cruz is located in the historic floodplain shaped by the River over tens of thousands of years.
Urban Development and Levees Urban development from the late 1800s to 1955 involved additional filling and development, which further narrowed the riverbed. Severe flooding in 1938, 1941 and 1955 caused damage to many properties (Figure 3). The 1955 flood prompted the City to implement a U.S. Army Corps of Engineers (Corps) flood control project utilizing levees. The project included construction of levees (completed in 1960), straightening and dredging the river channel and elimination of the riparian corridor (Figure 4). The lagoon and estuary were narrowed considerably by the levee project and a large island was eliminated. A 1968 photo taken near the Santa Cruz County Building shows an absolutely clear riverbed with a flat braided channel (Figure 5).
Dredging for Flood Control In the 1970s and 1980s, the riverbed was kept clear and a "fish pilot channel" was dredged along the east side of the river (Figure 6 and 7). During this time the Corps of Engineers and the City were embroiled in a dispute over dredging the riverbed of approximately 1.0 million yards of sand that had filled the flood channel. The discord continued until 1982 when the river conveyed more flow than had been calculated due to bed scour during peak flow. This new understanding of scour capacity caused a shift in focus away from dredging and directed new flood control infrastructure efforts to replace flood-constricting bridges and to increase levee heights.
1989 San Lorenzo River Enhancement Plan During the late 1980s two citizens' advisory committees were established by the Santa Cruz City Council; the San Lorenzo River Task Force and the San Lorenzo River Restoration


Swanson Hydrology & Geomorphology Lower San Lorenzo River & Lagoon Management Plan
Page 1-5
Hydrology / Geomorphology / Restoration / Water Resources / Construction Planning & Supervision
Committee. The committees began to address habitat conditions in the river and their work resulted in the development of the San Lorenzo River Design Plan (1987) and the San Lorenzo River Enhancement Plan (1989) (Figure 8). The 1989 San Lorenzo River Enhancement Plan laid the groundwork for the management and habitat enhancement of the San Lorenzo River from 1989 to 2000. The plan was developed in response to the revised Corps plan to abandon maintenance dredging, improve flood capacity by raising levees, and, in acknowledgment of the expanded capacity provided by channel bed scour that was demonstrated during the January 1982 flood. The 1989 Enhancement Plan included an engineering hydraulic modeling study of vegetation density to assess the effect of vegetation on channel flood control capacity. With this tool, the Corps and City were able to reach an agreement to allow some vegetation to remain in the channel. This work was done before replacement of the Riverside Avenue, Water Street, Soquel Avenue and Laurel Street bridges and prior to the present levee-raising project. These important changes have increased flood capacity. However, the capacity is also dependent upon scour depth and the density and hydraulic resistance of vegetation in the channel. The 1989 plan also developed recommendations for riparian vegetation restoration along the outer levee banks, lagoon management for enhanced fisheries habitat, and operations and maintenance refinements for vegetation and sediment management within the flood control channel. The plan included recommendations for a monitoring plan to assess the effectiveness of proposed restoration and management activities. The monitoring plan for the 1989 Enhancement Plan was not implemented. Operations and maintenance refinements for vegetation and sediment management have been implemented irregularly due to funding and staffing constraints. Finally, the 1989 plan included recommendations for habitat improvements to Jessie Street Marsh. Jessie Street Marsh improvements have been addressed through the development of the Jessie Street Marsh Enhancement Plan adopted in 1998. Restoration of the marsh will occur in 2002-2003 and will include restoration of brackish and freshwater marsh areas, tidal interchange with the river, and public access and interpretive facilities. The lagoon management component of the 1989 San Lorenzo River Enhancement Plan called for controlling water levels in the lagoon without sandbar breaching, a practice found harmful to salmonids (Figure 9). Flooding problems occurred regularly during the summer seasons when the sandbar closed and the water level in the river through town increased. Storm drains flooded onto the streets in the lower Ocean Street neighborhood and basements in the downtown area flooded. Research found that low lagoon levels do not necessarily harm habitat conditions, but breaching degrades the water quality of the lagoon by re-introducing saltwater during normally freshwater periods. A water level control structure was proposed, but was determined to be infeasible due to liability concerns. The summer flooding problems were solved by installation of new storm drains and abandonment of basements in downtown buildings after the 1989 Loma Prieta earthquake. The lagoon has remained as a natural system since sandbar breaching was halted in 1995 when regulatory permits expired. The City of Santa Cruz has done no formal management of the lagoon since the expiration of permits due to public safety liability issues and natural resource management concerns.
Swanson Hydrology & Geomorphology Lower San Lorenzo River & Lagoon Management Plan
Page 1-6
Hydrology / Geomorphology / Restoration / Water Resources / Construction Planning & Supervision
1989 Loma Prieta Earthquake The 1990s era was preceded by the Loma Prieta Earthquake (October 1989), which damaged the Riverside Avenue Bridge beyond repair and initiated its replacement. Between 1994 and 1999 three other bridges, Soquel Avenue, Water Street and Laurel / Broadway, were replaced or modified to improve flood passage and seismic safety. Other changes stemming from the earthquake included filling basements that had flooded in the summer months for seismic stability and completion of the Lower Ocean Street / Barson Street Storm Drain project in 1999. Parts of the levee were damaged and replaced, especially in the lagoon area, and new riprap slopes destroyed what little vegetation had developed. The lagoon remains largely barren in a normally rich ecological zone (Figure 10). The current lagoon habitat quality is probably well below its potential.
Endangered Species Listings for Coho Salmon and Steelhead Trout: 1996 and 1997 The San Lorenzo River has historically supported populations of the steelhead trout (Oncorynchus mykiss) and coho salmon (Oncorhynchus kisutch). The National Marine Fisheries Service (NMFS) completed a status review of West Coast steelhead populations under the Endangered Species Act and adopted a Final Rule designating steelhead trout in the Central California Coast Evolutionary Significant Unit as a Federally threatened species effective October 17, 1997. Species identified as “threatened” are likely to become endangered within the foreseeable future throughout all or a significant portion of its range (Busby et al, 1996; National Marine Fisheries Service, 1997). The designation applies only to naturally spawned populations of anadromous forms of O. mykiss residing below long-term naturally occurring or man-made impassable barriers. The San Lorenzo River is included in critical habitat designated under the federal listing for all accessible reaches excluding reaches above Newell Dam (Loch Lomond). Critical habitat is defined as habitat key to the survival of threatened and endangered species. These areas may require special management considerations or protection (Busby et al, 1996; National Marine Fisheries Service, 1997). Steelhead south of San Francisco Bay are listed as a threatened species by the State of California under the California Endangered Species Act. The San Lorenzo River supported coho salmon in relatively small numbers until the drought of 1987-92. Although coho salmon historically inhabited most coastal streams in San Mateo and Santa Cruz counties, presently they are only found south of San Francisco Bay in Waddell and Scott Creek. Coho salmon in the Central California Coast Evolutionary Significant Unit are protected under the Federal Endangered Species Act as a threatened species effective December 2, 1996. Accessible reaches of the San Lorenzo River are included within the critical habitat designation for Central California Coast coho salmon. Coho salmon south of San Francisco Bay are also listed as an endangered species by the State of California under the California Endangered Species Act.
Riparian and Aquatic Habitat - Present Conditions and Opportunities There were several successes associated with the 1989 San Lorenzo River Enhancement Plan. The plan improved the management of vegetation in the river by allowing increased riparian habitat on the riverbed and on the levees. With the notable exception of the lagoon area below Riverside Avenue, riparian habitat in the lower San Lorenzo has improved
Swanson Hydrology & Geomorphology Lower San Lorenzo River & Lagoon Management Plan
Page 1-8
Hydrology / Geomorphology / Restoration / Water Resources / Construction Planning & Supervision
markedly. Since 1990, extensive stands of native riparian vegetation have colonized the bed and banks of the river and have led to improved channel and substrate conditions for aquatic habitat. Development of undercut banks, waterside vegetation and instream cover have improved aquatic habitat quality. The presence of coarse substrate (gravel and cobble sizes), pools and riffles indicates the potential for improving aquatic macroinvertebrate productivity and increasing aquatic habitat diversity. This response indicates that more habitat will be created in the future by simply allowing natural geomorphic processes to take place with minimal intervention. Certain reaches, however, such as the banks along the lagoon below Riverside Avenue and the lagoon mouth, require more direct intervention to promote native vegetation, habitat development and natural lagoon processes.
1999 – 2003 Levee Raising Project In 1994 the U.S. Army Corps of Engineers approved plans for the San Lorenzo River Flood Control and Environmental Restoration Project. The plans called for raising the levee height, replacing storm drains, and revegetating the outer levee slopes with native riparian species. Construction on the project began in 1999 and is projected for completion by 2003. Upon completion of the project, the City of Santa Cruz will be required to obtain flood certification from the Federal Emergency Management Agency (FEMA) that the levees will hold a 100-year flood as defined by FEMA. A flood control management manual will detail the management activities necessary to maintain the integrity and function of the flood control channel once completed by the Corps. Once FEMA certification is obtained, flood insurance requirements for neighboring properties will be removed. A final component of this project is a stream bank erosion project along Laurel Street Extension and Third Street. With the realignment of the River as it flows east below the Laurel Street Bridge, the southern riverbank along Laurel Street Extension and Third Street has suffered severe erosion and portions of the bank have collapsed in this area. To prevent further erosion and street collapse, a sculptured tieback bank face and riverbank riparian plantings are proposed for approximately 900 feet of this riverbank.
1.2 PROJECT NEED
With the completion of the San Lorenzo River Flood Control and Environmental Restoration Project there are opportunities to improve riparian and aquatic habitat in the lower San Lorenzo River within the constraints of ensuring flood protection. The 1989 Enhancement Plan does not incorporate the recent and ongoing changes in infrastructure and improvements in flood capacity resulting from the San Lorenzo River Flood Control and Environmental Restoration Project. Further, the presence of the threatened steelhead trout and coho salmon in the lower San Lorenzo River necessitate a more specific approach to managing and enhancing the river environment to maintain habitat conditions for these species. Current conditions therefore necessitate an update to the 1989 San Lorenzo River Enhancement Plan. The update must address current channel conditions and opportunities for habitat enhancement through management and active restoration. The plan must also identify important limiting factors to maintaining habitat for steelhead trout and coho salmon and other species inhabiting the river corridor. Finally the plan should identify the need for

Swanson Hydrology & Geomorphology Lower San Lorenzo River & Lagoon Management Plan
Page 1-9
Hydrology / Geomorphology / Restoration / Water Resources / Construction Planning & Supervision
studies which could provide additional scientific data for better management of the river corridor.
1.3 PLAN PURPOSE AND GOALS
Plan Purpose The Lower San Lorenzo River and Lagoon Management Plan (Management Plan) is designed to update the original 1989 Enhancement Plan through a process of conducting new biologic, geomorphic and hydrologic data collection; interpretation of habitat sustaining processes and development of recommendations that will improve the physical conditions to sustain a healthy and diverse ecosystem. The plan is based on a multi-species approach to habitat enhancement and identifies the primary physical, chemical and biological processes necessary to build a framework to support a more developed biological web. Establishing appropriate habitat conditions that can adapt to the dynamic nature of the San Lorenzo River is a vital element in the success of ecosystem restoration. The plan’s thesis is that by restoring stream channel and riparian function, multiple species will benefit. The Management Plan was developed by studying current and past geomorphic conditions, existing vegetation types, and existing fisheries habitat conditions. Current species presence/absence information was also collected. Reference areas were examined to obtain relevant information on vegetation patterns. A hydraulic analysis was performed to identify vegetation densities allowable under existing flood control infrastructure and critical levels to be maintained to ensure flood protection. Identification of limiting factors to successful recovery of threatened species was conducted through new hydrologic data and analysis. Finally, analysis of potential areas to increase floodplain habitat were identified. The following section on methods describes each of these tasks in more detail. The plan was developed by Swanson Hydrology & Geomorphology and the City of Santa Cruz staff. The plan was reviewed and approved by the San Lorenzo Urban River Plan Task Force and appropriate agencies.
Plan Purpose Statement The Management Plan provides for the enhancement and management of the lower San Lorenzo River as a functioning riparian corridor to increase abundance and diversity of all native species with added focus on anadromous fish (steelhead and coho salmon) and other special status species.
Plan Goals 1. Provide environmental management and enhancement prescriptions for the
restoration of the Lower San Lorenzo River and Lagoon for anadromous fish and terrestrial species.
2. Maintain adequate flood capacity in the Lower San Lorenzo River to convey a
100-year flow event. 3. Provide for the adaptive management of aquatic and terrestrial resources.
Swanson Hydrology & Geomorphology Lower San Lorenzo River & Lagoon Management Plan
Page 1-10
Hydrology / Geomorphology / Restoration / Water Resources / Construction Planning & Supervision
4. Identify opportunities to widen the river and expand habitat into a larger
floodplain consistent with an urban setting. 5. Develop a monitoring program for evaluation of success and continued adaptive
management.
Plan Timeline and Implementation The Management Plan provides management and enhancement recommendations for the Lower San Lorenzo River and Lagoon for a 15-year implementation period beginning in 2002. Implementation of plan components will necessitate coordination among several City departments including Public Works, Parks and Recreation, and Water. Overall management and implementation of plan elements will be facilitated through the City Manager’s office. A permanent River Commission will be explored by the Santa Cruz City Council in early 2002. This commission would be charged with monitoring plan implementation as well as other aspects of river management.
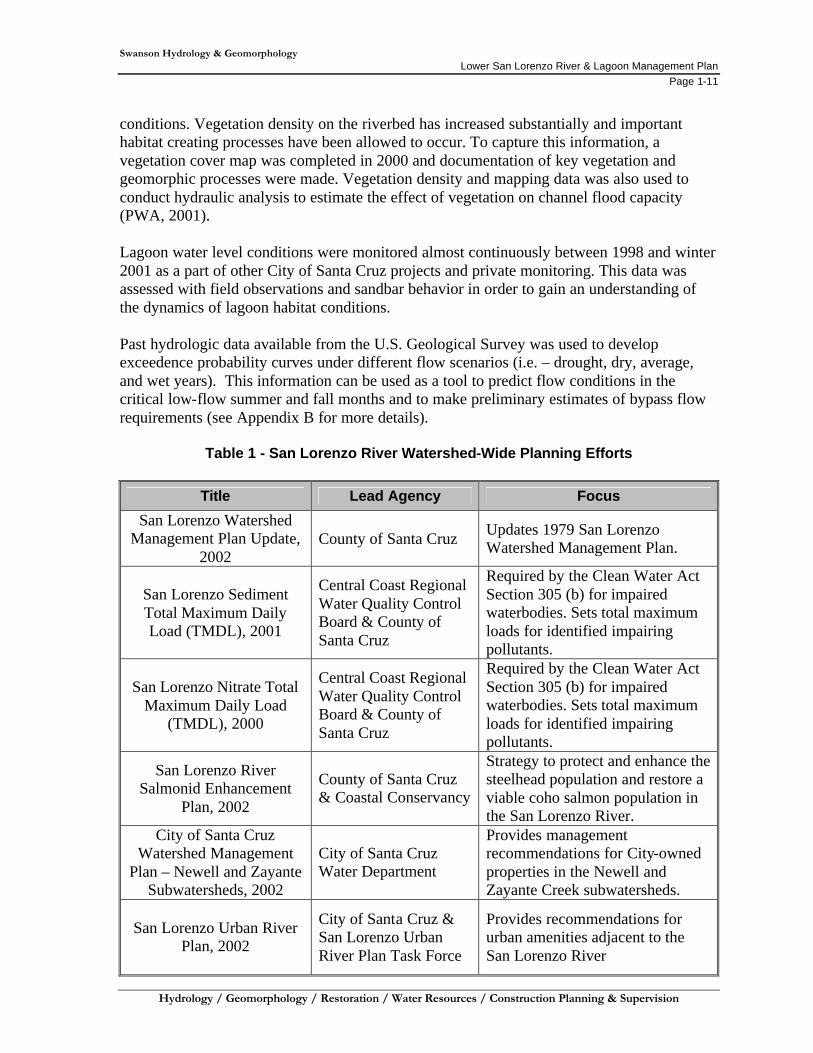
Relationship to Watershed-Wide Planning Efforts The City of Santa Cruz is developing the Management Plan under the guidance of the San Lorenzo Urban River Plan Task Force, appointed by the City Council and charged with updating the 1989 San Lorenzo River Enhancement Plan. It is the desire of the San Lorenzo Urban River Plan Task Force to develop a management plan which is reflective of current regional planning efforts and activities of the County of Santa Cruz and other state and federal agencies and to ensure that recommendations are consistent with federal, state and local environmental regulations. This integrated approach will be reflected in planning documents such as the San Lorenzo River Salmonid Enhancement Plan and the San Lorenzo Watershed Plan Update being prepared by the County of Santa Cruz. The City of Santa Cruz will also integrate findings of the Lower San Lorenzo River and Lagoon Management Plan into a City-wide Habitat Conservation Plan to be prepared according to the requirements of the Federal Endangered Species Act. The Management Plan is being developed in cooperation with watershed-wide efforts of the County of Santa Cruz and other agencies (Table 1). The commonality among all the planning efforts is the emphasis on improving habitat for endangered species such as steelhead trout. Concurrent with this goal is the desire to improve water quality and quantity, reduce sedimentation and improve riparian habitat.
1.4 METHODS
Original data collection and analysis for geomorphic, hydrologic, and biologic conditions within the river corridor was conducted in summer and fall 2000 and 2001 for the development of this report. The results from the studies are described in Section 2.0 Existing Conditions.
Geomorphologic and Hydrologic Conditions The hydraulic and geomorphic conditions in the lower San Lorenzo River were assessed through examination of topographic data, recent hydraulic modeling and observation of field
Swanson Hydrology & Geomorphology Lower San Lorenzo River & Lagoon Management Plan
Page 1-11
Hydrology / Geomorphology / Restoration / Water Resources / Construction Planning & Supervision
conditions. Vegetation density on the riverbed has increased substantially and important habitat creating processes have been allowed to occur. To capture this information, a vegetation cover map was completed in 2000 and documentation of key vegetation and geomorphic processes were made. Vegetation density and mapping data was also used to conduct hydraulic analysis to estimate the effect of vegetation on channel flood capacity (PWA, 2001). Lagoon water level conditions were monitored almost continuously between 1998 and winter 2001 as a part of other City of Santa Cruz projects and private monitoring. This data was assessed with field observations and sandbar behavior in order to gain an understanding of the dynamics of lagoon habitat conditions. Past hydrologic data available from the U.S. Geological Survey was used to develop exceedence probability curves under different flow scenarios (i.e. – drought, dry, average, and wet years). This information can be used as a tool to predict flow conditions in the critical low-flow summer and fall months and to make preliminary estimates of bypass flow requirements (see Appendix B for more details).
Table 1 - San Lorenzo River Watershed-Wide Planning Efforts
Title Lead Agency Focus
San Lorenzo Watershed Management Plan Update,
2002 County of Santa Cruz Updates 1979 San Lorenzo
Watershed Management Plan.
San Lorenzo Sediment Total Maximum Daily Load (TMDL), 2001
Central Coast Regional Water Quality Control Board & County of Santa Cruz
Required by the Clean Water Act Section 305 (b) for impaired waterbodies. Sets total maximum loads for identified impairing pollutants.
San Lorenzo Nitrate Total Maximum Daily Load
(TMDL), 2000
Central Coast Regional Water Quality Control Board & County of Santa Cruz
Required by the Clean Water Act Section 305 (b) for impaired waterbodies. Sets total maximum loads for identified impairing pollutants.
San Lorenzo River Salmonid Enhancement
Plan, 2002
County of Santa Cruz & Coastal Conservancy
Strategy to protect and enhance the steelhead population and restore a viable coho salmon population in the San Lorenzo River.
City of Santa Cruz Watershed Management
Plan – Newell and Zayante Subwatersheds, 2002
City of Santa Cruz Water Department
Provides management recommendations for City-owned properties in the Newell and Zayante Creek subwatersheds.
San Lorenzo Urban River Plan, 2002
City of Santa Cruz & San Lorenzo Urban River Plan Task Force
Provides recommendations for urban amenities adjacent to the San Lorenzo River

Swanson Hydrology & Geomorphology Lower San Lorenzo River & Lagoon Management Plan
Page 1-12
Hydrology / Geomorphology / Restoration / Water Resources / Construction Planning & Supervision
Title Lead Agency Focus
City-Wide Creeks and Wetlands Master Plan
City of Santa Cruz Planning Department
Provides development regulations for creekside properties within the City of Santa Cruz
Branciforte Creek Flood Conveyance and Fish
Habitat Assessment, 2001
City of Santa Cruz & Coastal Conservancy
Assesses flood issues and fisheries restoration on Branciforte Creek.
Drinking Water Quality Protection, 2003
County of Santa Cruz & U.S. Environmental Protection Agency
Focuses on pathogens and turbidity impacts to drinking water.
A coarse water budget model was also developed for the lagoon to estimate the amount of time that would be required to fill the lagoon with freshwater under different flow conditions. These estimates are crucial in understanding the link between streamflow, timing of lagoon closure, late summer breaching events and overall lagoon water quality (see Appendix B for more details).
Plant Community Mapping Mapping of plant communities, sandbars, artificial bank stabilization (i.e. riprap), and open water areas occurring within the urban portion of the San Lorenzo River riparian corridor was conducted in Fall 2000 by Native Vegetation Network with support from Swanson Hydrology & Geomorphology. The locations of the plant communities and other ground features were mapped onto a 1999 aerial photograph (scale 1 inch = 75 feet; photo base from digital orthophoto). Each mapped unit/polygon was assigned a unique polygon number, and had the following information recorded on a field data sheet: overstory plant community, understory plant community, and the three most common plant species present in the overstory and/or understory, as applicable. To facilitate recording the data, codes were entered for the plant communities, plant species, and ground features observed. Data was entered and analyzed for a total of 105 different mapped units. The mapped information was digitized and entered into a geographic information system (GIS), enabling the determination of areas for each plant community type or ground feature and the mapping these areas. An effort was made to identify plant communities and habitats from appropriate reference sites on less disturbed and urbanized lagoon systems on the Central Coast. This included topographic surveys of the elevation range of individual plant species occurrence in the Lower San Lorenzo River Estuary Reach and Lower Scott Creek, a stream located 10 miles north of Santa Cruz (see Appendix C for results).
Fisheries Assessment The initial assessment of fisheries in the Lower River included habitat typing and population sampling in the Riverine Reach between Water Street and Highway 1. Initial habitat typing indicated that the bifurcated channel occurring in this reach was an important feature for fisheries habitat that needed to be documented and compared to a similar reach that lacked this characteristic. Based on the initial assessment, habitat and population surveys were continued upstream of Highway 1 to the vicinity of Paradise Park. The habitat and population surveys were completed by D.W. Alley and Associates using standard sampling
Swanson Hydrology & Geomorphology Lower San Lorenzo River & Lagoon Management Plan
Page 1-13
Hydrology / Geomorphology / Restoration / Water Resources / Construction Planning & Supervision
techniques described in the California Salmonid Stream Habitat Restoration Manual (Flosi et. al., 1998). Visual observations were also made with regards to habitat conditions, fish presence, and fish behavior from April to August of 2001.
Integrated Habitat Analysis The river corridor was divided into three segments based upon similar geomorphic and hydrologic conditions and habitat types. Within each reach, vegetative and wildlife habitat were assessed in light of the hydraulic assessment of flood capacity. Conditions unfavorable to habitat development were identified and ranked according to severity. Enhancement actions were then identified to improve native vegetation and habitat within the constraints of maintaining flood control capacity.
Swanson Hydrology & Geomorphology Lower San Lorenzo River & Lagoon Management Plan
Page 2-1
Hydrology / Geomorphology / Restoration / Water Resources / Construction Planning & Supervision
2.0 LOWER RIVER & LAGOON EXISTING CONDITIONS
2.1 PROJECT AREA
The San Lorenzo River drains an approximately 137 square mile watershed of forested, as well as urbanized areas on the Central Coast of California. The River drains to the Pacific Ocean at the north end of the Monterey Bay. The City of Santa Cruz is located adjacent to the lower 3 miles of the River and encompasses much of the River’s historic floodplain. The City limits within the area of the River extend to Sycamore Grove and Pogonip on the west side of the River along Highway 9 and to the lower 1 mile of Graham Hill Road on the east side of the River. The County of Santa Cruz has jurisdictional authority of the area of the watershed outside of the City limits.
2.2 HYDROLOGIC OVERVIEW
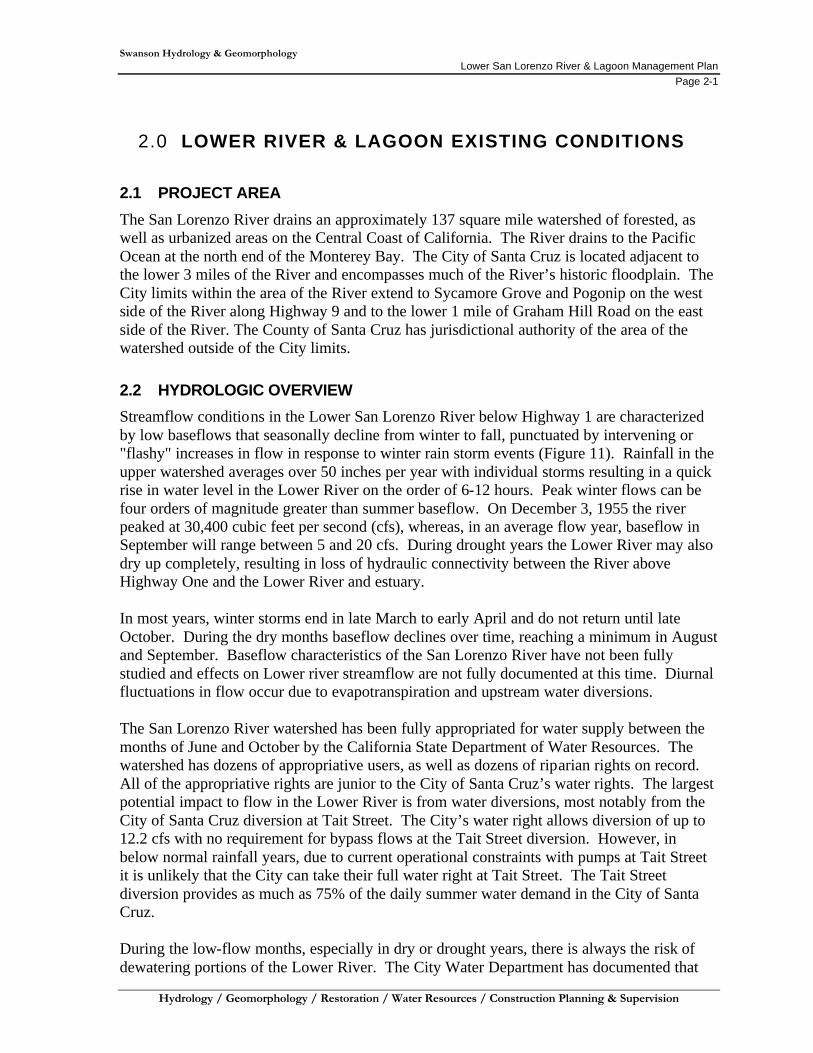
Streamflow conditions in the Lower San Lorenzo River below Highway 1 are characterized by low baseflows that seasonally decline from winter to fall, punctuated by intervening or "flashy" increases in flow in response to winter rain storm events (Figure 11). Rainfall in the upper watershed averages over 50 inches per year with individual storms resulting in a quick rise in water level in the Lower River on the order of 6-12 hours. Peak winter flows can be four orders of magnitude greater than summer baseflow. On December 3, 1955 the river peaked at 30,400 cubic feet per second (cfs), whereas, in an average flow year, baseflow in September will range between 5 and 20 cfs. During drought years the Lower River may also dry up completely, resulting in loss of hydraulic connectivity between the River above Highway One and the Lower River and estuary. In most years, winter storms end in late March to early April and do not return until late October. During the dry months baseflow declines over time, reaching a minimum in August and September. Baseflow characteristics of the San Lorenzo River have not been fully studied and effects on Lower river streamflow are not fully documented at this time. Diurnal fluctuations in flow occur due to evapotranspiration and upstream water diversions. The San Lorenzo River watershed has been fully appropriated for water supply between the months of June and October by the California State Department of Water Resources. The watershed has dozens of appropriative users, as well as dozens of riparian rights on record. All of the appropriative rights are junior to the City of Santa Cruz’s water rights. The largest potential impact to flow in the Lower River is from water diversions, most notably from the City of Santa Cruz diversion at Tait Street. The City’s water right allows diversion of up to 12.2 cfs with no requirement for bypass flows at the Tait Street diversion. However, in below normal rainfall years, due to current operational constraints with pumps at Tait Street it is unlikely that the City can take their full water right at Tait Street. The Tait Street diversion provides as much as 75% of the daily summer water demand in the City of Santa Cruz. During the low-flow months, especially in dry or drought years, there is always the risk of dewatering portions of the Lower River. The City Water Department has documented that
Swanson Hydrology and Geomorphology115 Limekiln Street Santa Cruz, CA 95060
tel: 831.427.0288 fax: 831.427.0472
San Lorenzo River at Santa CruzHydrograph of Average Daily Flows (1988-1999)
0
100
200
300
400
500
600
700
800
900
1000
1100
1-Oct 29-Oct 26-Nov 24-Dec 21-Jan 18-Feb 18-Mar 15-Apr 13-May 10-Jun 8-Jul 5-Aug 2-Sep 30-Sep
Ave
rag
e D
aily
Dis
char
ge
- cf
s
Figure 11: Hydrograph for the San Lorenzo River at Santa Cruz (USGS gage #11161000) showing the average daily flow in cubic feet per second (cfs) for the period of record from 1988-1999. Typical daily average flows for the dry season range from 6-10 cfs with most precipitation and runoff occurring between early December and late March.

Swanson Hydrology & Geomorphology Lower San Lorenzo River & Lagoon Management Plan
Page 2-3
Hydrology / Geomorphology / Restoration / Water Resources / Construction Planning & Supervision
flows in the Lower River have progressively declined over the years. USGS gauges indicate 1977 flows (the lowest rainfall year in recorded history) at the San Lorenzo River gauge at Felton were no lower than 1988 flows (categorized as only a below-average rainfall year). Currently, efforts are made by the City to maintain reasonable bypasses to the Lower River at Tait Street. This unwritten policy has been helped by above average winters in the mid and late-1990’s that have kept baseflows relatively high. The City of Santa Cruz Water Department is required to provide bypass flows at Loch Lomond and the Felton Diversion but not at Tait Street. It would be difficult for the City to maintain bypass flows in years of drought as demand for residential water supplies increase in late summer. Moreover, with modest system growth through 2020, unless current supplies are augmented, the City will be unable to meet average annual demands in normal rainfall years. The City of Santa Cruz Water Department recognizes that existing water supplies are inadequate to meet the health and safety needs of its current users in drought conditions.
2.3 GEOLOGIC OVERVIEW
The project area is located at the terminus of the San Lorenzo River on the southwestern side of the Santa Cruz Mountains. The lower 3 miles of the River comprise the watershed’s floodplain and is characterized by alluvial soils. The potential for seismic activity in the area is high due to nearby active faults (San Andreas) and the liquefaction potential of soils. Slope instability and erosion potential are low in the study area due to the urbanized nature of the surrounding land areas.
2.4 ECOLOGICAL RESOURCES
The Lower San Lorenzo River and Lagoon supports many important aquatic, avian and terrestrial species. Management for the enhancement of habitat for these species is a critical focus of the plan (Appendix A). Special status aquatic species which are known to occur in the lower San Lorenzo River include steelhead trout, coho salmon (now thought to be extirpated from the watershed), threespine stickleback (Gasterosteus aculeatus williamsoni), and southwestern pond turtle (Clemmys marmorata pallida). Avian species of special concern according to the California Department of Fish and game and Point Reyes Bird Observatory include Swainson’s Thrush (Catharus ustulatus), Warbling Vireo (Vireo gilvus), Black-headed Grosbeak (Pheuticus melanocephalus), Common Yellowthroat (Geothlypis trichas), Song Sparrow (Melosiza melodia), Wilson’s Warbler (Wilsonia pusilla), Yellow Warbler (Dendroica petechia), Peregrine Falcon (Falco peregrinus anatum), and Brown Pelican (Pelecanus occidentalis) (Scoggin, 2001). These species represent seven of the 14 focal species identified by the California Partners in Flight and Riparian Habitat Joint Venture for the riparian Bird Conservation Plan (CPIF & RHJV, 2000). Focal species are utilized to assess the relative health of a riparian system. Recent surveys for reptile and amphibian species within the river corridor have not been conducted. However, a survey of the Lower San Lorenzo River and Lower Branciforte Creek for California red legged frog (Rana aurora draytonii) conducted in 1997 did not find any present (Mori, 1997).

Swanson Hydrology & Geomorphology Lower San Lorenzo River & Lagoon Management Plan
Page 2-4
Hydrology / Geomorphology / Restoration / Water Resources / Construction Planning & Supervision
The Lower San Lorenzo River has new stands of riparian vegetation and riverbed features and channels formed primarily by natural processes (flood scour, sediment deposition and native vegetation colonization). This indicates that more habitat will be created in the future by simply allowing natural geomorphic processes to take place with minimal intervention. Certain reaches, however, such as the banks along the lagoon below Riverside Avenue and the lagoon mouth, require more direct intervention to promote native vegetation, habitat development and natural lagoon processes.
2.5 FLOOD CONTROL CONSTRAINTS
The San Lorenzo Flood Control Improvement Project is designed to provide 100-year Federal Emergency Management Agency (FEMA) equivalent flood protection for the downtown areas of the City of Santa Cruz designated as floodway or floodplain. Any restoration plans proposed for the lower reach of the river must be compatible with the authorized project purpose of flood control. Proposed restoration work cannot adversely affect the flow conveyance capacity or the flood protection level. Any restoration or management work must also be compatible with maintenance operations and inspections during flood events.
2.6 RIVER REACHES - EXISTING CONDITIONS
For the purposes of planning enhancement features along the lower 2.2 miles of the river, the area was divided into three reaches: Estuarine Reach, Transitional Reach, and Riverine Reach (Figure 12). This demarcation is different than that used in the 1989 Enhancement Plan, where the river was divided into seven reaches with bridges acting as divisions. The new system of division more accurately reflects geomorphic and hydrologic conditions, substrate, periodicity of inundation, salinity influences and resultant vegetation and habitat cover. The new system is consistent with findings of vegetation mapping conducted in the summer of 2000.
2.7 RIVERINE REACH (HIGHWAY 1 TO WATER STREET BRIDGE)
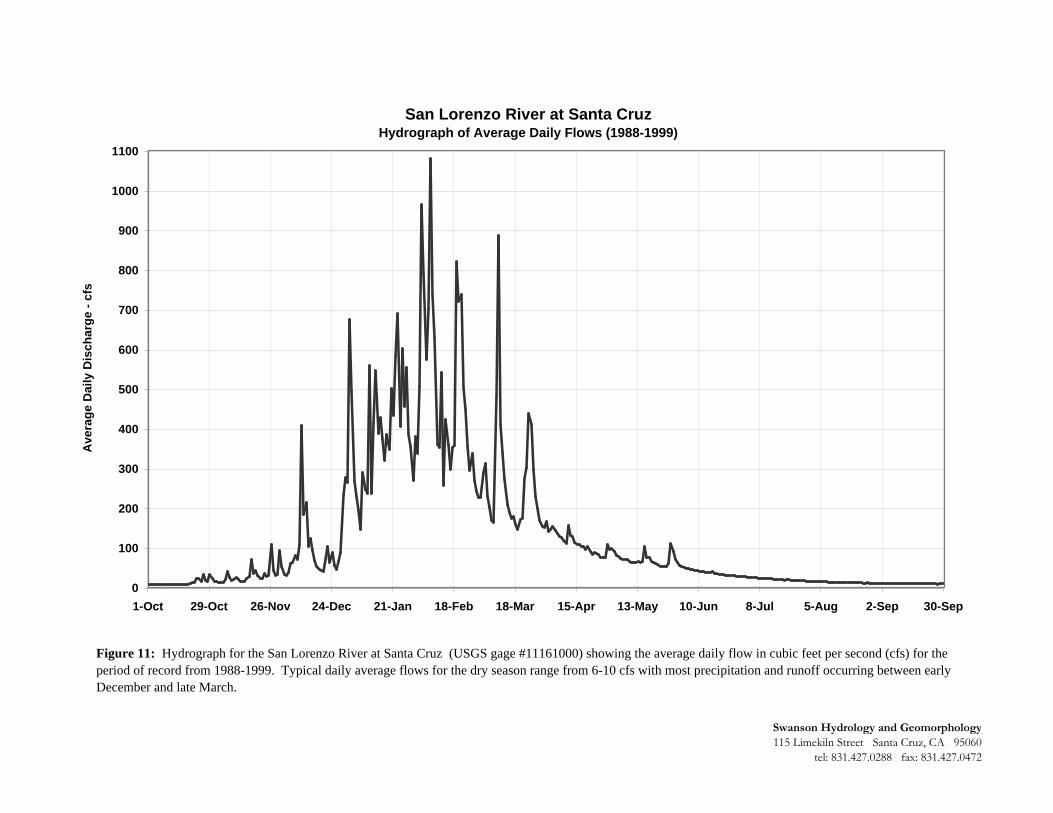
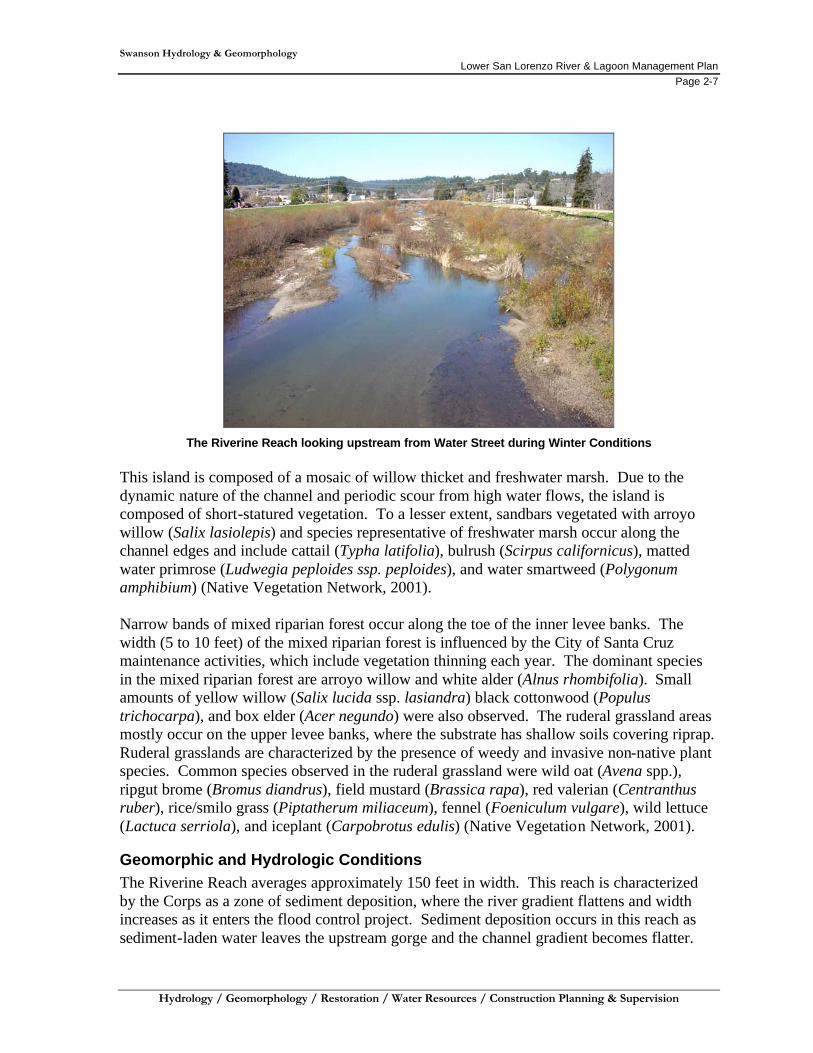
Plant Community Distribution The three most prevalent plant communities in the upstream reach are ruderal grassland, mixed riparian forest, and a mosaic of willow thicket and freshwater marsh, which occurs in the channel bottom (Figure 13). Downstream of Highway 1, the open water splits into two channels, which flow past a central “island”.

Branciforte Creek
Flood Control Channel
Reach DelineationsCity of Santa Cruz, California
San Lorenzo RiverFigure 12
Scale 1:7,200 or 1 inch = 600 feetAerial photo base: Fall 1999
500 0 500 1000 1500 Feet
NLEGENDLEGEND
Swanson Hydrology & Geomorphology 115 Limekiln Street Santa Cruz, CA 95060
San Lorenzo Park
San Lorenzo Park
Beach Boardwalk
Parking Lot
Beach Boardwalk
Parking Lot
Dow
ntown
Dow
ntown
Soquel Ave
Laurel Street
Highway 1
Figure 12
Water Street
Jessie Street Marsh
Jessie Street Marsh
estuarine reachtransitional reach
riverine reach
%U
%U
%U
%U
%U
%U
%U
Water St
River St
Highway 1
Josephine St
Blaine St
Edgewood W
ay
Storm Drain Outfalls%UVegetation Community Type
brackish marsh
cottonwood riparian
fresh marsh
fresh marsh/willow riparian
mixed riparian
mixed riparian/fresh marsh
non-native
open water
ruderal grassland
ruderal scrub
sandbar
sandbar/bulrush
sandbar/willow
urban landscape
willow riparian
willow shrub
willow thicket/fresh marsh
LEGEND
N
Scale 1:3,600 or 1 inch = 300 feetAerial photo base: Fall 1999
200 0 200 Feet
Swanson Hydrology & Geomorphology115 Limekiln Street Santa Cruz, CA 95060
Riverine Reach San Lorenzo RiverSanta Cruz, California
Figure 13Vegetation Communitiy Types
Swanson Hydrology & Geomorphology Lower San Lorenzo River & Lagoon Management Plan
Page 2-7
Hydrology / Geomorphology / Restoration / Water Resources / Construction Planning & Supervision
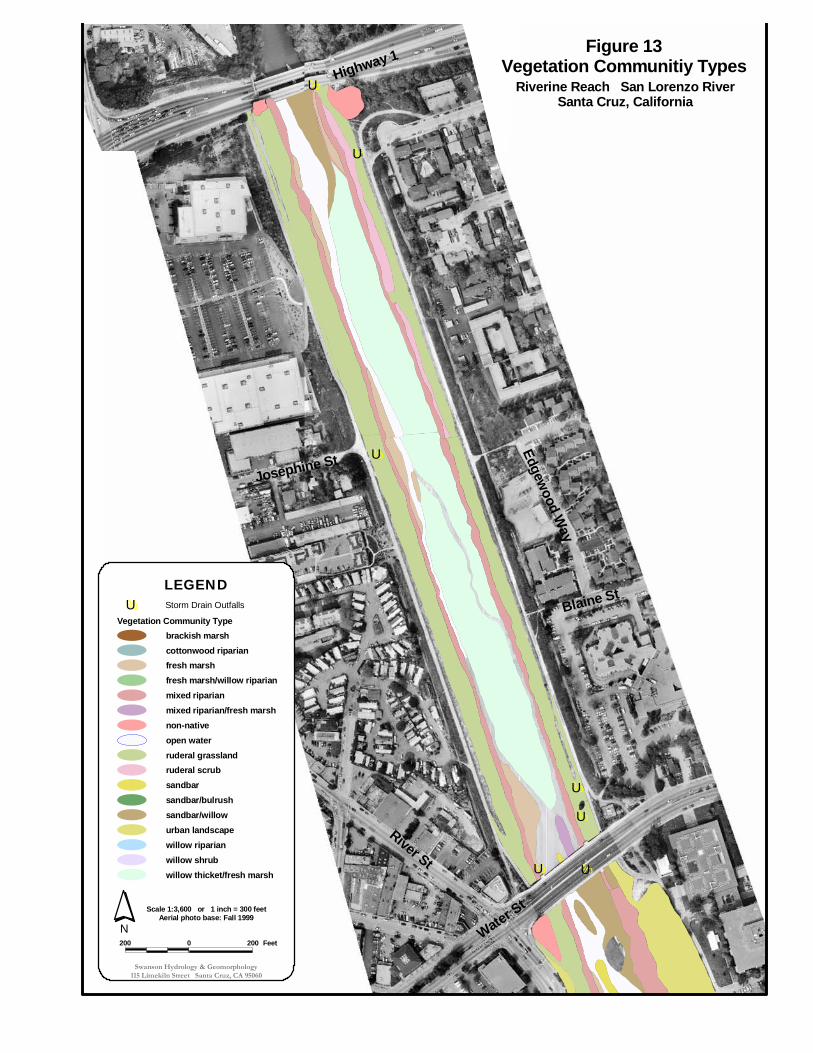
The Riverine Reach looking upstream from Water Street during Winter Conditions
This island is composed of a mosaic of willow thicket and freshwater marsh. Due to the dynamic nature of the channel and periodic scour from high water flows, the island is composed of short-statured vegetation. To a lesser extent, sandbars vegetated with arroyo willow (Salix lasiolepis) and species representative of freshwater marsh occur along the channel edges and include cattail (Typha latifolia), bulrush (Scirpus californicus), matted water primrose (Ludwegia peploides ssp. peploides), and water smartweed (Polygonum amphibium) (Native Vegetation Network, 2001). Narrow bands of mixed riparian forest occur along the toe of the inner levee banks. The width (5 to 10 feet) of the mixed riparian forest is influenced by the City of Santa Cruz maintenance activities, which include vegetation thinning each year. The dominant species in the mixed riparian forest are arroyo willow and white alder (Alnus rhombifolia). Small amounts of yellow willow (Salix lucida ssp. lasiandra) black cottonwood (Populus trichocarpa), and box elder (Acer negundo) were also observed. The ruderal grassland areas mostly occur on the upper levee banks, where the substrate has shallow soils covering riprap. Ruderal grasslands are characterized by the presence of weedy and invasive non-native plant species. Common species observed in the ruderal grassland were wild oat (Avena spp.), ripgut brome (Bromus diandrus), field mustard (Brassica rapa), red valerian (Centranthus ruber), rice/smilo grass (Piptatherum miliaceum), fennel (Foeniculum vulgare), wild lettuce (Lactuca serriola), and iceplant (Carpobrotus edulis) (Native Vegetation Network, 2001).
Geomorphic and Hydrologic Conditions The Riverine Reach averages approximately 150 feet in width. This reach is characterized by the Corps as a zone of sediment deposition, where the river gradient flattens and width increases as it enters the flood control project. Sediment deposition occurs in this reach as sediment-laden water leaves the upstream gorge and the channel gradient becomes flatter.
Swanson Hydrology & Geomorphology Lower San Lorenzo River & Lagoon Management Plan
Page 2-8
Hydrology / Geomorphology / Restoration / Water Resources / Construction Planning & Supervision
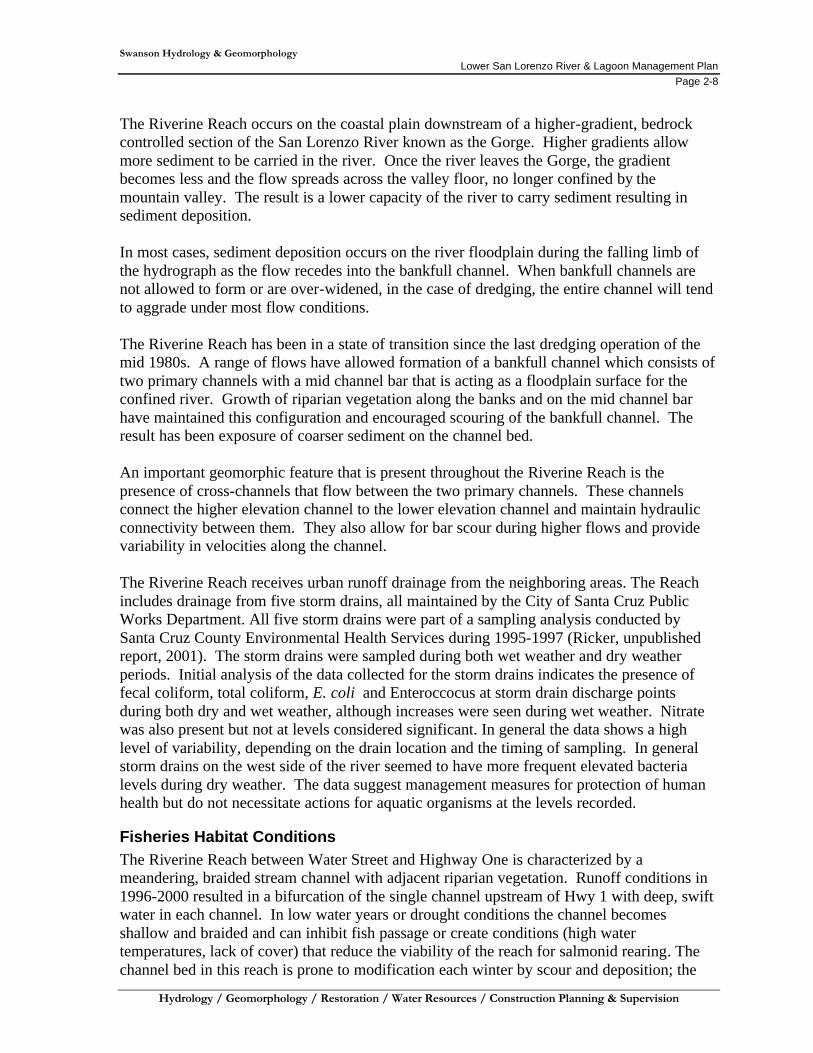
The Riverine Reach occurs on the coastal plain downstream of a higher-gradient, bedrock controlled section of the San Lorenzo River known as the Gorge. Higher gradients allow more sediment to be carried in the river. Once the river leaves the Gorge, the gradient becomes less and the flow spreads across the valley floor, no longer confined by the mountain valley. The result is a lower capacity of the river to carry sediment resulting in sediment deposition. In most cases, sediment deposition occurs on the river floodplain during the falling limb of the hydrograph as the flow recedes into the bankfull channel. When bankfull channels are not allowed to form or are over-widened, in the case of dredging, the entire channel will tend to aggrade under most flow conditions. The Riverine Reach has been in a state of transition since the last dredging operation of the mid 1980s. A range of flows have allowed formation of a bankfull channel which consists of two primary channels with a mid channel bar that is acting as a floodplain surface for the confined river. Growth of riparian vegetation along the banks and on the mid channel bar have maintained this configuration and encouraged scouring of the bankfull channel. The result has been exposure of coarser sediment on the channel bed. An important geomorphic feature that is present throughout the Riverine Reach is the presence of cross-channels that flow between the two primary channels. These channels connect the higher elevation channel to the lower elevation channel and maintain hydraulic connectivity between them. They also allow for bar scour during higher flows and provide variability in velocities along the channel. The Riverine Reach receives urban runoff drainage from the neighboring areas. The Reach includes drainage from five storm drains, all maintained by the City of Santa Cruz Public Works Department. All five storm drains were part of a sampling analysis conducted by Santa Cruz County Environmental Health Services during 1995-1997 (Ricker, unpublished report, 2001). The storm drains were sampled during both wet weather and dry weather periods. Initial analysis of the data collected for the storm drains indicates the presence of fecal coliform, total coliform, E. coli and Enteroccocus at storm drain discharge points during both dry and wet weather, although increases were seen during wet weather. Nitrate was also present but not at levels considered significant. In general the data shows a high level of variability, depending on the drain location and the timing of sampling. In general storm drains on the west side of the river seemed to have more frequent elevated bacteria levels during dry weather. The data suggest management measures for protection of human health but do not necessitate actions for aquatic organisms at the levels recorded.
Fisheries Habitat Conditions The Riverine Reach between Water Street and Highway One is characterized by a meandering, braided stream channel with adjacent riparian vegetation. Runoff conditions in 1996-2000 resulted in a bifurcation of the single channel upstream of Hwy 1 with deep, swift water in each channel. In low water years or drought conditions the channel becomes shallow and braided and can inhibit fish passage or create conditions (high water temperatures, lack of cover) that reduce the viability of the reach for salmonid rearing. The channel bed in this reach is prone to modification each winter by scour and deposition; the

Swanson Hydrology & Geomorphology Lower San Lorenzo River & Lagoon Management Plan
Page 2-9
Hydrology / Geomorphology / Restoration / Water Resources / Construction Planning & Supervision
depth and alignment of the low flow channel and the density and the vegetation cover can change annually. During fisheries surveys conducted in fall 2000 (Alley 2001), the two parallel channels of approximately the same length provided close to 4,000 linear feet of fish habitat. The surveys indicate that the bifurcated channel provides enhanced rearing habitat compared to the reach above Highway 1 where a single, wide channel exists. The bifurcated channel includes significant amounts of escape cover, primarily due to the presence of emergent vegetation along the edges. The reach supports more varied habitat with greater complexity, including more fast riffles, swift runs, and fast water areas at heads of pools. The riparian growth was more continuous and the floating primrose provided additional cover habitat along the length of the split channel. Maintenance of a bifurcated channel is important because it provides more vegetated channel edge which results in more shade and escape cover for fish per unit area of stream channel. For example, if two eight foot wide channels exist compared to one 16 foot wide channel, overhanging vegetation will typically shade a larger percent of the area in the two channel system compared to the one channel system due to the presence of twice the bank length. Therefore, maintenance of split channels during average flow conditions will generally provide more shaded habitat, escape cover, coarser bed substrate and higher flow velocities. Based on fish sampling of selected habitat units, the overall juvenile steelhead densities in the Riverine Reach were estimated at 4.5 fish/100 feet. Extrapolated over the entire reach, the estimated densities are approximately 170 smolt-sized juvenile steelhead (Alley, 2001). Based on the fish monitoring results from the rest of the San Lorenzo River, it is suspected that steelhead densities were especially low in all of the Lower River reaches in Fall 2000 though the cause for this is currently unknown (Alley, 2001). Other fish that were captured during fish sampling include coastrange sculpin (Cottus aleuticus), largemouth bass (Micropterus salmoides), pacific lamprey (Lampetra tridentata), prickly sculpin (Cottus asper), sacramento sucker (Catostomus occidentalis), staghorn sculpin (Leptocottus armatus), starry flounder (Platichthys stellatus) and threespine stickleback (Gasterosteus aculeatus) (Alley 2001). During low flow or drought conditions the river can create a shallow, braided channel. To improve fish passage and provide juvenile steelhead rearing habitat, the City has in the past created a low flow channel from Highway One downstream. This low flow channel is normally created on the east side of the flood control channel (Gilchrist, 2001; see Figure 7). Under normal flow conditions, the benefits gained from diverting all of the flow to a single channel may not be enough to offset the short-term impacts to the aquatic resources in the abandoned channel. Conversely, under dry and drought conditions, habitat conditions may be greatly improved by diverting all of the flow into a single, low-flow channel. To better manage a low-flow channel, an adaptive management strategy was developed as part of this project to determine the timing and flow regime of implementing a single channel flow. The management strategy is based on a hydrologic analysis of past flows at the Tait Street Gage (USGS Gage #11161000, San Lorenzo River at Santa Cruz) and development of exceedence probability values. This information could be used to predict flow conditions for
Swanson Hydrology & Geomorphology Lower San Lorenzo River & Lagoon Management Plan
Page 2-10
Hydrology / Geomorphology / Restoration / Water Resources / Construction Planning & Supervision
late summer and fall months by using equivalent exceedence probabilities and measured flow values from May (see Appendix B for further detail). Based on the results of the flow analysis, active management of the low flow channel (i.e. – diversion into a single low-flow channel) should occur when flows are less than the 70% exceedence value for an average September (approximately 3 cfs). That would translate to a flow of 21 cfs in May. Changes to this strategy would need to be assessed on a yearly basis depending upon the conditions found in the bifurcated channel.
Previous Management Measures Applied to the Riverine Reach This reach has been maintained the most extensively of the three reaches for flood control purposes. Because this section of the flood control channel is known to aggrade sediment, maintenance is necessary within this reach to ensure bed scour during higher flows. According to the 1989 Enhancement Plan this reach was to be managed to allow a 10-foot wide buffer of riparian vegetation along the toe of the levee and a 5-foot wide buffer on either side of the low flow channel. Volunteer alders and willows were to be allowed in groves and individual trees greater than 6 inches diameter at breast height were to be removed. These management prescriptions have been applied to some extent within this reach, however, the width of buffer strips has not been protected and individual groves of trees have not been allowed to develop. Larger trees exceeding the diameter at breast height requirement have been removed. In general the channel in this area is characterized by vegetation of the same height and density with little variability in density and structure. Buffer strips are narrower than the agreed width in the management plan and provide less canopy cover to the low flow channel. The City of Santa Cruz has removed sediment in this reach in accordance with the original 1958 Corps flood control project maintenance agreement up to the mid-1980’s, resulting in removal of approximately 7,500 cubic yards on a biannual basis. Since the mid 1980’s the City has not conducted sediment removal in the channel bed in this reach. The channel bed in this reach also has been plowed to maintain loose sediments that are easily mobilized during heavy flows.
2.8 TRANSITIONAL REACH (WATER STREET BRIDGE TO LAUREL STREET BRIDGE)
Plant Community Distribution The three most prevalent plant communities in the middle reach are urban landscape, ruderal grassland, and mixed riparian forest (Figure 14). The wide east bank and flood plain by San Lorenzo Park supports a more developed stand of mixed riparian forest compared to the upstream reach. Groves of mature black cottonwood trees (60 to 80 feet tall) occur adjacent to the arroyo willow and white alder trees. The willows tend to be distributed at the toe of the bank or channel edge, often in association with small strips of freshwater marsh dominated by bulrush. The urban landscape areas mainly occur at San Lorenzo Park on the east bank and along River Street South on the west bank.

%U
%U
%U
%U
%U
%U
%U
%U
Figure 14 Vegetation Communitiy Types
Transitional Reach San Lorenzo RiverSanta Cruz, California
Swanson Hydrology & Geomorphology115 Limekiln Street Santa Cruz, CA 95060
200 0 200 Feet
Scale 1:3,600 or 1 inch = 300 feetAerial photo base: Fall 1999
N
LEGEND
Vegetation Community Type
brackish marsh
cottonwood riparian
fresh marsh
fresh marsh/willow riparian
mixed riparian
mixed riparian/fresh marsh
non-native
open water
ruderal grassland
ruderal scrub
sandbar
sandbar/bulrush
sandbar/willow
urban landscape
willow riparian
willow shrub
willow thicket/fresh marsh
Broad
way
Soquel Ave
Rive
r St
Water St
Riv
ersi
de A
ve
Front St
Barson St
Dakota A
ve
San Lorenzo Park
San Lorenzo Park
Dow
ntown
Dow
ntown
%U Storm Drain Outfalls
Swanson Hydrology & Geomorphology Lower San Lorenzo River & Lagoon Management Plan
Page 2-12
Hydrology / Geomorphology / Restoration / Water Resources / Construction Planning & Supervision
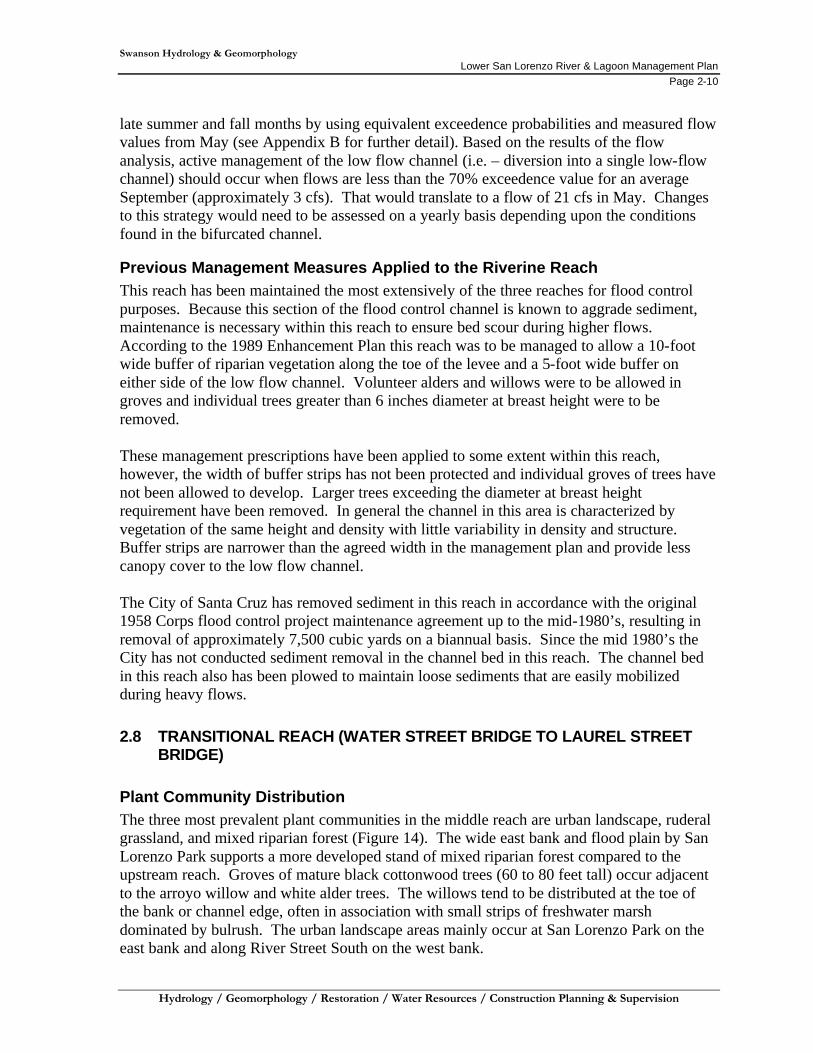
The ruderal grassland is distributed on the upper levee banks, and is prevalent on the levee between Soquel Avenue and the Laurel Street Bridge. The plant species composition is similar to that found in the grassland of the riverine reach; however, the following non-native weedy species become more prevalent in the ruderal grassland: kikuyu grass (Pennisetum clandestinum), white sweet clover (Melilotus albus), and fennel (Native Vegetation Network, 2001). A gently sloping riverbank occurs next to a large vegetated sandbar along the west bank near the Long’s shopping center. Low stature arroyo willows 4 to 6 feet tall are the dominant species with clumps of bulrush along the channel edge. Scattered white alders (5 to 12 feet tall) and a few black cottonwoods also occur on the large sandbar. The vegetation appears more established on this sandbar compared to the other vegetated sandbars observed. A patch of arroyo willow trees occurs at the confluence with the Branciforte Creek channel. The willows mingle with bulrushes at the water’s edge. Of interest, is the tall Hooker’s primrose (Oenothera elata ssp. hookeri) that ranges from 3 to 5 feet tall. This showy plant is common in the willow riparian understory.
Geomorphic and Hydrologic Conditions The term, Transitional Reach, stems from the fact that part of the time this reach functions as a riverine system and part of the time it functions as an estuarine system. The timing of the transition from riverine to estuarine varies from year to year. Typically, this reach will function as riverine during winter and spring months from December to May. Between June and November the reach alternates between riverine and estuarine depending upon the status of the sand bar at the mouth of the River. When the sand bar is open, the reach functions as a riverine system. When the bar is closed, the reach is flooded and functions as an estuarine system. From a purely geomorphic perspective, this reach functions in a similar way to the riverine system described above. Channel and bar features are formed during winter months when the mouth is open forming a primary bankfull channel with several secondary side channels that only have water during high flow events. The secondary channels will tend to scour during high flow events as flow converges into them and around the stable bar features. This process is evidenced by coarse substrate (gravels and cobbles) found in the secondary channels.
Swanson Hydrology & Geomorphology Lower San Lorenzo River & Lagoon Management Plan
Page 2-13
Hydrology / Geomorphology / Restoration / Water Resources / Construction Planning & Supervision
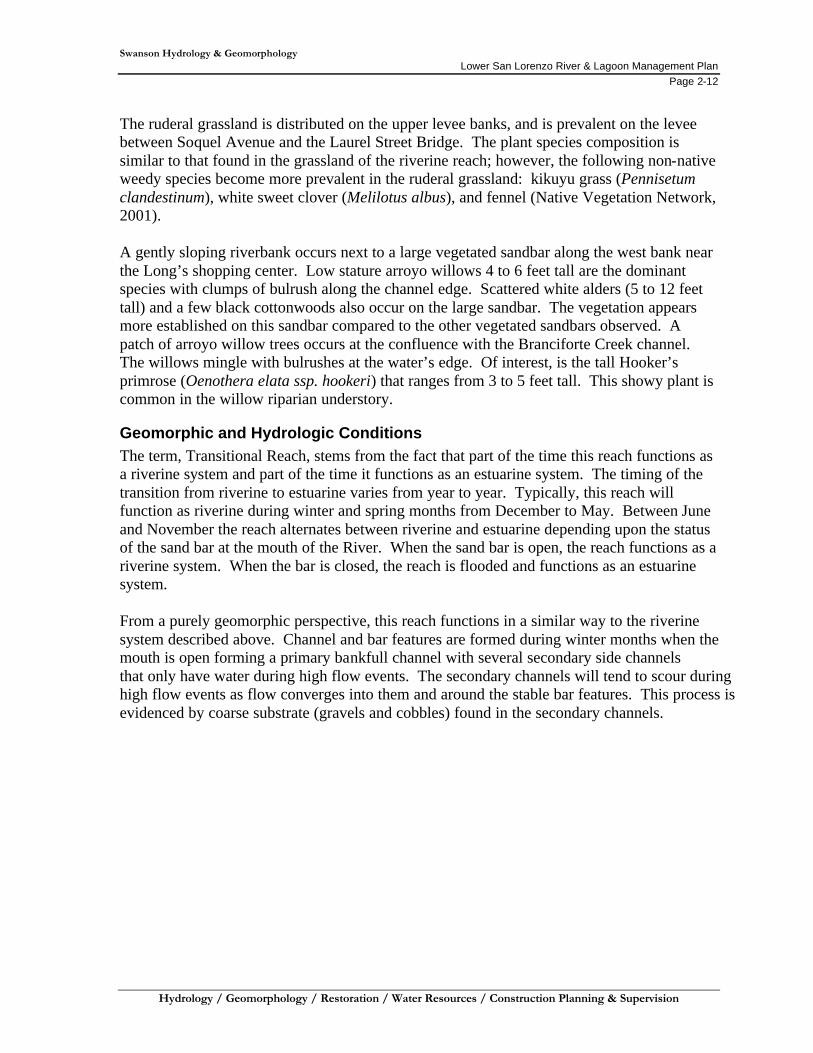
Example of Transitional Reach looking downstream from the pedestrian bridge
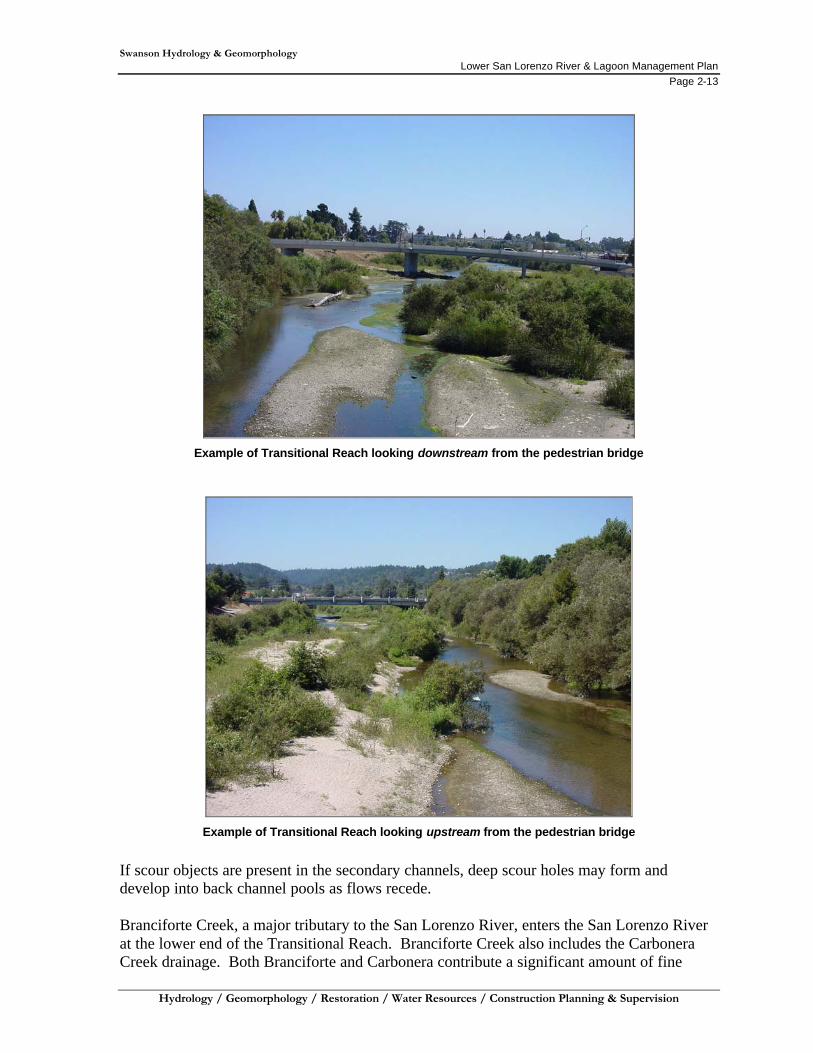
Example of Transitional Reach looking upstream from the pedestrian bridge
If scour objects are present in the secondary channels, deep scour holes may form and develop into back channel pools as flows recede. Branciforte Creek, a major tributary to the San Lorenzo River, enters the San Lorenzo River at the lower end of the Transitional Reach. Branciforte Creek also includes the Carbonera Creek drainage. Both Branciforte and Carbonera contribute a significant amount of fine
Swanson Hydrology & Geomorphology Lower San Lorenzo River & Lagoon Management Plan
Page 2-14
Hydrology / Geomorphology / Restoration / Water Resources / Construction Planning & Supervision
sediment to the Transitional and Estuarine Reach. Evidence of high sediment loads from Branciforte Creek can be seen at the mouth as bar features that fluctuate in size depending upon sediment supply from Branciforte and flow levels in the San Lorenzo River. When the mouth is closed and the transitional reach begins to function as an estuarine system, sediment supply to the transitional reach is fairly low resulting in minimal sediment deposition with very little alteration of riverine-type channel and floodplain features. When converted to an estuarine system, floodplain channels become inundated and may provide additional aquatic habitat. Water level data collected over the past several years in the San Lorenzo River estuary suggests that the bar at the mouth of the River does not persist. Though the source of the bar breaching is unknown, the impact to the transitional reach is quite significant. In August-October of 2000 the bar was on a 5-6 day cycle of forming and breaching. This consisted of the bar forming and flooding of the River back to Water Street over the course of one day. After five days the bar would breach and the transitional reach would convert back to a riverine system (Figure 15). Though the cycle of bar formation and breaching appeared to be natural, an initial human-induced breaching of the bar when it first appears in early summer can cause weaknesses in the bar that limit subsequent formation for the summer-fall season. The Transitional Reach receives urban runoff drainage from Branciforte Creek and a storm drain located on the west side of the river at Soquel Avenue. These areas were a part of the sampling analysis conducted by Santa Cruz County from 1995-1997. Dry weather monitoring was not conducted at these sites during the sampling period because the drains were dry. These drains also showed presence of fecal coliform, E. coli, total coliform, and enteroccocus. Nitrates were also present at slightly higher levels than the riverine reach storm drains. The County identified through sampling that fecal coliform levels did increase downstream of the Branciforte Creek confluence in both wet and dry weather.
Fisheries Habitat Conditions The Transitional Reach is characterized by a single channel that begins below a significant riffle complex downstream of the Water Street Bridge. The riffle complex provides diversity for the upper end of the reach and the channel continues to be somewhat braided until it parallels the streambank along San Lorenzo Park. Two significant pools are associated with this riffle complex. Additionally, velocities are relatively high through this reach resulting in scour along the eastern streambank. This type of scour induces the development of undercut banks and cover habitat for steelhead. The riparian corridor along San Lorenzo Park is the most significant of any section within the Lower River and provides an important area for steelhead rearing and cover. The western edge of this reach is characterized by a wide, flat, sandy bank, which extends for almost 75-feet from the west bank. The edges of this bank are not well vegetated due to manual cutting and winter storm scour and it is expected that steelhead do not use this area because of the lack of cover. A notable exception on this bank is a significant grove of alders, which have established in the upper third of the reach. This grove does provide protection for the streambank and has resulted in significant pool development around its edges. Tules and cattail provide further cover along the edges of the pool.
Swanson Hydrology and Geomorphology115 Limekiln Street Santa Cruz, CA 95060
tel: 831.427.0288 fax: 831.427.0472
-1.0
0.0
1.0
2.0
3.0
4.0
5.0
6.0
7.0
8.0
1-Aug-00 8-Aug-00 15-Aug-00 22-Aug-00 29-Aug-00 5-Sep-00 12-Sep-00 19-Sep-00 26-Sep-00
Stag
e H
eigh
t (in
feet
)
Figure 15: Records of water surface stage on the San Lorenzo River Lagoon at the Jessie Street Marsh outlet through August and September 2000 show a pattern of lagoon filling and breaching. Filling occurs when waves push sand into the mouth of the river forming a barrier to outflow. Breach events (a) break through the beach barrier and reestablish tidal influence in the lagoon. In the absence of mixing, the differing densities between river and sea water creates layering or stratification in the water column. Significant differences between salinity levels at the surface and along the bottom are common.
filli
ng filli
ng
filli
ng
filli
ng
filli
ng
filli
ng
typical breach signature on graph
(a)
a
a
a
a
a
a
a
a
filli
ngfilli
ng
Swanson Hydrology & Geomorphology Lower San Lorenzo River & Lagoon Management Plan
Page 2-16
Hydrology / Geomorphology / Restoration / Water Resources / Construction Planning & Supervision
Visual observations in June through August of 2001 noted approximately 10-15 smolt-size steelhead using shallow pool and glide areas just upstream of the Pedestrian Bridge. This area may provide good rearing habitat since it is just downstream of the large riffle at Water Street and adjacent to adequate escape cover from overhanging vegetation. A significant impact to steelhead in the Transitional Reach is the unpredictability of habitat and flow conditions. In a closed-bar condition at the mouth, the lagoon could potentially flood upstream to the Water Street Bridge producing deep, slack water habitat with adequate escape cover (e.g.-riparian vegetation, undercut banks) and food production from zooplankton. Under an open-bar situation, the Transitional Reach becomes riverine habitat with characteristic pool and riffle sequences and shallower water depths. Though each system provides steelhead habitat, rapid changes between lagoon and riverine systems results in a high frequency of disturbance on the system with very little response time for the biotic communities to react to the new hydrologic regime.
Previous Management Measures Applied to Transitional Reach The Transitional Reach has been managed according to the management prescriptions outlined in the 1989 Enhancement Plan. Management prescriptions on the west bank have allowed small groves of alders to become established, with periodic trimming and removal of alders greater than 6 inches diameter at breast height. An irregular buffer of smaller willows has been allowed along the stream channel south of the pedestrian bridge. Willows on the west bank at the toe of the slope have been allowed to develop with periodic trimming necessary for dissuading use of the area for illegal camping. Tule and cattails have been maintained in wetted areas throughout the reach. Sporadic attempts to manage non-natives on the east bank adjacent to San Lorenzo Park have not succeeded and this area is still impacted by non-natives. Management has not been effective in this effort. Occasionally, limbs overhanging the water have been trimmed to prevent breakage in high flows. In 2000 and 2001 the sediment bar located along the west bank was disked with a plow to loosen sediments and root wads in an attempt to better mobilize these materials during high flows.
2.9 ESTUARINE REACH (LAUREL STREET BRIDGE TO PACIFIC OCEAN)
Plant Community Distribution The following plant communities occur in the downstream reach: ruderal scrub, non-native vegetation, brackish marsh, ruderal grassland, and small areas of arroyo willow riparian forest (Figure 16). Ruderal scrub is the most prevalent plant community type in the downstream reach. The dominant plant species in the ruderal scrub are pincushion flower, red valerian, fennel, and Tangier pea (Lathyrus tingitanus). Scattered coyote brush, pampas grass, and French broom plants also occur on the upper levee banks. Downstream of the Laurel Street Bridge the riparian forest is dominated by arroyo willow. Fewer white alders and black cottonwoods occur compared to upstream of the Laurel Street Bridge. This may be partially explained by changes in water salinity, as conditions become more brackish downstream. The freshwater marsh is reduced in size, and occurs as a narrow
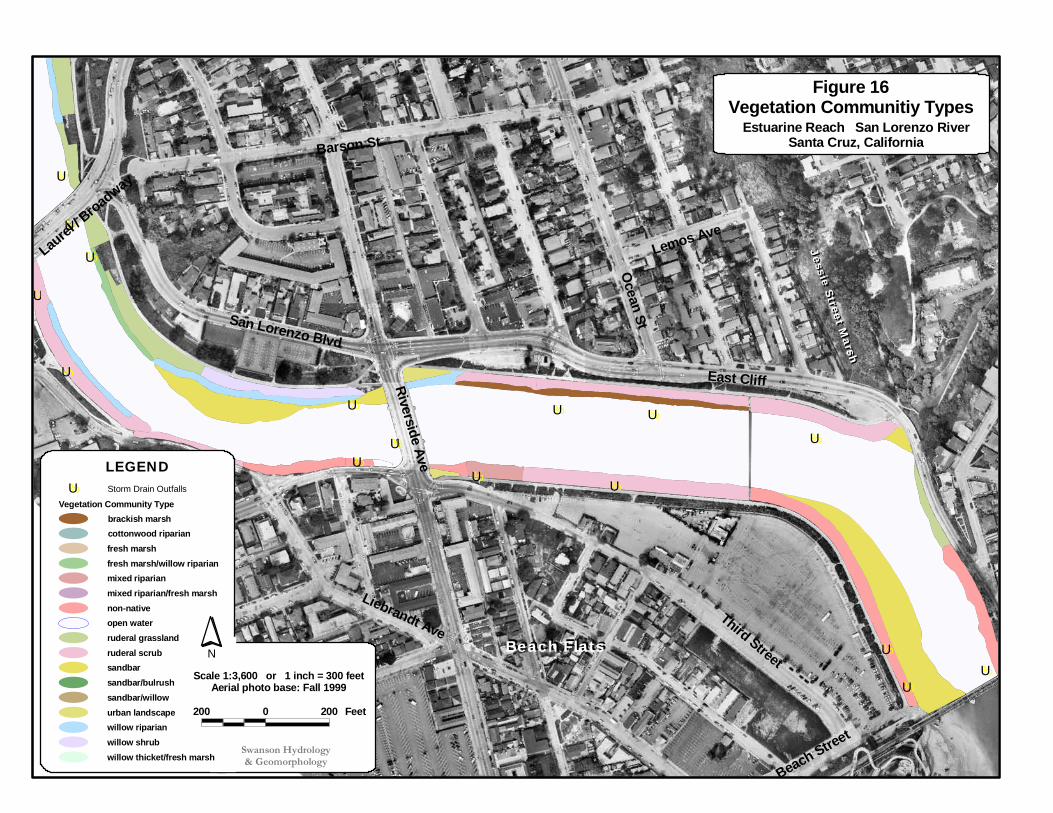
%U
%U
%U
%U
%U
%U%U
%U
%U
%U%U%U
%U
%U
%U
%U
Estuarine Reach San Lorenzo RiverSanta Cruz, California
Figure 16Vegetation Communitiy Types
Swanson Hydrology& Geomorphology
Jessie Street Marsh
Jessie Street Marsh
Riverside A
ve
Ocean S
t
Beach FlatsBeach Flats
Laurel
/ Bro
adway
Barson St
East Cliff
San Lorenzo Blvd
Lemos Ave
Liebrandt AveThird Street
Beach Street
Storm Drain Outfalls%U
LEGEND
willow shrub
willow riparian
urban landscape
sandbar/willow
sandbar/bulrush
sandbar
ruderal scrub
ruderal grassland
open water
non-native
mixed riparian/fresh marsh
mixed riparian
fresh marsh/willow riparian
fresh marsh
cottonwood riparian
brackish marsh
Vegetation Community Type
200 0 200 Feet
Scale 1:3,600 or 1 inch = 300 feetAerial photo base: Fall 1999
N
willow thicket/fresh marsh

Swanson Hydrology & Geomorphology Lower San Lorenzo River & Lagoon Management Plan
Page 2-18
Hydrology / Geomorphology / Restoration / Water Resources / Construction Planning & Supervision
strip along the west bank between Soquel Avenue and Laurel Street. More open water occupies the channel below the Laurel Street Bridge. Vegetated “islands” and freshwater marsh areas in the center of the channel disappear. Arroyo willows grow in narrow bands along the river channel in several areas. One representative location occurs adjacent to the tennis courts on Riverside Avenue. As noted in the middle reach, there are scattered individuals of white alder in the willow riparian forest. The white alders tend to have brownish leaves, perhaps as a result of salt burn and the brackish water present. The white alders are larger and more vigorous in the upper reaches compared to the downstream reach. The Estuarine Reach is the main reach where brackish marsh occurs. A narrow strip of brackish marsh is located along the channel edge between the Riverside Avenue Bridge and the Bixby Street pump station. The main indicator plant species for this community type is coast gumplant (Grindelia stricta), which grows on the inner levee toe. A few bulrushes and red-root cypress (Cyperus erythrorhizos) also grow along the channel. Another rush species was observed at the channel edge. Due to few flowering structures being present, the species identification is still in question, perhaps prairie bulrush (Scirpus robustus), which grows in salt or fresh water marshes.
Example of Estuarine Reach looking downstream from vicinity of Laurel Street Bridge
The levees in the downstream reach have been stabilized with riprap, which has resulted in the establishment of weedy and/or opportunistic species. The majority of the vegetation below the Riverside Bridge is composed of non-native species. A large grove of blue gum eucalyptus (Eucalyptus globulus) is located on the steep eastern bank by the railroad trestle. The trees are helping to stabilize the steep bank. Upstream of the eucalyptus grove, there is a small area of ruderal grassland, which is dominated by wild oats, pincushion flower
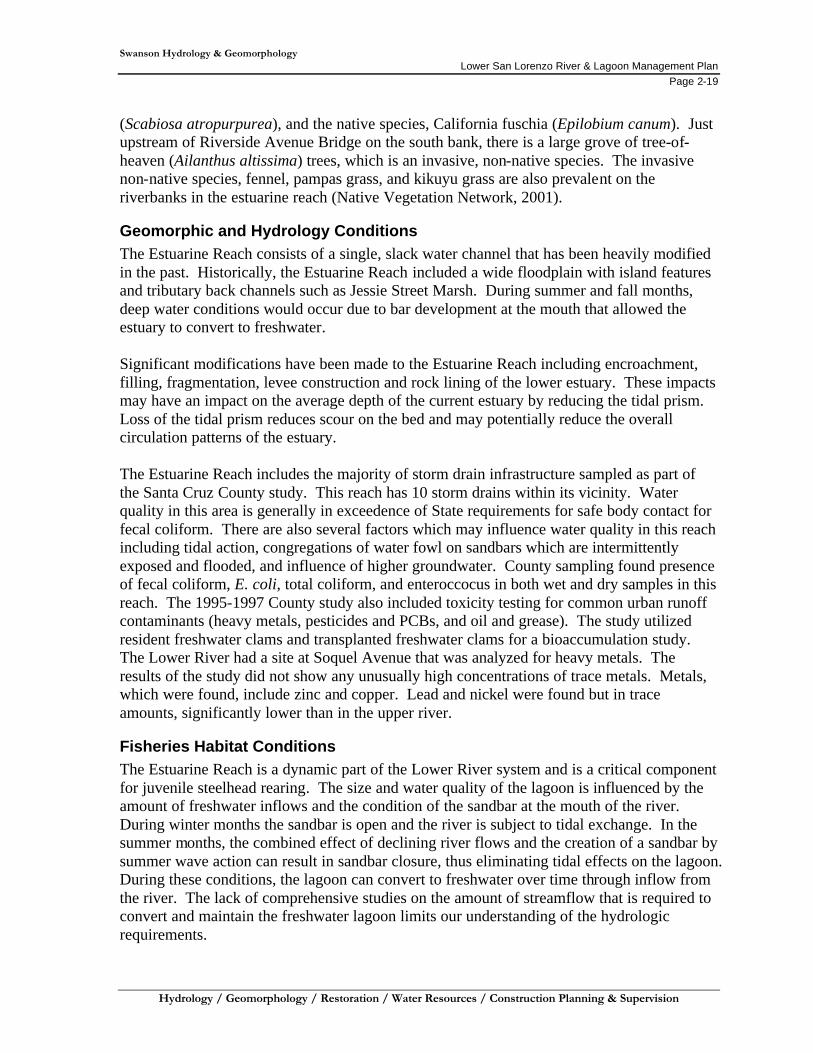
Swanson Hydrology & Geomorphology Lower San Lorenzo River & Lagoon Management Plan
Page 2-19
Hydrology / Geomorphology / Restoration / Water Resources / Construction Planning & Supervision
(Scabiosa atropurpurea), and the native species, California fuschia (Epilobium canum). Just upstream of Riverside Avenue Bridge on the south bank, there is a large grove of tree-of-heaven (Ailanthus altissima) trees, which is an invasive, non-native species. The invasive non-native species, fennel, pampas grass, and kikuyu grass are also prevalent on the riverbanks in the estuarine reach (Native Vegetation Network, 2001).
Geomorphic and Hydrology Conditions The Estuarine Reach consists of a single, slack water channel that has been heavily modified in the past. Historically, the Estuarine Reach included a wide floodplain with island features and tributary back channels such as Jessie Street Marsh. During summer and fall months, deep water conditions would occur due to bar development at the mouth that allowed the estuary to convert to freshwater. Significant modifications have been made to the Estuarine Reach including encroachment, filling, fragmentation, levee construction and rock lining of the lower estuary. These impacts may have an impact on the average depth of the current estuary by reducing the tidal prism. Loss of the tidal prism reduces scour on the bed and may potentially reduce the overall circulation patterns of the estuary. The Estuarine Reach includes the majority of storm drain infrastructure sampled as part of the Santa Cruz County study. This reach has 10 storm drains within its vicinity. Water quality in this area is generally in exceedence of State requirements for safe body contact for fecal coliform. There are also several factors which may influence water quality in this reach including tidal action, congregations of water fowl on sandbars which are intermittently exposed and flooded, and influence of higher groundwater. County sampling found presence of fecal coliform, E. coli, total coliform, and enteroccocus in both wet and dry samples in this reach. The 1995-1997 County study also included toxicity testing for common urban runoff contaminants (heavy metals, pesticides and PCBs, and oil and grease). The study utilized resident freshwater clams and transplanted freshwater clams for a bioaccumulation study. The Lower River had a site at Soquel Avenue that was analyzed for heavy metals. The results of the study did not show any unusually high concentrations of trace metals. Metals, which were found, include zinc and copper. Lead and nickel were found but in trace amounts, significantly lower than in the upper river.
Fisheries Habitat Conditions The Estuarine Reach is a dynamic part of the Lower River system and is a critical component for juvenile steelhead rearing. The size and water quality of the lagoon is influenced by the amount of freshwater inflows and the condition of the sandbar at the mouth of the river. During winter months the sandbar is open and the river is subject to tidal exchange. In the summer months, the combined effect of declining river flows and the creation of a sandbar by summer wave action can result in sandbar closure, thus eliminating tidal effects on the lagoon. During these conditions, the lagoon can convert to freshwater over time through inflow from the river. The lack of comprehensive studies on the amount of streamflow that is required to convert and maintain the freshwater lagoon limits our understanding of the hydrologic requirements.

Swanson Hydrology & Geomorphology Lower San Lorenzo River & Lagoon Management Plan
Page 2-20
Hydrology / Geomorphology / Restoration / Water Resources / Construction Planning & Supervision
The timing of freshwater conversion of the lagoon is a function of the quantity of freshwater inflows, the rate of seepage of saltwater through the sandbar, summer wave action, and overtopping or breaching of the sandbar either from too much freshwater inflow or human-induced breaching. All of these factors need to be understood before a clear plan can be developed to manage water levels in the lagoon. A coarse water balance model was developed, using these parameters, to understand the relationship between freshwater inflows into the lagoon and the time it takes for the lagoon to fill (see Appendix B for further details). Estimation of filling rates under different flow scenarios is important when considering breaching scenarios, habitat value for aquatic organisms and minimum bypass requirements. Based on the results from this model, it would take approximately 4 days for the lagoon to fill under a flow rate of 12 cfs. Conversely, it would take approximately 31 days for the lagoon to fill under a flow rate of 3 cfs. A deep, properly functioning, freshwater lagoon is important to steelhead as it provides an area where the steelhead can make the transition from freshwater to saltwater, provide adequate food resources to grow quickly and allow fish to escape from predators by maintaining refuge habitat. It has been estimated that the lagoon could support approximately 5,000 juveniles under natural conditions based on comparisons with Pescadero, San Gregorio and Scott Creek lagoons north of the San Lorenzo River (Alley, 2001). Though this estimate may be overly optimistic due to the high level of impacts that are occurring in the upper watershed of the San Lorenzo relative to these other more-protected watersheds, the potential still exists for a healthy population of juvenile steelhead in the San Lorenzo River lagoon. In addition to the physical and biological factors that limit juvenile steelhead production in the lagoon, chemical factors also play a role in steelhead survival. These factors include water quality parameters necessary for juvenile survival and optimal rearing. Parameters such as pH, dissolved oxygen (DO), water temperature and salinity all influence the viability of the lagoon as habitat for juvenile salmonids.
Previous Management Measures Applied to Estuarine Reach The Estuarine Reach includes a “no maintenance zone” in the channel bottom area and maintenance in this reach has been minimal, concentrating primarily on vegetation management on the levee slopes. Vegetation along the levee toe is maintained in a 10- foot buffer, although buffer widths have been irregular due to limited management of maintenance crews. Removal of non-natives has not occurred in any organized manner in this reach. The City of Santa Cruz does not presently implement a sandbar management or breaching program for the mouth of the San Lorenzo River, but did so prior to 1995. Breaching activities were ceased following issues with public safety and natural resource management (ie., steelhead). The sandbar across the mouth of the river forms naturally through wave action in the late spring and summer. The sand bar closes the mouth of the river and forms a seasonal summer lagoon; in wetter years it appears that the sand bar self-breaches when the lagoon fills and spills over the sandbar. However, unregulated breaching of the sandbar may occur by the hand of others during the summer months. No enforcement or regulations are posted at the mouth of the river regarding illegal breaching, endangered species or habitat requirements.

Swanson Hydrology & Geomorphology Lower San Lorenzo River & Lagoon Management Plan
Page 3-1
Hydrology / Geomorphology / Restoration / Water Resources / Construction Planning & Supervision
3.0 FINDINGS, OPPORTUNITIES & CONSTRAINTS, AND RESTORATION & MANAGEMENT GOALS & OBJECTIVES
3.1 FINDINGS
The following findings are provided based on review of data collection and analysis for geomorphic, hydrologic, and biologic conditions within the river corridor during summer and fall 2000 and 2001. These findings provide the basis for identification of problems affecting the viability of the Lower River for aquatic and terrestrial species, as well as conditions of the riparian and aquatic habitat throughout the corridor. The findings also identify habitat areas in the Lower River that are serving as adequate or good habitat for aquatic and terrestrial species.
Riverine Reach (Highway 1 to Water Street) • The Riverine Reach is a critical reach in achieving flood control and needs to be
managed to ensure the passage of the FEMA 100-year flood level. • The Riverine Reach is an area where the river bed aggrades and sediments
accumulate. Periodic sediment removal may be necessary in this reach. • The Riverine Reach is geomorphically diverse, supporting two channels during
higher flow years and one channel during lower flow years. • An important geomorphic feature that is present throughout the Riverine Reach is
the presence of cross-channels that flow between the two primary channels. These bars allow for bar scour during higher flows and provide variability in velocities along the channel.
• The Riverine Reach has smaller stands of riparian vegetation and an irregular
riparian buffer due to past management actions. Riparian vegetation has little structural diversity and is composed mostly of willow species of similar height and density.
• The Riverine Reach has been in a state of geomorphic transition since the last
dredging operation of the mid 1980s. • The Riverine Reach supports more varied fisheries habitat than other areas of the
Lower River. Habitat includes fast riffles, swift runs, and fast water areas at heads of pools.
• The Riverine Reach can be enhanced through application of management measures
and restoration actions which enhance channel complexity and establish riparian buffers consistent with flood control constraints.

Swanson Hydrology & Geomorphology Lower San Lorenzo River & Lagoon Management Plan
Page 3-2
Hydrology / Geomorphology / Restoration / Water Resources / Construction Planning & Supervision
Transitional Reach (Water Street to Laurel Street Bridge) • The Transitional Reach functions as both a riverine and an estuarine system
depending on whether the rivermouth has a sand bar in place or not. • The Transitional Reach supports the most significant stand of mixed riparian forest
in the study area. This stand is located in San Lorenzo Park and should be managed to promote species diversity and structural diversity, as well as cover for steelhead.
• Geomorphically the Transitional Reach is characterized by channel and bar features
that are formed during winter months when the rivermouth is open and includes a primary bankfull channel with several secondary side channels that only have water during high flow events. The secondary channels tend to scour during high flow events and can provide back channel pools as flows recede.
• The impact from sandbar breaching is significant to the Transitional Reach because
of the rapid change from estuarine, deep water to shallow freshwater conditions. These rapid changes allow very little response time for biotic communities to react to the new hydrologic regimes.
• One of the few significant riffles in the study area is located in the Transitional
Reach. This riffle does provide a food source to steelhead as shown by a mayfly hatch witnessed during summer 2001.
• Steelhead have been observed to utilize the eastern bank of this reach which
includes shallow pool and glide areas and significant cover from undercut banks and overhanging vegetation.
• The west bank of the Transitional Reach should be a focus of prescribed vegetation
management and restoration actions.
Estuarine Reach (Laurel Street to Pacific Ocean) • The Estuarine Reach contains the most degraded riparian area due to invasion of
non-natives, the presence of riprap and past management actions. • Vegetation in this reach is influenced by the presence of saltwater and saline soils. • The Estuarine Reach contains the most degraded fisheries habitat (refugia) of the
entire study area due to lack of cover and in-stream diversity. • Alterations to the Estuarine Reach have been significant and may have impacted the
average depth of the current estuary by reducing the tidal prism. Loss of the tidal prism reduces scour on the streambed and may potentially reduce the overall circulation patterns of the estuary.
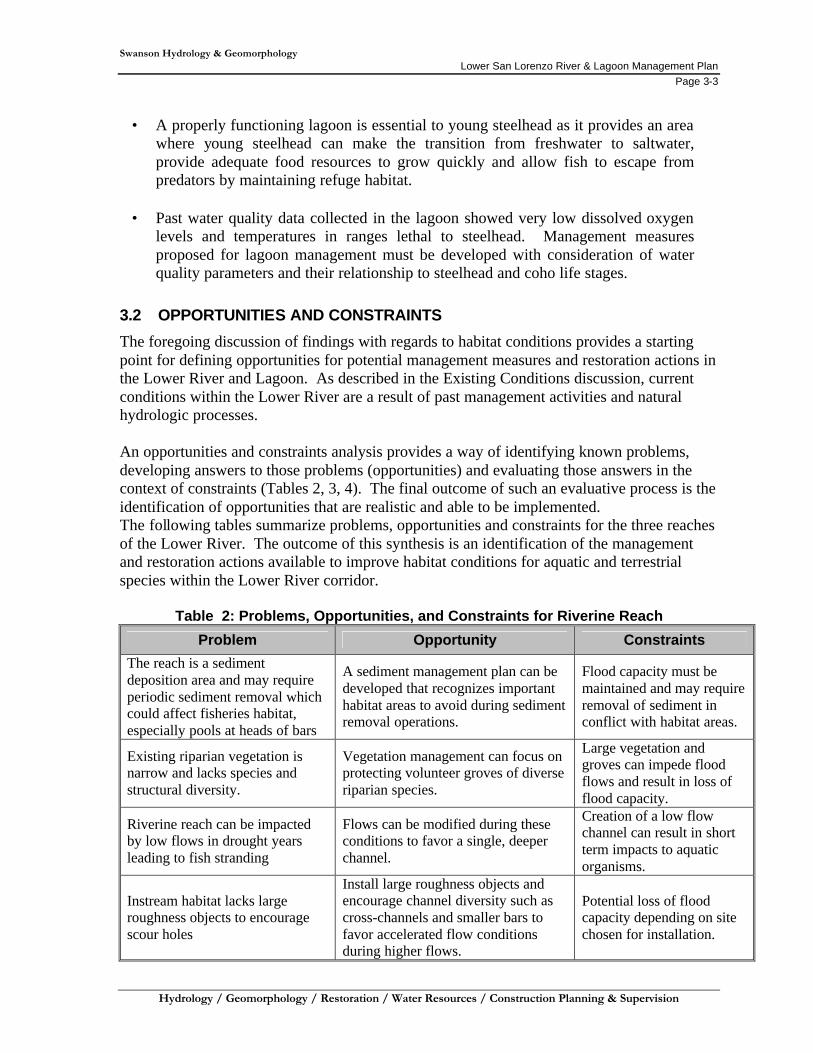
Swanson Hydrology & Geomorphology Lower San Lorenzo River & Lagoon Management Plan
Page 3-3
Hydrology / Geomorphology / Restoration / Water Resources / Construction Planning & Supervision
• A properly functioning lagoon is essential to young steelhead as it provides an area where young steelhead can make the transition from freshwater to saltwater, provide adequate food resources to grow quickly and allow fish to escape from predators by maintaining refuge habitat.
• Past water quality data collected in the lagoon showed very low dissolved oxygen
levels and temperatures in ranges lethal to steelhead. Management measures proposed for lagoon management must be developed with consideration of water quality parameters and their relationship to steelhead and coho life stages.
3.2 OPPORTUNITIES AND CONSTRAINTS
The foregoing discussion of findings with regards to habitat conditions provides a starting point for defining opportunities for potential management measures and restoration actions in the Lower River and Lagoon. As described in the Existing Conditions discussion, current conditions within the Lower River are a result of past management activities and natural hydrologic processes. An opportunities and constraints analysis provides a way of identifying known problems, developing answers to those problems (opportunities) and evaluating those answers in the context of constraints (Tables 2, 3, 4). The final outcome of such an evaluative process is the identification of opportunities that are realistic and able to be implemented. The following tables summarize problems, opportunities and constraints for the three reaches of the Lower River. The outcome of this synthesis is an identification of the management and restoration actions available to improve habitat conditions for aquatic and terrestrial species within the Lower River corridor.
Table 2: Problems, Opportunities, and Constraints for Riverine Reach
Problem Opportunity Constraints
The reach is a sediment deposition area and may require periodic sediment removal which could affect fisheries habitat, especially pools at heads of bars
A sediment management plan can be developed that recognizes important habitat areas to avoid during sediment removal operations.
Flood capacity must be maintained and may require removal of sediment in conflict with habitat areas.
Existing riparian vegetation is narrow and lacks species and structural diversity.
Vegetation management can focus on protecting volunteer groves of diverse riparian species.
Large vegetation and groves can impede flood flows and result in loss of flood capacity.
Riverine reach can be impacted by low flows in drought years leading to fish stranding
Flows can be modified during these conditions to favor a single, deeper channel.
Creation of a low flow channel can result in short term impacts to aquatic organisms.
Instream habitat lacks large roughness objects to encourage scour holes
Install large roughness objects and encourage channel diversity such as cross-channels and smaller bars to favor accelerated flow conditions during higher flows.
Potential loss of flood capacity depending on site chosen for installation.
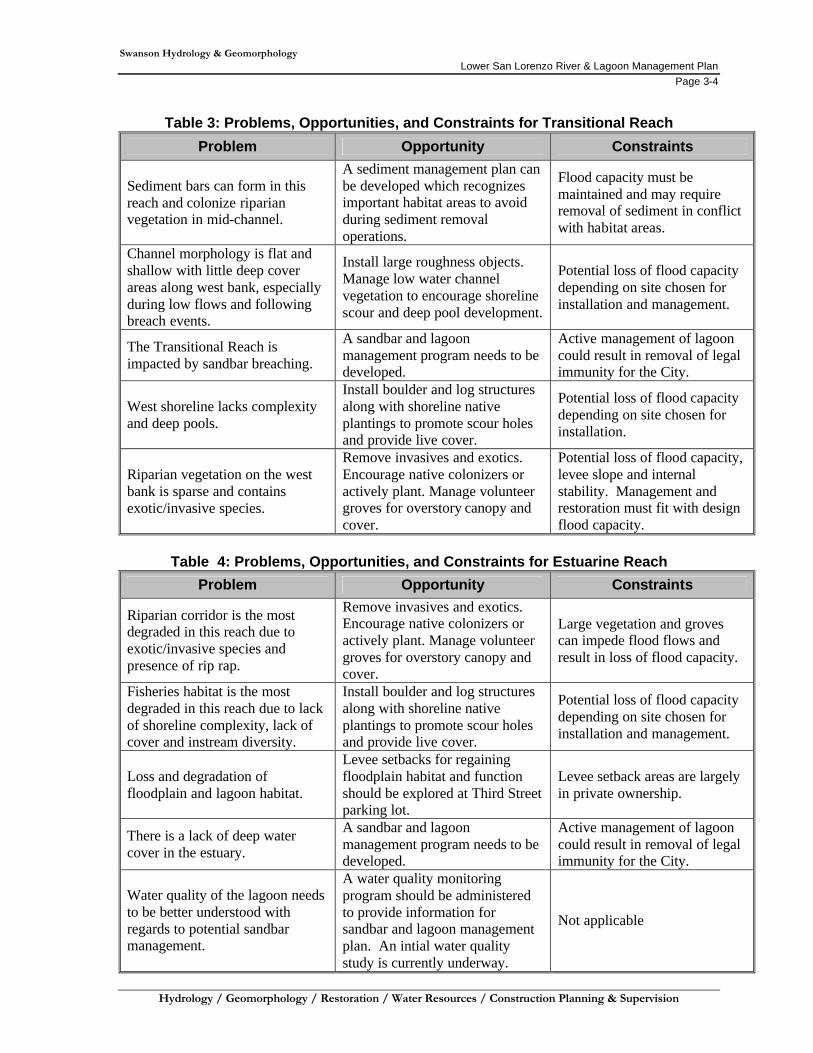
Swanson Hydrology & Geomorphology Lower San Lorenzo River & Lagoon Management Plan
Page 3-4
Hydrology / Geomorphology / Restoration / Water Resources / Construction Planning & Supervision
Table 3: Problems, Opportunities, and Constraints for Transitional Reach
Problem Opportunity Constraints
Sediment bars can form in this reach and colonize riparian vegetation in mid-channel.
A sediment management plan can be developed which recognizes important habitat areas to avoid during sediment removal operations.
Flood capacity must be maintained and may require removal of sediment in conflict with habitat areas.
Channel morphology is flat and shallow with little deep cover areas along west bank, especially during low flows and following breach events.
Install large roughness objects. Manage low water channel vegetation to encourage shoreline scour and deep pool development.
Potential loss of flood capacity depending on site chosen for installation and management.
The Transitional Reach is impacted by sandbar breaching.
A sandbar and lagoon management program needs to be developed.
Active management of lagoon could result in removal of legal immunity for the City.
West shoreline lacks complexity and deep pools.
Install boulder and log structures along with shoreline native plantings to promote scour holes and provide live cover.
Potential loss of flood capacity depending on site chosen for installation.
Riparian vegetation on the west bank is sparse and contains exotic/invasive species.
Remove invasives and exotics. Encourage native colonizers or actively plant. Manage volunteer groves for overstory canopy and cover.
Potential loss of flood capacity, levee slope and internal stability. Management and restoration must fit with design flood capacity.
Table 4: Problems, Opportunities, and Constraints for Estuarine Reach
Problem Opportunity Constraints
Riparian corridor is the most degraded in this reach due to exotic/invasive species and presence of rip rap.
Remove invasives and exotics. Encourage native colonizers or actively plant. Manage volunteer groves for overstory canopy and cover.
Large vegetation and groves can impede flood flows and result in loss of flood capacity.
Fisheries habitat is the most degraded in this reach due to lack of shoreline complexity, lack of cover and instream diversity.
Install boulder and log structures along with shoreline native plantings to promote scour holes and provide live cover.
Potential loss of flood capacity depending on site chosen for installation and management.
Loss and degradation of floodplain and lagoon habitat.
Levee setbacks for regaining floodplain habitat and function should be explored at Third Street parking lot.
Levee setback areas are largely in private ownership.
There is a lack of deep water cover in the estuary.
A sandbar and lagoon management program needs to be developed.
Active management of lagoon could result in removal of legal immunity for the City.
Water quality of the lagoon needs to be better understood with regards to potential sandbar management.
A water quality monitoring program should be administered to provide information for sandbar and lagoon management plan. An intial water quality study is currently underway.
Not applicable

Swanson Hydrology & Geomorphology Lower San Lorenzo River & Lagoon Management Plan
Page 3-5
Hydrology / Geomorphology / Restoration / Water Resources / Construction Planning & Supervision
3.3 MANAGEMENT AND RESTORATION GOALS AND OBJECTIVES
The findings and opportunities and constraints analysis provides the context for identifying goals and objectives for management and restoration in the Lower River and Lagoon. The following goals and objectives also reflect information provided in the existing conditions analysis. In order to evaluate conditions such as degraded riparian habitat, degraded fisheries habitat degraded wildlife habitat, and management issues with lagoon breaching and adequate stream flows the following goals and objectives have been identified. While the Management Plan goals were detailed in Chapter 1, the following goals and objectives identify the desired restoration outcomes on the Lower River and Lagoon over the 15-year plan period. Immediate management and restoration actions will focus on improving vegetation and geomorphic and hydrologic conditions in the hopes that these will improve habitat conditions for wildlife species (including vertebrate and invertebrate species).
VEGETATION Goal: To increase abundance and diversity of native plant species above baseline (2000) levels (including special status species).
Objective #1: Restore and manage native riparian forest to promote species diversity, structural diversity and density along inner and outer levee banks. Objective #2: Increase width of riparian corridor consistent with flood protection constraints to provide increased stream shading and instream cover for aquatic organisms. Objective #3: Enhance native populations of riparian species via natural recruitment and an active planting program. Objective #4: Control non-native, invasive species. Objective #5: Emulate reference (historic and extant) vegetation structure (diversity, age, community composition) and function (nutrient cycling, habitat values).
GEOMORPHOLOGY/HYDROLOGY Goal: To restore geomorphic and hydrologic form and function to the Lower San Lorenzo River so as to improve channel and habitat conditions that will support and sustain native flora and fauna.
Objective #1: Manage instream riparian vegetation to encourage geomorphic form and function. Objective #2: Maintain a stable bankfull channel to improve channel substrate conditions.
Swanson Hydrology & Geomorphology Lower San Lorenzo River & Lagoon Management Plan
Page 3-6
Hydrology / Geomorphology / Restoration / Water Resources / Construction Planning & Supervision
Objective #3: Maintain adequate baseflow through the Lower San Lorenzo River and maintain hydrologic connectivity between the estuary and the Upper San Lorenzo River. Objective #4: Improve quality of waters entering river from stormdrains and nonpoint sources through public education, structural retrofits and pollutant source reduction. Objective #5: Improve and maintain lagoon water quality and quantity at levels consistent with steelhead and coho salmon rearing needs. Objective #6: Reduce water temperature to optimal levels for aquatic species rearing and reproduction. Objective #7: Restore floodplain function through levee setbacks in areas determined to be feasible.
WILDLIFE (Vertebrate and Invertebrate Species) Goal: To enhance habitat conditions for native and special status wildlife species (listed under federal or state endangered species acts, the Migratory Bird Act, or any other relevant legislation) dependent upon the San Lorenzo River, above baseline (2000) levels.
Objective #1: Enhance native resident and migratory fish, bird, mammal, reptile, and amphibian species abundance and richness. Objective #2: Enhance habitat for breeding/nesting populations. Objective #3: Sustain and increase populations of steelhead trout (Oncorhynchus mykiss). Objective #4: Provide functional habitat for Western Pond Turtle (Clemmys marmorata) to increase potential occurrence of this species. Objective #5: Create adequate habitat conditions to allow for migration of coho salmon (Oncorhynchus kisutch) into the upper watershed. Objective #6: Enhance diversity and abundance of aquatic invertebrates, particularly sensitive indicator species. Objective #7: Enhance diversity and abundance of terrestrial invertebrates.
Swanson Hydrology & Geomorphology Lower San Lorenzo River & Lagoon Management Plan
Page 4-1
Hydrology / Geomorphology / Restoration / Water Resources / Construction Planning & Supervision
4.0 MANAGEMENT AND RESTORATION RECOMMENDATIONS
4.1 CRITERIA FOR RECOMMENDATIONS
The following criteria were used to develop the management and restoration recommendations based on the opportunities and constraints and goals and objectives identified in Chapter 3.
1. Recommended management and restoration actions must acknowledge constraints such as maintenance of flood control capacity and public safety.
2. Recommended management and restoration actions should address ecosystem degradation identified in this study; and
3. Recommended management and restoration actions should work within the natural geomorphic and hydrologic processes of the river in creating and sustaining habitat.
Given these criteria the following set of recommendations for management and restoration actions listed below were developed to address specific problems related to ecosystem function and vitality in the Lower River and Lagoon. Specific recommendations may be species specific (i.e. – suggested improvements to steelhead habitat) but also include measures that address improvements to food web dynamics and physical habitat improvement that are ultimately multi-species actions, thus accomplishing the management and restoration goals identified in Chapter 3.
4.2 MANAGEMENT RECOMMENDATIONS
Management Recommendation 1: Develop Annual Vegetation and Sediment Management Plan for Flood Control Maintenance In an effort to evaluate the effectiveness of the current vegetation management per the 1989 Enhancement Plan and how it might be modified, the City of Santa Cruz contracted with Philip Williams & Associates (PWA) to conduct a hydraulic analysis of the channel given current (2000) conditions upstream of the lagoon. The analysis, which used similar techniques as those in the 1989 Enhancement Plan, found that the current vegetation cover, at its present density above the pedestrian bridge, is consistent with the Corps’ design assumptions and that the vegetation management is effective (PWA, 2001). Therefore, vegetation cover can be modified, but its density cannot be increased. Below the pedestrian bridge, the hydraulic analysis indicates that there are opportunities to enhance the vegetation buffer and install shoreline enhancements without affecting flood capacity. The following management recommendation recognizes these findings and presents new management prescriptions to be carried out beginning in fall 2002.
Swanson Hydrology & Geomorphology Lower San Lorenzo River & Lagoon Management Plan
Page 4-2
Hydrology / Geomorphology / Restoration / Water Resources / Construction Planning & Supervision
In the fall of each year the Department of Public Works and the river coordinating staff from the City Manager’s Office should meet to develop a vegetation management plan for implementation during the following summer prior to winter flood flows to meet the Corps flood channel maintenance requirements. Vegetation maintenance should be conducted August – October to avoid the nest season. The plan should include the following components:
1. A 1601 Streambed Alteration Permit Application to the California Department of Fish and Game including appropriate CEQ; a 401 water quality certification form the Central Coast Regional Water Quality Control Board; and a 404 nationwide permit from the U.S. Army Corps of Engineers. Section 7 consultation (Endangered Species Act) may also be required.
2. A map or aerial photo of each reach detailing current important habitat areas to
be avoided during maintenance operations. 3. For seasons where sediment removal or grading is proposed, equipment entry
and exit areas should be labeled on the map or photo. 4. A list of vegetation cutting and thinning prescriptions by reach (Estuarine,
Transitional, and Riverine) including delineation of required buffer areas along stream edges and toe of levee slope, as well as prescriptions for volunteer riparian grove areas (see detailed description in Tables 5 and 6 for prescriptions by reach). A 50-foot area on either side of all bridges should be kept clear of vegetation on the toe of the bank.
5. Identification of exotic/nonnative treatment areas and type of removal
techniques. 6. Delineation of storm drain clean out areas. 7. List of field managers to be present or available during maintenance operations
by City staff or hired contractors. 8. Description of actions to be followed if species of special concern are located
during maintenance activities.
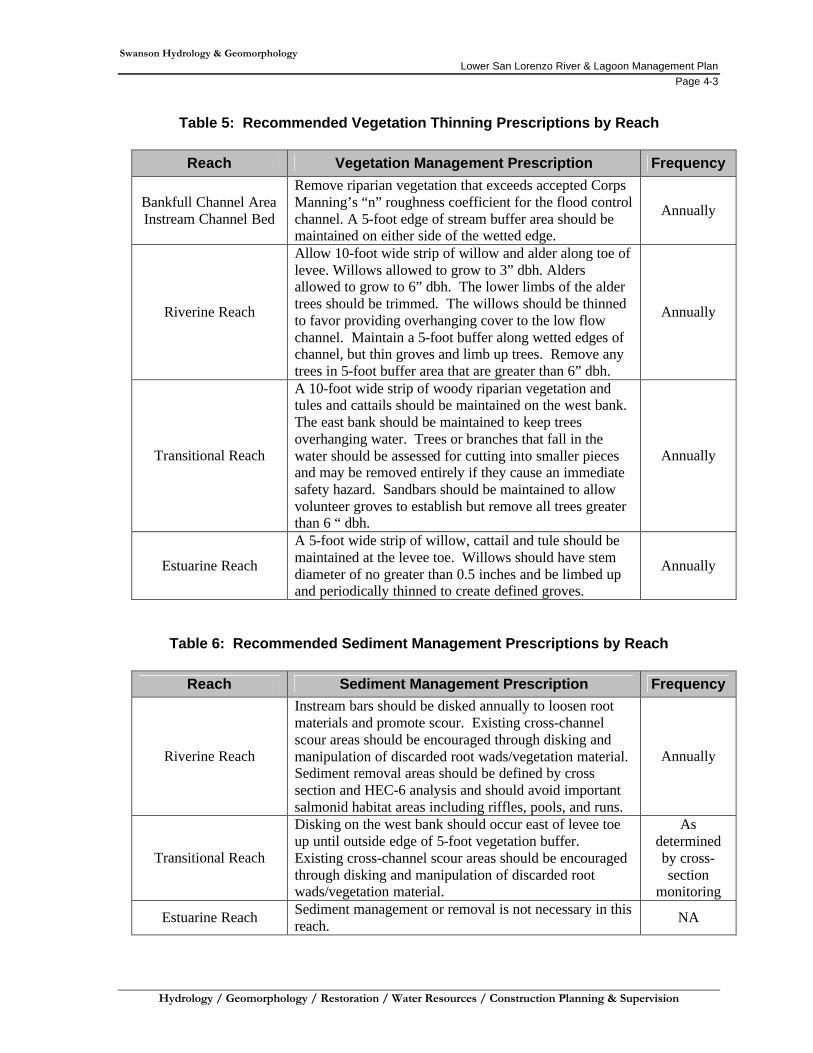
Swanson Hydrology & Geomorphology Lower San Lorenzo River & Lagoon Management Plan
Page 4-3
Hydrology / Geomorphology / Restoration / Water Resources / Construction Planning & Supervision
Table 5: Recommended Vegetation Thinning Prescriptions by Reach
Reach Vegetation Management Prescription Frequency
Bankfull Channel Area Instream Channel Bed
Remove riparian vegetation that exceeds accepted Corps Manning’s “n” roughness coefficient for the flood control channel. A 5-foot edge of stream buffer area should be maintained on either side of the wetted edge.
Annually
Riverine Reach
Allow 10-foot wide strip of willow and alder along toe of levee. Willows allowed to grow to 3” dbh. Alders allowed to grow to 6” dbh. The lower limbs of the alder trees should be trimmed. The willows should be thinned to favor providing overhanging cover to the low flow channel. Maintain a 5-foot buffer along wetted edges of channel, but thin groves and limb up trees. Remove any trees in 5-foot buffer area that are greater than 6” dbh.
Annually
Transitional Reach
A 10-foot wide strip of woody riparian vegetation and tules and cattails should be maintained on the west bank. The east bank should be maintained to keep trees overhanging water. Trees or branches that fall in the water should be assessed for cutting into smaller pieces and may be removed entirely if they cause an immediate safety hazard. Sandbars should be maintained to allow volunteer groves to establish but remove all trees greater than 6 “ dbh.
Annually
Estuarine Reach
A 5-foot wide strip of willow, cattail and tule should be maintained at the levee toe. Willows should have stem diameter of no greater than 0.5 inches and be limbed up and periodically thinned to create defined groves.
Annually
Table 6: Recommended Sediment Management Prescriptions by Reach
Reach Sediment Management Prescription Frequency
Riverine Reach
Instream bars should be disked annually to loosen root materials and promote scour. Existing cross-channel scour areas should be encouraged through disking and manipulation of discarded root wads/vegetation material. Sediment removal areas should be defined by cross section and HEC-6 analysis and should avoid important salmonid habitat areas including riffles, pools, and runs.
Annually
Transitional Reach
Disking on the west bank should occur east of levee toe up until outside edge of 5-foot vegetation buffer. Existing cross-channel scour areas should be encouraged through disking and manipulation of discarded root wads/vegetation material.
As determined by cross-section
monitoring
Estuarine Reach Sediment management or removal is not necessary in this reach. NA
Swanson Hydrology & Geomorphology Lower San Lorenzo River & Lagoon Management Plan
Page 4-4
Hydrology / Geomorphology / Restoration / Water Resources / Construction Planning & Supervision
Management Recommendation 2: Summer Lagoon Water Level Management Key factors for physical fish habitat are lagoon depth and water quality during the summer and fall seasons. Smith (1989) and Alley (2001) cite the artificial management of the sandbar in a closed condition at the lagoon mouth as the most effective method to maintain a freshwater lagoon and deepwater cover. The recommendation is based upon limited water quality measurements and fish population surveys conducted when the lagoon was artificially opened in the late 1980s. The hypothesis is that a closed summer lagoon is a natural condition that supports more productive habitat for steelhead, and that this closure has been disrupted by human breaching of the sandbar. This hypothesis has not been tested on the lagoon, even after sandbar breaching was halted by regulatory agencies in 1995 due to public safety concerns and natural resource management issues. A key management recommendation in the 1989 San Lorenzo River Enhancement Plan is to regulate summer water levels in the lagoon through a manual program of sandbar creation and control. This would allow for conversion of the estuary to freshwater during the later summer, providing a more productive estuary for steelhead rearing. While this plan has merits biologically for the steelhead, the water quality conditions resulting from such a program need to be assessed in order to provide for sound management of the lagoon. Unlike a natural lagoon without anthropogenic influences, the San Lorenzo River Lagoon is influenced by surrounding land uses and water quality contaminants, including nutrients and pathogens. Water quality data collected for the estuary and its input points (stormdrains) have demonstrated high temperatures, very low dissolved oxygen (DO) levels, and the presence of nitrates (Ricker, 2001; Smith, 1989). Due to the stratified conditions (freshwater top layer and saltwater bottom-layer) in the lagoon during most summers, DO levels and high temperatures (combined with nutrient and bacteria inputs) are more of a concern for the steelhead trout at this time. Water quality data collected in 1987-1989 documented dissolved oxygen levels in the lagoon at 5.0 mg/l and lower. Sampling was conducted in the afternoon (1:00-3:00pm) in most cases when DO levels are expected to be higher due to photosynthesis. The lowest dissolved oxygen levels corresponded to depths of 0.5 meters and deeper. These depths are the preferred depths for steelhead during rearing (Smith, 1987). The low levels of DO would therefore be expected to drive the steelhead to the shallower depths where less protection from predation is available. Congruent with low DO values, data also showed increased temperatures with increasing depth and higher salinities. This is to be expected due to the stratified conditions within the estuary with the denser saltwater remaining at the lower depths. Documented occurrences of fish kills resulting from anoxic events are well known. Recent research completed in estuaries that become seasonally closed along the California central coast and the U.S. demonstrate that estuaries receiving high nutrient inputs may be at risk of experiencing anoxic events due to reduced circulation and mixing, elevated phytoplankton growth, and stratified photosynthesis (surface waters) and respiration (bottom waters) conditions (Beck and Bruland, 2000; D’Avanzo and Kremer, 1994). These conditions result in bottom waters becoming anoxic. Anoxic bottom waters experience a dramatic increase in
Swanson Hydrology & Geomorphology Lower San Lorenzo River & Lagoon Management Plan
Page 4-5
Hydrology / Geomorphology / Restoration / Water Resources / Construction Planning & Supervision
hydrogen sulfide concentrations. Hydrogen sulfide is known to be toxic to aerobic organisms. The first storm event of the season will mix the water column and expose resident fish populations to high levels of hydrogen sulfide previously isolated in bottom waters and sediments. While never officially documented in the San Lorenzo River Estuary, these conditions could hinder implementation of enhancement measures in the lower lagoon. While there is little question that deeper water would create superior cover for rearing steelhead, there remain questions regarding lagoon closure effects on water circulation and potential eutrophication. It is also unclear whether conditions in the San Lorenzo River lagoon can be correlated to other less impacted central coast lagoons such as Pescadero Creek, Waddell, Scott and Soquel. Hydrologic and ecosystem conditions are far different in those lagoons than the urban dominated San Lorenzo River Lagoon and watershed. The 1989 San Lorenzo River Enhancement Plan recommended a water level control structure that was subsequently designed but never installed. The main reason for not installing the structure was the liability the City would acquire if it changed the natural lagoon conditions. Natural immunity protection would not be available to the City in the case of accidents due to high water levels or during breaches. Secondly, there are questions regarding the impacts of managing the lagoon at a higher level with less circulation than if it periodically opened. There is currently insufficient data to address the water quality issues, mainly whether eutrophication would occur if the lagoon remained closed (this issue is the subject of the San Lorenzo River Estuary Water Quality Assessment currently being conducted by the City of Santa Cruz with a grant from the Central Coast Regional Water Quality Control Board). The liability and technical questions surrounding artificial lagoon closure could not be resolved during this study. However, since there could be significant direct benefits to steelhead, further study and investigation should be a high priority to attempt to resolve the outstanding issues. The specific recommended measures for lagoon water level management are:
i. Conduct year 2 of the San Lorenzo River Estuary Water Quality Assessment to estimate impacts of summer lagoon closure. This study and accompanying recommendations will be completed in Fall 2002 under a grant from the Central Coast Regional Water Quality Control Board. The study will evaluate dissolved oxygen, temperature, pH, salinity and the potential for eutrophic events under open and closed lagoon conditions.
ii. Seek State legislation to address liability issues for river lagoon management projects.
iii. Assess differences in conditions at other central coast lagoons and the applicability of recommended management measures of these systems to the San Lorenzo River Lagoon.
iv. Determine alternative management strategies to address Steelhead needs in case it is not feasible to control summer lagoon water levels artificially (Note: some of the measures described below will aid Steelhead habitat whether the lagoon water level is managed or not).
Swanson Hydrology & Geomorphology Lower San Lorenzo River & Lagoon Management Plan
Page 4-6
Hydrology / Geomorphology / Restoration / Water Resources / Construction Planning & Supervision
Implementation of Recommendation 2 is contingent upon completion of the water quality assessment and resolution of the City’s liability concerns, the timeline of which is unknown. Completion of assessments of other lagoons and their applicability to the San Lorenzo River Lagoon, as well as identifying what other management actions could create similar benefits, is unknown. If all of the outstanding issues were resolved it could potentially take two years to implement structural control of water levels in the lagoon.
Management Recommendation 3: Establish a Streamflow Standard for Inflow into the Lagoon and Maintenance of a Low Flow Channel Adequate streamflow into the lagoon is an essential element in maintaining a productive freshwater lagoon to improve habitat conditions for steelhead and overall aquatic ecosystem health. Maintenance of a freshwater lagoon is dependent upon stream flow and the configuration and geomorphic characteristics of the low water channel. Key factors are the seasonal and life cycle needs of key aquatic organisms, the hydrologic character of the waterway, the amount of precipitation and its timing year-to-year (i.e. drought, average, or wet). The two key management issues relate to the amount and timing of streamflow, and the need to maximize habitat value with the amount of flow available through enhancement of the low water channel condition. During dry periods, streamflow to the Lower River has been reduced significantly due to drought conditions and water diversion. Little information is known about the relationship between inflows to the Lower River and lagoon, flow losses to percolation from stream gaging points, and water diversion impacts. Streamflow data taken below the City’s diversion at Tait Street indicate flow levels as low as 0.01 cfs during some late summer days during drought periods (USGS Gage #11161000). The Tait Street Diversion is a primary component of the City’s water supply system and is the primary water source during the summer and fall months. The City Water Department is in the process of developing a long-term water supply plan to address a potential 48 percent shortfall during a drought period. The Water Department is presently involved in the development of a Habitat Conservation Plan (HCP) for steelhead and coho salmon, which will examine diversion issues; its development and implementation is several years away. In the nearer term, the County of Santa Cruz is preparing a Steelhead Enhancement Plan for the San Lorenzo River Watershed (a companion project to the Management Plan), which includes an examination of long term water supply, facilities and operations throughout the watershed for the dual objectives of enhancing stream flow for steelhead and providing greater reliability for supply. Management Recommendation 3 addresses the low flow habitat issues through adaptive management of the low flow water channel as part of the annual maintenance plan, and through developing the preliminary technical basis for determination of a recommended inflow for the Lower River. The recommendations provided below are designed to make the best use of streamflow entering the Lower River and lagoon, and to develop a preliminary bypass flow recommendation to be further developed by additional water balance modeling.
Swanson Hydrology & Geomorphology Lower San Lorenzo River & Lagoon Management Plan
Page 4-7
Hydrology / Geomorphology / Restoration / Water Resources / Construction Planning & Supervision
i. Adaptively manage the low flow channels and habitat in the reaches between Highway One and the mouth through annual inspections and implementation of enhancement measures from early spring through late summer. An adaptive strategy should be developed for annual management of the low water channel based upon May projections of late summer and fall streamflow and the conditions of channel(s) in the Riverine and Transitional Reaches (see Appendix B). Based upon an examination of channels and streamflow in May, a team consisting of a fisheries biologist, riparian biologist, construction contractor (one specializing in stream work), City staff and representatives of the California Department of Fish and Game and National Marine Fisheries Service (NMFS) will formulate that year’s plan for low water channel management and consider the following actions:
a) Establish one channel as the main low flow channel when it appears that
summer and fall stream flow will result is less habitat in multiple channels. Use low impact methods to achieve single flow establishment and assess whether fish salvage operations are needed and if the risks associated with salvage are outweighed by the projected benefits of a single channel. Results from an analysis of historic streamflow records and additional data collected in the spring and summer of 2001 suggest that at flows less than 3 cfs, steps should be taken to direct the flow into a single channel. This is an interim recommendation that would require further analysis as conditions in the Riverine Reach change due to winter flows (see Appendix B). Flow measurements, taken in May can be used in conjunction with developed exceedence values to predict late summer flow conditions.
b) Consider installation of instream cover elements such as logs, transplanted
willows and other objects.
ii. Consider alternative additional sources of water for streamflow entering the Lower River and lagoon, such as reclaimed wastewater, if water quality standards are acceptable.
iii. Attempt to maintain a minimum flow requirement to the Lower River and
lagoon of 6.5 cfs during the period designated for lagoon filling. This would allow the lagoon to fill with freshwater in approximately 7 days based on the water balance model developed in this report (see Appendix B). A seven-day filling period seems reasonable considering the frequent breach events that have occurred at the mouth the past few years. If less frequent breaches occur (as is hoped once a lagoon water level management program is in place), this minimum flow requirement can be reduced to account for a single summer filling. A minimum flow requirement of 6.5 cfs through the Lower River would also reduce the need to manage the bifurcated channel in the Riverine Reach except in below average flow years.
This recommendation is based on a preliminary water balance model developed for the Management Plan (see Appendix B) and should be considered an interim
Swanson Hydrology & Geomorphology Lower San Lorenzo River & Lagoon Management Plan
Page 4-8
Hydrology / Geomorphology / Restoration / Water Resources / Construction Planning & Supervision
recommendation until a more detailed water balance model can be developed. The model has not been tested and a more comprehensive model should be developed with the assistance of appropriate resource agencies. Flow records show that in below normal rainfall years such a flow is not available as far upstream as Felton and so the implementation of the 6.5 bypass will be a complicated exercise. Maintenance of the minimum bypass will require negotiations with existing water users watershed wide. As described in Chapter 2, Existing Conditions, the San Lorenzo River has been fully appropriated between the months of June and October for water supply by the California State Department of Water Resources. There are currently dozens of appropriative users and riparian rights in the watershed. In order to achieve greater flows downstream, it will be important to look for solutions that include every appropriator in the San Lorenzo system.
Based on current water demand and water supply shortfalls, the City of Santa Cruz Water Department presently cannot guarantee that a 6.5 cfs bypass could be provided due to the fact that the Tait Street diversion provides as much as 75% of the summer daily water demand for City users. Appropriative water rights at the Tait Street diversion currently allow for diversion of 12.2 cfs, however the diversion is currently operated to allow as much bypass as feasible. The City of Santa Cruz will ultimately need to consult with state and federal agencies, such as the California Department of Fish and Game and the National Marine Fisheries Service to determine an appropriate minimum bypass to maintain a freshwater lagoon.
4.3 RESTORATION RECOMMENDATIONS
As described previously, enhancement of the Lower River and Lagoon will require both management actions and restoration projects to restore ecosystem function. The following restoration projects are recommended for implementation in the Lower River corridor.
Restoration Recommendation 1: Enhance Streambed Aquatic Cover and Substrate in Estuarine and Transitional Reaches Many aquatic organisms require a narrow range of substrate conditions for different phases of their life cycle along with the presence of organic matter and substrate to maintain low water temperatures, and provide cover and food. Steelhead require adequate cover in order to escape predators such as waterfowl and humans. Besides maintaining the water level of the lagoon at a higher level in the summer months, cover can be provided by:
• Undercut banks, usually formed by scour in the low water channel against root bound soils;
• Scour holes around large roughness objects such as wood stumps, root wads, rocks, patches of tules or cattails, bridge piers or logs;

Swanson Hydrology & Geomorphology Lower San Lorenzo River & Lagoon Management Plan
Page 4-9
Hydrology / Geomorphology / Restoration / Water Resources / Construction Planning & Supervision
• Pools resulting from natural bar forms and meandering in alluvial materials, riffles and pools.
The dominance of a sandy streambed in the San Lorenzo River allows filling of pools during low flows when sand is still mobile but scouring action against roughness objects is limited. Sand also fills the interstices of coarse substrate often embedding potential rearing areas and escape cover. Primary productivity of aquatic invertebrates, essential for food production for steelhead, is very limited in a streambed dominated by sand substrate. Coarse gravels and cobbles generally free of fine sediments are necessary for good primary productivity. Large roughness objects (see Figure 17) also benefit the sorting of sediment loads by hydraulically concentrating the hydraulic force of available flow. Scour holes are generally flushed of fine sediments and a sorting to fine gravels occurs at the scour hole tail out. The presence of large roughness objects is essential to overcoming the abundant supply of fine sediment in the San Lorenzo River system. The improvements in riparian vegetation cover over the past 12 years since implementation of the first Enhancement Plan has dramatically increased root bound soils and undercut banks and has concentrated flow and bed scour to the point where cobbles and gravel substrates have been exposed. Natural processes of bar formation and meandering has allowed for pool development. Further improvements in fish habitat and ecosystem diversity can be realized if geomorphic and vegetative processes are enhanced. The proposed enhancements are designed to improve existing natural geomorphic processes of scour and sediment deposition. They will aid in diversifying small-scale hydraulic conditions that have already proven successful through vegetation management. Improvement of aquatic habitat cover and substrate can be accomplished by installing log and boulder structures as well as vegetation plantings and placement of additional substrate material. These improvements could be implemented from 2001-2005 with improvements to channel and habitat conditions monitored to assess their effectiveness. Two types of structures are recommended:
• Log / boulder structures (Figure 17) consist of large logs, in excess of 30 inches in diameter, at least 15 feet long and with root wad attached, cabled to large boulders, in excess of 30 inches mean diameter or 1.5 tons. These are commonly used as naturalistic large roughness objects to promote bed scour for pool formation and to flush sand leaving coarser particles of cobbles and gravels (CDFG, 1998; Rosgen 1993). In the example shown (see photo), the hydraulic effect of the log/boulder structure was sufficient to move large cobbles and small boulders leaving a deep 3 + foot hole and wood cover. These structures would be placed along the edge of the low water channel in the upper estuarine and transitional reaches. In the San Lorenzo River, the boulder segments of these structures would likely sink into the sandy bed during flood events, but the log would be buoyant, align in the direction of flow and should persist on the channel bed surface up to 20 years. They could be
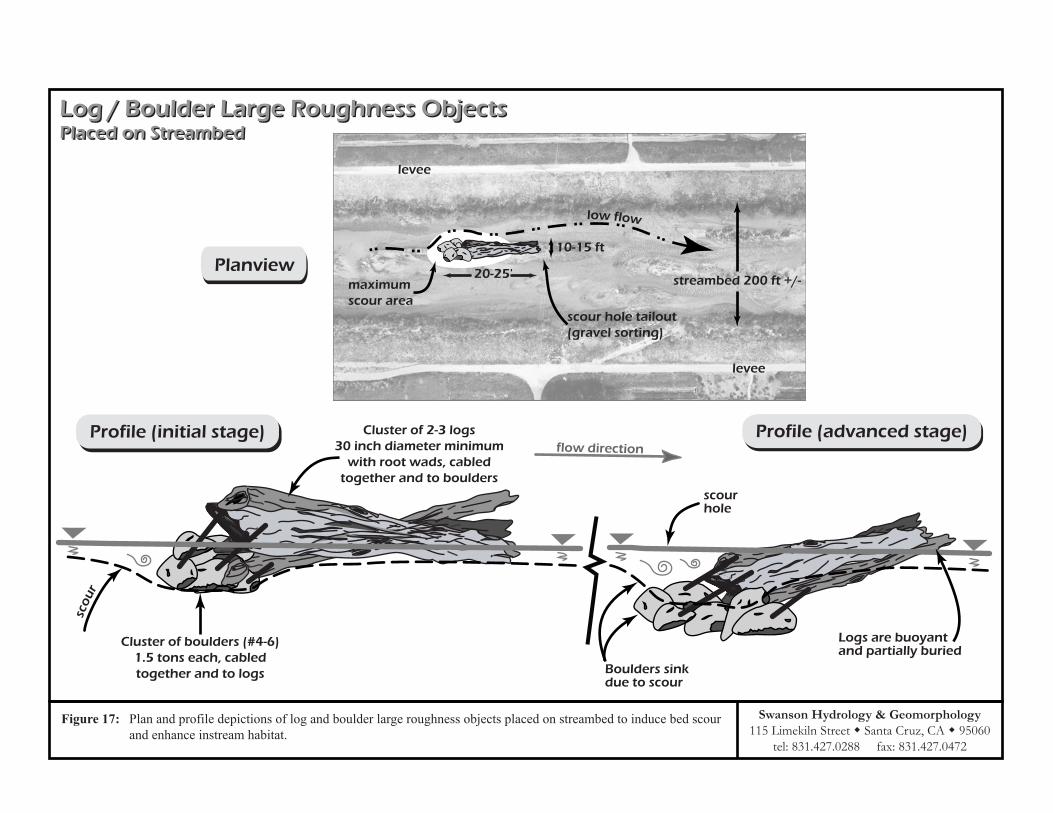
Swanson Hydrology & Geomorphology115 Limekiln Street w Santa Cruz, CA w 95060�
tel: 831.427.0288 fax: 831.427.0472
Figure 17: Plan and profile depictions of log and boulder large roughness objects placed on streambed to induce bed scourand enhance instream habitat.
flow direction
s
cour
Cluster of boulders (#4-6)1.5 tons each, cabledtogether and to logs
Profile (initial stage) Profile (advanced stage)Cluster of 2-3 logs30 inch diameter minimum
with root wads, cabledtogether and to boulders
scourhole
Planview
Boulders sinkdue to scour
Logs are buoyant and partially buried
Log / Boulder Large Roughness Objects Placed on StreambedLog / Boulder Large Roughness Objects Placed on Streambed
maximumscour area
20-25'
scour hole tailout(gravel sorting)
levee
levee
low flow
10-15 ft
streambed 200 ft +/-

Swanson Hydrology & Geomorphology Lower San Lorenzo River & Lagoon Management Plan
Page 4-11
Hydrology / Geomorphology / Restoration / Water Resources / Construction Planning & Supervision
periodically rehabilitated using large logs washed onto the City’s beaches in the winter (these are normally removed at an expense).
Large virgin timber logs, including conifers from the watershed and riparian trees from the riverbanks upstream, were once an important source of large roughness objects in the Lower River and lagoon. The City's efforts to remove large conifer logs from bridges during large floods (1982 and at the Soquel Avenue bridge in 1999) and from beaches after moderate flood events are evidence of the abundance of logs in the watershed. The proposed log / boulder structures would help replace the original large woody and roughness objects. An effort could be made to use beach logs as a replenishment source in the river. Natural recruitment of woody debris should also be encouraged through policies designed to limit log removal in the upper watershed.
Example of log / boulder habitat enhancement structure for streambed and shoreline enhancement.
• Cobble and cattail bulrush structures: One type of large roughness object observed
on the streambed of the project reach are stands of emergent clumps of bulrush or cattails found at the base of the low water channel banks or at the head of islands. In some instances, these clumps are rooted into a cobble substrate. These clumps provide a large roughness object for scouring holes in the riverbed, a host for primary productivity and escape cover for fish. Tules and cattails are also neutral for flood capacity impact as they are pushed down to the streambed quite easily in small floods.
Figure 18 shows a sketch of the proposed structures. These can be placed directly on the streambed, or at the base of banks that are lacking riparian cover. Plant materials are abundant in the Riverine Reach and could be scavenged for the structures.

Swanson Hydrology & Geomorphology115 Limekiln Street w Santa Cruz, CA w 95060�
tel: 831.427.0288 fax: 831.427.0472
Figure 18: Plan and profile depictions of tule / cattail clumps placed on streambed to induce bed scour and enhance instream habitat.
flow direction
s
cour
cobble
Backfill with native sand and streambed material
Tule / Cattail Clumps Placed on StreambedTule / Cattail Clumps Placed on Streambed
Planviewlevee
levee
low flow
10-15 ft
streambed 200 ft +/-
BAR
Profile PlanviewPlant / transplant clumps ofemergent tule / cattail
maximumscour area
Swanson Hydrology & Geomorphology Lower San Lorenzo River & Lagoon Management Plan
Page 4-13
Hydrology / Geomorphology / Restoration / Water Resources / Construction Planning & Supervision
Restoration Recommendation 2: Enhance Riverbank Shoreline Habitat in Transitional and Estuarine Reaches Shoreline conditions are degraded along reaches of the Transitional and Estuarine Reaches due to a lack of vegetation and rooted soil mass in the banks and straight rock rip rap slopes, especially below Riverside Avenue. These measures will help create diversity along the shoreline, increase shoreline hydraulic roughness to induce fine sediment deposition on the shoreline slope and provide opportunities for soil development and plant colonization. Three shoreline treatments are proposed for enhancement measures. Installation of these treatments will require detailed plans for access and construction techniques including types of equipment. These treatments could be implemented from 2002-2005. They include:
i. Log boulder structures similar to those proposed for the streambed enhancements but laid on the shoreline slope;
ii. Install bulrush/cattail cobble structures at shoreline.
• Log Boulder Structures along the Shoreline: Figure 19 shows log boulder structures for shoreline placement. The priority sites are the Estuarine Reach and the lower Transitional Reach below Soquel Avenue. These are designed to provide cover, encourage hydraulic variability and induce scouring on the streambed at the toe of the bank. These are similar in materials as the streambed placed structures, however placement is along the interior slope of the levees, especially rip-rap sections in the Estuarine Reach below Riverside Avenue.
• Bulrush/Cattail cobble structures at Shoreline: The bulrush/cattail cobble
structures are identical to the streambed versions with the exception that placement should occur at the shoreline. The structures should be placed where bank vegetation is degraded or non-existent and should be used as a stopgap for bank vegetation enhancement projects to provide cover and scour hole opportunities.
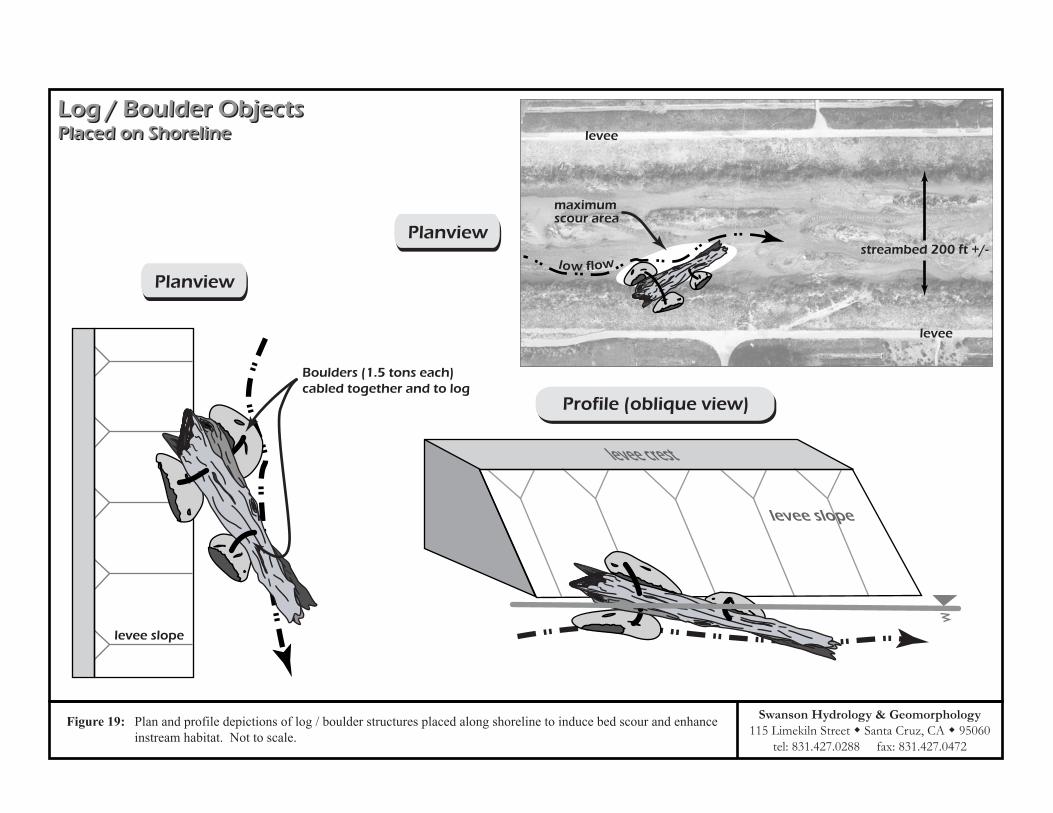
levee
levee
streambed 200 ft +/-
Log / Boulder Objects Placed on ShorelineLog / Boulder Objects Placed on Shoreline
Planview
low flow
Swanson Hydrology & Geomorphology115 Limekiln Street w Santa Cruz, CA w 95060�
tel: 831.427.0288 fax: 831.427.0472
Plan and profile depictions of log / boulder structures placed along shoreline to induce bed scour and enhance instream habitat. Not to scale.
Figure 19:
maximum scour area
leve
e cr
est
Planview
levee slope
Boulders (1.5 tons each)cabled together and to log
levee crest
levee slope
Profile (oblique view)
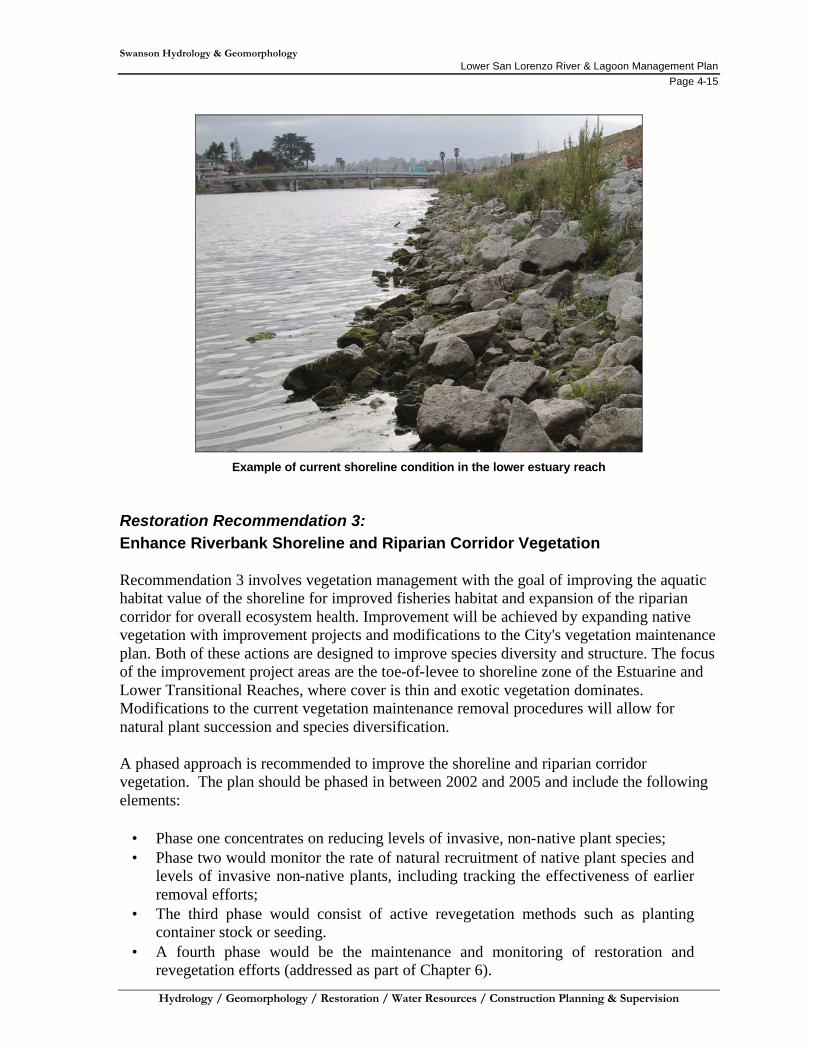
Swanson Hydrology & Geomorphology Lower San Lorenzo River & Lagoon Management Plan
Page 4-15
Hydrology / Geomorphology / Restoration / Water Resources / Construction Planning & Supervision
Example of current shoreline condition in the lower estuary reach
Restoration Recommendation 3: Enhance Riverbank Shoreline and Riparian Corridor Vegetation Recommendation 3 involves vegetation management with the goal of improving the aquatic habitat value of the shoreline for improved fisheries habitat and expansion of the riparian corridor for overall ecosystem health. Improvement will be achieved by expanding native vegetation with improvement projects and modifications to the City's vegetation maintenance plan. Both of these actions are designed to improve species diversity and structure. The focus of the improvement project areas are the toe-of-levee to shoreline zone of the Estuarine and Lower Transitional Reaches, where cover is thin and exotic vegetation dominates. Modifications to the current vegetation maintenance removal procedures will allow for natural plant succession and species diversification. A phased approach is recommended to improve the shoreline and riparian corridor vegetation. The plan should be phased in between 2002 and 2005 and include the following elements:
• Phase one concentrates on reducing levels of invasive, non-native plant species; • Phase two would monitor the rate of natural recruitment of native plant species and
levels of invasive non-native plants, including tracking the effectiveness of earlier removal efforts;
• The third phase would consist of active revegetation methods such as planting container stock or seeding.
• A fourth phase would be the maintenance and monitoring of restoration and revegetation efforts (addressed as part of Chapter 6).
Swanson Hydrology & Geomorphology Lower San Lorenzo River & Lagoon Management Plan
Page 4-16
Hydrology / Geomorphology / Restoration / Water Resources / Construction Planning & Supervision
The phasing is designed to accomplish enhancement by first creating conditions where the existing riparian vegetation can expand by natural recruitment. This would reduce intervention efforts to a low level. Where this is not feasible, or where natural recruitment proves insufficient, active revegetation would then be applied.
Phase 1: Control of Invasive Non-native Plant Species Control and/or eradication of invasive, non-native species is essential to restoring the riparian corridor to a more natural condition than presently exists. At present, invasive, non-native species are displacing and out-competing native vegetation, especially on the levee slopes. The elimination of such invasive species would encourage an increase in the number and diversity of native plant species. The following discussion primarily addresses controlling the invasive non-native species that occur on the inner levee slopes and channel edge.
• Non-herbicide Methods for the Control of Invasive Non-native Plants:
i. Mechanical control such as mowers, flaming equipment, and weed trimmers, ii. Manual methods such as hand pulling and hoeing iii. Biological control (use of natural enemies/ insect predators), iv. Maintenance practices such as mulching and solarization with plastic sheeting v. Physical controls such as traps and barriers.
• Integrated Pest Management. The control of invasive non-native plants should
have an integrated approach, and should be performed in accordance with the City of Santa Cruz Pesticide Use Policy, as adopted on November 10, 1998 and updated annually. The urban riparian corridor is located on City property. According to the Pesticide Use Policy, City departments and City contractors should “eliminate or reduce pesticide applications on City property to the maximum extent feasible”. City departments should give first priority to available non-pesticide, alternative control methods, when considering the use of pesticides on City property, especially near watercourses and riparian areas. “The application of pesticides may remain an option if alternative control methods are not effective” (ibid) especially for situations where extreme invasive non-native species (ie., Arundo sp.) may be present. Current scientific literature and study should guide the use of any chemical controls of non-native species.
• Priority Ranking for Control. The invasive, non-native plants occurring within
the study area have been assigned a priority ranking for control of high, medium or low (Table 7). High priority species are considered the most invasive and in need of control or eradication. The majority of the high priority species listed in Table 7 are perennial and spread aggressively (i.e., French broom, pampas grass, fennel, English ivy, kikuyu grass, and acacia). These species are recommended for removal/control as soon as possible. It is expected that control/eradication of high priority species will continue for up to five years, depending on available funding and staffing.

Swanson Hydrology & Geomorphology Lower San Lorenzo River & Lagoon Management Plan
Page 4-17
Hydrology / Geomorphology / Restoration / Water Resources / Construction Planning & Supervision
Table 7: Existing Invasive, Non-Native Plants Observed in the Urban San Lorenzo River Riparian Corridor
Riverine Reach
Transitional Reach
Estuarine Reach Invasive, Non-Native Species Priority for
Control E W E W NE SW
Bindweed (Convolvulus arvensis) High X X X
Blue Gum (Eucalyptus globulus) High X X X X X
Bull Thistle (Cirsium vulgare) Medium X X X X
Cape Ivy (Senecio mikanoides) High X X X
Cocklebur (Xanthium strumarium) Low X X X X X
English Ivy (Hedera helix) High X X X X X
Fennel (Foeniculum vulgare) High X X X X X X
Field Mustard (Brassica rapa) Medium X X X X X X
French Broom (Genista monspessulana) High X X X X X
Green Wattle Acacia (Acacia decurrens) High X X X X X
Himalayan Blackberry (Rubus procerus) Low X X X X X
Iceplant or Sea Fig (Carpobrotus edulis) Medium X X X X X
Italian Ryegrass (Lolium multiflorum) Medium X X
Johnson Grass (Sorghum halepense) Low X
Kikuyu Grass (Pennisetum clandestinum) High X X X X X
Nasturtium (Tropaeolum majus) Low X
Pampas Grass (Cortaderia jubata) High X X X
Periwinkle (Vinca major) High X
Pin Cushion (Scabiosa atropurpurea) Low X X X X
Prickly Wild Lettuce (Lactuca serriola) Medium X X X X X Rabbit’s Foot Grass (Polypogon monspelensis) Medium X X X X X
Rice Grass (Piptatherum miliaceum) Medium X X X X X
Ripgut Brome (Bromus diandrus) Low X X X X
Tangier Pea (Lathyrus tingitanus) Low X X
Tree-of-Heaven (Ailanthus altissima) Medium X
Red Valerian (Centranthus ruber) Low X X X X X X
Velvet Grass (Holcus lanatus) High X X X X
White Sweet Clover (Melilotus albus) Medium X X X X X
Wild Radish (Raphanus sativus) Low X X
Yellow Dock (Rumex crispus) Medium X X X X X Key: E = Eastside W = Westside NE = Northeast Side SW = Southwest Side
Swanson Hydrology & Geomorphology Lower San Lorenzo River & Lagoon Management Plan
Page 4-18
Hydrology / Geomorphology / Restoration / Water Resources / Construction Planning & Supervision
Medium priority species for control are also aggressive and may create large stands. Given site conditions, these species are not considered as invasive as the high priority species listed, but also should be reduced to lower levels. Medium priority invasive plant species are often annuals or biennials. Examples of invasive non-native species having medium priority for control include: bull thistle, white sweet clover, prickly wild lettuce, Italian ryegrass, rice grass, and ice plant. Medium priority species should be removed once high priority invasive plant species are under control, and have either been contained or significantly reduced, depending on the particular species. As described above, the control of invasive, non-native species should have an integrated pest management plan that employs a variety of control measures, including: manual, mechanical, physical, and chemical (last resort). The use of herbicides is best restricted to high priority species, especially rhizomatous (spreads by underground stems) plants such as kikuyu grass and stump-sprouting trees that are difficult to eradicate (e.g., green wattle acacia and blue gum eucalyptus). Herbicides should only be applied by personnel who are trained and licensed to do so. Most medium priority species can be removed mechanically by uprooting, pulling, and hoeing below the ground. As control measures are implemented, it is important to minimize disturbance to the soil, since invasive species establish readily in open disturbed areas. Non-chemical methods are preferred whenever possible.
• Size of Treatment Areas. In order to minimize soil erosion and sedimentation into the river, it is recommended that invasive non-native plants be removed from small areas (less than 3 meters in diameter) at a time. In some locations, it may be possible to have longer treatment areas/strips that are oriented with the long side along the contour of the riverbank. The treatment strip would be placed so that there would be vegetation below the removal area to trap the loosened soil. Once the areas have been cleared of invasive plant species, the resulting barren soil should be seeded or stabilized with a layer of weed-free mulch and/or fiber rolls to shorten the run of the inner levee slope. The specific type of erosion control needed after invasive non-native species removal should be determined on a case-by-case basis for each restoration area.
• Containment versus Eradication. In some instances, it may not be feasible to
eradicate all of an invasive non-native species, but the species could be reduced to an acceptable level. A success criterion of a maximum of 10% vegetative cover of invasive non-native plant species is suggested. Kikuyu grass is particularly difficult to eradicate, and may be a species that needs to be contained to smaller patches, especially if herbicides are not used. Kikuyu grass is rhizomatous, and easily reproduces from stem fragments. This invasive grass species spreads to form thick patches of woven turf. Deep scalping is necessary to remove the turf, and consequently leaves disturbed soil surfaces. The resulting barren slopes may be subject to soil erosion, which could cause sedimentation into the river.
• Documentation. Photographs should be taken of the specific restoration sites both
before and after removing the invasive non-native plants present. Ideally the locations will also be mapped onto an aerial photograph, so that monitoring and follow-up removal may be accurately conducted. Notes should be recorded on the
Swanson Hydrology & Geomorphology Lower San Lorenzo River & Lagoon Management Plan
Page 4-19
Hydrology / Geomorphology / Restoration / Water Resources / Construction Planning & Supervision
types of control methods used (hand-pulling, hoeing, etc.), frequency, the number of labor hours involved, and whether erosion control measures were implemented. This information will help the City determine the level of future maintenance needed to control/remove invasive non-native plants.
Phase 2: Monitor Natural Recruitment of Native Plant Species Once the invasive plant species have been removed, the restoration sites should be monitored in spring and fall for 1 to 2 years to see which native plant species re-establish naturally. A qualified botanist should conduct monitoring of natural recruitment. The effectiveness of removal methods for invasive non-native plants should also be monitored. Notes recorded on naturally recruiting native species will guide the active revegetation of the restoration sites, if revegetation is deemed necessary. The proposed planting lists in this plan (Tables 8, 9 and 10) are therefore subject to refinement according to the monitoring results.
Phase 3: Revegetation Program to Promote the Establishment of Native Plants In general, a conservative approach is recommended for active revegetation. Natural processes that allow recruitment of native plant species are preferred and likely to be more successful than planting. If planting is desired or needed, it is recommended that smaller revegetation areas should be implemented first, as field tests. The estuarine area is anticipated to be one area where active revegetation will need to occur due to the condition of riprap slopes. Once field-testing proves successful, revegetation activities may be increased in scope. The revegetated areas may require periodic removal of invasive non-native plants, or the expansion of existing plant communities. Vegetated islands or upper portions of sandbars, having more stable conditions, may also be an option for planting, if compatible with the results of the hydraulic studies. The amount of planting will also be limited in that too much vegetation/roughness can impede water flows and compromise flood control measures. In general, areas close to the bridges should not be planted, as these constriction points need to be kept clear for flood capacity.
Native Plant Species Proposed for Revegetation As mentioned above, monitoring areas for natural recruitment of native plants will provide information that may be used to refine the planting lists presented in this report (Tables 8, 9, and 10). A proposed planting list has been prepared for the Riverine Reach, Transitional Reach, and Estuarine Reach. The species listed and their bank locations have been determined through field surveys along the river and at coastal reference sites.
• Riverine Reach (Highway 1 to Water Street Bridge). The plant species proposed for revegetation in the Riverine Reach are listed in Table 8. All of the tree species listed, including white alder, black cottonwood, box elder, and yellow willow, have been observed along the urban riparian corridor. Many of the listed shrubs (California blackberry, coffeeberry, wild rose, and thimbleberry) have berries that may be utilized by wildlife. Sandbar willow (Salix exigua) has been observed at the Pajaro River in Watsonville, but not at the San Lorenzo River. Sandbar willow may have been present historically and is a good species to plant in sandbars and along
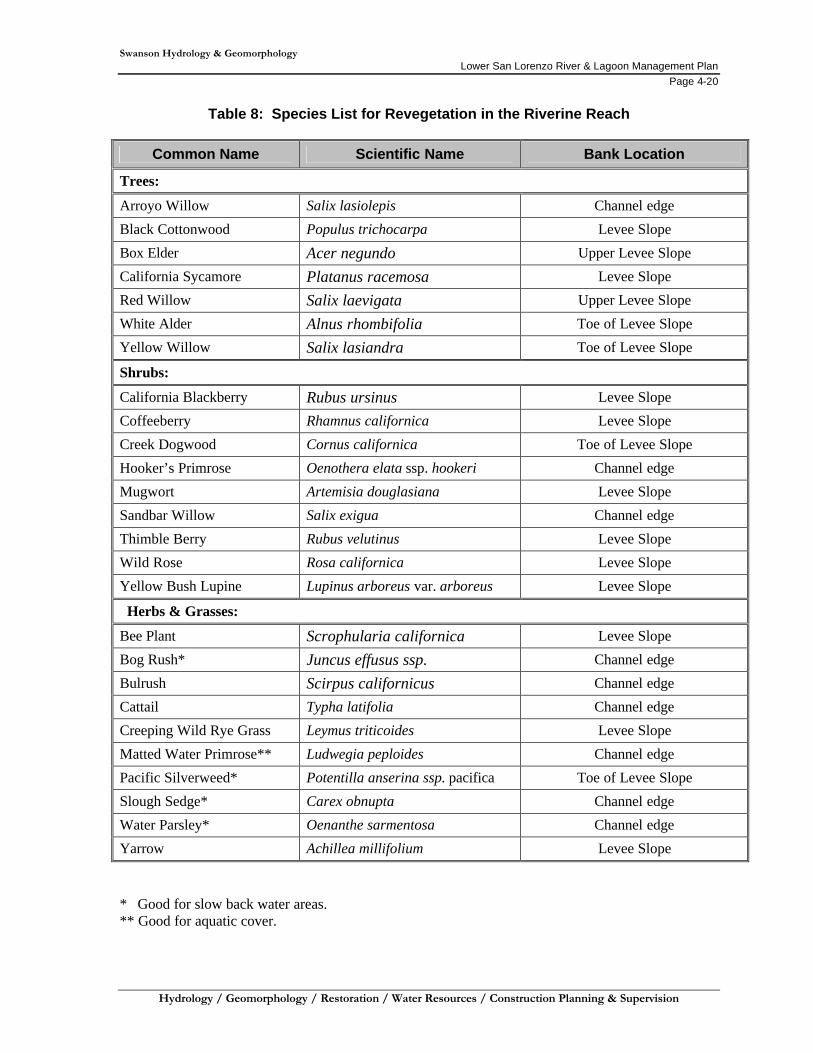
Swanson Hydrology & Geomorphology Lower San Lorenzo River & Lagoon Management Plan
Page 4-20
Hydrology / Geomorphology / Restoration / Water Resources / Construction Planning & Supervision
Table 8: Species List for Revegetation in the Riverine Reach
Common Name Scientific Name Bank Location
Trees:
Arroyo Willow Salix lasiolepis Channel edge
Black Cottonwood Populus trichocarpa Levee Slope
Box Elder Acer negundo Upper Levee Slope
California Sycamore Platanus racemosa Levee Slope
Red Willow Salix laevigata Upper Levee Slope
White Alder Alnus rhombifolia Toe of Levee Slope
Yellow Willow Salix lasiandra Toe of Levee Slope
Shrubs:
California Blackberry Rubus ursinus Levee Slope
Coffeeberry Rhamnus californica Levee Slope
Creek Dogwood Cornus californica Toe of Levee Slope
Hooker’s Primrose Oenothera elata ssp. hookeri Channel edge
Mugwort Artemisia douglasiana Levee Slope
Sandbar Willow Salix exigua Channel edge
Thimble Berry Rubus velutinus Levee Slope
Wild Rose Rosa californica Levee Slope
Yellow Bush Lupine Lupinus arboreus var. arboreus Levee Slope
Herbs & Grasses:
Bee Plant Scrophularia californica Levee Slope
Bog Rush* Juncus effusus ssp. Channel edge
Bulrush Scirpus californicus Channel edge
Cattail Typha latifolia Channel edge
Creeping Wild Rye Grass Leymus triticoides Levee Slope
Matted Water Primrose** Ludwegia peploides Channel edge
Pacific Silverweed* Potentilla anserina ssp. pacifica Toe of Levee Slope
Slough Sedge* Carex obnupta Channel edge
Water Parsley* Oenanthe sarmentosa Channel edge
Yarrow Achillea millifolium Levee Slope
* Good for slow back water areas. ** Good for aquatic cover.
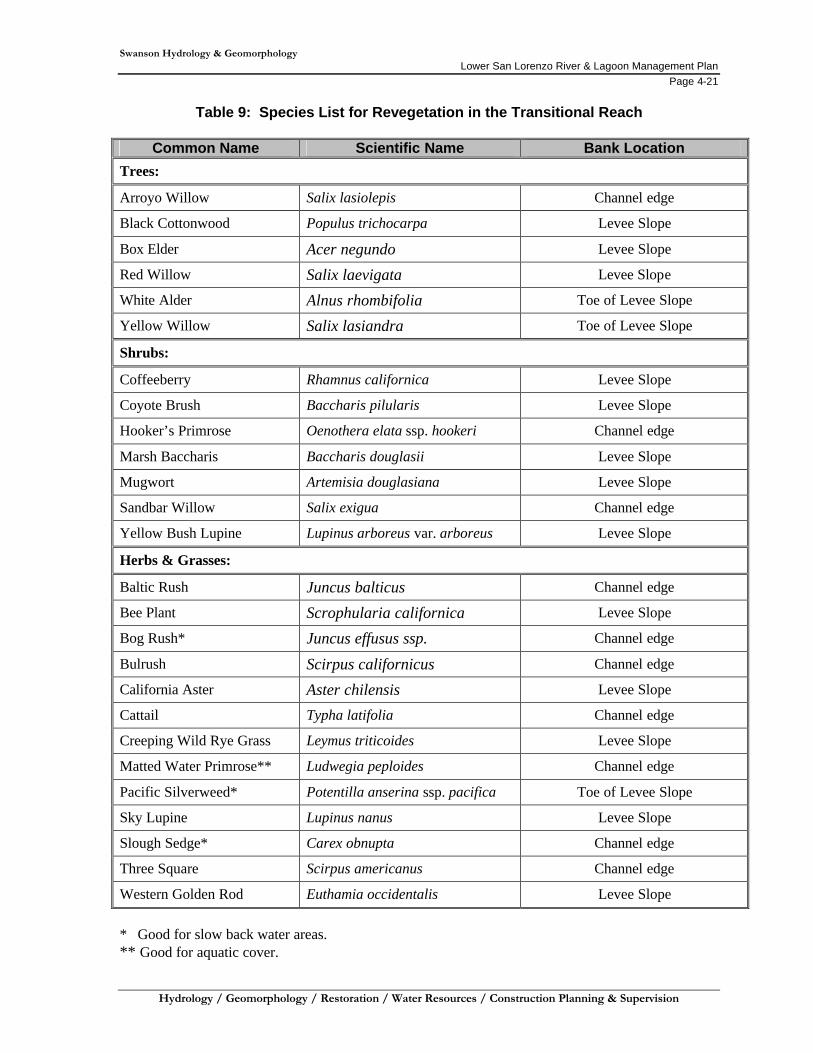
Swanson Hydrology & Geomorphology Lower San Lorenzo River & Lagoon Management Plan
Page 4-21
Hydrology / Geomorphology / Restoration / Water Resources / Construction Planning & Supervision
Table 9: Species List for Revegetation in the Transitional Reach
Common Name Scientific Name Bank Location
Trees:
Arroyo Willow Salix lasiolepis Channel edge
Black Cottonwood Populus trichocarpa Levee Slope
Box Elder Acer negundo Levee Slope
Red Willow Salix laevigata Levee Slope
White Alder Alnus rhombifolia Toe of Levee Slope
Yellow Willow Salix lasiandra Toe of Levee Slope
Shrubs:
Coffeeberry Rhamnus californica Levee Slope
Coyote Brush Baccharis pilularis Levee Slope
Hooker’s Primrose Oenothera elata ssp. hookeri Channel edge
Marsh Baccharis Baccharis douglasii Levee Slope
Mugwort Artemisia douglasiana Levee Slope
Sandbar Willow Salix exigua Channel edge
Yellow Bush Lupine Lupinus arboreus var. arboreus Levee Slope
Herbs & Grasses:
Baltic Rush Juncus balticus Channel edge
Bee Plant Scrophularia californica Levee Slope
Bog Rush* Juncus effusus ssp. Channel edge
Bulrush Scirpus californicus Channel edge
California Aster Aster chilensis Levee Slope
Cattail Typha latifolia Channel edge
Creeping Wild Rye Grass Leymus triticoides Levee Slope
Matted Water Primrose** Ludwegia peploides Channel edge
Pacific Silverweed* Potentilla anserina ssp. pacifica Toe of Levee Slope
Sky Lupine Lupinus nanus Levee Slope
Slough Sedge* Carex obnupta Channel edge
Three Square Scirpus americanus Channel edge
Western Golden Rod Euthamia occidentalis Levee Slope
* Good for slow back water areas. ** Good for aquatic cover.

Swanson Hydrology & Geomorphology Lower San Lorenzo River & Lagoon Management Plan
Page 4-22
Hydrology / Geomorphology / Restoration / Water Resources / Construction Planning & Supervision
Table 10: Species List for Revegetation in the Estuarine Reach
Common Name Scientific Name Bank Location
Trees:
White Alder Alnus rhombifolia Toe of Levee Slope
Arroyo Willow Salix lasiolepis Channel edge
Shrubs:
California Blackberry Rubus ursinus Levee Slope
California Wild Rose Rosa californica Levee Slope
Coffeeberry Rhamnus californica Levee Slope
Coyote Brush Baccharis pilularis Levee Slope
Gumplant Grindelia stricta Levee Slope
Lizard Tail Eriophyllum staechadifolium Levee Slope
Yellow Bush Lupine Lupinus arboreus var. arboreus Levee Slope
Spear Oracle Atriplex patula var. patula Levee Slope
Herbs & Grasses:
Baltic Rush Juncus balticus Channel edge
Bee Plant Scrophularia californica Levee Slope
Bulrush Scirpus californicus Channel edge
California Poppy* Eschscholzia californica Channel edge
Coast Buckwheat Eriogonum latifolium Levee Slope
Lindley’s Varied Lupine Lupinus variicolor Levee Slope
Paint Brush Castilleja foliosa Levee Slope
Salt Grass Distichlis spicata Toe of Levee Slope
Salt Rush Juncus leseurii Channel edge
Slough Sedge** Carex obnupta Channel edge
Three Square Scirpus americanus Channel edge
* Coastal ecotype of California poppy. ** Good for slow back water areas.
Swanson Hydrology & Geomorphology Lower San Lorenzo River & Lagoon Management Plan
Page 4-23
Hydrology / Geomorphology / Restoration / Water Resources / Construction Planning & Supervision
channel edges. The proposed bank locations may be refined after monitoring natural recruitment of native plants. Matted water primrose (currently prevalent in the channel) provides aquatic cover that is beneficial for fish habitat. Water parsley (Oenanthe sarmentosa) and common yarrow (Achillea millifolium) have small flowers in clusters that attract insects, which may be in turn be consumed by fish.
• Transitional Reach (Water Street Bridge to Laurel Street Bridge). The plant
species proposed for planting in the transitional reach are listed in Table 9. The listed tree and shrub species are similar to those proposed for planting in the upstream reach. Hooker’s primrose, a short-lived perennial, is common in the transitional reach, and produces copious amounts of seed that may be collected for revegetation. Creeping wild ryegrass (Leymus triticoides) provides forage for waterfowl and its creeping habit helps to stabilize the soil. Several species have also been included in Table 9 that were recorded at the Scott Creek reference site near Highway 1 including western golden rod (Euthamia occidentalis), California aster (Aster chilensis), marsh baccharis (Baccharis douglasii), and baltic rush (Juncus balticus). The marsh at Scott Creek is composed primarily of native plant species.
• Estuarine Reach (Laurel Street Bridge to rivermouth). Table 10 lists the plant
species proposed for revegetation in the Estuarine Reach, where there are brackish water conditions. Arroyo willow and white alder are the main tree species recommended, as they are the dominant trees already present in this reach. Additional salt tolerant species listed are gumplant, salt grass (Distichlis spicata), salt rush (Juncus leseurii), and spear oracle (Atriplex patula var. patula). Most of the shrub species listed are appropriate for planting on the upper bank and include California blackberry, coyote brush, yellow bush lupine (Lupinus arboreus var. arboreus), and lizard tail (Eriophyllum staechadifolium).
Other Revegetation Projects outside the Riverbank Shoreline Zone There are many other native riparian vegetation enhancement measures away from the shoreline zone that are valuable in expanding riparian corridor width and continuity. These measures include:
• Expanding the existing mature mixed riparian forest that occurs along the riverbank of San Lorenzo Park and improve the habitat value of the existing understory. This would involve exotic plant removal and revegetation with native trees and shrubs.
• Revegetate the upper bank just upstream of the Soquel Street Bridge near the
confluence with Branciforte Creek. Eucalyptus trees and acacia trees currently occupy this area. This would provide for a more continuous wildlife corridor connecting to the mature riparian forest at San Lorenzo Park.
• Preserve and enhance the wide riverbank along River Street south by the pedestrian
bridge. Revegetate with native plant species listed in Table 6 and include black
Swanson Hydrology & Geomorphology Lower San Lorenzo River & Lagoon Management Plan
Page 4-24
Hydrology / Geomorphology / Restoration / Water Resources / Construction Planning & Supervision
cottonwoods (tall at maturity) to provide fish shade, and arroyo willow and box elder trees with branching lateral canopies that are good for bird habitat.
• Plant native trees and shrubs on the upper bank of the Riverine Reach at selected
locations that are compatible with the desired flood capacity. • Remove/control high priority invasive, non-native plant species on the inner levee
slopes and river banks from Highway 1 to the river mouth. Removal efforts should start at the east bank of the river along San Lorenzo Park. Intensive efforts are likely for up to five years and periodic follow-up removal efforts are likely in perpetuity, depending on the results of monitoring surveys.
Restoration Recommendation 4: Develop Planning for Floodplain and Marsh Restoration in Special Planning Areas The scope of this Management Plan includes a reconnaissance assessment of potential areas where the natural flood plain or marsh plain areas could be expanded, including setting back levees. The scope of the assessment includes an estimate of project features and benefits to natural resources and opportunities and constraints for development. Completing enhancement projects within confining levees has limitations where the available width is less than that required to sustain a channel and adjacent flood plain surfaces. The greatest opportunity to expand habitat acreage and restore geomorphic and hydrologic function important to a self-sustaining ecosystem along the San Lorenzo River is to set levees back and restore low floodplain surfaces adjacent to the river channel. This action would develop the proper hydrology, flood inundation frequency, scour and fine mineral soil deposition to promote native vegetation and primary biological productivity (i.e., organic carbon input, insect growth and aquatic macroinvertebrates). Three areas along the San Lorenzo River, all formerly low floodplain surfaces, were researched in this study for feasibility of restoration:
1. The Seaside Company/Santa Cruz Boardwalk Third Street Parking Lot, 2. The area on the north bank of the river between Riverside Avenue and
Broadway/Laurel Bridges, which includes some City tennis courts; 3. San Lorenzo Park between the Branciforte Creek confluence and Water Street.
Restoration of these areas for floodplain requires modification of their current uses: Seaside Company land as a parking lot; San Lorenzo Park lawn as a recreation area; and the tennis courts at Broadway to Riverside Street site for active recreation. Converting these uses to habitat restoration is the first step for designing specific plans. This could not be accomplished during the preparation of the Plan, however it should be the focus of future planning efforts by the City.
Swanson Hydrology & Geomorphology Lower San Lorenzo River & Lagoon Management Plan
Page 4-25
Hydrology / Geomorphology / Restoration / Water Resources / Construction Planning & Supervision
The Seaside Company / Santa Cruz Boardwalk Parking Lot There is no doubt from a scientific standpoint that a levee setback and marsh restoration project at the Seaside Company Parking Lot would have significant benefits to the ecosystem of the River and Lagoon. The estuarine marsh and island were destroyed in 1958 by the levee construction project and converted to a parking lot. It is clear from an examination of historical photos that this area supported a range of aquatic and terrestrial habitats not seen within the river system today. Restoring it would bring these habitats back into the system physically, but just as important would be the reintroduction of natural geomorphic processes that sustain habitat and ecosystem vitality. The benefits anticipated with this project would be:
• Restored vegetation communities native to the estuarine environment replacing bare riprap slopes;
• Restored primary production for fish and waterfowl where such production is now
severely limited; • Improved food sources and habitats for waterfowl and songbirds, including possible
areas for breeding; • Improved habitat for fish including improved depth and object cover refugia and
production of food sources; and • Dramatically improved visual aesthetics with substantial opportunities for improved
public access between the Main Beach and the trails on the levees. The estimated cost of the project would be approximately $6-8 million. The City should continue efforts to pursue funding for this project. Detailed planning should proceed once the project area is defined and negotiations with the Seaside Company are complete.
Laurel Street Extension/Third Street Bank Erosion Control Project The realignment of the San Lorenzo River by the Corps of Engineers 1960 flood control project resulted in increased riverbank erosion along the southern riverbank adjacent to Laurel Street Extension and Third Street. To prevent further erosion and street collapse, a sculptured tieback bank face and riverbank riparian planting is proposed for approximately 900 feet of this riverbank. A design concept plan for this section of riverbank has been developed through a public participation process, which contains the following elements:
• A connection of the bike path between the Riverside Avenue and Laurel Street bridges;
• River bank vegetation; • A sculptured concrete wall to mimic the existing visual appearance of the riverside
cliff; and
Swanson Hydrology & Geomorphology Lower San Lorenzo River & Lagoon Management Plan
Page 4-26
Hydrology / Geomorphology / Restoration / Water Resources / Construction Planning & Supervision
• A river viewing area at the intersection of Third Street and Laurel Street Extension which avoids impacting the deep river pools adjacent to Third Street and Laurel Street Extension
Implementation of this plan is estimated to cost approximately $4.7 million, of which Congress has authorized the Corps of Engineers to fund $3.1 million. To construct the project and avoid the related street collapse impact on the San Lorenzo River, the City needs to secure $1.6 million in local or state grant funding. Construction of this project will complete the last remaining element in the levee bike and pedestrian pathway.
San Lorenzo Park For the “benchland” at San Lorenzo Park, there are many possible projects for environmental enhancement including fully dredging backwater wetlands to yield an island along the east bank of the river, to expansion of the native riparian corridor without any grading. Significant issues related to park use and urban planning are complex and could not be resolved to provide a clear direction. Given these circumstances, the City should designate a Special Planning Areas for this potential restoration site where enhancement options could be considered in light of park use issues.
Riverside Avenue and Laurel / Broadway Tennis Courts The area between Broadway and Riverside Avenue was considered during the levee raising project and the benefits were found to be too limited for the cost ($2-4 million; Joe Hall, personal communication, 2001). As a result, the other two areas are of higher priority and no further planning work for removing the tennis courts is recommended.
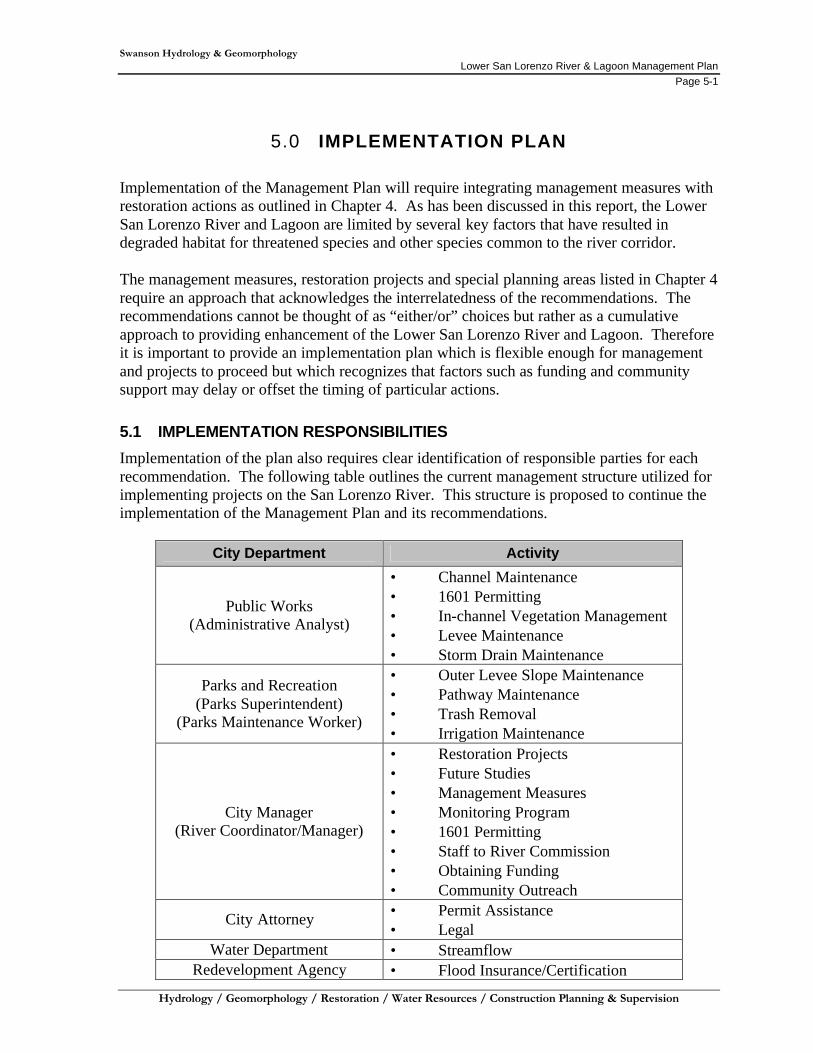
Swanson Hydrology & Geomorphology Lower San Lorenzo River & Lagoon Management Plan
Page 5-1
Hydrology / Geomorphology / Restoration / Water Resources / Construction Planning & Supervision
5.0 IMPLEMENTATION PLAN Implementation of the Management Plan will require integrating management measures with restoration actions as outlined in Chapter 4. As has been discussed in this report, the Lower San Lorenzo River and Lagoon are limited by several key factors that have resulted in degraded habitat for threatened species and other species common to the river corridor. The management measures, restoration projects and special planning areas listed in Chapter 4 require an approach that acknowledges the interrelatedness of the recommendations. The recommendations cannot be thought of as “either/or” choices but rather as a cumulative approach to providing enhancement of the Lower San Lorenzo River and Lagoon. Therefore it is important to provide an implementation plan which is flexible enough for management and projects to proceed but which recognizes that factors such as funding and community support may delay or offset the timing of particular actions.
5.1 IMPLEMENTATION RESPONSIBILITIES
Implementation of the plan also requires clear identification of responsible parties for each recommendation. The following table outlines the current management structure utilized for implementing projects on the San Lorenzo River. This structure is proposed to continue the implementation of the Management Plan and its recommendations.
City Department Activity
Public Works (Administrative Analyst)
• Channel Maintenance • 1601 Permitting • In-channel Vegetation Management • Levee Maintenance • Storm Drain Maintenance
Parks and Recreation (Parks Superintendent)
(Parks Maintenance Worker)
• Outer Levee Slope Maintenance • Pathway Maintenance • Trash Removal • Irrigation Maintenance
City Manager (River Coordinator/Manager)
• Restoration Projects • Future Studies • Management Measures • Monitoring Program • 1601 Permitting • Staff to River Commission • Obtaining Funding • Community Outreach
City Attorney • Permit Assistance • Legal
Water Department • Streamflow Redevelopment Agency • Flood Insurance/Certification

Swanson Hydrology & Geomorphology Lower San Lorenzo River & Lagoon Management Plan
Page 5-2
Hydrology / Geomorphology / Restoration / Water Resources / Construction Planning & Supervision
It is proposed that a permanent advisory body or commission be created to oversee the implementation of the Management Plan during the next 15 years. This body should be appointed by the City Council and charged with implementing recommendations from the Management Plan. Recommendations for the structure of this body will be developed by the San Lorenzo Urban River Plan Task Force and forwarded to the Santa Cruz City Council in March 2002. At this time the permanent river oversight body is proposed to be staffed from the City Manager’s office.
5.2 SCHEDULE OF IMPLEMENTATION
The Management Plan provides a 15-year plan for the management and restoration of the Lower San Lorenzo River and Lagoon. Year 1 of the plan will be established as 2002. The plan will most effectively be completed in 5-year increments with management and restoration actions being implemented simultaneously as funding permits.
Adaptive Management and Monitoring As stated in the findings and conclusions portion of this report, the River is responding to natural processes. New stands of riparian vegetation, riverbed features and channels are now present. This indicates that more habitat will be created in the future by simply allowing natural geomorphic processes to take place with minimal intervention and by following the management recommendations in Chapter 4 consistent with flood control. Restoration actions will help to enhance natural channel features and will provide additional habitat areas for use by targeted species. Due to these factors, monitoring of management prescriptions and restoration projects will be critical to the success of the Management Plan. A technical advisory committee should be formed within the first year to develop a comprehensive monitoring program. It will be important that the plan be implemented according to an adaptive management strategy that responds to monitoring results and findings. A monitoring program for the Management Plan is included as Chapter 6. Funding will be one of the largest obstacles to ensuring implementation of the management and restoration actions. For this reason, it will be important to demonstrate the success of restoration projects with regards to improving or providing additional habitat, documenting increases in the population of a species, or use of an area by a species previously not present. In the same context, monitoring will also provide an assessment of whether management and restoration actions are not working as predicted and what kinds of adjustments need to be done with regards to design or implementation.
Feasibility of Proposed Measures Many of the proposed restoration actions are feasible today given public land ownership of the river channel, levees and San Lorenzo Park and the probable minor impact to operation of the flood control system. These include riparian vegetation enhancement and installation of instream and shoreline structures to improve aquatic habitat diversity. In fact, all of the proposed management and restoration actions can be designed in a manner that does not impact the flood control system.
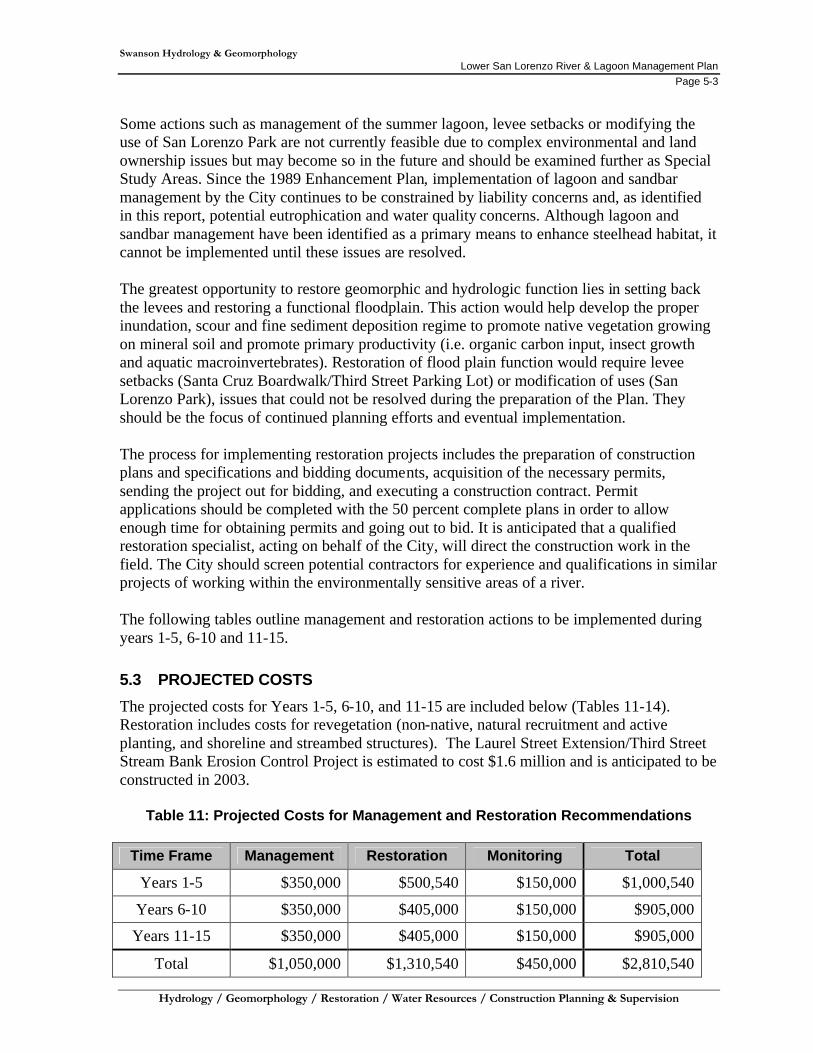
Swanson Hydrology & Geomorphology Lower San Lorenzo River & Lagoon Management Plan
Page 5-3
Hydrology / Geomorphology / Restoration / Water Resources / Construction Planning & Supervision
Some actions such as management of the summer lagoon, levee setbacks or modifying the use of San Lorenzo Park are not currently feasible due to complex environmental and land ownership issues but may become so in the future and should be examined further as Special Study Areas. Since the 1989 Enhancement Plan, implementation of lagoon and sandbar management by the City continues to be constrained by liability concerns and, as identified in this report, potential eutrophication and water quality concerns. Although lagoon and sandbar management have been identified as a primary means to enhance steelhead habitat, it cannot be implemented until these issues are resolved. The greatest opportunity to restore geomorphic and hydrologic function lies in setting back the levees and restoring a functional floodplain. This action would help develop the proper inundation, scour and fine sediment deposition regime to promote native vegetation growing on mineral soil and promote primary productivity (i.e. organic carbon input, insect growth and aquatic macroinvertebrates). Restoration of flood plain function would require levee setbacks (Santa Cruz Boardwalk/Third Street Parking Lot) or modification of uses (San Lorenzo Park), issues that could not be resolved during the preparation of the Plan. They should be the focus of continued planning efforts and eventual implementation. The process for implementing restoration projects includes the preparation of construction plans and specifications and bidding documents, acquisition of the necessary permits, sending the project out for bidding, and executing a construction contract. Permit applications should be completed with the 50 percent complete plans in order to allow enough time for obtaining permits and going out to bid. It is anticipated that a qualified restoration specialist, acting on behalf of the City, will direct the construction work in the field. The City should screen potential contractors for experience and qualifications in similar projects of working within the environmentally sensitive areas of a river. The following tables outline management and restoration actions to be implemented during years 1-5, 6-10 and 11-15.
5.3 PROJECTED COSTS
The projected costs for Years 1-5, 6-10, and 11-15 are included below (Tables 11-14). Restoration includes costs for revegetation (non-native, natural recruitment and active planting, and shoreline and streambed structures). The Laurel Street Extension/Third Street Stream Bank Erosion Control Project is estimated to cost $1.6 million and is anticipated to be constructed in 2003.
Table 11: Projected Costs for Management and Restoration Recommendations
Time Frame Management Restoration Monitoring Total
Years 1-5 $350,000 $500,540 $150,000 $1,000,540
Years 6-10 $350,000 $405,000 $150,000 $905,000
Years 11-15 $350,000 $405,000 $150,000 $905,000
Total $1,050,000 $1,310,540 $450,000 $2,810,540

Table 12: Management and Restoration Actions (Years 1-5)
Timeframe Reach Management Actions Management Focus Restoration Actions Restoration Focus
YEARS 1-5 Estuarine Phase 1 riparian vegetation restoration: control non-natives Vegetation Install 10 streambed structures per hydrologist identified location Geomorphology/Wildlife
Establish 10 foot riparian buffer along stream edge Vegetation Install 10 shoreline structures per hydrologist identified location Geomorphology/Wildlifemeasured from wetted edge in summer
Phase 3: Revegetation program to promote nativesAvoid disturbance to emergent vegetation growing in channel bottom Geomorphologywithin 10 feet of toe of slope.
Allow volunteer riparian trees to establish in groves Vegetation
Every two years remove woody vegetation between established groves Vegetation
Limb up vegetation 6-8 feet from base Hydrology
Remove all trees greater than 6 inches diameter at breast height Hydrology
Establish by-pass flow of 6.5 cfs in July to allow for lagoon filling - Hydrology/Wildlifeflow should be available for 7 days
Phase 2: Monitor natural recruitment
Transitional Phase 1 riparian vegetation restoration: control non-natives Vegetation Install 10 streambed structures per hydrologist identified location Geomorphology/Wildlife
Establish 5 foot riparian buffer along stream edge measured from wetted edge in summer Vegetation/Wildlife Install 10 shoreline structures per hydrologist identified location Geomorphology/Wildlife
Establish 10 foot riparian buffer along toe of levee slope measured from base of levee Vegetation/Wildlife
Allow volunteer riparian trees to establish in groves on west bank Vegetation
Every two years remove woody vegetation between established groves Vegetation/Hydrology
Limb up vegetation 6-8 feet from base on west bank Hydrology
Along San Lorenzo Park remove trees that fall in water Hydrology
Select for and maintain overhanging trees along San Lorenzo Park Wildlife
Maintain 50 foot vegetation break on either side of pedestrian bridge Hydrology
Remove young willows on east bank (San Lorenzo Park) Vegetation
Phase 2: Monitor natural recruitment
Riverine Conduct sediment disking to loosen sediment bars in mid channel Hydrology No restoration actions recommended
Allow volunteer riparian trees to establish in groves Vegetation
Every two years remove woody vegetation between established groves Vegetation
Remove all trees greater than 6 inches diameter at breast height Hydrology
Establish 5 foot riparian buffer along stream edge measured from wetted edge in summer Vegetation/Wildlife
Establish 10 foot riparian buffer along toe of levee slope measured from base of levee Vegetation/Wildlife
Determine flow characteristics of channel based on review Geomorphology/Wildlifeof flow duration curve. Establish plan with resource agencies for maintaining the presence of one or two channels through the summer season.
Phase 2: Monitor natural recruitment
Lower San Lorenzo River and Lagoon Management Plan
Swanson Hydrology and Geomorphology115 Limekiln Street Santa Cruz, CA 95060
tel: 831.427.0288 fax: 831.427.0472
Table 13: Management and Restoration Actions (Years 6-10)
Timeframe Reach Management Actions Management Focus Restoration Actions Restoration Focus
YEARS 6-10 Estuarine Phase 2: Monitor natural recruitment of native plant species Vegetation Install 12 streambed structures per hydrologist identified location Geomorphology/Wildlife
Establish 10 foot riparian buffer along stream edge Vegetation Install 20 shoreline structures per hydrologist identified location Geomorphology/Wildlifemeasured from wetted edge in summer
Begin investigation of special planning areas Wildlife/VegetationAvoid disturbance to emergent vegetation growing in channel bottom Geomorphologywithin 10 feet of toe of slope. Phase 3: Revegation Program to Promote Natives Vegetation
Allow volunteer riparian trees to establish in groves Vegetation
Every two years remove woody vegetation between established groves Vegetation
Limb up vegetation 6-8 feet from base Hydrology
Remove all trees greater than 6 inches diameter at breast height Hydrology
Transitional Phase 2: Monitor natural recruitment of native plant species Vegetation Install 20 streambed structures per hydrologist identified location Geomorphology/Wildlife
Establish 5 foot riparian buffer along stream edge measured from wetted edge in summer Vegetation/Wildlife Install 20 shoreline structures per hydrologist identified location Geomorphology/Wildlife
Establish 10 foot riparian buffer along toe of levee slope measured from base of levee Vegetation/Wildlife Begin investigation of special planning areas Wildlife/Vegetation
Allow volunteer riparian trees to establish in groves on west bank Vegetation Phase 3: Revegation Program to Promote Natives Vegetation
Every two years remove woody vegetation between established groves Vegetation/Hydrology
Limb up vegetation 6-8 feet from base on west bank Hydrology
Along San Lorenzo Park remove trees that fall in water Hydrology
Select for and maintain overhanging trees along San Lorenzo Park Wildlife
Maintain 50 foot vegetation break on either side of pedestrian bridge Hydrology
Remove young willows on east bank (San Lorenzo Park) Vegetation
Riverine Conduct sediment disking to loosen sediment bars in mid channel Hydrology Phase 3: Revegation Program to Promote Natives Vegetation
Allow volunteer riparian trees to establish in groves Vegetation
Every two years remove woody vegetation between established groves Vegetation
Remove all trees greater than 6 inches diameter at breast height Hydrology
Establish 5 foot riparian buffer along stream edge measured from wetted edge in summer Vegetation/Wildlife
Establish 10 foot riparian buffer along toe of levee slope measured from base of levee Vegetation/Wildlife
Phase 2: Monitor natural recruitment of native plant species Vegetation
Lower San Lorenzo River and Lagoon Management Plan
Swanson Hydrology and Geomorphology115 Limekiln Street Santa Cruz, CA 95060
tel: 831.427.0288 fax: 831.427.0472

Table 14: Management and Restoration Actions (Years 11-15)
Timeframe Reach Management Actions Management Focus Restoration Actions Restoration Focus
YEARS 11-15 Estuarine Phase 1 & 2 riparian corridor management Vegetation Install 10 streambed structures per hydrologist identified location Geomorphology/Wildlife
Establish 10 foot riparian buffer along stream edge Vegetation Install 24 shoreline structures per hydrologist identified location Geomorphology/Wildlifemeasured from wetted edge in summer
Define outcome of special planning areas study and proceed Wildlife/VegetationAvoid disturbance to emergent vegetation growing in channel bottom Geomorphologywithin 10 feet of toe of slope. Phase 3: Revegation Program to Promote Natives Vegetation
Allow volunteer riparian trees to establish in groves Vegetation
Every two years remove woody vegetation between established groves Vegetation
Limb up vegetation 6-8 feet from base Hydrology
Remove all trees greater than 6 inches diameter at breast height Hydrology
Transitional Phase 1 & 2 riparian corridor management Vegetation Install 42 streambed structures per hydrologist identified location Geomorphology/Wildlife
Establish 5 foot riparian buffer along stream edge measured from wetted edge in summer Vegetation/Wildlife Install 34 shoreline structures per hydrologist identified location Geomorphology/Wildlife
Establish 10 foot riparian buffer along toe of levee slope measured from base of levee Vegetation/Wildlife Define outcome of special planning areas study and proceed Wildlife/Vegetation
Allow volunteer riparian trees to establish in groves on west bank Vegetation Phase 3: Revegation Program to Promote Natives Vegetation
Every two years remove woody vegetation between established groves Vegetation/Hydrology
Limb up vegetation 6-8 feet from base on west bank Hydrology
Along San Lorenzo Park remove trees that fall in water Hydrology
Select for and maintain overhanging trees along San Lorenzo Park Wildlife
Maintain 50 foot vegetation break on either side of pedestrian bridge Hydrology
Remove young willows on east bank (San Lorenzo Park) Vegetation
Riverine Conduct sediment disking to loosen sediment bars in mid channel Hydrology Phase 3: Revegation Program to Promote Natives Vegetation
Allow volunteer riparian trees to establish in groves Vegetation
Every two years remove woody vegetation between established groves Vegetation
Remove all trees greater than 6 inches diameter at breast height Hydrology
Establish 5 foot riparian buffer along stream edge measured from wetted edge in summer Vegetation/Wildlife
Establish 10 foot riparian buffer along toe of levee slope measured from base of levee Vegetation/Wildlife
Phase 2: Monitor natural recruitment of native plant species Vegetation
Lower San Lorenzo River and Lagoon Management Plan
Swanson Hydrology and Geomorphology115 Limekiln Street Santa Cruz, CA 95060
tel: 831.427.0288 fax: 831.427.0472
Swanson Hydrology & Geomorphology Lower San Lorenzo River & Lagoon Management Plan
Page 5-7
Hydrology / Geomorphology / Restoration / Water Resources / Construction Planning & Supervision
Financing and Potential Funding Sources Management and restoration recommendations included in the Management Plan will be implemented as funding becomes available through City funds and resource grants. The City established a stormwater utility fund for the purpose of financing improvements to the River levee system and its associated infrastructure. The fund is an enterprise fund and is limited in the types of projects which may be funded through it. The City utilizes the fund for management and maintenance projects and the annual vegetation maintenance activities required by the Corps. Installation of the restoration projects and vegetation enhancement projects are considered capital improvement projects and will require dedicated funding from the City’s general fund or funding from resource grants. It is anticipated that grants will be sought from the following resource agencies during the implementation period of the Management Plan. National Oceanic and Atmospheric Administration – National Marine Fisheries Service Environmental Protection Agency California State Coastal Conservancy California Department of Fish and Game California State Water Resources Control Board Central Coast Regional Water Quality Control Board National Fish and Wildlife Foundation County of Santa Cruz Implementation projects should allow for at least one year for grant funding to be acquired and confirmed. Multiple projects that compliment one another should be packaged in grant requests as often as possible.
Swanson Hydrology & Geomorphology Lower San Lorenzo River & Lagoon Management Plan
Page 6-1
Hydrology / Geomorphology / Restoration / Water Resources / Construction Planning & Supervision
6.0 MONITORING PLAN
6.1 PURPOSE OF MONITORING PLAN
The monitoring plan for the Management Plan will assess the performance of the management and restoration recommendations relative to the stated goals of the plan. The monitoring plan will provide information that will be used to improve the performance of the management and restoration actions and the long-term success of the actions. For a true evaluation of ecological conditions, the monitoring program needs to provide information on physically, chemically and biologically functional responses to restoration or active management. These responses will then be compared with identified expectations for management and restoration projects (i.e., - presence of specific species, increased productivity) and a feedback loop will be created to adjust management and restoration as necessary.
6.2 RESTORATION GOALS AND OBJECTIVES
The restoration goals defined for the Management Plan include increasing the abundance and diversity of native flora and fauna above baseline 2000 levels; enhancing habitat conditions for special status species to improve populations above baseline 2000 levels; restoring geomorphic and hydrologic form and function to improve channel and habitat conditions; and maintaining adequate flood capacity to convey a 100-year flow. Objectives for the plan focus on the following riverine conditions and biological communities:
• Vegetation • Vertebrates (fish, birds, small mammals, herptiles) • Invertebrates (aquatic) • Water Quality • Geomorphology and Hydrology
The defined timeline for the plan is 15 years with recommended restoration actions occurring in five-year increments. Monitoring will occur in the first year after plan adoption and will focus on implementation and effectiveness monitoring. Implementation monitoring will evaluate actual implementation of plan recommendations. Effectiveness monitoring will evaluate whether the restoration recommendations and projects are meeting the objectives of the restoration plan. Effectiveness monitoring will be more long term and will provide the necessary data for adaptive management.
6.3 BASELINE CONDITIONS
The baseline conditions for measurement of restoration effectiveness will be based on data collected during 1999-2001. During this period the following studies and monitoring activities occurred. Additional data from past surveys and monitoring activities provide a dataset of historic conditions.
Swanson Hydrology & Geomorphology Lower San Lorenzo River & Lagoon Management Plan
Page 6-2
Hydrology / Geomorphology / Restoration / Water Resources / Construction Planning & Supervision
Vegetation Mapping of plant communities, sandbars, artificial bank stabilization (i.e., riprap) and open water areas occurring from Highway 1 south to the river mouth were mapped in Fall 2000 by Native Vegetation Network. The locations of plant communities and other ground features were mapped onto a 1999 aerial photograph (scale 1 inch equals 75 feet; photo base from digital orthophoto). Each mapped unit included overstory plant community, understory plant community, and the three most common species present in the overstory and/or understory as applicable. The mapped information was digitized and entered into a geographic information system, which enables determination of each plant community type or ground feature. A more detailed discussion of this mapping procedure and resulting GIS maps are included in Chapter 2 of the Management Plan.
Wildlife Fish – Population estimates for steelhead trout have been prepared by D.W. Alley and Associates from 1994-2000 for the San Lorenzo River mainstem. The study involved fish sampling and habitat evaluation for juvenile steelhead production and rearing habitat conditions. Steelhead density was sampled at 13 mainstem sampling sites. Habitat typing was conducted in 12 reaches of the mainstem. Fish sampling was also conducted on 20 tributary sites. Densities determined by habitat type were combined with habitat proportion data by reach to estimate juvenile steelhead production in the mainstem river and its major tributaries. An estimate of an index of adults returning to the system was extrapolated from mainstem and tributary juvenile steelhead production by use of a model based on survival rates of three juvenile size classes. Data from this study was also compared to data collected in 1981. An additional dataset is available from work conducted by Dr. Jerry Smith on fish trapping conducted in spring 1987, spring 1988 and spring 1989. This study also documented other fish species present in the lagoon following a seine sampling conducted on June 20, 1986. Birds – The Point Reyes Bird Observatory has conducted point count censuses and area searches for riparian birds during the spring and summer from 1999-2001. Area searches were conducted on three plots in and around Henry Cowell State Park and on three plots from Highway 1 to the Laurel/Broadway Bridge. One point count transect was visited three times per season from the mouth of the river through the Sycamore Grove area. The area between the Highway 1 bridge and the south end of the Sycamore Grove area was excluded from this point count. Territory mapping was conducted in 1999 at two plots; one from the Water Street bridge to Soquel Avenue bridge and one within the Sycamore Grove area. The point count censuses began one year prior to the U.S. Army Corps of Engineers Flood Control Project and provide a relatively robust dataset to evaluate wildlife responses to the project. Bird species identified within the riparian area are included in Appendix A-3 of the Management Plan. Herptiles – Professional reptile and amphibian surveys have been limited in the San Lorenzo River corridor from Sycamore Grove south to the rivermouth. A California red- legged frog assessment was conducted by Brian Mori Biological Consulting Services in 1997. The assessment included a site reconnaissance, literature review, access to the California Natural Diversity Database map overlays for the Santa Cruz and Soquel quadrangles, as well as
Swanson Hydrology & Geomorphology Lower San Lorenzo River & Lagoon Management Plan
Page 6-3
Hydrology / Geomorphology / Restoration / Water Resources / Construction Planning & Supervision
consultations with other local consulting biologists and local resource agency personnel to document red-legged frog occurrences within a 5-mile radius of the project site. Reconnaissance-level field surveys recorded aquatic habitats within the flood control channel including size, water depth, qualitative assessment of turbidity, characteristic plant species, and amphibians and aquatic invertebrates observed. The upland and aquatic habitats in the river corridor were photo-documented. A sample of pool habitats observed in the flood control channel was delineated on a site map. All aquatic habitats within a 1-mile radius of the project site were mapped on a section of the USGS Santa Cruz Quadrangle. The study concluded that due to the channelization of the river together with ongoing channel maintenance activities and the magnitude of urban development surrounding the channelized portion of the river, the likelihood of red-legged frogs inhabiting the Lower River is very low (Mori, 1997). Surveys for other amphibians and reptiles have not been conducted by professional biologists in the Lower River. Aquatic Macroinvertebrates – Extensive macroinvertebrate sampling was conducted by a San Jose State University student during the summer of 1999. These samples could serve as a baseline dataset from which to build a continuing data set on macroinvertebrates in the restoration project area. Laboratory analysis and identification of the samples still needs to be conducted.
Water Quality Water quality data from 1995-2001 is available from Santa Cruz County Environmental Health Department Water Quality Laboratory for the lagoon area and stormdrain outlets along the Lower River. Water quality parameters available include bacteria, nitrate-nitrogen, dissolved oxygen, pH, temperature, turbidity, and conductivity. Historic data on water quality conditions is available through this agency back to 1953. Sediment sampling conducted from 1995-1997 also provides a dataset on nutrients and bacteria in sediments in the Lower River. Trace metals and synthetic trace organic compound levels in tissues from resident clams and transplanted freshwater clams was documented in a 1996 study at four sites in the San Lorenzo watershed including one site in the Lower River.
Geomorphologic and Hydrologic Conditions Geomorphic and hydrologic data is available from 1982 through the present as the result of various studies conducted by the U.S. Army Corps of Engineers, the University of California Santa Cruz Geology Department and the City of Santa Cruz. This dataset is probably the most robust dataset available for the river channel in the enhancement plan area. Pertinent baseline data sets include the cross-sections completed for the HEC-RAS model in 2000, the thalweg profile completed in 2000, and the thalweg profile completed for the Corps design on the flood control improvement project. Stream flow measurements conducted in 2001 will provide baseline information for streamflow and the development of a flow duration curve will provide an additional management tool for stream flow based on rain year. Finally the United State Geological Survey (USGS) streamflow gauge at Big Trees station provides a historic dataset for discharge from 1937 through the present. An additional USGS gauge at the Tait Street Diversion also documents discharge in the Lower River. Finally data collected on lagoon water levels during 1998-2001 will provide lagoon water surface elevations in a closed sandbar and open sandbar condition.
Swanson Hydrology & Geomorphology Lower San Lorenzo River & Lagoon Management Plan
Page 6-4
Hydrology / Geomorphology / Restoration / Water Resources / Construction Planning & Supervision
6.4 MONITORING PARAMETERS
Vegetation Vegetation Monitoring Objectives
1. Assess the success of planted riparian and grassland areas on the outer levee banks
2. Assess enhancement of the natural riparian area on the inner levees through natural recruitment, management prescriptions, and active planting.
Restoration objectives identified for vegetation include promoting structural diversity and density of the inner channel and outer levee riparian corridor; increasing the width of the riparian corridor consistent with flood control constraints; and enhancing populations of native riparian species. Restoration recommendations for vegetation focus on enhancing shoreline and riparian corridor vegetation through controlling non-native plant species (phase 1), natural recruitment (phase 2), and active revegetation in specific areas (phase 3). Reference areas north of Highway One on the east bank will help guide vegetation structure (diversity, age, species composition) and function (nutrient cycling, habitat values). Baseline Data Set Baseline data used for effectiveness evaluation will be the 2000 vegetation map and associated plant lists and field datasheets described in the baseline conditions discussion above. Success Criteria for Evaluation
Plant Survival. On the levee landscape areas plant replacement should be at 100% in the case of failure of planted trees and shrubs during years 1 and 2 of the establishment period; Vegetative Cover. Maximum of 10% vegetative cover of high priority/perennial, invasive non-native plants; Bare Ground. Maximum of 10% bare ground; Species Richness. Minimum of three different native tree species, a minimum of three native shrub species, and a minimum of 5 different herbaceous species.
Monitoring Methods
Planted Riparian and Grassland Areas – Outer Levee Banks The following monitoring procedures will be used during the five years following installation of plants along the outer levee banks. This planting was completed as part of the flood control levee raising project constructed from 1999-2003. Monitoring will document the success of planted and seeded areas per specifications of the flood control project. Monitoring will be conducted by a qualified botanist or revegetation specialist.
Swanson Hydrology & Geomorphology Lower San Lorenzo River & Lagoon Management Plan
Page 6-5
Hydrology / Geomorphology / Restoration / Water Resources / Construction Planning & Supervision
Establishment period monitoring will include monitoring of plant survival, growth, percent vegetative cover of native vegetation versus non-native vegetation, percent cover of invasive non-native species, species richness, and any noted erosion or site disturbance problems. Monitoring during the 5-year establishment period after installation will help to insure that the planted restoration area will proceed toward long-term vegetation restoration goals, and will allow for remedial action as needed.
Reconnaissance Surveys. A qualified botanist or revegetation specialist will survey the restoration area a minimum of 6 times each of the first 3 years after planting, and a minimum of 3 times each year during Years 4 and 5. The purpose of the reconnaissance visits will be to assess how the revegetation is proceeding, and to identify problems or potential problems that may exist. During these surveys, the monitor will look for plant damage, pests and diseases, and will make recommendations to correct any significant problems or potential problems. These visits will also be used to document the need to change or adjust revegetation plan activities (i.e., altering the maintenance schedule, adding extra weed control visits, increasing or reducing the frequency or amount of irrigation water, etc.). Plant Survival and Growth. In addition to the reconnaissance surveys, one additional monitoring visit will be made in summer for the five years following installation. The summer monitoring will verify plant health, plant survival, and vegetative cover. Photodocumentation. During the summer monitoring, photographs will be taken to document the success of restoration area. Photographs will be taken from the same vantage point (photostation) and in the same direction every year. Vegetation Mapping. Vegetation mapping will be conducted every three years to document changes in plant communities. Baseline data for comparison will be the 2000 vegetation mapping at 1:75 scale.
Natural Riparian Areas Inside Bankfull Channel The natural riparian areas along the bankfull channel will be managed primarily through removal of non-native species and natural recruitment through restored hydrologic function. Installation or planting of trees, shrubs, and herbs will be kept to a minimum within the bankfull channel. Management for identified riparian species will be conducted during the annual vegetation management program for flood control and conveyance. The following monitoring parameters will be used to assess restoration effectiveness in the natural riparian area inside the bankfull channel. The goal of the monitoring will be to document the enhanced structure and diversity of the riparian area resulting from adaptive management and active restoration. These monitoring techniques should be completed on a 3-year schedule throughout the life of the project (25 years) on geographically referenced (latitude/longitude) transects or an appropriately defined unit area.
Foliage Density. Foliage density refers to the amount of green foliage present or to the amount of leaf bearing stems and leaves per unit area (Cooperrider et al, 1986). Foliage
Swanson Hydrology & Geomorphology Lower San Lorenzo River & Lagoon Management Plan
Page 6-6
Hydrology / Geomorphology / Restoration / Water Resources / Construction Planning & Supervision
density is not the same as plant density, which is a measure of the number of plants per unit area. Foliage density is taken at various vertical levels along a measured transect. Species Composition by Size Class and Condition. Identification and count of each tree/shrub species present along with documentation of size class and condition or health. Compared to unit area, tree density estimates can be derived from the data collected. Structural Type. Documents the transition from bare soil to mature riparian forest. Recognizing and classifying structural stages (young through mature) allows a quick assessment of the riparian ecosystem’s health. Vegetation Mapping. The information collected above should be mapped and available for comparison to the 2000 plant community baseline map.
Wildlife Wildlife Monitoring Objectives
1. Determine species diversity 2. Determine species abundance 3. Calculate species density
Due to the size of the project area and limited funding available for monitoring of wildlife species, monitoring for restoration effectiveness will focus primarily on species diversity, abundance and density. Species diversity provides an evaluation of the biodiversity of the River and its habitats. Multiple-year diversity studies are preferred rather than one time studies. Species abundance provides a direct method of determining abundance of wildlife in certain areas or habitats. Species density provides a measure of number of animals per unit area. Combined with the vegetation monitoring described above, wildlife monitoring for birds, small mammals, and herptiles will help to ascertain whether habitat types are supporting the microhabitats used by these species. It should be noted that wildlife monitoring is complex and should be developed with the assistance of a Technical Advisory Committee once research questions have been identified. The determination of wildlife monitoring protocols was beyond the scope of this Management Plan and due to the depth of scientific literature in this area. It is recommended that once the Technical Advisory Committee is developed a series of acceptable and preferred wildlife monitoring protocols be developed and provided in requests for monitoring by professional consultants. Baseline Data Sets The steelhead population and habitat monitoring conducted cooperatively by the City of Santa Cruz, County of Santa Cruz and San Lorenzo Valley Water District will provide a baseline data set for fisheries monitoring. The baseline data set developed by the Pt. Reyes Bird Observatory will be utilized for monitoring comparisons for birds.
Swanson Hydrology & Geomorphology Lower San Lorenzo River & Lagoon Management Plan
Page 6-7
Hydrology / Geomorphology / Restoration / Water Resources / Construction Planning & Supervision
Data sets for small mammals, herptiles and macroinvertebrates are not available. These data sets should be developed within the first three years of plan implementation. Success Criteria Wildlife species success criteria will include continued use of river habitat areas as denoted by diversity data; increases in populations above baseline levels, and increases in species density per unit area. Monitoring Methods
Fish – The restoration techniques applied in the river channel are designed to provide enhanced habitat for steelhead trout and coho salmon (if present). Since salmonids utilize various areas of the entire watershed during their lifecycle. Monitoring for presence/absence, abundance and diversity should be coordinated with the watershed wide salmonid monitoring conducted by the Santa Cruz City Water Department, San Lorenzo Valley Water District, Santa Cruz County, Department of Fish and Game, and National Marine Fisheries Service. Three monitoring stations within the restoration area should be established (one in each reach of the restoration plan area). Monitoring of salmonid populations should be conducted annually or every other year. Birds – The City of Santa Cruz should continue to work with the Point Reyes Bird Observatory to conduct point count censuses and area searches for birds during migrational and breeding periods. Nest monitoring should be initiated where feasible. Data collected for birds will be especially important for comparison to vegetation monitoring described above to help in assessing the success in restoring riparian habitat. Small Mammals – Data on small mammals is lacking for the restoration area. An initial survey should be conducted within the first three years of restoration plan adoption to establish a baseline data set for these species. Monitoring over the life of the plan should be conducted every five years. Herptiles – Aquatic amphibians are good indicators of the health of aquatic systems. These animals are especially sensitive to pollution and loss of aquatic habitat (Hall, 1980). However, it is also difficult to monitor and assess herptile populations because these animals’ activities and reproduction vary with natural environmental fluctuations such as precipitation and temperature (Cooperrider, 1986). An existing dataset on herptiles is not available for the restoration area addressed in this plan. There is an immediate need to conduct monitoring and develop a species list for herptiles in the restoration area. This baseline monitoring should be conducted within the first year of implementation of the plan. Aquatic Macroinvertebrates - Partly because of their importance within the stream community as a fundamental link in the food web between organic matter resources (e.g. leaf litter, algae, detritus) and fishes, and partly because of their diversity and ubiquity, the study of macroinvertebrates has been a central part of stream ecology (Hauer, 1996). Macroinvertebrates are aquatic insects that live on the channel bottom (e.g. bedrock, cobble) or other stable surfaces (e.g. roots, snags). The types and numbers of macroinvertebrates present in the stream can provide clues to the health of the stream.
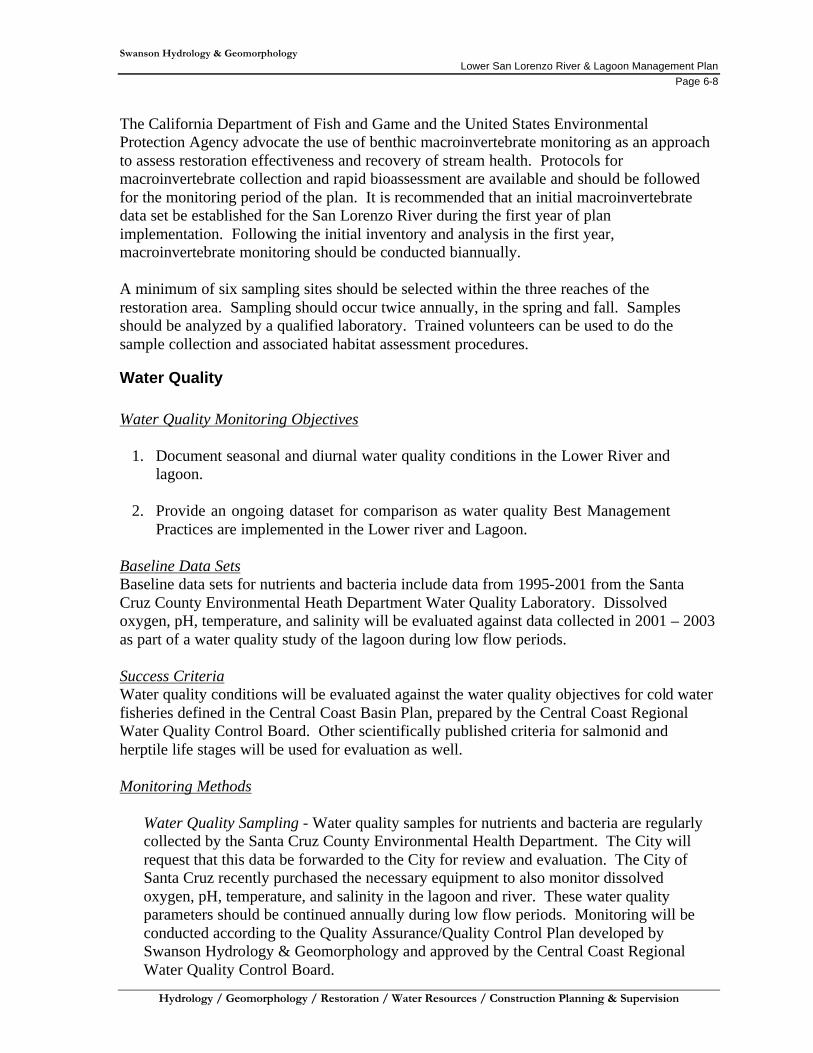
Swanson Hydrology & Geomorphology Lower San Lorenzo River & Lagoon Management Plan
Page 6-8
Hydrology / Geomorphology / Restoration / Water Resources / Construction Planning & Supervision
The California Department of Fish and Game and the United States Environmental Protection Agency advocate the use of benthic macroinvertebrate monitoring as an approach to assess restoration effectiveness and recovery of stream health. Protocols for macroinvertebrate collection and rapid bioassessment are available and should be followed for the monitoring period of the plan. It is recommended that an initial macroinvertebrate data set be established for the San Lorenzo River during the first year of plan implementation. Following the initial inventory and analysis in the first year, macroinvertebrate monitoring should be conducted biannually. A minimum of six sampling sites should be selected within the three reaches of the restoration area. Sampling should occur twice annually, in the spring and fall. Samples should be analyzed by a qualified laboratory. Trained volunteers can be used to do the sample collection and associated habitat assessment procedures.
Water Quality Water Quality Monitoring Objectives
1. Document seasonal and diurnal water quality conditions in the Lower River and lagoon.
2. Provide an ongoing dataset for comparison as water quality Best Management
Practices are implemented in the Lower river and Lagoon. Baseline Data Sets Baseline data sets for nutrients and bacteria include data from 1995-2001 from the Santa Cruz County Environmental Heath Department Water Quality Laboratory. Dissolved oxygen, pH, temperature, and salinity will be evaluated against data collected in 2001 – 2003 as part of a water quality study of the lagoon during low flow periods. Success Criteria Water quality conditions will be evaluated against the water quality objectives for cold water fisheries defined in the Central Coast Basin Plan, prepared by the Central Coast Regional Water Quality Control Board. Other scientifically published criteria for salmonid and herptile life stages will be used for evaluation as well. Monitoring Methods
Water Quality Sampling - Water quality samples for nutrients and bacteria are regularly collected by the Santa Cruz County Environmental Health Department. The City will request that this data be forwarded to the City for review and evaluation. The City of Santa Cruz recently purchased the necessary equipment to also monitor dissolved oxygen, pH, temperature, and salinity in the lagoon and river. These water quality parameters should be continued annually during low flow periods. Monitoring will be conducted according to the Quality Assurance/Quality Control Plan developed by Swanson Hydrology & Geomorphology and approved by the Central Coast Regional Water Quality Control Board.

Swanson Hydrology & Geomorphology Lower San Lorenzo River & Lagoon Management Plan
Page 6-9
Hydrology / Geomorphology / Restoration / Water Resources / Construction Planning & Supervision
Geomorphic and Hydrologic Monitoring Objectives
1. To evaluate changes in physical habitat resulting from management and restoration actions.
2. To document flow conditions. Baseline Data Set Geomorphic and hydrologic data is available for the three reaches of the channel as a result of analysis conducted in the preparation of this plan. The data from 2000 channel conditions will be utilized as a baseline for comparison. Success Criteria The overall health of the habitat and the plants and animals that use it depends upon the hydrologic and geomorphic condition of the channel. The goal of enhancing the Lower River’s geomorphic character is to create a self-sustaining, natural system that can support a native flora and fauna. Hydrologically, the system should maintain adequate flow to support the habitat and the lagoon should be allowed to function naturally (i.e., – natural closing and breaching of the lagoon mouth). Monitoring Methods
Streamflow and Water Level - The variables that would be required to monitor these factors would be streamflow in the Riverine and Transitional Reaches and water level in the lagoon. Streamflow in the Riverine and Transitional Reaches should be measured twice per month during the summer low-flow period to monitor potential impacts on aquatic habitat. Water levels in the lagoon should also be monitored using a continuously recording depth gage. An attempt should be made to reoccupy a site established by Swanson Hydrology and Geomorphology at the mouth of Jessie Street Marsh. This site was abandoned in the summer of 2000 due to lack of funding and construction activities on the levee. Geomorphic Conditions - Important variables that should be used to determine adequate geomorphic conditions in the Lower River to sustain healthy habitat include substrate conditions, bankfull widths and depths, and channel roughness. These parameters should be monitored through a program of establishing approximately 10-15 permanent cross-sections along the Lower River. The cross-sections should be surveyed in the fall and spring of each year. Substrate measurements should include pebble counts, embeddedness and percent fines.
Data Management and Triennial Reports One of the challenges of initiating a comprehensive monitoring plan is the large amount of data that is generated. This data, vital to understanding and quantifying the success of the

Swanson Hydrology & Geomorphology Lower San Lorenzo River & Lagoon Management Plan
Page 6-10
Hydrology / Geomorphology / Restoration / Water Resources / Construction Planning & Supervision
recommended and implemented management actions, needs to be organized in a manner that allows for easy access, manipulation and reporting of the results. In addition to managing data generated from this monitoring plan, large amounts of data will become available from other government agencies, consulting firms and private individuals. Managing all this data needs to be centralized and coordinated to maximize the potential benefit of the collected information. To accomplish the goal of managing large amounts of data from different scientific disciplines, an initial effort has to be made to outline a data management strategy and construct. The final database must be all encompassing as well as being flexible enough to integrate new data sources. The initial development phase will dictate future success and manageability. The developed data management strategy should consider the following issues:
• Spatial context or location of data sources (GIS database development): Cross-section information should be treated differently than a vegetation map of the entire Lower River because they are different types of features (lines versus polygons). The associated data, stored in a database, should have cross-referencing to the spatial features.
• Temporal context of data sources: Many observations or measurements are time
dependent and need to be carefully considered in that context. For example, migratory birds may only be present during brief periods of time. This information must be documented and captured in the developed database.
• Metadata: Information about the source, lineage, scale, etc needs to be collected
and managed along with the actual data records. • Database updates and security: Issues regarding location, update frequency, access,
and who will be the database manager need to be considered. Since it is often difficult for individual database users to understand, sort through, and synthesis all the information that exists within a database, summary reports should be generated every three years. These reports should analyze the data collected over the three previous years. The results should describe existing conditions, discuss implementation actions completed to date, make comparisons to the results from the previous summary report and assess the current conditions in the context of the goals and priorities of the management plan.

Swanson Hydrology & Geomorphology Lower San Lorenzo River & Lagoon Management Plan
Page 6-11
Hydrology / Geomorphology / Restoration / Water Resources / Construction Planning & Supervision
MONITORING PLAN
PARAMETERS AND SCHEDULE
Restoration Plan Component
Monitoring Parameter
Prescribed Schedule
Vegetation
Outer Levee
Reconnaissance Surveys (documented plant damage, pests, disease, changes and adjustments needed in maintenance, weeding) Plant Survival & Growth (documents plant health, plant survival, and vegetative cover) Photodocumentation Mapping
Years 1-3 6 visits per year Years 4-5 3 visits per year Years 1-5 Once annually in summer Annually Every 3 years
Bankfull Channel
Foliage Density Species Composition by Age Class & Condition Structural Type Mapping
Every 3 years Every 3 years Every 3 years Every 3 years
Wildlife
Fish
Presence/Absence Population Abundance Population/Species Density
Annually or biannually Annually or biannually Annually or biannually
Birds
Presence/Absence Population Abundance Population/Species Density
Annually or biannually Annually or biannually Annually or biannually
Small Mammals
Initial Inventory Presence/Absence Population Abundance Population/Species Density
2002 Annually or biannually Annually or biannually Annually or biannually
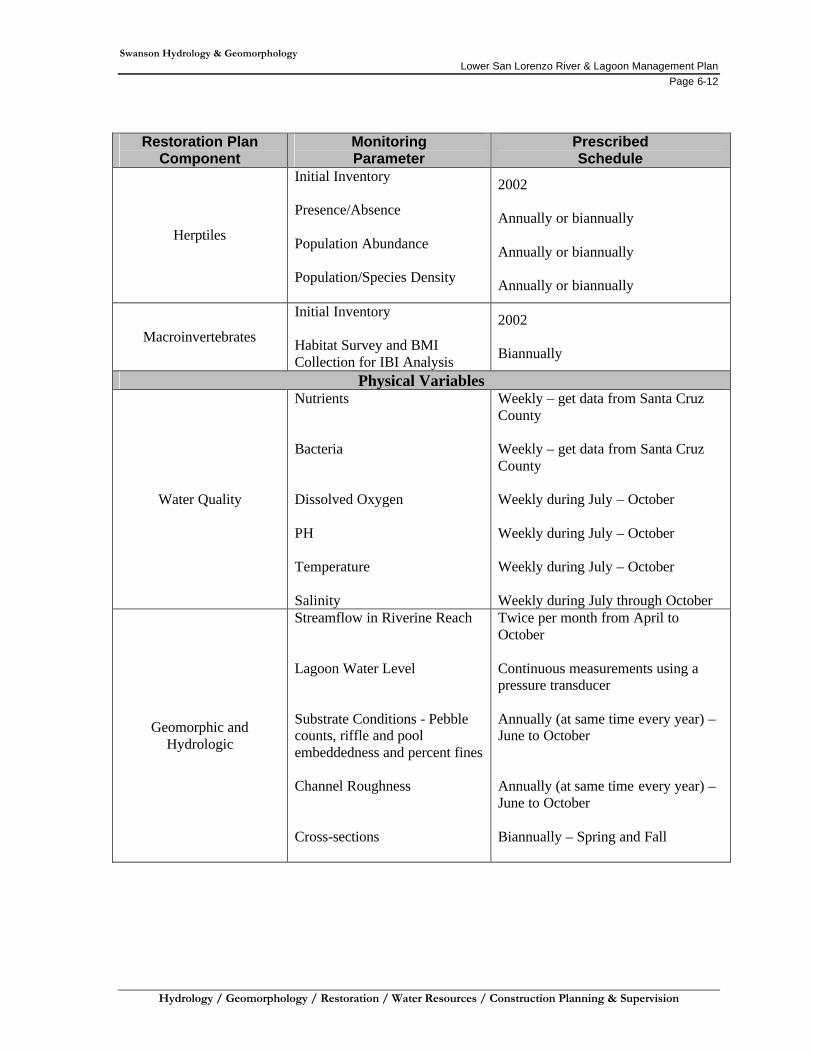
Swanson Hydrology & Geomorphology Lower San Lorenzo River & Lagoon Management Plan
Page 6-12
Hydrology / Geomorphology / Restoration / Water Resources / Construction Planning & Supervision
Restoration Plan
Component Monitoring Parameter
Prescribed Schedule
Herptiles
Initial Inventory Presence/Absence Population Abundance Population/Species Density
2002 Annually or biannually Annually or biannually Annually or biannually
Macroinvertebrates
Initial Inventory Habitat Survey and BMI Collection for IBI Analysis
2002 Biannually
Physical Variables
Water Quality
Nutrients Bacteria Dissolved Oxygen PH Temperature Salinity
Weekly – get data from Santa Cruz County Weekly – get data from Santa Cruz County Weekly during July – October Weekly during July – October Weekly during July – October Weekly during July through October
Geomorphic and Hydrologic
Streamflow in Riverine Reach Lagoon Water Level Substrate Conditions - Pebble counts, riffle and pool embeddedness and percent fines Channel Roughness Cross-sections
Twice per month from April to October Continuous measurements using a pressure transducer Annually (at same time every year) – June to October Annually (at same time every year) – June to October Biannually – Spring and Fall

Swanson Hydrology & Geomorphology Lower San Lorenzo River & Lagoon Management Plan
Page 7-1
Hydrology / Geomorphology / Restoration / Water Resources / Construction Planning & Supervision
7.0 REFERENCES CITED Alley, D.W. 2001 (unpublished). Limiting factors to juvenile steelhead and coho salmon
production in the San Lorenzo River within the Santa Cruz city limits – Draft. Pp 9. Beck, N. and Bruland, K. 2000. Diel biogeochemical cycling in a hyperventilation shallow
estuarine environment. Estuaries, Vol 23, No 2, pp 177-187. Busby, P. J., Wainwright, T. C., Bryant, G. J., Lierheimer, L. J., Waples, R. S., Waknitz, F.
W., and Lagomarsino, I. V. (1996). Status review of west coast steelhead from Washington, Idaho, Oregon, and California. National Marine Fisheries Service, Seattle, WA. NMFS-NWFSC-27.
California Partners in Flight and Riparian Habitat Joint Venture. 2000 (unpublished). The
riparian bird conservation plan. Version 1.0. Cooperrider, Allen W., Boyd, Raymond J., and Stuart, Hansen R., 1986. Inventory and
monitoring of wildlife habitat, U.S. Department of the Interior. D’Avanzo, C. and Kremer, J. 1994. Diel oxygen dynamics and anoxic events in an eutrophic
estuary of Waquoit Bay, Massachusetts. Estuaries., Vol 17, pp 131-139. Flosi, G., and Reynolds, F.L. 1998. California salmonid stream habitat restoration manual.
State of California Resources Agency, Department of Fish & Game. Hall, R.J., 1980. Effects of environmental contaminants on reptiles: a review. U.S.
Department of the Interior, Fish and Wildlife Service Special Scientific Report 228. Hauer, Richard and Lambati, Gary A., 1996. Methods in stream ecology. Academic Press. Mori. B. 1997. California red legged frog site assessment – San Lorenzo River Flood
Control Channel. Prepared for the City of Santa Cruz Public Works Department. Native Vegetation Network. 2001 (unpublished). Riparian habitat mapping for the Lower
San Lorenzo River below Highway 1 – Draft Report. National Marine Fisheries Service. 1997. Endangered and Threatened Species: Listing of
Several Evolutionary Significant Units (ESUs) of West Coast Steelhead, Final Rule. Federal Register: August 18, 1997 62(159): 43937-43954.
Pacific Rivers Council, Inc., 1996. Healing the watershed: A guide to the restoration of
watershed and native fish in the west, Pacific Rivers Council, Inc. Phillip Williams and Associates. 2001. San Lorenzo River lagoon enhancement project
hydraulic analysis. Prepared for the City of Santa Cruz.

Swanson Hydrology & Geomorphology Lower San Lorenzo River & Lagoon Management Plan
Page 7-2
Hydrology / Geomorphology / Restoration / Water Resources / Construction Planning & Supervision
Ricker, J. 2001 (unpublished). Evaluation of Urban Water Quality – Task 4 Report. In: Draft
– San Lorenzo River Watershed Management Plan Update 2000. County of Santa Cruz Environmental Health Services.
RRM Design Group and Habitat Restoration Group. 1998. Jessie Street Marsh Management
Plan. Prepared for the City of Santa Cruz Parks and Recreation Department. Skoggins, S. 2001 (unpublished). San Lorenzo River bird survey. Unpublished data. Point
Reyes Bird Observatory. Smith, J. 1989. Lagoon management. Chapter In: San Lorenzo River Enhancement Plan.
Prepared for the City of Santa Cruz. Smith, J. 1988 (unpublished). Memorandum to Mitchell Swanson regarding fisheries
concerns for Lower San Lorenzo River management. Dated August 1, 1988. Swanson, M., Phillip Williams and Associates, and John Stanley and Associates. 1989. San
Lorenzo River Enhancement Plan. Prepared for the City of Santa Cruz.
Swanson Hydrology & Geomorphology
Hydrology / Geomorphology / Restoration / Water Resources / Construction Planning & Supervision
APPENDICES
Lower San Lorenzo River & Lagoon Management Plan
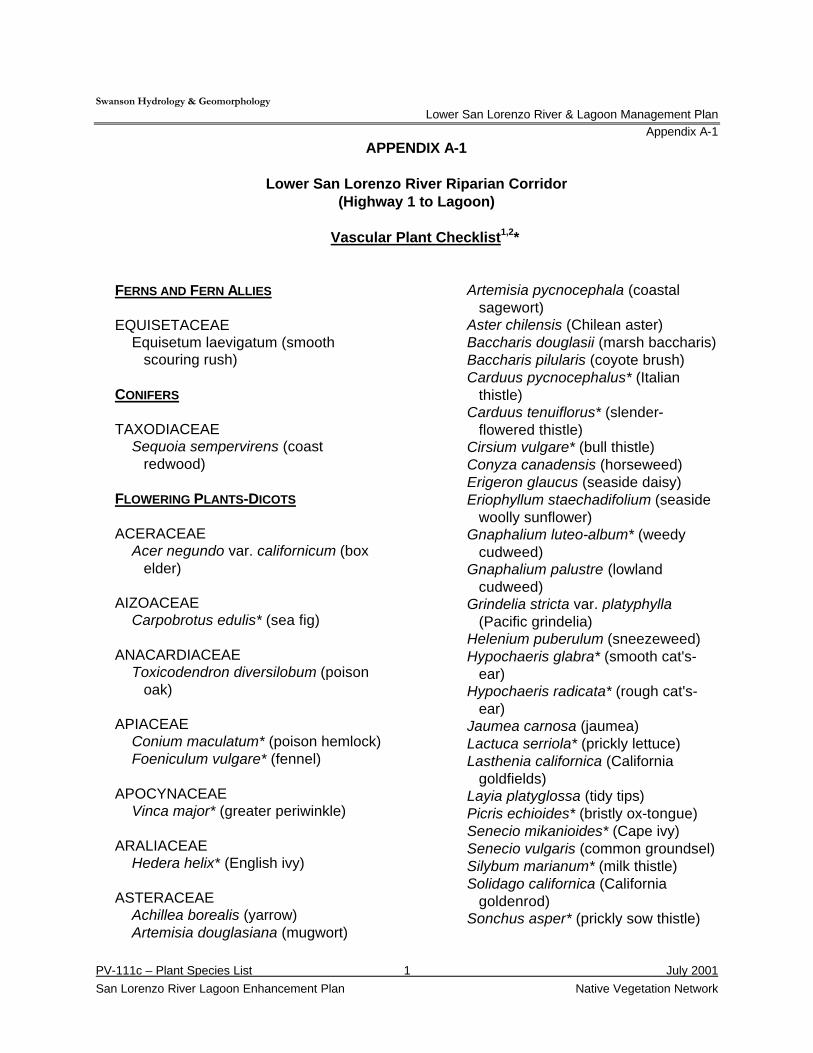
Swanson Hydrology & Geomorphology Lower San Lorenzo River & Lagoon Management Plan
Appendix A-1
PV-111c – Plant Species List 1 July 2001 San Lorenzo River Lagoon Enhancement Plan Native Vegetation Network
APPENDIX A-1
Lower San Lorenzo River Riparian Corridor (Highway 1 to Lagoon)
Vascular Plant Checklist1,2*
FERNS AND FERN ALLIES EQUISETACEAE Equisetum laevigatum (smooth
scouring rush) CONIFERS TAXODIACEAE Sequoia sempervirens (coast
redwood) FLOWERING PLANTS-DICOTS ACERACEAE Acer negundo var. californicum (box
elder) AIZOACEAE Carpobrotus edulis* (sea fig) ANACARDIACEAE Toxicodendron diversilobum (poison
oak) APIACEAE Conium maculatum* (poison hemlock) Foeniculum vulgare* (fennel) APOCYNACEAE Vinca major* (greater periwinkle) ARALIACEAE Hedera helix* (English ivy) ASTERACEAE Achillea borealis (yarrow) Artemisia douglasiana (mugwort)
Artemisia pycnocephala (coastal sagewort)
Aster chilensis (Chilean aster) Baccharis douglasii (marsh baccharis) Baccharis pilularis (coyote brush) Carduus pycnocephalus* (Italian
thistle) Carduus tenuiflorus* (slender-
flowered thistle) Cirsium vulgare* (bull thistle) Conyza canadensis (horseweed) Erigeron glaucus (seaside daisy) Eriophyllum staechadifolium (seaside
woolly sunflower) Gnaphalium luteo-album* (weedy
cudweed) Gnaphalium palustre (lowland
cudweed) Grindelia stricta var. platyphylla
(Pacific grindelia) Helenium puberulum (sneezeweed) Hypochaeris glabra* (smooth cat's-
ear) Hypochaeris radicata* (rough cat's-
ear) Jaumea carnosa (jaumea) Lactuca serriola* (prickly lettuce) Lasthenia californica (California
goldfields) Layia platyglossa (tidy tips) Picris echioides* (bristly ox-tongue) Senecio mikanioides* (Cape ivy) Senecio vulgaris (common groundsel) Silybum marianum* (milk thistle) Solidago californica (California
goldenrod) Sonchus asper* (prickly sow thistle)
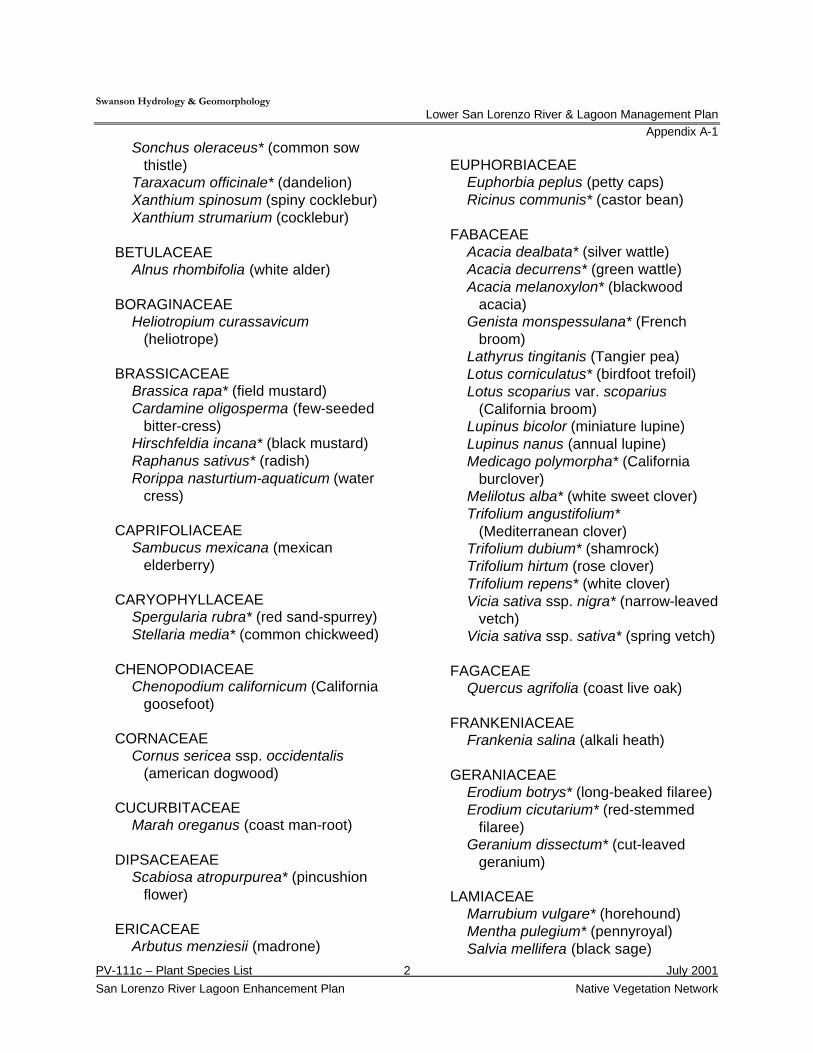
Swanson Hydrology & Geomorphology Lower San Lorenzo River & Lagoon Management Plan
Appendix A-1
PV-111c – Plant Species List 2 July 2001 San Lorenzo River Lagoon Enhancement Plan Native Vegetation Network
Sonchus oleraceus* (common sow thistle)
Taraxacum officinale* (dandelion) Xanthium spinosum (spiny cocklebur) Xanthium strumarium (cocklebur) BETULACEAE Alnus rhombifolia (white alder) BORAGINACEAE Heliotropium curassavicum
(heliotrope) BRASSICACEAE Brassica rapa* (field mustard) Cardamine oligosperma (few-seeded
bitter-cress) Hirschfeldia incana* (black mustard) Raphanus sativus* (radish) Rorippa nasturtium-aquaticum (water
cress) CAPRIFOLIACEAE Sambucus mexicana (mexican
elderberry) CARYOPHYLLACEAE Spergularia rubra* (red sand-spurrey) Stellaria media* (common chickweed) CHENOPODIACEAE Chenopodium californicum (California
goosefoot) CORNACEAE Cornus sericea ssp. occidentalis
(american dogwood) CUCURBITACEAE Marah oreganus (coast man-root) DIPSACEAEAE Scabiosa atropurpurea* (pincushion
flower) ERICACEAE Arbutus menziesii (madrone)
EUPHORBIACEAE Euphorbia peplus (petty caps) Ricinus communis* (castor bean) FABACEAE Acacia dealbata* (silver wattle) Acacia decurrens* (green wattle) Acacia melanoxylon* (blackwood
acacia) Genista monspessulana* (French
broom) Lathyrus tingitanis (Tangier pea) Lotus corniculatus* (birdfoot trefoil) Lotus scoparius var. scoparius
(California broom) Lupinus bicolor (miniature lupine) Lupinus nanus (annual lupine) Medicago polymorpha* (California
burclover) Melilotus alba* (white sweet clover) Trifolium angustifolium*
(Mediterranean clover) Trifolium dubium* (shamrock) Trifolium hirtum (rose clover) Trifolium repens* (white clover) Vicia sativa ssp. nigra* (narrow-leaved
vetch) Vicia sativa ssp. sativa* (spring vetch) FAGACEAE Quercus agrifolia (coast live oak) FRANKENIACEAE Frankenia salina (alkali heath) GERANIACEAE Erodium botrys* (long-beaked filaree) Erodium cicutarium* (red-stemmed
filaree) Geranium dissectum* (cut-leaved
geranium) LAMIACEAE Marrubium vulgare* (horehound) Mentha pulegium* (pennyroyal) Salvia mellifera (black sage)
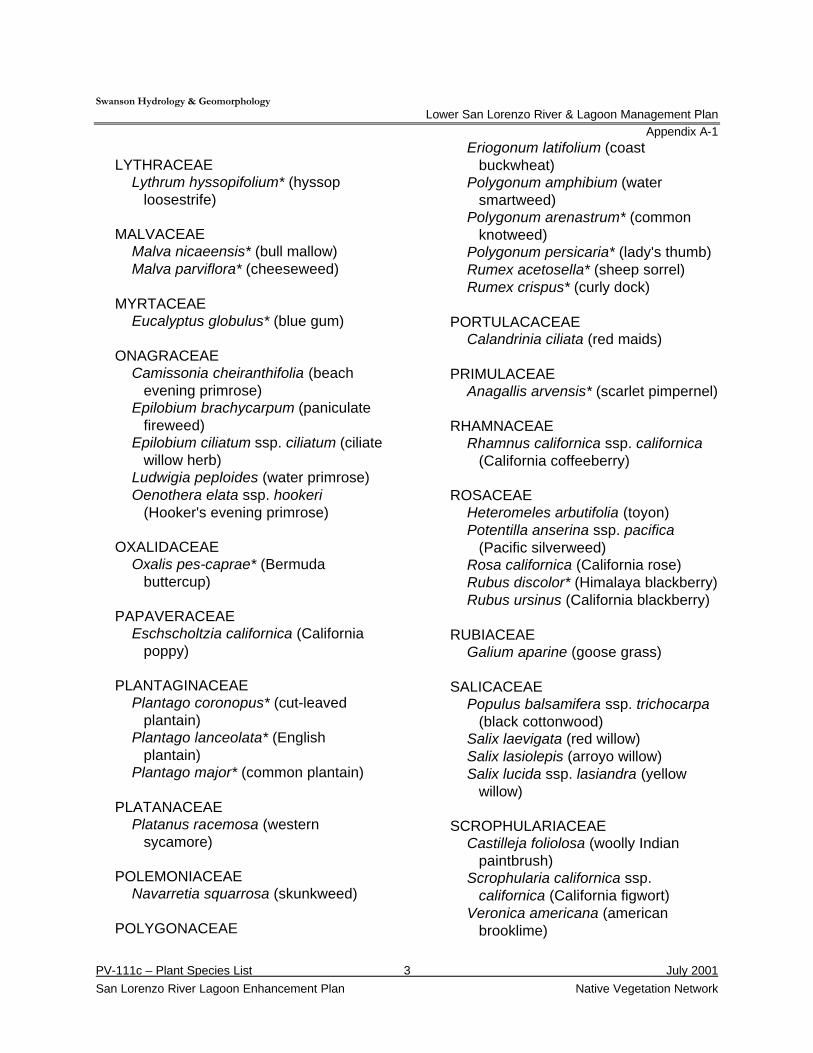
Swanson Hydrology & Geomorphology Lower San Lorenzo River & Lagoon Management Plan
Appendix A-1
PV-111c – Plant Species List 3 July 2001 San Lorenzo River Lagoon Enhancement Plan Native Vegetation Network
LYTHRACEAE Lythrum hyssopifolium* (hyssop
loosestrife) MALVACEAE Malva nicaeensis* (bull mallow) Malva parviflora* (cheeseweed) MYRTACEAE Eucalyptus globulus* (blue gum) ONAGRACEAE Camissonia cheiranthifolia (beach
evening primrose) Epilobium brachycarpum (paniculate
fireweed) Epilobium ciliatum ssp. ciliatum (ciliate
willow herb) Ludwigia peploides (water primrose) Oenothera elata ssp. hookeri
(Hooker's evening primrose) OXALIDACEAE Oxalis pes-caprae* (Bermuda
buttercup) PAPAVERACEAE Eschscholtzia californica (California
poppy) PLANTAGINACEAE Plantago coronopus* (cut-leaved
plantain) Plantago lanceolata* (English
plantain) Plantago major* (common plantain) PLATANACEAE Platanus racemosa (western
sycamore) POLEMONIACEAE Navarretia squarrosa (skunkweed) POLYGONACEAE
Eriogonum latifolium (coast buckwheat)
Polygonum amphibium (water smartweed)
Polygonum arenastrum* (common knotweed)
Polygonum persicaria* (lady's thumb) Rumex acetosella* (sheep sorrel) Rumex crispus* (curly dock) PORTULACACEAE Calandrinia ciliata (red maids) PRIMULACEAE Anagallis arvensis* (scarlet pimpernel) RHAMNACEAE Rhamnus californica ssp. californica
(California coffeeberry) ROSACEAE Heteromeles arbutifolia (toyon) Potentilla anserina ssp. pacifica
(Pacific silverweed) Rosa californica (California rose) Rubus discolor* (Himalaya blackberry) Rubus ursinus (California blackberry) RUBIACEAE Galium aparine (goose grass) SALICACEAE Populus balsamifera ssp. trichocarpa
(black cottonwood) Salix laevigata (red willow) Salix lasiolepis (arroyo willow) Salix lucida ssp. lasiandra (yellow
willow) SCROPHULARIACEAE Castilleja foliolosa (woolly Indian
paintbrush) Scrophularia californica ssp.
californica (California figwort) Veronica americana (american
brooklime)
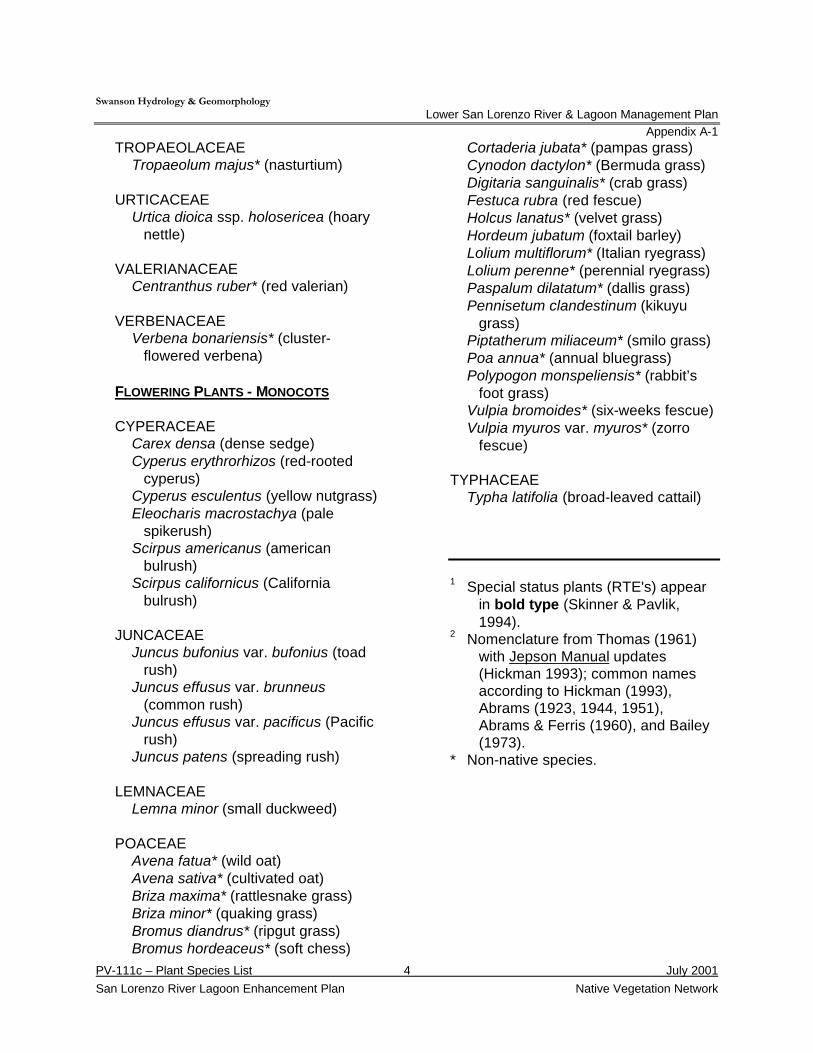
Swanson Hydrology & Geomorphology Lower San Lorenzo River & Lagoon Management Plan
Appendix A-1
PV-111c – Plant Species List 4 July 2001 San Lorenzo River Lagoon Enhancement Plan Native Vegetation Network
TROPAEOLACEAE Tropaeolum majus* (nasturtium) URTICACEAE Urtica dioica ssp. holosericea (hoary
nettle) VALERIANACEAE Centranthus ruber* (red valerian) VERBENACEAE Verbena bonariensis* (cluster-
flowered verbena) FLOWERING PLANTS - MONOCOTS CYPERACEAE Carex densa (dense sedge) Cyperus erythrorhizos (red-rooted
cyperus) Cyperus esculentus (yellow nutgrass) Eleocharis macrostachya (pale
spikerush) Scirpus americanus (american
bulrush) Scirpus californicus (California
bulrush) JUNCACEAE Juncus bufonius var. bufonius (toad
rush) Juncus effusus var. brunneus
(common rush) Juncus effusus var. pacificus (Pacific
rush) Juncus patens (spreading rush) LEMNACEAE Lemna minor (small duckweed) POACEAE Avena fatua* (wild oat) Avena sativa* (cultivated oat) Briza maxima* (rattlesnake grass) Briza minor* (quaking grass) Bromus diandrus* (ripgut grass) Bromus hordeaceus* (soft chess)
Cortaderia jubata* (pampas grass) Cynodon dactylon* (Bermuda grass) Digitaria sanguinalis* (crab grass) Festuca rubra (red fescue) Holcus lanatus* (velvet grass) Hordeum jubatum (foxtail barley) Lolium multiflorum* (Italian ryegrass) Lolium perenne* (perennial ryegrass) Paspalum dilatatum* (dallis grass) Pennisetum clandestinum (kikuyu
grass) Piptatherum miliaceum* (smilo grass) Poa annua* (annual bluegrass) Polypogon monspeliensis* (rabbit’s
foot grass) Vulpia bromoides* (six-weeks fescue) Vulpia myuros var. myuros* (zorro
fescue) TYPHACEAE Typha latifolia (broad-leaved cattail)
1 Special status plants (RTE's) appear
in bold type (Skinner & Pavlik, 1994).
2 Nomenclature from Thomas (1961) with Jepson Manual updates (Hickman 1993); common names according to Hickman (1993), Abrams (1923, 1944, 1951), Abrams & Ferris (1960), and Bailey (1973).
* Non-native species.
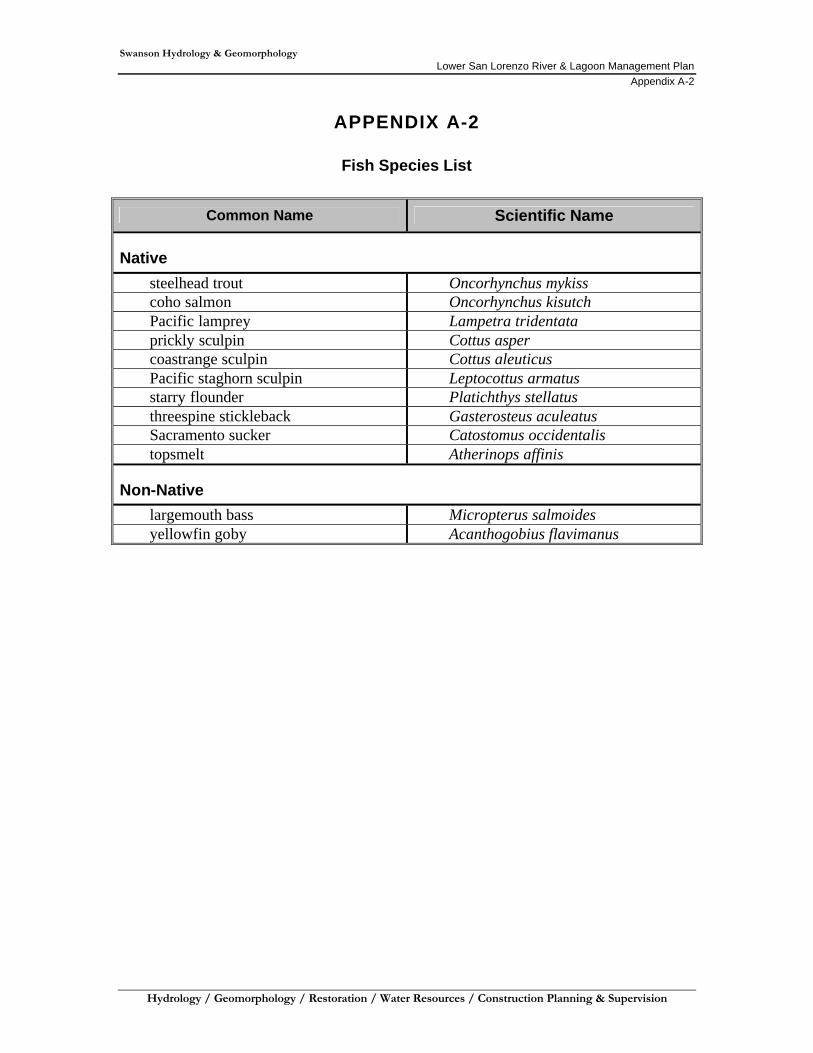
Swanson Hydrology & Geomorphology Lower San Lorenzo River & Lagoon Management Plan
Appendix A-2
Hydrology / Geomorphology / Restoration / Water Resources / Construction Planning & Supervision
APPENDIX A-2
Fish Species List
Common Name Scientific Name
Native
steelhead trout Oncorhynchus mykiss coho salmon Oncorhynchus kisutch Pacific lamprey Lampetra tridentata prickly sculpin Cottus asper coastrange sculpin Cottus aleuticus Pacific staghorn sculpin Leptocottus armatus starry flounder Platichthys stellatus threespine stickleback Gasterosteus aculeatus Sacramento sucker Catostomus occidentalis topsmelt Atherinops affinis
Non-Native
largemouth bass Micropterus salmoides yellowfin goby Acanthogobius flavimanus
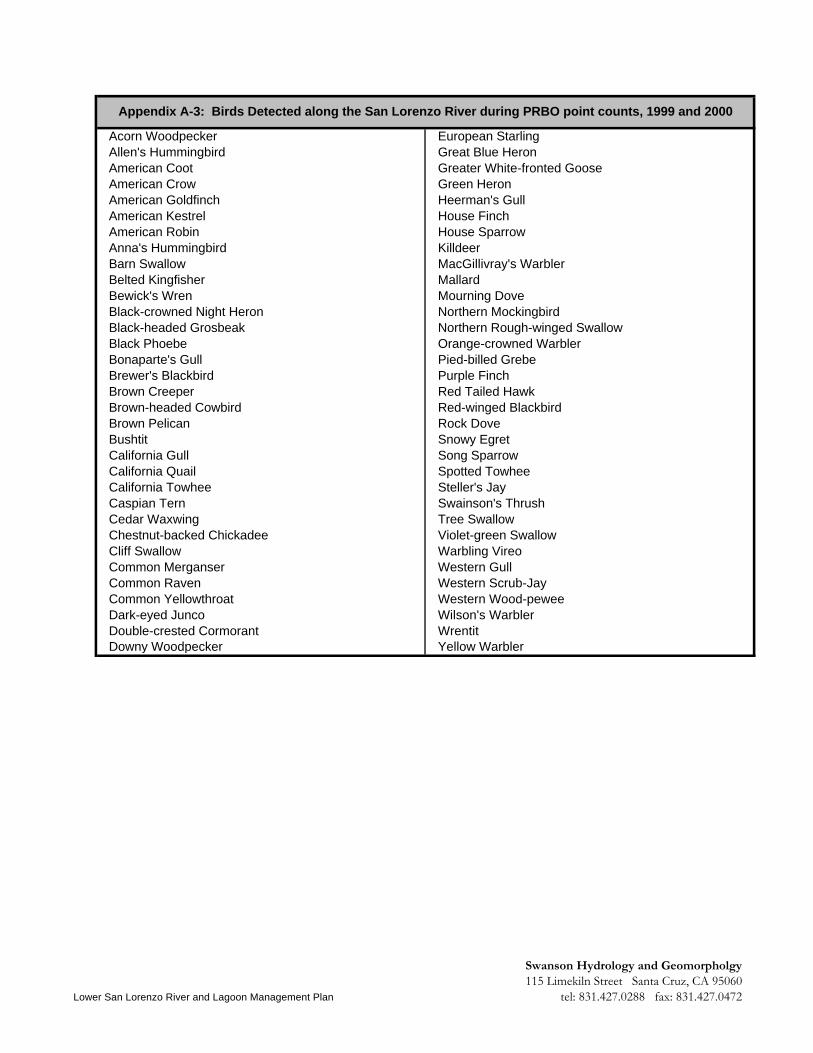
Acorn Woodpecker European StarlingAllen's Hummingbird Great Blue HeronAmerican Coot Greater White-fronted GooseAmerican Crow Green HeronAmerican Goldfinch Heerman's GullAmerican Kestrel House FinchAmerican Robin House SparrowAnna's Hummingbird KilldeerBarn Swallow MacGillivray's WarblerBelted Kingfisher MallardBewick's Wren Mourning DoveBlack-crowned Night Heron Northern MockingbirdBlack-headed Grosbeak Northern Rough-winged SwallowBlack Phoebe Orange-crowned WarblerBonaparte's Gull Pied-billed GrebeBrewer's Blackbird Purple FinchBrown Creeper Red Tailed Hawk Brown-headed Cowbird Red-winged BlackbirdBrown Pelican Rock DoveBushtit Snowy EgretCalifornia Gull Song Sparrow California Quail Spotted TowheeCalifornia Towhee Steller's Jay Caspian Tern Swainson's ThrushCedar Waxwing Tree SwallowChestnut-backed Chickadee Violet-green SwallowCliff Swallow Warbling Vireo Common Merganser Western GullCommon Raven Western Scrub-JayCommon Yellowthroat Western Wood-peweeDark-eyed Junco Wilson's Warbler Double-crested Cormorant WrentitDowny Woodpecker Yellow Warbler
Appendix A-3: Birds Detected along the San Lorenzo River during PRBO point counts, 1999 and 2000
Lower San Lorenzo River and Lagoon Management Plan
Swanson Hydrology and Geomorpholgy115 Limekiln Street Santa Cruz, CA 95060
tel: 831.427.0288 fax: 831.427.0472
Swanson Hydrology & Geomorphology Lower San Lorenzo River & Lagoon Management Plan
Appendix B
Hydrology / Geomorphology / Restoration / Water Resources / Construction Planning & Supervision
APPENDIX B
HYDROLOGIC ASSESSMENT
Technical Memorandum to the
Lower San Lorenzo River & Lagoon Management Plan
September 20, 2001
OVERVIEW
The quality of aquatic habitat conditions in the Lower River depend heavily on the quantity of water flowing through the system, especially during the low flow months of August, September and October. The amount of water available to the lower River can be significantly impacted by water diversions occurring upstream of the Highway 1 Bridge. This is especially true in the Riverine and Estuarine reaches. A City of Santa Cruz Water Department diversion on the San Lorenzo River, located at Tait Street, has the potential to significantly reduce streamflow to the lower River through the use of water for municipal supplies. During the low flow summer months and periods of drought, diversions at Tait Street can impact the lower River aquatic ecosystem by reducing available habitat, increasing water temperatures, and limiting conversion of the lagoon to freshwater. In the Riverine reach, aquatic habitat surveys have shown that the presence of a bifurcated channel has improved habitat conditions by increasing the amount of vegetated edge, therefore increasing the amount of escape cover for fish per unit area of habitat. The bifurcated channel also allows higher flows to converge into narrow channels, improving bed scour and exposing coarser sediments that ultimately improve substrate conditions for macro invertebrate production. In the Estuarine reach, the quantity of water flowing into the estuary dictates the amount of time required for conversion from saltwater to freshwater, following closure of the sand bar at the estuary mouth sometime in the summer months. If there is not enough streamflow, it is more difficult for the freshwater to displace the saltwater, resulting in a lagoon that is poorly mixed with potentially anoxic bottom waters. In addition, the amount of time required to convert the lagoon to freshwater has an impact on the primary and secondary producers in the food chain that require that hydrologic conditions remain relatively stable. Management of the lower River to improve population numbers and aquatic habitat conditions requires a good understanding of the hydrologic conditions, both in a given year and seasonally. A flow conditions summary should be a key element in any adaptive management strategy for the lower River. Appropriate hydrologic information will need to ask questions regarding what the minimum flow requirements are for healthy aquatic habitat, what flows are necessary to convert the lagoon to freshwater, and what are the historical range of flows for any given month on the Lower River. The remainder of this technical memo will attempt to answer these questions by using a combination of historical hydrologic data and recent field measurements to statistically assess monthly and seasonal flow conditions and provide a framework to make predictions that would feed into an adaptive management strategy. In addition, a coarse water balance model of lagoon filling will be described with output that will assist managers in determining minimum flow requirements into the lagoon to maintain a functioning freshwater ecosystem.
Swanson Hydrology & Geomorphology Lower San Lorenzo River & Lagoon Management Plan
Appendix B
Hydrology / Geomorphology / Restoration / Water Resources / Construction Planning & Supervision
METHODS
Exceedence Probability Estimates – Flow Predictions The primary dataset used in this analysis is the mean daily flow values from the USGS gage site #11161000, San Lorenzo River at Santa Cruz. Data for this gage site is available from 1988 to 1999, which is an 11-year record that spans periods of significant drought as well as several high flow years. Additional streamflow data was collected in the spring and summer of 2001 at the Tait Street Gage and below Highway 1. The USGS streamflow data was used to generate monthly exceedence probability flow values under different climatic conditions, namely wet, average, dry, and drought year conditions. Exceedence probabilities can be defined as the percent chance that a certain flow is exceeded under a specified criteria. For example, in July during a wet year, the flow may exceed 39 cfs, 70% of time but only exceed 42 cfs, 60% of the time. The initial step required to generate the exceedence probabilities for each month is to separate all the available flow data into wet, average, dry, and drought. The data was sorted by month and then sorted further into percentiles with a wet year being daily flow values greater than the 75th percentile, an average year ranging from the 75th to the 25th percentile, a dry year ranging from the 25th to the 10th percentile and a drought year being values occurring below the 10th percentile. Once sorted by month and flow-type the data within each class was analyzed to determine the exceedence probability using standard statistical techniques. Additional flow data was collected for the lower River on three different dates in order to verify flow predictions and to determine conditions in the bifurcated channel. Standard USGS flow estimate techniques were used that included a pygmy or Price-AA flow meter and the velocity-area technique. Measurements were made near the USGS Tait Street gage and adjacent to the Gateway Shopping Center just downstream of the Highway 1 bridge in the west and east branches of the San Lorenzo River.
Water Balance Model – Lagoon Filling A simple water balance model was developed for the lagoon to get a better understanding of the time required to fill the lagoon under different bypass flow scenarios. The water balance model took the simple form of:
Sfi1 – Eto1 – PLo2 = Sc and Sc + Se = St where: Sfi1 = Streamflow (Input Variable) Eto1 = Evapotranspiration (Output Variable) Plo2 = Percolation Loss (Output Variable) Sc = Change in Storage Se = Existing Storage St = Total Storage Total potential water storage in the lagoon was calculated using digital topographic contours provided by the U.S. Army Corp of Engineers based on conditions present in 1999. Contours were converted to a Triangular Integrated Network (TIN) to develop a continuous topographic surface. The lagoon was assumed to be full when it reached an elevation of 4.5 feet NGVD or the elevation of the top of the riffle under the Water Street Bridge. This elevation was then used to calculate a total volume for the lagoon of 4,385,340 ft3. An initial lagoon volume of 1/3rd the total volume is assumed since a
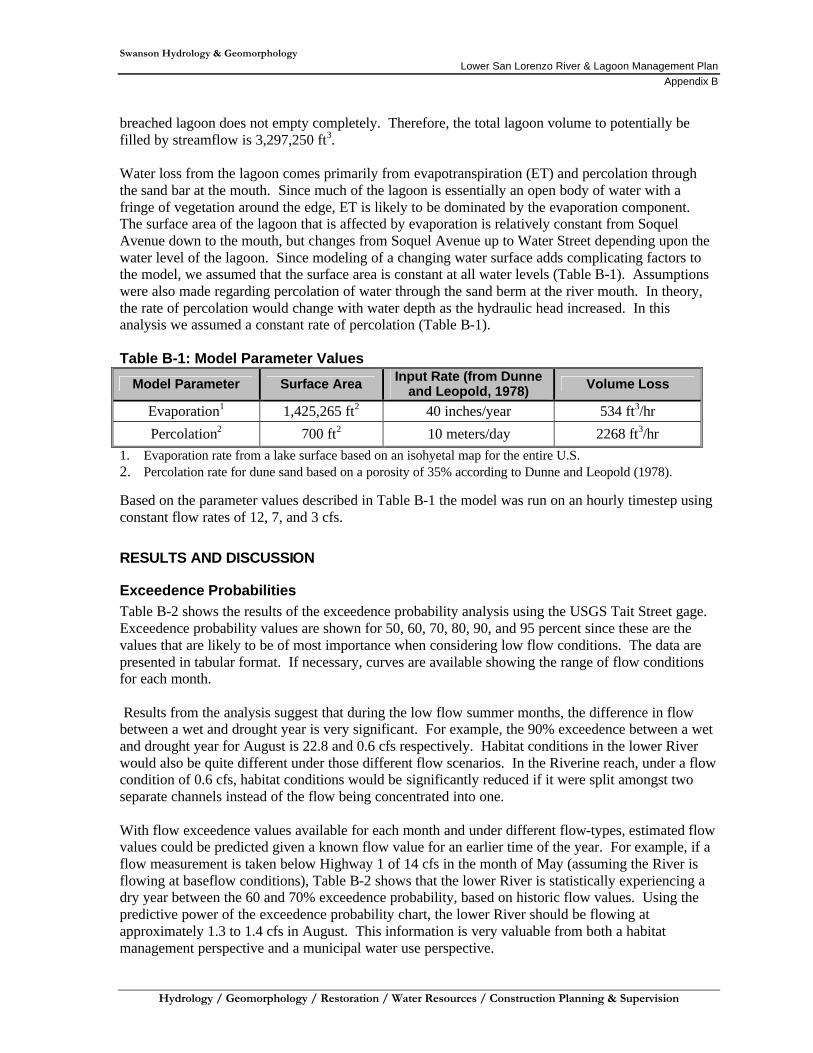
Swanson Hydrology & Geomorphology Lower San Lorenzo River & Lagoon Management Plan
Appendix B
Hydrology / Geomorphology / Restoration / Water Resources / Construction Planning & Supervision
breached lagoon does not empty completely. Therefore, the total lagoon volume to potentially be filled by streamflow is 3,297,250 ft3. Water loss from the lagoon comes primarily from evapotranspiration (ET) and percolation through the sand bar at the mouth. Since much of the lagoon is essentially an open body of water with a fringe of vegetation around the edge, ET is likely to be dominated by the evaporation component. The surface area of the lagoon that is affected by evaporation is relatively constant from Soquel Avenue down to the mouth, but changes from Soquel Avenue up to Water Street depending upon the water level of the lagoon. Since modeling of a changing water surface adds complicating factors to the model, we assumed that the surface area is constant at all water levels (Table B-1). Assumptions were also made regarding percolation of water through the sand berm at the river mouth. In theory, the rate of percolation would change with water depth as the hydraulic head increased. In this analysis we assumed a constant rate of percolation (Table B-1). Table B-1: Model Parameter Values
Model Parameter Surface Area Input Rate (from Dunne and Leopold, 1978) Volume Loss
Evaporation1 1,425,265 ft2 40 inches/year 534 ft3/hr
Percolation2 700 ft2 10 meters/day 2268 ft3/hr 1. Evaporation rate from a lake surface based on an isohyetal map for the entire U.S. 2. Percolation rate for dune sand based on a porosity of 35% according to Dunne and Leopold (1978). Based on the parameter values described in Table B-1 the model was run on an hourly timestep using constant flow rates of 12, 7, and 3 cfs.
RESULTS AND DISCUSSION
Exceedence Probabilities Table B-2 shows the results of the exceedence probability analysis using the USGS Tait Street gage. Exceedence probability values are shown for 50, 60, 70, 80, 90, and 95 percent since these are the values that are likely to be of most importance when considering low flow conditions. The data are presented in tabular format. If necessary, curves are available showing the range of flow conditions for each month. Results from the analysis suggest that during the low flow summer months, the difference in flow between a wet and drought year is very significant. For example, the 90% exceedence between a wet and drought year for August is 22.8 and 0.6 cfs respectively. Habitat conditions in the lower River would also be quite different under those different flow scenarios. In the Riverine reach, under a flow condition of 0.6 cfs, habitat conditions would be significantly reduced if it were split amongst two separate channels instead of the flow being concentrated into one. With flow exceedence values available for each month and under different flow-types, estimated flow values could be predicted given a known flow value for an earlier time of the year. For example, if a flow measurement is taken below Highway 1 of 14 cfs in the month of May (assuming the River is flowing at baseflow conditions), Table B-2 shows that the lower River is statistically experiencing a dry year between the 60 and 70% exceedence probability, based on historic flow values. Using the predictive power of the exceedence probability chart, the lower River should be flowing at approximately 1.3 to 1.4 cfs in August. This information is very valuable from both a habitat management perspective and a municipal water use perspective.
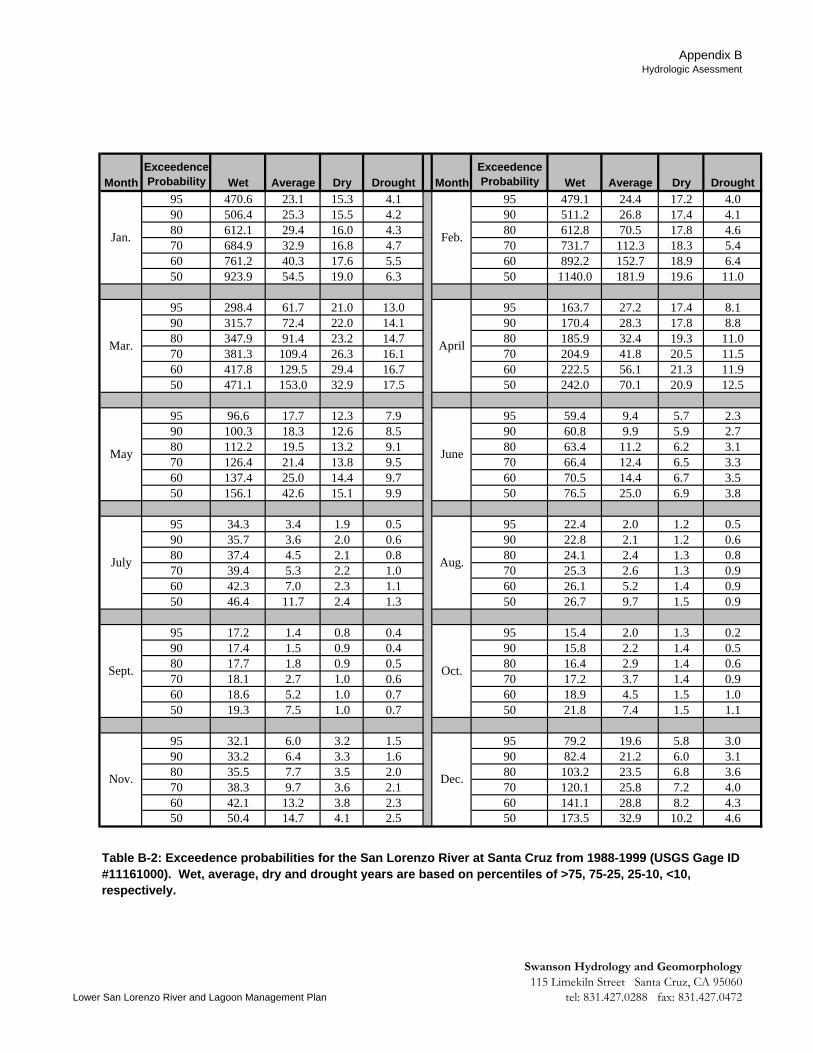
Appendix BHydrologic Asessment
MonthExceedence Probability Wet Average Dry Drought Month
Exceedence Probability Wet Average Dry Drought
95 470.6 23.1 15.3 4.1 95 479.1 24.4 17.2 4.090 506.4 25.3 15.5 4.2 90 511.2 26.8 17.4 4.180 612.1 29.4 16.0 4.3 80 612.8 70.5 17.8 4.670 684.9 32.9 16.8 4.7 70 731.7 112.3 18.3 5.460 761.2 40.3 17.6 5.5 60 892.2 152.7 18.9 6.450 923.9 54.5 19.0 6.3 50 1140.0 181.9 19.6 11.0
95 298.4 61.7 21.0 13.0 95 163.7 27.2 17.4 8.190 315.7 72.4 22.0 14.1 90 170.4 28.3 17.8 8.880 347.9 91.4 23.2 14.7 80 185.9 32.4 19.3 11.070 381.3 109.4 26.3 16.1 70 204.9 41.8 20.5 11.560 417.8 129.5 29.4 16.7 60 222.5 56.1 21.3 11.950 471.1 153.0 32.9 17.5 50 242.0 70.1 20.9 12.5
95 96.6 17.7 12.3 7.9 95 59.4 9.4 5.7 2.390 100.3 18.3 12.6 8.5 90 60.8 9.9 5.9 2.780 112.2 19.5 13.2 9.1 80 63.4 11.2 6.2 3.170 126.4 21.4 13.8 9.5 70 66.4 12.4 6.5 3.360 137.4 25.0 14.4 9.7 60 70.5 14.4 6.7 3.550 156.1 42.6 15.1 9.9 50 76.5 25.0 6.9 3.8
95 34.3 3.4 1.9 0.5 95 22.4 2.0 1.2 0.590 35.7 3.6 2.0 0.6 90 22.8 2.1 1.2 0.680 37.4 4.5 2.1 0.8 80 24.1 2.4 1.3 0.870 39.4 5.3 2.2 1.0 70 25.3 2.6 1.3 0.960 42.3 7.0 2.3 1.1 60 26.1 5.2 1.4 0.950 46.4 11.7 2.4 1.3 50 26.7 9.7 1.5 0.9
95 17.2 1.4 0.8 0.4 95 15.4 2.0 1.3 0.290 17.4 1.5 0.9 0.4 90 15.8 2.2 1.4 0.580 17.7 1.8 0.9 0.5 80 16.4 2.9 1.4 0.670 18.1 2.7 1.0 0.6 70 17.2 3.7 1.4 0.960 18.6 5.2 1.0 0.7 60 18.9 4.5 1.5 1.050 19.3 7.5 1.0 0.7 50 21.8 7.4 1.5 1.1
95 32.1 6.0 3.2 1.5 95 79.2 19.6 5.8 3.090 33.2 6.4 3.3 1.6 90 82.4 21.2 6.0 3.180 35.5 7.7 3.5 2.0 80 103.2 23.5 6.8 3.670 38.3 9.7 3.6 2.1 70 120.1 25.8 7.2 4.060 42.1 13.2 3.8 2.3 60 141.1 28.8 8.2 4.350 50.4 14.7 4.1 2.5 50 173.5 32.9 10.2 4.6
Jan. Feb.
Mar. April
May June
July Aug.
Table B-2: Exceedence probabilities for the San Lorenzo River at Santa Cruz from 1988-1999 (USGS Gage ID #11161000). Wet, average, dry and drought years are based on percentiles of >75, 75-25, 25-10, <10, respectively.
Sept. Oct.
Nov. Dec.
Lower San Lorenzo River and Lagoon Management Plan
Swanson Hydrology and Geomorphology115 Limekiln Street Santa Cruz, CA 95060
tel: 831.427.0288 fax: 831.427.0472
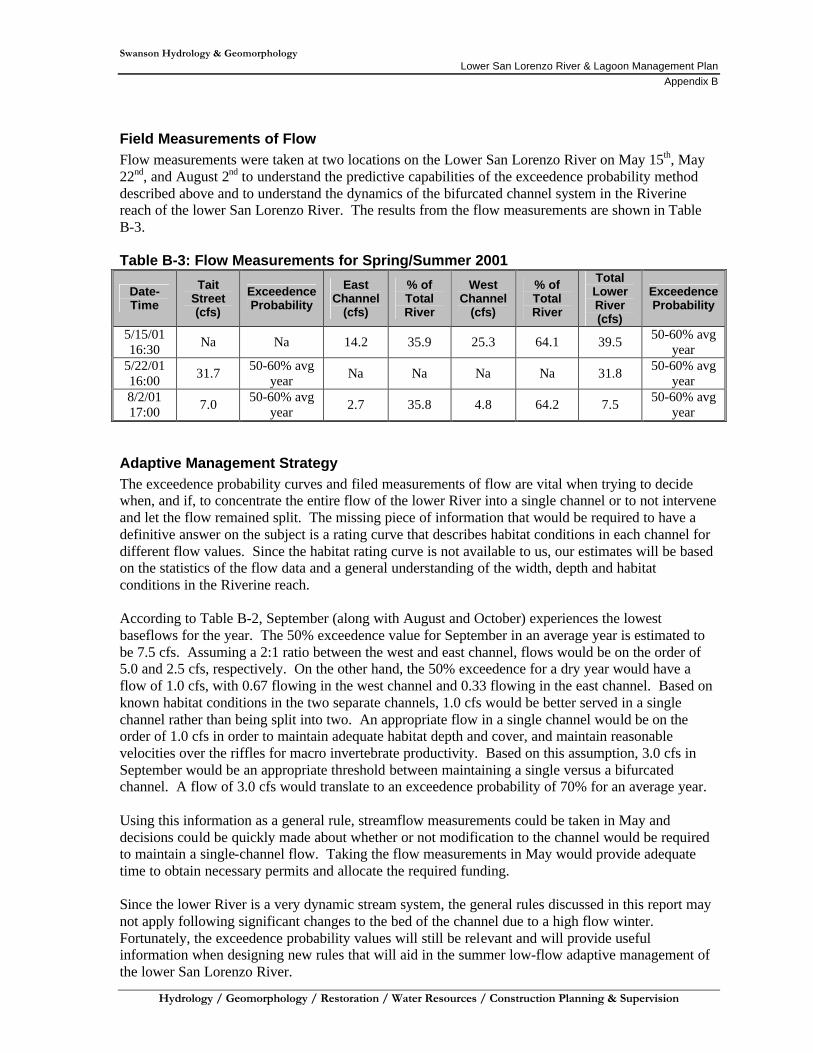
Swanson Hydrology & Geomorphology Lower San Lorenzo River & Lagoon Management Plan
Appendix B
Hydrology / Geomorphology / Restoration / Water Resources / Construction Planning & Supervision
Field Measurements of Flow Flow measurements were taken at two locations on the Lower San Lorenzo River on May 15th, May 22nd, and August 2nd to understand the predictive capabilities of the exceedence probability method described above and to understand the dynamics of the bifurcated channel system in the Riverine reach of the lower San Lorenzo River. The results from the flow measurements are shown in Table B-3. Table B-3: Flow Measurements for Spring/Summer 2001
Date-Time
Tait Street (cfs)
Exceedence Probability
East Channel
(cfs)
% of Total River
West Channel
(cfs)
% of Total River
Total Lower River (cfs)
Exceedence Probability
5/15/01 16:30 Na Na 14.2 35.9 25.3 64.1 39.5 50-60% avg
year 5/22/01 16:00 31.7 50-60% avg
year Na Na Na Na 31.8 50-60% avg year
8/2/01 17:00 7.0 50-60% avg
year 2.7 35.8 4.8 64.2 7.5 50-60% avg year
Adaptive Management Strategy The exceedence probability curves and filed measurements of flow are vital when trying to decide when, and if, to concentrate the entire flow of the lower River into a single channel or to not intervene and let the flow remained split. The missing piece of information that would be required to have a definitive answer on the subject is a rating curve that describes habitat conditions in each channel for different flow values. Since the habitat rating curve is not available to us, our estimates will be based on the statistics of the flow data and a general understanding of the width, depth and habitat conditions in the Riverine reach. According to Table B-2, September (along with August and October) experiences the lowest baseflows for the year. The 50% exceedence value for September in an average year is estimated to be 7.5 cfs. Assuming a 2:1 ratio between the west and east channel, flows would be on the order of 5.0 and 2.5 cfs, respectively. On the other hand, the 50% exceedence for a dry year would have a flow of 1.0 cfs, with 0.67 flowing in the west channel and 0.33 flowing in the east channel. Based on known habitat conditions in the two separate channels, 1.0 cfs would be better served in a single channel rather than being split into two. An appropriate flow in a single channel would be on the order of 1.0 cfs in order to maintain adequate habitat depth and cover, and maintain reasonable velocities over the riffles for macro invertebrate productivity. Based on this assumption, 3.0 cfs in September would be an appropriate threshold between maintaining a single versus a bifurcated channel. A flow of 3.0 cfs would translate to an exceedence probability of 70% for an average year. Using this information as a general rule, streamflow measurements could be taken in May and decisions could be quickly made about whether or not modification to the channel would be required to maintain a single-channel flow. Taking the flow measurements in May would provide adequate time to obtain necessary permits and allocate the required funding. Since the lower River is a very dynamic stream system, the general rules discussed in this report may not apply following significant changes to the bed of the channel due to a high flow winter. Fortunately, the exceedence probability values will still be relevant and will provide useful information when designing new rules that will aid in the summer low-flow adaptive management of the lower San Lorenzo River.
Swanson Hydrology & Geomorphology Lower San Lorenzo River & Lagoon Management Plan
Appendix B
Hydrology / Geomorphology / Restoration / Water Resources / Construction Planning & Supervision
Water Balance Model As mentioned previously, the water balance model was run on an hourly timestep for flows of 12, 7, and 3 cfs. The filling time for each of these flows were estimated to be 3.4, 6.2, and 17.2 cfs, respectively. This information was then used to generate a relationship between streamflow and the number of days required to fill the lagoon (Figure B-1). The result is a power function with the following form: 61.899 * Streamflow –1.1725 or 33.711 * Days –0.8525 Though the model has not been rigorously tested, observation during the summer of 2001 have supported the validity of the model based on 3 periods of breaching and refilling from July to September. The City of Santa Cruz will ultimately need to consult with state and federal agencies, such as the California Department of Fish and Game and the National Marine Fisheries Service, to determine an appropriate minimum bypass to maintain a freshwater lagoon. This decision will need to involve not only the results of this model and the previous discussion of minimum bypass to maintain a bifurcated channel, but include information about lagoon breaching and water quality. Based on the results of the model and knowledge about the frequent sand bar breaches that have occurred in the summer of 2000 and 2001, it is clear that the lagoon requires quick filling in order to reduce excessive transition times from a shallow, tidal system affected by saltwater inflows, to a freshwater system that can support a healthy aquatic and terrestrial food chain. Therefore, our interim recommendation would be to maintain adequate bypass flows to allow the lagoon to fill within 7 days of mouth closure or a flow of approximately 6.5 cfs, according to the model.
REFERENCE CITED Dunne, T. and L.Leopold. 1978. Water in Environmental Planning. W.H. Freeman and Company,
New York. 815 pp.
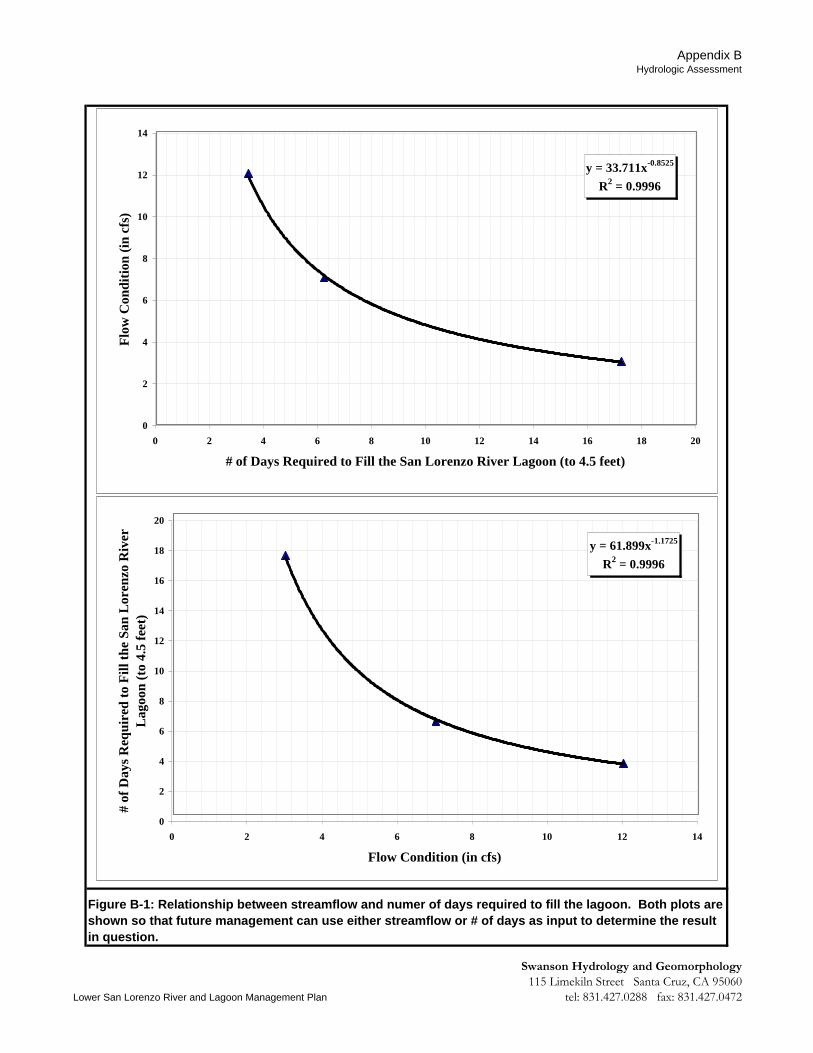
Appendix BHydrologic Assessment
Figure B-1: Relationship between streamflow and numer of days required to fill the lagoon. Both plots are shown so that future management can use either streamflow or # of days as input to determine the result in question.
y = 61.899x-1.1725
R2 = 0.9996
0
2
4
6
8
10
12
14
16
18
20
0 2 4 6 8 10 12 14
Flow Condition (in cfs)
# of
Day
s R
equi
red
to F
ill th
e Sa
n L
oren
zo R
iver
L
agoo
n (t
o 4.
5 fe
et)
y = 33.711x-0.8525
R2 = 0.9996
0
2
4
6
8
10
12
14
0 2 4 6 8 10 12 14 16 18 20
# of Days Required to Fill the San Lorenzo River Lagoon (to 4.5 feet)
Flo
w C
ondi
tion
(in
cfs)
Lower San Lorenzo River and Lagoon Management Plan
Swanson Hydrology and Geomorphology115 Limekiln Street Santa Cruz, CA 95060
tel: 831.427.0288 fax: 831.427.0472
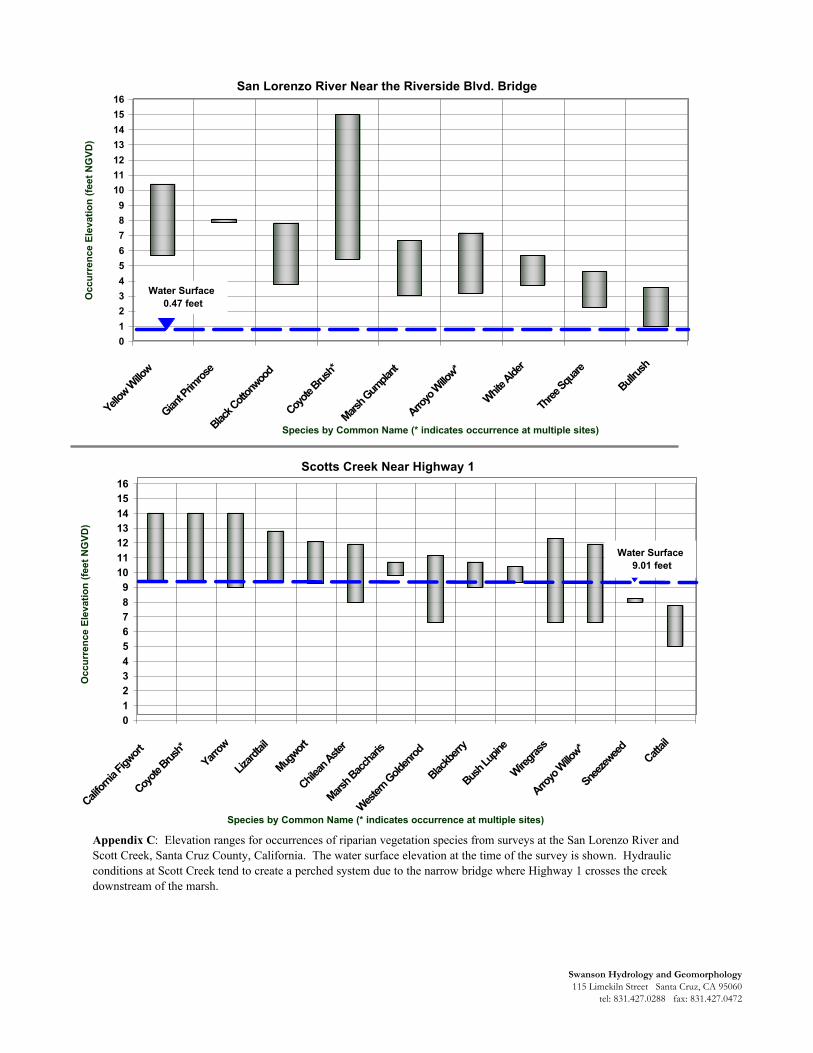
San Lorenzo River Near the Riverside Blvd. Bridge
0123456789
10111213141516
Yellow
Willo
w
Giant P
rimros
e
Black C
otton
wood
Coyote B
rush*
Marsh G
umpla
nt
Arroyo
Willow*
White Alde
r
Three
Squar
e
Bullrus
h
Species by Common Name (* indicates occurrence at multiple sites)
Occ
urre
nce
Elev
atio
n (fe
et N
GVD
)
Water Surface 0.47 feet
Scotts Creek Near Highway 1
0123456789
10111213141516
Californ
ia Figw
ort
Coyote B
rush*
Yarrow
Lizard
tail
Mugwort
Chilean
Aster
Marsh B
acchar
is
Western
Golden
rod
Blackbe
rry
Bush Lu
pine
Wiregras
s
Arroyo
Willow*
Sneez
eweed Catt
ail
Species by Common Name (* indicates occurrence at multiple sites)
Occ
urre
nce
Elev
atio
n (fe
et N
GVD
)
Water Surface 9.01 feet
Appendix C: Elevation ranges for occurrences of riparian vegetation species from surveys at the San Lorenzo River and Scott Creek, Santa Cruz County, California. The water surface elevation at the time of the survey is shown. Hydraulic conditions at Scott Creek tend to create a perched system due to the narrow bridge where Highway 1 crosses the creek downstream of the marsh.
Swanson Hydrology and Geomorphology115 Limekiln Street Santa Cruz, CA 95060
tel: 831.427.0288 fax: 831.427.0472

Swanson Hydrology & Geomorphology Lower San Lorenzo River & Lagoon Management Plan
Appendix D
Hydrology / Geomorphology / Restoration / Water Resources / Construction Planning & Supervision
APPENDIX D
Estimated Costs for Restoration Structures Item Cost Log/Boulder Streambed or Shoreline Structure $8,000 per structure* Tule/Cattail Streambed or Shoreline Structure $1,200 per structure Riparian Revegetation Shoreline to Levee $0.42/square feet) * Log/Boulder costs assume $3,000 per tree/rootwad; lower costs may be realized by investigating sources or through recovery program from main Beach storm debris.