sustainable energy foundation (“foundation”) - wise · sustainable energy foundation ... tamil...
TRANSCRIPT
Action Plan for Comprehensive RE Development in Tamil Nadu
i
Action Plan for
Comprehensive Renewable Energy Development
in Tamil Nadu
FINAL REPORT
December 2012
Prepared by
World Institute of Sustainable Energy (WISE), Pune
Supported by
Shakti Sustainable Energy Foundation, New Delhi
CII (Southern Region)
Tamil Nadu Energy Development Agency
Action Plan for Comprehensive RE Development in Tamil Nadu
ii
© World Institute of Sustainable Energy 2012
Citation
WISE. 2012. Action Plan for Comprehensive Renewable Energy Development in Tamil Nadu. Pune:
World Institute of Sustainable Energy, 158 pp. [Report prepared for Tamil Nadu Energy Development
Agency, Chennai and Shakti Sustainable Energy Foundation, New Delhi]
Circulation policy
This report is prepared for the Tamil Nadu Energy Development Agency, Chennai and Shakti
Sustainable Energy Foundation, New Delhi.
Disclaimer
The views and analyses represented in the documents do not necessarily reflect those of Shakti
Sustainable Energy Foundation (“Foundation”), CII and TEDA. The Foundation, CII, and TEDA accept
no liability for the contents of this document or for the consequences of any actions taken on the
basis of the information provided.
Information contained in this publication is reliable and deemed correct to the knowledge of WISE.
Due care and caution has been taken by WISE in compilation of data from various primary and
secondary resources that WISE considers reliable. However, WISE does not guarantee the accuracy
and completeness of any information. WISE shall not be held responsible for any errors or omissions
or for the end results obtained from use of this information. WISE shall not have any liability
whatsoever, including financial, at any time in future because of the use of information in this
report.
Report Team
Suhas Tendulkar, DGM, Projects
Rajendra Kharul, Joint Director and Head, Centre for Wind Power
Sudhir Kumar, Joint Director and Head, Centre for Solar Power
Surendra Pimperkhedkar, Fellow and Head, Center for Renewable Regulation and Policy
Sanjeev Ghotge, Joint Director (Research) and Head, Centre for Climate Sustainability and Policy
Praveena Sanjay, Joint Director and Head, Centre for Co-ordination & Communication
Address any enquiry about this document to
Centre for Wind Power Fax (020) 2661 1438
World Institute of Sustainable Energy E-mail [email protected]
Kalyani Nagar Tel. (020) 2661 3832
Pune – 411006 / India [Country code +91] Web www.wisein.org
Action Plan for Comprehensive RE Development in Tamil Nadu
iii
Contents
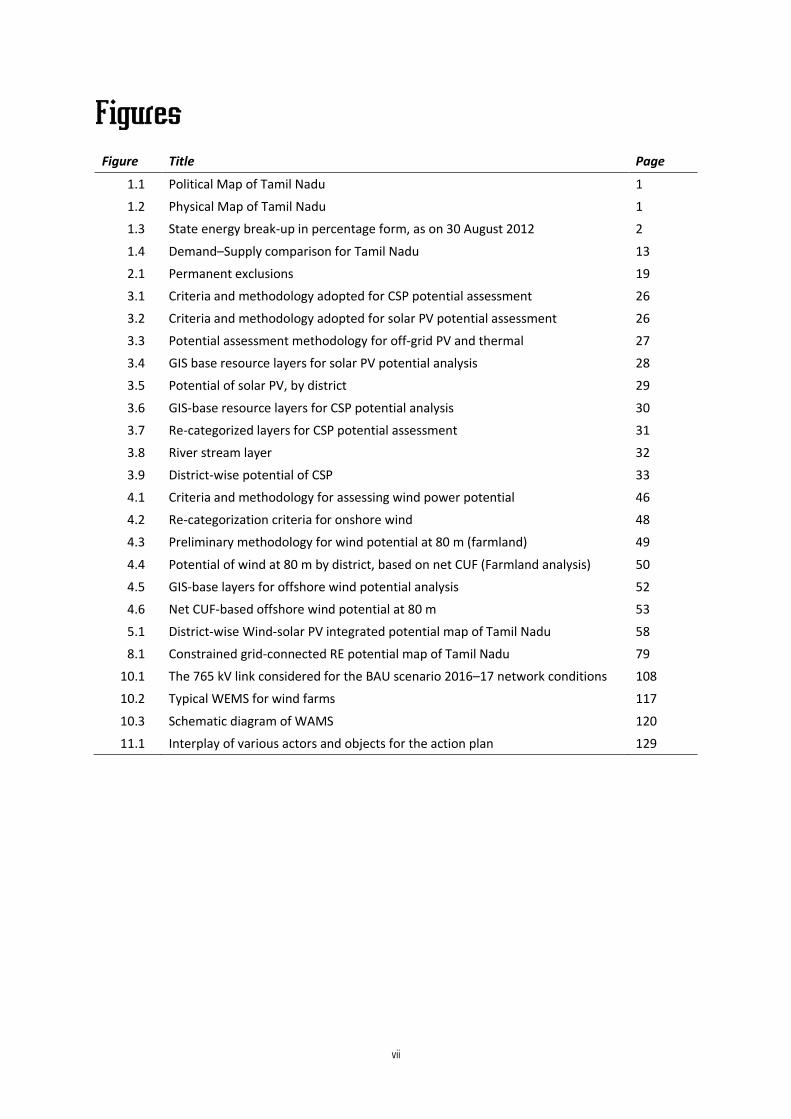
Tables iv
Figures vii
Abbreviations viii
Acknowledgements ix
Executive Summary x
PART I INTRODUCTION
1. Tamil Nadu: Introduction & Overview of the Power Sector 1
PART II RE-ASSEESSMENT OF RE POTENTIAL IN TAMIL NADU
2. The Context, General Objectives and Principles of RE Potential Assessment
17
3. Solar Power Potential in Tamil Nadu 21
4. Wind Power Potential in Tamil Nadu 41
5. Potential of Wind-Solar PV Hybrid 57
6. Potential for Power Generation from Biomass 61
7. Small Hydro Potential 71
8. Summary of Renewable Potential Assessment 77
PART III ACCELERATED RE CAPACITY ADDITION: THE TWO SCENARIOS, CHALLENGES & SOLUTIONS
9. Accelerated RE Capacity Addition: The Scenarios, Challenges & Solutions
85
10. Summary Results of a Detailed Grid Study for Large Scale RE Integration and Evacuation
101
PART IV RE ACTION PLAN & IMPLEMENTATION ROADMAP FOR TAMIL NADU
11. RE Action Plan for the State 129
12. Implementation Roadmap, Benefits & Conclusion 141
References 157
Action Plan for Comprehensive RE Development in Tamil Nadu
iv
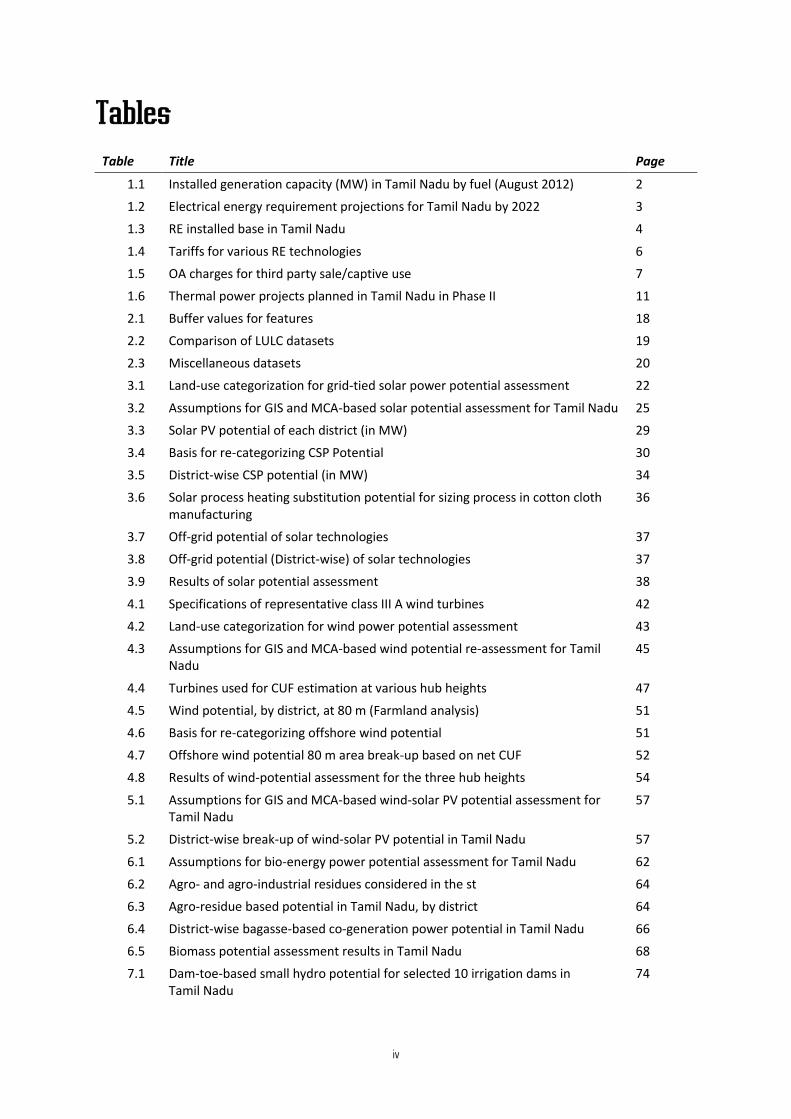
Tables
Table Title Page
1.1 Installed generation capacity (MW) in Tamil Nadu by fuel (August 2012) 2
1.2 Electrical energy requirement projections for Tamil Nadu by 2022 3
1.3 RE installed base in Tamil Nadu 4
1.4 Tariffs for various RE technologies 6
1.5 OA charges for third party sale/captive use 7
1.6 Thermal power projects planned in Tamil Nadu in Phase II 11
2.1 Buffer values for features 18
2.2 Comparison of LULC datasets 19
2.3 Miscellaneous datasets 20
3.1 Land-use categorization for grid-tied solar power potential assessment 22
3.2 Assumptions for GIS and MCA-based solar potential assessment for Tamil Nadu 25
3.3 Solar PV potential of each district (in MW) 29
3.4 Basis for re-categorizing CSP Potential 30
3.5 District-wise CSP potential (in MW) 34
3.6 Solar process heating substitution potential for sizing process in cotton cloth manufacturing
36
3.7 Off-grid potential of solar technologies 37
3.8 Off-grid potential (District-wise) of solar technologies 37
3.9 Results of solar potential assessment 38
4.1 Specifications of representative class III A wind turbines 42
4.2 Land-use categorization for wind power potential assessment 43
4.3 Assumptions for GIS and MCA-based wind potential re-assessment for Tamil Nadu
45
4.4 Turbines used for CUF estimation at various hub heights 47
4.5 Wind potential, by district, at 80 m (Farmland analysis) 51
4.6 Basis for re-categorizing offshore wind potential 51
4.7 Offshore wind potential 80 m area break-up based on net CUF 52
4.8 Results of wind-potential assessment for the three hub heights 54
5.1 Assumptions for GIS and MCA-based wind-solar PV potential assessment for Tamil Nadu
57
5.2 District-wise break-up of wind-solar PV potential in Tamil Nadu 57
6.1 Assumptions for bio-energy power potential assessment for Tamil Nadu 62
6.2 Agro- and agro-industrial residues considered in the st 64
6.3 Agro-residue based potential in Tamil Nadu, by district 64
6.4 District-wise bagasse-based co-generation power potential in Tamil Nadu 66
6.5 Biomass potential assessment results in Tamil Nadu 68
7.1 Dam-toe-based small hydro potential for selected 10 irrigation dams in Tamil Nadu
74
Action Plan for Comprehensive RE Development in Tamil Nadu
v
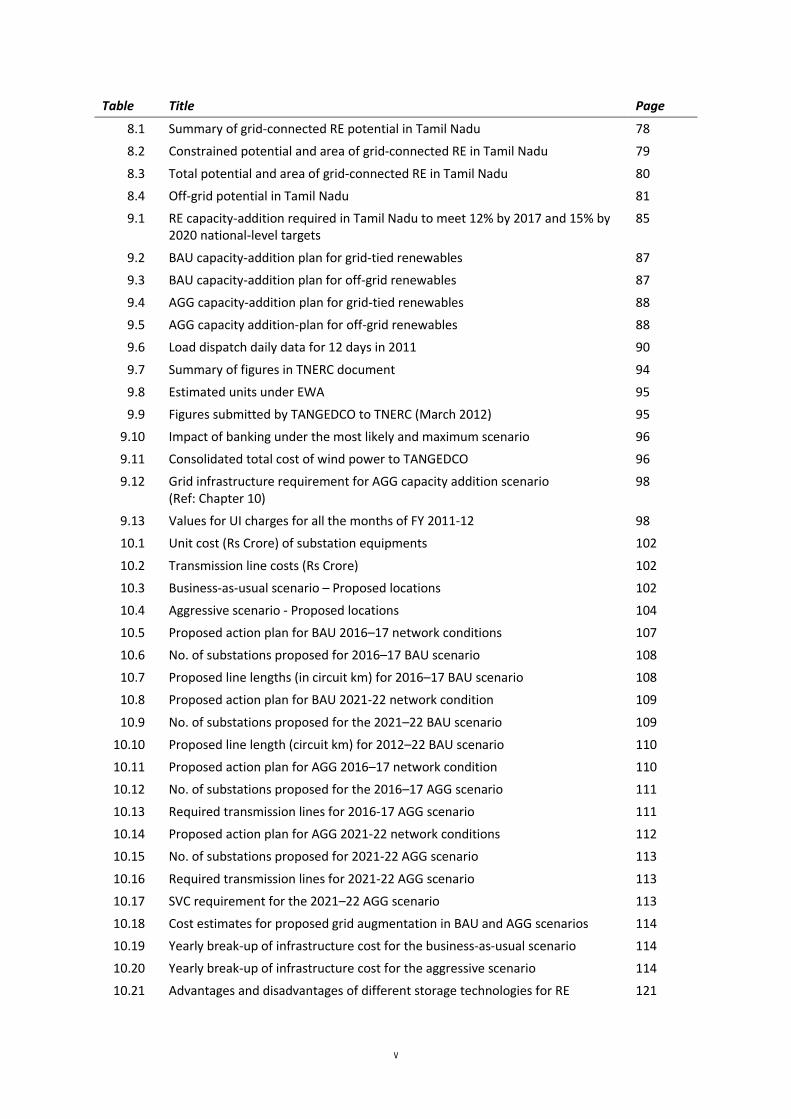
Table Title Page
8.1 Summary of grid-connected RE potential in Tamil Nadu 78
8.2 Constrained potential and area of grid-connected RE in Tamil Nadu 79
8.3 Total potential and area of grid-connected RE in Tamil Nadu 80
8.4 Off-grid potential in Tamil Nadu 81
9.1 RE capacity-addition required in Tamil Nadu to meet 12% by 2017 and 15% by 2020 national-level targets
85
9.2 BAU capacity-addition plan for grid-tied renewables 87
9.3 BAU capacity-addition plan for off-grid renewables 87
9.4 AGG capacity-addition plan for grid-tied renewables 88
9.5 AGG capacity addition-plan for off-grid renewables 88
9.6 Load dispatch daily data for 12 days in 2011 90
9.7 Summary of figures in TNERC document 94
9.8 Estimated units under EWA 95
9.9 Figures submitted by TANGEDCO to TNERC (March 2012) 95
9.10 Impact of banking under the most likely and maximum scenario 96
9.11 Consolidated total cost of wind power to TANGEDCO 96
9.12 Grid infrastructure requirement for AGG capacity addition scenario (Ref: Chapter 10)
98
9.13 Values for UI charges for all the months of FY 2011-12 98
10.1 Unit cost (Rs Crore) of substation equipments 102
10.2 Transmission line costs (Rs Crore) 102
10.3 Business-as-usual scenario – Proposed locations 102
10.4 Aggressive scenario - Proposed locations 104
10.5 Proposed action plan for BAU 2016–17 network conditions 107
10.6 No. of substations proposed for 2016–17 BAU scenario 108
10.7 Proposed line lengths (in circuit km) for 2016–17 BAU scenario 108
10.8 Proposed action plan for BAU 2021-22 network condition 109
10.9 No. of substations proposed for the 2021–22 BAU scenario 109
10.10 Proposed line length (circuit km) for 2012–22 BAU scenario 110
10.11 Proposed action plan for AGG 2016–17 network condition 110
10.12 No. of substations proposed for the 2016–17 AGG scenario 111
10.13 Required transmission lines for 2016-17 AGG scenario 111
10.14 Proposed action plan for AGG 2021-22 network conditions 112
10.15 No. of substations proposed for 2021-22 AGG scenario 113
10.16 Required transmission lines for 2021-22 AGG scenario 113
10.17 SVC requirement for the 2021–22 AGG scenario 113
10.18 Cost estimates for proposed grid augmentation in BAU and AGG scenarios 114
10.19 Yearly break-up of infrastructure cost for the business-as-usual scenario 114
10.20 Yearly break-up of infrastructure cost for the aggressive scenario 114
10.21 Advantages and disadvantages of different storage technologies for RE 121
Action Plan for Comprehensive RE Development in Tamil Nadu
vi
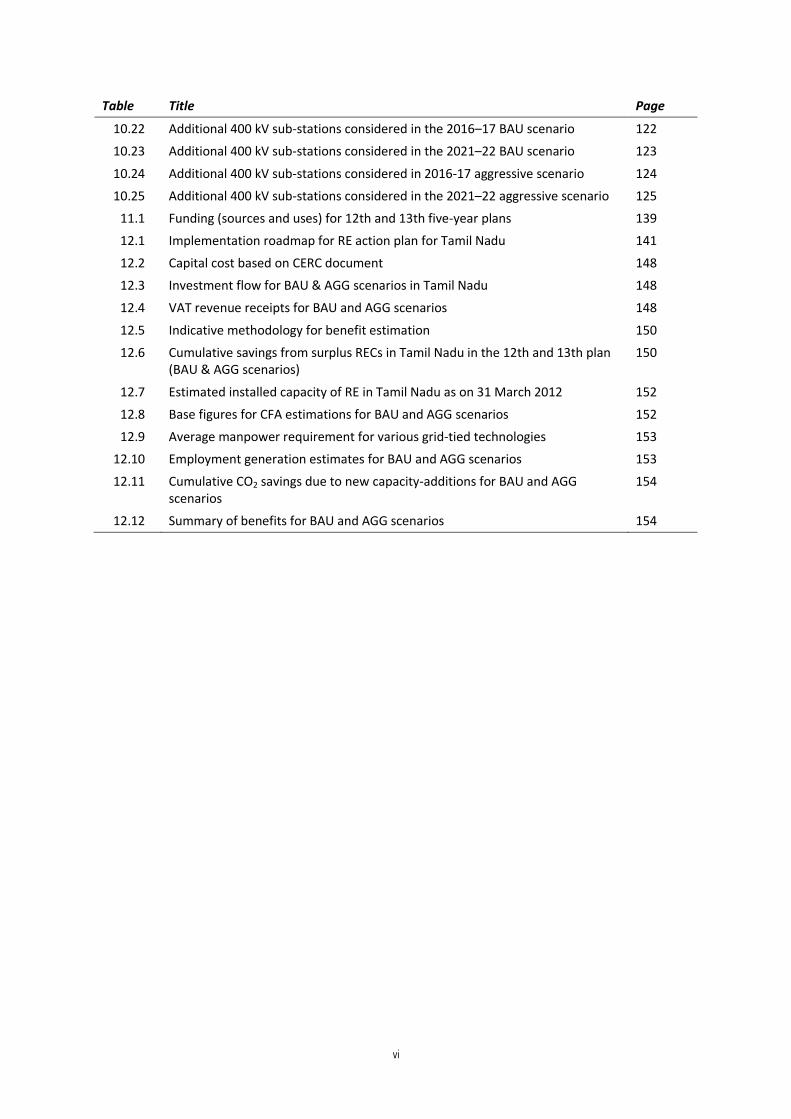
Table Title Page
10.22 Additional 400 kV sub-stations considered in the 2016–17 BAU scenario 122
10.23 Additional 400 kV sub-stations considered in the 2021–22 BAU scenario 123
10.24 Additional 400 kV sub-stations considered in 2016-17 aggressive scenario 124
10.25 Additional 400 kV sub-stations considered in the 2021–22 aggressive scenario 125
11.1 Funding (sources and uses) for 12th and 13th five-year plans 139
12.1 Implementation roadmap for RE action plan for Tamil Nadu 141
12.2 Capital cost based on CERC document 148
12.3 Investment flow for BAU & AGG scenarios in Tamil Nadu 148
12.4 VAT revenue receipts for BAU and AGG scenarios 148
12.5 Indicative methodology for benefit estimation 150
12.6 Cumulative savings from surplus RECs in Tamil Nadu in the 12th and 13th plan (BAU & AGG scenarios)
150
12.7 Estimated installed capacity of RE in Tamil Nadu as on 31 March 2012 152
12.8 Base figures for CFA estimations for BAU and AGG scenarios 152
12.9 Average manpower requirement for various grid-tied technologies 153
12.10 Employment generation estimates for BAU and AGG scenarios 153
12.11 Cumulative CO2 savings due to new capacity-additions for BAU and AGG scenarios
154
12.12 Summary of benefits for BAU and AGG scenarios 154
Action Plan for Comprehensive RE Development in Tamil Nadu
vii
Figures
Figure Title Page
1.1 Political Map of Tamil Nadu 1
1.2 Physical Map of Tamil Nadu 1
1.3 State energy break-up in percentage form, as on 30 August 2012 2
1.4 Demand–Supply comparison for Tamil Nadu 13
2.1 Permanent exclusions 19
3.1 Criteria and methodology adopted for CSP potential assessment 26
3.2 Criteria and methodology adopted for solar PV potential assessment 26
3.3 Potential assessment methodology for off-grid PV and thermal 27
3.4 GIS base resource layers for solar PV potential analysis 28
3.5 Potential of solar PV, by district 29
3.6 GIS-base resource layers for CSP potential analysis 30
3.7 Re-categorized layers for CSP potential assessment 31
3.8 River stream layer 32
3.9 District-wise potential of CSP 33
4.1 Criteria and methodology for assessing wind power potential 46
4.2 Re-categorization criteria for onshore wind 48
4.3 Preliminary methodology for wind potential at 80 m (farmland) 49
4.4 Potential of wind at 80 m by district, based on net CUF (Farmland analysis) 50
4.5 GIS-base layers for offshore wind potential analysis 52
4.6 Net CUF-based offshore wind potential at 80 m 53
5.1 District-wise Wind-solar PV integrated potential map of Tamil Nadu 58
8.1 Constrained grid-connected RE potential map of Tamil Nadu 79
10.1 The 765 kV link considered for the BAU scenario 2016–17 network conditions 108
10.2 Typical WEMS for wind farms 117
10.3 Schematic diagram of WAMS 120
11.1 Interplay of various actors and objects for the action plan 129
Action Plan for Comprehensive RE Development in Tamil Nadu
viii
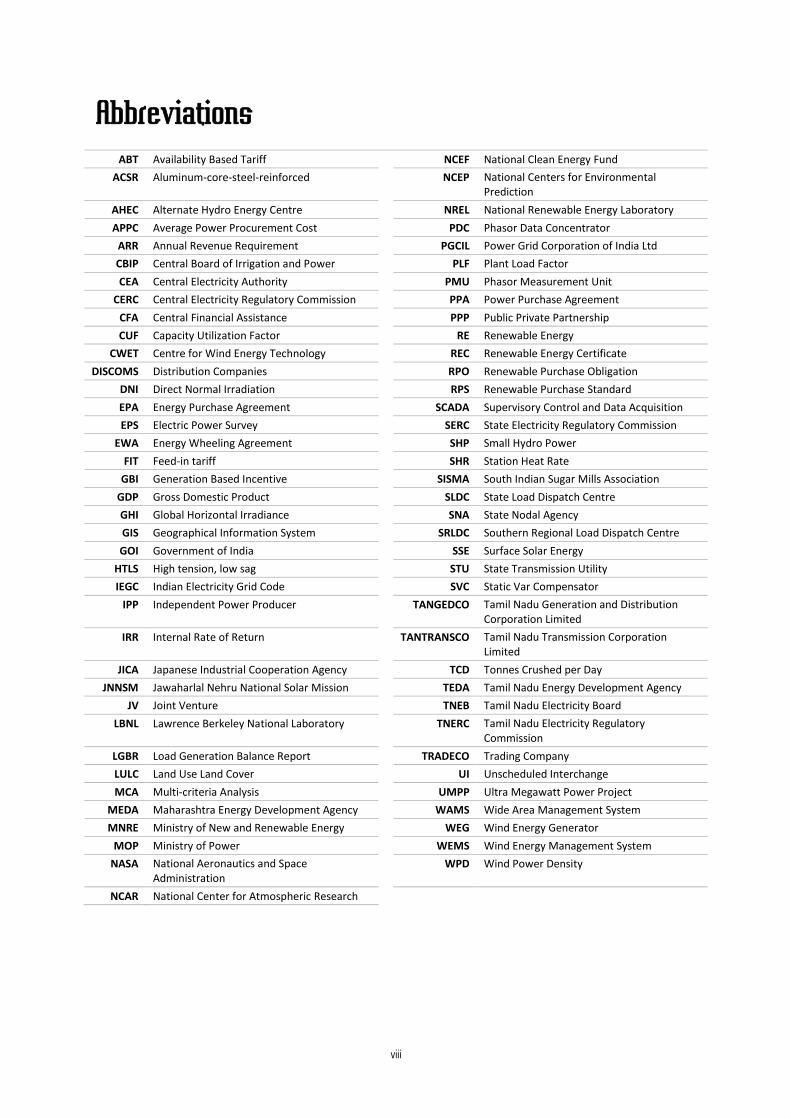
Abbreviations
ABT Availability Based Tariff NCEF National Clean Energy Fund
ACSR Aluminum-core-steel-reinforced NCEP National Centers for Environmental Prediction
AHEC Alternate Hydro Energy Centre NREL National Renewable Energy Laboratory
APPC Average Power Procurement Cost PDC Phasor Data Concentrator
ARR Annual Revenue Requirement PGCIL Power Grid Corporation of India Ltd
CBIP Central Board of Irrigation and Power PLF Plant Load Factor
CEA Central Electricity Authority PMU Phasor Measurement Unit
CERC Central Electricity Regulatory Commission PPA Power Purchase Agreement
CFA Central Financial Assistance PPP Public Private Partnership
CUF Capacity Utilization Factor RE Renewable Energy
CWET Centre for Wind Energy Technology REC Renewable Energy Certificate
DISCOMS Distribution Companies RPO Renewable Purchase Obligation
DNI Direct Normal Irradiation RPS Renewable Purchase Standard
EPA Energy Purchase Agreement SCADA Supervisory Control and Data Acquisition
EPS Electric Power Survey SERC State Electricity Regulatory Commission
EWA Energy Wheeling Agreement SHP Small Hydro Power
FIT Feed-in tariff SHR Station Heat Rate
GBI Generation Based Incentive SISMA South Indian Sugar Mills Association
GDP Gross Domestic Product SLDC State Load Dispatch Centre
GHI Global Horizontal Irradiance SNA State Nodal Agency
GIS Geographical Information System SRLDC Southern Regional Load Dispatch Centre
GOI Government of India SSE Surface Solar Energy
HTLS High tension, low sag STU State Transmission Utility
IEGC Indian Electricity Grid Code SVC Static Var Compensator
IPP Independent Power Producer TANGEDCO Tamil Nadu Generation and Distribution Corporation Limited
IRR Internal Rate of Return TANTRANSCO Tamil Nadu Transmission Corporation Limited
JICA Japanese Industrial Cooperation Agency TCD Tonnes Crushed per Day
JNNSM Jawaharlal Nehru National Solar Mission TEDA Tamil Nadu Energy Development Agency
JV Joint Venture TNEB Tamil Nadu Electricity Board
LBNL Lawrence Berkeley National Laboratory TNERC Tamil Nadu Electricity Regulatory Commission
LGBR Load Generation Balance Report TRADECO Trading Company
LULC Land Use Land Cover UI Unscheduled Interchange
MCA Multi-criteria Analysis UMPP Ultra Megawatt Power Project
MEDA Maharashtra Energy Development Agency WAMS Wide Area Management System
MNRE Ministry of New and Renewable Energy WEG Wind Energy Generator
MOP Ministry of Power WEMS Wind Energy Management System
NASA National Aeronautics and Space Administration
WPD Wind Power Density
NCAR National Center for Atmospheric Research
Action Plan for Comprehensive RE Development in Tamil Nadu
ix
Acknowledgements
WISE thankfully acknowledges the support and cooperation extended by Tamil Nadu Energy
Development Agency (TEDA). WISE would like to acknowledge the support of Mr. Sudeep Jain,
Chairman and Managing Director of TEDA and Mr. Deepak Gupta, Senior Program Officer, Shakti
Sustainable Energy Foundation, for providing crucial inputs and balanced feedback that helped us to
make the report even more comprehensive and insightful.
The support of the Power Research Development Consultants (PRDC), Bangalore was very vital in
assessing the grid related implications for large-scale RE integration in Tamil Nadu. We thank them
for the detailed study exercise they undertook on our request.
In addition, WISE would also like to thank Dr. Chirstodas Gandhi, Development Commissioner,
Government of Tamil Nadu and Dr. R Vijaykumar, Addl Chief Secretary, Planning and Development
Department, Government of Tamil Nadu, who provided much-needed support and guidance during
the entire duration of the project.
Acknowledgments are also due to Mr. S Akshaykumar, Director, Transmission Projects,
TANTRANSCO and Mr. R Sekar, Chief Engineer, NCES, TANGEDCO, for providing a balanced
perspective on renewables. WISE also acknowledges the contribution of other key representatives
from the government, private sector, civil society organizations and academic institutions for
providing valuable insights and suggestions related to the project.
We also acknowledge the support provided by Shakti Sustainable Energy Foundation, New Delhi and
CII Southern Region which made this study possible.
Action Plan for Comprehensive RE Development in Tamil Nadu
x
Executive Summary
The state of Tamil Nadu is rich in renewable energy (RE) sources, especially wind and solar.
Currently, approximately one-third of the country’s installed RE capacity exists in Tamil Nadu alone.
The Action Plan for Comprehensive Renewable Energy Development in Tamil Nadu, aims to tap this
abundant source of energy and make Tamil Nadu an energy-sufficient and energy secure state. The
action plan is the result of a comprehensive analysis of renewable energy choices and their
relevance to the present and future energy plans and energy security of Tamil Nadu for the next two
five-year plans (2012–22).
On a broad level, the project findings are striking and indicate that while the existing coal-based
power sector planning of the state is exposed to huge risks, the re-assessed renewable energy
potential is in multiples of the official estimated potential. The study also sheds light on important
aspects related to technical integration and commercial acceptance of renewables and develops a
renewable energy action plan and implementation roadmap for the state.
A Key Findings
Coal-Dependent Energy Sector Planning Entails Huge Risks
There are major risks involved in the ‘business-as-usual’ approach associated with coal dependent
power planning in the state. About 9,460 MW of new coal-based thermal power projects expected
to be commissioned by 2015–16 are still at very preliminary stages (with a majority at the pre-
environmental impact assessment stage). Of this, about 2,400 MW capacity is not expected to have
any domestic coal linkage and the state is assessing plans to use 100% imported coal for these new
capacities. But with issues related to availability of domestic coal, import dependence, and price
volatility of imported coal, it is imperative for the state to factor-in the long-term risks of coal-
dependent power planning. On the one hand, large sums of government investment will be locked in
capital costs and debt repayments for projects that may not deliver low-cost power, while on the
other hand, rising power costs would have an inflationary effect on prices, affecting business growth
and economic development.
Against this background, the focus of energy planning has to essentially shift from a mere matching
of supply-demand, to an approach guided by long-term energy security. This is where renewables
can add value and contribute to long-term energy security for the state.
Need for Re-assessment of RE Potential: Implementation not a Constraint
While the official wind potential estimate for Tamil Nadu is 5,374 MW, the state had already reached
6000 MW in August 2011. This gave rise for the need to reassess the total RE potential in the state.
As compared to past potential reassessment studies, the current study uses the Geographic
Information System (GIS), with the base data sourced from government and other commercial
authorities, thus striving to remove ambiguities or differences (if any), to provide a reliable RE
potential estimate. Further, the study also makes use of current market information and literature
review for obtaining more accuracy in the reassessment exercise. The use of these methodologies
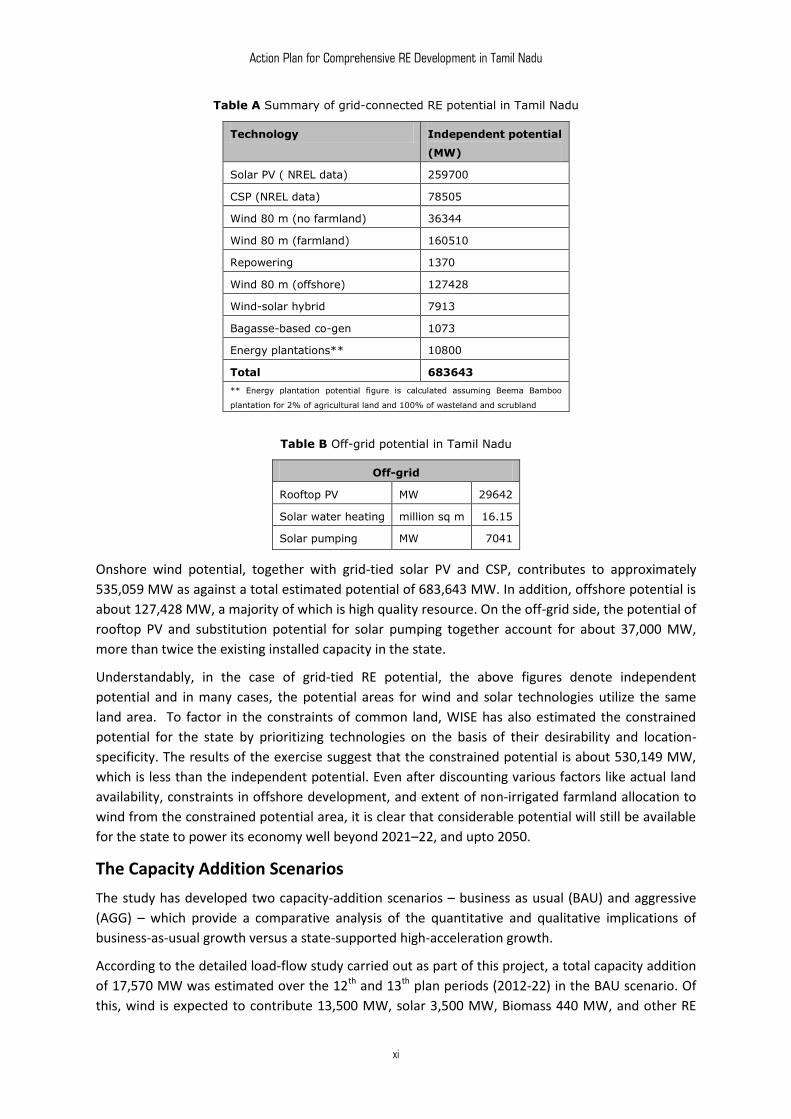
has shown that the total (reassessed) RE potential for Tamil Nadu is over 720,000 MW (including
grid-connected and off-grid power). Table A reproduces the results of the total grid-connected RE
potential, while Table B shows the off-grid potential.
Action Plan for Comprehensive RE Development in Tamil Nadu
xi
Table A Summary of grid-connected RE potential in Tamil Nadu
Technology Independent potential
(MW)
Solar PV ( NREL data) 259700
CSP (NREL data) 78505
Wind 80 m (no farmland) 36344
Wind 80 m (farmland) 160510
Repowering 1370
Wind 80 m (offshore) 127428
Wind-solar hybrid 7913
Bagasse-based co-gen 1073
Energy plantations** 10800
Total 683643
** Energy plantation potential figure is calculated assuming Beema Bamboo
plantation for 2% of agricultural land and 100% of wasteland and scrubland
Table B Off-grid potential in Tamil Nadu
Off-grid
Rooftop PV MW 29642
Solar water heating million sq m 16.15
Solar pumping MW 7041
Onshore wind potential, together with grid-tied solar PV and CSP, contributes to approximately
535,059 MW as against a total estimated potential of 683,643 MW. In addition, offshore potential is
about 127,428 MW, a majority of which is high quality resource. On the off-grid side, the potential of
rooftop PV and substitution potential for solar pumping together account for about 37,000 MW,
more than twice the existing installed capacity in the state.
Understandably, in the case of grid-tied RE potential, the above figures denote independent
potential and in many cases, the potential areas for wind and solar technologies utilize the same
land area. To factor in the constraints of common land, WISE has also estimated the constrained
potential for the state by prioritizing technologies on the basis of their desirability and location-
specificity. The results of the exercise suggest that the constrained potential is about 530,149 MW,
which is less than the independent potential. Even after discounting various factors like actual land
availability, constraints in offshore development, and extent of non-irrigated farmland allocation to
wind from the constrained potential area, it is clear that considerable potential will still be available
for the state to power its economy well beyond 2021–22, and upto 2050.
The Capacity Addition Scenarios
The study has developed two capacity-addition scenarios – business as usual (BAU) and aggressive
(AGG) – which provide a comparative analysis of the quantitative and qualitative implications of
business-as-usual growth versus a state-supported high-acceleration growth.
According to the detailed load-flow study carried out as part of this project, a total capacity addition
of 17,570 MW was estimated over the 12th and 13th plan periods (2012-22) in the BAU scenario. Of
this, wind is expected to contribute 13,500 MW, solar 3,500 MW, Biomass 440 MW, and other RE
Action Plan for Comprehensive RE Development in Tamil Nadu
xii
130 MW. In the AGG scenario, total capacity addition of 36,470 MW was estimated over the 12th and
13th plan periods (2012-22). Of this, wind is expected to contribute 28,400 MW, solar 7,500 MW,
Biomass 440 MW, and other RE 130 MW. As the BAU scenario is an extrapolation of current RE
development in the state, the AGG scenario was taken as the basis of the Action Plan, as the main
objective was accelerated development and deployment of renewables in Tamil Nadu.
Integration of Aggressive RE Capacity Addition in the Grid is Technically Feasible
The study shows that an aggressive RE integration scenario is technically feasible, provided
operational philosophies are modified and evacuation infrastructure is built to integrate RE.
The biggest technical challenge to renewable integration is managing generation variability and
ensuring power quality with system security. For managing variability, major changes in operational
philosophy will be needed to ensure that renewables are accommodated optimally at all times.
These changes would not only include dynamic demand-side measures but also incorporate strong
supply-side measures such as backing down thermal load to its technical limit and complete backing
down of hydro for the whole of the southern region when required. However, future developments
like the establishment of a national grid in 2014 (the commissioning of a 765 kV Raichur-Solapur
line), establishment of an RE Management Centre, and early adoption of forecasting and new
technologies like pumped storage and smart grids can help the state to manage its operations even
more optimally, allowing it to export surplus power across regional borders.
Under the AGG scenario, RE evacuation studies for the 12th plan showed that in order to evacuate
23,613 MW of RE, (Proposed 16660 + Existing 6953 MW) additional 51 substations of 230 kV and 60
substations of 110 kV are required. In order to evacuate 43,423 MW of RE (Proposed 36470 +
Existing 6953 MW) in the 13th plan, additional 74 substations of 230 kV and 61 substations of 110 kV
are required. However, for both the plan periods, large increases in power flows are expected due to
injection of solar power into the grid.
Funds for Supporting AGG Capacity Addition can be generated from within the state
As estimated in the study, the estimated cost for the total evacuation infrastructure over the 12th
and 13th five-year plans to support aggressive RE capacity addition is Rs.11,025 crore (Rs.110.25
billion). This estimate is a very small portion of the total funds planned for transmission and
distribution capacity augmentation under the Vision 2023 document (Rs.200,000 crore). In addition,
there are various ways in which additional funds can be generated. The state can, if it wants,
develop a corpus fund of about Rs.17,000 crore (Rs.170 billion) by using options like diverting funds
from value-added tax (VAT) receipts of new RE capacity, allocating dedicated funds for state-owned
wind power projects in line with allocations made for imported-coal-based thermal power projects,
and creating a state clean energy fund. These options, in addition to central financial assistance for
RE development, would allow the state not only to develop the necessary evacuation backbone but
also meet other obligations and expenses like payment of wind dues to owners, pilot projects, short-
term capacity additions, and capacity building.
Action Plan for Comprehensive RE Development in Tamil Nadu
xiii
Significant Monetary Benefits Accruing from the AGG Scenario
The state can ensure an investment inflow of Rs.2,26,976 crore (Rs.2,269 billion) upto 2021-22.
On the revenue side, VAT receipts of Rs.8,171 crore (Rs.81.7 Billion) can be expected during the same period.
The total estimated central financial assistance (the thirteenth finance commission’s RE corpus) is estimated at Rs.1,326 crore (Rs. 13.26 billion) for the period 2010-2015.
Other Benefits Accruing from the AGG Scenario
As per the Renewable Energy Certificate (REC) registry data, about 2,251.83 MW capacity is registered under RECs (as on 31.01.12), out of which Tamil Nadu accounts for 528.3 MW, amounting to around 23.46%. Cumulative notional savings from surplus RECs in the 12th and 13th plan periods (non-solar) is estimated at Rs.14,838 crore.
The aggressive RE development plan would create over 3,91,830 jobs upto 2021-22.
Savings of CO2 emissions would be to the tune of 2,987,000 tonnes upto 2021-22.
Renewables would provide more Commercial Benefits than Conventional Technologies
The study suggests that contrary to general perceptions, commercial implications of RE are not very
high as compared to risks involved in other purchase options such as that of conventional power
projects, whose price is variable and increases due to delays, cancellations, etc. The main
bottlenecks for commercial acceptance of RE are related to tariff levels, infrastructure funding, and
balancing costs. In the case of wind power in Tamil Nadu, there is a generally held notion that high
wind penetration has resulted in significant losses to TNEB, on account of balancing costs, due to
generation variability of wind. The analysis in the report suggests that commercial impacts of wind
may not be as high as thought to be.
From the future perspective, it is also important to understand that the year-on-year increasing
trend of average power procurement costs (APPC) indicates a steady increase in conventional power
prices. Additionally, the costs of fossil-fuel-based generation are bound to increase with time
because of supply constraints and price variability. In this scenario, when we invest in conventional
generation capacities, we are effectively locking ourselves for 30-40 years. As the effective cost of
generation would be dependent on the fuel price, we need to look at above-normal increase in cost
of generation, which is ultimately borne by the consumers or the state. In the worst case, we may
have a scenario where non-availability or very high operating costs would force these capacities to
be shut down, as has happened in the case of gas or that of plants designed to run on liquid fuels.
In contrast, renewable sources keep on delivering energy at low or no variable costs, with their
prices either increasing moderately or sometimes, even decreasing, eg. in the case of solar. The only
other cost implication would be the capital investment, bulk of which is anyway expected to come
from the private sector. The commencement of forecasting for RE coupled with the development of
an ancillary market for power after the establishment of a national grid would effectively translate
into huge trading opportunities for the Tamil Nadu Electricity Board (TNEB), allowing it to recoup
past losses and cover expenses more effectively.
Action Plan for Comprehensive RE Development in Tamil Nadu
xiv
B RE Action Plan for Tamil Nadu: Interventions and Recommendations
The message from the project’s findings is very clear: given the present situation and the emerging
scenario in terms of resource ownership and our choice of the development path, renewables seem
to be the most optimal option for the state from a long-term perspective. The following summary of
interventions/recommendations tries to capture the essence of the changes that are required.
Interventions in Governance and Resource Development
(i) Leadership and advocacy initiatives by
ensuring that regional RE capacity additions are factored into the power planning process
at the national level,
conducting a detailed grid study to assess power system stability and load flow at inter-
state and inter-regional levels to critically identify inter-regional evacuation capacity
augmentation,
ensuring early commissioning of inter-regional link to facilitate operationalization of the
national grid, and
advocating creation of an ancillary market to enable intra-day and spot trading of power.
(ii) Capacity building of state-based agencies to support renewable deployment
The study recommends developing technical, administrative, and communication capacities in
identified government agencies such as the Energy Department, TNEB, Tamil Nadu Energy
Development Agency (TEDA), State Planning Commission, and the Tamil Nadu Electricity
Regulatory Commission (TNERC). The capacity building plan should include aspects related to
organizational restructuring, planning, procedures, rules, laws, a management information
system, human resource development, financial management, financial autonomy,
communication and outreach strategy, and most importantly, training needs identification for
RE-specific aspects related to policy, regulation, technology, grid impact, finance, etc.
(iii) Renewable Resource Development
The renewable resource assessment exercise indicates an RE potential significantly greater
than the existing estimates. The GIS-based assessment for grid-tied wind and solar power has
provided significant data in spatial terms and important takeaways for energy sector planning
and policy design. Based on the analysis of RE potential in the study, the key focus areas for
field-based renewable resource assessment are identified as CSP, biomass, and offshore wind.
In addition, it is also recommended to develop pilot projects of appropriate size for CSP,
offshore wind, and energy plantations.
Policy and Regulatory Interventions
(i) Policy Interventions
At present, Tamil Nadu has a solar policy but no notified RE policy. In the absence of a notified
RE policy, the following interventions are suggested:
Creation of a state clean energy fund.
Land policy for renewable projects that lays down clear guidelines for land allocation, land
acquisition, mixed land use, right of way, and title transfer.
Early approval of pending wind project applications of 13,400 MW.
Streamlining approval processes for offshore wind.
Action Plan for Comprehensive RE Development in Tamil Nadu
xv
Policy on public-private partnership (PPP) for development of RE pilot projects.
Strengthening of policy and approval process for biomass projects.
Relaxation of micrositing criteria (5D × 7D) for wind power projects.
Mandating appropriate clearances for repowering.
Creation of a state RE law.
Creation of single window clearance mechanisms for all RE sources.
Specific interventions for supporting off-grids.
Preferential payment disbursement to RE generators.
(ii) Regulatory Interventions
The Tamil Nadu Electricity Regulatory Commission will have to act proactively by addressing
not only the existing bottlenecks, but also formulating regulation, considering the futuristic
needs of the state if renewables have to be promoted aggressively. Some of the proposed
interventions are suggested below.
Revision of tariff determination methodology by considering the time value of money.
Revision of methodology to determine APPC based on CERC methodology.
Revision of solar RPO targets for utility and RPO compliance mechanism.
Tariff orders for large state-based off-grid solar.
Regulation on RE-dictated inter-state power transfer.
Establishment of a payment security mechanism as was done in other states like
Karnataka.
Grid Planning and Operational Management
The implementation plan for RE has to essentially address a multitude of technical and non-technical issues. From the perspective of high RE integration under the AGG scenario, it is obvious that integration can happen only at the regional and national levels. In this context, integration of the southern grid with the NEW (North-East-West) grid and enactment of a commercial mechanism for inter-state trade of power are the two most important requirements for RE integration. The following specific action points highlight the requirements from the perspective of transmission planning and operational management practices.
Incorporation of RE capacity-addition in long-term transmission planning.
Short-term measures like the use of HTLS (high tension low sag) lines and conversion of single
circuit lines to double circuit lines for strengthening evacuation infrastructure in congested
pockets.
Modification of the operational philosophy of grid management to include strong supply-side
measures to enable participation of storage-based hydro and thermal power plants in
variability management.
Creation of a trading company to manage all interstate power exchanges.
Activation of advanced wind energy management systems (WEMS), Static VAR controllers
(SVCs), and new technologies for better operational control.
Financial Interventions (Sources and Uses)
Funding is the most critical bottleneck in the implementation of any action plan. The study has also assessed the capital requirements for an aggressive RE capacity addition scenario, in addition to exploring the possible sources for raising the funds. Some of the suggested heads for sources and uses of funds are as follows.
Action Plan for Comprehensive RE Development in Tamil Nadu
xvi
Possible sources or avenues:
Central Finance Assistance (CFA) from the 13th Finance Commission,
Diversion of value-added tax (VAT) receipts from RE,
Allocation of funds in line with allocations made to imported-coal-based projects,
Creation of a state clean energy fund.
Proposed uses:
Capacity-building of state agencies,
Short-term augmentation of overloaded lines,
Pilot projects (CSP, energy plantations, offshore wind),
Field-level resource assessment for offshore, CSP, and biomass through field studies,
Integrating Wind Energy Management Systems (WEMS) in the existing infrastructure,
New grid infrastructure and SVCs.
These recommendations are not exhaustive but they represent a set of suggestions that have the
potential to make the highest impact in integrating renewables. The overall conclusion of the study
is that renewables are abundant and can provide most of the power for Tamil Nadu upto 2050. The
main problem with RE integration is not technical; it is our mindset. We are so tuned to the comforts
of a predictable centralized conventional-machine model and associated network that renewables
seem like an unwieldy change, bringing us out of our ‘comfort zones’. This aspect also implies that
RE integration requires only our willingness to understand renewables and our resolve to choose
them.
***

Action Plan for Comprehensive RE Development in Tamil Nadu
17
PART A
PART – I
INTRODUCTION

Action Plan for Comprehensive RE Development in Tamil Nadu
18
Action Plan for Comprehensive RE Development in Tamil Nadu
1
1. Tamil Nadu: Introduction & Overview of the Power Sector
Tamil Nadu, the eleventh largest state in India, covers 130,058 square kilometers (50,216 sq miles),
and has a coastline of about 910 kilometers (600 miles). In terms of population, it is the seventh
most populous state with a population of about 72 million, nearly 6% of India's population (census
2011). At 43.86%, the state has the highest level of urbanization in India and accounts for 9.6% of
India’s urban population.
Tamil Nadu is divided into 32 districts and 220 talukas for the purposes of administration.
Geographically, it is classified into seven agro-climatic zones: north-eastern, north-western, western,
southern, high rainfall, high altitude hilly, and the Cauvery delta (the most fertile agricultural zone).
However, the state can be broadly divided into two main natural regions, the hilly western area and
the coastal plains. The Western Ghats dominate the entire western border with Kerala, whereas the
central and the south-central regions are arid plains and receive less rainfall than the other regions.
The climate of the state ranges from dry sub-humid to semi-arid, but the state has the distinction of
having two monsoon seasons: south-west monsoon from June to September and the north-east
monsoon from October to December. This distinctive feature has helped Tamil Nadu to become a
favoured wind power destination because the monsoon winds contribute to the bulk of the annual
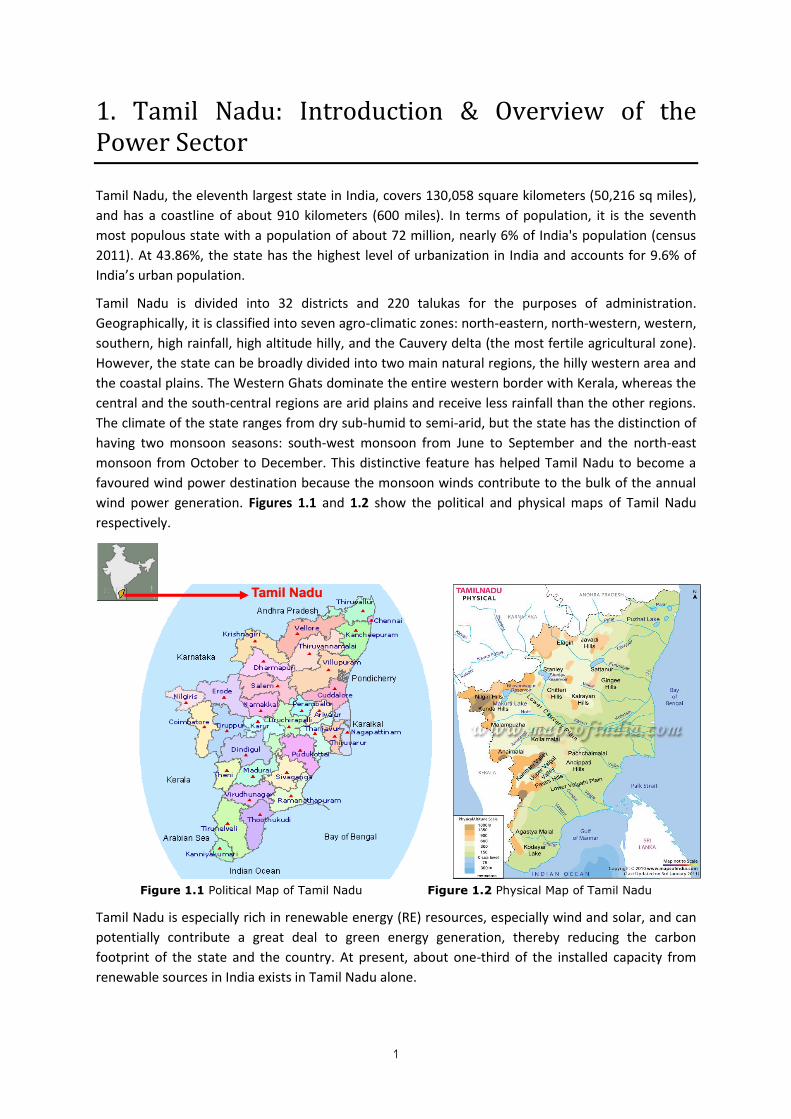
wind power generation. Figures 1.1 and 1.2 show the political and physical maps of Tamil Nadu
respectively.
Figure 1.1 Political Map of Tamil Nadu Figure 1.2 Physical Map of Tamil Nadu
Tamil Nadu is especially rich in renewable energy (RE) resources, especially wind and solar, and can
potentially contribute a great deal to green energy generation, thereby reducing the carbon
footprint of the state and the country. At present, about one-third of the installed capacity from
renewable sources in India exists in Tamil Nadu alone.
Action Plan for Comprehensive RE Development in Tamil Nadu
2
1.1 Overview of Energy Scenario in Tamil Nadu
1.1.1 Generation capacity
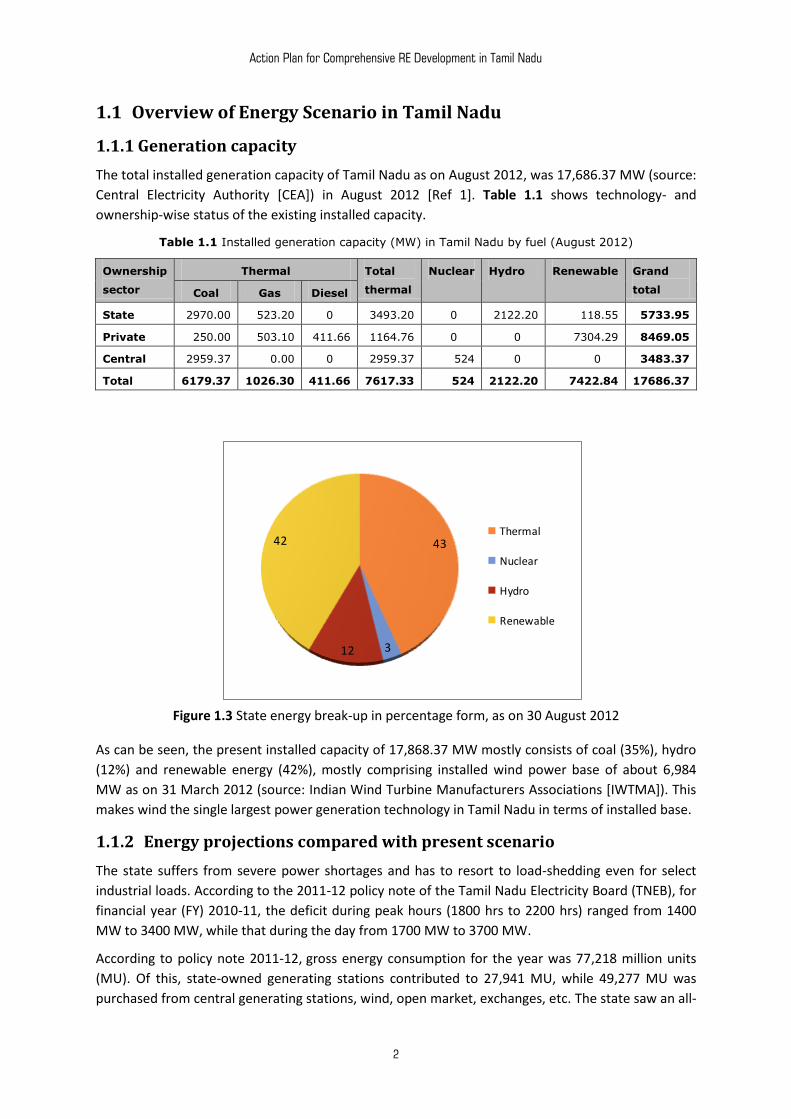
The total installed generation capacity of Tamil Nadu as on August 2012, was 17,686.37 MW (source:
Central Electricity Authority [CEA]) in August 2012 [Ref 1]. Table 1.1 shows technology- and
ownership-wise status of the existing installed capacity.
Table 1.1 Installed generation capacity (MW) in Tamil Nadu by fuel (August 2012)
Ownership
sector
Thermal Total
thermal
Nuclear Hydro Renewable Grand
total Coal Gas Diesel
State 2970.00 523.20 0.00 3493.20 0.00 2122.20 118.55 5733.95
Private 250.00 503.10 411.66 1164.76 0.00 0.00 7304.29 8469.05
Central 2959.37 0.00 0.00 2959.37 524 0.00 0.00 3483.37
Total 6179.37 1026.30 411.66 7617.33 524 2122.20 7422.84 17686.37
Figure 1.3 State energy break-up in percentage form, as on 30 August 2012
As can be seen, the present installed capacity of 17,868.37 MW mostly consists of coal (35%), hydro
(12%) and renewable energy (42%), mostly comprising installed wind power base of about 6,984
MW as on 31 March 2012 (source: Indian Wind Turbine Manufacturers Associations [IWTMA]). This
makes wind the single largest power generation technology in Tamil Nadu in terms of installed base.
1.1.2 Energy projections compared with present scenario
The state suffers from severe power shortages and has to resort to load-shedding even for select
industrial loads. According to the 2011-12 policy note of the Tamil Nadu Electricity Board (TNEB), for
financial year (FY) 2010-11, the deficit during peak hours (1800 hrs to 2200 hrs) ranged from 1400
MW to 3400 MW, while that during the day from 1700 MW to 3700 MW.
According to policy note 2011-12, gross energy consumption for the year was 77,218 million units
(MU). Of this, state-owned generating stations contributed to 27,941 MU, while 49,277 MU was
purchased from central generating stations, wind, open market, exchanges, etc. The state saw an all-
43
312
42Thermal
Nuclear
Hydro
Renewable
Action Plan for Comprehensive RE Development in Tamil Nadu
3
time maximum demand of 10,859 MW on 19 July 2011 and a maximum daily energy consumption of
237 MU on 20 June 2011. State load dispatch centre (SLDC) reports for March and April suggest load
shedding to the tune of 2000-2800 MW during lighting peak and evening peak hours. Despite load
shedding, the state remains largely dependent on independent power producers (IPPs) and
purchases power through power exchanges on a daily basis.
To address the present shortfall of about 1700–3700 MW at different times during the day, the state
government is trying to manage the grid by using strong measures in load curtailment and demand
side management. Some of the measures are highlighted below (source: Policy Note 2012-13)
[Ref 2]:
40% cut on base demand and energy for high tension (HT) industrial and commercial services.
Daily two-hour load shedding in Chennai and its suburbs, and four hours in urban and rural
feeders in other areas.
A nine-hour (six hours during day time and three hours at night) three-phase supply for
agricultural services.
HT industrial and commercial consumers are not allowed to draw more than 10% power from
the grid during evening peak hours (1800 hrs to 2200 hrs), for lighting and security purposes.
Introduction of power holiday to all HT, low tension (LT) and low-tension current transformer
(LTCT) industries for one day between Monday and Saturday on a staggered basis. In addition to
the above, all HT industries are required to declare Sunday as a weekly holiday.
All HT industries are permitted to procure power through both inter-state and intra-state open
access.
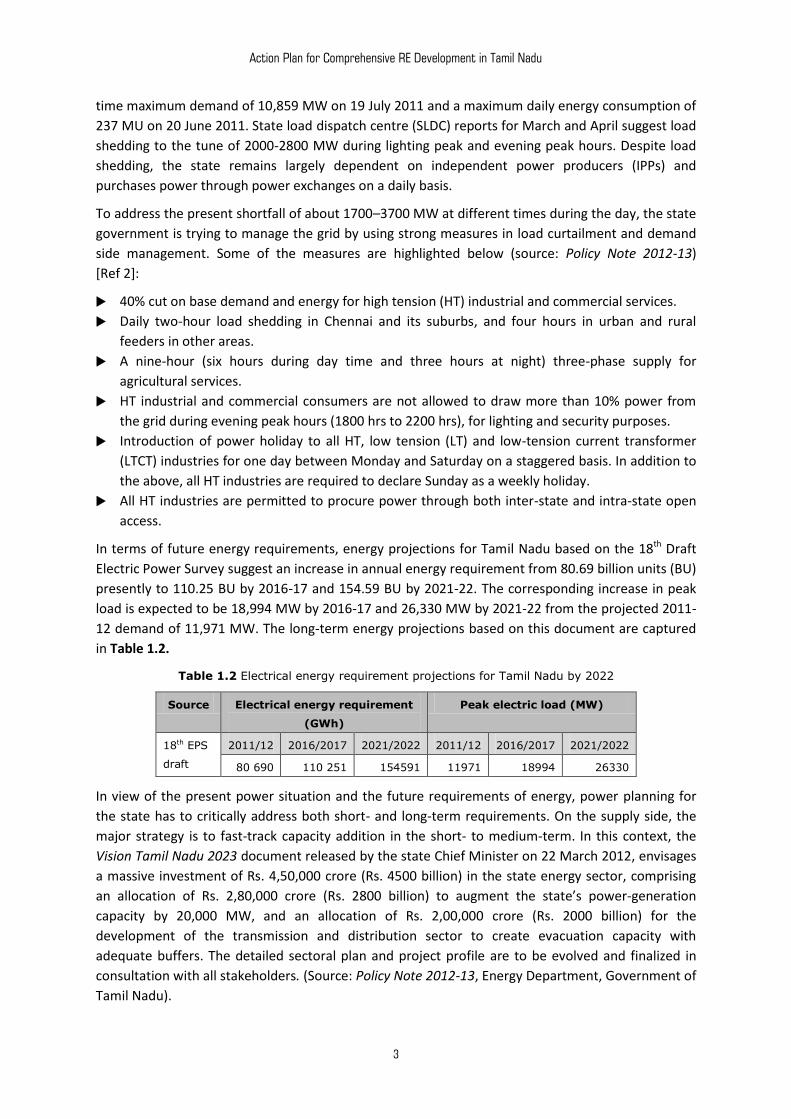
In terms of future energy requirements, energy projections for Tamil Nadu based on the 18th Draft
Electric Power Survey suggest an increase in annual energy requirement from 80.69 billion units (BU)
presently to 110.25 BU by 2016-17 and 154.59 BU by 2021-22. The corresponding increase in peak
load is expected to be 18,994 MW by 2016-17 and 26,330 MW by 2021-22 from the projected 2011-
12 demand of 11,971 MW. The long-term energy projections based on this document are captured
in Table 1.2.
Table 1.2 Electrical energy requirement projections for Tamil Nadu by 2022
Source Electrical energy requirement
(GWh)
Peak electric load (MW)
18th EPS
draft
2011/12 2016/2017 2021/2022 2011/12 2016/2017 2021/2022
80 690 110 251 154591 11971 18994 26330
In view of the present power situation and the future requirements of energy, power planning for
the state has to critically address both short- and long-term requirements. On the supply side, the
major strategy is to fast-track capacity addition in the short- to medium-term. In this context, the
Vision Tamil Nadu 2023 document released by the state Chief Minister on 22 March 2012, envisages
a massive investment of Rs. 4,50,000 crore (Rs. 4500 billion) in the state energy sector, comprising
an allocation of Rs. 2,80,000 crore (Rs. 2800 billion) to augment the state’s power-generation
capacity by 20,000 MW, and an allocation of Rs. 2,00,000 crore (Rs. 2000 billion) for the
development of the transmission and distribution sector to create evacuation capacity with
adequate buffers. The detailed sectoral plan and project profile are to be evolved and finalized in
consultation with all stakeholders. (Source: Policy Note 2012-13, Energy Department, Government of
Tamil Nadu).
Action Plan for Comprehensive RE Development in Tamil Nadu
4
According to the data on the website of Tamil Nadu Generation and Distribution Corporation Limited
(TANGEDCO) as on 25 May 2012, the expected addition over FY 2012-13 is to the tune of 1,876 MW,
with a further 1500 MW conventional thermal under the joint venture (JV) mode, where the capacity
available to the state will depend on the power sharing agreement with the JV partners. Most of the
planned additions expected to be commissioned in FY 2012-13 were actually slated to come earlier
but were beset with huge delays and setbacks, worsening the present power situation considerably.
The Kudankulam nuclear power plant’s first unit of 1,000 MW is expected to start generating within
months and the other unit is expected to become operational by 2013. These additions will ease the
power situation by end-FY 2012-13 but will not compensate for the whole deficit.
The second tranche of new projects – mostly from new coal-based plants, amounting to about
11,060 MW – are expected to come into operation only towards the end of the 12th five-year plan
and early part of the 13th plan period. However, most of these projects are at a very preliminary
stage (most still at the pre-tendering stage) and materialization of all the capacity seems
questionable in the present scenario of coal shortages and Engineering, Procurement and
Construction (EPC) bottlenecks. These aspects are covered in more detail in section 1.6.
1.2 Renewable Energy in Tamil Nadu Power Sector
Tamil Nadu has maintained its position as the renewable energy leader in India right from the early
1990s. The two monsoons, with the accompanying additional wind power, allow major sites in Tamil
Nadu to have much higher capacity-utilization factors as compared to other states. Tamil Nadu has
also made considerable efforts in tapping other renewable energy (RE) resources like small hydro
and biomass. Installed RE power generation capacity in the state has now reached over 40% of total
installed power. RE contribution is expected to increase over the years as the RE market leapfrogs in
Tamil Nadu, primarily driven by the new government’s thrust to add 5,000 MW of wind and 3,000
MW of solar power over the next five years.
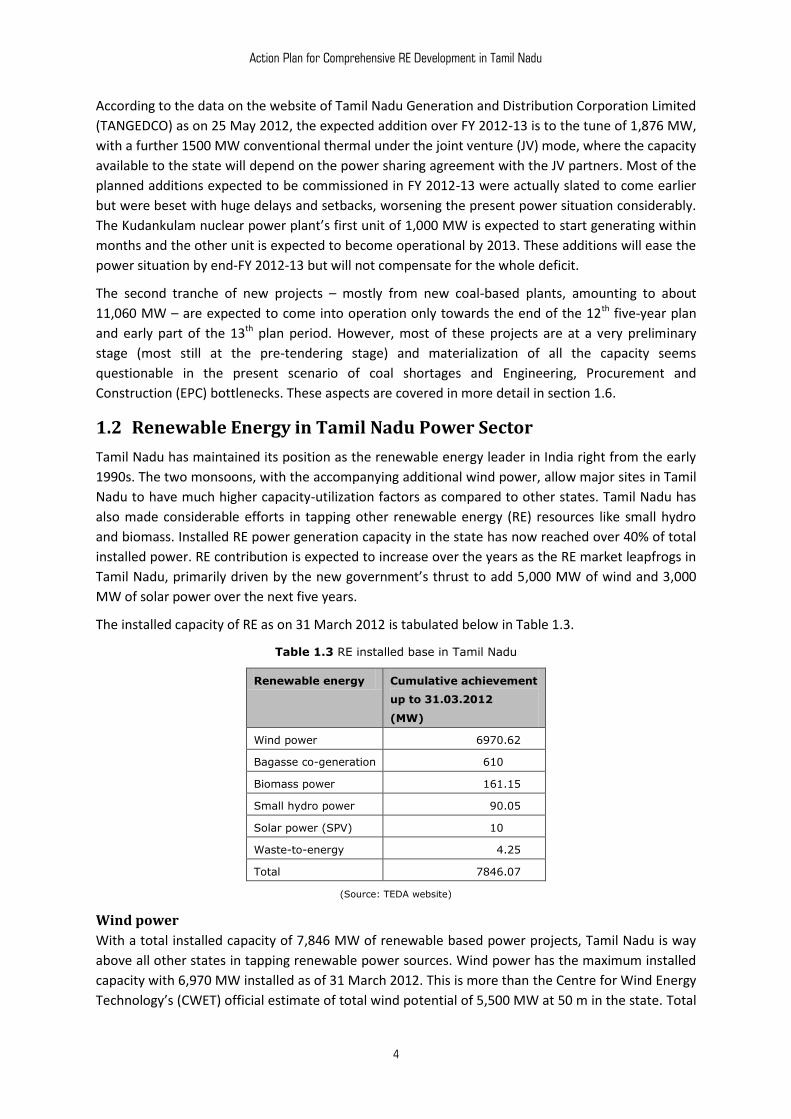
The installed capacity of RE as on 31 March 2012 is tabulated below in Table 1.3.
Table 1.3 RE installed base in Tamil Nadu
Renewable energy Cumulative achievement
up to 31.03.2012
(MW)
Wind power 6970.62
Bagasse co-generation 610.00
Biomass power 161.15
Small hydro power 90.05
Solar power (SPV) 10.00
Waste-to-energy 4.25
Total 7846.07
(Source: TEDA website)
Wind power
With a total installed capacity of 7,846 MW of renewable based power projects, Tamil Nadu is way
above all other states in tapping renewable power sources. Wind power has the maximum installed
capacity with 6,970 MW installed as of 31 March 2012. This is more than the Centre for Wind Energy
Technology’s (CWET) official estimate of total wind potential of 5,500 MW at 50 m in the state. Total
Action Plan for Comprehensive RE Development in Tamil Nadu
5
capacity addition in FY 2011-12 was about 1,084 MW. About 13,400 MW of new project applications
are pending with TNEB.
Four mountain passes, namely the Palghat pass (Coimbatore and Dindigul region), Shengottah pass
(Tirunelveli and Thottukudi), Aralvoimozhi pass (Kanyakumari, Radhapuram, and Muppandal region)
and Cumbum pass (Theni, Cumbum, and Andipatti region) in Tamil Nadu, are endowed with heavy
wind flows due to the tunnelling effect during the south-west monsoon.
Solar energy
Tamil Nadu has an installed base of 10 MW of solar power as on 31 March 2012. Under the Rooftop
Photovoltaic and Small Solar Power Generation Programme (RPSSGP) scheme, 7 projects of 1 MW
each were allotted to the state, out of which 5 projects have been commissioned. An additional 2
MW capacity is under construction. 15 MW of SPV projects have been allotted under the Jawaharlal
Nehru National Solar Mission (JNNSM) Batch-I and Batch-II in Tuticorin district. A 5 MW SPV power
project has been commissioned under Batch-I by CCCL Infrastructure Limited at village
Kombukaranatham, Dist. Tuticorin.
Recently, Tamil Nadu has also announced its State Solar Energy Policy with a target of 3,000 MW up
to year 2015 with 1000 MW capacity addition each year starting from 2013. The proposed addition
will be achieved through utility scale projects, rooftop and REC mechanism. TANGEDCO has already
invited bids for 1,000 MW solar power projects under competitive bidding scheme.
On the off-grid side, the state has supplied 12,000 solar lanterns, 6,378 solar home lights and solar
street lights under rural village electrification (RVE) schemes, along with 285 solar pump systems and
4,206 solar thermal systems with a collector area of 25,658 m2 as on October 2011 (source: TEDA
website).
Biomass
Cumulative installed capacity of grid-interactive biomass and bagasse-based co-generation stood at
771.15 MW as of 31 March 2012. Of this, bagasse-based cogeneration accounted for 610 MW. The
state government is keen to develop biomass potential even further through the
gasification/combustion route.
Small hydro
About 111.69 MW of small hydro-power had already been commissioned and 18 MW was under
construction as on 31 December 2011 (source: MNRE). Almost all the capacity, (except one 7 MW
SHP plant), was developed and is operated by TANGEDCO.
1.3 RE Policy and Regulation in Tamil Nadu
The nodal agency responsible for renewable energy development in the state, TEDA, has drafted a
state renewable energy policy framework, which presently awaits approval.
1.3.1 Renewable Regulation in Tamil Nadu
There have been many developments in the field of RE regulation. Some of the main regulations
related to RE are discussed below.
Tariff determination methodology
The main features of the various RE tariff orders issued by the Tamil Nadu Electricity Regularity
Commission (TNERC) are summarized below.
Action Plan for Comprehensive RE Development in Tamil Nadu
6
Cost plus tariff.
Single-part tariff for wind, SHP, and solar, and two-part tariff for biomass, bagasse co-
generation, biogas and bio-gasification power plants.
The Commission has awarded average tariff for wind and SHP, whereas levellized tariff is
awarded for small scale solar power projects commissioned under JNNSM.
Control period specified is two years.
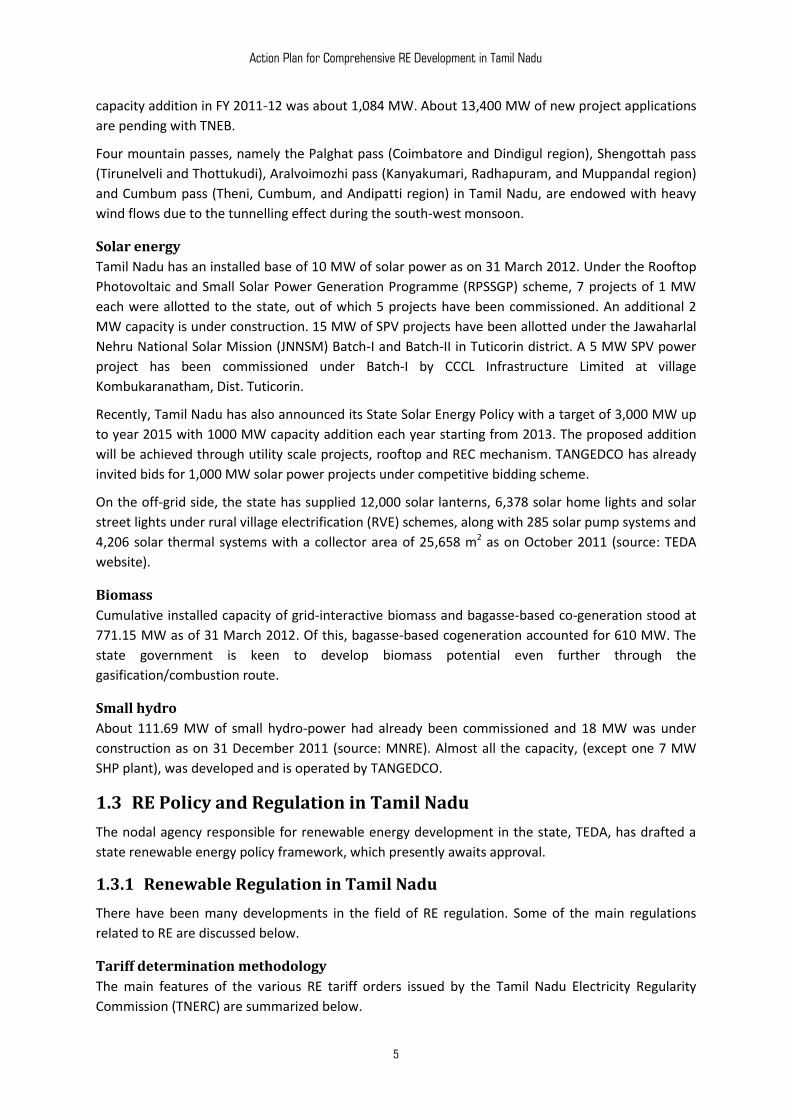
Table 1.4 summarizes the notified tariff for various technologies
Table 1.4 Tariffs for various RE technologies
Resource Wind Biomass Bagasse Co-
generation
SHP Small
Solar PV
Small
Solar
thermal
Order date 31.07.2012 31.07.2012 31.07.2012 March 2010
(Consultative
paper)
27.05.10 08.07.10
Applicable
for projects
Commissioned
on or after
Commissioned
on and after
Commissioned
on and after
Capacity
upto 5 MW
Connected at HT level of
distribution network
31.07.2012 01.08.2012 01.08.2012 (below 33 kV) with
installed capacity of 100
kW and up to 2 MW
Tariff
(Rs/kWh)
3.51 4.694–4.893 4.376–4.49 3.76
(FY2012/13)
18.45
(14.34 if
Accelerated
Depreciation
is availed)
15.51
(12.16 if
Accelerated
Depreciation
is availed)
Present
status
Tariff applicable for projects commissioned up to
31.07.2014
Up to 31.05.2012
Interconnection point
The interconnection point for wind power and solar PV projects is defined at the pooling substation
whereas for SHP, biomass and cogeneration projects, the same is defined on HV side of the
generator transformer. This is consistent with the CERC’s RE tariff regulations of 2009 and 2012.
Infrastructure cost
The State Transmission Utility (STU)/ distribution licensee is being made responsible for bearing the
cost of interfacing line and related evacuation infrastructure, in case the RE generator opts for sale
of entire energy to the distribution licensee. In case the RE generator opts to sell energy to a third
party, or decides to use the energy for captive purposes, then the RE generator has to reimburse the
cost of evacuation line.
Under an alternative infrastructure development model called 10(1), the wind developer pays no
upfront charges but invests directly in the infrastructure, which is then transferred to the
distribution licensee. The distribution licensee reimburses the wind project developer an amount
equivalent to the lowest tender quote for the same infrastructure development.
Open access
The regulation allows wheeling and banking to facilitate third party sale and captive use of RE.
Renewable energy generators in Tamil Nadu can also sell the electricity to any entity other than the
Action Plan for Comprehensive RE Development in Tamil Nadu
7
host distribution licensee (TANGEDCO) at a mutually agreed upon tariff, subject to the payment of
applicable transmission/ wheeling charges and other open access (OA) charges specified in TNERC’s
RE tariff orders. A generator of electricity from non-conventional energy sources shall be treated as a
long-term intra-state open access customer and shall be eligible for open access irrespective of the
generating capacity. As per the Government of Tamil Nadu policy for captive generation (G.O. MS.
No.48 Energy dated 22 April 1998), and subsequent amendments (a) a consumer of electricity; (b) a
group comprising more than one consumer as joint venture; (c) an actual user of power but not a
consumer; (d) a group of actual users of power, but not consumers as joint venture; (e) a group
comprising both consumers and users of power as joint venture – are allowed to install captive
power plants of any capacity and the power generated by these captive power plants shall be used
by the owner or by the sister concern(s) of the owner of the captive power plant(s). More
specifically, the generated power can be used by the owner and by the sister concern of the owner.
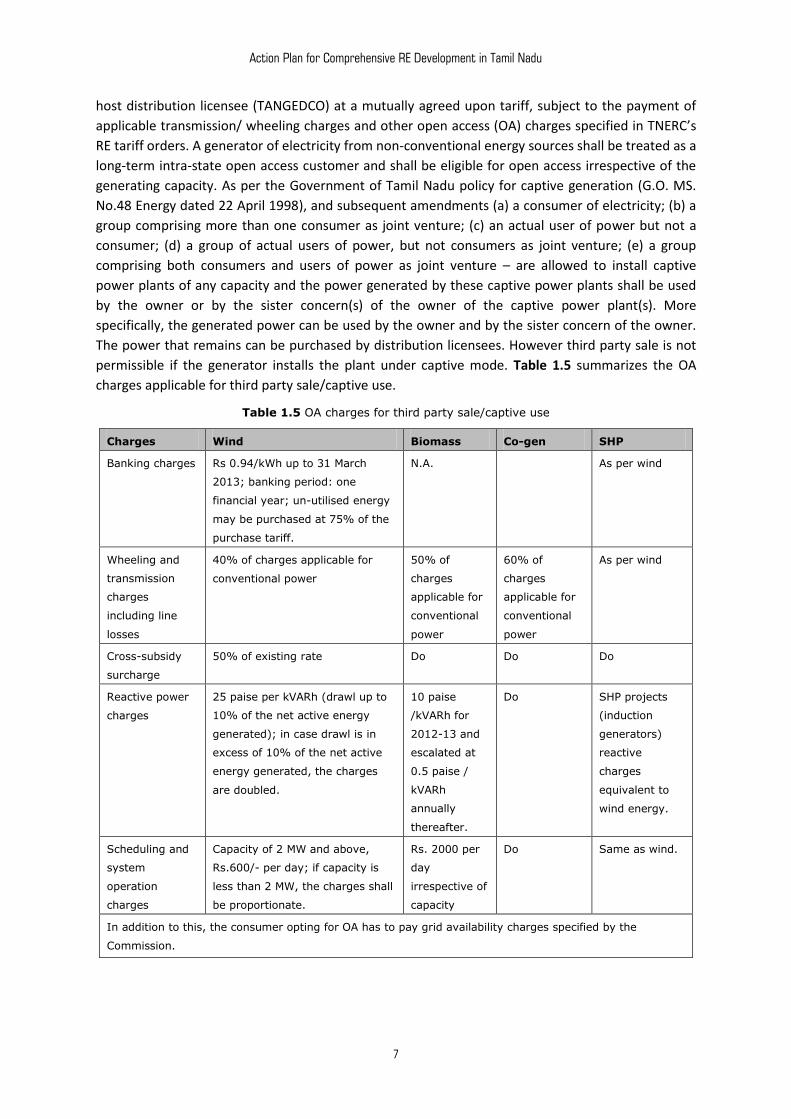
The power that remains can be purchased by distribution licensees. However third party sale is not
permissible if the generator installs the plant under captive mode. Table 1.5 summarizes the OA
charges applicable for third party sale/captive use.
Table 1.5 OA charges for third party sale/captive use
Charges Wind Biomass Co-gen SHP
Banking charges Rs 0.94/kWh up to 31 March
2013; banking period: one
financial year; un-utilised energy
may be purchased at 75% of the
purchase tariff.
N.A. As per wind
Wheeling and
transmission
charges
including line
losses
40% of charges applicable for
conventional power
50% of
charges
applicable for
conventional
power
60% of
charges
applicable for
conventional
power
As per wind
Cross-subsidy
surcharge
50% of existing rate Do Do Do
Reactive power
charges
25 paise per kVARh (drawl up to
10% of the net active energy
generated); in case drawl is in
excess of 10% of the net active
energy generated, the charges
are doubled.
10 paise
/kVARh for
2012-13 and
escalated at
0.5 paise /
kVARh
annually
thereafter.
Do SHP projects
(induction
generators)
reactive
charges
equivalent to
wind energy.
Scheduling and
system
operation
charges
Capacity of 2 MW and above,
Rs.600/- per day; if capacity is
less than 2 MW, the charges shall
be proportionate.
Rs. 2000 per
day
irrespective of
capacity
Do Same as wind.
In addition to this, the consumer opting for OA has to pay grid availability charges specified by the
Commission.
Action Plan for Comprehensive RE Development in Tamil Nadu
8
Renewable Purchase Obligation (RPO)/Renewable Energy Certificate (REC)
TNERC notified the regulation on RPO on 7 October 2010, further amended on 29 July 2011 to
incorporate REC related provisions. In order to facilitate REC trading, the minimum percentage of
obligation (for all obligated entities) was reduced to 9% for FY 2011-12, from the earlier proposed
14%. For FY 2011-12 the solar obligation was pegged at 0.05%. In a recent draft amendment to RPO
regulation, the solar percentage has been proposed to be fixed at 0.1% for FY 2012-13, while the
total renewable purchase obligation has been kept at the same level. The regulation defines the
‘Pooled cost of power purchase’ as the weighted average pooled price at which the distribution
licensee has purchased the electricity, including cost of self-generation in the previous year, from all
the long-term energy suppliers, but excluding those based on liquid fuel, purchase from traders,
short-term purchases and RE sources. Recently, TNERC by a separate order, specified pooled cost of
power purchase as Rs. 2.54 per unit for FY 2012-13. The eligibility criteria for RE generators to avail
REC benefit is as per the Central Electricity Regulatory Commission’s (CERC) REC regulation. The
regulation designates the SLDC as ‘State Agency’. Furthermore, it specifies that a RE-based grid-
connected co-generation plant (CGP) shall be eligible for RECs on the energy generated, excluding
auxiliary consumption, that such CGP has not availed or does not propose to avail any benefit in the
form of concessional/promotional transmission or wheeling charges, banking facility benefit and
waiver of electricity duty/tax. The regulation also obligates captive users and open access consumers
but allows phased implementation of the obligation due to implementation constraints.
1.4 Challenges to Integrating RE in Tamil Nadu
The installed capacity of power generation in Tamil Nadu from renewable energy sources has now
reached about 33% of the country’s installed capacity from renewable sources.
However, wind power development in Tamil Nadu has significantly outpaced grid development,
leading to severe problems related to grid integration. The developers cite evacuation bottlenecks
and low tariffs as the biggest hurdle while the major issue with grid operators and the utility is the
technical management of variable generation and the associated commercial implications.
We briefly highlight the major issues to set the reference. A more detailed coverage of these issues
is provided in subsequent chapters.
Evacuation infrastructure
Evacuation arrangement for RE resources is difficult owing to resource locations in remote areas
where the distribution grids are typically weak. This is especially problematic for small-capacity
plants whose size cannot justify creation of additional HV infrastructure. Even in case of large-
capacity clusters, the laying of parallel evacuation infrastructure not only adds to costs but also to
construction time.
At present, evacuating wind power during peak wind season, especially in Tirunelveli and
Muppandal, requires evacuation to nearby major 230 kV or 400 kV substations, as the downstream
demand is already met. This overloads the existing 110 kV lines resulting in backing down of wind
even when the system may have unmet demand. The only option is to connect wind power
generation directly at 220 or 400 kV level or to strengthen the existing line. Both the options have
technical and commercial implications. These implications are discussed in more detail in
subsequent chapters.
Action Plan for Comprehensive RE Development in Tamil Nadu
9
Power system stability
Today RE has prominent influence on grid security, stability and congestion management. As the
majority of grid-connected wind farms in India have asynchronous generators drawing reactive
power from the grid, there may be problems related to voltage instability and power quality. The
dispersed nature of wind resources and their decentralized locations also mean weak
interconnection links that result in local impacts like transmission- /sub-transmission-level system
overloading. However, it is worth noting that for many new projects, advanced technologies have
been deployed to effectively overcome these problems. Many new technology wind turbines can
provide a voltage-ride through (VRT) feature in addition to supporting the grid with reactive power
based on system conditions.
Power system operation
It is known that the generation pattern of wind and solar power is variable. Typically, the MW
contribution of wind in Tamil Nadu may vary from about 3,000 MW (high-wind season) to about 50
MW (low-wind season). On the other hand, even during the wind season, wind generation may, at
times, taper down to 900 MW or less from a high of 2,500 MW within a day. This variability poses
significant challenges in balancing generation as system operators have to adjust generation from
other stations. This results in operational complexities and associated commercial implications.
Costs of regulatory provisions due to banking
Another related aspect is the co-relation of wind generation with demand. In Tamil Nadu, peak
demand season is in early summer months, when wind power generation is low. Wind picks up in
late summer and monsoon seasons when the demand drops down. This nature of wind generation
coupled with the regulatory provision of banking has also been a major point of contention. Banking
facility allows wind generators to bank a part of the energy generated during the wind season and
offset it with their consumption in off-wind season. As per provisions, banking customers have to be
supplied their banked units on priority. This may necessitate the utility to overdraw or buy power
from exchanges/IPPs/traders in a low supply situation, when the power costs may be high.
Costs and impacts of balancing generation
Understandably, this variability in generation also has commercial implications. In extreme cases,
wind generation contribution may result in a high-supply situation and the utility finds itself in a
position where, in order to integrate wind generation, it may either have to back down low-cost
thermal or hydro generation, or will have to inject the excess power in the regional grid, and seek
frequency dependent unscheduled interchange (UI) charges. Both the options are not acceptable to
the utility, which sees more merit in shutting down excess wind generation. On the other hand,
there could be situations when gradual drop in wind generation may force the utility either to
overdraw power or to resort to unplanned load shedding.
Commercial implications of infrastructure development
Strengthening of existing network or creation of new dedicated evacuation infrastructure carries
significant cost implications for the utility. Issues related to evacuation infrastructure are thus
commercial and require a commercial solution. It seems that TNEB has also realized this and under
the National Clean Energy Fund (NCEF) proposal submission process of the Ministry of New and
Renewable Energy (MNRE), has asked for central assistance of Rs. 17,570 million to develop
transmission grid infrastructure to evacuate about 4,000 MW of renewable power. This expansion is
aimed at evolving a power grid to facilitate free flow of power across regional boundaries by raising
Action Plan for Comprehensive RE Development in Tamil Nadu
10
the transmission voltage from 230 kV to 400 kV and, if required, enhancing transmission capability
to 765 kV level. (Source: MNRE, TNEB websites). The huge capital investment led TNEB to approach
the Japanese Industrial Cooperative Agency (JICA) which will provide financial assistance in certain
transmission schemes to be taken up during the next five years. The Official Development Assistance
(ODA) loan by JICA will strengthen the transmission network at a cost of Rs. 3,572.93 crore, by
establishing five 400 kV substations and fourteen 230 kV substations with associated lines during the
next five years. Further, to evacuate power from wind generators, a separate corridor with three
new 400 kV substations at Thappagundu, Anaikadavu and Rasipalayam, is to be built, along with the
associated 400 kV lines of 336 circuit (ckt) km length. These substations will be connected to the
proposed 765 kV substations being executed by Power Grid Corporation of India Ltd (PGCIL) at
Salem. (Source: Policy Note 2012-13, Energy Department, Government of Tamil Nadu).
1.5 Emerging Perspective on Power Sector
Historically, power generation capacity additions of conventional technologies in India have fallen
significantly short of government targets. The opposite has been true for renewables. Even from the
perspective of future planning, renewables seem to be a better bet as compared to conventional
power generation technologies.
While there are contending views on figures related to the availability of fossil fuel sources (coal,
gas, etc), there is no disputing the fact that these sources are going to get depleted. Recent
developments related to difficulties in coal allocations, limited coal stocks in running plants and price
volatility, point to the fact that a coal-based power system is exposed to serious systemic and
financial risks. This has major implications for power sector planning and energy security, especially
for a state like Tamil Nadu. On the other hand, renewables are not going to deplete. As for their
potential to deliver, recent studies clearly point out that wind potential in Tamil Nadu is significantly
higher than the official estimate of 5,400 MW. For other RE technologies too, especially solar,
preliminary information indicates a very high potential.
If we look at technical integration issues, it can be said that most of the technical challenges related
to power quality like reactive power drawl, harmonics, under voltage trip, etc., have been
adequately addressed using new technology configurations, while problems related to load
management of renewables are still unresolved. Wind and solar generation patterns typically vary
significantly across the seasons and even across the day, and integrating this variable generation
with scheduled conventional generation and matching it with demand is a challenge for grid
operators. But it is worth noting that these same challenges have been addressed very effectively by
European utilities, particularly those in Ireland and Denmark, where the instantaneous wind energy
contribution has, at times, gone as high as 100% of total system demand. And it is worth noting that
despite the experience of dealing with a large penetration of wind, Denmark is planning to increase
its wind energy penetration in its network to 50% [Ref 3]. According to Danish energy planners and
technologists, the variability problem is technically manageable.
From the point of view of commercial acceptance of renewables, private sector investments from
IPPs suggest that wind is already commercially competitive. The year on year increasing trend of
average power procurement cost (APPC) indicates a steady increase in conventional power prices. In
contrast, solar power prices have seen a steep fall in recent years with prices falling drastically in
each successive round of reverse bidding process under the JNNSM. Wind power tariffs are
increasing but are not expected to match the rate of increase in the conventional generation prices
as delays, coal shortages, financial situation of distribution companies (DISCOMS) and high
Action Plan for Comprehensive RE Development in Tamil Nadu
11
imported-coal prices are expected to precipitate a serious supply crunch in the face of increasing
demand
In this background, low thermal power-generation costs cannot be taken for granted. It has to be
accepted that wind power, and ultimately all renewables are getting competitive and will achieve
grid parity in the near future, effectively discounting any need for cost comparison. Even from a
global perspective, man-made crises related to environmental sustainability, climate change, water
scarcity, etc., seem to suggest that a business-as-usual approach and a narrow definition of growth
are not justifiable any more.
1.6 The Case for a Transition to RE Power in Tamil Nadu
The total installed generation capacity in Tamil Nadu including state-owned capacity, centrally
owned capacity, and private sector capacity is 17686.37 MW (as on 31.08.2012, source: Central
Electricity Authority [CEA]), comprising 7617.8 MW of thermal (coal, gas and diesel), 524 MW of
nuclear, 2,122 MW of hydro, and 7,422.84 MW of renewables.
However, the power deficit situation in the state is so acute that the state is forced to buy high-cost
power despite high level of demand curtailment. The state-owned energy generation capacity is also
not large, resulting in considerable dependence on power from central generating stations,
independent power producers (IPPs), captive power plants, energy exchanges, traders and
renewables.
The proposed capacity addition plans comprising mainly coal-based power generation capacities are
expected to transform the state from a power-deficit state to a power-surplus state. However, a
preliminary analysis of the existing data related to coal-based capacity addition indicates that the
state energy planning based on these projects is exposed to huge risks that can have serious
implications for the state in the years to come.
To elaborate, the conventional capacity addition plans of the state can be categorized into two
distinct phases. The first phase includes short-term capacity additions that are expected to come by
the end of FY 2012-13. These comprise 2 × 600 MW units of North Chennai Thermal Power Station
(NCTPS) Phase II, one 600 MW unit of Mettur Thermal Power Station (MTPS), one 1,000 MW of
Neyveli Lignite Corporation (NLC) Limited and 1,500 MW of National Thermal Power Corporation
(NTPC)–Tamil Nadu Electricity Board (TNEB) Limited, in addition to about 56.5 MW of hydro capacity,
totaling to 4,356 MW.
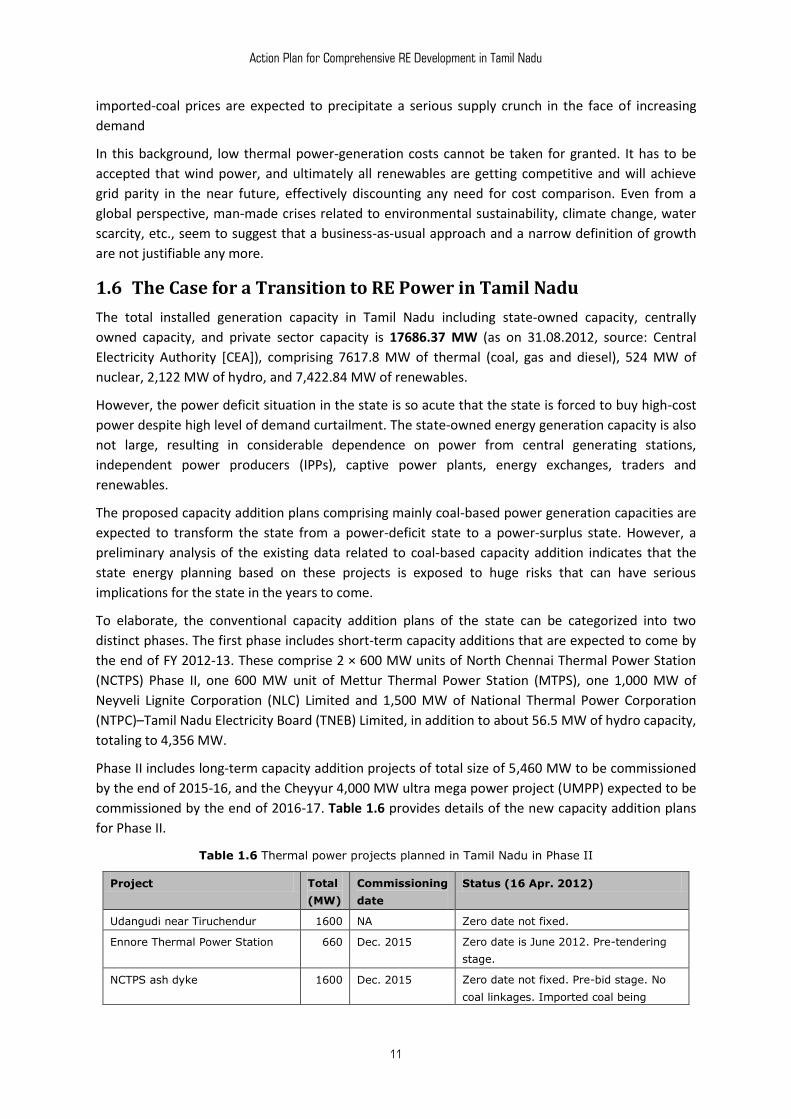
Phase II includes long-term capacity addition projects of total size of 5,460 MW to be commissioned
by the end of 2015-16, and the Cheyyur 4,000 MW ultra mega power project (UMPP) expected to be
commissioned by the end of 2016-17. Table 1.6 provides details of the new capacity addition plans
for Phase II.
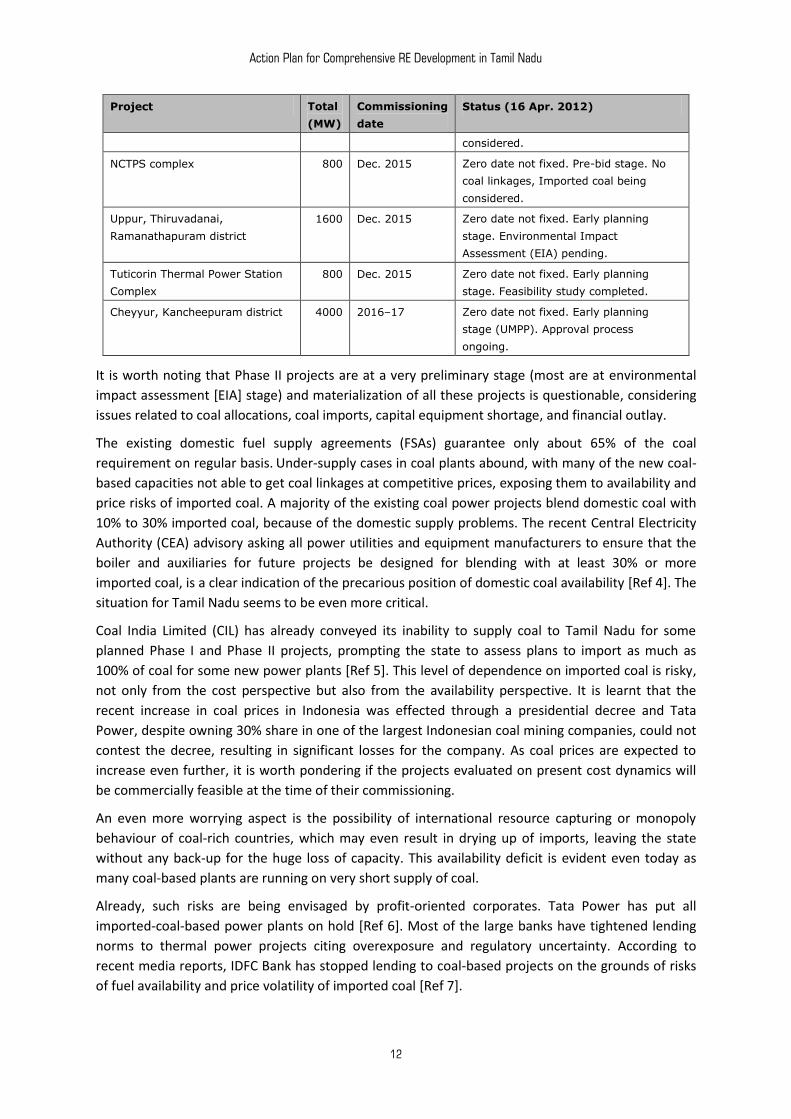
Table 1.6 Thermal power projects planned in Tamil Nadu in Phase II
Project Total
(MW)
Commissioning
date
Status (16 Apr. 2012)
Udangudi near Tiruchendur 1600 NA Zero date not fixed.
Ennore Thermal Power Station 660 Dec. 2015 Zero date is June 2012. Pre-tendering
stage.
NCTPS ash dyke 1600 Dec. 2015 Zero date not fixed. Pre-bid stage. No
coal linkages. Imported coal being
Action Plan for Comprehensive RE Development in Tamil Nadu
12
Project Total
(MW)
Commissioning
date
Status (16 Apr. 2012)
considered.
NCTPS complex 800 Dec. 2015 Zero date not fixed. Pre-bid stage. No
coal linkages, Imported coal being
considered.
Uppur, Thiruvadanai,
Ramanathapuram district
1600 Dec. 2015 Zero date not fixed. Early planning
stage. Environmental Impact
Assessment (EIA) pending.
Tuticorin Thermal Power Station
Complex
800 Dec. 2015 Zero date not fixed. Early planning
stage. Feasibility study completed.
Cheyyur, Kancheepuram district 4000 2016–17 Zero date not fixed. Early planning
stage (UMPP). Approval process
ongoing.
It is worth noting that Phase II projects are at a very preliminary stage (most are at environmental
impact assessment [EIA] stage) and materialization of all these projects is questionable, considering
issues related to coal allocations, coal imports, capital equipment shortage, and financial outlay.
The existing domestic fuel supply agreements (FSAs) guarantee only about 65% of the coal
requirement on regular basis. Under-supply cases in coal plants abound, with many of the new coal-
based capacities not able to get coal linkages at competitive prices, exposing them to availability and
price risks of imported coal. A majority of the existing coal power projects blend domestic coal with
10% to 30% imported coal, because of the domestic supply problems. The recent Central Electricity
Authority (CEA) advisory asking all power utilities and equipment manufacturers to ensure that the
boiler and auxiliaries for future projects be designed for blending with at least 30% or more
imported coal, is a clear indication of the precarious position of domestic coal availability [Ref 4]. The
situation for Tamil Nadu seems to be even more critical.
Coal India Limited (CIL) has already conveyed its inability to supply coal to Tamil Nadu for some
planned Phase I and Phase II projects, prompting the state to assess plans to import as much as
100% of coal for some new power plants [Ref 5]. This level of dependence on imported coal is risky,
not only from the cost perspective but also from the availability perspective. It is learnt that the
recent increase in coal prices in Indonesia was effected through a presidential decree and Tata
Power, despite owning 30% share in one of the largest Indonesian coal mining companies, could not
contest the decree, resulting in significant losses for the company. As coal prices are expected to
increase even further, it is worth pondering if the projects evaluated on present cost dynamics will
be commercially feasible at the time of their commissioning.
An even more worrying aspect is the possibility of international resource capturing or monopoly
behaviour of coal-rich countries, which may even result in drying up of imports, leaving the state
without any back-up for the huge loss of capacity. This availability deficit is evident even today as
many coal-based plants are running on very short supply of coal.
Already, such risks are being envisaged by profit-oriented corporates. Tata Power has put all
imported-coal-based power plants on hold [Ref 6]. Most of the large banks have tightened lending
norms to thermal power projects citing overexposure and regulatory uncertainty. According to
recent media reports, IDFC Bank has stopped lending to coal-based projects on the grounds of risks
of fuel availability and price volatility of imported coal [Ref 7].
Action Plan for Comprehensive RE Development in Tamil Nadu
13
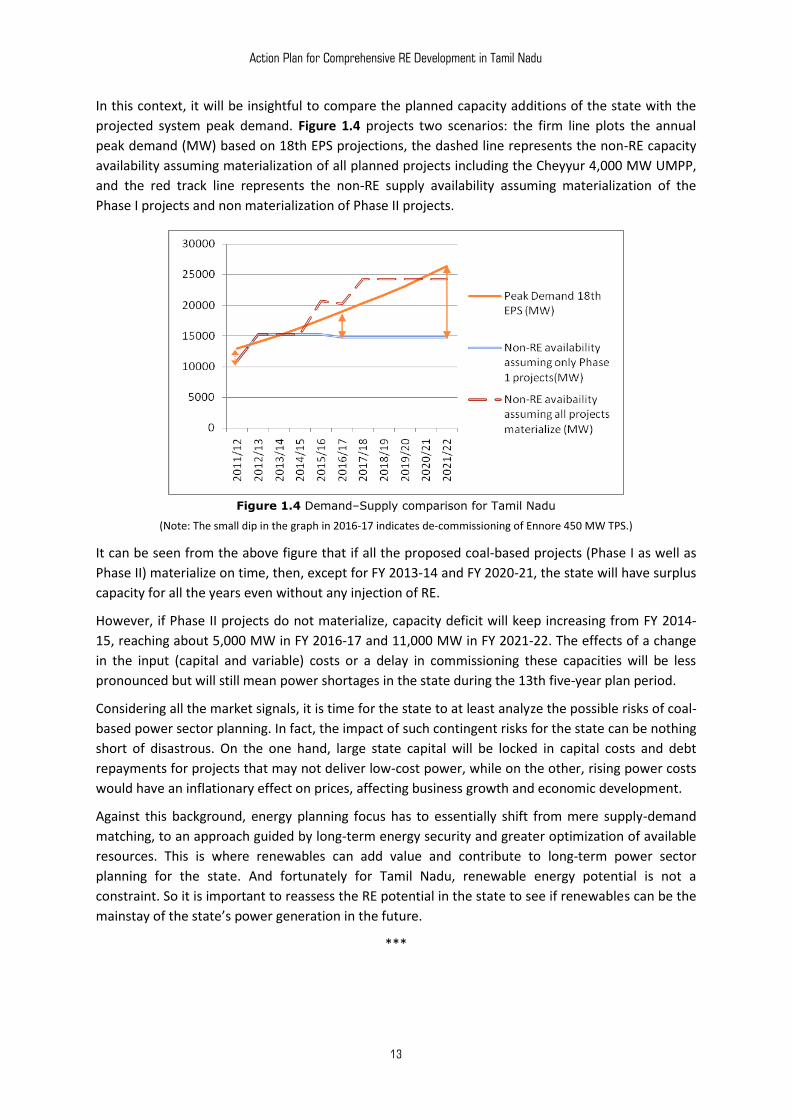
In this context, it will be insightful to compare the planned capacity additions of the state with the
projected system peak demand. Figure 1.4 projects two scenarios: the firm line plots the annual
peak demand (MW) based on 18th EPS projections, the dashed line represents the non-RE capacity
availability assuming materialization of all planned projects including the Cheyyur 4,000 MW UMPP,
and the red track line represents the non-RE supply availability assuming materialization of the
Phase I projects and non materialization of Phase II projects.
Figure 1.4 Demand–Supply comparison for Tamil Nadu
(Note: The small dip in the graph in 2016-17 indicates de-commissioning of Ennore 450 MW TPS.)
It can be seen from the above figure that if all the proposed coal-based projects (Phase I as well as
Phase II) materialize on time, then, except for FY 2013-14 and FY 2020-21, the state will have surplus
capacity for all the years even without any injection of RE.
However, if Phase II projects do not materialize, capacity deficit will keep increasing from FY 2014-
15, reaching about 5,000 MW in FY 2016-17 and 11,000 MW in FY 2021-22. The effects of a change
in the input (capital and variable) costs or a delay in commissioning these capacities will be less
pronounced but will still mean power shortages in the state during the 13th five-year plan period.
Considering all the market signals, it is time for the state to at least analyze the possible risks of coal-
based power sector planning. In fact, the impact of such contingent risks for the state can be nothing
short of disastrous. On the one hand, large state capital will be locked in capital costs and debt
repayments for projects that may not deliver low-cost power, while on the other, rising power costs
would have an inflationary effect on prices, affecting business growth and economic development.
Against this background, energy planning focus has to essentially shift from mere supply-demand
matching, to an approach guided by long-term energy security and greater optimization of available
resources. This is where renewables can add value and contribute to long-term power sector
planning for the state. And fortunately for Tamil Nadu, renewable energy potential is not a
constraint. So it is important to reassess the RE potential in the state to see if renewables can be the
mainstay of the state’s power generation in the future.
***

Action Plan for Comprehensive RE Development in Tamil Nadu
14
Action Plan for Comprehensive RE Development in Tamil Nadu
15
PART – II
RE-ASSESSMENT OF RE POTENTIAL IN TAMIL NADU

Action Plan for Comprehensive RE Development in Tamil Nadu
16
Action Plan for Comprehensive RE Development in Tamil Nadu
17
2. The Context, General Objectives and Principles of RE Potential Assessment
The context for re-assessment of renewable energy potential was set after Tamil Nadu reached an
installed wind capacity of 6,000 MW in August 2011 as against the official state potential estimate of
5,374 MW. Notwithstanding the fact that an additional 1000+ MW wind capacity was in the pipeline
for 2011-12, this mismatch corroborated the long-standing contention of wind power stakeholders,
industry leaders and independent experts that the official wind potential estimate was extremely
conservative and not representative of the actual achievable potential.
The aim of the present study is to critically re-assess the renewable energy potential of Tamil Nadu
and draw up a comprehensive action plan for the development of identified renewable energy
capacity in the state. As compared to past potential assessment studies, the present study is
different in respect to two aspects.
The study uses the geographical information system (GIS) platform linked with multi-criteria
analysis (MCA) for assessment of wind (onshore and offshore) and grid-tied solar power (solar
PV and CSP). In addition, the study also tries to assess potential for other renewable energy
technologies like repowering, off-grid solar applications, biomass power and small hydro using
standard tabulated calculations.
The present study uses a mix of market information and literature review to arrive at the
methodology and the assumptions for the potential assessment exercise.
Why GIS?
Considering the ambiguities and differences in the assumptions, it is increasingly obvious that a
paper-based exercise for potential assessment cannot and will not give a reliable and robust
estimate of renewable resource potential. The first step before any real assessment exercise can
take place is to understand the assumptions and their underlying rationale. For renewable resources
and technology, this assumption set can only be accurately validated with on-site measurements and
detailed land surveys. The scope of the project visualised a GIS-based exercise supported by suitable
field and spatial data, that not only considers terrain features but also numerical models based on
reliable source data for micro-scale assessment. Moreover, such a GIS-based exercise will add
tremendous value to the planning process as it will enhance visualization and aid data analysis for
varying spatial selections. For the present project, all the GIS-based analysis has been done on the
Arc View 10 platform.
GIS-based RE Potential Estimation Plan
WISE has sourced the base GIS data from various commercial and government sources. The
emphasis will be on selecting the highest resolution data that meets cost and time targets. WISE has
used the following major GIS data layers – wind resource, solar resource, land-use and land cover,
terrain elevation, hydrogeology, cropping pattern and irrigated land, administrative and political
boundaries, etc. In addition, various thematic layers with features like roads, rivers, railway,
transmission lines, etc., have also been included.
The final GIS portal includes a map of Tamil Nadu state with suitable raster and vector layers
including land-use, land cover, terrain elevation, administrative boundaries along with gradations
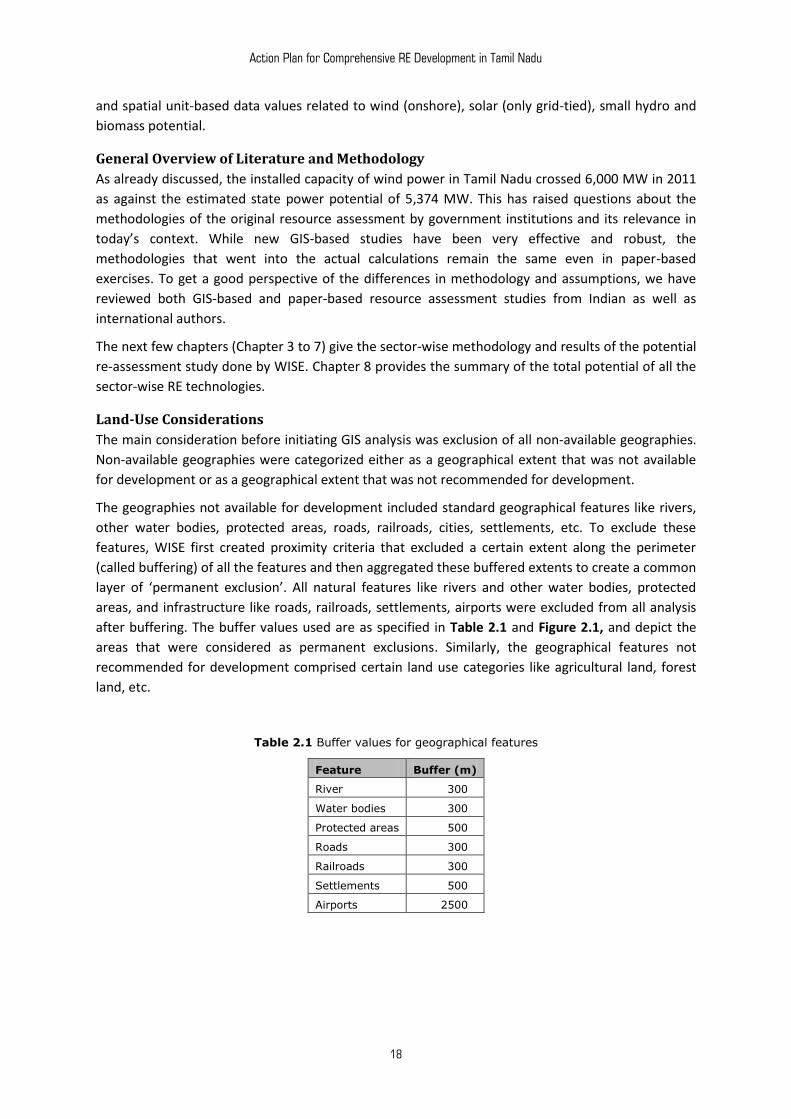
Action Plan for Comprehensive RE Development in Tamil Nadu
18
and spatial unit-based data values related to wind (onshore), solar (only grid-tied), small hydro and
biomass potential.
General Overview of Literature and Methodology
As already discussed, the installed capacity of wind power in Tamil Nadu crossed 6,000 MW in 2011
as against the estimated state power potential of 5,374 MW. This has raised questions about the
methodologies of the original resource assessment by government institutions and its relevance in
today’s context. While new GIS-based studies have been very effective and robust, the
methodologies that went into the actual calculations remain the same even in paper-based
exercises. To get a good perspective of the differences in methodology and assumptions, we have
reviewed both GIS-based and paper-based resource assessment studies from Indian as well as
international authors.
The next few chapters (Chapter 3 to 7) give the sector-wise methodology and results of the potential
re-assessment study done by WISE. Chapter 8 provides the summary of the total potential of all the
sector-wise RE technologies.
Land-Use Considerations
The main consideration before initiating GIS analysis was exclusion of all non-available geographies.
Non-available geographies were categorized either as a geographical extent that was not available
for development or as a geographical extent that was not recommended for development.
The geographies not available for development included standard geographical features like rivers,
other water bodies, protected areas, roads, railroads, cities, settlements, etc. To exclude these
features, WISE first created proximity criteria that excluded a certain extent along the perimeter
(called buffering) of all the features and then aggregated these buffered extents to create a common
layer of ‘permanent exclusion’. All natural features like rivers and other water bodies, protected
areas, and infrastructure like roads, railroads, settlements, airports were excluded from all analysis
after buffering. The buffer values used are as specified in Table 2.1 and Figure 2.1, and depict the
areas that were considered as permanent exclusions. Similarly, the geographical features not
recommended for development comprised certain land use categories like agricultural land, forest
land, etc.
Table 2.1 Buffer values for geographical features
Feature Buffer (m)
River 300
Water bodies 300
Protected areas 500
Roads 300
Railroads 300
Settlements 500
Airports 2500
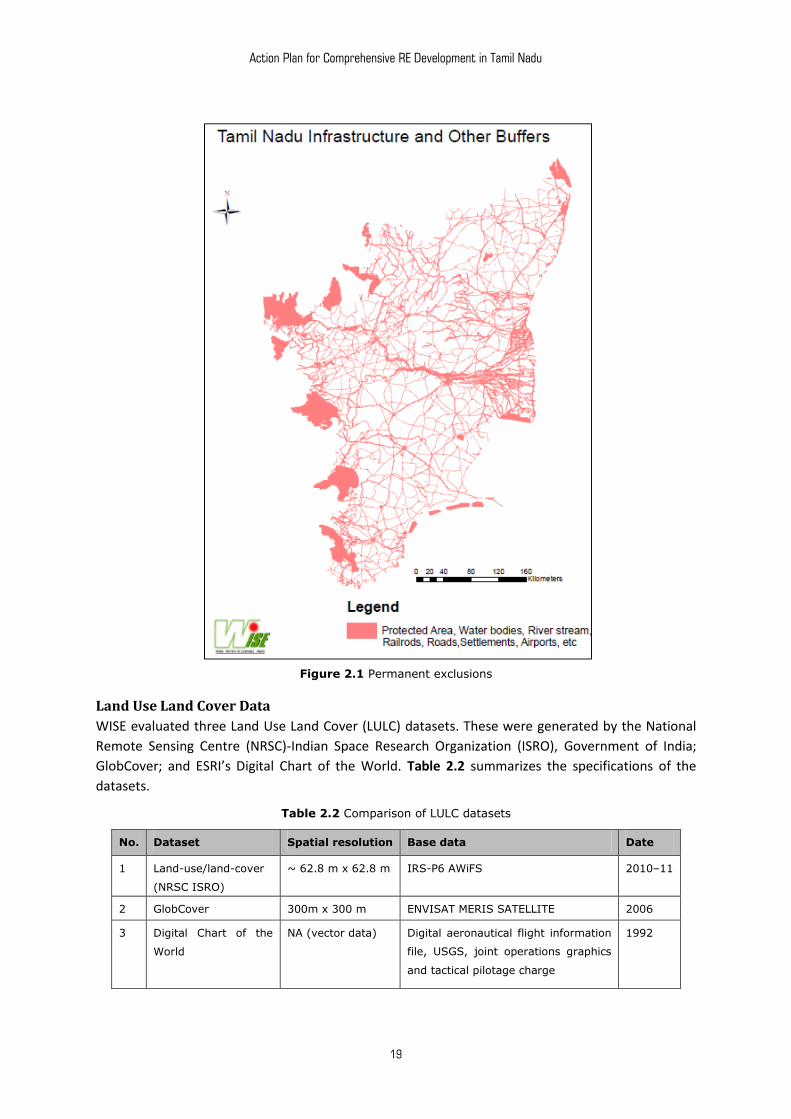
Action Plan for Comprehensive RE Development in Tamil Nadu
19
Figure 2.1 Permanent exclusions
Land Use Land Cover Data
WISE evaluated three Land Use Land Cover (LULC) datasets. These were generated by the National
Remote Sensing Centre (NRSC)-Indian Space Research Organization (ISRO), Government of India;
GlobCover; and ESRI’s Digital Chart of the World. Table 2.2 summarizes the specifications of the
datasets.
Table 2.2 Comparison of LULC datasets
No. Dataset Spatial resolution Base data Date
1 Land-use/land-cover
(NRSC ISRO)
~ 62.8 m x 62.8 m IRS-P6 AWiFS 2010–11
2 GlobCover 300m x 300 m ENVISAT MERIS SATELLITE 2006
3 Digital Chart of the
World
NA (vector data) Digital aeronautical flight information
file, USGS, joint operations graphics
and tactical pilotage charge
1992
Action Plan for Comprehensive RE Development in Tamil Nadu
20
It was decided to use NRSC-ISRO LULC data for the analysis because it was the latest data (2010-11)
and had very high resolution as compared to global datasets. Another important reason for choosing
NRSC-ISRO data was that it was government approved and validated by experts attuned to Indian
land-use patterns.
WISE retrieved other data including that of administrative areas and geographical features from
AWS Truepower. Table 2.3 provides description and specification of the other datasets used.
Table 2.3 Miscellaneous datasets
No. Database Dataset Base data Date
1 Shuttle Radar Topography Mission
(SRTM) Version 2
90 m × 90 m NASA satellite 2009
2 Protected area World Database on
Protected Areas
UNEP Not known
3 Geographic features (rivers, water
bodies)
VMAP 0 National Imagery and
Mapping Agency
Not known
4 Administrative boundaries GADM database of
Global Administrative
Areas v2
Unknown 2012
5 Infrastructure (roads, railroads,
cities, settlements, urban areas)
VMAP 0 National Imagery and
Mapping Agency
2000
6 Bathymetry map** Hard copy navigation
map INT 754 32
Marine Aids Not known
**Bathymetry hard copy map was digitized to convert it into a GIS polygon layer
***
Action Plan for Comprehensive RE Development in Tamil Nadu
21
3. Solar Power Potential in Tamil Nadu
WISE has assessed solar power potential in Tamil Nadu and its findings are highlighted as part of the
literature review. Additionally, to bring the present exercise in context, the emphasis was on
reviewing the literature on the use of GIS for solar resource assessment or planning. The brief of the
reviewed literature is as below.
Technical parameters keep changing for the solar sector, as new incremental and breakthrough
innovations are introduced. Even more important factors like topography, vegetation, land-use
considerations and water availability are also crucial factors for identification of areas with solar
power potential. GIS-based solar resource assessment goes beyond just providing a figure; it can
identify the exact location and the quality of the resources allowing governments and decision-
makers to use the results as policy inputs.
3.1 Solar-Resource Data
After evaluating the specifications of freely available datasets (from the American National
Renewable Energy Laboratory [NREL] and the National Aeronautics and Space Administration
[NASA]) and other modelled datasets on solar resources, WISE procured a modelled dataset of
SolarGIS from GeoModel Solar ES, a Slovakia-based resource assessment firm. The main reason for
choosing the SolarGIS dataset was the resolution of the dataset (1 sq. km × 1 sq. km), a resolution
that was 100 times higher than the NREL dataset, which offered a grid size of 10 sq. km × 10 sq. km.
The NASA dataset was at an even lower resolution of 110 sq. km × 110 sq. km.
WISE compared the global horizontal irradiance (GHI) data of GeoModel with other modelled data
from NASA, NREL, and Meteonorm, and found that the deviation in correlation coefficient value
across the models varied in the range of 0.91 to 0.96, suggesting very good correspondence.
However, comparison of GeoModel’s Direct Normal Irradiation (DNI) data with other datasets
showed considerable differences in the values, with the GeoModel values being consistently lower
by about 10%–50% across all locations. In fact, the GeoModel data indicated a maximum DNI value
in Tamil Nadu of 1632 kWh/sq. m, effectively ruling out any attractive CSP potential in Tamil Nadu. In
contrast, the next high resolution dataset of NREL (10 km × 10 km) indicated very high values of over
1800 kWh/sq. m for majority of the state.
Interaction with experts indicated that DNI is a derived value and is very sensitive to small deviations
in the data inputs, such as aerosol content, water vapour or terrain. Many solar resource assessment
studies also suggest that the high deviation in DNI value is mainly due to treatment of aerosols in the
model. It is also well known that data variations are common all over the world. WISE’s internal
research indicates +/– 15% variation in DNI values while comparing the India Meteorological
Department data with that obtained from various other software tools from NASA, NREL,
Meteonorm etc.
In view of these technicalities and observations, no conclusive comparison could be done for DNI
data and it was decided to use both the NREL and GeoModel datasets for solar power potential
assessment.
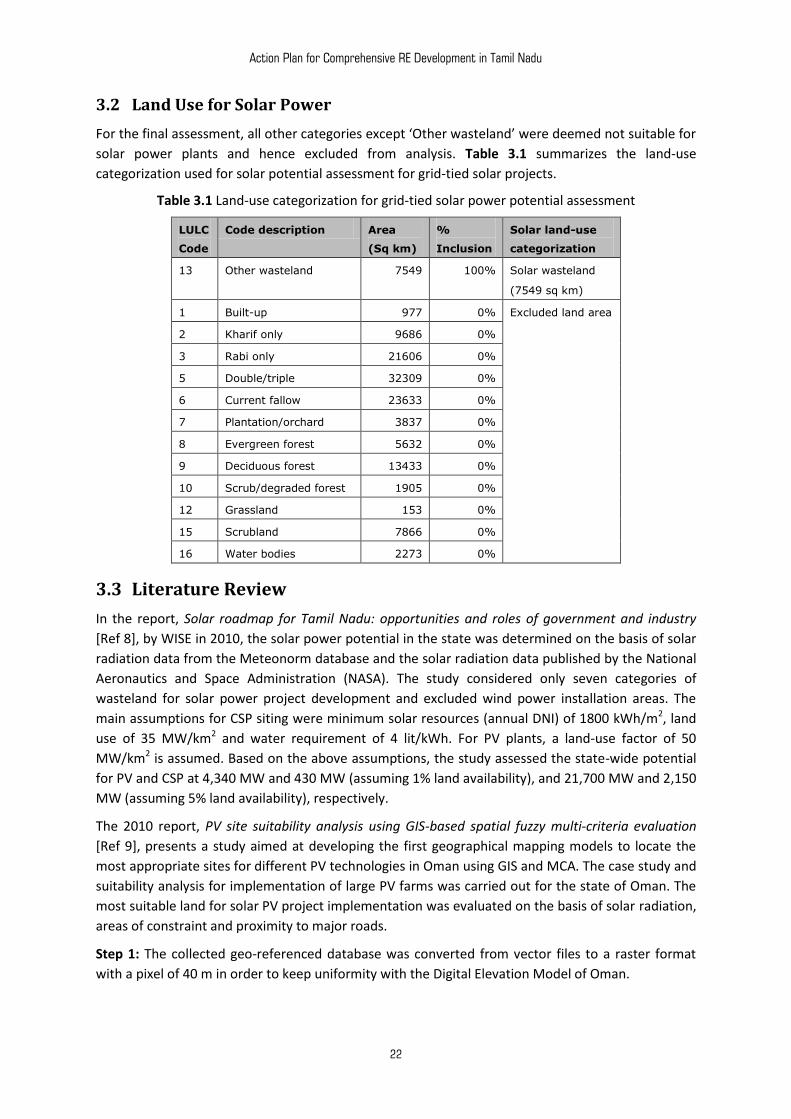
Action Plan for Comprehensive RE Development in Tamil Nadu
22
3.2 Land Use for Solar Power
For the final assessment, all other categories except ‘Other wasteland’ were deemed not suitable for
solar power plants and hence excluded from analysis. Table 3.1 summarizes the land-use
categorization used for solar potential assessment for grid-tied solar projects.
Table 3.1 Land-use categorization for grid-tied solar power potential assessment
LULC
Code
Code description Area
(Sq km)
%
Inclusion
Solar land-use
categorization
13 Other wasteland 7549 100% Solar wasteland
(7549 sq km)
1 Built-up 977 0% Excluded land area
2 Kharif only 9686 0%
3 Rabi only 21606 0%
5 Double/triple 32309 0%
6 Current fallow 23633 0%
7 Plantation/orchard 3837 0%
8 Evergreen forest 5632 0%
9 Deciduous forest 13433 0%
10 Scrub/degraded forest 1905 0%
12 Grassland 153 0%
15 Scrubland 7866 0%
16 Water bodies 2273 0%
3.3 Literature Review
In the report, Solar roadmap for Tamil Nadu: opportunities and roles of government and industry
[Ref 8], by WISE in 2010, the solar power potential in the state was determined on the basis of solar
radiation data from the Meteonorm database and the solar radiation data published by the National
Aeronautics and Space Administration (NASA). The study considered only seven categories of
wasteland for solar power project development and excluded wind power installation areas. The
main assumptions for CSP siting were minimum solar resources (annual DNI) of 1800 kWh/m2, land
use of 35 MW/km2 and water requirement of 4 lit/kWh. For PV plants, a land-use factor of 50
MW/km2 is assumed. Based on the above assumptions, the study assessed the state-wide potential
for PV and CSP at 4,340 MW and 430 MW (assuming 1% land availability), and 21,700 MW and 2,150
MW (assuming 5% land availability), respectively.
The 2010 report, PV site suitability analysis using GIS-based spatial fuzzy multi-criteria evaluation
[Ref 9], presents a study aimed at developing the first geographical mapping models to locate the
most appropriate sites for different PV technologies in Oman using GIS and MCA. The case study and
suitability analysis for implementation of large PV farms was carried out for the state of Oman. The
most suitable land for solar PV project implementation was evaluated on the basis of solar radiation,
areas of constraint and proximity to major roads.
Step 1: The collected geo-referenced database was converted from vector files to a raster format
with a pixel of 40 m in order to keep uniformity with the Digital Elevation Model of Oman.
Action Plan for Comprehensive RE Development in Tamil Nadu
23
Step 2: The solar radiation analyst module of Arc-GIS was used to map the total solar radiation. The
module incorporates slope, hill shade, and the ability to produce an accurate solar radiation map,
allowing the coefficient of the atmospheric transmissivity to be modified.
Step 3: A constraint layer regrouping all the unsuitable areas was created. This layer is composed of
dams, flood areas, land used, village boundaries, historical monuments, tourist attractions, rivers,
sand dunes, roads, and area with slopes of more than 5%. The unsuitable areas were attributed by 0
and the suitable by 1.
Step 4: Land accessibility was recognized as an important criteria for PV farms. As the objective was
to minimize distance from roads, the straight-line distance tool of Arc-GIS was used to measure
distances from each location to the closest road.
Step 5: Solar radiation, constraint layer and the straight-line distance to roads were used to run the
FLOWA module (an optimization application).
The 2011 study Hotspots of solar potential in India [Ref 10], sought to identify solar hotspots in a
vast and densely inhabited geographical area to help meet the escalating power demand in a
decentralized, efficient and sustainable manner. The study collected NASA Surface Solar Energy (SSE)
monthly average global insolation data for more than 900 grids, which optimally cover the entire
topography of India within 8-38°N latitude and 68-98°E longitude. A geo-statistical bilinear
interpolation was employed by the study to produce monthly average global insolation maps for the
country detailed with isohels (lines/contours of equal solar radiation) using GIS. Regions receiving
favourable annual global insolation for electricity generation with technologies like SPV and CSP and
the prospects for successful dissemination of solar devices were demarcated as solar hotspots.
Devices based on CSP depend on a direct component of global insolation; hence its intensity in the
identified solar hotspots in India was verified based on surface measurements obtained from solar
radiation stations.
The result showed that the Gangetic plains plateau region, western dry region, Gujarat plains and hill
region as well as the West Coast plains and Ghat region receive annual global insolation above 5
kWh/m2/day. The eastern part of Ladakh region and minor parts of Himachal Pradesh, Uttarakhand,
and Sikkim located in the Himalayan belt also receive similar average global insolation annually.
These regions constitute solar hotspots and cover nearly 1.89 million km2 (~58%) of land in India and
offer favourable prospects for solar-based renewable energy technologies.
The objective of another 2010 project conducted by Clean Energy Associates in the city of Austin in
Texas, USA – A solar rooftop assessment for Austin [Ref 11] – was to create a model for assessing the
extent of rooftop area on commercial, industrial, institutional, and government buildings in Austin
energy, the local power utility’s service area (suitable for solar electric energy development) and
based on this model, determine the potential installed capacity and annual energy production from
solar electric installations on the rooftops of these buildings. In this study, Clean Energy Associates
created a model to assess the rooftop solar potential available in Austin. The model employed a
step-by-step analytical approach to determine the rooftop area available on buildings in Austin
Energy. Once the extent was known, Clean Energy Associates applied appropriate factors to
calculate the available MW power and annual energy in MW hours (MWh).
The present study also reviewed two other studies: Potential and prospects of solar energy in Uttara
Kannada, district of Karnataka state, India [Ref 12], and Implications of renewable energy
technologies in Bangladesh power sector: Long-term planning strategies [Ref 13].
Action Plan for Comprehensive RE Development in Tamil Nadu
24
3.4 Summary of Assumptions and Findings from the Literature Review
The majority of studies considered base solar insolation data along with constraint data from land-
use and technology requirement, to identify critical development areas but not to evaluate actual
potential. In all potential assessment exercises related to solar, the net land area available after
meeting the technical, geographical, social and legal constraints was directly converted into MW
potential by using the corresponding solar technology area density (for different PV as well as CSP
technologies). Some of the other findings along with the approach adopted by WISE are as follows.
The studies utilized a mix of numerically modelled or statistically extrapolated solar insolation
data.
For the present study, WISE used numerically modelled data from commercial as well as
academic sources. A sample comparison of the modelled data with other datasets like
Meteonorm was also done.
The majority of studies included considerations based on GIS, slope, shading effect and elevation
to establish base-siting requirements.
WISE assumed the following siting considerations: Slope <3% for CSP and <5% for solar PV, in
addition to land-use inclusion of ‘only wasteland’ category.
All the studies except that of WISE (which was not GIS-based), considered only one technology.
As the present study on Tamil Nadu study requires evaluation of both solar PV and solar thermal
potential, WISE considered only the following generation technologies under the solar PV and
CSP technology family.
Solar PV: crystalline PV and CPV
CSP: solar tower and solar trough
Furthermore, considering technology costs and potential, WISE gave preference to CSP over solar
PV as CSP requires water in addition to a high value of solar DNI. CSP siting was done based on
availability of surface water within a 10 km radius. Furthermore, for each technology family (PV
and CSP), a single average land-use requirement for all technologies was taken as the basis for
potential evaluation.
The land requirement for CSP was assumed as 35 MW/km2 based on the report, ‘Global
Concentrated Solar Power Markets and Strategies, 2007–2020’, while that for PV was taken as
50 MW/km2, consistent with the industry norms for crystalline PV plants.
Based on literature and standard norms adopted by the industry, the established norm for
minimum annual DNI is 1800 kWh/m2 for CSP to ensure feasibility of currently established
technologies.
WISE used the same cut-off values (annual DNI of 1800 kWh/m2 for CSP) for evaluating the
adequacy of the solar resource. For PV technologies, a minimum annual GHI value of 1600
kWh/m2 was assumed to reduce data processing efforts.
3.5 Solar PV & CSP Methodology for Potential Assessment of Solar Power
The basic approach for solar potential was to work out the net available area suitable for solar
generation after excluding the technical, geographic and social constraint layers. This net area
identified for each technology family, namely CSP and solar PV, was then to be converted into
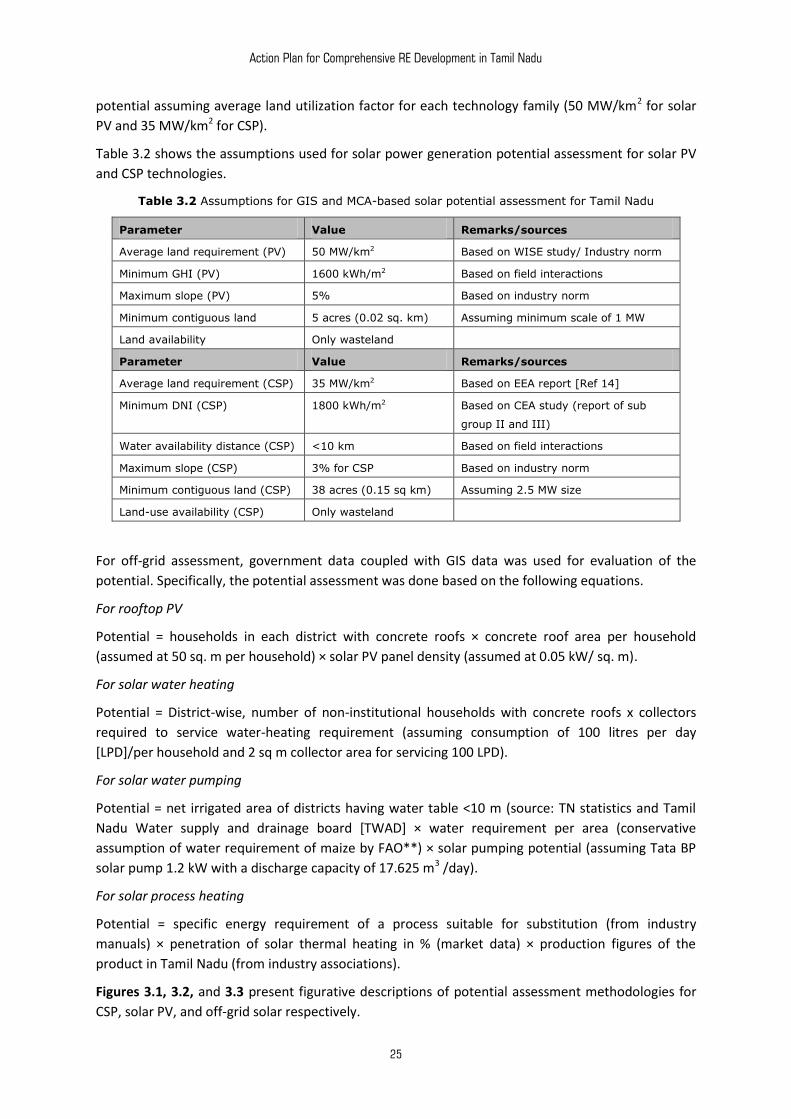
Action Plan for Comprehensive RE Development in Tamil Nadu
25
potential assuming average land utilization factor for each technology family (50 MW/km2 for solar
PV and 35 MW/km2 for CSP).
Table 3.2 shows the assumptions used for solar power generation potential assessment for solar PV
and CSP technologies.
Table 3.2 Assumptions for GIS and MCA-based solar potential assessment for Tamil Nadu
Parameter Value Remarks/sources
Average land requirement (PV) 50 MW/km2 Based on WISE study/ Industry norm
Minimum GHI (PV) 1600 kWh/m2 Based on field interactions
Maximum slope (PV) 5% Based on industry norm
Minimum contiguous land 5 acres (0.02 sq. km) Assuming minimum scale of 1 MW
Land availability Only wasteland
Parameter Value Remarks/sources
Average land requirement (CSP) 35 MW/km2 Based on EEA report [Ref 14]
Minimum DNI (CSP) 1800 kWh/m2 Based on CEA study (report of sub
group II and III)
Water availability distance (CSP) <10 km Based on field interactions
Maximum slope (CSP) 3% for CSP Based on industry norm
Minimum contiguous land (CSP) 38 acres (0.15 sq km) Assuming 2.5 MW size
Land-use availability (CSP) Only wasteland
For off-grid assessment, government data coupled with GIS data was used for evaluation of the
potential. Specifically, the potential assessment was done based on the following equations.
For rooftop PV
Potential = households in each district with concrete roofs × concrete roof area per household
(assumed at 50 sq. m per household) × solar PV panel density (assumed at 0.05 kW/ sq. m).
For solar water heating
Potential = District-wise, number of non-institutional households with concrete roofs x collectors
required to service water-heating requirement (assuming consumption of 100 litres per day
[LPD]/per household and 2 sq m collector area for servicing 100 LPD).
For solar water pumping
Potential = net irrigated area of districts having water table <10 m (source: TN statistics and Tamil
Nadu Water supply and drainage board [TWAD] × water requirement per area (conservative
assumption of water requirement of maize by FAO**) × solar pumping potential (assuming Tata BP
solar pump 1.2 kW with a discharge capacity of 17.625 m3 /day).
For solar process heating
Potential = specific energy requirement of a process suitable for substitution (from industry
manuals) × penetration of solar thermal heating in % (market data) × production figures of the
product in Tamil Nadu (from industry associations).
Figures 3.1, 3.2, and 3.3 present figurative descriptions of potential assessment methodologies for
CSP, solar PV, and off-grid solar respectively.
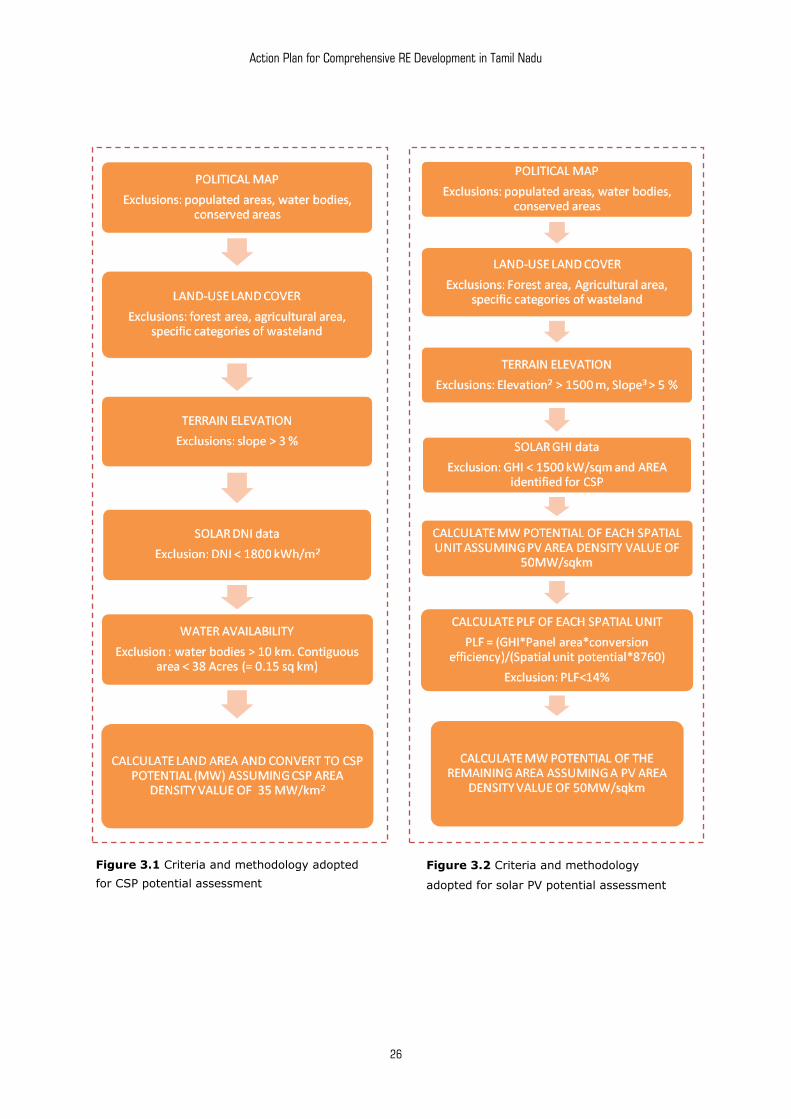
Action Plan for Comprehensive RE Development in Tamil Nadu
26
Figure 3.1 Criteria and methodology adopted
for CSP potential assessment
Figure 3.2 Criteria and methodology
adopted for solar PV potential assessment
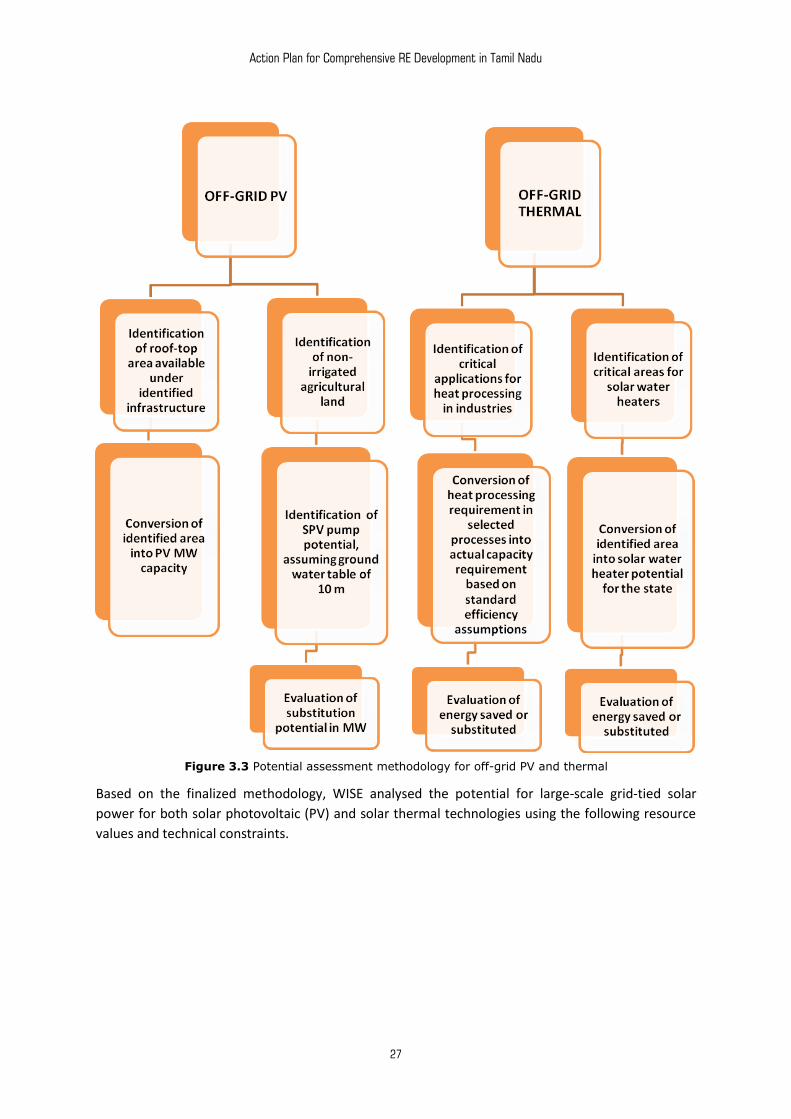
Action Plan for Comprehensive RE Development in Tamil Nadu
27
Figure 3.3 Potential assessment methodology for off-grid PV and thermal
Based on the finalized methodology, WISE analysed the potential for large-scale grid-tied solar
power for both solar photovoltaic (PV) and solar thermal technologies using the following resource
values and technical constraints.
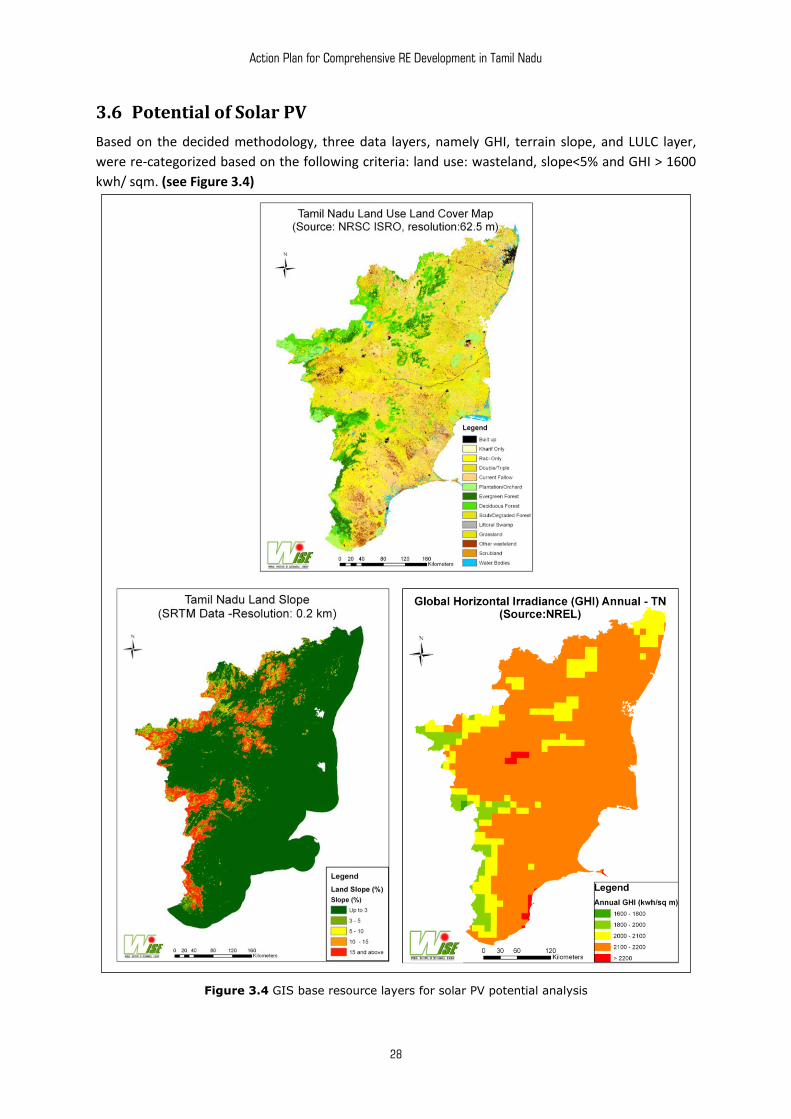
Action Plan for Comprehensive RE Development in Tamil Nadu
28
3.6 Potential of Solar PV
Based on the decided methodology, three data layers, namely GHI, terrain slope, and LULC layer,
were re-categorized based on the following criteria: land use: wasteland, slope<5% and GHI > 1600
kwh/ sqm. (see Figure 3.4)
Figure 3.4 GIS base resource layers for solar PV potential analysis
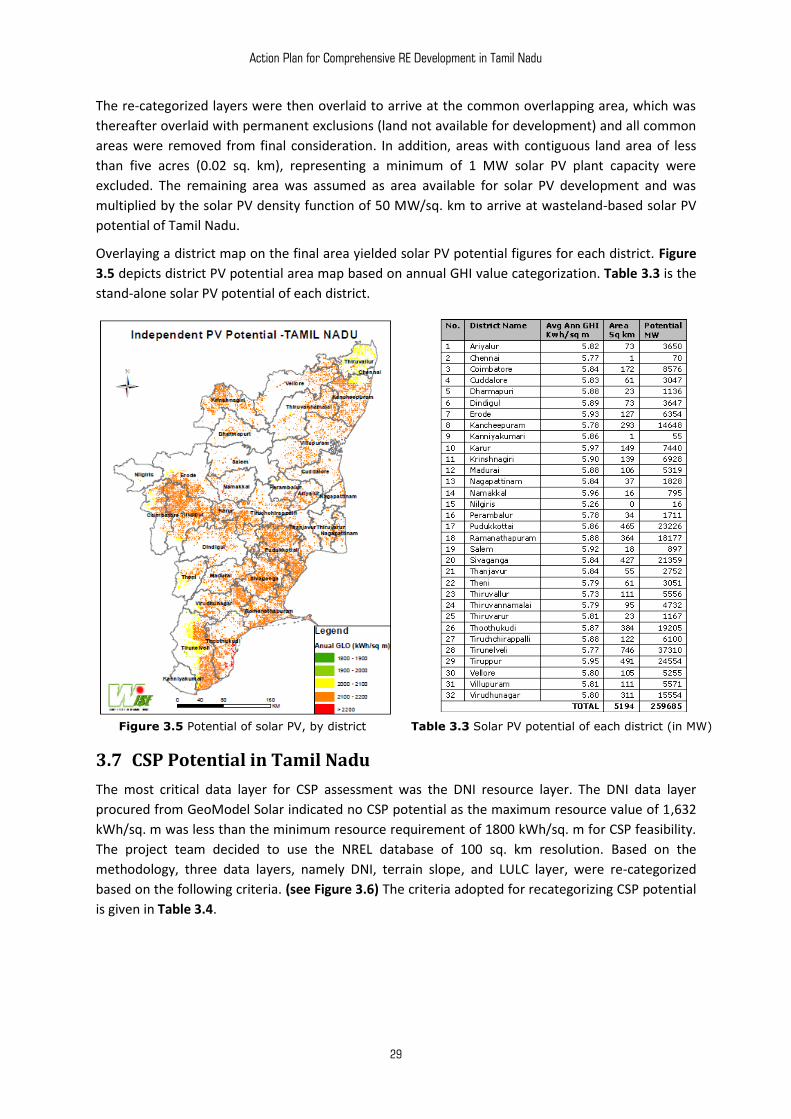
Action Plan for Comprehensive RE Development in Tamil Nadu
29
The re-categorized layers were then overlaid to arrive at the common overlapping area, which was
thereafter overlaid with permanent exclusions (land not available for development) and all common
areas were removed from final consideration. In addition, areas with contiguous land area of less
than five acres (0.02 sq. km), representing a minimum of 1 MW solar PV plant capacity were
excluded. The remaining area was assumed as area available for solar PV development and was
multiplied by the solar PV density function of 50 MW/sq. km to arrive at wasteland-based solar PV
potential of Tamil Nadu.
Overlaying a district map on the final area yielded solar PV potential figures for each district. Figure
3.5 depicts district PV potential area map based on annual GHI value categorization. Table 3.3 is the
stand-alone solar PV potential of each district.
Figure 3.5 Potential of solar PV, by district Table 3.3 Solar PV potential of each district (in MW)
3.7 CSP Potential in Tamil Nadu
The most critical data layer for CSP assessment was the DNI resource layer. The DNI data layer
procured from GeoModel Solar indicated no CSP potential as the maximum resource value of 1,632
kWh/sq. m was less than the minimum resource requirement of 1800 kWh/sq. m for CSP feasibility.
The project team decided to use the NREL database of 100 sq. km resolution. Based on the
methodology, three data layers, namely DNI, terrain slope, and LULC layer, were re-categorized
based on the following criteria. (see Figure 3.6) The criteria adopted for recategorizing CSP potential
is given in Table 3.4.
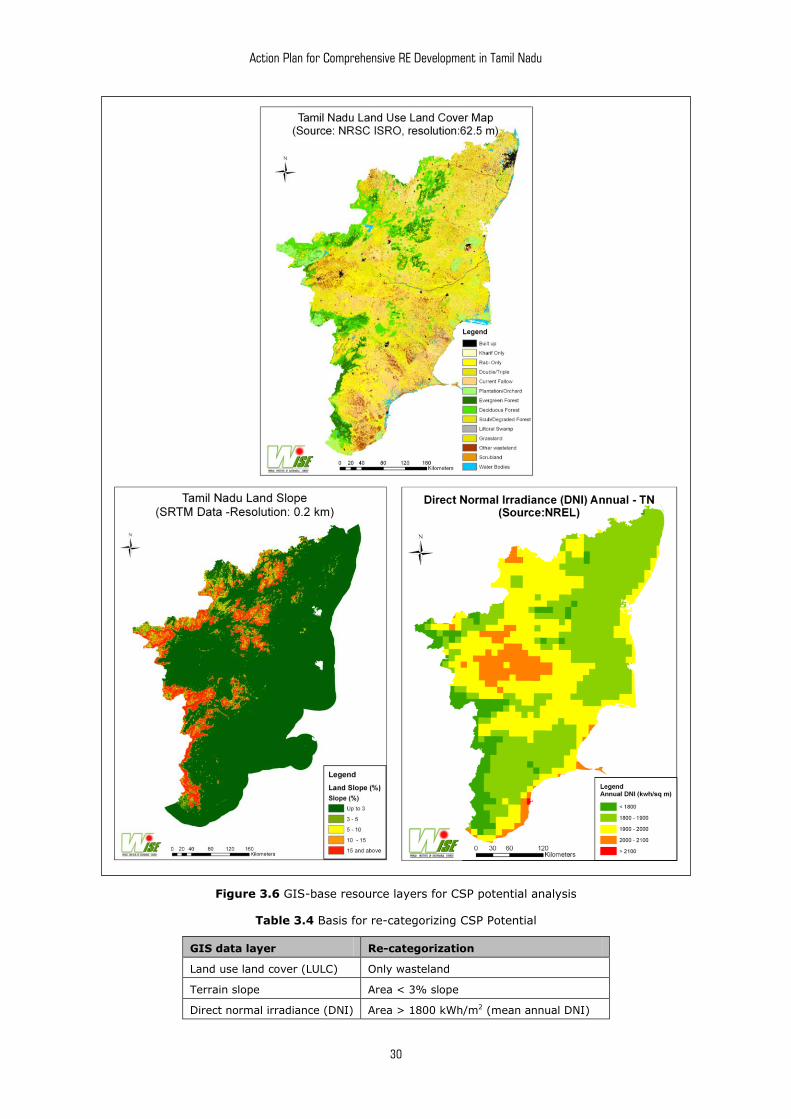
Action Plan for Comprehensive RE Development in Tamil Nadu
30
Figure 3.6 GIS-base resource layers for CSP potential analysis
Table 3.4 Basis for re-categorizing CSP Potential
GIS data layer Re-categorization
Land use land cover (LULC) Only wasteland
Terrain slope Area < 3% slope
Direct normal irradiance (DNI) Area > 1800 kWh/m2 (mean annual DNI)
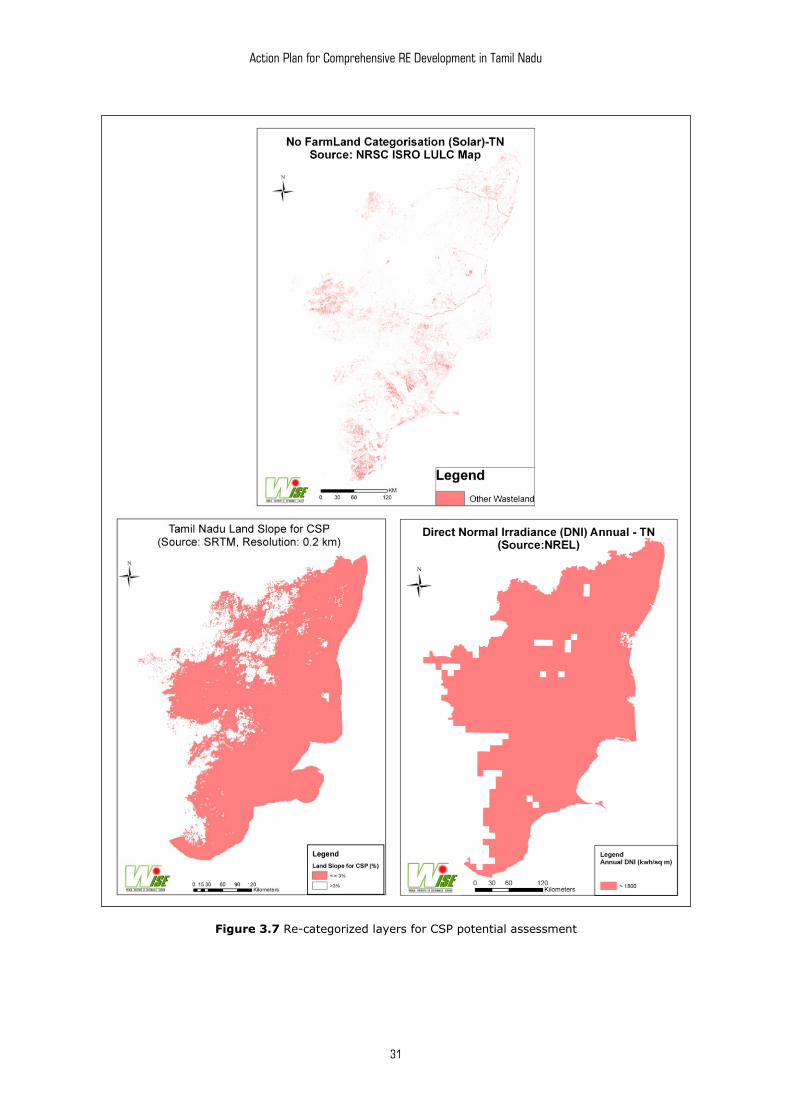
Action Plan for Comprehensive RE Development in Tamil Nadu
31
Figure 3.7 Re-categorized layers for CSP potential assessment
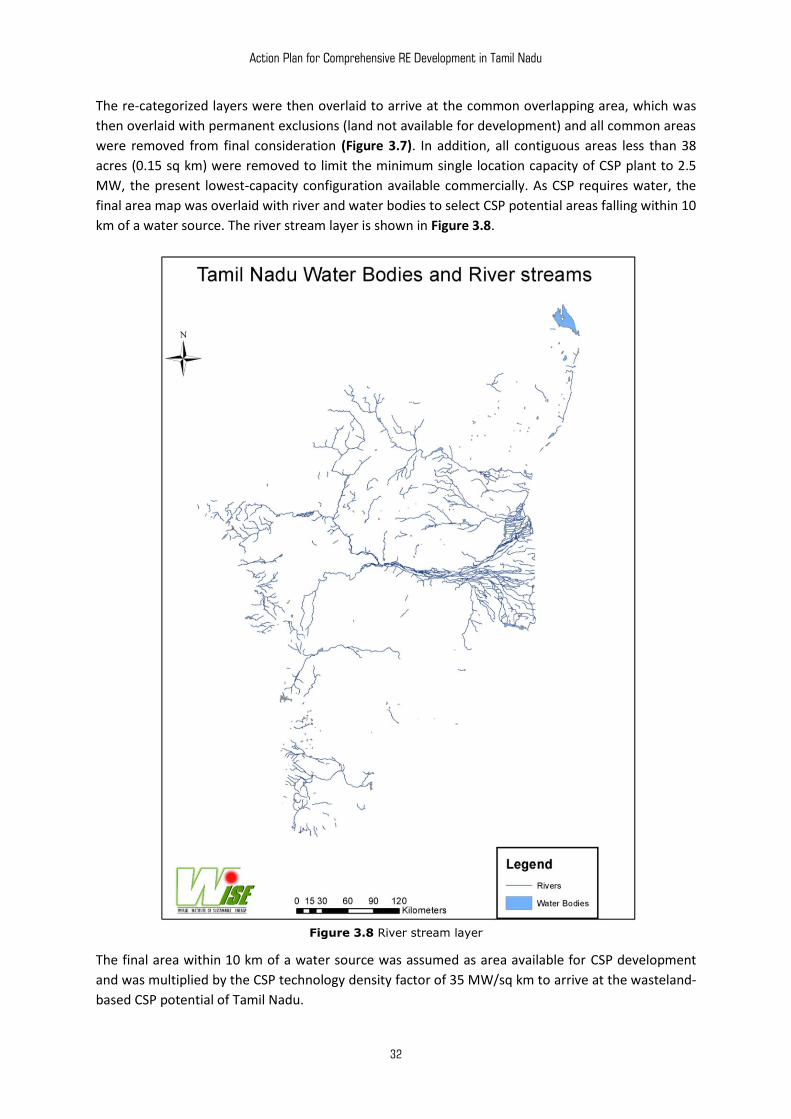
Action Plan for Comprehensive RE Development in Tamil Nadu
32
The re-categorized layers were then overlaid to arrive at the common overlapping area, which was
then overlaid with permanent exclusions (land not available for development) and all common areas
were removed from final consideration (Figure 3.7). In addition, all contiguous areas less than 38
acres (0.15 sq km) were removed to limit the minimum single location capacity of CSP plant to 2.5
MW, the present lowest-capacity configuration available commercially. As CSP requires water, the
final area map was overlaid with river and water bodies to select CSP potential areas falling within 10
km of a water source. The river stream layer is shown in Figure 3.8.
Figure 3.8 River stream layer
The final area within 10 km of a water source was assumed as area available for CSP development
and was multiplied by the CSP technology density factor of 35 MW/sq km to arrive at the wasteland-
based CSP potential of Tamil Nadu.
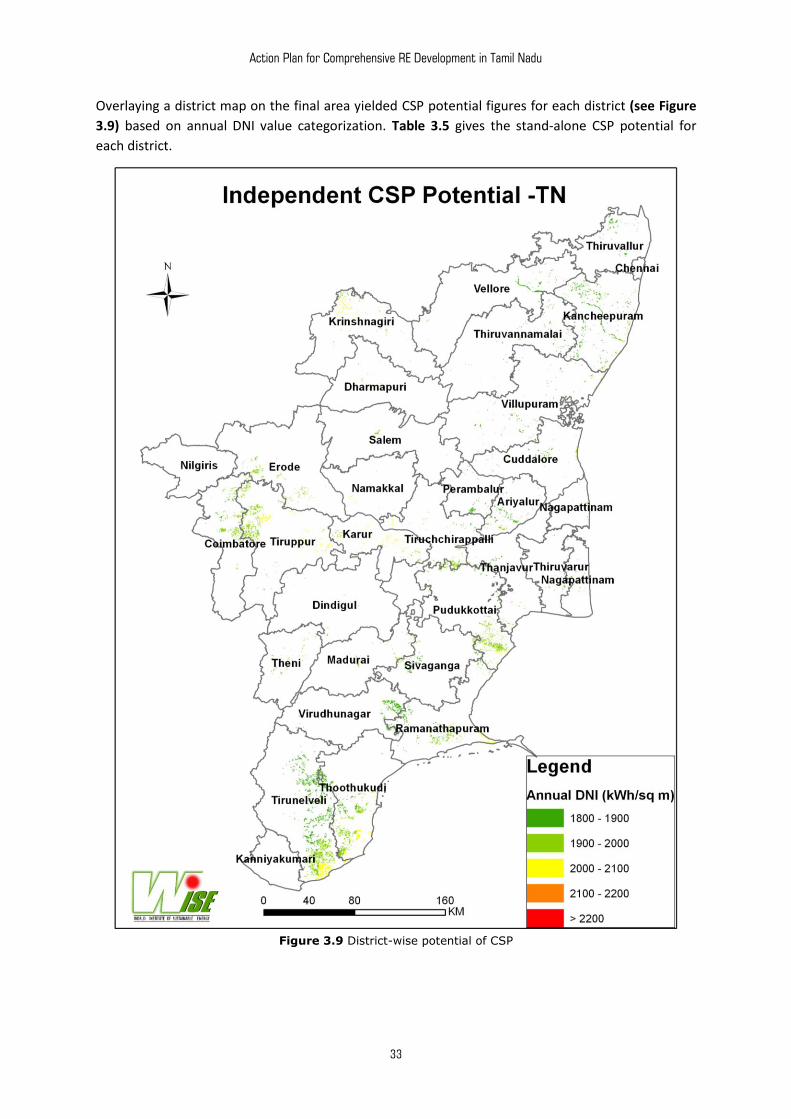
Action Plan for Comprehensive RE Development in Tamil Nadu
33
Overlaying a district map on the final area yielded CSP potential figures for each district (see Figure
3.9) based on annual DNI value categorization. Table 3.5 gives the stand-alone CSP potential for
each district.
Figure 3.9 District-wise potential of CSP
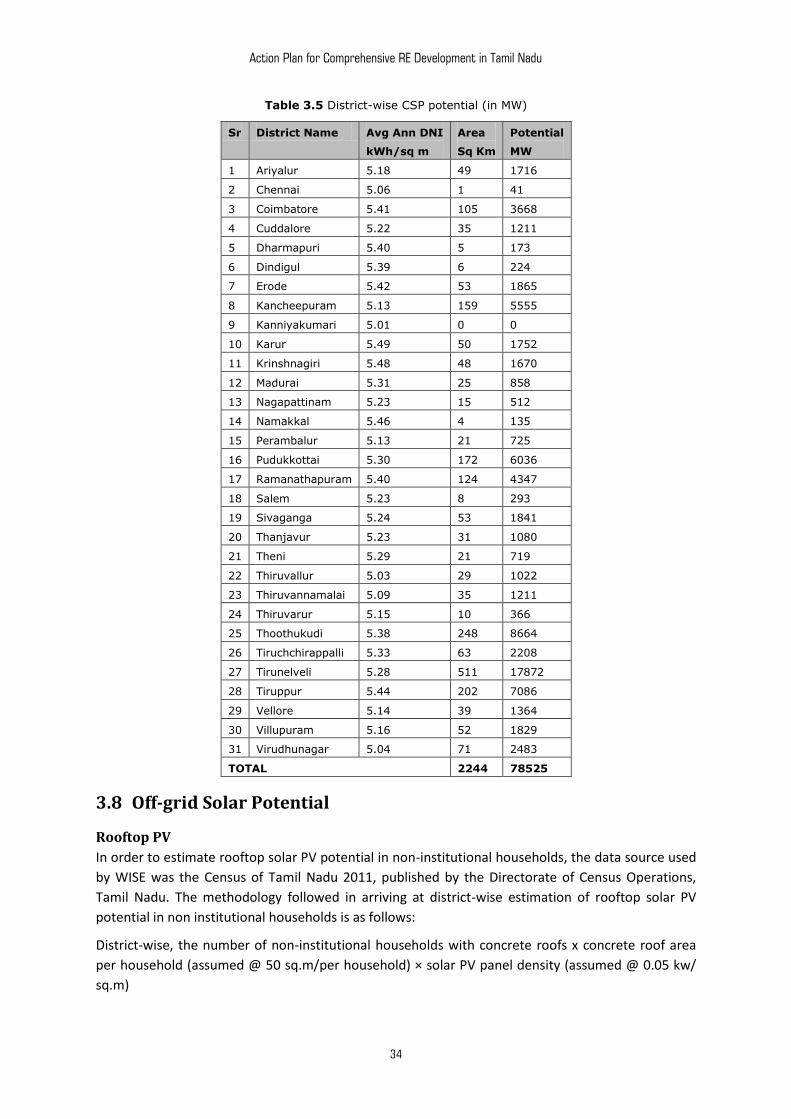
Action Plan for Comprehensive RE Development in Tamil Nadu
34
Table 3.5 District-wise CSP potential (in MW)
Sr District Name Avg Ann DNI
kWh/sq m
Area
Sq Km
Potential
MW
1 Ariyalur 5.18 49 1716
2 Chennai 5.06 1 41
3 Coimbatore 5.41 105 3668
4 Cuddalore 5.22 35 1211
5 Dharmapuri 5.40 5 173
6 Dindigul 5.39 6 224
7 Erode 5.42 53 1865
8 Kancheepuram 5.13 159 5555
9 Kanniyakumari 5.01 0 0
10 Karur 5.49 50 1752
11 Krinshnagiri 5.48 48 1670
12 Madurai 5.31 25 858
13 Nagapattinam 5.23 15 512
14 Namakkal 5.46 4 135
15 Perambalur 5.13 21 725
16 Pudukkottai 5.30 172 6036
17 Ramanathapuram 5.40 124 4347
18 Salem 5.23 8 293
19 Sivaganga 5.24 53 1841
20 Thanjavur 5.23 31 1080
21 Theni 5.29 21 719
22 Thiruvallur 5.03 29 1022
23 Thiruvannamalai 5.09 35 1211
24 Thiruvarur 5.15 10 366
25 Thoothukudi 5.38 248 8664
26 Tiruchchirappalli 5.33 63 2208
27 Tirunelveli 5.28 511 17872
28 Tiruppur 5.44 202 7086
29 Vellore 5.14 39 1364
30 Villupuram 5.16 52 1829
31 Virudhunagar 5.04 71 2483
TOTAL 2244 78525
3.8 Off-grid Solar Potential
Rooftop PV
In order to estimate rooftop solar PV potential in non-institutional households, the data source used
by WISE was the Census of Tamil Nadu 2011, published by the Directorate of Census Operations,
Tamil Nadu. The methodology followed in arriving at district-wise estimation of rooftop solar PV
potential in non institutional households is as follows:
District-wise, the number of non-institutional households with concrete roofs x concrete roof area
per household (assumed @ 50 sq.m/per household) × solar PV panel density (assumed @ 0.05 kw/
sq.m)
Action Plan for Comprehensive RE Development in Tamil Nadu
35
A similar calculation was done for institutional households with available rooftop area being
assumed different for different institutional household categories.
The total potential for rooftop PV was estimated at 29,642 MW.
Solar water heating
In order to estimate solar water heating potential in non-institutional households, the data source
used by WISE was once again the Census of Tamil Nadu 2011. The methodology followed in arriving
at district-wise estimation of rooftop solar water heating potential in non-institutional households is
as follows:
District-wise, number of non-institutional households with concrete roofs x collectors required to
service water-heating requirement (assuming consumption of 100 litres per day [LPD]/per
household and 2 sq m collector area for servicing 100 LPD).
The estimated potential was assessed as equivalent to a collector area of about 16.15 million sq m.
Solar water pumping
In order to estimate solar water-pumping potential in agriculture, the data for the district-wise net
area sown and irrigated during 2009-10 was taken from the Statistical Hand Book – 2011 [Ref 15]
(the only available data source). The methodology followed in arriving at district-wise estimation of
solar water pump potential in agriculture is as follows.
Net irrigated area of districts having water table <10m (source: TN statistics and Tamil Nadu Water
Supply and Drainage Board [TWAD] × water requirement per area (conservative assumption of water
requirement of maize by FAO [http://www.fao.org/nr/water/cropinfo_maize.html]) × solar pumping
potential (assuming Tata BP solar pump 1.2 kW with a discharge capacity of 17.625m3 /day)
Based on the data available and the methodology, the total substitution potential for solar PV
pumping was assessed at 7,041 MW.
Solar process heating
In order to estimate solar industrial process heating applications, the most important consideration
was identifying processes and industries suitable for available solar-heating technologies. As solar
water heating can supply temperatures up to 100-120° C, there are simply too many processes
across major industrial segments that can actually be substituted by solar process heating
applications.
However, the actual assessment of solar process heating potential requires authentic data related to
process engineering (conventional heat source and specific heat consumption for a particular
process) as well as industrial production data for the state. A recent report by
PricewaterhouseCoopers (PwC) India titled Identification of Industrial Sectors Promising for
Commercialization of Solar Energy [Ref 16] details specific heat requirements for some selected
processes.
However, WISE also interacted with independent consultants and experts working in the field of
solar process heating applications to understand their views on potential estimation. According to
them, arriving at a potential output in terms of energy equivalent was difficult because process and
product variations within the same industries made generalizations difficult. Detailed state-specific
data could only be gleaned from field visits and process analysis, which was beyond the scope of the
present study.
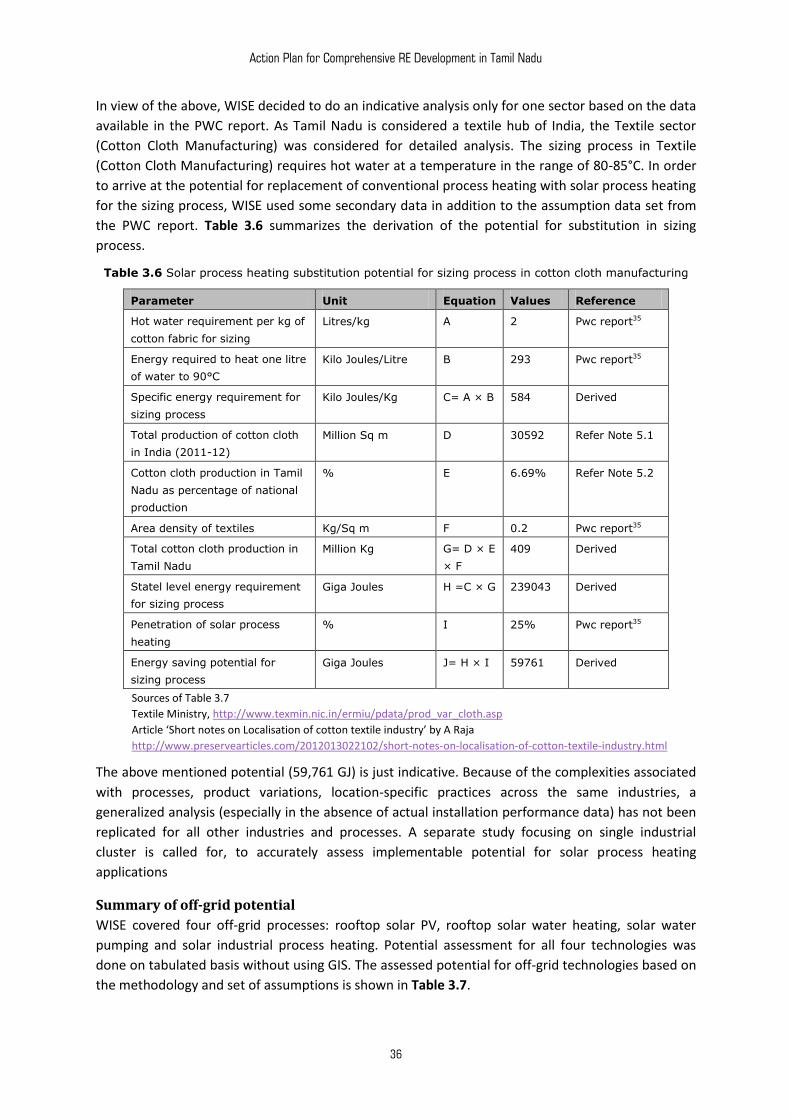
Action Plan for Comprehensive RE Development in Tamil Nadu
36
In view of the above, WISE decided to do an indicative analysis only for one sector based on the data
available in the PWC report. As Tamil Nadu is considered a textile hub of India, the Textile sector
(Cotton Cloth Manufacturing) was considered for detailed analysis. The sizing process in Textile
(Cotton Cloth Manufacturing) requires hot water at a temperature in the range of 80-85°C. In order
to arrive at the potential for replacement of conventional process heating with solar process heating
for the sizing process, WISE used some secondary data in addition to the assumption data set from
the PWC report. Table 3.6 summarizes the derivation of the potential for substitution in sizing
process.
Table 3.6 Solar process heating substitution potential for sizing process in cotton cloth manufacturing
Parameter Unit Equation Values Reference
Hot water requirement per kg of
cotton fabric for sizing
Litres/kg A 2 Pwc report35
Energy required to heat one litre
of water to 90°C
Kilo Joules/Litre B 293 Pwc report35
Specific energy requirement for
sizing process
Kilo Joules/Kg C= A × B 584 Derived
Total production of cotton cloth
in India (2011-12)
Million Sq m D 30592 Refer Note 5.1
Cotton cloth production in Tamil
Nadu as percentage of national
production
% E 6.69% Refer Note 5.2
Area density of textiles Kg/Sq m F 0.2 Pwc report35
Total cotton cloth production in
Tamil Nadu
Million Kg G= D × E
× F
409 Derived
Statel level energy requirement
for sizing process
Giga Joules H =C × G 239043 Derived
Penetration of solar process
heating
% I 25% Pwc report35
Energy saving potential for
sizing process
Giga Joules J= H × I 59761 Derived
Sources of Table 3.7
Textile Ministry, http://www.texmin.nic.in/ermiu/pdata/prod_var_cloth.asp
Article ‘Short notes on Localisation of cotton textile industry’ by A Raja
http://www.preservearticles.com/2012013022102/short-notes-on-localisation-of-cotton-textile-industry.html
The above mentioned potential (59,761 GJ) is just indicative. Because of the complexities associated
with processes, product variations, location-specific practices across the same industries, a
generalized analysis (especially in the absence of actual installation performance data) has not been
replicated for all other industries and processes. A separate study focusing on single industrial
cluster is called for, to accurately assess implementable potential for solar process heating
applications
Summary of off-grid potential
WISE covered four off-grid processes: rooftop solar PV, rooftop solar water heating, solar water
pumping and solar industrial process heating. Potential assessment for all four technologies was
done on tabulated basis without using GIS. The assessed potential for off-grid technologies based on
the methodology and set of assumptions is shown in Table 3.7.
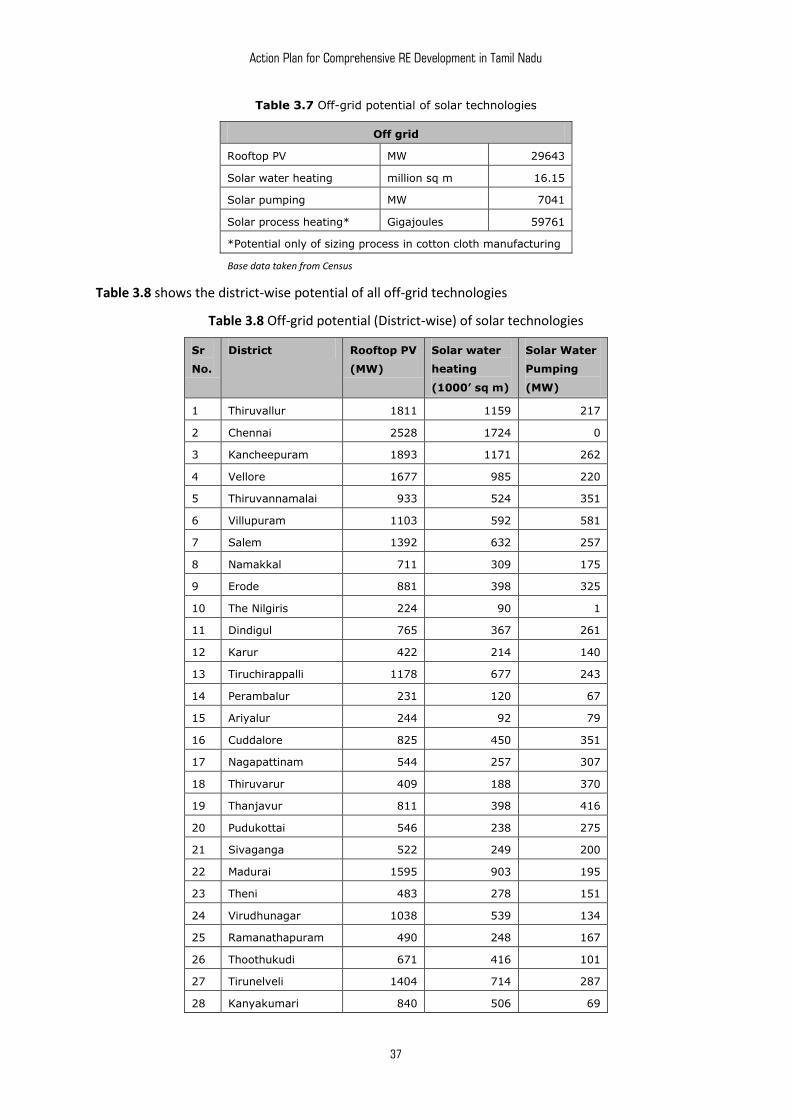
Action Plan for Comprehensive RE Development in Tamil Nadu
37
Table 3.7 Off-grid potential of solar technologies
Off grid
Rooftop PV MW 29643
Solar water heating million sq m 16.15
Solar pumping MW 7041
Solar process heating* Gigajoules 59761
*Potential only of sizing process in cotton cloth manufacturing
Base data taken from Census
Table 3.8 shows the district-wise potential of all off-grid technologies
Table 3.8 Off-grid potential (District-wise) of solar technologies
Sr
No.
District Rooftop PV
(MW)
Solar water
heating
(1000’ sq m)
Solar Water
Pumping
(MW)
1 Thiruvallur 1811 1159 217
2 Chennai 2528 1724 0
3 Kancheepuram 1893 1171 262
4 Vellore 1677 985 220
5 Thiruvannamalai 933 524 351
6 Villupuram 1103 592 581
7 Salem 1392 632 257
8 Namakkal 711 309 175
9 Erode 881 398 325
10 The Nilgiris 224 90 1
11 Dindigul 765 367 261
12 Karur 422 214 140
13 Tiruchirappalli 1178 677 243
14 Perambalur 231 120 67
15 Ariyalur 244 92 79
16 Cuddalore 825 450 351
17 Nagapattinam 544 257 307
18 Thiruvarur 409 188 370
19 Thanjavur 811 398 416
20 Pudukottai 546 238 275
21 Sivaganga 522 249 200
22 Madurai 1595 903 195
23 Theni 483 278 151
24 Virudhunagar 1038 539 134
25 Ramanathapuram 490 248 167
26 Thoothukudi 671 416 101
27 Tirunelveli 1404 714 287
28 Kanyakumari 840 506 69
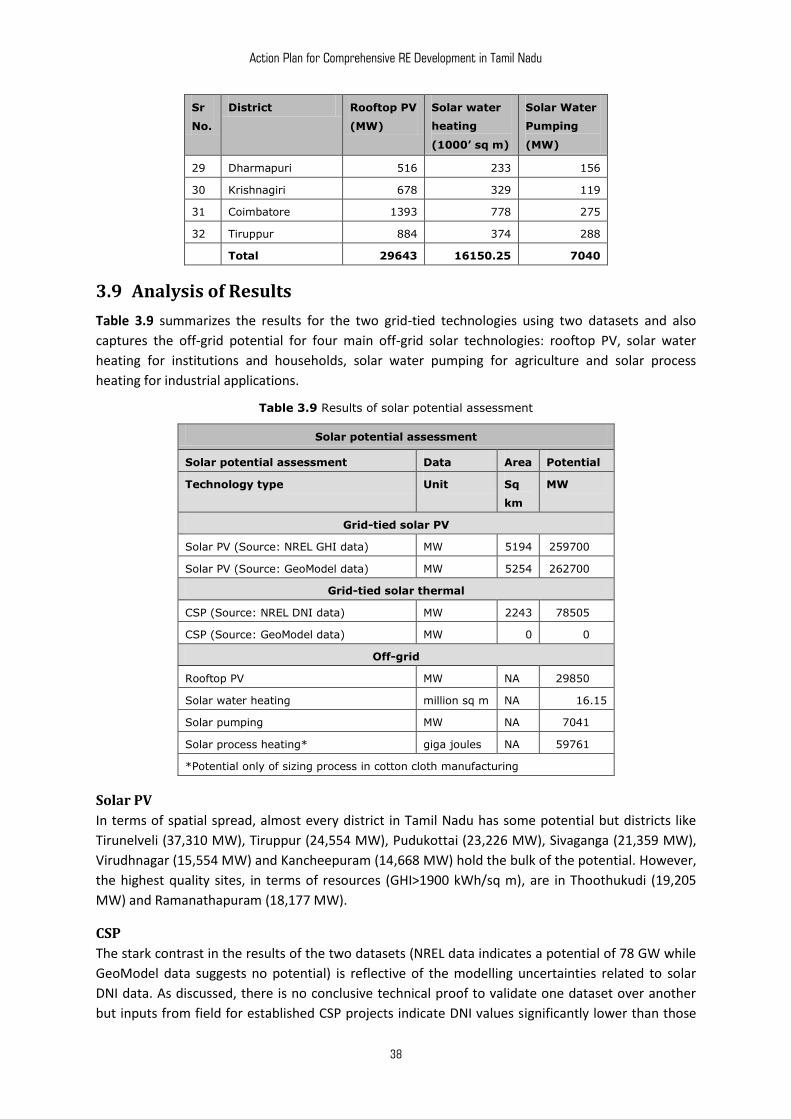
Action Plan for Comprehensive RE Development in Tamil Nadu
38
Sr
No.
District Rooftop PV
(MW)
Solar water
heating
(1000’ sq m)
Solar Water
Pumping
(MW)
29 Dharmapuri 516 233 156
30 Krishnagiri 678 329 119
31 Coimbatore 1393 778 275
32 Tiruppur 884 374 288
Total 29643 16150.25 7040
3.9 Analysis of Results
Table 3.9 summarizes the results for the two grid-tied technologies using two datasets and also
captures the off-grid potential for four main off-grid solar technologies: rooftop PV, solar water
heating for institutions and households, solar water pumping for agriculture and solar process
heating for industrial applications.
Table 3.9 Results of solar potential assessment
Solar potential assessment
Solar potential assessment Data Area Potential
Technology type Unit Sq
km
MW
Grid-tied solar PV
Solar PV (Source: NREL GHI data) MW 5194 259700.00
Solar PV (Source: GeoModel data) MW 5254 262700.00
Grid-tied solar thermal
CSP (Source: NREL DNI data) MW 2243 78505.00
CSP (Source: GeoModel data) MW 0 0.00
Off-grid
Rooftop PV MW NA 29850.00
Solar water heating million sq m NA 16.15
Solar pumping MW NA 7041.00
Solar process heating* giga joules NA 59761.00
*Potential only of sizing process in cotton cloth manufacturing
Solar PV
In terms of spatial spread, almost every district in Tamil Nadu has some potential but districts like
Tirunelveli (37,310 MW), Tiruppur (24,554 MW), Pudukottai (23,226 MW), Sivaganga (21,359 MW),
Virudhnagar (15,554 MW) and Kancheepuram (14,668 MW) hold the bulk of the potential. However,
the highest quality sites, in terms of resources (GHI>1900 kWh/sq m), are in Thoothukudi (19,205
MW) and Ramanathapuram (18,177 MW).
CSP
The stark contrast in the results of the two datasets (NREL data indicates a potential of 78 GW while
GeoModel data suggests no potential) is reflective of the modelling uncertainties related to solar
DNI data. As discussed, there is no conclusive technical proof to validate one dataset over another
but inputs from field for established CSP projects indicate DNI values significantly lower than those
Action Plan for Comprehensive RE Development in Tamil Nadu
39
estimated by NREL. On the other hand, the accuracy of GeoModel data also cannot be ascertained
without comparing actual field values in Tamil Nadu with measured data, which is difficult to get.
In view of the same, it is recommended that more rigorous field-level verification, including resource
assessment and pilot projects, be carried out.
However, insights can be drawn from the analysis in terms of identifying areas where such pilot
studies can be undertaken. Based on the assessment, Thoothukudi, Ottapidaram, Tiruchedur, and
Santhakulam talukas of Thoothukudi district; Dharapuram, Tiruppur, Kangeyam, and Palladum
talukas of Tiruppur district and some parts of Karur and Krishnagiri districts show good resource
potential (annual DNI >2000 kWh/sq m) and can be identified for detailed study.
Off-grid Solar
Tamil Nadu also has a large potential for off-grid solar applications. Based on tabulated analysis, the
rooftop PV potential for Tamil Nadu on gross availability of concrete roofs is about 30,000 MW; even
availability of 33% concrete roofs implies implementable potential of 10,000 MW. However, the
actual implementable target is dependent on policy and regulatory support. New regulatory
measures like feed-in tariffs for rooftops or net metering can significantly impact the deployment by
reducing the financial viability gap. Policy measures can aim at increasing the reliability of the system
starting from supply to servicing, by introducing measures like empanelment, coupled with strong
performance monitoring and system performance guarantees to instill confidence in investors and
help in building long-term systemic sustainability.
Solar water heating potential for the state assumes the use of around 100 LPD of hot water per
household. The potential of about 16.15 million sq m collector area translates into a water heating
potential of 33 million LPD. Assuming substitution potential of 1500 electricity units annually (based
on MNRE data) [Ref 17] by replacing an electrical 100 LPD water heating unit and assuming 10%
substitution potential, the energy-saving potential will be to the tune of 4,950 MU, equivalent to
average 15-20 days of consumption for the whole state. While subsidy and incentive mechanisms
are in place for these applications, the disbursement model needs improvement.
Solar pumping potential at 7,400 MW implies substantial savings in electricity and grid losses for the
Tamil Nadu Electricity Department (TNED). As this figure is based on a number of assumptions
related to electrified pumps, water requirement for agriculture, water table, etc., the actual solar
pumping potential could be significantly different. There is a need for a taluka-level study to assess
actual substitution potential.
Solar process heating for industrial applications is a vast area. Based on data availability, potential
assessment was only done for one process in one industry. However, considering the capability of
present systems to deliver water temperatures of up to 100°–120° C, many processes across major
industries can use solar process heating applications. There are specific processes where the
commercial potential of these technologies is high enough to discount the need for any direct fiscal
support from the government. However, for other processes, the payback period could be high
enough to warrant some basic support in terms of subsidy. More important, there is also a need to
create awareness about the potential of solar process heating applications as the knowledge in the
industry about these applications is limited. In the absence of a large and dynamic service industry in
this sector, it is for the government to increase the knowledge-base and generate an understanding
in the industry about the potential benefits of solar process heating applications.
***

Action Plan for Comprehensive RE Development in Tamil Nadu
40
Action Plan for Comprehensive RE Development in Tamil Nadu
41
4. Wind Power Potential in Tamil Nadu
4.1 Literature Review
The study titled A GIS-based assessment of potential for wind farms in India, 2011 [Ref 18], assessed
the wind power potential in India to be 42,50,000 MW. Deviating from the concept of a ballpark
percentage availability of land, this study considered all the available land area (almost 83% of the
Indian land mass), other than the Himalayan regions, ecologically sensitive areas and human
settlements. The study extrapolated measured CWET and National Centers for Environmental
Prediction (NCEP)/National Center for Atmospheric Research (NCAR) data to derive a wind resource
map across a 1 sq km grid resolution at 80 m hub height using the boundary layer technique. The
annual energy estimates were calculated for each grid assuming a normalized power curve, an 80 m
rotor diameter for a 1 MW turbine, and a turbine density of 3 MW/ km2. In the final step, all the sites
with capacity utilization factor (CUF) less than 15% were masked, and potential was arrived at for
each grid element and then added to arrive at the final figure of 42,50,000 MW.
The second study titled, Reassessing Wind Potential Estimates for India: Economic and Policy
Implications, March 2012 [Ref 19], assesses the all-India potential at 80 m to be 20,06,000 MW. This
study uses more advanced modelling and GIS tools for a grid size of 3.6 X 3.6 km to arrive at the
potential at three hub heights of 80 m, 100 m and 120 m, and assesses the potential assuming 100%
availability of wasteland, farmland, and non-forest scrubland. The wind resource data is a numerical
model based data procured from 3 Tier. The study excludes land areas with wind power density less
than 200 W/m2, slope greater than 20%, elevations greater than 1500 m, and assumes a turbine
density of 9 MW/km2. For the state of Tamil Nadu, the expected potential at 80 m was estimated to
be about 380,000 MW.
In yet another study titled, Global potential for wind-generated electricity, 2009 [Ref 20], numerically
modelled wind speed data (GEOSS 5 analysis) extrapolated to 100 m hub height was used along with
a 2.5 MW onshore and 3 MW offshore turbine power curve (General Electric [GE] models) and an
onshore turbine density of about 9 MW/km2 for onshore and 5 MW/km2 for offshore, to evaluate
the wind power potential worldwide. The standard exclusions included areas under forest, ice, water
and population clusters. The technical exclusion included CUF of less than 20%. The results of the
global study, which are in Terra Watt Hours (TWh= 10^6 MWh) generation, are not as relevant in the
present context, but the study has been included as the assumptions could form the basis for our
analysis.
Other major studies that were referred to during the literature survey included Europe's Onshore
and Offshore Wind Energy Potential [Ref 21], Wind Power Project Site-Identification and Land
Requirements [Ref 22], Evaluation of Renewable Energy Potential using a GIS Decision Support
System [Ref 23], and, An Assessment of the Available Windy Land Area and Wind Energy Potential in
the Contiguous United States [Ref 24].
A few of the major insights drawn from these studies are summarized below along with the
approach adopted by WISE are as follows:
In all the studies, one of the two methodologies was used for evaluation of wind resources at
micro-scale. The first methodology was based on the extrapolation of measured data, the other
was based on numerical modelling. Because of limitations of measured data availability, recent
studies have relied more on numerically modelled wind data.
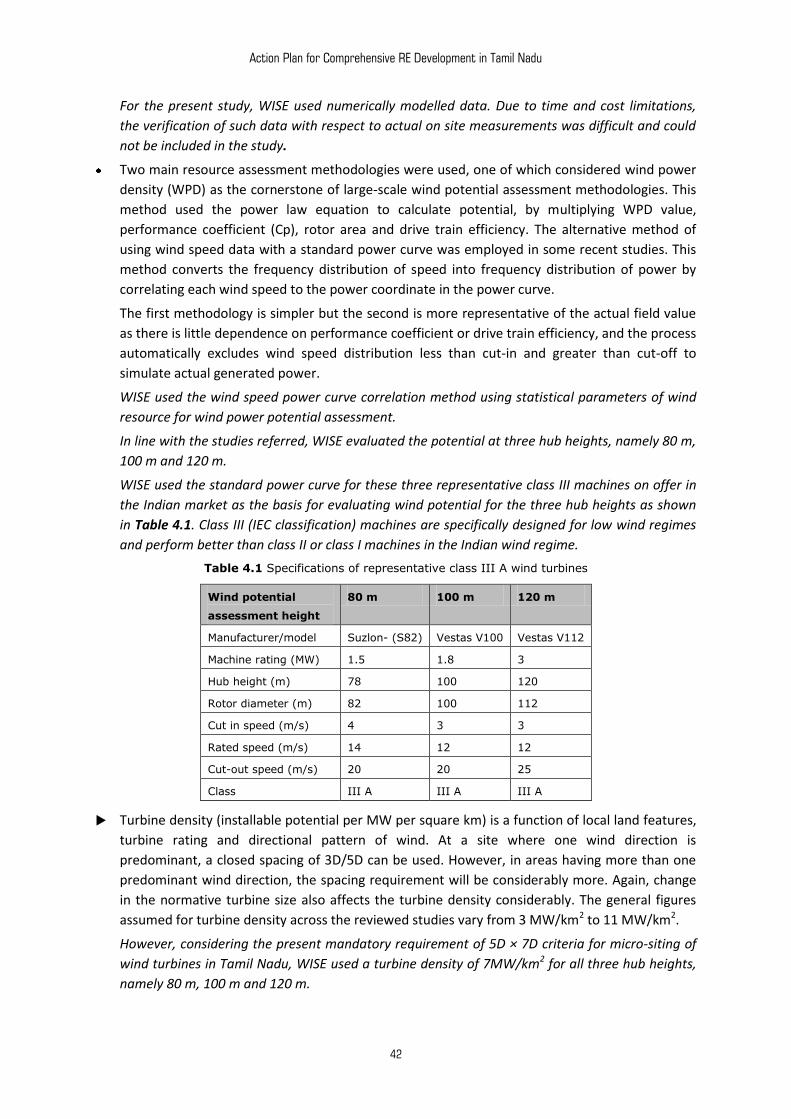
Action Plan for Comprehensive RE Development in Tamil Nadu
42
For the present study, WISE used numerically modelled data. Due to time and cost limitations,
the verification of such data with respect to actual on site measurements was difficult and could
not be included in the study.
Two main resource assessment methodologies were used, one of which considered wind power
density (WPD) as the cornerstone of large-scale wind potential assessment methodologies. This
method used the power law equation to calculate potential, by multiplying WPD value,
performance coefficient (Cp), rotor area and drive train efficiency. The alternative method of
using wind speed data with a standard power curve was employed in some recent studies. This
method converts the frequency distribution of speed into frequency distribution of power by
correlating each wind speed to the power coordinate in the power curve.
The first methodology is simpler but the second is more representative of the actual field value
as there is little dependence on performance coefficient or drive train efficiency, and the process
automatically excludes wind speed distribution less than cut-in and greater than cut-off to
simulate actual generated power.
WISE used the wind speed power curve correlation method using statistical parameters of wind
resource for wind power potential assessment.
In line with the studies referred, WISE evaluated the potential at three hub heights, namely 80 m,
100 m and 120 m.
WISE used the standard power curve for these three representative class III machines on offer in
the Indian market as the basis for evaluating wind potential for the three hub heights as shown
in Table 4.1. Class III (IEC classification) machines are specifically designed for low wind regimes
and perform better than class II or class I machines in the Indian wind regime.
Table 4.1 Specifications of representative class III A wind turbines
Wind potential
assessment height
80 m 100 m 120 m
Manufacturer/model Suzlon- (S82) Vestas V100 Vestas V112
Machine rating (MW) 1.5 1.8 3
Hub height (m) 78 100 120
Rotor diameter (m) 82 100 112
Cut in speed (m/s) 4 3 3
Rated speed (m/s) 14 12 12
Cut-out speed (m/s) 20 20 25
Class III A III A III A
Turbine density (installable potential per MW per square km) is a function of local land features,
turbine rating and directional pattern of wind. At a site where one wind direction is
predominant, a closed spacing of 3D/5D can be used. However, in areas having more than one
predominant wind direction, the spacing requirement will be considerably more. Again, change
in the normative turbine size also affects the turbine density considerably. The general figures
assumed for turbine density across the reviewed studies vary from 3 MW/km2 to 11 MW/km2.
However, considering the present mandatory requirement of 5D × 7D criteria for micro-siting of
wind turbines in Tamil Nadu, WISE used a turbine density of 7MW/km2 for all three hub heights,
namely 80 m, 100 m and 120 m.
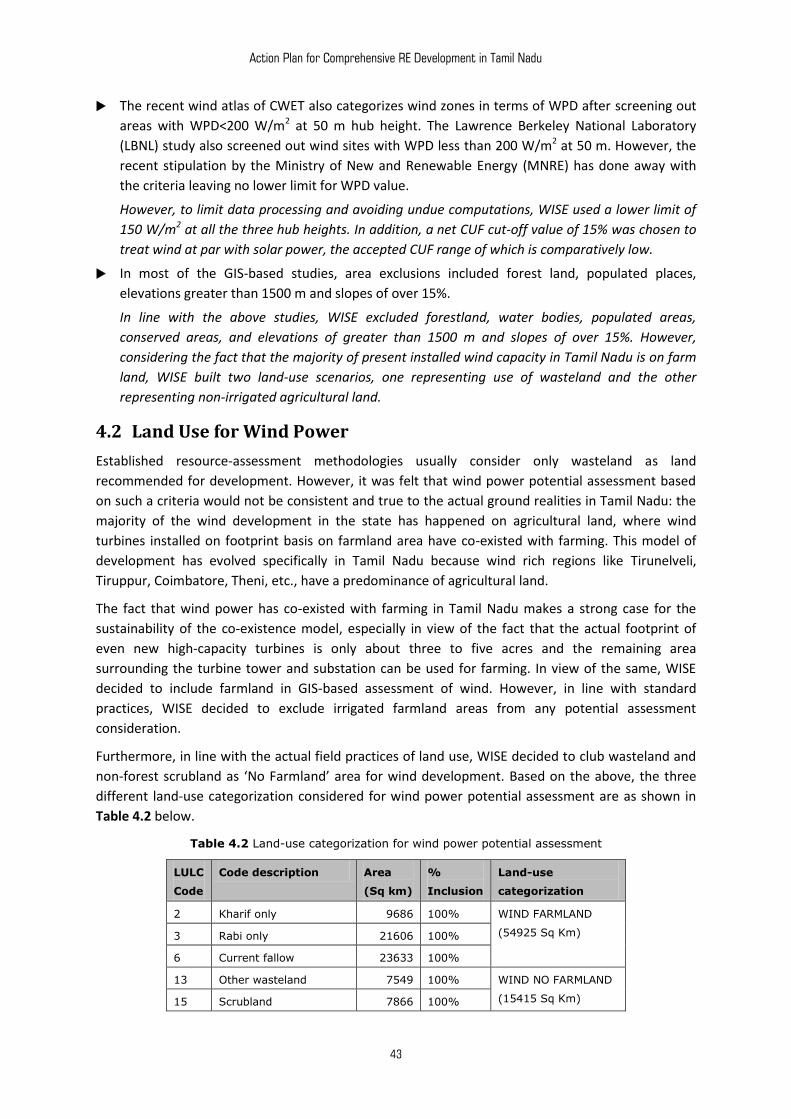
Action Plan for Comprehensive RE Development in Tamil Nadu
43
The recent wind atlas of CWET also categorizes wind zones in terms of WPD after screening out
areas with WPD<200 W/m2 at 50 m hub height. The Lawrence Berkeley National Laboratory
(LBNL) study also screened out wind sites with WPD less than 200 W/m2 at 50 m. However, the
recent stipulation by the Ministry of New and Renewable Energy (MNRE) has done away with
the criteria leaving no lower limit for WPD value.
However, to limit data processing and avoiding undue computations, WISE used a lower limit of
150 W/m2 at all the three hub heights. In addition, a net CUF cut-off value of 15% was chosen to
treat wind at par with solar power, the accepted CUF range of which is comparatively low.
In most of the GIS-based studies, area exclusions included forest land, populated places,
elevations greater than 1500 m and slopes of over 15%.
In line with the above studies, WISE excluded forestland, water bodies, populated areas,
conserved areas, and elevations of greater than 1500 m and slopes of over 15%. However,
considering the fact that the majority of present installed wind capacity in Tamil Nadu is on farm
land, WISE built two land-use scenarios, one representing use of wasteland and the other
representing non-irrigated agricultural land.
4.2 Land Use for Wind Power
Established resource-assessment methodologies usually consider only wasteland as land
recommended for development. However, it was felt that wind power potential assessment based
on such a criteria would not be consistent and true to the actual ground realities in Tamil Nadu: the
majority of the wind development in the state has happened on agricultural land, where wind
turbines installed on footprint basis on farmland area have co-existed with farming. This model of
development has evolved specifically in Tamil Nadu because wind rich regions like Tirunelveli,
Tiruppur, Coimbatore, Theni, etc., have a predominance of agricultural land.
The fact that wind power has co-existed with farming in Tamil Nadu makes a strong case for the
sustainability of the co-existence model, especially in view of the fact that the actual footprint of
even new high-capacity turbines is only about three to five acres and the remaining area
surrounding the turbine tower and substation can be used for farming. In view of the same, WISE
decided to include farmland in GIS-based assessment of wind. However, in line with standard
practices, WISE decided to exclude irrigated farmland areas from any potential assessment
consideration.
Furthermore, in line with the actual field practices of land use, WISE decided to club wasteland and
non-forest scrubland as ‘No Farmland’ area for wind development. Based on the above, the three
different land-use categorization considered for wind power potential assessment are as shown in
Table 4.2 below.
Table 4.2 Land-use categorization for wind power potential assessment
LULC
Code
Code description Area
(Sq km)
%
Inclusion
Land-use
categorization
2 Kharif only 9686 100% WIND FARMLAND
(54925 Sq Km) 3 Rabi only 21606 100%
6 Current fallow 23633 100%
13 Other wasteland 7549 100% WIND NO FARMLAND
(15415 Sq Km) 15 Scrubland 7866 100%
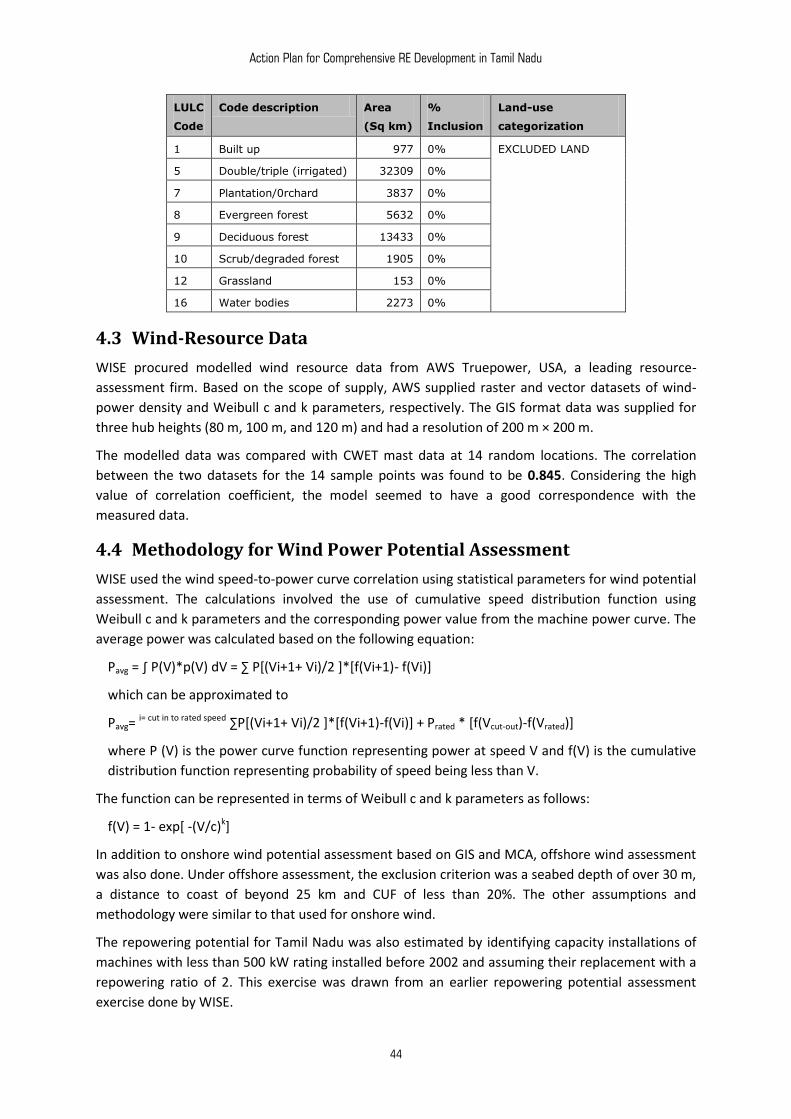
Action Plan for Comprehensive RE Development in Tamil Nadu
44
LULC
Code
Code description Area
(Sq km)
%
Inclusion
Land-use
categorization
1 Built up 977 0% EXCLUDED LAND
5 Double/triple (irrigated) 32309 0%
7 Plantation/0rchard 3837 0%
8 Evergreen forest 5632 0%
9 Deciduous forest 13433 0%
10 Scrub/degraded forest 1905 0%
12 Grassland 153 0%
16 Water bodies 2273 0%
4.3 Wind-Resource Data
WISE procured modelled wind resource data from AWS Truepower, USA, a leading resource-
assessment firm. Based on the scope of supply, AWS supplied raster and vector datasets of wind-
power density and Weibull c and k parameters, respectively. The GIS format data was supplied for
three hub heights (80 m, 100 m, and 120 m) and had a resolution of 200 m × 200 m.
The modelled data was compared with CWET mast data at 14 random locations. The correlation
between the two datasets for the 14 sample points was found to be 0.845. Considering the high
value of correlation coefficient, the model seemed to have a good correspondence with the
measured data.
4.4 Methodology for Wind Power Potential Assessment
WISE used the wind speed-to-power curve correlation using statistical parameters for wind potential
assessment. The calculations involved the use of cumulative speed distribution function using
Weibull c and k parameters and the corresponding power value from the machine power curve. The
average power was calculated based on the following equation:
Pavg = ∫ P(V)*p(V) dV = ∑ P[(Vi+1+ Vi)/2 ]*[f(Vi+1)- f(Vi)]
which can be approximated to
Pavg= i= cut in to rated speed ∑P[(Vi+1+ Vi)/2 ]*[f(Vi+1)-f(Vi)] + Prated * [f(Vcut-out)-f(Vrated)]
where P (V) is the power curve function representing power at speed V and f(V) is the cumulative
distribution function representing probability of speed being less than V.
The function can be represented in terms of Weibull c and k parameters as follows:
f(V) = 1- exp[ -(V/c)k]
In addition to onshore wind potential assessment based on GIS and MCA, offshore wind assessment
was also done. Under offshore assessment, the exclusion criterion was a seabed depth of over 30 m,
a distance to coast of beyond 25 km and CUF of less than 20%. The other assumptions and
methodology were similar to that used for onshore wind.
The repowering potential for Tamil Nadu was also estimated by identifying capacity installations of
machines with less than 500 kW rating installed before 2002 and assuming their replacement with a
repowering ratio of 2. This exercise was drawn from an earlier repowering potential assessment
exercise done by WISE.
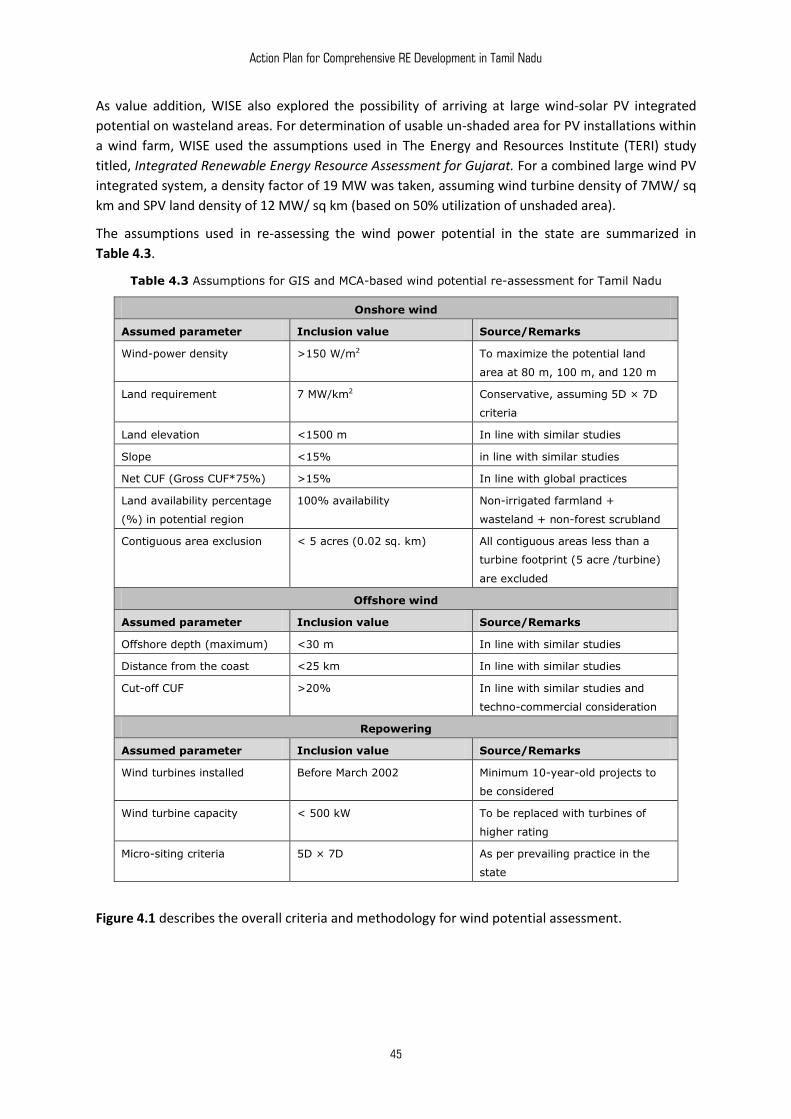
Action Plan for Comprehensive RE Development in Tamil Nadu
45
As value addition, WISE also explored the possibility of arriving at large wind-solar PV integrated
potential on wasteland areas. For determination of usable un-shaded area for PV installations within
a wind farm, WISE used the assumptions used in The Energy and Resources Institute (TERI) study
titled, Integrated Renewable Energy Resource Assessment for Gujarat. For a combined large wind PV
integrated system, a density factor of 19 MW was taken, assuming wind turbine density of 7MW/ sq
km and SPV land density of 12 MW/ sq km (based on 50% utilization of unshaded area).
The assumptions used in re-assessing the wind power potential in the state are summarized in
Table 4.3.
Table 4.3 Assumptions for GIS and MCA-based wind potential re-assessment for Tamil Nadu
Onshore wind
Assumed parameter Inclusion value Source/Remarks
Wind-power density >150 W/m2 To maximize the potential land
area at 80 m, 100 m, and 120 m
Land requirement 7 MW/km2 Conservative, assuming 5D × 7D
criteria
Land elevation <1500 m In line with similar studies
Slope <15% in line with similar studies
Net CUF (Gross CUF*75%) >15% In line with global practices
Land availability percentage
(%) in potential region
100% availability Non-irrigated farmland +
wasteland + non-forest scrubland
Contiguous area exclusion < 5 acres (0.02 sq. km) All contiguous areas less than a
turbine footprint (5 acre /turbine)
are excluded
Offshore wind
Assumed parameter Inclusion value Source/Remarks
Offshore depth (maximum) <30 m In line with similar studies
Distance from the coast <25 km In line with similar studies
Cut-off CUF >20% In line with similar studies and
techno-commercial consideration
Repowering
Assumed parameter Inclusion value Source/Remarks
Wind turbines installed Before March 2002 Minimum 10-year-old projects to
be considered
Wind turbine capacity < 500 kW To be replaced with turbines of
higher rating
Micro-siting criteria 5D × 7D As per prevailing practice in the
state
Figure 4.1 describes the overall criteria and methodology for wind potential assessment.
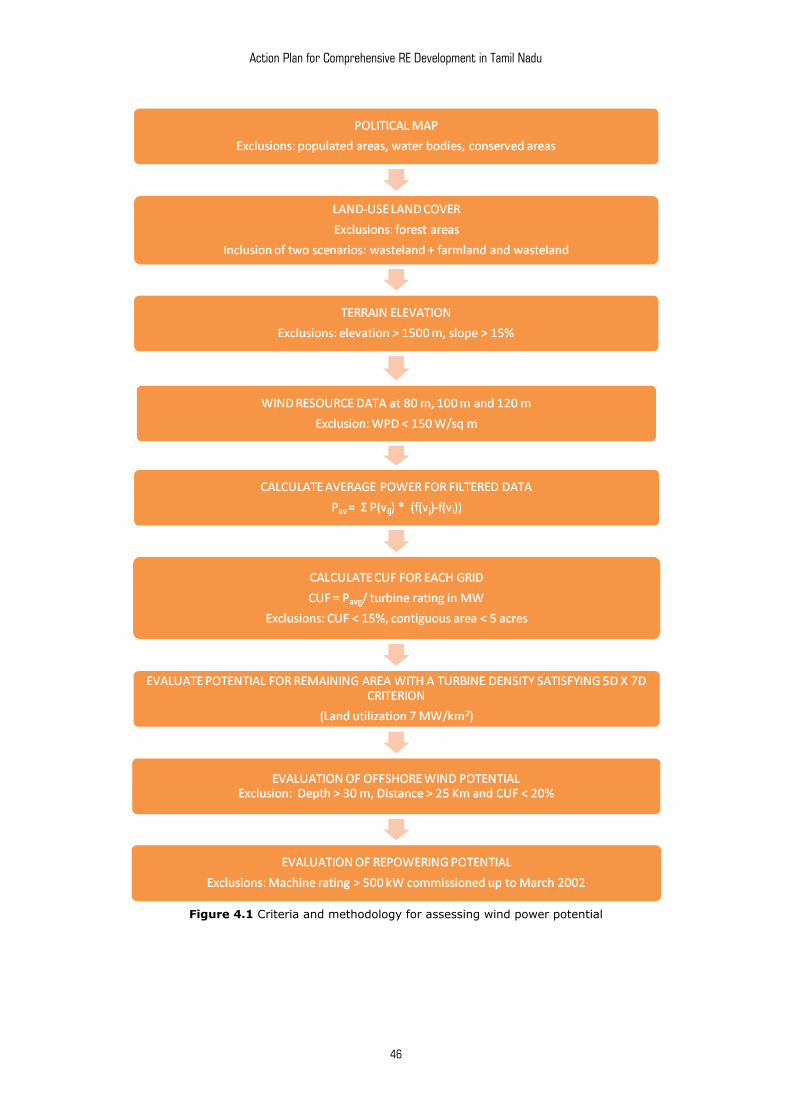
Action Plan for Comprehensive RE Development in Tamil Nadu
46
Figure 4.1 Criteria and methodology for assessing wind power potential
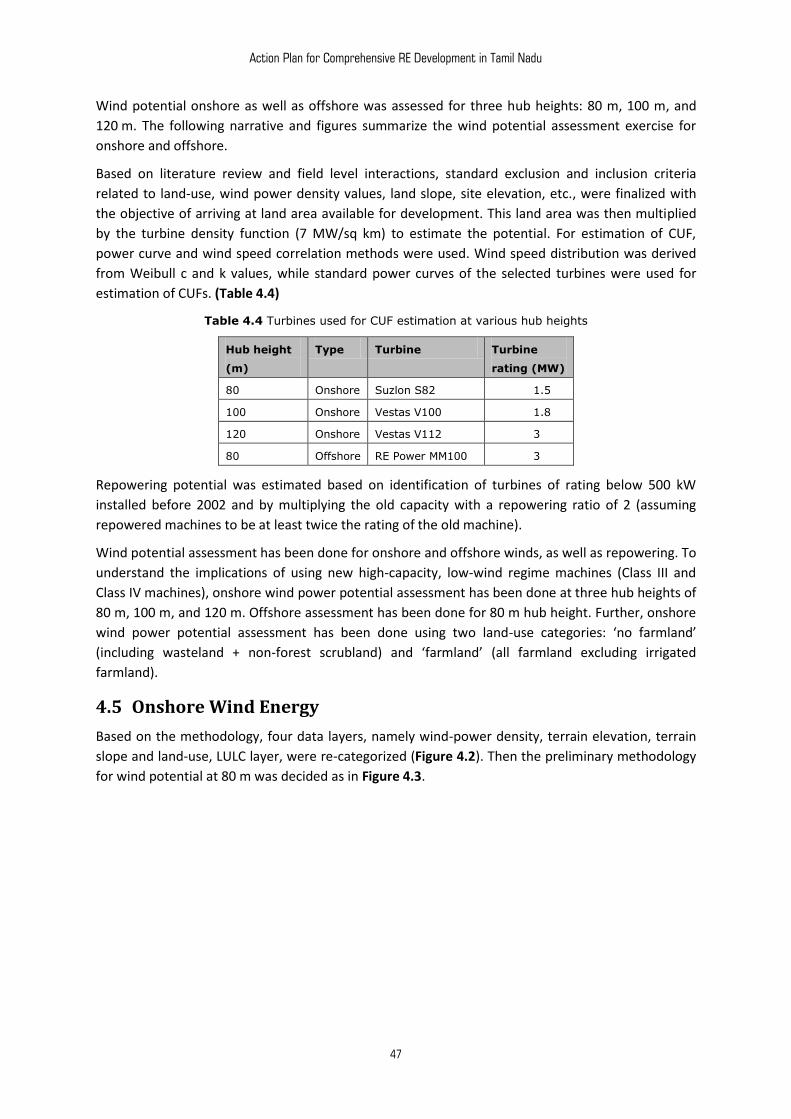
Action Plan for Comprehensive RE Development in Tamil Nadu
47
Wind potential onshore as well as offshore was assessed for three hub heights: 80 m, 100 m, and
120 m. The following narrative and figures summarize the wind potential assessment exercise for
onshore and offshore.
Based on literature review and field level interactions, standard exclusion and inclusion criteria
related to land-use, wind power density values, land slope, site elevation, etc., were finalized with
the objective of arriving at land area available for development. This land area was then multiplied
by the turbine density function (7 MW/sq km) to estimate the potential. For estimation of CUF,
power curve and wind speed correlation methods were used. Wind speed distribution was derived
from Weibull c and k values, while standard power curves of the selected turbines were used for
estimation of CUFs. (Table 4.4)
Table 4.4 Turbines used for CUF estimation at various hub heights
Hub height
(m)
Type Turbine Turbine
rating (MW)
80 Onshore Suzlon S82 1.5
100 Onshore Vestas V100 1.8
120 Onshore Vestas V112 3.0
80 Offshore RE Power MM100 3.0
Repowering potential was estimated based on identification of turbines of rating below 500 kW
installed before 2002 and by multiplying the old capacity with a repowering ratio of 2 (assuming
repowered machines to be at least twice the rating of the old machine).
Wind potential assessment has been done for onshore and offshore winds, as well as repowering. To
understand the implications of using new high-capacity, low-wind regime machines (Class III and
Class IV machines), onshore wind power potential assessment has been done at three hub heights of
80 m, 100 m, and 120 m. Offshore assessment has been done for 80 m hub height. Further, onshore
wind power potential assessment has been done using two land-use categories: ‘no farmland’
(including wasteland + non-forest scrubland) and ‘farmland’ (all farmland excluding irrigated
farmland).
4.5 Onshore Wind Energy
Based on the methodology, four data layers, namely wind-power density, terrain elevation, terrain
slope and land-use, LULC layer, were re-categorized (Figure 4.2). Then the preliminary methodology
for wind potential at 80 m was decided as in Figure 4.3.
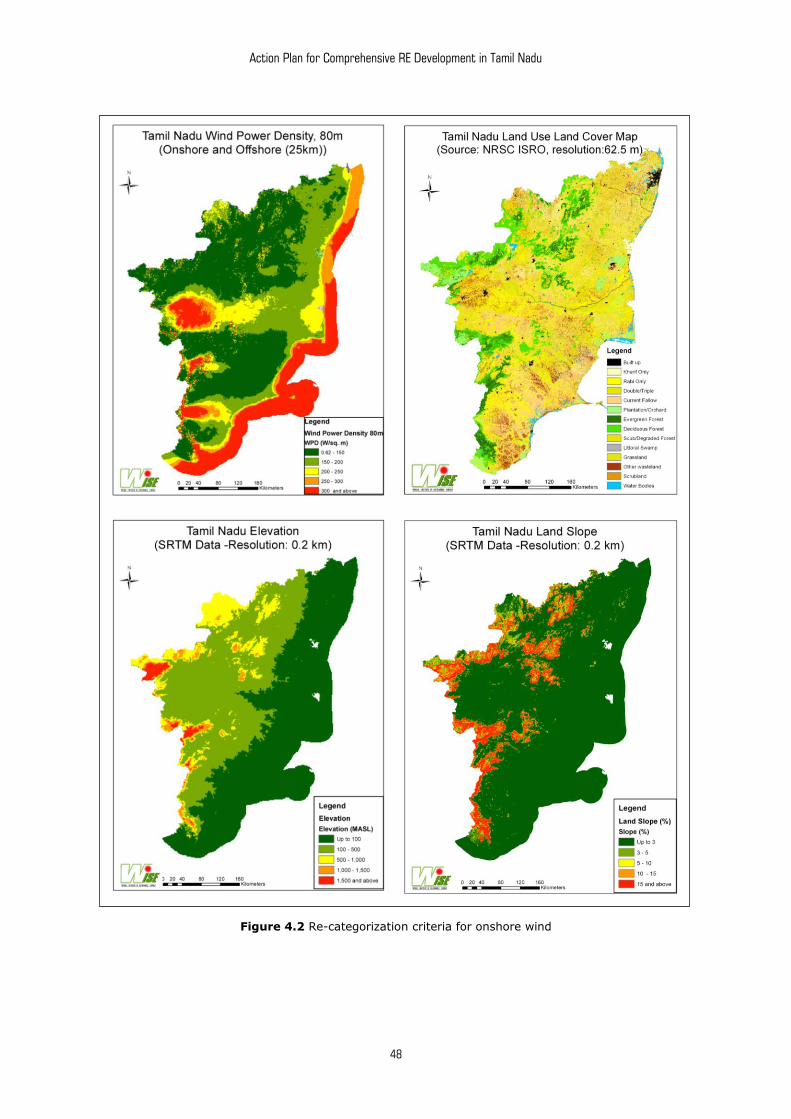
Action Plan for Comprehensive RE Development in Tamil Nadu
48
Figure 4.2 Re-categorization criteria for onshore wind
Action Plan for Comprehensive RE Development in Tamil Nadu
49
Figure 4.3 Preliminary methodology for wind potential at 80 m (farmland)
The common area was then overlaid with permanent exclusions (land not available for
development) and all common areas were removed from final consideration. The remaining area
was overlaid with a vector map of Weibull c and k parameters (200 m × 200 m polygon) to calculate
the net CUF based on the power curve wind speed correlation method as detailed in the
methodology (Suzlon 1.5 MW S82 turbine power curve was used for CUF calculation at 80 m hub
height). In the final analysis, all the areas with NET CUF (Net CUF =Gross CUF *0.95^5*0.97) less than
15% were excluded in addition to areas with a contiguous land area of less than five acres (0.02 sq.
km), the required land for a turbine footprint. The remaining area was assumed as area available for
wind power development and was multiplied by the turbine density factor of 7 MW/sq. km to arrive
at the farmland potential of Tamil Nadu.
Overlaying a district map on the final area, yielded wind potential figures for each district. Figure 4.4
depicts the potential district-wise map of onshore wind based on net CUF value categorization at 80
m and Table 4.5 shows the wind potential, by district, at 80 m for ‘farmland’ analysis.
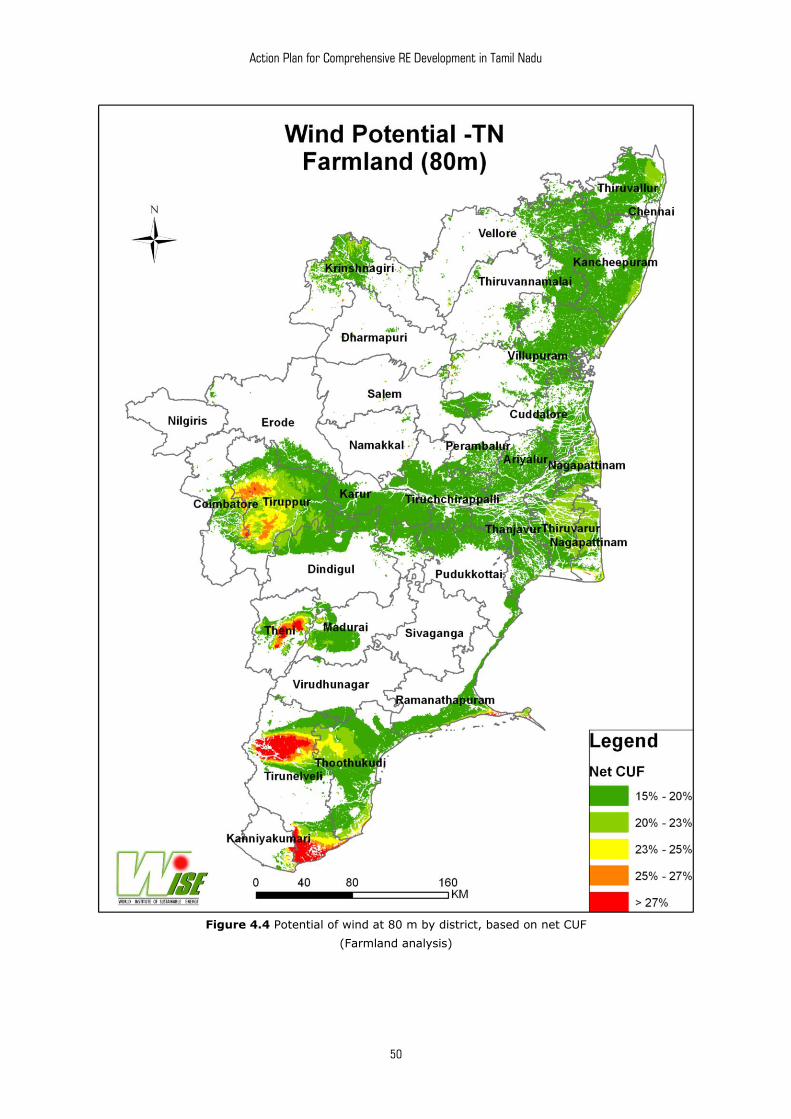
Action Plan for Comprehensive RE Development in Tamil Nadu
50
Figure 4.4 Potential of wind at 80 m by district, based on net CUF
(Farmland analysis)
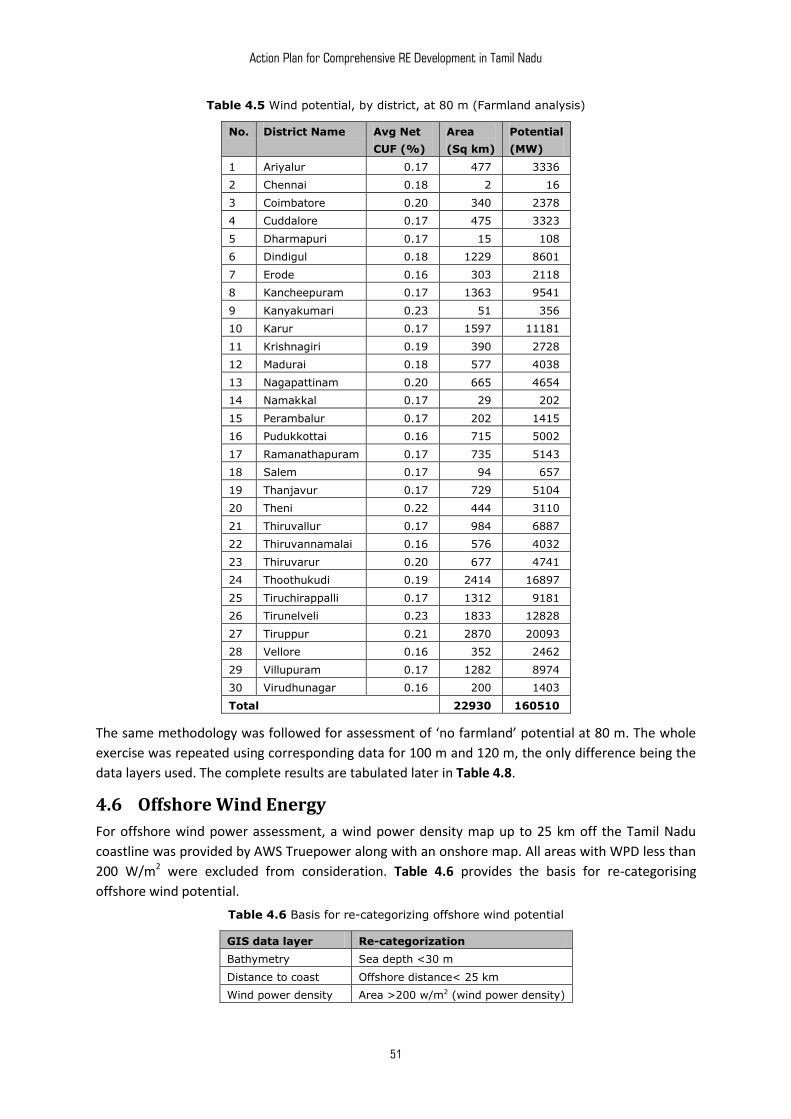
Action Plan for Comprehensive RE Development in Tamil Nadu
51
Table 4.5 Wind potential, by district, at 80 m (Farmland analysis)
No. District Name Avg Net
CUF (%)
Area
(Sq km)
Potential
(MW)
1 Ariyalur 0.17 477 3336
2 Chennai 0.18 2 16
3 Coimbatore 0.20 340 2378
4 Cuddalore 0.17 475 3323
5 Dharmapuri 0.17 15 108
6 Dindigul 0.18 1229 8601
7 Erode 0.16 303 2118
8 Kancheepuram 0.17 1363 9541
9 Kanyakumari 0.23 51 356
10 Karur 0.17 1597 11181
11 Krishnagiri 0.19 390 2728
12 Madurai 0.18 577 4038
13 Nagapattinam 0.20 665 4654
14 Namakkal 0.17 29 202
15 Perambalur 0.17 202 1415
16 Pudukkottai 0.16 715 5002
17 Ramanathapuram 0.17 735 5143
18 Salem 0.17 94 657
19 Thanjavur 0.17 729 5104
20 Theni 0.22 444 3110
21 Thiruvallur 0.17 984 6887
22 Thiruvannamalai 0.16 576 4032
23 Thiruvarur 0.20 677 4741
24 Thoothukudi 0.19 2414 16897
25 Tiruchirappalli 0.17 1312 9181
26 Tirunelveli 0.23 1833 12828
27 Tiruppur 0.21 2870 20093
28 Vellore 0.16 352 2462
29 Villupuram 0.17 1282 8974
30 Virudhunagar 0.16 200 1403
Total 22930 160510
The same methodology was followed for assessment of ‘no farmland’ potential at 80 m. The whole
exercise was repeated using corresponding data for 100 m and 120 m, the only difference being the
data layers used. The complete results are tabulated later in Table 4.8.
4.6 Offshore Wind Energy
For offshore wind power assessment, a wind power density map up to 25 km off the Tamil Nadu
coastline was provided by AWS Truepower along with an onshore map. All areas with WPD less than
200 W/m2 were excluded from consideration. Table 4.6 provides the basis for re-categorising
offshore wind potential.
Table 4.6 Basis for re-categorizing offshore wind potential
GIS data layer Re-categorization
Bathymetry Sea depth <30 m
Distance to coast Offshore distance< 25 km
Wind power density Area >200 w/m2 (wind power density)
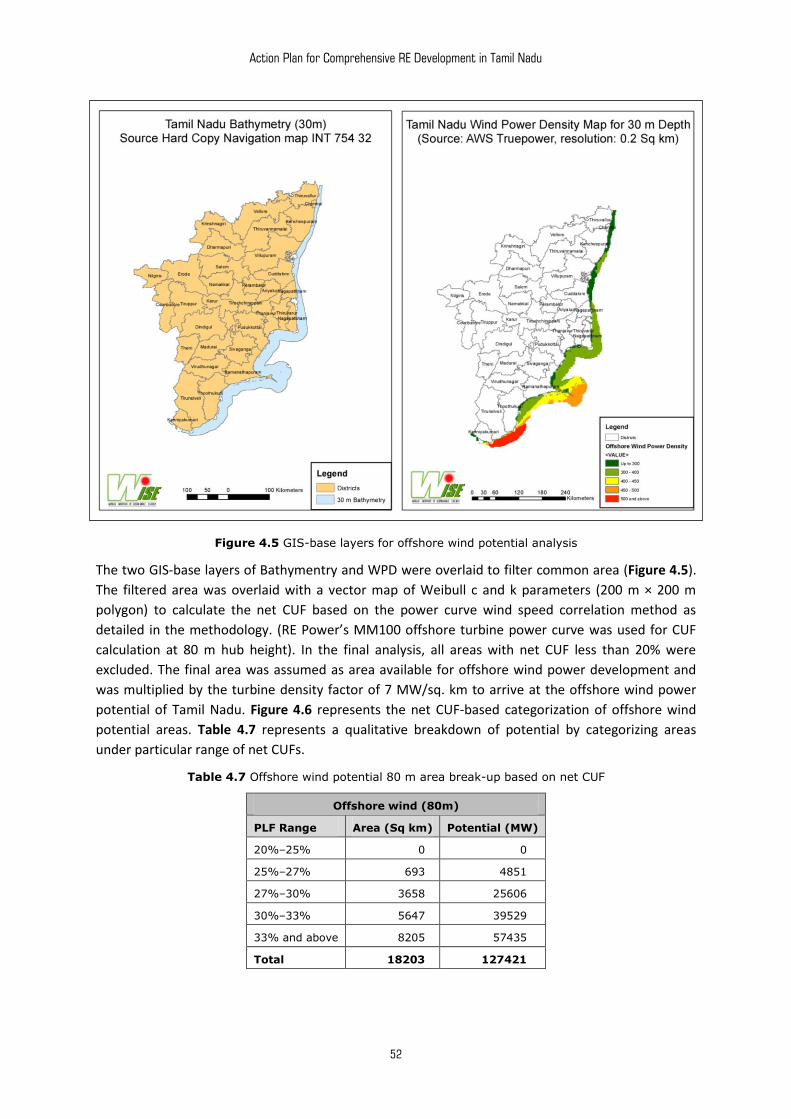
Action Plan for Comprehensive RE Development in Tamil Nadu
52
Figure 4.5 GIS-base layers for offshore wind potential analysis
The two GIS-base layers of Bathymentry and WPD were overlaid to filter common area (Figure 4.5).
The filtered area was overlaid with a vector map of Weibull c and k parameters (200 m × 200 m
polygon) to calculate the net CUF based on the power curve wind speed correlation method as
detailed in the methodology. (RE Power’s MM100 offshore turbine power curve was used for CUF
calculation at 80 m hub height). In the final analysis, all areas with net CUF less than 20% were
excluded. The final area was assumed as area available for offshore wind power development and
was multiplied by the turbine density factor of 7 MW/sq. km to arrive at the offshore wind power
potential of Tamil Nadu. Figure 4.6 represents the net CUF-based categorization of offshore wind
potential areas. Table 4.7 represents a qualitative breakdown of potential by categorizing areas
under particular range of net CUFs.
Table 4.7 Offshore wind potential 80 m area break-up based on net CUF
Offshore wind (80m)
PLF Range Area (Sq km) Potential (MW)
20%–25% 0 0
25%–27% 693 4851
27%–30% 3658 25606
30%–33% 5647 39529
33% and above 8205 57435
Total 18203 127421
Action Plan for Comprehensive RE Development in Tamil Nadu
53
Figure 4.6 Net CUF-based offshore wind potential at 80 m
4.7 Repowering
Repowering deals with the replacement of first-generation wind turbines with modern multi-
megawatt wind turbines to improve the extraction efficiency of wind power and to generate more
electricity from the same area. GIS was not used for repowering potential estimation as it would
have required incorporation of some subjective analysis in addition to raw field data related to
turbine locations.
Since Tamil Nadu was one of the earliest markets for wind power in India, there is a substantial
number of small-capacity turbines (less than 500 kW rating) still in operation but have lower
performance as compared to present-day modern turbines. Taking into account the number of such
small-capacity turbines in Tamil Nadu, a capacity of about 685 MW was identified as suitable for
repowering. Considering a repowering ratio of 2 (conservative estimate), the repowering potential
estimated in Tamil Nadu is about 1370 MW.
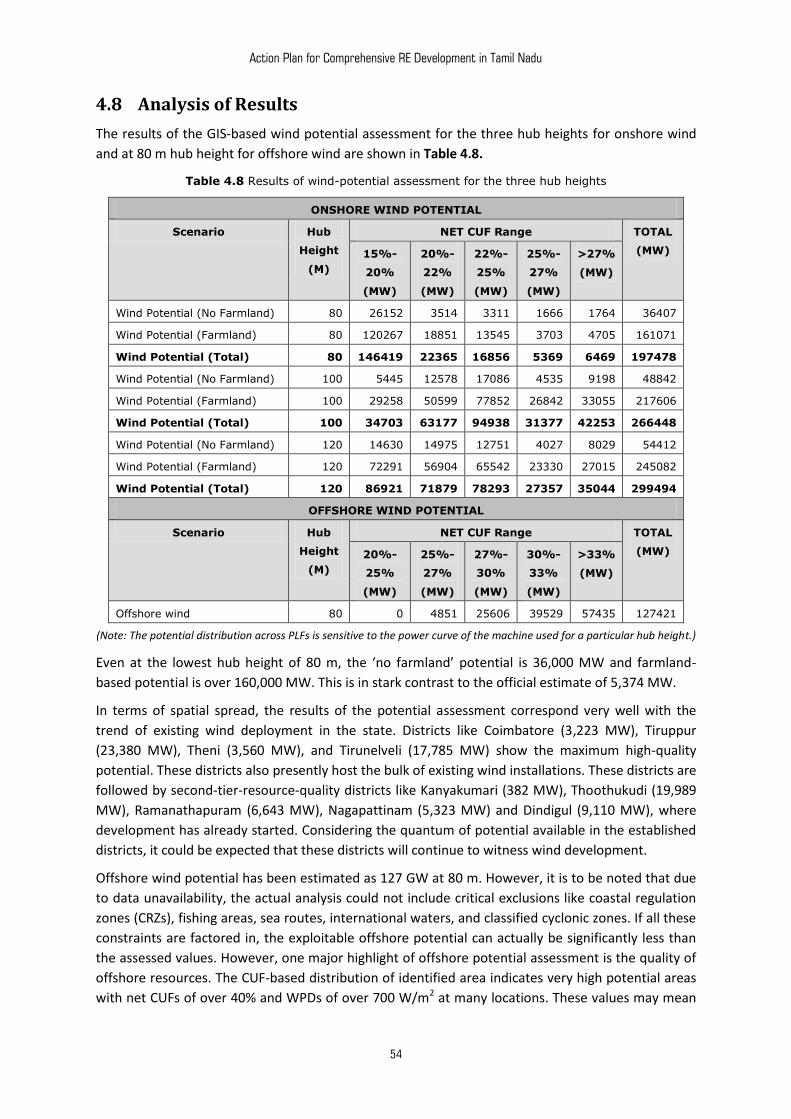
Action Plan for Comprehensive RE Development in Tamil Nadu
54
4.8 Analysis of Results
The results of the GIS-based wind potential assessment for the three hub heights for onshore wind
and at 80 m hub height for offshore wind are shown in Table 4.8.
Table 4.8 Results of wind-potential assessment for the three hub heights
ONSHORE WIND POTENTIAL
Scenario Hub
Height
(M)
NET CUF Range TOTAL
(MW) 15%-
20%
(MW)
20%-
22%
(MW)
22%-
25%
(MW)
25%-
27%
(MW)
>27%
(MW)
Wind Potential (No Farmland) 80 26152 3514 3311 1666 1764 36407
Wind Potential (Farmland) 80 120267 18851 13545 3703 4705 161071
Wind Potential (Total) 80 146419 22365 16856 5369 6469 197478
Wind Potential (No Farmland) 100 5445 12578 17086 4535 9198 48842
Wind Potential (Farmland) 100 29258 50599 77852 26842 33055 217606
Wind Potential (Total) 100 34703 63177 94938 31377 42253 266448
Wind Potential (No Farmland) 120 14630 14975 12751 4027 8029 54412
Wind Potential (Farmland) 120 72291 56904 65542 23330 27015 245082
Wind Potential (Total) 120 86921 71879 78293 27357 35044 299494
OFFSHORE WIND POTENTIAL
Scenario Hub
Height
(M)
NET CUF Range TOTAL
(MW) 20%-
25%
(MW)
25%-
27%
(MW)
27%-
30%
(MW)
30%-
33%
(MW)
>33%
(MW)
Offshore wind 80 0 4851 25606 39529 57435 127421
(Note: The potential distribution across PLFs is sensitive to the power curve of the machine used for a particular hub height.)
Even at the lowest hub height of 80 m, the ‘no farmland’ potential is 36,000 MW and farmland-
based potential is over 160,000 MW. This is in stark contrast to the official estimate of 5,374 MW.
In terms of spatial spread, the results of the potential assessment correspond very well with the
trend of existing wind deployment in the state. Districts like Coimbatore (3,223 MW), Tiruppur
(23,380 MW), Theni (3,560 MW), and Tirunelveli (17,785 MW) show the maximum high-quality
potential. These districts also presently host the bulk of existing wind installations. These districts are
followed by second-tier-resource-quality districts like Kanyakumari (382 MW), Thoothukudi (19,989
MW), Ramanathapuram (6,643 MW), Nagapattinam (5,323 MW) and Dindigul (9,110 MW), where
development has already started. Considering the quantum of potential available in the established
districts, it could be expected that these districts will continue to witness wind development.
Offshore wind potential has been estimated as 127 GW at 80 m. However, it is to be noted that due
to data unavailability, the actual analysis could not include critical exclusions like coastal regulation
zones (CRZs), fishing areas, sea routes, international waters, and classified cyclonic zones. If all these
constraints are factored in, the exploitable offshore potential can actually be significantly less than
the assessed values. However, one major highlight of offshore potential assessment is the quality of
offshore resources. The CUF-based distribution of identified area indicates very high potential areas
with net CUFs of over 40% and WPDs of over 700 W/m2 at many locations. These values may mean

Action Plan for Comprehensive RE Development in Tamil Nadu
55
that offshore wind deployment in Tamil Nadu could become commercially viable despite high costs.
These values also make a strong case for developing offshore wind in Tamil Nadu. In terms of spatial
spread, the assessment indicates very high quality potential off Tirunelveli and southern
Thoothukudi, followed by the coastal region off Rameshwaram. Incidentally, CWET is in the process
of setting up a 100 m wind monitoring mast near Dhanushkodi in Rameshwaram to assess offshore
resources in the Rameshwaram area.
Repowering is another major area which has been languishing because of policy and regulatory
issues. In many cases, repowering of old wind farms requires capacity-augmentation of the grid to
evacuate the additional power, which is a real technical constraint. But even in cases where such
additional capacity is available, issues related to land ownership, land costing and micro-siting of
WTGs are hampering any private activity. TNEB is allowing repowering, subject to the criteria that
there will be no change in repowered capacity, tariff and micro-siting criteria. Presently, TNEB insists
on a spacing of 5D × 7D even for repowering old machines with new higher-capacity machines. This
is not only arbitrary but also not feasible because the new machines have larger rotor diameters and
cannot be sited within the constrained private area of existing machines. Furthermore, the
insistence on continuing with old tariffs and allotted capacities is further disincentivizing any private
efforts in repowering. While there are other commercial and financial issues involved in repowering,
the private sector is more than capable of devising ingenious revenue-sharing models to take care of
these constraints, only if the technicalities and administrative processes are in place to support the
initiative in other areas.
***

Action Plan for Comprehensive RE Development in Tamil Nadu
56
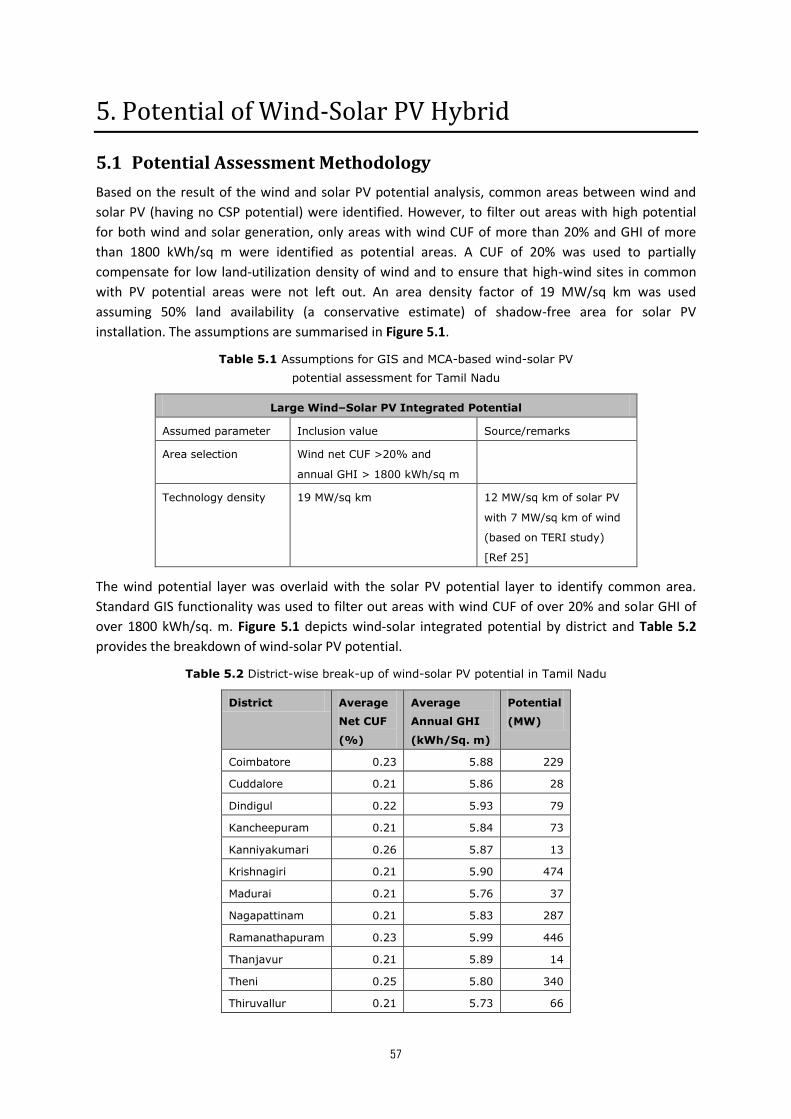
Action Plan for Comprehensive RE Development in Tamil Nadu
57
5. Potential of Wind-Solar PV Hybrid
5.1 Potential Assessment Methodology
Based on the result of the wind and solar PV potential analysis, common areas between wind and
solar PV (having no CSP potential) were identified. However, to filter out areas with high potential
for both wind and solar generation, only areas with wind CUF of more than 20% and GHI of more
than 1800 kWh/sq m were identified as potential areas. A CUF of 20% was used to partially
compensate for low land-utilization density of wind and to ensure that high-wind sites in common
with PV potential areas were not left out. An area density factor of 19 MW/sq km was used
assuming 50% land availability (a conservative estimate) of shadow-free area for solar PV
installation. The assumptions are summarised in Figure 5.1.
Table 5.1 Assumptions for GIS and MCA-based wind-solar PV
potential assessment for Tamil Nadu
Large Wind–Solar PV Integrated Potential
Assumed parameter Inclusion value Source/remarks
Area selection Wind net CUF >20% and
annual GHI > 1800 kWh/sq m
Technology density 19 MW/sq km 12 MW/sq km of solar PV
with 7 MW/sq km of wind
(based on TERI study)
[Ref 25]
The wind potential layer was overlaid with the solar PV potential layer to identify common area.
Standard GIS functionality was used to filter out areas with wind CUF of over 20% and solar GHI of
over 1800 kWh/sq. m. Figure 5.1 depicts wind-solar integrated potential by district and Table 5.2
provides the breakdown of wind-solar PV potential.
Table 5.2 District-wise break-up of wind-solar PV potential in Tamil Nadu
District Average
Net CUF
(%)
Average
Annual GHI
(kWh/Sq. m)
Potential
(MW)
Coimbatore 0.23 5.88 229
Cuddalore 0.21 5.86 28
Dindigul 0.22 5.93 79
Kancheepuram 0.21 5.84 73
Kanniyakumari 0.26 5.87 13
Krishnagiri 0.21 5.90 474
Madurai 0.21 5.76 37
Nagapattinam 0.21 5.83 287
Ramanathapuram 0.23 5.99 446
Thanjavur 0.21 5.89 14
Theni 0.25 5.80 340
Thiruvallur 0.21 5.73 66
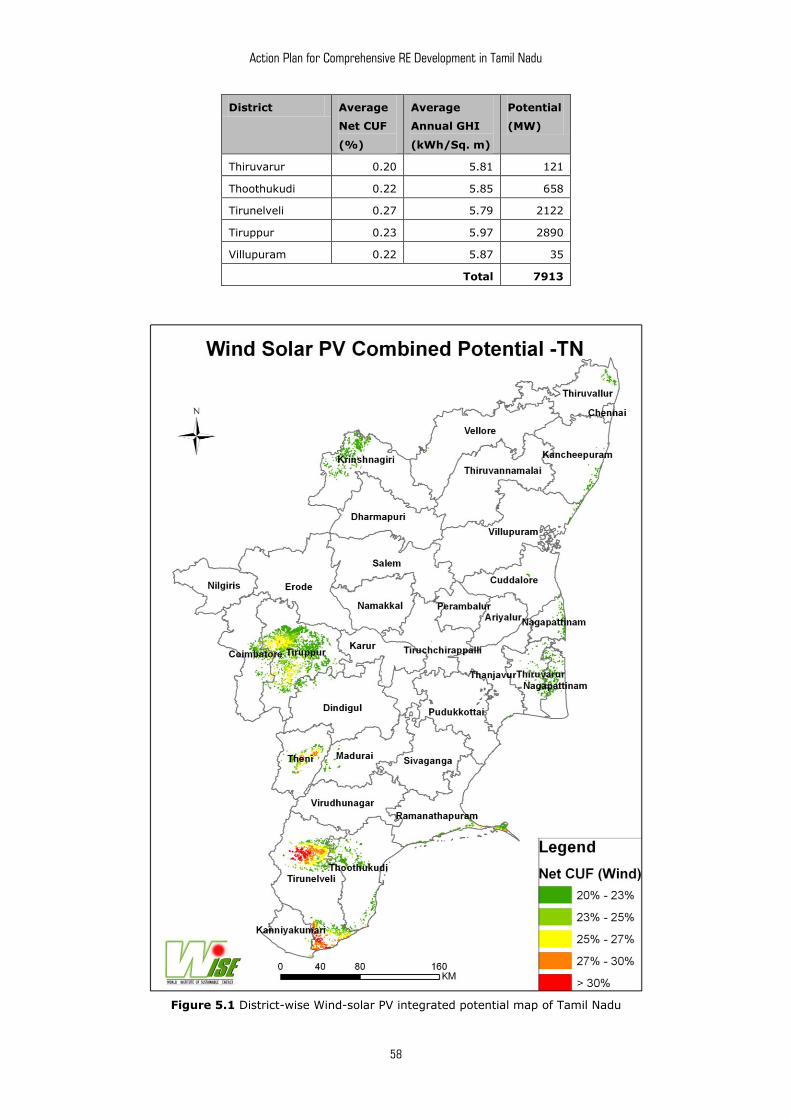
Action Plan for Comprehensive RE Development in Tamil Nadu
58
District Average
Net CUF
(%)
Average
Annual GHI
(kWh/Sq. m)
Potential
(MW)
Thiruvarur 0.20 5.81 121
Thoothukudi 0.22 5.85 658
Tirunelveli 0.27 5.79 2122
Tiruppur 0.23 5.97 2890
Villupuram 0.22 5.87 35
Total 7913
Figure 5.1 District-wise Wind-solar PV integrated potential map of Tamil Nadu
Action Plan for Comprehensive RE Development in Tamil Nadu
59
5.2 Analysis of Results
Generation variability of wind and solar are the biggest impediments to grid integration of these two
promising technologies.
Presently, the major options being considered to address and manage variability are storage,
spinning reserve, forecasting, etc. However, there is very little focus on integrating wind with solar
PV to partially address the variability. It is known that wind and solar generation patterns
complement each other. On a day-to-day basis, solar PV generation usually peaks near midday,
when wind generation is at the lowest and tapers off in the evening when wind generation starts
picking up. Even on a seasonal basis, low solar generation during monsoons is compensated by wind
generation, which is at its peak. A combined wind and solar PV interface with the grid can be
expected to at least reduce the extent of variability of the combined generation as compared to
individual generation. It is in this context that the potential assessment for an integrated wind-solar
PV project was conducted.
However, large wind-solar PV integration is an area that has not been explored in great detail.
Additionally, there are concerns like the possibility of solar PV panel damage in routine wind
project/operations activities, lack of a sustainable investment model, and grid interfacing of the
combined systems. Any recommendations related to policy, regulation, business models and
administrative handling require a great deal of due diligence and consultation. Based on the
availability of wind resource quality, Tirunelveli (2,122 MW), Tiruppur (2,890 MW), and Thoothukudi
(658 MW) are the major areas with high potential followed by Krishnagiri, Ramanathapuram, Theni,
Nagapattinam and Coimbatore. However, the most high-quality potential in terms of wind quality
(Net CUF) and GHI is found in Tirunelveli and Theni.
***

Action Plan for Comprehensive RE Development in Tamil Nadu
60
Action Plan for Comprehensive RE Development in Tamil Nadu
61
6. Potential for Power Generation from Biomass
The most critical factor in assessment of biomass power potential is the actual availability of biomass
residue that can be used for power generation unlike in the case of other technologies, where
assumptions related to technical parameters are crucial. Consequently, biomass potential
assessment is very location-specific and depends largely on the pattern of biomass residue
generation and consumption at a local level.
A number of studies have been conducted in Tamil Nadu for assessment of biomass potential. In
view of the considerations mentioned above, the present literature review covered state-specific
studies that focus on assessing biomass power potential based on surplus biomass availability from
agricultural, forest and wasteland areas.
6.1 Literature Review
District-wise power potential assessment for Tamil Nadu was completed in the Biomass Resource
Atlas of India [Ref 26] In this project, the Combustion Gasification and Propulsion Laboratory (CGPL)
acted as the national focal point (NFP) that provided information on biomass residue from crops
related to energy generation, both in spatial and statistical form.
The residue generation based on agricultural output was used to compute the surplus biomass
available for energy production after accounting for societal uses such as fodder, domestic fuel and
thatching. While all the use for fodder and thatching was considered unavailable for energy
generation, use for domestic fuel was decided based on district-level surveys conducted with MNRE
support. Data on agricultural output was obtained from the Ministry of Agriculture, Government of
India, whereas the data on residues were obtained from taluka and district surveys. The taluka study
was initiated by the Ministry of New and Renewable Energy, Government of India, and conducted
during 1999-2001 for about 500 strategically selected talukas across the country. CGPL acting as the
NFP had integrated these crop-related data into a database to be used for creating the spatial atlas
(Indian Bio-Residue Map, or IBRM). Spatial maps showing land-use were set into GIS by CGPL to use
the statistical crop data for spatial distribution at the district-level. GIS-based techniques were
adopted for distributing the polygons (with the appropriate crop names) by combining the
information on the areas from the land-use data, with statistical data on the crop area. The maps
were re-processed to also embed the district- and taluka-level spatial data extracted from the same
crop distribution map. However, it is not clear if potential crops like tapioca and other biomass
wastes were accurately assessed.
Anna University, Chennai, carried out district-level biomass assessment in 2010 [Ref 27]. The study
reports were submitted to the Tamil Nadu Energy Development Agency (TEDA) in 2005 and 2010.
According to the 2010 assessment, the net power generation potential based on surplus biomass
availability in the state is estimated at 487.41 MW.
TEDA had also conducted a taluka-level biomass power potential assessment study in 2008 [Ref 28],
in which 49 out of the 220 talukas were covered. The result of the study indicated a potential of 228
MW for the talukas under consideration. Some other studies were also reviewed.
Most studies assessed biomass potential primarily based on the potential energy content (calorific
value) of available feedstock. No specific distinction was made between the combustion and the
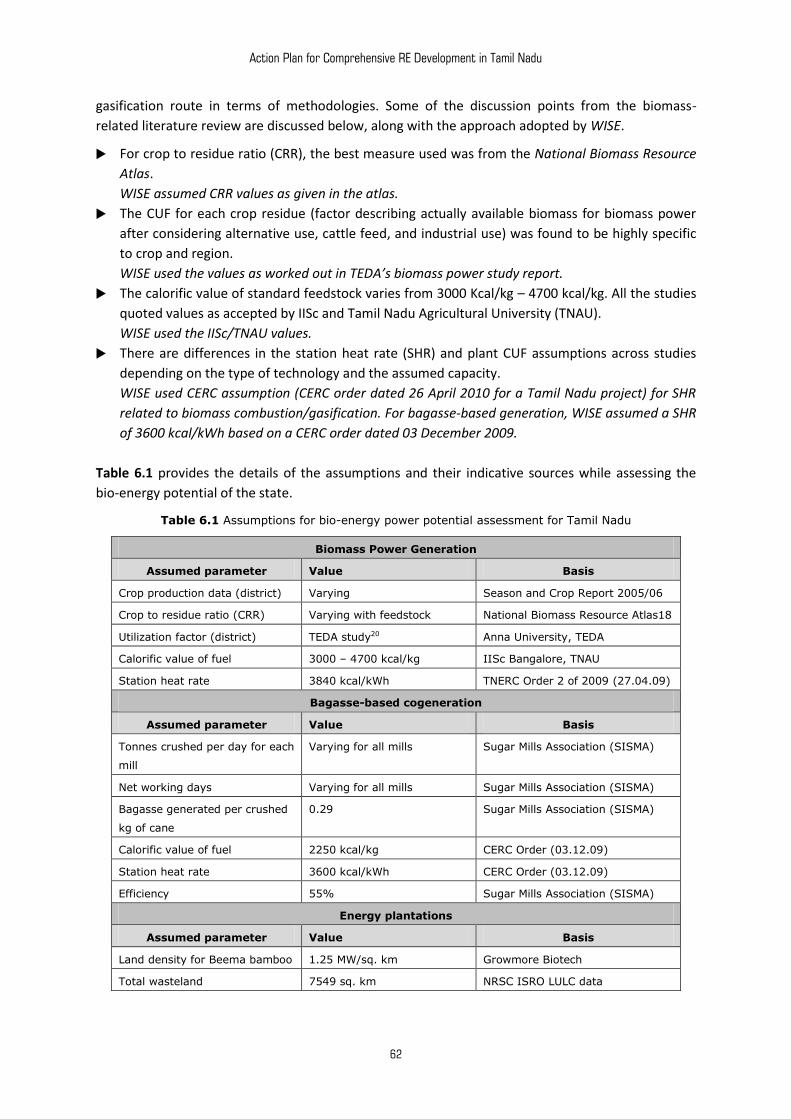
Action Plan for Comprehensive RE Development in Tamil Nadu
62
gasification route in terms of methodologies. Some of the discussion points from the biomass-
related literature review are discussed below, along with the approach adopted by WISE.
For crop to residue ratio (CRR), the best measure used was from the National Biomass Resource
Atlas.
WISE assumed CRR values as given in the atlas.
The CUF for each crop residue (factor describing actually available biomass for biomass power
after considering alternative use, cattle feed, and industrial use) was found to be highly specific
to crop and region.
WISE used the values as worked out in TEDA’s biomass power study report.
The calorific value of standard feedstock varies from 3000 Kcal/kg – 4700 kcal/kg. All the studies
quoted values as accepted by IISc and Tamil Nadu Agricultural University (TNAU).
WISE used the IISc/TNAU values.
There are differences in the station heat rate (SHR) and plant CUF assumptions across studies
depending on the type of technology and the assumed capacity.
WISE used CERC assumption (CERC order dated 26 April 2010 for a Tamil Nadu project) for SHR
related to biomass combustion/gasification. For bagasse-based generation, WISE assumed a SHR
of 3600 kcal/kWh based on a CERC order dated 03 December 2009.
Table 6.1 provides the details of the assumptions and their indicative sources while assessing the
bio-energy potential of the state.
Table 6.1 Assumptions for bio-energy power potential assessment for Tamil Nadu
Biomass Power Generation
Assumed parameter Value Basis
Crop production data (district) Varying Season and Crop Report 2005/06
Crop to residue ratio (CRR) Varying with feedstock National Biomass Resource Atlas18
Utilization factor (district) TEDA study20 Anna University, TEDA
Calorific value of fuel 3000 – 4700 kcal/kg IISc Bangalore, TNAU
Station heat rate 3840 kcal/kWh TNERC Order 2 of 2009 (27.04.09)
Bagasse-based cogeneration
Assumed parameter Value Basis
Tonnes crushed per day for each
mill
Varying for all mills Sugar Mills Association (SISMA)
Net working days Varying for all mills Sugar Mills Association (SISMA)
Bagasse generated per crushed
kg of cane
0.29 Sugar Mills Association (SISMA)
Calorific value of fuel 2250 kcal/kg CERC Order (03.12.09)
Station heat rate 3600 kcal/kWh CERC Order (03.12.09)
Efficiency 55% Sugar Mills Association (SISMA)
Energy plantations
Assumed parameter Value Basis
Land density for Beema bamboo 1.25 MW/sq. km Growmore Biotech
Total wasteland 7549 sq. km NRSC ISRO LULC data
Action Plan for Comprehensive RE Development in Tamil Nadu
63
6.2 Methodology for Assessment of Biomass Power Potential
WISE used statistical data from various sources covering agriculture, animal husbandry, and agro-
based industries in addition to literature review covering state-specific studies that focus on
assessing biomass power potential based on surplus biomass availability from agricultural, forest and
wasteland areas.
The agro-based power potential for every district was calculated considering all the residues
available in that district. For each crop in a particular district, the available agro residue was
estimated from the crop production and crop-to-residue ratio. The generated agro residues were
then discounted by the known utilization factors to estimate surplus availability, which was finally
converted into potential using normative station heat rate (SHR) and plant efficiency values. The
following equations depict the methodology.
Equation 1
Crop production (kg) × crop to residue ratio × (1 – Utilization ratio) = surplus availability (kg)
Equation 2
[Surplus (kg) × calorific value (kcal/kg) × station heat rate (kWh/kcal)] / [8760 (h) × efficiency] = kW
For bagasse, the methodology used empirical data related to tonnes (of cane) crushed per day (TCD).
The ratio of bagasse generated from crushed cane was used to estimate the value of bagasse
generation. Bagasse availability was then converted into potential using similar methodology as that
of biomass. The following equations depict the methodology.
Equation 3
Tonnes crushed per day (tonnes/day) × % of bagasse to cane crushed × net working days (days) =
bagasse generated (kg)
Equation 4
Bagasse (kg) × calorific value (kcal/kg) × station heat rate (kWh/kcal)] / (8760 (h) × efficiency) = kW
For estimating the potential of energy plantations, Beema bamboo, a high-yielding bamboo species
developed by Growmore Biotech was chosen for assessment. Because of limited data availability,
the declared land-use density of Beema bamboo (1.25 MW/ sq. km) was multiplied by the available
wasteland to estimate the maximum potential of energy plantations in Tamil Nadu.
The biomass power potential was calculated for agro-residue and agro-industrial biomass residue. In
addition, assessment was also done for bagasse-based potential and energy plantations.
6.3 Agro Residue-based Potential
In order to estimate the energy potential from agriculture-based residue or agro-residue and agro-
industrial residue, WISE used the Season and Crop Report 2005-06, published by the Department of
Economics and Statistics, Government of Tamil Nadu. This data was used as it was the most
comprehensive data covering maximum crops for maximum number of districts.
The agro- and agro-industrial residue list, considered for this resource assessment, are provided in
Table 6.2.
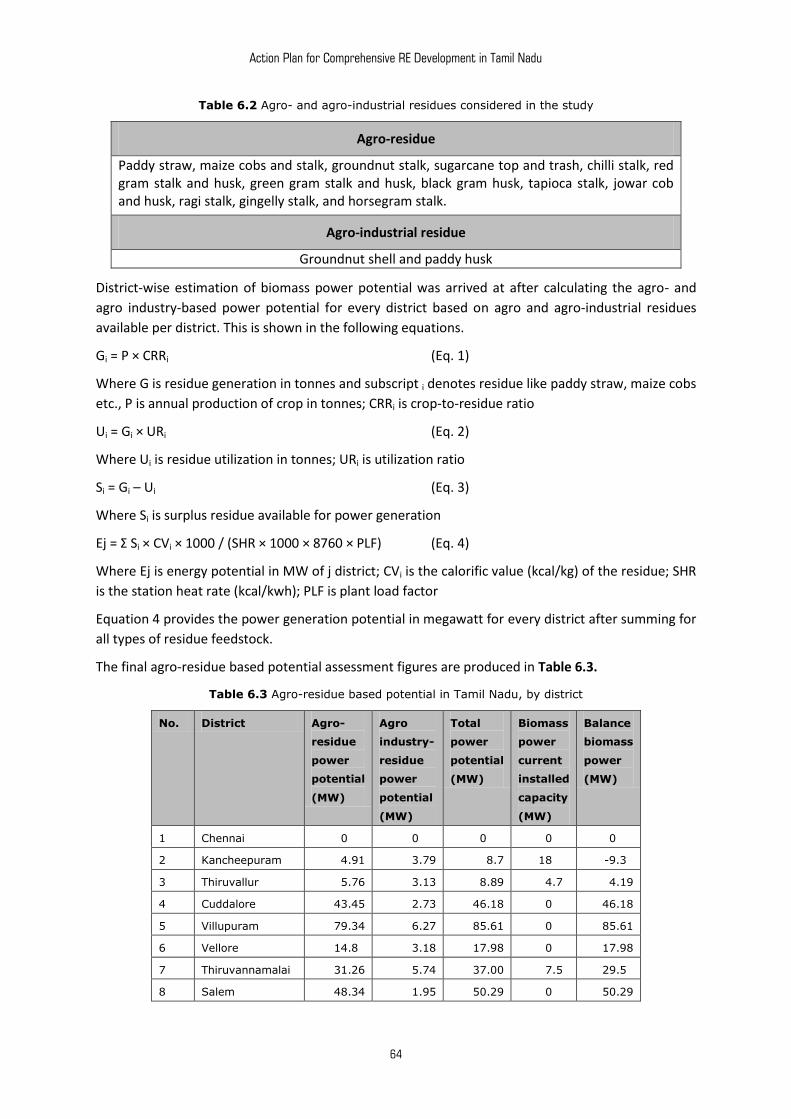
Action Plan for Comprehensive RE Development in Tamil Nadu
64
Table 6.2 Agro- and agro-industrial residues considered in the study
Agro-residue
Paddy straw, maize cobs and stalk, groundnut stalk, sugarcane top and trash, chilli stalk, red gram stalk and husk, green gram stalk and husk, black gram husk, tapioca stalk, jowar cob and husk, ragi stalk, gingelly stalk, and horsegram stalk.
Agro-industrial residue
Groundnut shell and paddy husk
District-wise estimation of biomass power potential was arrived at after calculating the agro- and
agro industry-based power potential for every district based on agro and agro-industrial residues
available per district. This is shown in the following equations.
Gi = P × CRRi (Eq. 1)
Where G is residue generation in tonnes and subscript i denotes residue like paddy straw, maize cobs
etc., P is annual production of crop in tonnes; CRRi is crop-to-residue ratio
Ui = Gi × URi (Eq. 2)
Where Ui is residue utilization in tonnes; URi is utilization ratio
Si = Gi – Ui (Eq. 3)
Where Si is surplus residue available for power generation
Ej = Σ Si × CVi × 1000 / (SHR × 1000 × 8760 × PLF) (Eq. 4)
Where Ej is energy potential in MW of j district; CVi is the calorific value (kcal/kg) of the residue; SHR
is the station heat rate (kcal/kwh); PLF is plant load factor
Equation 4 provides the power generation potential in megawatt for every district after summing for
all types of residue feedstock.
The final agro-residue based potential assessment figures are produced in Table 6.3.
Table 6.3 Agro-residue based potential in Tamil Nadu, by district
No. District Agro-
residue
power
potential
(MW)
Agro
industry-
residue
power
potential
(MW)
Total
power
potential
(MW)
Biomass
power
current
installed
capacity
(MW)
Balance
biomass
power
(MW)
1 Chennai 0.00 0.00 0.00 0.00 0.00
2 Kancheepuram 4.91 3.79 8.7 18.00 -9.30
3 Thiruvallur 5.76 3.13 8.89 4.70 4.19
4 Cuddalore 43.45 2.73 46.18 0.00 46.18
5 Villupuram 79.34 6.27 85.61 0.00 85.61
6 Vellore 14.80 3.18 17.98 0.00 17.98
7 Thiruvannamalai 31.26 5.74 37.00 7.50 29.50
8 Salem 48.34 1.95 50.29 0.00 50.29
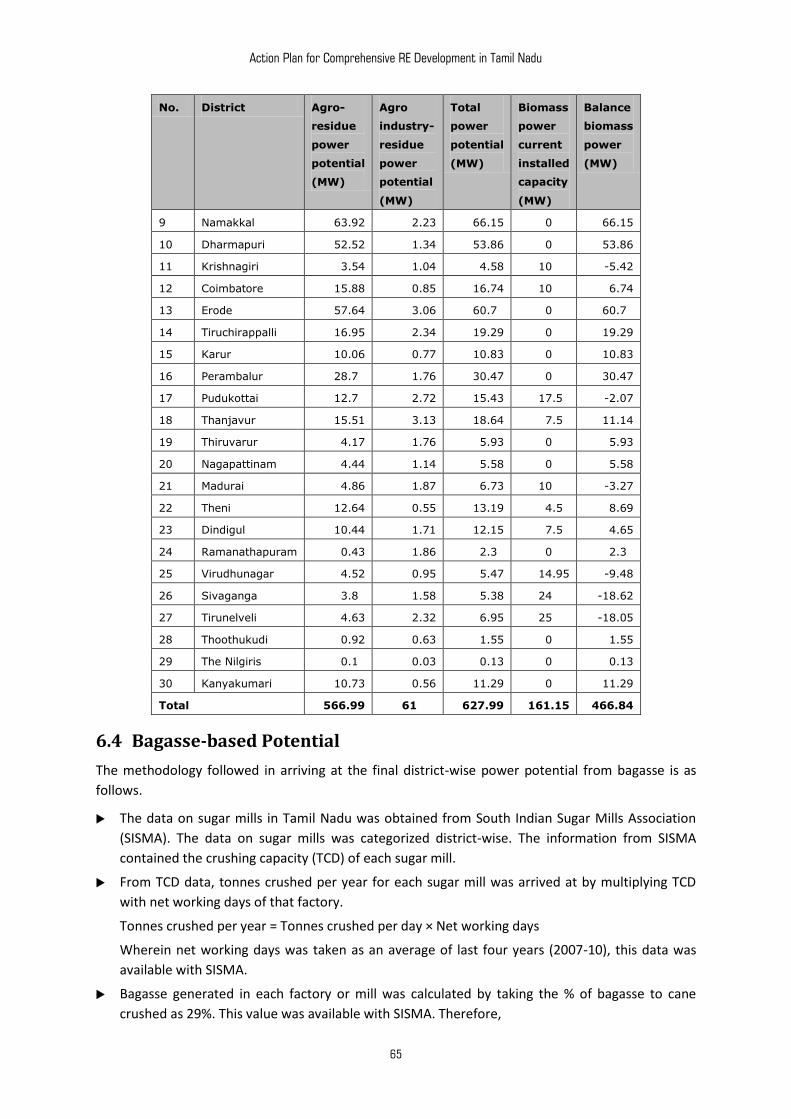
Action Plan for Comprehensive RE Development in Tamil Nadu
65
No. District Agro-
residue
power
potential
(MW)
Agro
industry-
residue
power
potential
(MW)
Total
power
potential
(MW)
Biomass
power
current
installed
capacity
(MW)
Balance
biomass
power
(MW)
9 Namakkal 63.92 2.23 66.15 0.00 66.15
10 Dharmapuri 52.52 1.34 53.86 0.00 53.86
11 Krishnagiri 3.54 1.04 4.58 10.00 -5.42
12 Coimbatore 15.88 0.85 16.74 10.00 6.74
13 Erode 57.64 3.06 60.70 0.00 60.70
14 Tiruchirappalli 16.95 2.34 19.29 0.00 19.29
15 Karur 10.06 0.77 10.83 0.00 10.83
16 Perambalur 28.70 1.76 30.47 0.00 30.47
17 Pudukottai 12.70 2.72 15.43 17.50 -2.07
18 Thanjavur 15.51 3.13 18.64 7.50 11.14
19 Thiruvarur 4.17 1.76 5.93 0.00 5.93
20 Nagapattinam 4.44 1.14 5.58 0.00 5.58
21 Madurai 4.86 1.87 6.73 10.00 -3.27
22 Theni 12.64 0.55 13.19 4.50 8.69
23 Dindigul 10.44 1.71 12.15 7.50 4.65
24 Ramanathapuram 0.43 1.86 2.30 0.00 2.30
25 Virudhunagar 4.52 0.95 5.47 14.95 -9.48
26 Sivaganga 3.80 1.58 5.38 24.00 -18.62
27 Tirunelveli 4.63 2.32 6.95 25.00 -18.05
28 Thoothukudi 0.92 0.63 1.55 0.00 1.55
29 The Nilgiris 0.10 0.03 0.13 0.00 0.13
30 Kanyakumari 10.73 0.56 11.29 0.00 11.29
Total 566.99 61.00 627.99 161.15 466.84
6.4 Bagasse-based Potential
The methodology followed in arriving at the final district-wise power potential from bagasse is as
follows.
The data on sugar mills in Tamil Nadu was obtained from South Indian Sugar Mills Association
(SISMA). The data on sugar mills was categorized district-wise. The information from SISMA
contained the crushing capacity (TCD) of each sugar mill.
From TCD data, tonnes crushed per year for each sugar mill was arrived at by multiplying TCD
with net working days of that factory.
Tonnes crushed per year = Tonnes crushed per day × Net working days
Wherein net working days was taken as an average of last four years (2007-10), this data was
available with SISMA.
Bagasse generated in each factory or mill was calculated by taking the % of bagasse to cane
crushed as 29%. This value was available with SISMA. Therefore,
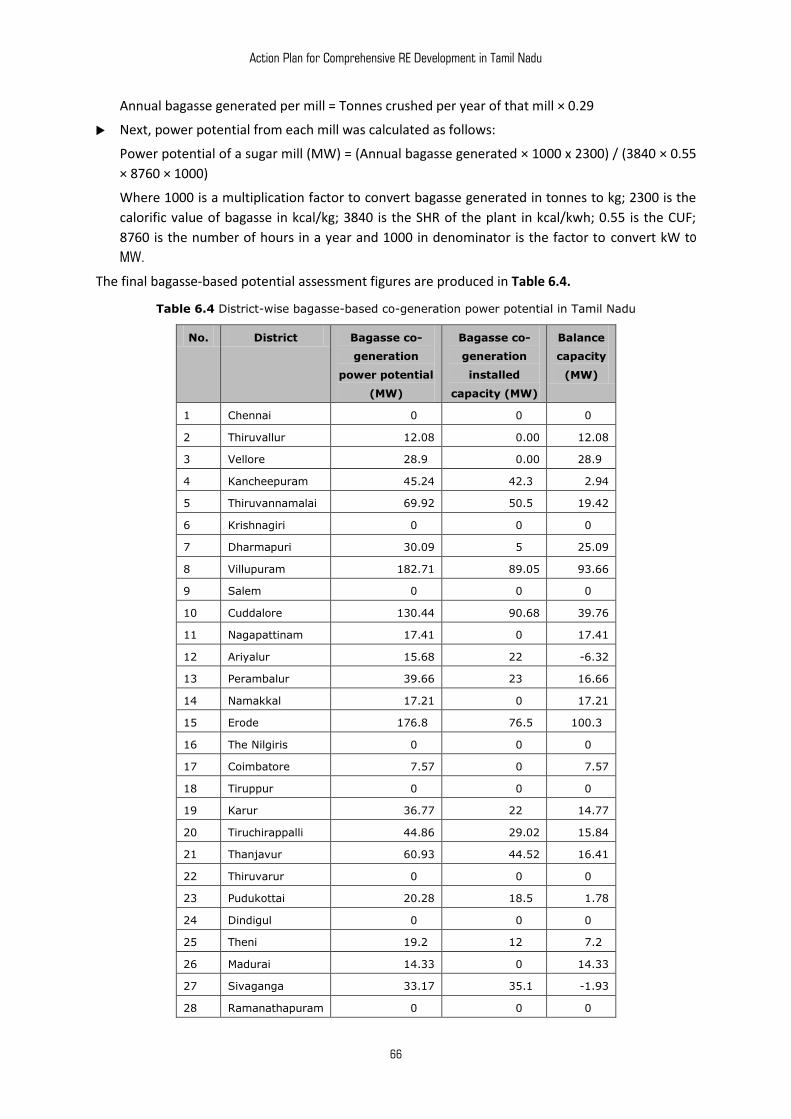
Action Plan for Comprehensive RE Development in Tamil Nadu
66
Annual bagasse generated per mill = Tonnes crushed per year of that mill × 0.29
Next, power potential from each mill was calculated as follows:
Power potential of a sugar mill (MW) = (Annual bagasse generated × 1000 x 2300) / (3840 × 0.55
× 8760 × 1000)
Where 1000 is a multiplication factor to convert bagasse generated in tonnes to kg; 2300 is the
calorific value of bagasse in kcal/kg; 3840 is the SHR of the plant in kcal/kwh; 0.55 is the CUF;
8760 is the number of hours in a year and 1000 in denominator is the factor to convert kW to
MW.
The final bagasse-based potential assessment figures are produced in Table 6.4.
Table 6.4 District-wise bagasse-based co-generation power potential in Tamil Nadu
No. District Bagasse co-
generation
power potential
(MW)
Bagasse co-
generation
installed
capacity (MW)
Balance
capacity
(MW)
1 Chennai 0.00 0.00 0.00
2 Thiruvallur 12.08 0.00 12.08
3 Vellore 28.90 0.00 28.90
4 Kancheepuram 45.24 42.30 2.94
5 Thiruvannamalai 69.92 50.50 19.42
6 Krishnagiri 0.00 0.00 0.00
7 Dharmapuri 30.09 5.00 25.09
8 Villupuram 182.71 89.05 93.66
9 Salem 0.00 0.00 0.00
10 Cuddalore 130.44 90.68 39.76
11 Nagapattinam 17.41 0.00 17.41
12 Ariyalur 15.68 22.00 -6.32
13 Perambalur 39.66 23.00 16.66
14 Namakkal 17.21 0.00 17.21
15 Erode 176.80 76.50 100.30
16 The Nilgiris 0.00 0.00 0.00
17 Coimbatore 7.57 0.00 7.57
18 Tiruppur 0.00 0.00 0.00
19 Karur 36.77 22.00 14.77
20 Tiruchirappalli 44.86 29.02 15.84
21 Thanjavur 60.93 44.52 16.41
22 Thiruvarur 0.00 0.00 0.00
23 Pudukottai 20.28 18.50 1.78
24 Dindigul 0.00 0.00 0.00
25 Theni 19.20 12.00 7.20
26 Madurai 14.33 0.00 14.33
27 Sivaganga 33.17 35.10 -1.93
28 Ramanathapuram 0.00 0.00 0.00
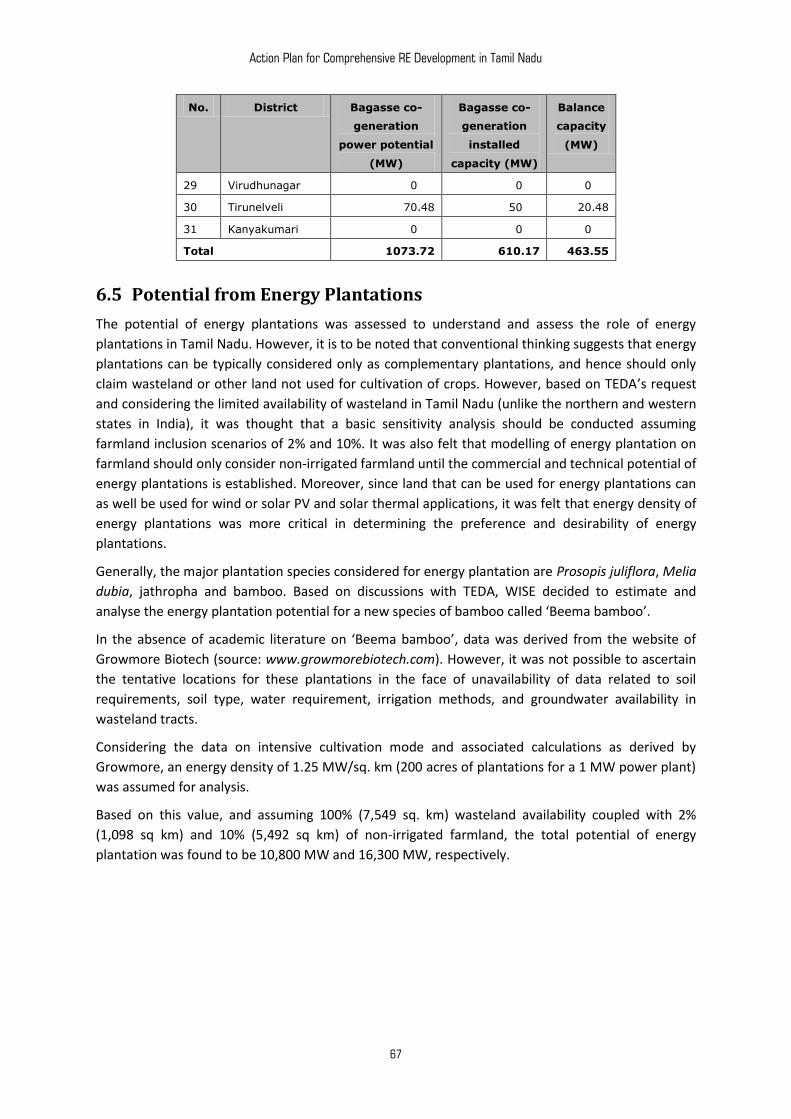
Action Plan for Comprehensive RE Development in Tamil Nadu
67
No. District Bagasse co-
generation
power potential
(MW)
Bagasse co-
generation
installed
capacity (MW)
Balance
capacity
(MW)
29 Virudhunagar 0.00 0.00 0.00
30 Tirunelveli 70.48 50.00 20.48
31 Kanyakumari 0.00 0.00 0.00
Total 1073.72 610.17 463.55
6.5 Potential from Energy Plantations
The potential of energy plantations was assessed to understand and assess the role of energy
plantations in Tamil Nadu. However, it is to be noted that conventional thinking suggests that energy
plantations can be typically considered only as complementary plantations, and hence should only
claim wasteland or other land not used for cultivation of crops. However, based on TEDA’s request
and considering the limited availability of wasteland in Tamil Nadu (unlike the northern and western
states in India), it was thought that a basic sensitivity analysis should be conducted assuming
farmland inclusion scenarios of 2% and 10%. It was also felt that modelling of energy plantation on
farmland should only consider non-irrigated farmland until the commercial and technical potential of
energy plantations is established. Moreover, since land that can be used for energy plantations can
as well be used for wind or solar PV and solar thermal applications, it was felt that energy density of
energy plantations was more critical in determining the preference and desirability of energy
plantations.
Generally, the major plantation species considered for energy plantation are Prosopis juliflora, Melia
dubia, jathropha and bamboo. Based on discussions with TEDA, WISE decided to estimate and
analyse the energy plantation potential for a new species of bamboo called ‘Beema bamboo’.
In the absence of academic literature on ‘Beema bamboo’, data was derived from the website of
Growmore Biotech (source: www.growmorebiotech.com). However, it was not possible to ascertain
the tentative locations for these plantations in the face of unavailability of data related to soil
requirements, soil type, water requirement, irrigation methods, and groundwater availability in
wasteland tracts.
Considering the data on intensive cultivation mode and associated calculations as derived by
Growmore, an energy density of 1.25 MW/sq. km (200 acres of plantations for a 1 MW power plant)
was assumed for analysis.
Based on this value, and assuming 100% (7,549 sq. km) wasteland availability coupled with 2%
(1,098 sq km) and 10% (5,492 sq km) of non-irrigated farmland, the total potential of energy
plantation was found to be 10,800 MW and 16,300 MW, respectively.
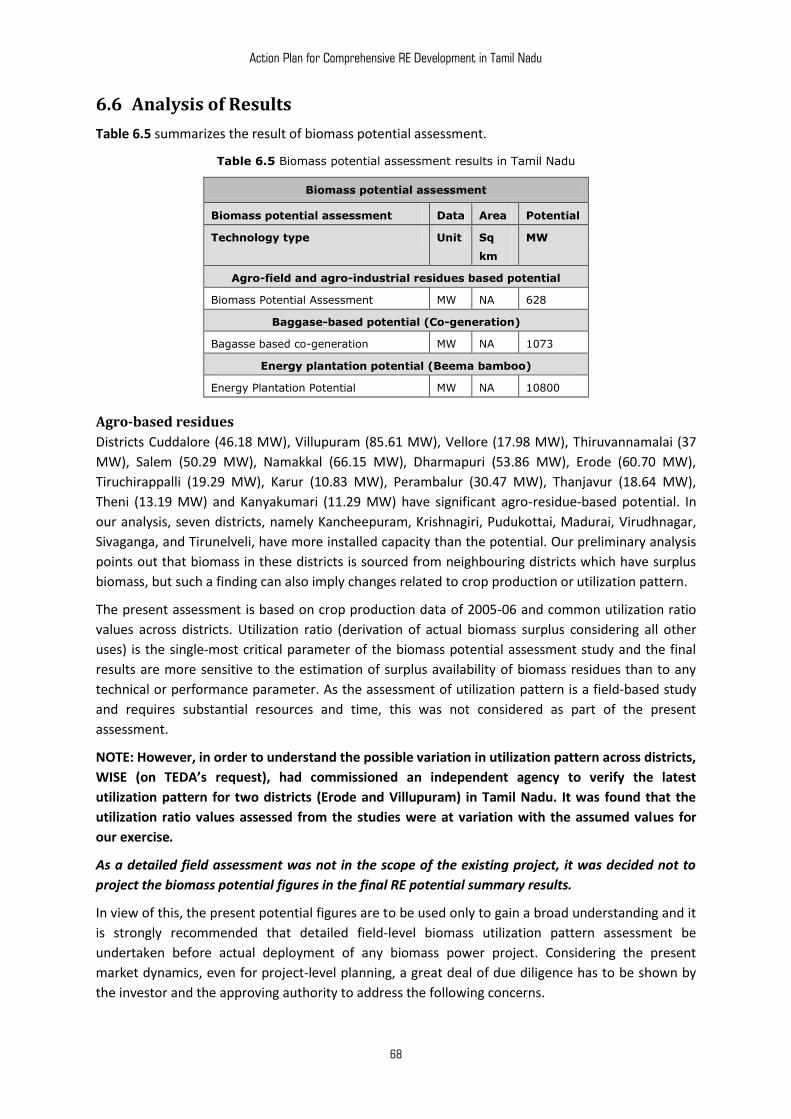
Action Plan for Comprehensive RE Development in Tamil Nadu
68
6.6 Analysis of Results
Table 6.5 summarizes the result of biomass potential assessment.
Table 6.5 Biomass potential assessment results in Tamil Nadu
Biomass potential assessment
Biomass potential assessment Data Area Potential
Technology type Unit Sq
km
MW
Agro-field and agro-industrial residues based potential
Biomass Potential Assessment MW NA 628
Baggase-based potential (Co-generation)
Bagasse based co-generation MW NA 1073
Energy plantation potential (Beema bamboo)
Energy Plantation Potential MW NA 10800
Agro-based residues
Districts Cuddalore (46.18 MW), Villupuram (85.61 MW), Vellore (17.98 MW), Thiruvannamalai (37
MW), Salem (50.29 MW), Namakkal (66.15 MW), Dharmapuri (53.86 MW), Erode (60.70 MW),
Tiruchirappalli (19.29 MW), Karur (10.83 MW), Perambalur (30.47 MW), Thanjavur (18.64 MW),
Theni (13.19 MW) and Kanyakumari (11.29 MW) have significant agro-residue-based potential. In
our analysis, seven districts, namely Kancheepuram, Krishnagiri, Pudukottai, Madurai, Virudhnagar,
Sivaganga, and Tirunelveli, have more installed capacity than the potential. Our preliminary analysis
points out that biomass in these districts is sourced from neighbouring districts which have surplus
biomass, but such a finding can also imply changes related to crop production or utilization pattern.
The present assessment is based on crop production data of 2005-06 and common utilization ratio
values across districts. Utilization ratio (derivation of actual biomass surplus considering all other
uses) is the single-most critical parameter of the biomass potential assessment study and the final
results are more sensitive to the estimation of surplus availability of biomass residues than to any
technical or performance parameter. As the assessment of utilization pattern is a field-based study
and requires substantial resources and time, this was not considered as part of the present
assessment.
NOTE: However, in order to understand the possible variation in utilization pattern across districts,
WISE (on TEDA’s request), had commissioned an independent agency to verify the latest
utilization pattern for two districts (Erode and Villupuram) in Tamil Nadu. It was found that the
utilization ratio values assessed from the studies were at variation with the assumed values for
our exercise.
As a detailed field assessment was not in the scope of the existing project, it was decided not to
project the biomass potential figures in the final RE potential summary results.
In view of this, the present potential figures are to be used only to gain a broad understanding and it
is strongly recommended that detailed field-level biomass utilization pattern assessment be
undertaken before actual deployment of any biomass power project. Considering the present
market dynamics, even for project-level planning, a great deal of due diligence has to be shown by
the investor and the approving authority to address the following concerns.
Action Plan for Comprehensive RE Development in Tamil Nadu
69
An overestimate of the surplus availability may force a ‘going concern’ to shift to a higher fossil-
fuel mix in the case of biomass non-availability, effectively rendering the whole approval and
subsidy process obsolete.
Clustering of biomass power plants within a small region will increase local competition for fuel
and will negatively impact the project generation/quality of generation and commercials.
Despite best efforts in estimating the field utilization of residues, commercial pressures actually
divert fodder for biomass generation or affect fodder availability adversely by increasing the
price of fodder.
All these concerns can only be addressed by strengthening the policy and approval processes.
Another way of partly mitigating adverse impacts can be to promote small-scale plants, initially
approving small plants in defined areas and encouraging the plants to expand after a certain period
of stipulated technical and successful commercial operation.
Bagasse-based co-generation
The total unexploited power potential from bagasse-based co-generation is estimated to be 1,073
MW, based on the data on crushed sugarcane and without considering any alternative use of
bagasse. Though it is known that bagasse is used in the paper industry, the actual availability could
not be factored in the present calculation due to unavailability of data related to present bagasse-
use in paper mills.
However, considering the power shortage in Tamil Nadu, it is more preferable to use bagasse for
power-generation, at least in the short run, until the power situation improves. Suitable policies
incentivizing the use of bagasse for power generation can help to ensure the diversion of bagasse for
the same.
Interestingly, from a long-term perspective, diversion of bagasse to the paper industry may help in
carbon sequestration (as paper is recyclable) as compared to direct combustion of bagasse (in
generation) and may be considered as a priority after the power situation improves.
Energy plantations
As for energy plantations, the total potential of 10,800 MW, assuming 100% wasteland and 2% non-
irrigated farmland, implies that there may be substantial potential from this technology. However,
considering the low land-use density of 1.25 MW/sq. km (even under intensive cultivation), it is
difficult to consider energy plantations as a competing technology vying for wasteland availability
like solar PV and CSP, which have a land density of 50 MW/sq. km and 35 MW/sq. km respectively.
The only advantage of energy plantations is in terms of employment generation as plantation
activity is labour intensive. However, it has to be understood that this employment will be generated
only for unskilled labour, with majority of semi-skilled and skilled workforce not finding any
employment. The deployment of other technologies would, however, have the potential to generate
employment for all categories of workforce, including the highly skilled category.
The best way to assess the impact and viability of energy plantations is to develop a pilot project.
Unless the productivity figures, water requirements, pre-processing requirements, technology
configuration and lifecycle commercials are known and validated, large-scale promotion of energy
plantations may not be recommended as it may lead to disturbances in land use patterns and affect
livelihoods and food security in the long-run.
***

Action Plan for Comprehensive RE Development in Tamil Nadu
70
Action Plan for Comprehensive RE Development in Tamil Nadu
71
7. Small Hydro Potential
There have been no state-specific small hydro power (SHP) potential-assessment studies in the
public domain in Tamil Nadu. A detailed small hydro potential assessment requires a huge chest of
resources including GIS maps, catchment modelling software, and tabulated data. The only large-
scale study in small hydro potential assessment was done by Alternate Hydro Energy Centre (AHEC)
of the Indian Institute of Technology (IIT) Roorkee. A second study by Central Board of Irrigation and
Power (CBIP) recommended the methodology for the assessment of dam-toe based small hydro
potential. Considering the scope of the project, these two studies considered for literature review
are highlighted in the next section.
7.1 Literature Review
The AHEC study titled, Optimizing Development of Small Hydel Resources in the Hilly Regions (13
Himalayan and sub-Himalayan states of India) [Ref 29] assessed the SHP potential of the identified
region and assessed the potential on run-of-the-river schemes using the following methodology.
(i) Identification of potential sites.
Information on possible locations of hydro sites was first collected from various state
government offices. Survey of India (SOI) topographic maps (1:50,000) of the nation’s Himalayan
region were used to identify potential small hydro sites. Potential sites, earlier identified by state
agencies, were also verified during this process.
In order to identify potential catchments for small hydropower generation, the following criteria
were adopted:
catchment area should be at least 10 km2;
channel should be perennial (SOI toposheets show perennial channels and streams in blue);
main channel should be 7-8 km long; and
availability of head should be at least 20 m.
(ii) Once the above basic criteria were satisfied, all potential catchments in all 13 Himalayan and
sub-Himalayan states (Jammu & Kashmir, Himachal Pradesh, Uttar Pradesh, Bihar, West Bengal,
Assam, Arunachal Pradesh, Manipur, Meghalaya, Mizoram, Nagaland, Sikkim and Tripura) were
delineated using SOI toposheets. After delineation of all potential catchments, information
related to individual catchments was entered in a spreadsheet programme (Lotus 1-2-3) for
presentation and for future use.
(iii) Computation of available head.
One of the major factors in assessing a potential small hydro site is the head available in the
catchment. To compute this information, the points on the main channel where the elevation
contours cross the channel were marked on the catchment drawing. In each catchment, lower
two-third length of the channel was considered for the determination of head (drop), since this
part of the channel carries maximum discharge. The information on available head was used to
evaluate its hydropower potential.
(iv) Development of regional and sub-regional flow duration curves for un-gauged catchments.
The discharge data for various streams (of varying length and quality) were collected from
various sources in the 13 states for the gauged small streams. Discharge data of only 102
Action Plan for Comprehensive RE Development in Tamil Nadu
72
catchments could be collected. Based on gauged stream data, flow duration estimates were
prepared for un-gauged streams.
(v) Estimation of hydro power potential.
For each catchment, hydropower potential was computed (assuming discharge levels of 50%,
75% and 90%).
The actual electrical power output of the scheme depends on how efficiently the turbine
converts water power into electrical power (a maximum efficiency of 80% is possible). Power
output is calculated using the standard formula.
P = 9.81 x Q x H x e
where
P = Output power in kW
the value 9.81 represents acceleration due to gravity in m/s2
Q = Flow rate measured in (m³/s)
H = gross head in meter (m)
e = conversion efficiency (%)
The study then went a step further and identified small hydro development clusters (many
potential sites located near each other) on a GIS map for encouraging private sector investors.
The second publication, Manual on planning and design of small hydro power [Ref 30]
recommended the following methodology for dam-toe based system, which broadly comprised
three main parts.
(i) Dam-toe based small hydro stations
1.1 Field investigations
Reconnaissance surveys
Meteorological surveys (rainfall, temperature, wind, etc.)
Hydrological survey for assessing the design head, design discharge, finalizing
installed capacity, daily lake level (daily inflow, daily discharge (10-year data), dam
features, downstream water levels, and water-release patterns.
Topographical survey for setting up an SHP plant at the toe of a dam (general plan
and layout of the irrigation dam, details at the intake, contour plan, spillway details,
stilling basin details, outlet area of the river/ canal sluice, confluence point of the
river sluice discharge with the main river, and site survey furnishing the details of
network of roads.
(ii) Analysis
The study considered the inflow, outflow, evaporation losses, reservoir levels at the
beginning and at the end of stipulated period and determined the average level in the
reservoir. The reservoir level for any capacity is determined from the area capacity curve of
the reservoir prepared with the help of a topographical survey. Evaporation losses were
computed based on the area of reservoir at average level and the evaporation losses in that
month. With the help of a tail water rating curve which indicates the tail water level at
Action Plan for Comprehensive RE Development in Tamil Nadu
73
various discharges, the gross head is computed by deducting the tail water level from the
average water in the reservoir. The output of the turbine varies with the head.
(iii) Evaluation of potential.
The output of the turbine varies with the head. In a reservoir scheme the head varies from a
maximum to a minimum. The output of the turbine at lower heads is computed by the
following formula or by the performance curve supplied by the manufacturers.
(P1/P2) = (H1/H2)3/2
where,
P1 = Turbine output in kW at rated head H1 (m)
P2 = Turbine output (kW) at the other head H2 (m).
Similarly, the efficiency of a turbine varies at different heads. The efficiency at various heads
is computed as per performance curve supplied by the manufacturers. After ascertaining the
efficiency, head, and discharge (limited to requirements of machine output at particular
head), the power potential is computed. Such a study is normally carried out for stretches of
10 consecutive days at a time.
The other method of assessing the dependability for small hydroelectric schemes is to plot
the following curve to arrive at a decision for economic installation:
Flow duration curve (discharge vs. percentage exceeded)
Head duration curve (head vs. percentage exceeded)
Energy curve (discharge vs. energy in kWh).
Summary of assumptions and findings from the literature review
Like other renewable energy sources, SHP potential cannot be predicted based on mapped resource
data and assumptions with regard to land use. Prior meteorological, topographical and hydrological
investigations are essential for arriving at the SHP potential. The most important consideration is
long-term (10-year) hydrological data. In case of run-of-the-river schemes, most of the time, the
potential locations fall within un-gauged catchments, where the determination of dependable flow
availability requires time and expert judgment. For un-gauged streams, in case of run-of-the-river
schemes, flow duration estimates were found to be extrapolated from available data. For e.g. AHEC
has developed flow duration curves for each climatic region in the 13 states, which itself is a
comprehensive work that involved three different departments of IIT Roorkee. The regional flow
duration exercise is covered in Volume II of the AHEC study report.
Furthermore, the AHEC study calculated the catchment areas using specialized software, hard
toposheets, specialized expertise, and some broad-based exclusions for selection of potential
catchment areas for run-of-the-river schemes. It is to be noted that the AHEC study spanned three
years, had more than three expert teams, and involved a cost of Rs 60 crore (US $ 18 million).
Determination of head for dam-toe type schemes is highly dependent on reservoir operations
(variation in full supply level and tail race water level) and is thus extremely site-specific, whereas for
run-of-the-river schemes, the head is determined based on topographic details along the stream.
The AHEC study calculated the head using standard area toposheets.
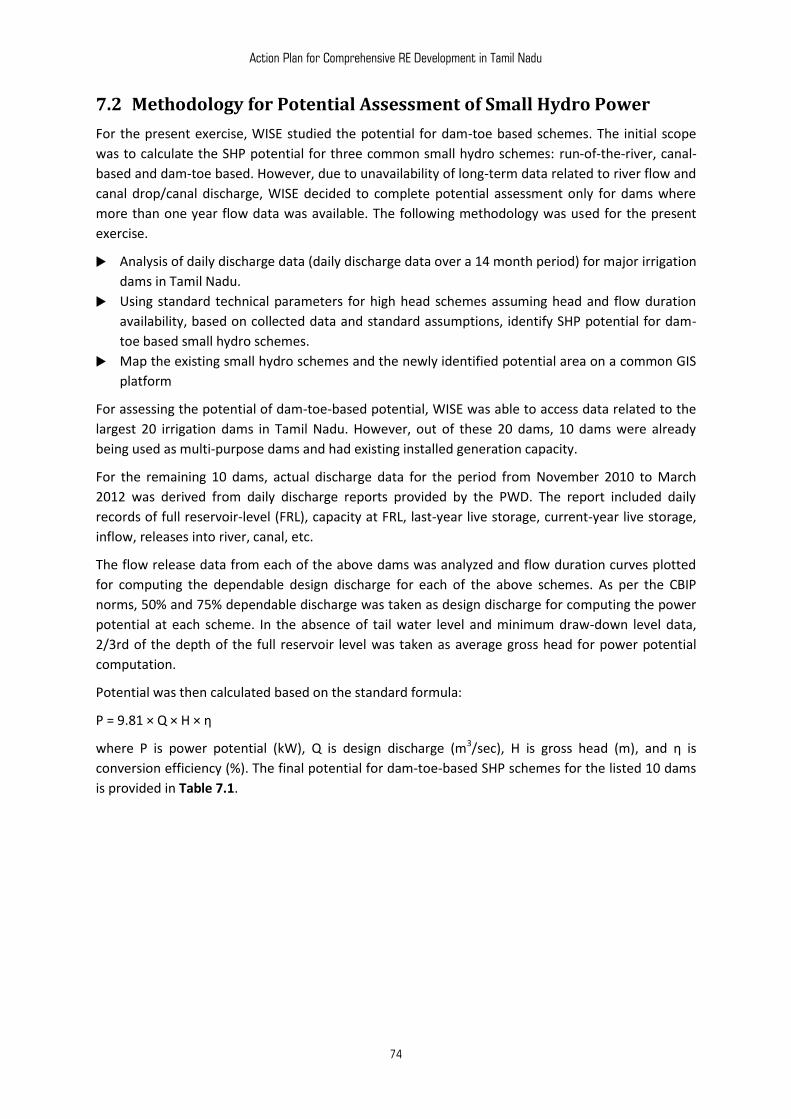
Action Plan for Comprehensive RE Development in Tamil Nadu
74
7.2 Methodology for Potential Assessment of Small Hydro Power
For the present exercise, WISE studied the potential for dam-toe based schemes. The initial scope
was to calculate the SHP potential for three common small hydro schemes: run-of-the-river, canal-
based and dam-toe based. However, due to unavailability of long-term data related to river flow and
canal drop/canal discharge, WISE decided to complete potential assessment only for dams where
more than one year flow data was available. The following methodology was used for the present
exercise.
Analysis of daily discharge data (daily discharge data over a 14 month period) for major irrigation
dams in Tamil Nadu.
Using standard technical parameters for high head schemes assuming head and flow duration
availability, based on collected data and standard assumptions, identify SHP potential for dam-
toe based small hydro schemes.
Map the existing small hydro schemes and the newly identified potential area on a common GIS
platform
For assessing the potential of dam-toe-based potential, WISE was able to access data related to the
largest 20 irrigation dams in Tamil Nadu. However, out of these 20 dams, 10 dams were already
being used as multi-purpose dams and had existing installed generation capacity.
For the remaining 10 dams, actual discharge data for the period from November 2010 to March
2012 was derived from daily discharge reports provided by the PWD. The report included daily
records of full reservoir-level (FRL), capacity at FRL, last-year live storage, current-year live storage,
inflow, releases into river, canal, etc.
The flow release data from each of the above dams was analyzed and flow duration curves plotted
for computing the dependable design discharge for each of the above schemes. As per the CBIP
norms, 50% and 75% dependable discharge was taken as design discharge for computing the power
potential at each scheme. In the absence of tail water level and minimum draw-down level data,
2/3rd of the depth of the full reservoir level was taken as average gross head for power potential
computation.
Potential was then calculated based on the standard formula:
P = 9.81 × Q × H × η
where P is power potential (kW), Q is design discharge (m3/sec), H is gross head (m), and η is
conversion efficiency (%). The final potential for dam-toe-based SHP schemes for the listed 10 dams
is provided in Table 7.1.
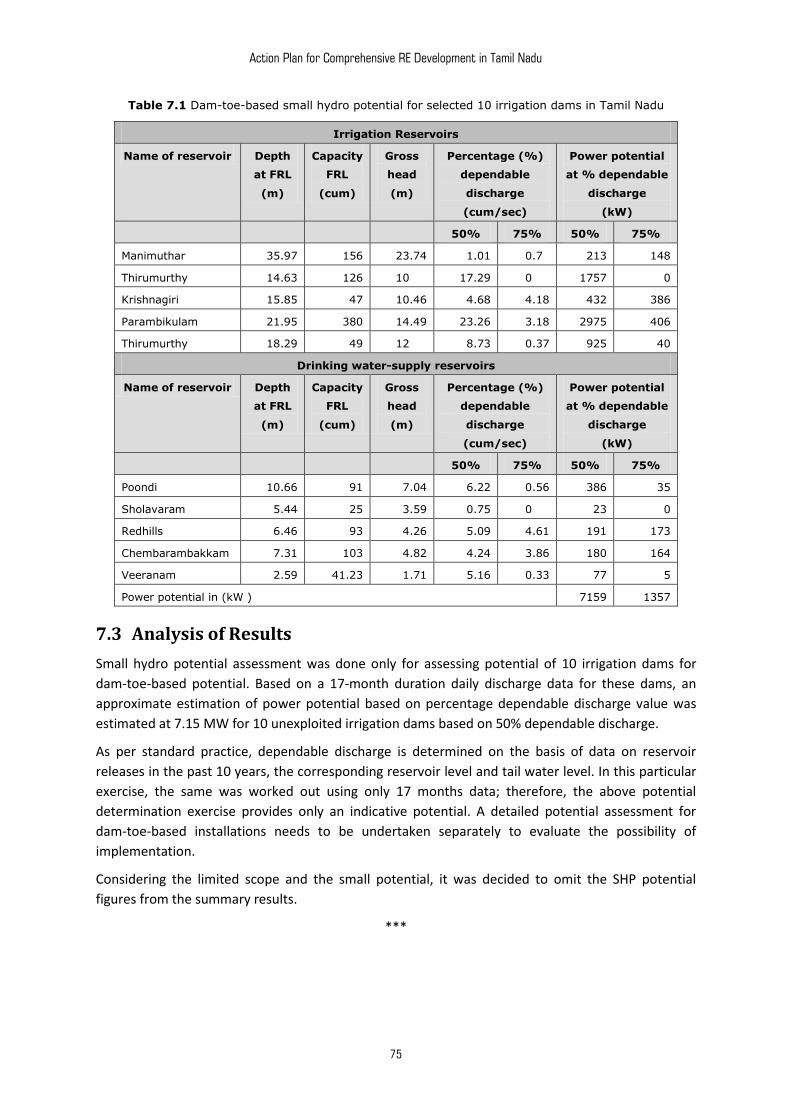
Action Plan for Comprehensive RE Development in Tamil Nadu
75
Table 7.1 Dam-toe-based small hydro potential for selected 10 irrigation dams in Tamil Nadu
Irrigation Reservoirs
Name of reservoir Depth
at FRL
(m)
Capacity
FRL
(cum)
Gross
head
(m)
Percentage (%)
dependable
discharge
(cum/sec)
Power potential
at % dependable
discharge
(kW)
50% 75% 50% 75%
Manimuthar 35.97 156 23.74 1.01 0.70 213 148
Thirumurthy 14.63 126 10.00 17.29 0.00 1757 0
Krishnagiri 15.85 47 10.46 4.68 4.18 432 386
Parambikulam 21.95 380 14.49 23.26 3.18 2975 406
Thirumurthy 18.29 49 12.00 8.73 0.37 925 40
Drinking water-supply reservoirs
Name of reservoir Depth
at FRL
(m)
Capacity
FRL
(cum)
Gross
head
(m)
Percentage (%)
dependable
discharge
(cum/sec)
Power potential
at % dependable
discharge
(kW)
50% 75% 50% 75%
Poondi 10.66 91 7.04 6.22 0.56 386 35
Sholavaram 5.44 25 3.59 0.75 0.00 23 0
Redhills 6.46 93 4.26 5.09 4.61 191 173
Chembarambakkam 7.31 103 4.82 4.24 3.86 180 164
Veeranam 2.59 41.23 1.71 5.16 0.33 77 5
Power potential in (kW ) 7159 1357
7.3 Analysis of Results
Small hydro potential assessment was done only for assessing potential of 10 irrigation dams for
dam-toe-based potential. Based on a 17-month duration daily discharge data for these dams, an
approximate estimation of power potential based on percentage dependable discharge value was
estimated at 7.15 MW for 10 unexploited irrigation dams based on 50% dependable discharge.
As per standard practice, dependable discharge is determined on the basis of data on reservoir
releases in the past 10 years, the corresponding reservoir level and tail water level. In this particular
exercise, the same was worked out using only 17 months data; therefore, the above potential
determination exercise provides only an indicative potential. A detailed potential assessment for
dam-toe-based installations needs to be undertaken separately to evaluate the possibility of
implementation.
Considering the limited scope and the small potential, it was decided to omit the SHP potential
figures from the summary results.
***

Action Plan for Comprehensive RE Development in Tamil Nadu
76
Action Plan for Comprehensive RE Development in Tamil Nadu
77
8. Summary of Renewable Potential Assessment
The present GIS-based renewable potential assessment is different from other GIS-based studies
mainly on three counts: use of base datasets that have strong data source credentials, transparent
methodology assumptions for potential assessment and creation of a GIS interface access portal for
wide dissemination. The most important base data considerations for a potential assessment
exercise are land use land cover resource data. To recap, the present assessment has used 2010-11
Tamil Nadu LULC data sourced from the National Remote Sensing Centre–Indian Space Research
Organization (NRSC–ISRO), which is the latest (2010-11) high resolution (62.88 m) LULC database
approved by the Government of India.
8.1 Total Grid-connected RE Potential
The resource data used for wind power assessment has been procured from AWS Truepower, USA,
which is a global leader in wind-resource assessment. Comparison of the modelled values with
measured data has shown average to good correspondence. The resource data used for grid-tied
solar potential assessment (PV and thermal) is sourced from NREL, USA. The NREL data is the official
reference source of MNRE.
All the other datasets have been taken from globally known sources. The methodology assumptions
as well as procedures have also been transparently described in Chapter 1 in order to dispel any
reservations related to the results of the GIS-based assessment methodology.
The potential assessment methodology was based on a detailed literature assessment exercise (as
detailed in Chapter 3) and the methodology derivation and assumption sets were validated by field
experts and independent reviewers. The methodologies have used well-defined land-use criteria
depending on technologies. For example, wind analysis includes five land-use categories: ‘kharif
only’, ‘rabi only’, ‘current fallow’, ‘non-forest scrubland’, and ‘wasteland’ and completely excludes
‘irrigated farmland’, ‘forests’ and all other land areas. In the case of solar potential assessment, only
‘wasteland’ is considered for analysis and all other land including ‘non-forest scrubland’ and ‘all
categories of farmland’ and ‘forests’ have been excluded. All the other technical assumptions are
also based on values derived from well-known sources and validated by technology specialists.
The results of the potential assessment based on the derived methodology assumptions and base
data are striking. Table 8.1 captures the final numbers of the assessed RE potential in the state.
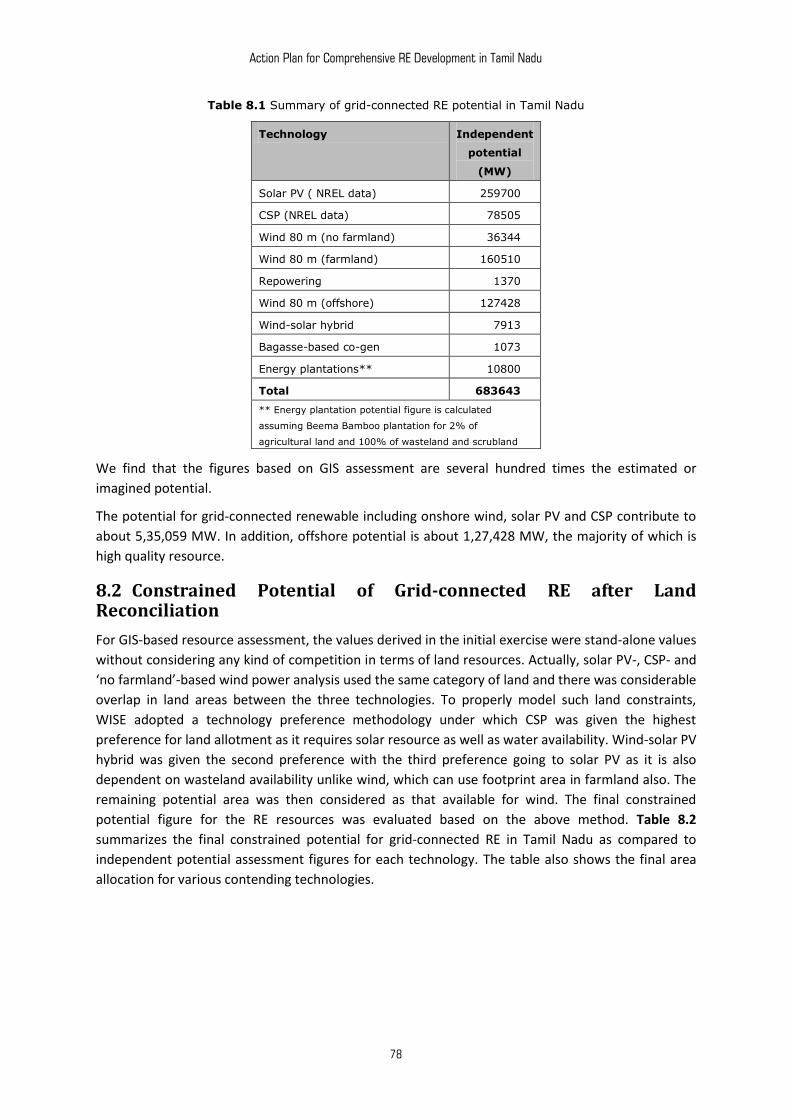
Action Plan for Comprehensive RE Development in Tamil Nadu
78
Table 8.1 Summary of grid-connected RE potential in Tamil Nadu
Technology Independent
potential
(MW)
Solar PV ( NREL data) 259700
CSP (NREL data) 78505
Wind 80 m (no farmland) 36344
Wind 80 m (farmland) 160510
Repowering 1370
Wind 80 m (offshore) 127428
Wind-solar hybrid 7913
Bagasse-based co-gen 1073
Energy plantations** 10800
Total 683643
** Energy plantation potential figure is calculated
assuming Beema Bamboo plantation for 2% of
agricultural land and 100% of wasteland and scrubland
We find that the figures based on GIS assessment are several hundred times the estimated or
imagined potential.
The potential for grid-connected renewable including onshore wind, solar PV and CSP contribute to
about 5,35,059 MW. In addition, offshore potential is about 1,27,428 MW, the majority of which is
high quality resource.
8.2 Constrained Potential of Grid-connected RE after Land Reconciliation
For GIS-based resource assessment, the values derived in the initial exercise were stand-alone values
without considering any kind of competition in terms of land resources. Actually, solar PV-, CSP- and
‘no farmland’-based wind power analysis used the same category of land and there was considerable
overlap in land areas between the three technologies. To properly model such land constraints,
WISE adopted a technology preference methodology under which CSP was given the highest
preference for land allotment as it requires solar resource as well as water availability. Wind-solar PV
hybrid was given the second preference with the third preference going to solar PV as it is also
dependent on wasteland availability unlike wind, which can use footprint area in farmland also. The
remaining potential area was then considered as that available for wind. The final constrained
potential figure for the RE resources was evaluated based on the above method. Table 8.2
summarizes the final constrained potential for grid-connected RE in Tamil Nadu as compared to
independent potential assessment figures for each technology. The table also shows the final area
allocation for various contending technologies.
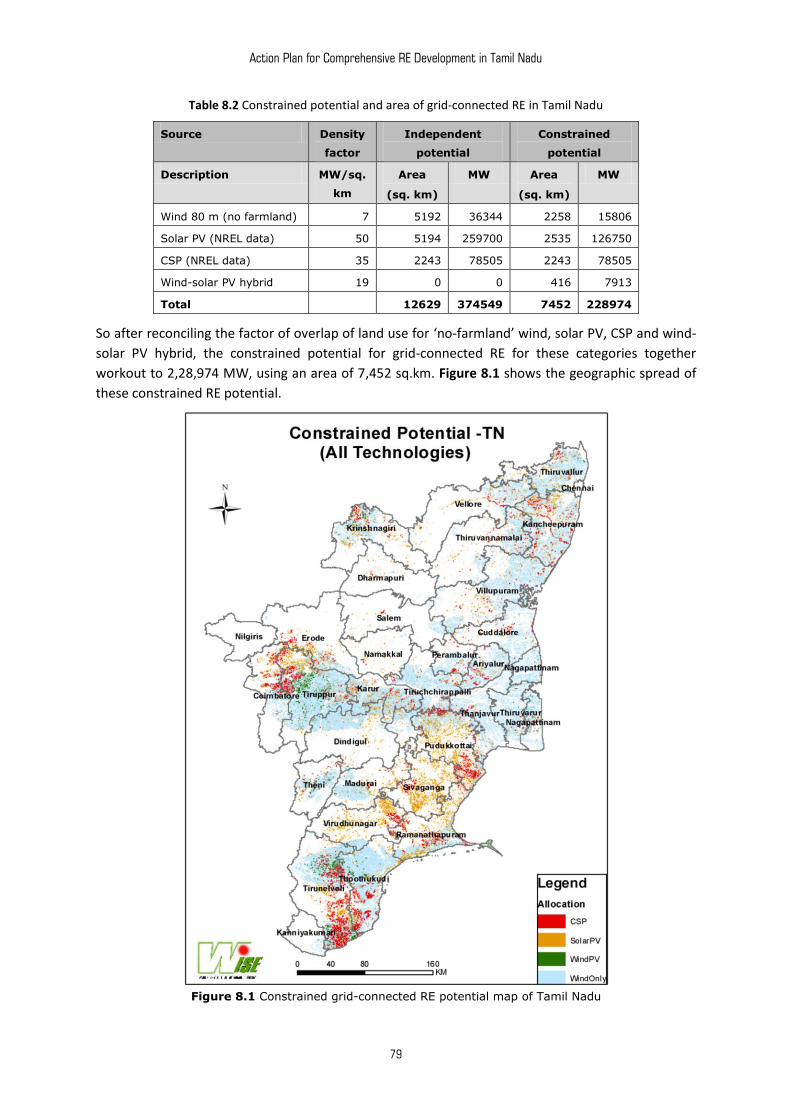
Action Plan for Comprehensive RE Development in Tamil Nadu
79
Table 8.2 Constrained potential and area of grid-connected RE in Tamil Nadu
Source Density
factor
Independent
potential
Constrained
potential
Description MW/sq.
km
Area
(sq. km)
MW Area
(sq. km)
MW
Wind 80 m (no farmland) 7 5192 36344 2258 15806
Solar PV (NREL data) 50 5194 259700 2535 126750
CSP (NREL data) 35 2243 78505 2243 78505
Wind-solar PV hybrid 19 0 0 416 7913
Total 12629 374549 7452 228974
So after reconciling the factor of overlap of land use for ‘no-farmland’ wind, solar PV, CSP and wind-
solar PV hybrid, the constrained potential for grid-connected RE for these categories together
workout to 2,28,974 MW, using an area of 7,452 sq.km. Figure 8.1 shows the geographic spread of
these constrained RE potential.
Figure 8.1 Constrained grid-connected RE potential map of Tamil Nadu
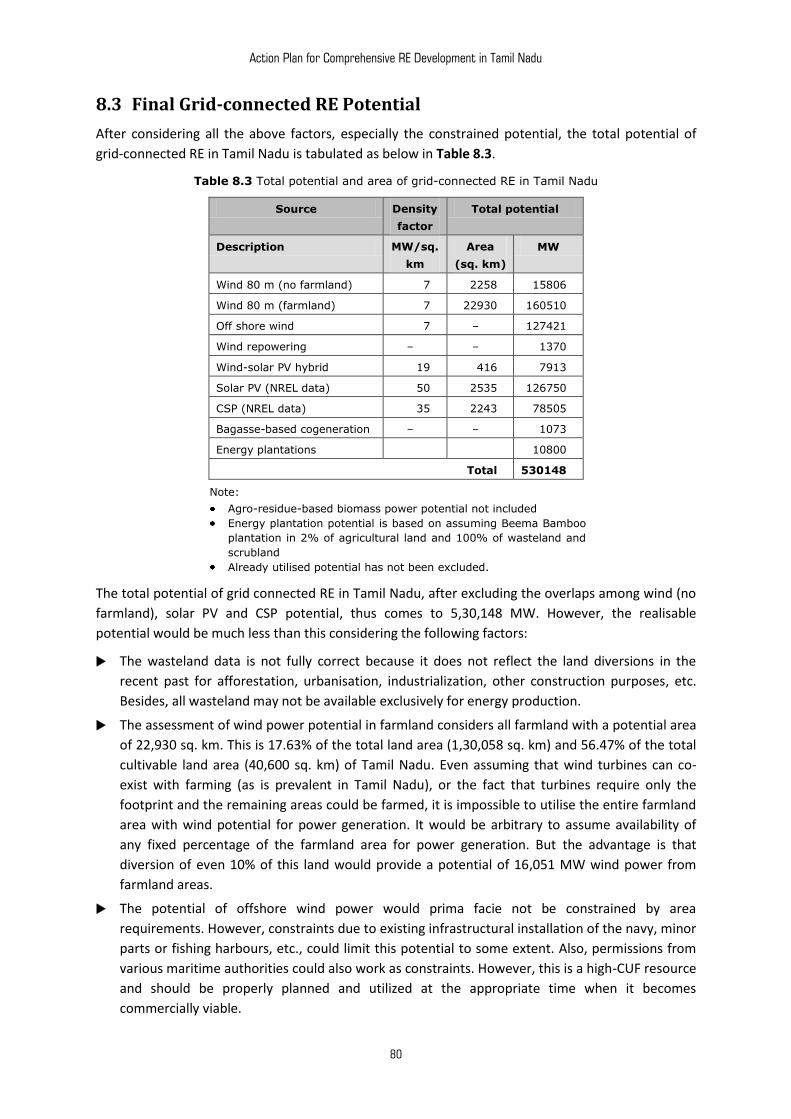
Action Plan for Comprehensive RE Development in Tamil Nadu
80
8.3 Final Grid-connected RE Potential
After considering all the above factors, especially the constrained potential, the total potential of
grid-connected RE in Tamil Nadu is tabulated as below in Table 8.3.
Table 8.3 Total potential and area of grid-connected RE in Tamil Nadu
Source Density
factor
Total potential
Description MW/sq.
km
Area
(sq. km)
MW
Wind 80 m (no farmland) 7 2258 15806
Wind 80 m (farmland) 7 22930 160510
Off shore wind 7 – 127421
Wind repowering – – 1370
Wind-solar PV hybrid 19 416 7913
Solar PV (NREL data) 50 2535 126750
CSP (NREL data) 35 2243 78505
Bagasse-based cogeneration – – 1073
Energy plantations 10800
Total 530148
Note:
Agro-residue-based biomass power potential not included
Energy plantation potential is based on assuming Beema Bamboo
plantation in 2% of agricultural land and 100% of wasteland and
scrubland
Already utilised potential has not been excluded.
The total potential of grid connected RE in Tamil Nadu, after excluding the overlaps among wind (no
farmland), solar PV and CSP potential, thus comes to 5,30,148 MW. However, the realisable
potential would be much less than this considering the following factors:
The wasteland data is not fully correct because it does not reflect the land diversions in the
recent past for afforestation, urbanisation, industrialization, other construction purposes, etc.
Besides, all wasteland may not be available exclusively for energy production.
The assessment of wind power potential in farmland considers all farmland with a potential area
of 22,930 sq. km. This is 17.63% of the total land area (1,30,058 sq. km) and 56.47% of the total
cultivable land area (40,600 sq. km) of Tamil Nadu. Even assuming that wind turbines can co-
exist with farming (as is prevalent in Tamil Nadu), or the fact that turbines require only the
footprint and the remaining areas could be farmed, it is impossible to utilise the entire farmland
area with wind potential for power generation. It would be arbitrary to assume availability of
any fixed percentage of the farmland area for power generation. But the advantage is that
diversion of even 10% of this land would provide a potential of 16,051 MW wind power from
farmland areas.
The potential of offshore wind power would prima facie not be constrained by area
requirements. However, constraints due to existing infrastructural installation of the navy, minor
parts or fishing harbours, etc., could limit this potential to some extent. Also, permissions from
various maritime authorities could also work as constraints. However, this is a high-CUF resource
and should be properly planned and utilized at the appropriate time when it becomes
commercially viable.
Action Plan for Comprehensive RE Development in Tamil Nadu
81
Re-powering of old wind power projects is a potential source which can be tapped immediately
if a suitable policy is put in place.
Wind-solar PV hybrid projects are possible in ‘no-farmland’ areas. But each project should be
carefully planned after studying the shading effect of wind turbine blades in each location.
Considering the recent fall in prices of solar PV, this is a resource available in abundance and
could be tapped in an accelerated way, subject to other considerations of grid balancing, etc.
CSP development should be planned to time it with commercial viability since high prices are still
a constraint in developing this technology. Right now we would recommend establishment of a
few pilot projects. CSP projects should invariably be planned with thermal storage since in an
aggressive RE addition scenario storage would be essential to balancing the grid. Planned
development of CSP would be critical for the future from this perspective.
Agro-residue-based biomass potential has been excluded for reasons of uncertainty of data.
Bagasse-based power generation potential is realisable.
The potential of bio-energy plantations have been worked out on the basis of 2% of farmland
being made available, as well as the entire wasteland. However, this needs to be studied in more
detail because the same wasteland has been considered in working out the potential of wind
power, solar PV and CSP. Intercropping in wind project areas is possible, whereas for solar
projects the land has to be cleared of vegetation. Besides, the land density of this source is 1.25
MW per sq. km which is very poor compared to 50 MW per sq. km for solar PV, and 35 MW per
sq. km for CSP. In addition, Bamboo requires water to give optimal biomass output which may
not be forthcoming in Tamil Nadu wastelands. So first, we would recommend few pilot projects
which should be studied in detail, before going for any large-scale development.
8.4 Off-grid Potential
The off-grid potential in Tamil Nadu is also substantial. Table 8.4 shows Tamil Nadu’s off-grid
potential.
Table 8.4 Off-grid potential in Tamil Nadu
Off-grid
Rooftop PV MW 29642
Solar water heating million sq m 16.15
Solar pumping MW 7041
It can be seen that the potential of rooftop PV and substitution potential for solar pumping together
account for about 37,000 MW, more than twice the existing installed capacity in the state.
To conclude, the implementable RE potential for Tamil Nadu is not a constraint for creating a future
energy secure renewable-power-based economy in the state.
8.5 Total Realisable RE Potential
Even after discounting various factors, it is clear that it is possible for Tamil Nadu to power its
economy from renewable sources of power. Enough potential is available. Issues of grid balancing,
storage, water availability, etc., will have to be tackled. Energy conservation, industrial process heat,
decentralised power generation on rooftops and for water pumping, etc., will provide enough RE
potential even upto 2050.

Action Plan for Comprehensive RE Development in Tamil Nadu
82
8.6 GIS-based Portal for RE Resources in Tamil Nadu
It was further felt that the real benefit of the GIS analysis will only accrue if the findings are made
available to potential RE investors, nodal agencies, and other sector stakeholders. In view of this, it
was decided to conceptualize and develop a dedicated portal that provides access to the GIS data
and allows data download for selected spatial locations. The proposed portal has used Google API as
a base layer with Geoserver to provide individual layer visualization and zoom enablers with data
download facility. It is expected that the portal will enable the user to see the final potential maps of
all the technologies, in addition to allowing the user to visualize and download taluka-level data for
grid-tied wind and solar power technology layers. The portal, which will be freely accessible to
registered users, will be available through a link on WISE’s website www.wisein.org.
***
Action Plan for Comprehensive RE Development in Tamil Nadu
83
PART – III
ACCELERATED RE CAPACITY ADDITION: THE TWO SCENARIOS, CHALLENGES & SOLUTIONS

Action Plan for Comprehensive RE Development in Tamil Nadu
84
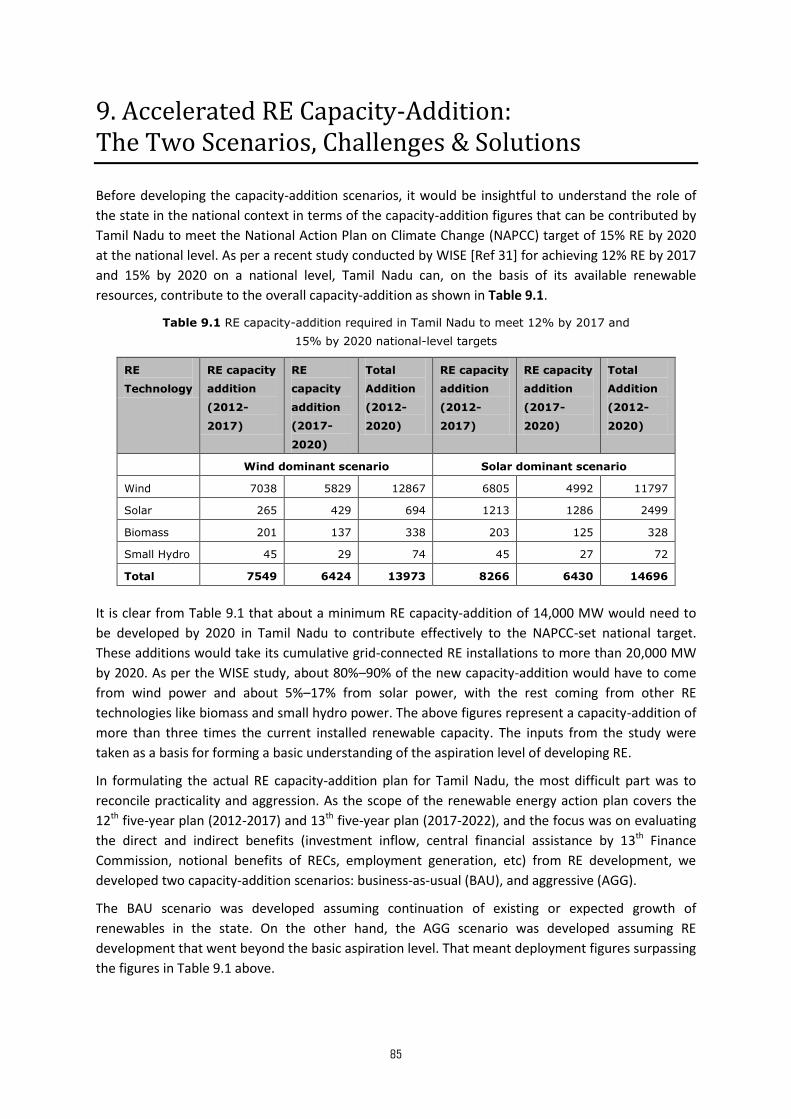
Action Plan for Comprehensive RE Development in Tamil Nadu
85
9. Accelerated RE Capacity-Addition: The Two Scenarios, Challenges & Solutions
Before developing the capacity-addition scenarios, it would be insightful to understand the role of
the state in the national context in terms of the capacity-addition figures that can be contributed by
Tamil Nadu to meet the National Action Plan on Climate Change (NAPCC) target of 15% RE by 2020
at the national level. As per a recent study conducted by WISE [Ref 31] for achieving 12% RE by 2017
and 15% by 2020 on a national level, Tamil Nadu can, on the basis of its available renewable
resources, contribute to the overall capacity-addition as shown in Table 9.1.
Table 9.1 RE capacity-addition required in Tamil Nadu to meet 12% by 2017 and
15% by 2020 national-level targets
RE
Technology
RE capacity
addition
(2012-
2017)
RE
capacity
addition
(2017-
2020)
Total
Addition
(2012-
2020)
RE capacity
addition
(2012-
2017)
RE capacity
addition
(2017-
2020)
Total
Addition
(2012-
2020)
Wind dominant scenario Solar dominant scenario
Wind 7038 5829 12867 6805 4992 11797
Solar 265 429 694 1213 1286 2499
Biomass 201 137 338 203 125 328
Small Hydro 45 29 74 45 27 72
Total 7549 6424 13973 8266 6430 14696
It is clear from Table 9.1 that about a minimum RE capacity-addition of 14,000 MW would need to
be developed by 2020 in Tamil Nadu to contribute effectively to the NAPCC-set national target.
These additions would take its cumulative grid-connected RE installations to more than 20,000 MW
by 2020. As per the WISE study, about 80%–90% of the new capacity-addition would have to come
from wind power and about 5%–17% from solar power, with the rest coming from other RE
technologies like biomass and small hydro power. The above figures represent a capacity-addition of
more than three times the current installed renewable capacity. The inputs from the study were
taken as a basis for forming a basic understanding of the aspiration level of developing RE.
In formulating the actual RE capacity-addition plan for Tamil Nadu, the most difficult part was to
reconcile practicality and aggression. As the scope of the renewable energy action plan covers the
12th five-year plan (2012-2017) and 13th five-year plan (2017-2022), and the focus was on evaluating
the direct and indirect benefits (investment inflow, central financial assistance by 13th Finance
Commission, notional benefits of RECs, employment generation, etc) from RE development, we
developed two capacity-addition scenarios: business-as-usual (BAU), and aggressive (AGG).
The BAU scenario was developed assuming continuation of existing or expected growth of
renewables in the state. On the other hand, the AGG scenario was developed assuming RE
development that went beyond the basic aspiration level. That meant deployment figures surpassing
the figures in Table 9.1 above.
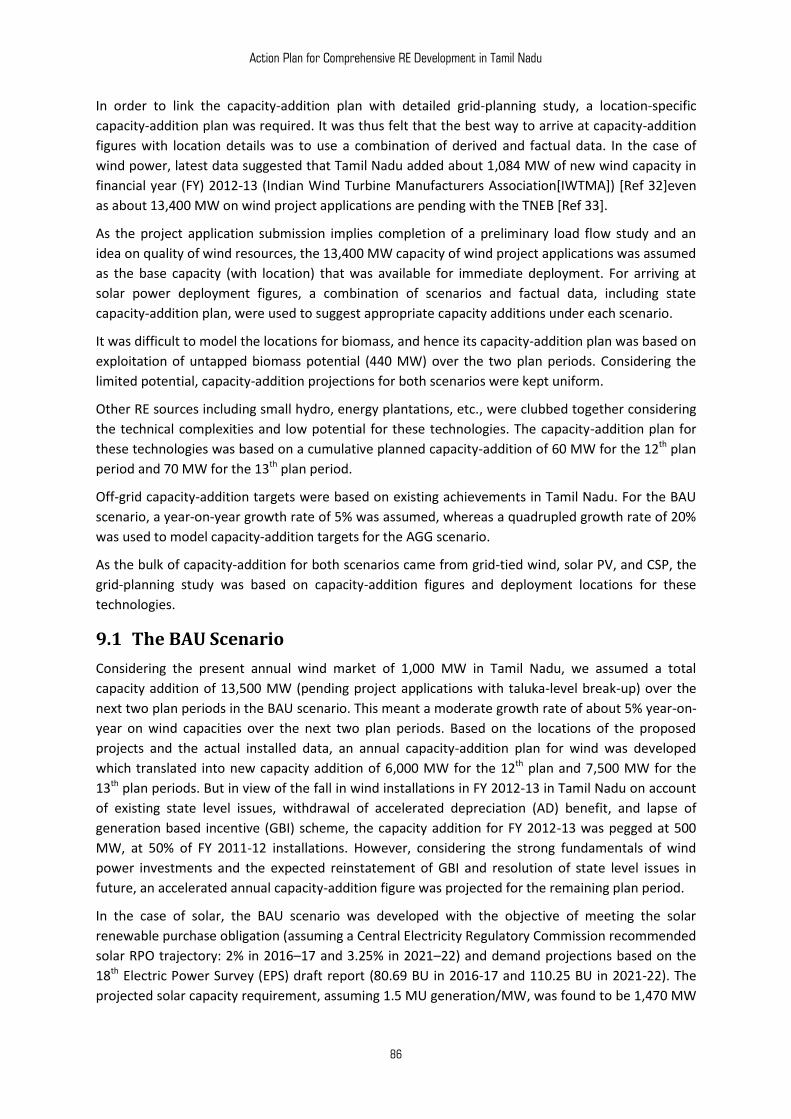
Action Plan for Comprehensive RE Development in Tamil Nadu
86
In order to link the capacity-addition plan with detailed grid-planning study, a location-specific
capacity-addition plan was required. It was thus felt that the best way to arrive at capacity-addition
figures with location details was to use a combination of derived and factual data. In the case of
wind power, latest data suggested that Tamil Nadu added about 1,084 MW of new wind capacity in
financial year (FY) 2012-13 (Indian Wind Turbine Manufacturers Association[IWTMA]) [Ref 32]even
as about 13,400 MW on wind project applications are pending with the TNEB [Ref 33].
As the project application submission implies completion of a preliminary load flow study and an
idea on quality of wind resources, the 13,400 MW capacity of wind project applications was assumed
as the base capacity (with location) that was available for immediate deployment. For arriving at
solar power deployment figures, a combination of scenarios and factual data, including state
capacity-addition plan, were used to suggest appropriate capacity additions under each scenario.
It was difficult to model the locations for biomass, and hence its capacity-addition plan was based on
exploitation of untapped biomass potential (440 MW) over the two plan periods. Considering the
limited potential, capacity-addition projections for both scenarios were kept uniform.
Other RE sources including small hydro, energy plantations, etc., were clubbed together considering
the technical complexities and low potential for these technologies. The capacity-addition plan for
these technologies was based on a cumulative planned capacity-addition of 60 MW for the 12th plan
period and 70 MW for the 13th plan period.
Off-grid capacity-addition targets were based on existing achievements in Tamil Nadu. For the BAU
scenario, a year-on-year growth rate of 5% was assumed, whereas a quadrupled growth rate of 20%
was used to model capacity-addition targets for the AGG scenario.
As the bulk of capacity-addition for both scenarios came from grid-tied wind, solar PV, and CSP, the
grid-planning study was based on capacity-addition figures and deployment locations for these
technologies.
9.1 The BAU Scenario
Considering the present annual wind market of 1,000 MW in Tamil Nadu, we assumed a total
capacity addition of 13,500 MW (pending project applications with taluka-level break-up) over the
next two plan periods in the BAU scenario. This meant a moderate growth rate of about 5% year-on-
year on wind capacities over the next two plan periods. Based on the locations of the proposed
projects and the actual installed data, an annual capacity-addition plan for wind was developed
which translated into new capacity addition of 6,000 MW for the 12th plan and 7,500 MW for the
13th plan periods. But in view of the fall in wind installations in FY 2012-13 in Tamil Nadu on account
of existing state level issues, withdrawal of accelerated depreciation (AD) benefit, and lapse of
generation based incentive (GBI) scheme, the capacity addition for FY 2012-13 was pegged at 500
MW, at 50% of FY 2011-12 installations. However, considering the strong fundamentals of wind
power investments and the expected reinstatement of GBI and resolution of state level issues in
future, an accelerated annual capacity-addition figure was projected for the remaining plan period.
In the case of solar, the BAU scenario was developed with the objective of meeting the solar
renewable purchase obligation (assuming a Central Electricity Regulatory Commission recommended
solar RPO trajectory: 2% in 2016–17 and 3.25% in 2021–22) and demand projections based on the
18th Electric Power Survey (EPS) draft report (80.69 BU in 2016-17 and 110.25 BU in 2021-22). The
projected solar capacity requirement, assuming 1.5 MU generation/MW, was found to be 1,470 MW
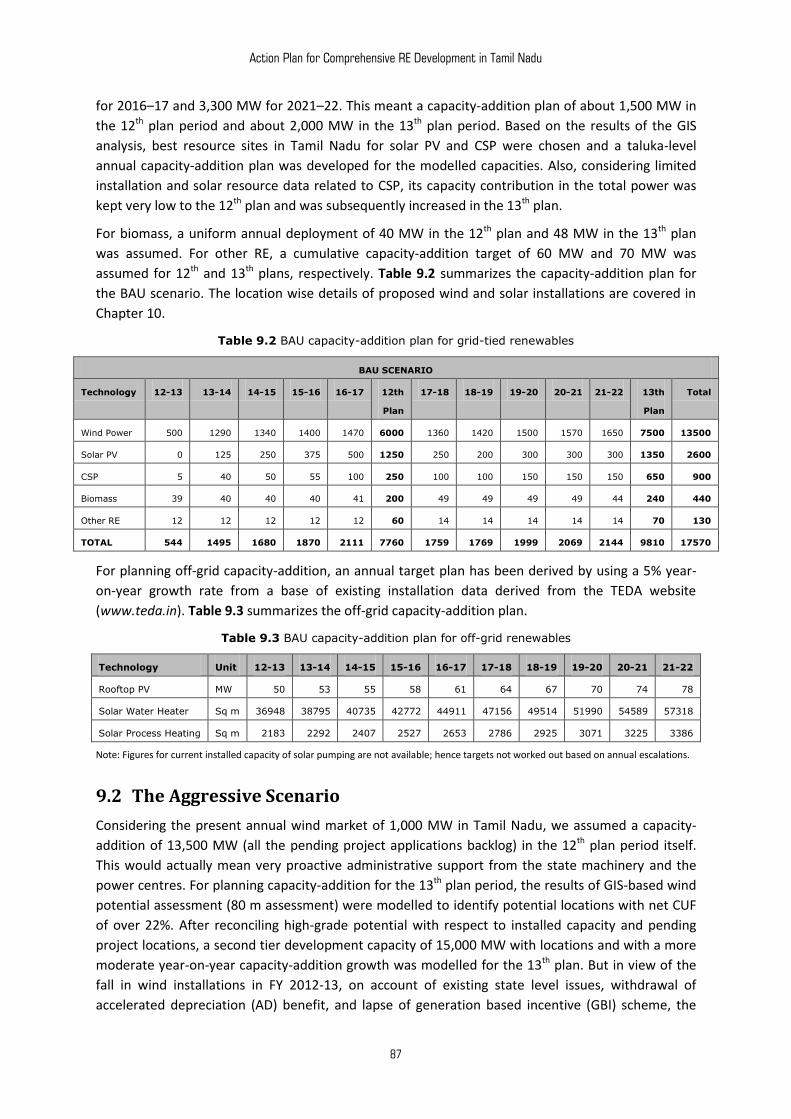
Action Plan for Comprehensive RE Development in Tamil Nadu
87
for 2016–17 and 3,300 MW for 2021–22. This meant a capacity-addition plan of about 1,500 MW in
the 12th plan period and about 2,000 MW in the 13th plan period. Based on the results of the GIS
analysis, best resource sites in Tamil Nadu for solar PV and CSP were chosen and a taluka-level
annual capacity-addition plan was developed for the modelled capacities. Also, considering limited
installation and solar resource data related to CSP, its capacity contribution in the total power was
kept very low to the 12th plan and was subsequently increased in the 13th plan.
For biomass, a uniform annual deployment of 40 MW in the 12th plan and 48 MW in the 13th plan
was assumed. For other RE, a cumulative capacity-addition target of 60 MW and 70 MW was
assumed for 12th and 13th plans, respectively. Table 9.2 summarizes the capacity-addition plan for
the BAU scenario. The location wise details of proposed wind and solar installations are covered in
Chapter 10.
Table 9.2 BAU capacity-addition plan for grid-tied renewables
BAU SCENARIO
Technology 12-13 13-14 14-15 15-16 16-17 12th
Plan
17-18 18-19 19-20 20-21 21-22 13th
Plan
Total
Wind Power 500 1290 1340 1400 1470 6000 1360 1420 1500 1570 1650 7500 13500
Solar PV 0 125 250 375 500 1250 250 200 300 300 300 1350 2600
CSP 5 40 50 55 100 250 100 100 150 150 150 650 900
Biomass 39 40 40 40 41 200 49 49 49 49 44 240 440
Other RE 12 12 12 12 12 60 14 14 14 14 14 70 130
TOTAL 544 1495 1680 1870 2111 7760 1759 1769 1999 2069 2144 9810 17570
For planning off-grid capacity-addition, an annual target plan has been derived by using a 5% year-
on-year growth rate from a base of existing installation data derived from the TEDA website
(www.teda.in). Table 9.3 summarizes the off-grid capacity-addition plan.
Table 9.3 BAU capacity-addition plan for off-grid renewables
Technology Unit 12-13 13-14 14-15 15-16 16-17 17-18 18-19 19-20 20-21 21-22
Rooftop PV MW 50 53 55 58 61 64 67 70 74 78
Solar Water Heater Sq m 36948 38795 40735 42772 44911 47156 49514 51990 54589 57318
Solar Process Heating Sq m 2183 2292 2407 2527 2653 2786 2925 3071 3225 3386
Note: Figures for current installed capacity of solar pumping are not available; hence targets not worked out based on annual escalations.
9.2 The Aggressive Scenario
Considering the present annual wind market of 1,000 MW in Tamil Nadu, we assumed a capacity-
addition of 13,500 MW (all the pending project applications backlog) in the 12th plan period itself.
This would actually mean very proactive administrative support from the state machinery and the
power centres. For planning capacity-addition for the 13th plan period, the results of GIS-based wind
potential assessment (80 m assessment) were modelled to identify potential locations with net CUF
of over 22%. After reconciling high-grade potential with respect to installed capacity and pending
project locations, a second tier development capacity of 15,000 MW with locations and with a more
moderate year-on-year capacity-addition growth was modelled for the 13th plan. But in view of the
fall in wind installations in FY 2012-13, on account of existing state level issues, withdrawal of
accelerated depreciation (AD) benefit, and lapse of generation based incentive (GBI) scheme, the
Action Plan for Comprehensive RE Development in Tamil Nadu
88
capacity addition for FY 2012-13 was pegged at 750 MW, at 75% of FY 2011-12 installations.
However, considering the strong fundamentals of wind power investments and the expected
reinstatement of GBI and resolution of state level issues in future, an accelerated annual capacity
addition figures were projected for the remaining plan period.
For the AGG scenario, solar capacity-addition was linked to the government plan of developing solar
capacity of 3,000 MW in the first four years of the 12th plan period. For the 13th plan a more
moderate or flat yearly growth rate was assumed to model a capacity of 4,500 MW in the 13th plan.
Also considering limited installation and solar resource data related to CSP, its capacity contribution
to the total power was kept very low in the 12th plan period and was subsequently increased in the
13th plan.
For biomass, a uniform annual deployment of 40 MW in the 12th plan and 48 MW in the 13th plan
was assumed. For other RE, a cumulative capacity-addition target of 60 MW and 70 MW was
assumed for 12th and 13th plans, respectively. Table 9.4 summarizes the capacity-addition plan for
the AGG scenario. The location wise details of proposed wind and solar installations are covered in
Chapter 10.
Table 9.4 AGG capacity-addition plan for grid-tied renewables
AGG SCENARIO
Technology 12-13 13-14 14-15 15-16 16-17 12th
Plan
17-18 18-19 19-20 20-21 21-22 13th
Plan
Total
Wind power 750 3000 3100 3250 3300 13400 3000 3000 3000 3000 3000 15000 28400
Solar PV 70 190 300 425 625 2600 625 625 750 750 750 3500 6100
CSP 5 20 75 150 150 400 150 150 175 225 300 1000 1400
Biomass 39 40 40 40 41 200 49 49 49 49 44 240 440
Other RE 12 12 12 12 12 60 14 14 14 14 14 70 130
TOTAL 864 3250 3515 3865 4116 16660 3824 3824 3974 4024 4094 19810 36470
For planning off-grid capacity addition, the annual target plan is derived by using a 20% year-on-year
growth rate from a base of existing installation data derived from TEDA website (www.teda.in).
Table 9.5 summarizes the off-grid capacity-addition plan.
Table 9.5 AGG capacity addition-plan for off-grid renewables
Technology Unit 12-13 13-14 14-15 15-16 16-17 17-18 18-19 19-20 20-21 21-22
Rooftop PV MW 50 60 72 86.4 104 124 149 179 215 258
Solar Water
Heater
Sq m 36948 44338 53205 63846 76615 91938 110326 132391 158870 190644
Solar Process
Heating
Sq m 2182.8 2619 3143 3772 4526 5432 6518 7821 9386 11263
Note: Figures for current installed capacity of solar pumping are not available; hence targets not worked out based on annual escalations.
As the BAU scenario is an extrapolation of current RE development and the action plan aims to
expand the limit of renewables by highlighting the extent of possibilities, the AGG capacity-
addition plan was taken as the basis for action plan development, as elaborated in Chapters 11
and 12 of this report.
Action Plan for Comprehensive RE Development in Tamil Nadu
89
9.3 Challenges and Solutions
The proposed capacity-addition plan is essentially a modelling exercise and therefore, before
drawing the development path required for capacity deployment, it is important to see if it can be
realistically justified. At the same time, analyzing the proposed plan scenario from the perspective of
present capabilities will only be half an exercise. To fully fathom the extent of possibilities, we need
to take the expected future developments also into consideration.
The following sections try to assess the technical and commercial challenges and possible solutions
for deploying the aggressive capacity addition plan.
9.3.1 RE integration into the grid
The major problems in integration of renewables are more a result of perception gaps than a result
of real technical constraints. For a sector that is tuned to a centralized generation model with
defined system behaviour, switching to renewables requires a paradigm shift. The following
narrative highlights the specific issues that arise from this mindset and tries to look at the problems
and possible solutions for aggressive RE integration.
Grid transmission planning process
At present, there is no provision in the present long-term transmission planning process to
incorporate transmission and evacuation requirements of renewable energy. This is a major area of
concern simply because RE projects (wind, solar and biomass) have significantly low gestation
periods and the slow pace of grid infrastructure creation, which is based on large gestation periods
of conventional projects, will always mean that new transmission capacities will not be adequate to
accommodate the rapidly building RE portfolio.
However, the need for an integrated transmission planning process is being felt at the highest level.
The Ministry of Power has constituted a committee to look into aspects related to renewable energy
development through legislative and policy changes. The terms of reference (ToR) for the committee
acknowledge that planning for conventional transmission has been done keeping conventional
sources in mind and seeks that the committee make demand-specific mentions in the Electricity Act,
2003, to factor in likely RE capacity in transmission planning [Ref 34]. This major shift in outlook has
very significant implications for Tamil Nadu as it will mean that transmission planning at the state
and Central Transmission Utility (CTU) level (inter-state and inter-regional corridors) will factor in the
transmission requirements of new renewable capacity additions in the state. In the long-term, this
will allow Tamil Nadu to evacuate renewable generation and import/export power from a wider
pool.
Generation variability
Typically the contribution of wind during peak demand period in Tamil Nadu varies from about 2500
MW (high-wind season) to about 100 MW (low-wind season). In fact, the contribution of wind during
the high-wind season is on many days more than that from state-owned thermal power stations.
This poses significant challenges in balancing generation between various technologies and may lead
to backing down of wind capacities in high-wind season, when system operators see more merit in
running thermal power plants at high plant-load factors (PLFs) instead of allowing wind to meet the
demand.
We analyzed Tamil Nadu state load dispatch centre reports for two dates (the 10th and the 20th of
each month) of three off-wind months (February, March, April) and three high-wind months (June,
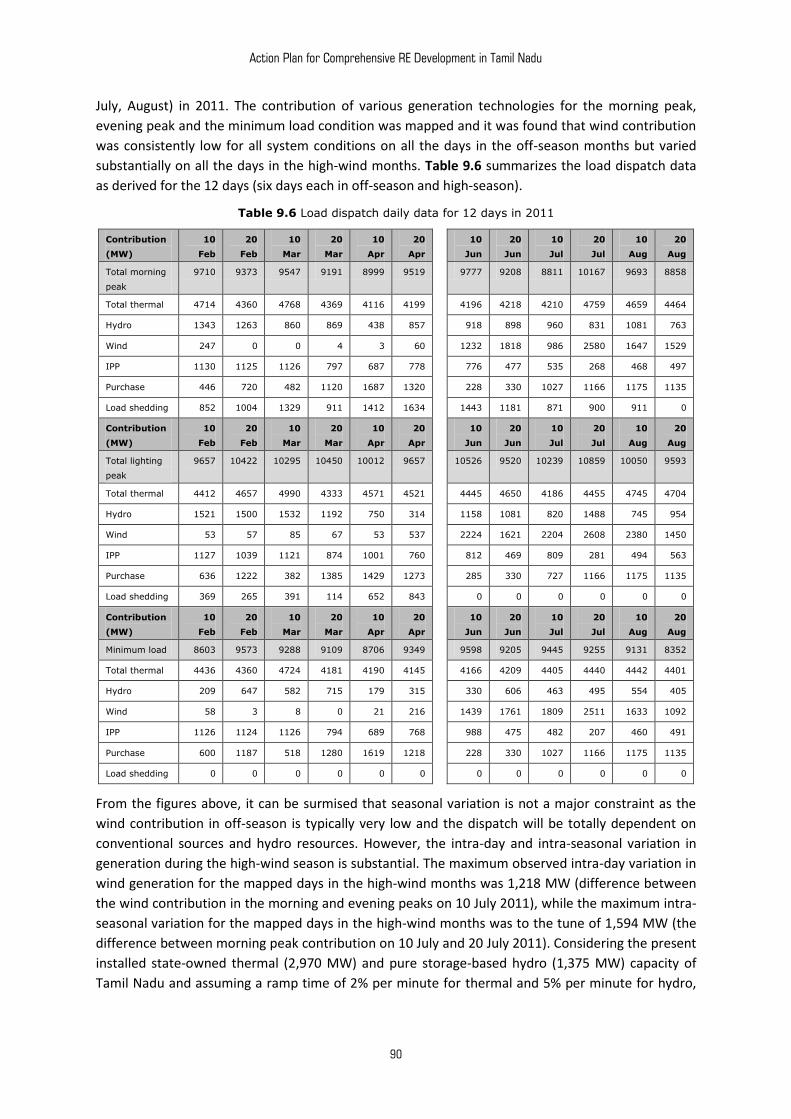
Action Plan for Comprehensive RE Development in Tamil Nadu
90
July, August) in 2011. The contribution of various generation technologies for the morning peak,
evening peak and the minimum load condition was mapped and it was found that wind contribution
was consistently low for all system conditions on all the days in the off-season months but varied
substantially on all the days in the high-wind months. Table 9.6 summarizes the load dispatch data
as derived for the 12 days (six days each in off-season and high-season).
Table 9.6 Load dispatch daily data for 12 days in 2011
Contribution
(MW)
10
Feb
20
Feb
10
Mar
20
Mar
10
Apr
20
Apr
10
Jun
20
Jun
10
Jul
20
Jul
10
Aug
20
Aug
Total morning
peak
9710 9373 9547 9191 8999 9519 9777 9208 8811 10167 9693 8858
Total thermal 4714 4360 4768 4369 4116 4199 4196 4218 4210 4759 4659 4464
Hydro 1343 1263 860 869 438 857 918 898 960 831 1081 763
Wind 247 0 0 4 3 60 1232 1818 986 2580 1647 1529
IPP 1130 1125 1126 797 687 778 776 477 535 268 468 497
Purchase 446 720 482 1120 1687 1320 228 330 1027 1166 1175 1135
Load shedding 852 1004 1329 911 1412 1634 1443 1181 871 900 911 0
Contribution
(MW)
10
Feb
20
Feb
10
Mar
20
Mar
10
Apr
20
Apr
10
Jun
20
Jun
10
Jul
20
Jul
10
Aug
20
Aug
Total lighting
peak
9657 10422 10295 10450 10012 9657 10526 9520 10239 10859 10050 9593
Total thermal 4412 4657 4990 4333 4571 4521 4445 4650 4186 4455 4745 4704
Hydro 1521 1500 1532 1192 750 314 1158 1081 820 1488 745 954
Wind 53 57 85 67 53 537 2224 1621 2204 2608 2380 1450
IPP 1127 1039 1121 874 1001 760 812 469 809 281 494 563
Purchase 636 1222 382 1385 1429 1273 285 330 727 1166 1175 1135
Load shedding 369 265 391 114 652 843 0 0 0 0 0 0
Contribution
(MW)
10
Feb
20
Feb
10
Mar
20
Mar
10
Apr
20
Apr
10
Jun
20
Jun
10
Jul
20
Jul
10
Aug
20
Aug
Minimum load 8603 9573 9288 9109 8706 9349 9598 9205 9445 9255 9131 8352
Total thermal 4436 4360 4724 4181 4190 4145 4166 4209 4405 4440 4442 4401
Hydro 209 647 582 715 179 315 330 606 463 495 554 405
Wind 58 3 8 0 21 216 1439 1761 1809 2511 1633 1092
IPP 1126 1124 1126 794 689 768 988 475 482 207 460 491
Purchase 600 1187 518 1280 1619 1218 228 330 1027 1166 1175 1135
Load shedding 0 0 0 0 0 0 0 0 0 0 0 0
From the figures above, it can be surmised that seasonal variation is not a major constraint as the
wind contribution in off-season is typically very low and the dispatch will be totally dependent on
conventional sources and hydro resources. However, the intra-day and intra-seasonal variation in
generation during the high-wind season is substantial. The maximum observed intra-day variation in
wind generation for the mapped days in the high-wind months was 1,218 MW (difference between
the wind contribution in the morning and evening peaks on 10 July 2011), while the maximum intra-
seasonal variation for the mapped days in the high-wind months was to the tune of 1,594 MW (the
difference between morning peak contribution on 10 July and 20 July 2011). Considering the present
installed state-owned thermal (2,970 MW) and pure storage-based hydro (1,375 MW) capacity of
Tamil Nadu and assuming a ramp time of 2% per minute for thermal and 5% per minute for hydro,
Action Plan for Comprehensive RE Development in Tamil Nadu
91
theoretically, a maximum of 1,900 MW of generation variability can be managed over a 15-minute
period assuming a constant load.
In the context of aggressive capacity addition scenario, the expected variance in wind generation will
translate to 2,800 MW and 5,200 MW during 2016-17 and 2021-22 respectively.
However, even considering the present level of resources, this variability can be managed by
effective control of 10,070 MW hydro power in the southern region provided inter-state cooperation
coupled with a suitable commercial incentive is put in place to incentivize storage-based hydro
schemes to participate as a spinning reserve for wind in the whole southern region. Taking
advantage of the skewed RE generation pattern, the RE peak season can be used by the thermal
power plants in the southern region to undertake maintenance and efficiency improvement
projects. Considering the precarious situation of coal stocks in some thermal power plants, an
increased RE penetration can help in conserving coal stocks, especially in plants having a history of
generation back-down due to coal shortage.
But going beyond this, there are multiple opportunities to create new avenues and tap new
resources to integrate the variability in the grid. Perhaps the most effective solution is to strengthen
inter-regional corridor capacity and allow power transfer from southern region to the northern
region. In this context, it is worth noting that the high-wind, low-demand situation in Tamil Nadu
coincides with the high-demand, low-supply situation in the northern grid. Thus a strong inter-
regional power transfer capability will doubly help Tamil Nadu; by allowing it to sell excess RE
generation at profitable prices during peak season and buy deficit power from a larger seller base at
a more reasonable price during off-peak season.
In this context, it is expected that a common national grid will be a reality in 2014, after the
commissioning of 765 kV Raichur-Solapur line, which will facilitate exchange of surplus power
between the southern region and the rest of the country. In addition, it is also expected that a 765
kV main corridor running from Tamil Nadu to Karnataka and Andhra Pradesh will be commissioned
in 2015. If the expected grid extensions materialize, they will not only mean a smoothening in load
management, but will also mean commercial benefits to host states by sweeping away the existing
issues stemming from the limitations of the state grid.
The second major solution to manage grid variability could be implementation of RE forecasting. As
per the Indian Electricity Grid Code (IEGC), 2010, the RE developer/operator shall forecast day-ahead
power at intervals of 15 minutes with some provision for short time deviation. This forecasting
mechanism is also linked to a commercial mechanism that will require the generators to pay charges
for forecast deviations above a stipulated limit. Effective implementation of forecasting would allow
utilities to plan for wind power in advance and will significantly reduce operational complexities and
commercial impacts arising from generation variability.
In addition to the above mentioned alternatives, other options like pumped hydro, utility-scale
energy storage, wind-solar PV integration, etc., coupled with smart load-management practices
using smart grids and wind energy management systems (WEMS), will help in addressing the
problem even at high renewable penetration. It is learnt that the Tamil Nadu Generation and
Distribution Corporation (TANGEDCO) Ltd. is proposing to commission a 500 MW pumped storage
scheme in Kundah in the 12th plan period, to balance the excess power available during off-peak
hours and to tide over the peak hour shortage. A detailed description of the above mentioned
options (storage, pumped hydro, smart grids and WEMS is covered in Chapter 10.
Action Plan for Comprehensive RE Development in Tamil Nadu
92
In conclusion, it can be said that even for a substantially higher RE penetration, the generation
variability can be managed by using operational flexibility, stronger interconnections, forecasting
services and storage options.
International experiences in managing RE variability are interesting. The Danish grid sometimes sees
an instantaneous wind penetration surpassing total demand but is still able to manage this by
making use of its strong interconnection to a larger Nordic system. In contrast, Ireland has a
relatively small independent system but is still able to manage an instantaneous wind penetration of
40% by using flexible natural gas plants.
Power system stability
Today, RE has a prominent influence on grid security, stability, and congestion management. As the
majority of grid-connected wind farms in India have asynchronous generators which draw reactive
power from the grid, there may be problems related to voltage instability and power quality.
Furthermore, a weak interconnection link may result in local impacts like transmission- or sub-
transmission-level system overloading.
While the Nordic countries of Germany, UK, Ireland, Spain and Canada, among others, have
introduced technical regulations for RE integration, the IEGC, 2010, has also introduced some special
clauses relating to wind and solar power integration into the grid. Some of the important clauses
are:
Special requirements for wind and solar generators from the system-security approach
Reactive power and voltage control
Outage planning.
The IEGC, 2010, also specifies that all necessary information be provided by RE generators and they
should not draw/inject reactive power (voltage and reactive power or VAR) when system safety is
DEDICATED RE MANGEMENT AND CONTROL CENTRE
Another very effective planning initiative for integrating wind and RE as seen by many is to set up
a dedicated RE control centre. In this context, Spain is the first country to set up a dedicated RE
control centre called Control Centre of Renewable Energies (CECRE) and is responsible for
managing all wind farms of over 10 MW. CECRE is integrated into the main power control centre
of Spain and acts as an intermediary between the grid operators and the RE generators. The
main function of CECRE is to integrate the maximum RE production into the electricity system
whilst maintaining quality levels and guaranteeing supply security. CECRE receives real time
information (every 12 seconds) from 23 control centers of generating companies and assesses it
to determine the possibility of integrating the available wind generation into the system without
compromising system security and operational performance. The analysis of CECRE is conveyed
to the main national control centre, which modulates the generation from other sources. Doing
this for Tamil Nadu would significantly change the way of integrating and managing variability.
Understandably, the basic requirement before putting up this system would be to have
forecasting in place. This may be challenging in the present scenario as the high dispersion of
wind power across location, ownership, voltage, etc., would make aggregation of forecasts very
challenging. However, in parallel and independently, many organizations and institutions are
exploring the possibility of integrating forecasts. More about this is covered in Chapter 10.
Action Plan for Comprehensive RE Development in Tamil Nadu
93
involved. The new code also specifies that during wind generator start-up, the wind generator shall
ensure that the reactive power drawal (in-rush currents in the case of induction generators) shall not
affect grid performance. With this guideline on reactive compensation, grid operators can ensure
that system voltage (at the grid connection point) remains within the limits set by the IEGC.
The IEGC has also laid down forecasting process for RE generators, which state that the RE
developer/operator shall forecast power for the next day, and the next few hours to minimize
scheduling errors. Some of the specific provisions of IEGC, 2010, related to forecasting are discussed
below.
Day-ahead forecast: at intervals of 15 minutes for the next 24 hours, for aggregate generation
capacity of 10 MW and above.
The schedule by such RE-generating stations supplying inter-state power under long-term access
and medium-term and short-term open access may be revised by giving advance notice to the
regional load dispatch centre (RLDC). Such revisions by RE-generating stations shall be effective
from the sixth time-block, the first being the time-block in which notice was given. There may be
a maximum of eight revisions for each three-hour time slot starting from 00:00 hours during the
day.
A commercial mechanism is also detailed in the new code in which the commercial implications of all
variations between the RE forecast and actual up to +/-30% are absorbed by the host state and
adjusted through renewable regulatory fund (with RE developers paid for all energy supplied at
agreed feed-in tariff and host state getting paid at applicable UI rate, which is usually lower than
feed-in tariff, as system frequency at peak wind injection period will be generally high) and any
variation beyond +/-30% is taken by the RE developer/operator. RE generators will be paid (for over
injection) or will have to pay (for under injection) at applicable UI rates beyond +/-30% up to +/- 50%
variation. With this standardization, it is easier for grid operators to provide secure and stable grid
operation.
9.3.2 Commercial acceptance
The high wind penetration in Tamil Nadu has resulted in significant operational and commercial
complexities in integrating wind power. While the need and the importance of wind energy and
renewables are not being discounted, there are very grave concerns about the impact of high-wind
penetration on finances of TANGEDCO.
Notwithstanding the recent instances of high-wind generation that allowed the utility to meet 100%
demand, the emphasis of the utility is on the correlation of wind energy generation with demand
and its impact on the operational costs associated with ‘power drawal and purchase’.
On the other hand, wind energy generators (WEGs) say that the losses to TANGEDCO are more a
result of sub-optimal planning, system losses and subsidized supply, and that wind power, because
of its accounting complexities, is being projected as the reason for major losses and lost recoveries.
In this context, it is important to highlight the direct costs of wind to TANGEDCO and evaluate the
desirability and the financial feasibility of wind power for TANGEDCO and for the state as a whole.
The main issues in commercial acceptance of renewables are related to tariff levels, infrastructure
funding and balancing costs.
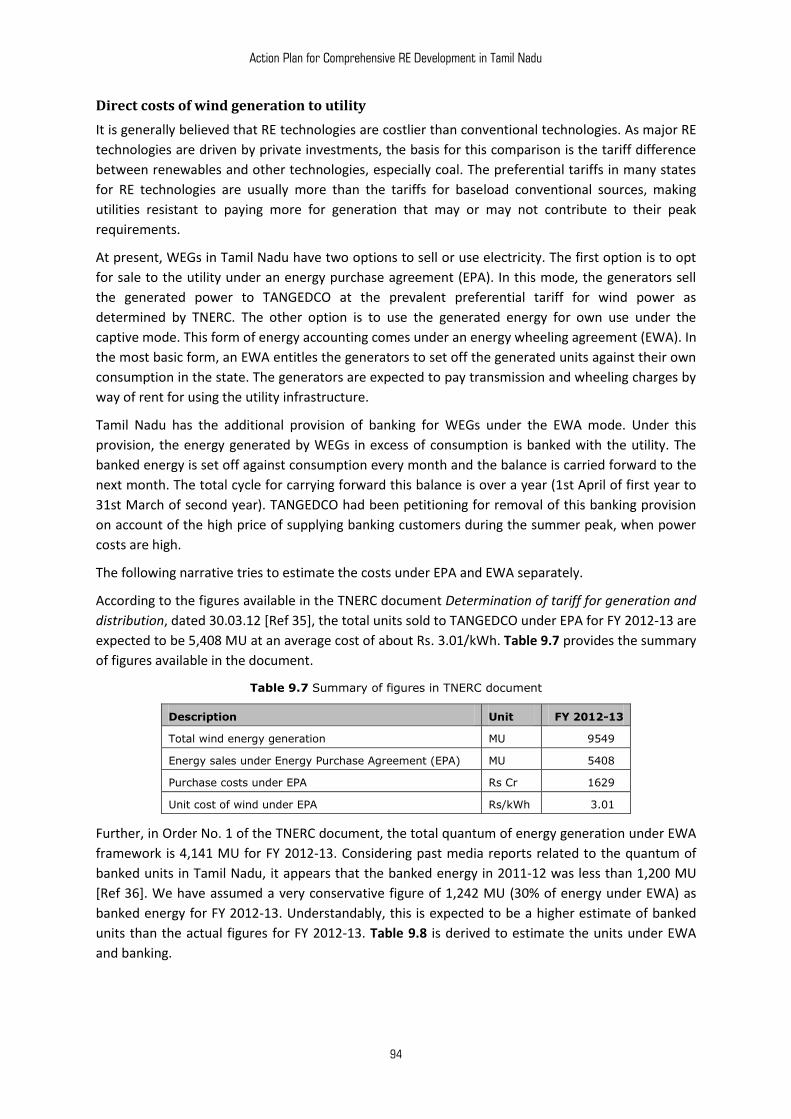
Action Plan for Comprehensive RE Development in Tamil Nadu
94
Direct costs of wind generation to utility
It is generally believed that RE technologies are costlier than conventional technologies. As major RE
technologies are driven by private investments, the basis for this comparison is the tariff difference
between renewables and other technologies, especially coal. The preferential tariffs in many states
for RE technologies are usually more than the tariffs for baseload conventional sources, making
utilities resistant to paying more for generation that may or may not contribute to their peak
requirements.
At present, WEGs in Tamil Nadu have two options to sell or use electricity. The first option is to opt
for sale to the utility under an energy purchase agreement (EPA). In this mode, the generators sell
the generated power to TANGEDCO at the prevalent preferential tariff for wind power as
determined by TNERC. The other option is to use the generated energy for own use under the
captive mode. This form of energy accounting comes under an energy wheeling agreement (EWA). In
the most basic form, an EWA entitles the generators to set off the generated units against their own
consumption in the state. The generators are expected to pay transmission and wheeling charges by
way of rent for using the utility infrastructure.
Tamil Nadu has the additional provision of banking for WEGs under the EWA mode. Under this
provision, the energy generated by WEGs in excess of consumption is banked with the utility. The
banked energy is set off against consumption every month and the balance is carried forward to the
next month. The total cycle for carrying forward this balance is over a year (1st April of first year to
31st March of second year). TANGEDCO had been petitioning for removal of this banking provision
on account of the high price of supplying banking customers during the summer peak, when power
costs are high.
The following narrative tries to estimate the costs under EPA and EWA separately.
According to the figures available in the TNERC document Determination of tariff for generation and
distribution, dated 30.03.12 [Ref 35], the total units sold to TANGEDCO under EPA for FY 2012-13 are
expected to be 5,408 MU at an average cost of about Rs. 3.01/kWh. Table 9.7 provides the summary
of figures available in the document.
Table 9.7 Summary of figures in TNERC document
Description Unit FY 2012-13
Total wind energy generation MU 9549
Energy sales under Energy Purchase Agreement (EPA) MU 5408
Purchase costs under EPA Rs Cr 1629
Unit cost of wind under EPA Rs/kWh 3.01
Further, in Order No. 1 of the TNERC document, the total quantum of energy generation under EWA
framework is 4,141 MU for FY 2012-13. Considering past media reports related to the quantum of
banked units in Tamil Nadu, it appears that the banked energy in 2011-12 was less than 1,200 MU
[Ref 36]. We have assumed a very conservative figure of 1,242 MU (30% of energy under EWA) as
banked energy for FY 2012-13. Understandably, this is expected to be a higher estimate of banked
units than the actual figures for FY 2012-13. Table 9.8 is derived to estimate the units under EWA
and banking.
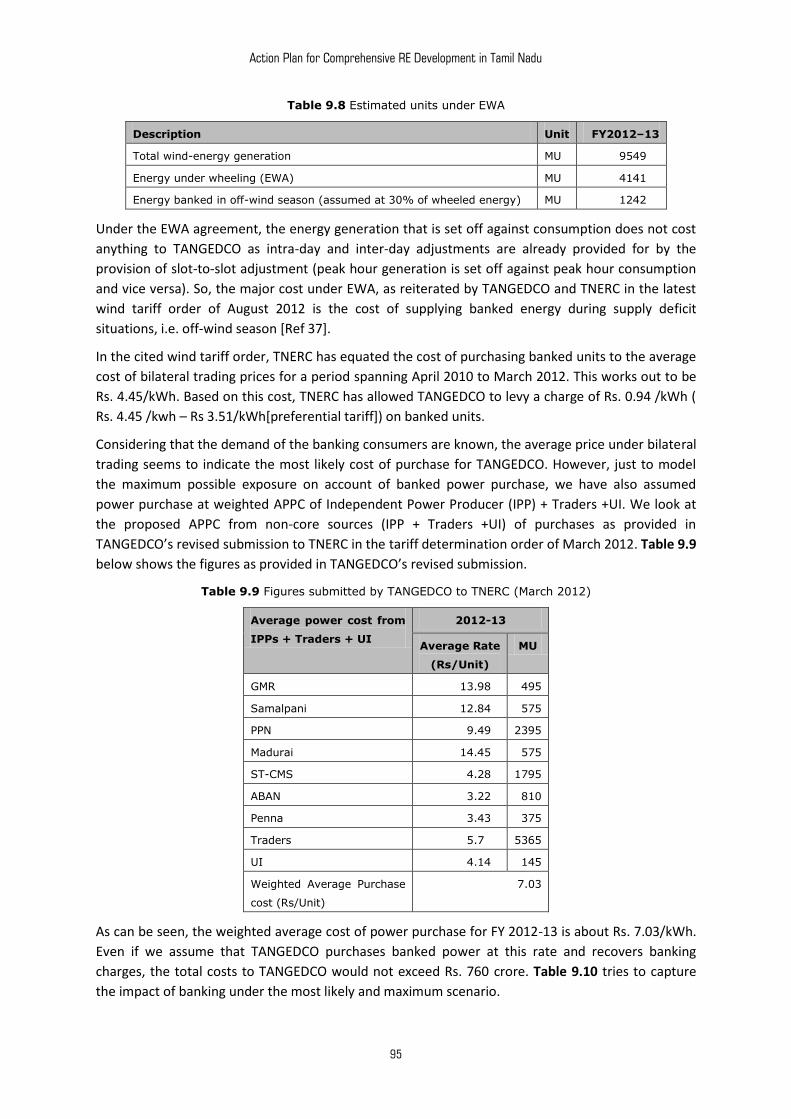
Action Plan for Comprehensive RE Development in Tamil Nadu
95
Table 9.8 Estimated units under EWA
Description Unit FY2012–13
Total wind-energy generation MU 9549
Energy under wheeling (EWA) MU 4141
Energy banked in off-wind season (assumed at 30% of wheeled energy) MU 1242
Under the EWA agreement, the energy generation that is set off against consumption does not cost
anything to TANGEDCO as intra-day and inter-day adjustments are already provided for by the
provision of slot-to-slot adjustment (peak hour generation is set off against peak hour consumption
and vice versa). So, the major cost under EWA, as reiterated by TANGEDCO and TNERC in the latest
wind tariff order of August 2012 is the cost of supplying banked energy during supply deficit
situations, i.e. off-wind season [Ref 37].
In the cited wind tariff order, TNERC has equated the cost of purchasing banked units to the average
cost of bilateral trading prices for a period spanning April 2010 to March 2012. This works out to be
Rs. 4.45/kWh. Based on this cost, TNERC has allowed TANGEDCO to levy a charge of Rs. 0.94 /kWh (
Rs. 4.45 /kwh – Rs 3.51/kWh[preferential tariff]) on banked units.
Considering that the demand of the banking consumers are known, the average price under bilateral
trading seems to indicate the most likely cost of purchase for TANGEDCO. However, just to model
the maximum possible exposure on account of banked power purchase, we have also assumed
power purchase at weighted APPC of Independent Power Producer (IPP) + Traders +UI. We look at
the proposed APPC from non-core sources (IPP + Traders +UI) of purchases as provided in
TANGEDCO’s revised submission to TNERC in the tariff determination order of March 2012. Table 9.9
below shows the figures as provided in TANGEDCO’s revised submission.
Table 9.9 Figures submitted by TANGEDCO to TNERC (March 2012)
Average power cost from
IPPs + Traders + UI
2012-13
Average Rate
(Rs/Unit)
MU
GMR 13.98 495
Samalpani 12.84 575
PPN 9.49 2395
Madurai 14.45 575
ST-CMS 4.28 1795
ABAN 3.22 810
Penna 3.43 375
Traders 5.70 5365
UI 4.14 145
Weighted Average Purchase
cost (Rs/Unit)
7.03
As can be seen, the weighted average cost of power purchase for FY 2012-13 is about Rs. 7.03/kWh.
Even if we assume that TANGEDCO purchases banked power at this rate and recovers banking
charges, the total costs to TANGEDCO would not exceed Rs. 760 crore. Table 9.10 tries to capture
the impact of banking under the most likely and maximum scenario.
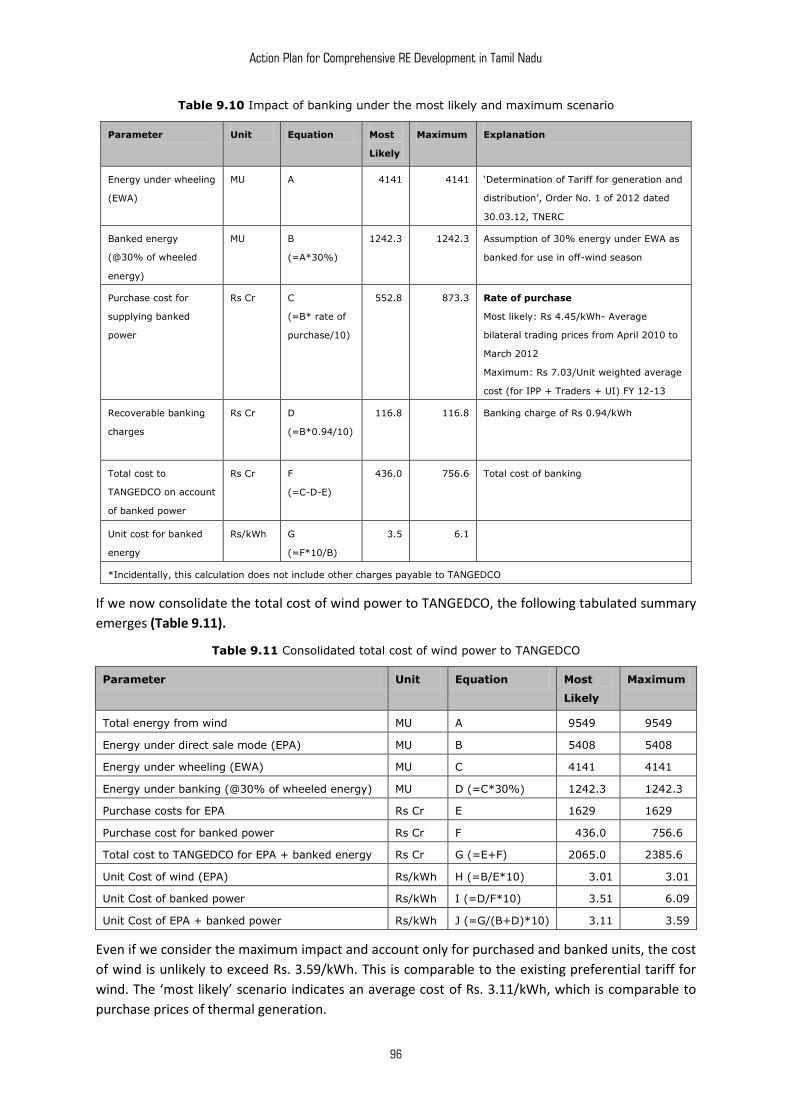
Action Plan for Comprehensive RE Development in Tamil Nadu
96
Table 9.10 Impact of banking under the most likely and maximum scenario
Parameter Unit Equation Most
Likely
Maximum Explanation
Energy under wheeling
(EWA)
MU A 4141 4141 ‘Determination of Tariff for generation and
distribution’, Order No. 1 of 2012 dated
30.03.12, TNERC
Banked energy
(@30% of wheeled
energy)
MU B
(=A*30%)
1242.3 1242.3 Assumption of 30% energy under EWA as
banked for use in off-wind season
Purchase cost for
supplying banked
power
Rs Cr C
(=B* rate of
purchase/10)
552.8 873.3 Rate of purchase
Most likely: Rs 4.45/kWh- Average
bilateral trading prices from April 2010 to
March 2012
Maximum: Rs 7.03/Unit weighted average
cost (for IPP + Traders + UI) FY 12-13
Recoverable banking
charges
Rs Cr D
(=B*0.94/10)
116.8 116.8 Banking charge of Rs 0.94/kWh
Total cost to
TANGEDCO on account
of banked power
Rs Cr F
(=C-D-E)
436.0 756.6 Total cost of banking
Unit cost for banked
energy
Rs/kWh G
(=F*10/B)
3.5 6.1
*Incidentally, this calculation does not include other charges payable to TANGEDCO
If we now consolidate the total cost of wind power to TANGEDCO, the following tabulated summary
emerges (Table 9.11).
Table 9.11 Consolidated total cost of wind power to TANGEDCO
Parameter Unit Equation Most
Likely
Maximum
Total energy from wind MU A 9549.00 9549.00
Energy under direct sale mode (EPA) MU B 5408.00 5408.00
Energy under wheeling (EWA) MU C 4141.00 4141.00
Energy under banking (@30% of wheeled energy) MU D (=C*30%) 1242.30 1242.30
Purchase costs for EPA Rs Cr E 1629.00 1629.00
Purchase cost for banked power Rs Cr F 436.00 756.60
Total cost to TANGEDCO for EPA + banked energy Rs Cr G (=E+F) 2065.00 2385.60
Unit Cost of wind (EPA) Rs/kWh H (=B/E*10) 3.01 3.01
Unit Cost of banked power Rs/kWh I (=D/F*10) 3.51 6.09
Unit Cost of EPA + banked power Rs/kWh J (=G/(B+D)*10) 3.11 3.59
Even if we consider the maximum impact and account only for purchased and banked units, the cost
of wind is unlikely to exceed Rs. 3.59/kWh. This is comparable to the existing preferential tariff for
wind. The ‘most likely’ scenario indicates an average cost of Rs. 3.11/kWh, which is comparable to
purchase prices of thermal generation.
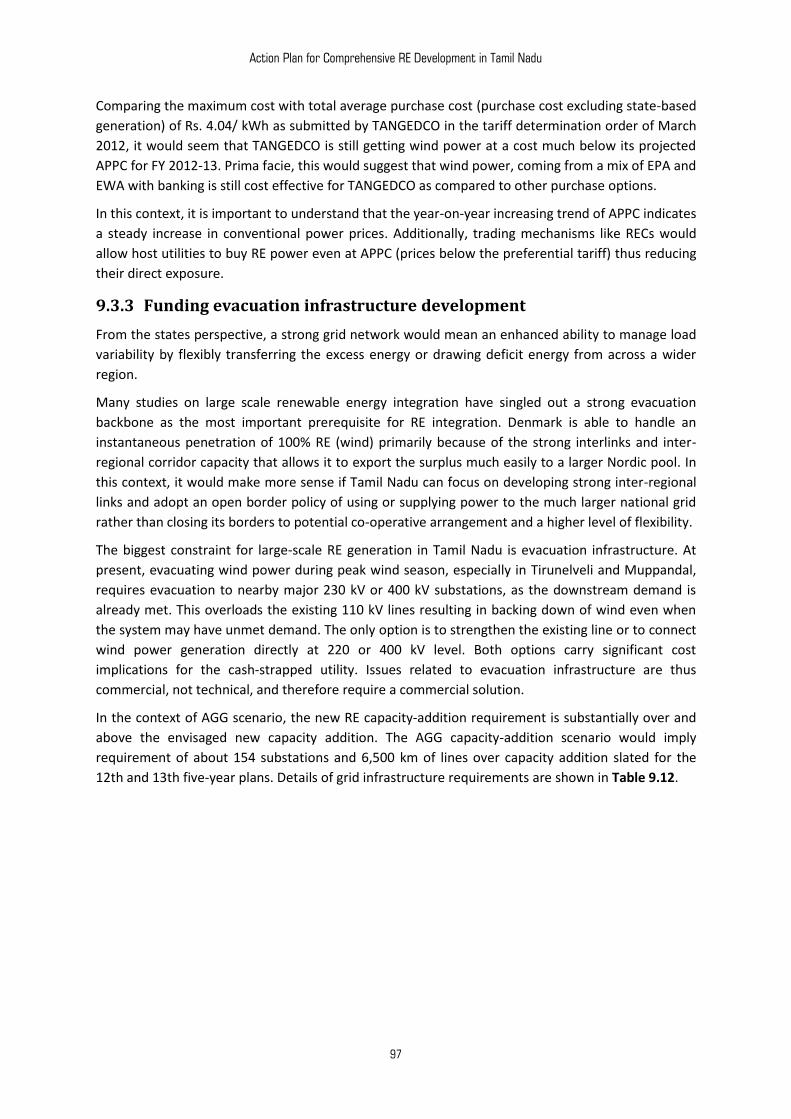
Action Plan for Comprehensive RE Development in Tamil Nadu
97
Comparing the maximum cost with total average purchase cost (purchase cost excluding state-based
generation) of Rs. 4.04/ kWh as submitted by TANGEDCO in the tariff determination order of March
2012, it would seem that TANGEDCO is still getting wind power at a cost much below its projected
APPC for FY 2012-13. Prima facie, this would suggest that wind power, coming from a mix of EPA and
EWA with banking is still cost effective for TANGEDCO as compared to other purchase options.
In this context, it is important to understand that the year-on-year increasing trend of APPC indicates
a steady increase in conventional power prices. Additionally, trading mechanisms like RECs would
allow host utilities to buy RE power even at APPC (prices below the preferential tariff) thus reducing
their direct exposure.
9.3.3 Funding evacuation infrastructure development
From the states perspective, a strong grid network would mean an enhanced ability to manage load
variability by flexibly transferring the excess energy or drawing deficit energy from across a wider
region.
Many studies on large scale renewable energy integration have singled out a strong evacuation
backbone as the most important prerequisite for RE integration. Denmark is able to handle an
instantaneous penetration of 100% RE (wind) primarily because of the strong interlinks and inter-
regional corridor capacity that allows it to export the surplus much easily to a larger Nordic pool. In
this context, it would make more sense if Tamil Nadu can focus on developing strong inter-regional
links and adopt an open border policy of using or supplying power to the much larger national grid
rather than closing its borders to potential co-operative arrangement and a higher level of flexibility.
The biggest constraint for large-scale RE generation in Tamil Nadu is evacuation infrastructure. At
present, evacuating wind power during peak wind season, especially in Tirunelveli and Muppandal,
requires evacuation to nearby major 230 kV or 400 kV substations, as the downstream demand is
already met. This overloads the existing 110 kV lines resulting in backing down of wind even when
the system may have unmet demand. The only option is to strengthen the existing line or to connect
wind power generation directly at 220 or 400 kV level. Both options carry significant cost
implications for the cash-strapped utility. Issues related to evacuation infrastructure are thus
commercial, not technical, and therefore require a commercial solution.
In the context of AGG scenario, the new RE capacity-addition requirement is substantially over and
above the envisaged new capacity addition. The AGG capacity-addition scenario would imply
requirement of about 154 substations and 6,500 km of lines over capacity addition slated for the
12th and 13th five-year plans. Details of grid infrastructure requirements are shown in Table 9.12.
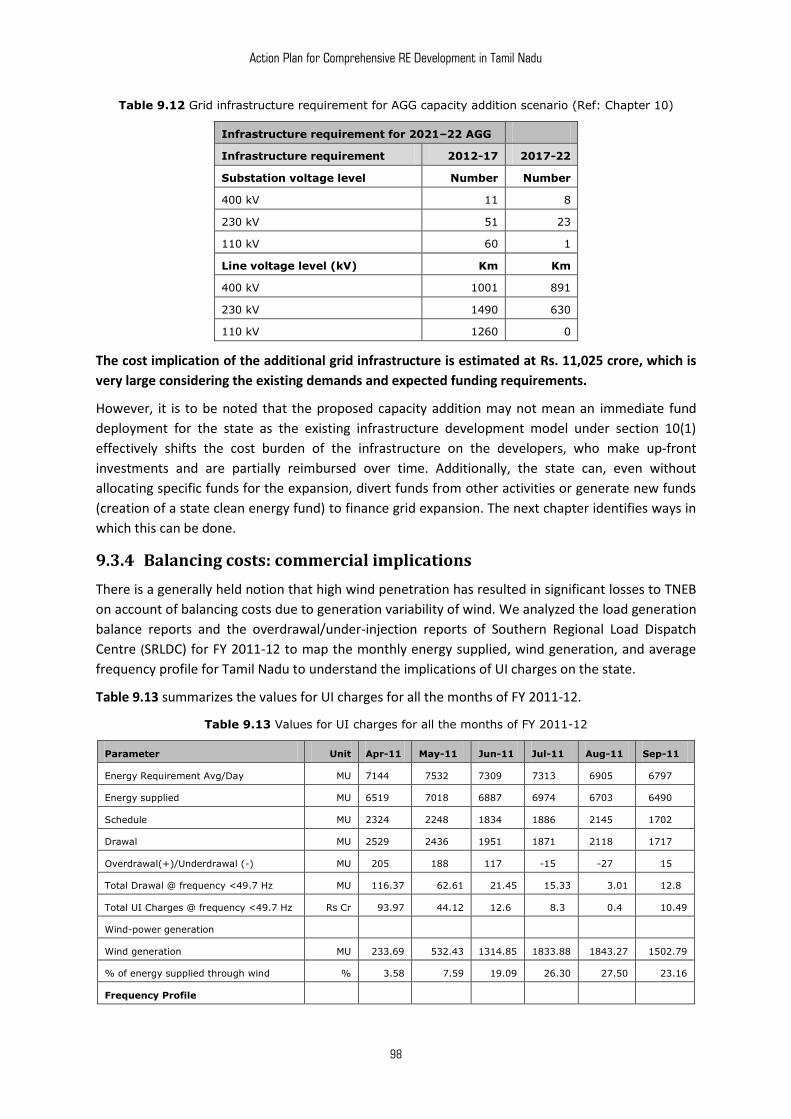
Action Plan for Comprehensive RE Development in Tamil Nadu
98
Table 9.12 Grid infrastructure requirement for AGG capacity addition scenario (Ref: Chapter 10)
Infrastructure requirement for 2021–22 AGG
Infrastructure requirement 2012-17 2017-22
Substation voltage level Number Number
400 kV 11 8
230 kV 51 23
110 kV 60 1
Line voltage level (kV) Km Km
400 kV 1001 891
230 kV 1490 630
110 kV 1260 0
The cost implication of the additional grid infrastructure is estimated at Rs. 11,025 crore, which is
very large considering the existing demands and expected funding requirements.
However, it is to be noted that the proposed capacity addition may not mean an immediate fund
deployment for the state as the existing infrastructure development model under section 10(1)
effectively shifts the cost burden of the infrastructure on the developers, who make up-front
investments and are partially reimbursed over time. Additionally, the state can, even without
allocating specific funds for the expansion, divert funds from other activities or generate new funds
(creation of a state clean energy fund) to finance grid expansion. The next chapter identifies ways in
which this can be done.
9.3.4 Balancing costs: commercial implications
There is a generally held notion that high wind penetration has resulted in significant losses to TNEB
on account of balancing costs due to generation variability of wind. We analyzed the load generation
balance reports and the overdrawal/under-injection reports of Southern Regional Load Dispatch
Centre (SRLDC) for FY 2011-12 to map the monthly energy supplied, wind generation, and average
frequency profile for Tamil Nadu to understand the implications of UI charges on the state.
Table 9.13 summarizes the values for UI charges for all the months of FY 2011-12.
Table 9.13 Values for UI charges for all the months of FY 2011-12
Parameter Unit Apr-11 May-11 Jun-11 Jul-11 Aug-11 Sep-11
Energy Requirement Avg/Day MU 7144.00 7532.00 7309.00 7313.00 6905.00 6797.00
Energy supplied MU 6519.00 7018.00 6887.00 6974.00 6703.00 6490.00
Schedule MU 2324.00 2248.00 1834.00 1886.00 2145.00 1702.00
Drawal MU 2529.00 2436.00 1951.00 1871.00 2118.00 1717.00
Overdrawal(+)/Underdrawal (-) MU 205.00 188.00 117.00 -15.00 -27.00 15.00
Total Drawal @ frequency <49.7 Hz MU 116.37 62.61 21.45 15.33 3.01 12.80
Total UI Charges @ frequency <49.7 Hz Rs Cr 93.97 44.12 12.60 8.30 0.40 10.49
Wind-power generation
Wind generation MU 233.69 532.43 1314.85 1833.88 1843.27 1502.79
% of energy supplied through wind % 3.58 7.59 19.09 26.30 27.50 23.16
Frequency Profile
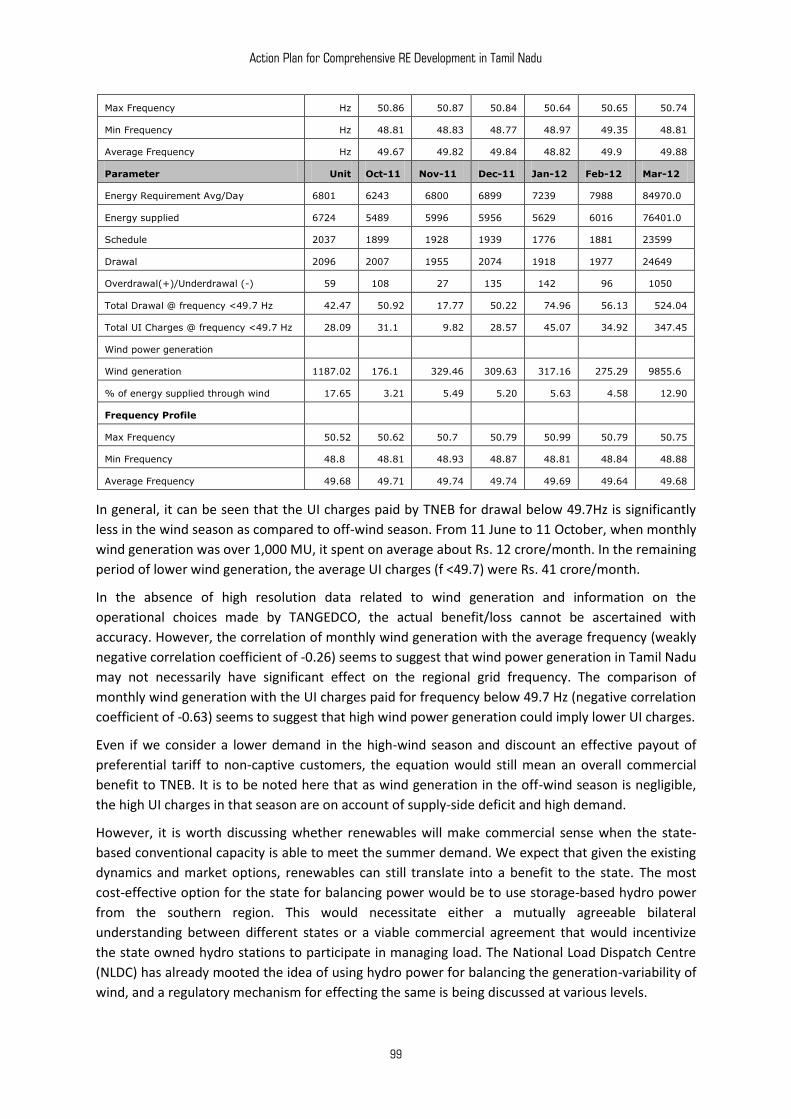
Action Plan for Comprehensive RE Development in Tamil Nadu
99
Max Frequency Hz 50.86 50.87 50.84 50.64 50.65 50.74
Min Frequency Hz 48.81 48.83 48.77 48.97 49.35 48.81
Average Frequency Hz 49.67 49.82 49.84 48.82 49.90 49.88
Parameter Unit Oct-11 Nov-11 Dec-11 Jan-12 Feb-12 Mar-12
Energy Requirement Avg/Day 6801.00 6243.00 6800.00 6899.00 7239.00 7988.00 84970.00
Energy supplied 6724.00 5489.00 5996.00 5956.00 5629.00 6016.00 76401.00
Schedule 2037.00 1899.00 1928.00 1939.00 1776.00 1881.00 23599.00
Drawal 2096.00 2007.00 1955.00 2074.00 1918.00 1977.00 24649.00
Overdrawal(+)/Underdrawal (-) 59.00 108.00 27.00 135.00 142.00 96.00 1050.00
Total Drawal @ frequency <49.7 Hz 42.47 50.92 17.77 50.22 74.96 56.13 524.04
Total UI Charges @ frequency <49.7 Hz 28.09 31.10 9.82 28.57 45.07 34.92 347.45
Wind power generation
Wind generation 1187.02 176.10 329.46 309.63 317.16 275.29 9855.60
% of energy supplied through wind 17.65 3.21 5.49 5.20 5.63 4.58 12.90
Frequency Profile
Max Frequency 50.52 50.62 50.70 50.79 50.99 50.79 50.75
Min Frequency 48.80 48.81 48.93 48.87 48.81 48.84 48.88
Average Frequency 49.68 49.71 49.74 49.74 49.69 49.64 49.68
In general, it can be seen that the UI charges paid by TNEB for drawal below 49.7Hz is significantly
less in the wind season as compared to off-wind season. From 11 June to 11 October, when monthly
wind generation was over 1,000 MU, it spent on average about Rs. 12 crore/month. In the remaining
period of lower wind generation, the average UI charges (f <49.7) were Rs. 41 crore/month.
In the absence of high resolution data related to wind generation and information on the
operational choices made by TANGEDCO, the actual benefit/loss cannot be ascertained with
accuracy. However, the correlation of monthly wind generation with the average frequency (weakly
negative correlation coefficient of -0.26) seems to suggest that wind power generation in Tamil Nadu
may not necessarily have significant effect on the regional grid frequency. The comparison of
monthly wind generation with the UI charges paid for frequency below 49.7 Hz (negative correlation
coefficient of -0.63) seems to suggest that high wind power generation could imply lower UI charges.
Even if we consider a lower demand in the high-wind season and discount an effective payout of
preferential tariff to non-captive customers, the equation would still mean an overall commercial
benefit to TNEB. It is to be noted here that as wind generation in the off-wind season is negligible,
the high UI charges in that season are on account of supply-side deficit and high demand.
However, it is worth discussing whether renewables will make commercial sense when the state-
based conventional capacity is able to meet the summer demand. We expect that given the existing
dynamics and market options, renewables can still translate into a benefit to the state. The most
cost-effective option for the state for balancing power would be to use storage-based hydro power
from the southern region. This would necessitate either a mutually agreeable bilateral
understanding between different states or a viable commercial agreement that would incentivize
the state owned hydro stations to participate in managing load. The National Load Dispatch Centre
(NLDC) has already mooted the idea of using hydro power for balancing the generation-variability of
wind, and a regulatory mechanism for effecting the same is being discussed at various levels.
Action Plan for Comprehensive RE Development in Tamil Nadu
100
Any unscheduled wind generation can still make commercial sense as the financial exposure of the
utility is only to the extent of preferential tariff or APPC (depending on power sale mode) for non-
captive wind generators as against spot purchase prices through exchanges. As the REC market
develops, the exposure would become even less when the generators opt for RECs and sell the
power at APPC rather than at the preferential tariff. Further, considering the weak co-relation of
wind with the grid frequency, any additional generation would mean underdrawal that will bring in
frequency dependent UI rate, which may range from Rs. 0 /kWh to about Rs. 10 /kWh for frequency
in the range of 50.2 Hz to 49.7 Hz, respectively. Conversely, any drop in wind generation would
result in the utility incurring charges for overdrawal.
However, the commencement of forecasting for RE coupled with the establishment of a national
grid would change the picture completely and translate into huge trading opportunities to TNEB,
allowing it to recoup past losses and cover expenses in a more effective manner.
But perhaps the real commercial benefit of the proposed RE integration can only be assessed by
comparing the expected commercial implications of RE with the possible commercial implications
arising from delay, cancellations, or price escalation of planned conventional power projects. As on
today, the possibility for this seems very real.
In conclusion, the single-most important finding from the analysis is that even an aggressive
renewable energy deployment scenario (capacity-addition of 36,470 MW of RE in the 12th and
13th five-year plans) is technically feasible, if we are willing to make changes in the way we
analyze and value renewables.
***
Action Plan for Comprehensive RE Development in Tamil Nadu
101
10. Summary Results of a Detailed Grid Study for Large Scale RE Integration and Evacuation
A detailed study of the grid integration issues, infrastructure development, and costs involved were
done by WISE with the help of Power Research Development Consultants (PRDC), Bengaluru. The
following summary is based on that detailed study. Please note that there may be minor tweaking of
the proposed target capacity addition figures in this study.
Power evacuation studies were carried out in-depth to check the ability of the network to absorb
large-scale integration of RE into the Tamil Nadu grid. Load flow analysis is the best algorithm
available for this purpose. The starting point of any analysis of a power system is the computation of
complex voltages at all the buses. The study showed the electrical performance and power flows
(real and reactive) for specified conditions when the system is operating under steady state. Load
flow analysis of network conditions with the proposed RE sources was carried out for 2016–17 (end
of the 12th five-year plan) and 2021–22 (end of the 13th five-year plan). In line with the preliminary
recommendations of the RE roadmap, it was decided to study large-scale RE integration for the BAU
and Aggressive scenarios.
The methodology followed for the study is as below:
The entire southern grid database has been modelled for 2011–12, 2016–17 and 2021–22
network conditions covering 765 kV and 400 kV networks (for 2016–17 and 2021–22).
Since RE sources are concentrated mainly in four regions of Tamil Nadu—Tirunelveli, Udumalpet,
Muppandal and Theni—geographical drawings have been prepared for these four regions
representing the existing and proposed renewable sources in these regions.
Capacity utilization factor: From the past data available for the TNEB network, it was found that
peak wind generation during windy season could occur simultaneously with solar power
generation. Following a worst-case scenario basis to ascertain the ability of the network to
absorb large-scale RE integration into the grid, it was clear that the contribution of wind and
solar together formed the critical scenario. The study team assumed a capacity utilization factor
of 0.6, which is applicable for wind power as well as solar power, although the factor will
decrease with large-scale integration of RE sources.
Network conditions: Studies were carried out for the following network conditions.
2011–12 network conditions (the existing case or the base case).
2016–17 network conditions (end of the 12th Plan).
2021–22 network conditions (end of the 13th Plan).
Demand details: The system peak demand details were extracted from the 18th EPS (draft)
report. Since the windy season in Tamil Nadu does not coincide with the system peak demand,
80% (of the system peak demand) was considered as the peak demand during high wind season.
The Raichur to Sholapur inter-regional 765 kV line was considered as the slack bus and
equivalent generator is modelled at Raichur 765 kV bus (for 2016-17 and 2021-22 scenarios).
System studies were carried out considering all the above-mentioned points.
The cost of strengthening the transmission network to meet the projected demand with
different RE integration scenarios was estimated based on the unit cost figures (based on
STU/CTU/CERC benchmarking costs) given in Tables 10.1 and 10.2.
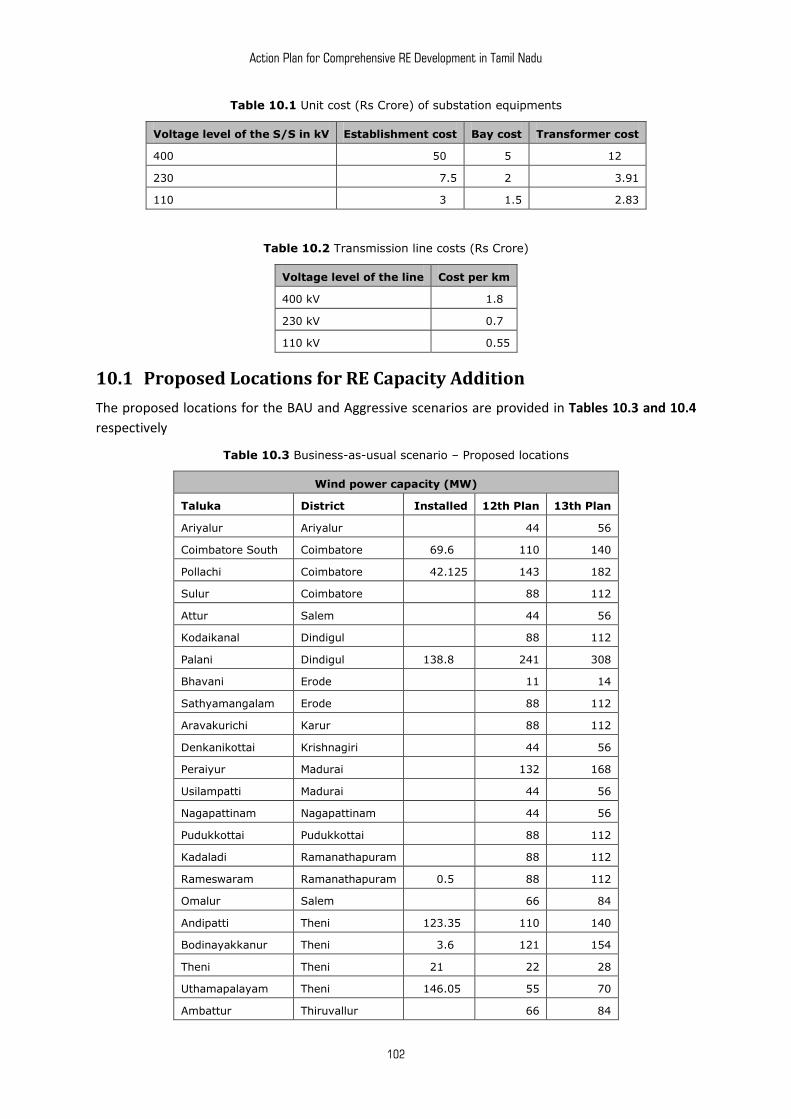
Action Plan for Comprehensive RE Development in Tamil Nadu
102
Table 10.1 Unit cost (Rs Crore) of substation equipments
Voltage level of the S/S in kV Establishment cost Bay cost Transformer cost
400 50.0 5.0 12.00
230 7.5 2.0 3.91
110 3.0 1.5 2.83
Table 10.2 Transmission line costs (Rs Crore)
Voltage level of the line Cost per km
400 kV 1.80
230 kV 0.70
110 kV 0.55
10.1 Proposed Locations for RE Capacity Addition
The proposed locations for the BAU and Aggressive scenarios are provided in Tables 10.3 and 10.4
respectively
Table 10.3 Business-as-usual scenario – Proposed locations
Wind power capacity (MW)
Taluka District Installed 12th Plan 13th Plan
Ariyalur Ariyalur 44 56
Coimbatore South Coimbatore 69.600 110 140
Pollachi Coimbatore 42.125 143 182
Sulur Coimbatore 88 112
Attur Salem 44 56
Kodaikanal Dindigul 88 112
Palani Dindigul 138.800 241 308
Bhavani Erode 11 14
Sathyamangalam Erode 88 112
Aravakurichi Karur 88 112
Denkanikottai Krishnagiri 44 56
Peraiyur Madurai 132 168
Usilampatti Madurai 44 56
Nagapattinam Nagapattinam 44 56
Pudukkottai Pudukkottai 88 112
Kadaladi Ramanathapuram 88 112
Rameswaram Ramanathapuram 0.500 88 112
Omalur Salem 66 84
Andipatti Theni 123.350 110 140
Bodinayakkanur Theni 3.600 121 154
Theni Theni 21.000 22 28
Uthamapalayam Theni 146.050 55 70
Ambattur Thiruvallur 66 84
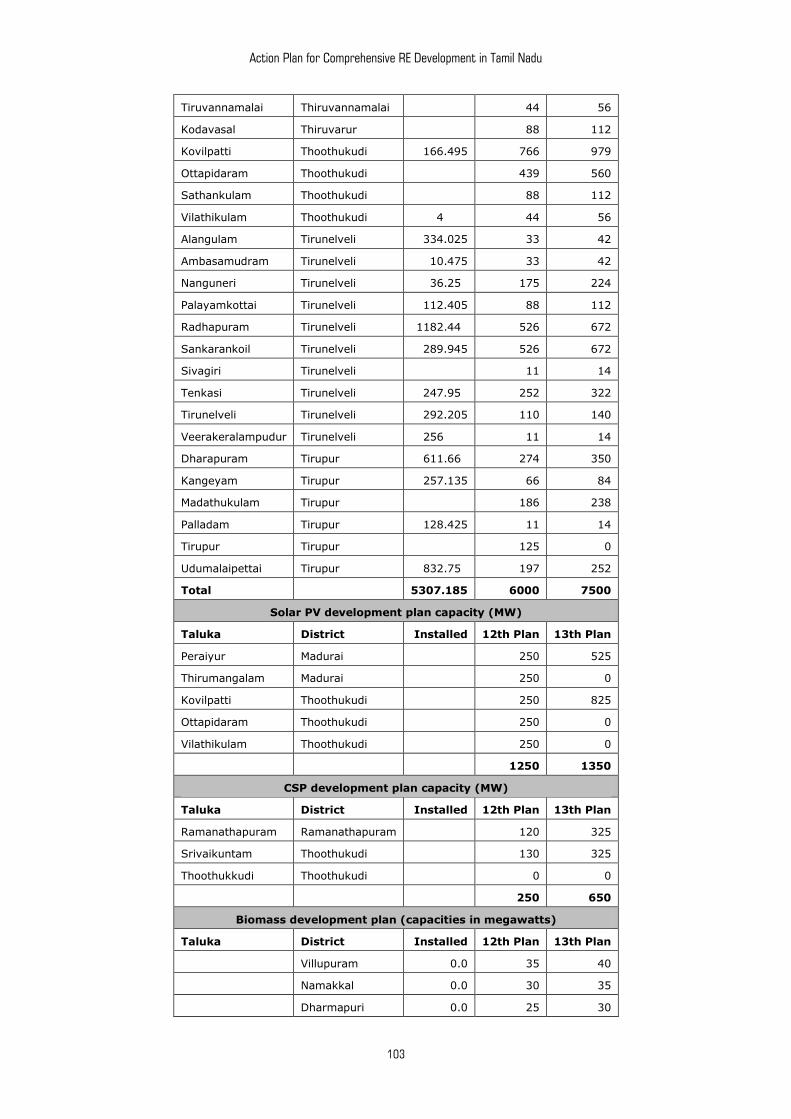
Action Plan for Comprehensive RE Development in Tamil Nadu
103
Tiruvannamalai Thiruvannamalai 44 56
Kodavasal Thiruvarur 88 112
Kovilpatti Thoothukudi 166.495 766 979
Ottapidaram Thoothukudi 439 560
Sathankulam Thoothukudi 88 112
Vilathikulam Thoothukudi 4.000 44 56
Alangulam Tirunelveli 334.025 33 42
Ambasamudram Tirunelveli 10.475 33 42
Nanguneri Tirunelveli 36.250 175 224
Palayamkottai Tirunelveli 112.405 88 112
Radhapuram Tirunelveli 1182.440 526 672
Sankarankoil Tirunelveli 289.945 526 672
Sivagiri Tirunelveli 11 14
Tenkasi Tirunelveli 247.950 252 322
Tirunelveli Tirunelveli 292.205 110 140
Veerakeralampudur Tirunelveli 256.000 11 14
Dharapuram Tirupur 611.660 274 350
Kangeyam Tirupur 257.135 66 84
Madathukulam Tirupur 186 238
Palladam Tirupur 128.425 11 14
Tirupur Tirupur 125 0
Udumalaipettai Tirupur 832.750 197 252
Total 5307.185 6000 7500
Solar PV development plan capacity (MW)
Taluka District Installed 12th Plan 13th Plan
Peraiyur Madurai 250 525
Thirumangalam Madurai 250 0
Kovilpatti Thoothukudi 250 825
Ottapidaram Thoothukudi 250 0
Vilathikulam Thoothukudi 250 0
1250 1350
CSP development plan capacity (MW)
Taluka District Installed 12th Plan 13th Plan
Ramanathapuram Ramanathapuram 120 325
Srivaikuntam Thoothukudi 130 325
Thoothukkudi Thoothukudi 0 0
250 650
Biomass development plan (capacities in megawatts)
Taluka District Installed 12th Plan 13th Plan
Villupuram 0.0 35 40
Namakkal 0.0 30 35
Dharmapuri 0.0 25 30
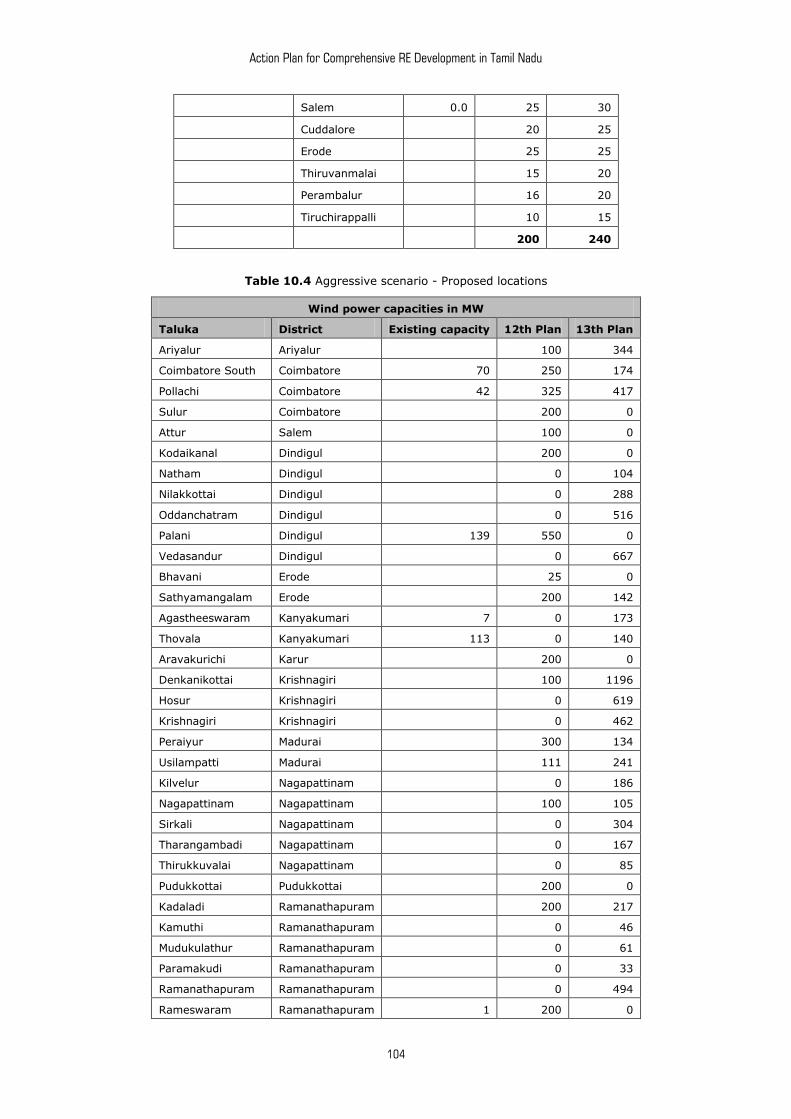
Action Plan for Comprehensive RE Development in Tamil Nadu
104
Salem 0.0 25 30
Cuddalore 20 25
Erode 25 25
Thiruvanmalai 15 20
Perambalur 16 20
Tiruchirappalli 10 15
200 240
Table 10.4 Aggressive scenario - Proposed locations
Wind power capacities in MW
Taluka District Existing capacity 12th Plan 13th Plan
Ariyalur Ariyalur 100 344
Coimbatore South Coimbatore 70 250 174
Pollachi Coimbatore 42 325 417
Sulur Coimbatore 200 0
Attur Salem 100 0
Kodaikanal Dindigul 200 0
Natham Dindigul 0 104
Nilakkottai Dindigul 0 288
Oddanchatram Dindigul 0 516
Palani Dindigul 139 550 0
Vedasandur Dindigul 0 667
Bhavani Erode 25 0
Sathyamangalam Erode 200 142
Agastheeswaram Kanyakumari 7 0 173
Thovala Kanyakumari 113 0 140
Aravakurichi Karur 200 0
Denkanikottai Krishnagiri 100 1196
Hosur Krishnagiri 0 619
Krishnagiri Krishnagiri 0 462
Peraiyur Madurai 300 134
Usilampatti Madurai 111 241
Kilvelur Nagapattinam 0 186
Nagapattinam Nagapattinam 100 105
Sirkali Nagapattinam 0 304
Tharangambadi Nagapattinam 0 167
Thirukkuvalai Nagapattinam 0 85
Pudukkottai Pudukkottai 200 0
Kadaladi Ramanathapuram 200 217
Kamuthi Ramanathapuram 0 46
Mudukulathur Ramanathapuram 0 61
Paramakudi Ramanathapuram 0 33
Ramanathapuram Ramanathapuram 0 494
Rameswaram Ramanathapuram 1 200 0
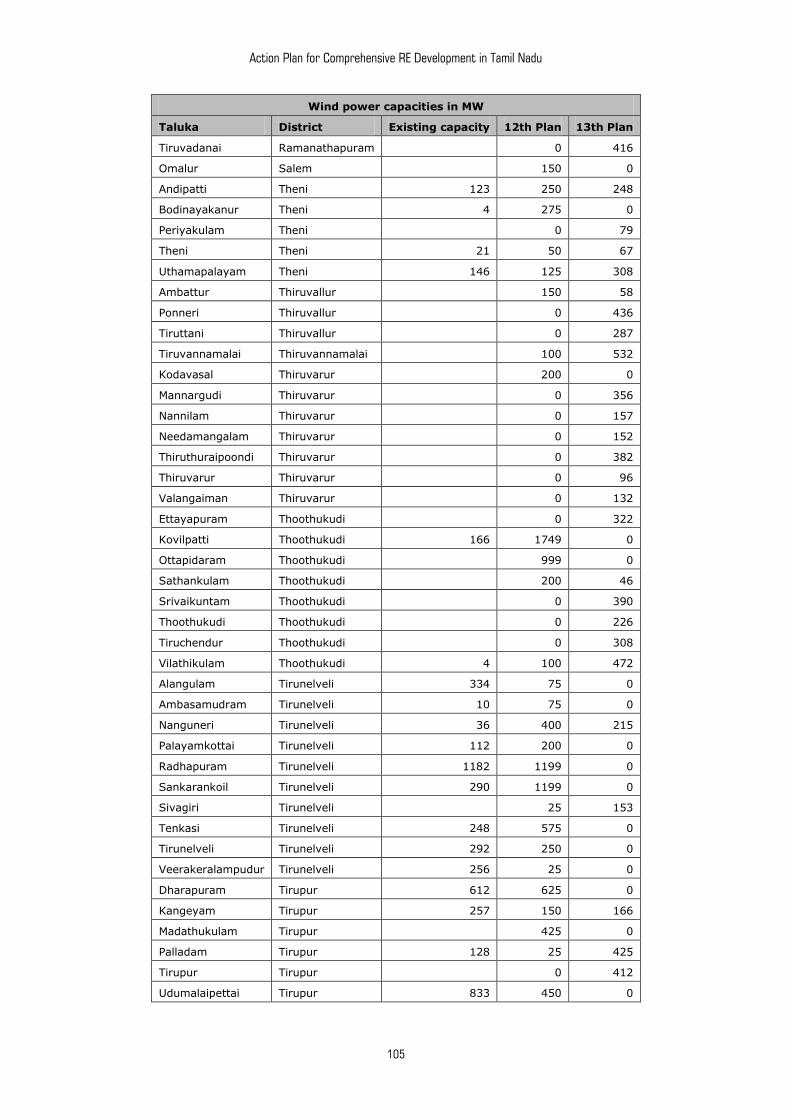
Action Plan for Comprehensive RE Development in Tamil Nadu
105
Wind power capacities in MW
Taluka District Existing capacity 12th Plan 13th Plan
Tiruvadanai Ramanathapuram 0 416
Omalur Salem 150 0
Andipatti Theni 123 250 248
Bodinayakanur Theni 4 275 0
Periyakulam Theni 0 79
Theni Theni 21 50 67
Uthamapalayam Theni 146 125 308
Ambattur Thiruvallur 150 58
Ponneri Thiruvallur 0 436
Tiruttani Thiruvallur 0 287
Tiruvannamalai Thiruvannamalai 100 532
Kodavasal Thiruvarur 200 0
Mannargudi Thiruvarur 0 356
Nannilam Thiruvarur 0 157
Needamangalam Thiruvarur 0 152
Thiruthuraipoondi Thiruvarur 0 382
Thiruvarur Thiruvarur 0 96
Valangaiman Thiruvarur 0 132
Ettayapuram Thoothukudi 0 322
Kovilpatti Thoothukudi 166 1749 0
Ottapidaram Thoothukudi 999 0
Sathankulam Thoothukudi 200 46
Srivaikuntam Thoothukudi 0 390
Thoothukudi Thoothukudi 0 226
Tiruchendur Thoothukudi 0 308
Vilathikulam Thoothukudi 4 100 472
Alangulam Tirunelveli 334 75 0
Ambasamudram Tirunelveli 10 75 0
Nanguneri Tirunelveli 36 400 215
Palayamkottai Tirunelveli 112 200 0
Radhapuram Tirunelveli 1182 1199 0
Sankarankoil Tirunelveli 290 1199 0
Sivagiri Tirunelveli 25 153
Tenkasi Tirunelveli 248 575 0
Tirunelveli Tirunelveli 292 250 0
Veerakeralampudur Tirunelveli 256 25 0
Dharapuram Tirupur 612 625 0
Kangeyam Tirupur 257 150 166
Madathukulam Tirupur 425 0
Palladam Tirupur 128 25 425
Tirupur Tirupur 0 412
Udumalaipettai Tirupur 833 450 0
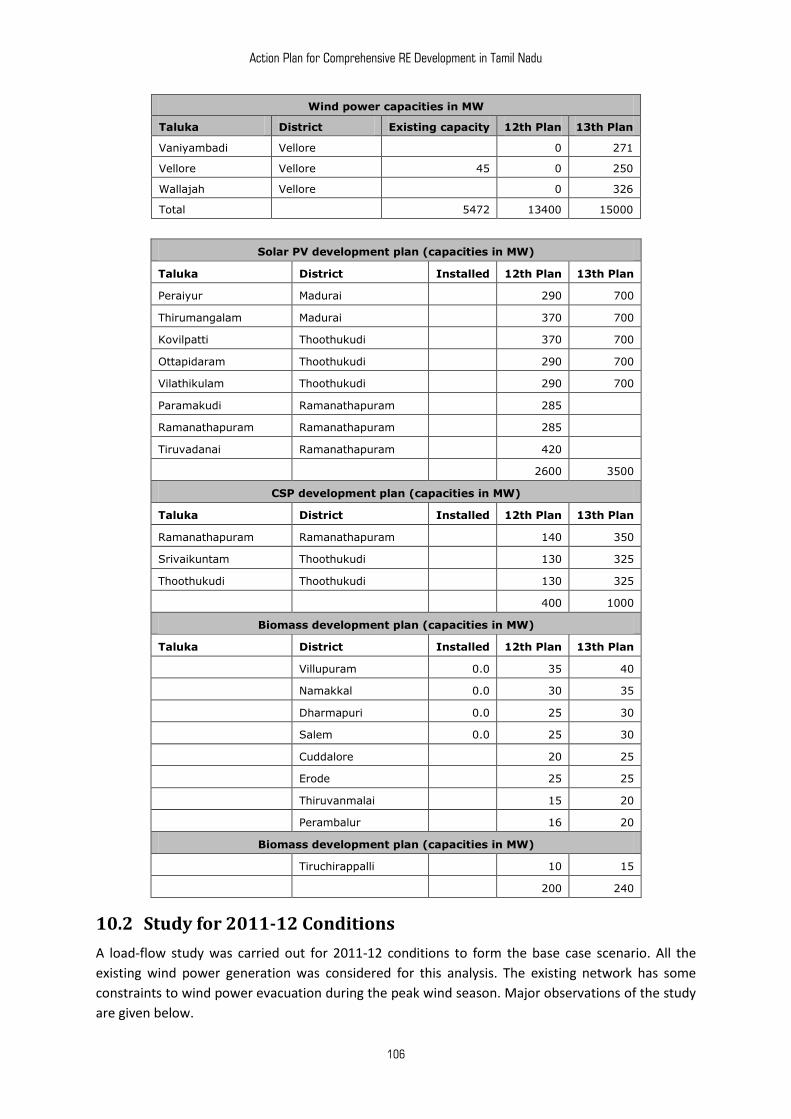
Action Plan for Comprehensive RE Development in Tamil Nadu
106
Wind power capacities in MW
Taluka District Existing capacity 12th Plan 13th Plan
Vaniyambadi Vellore 0 271
Vellore Vellore 45 0 250
Wallajah Vellore 0 326
Total 5472 13400 15000
Solar PV development plan (capacities in MW)
Taluka District Installed 12th Plan 13th Plan
Peraiyur Madurai 290 700
Thirumangalam Madurai 370 700
Kovilpatti Thoothukudi 370 700
Ottapidaram Thoothukudi 290 700
Vilathikulam Thoothukudi 290 700
Paramakudi Ramanathapuram 285
Ramanathapuram Ramanathapuram 285
Tiruvadanai Ramanathapuram 420
2600 3500
CSP development plan (capacities in MW)
Taluka District Installed 12th Plan 13th Plan
Ramanathapuram Ramanathapuram 140 350
Srivaikuntam Thoothukudi 130 325
Thoothukudi Thoothukudi 130 325
400 1000
Biomass development plan (capacities in MW)
Taluka District Installed 12th Plan 13th Plan
Villupuram 0.0 35 40
Namakkal 0.0 30 35
Dharmapuri 0.0 25 30
Salem 0.0 25 30
Cuddalore 20 25
Erode 25 25
Thiruvanmalai 15 20
Perambalur 16 20
Biomass development plan (capacities in MW)
Tiruchirappalli 10 15
200 240
10.2 Study for 2011-12 Conditions
A load-flow study was carried out for 2011-12 conditions to form the base case scenario. All the
existing wind power generation was considered for this analysis. The existing network has some
constraints to wind power evacuation during the peak wind season. Major observations of the study
are given below.
Action Plan for Comprehensive RE Development in Tamil Nadu
107
Tirunelveli region: A few lines are loaded beyond their thermal loading limit. Necessary
augmentation measures are being implemented such as the use of high tension, low sag (HTLS)
conductor and network reconfiguration to reduce the overload.
Udumalpet region: All the line loadings (except the Palladam to Kethanur 110 kV S/C line) and
voltages in the vicinity of the wind farm are within acceptable limits during normal operating
conditions. However, during high wind season, the reactive power drawals from old machines
are high, which results in low voltage in certain pockets.
Muppandal region: A few lines are loaded beyond their thermal loading limit. Necessary
augmentation measures are being implemented, such as network reconfiguration, to reduce the
overload.
General observations: At present, most of the 110 kV substations are connected to one another
using S/C lines. Wind farms are connected to these 110 kV substations. During an average windy day,
the local loads consume most of the wind power generated. However, during peak wind season, if
the local demand is less (which is the worst possible case), the wind power generated will have to be
evacuated into nearby major 230 kV or 400 kV S/S. Due to this, 110 kV lines are overloaded during
the peak wind season.
At present the split-bus arrangement and network reconfigurations are being implemented to
reduce such overloads. However, these are only short-term solutions. To integrate large-scale RE
into the TAMIL NADU grid, a reliable transmission network is needed.
10.3 Load-Flow Analysis for BAU Scenario
As explained earlier, load flow was studied for 2016–17 and 2021–22 network conditions considering
business-as-usual scenario, which is addressed in this section.
10.3.1 Business-as-usual Scenario for 2016–17 conditions
The proposed action plan for BAU 2016–17 network conditions is given in Table 10.5. The 18th EPS
(draft) puts Tamil Nadu system peak demand at 18,994 MW. Considering 80% of this demand, the
Tamil Nadu system was simulated for 15,195 MW during the peak wind season. Three 765 kV links
will become operational during this period. System reinforcements like transmission line and sub-
stations already planned by Tamil Nadu under the National Clean Energy Fund (NCEF) were also
considered in the study. The 765 kV substations expected are shown in Figure 10.1. A consolidated
list of existing and proposed RE resources considered for study is given earlier in Section 10.1 of this
chapter.
Table 10.5 Proposed action plan for BAU 2016–17 network conditions
Proposed new capacity addition in 12th plan (BAU)
RE source 2016–17 scenario (MW)
Wind 6000
Solar 1500
Biomass 200
Other RE 60
Existing RE (Effective) 6953
Total RE (expected) 14713
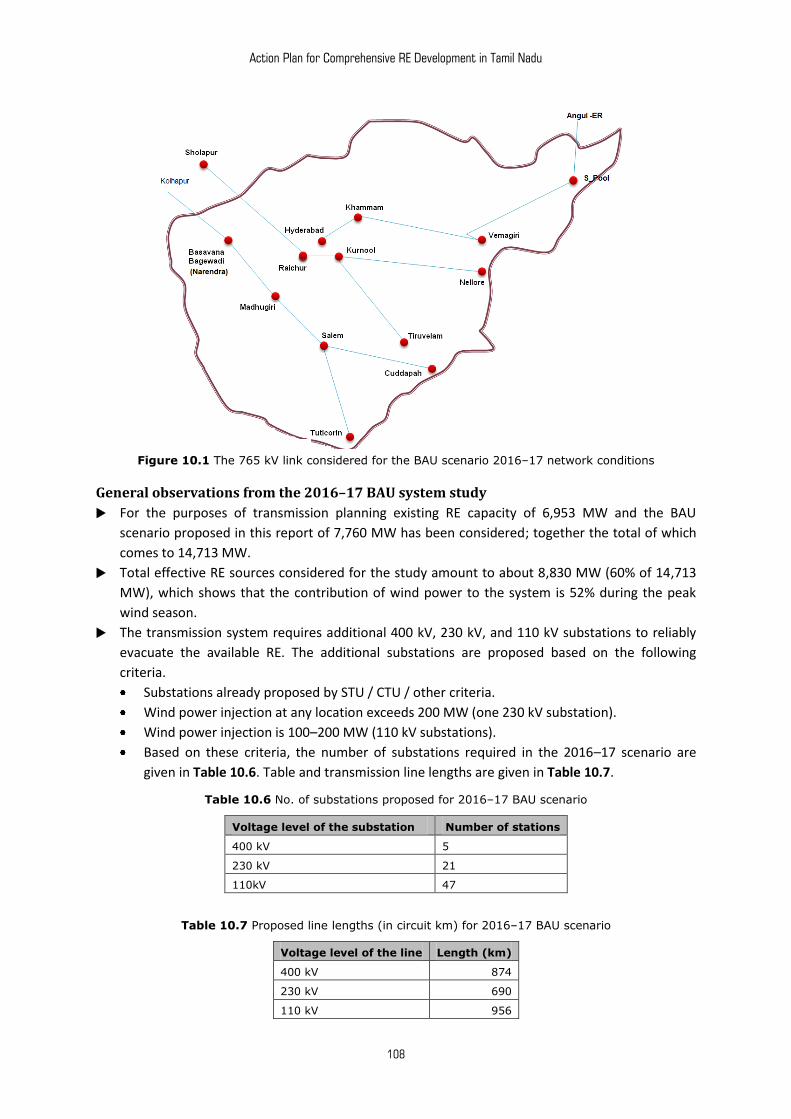
Action Plan for Comprehensive RE Development in Tamil Nadu
108
Figure 10.1 The 765 kV link considered for the BAU scenario 2016–17 network conditions
General observations from the 2016–17 BAU system study
For the purposes of transmission planning existing RE capacity of 6,953 MW and the BAU
scenario proposed in this report of 7,760 MW has been considered; together the total of which
comes to 14,713 MW.
Total effective RE sources considered for the study amount to about 8,830 MW (60% of 14,713
MW), which shows that the contribution of wind power to the system is 52% during the peak
wind season.
The transmission system requires additional 400 kV, 230 kV, and 110 kV substations to reliably
evacuate the available RE. The additional substations are proposed based on the following
criteria.
Substations already proposed by STU / CTU / other criteria.
Wind power injection at any location exceeds 200 MW (one 230 kV substation).
Wind power injection is 100–200 MW (110 kV substations).
Based on these criteria, the number of substations required in the 2016–17 scenario are
given in Table 10.6. Table and transmission line lengths are given in Table 10.7.
Table 10.6 No. of substations proposed for 2016–17 BAU scenario
Voltage level of the substation Number of stations
400 kV 5
230 kV 21
110kV 47
Table 10.7 Proposed line lengths (in circuit km) for 2016–17 BAU scenario
Voltage level of the line Length (km)
400 kV 874
230 kV 690
110 kV 956
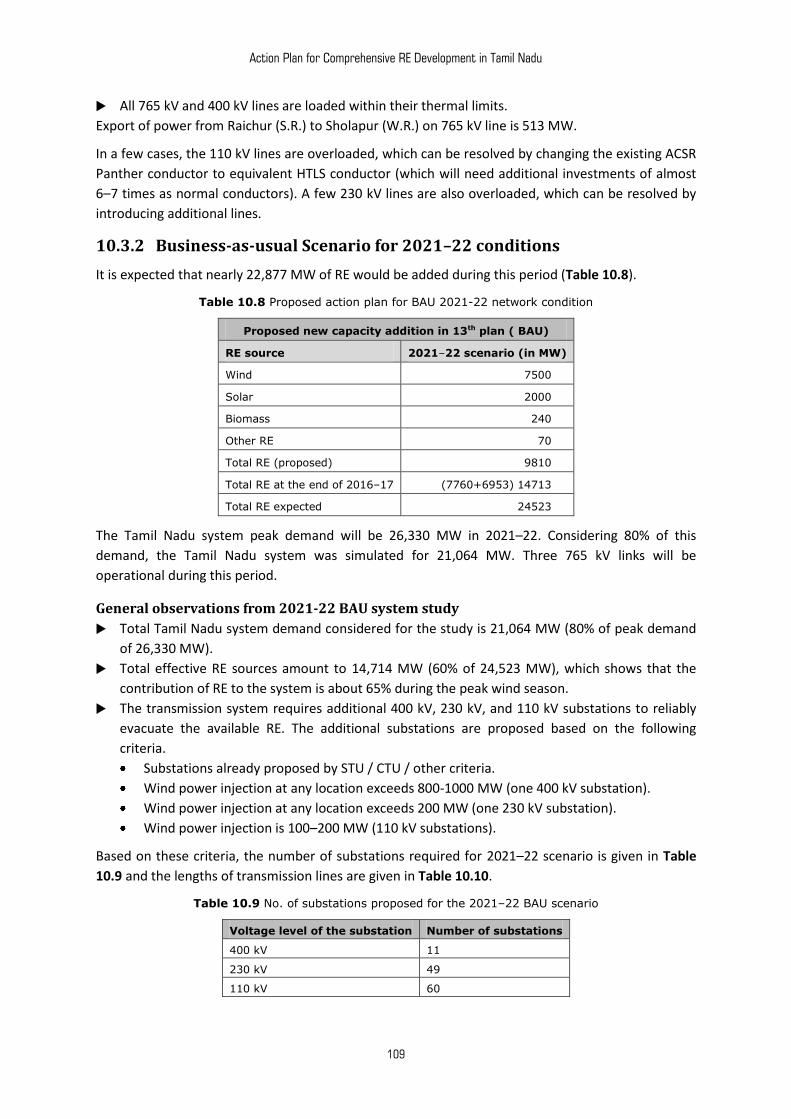
Action Plan for Comprehensive RE Development in Tamil Nadu
109
All 765 kV and 400 kV lines are loaded within their thermal limits.
Export of power from Raichur (S.R.) to Sholapur (W.R.) on 765 kV line is 513 MW.
In a few cases, the 110 kV lines are overloaded, which can be resolved by changing the existing ACSR
Panther conductor to equivalent HTLS conductor (which will need additional investments of almost
6–7 times as normal conductors). A few 230 kV lines are also overloaded, which can be resolved by
introducing additional lines.
10.3.2 Business-as-usual Scenario for 2021–22 conditions
It is expected that nearly 22,877 MW of RE would be added during this period (Table 10.8).
Table 10.8 Proposed action plan for BAU 2021-22 network condition
Proposed new capacity addition in 13th plan ( BAU)
RE source 2021–22 scenario (in MW)
Wind 7500
Solar 2000
Biomass 240
Other RE 70
Total RE (proposed) 9810
Total RE at the end of 2016–17 (7760+6953) 14713
Total RE expected 24523
The Tamil Nadu system peak demand will be 26,330 MW in 2021–22. Considering 80% of this
demand, the Tamil Nadu system was simulated for 21,064 MW. Three 765 kV links will be
operational during this period.
General observations from 2021-22 BAU system study
Total Tamil Nadu system demand considered for the study is 21,064 MW (80% of peak demand
of 26,330 MW).
Total effective RE sources amount to 14,714 MW (60% of 24,523 MW), which shows that the
contribution of RE to the system is about 65% during the peak wind season.
The transmission system requires additional 400 kV, 230 kV, and 110 kV substations to reliably
evacuate the available RE. The additional substations are proposed based on the following
criteria.
Substations already proposed by STU / CTU / other criteria.
Wind power injection at any location exceeds 800-1000 MW (one 400 kV substation).
Wind power injection at any location exceeds 200 MW (one 230 kV substation).
Wind power injection is 100–200 MW (110 kV substations).
Based on these criteria, the number of substations required for 2021–22 scenario is given in Table
10.9 and the lengths of transmission lines are given in Table 10.10.
Table 10.9 No. of substations proposed for the 2021–22 BAU scenario
Voltage level of the substation Number of substations
400 kV 11
230 kV 49
110 kV 60
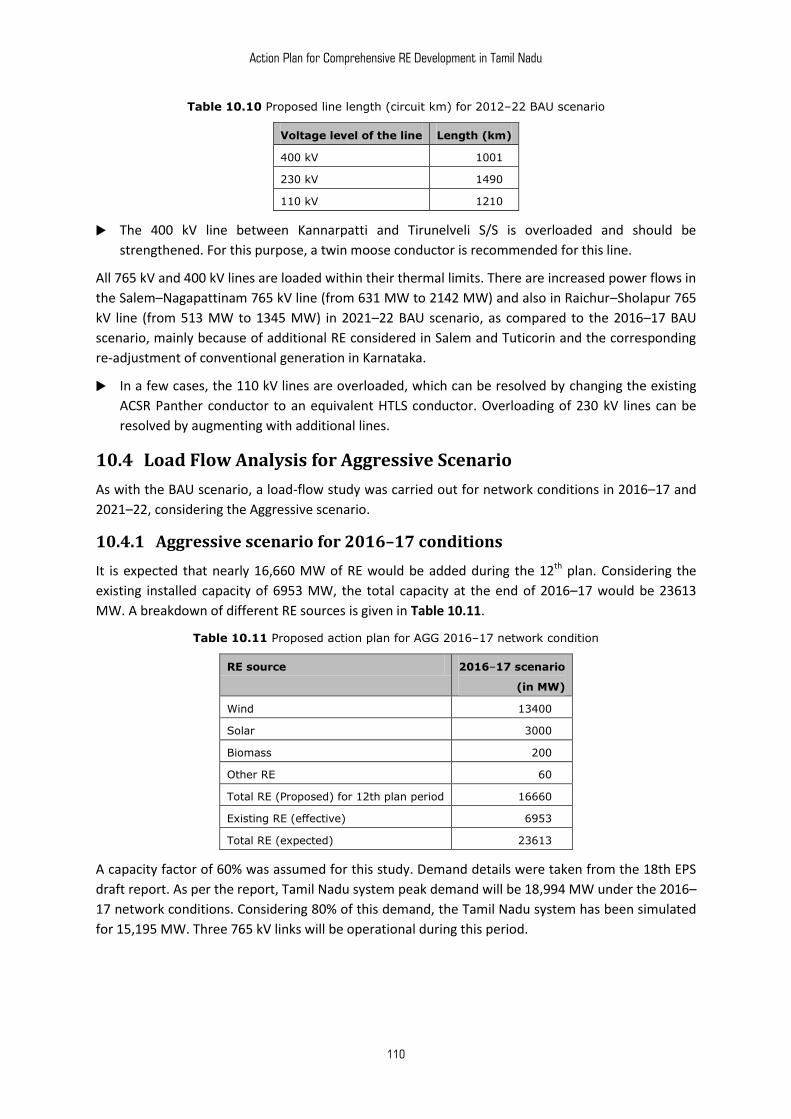
Action Plan for Comprehensive RE Development in Tamil Nadu
110
Table 10.10 Proposed line length (circuit km) for 2012–22 BAU scenario
Voltage level of the line Length (km)
400 kV 1001
230 kV 1490
110 kV 1210
The 400 kV line between Kannarpatti and Tirunelveli S/S is overloaded and should be
strengthened. For this purpose, a twin moose conductor is recommended for this line.
All 765 kV and 400 kV lines are loaded within their thermal limits. There are increased power flows in
the Salem–Nagapattinam 765 kV line (from 631 MW to 2142 MW) and also in Raichur–Sholapur 765
kV line (from 513 MW to 1345 MW) in 2021–22 BAU scenario, as compared to the 2016–17 BAU
scenario, mainly because of additional RE considered in Salem and Tuticorin and the corresponding
re-adjustment of conventional generation in Karnataka.
In a few cases, the 110 kV lines are overloaded, which can be resolved by changing the existing
ACSR Panther conductor to an equivalent HTLS conductor. Overloading of 230 kV lines can be
resolved by augmenting with additional lines.
10.4 Load Flow Analysis for Aggressive Scenario
As with the BAU scenario, a load-flow study was carried out for network conditions in 2016–17 and
2021–22, considering the Aggressive scenario.
10.4.1 Aggressive scenario for 2016–17 conditions
It is expected that nearly 16,660 MW of RE would be added during the 12th plan. Considering the
existing installed capacity of 6953 MW, the total capacity at the end of 2016–17 would be 23613
MW. A breakdown of different RE sources is given in Table 10.11.
Table 10.11 Proposed action plan for AGG 2016–17 network condition
RE source 2016–17 scenario
(in MW)
Wind 13400
Solar 3000
Biomass 200
Other RE 60
Total RE (Proposed) for 12th plan period 16660
Existing RE (effective) 6953
Total RE (expected) 23613
A capacity factor of 60% was assumed for this study. Demand details were taken from the 18th EPS
draft report. As per the report, Tamil Nadu system peak demand will be 18,994 MW under the 2016–
17 network conditions. Considering 80% of this demand, the Tamil Nadu system has been simulated
for 15,195 MW. Three 765 kV links will be operational during this period.
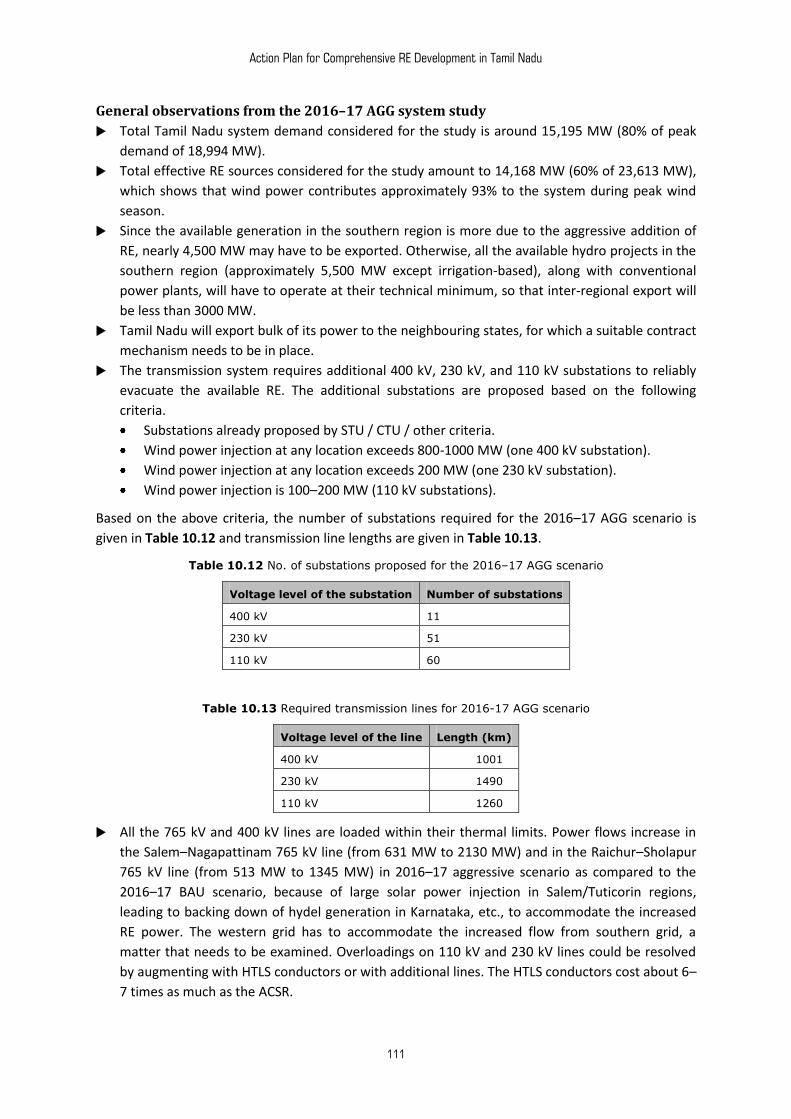
Action Plan for Comprehensive RE Development in Tamil Nadu
111
General observations from the 2016–17 AGG system study
Total Tamil Nadu system demand considered for the study is around 15,195 MW (80% of peak
demand of 18,994 MW).
Total effective RE sources considered for the study amount to 14,168 MW (60% of 23,613 MW),
which shows that wind power contributes approximately 93% to the system during peak wind
season.
Since the available generation in the southern region is more due to the aggressive addition of
RE, nearly 4,500 MW may have to be exported. Otherwise, all the available hydro projects in the
southern region (approximately 5,500 MW except irrigation-based), along with conventional
power plants, will have to operate at their technical minimum, so that inter-regional export will
be less than 3000 MW.
Tamil Nadu will export bulk of its power to the neighbouring states, for which a suitable contract
mechanism needs to be in place.
The transmission system requires additional 400 kV, 230 kV, and 110 kV substations to reliably
evacuate the available RE. The additional substations are proposed based on the following
criteria.
Substations already proposed by STU / CTU / other criteria.
Wind power injection at any location exceeds 800-1000 MW (one 400 kV substation).
Wind power injection at any location exceeds 200 MW (one 230 kV substation).
Wind power injection is 100–200 MW (110 kV substations).
Based on the above criteria, the number of substations required for the 2016–17 AGG scenario is
given in Table 10.12 and transmission line lengths are given in Table 10.13.
Table 10.12 No. of substations proposed for the 2016–17 AGG scenario
Voltage level of the substation Number of substations
400 kV 11
230 kV 51
110 kV 60
Table 10.13 Required transmission lines for 2016-17 AGG scenario
Voltage level of the line Length (km)
400 kV 1001
230 kV 1490
110 kV 1260
All the 765 kV and 400 kV lines are loaded within their thermal limits. Power flows increase in
the Salem–Nagapattinam 765 kV line (from 631 MW to 2130 MW) and in the Raichur–Sholapur
765 kV line (from 513 MW to 1345 MW) in 2016–17 aggressive scenario as compared to the
2016–17 BAU scenario, because of large solar power injection in Salem/Tuticorin regions,
leading to backing down of hydel generation in Karnataka, etc., to accommodate the increased
RE power. The western grid has to accommodate the increased flow from southern grid, a
matter that needs to be examined. Overloadings on 110 kV and 230 kV lines could be resolved
by augmenting with HTLS conductors or with additional lines. The HTLS conductors cost about 6–
7 times as much as the ACSR.
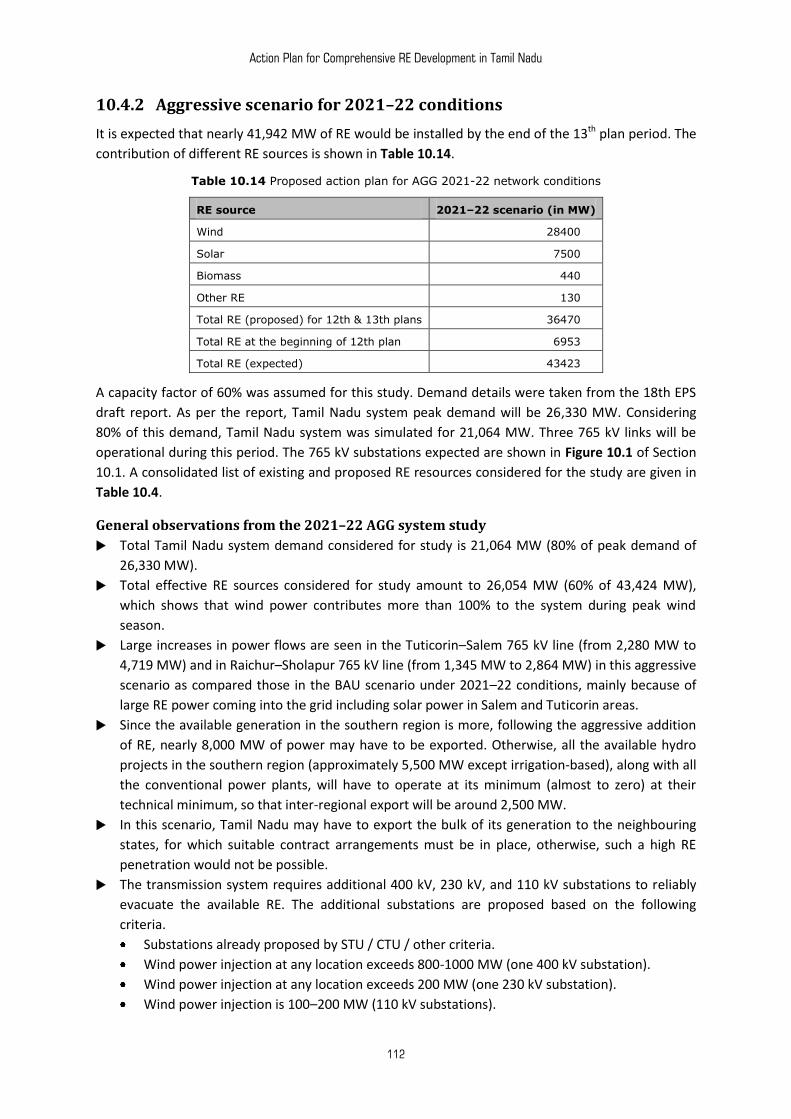
Action Plan for Comprehensive RE Development in Tamil Nadu
112
10.4.2 Aggressive scenario for 2021–22 conditions
It is expected that nearly 41,942 MW of RE would be installed by the end of the 13th plan period. The
contribution of different RE sources is shown in Table 10.14.
Table 10.14 Proposed action plan for AGG 2021-22 network conditions
RE source 2021–22 scenario (in MW)
Wind 28400
Solar 7500
Biomass 440
Other RE 130
Total RE (proposed) for 12th & 13th plans 36470
Total RE at the beginning of 12th plan 6953
Total RE (expected) 43423
A capacity factor of 60% was assumed for this study. Demand details were taken from the 18th EPS
draft report. As per the report, Tamil Nadu system peak demand will be 26,330 MW. Considering
80% of this demand, Tamil Nadu system was simulated for 21,064 MW. Three 765 kV links will be
operational during this period. The 765 kV substations expected are shown in Figure 10.1 of Section
10.1. A consolidated list of existing and proposed RE resources considered for the study are given in
Table 10.4.
General observations from the 2021–22 AGG system study
Total Tamil Nadu system demand considered for study is 21,064 MW (80% of peak demand of
26,330 MW).
Total effective RE sources considered for study amount to 26,054 MW (60% of 43,424 MW),
which shows that wind power contributes more than 100% to the system during peak wind
season.
Large increases in power flows are seen in the Tuticorin–Salem 765 kV line (from 2,280 MW to
4,719 MW) and in Raichur–Sholapur 765 kV line (from 1,345 MW to 2,864 MW) in this aggressive
scenario as compared those in the BAU scenario under 2021–22 conditions, mainly because of
large RE power coming into the grid including solar power in Salem and Tuticorin areas.
Since the available generation in the southern region is more, following the aggressive addition
of RE, nearly 8,000 MW of power may have to be exported. Otherwise, all the available hydro
projects in the southern region (approximately 5,500 MW except irrigation-based), along with all
the conventional power plants, will have to operate at its minimum (almost to zero) at their
technical minimum, so that inter-regional export will be around 2,500 MW.
In this scenario, Tamil Nadu may have to export the bulk of its generation to the neighbouring
states, for which suitable contract arrangements must be in place, otherwise, such a high RE
penetration would not be possible.
The transmission system requires additional 400 kV, 230 kV, and 110 kV substations to reliably
evacuate the available RE. The additional substations are proposed based on the following
criteria.
Substations already proposed by STU / CTU / other criteria.
Wind power injection at any location exceeds 800-1000 MW (one 400 kV substation).
Wind power injection at any location exceeds 200 MW (one 230 kV substation).
Wind power injection is 100–200 MW (110 kV substations).
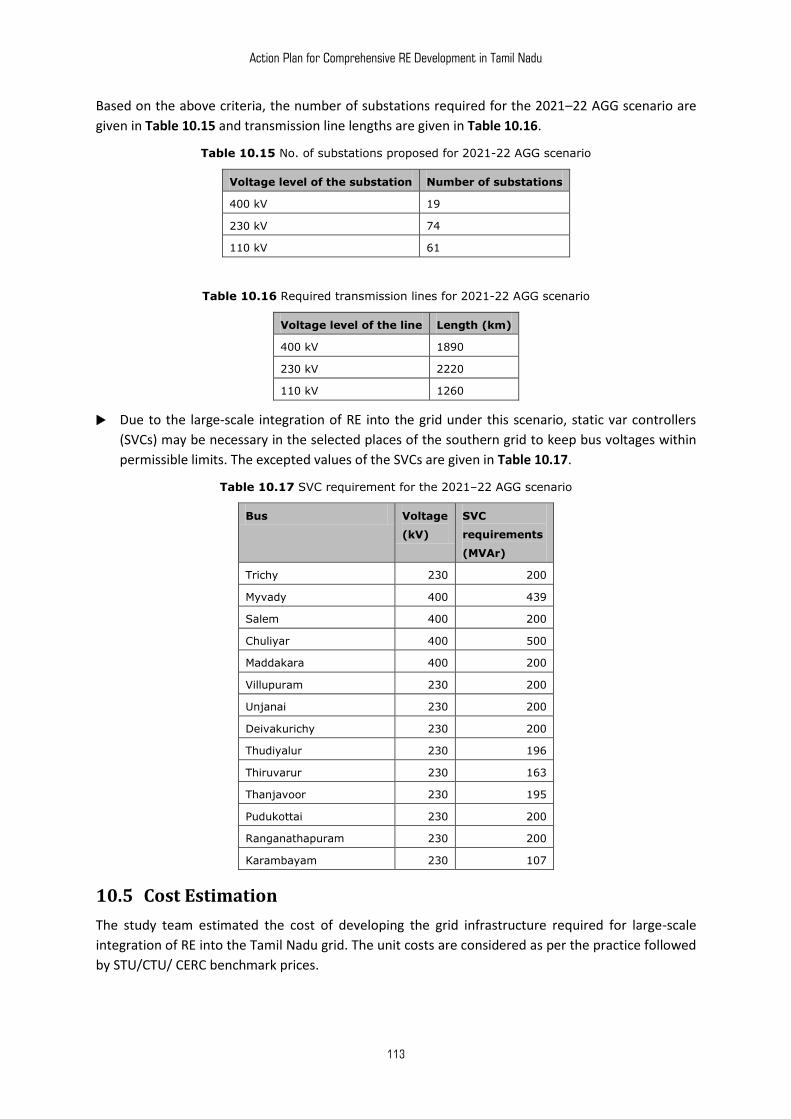
Action Plan for Comprehensive RE Development in Tamil Nadu
113
Based on the above criteria, the number of substations required for the 2021–22 AGG scenario are
given in Table 10.15 and transmission line lengths are given in Table 10.16.
Table 10.15 No. of substations proposed for 2021-22 AGG scenario
Voltage level of the substation Number of substations
400 kV 19
230 kV 74
110 kV 61
Table 10.16 Required transmission lines for 2021-22 AGG scenario
Voltage level of the line Length (km)
400 kV 1890
230 kV 2220
110 kV 1260
Due to the large-scale integration of RE into the grid under this scenario, static var controllers
(SVCs) may be necessary in the selected places of the southern grid to keep bus voltages within
permissible limits. The excepted values of the SVCs are given in Table 10.17.
Table 10.17 SVC requirement for the 2021–22 AGG scenario
Bus Voltage
(kV)
SVC
requirements
(MVAr)
Trichy 230 200
Myvady 400 439
Salem 400 200
Chuliyar 400 500
Maddakara 400 200
Villupuram 230 200
Unjanai 230 200
Deivakurichy 230 200
Thudiyalur 230 196
Thiruvarur 230 163
Thanjavoor 230 195
Pudukottai 230 200
Ranganathapuram 230 200
Karambayam 230 107
10.5 Cost Estimation
The study team estimated the cost of developing the grid infrastructure required for large-scale
integration of RE into the Tamil Nadu grid. The unit costs are considered as per the practice followed
by STU/CTU/ CERC benchmark prices.
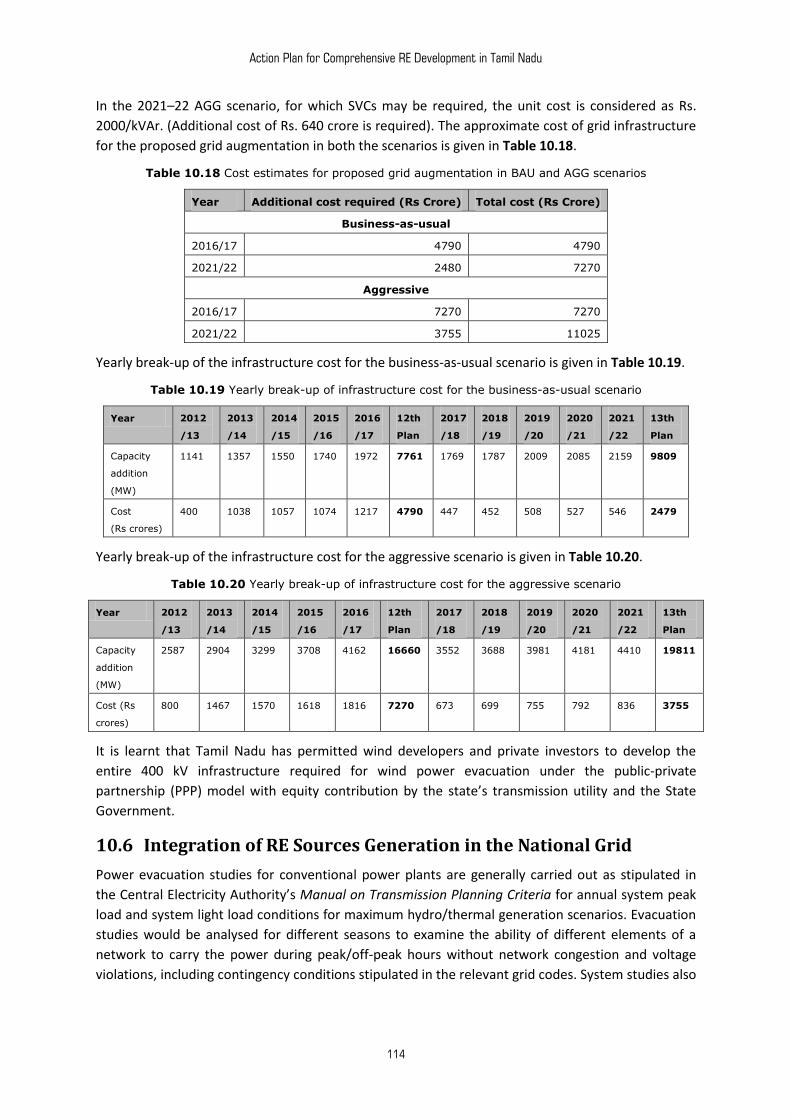
Action Plan for Comprehensive RE Development in Tamil Nadu
114
In the 2021–22 AGG scenario, for which SVCs may be required, the unit cost is considered as Rs.
2000/kVAr. (Additional cost of Rs. 640 crore is required). The approximate cost of grid infrastructure
for the proposed grid augmentation in both the scenarios is given in Table 10.18.
Table 10.18 Cost estimates for proposed grid augmentation in BAU and AGG scenarios
Year Additional cost required (Rs Crore) Total cost (Rs Crore)
Business-as-usual
2016/17 4790 4790
2021/22 2480 7270
Aggressive
2016/17 7270 7270
2021/22 3755 11025
Yearly break-up of the infrastructure cost for the business-as-usual scenario is given in Table 10.19.
Table 10.19 Yearly break-up of infrastructure cost for the business-as-usual scenario
Year 2012
/13
2013
/14
2014
/15
2015
/16
2016
/17
12th
Plan
2017
/18
2018
/19
2019
/20
2020
/21
2021
/22
13th
Plan
Capacity
addition
(MW)
1141 1357 1550 1740 1972 7761 1769 1787 2009 2085 2159 9809
Cost
(Rs crores)
400 1038 1057 1074 1217 4790 447 452 508 527 546 2479
Yearly break-up of the infrastructure cost for the aggressive scenario is given in Table 10.20.
Table 10.20 Yearly break-up of infrastructure cost for the aggressive scenario
Year 2012
/13
2013
/14
2014
/15
2015
/16
2016
/17
12th
Plan
2017
/18
2018
/19
2019
/20
2020
/21
2021
/22
13th
Plan
Capacity
addition
(MW)
2587 2904 3299 3708 4162 16660 3552 3688 3981 4181 4410 19811
Cost (Rs
crores)
800 1467 1570 1618 1816 7270 673 699 755 792 836 3755
It is learnt that Tamil Nadu has permitted wind developers and private investors to develop the
entire 400 kV infrastructure required for wind power evacuation under the public-private
partnership (PPP) model with equity contribution by the state’s transmission utility and the State
Government.
10.6 Integration of RE Sources Generation in the National Grid
Power evacuation studies for conventional power plants are generally carried out as stipulated in
the Central Electricity Authority’s Manual on Transmission Planning Criteria for annual system peak
load and system light load conditions for maximum hydro/thermal generation scenarios. Evacuation
studies would be analysed for different seasons to examine the ability of different elements of a
network to carry the power during peak/off-peak hours without network congestion and voltage
violations, including contingency conditions stipulated in the relevant grid codes. System studies also
Action Plan for Comprehensive RE Development in Tamil Nadu
115
examine whether voltage excursions are within limits, particularly during light load hours, and help
to suggest measures to keep the voltage within acceptable limits.
A true national grid with complete synchronous zone across the country is expected to be in place by
2014 with the commissioning of a 765 kV line between Raichur and Sholapur interconnecting the
Southern region with the new grid. This will facilitate exchange of surplus power between the
southern region and rest of the country. In addition, there is a plan for a 765 kV main corridor from
Tamil Nadu to Karnataka and Andhra Pradesh, which is likely to be commissioned in 2015.
RE projects like wind are generally at remote locations away from load centres, and long
transmission lines may be required to connect the projects to major load centres. Local substation
loads near the wind farm sites are also likely to be low during peak wind season. In such a scenario,
the entire wind generation may have to be transported to the nearest major grid substation for
further absorption in the grid and this ability of the network has to be checked in grid integration
studies. Hence, transmission planning for RE generation projects has to be carried out on a case-to-
case basis depending upon the topology of the local grid, spatial distribution of renewable sources,
and the total quantum of power to be evacuated.
Any large RE grid integration study in India has to recognize that peak RE generation season
(particularly of wind, which is in July/August in Tamil Nadu) does not coincide with the system peak
demand months (February/March). SRLDC data indicates that during peak wind season
(July/August), the peak system demand in Tamil Nadu is only around 80% of the annual system peak.
Wind generation pattern over the day in peak wind season (in August) in Tamil Nadu indicates that it
will occur during late afternoon (around 3.30 p.m. to 5 p.m.) on most days and the corresponding
system demand will be 80% of the annual peak demand in this season. Wind integration studies in
Tamil Nadu will therefore have to assume that system demand will be around 80% of the annual
peak during peak wind power injection periods. Peak wind season in the southern region covering
Karnataka, Andhra Pradesh (having substantial wind power potential), and Kerala is almost the same
as that in Tamil Nadu, i.e. June to September, except in Tamil Nadu, the season extends up to
November. Any wind integration study in the southern region has to recognize this aspect while
modelling the network and preparing load-generation balance for such studies. Further analysis of
hourly wind generation over a day indicates that in Karnataka and Andhra Pradesh, peak wind
generation will be at night or late evening hours and this diversity in peak wind generation between
states within a day is to be conveniently used to evacuate any excess wind power from Tamil Nadu
to adjacent states (and vice-versa) and balance RE power to adjacent regions without exceeding the
interconnecting tie line capacities and without backing down wind generation.
10.7 Operational Philosophy and Balancing Requirements with Large Scale Wind Integration
A major barrier to grid integration of large RE is its uncertainty (difference between forecast and
actual generation) and variability (change of output over a fixed interval of time). Because of its
dependence on the weather, the output cannot be guaranteed at any particular time. This makes
planning for the overall balance of the grid difficult, and biases utilities against using RE. Accurate
forecasting of power inputs from RE farms into the grid could improve the integration of RE by
reducing network operation issues caused by fluctuating wind power.
The CERC, recognizing this variability and uncertainty of RE, amended the Indian Electricity Grid Code
in April 2010 to allow flexibility to wind and solar plants in scheduling and dispatch of solar/wind
Action Plan for Comprehensive RE Development in Tamil Nadu
116
power. The new grid code of CERC mandates that all new RE power sources of 10 MW and above
and connected to the grid at 33 kV and above shall schedule power generation and provide a
forecast to the system operator. The code provides that a +/- 30% variation between scheduled and
actual RE power injections will not attract any penalties for the RE developer (with states taking all
the UI liabilities through RRF). Any variation beyond +/- 30% will be to the account of the RE
developers. Therefore, good short-term (day-ahead and 3-hour ahead) forecasting facilities of RE
power, especially for wind power, using modern tools are necessary to reduce forecasting errors and
reduce the impact of UI penalties. Grid operators will also need adequate tools to assimilate all the
forecasting data received from all the wind power developers/operators (as detailed in the new grid
code), and forecast possible wind generation from other existing wind farms (where forecasting
facilities are not mandated and hence not available). This is necessary to optimize generation
schedules from conventional power plants within the state or reschedule drawals from the central
generation, based on latest wind power forecasts. This 3-hour ahead forecast will reduce errors in
wind power forecasting and reduce the balancing requirement. Tamil Nadu, with its large RE
penetration will have to establish this grid-level RE forecasting facility at the earliest for better
operational flexibility, even with large RE penetration, and for reducing balancing requirements.
In order to schedule wind energy resources with acceptable accuracy based on an online monitoring
system, a short-term prediction system (a few hours ahead), a day-ahead forecast, and a WEMS is
recommended. The wind energy management system is a control system for wind farms in the
entire control area with the aim to reduce fluctuations in the energy fed into the grid by wind farms.
10.7.1 Wind Energy Management System
The wind energy management system is a control system for overall management of wind farms in a
state to manage intermittency and schedule power generation as done by the conventional sources.
The main tasks of the WEMS are given below.
Online monitoring of wind farms including data from wind turbines.
Wind forecasting in the short-term (a few hours ahead) and also a day-ahead.
Submitting a system-wide schedule to the SLDC.
Effective management of the resource with effective control based on instructions from the
SLDC.
Although online monitoring of wind farms that have been commissioned recently is possibly
equipped with the SCADA facility, the older wind farms may not have the necessary facility and it
would not be possible to obtain the necessary data from such farms. In this scenario, online
monitoring requires an evaluation model to extrapolate the total power fed in by the wind turbines
over a larger grid area or control area from the observed time series of power output of
representative wind farms.
The block diagram of WEMS is shown in Figure 10.2.
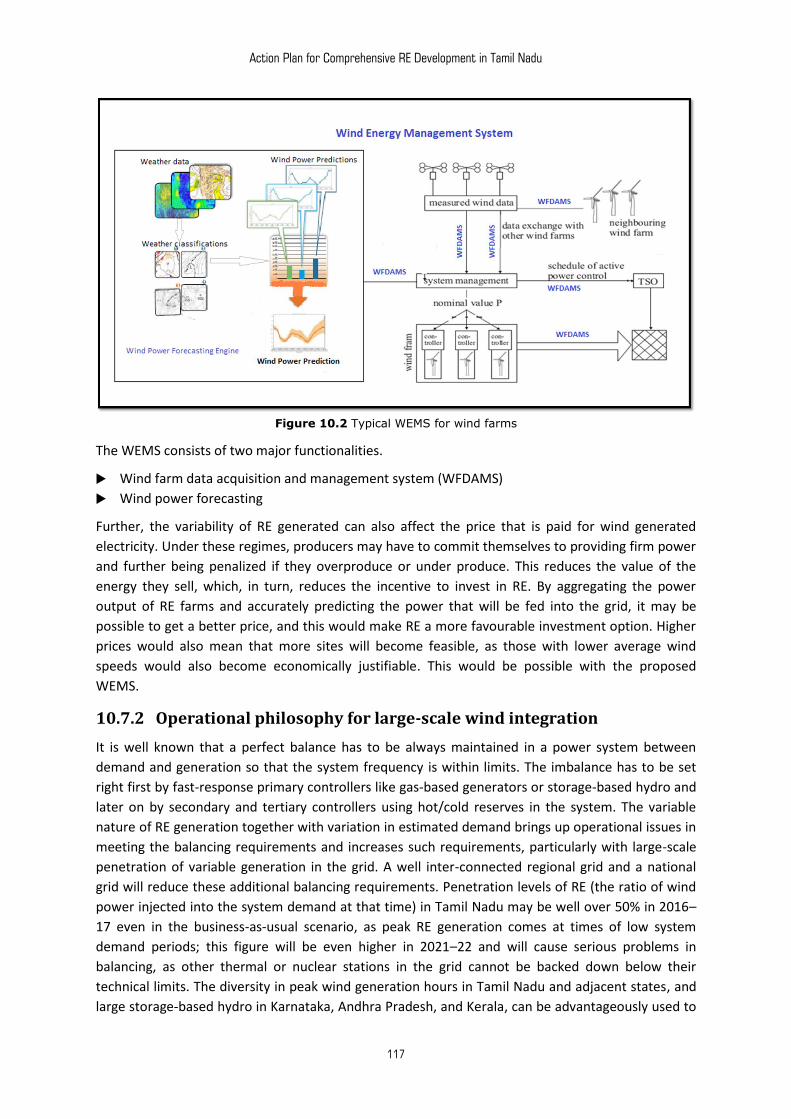
Action Plan for Comprehensive RE Development in Tamil Nadu
117
Figure 10.2 Typical WEMS for wind farms
The WEMS consists of two major functionalities.
Wind farm data acquisition and management system (WFDAMS)
Wind power forecasting
Further, the variability of RE generated can also affect the price that is paid for wind generated
electricity. Under these regimes, producers may have to commit themselves to providing firm power
and further being penalized if they overproduce or under produce. This reduces the value of the
energy they sell, which, in turn, reduces the incentive to invest in RE. By aggregating the power
output of RE farms and accurately predicting the power that will be fed into the grid, it may be
possible to get a better price, and this would make RE a more favourable investment option. Higher
prices would also mean that more sites will become feasible, as those with lower average wind
speeds would also become economically justifiable. This would be possible with the proposed
WEMS.
10.7.2 Operational philosophy for large-scale wind integration
It is well known that a perfect balance has to be always maintained in a power system between
demand and generation so that the system frequency is within limits. The imbalance has to be set
right first by fast-response primary controllers like gas-based generators or storage-based hydro and
later on by secondary and tertiary controllers using hot/cold reserves in the system. The variable
nature of RE generation together with variation in estimated demand brings up operational issues in
meeting the balancing requirements and increases such requirements, particularly with large-scale
penetration of variable generation in the grid. A well inter-connected regional grid and a national
grid will reduce these additional balancing requirements. Penetration levels of RE (the ratio of wind
power injected into the system demand at that time) in Tamil Nadu may be well over 50% in 2016–
17 even in the business-as-usual scenario, as peak RE generation comes at times of low system
demand periods; this figure will be even higher in 2021–22 and will cause serious problems in
balancing, as other thermal or nuclear stations in the grid cannot be backed down below their
technical limits. The diversity in peak wind generation hours in Tamil Nadu and adjacent states, and
large storage-based hydro in Karnataka, Andhra Pradesh, and Kerala, can be advantageously used to
Action Plan for Comprehensive RE Development in Tamil Nadu
118
meet the additional balancing requirements. The total storage based hydro and pumped storage
schemes in Karnataka, Andhra Pradesh, and Kerala amount to 7,723 MW in addition to 1,375 MW in
Tamil Nadu. This is about 70% of total RE power planned by 2016–17 in the business-as-usual
scenario and is likely to help in meeting the balance requirement of the entire southern region if
suitable regional operational plans are drawn up.
It is observed from the past data in the southern region that wind generation variation based on
similar-day forecasts (the least preferred form of forecast with the highest error) varies from less
than 10% during high wind to more than 50% during low wind. This translates to a variance (+ 2σ) of
700 MW during the high wind season with a probability of more than 95%, given the present
conditions. Further, unlike conventional generation, the reduction in wind generation is slower; it
takes a few minutes to reduce or increase 500 MW of wind generation, by which time the system
operator can respond if sufficient spinning reserves are available.
Analysis of past data also showed that during high wind season, contribution from hydro projects
varies from 3,000 MW to 6,500 MW. When wind power recorded its peak demand of 3,470 MW on
13 August 2011 for Tamil Nadu, hydro projects contributed around 5,500 MW in the southern
region. By reducing it to the minimum (very few run-of-the-river hydro projects are present in the
southern region and their contribution is not substantial), nearly 60%–70% of 5,500 MW can be
regulated and stored.
In future, the variation in the business-as-usual scenario would be around 1,700 MW and 2,800 MW
during 2016–17 and 2021–22 respectively. In the aggressive scenario, the corresponding figures are
2,800 MW and 5,200 MW with high probability. These variations can be better managed through
hydro resources and gas generators, along with operating the conventional thermal power plants at
their technical minimum. Further, there is a need to have a regional or national balancing
mechanism along with a special dispensation mechanism to compensate for UI.
Although the chances of the variation being much higher are small, that possibility needs to be
considered and dealt with through a special protection mechanism for inter-tripping of wind
generation combined with loads.
Based on the actual available RE generation, it is clear that Tamil Nadu will have surplus generation
in peak wind season and will have to export power to neighbouring states during 2016–17 in the
BAU scenario. In this scenario, all hydel projects in Tamil Nadu may have to operate at their
minimum or near zero-generation level (with all pumped storage schemes in pumping mode during
low system demand period), so that the generation can be balanced with demand. Stored water in
such hydro plants can be used during off-wind season. In addition, Tamil Nadu may have to enter
into contracts with the neighbouring states for sharing the balancing resources in those states to
fully absorb RE power.
In view of the large RE generation in Tamil Nadu in 2021–22, it is estimated that not only Tamil
Nadu, but the entire southern region will have surplus generation in this season in both the
scenarios. All hydel projects in the southern region will have to operate at their minimum or near-
zero along with conventional thermal power plants at their technical minimum (and planning annual
maintenance of their generating units in peak RE season). All the stored resources can be used for
the southern region during off-wind season based on techno-commercial considerations. In such a
scenario, the balancing cost of reduction in conventional power plants needs to be considered
because it entails the loss of PLF of these units.
Action Plan for Comprehensive RE Development in Tamil Nadu
119
Although it will be possible to evacuate the entire RE generation during the selected times frames, in
the aggressive scenario, it is to be noted that during high monsoon, when the reservoirs are full and
surplus water is being released, wind generation may also have to be curtailed to manageable limits.
10.8 Smart Grid
10.8.1 Smart transmission grid - need for RE systems
The large renewable capacity with wind generation as its main component is intermittent and, when
integrated into the grid, would make the monitoring and control of such large grid more complex.
The widespread grid and increasing complexities of its operation and that of the electricity market
require wide area monitoring, which may only be possible by the application of the emerging
synchrophasor technology. WAMS (wide area measurement system) is the key to achieving the
higher grid performance that is required in this changed scenario. WAMS requires installation of
phasor measurement units (PMUs) at the substations and power plants. The existing SCADA/EMS-
based grid operation can provide only a steady-state view of the power grid. PMU-based technology
with synchrophasor measurements over wide-area facilitates dynamic real-time measurements and
visualization of the power system, which are useful in monitoring safety and security of the grid as
well as in taking control/corrective actions. Developments in WAMS and other technologies in the
field of measurements, communication, control and automation, advanced meters, IT infrastructure,
energy storage, etc., have prominent roles to play in successful development of the smart grid.
Full implementation of WAMS technology would require installation of PMUs in each region (about
1000–1500 PMUs initially in the 12th five-year plan in India) and a reliable communication network
with very high bandwidth and least latency. Phasor data concentrators (about 30–60 initially in the
12th plan) are to be installed at various strategic grid locations and control centres. The state load
dispatch centres may have master Phasor Data Concentrators (PDC), and national and regional load
dispatch centres may have super PDCs working in hierarchy for real-time dynamic-state monitoring
of the complete national grid in a unified manner (Figure 10.3).These can be started in RE-rich states
like Tamil Nadu, Karnataka, Gujarat, Rajasthan, and Maharashtra, to help integrate renewable power
reliably with the grid. Better system monitoring with WAMS may reduce the network reinforcements
required for wind power, particularly because these power plants operate for only 4–6 months in a
year when ambient temperatures are low and higher thermal/dynamic loadings are possible on
associated networks.
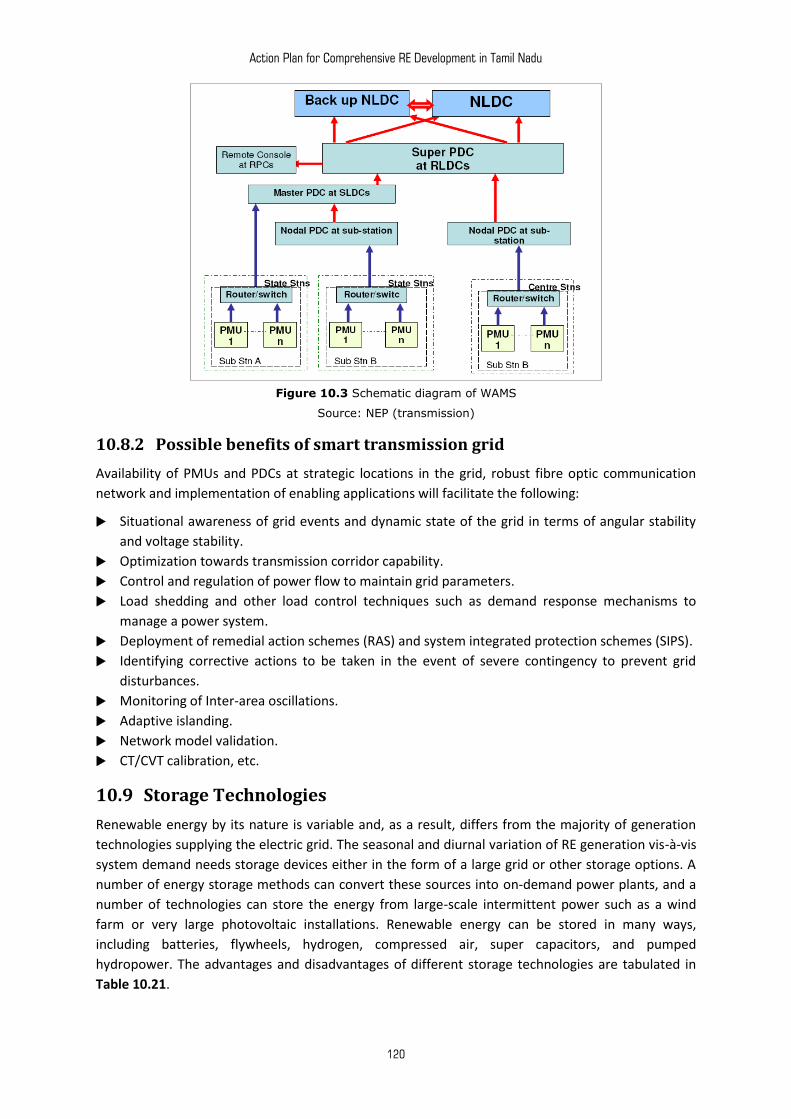
Action Plan for Comprehensive RE Development in Tamil Nadu
120
Figure 10.3 Schematic diagram of WAMS
Source: NEP (transmission)
10.8.2 Possible benefits of smart transmission grid
Availability of PMUs and PDCs at strategic locations in the grid, robust fibre optic communication
network and implementation of enabling applications will facilitate the following:
Situational awareness of grid events and dynamic state of the grid in terms of angular stability
and voltage stability.
Optimization towards transmission corridor capability.
Control and regulation of power flow to maintain grid parameters.
Load shedding and other load control techniques such as demand response mechanisms to
manage a power system.
Deployment of remedial action schemes (RAS) and system integrated protection schemes (SIPS).
Identifying corrective actions to be taken in the event of severe contingency to prevent grid
disturbances.
Monitoring of Inter-area oscillations.
Adaptive islanding.
Network model validation.
CT/CVT calibration, etc.
10.9 Storage Technologies
Renewable energy by its nature is variable and, as a result, differs from the majority of generation
technologies supplying the electric grid. The seasonal and diurnal variation of RE generation vis-à-vis
system demand needs storage devices either in the form of a large grid or other storage options. A
number of energy storage methods can convert these sources into on-demand power plants, and a
number of technologies can store the energy from large-scale intermittent power such as a wind
farm or very large photovoltaic installations. Renewable energy can be stored in many ways,
including batteries, flywheels, hydrogen, compressed air, super capacitors, and pumped
hydropower. The advantages and disadvantages of different storage technologies are tabulated in
Table 10.21.
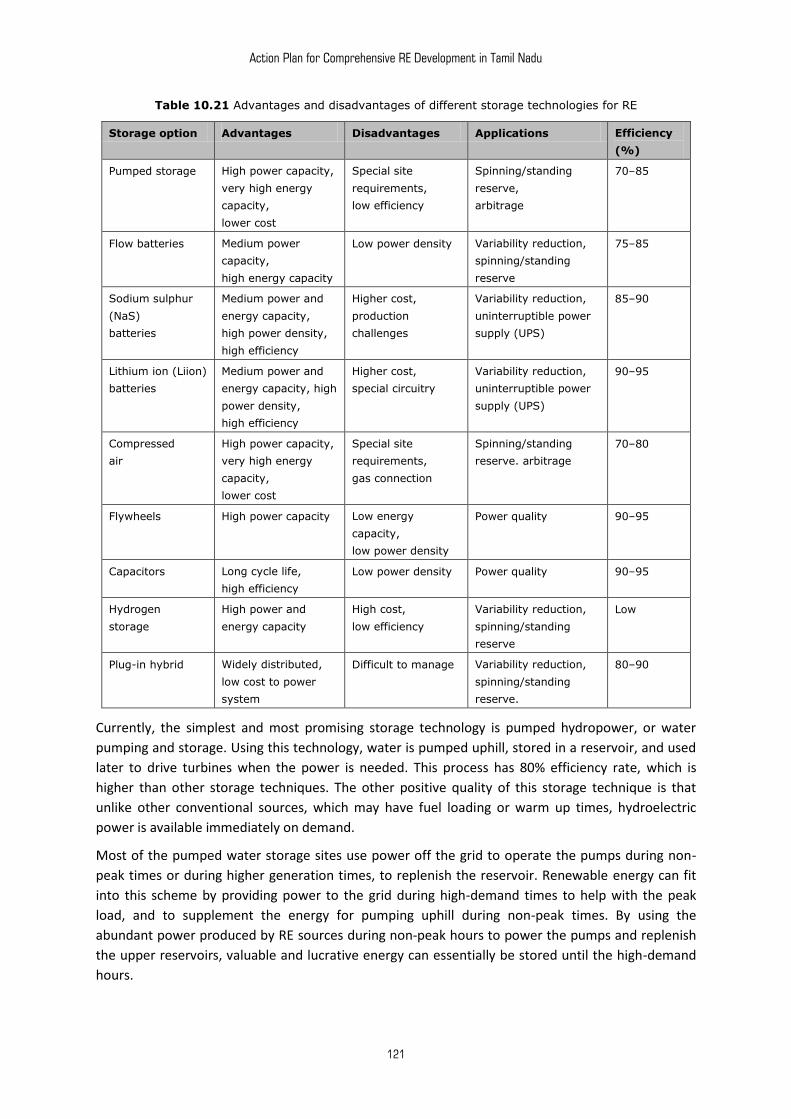
Action Plan for Comprehensive RE Development in Tamil Nadu
121
Table 10.21 Advantages and disadvantages of different storage technologies for RE
Storage option Advantages Disadvantages Applications Efficiency
(%)
Pumped storage High power capacity,
very high energy
capacity,
lower cost
Special site
requirements,
low efficiency
Spinning/standing
reserve,
arbitrage
70–85
Flow batteries Medium power
capacity,
high energy capacity
Low power density Variability reduction,
spinning/standing
reserve
75–85
Sodium sulphur
(NaS)
batteries
Medium power and
energy capacity,
high power density,
high efficiency
Higher cost,
production
challenges
Variability reduction,
uninterruptible power
supply (UPS)
85–90
Lithium ion (Liion)
batteries
Medium power and
energy capacity, high
power density,
high efficiency
Higher cost,
special circuitry
Variability reduction,
uninterruptible power
supply (UPS)
90–95
Compressed
air
High power capacity,
very high energy
capacity,
lower cost
Special site
requirements,
gas connection
Spinning/standing
reserve. arbitrage
70–80
Flywheels High power capacity Low energy
capacity,
low power density
Power quality 90–95
Capacitors Long cycle life,
high efficiency
Low power density Power quality 90–95
Hydrogen
storage
High power and
energy capacity
High cost,
low efficiency
Variability reduction,
spinning/standing
reserve
Low
Plug-in hybrid Widely distributed,
low cost to power
system
Difficult to manage Variability reduction,
spinning/standing
reserve.
80–90
Currently, the simplest and most promising storage technology is pumped hydropower, or water
pumping and storage. Using this technology, water is pumped uphill, stored in a reservoir, and used
later to drive turbines when the power is needed. This process has 80% efficiency rate, which is
higher than other storage techniques. The other positive quality of this storage technique is that
unlike other conventional sources, which may have fuel loading or warm up times, hydroelectric
power is available immediately on demand.
Most of the pumped water storage sites use power off the grid to operate the pumps during non-
peak times or during higher generation times, to replenish the reservoir. Renewable energy can fit
into this scheme by providing power to the grid during high-demand times to help with the peak
load, and to supplement the energy for pumping uphill during non-peak times. By using the
abundant power produced by RE sources during non-peak hours to power the pumps and replenish
the upper reservoirs, valuable and lucrative energy can essentially be stored until the high-demand
hours.
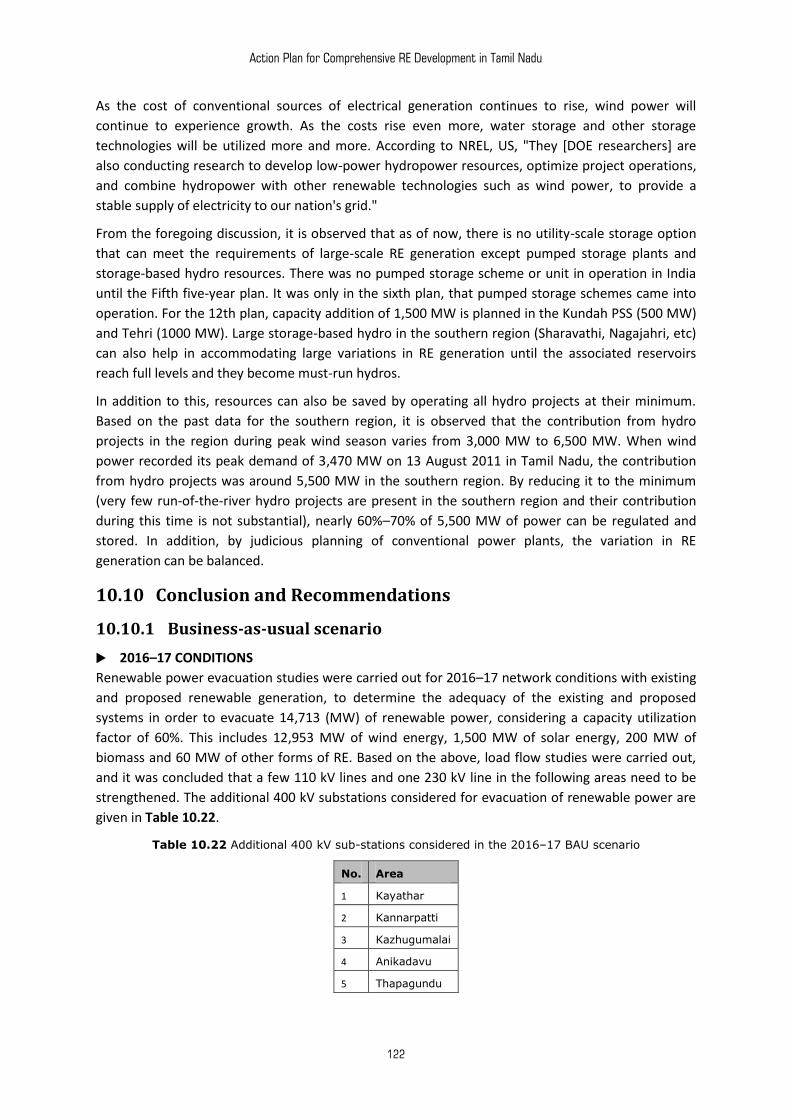
Action Plan for Comprehensive RE Development in Tamil Nadu
122
As the cost of conventional sources of electrical generation continues to rise, wind power will
continue to experience growth. As the costs rise even more, water storage and other storage
technologies will be utilized more and more. According to NREL, US, "They [DOE researchers] are
also conducting research to develop low-power hydropower resources, optimize project operations,
and combine hydropower with other renewable technologies such as wind power, to provide a
stable supply of electricity to our nation's grid."
From the foregoing discussion, it is observed that as of now, there is no utility-scale storage option
that can meet the requirements of large-scale RE generation except pumped storage plants and
storage-based hydro resources. There was no pumped storage scheme or unit in operation in India
until the Fifth five-year plan. It was only in the sixth plan, that pumped storage schemes came into
operation. For the 12th plan, capacity addition of 1,500 MW is planned in the Kundah PSS (500 MW)
and Tehri (1000 MW). Large storage-based hydro in the southern region (Sharavathi, Nagajahri, etc)
can also help in accommodating large variations in RE generation until the associated reservoirs
reach full levels and they become must-run hydros.
In addition to this, resources can also be saved by operating all hydro projects at their minimum.
Based on the past data for the southern region, it is observed that the contribution from hydro
projects in the region during peak wind season varies from 3,000 MW to 6,500 MW. When wind
power recorded its peak demand of 3,470 MW on 13 August 2011 in Tamil Nadu, the contribution
from hydro projects was around 5,500 MW in the southern region. By reducing it to the minimum
(very few run-of-the-river hydro projects are present in the southern region and their contribution
during this time is not substantial), nearly 60%–70% of 5,500 MW of power can be regulated and
stored. In addition, by judicious planning of conventional power plants, the variation in RE
generation can be balanced.
10.10 Conclusion and Recommendations
10.10.1 Business-as-usual scenario
2016–17 CONDITIONS
Renewable power evacuation studies were carried out for 2016–17 network conditions with existing
and proposed renewable generation, to determine the adequacy of the existing and proposed
systems in order to evacuate 14,713 (MW) of renewable power, considering a capacity utilization
factor of 60%. This includes 12,953 MW of wind energy, 1,500 MW of solar energy, 200 MW of
biomass and 60 MW of other forms of RE. Based on the above, load flow studies were carried out,
and it was concluded that a few 110 kV lines and one 230 kV line in the following areas need to be
strengthened. The additional 400 kV substations considered for evacuation of renewable power are
given in Table 10.22.
Table 10.22 Additional 400 kV sub-stations considered in the 2016–17 BAU scenario
No. Area
1 Kayathar
2 Kannarpatti
3 Kazhugumalai
4 Anikadavu
5 Thapagundu
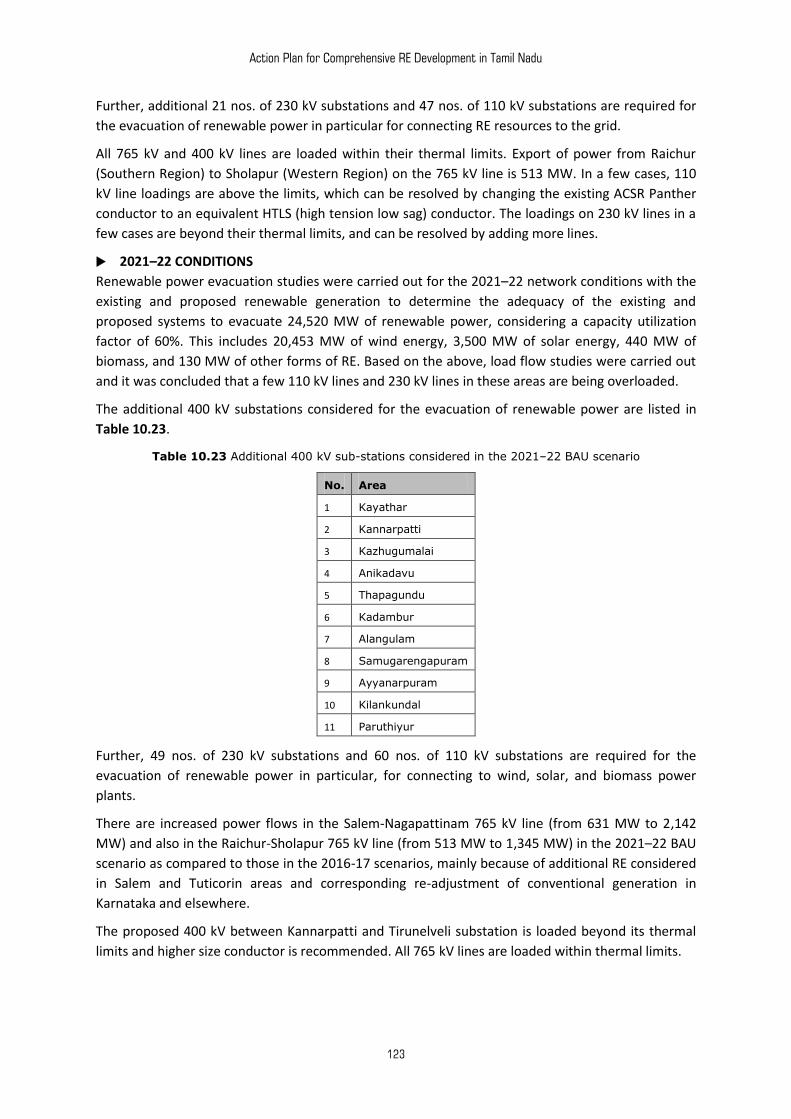
Action Plan for Comprehensive RE Development in Tamil Nadu
123
Further, additional 21 nos. of 230 kV substations and 47 nos. of 110 kV substations are required for
the evacuation of renewable power in particular for connecting RE resources to the grid.
All 765 kV and 400 kV lines are loaded within their thermal limits. Export of power from Raichur
(Southern Region) to Sholapur (Western Region) on the 765 kV line is 513 MW. In a few cases, 110
kV line loadings are above the limits, which can be resolved by changing the existing ACSR Panther
conductor to an equivalent HTLS (high tension low sag) conductor. The loadings on 230 kV lines in a
few cases are beyond their thermal limits, and can be resolved by adding more lines.
2021–22 CONDITIONS
Renewable power evacuation studies were carried out for the 2021–22 network conditions with the
existing and proposed renewable generation to determine the adequacy of the existing and
proposed systems to evacuate 24,520 MW of renewable power, considering a capacity utilization
factor of 60%. This includes 20,453 MW of wind energy, 3,500 MW of solar energy, 440 MW of
biomass, and 130 MW of other forms of RE. Based on the above, load flow studies were carried out
and it was concluded that a few 110 kV lines and 230 kV lines in these areas are being overloaded.
The additional 400 kV substations considered for the evacuation of renewable power are listed in
Table 10.23.
Table 10.23 Additional 400 kV sub-stations considered in the 2021–22 BAU scenario
No. Area
1 Kayathar
2 Kannarpatti
3 Kazhugumalai
4 Anikadavu
5 Thapagundu
6 Kadambur
7 Alangulam
8 Samugarengapuram
9 Ayyanarpuram
10 Kilankundal
11 Paruthiyur
Further, 49 nos. of 230 kV substations and 60 nos. of 110 kV substations are required for the
evacuation of renewable power in particular, for connecting to wind, solar, and biomass power
plants.
There are increased power flows in the Salem-Nagapattinam 765 kV line (from 631 MW to 2,142
MW) and also in the Raichur-Sholapur 765 kV line (from 513 MW to 1,345 MW) in the 2021–22 BAU
scenario as compared to those in the 2016-17 scenarios, mainly because of additional RE considered
in Salem and Tuticorin areas and corresponding re-adjustment of conventional generation in
Karnataka and elsewhere.
The proposed 400 kV between Kannarpatti and Tirunelveli substation is loaded beyond its thermal
limits and higher size conductor is recommended. All 765 kV lines are loaded within thermal limits.
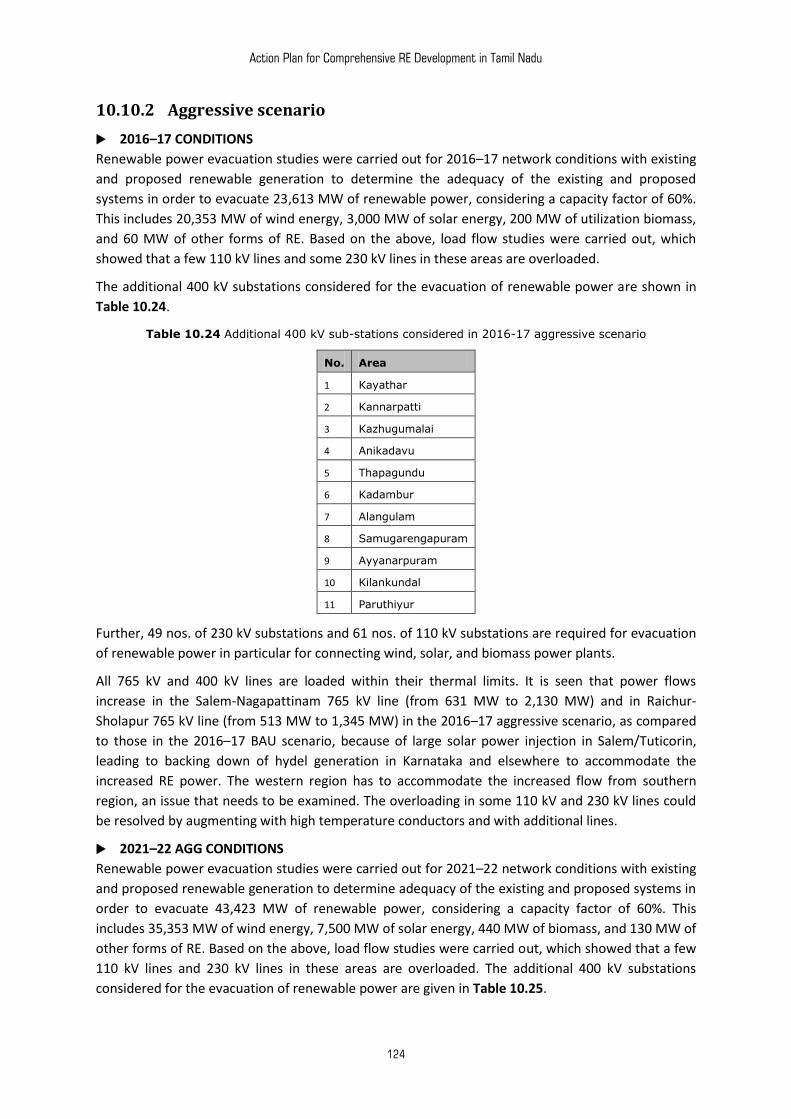
Action Plan for Comprehensive RE Development in Tamil Nadu
124
10.10.2 Aggressive scenario
2016–17 CONDITIONS
Renewable power evacuation studies were carried out for 2016–17 network conditions with existing
and proposed renewable generation to determine the adequacy of the existing and proposed
systems in order to evacuate 23,613 MW of renewable power, considering a capacity factor of 60%.
This includes 20,353 MW of wind energy, 3,000 MW of solar energy, 200 MW of utilization biomass,
and 60 MW of other forms of RE. Based on the above, load flow studies were carried out, which
showed that a few 110 kV lines and some 230 kV lines in these areas are overloaded.
The additional 400 kV substations considered for the evacuation of renewable power are shown in
Table 10.24.
Table 10.24 Additional 400 kV sub-stations considered in 2016-17 aggressive scenario
No. Area
1 Kayathar
2 Kannarpatti
3 Kazhugumalai
4 Anikadavu
5 Thapagundu
6 Kadambur
7 Alangulam
8 Samugarengapuram
9 Ayyanarpuram
10 Kilankundal
11 Paruthiyur
Further, 49 nos. of 230 kV substations and 61 nos. of 110 kV substations are required for evacuation
of renewable power in particular for connecting wind, solar, and biomass power plants.
All 765 kV and 400 kV lines are loaded within their thermal limits. It is seen that power flows
increase in the Salem-Nagapattinam 765 kV line (from 631 MW to 2,130 MW) and in Raichur-
Sholapur 765 kV line (from 513 MW to 1,345 MW) in the 2016–17 aggressive scenario, as compared
to those in the 2016–17 BAU scenario, because of large solar power injection in Salem/Tuticorin,
leading to backing down of hydel generation in Karnataka and elsewhere to accommodate the
increased RE power. The western region has to accommodate the increased flow from southern
region, an issue that needs to be examined. The overloading in some 110 kV and 230 kV lines could
be resolved by augmenting with high temperature conductors and with additional lines.
2021–22 AGG CONDITIONS
Renewable power evacuation studies were carried out for 2021–22 network conditions with existing
and proposed renewable generation to determine adequacy of the existing and proposed systems in
order to evacuate 43,423 MW of renewable power, considering a capacity factor of 60%. This
includes 35,353 MW of wind energy, 7,500 MW of solar energy, 440 MW of biomass, and 130 MW of
other forms of RE. Based on the above, load flow studies were carried out, which showed that a few
110 kV lines and 230 kV lines in these areas are overloaded. The additional 400 kV substations
considered for the evacuation of renewable power are given in Table 10.25.
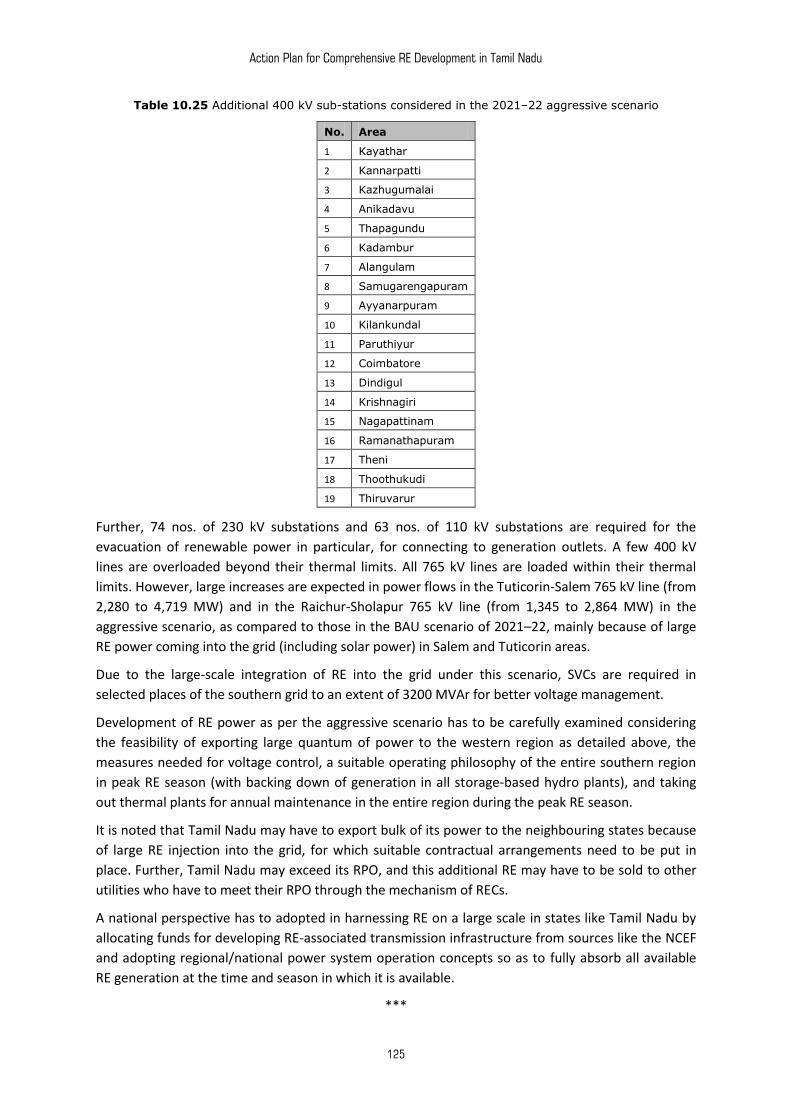
Action Plan for Comprehensive RE Development in Tamil Nadu
125
Table 10.25 Additional 400 kV sub-stations considered in the 2021–22 aggressive scenario
No. Area
1 Kayathar
2 Kannarpatti
3 Kazhugumalai
4 Anikadavu
5 Thapagundu
6 Kadambur
7 Alangulam
8 Samugarengapuram
9 Ayyanarpuram
10 Kilankundal
11 Paruthiyur
12 Coimbatore
13 Dindigul
14 Krishnagiri
15 Nagapattinam
16 Ramanathapuram
17 Theni
18 Thoothukudi
19 Thiruvarur
Further, 74 nos. of 230 kV substations and 63 nos. of 110 kV substations are required for the
evacuation of renewable power in particular, for connecting to generation outlets. A few 400 kV
lines are overloaded beyond their thermal limits. All 765 kV lines are loaded within their thermal
limits. However, large increases are expected in power flows in the Tuticorin-Salem 765 kV line (from
2,280 to 4,719 MW) and in the Raichur-Sholapur 765 kV line (from 1,345 to 2,864 MW) in the
aggressive scenario, as compared to those in the BAU scenario of 2021–22, mainly because of large
RE power coming into the grid (including solar power) in Salem and Tuticorin areas.
Due to the large-scale integration of RE into the grid under this scenario, SVCs are required in
selected places of the southern grid to an extent of 3200 MVAr for better voltage management.
Development of RE power as per the aggressive scenario has to be carefully examined considering
the feasibility of exporting large quantum of power to the western region as detailed above, the
measures needed for voltage control, a suitable operating philosophy of the entire southern region
in peak RE season (with backing down of generation in all storage-based hydro plants), and taking
out thermal plants for annual maintenance in the entire region during the peak RE season.
It is noted that Tamil Nadu may have to export bulk of its power to the neighbouring states because
of large RE injection into the grid, for which suitable contractual arrangements need to be put in
place. Further, Tamil Nadu may exceed its RPO, and this additional RE may have to be sold to other
utilities who have to meet their RPO through the mechanism of RECs.
A national perspective has to adopted in harnessing RE on a large scale in states like Tamil Nadu by
allocating funds for developing RE-associated transmission infrastructure from sources like the NCEF
and adopting regional/national power system operation concepts so as to fully absorb all available
RE generation at the time and season in which it is available.
***

Action Plan for Comprehensive RE Development in Tamil Nadu
126
Action Plan for Comprehensive RE Development in Tamil Nadu
127
PART – IV
RE ACTION PLAN & IMPLEMENTATION ROADMAP FOR TAMIL NADU

Action Plan for Comprehensive RE Development in Tamil Nadu
128
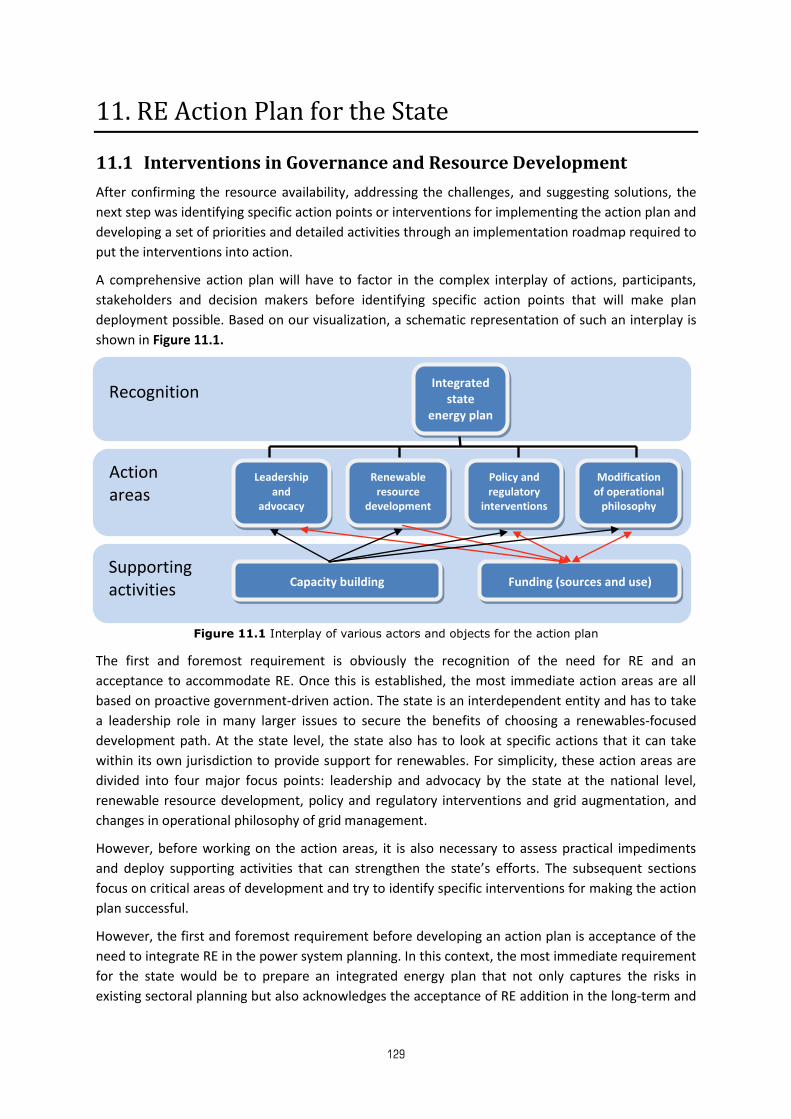
Action Plan for Comprehensive RE Development in Tamil Nadu
129
11. RE Action Plan for the State
11.1 Interventions in Governance and Resource Development
After confirming the resource availability, addressing the challenges, and suggesting solutions, the
next step was identifying specific action points or interventions for implementing the action plan and
developing a set of priorities and detailed activities through an implementation roadmap required to
put the interventions into action.
A comprehensive action plan will have to factor in the complex interplay of actions, participants,
stakeholders and decision makers before identifying specific action points that will make plan
deployment possible. Based on our visualization, a schematic representation of such an interplay is
shown in Figure 11.1.
Figure 11.1 Interplay of various actors and objects for the action plan
The first and foremost requirement is obviously the recognition of the need for RE and an
acceptance to accommodate RE. Once this is established, the most immediate action areas are all
based on proactive government-driven action. The state is an interdependent entity and has to take
a leadership role in many larger issues to secure the benefits of choosing a renewables-focused
development path. At the state level, the state also has to look at specific actions that it can take
within its own jurisdiction to provide support for renewables. For simplicity, these action areas are
divided into four major focus points: leadership and advocacy by the state at the national level,
renewable resource development, policy and regulatory interventions and grid augmentation, and
changes in operational philosophy of grid management.
However, before working on the action areas, it is also necessary to assess practical impediments
and deploy supporting activities that can strengthen the state’s efforts. The subsequent sections
focus on critical areas of development and try to identify specific interventions for making the action
plan successful.
However, the first and foremost requirement before developing an action plan is acceptance of the
need to integrate RE in the power system planning. In this context, the most immediate requirement
for the state would be to prepare an integrated energy plan that not only captures the risks in
existing sectoral planning but also acknowledges the acceptance of RE addition in the long-term and
Supporting activities
Action areas
Recognition Integrated
state energy plan
Leadership and
advocacy
Renewable resource
development
Policy and regulatory
interventions
Modification of operational
philosophy
Capacity building Funding (sources and use)
Action Plan for Comprehensive RE Development in Tamil Nadu
130
approves targets for RE capacity-addition for the 12th and 13th five-year plans. Once such a plan is
in place, the next actions are all based on proactive government-driven steps in the identified areas
of focus.
11.1.1 Leadership and advocacy by the state at the national level
Tamil Nadu has the distinction of being the leading state in RE development, especially wind. With
present wind installations accounting for 40% of total nationwide installed capacity coupled with an
ambitious solar policy, the state is all set to surpass its past record and take the lead over other
states. However, where actual implementation of RE is concerned in the coming years, it cannot
happen in isolation. Tamil Nadu will have to take a leadership role at the national level on issues that
impact the power sector and its ability to integrate renewable energy generation capacity effectively
into the grid. Some of the main issues in which the state will have to play a leadership role are:
Advocate changes in the power planning process at the national level
The need to integrate renewable energy capacity additions in the planning process has already been
mooted in the MoP document. However, considering the present RE installations and expected new
capacity additions, the state has to take a leading role in ensuring that the process is formalized and
put into practice as soon as possible.
Conduct a detailed grid study to assess power system stability and load flow at inter-state
and inter-regional levels
A detailed study is required to assess the actual effects of such high renewable penetration on
power system safety and protection aspects, not only for the state, but also for the southern region,
and finally for the national grid. The study can also assess the proposed plan from the perspective of
inter-state and inter-regional corridor capacity to evacuate power and to flag requirements of new
inter-regional or inter-state transmission lines. This study can only be done by involving expert
system consultants and national-level agencies like CEA and RLDCs, who are involved in planning and
operations.
Demand early commissioning of the inter-regional link to facilitate operationalization of
the national grid
The proposed renewable energy plan will effectively mean that Tamil Nadu and even the southern
region will become power surplus in 2021-22. In such a scenario, the availability of an inter-regional
corridor to evacuate power to the western and northern regions will be necessary. The state will
have to highlight the criticality of an inter-regional link and its timely completion at appropriate fora,
including the plan panel and CEA, to ensure early commissioning of such corridors.
Advocate creation of an ancillary market to enable intra-day and spot trading of power
Formulation of enabling regulatory provisions to facilitate creation of short-term and spot power
markets would provide maximum benefit to the state by allowing it to trade surplus power at higher
costs and buy deficit power at lower costs. The state can take the lead in approaching the central
regulator or MoP to enact enabling provisions for facilitating creation of such ancillary markets.
Streamlining approval processes for offshore wind
Preliminary GIS-based assessment indicates huge offshore potential in Tamil Nadu. Offshore
represents a very good opportunity for the state, primarily because a large-capacity cluster would
not affect land, would have more predictable generation and would not be as distributed as onshore
wind, making it easier to manage issues of the transmission corridor. Considering the present status
Action Plan for Comprehensive RE Development in Tamil Nadu
131
of offshore development in India, the state has to take a proactive role by identifying and approving
possible sites for offshore development. It is learnt that MNRE has already prepared a policy paper
for off-shore, which is in the draft stage but may be released soon.
11.1.2 Capacity building plan for state government agencies
All state agencies directly or indirectly related to the power sector have to be strengthened both in
terms of personnel strength and in terms of overall management (administrative, financial and
technical). The five main state-based entities identified for capacity-building are the Department of
Energy, TEDA, TNEB (including generation and transmission companies), TNERC, and the State
Planning Commission.
The capacity building plan for these entities has to mainly focus on technical capacity building and
sensitization to renewables. The Department of Energy, the State Planning Commission and TNERC
have to be sensitized to the need and benefits of RE, whereas TEDA, TANTRANSCO, TANGEDCO and
SLDC have to be strengthened mainly on the technology and grid management side.
In addition, the capacity-addition plan also has to include aspects related to organizational
restructuring, planning/procedures/rules/laws, management information system, human resource
development, financial management, financial autonomy, communication/outreach strategy and
most importantly, training needs identification for RE-specific aspects related to policy, regulation,
technology, grid impact, finance, etc.
The first requirement in this regard will be a report on training needs assessment in terms of specific
RE-related focus areas and development of an agency-specific curriculum and training course for
ensuring that each agency and its senior staff have a 360 degree perspective on RE.
11.1.3 Renewable Resource Development
The renewable resource re-assessment exercise indicates an RE potential significantly greater than
the existing estimates. The GIS-based assessment for grid-tied wind and solar power has provided
significant data in spatial terms and important takeaways for energy sector planning and policy
design. The following action points summarize the required interventions in renewable resource
development.
The available modelled datasets (NASA, NREL, Meteonorm, SolarGIS, etc.) have substantial
variations in the values of direct normal irradiance. At the ground level, a large deviation in DNI
value can affect the economics of any CSP project substantially because solar irradiance
requirements for CSP are more stringent than those of solar PV. In this context, it is important
for the state to assess the solar resource potential areas and notify them so that investors are
assured of a minimum availability of resource and carry out due diligence for installing CSP
projects on the identified locations. This is important as CSP investors would be more interested
in developing projects only at known locations in western India. According to our analysis based
on NREL data, the best locations for installing solar DNI measuring instruments (pyrheliometers)
would be in Thottukudi, Tirunelveli, Tirupur and Krishnagiri districts. Preliminary estimates
indicate that installing about 20–30 such instruments spread across these locations would not
cost more than Rs. 70 lakh.
The second area that requires validation is the installation of offshore wind masts. In the present
scenario, the policy vacuum in offshore wind is not attracting private development in offshore
resource assessment. In this area also, state intervention and direct investments would give the
Action Plan for Comprehensive RE Development in Tamil Nadu
132
state an idea of the developable potential. The resource data collected for these offshore
locations can then be shared with private developers on cost basis as and when required. CWET
is in the process of installing a mast near Ramanathapuram [Ref 38]. Based on our resource
assessment, installing additional masts off the coast at southern Thottukudi and Tirunelveli
would be a substantial value addition. Initially, installation of 10 offshore wind masts across
these locations would provide term data on offshore wind resource that would be readily
available for quick deployment of turbines. Rough estimates indicate a total cost for these masts
at Rs. 50 crore.
The third area of resource validation would be assessment of biomass resource utilization at the
taluka level. The results of this assessment can be used to prioritize highest-value residues based
on their end-use importance and combustion potential. The state can then enact suitable
regulations to control diversion/collection of such agro-residues.
11.1.4 Establishing pilot projects
Developing CSP pilots
CSP potential, although estimated at 78,505 MW using the NREL dataset, is not recommended for
immediate private development. There are considerable differences in DNI data between various
modelled datasets, with other (SolarGIS) datasets indicating no CSP potential in Tamil Nadu. As DNI
is derived data, the assumptions that go between the measurements and the derived value impact
the end results. In the absence of any validation of one dataset over another, any decision on CSP
potential cannot be done unless validated by field experience. Considering this, it will be advisable
for the government to install small pilot plants through its own funds and understand the resource
and the generation profile before asking private investors to scale it up. A small-scale set of two 5
MW projects, one with storage and one without storage, can be planned in Thottukudi and Tirupur.
Pilot for energy plantation
While there is no dispute that energy plantations should only be promoted in designated non-
farmland areas, the availability of water for such areas is a big question mark. Furthermore, the
projected yield figure of 200 acres/MW for species like Beema bamboo and Napier bajra grass seem
to be very high, considering traditional yields of other energy plantation species. Even if the yield is
assumed to be sustainable, land utilization for energy plantation at 1.25 MW/sq. km is simply too
low as compared to wind at 7 MW/sq. km and solar PV at 50 MW/sq. km. Furthermore, considering
the unproven capability of these new energy plantation species, it would be advisable to establish a
pilot project to validate the capability of this alternative before actually making a large-scale policy
commitment.
11.2 Interventions in Policy and Regulatory Implementation
11.2.1 Policy Interventions
At present, Tamil Nadu has no notified RE policy, though TEDA, has prepared an RE policy draft,
which is awaiting approval. In the absence of a notified policy draft, a state-specific policy-oriented
exercise was undertaken to understand areas in which targeted policy interventions can make the
maximum impact. Based on the analysis, the following interventions are suggested.
Creation of a state clean energy fund
The state can choose to levy green cess on electricity consumption by industrial and commercial
consumers. It would be easier to amend existing legislation through an ordinance to impose this
Action Plan for Comprehensive RE Development in Tamil Nadu
133
levy. While laying down the procedures for utilization of the green cess by creating a ‘Clean Energy
Fund’, it would helpful to study the Maharashtra experience. Maharashtra was the first state to
impose such a cess and its implementation experience would help in avoiding loopholes. It should be
ensured that the cess is fully passed on to TEDA and proper norms are laid down to ensure its
effective utilization solely for RE development.
Land policy for renewable projects
Land availability is a major constraint for deployment of large-scale, grid-tied renewables.
Furthermore, different land acquisition models (lease, outright sale, etc.) and the procedure for
acquiring land (even revenue land) is time consuming and costly. For wind power, there are right of
way (ROW) issues that lead to thefts or hamper development during the installation and operation
stages. For solar projects, acquisition of large tracts of contiguous land could also be a constraint
considering the small land holdings and availability of large wasteland tracts. A comprehensive land
policy that specifies revenue land allocation policy, mixed land use criteria in addition to clear
recommendatory guidelines for private land acquisition, and provisions related to RoW will go a long
way in addressing bottlenecks.
Approval of pending wind project applications
There are about 13,400 MW of project applications pending with TNEB. The main reason for delay in
approvals seem to be the inadequacy of the existing infrastructure to evacuate the proposed power.
Prolonged delay in project approvals is one of the biggest impediments to accelerated wind
deployment. Urgent and effective actions are needed to grant express approvals to pending
projects.
Policy on PPP partnerships for development of RE pilot projects
For solar power development, especially CSP, it is important to verify the availability of commercially
feasible potential through small pilot studies. The state can opt for a specific pilot project
development model through innovative mechanisms like PPP. Possible multilateral or bilateral
funding can be secured for such an initiative. This model, once a part of RE policy, can be replicated
for development of new and unexplored technologies including offshore wind, tidal and wave
energy systems.
Strengthening of policy and approval process for biomass projects
The unexploited biomass potential in Tamil Nadu is only to the tune of about 440 MW. While the
main advantage of biomass power generation is its firm nature, the actual possibilities of scale-up
seem limited. Based on the report, the surplus biomass availability itself is very low, and is calculated
after discounting all alternative uses of a particular biomass residue. Understandably, the surplus
biomass availability varies with production, location, season and price. Furthermore, past experience
indicates that biomass prices see substantial variation based on the claimant’s ability to pay. Many
organic products (cardboard, etc.) using such surplus biomass can pay a higher price than that paid
by power producers, who have to bear significant overheads in addition to fuel costs. There have
been instances of suppliers hiking biomass prices after the power plant comes into operation,
resulting in significant losses for the investors. The price increases are also known to divert
traditional fodder to the biomass plants, affecting marginalized communities who require cheap
fodder for their cattle. Furthermore, the practice of using biomass plants as a backdoor for installing
coal-based plants is also affecting the credibility of biomass resources. Considering the present
market dynamics, even at project-level planning, substantial due diligence has to be shown by the
Action Plan for Comprehensive RE Development in Tamil Nadu
134
investor and the approving authority. The immediate measure is strengthening of the policy and
approval processes. Another way of partly mitigating adverse impacts is to promote small-scale
plants, initially approving small plants in defined areas and encouraging them to expand after a
certain period of stipulated technical and successful commercial operation.
Relaxation of micrositing criteria for wind
Another area of concern is TNEB’s insistence of the 5D × 7D turbine spacing rule. Worldwide,
micrositing criteria are decided by the developer based on the site topography, wind profile and
other techno-economic parameters. Furthermore, as the main objective of micrositing is to optimize
energy yield, which only concerns the investor and the supplier, there is no role of any third agency
in dictating the micrositing parameter. Even in India, all the major wind power states (except
Maharashtra) have no compulsory micrositing criteria. In this context, TNEB’s insistence of 5D × 7D
criteria is perplexing. As a way forward, TNEB has to relax this criterion and give liberty to the wind
developers to freely site their turbines based on scientific optimization processes.
Clearances for repowering
As Tamil Nadu hosts some of the oldest turbines in India at the best wind resource sites, it has
significant potential for repowering. However, TNEB’s insistence on continuing with the old tariff and
the existing name-plate capacity is literally precluding repowering possibility for all sites, including
those that may have additional capacity in evacuation infrastructure. Repowering, if adopted, can be
a win-win formula for all. While it will mean monetary benefits to the investors, it will also mean
better land utilization and high-quality generation, as the new machines would have more grid-
friendly features than the old machines. TNEB should initiate necessary measures for supporting
repowering on a large scale.
Creation of a state RE law
Policies gather muscle if they are complemented by legislative measures. Since energy is a
concurrent subject, Tamil Nadu could have a state RE Law suited to its local needs and circumstances
without contradicting the national legislation. In the United States, many states have such provincial
laws, besides federal laws. Such a law amended suitably to meet state-specific concerns can address
issues like renewable purchase obligation (RPO) compliance, jurisdiction limit of utilities,
infrastructure strengthening responsibility, payment schedule, must-run status, etc.
Creation of single window clearance mechanism for all RE
Developing an efficient administrative framework may be useful for promotion of grid-connected
and off-grid RE power development in the state. This can include set-ups that ensure single window
clearance, which can be co-ordinated by TEDA.
Specific interventions for supporting off-grids
The development of off-grid solar in Tamil Nadu requires three major interventions: enactment of
state-based incentive or disincentive mechanisms, fast subsidy disbursal, and awareness generation.
In the past, the state-initiated diktat on water harvesting worked really effectively. A similar strategy
for commercially available and proven applications like solar water heating, LED lights, solar street
lights, etc., can prove effective. For costlier technologies like rooftop solar PV and solar water
pumping, a suitable incentive mechanism aimed at households, institutions and commercial
establishments will help in accelerated deployment. It is leant that the slow pace of subsidy disbursal
and discriminatory standards for subsidy eligibility are two main reasons for diversion of investments
from off-grids. Awareness generation is another aspect that can substantially help in this regard. A
Action Plan for Comprehensive RE Development in Tamil Nadu
135
majority of potential end users, especially in solar process heating, are not aware of the
technologies, their advantages and subsidies.
Small hydro development to be kept under the jurisdiction of TEDA
The small hydro potential assessment exercise could only be done for limited locations due to
unavailability of long-term data. However, considering the gap of about 554 MW between the SHP
potential and the installed capacity, it seems that there is considerable scope for improvement. The
present hydro development in Tamil Nadu is the responsibility of TNEB and there is no demarcation
in jurisdiction of large and small hydro areas, with the result that small hydro development lags
behind. Furthermore, private participation has been a major driver of SHP development in states like
Karnataka and Himachal Pradesh. This has also not happened in Tamil Nadu, probably because of
resistance to private development. It would be advisable for the state to hand over the jurisdiction
of small hydro development to TEDA, in line with the standard practice in other states. Tendering for
identified sites through TEDA would help in attracting experienced players in this space.
Preferential payment disbursement to RE generators
The delay in payment to wind energy generators in the state has severely hit new capacity additions
in the state. While the new solar policy talks about payment guarantees to solar energy generators,
no such mechanism is being considered for wind energy generators. The state has to ensure that the
pending payment to WEGs is made at an early date and future payments are guaranteed.
11.2.2 Regulatory Interventions
An aggressive policy framework alone cannot guarantee a deployment-friendly climate. It has to be
supported by a dynamic regulatory framework that is tuned to the prevalent economic situation and
is sensitive to market signals. At the same time, regulation should not become an instrument to
curtail or benefit a specific technology choice.
Regulation in Tamil Nadu has been largely influenced by the peculiar power situation in the state. In
view of crippling power shortages, delays in new project implementation, and precarious financial
position of the state utility, the Tamil Nadu Electricity Regulatory Commission (TNERC) has to enact
appropriate regulatory interventions if renewables have to be promoted. Some of the proposed
interventions are suggested below.
Revision of tariff determination methodology
At present, TNERC uses single part average tariff computation methodology for all RE (except solar)
as against a more robust levellized-tariff computation methodology, which captures the time value
of money and thus provides the investor a revenue stream, considering the future value of money
based on a certain discount rate. Even in the recent tariff order on wind in 2012, TNERC has used
single part average tariff stating the matter related to tariff determination methodology is sub
judice.
Revision of methodology to determine APPC
The TNERC RPO Regulations, 2011, while defining the methodology for computation of APPC,
exclude power purchased from power projects based on liquid/gas fuel and cost of the short-term
power purchases. The incorrect estimation of APPC will not only affect investment in RE projects but
also project an incomplete picture to power sector planners and financiers.
Action Plan for Comprehensive RE Development in Tamil Nadu
136
Tariff orders for large state-based off-grid solar
Considering the constrained power supply situation and extended load-shedding hours, off-grid and
micro-grid applications can help consumers as well as the utilities. Micro-grids especially could have
a good potential as many consumers would be willing to pay a higher price for electricity during
load-shedding hours. However, large-scale development of such applications cannot be done
without a strong off-grid regulation that specifies tariff, connectivity standards, connection points,
grievance redressal mechanisms, etc. In this context, specific regulation on off-grid metering
practices and tariffs would be beneficial. A recent study by ABPS Infrastructure Advisory has
proposed a business model called Off-grid Distributed Generation Based Distribution Franchisee,
which suggests a viable way to power community level off-grid applications [Ref 39]. The state may
look at the proposed model and decide to support and implement a similar or customized business
model that can run sustainably.
Revision of RPO targets and RPO compliance mechanism
Revision of RPO targets upwards, especially for solar power, is necessary because the present solar
RPO level of 0.05% and a weak solar REC market will not be able to sustain accelerated solar power
development in the state. The present level of solar RPOs in Tamil Nadu is 0.05%. To ensure scaling-
up in solar capacities, revision of RPO to bring it in line with the national target set by the National
Tariff Policy (as amended on 20 January 2011) at 0.25% with a yearly increment of 0.25% up to 2020
is required. Formulation of a strong RPO compliance mechanism that ensures appropriate penalties
for non-compliance will be beneficial to the state.
Regulation on RE-dictated interstate power transfer
There is a need to develop an effective regulatory framework for a workable inter-state power
transfer model for RE power exchanges, especially during peak RE season. This can be done with the
help of the Forum of Regulators (FoR), CERC, and SERCs. The existing regulations related to inter-
state power transfer and UIs attributable to RE generation variation/uncertainty are hindering Tamil
Nadu to draw or export power from/to neighbouring states because of commercial implications. This
is leading to backing down precious wind power during peak wind season when system frequencies
are high.
11.3 Grid Planning and Operational Management Interventions
Based on the action points identified in the previous chapter, the implementation plan for RE has to
essentially address a multitude of technical and non-technical issues. From the perspective of high
RE integration under an AGG scenario, it is obvious that the integration can only happen at the
regional and national level. In this context, integration of the southern grid with the NEW (North-
East-West) grid and enactment of a commercial mechanism for inter-state export of power are two
most important requirements for RE integration. The following specific action points highlight the
requirement from the perspective of transmission planning and operational management practices.
Incorporating RE capacity-addition in long-term transmission planning
The existing evacuation bottlenecks in Tamil Nadu are a result of grid expansion planning that did
not consider requirements of the rapidly building RE portfolio. Therefore, it is important for the state
to create an apex transmission planning body comprising members from TNEB, wind developers,
solar power developers, independent consultants, SLDC and CTU representatives to create long-term
plans and decide on budgetary provisions for new intra-state and inter-state transmission capacity.
Action Plan for Comprehensive RE Development in Tamil Nadu
137
Short-term measures for strengthening evacuation infrastructure
The second major area of concern is the condition of evacuation infrastructure. Load flow studies of
2011-12 conditions indicate that a large number of 100 kV and 220 kV lines get loaded beyond their
thermal limit during the high-wind season. While the long-term solution is to create new grid
infrastructure and connect large wind capacities at 400 kV level, short-term measures like replacing
standard conductors with HTLS conductors and changing single circuit lines to double circuit lines
may help immensely. This modification can be done for the highly loaded lines and will require
smaller investments than those for installation of new capacities.
Modify operational philosophy of grid management
The state has to overhaul the existing operational management practices to allow accommodation of
high RE in the grid. The conventional operational philosophy cannot accommodate RE simply
because it is modelled around the predictable system behaviour of conventional sources and the
new philosophy has to essentially be centered on the need for accommodating renewables as and
when they come. The state can avail services of reputable national/international consultants to look
at this aspect. Detailed consultative exercises with operations experts in European utilities and grid
planners can help in developing the guiding precepts for the new operational management
philosophy.
11.4 Financial Interventions (sources and uses)
The most fundamental requirement for implementing the RE plan is the availability of funding. For
RE development, the funding requirement will essentially be only for supporting infrastructure and
pilots as the capital investments are expected to come predominantly from the private sector.
However, the funding requirement for infrastructure as estimated for high RE integration (AGG
scenario) is to the tune of Rs.11,000 crore, a substantial amount by any standards.
It seems that TNEB has also realized this and has asked for central assistance of Rs. 17,570 million
from the National Clean Energy Fund to develop a transmission grid infrastructure to evacuate about
4,000 MW of renewable power. This expansion is aimed at evolving a power grid to facilitate free
flow of power across regional boundaries by raising the transmission voltage from 230 kV to 400 kV
and, if required, enhancing transmission capability to 765 kV level. (Source: MNRE, TNEB websites).
It has also sought assistance from the Japanese Industrial Cooperative Agency (JICA) which will
provide financial assistance in certain transmission schemes to be taken up during the next five
years. The Official Development Assistance (ODA) loan by JICA will strengthen the transmission
network at a cost of Rs. 3,572.93 crore by establishing five 400 kV sub-stations and fourteen 230 kV
sub-stations with associated lines during the next five years. Further, to evacuate power from wind
generators, a separate corridor with three new 400 kV sub-stations at Thappagundu, Anaikadavu,
and Rasipalayam is to be built, along with the associated 400 kV lines of 336 circuit (ckt) km length.
These sub-stations will be connected to the proposed 765 kV sub-stations being executed by Power
Grid Corporation of India Ltd. at Salem. (Source: Policy Note 2012-13, Energy Department,
Government of Tamil Nadu).
However, on the other side, there are many opportunities of sourcing funds in addition to other
possible initiatives that can create new funding avenues. The subsequent sections try to analyze the
funding requirements from the source and use perspective.
Action Plan for Comprehensive RE Development in Tamil Nadu
138
Sources of funds
The state has already applied for funds of about Rs. 1,756 crore from NCEF for grid augmentation.
An additional Rs. 3,572 crore has been sourced from JICA for grid strengthening and new capacity-
addition.
However, the state also has other avenues to raise funds. The 13th Finance Commission has
earmarked a corpus of Rs. 5,000 crore for incentivizing RE development. The total corpus is expected
to be distributed among the states based on their performance in developing RE. Considering the
present status of renewables and projecting an RE development path as proposed in the AGG
scenario, a preliminary analysis indicates that the state can expect to get a share of Rs. 1,200-1,400
crore from the CFA by the end of 2014.
Additionally, there are other initiatives that the state can take to divert existing funds or create new
funding avenues. Based on preliminary calculations, AGG scenario of RE development will mean an
investment of Rs. 22,6976 crore over the 12th and 13th five-year plans. Assuming 90% of investment
as equipment cost and a state VAT of 4%, the VAT receipts would translate into a minimum revenue
realization of approximately Rs. 8,171 crore over the 12th and 13th plans from the AGG scenario.
The state, if it wants, can decide to channel all or some of these receipts into infrastructure
development. Another way of diverting funds could be to make budgetary allocation in line with
allocations made for coal-based projects. Assuming a capital cost of Rs. 5 crore/MW for new thermal
plants, allocation of funds for 1,000 MW power plants would imply a capital cost of Rs. 5,000 crore.
Even a partial diversion of this budgeted capital cost for grid augmentation will actually translate
into a long-term benefit for the state.
Another very simple way to create a new funding avenue could be to create a state clean energy
fund. The concept of charging an additional green cess on industrial and commercial customers has
created a large corpus fund in Maharashtra. Based on the projected energy sales of commercial and
industrial customers in FY 2012-13, a nominal green cess of 8 paisa/unit (at par with the existing
green cess in Maharashtra) would translate into a fund of Rs. 227 crore for FY 2012-13. Assuming a
moderate demand increase of 5% per annum for this category of customers, the total fund over the
12th and 13th plans could amount to Rs. 2,850 crore.
Uses of funds
The immediate requirement of funding could be payment of pending wind generation tariffs to wind
turbine owners, majority of whom have not been paid for the last one year of generation. This non-
payment is severely affecting the capabilities of IPP players, some of whom have no alternative
sources of income to even meet their debt obligation. This has curtailed IPP investments in Tamil
Nadu. To build investor confidence and push development, immediate measures are needed to pay
the pending balance over a committed time limit. Considering the present financial position of TNEB,
it can choose to make partial payments along with a commitment letter for full payment within a
stipulated time. This will allow many IPPs to restructure their debts, saving them from considerable
hardships. Assuming 4,000 MW of wind under sale to DISCOM mode, generation of 2 MU/MW and
the present tariff of Rs. 3.39/kWh, a one-year payout figure would translate into approximately
Rs. 2,700 crore.
The other more immediate requirement for fund deployment would be to modify or augment
existing transmission lines and associated network. A load-flow study of present conditions indicates
thermal overloading of some transmission lines in the high-wind season. Without any augmentation,
these lines would not support even a business-as-usual growth. In this context, a short-term
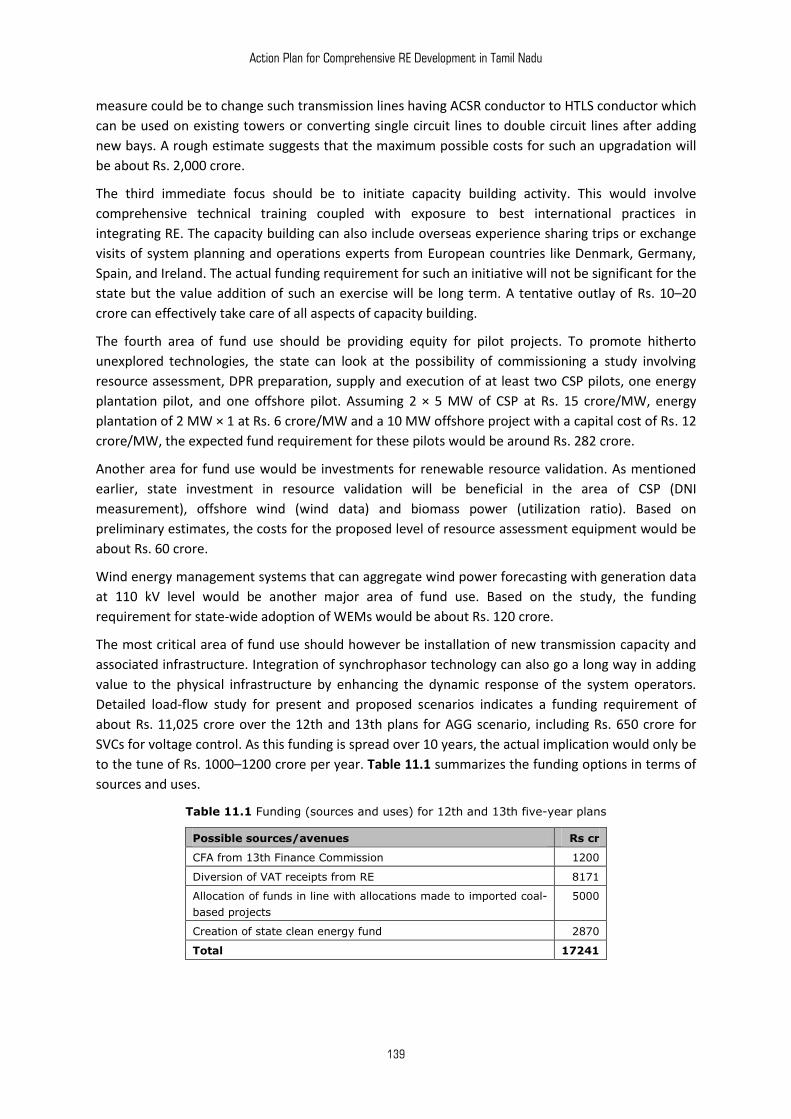
Action Plan for Comprehensive RE Development in Tamil Nadu
139
measure could be to change such transmission lines having ACSR conductor to HTLS conductor which
can be used on existing towers or converting single circuit lines to double circuit lines after adding
new bays. A rough estimate suggests that the maximum possible costs for such an upgradation will
be about Rs. 2,000 crore.
The third immediate focus should be to initiate capacity building activity. This would involve
comprehensive technical training coupled with exposure to best international practices in
integrating RE. The capacity building can also include overseas experience sharing trips or exchange
visits of system planning and operations experts from European countries like Denmark, Germany,
Spain, and Ireland. The actual funding requirement for such an initiative will not be significant for the
state but the value addition of such an exercise will be long term. A tentative outlay of Rs. 10–20
crore can effectively take care of all aspects of capacity building.
The fourth area of fund use should be providing equity for pilot projects. To promote hitherto
unexplored technologies, the state can look at the possibility of commissioning a study involving
resource assessment, DPR preparation, supply and execution of at least two CSP pilots, one energy
plantation pilot, and one offshore pilot. Assuming 2 × 5 MW of CSP at Rs. 15 crore/MW, energy
plantation of 2 MW × 1 at Rs. 6 crore/MW and a 10 MW offshore project with a capital cost of Rs. 12
crore/MW, the expected fund requirement for these pilots would be around Rs. 282 crore.
Another area for fund use would be investments for renewable resource validation. As mentioned
earlier, state investment in resource validation will be beneficial in the area of CSP (DNI
measurement), offshore wind (wind data) and biomass power (utilization ratio). Based on
preliminary estimates, the costs for the proposed level of resource assessment equipment would be
about Rs. 60 crore.
Wind energy management systems that can aggregate wind power forecasting with generation data
at 110 kV level would be another major area of fund use. Based on the study, the funding
requirement for state-wide adoption of WEMs would be about Rs. 120 crore.
The most critical area of fund use should however be installation of new transmission capacity and
associated infrastructure. Integration of synchrophasor technology can also go a long way in adding
value to the physical infrastructure by enhancing the dynamic response of the system operators.
Detailed load-flow study for present and proposed scenarios indicates a funding requirement of
about Rs. 11,025 crore over the 12th and 13th plans for AGG scenario, including Rs. 650 crore for
SVCs for voltage control. As this funding is spread over 10 years, the actual implication would only be
to the tune of Rs. 1000–1200 crore per year. Table 11.1 summarizes the funding options in terms of
sources and uses.
Table 11.1 Funding (sources and uses) for 12th and 13th five-year plans
Possible sources/avenues Rs cr
CFA from 13th Finance Commission 1200
Diversion of VAT receipts from RE 8171
Allocation of funds in line with allocations made to imported coal-
based projects
5000
Creation of state clean energy fund 2870
Total 17241
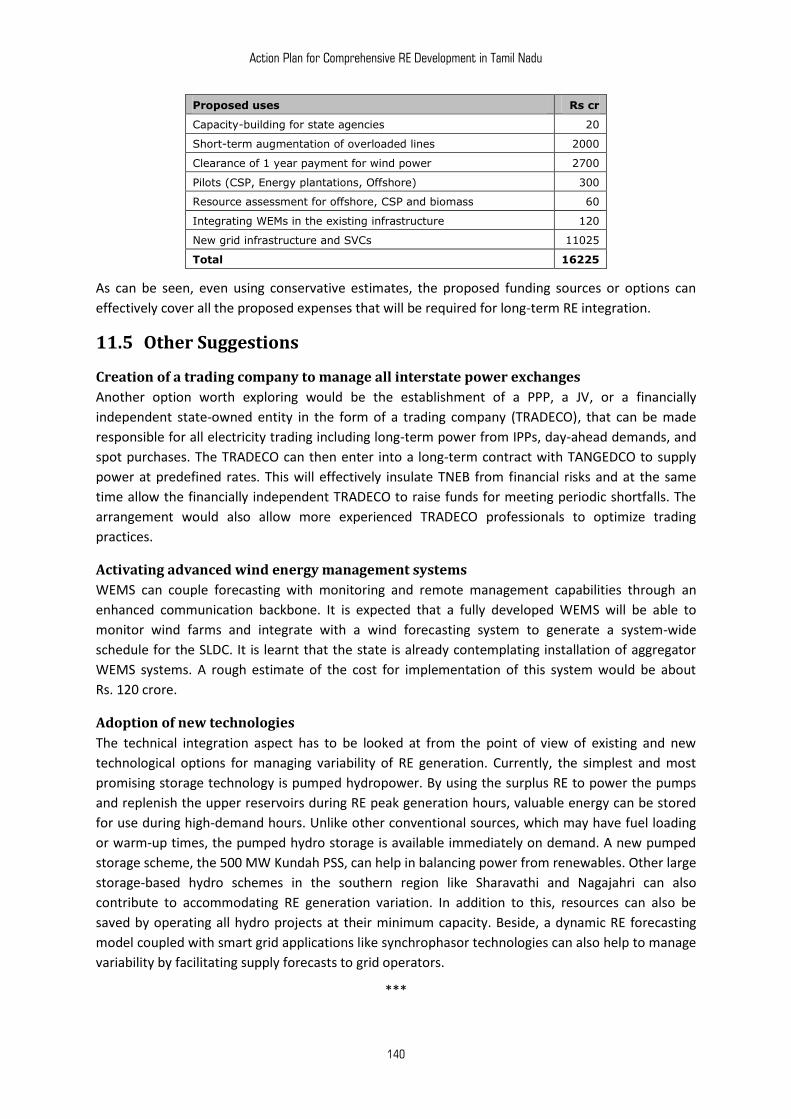
Action Plan for Comprehensive RE Development in Tamil Nadu
140
Proposed uses Rs cr
Capacity-building for state agencies 20
Short-term augmentation of overloaded lines 2000
Clearance of 1 year payment for wind power 2700
Pilots (CSP, Energy plantations, Offshore) 300
Resource assessment for offshore, CSP and biomass 60
Integrating WEMs in the existing infrastructure 120
New grid infrastructure and SVCs 11025
Total 16225
As can be seen, even using conservative estimates, the proposed funding sources or options can
effectively cover all the proposed expenses that will be required for long-term RE integration.
11.5 Other Suggestions
Creation of a trading company to manage all interstate power exchanges
Another option worth exploring would be the establishment of a PPP, a JV, or a financially
independent state-owned entity in the form of a trading company (TRADECO), that can be made
responsible for all electricity trading including long-term power from IPPs, day-ahead demands, and
spot purchases. The TRADECO can then enter into a long-term contract with TANGEDCO to supply
power at predefined rates. This will effectively insulate TNEB from financial risks and at the same
time allow the financially independent TRADECO to raise funds for meeting periodic shortfalls. The
arrangement would also allow more experienced TRADECO professionals to optimize trading
practices.
Activating advanced wind energy management systems
WEMS can couple forecasting with monitoring and remote management capabilities through an
enhanced communication backbone. It is expected that a fully developed WEMS will be able to
monitor wind farms and integrate with a wind forecasting system to generate a system-wide
schedule for the SLDC. It is learnt that the state is already contemplating installation of aggregator
WEMS systems. A rough estimate of the cost for implementation of this system would be about
Rs. 120 crore.
Adoption of new technologies
The technical integration aspect has to be looked at from the point of view of existing and new
technological options for managing variability of RE generation. Currently, the simplest and most
promising storage technology is pumped hydropower. By using the surplus RE to power the pumps
and replenish the upper reservoirs during RE peak generation hours, valuable energy can be stored
for use during high-demand hours. Unlike other conventional sources, which may have fuel loading
or warm-up times, the pumped hydro storage is available immediately on demand. A new pumped
storage scheme, the 500 MW Kundah PSS, can help in balancing power from renewables. Other large
storage-based hydro schemes in the southern region like Sharavathi and Nagajahri can also
contribute to accommodating RE generation variation. In addition to this, resources can also be
saved by operating all hydro projects at their minimum capacity. Beside, a dynamic RE forecasting
model coupled with smart grid applications like synchrophasor technologies can also help to manage
variability by facilitating supply forecasts to grid operators.
***
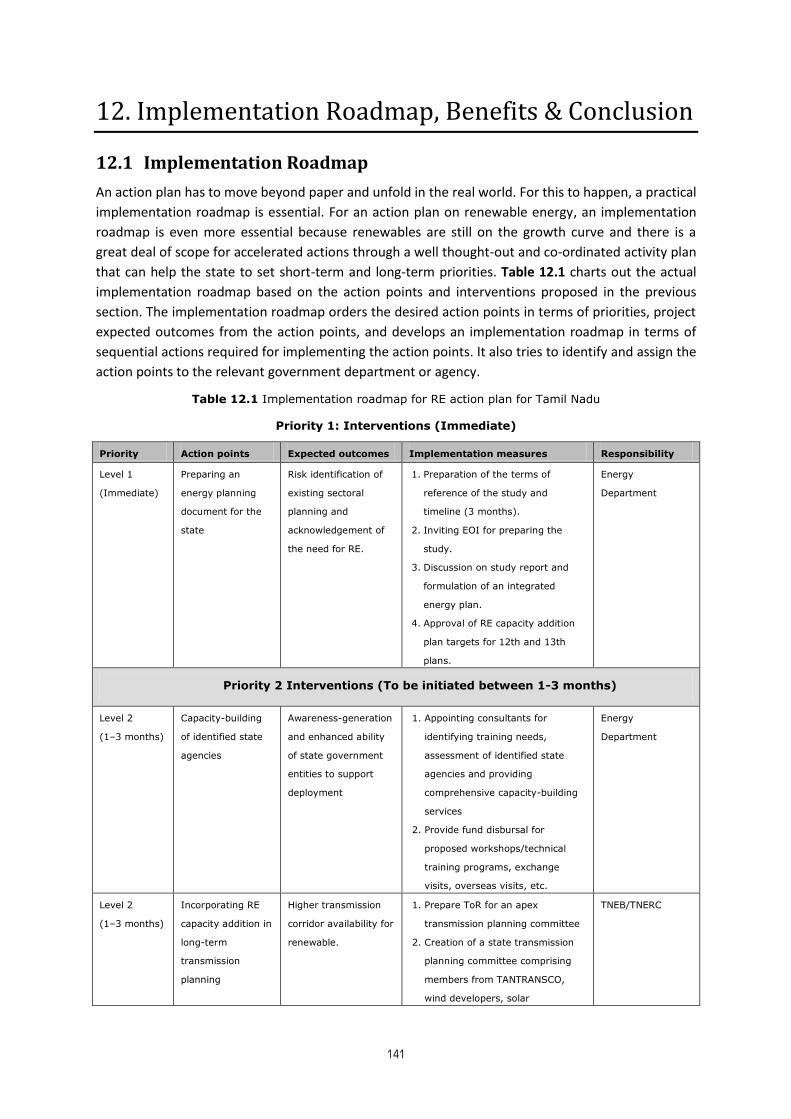
Action Plan for Comprehensive RE Development in Tamil Nadu
141
12. Implementation Roadmap, Benefits & Conclusion
12.1 Implementation Roadmap
An action plan has to move beyond paper and unfold in the real world. For this to happen, a practical
implementation roadmap is essential. For an action plan on renewable energy, an implementation
roadmap is even more essential because renewables are still on the growth curve and there is a
great deal of scope for accelerated actions through a well thought-out and co-ordinated activity plan
that can help the state to set short-term and long-term priorities. Table 12.1 charts out the actual
implementation roadmap based on the action points and interventions proposed in the previous
section. The implementation roadmap orders the desired action points in terms of priorities, project
expected outcomes from the action points, and develops an implementation roadmap in terms of
sequential actions required for implementing the action points. It also tries to identify and assign the
action points to the relevant government department or agency.
Table 12.1 Implementation roadmap for RE action plan for Tamil Nadu
Priority 1: Interventions (Immediate)
Priority Action points Expected outcomes Implementation measures Responsibility
Level 1
(Immediate)
Preparing an
energy planning
document for the
state
Risk identification of
existing sectoral
planning and
acknowledgement of
the need for RE.
1. Preparation of the terms of
reference of the study and
timeline (3 months).
2. Inviting EOI for preparing the
study.
3. Discussion on study report and
formulation of an integrated
energy plan.
4. Approval of RE capacity addition
plan targets for 12th and 13th
plans.
Energy
Department
Priority 2 Interventions (To be initiated between 1-3 months)
Level 2
(1–3 months)
Capacity-building
of identified state
agencies
Awareness-generation
and enhanced ability
of state government
entities to support
deployment
1. Appointing consultants for
identifying training needs,
assessment of identified state
agencies and providing
comprehensive capacity-building
services
2. Provide fund disbursal for
proposed workshops/technical
training programs, exchange
visits, overseas visits, etc.
Energy
Department
Level 2
(1–3 months)
Incorporating RE
capacity addition in
long-term
transmission
planning
Higher transmission
corridor availability for
renewable.
1. Prepare ToR for an apex
transmission planning committee
2. Creation of a state transmission
planning committee comprising
members from TANTRANSCO,
wind developers, solar
TNEB/TNERC
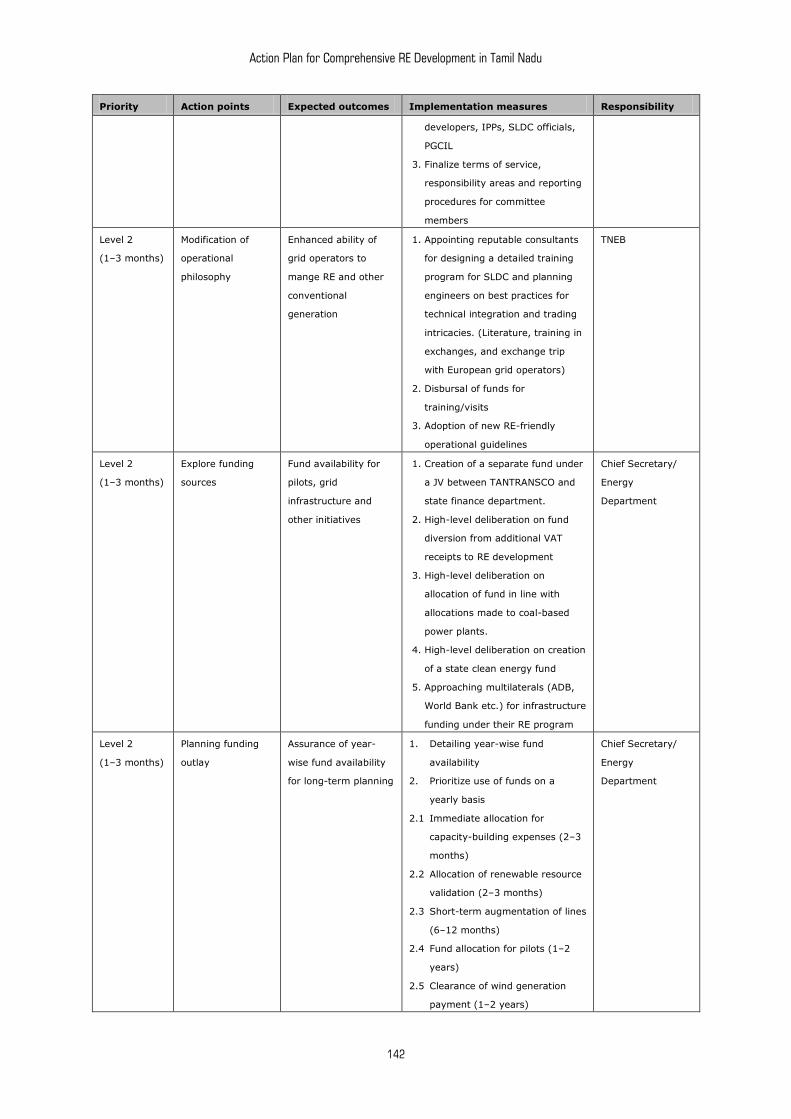
Action Plan for Comprehensive RE Development in Tamil Nadu
142
Priority Action points Expected outcomes Implementation measures Responsibility
developers, IPPs, SLDC officials,
PGCIL
3. Finalize terms of service,
responsibility areas and reporting
procedures for committee
members
Level 2
(1–3 months)
Modification of
operational
philosophy
Enhanced ability of
grid operators to
mange RE and other
conventional
generation
1. Appointing reputable consultants
for designing a detailed training
program for SLDC and planning
engineers on best practices for
technical integration and trading
intricacies. (Literature, training in
exchanges, and exchange trip
with European grid operators)
2. Disbursal of funds for
training/visits
3. Adoption of new RE-friendly
operational guidelines
TNEB
Level 2
(1–3 months)
Explore funding
sources
Fund availability for
pilots, grid
infrastructure and
other initiatives
1. Creation of a separate fund under
a JV between TANTRANSCO and
state finance department.
2. High-level deliberation on fund
diversion from additional VAT
receipts to RE development
3. High-level deliberation on
allocation of fund in line with
allocations made to coal-based
power plants.
4. High-level deliberation on creation
of a state clean energy fund
5. Approaching multilaterals (ADB,
World Bank etc.) for infrastructure
funding under their RE program
Chief Secretary/
Energy
Department
Level 2
(1–3 months)
Planning funding
outlay
Assurance of year-
wise fund availability
for long-term planning
1. Detailing year-wise fund
availability
2. Prioritize use of funds on a
yearly basis
2.1 Immediate allocation for
capacity-building expenses (2–3
months)
2.2 Allocation of renewable resource
validation (2–3 months)
2.3 Short-term augmentation of lines
(6–12 months)
2.4 Fund allocation for pilots (1–2
years)
2.5 Clearance of wind generation
payment (1–2 years)
Chief Secretary/
Energy
Department
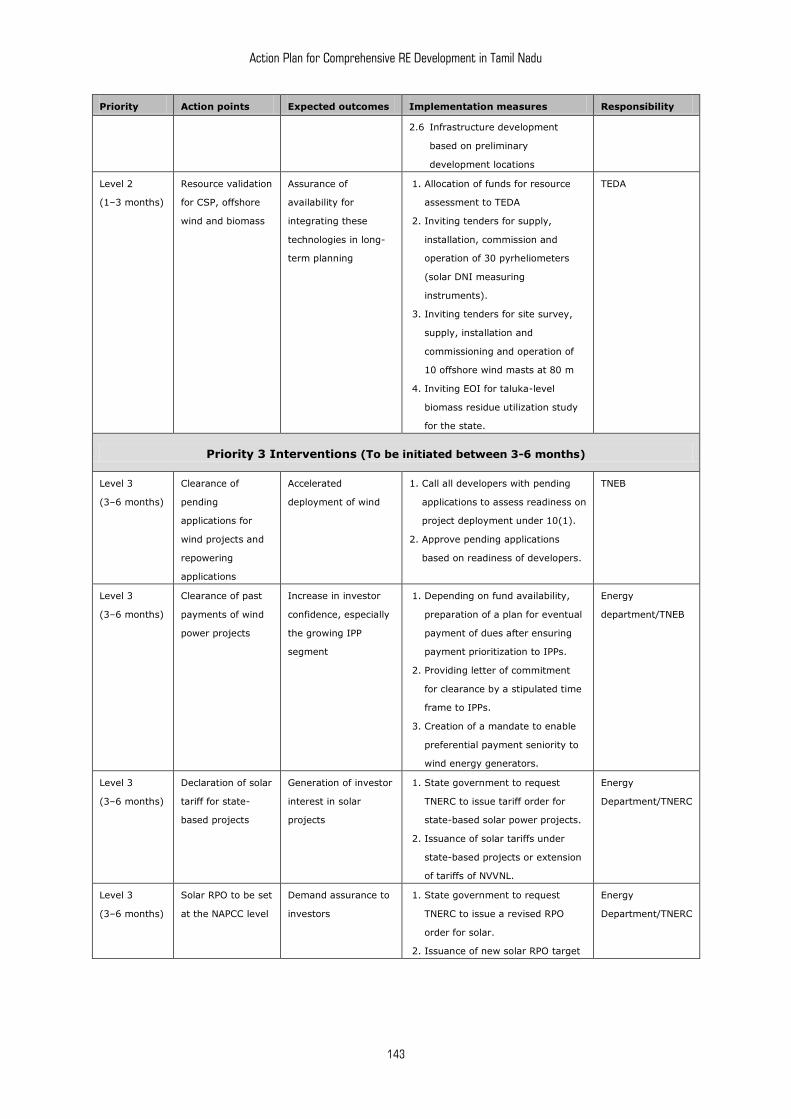
Action Plan for Comprehensive RE Development in Tamil Nadu
143
Priority Action points Expected outcomes Implementation measures Responsibility
2.6 Infrastructure development
based on preliminary
development locations
Level 2
(1–3 months)
Resource validation
for CSP, offshore
wind and biomass
Assurance of
availability for
integrating these
technologies in long-
term planning
1. Allocation of funds for resource
assessment to TEDA
2. Inviting tenders for supply,
installation, commission and
operation of 30 pyrheliometers
(solar DNI measuring
instruments).
3. Inviting tenders for site survey,
supply, installation and
commissioning and operation of
10 offshore wind masts at 80 m
4. Inviting EOI for taluka-level
biomass residue utilization study
for the state.
TEDA
Priority 3 Interventions (To be initiated between 3-6 months)
Level 3
(3–6 months)
Clearance of
pending
applications for
wind projects and
repowering
applications
Accelerated
deployment of wind
1. Call all developers with pending
applications to assess readiness on
project deployment under 10(1).
2. Approve pending applications
based on readiness of developers.
TNEB
Level 3
(3–6 months)
Clearance of past
payments of wind
power projects
Increase in investor
confidence, especially
the growing IPP
segment
1. Depending on fund availability,
preparation of a plan for eventual
payment of dues after ensuring
payment prioritization to IPPs.
2. Providing letter of commitment
for clearance by a stipulated time
frame to IPPs.
3. Creation of a mandate to enable
preferential payment seniority to
wind energy generators.
Energy
department/TNEB
Level 3
(3–6 months)
Declaration of solar
tariff for state-
based projects
Generation of investor
interest in solar
projects
1. State government to request
TNERC to issue tariff order for
state-based solar power projects.
2. Issuance of solar tariffs under
state-based projects or extension
of tariffs of NVVNL.
Energy
Department/TNERC
Level 3
(3–6 months)
Solar RPO to be set
at the NAPCC level
Demand assurance to
investors
1. State government to request
TNERC to issue a revised RPO
order for solar.
2. Issuance of new solar RPO target
Energy
Department/TNERC
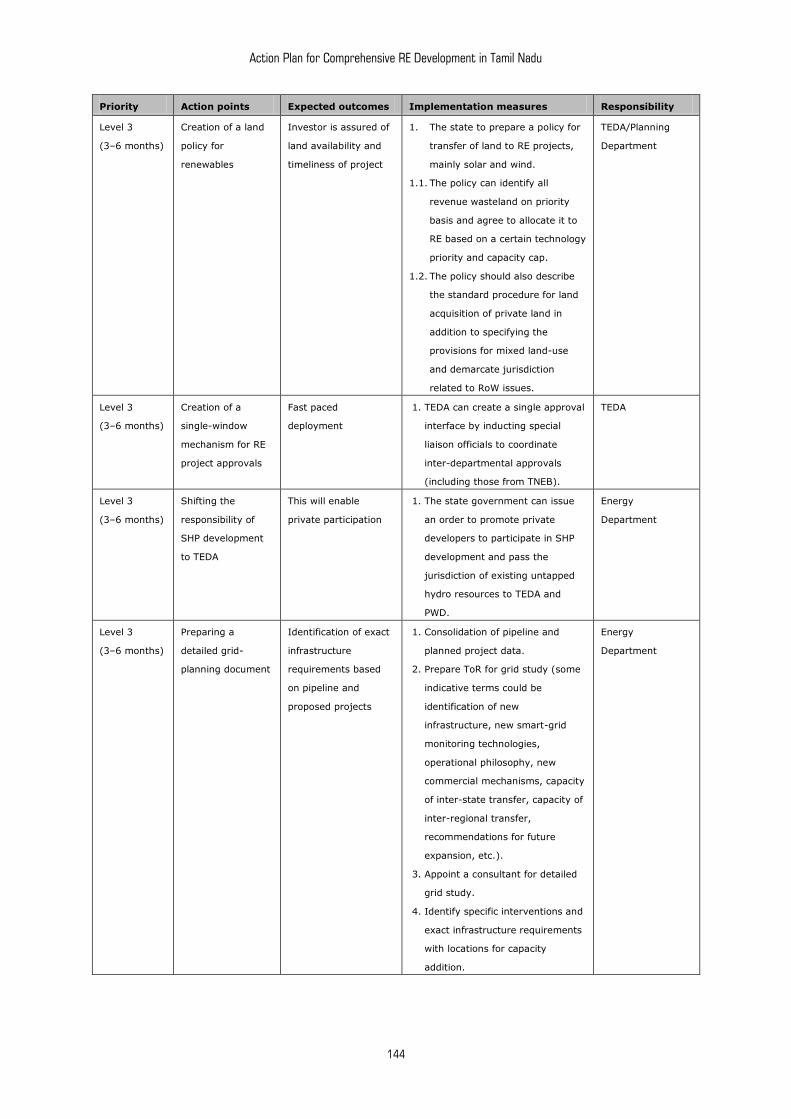
Action Plan for Comprehensive RE Development in Tamil Nadu
144
Priority Action points Expected outcomes Implementation measures Responsibility
Level 3
(3–6 months)
Creation of a land
policy for
renewables
Investor is assured of
land availability and
timeliness of project
1. The state to prepare a policy for
transfer of land to RE projects,
mainly solar and wind.
1.1. The policy can identify all
revenue wasteland on priority
basis and agree to allocate it to
RE based on a certain technology
priority and capacity cap.
1.2. The policy should also describe
the standard procedure for land
acquisition of private land in
addition to specifying the
provisions for mixed land-use
and demarcate jurisdiction
related to RoW issues.
TEDA/Planning
Department
Level 3
(3–6 months)
Creation of a
single-window
mechanism for RE
project approvals
Fast paced
deployment
1. TEDA can create a single approval
interface by inducting special
liaison officials to coordinate
inter-departmental approvals
(including those from TNEB).
TEDA
Level 3
(3–6 months)
Shifting the
responsibility of
SHP development
to TEDA
This will enable
private participation
1. The state government can issue
an order to promote private
developers to participate in SHP
development and pass the
jurisdiction of existing untapped
hydro resources to TEDA and
PWD.
Energy
Department
Level 3
(3–6 months)
Preparing a
detailed grid-
planning document
Identification of exact
infrastructure
requirements based
on pipeline and
proposed projects
1. Consolidation of pipeline and
planned project data.
2. Prepare ToR for grid study (some
indicative terms could be
identification of new
infrastructure, new smart-grid
monitoring technologies,
operational philosophy, new
commercial mechanisms, capacity
of inter-state transfer, capacity of
inter-regional transfer,
recommendations for future
expansion, etc.).
3. Appoint a consultant for detailed
grid study.
4. Identify specific interventions and
exact infrastructure requirements
with locations for capacity
addition.
Energy
Department
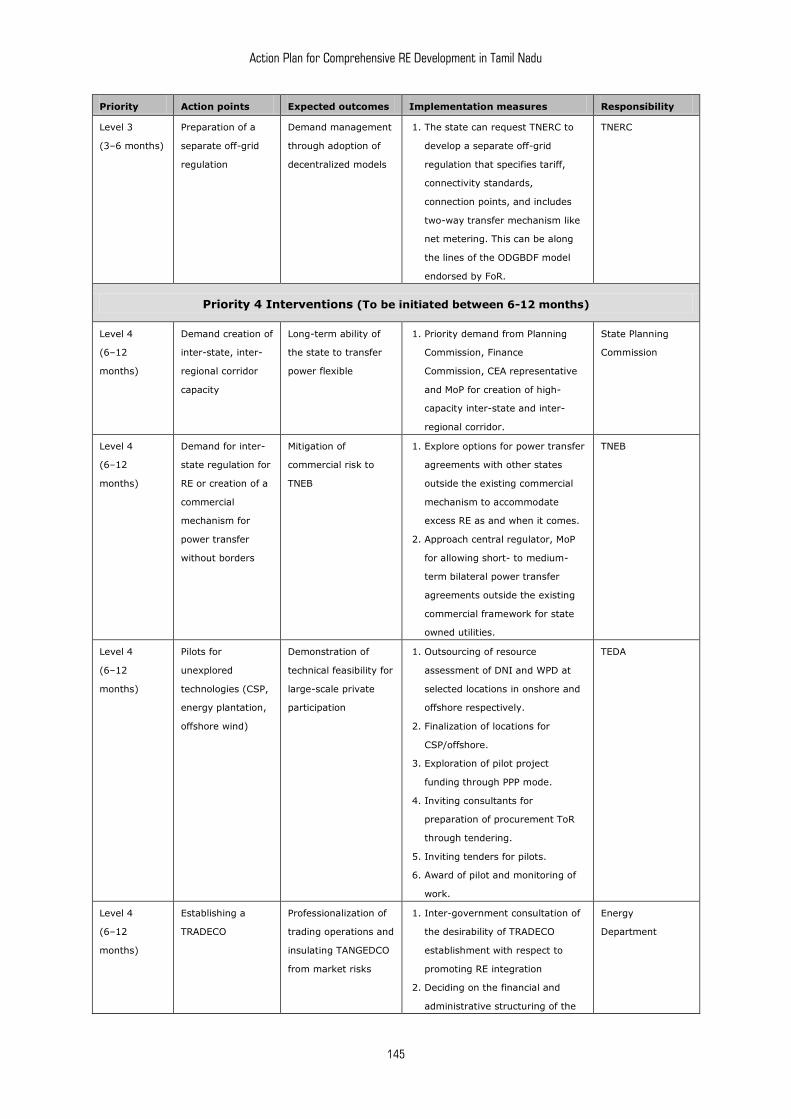
Action Plan for Comprehensive RE Development in Tamil Nadu
145
Priority Action points Expected outcomes Implementation measures Responsibility
Level 3
(3–6 months)
Preparation of a
separate off-grid
regulation
Demand management
through adoption of
decentralized models
1. The state can request TNERC to
develop a separate off-grid
regulation that specifies tariff,
connectivity standards,
connection points, and includes
two-way transfer mechanism like
net metering. This can be along
the lines of the ODGBDF model
endorsed by FoR.
TNERC
Priority 4 Interventions (To be initiated between 6-12 months)
Level 4
(6–12
months)
Demand creation of
inter-state, inter-
regional corridor
capacity
Long-term ability of
the state to transfer
power flexible
1. Priority demand from Planning
Commission, Finance
Commission, CEA representative
and MoP for creation of high-
capacity inter-state and inter-
regional corridor.
State Planning
Commission
Level 4
(6–12
months)
Demand for inter-
state regulation for
RE or creation of a
commercial
mechanism for
power transfer
without borders
Mitigation of
commercial risk to
TNEB
1. Explore options for power transfer
agreements with other states
outside the existing commercial
mechanism to accommodate
excess RE as and when it comes.
2. Approach central regulator, MoP
for allowing short- to medium-
term bilateral power transfer
agreements outside the existing
commercial framework for state
owned utilities.
TNEB
Level 4
(6–12
months)
Pilots for
unexplored
technologies (CSP,
energy plantation,
offshore wind)
Demonstration of
technical feasibility for
large-scale private
participation
1. Outsourcing of resource
assessment of DNI and WPD at
selected locations in onshore and
offshore respectively.
2. Finalization of locations for
CSP/offshore.
3. Exploration of pilot project
funding through PPP mode.
4. Inviting consultants for
preparation of procurement ToR
through tendering.
5. Inviting tenders for pilots.
6. Award of pilot and monitoring of
work.
TEDA
Level 4
(6–12
months)
Establishing a
TRADECO
Professionalization of
trading operations and
insulating TANGEDCO
from market risks
1. Inter-government consultation of
the desirability of TRADECO
establishment with respect to
promoting RE integration
2. Deciding on the financial and
administrative structuring of the
Energy
Department
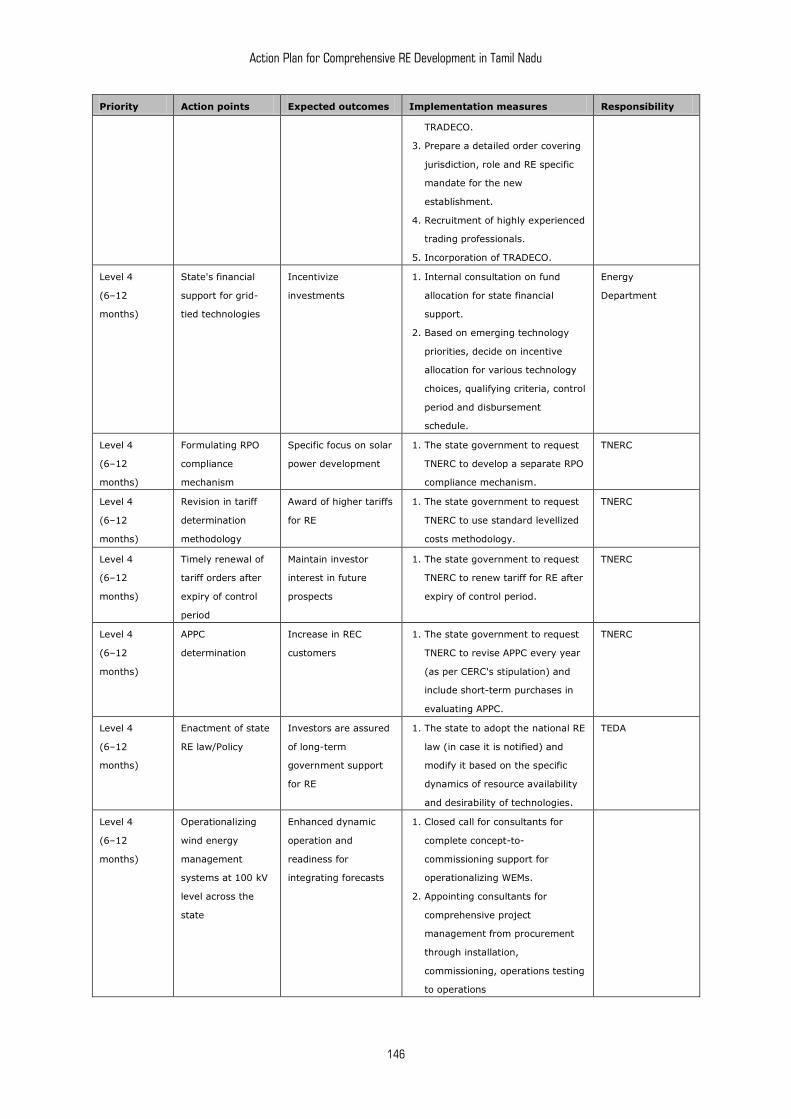
Action Plan for Comprehensive RE Development in Tamil Nadu
146
Priority Action points Expected outcomes Implementation measures Responsibility
TRADECO.
3. Prepare a detailed order covering
jurisdiction, role and RE specific
mandate for the new
establishment.
4. Recruitment of highly experienced
trading professionals.
5. Incorporation of TRADECO.
Level 4
(6–12
months)
State's financial
support for grid-
tied technologies
Incentivize
investments
1. Internal consultation on fund
allocation for state financial
support.
2. Based on emerging technology
priorities, decide on incentive
allocation for various technology
choices, qualifying criteria, control
period and disbursement
schedule.
Energy
Department
Level 4
(6–12
months)
Formulating RPO
compliance
mechanism
Specific focus on solar
power development
1. The state government to request
TNERC to develop a separate RPO
compliance mechanism.
TNERC
Level 4
(6–12
months)
Revision in tariff
determination
methodology
Award of higher tariffs
for RE
1. The state government to request
TNERC to use standard levellized
costs methodology.
TNERC
Level 4
(6–12
months)
Timely renewal of
tariff orders after
expiry of control
period
Maintain investor
interest in future
prospects
1. The state government to request
TNERC to renew tariff for RE after
expiry of control period.
TNERC
Level 4
(6–12
months)
APPC
determination
Increase in REC
customers
1. The state government to request
TNERC to revise APPC every year
(as per CERC's stipulation) and
include short-term purchases in
evaluating APPC.
TNERC
Level 4
(6–12
months)
Enactment of state
RE law/Policy
Investors are assured
of long-term
government support
for RE
1. The state to adopt the national RE
law (in case it is notified) and
modify it based on the specific
dynamics of resource availability
and desirability of technologies.
TEDA
Level 4
(6–12
months)
Operationalizing
wind energy
management
systems at 100 kV
level across the
state
Enhanced dynamic
operation and
readiness for
integrating forecasts
1. Closed call for consultants for
complete concept-to-
commissioning support for
operationalizing WEMs.
2. Appointing consultants for
comprehensive project
management from procurement
through installation,
commissioning, operations testing
to operations
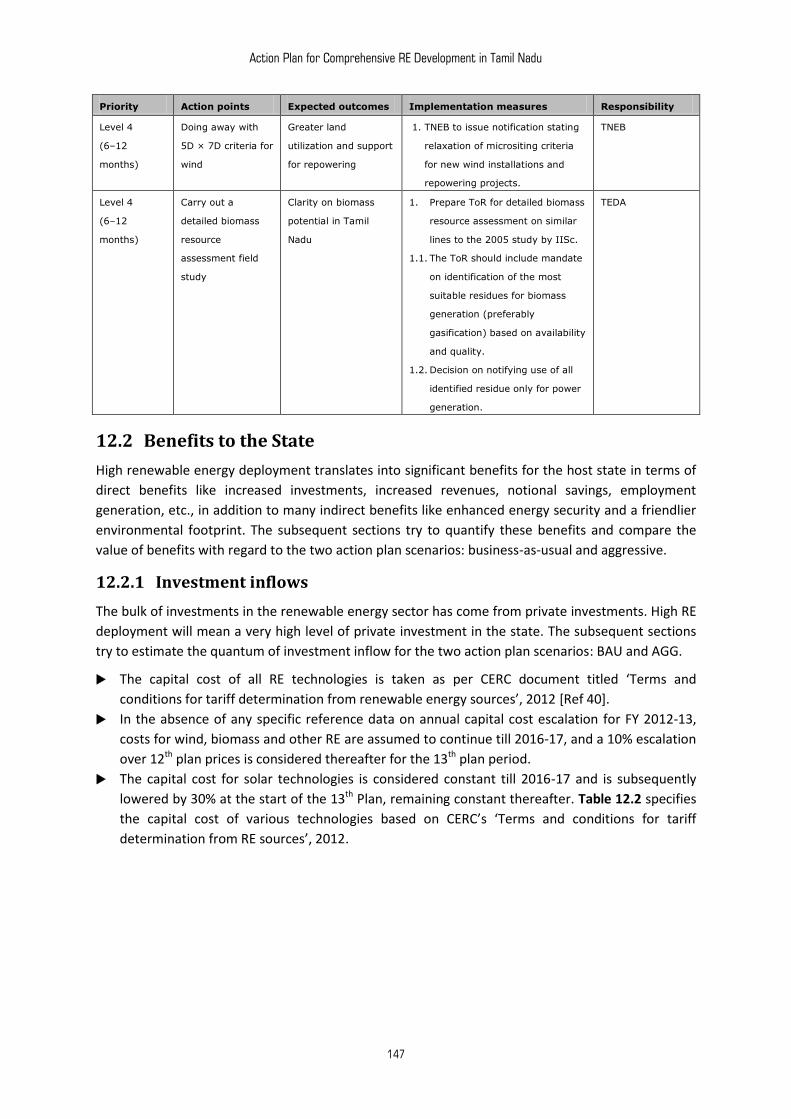
Action Plan for Comprehensive RE Development in Tamil Nadu
147
Priority Action points Expected outcomes Implementation measures Responsibility
Level 4
(6–12
months)
Doing away with
5D × 7D criteria for
wind
Greater land
utilization and support
for repowering
1. TNEB to issue notification stating
relaxation of micrositing criteria
for new wind installations and
repowering projects.
TNEB
Level 4
(6–12
months)
Carry out a
detailed biomass
resource
assessment field
study
Clarity on biomass
potential in Tamil
Nadu
1. Prepare ToR for detailed biomass
resource assessment on similar
lines to the 2005 study by IISc.
1.1. The ToR should include mandate
on identification of the most
suitable residues for biomass
generation (preferably
gasification) based on availability
and quality.
1.2. Decision on notifying use of all
identified residue only for power
generation.
TEDA
12.2 Benefits to the State
High renewable energy deployment translates into significant benefits for the host state in terms of
direct benefits like increased investments, increased revenues, notional savings, employment
generation, etc., in addition to many indirect benefits like enhanced energy security and a friendlier
environmental footprint. The subsequent sections try to quantify these benefits and compare the
value of benefits with regard to the two action plan scenarios: business-as-usual and aggressive.
12.2.1 Investment inflows
The bulk of investments in the renewable energy sector has come from private investments. High RE
deployment will mean a very high level of private investment in the state. The subsequent sections
try to estimate the quantum of investment inflow for the two action plan scenarios: BAU and AGG.
The capital cost of all RE technologies is taken as per CERC document titled ‘Terms and
conditions for tariff determination from renewable energy sources’, 2012 [Ref 40].
In the absence of any specific reference data on annual capital cost escalation for FY 2012-13,
costs for wind, biomass and other RE are assumed to continue till 2016-17, and a 10% escalation
over 12th plan prices is considered thereafter for the 13th plan period.
The capital cost for solar technologies is considered constant till 2016-17 and is subsequently
lowered by 30% at the start of the 13th Plan, remaining constant thereafter. Table 12.2 specifies
the capital cost of various technologies based on CERC’s ‘Terms and conditions for tariff
determination from RE sources’, 2012.
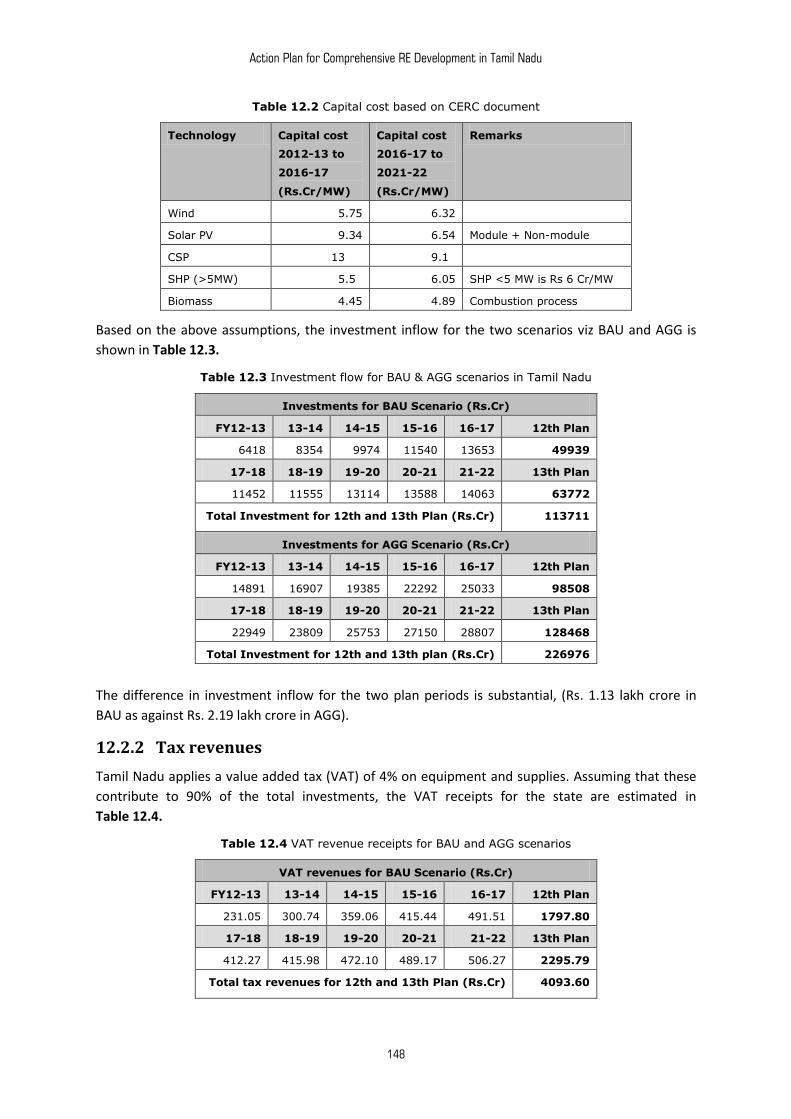
Action Plan for Comprehensive RE Development in Tamil Nadu
148
Table 12.2 Capital cost based on CERC document
Technology Capital cost
2012-13 to
2016-17
(Rs.Cr/MW)
Capital cost
2016-17 to
2021-22
(Rs.Cr/MW)
Remarks
Wind 5.75 6.32
Solar PV 9.34 6.54 Module + Non-module
CSP 13.00 9.10
SHP (>5MW) 5.50 6.05 SHP <5 MW is Rs 6 Cr/MW
Biomass 4.45 4.89 Combustion process
Based on the above assumptions, the investment inflow for the two scenarios viz BAU and AGG is
shown in Table 12.3.
Table 12.3 Investment flow for BAU & AGG scenarios in Tamil Nadu
Investments for BAU Scenario (Rs.Cr)
FY12-13 13-14 14-15 15-16 16-17 12th Plan
6418 8354 9974 11540 13653 49939
17-18 18-19 19-20 20-21 21-22 13th Plan
11452 11555 13114 13588 14063 63772
Total Investment for 12th and 13th Plan (Rs.Cr) 113711
Investments for AGG Scenario (Rs.Cr)
FY12-13 13-14 14-15 15-16 16-17 12th Plan
14891 16907 19385 22292 25033 98508
17-18 18-19 19-20 20-21 21-22 13th Plan
22949 23809 25753 27150 28807 128468
Total Investment for 12th and 13th plan (Rs.Cr) 226976
The difference in investment inflow for the two plan periods is substantial, (Rs. 1.13 lakh crore in
BAU as against Rs. 2.19 lakh crore in AGG).
12.2.2 Tax revenues
Tamil Nadu applies a value added tax (VAT) of 4% on equipment and supplies. Assuming that these
contribute to 90% of the total investments, the VAT receipts for the state are estimated in
Table 12.4.
Table 12.4 VAT revenue receipts for BAU and AGG scenarios
VAT revenues for BAU Scenario (Rs.Cr)
FY12-13 13-14 14-15 15-16 16-17 12th Plan
231.05 300.74 359.06 415.44 491.51 1797.80
17-18 18-19 19-20 20-21 21-22 13th Plan
412.27 415.98 472.10 489.17 506.27 2295.79
Total tax revenues for 12th and 13th Plan (Rs.Cr) 4093.60
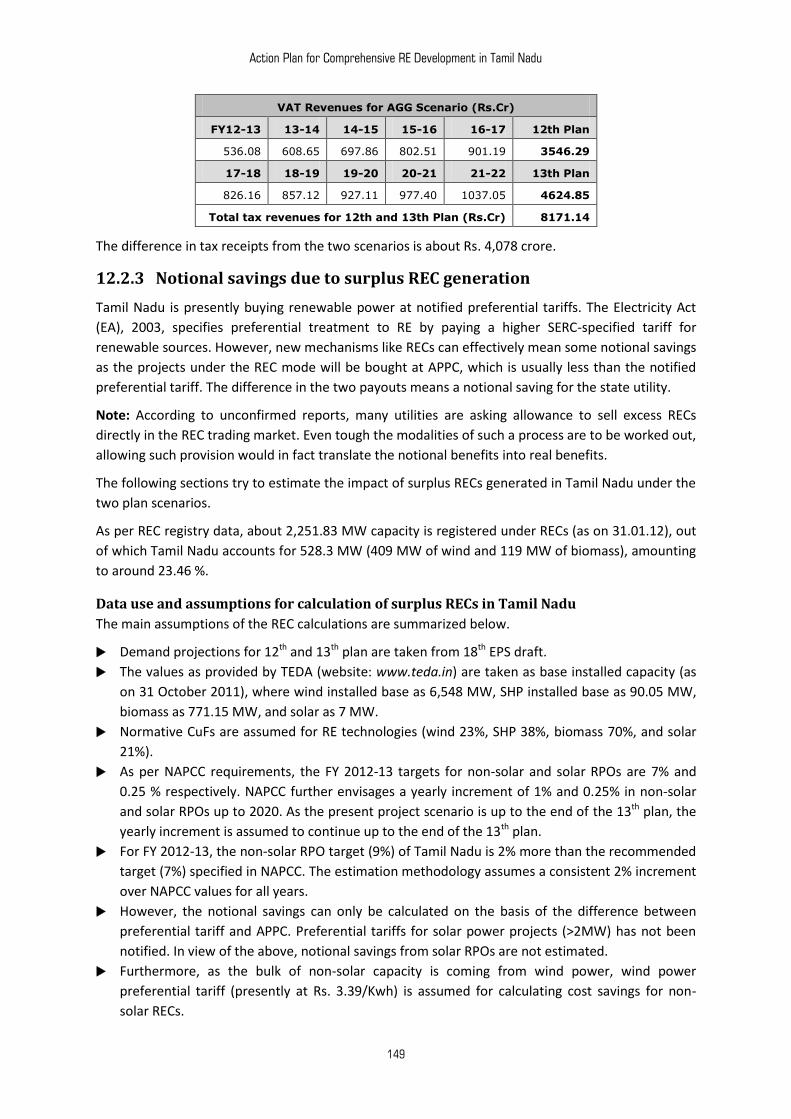
Action Plan for Comprehensive RE Development in Tamil Nadu
149
VAT Revenues for AGG Scenario (Rs.Cr)
FY12-13 13-14 14-15 15-16 16-17 12th Plan
536.08 608.65 697.86 802.51 901.19 3546.29
17-18 18-19 19-20 20-21 21-22 13th Plan
826.16 857.12 927.11 977.40 1037.05 4624.85
Total tax revenues for 12th and 13th Plan (Rs.Cr) 8171.14
The difference in tax receipts from the two scenarios is about Rs. 4,078 crore.
12.2.3 Notional savings due to surplus REC generation
Tamil Nadu is presently buying renewable power at notified preferential tariffs. The Electricity Act
(EA), 2003, specifies preferential treatment to RE by paying a higher SERC-specified tariff for
renewable sources. However, new mechanisms like RECs can effectively mean some notional savings
as the projects under the REC mode will be bought at APPC, which is usually less than the notified
preferential tariff. The difference in the two payouts means a notional saving for the state utility.
Note: According to unconfirmed reports, many utilities are asking allowance to sell excess RECs
directly in the REC trading market. Even tough the modalities of such a process are to be worked out,
allowing such provision would in fact translate the notional benefits into real benefits.
The following sections try to estimate the impact of surplus RECs generated in Tamil Nadu under the
two plan scenarios.
As per REC registry data, about 2,251.83 MW capacity is registered under RECs (as on 31.01.12), out
of which Tamil Nadu accounts for 528.3 MW (409 MW of wind and 119 MW of biomass), amounting
to around 23.46 %.
Data use and assumptions for calculation of surplus RECs in Tamil Nadu
The main assumptions of the REC calculations are summarized below.
Demand projections for 12th and 13th plan are taken from 18th EPS draft.
The values as provided by TEDA (website: www.teda.in) are taken as base installed capacity (as
on 31 October 2011), where wind installed base as 6,548 MW, SHP installed base as 90.05 MW,
biomass as 771.15 MW, and solar as 7 MW.
Normative CuFs are assumed for RE technologies (wind 23%, SHP 38%, biomass 70%, and solar
21%).
As per NAPCC requirements, the FY 2012-13 targets for non-solar and solar RPOs are 7% and
0.25 % respectively. NAPCC further envisages a yearly increment of 1% and 0.25% in non-solar
and solar RPOs up to 2020. As the present project scenario is up to the end of the 13th plan, the
yearly increment is assumed to continue up to the end of the 13th plan.
For FY 2012-13, the non-solar RPO target (9%) of Tamil Nadu is 2% more than the recommended
target (7%) specified in NAPCC. The estimation methodology assumes a consistent 2% increment
over NAPCC values for all years.
However, the notional savings can only be calculated on the basis of the difference between
preferential tariff and APPC. Preferential tariffs for solar power projects (>2MW) has not been
notified. In view of the above, notional savings from solar RPOs are not estimated.
Furthermore, as the bulk of non-solar capacity is coming from wind power, wind power
preferential tariff (presently at Rs. 3.39/Kwh) is assumed for calculating cost savings for non-
solar RECs.
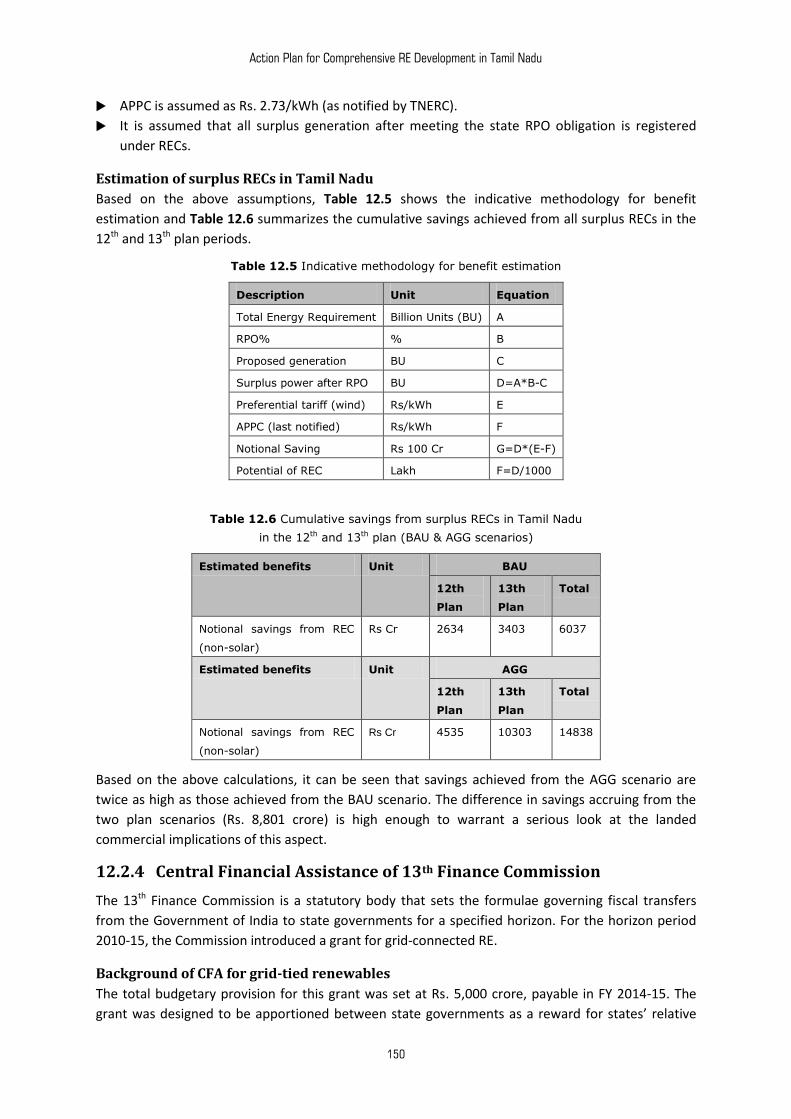
Action Plan for Comprehensive RE Development in Tamil Nadu
150
APPC is assumed as Rs. 2.73/kWh (as notified by TNERC).
It is assumed that all surplus generation after meeting the state RPO obligation is registered
under RECs.
Estimation of surplus RECs in Tamil Nadu
Based on the above assumptions, Table 12.5 shows the indicative methodology for benefit
estimation and Table 12.6 summarizes the cumulative savings achieved from all surplus RECs in the
12th and 13th plan periods.
Table 12.5 Indicative methodology for benefit estimation
Description Unit Equation
Total Energy Requirement Billion Units (BU) A
RPO% % B
Proposed generation BU C
Surplus power after RPO BU D=A*B-C
Preferential tariff (wind) Rs/kWh E
APPC (last notified) Rs/kWh F
Notional Saving Rs 100 Cr G=D*(E-F)
Potential of REC Lakh F=D/1000
Table 12.6 Cumulative savings from surplus RECs in Tamil Nadu
in the 12th and 13th plan (BAU & AGG scenarios)
Estimated benefits Unit BAU
12th
Plan
13th
Plan
Total
Notional savings from REC
(non-solar)
Rs Cr 2634 3403 6037
Estimated benefits Unit AGG
12th
Plan
13th
Plan
Total
Notional savings from REC
(non-solar)
Rs Cr 4535 10303 14838
Based on the above calculations, it can be seen that savings achieved from the AGG scenario are
twice as high as those achieved from the BAU scenario. The difference in savings accruing from the
two plan scenarios (Rs. 8,801 crore) is high enough to warrant a serious look at the landed
commercial implications of this aspect.
12.2.4 Central Financial Assistance of 13th Finance Commission
The 13th Finance Commission is a statutory body that sets the formulae governing fiscal transfers
from the Government of India to state governments for a specified horizon. For the horizon period
2010-15, the Commission introduced a grant for grid-connected RE.
Background of CFA for grid-tied renewables
The total budgetary provision for this grant was set at Rs. 5,000 crore, payable in FY 2014-15. The
grant was designed to be apportioned between state governments as a reward for states’ relative
Action Plan for Comprehensive RE Development in Tamil Nadu
151
achievement in renewable energy capacity-addition from 1 April 2010 to 31 March 2014. The
allocation to a particular case was assessed on the basis of a two-part formula that allocated the
following weightage to two main performance parameters:
75% for achievement in installed capacity addition (over 2010-14) relative to aggregate installed
capacity addition across all states; and
25% for achievement in installed capacity addition (over 2010-14) relative to unachieved
potential.
The formula for estimating the state’s relative achievement was designed as shown.
For the ith state:
Xi = Installed capacity addition up to 2014
Value of the 1st component for the ith state = Xi / ΣXi
The formula for the state’s relative achievement vis-á-vis its potential is
For the ith state
If Ai = RE potential for the state
And Yi= Achieved potential up to the end of FY 2008-09
And if CAi= Xi/ (Ai-Yi)
Then the coefficient for the 2nd component for the ith state will be CAi/Σ CAi
As Tamil Nadu may have a negative CAi, the highest value of CFi for any state can be used. The total
value of the grant is capped at Rs.1.25 crore per MW of installed capacity (Xi) for general category
states like Tamil Nadu. The actual grant disbursal is also subject to the following conditions:
it will be based on data published by the Government of India on capacity-addition by states;
the state should permit RE developers/projects access to competitive power markets, at charges
not exceeding the levels specified by the CERC; and
transmission charges and losses applicable for renewable energy targets are not to exceed a
level of Rs. 0.25/kWh and 5% respectively, or, the state transmission utility should have
implemented rational alternate transmission pricing frameworks (including point of connection
tariffs) if so recommended by the CERC, within 12 months of such recommendations coming into
force.
Data-use and assumptions for CFA calculation
Calculation of value for the second component of the CFA is not possible as it would require a
projected data for all states. Therefore, value of only the first component is estimated for both
the scenarios.
Existing installed values of RE were taken from MNRE and TEDA. Table 12.7 shows the installed
capacity figures
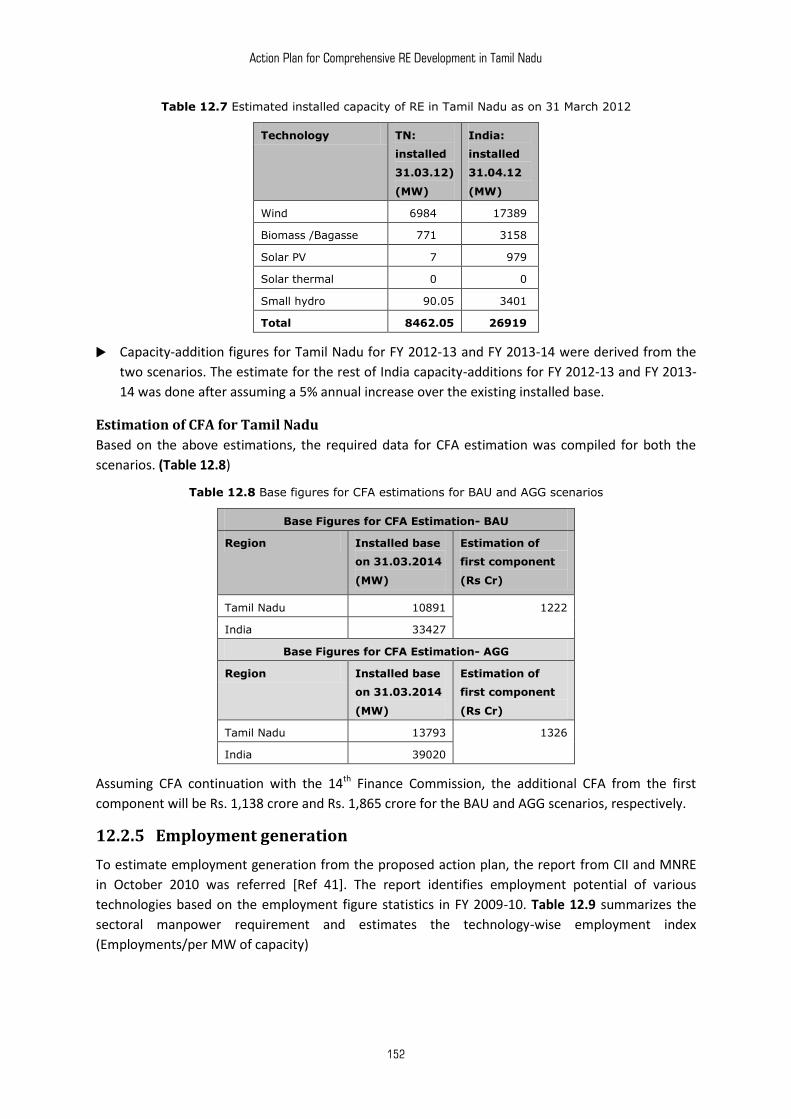
Action Plan for Comprehensive RE Development in Tamil Nadu
152
Table 12.7 Estimated installed capacity of RE in Tamil Nadu as on 31 March 2012
Technology TN:
installed
31.03.12)
(MW)
India:
installed
31.04.12
(MW)
Wind 6984.00 17389
Biomass /Bagasse 771.00 3158
Solar PV 7.00 979
Solar thermal 0.00 0
Small hydro 90.05 3401
Total 8462.05 26919
Capacity-addition figures for Tamil Nadu for FY 2012-13 and FY 2013-14 were derived from the
two scenarios. The estimate for the rest of India capacity-additions for FY 2012-13 and FY 2013-
14 was done after assuming a 5% annual increase over the existing installed base.
Estimation of CFA for Tamil Nadu
Based on the above estimations, the required data for CFA estimation was compiled for both the
scenarios. (Table 12.8)
Table 12.8 Base figures for CFA estimations for BAU and AGG scenarios
Base Figures for CFA Estimation- BAU
Region Installed base
on 31.03.2014
(MW)
Estimation of
first component
(Rs Cr)
Tamil Nadu 10891 1222
India 33427
Base Figures for CFA Estimation- AGG
Region Installed base
on 31.03.2014
(MW)
Estimation of
first component
(Rs Cr)
Tamil Nadu 13793 1326
India 39020
Assuming CFA continuation with the 14th Finance Commission, the additional CFA from the first
component will be Rs. 1,138 crore and Rs. 1,865 crore for the BAU and AGG scenarios, respectively.
12.2.5 Employment generation
To estimate employment generation from the proposed action plan, the report from CII and MNRE
in October 2010 was referred [Ref 41]. The report identifies employment potential of various
technologies based on the employment figure statistics in FY 2009-10. Table 12.9 summarizes the
sectoral manpower requirement and estimates the technology-wise employment index
(Employments/per MW of capacity)
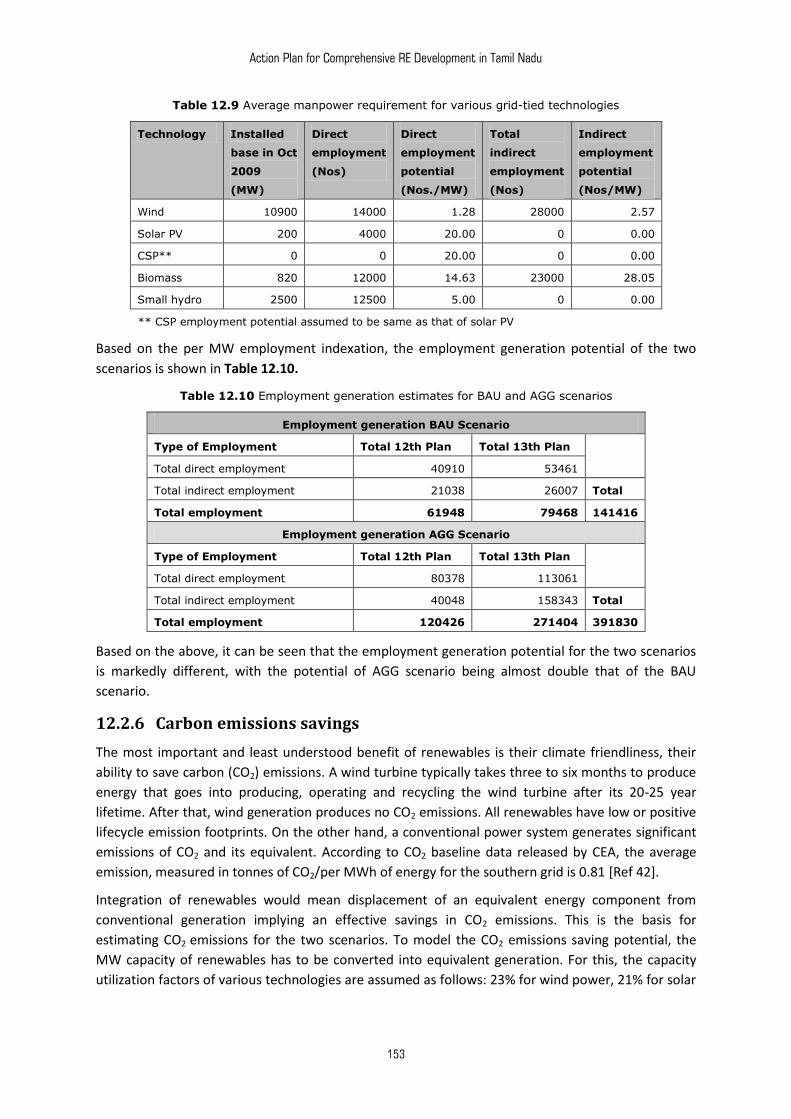
Action Plan for Comprehensive RE Development in Tamil Nadu
153
Table 12.9 Average manpower requirement for various grid-tied technologies
Technology Installed
base in Oct
2009
(MW)
Direct
employment
(Nos)
Direct
employment
potential
(Nos./MW)
Total
indirect
employment
(Nos)
Indirect
employment
potential
(Nos/MW)
Wind 10900 14000 1.28 28000 2.57
Solar PV 200 4000 20.00 0 0.00
CSP** 0 0 20.00 0 0.00
Biomass 820 12000 14.63 23000 28.05
Small hydro 2500 12500 5.00 0 0.00
** CSP employment potential assumed to be same as that of solar PV
Based on the per MW employment indexation, the employment generation potential of the two
scenarios is shown in Table 12.10.
Table 12.10 Employment generation estimates for BAU and AGG scenarios
Employment generation BAU Scenario
Type of Employment Total 12th Plan Total 13th Plan
Total direct employment 40910 53461
Total indirect employment 21038 26007 Total
Total employment 61948 79468 141416
Employment generation AGG Scenario
Type of Employment Total 12th Plan Total 13th Plan
Total direct employment 80378 113061
Total indirect employment 40048 158343 Total
Total employment 120426 271404 391830
Based on the above, it can be seen that the employment generation potential for the two scenarios
is markedly different, with the potential of AGG scenario being almost double that of the BAU
scenario.
12.2.6 Carbon emissions savings
The most important and least understood benefit of renewables is their climate friendliness, their
ability to save carbon (CO2) emissions. A wind turbine typically takes three to six months to produce
energy that goes into producing, operating and recycling the wind turbine after its 20-25 year
lifetime. After that, wind generation produces no CO2 emissions. All renewables have low or positive
lifecycle emission footprints. On the other hand, a conventional power system generates significant
emissions of CO2 and its equivalent. According to CO2 baseline data released by CEA, the average
emission, measured in tonnes of CO2/per MWh of energy for the southern grid is 0.81 [Ref 42].
Integration of renewables would mean displacement of an equivalent energy component from
conventional generation implying an effective savings in CO2 emissions. This is the basis for
estimating CO2 emissions for the two scenarios. To model the CO2 emissions saving potential, the
MW capacity of renewables has to be converted into equivalent generation. For this, the capacity
utilization factors of various technologies are assumed as follows: 23% for wind power, 21% for solar
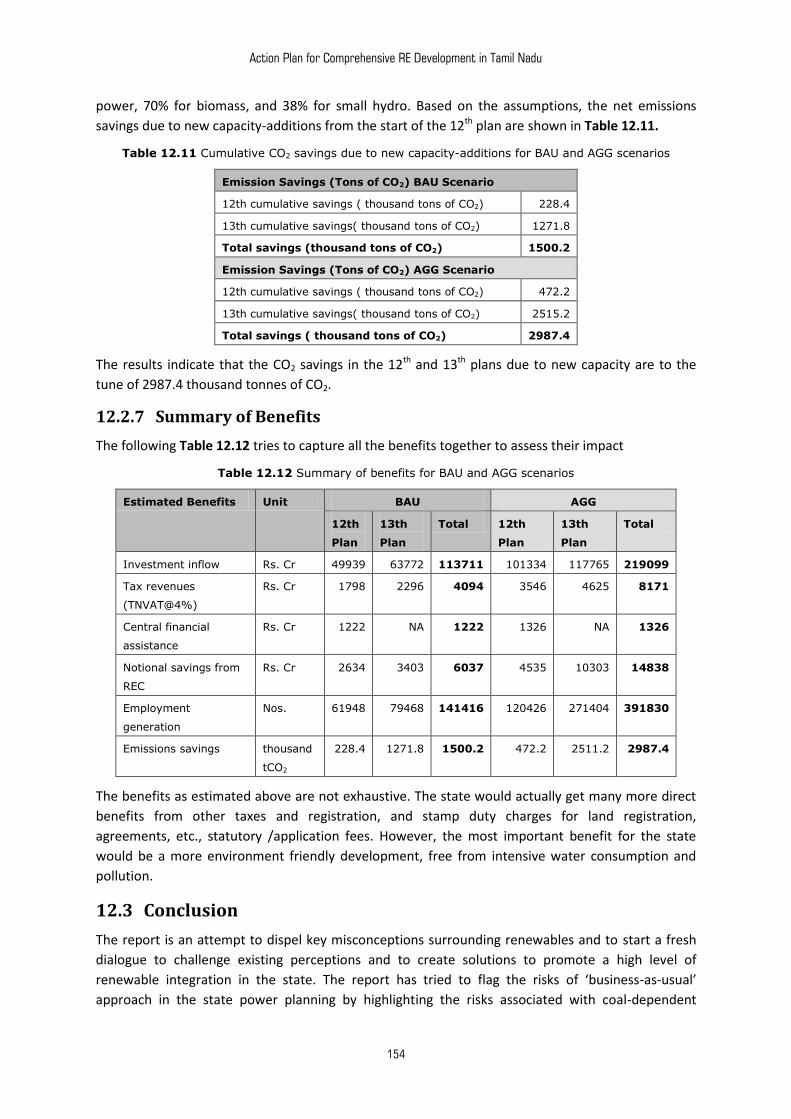
Action Plan for Comprehensive RE Development in Tamil Nadu
154
power, 70% for biomass, and 38% for small hydro. Based on the assumptions, the net emissions
savings due to new capacity-additions from the start of the 12th plan are shown in Table 12.11.
Table 12.11 Cumulative CO2 savings due to new capacity-additions for BAU and AGG scenarios
Emission Savings (Tons of CO2) BAU Scenario
12th cumulative savings ( thousand tons of CO2) 228.4
13th cumulative savings( thousand tons of CO2) 1271.8
Total savings (thousand tons of CO2) 1500.2
Emission Savings (Tons of CO2) AGG Scenario
12th cumulative savings ( thousand tons of CO2) 472.2
13th cumulative savings( thousand tons of CO2) 2515.2
Total savings ( thousand tons of CO2) 2987.4
The results indicate that the CO2 savings in the 12th and 13th plans due to new capacity are to the
tune of 2987.4 thousand tonnes of CO2.
12.2.7 Summary of Benefits
The following Table 12.12 tries to capture all the benefits together to assess their impact
Table 12.12 Summary of benefits for BAU and AGG scenarios
Estimated Benefits Unit BAU AGG
12th
Plan
13th
Plan
Total 12th
Plan
13th
Plan
Total
Investment inflow Rs. Cr 49939 63772 113711 101334 117765 219099
Tax revenues
(TNVAT@4%)
Rs. Cr 1798 2296 4094 3546 4625 8171
Central financial
assistance
Rs. Cr 1222 NA 1222 1326 NA 1326
Notional savings from
REC
Rs. Cr 2634 3403 6037 4535 10303 14838
Employment
generation
Nos. 61948 79468 141416 120426 271404 391830
Emissions savings thousand
tCO2
228.4 1271.8 1500.2 472.2 2511.2 2987.4
The benefits as estimated above are not exhaustive. The state would actually get many more direct
benefits from other taxes and registration, and stamp duty charges for land registration,
agreements, etc., statutory /application fees. However, the most important benefit for the state
would be a more environment friendly development, free from intensive water consumption and
pollution.
12.3 Conclusion
The report is an attempt to dispel key misconceptions surrounding renewables and to start a fresh
dialogue to challenge existing perceptions and to create solutions to promote a high level of
renewable integration in the state. The report has tried to flag the risks of ‘business-as-usual’
approach in the state power planning by highlighting the risks associated with coal-dependent
Action Plan for Comprehensive RE Development in Tamil Nadu
155
power planning. At the same time, the report has established that the renewable energy potential of
the state is in multiples of the existing estimates and is not a constraint for the state.
The report has further found that even an aggressive RE integration (an addition of 36,340 MW of
new RE capacity over the 12th and 13th five-year plans) is technically feasible and can be managed
by appropriate infrastructure augmentation and operational modifications. Further, the study has
also assessed the commercial impacts of the aggressive RE capacity addition plan and has tried to
estimate the extent of burden (in monetary terms), in addition to estimating the direct and indirect
benefits/losses to the state. Finally, the report also prioritizes the action points and interventions
into an implementation roadmap by developing a procedure-focused format along with
identification of key departments or agencies that will have the responsibility to implement the
proposed actions.
The message from the project’s findings is very clear: given the present situation and the emerging
scenario in terms of resource ownership and our choice of the development path, renewables seem
to be the most optimal option for the state from a long-term perspective.
In case the state decides to opt for renewables, it has to be open to bringing about swift and
unconventional changes in the way we perceive the sources and uses of power.
***

Action Plan for Comprehensive RE Development in Tamil Nadu
156
Action Plan for Comprehensive RE Development in Tamil Nadu
157
References
1. Monthly all-India installed generation capacity report, Central Electricity Authority: August 2012.
2. Policy Note, 2011-12, Energy Department, Government of Tamil Nadu: 2012
3. ‘Media Report’, The Guardian, UK, 26 March 2012. (http://www.guardian.co.uk/environment/2012/mar/26/wind-energy-
denmark)
4. ‘Coal shortage prompts change in power plant design’, The Hindi Business Line, 12 May 2012.
(http://www.thehindubusinessline.com/industry-and-economy/article2013086.ece)
5. ‘State may have to rely on imported coal for new thermal projects’, The Hindu, 14 November 2011.
(http://www.thehindu.com/news/states/tamil-nadu/article2625049.ece)
6. ‘Tata Power to shelve projects based on coal imports’, The financial express, 15 Jun 2012.
(http://www.financialexpress.com/news/tata-power-to-shelve-projects-based-on-coal-imports/962207/0)
7. ‘No loans to new thermal projects’, The Times of India, 21 December 2011.
(http://timesofindia.indiatimes.com/business/india-business/No-loans-to-thermal-power-
projects/articleshow/11188519.cms
8. Solar roadmap for Tamil Nadu: opportunities and roles of government and industry, World Institute of Sustainable Energy: 2010.
9. PV site suitability analysis using GIS-based spatial fuzzy multi-criteria evaluation, Dr Adel Gastli and Dr Yassine Charabi, Sultan
Qaboos University, Renewable & Sustainable Energies Research Group: 2010.
10. ‘Hotspots of solar potential in India’, by T.V. Ramachandra and others, Renewable and Sustainable Energy Reviews 15, 3178–3186:
2011.
11. A Solar Rooftop Assessment for Austin, Steve Wiese et al. American Solar Energy Society: 2010.
12. Potential and prospects of solar energy in Uttara Kannada, district of Karnataka state, India, by T. V. Ramachandra and D. K.
Subramanian, Centre for Ecological Sciences, Indian Institute of Science, Bangalore, India, (1997).
13. Implications of renewable energy technologies in Bangladesh power sector: Long-term planning strategies, by Md. Alam Hossain
Mondal, (2010).
14. Global Concentrated Solar Power Markets and Strategies, 2007–2020, by Emerging Energy Research, November 2007.
15. District-wise net area sown and irrigated during 2009-10, Statistical Hand Book – 2011, The Department of Economics and Statistics,
Government of Tamil (http://www.tn.gov.in/deptst/Stat.htm
16. Identification of Industrial Sectors Promising for Commercialization of Solar Energy, PricewaterhouseCoopers Pvt. Limited, India
(pwc), published by Deutsche Gesellschaft für Internationale Zusammenarbeit (GIZ) GmbH: December 2011
17. Page 2, Solar Water Heating Systems, MNRE
http://mnre.gov.in/file-manager/UserFiles/brief_swhs.pdf
18. ‘A GIS-based assessment of potential for wind farms in India’, by Jami Hossain, Vinay Sinha, V.V.N. Kishore, in, Renewable Energy,
Volume 36 (12), pp 3257-3267: December 2011.
19. ‘Reassessing wind potential estimates for India: Economic and Policy Implications, Amol Phadke (Lawrence Berkeley National
Laboratory), Ranjit Bharvirkar (Itron Inc.): March 2012.
20. Global potential for wind-generated electricity by Xi Lu, Michael B. McElroya and Juha Kiviluoma: April 2009.
21. ‘Europe's onshore and offshore wind energy potential – an assessment of environmental and economic constraints by European
Energy Agency’, published in EEA Technical Report, No 6/2009.
22. Wind Power Project Site -Identification and Land Requirements, Prepared by: Global Energy Concepts, AWS Truewind, LLC for NYS
Energy Research & Development Authority: October 2005
23. ‘Evaluation of renewable energy potential using a GIS decision support system’, by D. Voivontas, D. Assimacopoulos, A. Mourelatos
from National Technical University of Athens, and J. Corominas from Ecoserveis. Renewable Energy, Volume 13 (3), pp 333-344:
1998.
24. An Assessment of the Available Windy Land Area and Wind Energy Potential in the Contiguous United States, by D.L. Elliot, L.L.
Wendell, G.L. Gower from Pacific Northwest Laboratory for the US Department of Energy: August 1991.
25. Integrated renewable energy resource assessment for Gujarat, The Energy and Resources Institute (TERI), 113 pp. [Project Report No
2010RT08]: January 2012.
Action Plan for Comprehensive RE Development in Tamil Nadu
158
26. National Biomass Resource Atlas, developed by the Combustion Gasification and Propulsion Laboratory (CGPL), of the Indian
Institute of Science (IISc) Bangalore, in collaboration with the Ministry of New and Renewable Energy (MNRE), Govt of India: 2004.
27. District-wise biomass power potential for Tamil Nadu, by Anna University: 2010.
28. Taluk-level biomass power potential assessment, by TEDA and MNRE: 2008.
29. Optimizing development of small hydel resources in the hilly regions (13 Himalayan and sub-Himalayan states) of India, AHEC, IIT
(Roorkee) : 2007
30. Manual on planning and design of small hydro power, publication No. 280, CBIP: 2011
31. Achieving 12% green electricity by 2017, WISE: June 2011.
32. Capacity addition figures for FY2011-12, Indian Wind Turbine Manufacturers Association
33. Wind Project pending application from Non Conventional Energy Sources (NCES) division, Tamil Nadu Electricity Board
34. Constitution of committee to accelerate development of renewable energy through legislative and policy changes and to
evolve competitive bidding guidelines for procurement of power from renewable energy by distribution licensees and to
address issues related to connectivity and evacuation infrastructure’, Ministry of Power, F no. 23/17/2009-R&R (Pt): 13
February 2012.
35. Determination of Tariff for generation and distribution, order no 1 of 2012, Tamil Nadu Electricity Regulatory Commission:
30.03.12
36. ‘We're not responsible for your losses, TN wind industry tells Tangedco’, The Hindu Business Line, Chennai, 20.06.12
(http://www.thehindubusinessline.com/industry-and-economy/article3550673.ece)
37. Comprehensive Tariff order on wind energy, order no 6 of 2012, Tamil Nadu Electricity Regulatory Commission: 31.07.12
38. ‘Govt Plans offshore facility to tap wind energy’, Times of India, 06 January 2012.
(http://articles.timesofindia.indiatimes.com/2012-01-06/chennai/30597310_1_offshore-windmills-cwet-wind-energy-
technology)
39. Policy and Regulatory Interventions to support community level off grid projects, ABPS Infrastructure Advisory Private
Limited: November 2011
40. Terms and conditions for tariff determination from renewable energy sources, Regulation 2012, CERC: February 2012.
41. Human resource development strategies for Indian renewable energy sector, CII and MNRE, Final Report: October 2010
42. CO2 baseline data for Indian Power sector’ User Guide, Version 6, Central Electricity Authority: March 2011
***