sustainability of urban freight transport retail distribution … · 3 sustainability of urban...
TRANSCRIPT

HANS QUAK
Sustainability ofUrban Freight TransportRetail Distribution and Local Regulations in Cities
Erasmus University Rotterdam RSM Erasmus University Erasmus School of EconomicsP.O. Box 1738, 3000 DR RotterdamThe Netherlands
Tel. +31 10 408 11 82Fax +31 10 408 96 40E-mail [email protected] www.erim.eur.nl
HA
NS
QU
AK
- Su
stain
ab
ility o
f Urb
an
Freig
ht Tra
nsp
ort
ERIM PhD SeriesResearch in Management
Era
smu
s R
ese
arc
h I
nst
itu
te o
f M
an
ag
em
en
t-
ER
IM
124
ER
IM
De
sig
n &
la
you
t: B
&T
On
twe
rp e
n a
dvi
es
(w
ww
.b-e
n-t
.nl)
Pri
nt:
Ha
vek
a
(w
ww
.ha
vek
a.n
l)SUSTAINABILITY OF URBAN FREIGHT TRANSPORT
Retail Distribution and Local Regulations in Cities
Although our urbanised civilisation requires freight transport in order to sustain it,
urban freight transport is especially recognised for its unsustainable impacts. To reduce
the unsustainable impacts of urban freight transport, many local governments develop
policies that focus sometimes more on banning or restricting urban freight transport than
on making it more sustainable. In the first part of this thesis we develop a framework to
structure the urban freight transport field and to review urban freight transport
sustainability initiatives. The number of initiatives that is successfully implemented in
practice turns out to be quite low. In the review and the following analysis, we try to find
the barriers for successful implementation of the initiatives in practice. In the second part
we examine the impacts of the most commonly used local sustainability policies. Six time-
window scenarios and their impacts on the economical, environmental and social
sustainability are examined based on a multiple case study. Time-window regulations
increase both the environmental burden and distribution costs. Retail chains are affected
differently by time-window pressure and vehicle restrictions due to differences in their
logistical concept. Based on an experiment we examine the effects of retailers’ logistical
decisions in combination with local sustainability policies. Next, we examine the degree to
which retailers are able to deal with problems caused by time-windows. Combining the
primary and secondary distribution, i.e. factory gate pricing, results in more sustainable
distribution operations for the retailer and in less sensitivity towards time-window
regulations
ERIM
The Erasmus Research Institute of Management (ERIM) is the Research School (Onder -
zoek school) in the field of management of the Erasmus University Rotterdam. The founding
participants of ERIM are RSM Erasmus University and the Erasmus School of Econo mics.
ERIM was founded in 1999 and is officially accredited by the Royal Netherlands Academy
of Arts and Sciences (KNAW). The research undertaken by ERIM is focussed on the
management of the firm in its environment, its intra- and interfirm relations, and its busi -
ness processes in their interdependent connections.
The objective of ERIM is to carry out first rate research in manage ment, and to offer an
advanced doctoral pro gramme in Research in Management. Within ERIM, over three
hundred senior researchers and PhD candidates are active in the different research
programmes. From a variety of acade mic backgrounds and expertises, the ERIM commu nity
is united in striving for excellence and working at the fore front of creating new business
knowledge.
B&T28618 - Erim omslag Quak 21jan08

1
Sustainability of Urban Freight Transport Retail Distribution and Local Regulations in Cities

2

3
Sustainability of Urban Freight Transport Retail Distribution and Local Regulations in Cities
Duurzaamheid van stedelijk goederenvervoer Retail distributie en lokale regelgeving in steden
Proefschrift
ter verkrijging van de graad van doctor aan de Erasmus Universiteit Rotterdam
op gezag van de rector magnificus Prof.dr. S.W.J. Lamberts
en volgens besluit van het College voor Promoties.
De openbare verdediging zal plaatsvinden op donderdag 20 maart 2008 om 16.00 uur
door Henricus Joannes Quak geboren te Bergschenhoek

4
Promotiecommissie Promotor: Prof.dr. M.B.M. de Koster Overige leden: Prof. M.J. Browne MSc Prof.dr.ir. J.A.E.E. van Nunen Prof.dr.ing. G.R. Teisman Erasmus Research Institute of Management (ERIM) RSM Erasmus University / Erasmus School of Economics Erasmus University Rotterdam Internet: http://www.erim.eur.nl ERIM Electronic Series Portal: http://hdl.handle.net/1765/1 ERIM Ph.D. Series Research in Management 124 TRAIL Thesis Series T2008/5, the Netherlands, TRAIL Research School ISBN 978-90-5892-154-3 Design: B&T Ontwerp en advies www.b-en-t.nl / Print: Haveka www.haveka.nl © 2008, H.J. Quak All rights reserved. No part of this publication may be reproduced or transmitted in any form or by any means electronic or mechanical, including photocopying, recording, or by any information storage and retrieval system, without permission in writing from the author.

5
i
Acknowledgements
It has been a long time since Geert and I sat down drinking our first cup of coffee at the university …. just finished high school, we were sure that after four (maybe five) years we would find a great job in the private sector, you know at a real company, but definitely not in the public sector, let alone a university. At that time, nor at any other time during my study, did I ever consider beginning a Ph.D. trajectory. After finishing my MSc thesis, René was looking for a graduate student for a project on the impacts of governmental time-window restrictions. I saw this as an opportunity to go deeply in a subject for a short period, with the idea that during that period I could think about the kind of career I would like to pursue. However, when this project did not take off (fast enough) we discussed the possibilities to do this research as part of a Ph.D. program. ERIM accepted our proposal and without having an idea of what I was up to (with hindsight), I started this trajectory. I never regretted this decision and I enjoyed working at the university with the possibilities to learn, develop and examine many things and to travel to different continents. Many people contributed to this pleasant period at RSM Erasmus University and the resulting Ph.D. thesis (which you are currently reading …). And although it is difficult to express my gratitude to everyone who had a role in this, without forgetting someone, there are some people I definitely have to mention here. First and foremost I like to thank René! Enthusiastically as you are, you have been more motivating and supporting than I believe you ever think you are. Always seeing and sharing opportunities with me, but giving me a free hand to do things my way. Thank you for your confidence and our pleasant cooperation. The longer we worked together, the more I am convinced that you really deserve the ‘best supervisor award’ (which you already received in 2004 from the research school TRAIL). Next, I also like to thank the members of my inner committee. Mike thanks for your hospitality and the discussions about my research. I thank Jo for our useful discussions about innovative solutions for urban freight transport. Geert Teisman helped to improve my literature study, something I struggled with through the entire Ph.D. trajectory. This research would never have been possible without the cooperation of a number of retailers. I owe much gratitude to the managers and planners for their help and assistance. I would also like to thank Ron for introducing me in the City Logistics community and the great times at (usually) sunny locations. I would also like to thank my colleagues at the Department Management of Technology and Innovation for the pleasant working environment and in particular the “hardcore lunch group” or the AiO++ group as it was labelled longer ago. Wendy thank you (for taking care

6
Acknowledgements
ii
of the plants in T10-50 and of course) for being such a great roommate! Obviously, I can not leave out Carmen in this section; thank you for all your support (initially when I was a student-assistant) and continuing to confirm that everything would be fine (or “komt-wel-goed-jongen”). And, thank you for proof reading a chapter of my thesis Hans (and of course for our nice chats, pleasant ski-trips and so on), Geerten, Koen (whose door is always open), Mengfei (and for the many conversations), Elfi (and also for our joined alliteration research projects, trips and talks), Raf and Jordan. Finally, mam and pap, thanks for our many phone calls at times it was necessary (and all other times), for your support, confidence and everything! I give thanks to Truus and Bert. I also like to thank Bernard (sorry, from now on it is just ‘you from the Erasmus’ and no longer ‘we’) and Jacqueline for your continuing interest and support. That leaves me with thanking my ‘paranimfen’; Geert thanks for our pleasant times and dinners over the last years, for also (partly) sticking at the university, and for proof reading my thesis. Joline, although you probably won’t agree, without you and your unconditional support and confidence in me, I believe this thesis would not have been written at all. I can not thank you enough for just been being with me in this and all other things over the last years! Hans Quak Rotterdam, November 2007
7
iii
Table of Contents
Acknowledgements ........................................................................................................ i List of Figures ............................................................................................................... v List of Tables................................................................................................................ ix 1 Introduction........................................................................................................ 1
1.1 Sustainability of urban freight transport................................................... 1 1.2 Defining urban freight transport............................................................... 3 1.3 Urban freight transport and regulation ..................................................... 3 1.4 Retail chain distribution practices ............................................................ 7 1.5 Research questions and scientific contribution ...................................... 10 1.6 Managerial relevance ............................................................................. 13 1.7 Outline of the thesis ............................................................................... 14
Part I Urban freight transport sustainability initiatives ......................................... 17 2 A framework and classification for urban freight transport
sustainability initiatives ................................................................................... 19 2.1 Introduction............................................................................................ 19 2.2 Methodology: building the framework and classify UFTS
initiatives................................................................................................ 21 2.3 Selective literature review...................................................................... 24 2.4 The basic framework.............................................................................. 26 2.5 Framework: the dimensions and their classifications and elements....... 28 2.6 The framework....................................................................................... 38 2.7 Structuring UFTS initiatives .................................................................. 39 2.8 Initiative types........................................................................................ 40 2.9 Conclusions and summary ..................................................................... 43
3 Improving sustainability: a review of initiatives ........................................... 45 3.1 Introduction............................................................................................ 45 3.2 Policy initiatives..................................................................................... 46 3.3 Company driven initiatives .................................................................... 58 3.4 Physical infrastructure initiatives........................................................... 66 3.5 Transport reorganising initiatives .......................................................... 78 3.6 Analysis and discussion of UFTS initiatives.......................................... 83 3.7 Conclusions............................................................................................ 86
Part II Dealing with local sustainability policies: the impacts, sensitivity, and opportunities .................................................................................................... 89
4 Impacts of local authorities’ time-window policies ....................................... 91

8
Table of Contents
iv
4.1 Introduction ............................................................................................ 91 4.2 Time-window policies in the Netherlands.............................................. 93 4.3 Theoretical foundation and construct development................................ 95 4.4 Methodology ........................................................................................ 101 4.5 Scenario definition ............................................................................... 110 4.6 Results .................................................................................................. 114 4.7 Conclusions .......................................................................................... 121
5 Retailers’ sensitivity to local sustainability policies .................................... 125 5.1 Introduction .......................................................................................... 125 5.2 Retailers’ sensitivity to time-windows: results from cross-case
analysis................................................................................................. 127 5.3 Dealing with urban policy measures: theoretical foundation and
construct adjustment............................................................................. 131 5.4 Experiment with retailers’ distribution strategy ................................... 133 5.5 Results from the experiment................................................................. 139 5.6 Conclusions .......................................................................................... 148
6 Factory gate pricing opportunities due to time-window restrictions......... 151 6.1 Introduction .......................................................................................... 151 6.2 Factory gate pricing and backhauling................................................... 152 6.3 Case study ............................................................................................ 155 6.4 Methodology ........................................................................................ 161 6.5 Results .................................................................................................. 170 6.6 Conclusions .......................................................................................... 177
7 Concluding remarks ...................................................................................... 179 7.1 Introduction .......................................................................................... 179 7.2 Key findings ......................................................................................... 179 7.3 Summary of findings............................................................................ 180 7.4 Limitations and recommendations for further research........................ 184
Appendix A Retail chain characteristics ............................................................. 191 Appendix B Experimental design scenarios and corresponding variable
values (chapter 5) ............................................................................ 199 Appendix C List of abbreviations ........................................................................ 201 References.................................................................................................................. 203 Summary ................................................................................................................... 217 Samenvatting (summary in Dutch) ......................................................................... 223 About the author....................................................................................................... 231

9
v
List of Figures
Figure 1.1 Lex Iulia Municipalis dated B.C. 45 - the first regulation on urban freight transport............................................................................................. 5
Figure 1.2 Heterogeneity in relations between stakeholders: the cases of the large retail chain and the small sized business ....................................................... 8
Figure 1.3 The retail supply chain (Van der Vlist, 2007) ............................................... 9 Figure 1.4 Outline of the thesis .................................................................................... 15 Figure 2.1 Structure of used terminologies to develop the framework......................... 21 Figure 2.2 Basic framework ......................................................................................... 28 Figure 2.3 The classes ‘description’ and ‘type’ for the dimension ‘what
initiative’ ..................................................................................................... 29 Figure 2.4 Unsustainability hierarchy (Marshall and Toffel, 2005) ............................. 30 Figure 2.5 The classes ‘sustainability level’ and ‘sustainability type’ for the
dimension ‘why’ ......................................................................................... 31 Figure 2.6 The class ‘actors involved’ for the dimension ‘who’ .................................. 32 Figure 2.7 The classes ‘type and role’ and ‘reason of involvement’ for the
dimension ‘why involved’........................................................................... 33 Figure 2.8 The classes ‘spatial scarcity’, ‘urban type’, ‘geographical focus’ and
‘outlet type’ for the basic dimension ‘where’ ............................................. 34 Figure 2.9 The classes ‘transport mode’, ‘delivery characteristics’, ‘transport
motivation’, ‘supply chain directions’ and ‘product type’ for the dimension ‘what transport characteristics’.................................................. 36
Figure 2.10 The class ‘methods’ for the dimension ‘how’ ............................................. 37 Figure 2.11 The classes ‘success’, ‘evaluation criteria’ and ‘critical success factor
or barrier’ for the dimension ‘what results’................................................. 38 Figure 2.12 Framework for evaluating UFTS initiatives................................................ 39 Figure 3.1 Archetype road pricing initiative................................................................. 49 Figure 3.2 Archetype licensing and regulation initiative.............................................. 55 Figure 3.3 Archetype parking and unloading initiative ................................................ 57 Figure 3.4 Archetype carrier cooperation initiative...................................................... 61 Figure 3.5 Archetype vehicle routing improvement initiative...................................... 63 Figure 3.6 Chronocity................................................................................................... 65 Figure 3.7 Archetype technological vehicle innovation initiative ................................ 66 Figure 3.8 The city consolidation centre concept ......................................................... 67 Figure 3.9 Archetype consolidation centre initiative.................................................... 72

10
List of Figures
vi
Figure 3.10 Archetype underground logistics systems initiative ....................................74 Figure 3.11 Archetype road infrastructure development initiative .................................75 Figure 3.12 Archetype standardisation of load-units initiative .......................................77 Figure 3.13 Archetype transport auction initiative .........................................................79 Figure 3.14 Cargotram in Dresden .................................................................................80 Figure 3.15 Archetype intermodal transport initiative....................................................82 Figure 4.1 Drivers for distribution performance, based on Van Goor et al. (2003)......96 Figure 4.2 Research framework: constructs and their dimensions................................97 Figure 4.3 Steps of sequential insertion algorithm in SHORTREC (Poot et al.,
2002) .........................................................................................................107 Figure 4.4 Case specific cumulative percentage of stores affected by Time-
window pressure in sub scenarios .............................................................112 Figure 4.5 Impacts of varying Time-window pressure on Operational
performance (cumulative over all cases)...................................................115 Figure 4.6 Impacts of varying Time-window pressure on Financial performance
(cumulative over all cases) ........................................................................116 Figure 4.7 Impacts of varying Time-window pressure on Environmental
performance (cumulative over all cases)...................................................116 Figure 4.8 Percentage cost increase of time-window affected store compared to
non-affected store for scenarios 2, 3, 4, and 5 (per case and accumulated) .............................................................................................117
Figure 4.9 Local and global environmental impacts for different time-window schemes .....................................................................................................118
Figure 5.1 Impacts of varying Time-window pressure for different Retailer types ....128 Figure 5.2 Impacts of varying Time-window pressure for different Supply chain
strategies ...................................................................................................128 Figure 5.3 Impacts of varying Time-window pressure for different Network
structure and Logistical planning dimensions...........................................130 Figure 5.4 Adjusted research model ...........................................................................132 Figure 5.5 Locations of distribution centres in the Netherlands .................................136 Figure 5.6 Geographical store dispersion ...................................................................137 Figure 5.7 Comparison between cases: standardised financial performance
drivers........................................................................................................141 Figure 5.8 Comparison between cases: standardised environmental performance
drivers........................................................................................................143 Figure 5.9 Impact of policy measures on costs of different type of companies..........144 Figure 5.10 Main effects on costs compared with a third case .....................................147 Figure 6.1 The evolution of the retail supply chain (adapted from Aujla et al.,
2003; Fernie et al., 2000)...........................................................................152 Figure 6.2 DRC01’s store, DC, and supplier locations...............................................157
11
List of Figures
vii
Figure 6.3 DSD04-F’s store, DC, and supplier locations ........................................... 158 Figure 6.4 DSD04-R1’s store, DC, and supplier locations (per DC and total)........... 159 Figure 6.5 DSD04-R2’s store, DC, and supplier locations (per DC and total)........... 160 Figure 6.6 Dutch zip-code coordinates included in Matlog........................................ 163 Figure 6.7 Improvement heuristics illustration (Kindervater and Savelsbergh,
1997) ......................................................................................................... 165 Figure 6.8 Results DRC01 (one week)....................................................................... 171 Figure 6.9 Results DSD04-F (one week).................................................................... 172 Figure 6.10 Results DSD04-R1 (one week) ................................................................. 173 Figure 6.11 Results DSD04-R2 (one week) ................................................................. 173 Figure 6.12 Differences in kilometres travelled due to network improvement for
DSD04-R (one week)................................................................................ 174 Figure 6.13 Increase in number of vehicles after including primary distribution in
secondary distribution ............................................................................... 175 Figure 6.14 Vehicle utilisation during 24-hour period ................................................. 175 Figure A.1 Dutch store and DC locations DRC01 ...................................................... 191 Figure A.2 Dutch store and DC locations DSC02....................................................... 192 Figure A.3 Dutch store and DC locations DSC03....................................................... 192 Figure A.4 Dutch store and DC locations DSD04....................................................... 193 Figure A.5 Dutch store and DC locations DSD05....................................................... 193 Figure A.6 Dutch store and DC locations FAC06....................................................... 194 Figure A.7 Dutch store and DC locations FAC07....................................................... 194 Figure A.8 Dutch store and DC locations FAR08....................................................... 195 Figure A.9 Dutch store and DC locations FAR09....................................................... 195 Figure A.10 Dutch store and DC locations FAR10....................................................... 196 Figure A.11 Dutch store and DC locations FOdC11..................................................... 196 Figure A.12 Dutch store and DC locations FOdD12 and FOfD14................................ 197 Figure A.13 Dutch store and DC locations FOdfC13.................................................... 198 Figure A.14 Detachable swap body............................................................................... 198

12

13
ix
List of Tables
Table 2.1 A structure for urban freight transport sustainability initiatives.................. 40 Table 3.1 Number of initiatives in review................................................................... 45 Table 3.2 Road pricing initiatives’ most relevant elements ........................................ 47 Table 3.3 Licensing and regulation initiatives’ most relevant elements ..................... 50 Table 3.4 Parking and unloading initiatives’ most relevant elements ......................... 56 Table 3.5 Carrier cooperation initiatives’ most relevant elements .............................. 59 Table 3.6 Vehicle routing improvement initiatives’ most relevant elements .............. 62 Table 3.7 Technological vehicle innovation initiatives’ most relevant elements........ 64 Table 3.8 Consolidation centre initiatives’ most relevant elements ............................ 70 Table 3.9 Underground logistics systems initiatives’ most relevant elements ............ 73 Table 3.10 Road infrastructure development initiatives’ most relevant elements......... 75 Table 3.11 Standardisation of load-unit initiatives’ most relevant elements................. 76 Table 3.12 Transport auction initiatives’ most relevant elements................................. 78 Table 3.13 Intermodal transport initiatives’ most relevant elements ............................ 81 Table 4.1 Cities of which we interviewed policy-making officials responsible
for time-window policies ............................................................................ 94 Table 4.2 Official’s opinion on the effects of time-windows...................................... 95 Table 4.3 Variable costs per vehicle type.................................................................. 100 Table 4.4 Retailer characteristics per case ................................................................ 103 Table 4.5 SHORTREC calculation times (scenario 5b)................................................ 108 Table 4.6 Case study validity and reliability issues .................................................. 109 Table 4.7 Time-window policy scenario definitions................................................. 110 Table 4.8 Varying Time-window pressure in scenario 1........................................... 111 Table 4.9 Social performance indicators for different time-window schemes .......... 119 Table 4.10 Effects of moving time-windows from the morning to the night per
case............................................................................................................ 120 Table 5.1 Cases divided in groups per dimension for the cross-case analysis;
boundaries and number of cases per group ............................................... 129 Table 5.2 Variable values for experiment (grey-shaded cells represent current
values) ....................................................................................................... 135 Table 5.3 Costs per action type (other than costs per vehicle) .................................. 139 Table 5.4 Descriptive statistics (for a period of one week) ....................................... 139 Table 5.5 Descriptive statistics for DRC01 (one week) ............................................ 147

14
List of Tables
x
Table 6.1 Loading and unloading times ....................................................................156 Table 6.2 Scenarios ...................................................................................................161 Table 6.3 Computation time (Matlog).......................................................................167 Table B.1 Scenarios and corresponding variable values for the 37
IV2 − fractional factorial design ..........................................................................................199
Table B.2 Scenarios and corresponding variable values for the 28V2 − fractional
factorial design ..........................................................................................200

15
1
1 Introduction
1.1 Sustainability of urban freight transport Our current urban civilisation inevitably requires a freight transport system to support it. After all, urbanisation implies that people gather in a location, which is remote from their sources of e.g. food, consumer products, and also waste disposal opportunities (Ogden, 1992). Next, urban goods movement is fundamental to the economic vitality (Allen et al., 2000; Munuzuri et al., 2005) and indispensable for industrial, trade and leisure activities that are essential to wealth generation. Rapid and reliable goods distribution helps to support urban lifestyles in, for example, retailing, tourism, entertainment and leisure sectors (Allen et al., 2003). It is also widely recognised that an efficient distribution system is of major importance for the competitiveness of an urban area and that it is in itself already an important element of the urban economy (Browne, 1999; Browne and Allen, 1999). The total costs of freight transport and logistics are considerable and have an impact on the efficiency of the economy (Anderson et al., 2005). However, in spite of the vital role of urban freight transport in sustaining urban areas in the first place, urban freight transport is also recognised for its more unsustainable impacts. Urban goods transport is responsible for a number of social and environmental impacts that threaten the liveability in these urban areas. Several authors (e.g. Feitelson, 2002; Nicolas et al., 2003; Richardson, 2005) distinguish three sustainability issues: environmental sustainability, economic sustainability, and social sustainability, also known as the triple-bottom-line or triple-P: people, profit, and planet. The existing freight transport systems in urban areas have negative impacts on this triple-bottom-line (based on Anderson et al., 2005; Banister, 2000; Browne and Allen, 1999; May et al., 2003; Van Binsbergen and Visser, 2001), including: Impacts on planet (environmental sustainability):
o Pollutant emissions including global pollutants, such as carbon dioxide (CO2), and local pollutants, such as carbon monoxide (CO), nitrogen oxides (NOx), particulate matter (PM10) and volatile organic compounds (VOCs). Freight transport contributes to the global climate change (especially measured in CO2-emissions).
o The use of non-renewable natural resources, such as fossil-fuel. o Waste products, such as tyres, oil and other materials. o The loss of wildlife habitats and the associated threat to wild species.
Impacts on people (social sustainability): o The physical consequences of pollutant emissions on public health, such as death
and illness. o The injuries and death resulting from traffic accidents.

16
Chapter 1
2
o The increase in nuisance, such as noise disturbance, visual intrusion, stench, and vibration.
o Reduction in quality of life elements, such as the loss of greenfield sites and open spaces in urban areas as a result of transport infrastructure, intimidation, and decrease of attractiveness of a city centre.
o The damage to buildings and infrastructure. Impact on profit (economic sustainability):
o Inefficiency and waste of resources. o Decrease in journey reliability and delivery punctuality, potentially resulting in
less service to consumers and lost market. o Decrease in economic development. o Congestion and decreasing city accessibility.
The last point is also a threat to an efficient urban freight transport system. From the late 80s increasing incomes have led to a considerable increase in the number of private car owners. Next, the increased mobility and income have enabled people to start living at locations less dense than cities, resulting in separation between home and work, i.e. urban sprawl and the suburbanisation of the population in Western countries (see e.g. Banister et al., 2000). The increasing congestion and decreasing city accessibility make it quite difficult to achieve high levels of efficiency in urban freight transportation (Anderson et al., 2005). This in its turn increases the other unsustainable impacts of urban freight transport. A major change in insights was the observation that putting down more roads and more road capacity can not solve congestion problems on its own (see Visser et al. 1999). So increasing the road capacity was bound to limits, with the result that less road capacity was available for freight transport (Banister et al., 2000; Button and Pearman, 1981). This also leads to the emphasis on other types of regulations to deal with urban freight transport, accessibility and sustainable transport development - these are discussed in this thesis. Growth in road freight transport has resulted in an increase of these unsustainable impacts over the last decades. This increase occurred even in spite of achievements in industry, such as reducing the pollution from engines, and the improvement of fuels and vehicle productivity (Himanen et al., 2004). The growth of freight transport is related to economic growth, since the demand for freight transport is a derived demand; i.e. the gross domestic product and the road freight transport, measured in tonne-kilometres, develop similarly as if they are ‘coupled’ (see e.g. McKinnon, 2007; Tapio, 2005). Although the resulting growth of transport externalities also depends on other elements, such as vehicle utilisation, engine emission levels, and modal split, the increasing amount of freight transport still results in an increase of the unsustainable impacts. Next to economic growth, there are other developments that result in an increase of freight transport by road, for example:
1. The globalisation of the economy increased the separation and distance between production and consumption in place, i.e. production outsourcing, resulting in an increasing demand for freight transport (see e.g. Banister et al., 2000).
17
Introduction
3
2. Increased flexibility in production and distribution structures, e.g. just-in-time (JIT), results in smaller and more frequent deliveries. These types of deliveries result, next to an increase in transport, in a growth of road transport in particular in comparison with other modes, since road transport is feasible for small deliveries and is flexible (see e.g. Drewes Nielsen et al., 2003). In the urban area the stores’ storage rooms have been converted in commercially more interesting store areas. This has resulted in an increase of deliveries, while the delivered amount per delivery has decreased. This has led to an increase in the number of trucks and vans on the roads (see e.g. Vleugel and Janic, 2004).
1.2 Defining urban freight transport Many different freight flows constantly enter, cross, and leave urban areas. Examples include consumer goods, building material, waste, parcel and mail deliveries, etc. (Dablanc, 2007). The exact definition for urban freight transport differs per author. Urban goods movement is defined as “the movement of things (as distinct from people) to, from, within, and through urban areas” (Ogden, 1992). This definition corresponds to Munuzuri et al. (2005) “those movements of goods that are affected by particularities associated to urban traffic and morphology”. Ambrosini and Routhier (2004) argue that this definition should be extended, so that it includes “household purchasing trips, urban road maintenance and building, waste collection, etc.” and not only the movement of goods between premises. OECD (2003) defines it as “the delivery of consumer goods (not only by retail, but also by other sectors such as manufacturing) in city and suburban areas, including the reverse flow of used goods in terms of clean waste”. Allen et al. (2000) use a broader definition for urban freight transport that includes “(1) all types and sizes of goods vehicles and other motorised vehicles used for (core) goods collections and deliveries at premises in the urban area, (2) all types of goods vehicle movements to and from urban premises including goods transfers between premises, ancillary goods deliveries to urban premises, money collections and deliveries, waste collections and home deliveries made from urban premises to customers, and (3) service vehicle trips and other vehicle trips for commercial purposes which are essential to the functioning of urban premises”. We use the definition of Allen et al. (2000) in this thesis, although in the second part of this thesis we mainly focus on urban freight transport that is included in their first point. The terms urban freight transport and urban goods movement are used interchangeable throughout this thesis. 1.3 Urban freight transport and regulation At the time the negative impacts of urban freight transport became more and more visible and noticeable, the interest of policy-making bodies for urban goods movement started to grow (see e.g. Commission of the European Communities, 2001a; Commission of the European Communities, 2001b; DETR, 1998; 1999; EEA, 2001). The appearance of the concept of sustainable development and sustainable transport in policy reflections during the nineties also increased the policy-makers’ interest for urban goods transport (Allen et al., 2000; Anderson et al., 2005). Most policy measures may be familiar, unfortunately

18
Chapter 1
4
however there is a serious lack of detailed understanding of the impacts of many of these measures and their transferability to different contexts (May et al., 2003). Governmental policies in the urban freight transport area result from different objectives. Roughly we can divide these objectives based on the triple-bottom-line; environmental sustainable development, social sustainable development, and economic sustainable development. Examples are improving accessibility and encouraging economic develop-ment (May and Taylor, 2002; Van Binsbergen and Visser, 2001). The main problem with policy in this area is that some of these objectives tend to conflict. As Browne and Allen (1999) claim “introducing new policies to alleviate one environmental impact of urban freight movement can result in worsening the others”. Visser and Van Binsbergen (1999) argue that it is almost impossible for a policy planner to have adequate information about the total social costs of urban freight transport, about the lowest possible level of social costs as a balance between the demands for transport and society’s objectives, as well as the extent to which these policy measures really reduce social costs. Even if the policy-maker possesses all the information mentioned above, it is still the question whether this results in a ‘best’ solution for the society, if such a solution exists at all, as politicians have more interests than urban freight transport. Besides, different elements in the social costs, the people-component of the sustainability triple-P, conflict as well. For example, decreasing nuisance is likely to result in an increase in costs and a decrease in service levels. A complicating factor is the derived character of urban freight transport demand. To change freight transport and reduce its impacts, more factors have to be included than just the actual urban freight transport movements, e.g. geographical location of activities, land prices, cost of transport, customer preferences, etc. (Anderson et al., 2005). In most countries urban freight transport is considered a local issue, which implies that local authorities are responsible for the majority of the regulations in this area (OECD, 2003). To minimise the negative impacts of urban freight transport local authorities try to control urban goods transport operations by using different regulations (see e.g. Dablanc, 2007). Many local authorities do not have an extensive freight transport policy. Partly caused by a lack of sufficient knowledge on urban freight transport (Allen et al., 2000), the local authorities’ freight policies tend to be based on a reaction on problems and negative impacts, usually arising from complaints made by residents, rather than taking a proactive position. As a result, the point of departure in urban freight transport policies are usually the (perceived) problems caused by the transport, rather than an essential activity supporting urban life (Allen et al., 2000). Local authorities consider urban freight as something that has to be banned or at least strictly regulated, which means physical vehicle restrictions and time access windows (Dablanc, 2007). Policies that mainly focus on combating the negative impacts of urban goods movement often result in an increase in transport costs and in making the organisation of transport more complex. These policies are sometimes even counterproductive. Dablanc (2007) argues that local authorities’ urban freight transport policies are “scarce and out-of-date”. The call for harmonisation of different local policy measures, by especially carriers that are active in several cities, is

19
Introduction
5
therefore a frequently returning issue in urban freight transport (see e.g. Lemstra, 2004; Munuzuri et al., 2005; OECD, 2003). Dablanc (2007) provides an example of this lack of harmonisation; in a certain French urban area, there are about 30 different restrictions on trucks, which results in an impossibility for a driver to obey all regulations in that area. The regulations used depend mainly on the type of perceived inconvenience caused by urban freight transport. This is not a new situation; the example in Figure 1.1 shows the oldest known urban freight transport restriction, that allows urban freight transport only during evening hours. As early as the first century BC the first regulations on urban freight transport are recorded; the commercial deliveries and pick ups were banned from the ancient city of Rome during the day by an edict attributed to Julius Caesar which is called the ‘Lex Iulia Municipalis’, based on references in conserved letters of Cicero to a comprehensive law of Caesar that deals with municipal affairs. This law is also known as ‘Table of Heraclea’, after the place where the fragments of a bronze tablet which contained the laws were found in 1732 (Smith, 1875). Figure 1.1 shows the part from the ‘Lex Iulia Municipalis’ that settles the first known urban freight transport regulations and its translation. In ancient Rome this already resulted in residents’ complaints about the noise generated by the freight transport operations (Holguin-Veras et al., 2006). It is striking, that the different stakeholders and their interest of urban freight transport were already an issue in ancient times.
QUAE VIAE IN URBAN ROMAN SUNT ERUNT INTRA EA LOCA, UNI CONTINETIQUAE VIAE IN URBAN ROMAN SUNT ERUNT INTRA EA LOCA, UNI CONTINETIHABITABITUR, NE QUIS IN IEIS VIEIS POST K. INANUR. PIRMAS PLOSTRHABITABITUR, NE QUIS IN IEIS VIEIS POST K. INANUR. PIRMAS PLOSTRUM UM INTERDIU POST SOLEM ORTUM, NEVE ANTE HORAM X DIEI DUCITO AGITO, INTERDIU POST SOLEM ORTUM, NEVE ANTE HORAM X DIEI DUCITO AGITO, NISI QUOD AUDIUM SACRARUM DEORUM INMORTALIUM CAUSSA NISI QUOD AUDIUM SACRARUM DEORUM INMORTALIUM CAUSSA AEDIFICANDARUM, OPERISVE PUBLICE FACIUMDEI CAUSA, ADVEHEI AEDIFICANDARUM, OPERISVE PUBLICE FACIUMDEI CAUSA, ADVEHEI PORTARI OPORTEBIT, AUT QUOD EX URBE EX VE IEIS LOCIS EARUM PORTARI OPORTEBIT, AUT QUOD EX URBE EX VE IEIS LOCIS EARUM RERUM, QUAE PUBLICE DEMOLIENDAE LOCATAE ERUNT, PUBLICE EX RERUM, QUAE PUBLICE DEMOLIENDAE LOCATAE ERUNT, PUBLICE EX PORTAREI OPORTEBIT, ET QUARUM RERUM CAUSSA PLOSTRA H.L. PORTAREI OPORTEBIT, ET QUARUM RERUM CAUSSA PLOSTRA H.L. CERTEIS HOMINIBUS CERTEIS DE CAUSEIS AGERE DUCERE LICIBIT.CERTEIS HOMINIBUS CERTEIS DE CAUSEIS AGERE DUCERE LICIBIT.
“On the roads which are in the city of Rome or will be within the area where will be lived joined tightly, no one is allowed after next January 1st to drive or lead a carriage during the day after sunrise and before the tenth hour of the day, except if something will have to be supplied or transported for building temples of the immortal gods or for the implementation of a work for the authorities, or as from the city or from those areas something of those things of which the demolition will be put out to tender by the authorities, will have to be removed on behalves of the authorities, and except for those cases in which it will be according to this law permitted to certain persons for certain reasons to drive or lead a carriage”.
Figure 1.1 Lex Iulia Municipalis dated B.C. 45 - the first regulation on urban freight transport1
1 From: ‘Fontes iuris Romani antique’, editit Carolus Georgius Bruns (1879), p. 98, lines 56-61.
Official acknowledgement of source: C.I.L. 1,119. n.206. Ri. Tab 33.34

20
Chapter 1
6
In modern times local authorities try to solve problems caused by urban freight transport by managing the delivery operations by various policy measures, depending on the problem and the policy objective. Browne et al. (2007a) classify these various policy measures and access limitations (based on OECD, 2003; Ogden, 1992) as follows:
o Restrictions for environmental-unfriendly vehicles, such as only allowing vehicles meeting specific standards, e.g. on EURO engine-type or age.
o Vehicle limiting measures, which can apply to different vehicle characteristics such as axle-pressure, height, width, length, and weight, and access regulations for specified locations only, e.g. a narrow street or old bridge.
o Loading capacity restrictions. o Establishment of special loading zones in areas with considerable delivery traffic. o Zones in which deliveries can only be carried out at certain times, e.g. pedestrian
zones, or which have to be completely or partly free of trucks, e.g. protection zones.
o Allowance or obligation of night deliveries. o Access slots, e.g. time-windows. o Limitation of loading / unloading time at the delivery point in the city. o Parking fee.
Munuzuri et al. (2005) show that local authorities have many other tools at their disposal than only these policy measures. They provide a classification of urban freight transport actions for local authorities, in which they distinguish four groups to which these actions can relate: 1. Actions related to the public infrastructure; e.g. the creation of transfer points, such as
city terminals, or the promotion of a shift to more environmental friendly modes; like the use of (shuttle) trains or an underground system.
2. Actions related to land use management; e.g. creation of parking facilities, such as the provision of load zones.
3. Actions related to access conditions; this category includes policy restrictions regarding to space, such as road pricing and vehicle restrictions, and regarding to time, such as time-windows and a ban on night deliveries.
4. Actions related to traffic management; e.g. reconsidering the scope of regulations, such as harmonisation of regulations with other local authorities.
In the urban freight transport context in the Netherlands two policy measures in particular are often mentioned: vehicle restrictions and time-windows (see e.g. BCI, 2006; Lemstra, 2004; PSD, 2002b). Carriers consider especially these two policy measures as major barriers to efficiency (Crum and Vossen, 2000). Identical time-windows, in different cities, make it difficult to combine trips. This results in more trips at the same time and therefore in an inefficient use of vehicles. Most time-windows are imposed during the morning, which results in an increase of trucks during this already congested period. Some time-windows do not match the opening hours of stores, so that staff has to be available in extra hours to receive the goods. Nevertheless more and more cities force deliveries to take place
21
Introduction
7
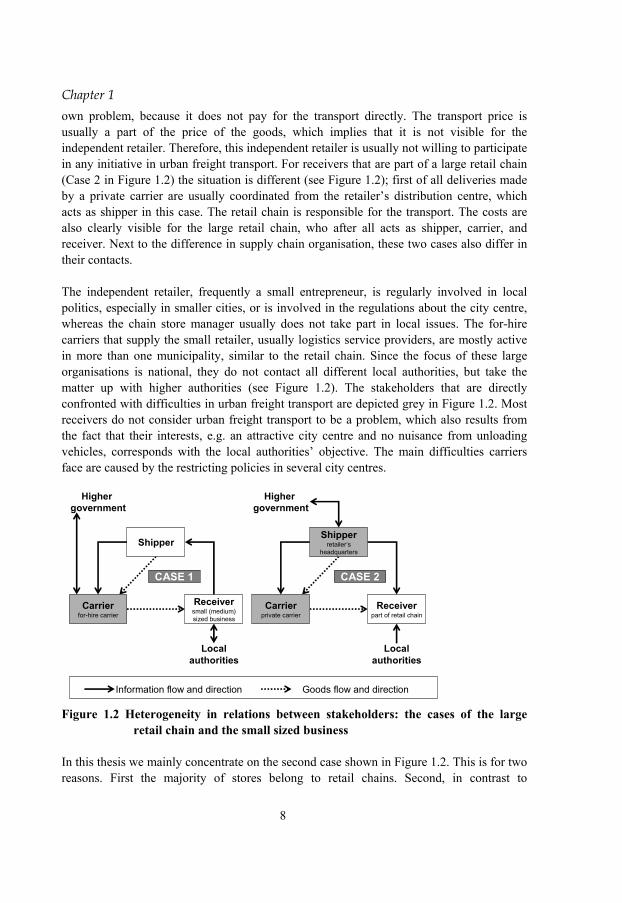
during a certain time-window period (BCI, 2006; PSD, 2002b). An example of the popularity of time-windows in the Netherlands is that 53% of the municipalities (with more than 15,000 inhabitants) in the Netherlands used time-windows in 2002. This percentage is even higher for the larger cities; 71% of the 100 largest and all municipalities in the top 20. Next to these time-windows almost 50% of these municipalities use at least one vehicle restriction (PSD, 2002b). Recently a third policy measure is mentioned more often; the use of an environmental zone (DHV, 2006), to decrease the local emissions and noise nuisance in cities. In July 2007 the first environmental zone in the Netherlands was established in Utrecht. Other Dutch cities will follow in the coming years (see the covenant to stimulate clean trucks in cities: “Convenant stimulering schone vrachtauto’s en milieuzonering” – March 2006). In this agreement ten Dutch municipalities, the Ministry of Transport and the Ministry of Housing, Spatial Planning and the Environment, and carrier organisations, agree to use cleaner and quieter vehicles from 2010 on. In return the cities promise to focus on improving circulation of freight transport. In this thesis we examine the impacts of different policy measures in more detail. 1.4 Retail chain distribution practices Although Dutch urban areas contain many different stores, large retail chains dominate the street scene. Especially in the bigger cities’ shopping centres and the core shopping centres in middle sized cities, the percentage of stores that belong to a retail chain runs up to 75%, measured in sales floor area and number of outlets (EIM, 2004). Urban freight issues are most visible in these cities and shopping centres. Retail chains differ seriously from independent retailers in among other things transport organisation and relationships with other stakeholders. We distinguish three different groups of stakeholders that are involved in urban freight transport (Ogden, 1992; Taniguchi et al., 2003; Van Binsbergen and Visser, 2001; Woudsma, 2001):
o Governments, e.g. local authorities, national governments, traffic authorities, etc. o Professionals, e.g. shippers, carriers, receivers, etc. o Impactees, e.g. residents, shopping public, city visitors, etc.
The group of professionals consists of very heterogenic stakeholders. Although both the retail chain and the independent retailer are receivers in the urban area, they differ considerably. And with that their stakes in urban freight transport issues differ as well. A large retail chain is supplied differently from a small retailer (see Figure 1.2). The transport is usually carried out by different types of carriers; private carriers and for-hire carriers respectively. These carriers act differently with respect to urban freight transport (see e.g. Holguin-Veras et al., 2006). An independent retailer, listed as Case 1 in Figure 1.2, orders at a shipper, who is responsible for the transport of the order either by carrying out the transport itself (e.g. some wholesalers) or by using a for-hire carrier. The retailer has no contact with the carrier except for the delivery. The retailer minimises the perceived inconvenience caused by trucks. Such a retailer does not consider the transport as its own responsibility, let alone its
22
Chapter 1
8
own problem, because it does not pay for the transport directly. The transport price is usually a part of the price of the goods, which implies that it is not visible for the independent retailer. Therefore, this independent retailer is usually not willing to participate in any initiative in urban freight transport. For receivers that are part of a large retail chain (Case 2 in Figure 1.2) the situation is different (see Figure 1.2); first of all deliveries made by a private carrier are usually coordinated from the retailer’s distribution centre, which acts as shipper in this case. The retail chain is responsible for the transport. The costs are also clearly visible for the large retail chain, who after all acts as shipper, carrier, and receiver. Next to the difference in supply chain organisation, these two cases also differ in their contacts. The independent retailer, frequently a small entrepreneur, is regularly involved in local politics, especially in smaller cities, or is involved in the regulations about the city centre, whereas the chain store manager usually does not take part in local issues. The for-hire carriers that supply the small retailer, usually logistics service providers, are mostly active in more than one municipality, similar to the retail chain. Since the focus of these large organisations is national, they do not contact all different local authorities, but take the matter up with higher authorities (see Figure 1.2). The stakeholders that are directly confronted with difficulties in urban freight transport are depicted grey in Figure 1.2. Most receivers do not consider urban freight transport to be a problem, which also results from the fact that their interests, e.g. an attractive city centre and no nuisance from unloading vehicles, corresponds with the local authorities’ objective. The main difficulties carriers face are caused by the restricting policies in several city centres.
Localauthorities
Higher government
Information flow and direction Goods flow and direction
CASE 1
Carrierfor-hire carrier
Receiversmall (medium)sized business
Shipper
Localauthorities
Higher government
CASE 2
Carrierprivate carrier
Receiverpart of retail chain
Shipperretailer’s
headquarters
Figure 1.2 Heterogeneity in relations between stakeholders: the cases of the large
retail chain and the small sized business In this thesis we mainly concentrate on the second case shown in Figure 1.2. This is for two reasons. First the majority of stores belong to retail chains. Second, in contrast to

23
Introduction
9
independent retailers, retail chains have the power to make changes in their competitive strategy and their logistical concept, i.e. their supply chain strategy, network structure, and logistical planning (see Figure 4.1 and Figure 4.2). Figure 1.3 shows a typical retail supply chain. Full truckload (FTL) deliveries are shipped from the manufacturing plants to the manufacturing warehouses. Next in the primary distribution, retail distribution centres are often supplied less efficient in less than full truckloads (LTL) based on specific replenishment orders from the retail chain. In the secondary distribution the retailer is responsible for supplying its stores, located in urban areas, in LTL quantities (Van der Vlist, 2007).
Retailstores
Retaildistribution centre
Manufacturer’swarehouse
Manufacturingplants
FTL LTL LTL
Primary distribution Secondary distribution
Replenishmentorders
Storeorders
Figure 1.3 The retail supply chain (Van der Vlist, 2007) The retail supply chain has evolved into its current status (see Figure 1.3) over the last decades. From Fernie et al. (2000) and Potter et al. (2007) we discern four separate stages in the evolution of the retail supply chain: • Supplier control stage (pre 1980s). In this stage suppliers were responsible for
deliveries to the stores directly. The stores were usually able to hold stock in backrooms.
• Centralisation stage (1980s). In this stage retailers introduced retail distribution centres to supply their stores from themselves. This resulted in reduced distribution costs and increased range of products available to customers at the stores. Stocks were partly shifted back in the chain from the stores to the retail distribution centres.
• Just-in-time stage (1990s). In this stage retailers requested more just-in-time deliveries from their suppliers, which enabled them to move stocks even more backwards in the chain, resulting in consolidation centres from where retail distribution centres are supplied.
• Relationship stage (2000s). In this stage the collaboration between supply chain partners increased, i.e. supply chain integration. The focus gets more on the overall
24
Chapter 1
10
supply chain efficiency, see for an example of collaboration Van der Vlist (2007), i.e. supply chain synchronisation.
1.5 Research questions and scientific contribution After a period of relative much interest in urban freight transport in the seventies and early eighties (see e.g. Button and Pearman, 1981; Hicks, 1977; Ogden, 1984), this topic was not considered to be particularly ‘hot’ in the late eighties and early nineties (Ogden, 1992). Ogden’s book ‘Urban Goods Movement: a guide to policy and planning’ was published in 1992 and can be considered to bridge between the research in the seventies and the more recent studies from the nineties until now. Ogden’s book compiles the various studies and material that have been published between 1974 and 1992. This book was issued just before the interest in this topic renewed in the late nineties. After the period in which there was little attention for urban freight transport, both in research and in policy considerations, urban freight transport was recognised again as an important issue (Allen et al., 2003). Modern urban freight transport research is a relative young field, and is growing rapidly over the last few years, see for example ECMT (1999), the OECD-report ‘Delivering the Goods – 21st century challenges to urban goods distribution’ (OECD, 2003), the establishment of the urban goods movement special interest group at the World Conference on Transport Research Society in 1999, and finally the establishment of the Institute of City Logistics in 1999. Currently, retail chains are the most important players for distributing goods to their stores in urban areas, whereas in the first period of relatively high research interest in urban freight transport during the seventies the suppliers directly delivered to the stores. The different stages in the retail supply chain (see section 1.4 and Fernie et al., 2000; Potter et al., 2007) influence urban freight transport and research in this area as well. In the period after this first wave of urban freight transport research in the seventies the organisation of freight operations changed considerably, and therewith the attention for negative sustainability impacts of urban freight transport. Allen et al. (2000) mention several of these changes:
(i) After an initial increase in efficiency in the centralisation stage (see section 1.4) another trend followed in the just-in-time stage; more frequent and smaller deliveries by smaller vehicles to retail stores as well as to retail distribution centres.
(ii) The supply chain structures changed considerably; larger companies, e.g. retail chains, have taken over more and more control over the supply chain and the physical distribution of goods to the stores (see e.g. Van der Vlist, 2007).
(iii) Sustainability has become an important issue. It was not an issue in the studies during the seventies.
This means there is a need for new research in this area. However, for several reasons there is a severe shortage of research into urban freight transport (Woudsma, 2001):
1. Passenger cars are responsible for the bulk of the traffic, between 75% of the street traffic of a typical city (Dablanc, 2007) or even more, between 82% and 93% of

25
Introduction
11
the traffic depending on the time of the day (Woudsma, 2001). This results in more research attention for urban passenger transport than for urban freight transport, especially combined with congestion.
2. The elements and the amount of different actors involved in urban freight transport make it far more complex than passenger transport, which makes it a difficult area to research.
3. There is a lack of detailed and reliable data on urban freight transport movements (see e.g. Ambrosini and Routhier, 2004; Browne and Allen, 2006).
Next, the attention for interurban freight transport, e.g. supply chain analysis, is also higher than that for urban freight transport (Munuzuri et al., 2005). Although the growth of urban freight transport research is encouraging, there are still many lacunas in the urban freight transport literature. We see a dichotomy in the urban freight transport literature: many contributions discuss a limited number (sometimes as little as only one) of initiatives or policy measures to make urban freight transport more sustainable, including the results and impacts. Only few contributions go beyond this limited focus and examine several initiatives or policy measures and their (combined) impacts. In their extensive Ph.D. thesis Van Binsbergen and Visser (2001) significantly contribute to the literature by discussing almost all aspects of urban freight transport. Although they mention different policy directions, network options and transport systems, they do not focus on the impacts and the results of policy regimes or sustainability initiatives. Ambrosini and Routhier (2004) find in their non-extensive comparison of urban goods movement studies between industrialised countries that the urban freight transport field is fragmented and the research directions and initiatives differ considerably. They do not discuss factors that are responsible for the results and impacts of these different initiatives. Other contributions also only provide an overview of one particular part of the urban freight transport field; Taniguchi et al. (2003) provide an overview of different modelling approaches to find the impacts of city logistics initiatives. Munuzuri et al. (2005) provide an overview of different actions local authorities can take to deal with urban freight transport issues. OECD (2003) provides an overview of different policy measures and approaches in urban goods transport. These overviews provide useful insights in the possible actions to improve sustainability or to evaluate the impacts, but lack the understanding of the success factors or barriers for successful implementation in practice. There are only a limited number of successfully implemented initiatives. There are no contributions that combine the lessons from several initiatives or policy measures. Since there is no clear structure nor are there clear dimensions to evaluate urban freight transport sustainability initiatives on, it is hard to provide substantial insights into the success factors and the barriers of initiatives to improve the sustainability of urban freight transport. We fill this lacuna in the modern urban freight transport field. In the first part of this thesis we develop a framework, which can be used to evaluate urban freight transport sustainability initiatives. This framework contributes to the field of urban freight transport, since it provides the basic dimensions of urban freight transport with a

26
Chapter 1
12
classification and it explains the relations between these dimensions. This is, to our knowledge, not available in urban freight transport literature yet. In order to develop theory on key success factors or barriers for the variety of urban freight transport sustainability initiatives these dimensions are a necessity. Next, we structure the urban freight transport field in two classes, four categories and twelve initiative types. Per type we determine the barriers and the factors that are indispensably for successful implementation, as well as success factors. It also identifies several areas that are not yet fully covered in urban freight transport literature. OECD (2003) states the main objective for urban freight transport policy should be to develop sustainable urban goods transport. This implies the development of an urban goods transport system on a social, economical, and environmental sound basis. And although the governmental interest as well as the research effort in the field of urban freight transport and sustainability increased over the years, the actual results of experiments in practice were not always very promising. Therefore, we build in the first part of this thesis on the different experiments that aim at making freight transport in urban areas more sustainable. We provide a framework in order to structure the field, explain the relations between the dimensions, and identify the configurations that are successful and the barriers that lead to failure. The research question for the first part of this thesis is:
What are the basic dimensions in urban freight transport sustainability initiatives, how are they related, and which configurations are successful?
Although the amount of research has increased, only a limited part examines the likely impact of policy measures on urban freight transport operations (Allen et al., 2003). In the second part of this thesis we add to the limited knowledge on the impacts of local authorities’ sustainability policies on not only the retailer’s costs, but also on the environment. This study is the first to examine the factors determining retailer’s sensitivity to these policies, as well as the possibilities retailers have to cope with local authorities’ sustainability policies. The relationship between policy measures, private companies’ reaction on these policy measures, and the effect on costs and the environment has hardly been researched (Allen et al., 2003). This relationship is the central point of this thesis’ second part. In this relationship Allen et al. (2003) basically distinguish three different elements: urban freight transport policy measures, which were introduced in section 1.3, the behaviour of private companies with respect to urban freight transport, which was discussed in section 1.4, and the impacts on sustainability, which was already introduced in section 1.1. The next three research questions are answered in the second part of this thesis and fill this gap in current urban freight transport literature. Allen et al. (2003) and Groothedde et al. (2003b) examine the impacts of time-window regulations and vehicle restrictions. Groothedde et al. (2003b) find that the current time-window and vehicle restrictions in the Netherlands increase yearly costs for the Dutch retail
27
Introduction
13
by € 425 million. Allen et al. (2003) use the expected response of seven companies in three urban areas to evaluate the impacts of time-windows and vehicle restrictions. However, no prior research examines the impacts of differences in time-window pressure and compares national different time-window schemes on both costs for companies and environmental burden. The answer on our second research question fills this gap:
What is the impact of local sustainability policies on a retailer’s distribution organisation and distribution costs and on the environment?
The answer to this research question shows considerable differences in the impacts of local sustainability policies for different companies. There is no prior research that examines, let alone explains, the factors that underlie these variations in impacts on local authorities’ sustainability policy measures. Therefore, our third research question examines these factors:
Which factors in the organisation of a retailer’s distribution process determine its performance sensitivity to local sustainability policies?
Our last research question examines an option for retailers to turn around the negative impacts of time-window restrictions, such as the decrease in vehicle utilisation during the day and an increase in the vehicle fleet necessary to supply all stores. By including backhauling activities this transforms into opportunities for them. Several studies did already examine backhauling opportunities, but none of these studies took local sustainability policies into account. Although factory gate pricing concepts are examined before, this was not yet done in combination with time-window restrictions. And exactly these regulations make the concept more appealing for retailers. This study is also different in the sense that most of the previous studies examined factory gate pricing initiatives for grocery retailers. This results in the fourth research question:
How could retailers deal with local sustainability policies and increase the sustainability of their transport operations?
In chapters 2 trough 6 we subdivide these four research questions into subsequent research questions. In these chapters we also position the specific questions in the relevant literature. Next, we also discuss the methodology and data collection to answer the specific research questions in the respective chapters. 1.6 Managerial relevance Next to the scientific contribution, this thesis has practical contributions as well. We distinguish two sectors to which this thesis is relevant; the public sector and the private sector. First, we examine success and fail factors of urban freight transport sustainability

28
Chapter 1
14
initiatives for public initiatives (policy initiatives), for private initiatives (company driven initiatives), and more radical initiatives that aim at improving sustainability by changing the urban freight transport context. This is especially relevant for governments, as many initiatives have failed or have not succeeded as planned. The framework enables an initiator to carefully deliberate which stakeholders should get involved, for what reasons, and what the pitfalls and success factors may be. It also enables the initiator to compare its initiative to others, in order to learn from it. Currently, many experiments are initiated without learning from earlier experiences. There are also useful sustainability initiative examples for the increasingly ‘green-consciousness’ in the private sector in the first part of this thesis. Since this is a relatively new trend, there are not many sources available in this area. Next, this research is interesting for managers, who are confronted with the ever increasing difficulties of providing efficient goods distribution in urban areas. This thesis not only provides managers with in-depth insights in the effects of local sustainability policies, we examine ways to cope with these policies as well as ways to organise distribution in a more sustainable way. The impact of increasing time-window pressure varies for different retailers. The study gives practical indications on what determines a retailer’s sensitivity to time-windows as well as what the impact of retailer’s decisions is in its logistical concept, in relation with local policies and retailer characteristics. The sixth chapter shows one way for retailers to organise their transport more sustainable and at the same time cope with problems caused by time-windows. The results may also help municipality policy decision-makers. For example, relaxation of time-windows immediately results in a relief of the environmental burden and a cost decrease for the retailers. In order to achieve social sustainability effects without unnecessarily increasing the environmental burden and the retailers’ costs, municipalities should consider harmonising their time-windows. Thirdly, this study’s results might be useful for consultation to make urban freight transport more efficient between private and public sectors, since we take both sides in account. The results provide clear insights in the impacts of local sustainability policies, which could serve as a handle for policy-making bodies in designing urban freight policies in such a way that it considers all three sustainability elements, i.e. the triple-P; people, profit, and planet. This study shows different retailers might respond differently to urban transport policy measures and affect the environment differently, although in the measures they are treated similarly. 1.7 Outline of the thesis In this section we provide an outline of this thesis. This thesis contains two parts that together with this introduction chapter and the last concluding chapter complete the Ph.D. thesis (see Figure 1.4) entitled “Sustainability of Urban Freight Transport – Retail Distribution and Local Regulations in Cities”.

29
Introduction
15
PART I URBAN FREIGHT TRANSPORT SUSTAINABILITY INITIATIVES Chapter 2 A framework and classification for urban freight transport sustainability issues This chapter develops a framework for evaluating urban freight transport sustainability initiatives. The purpose of the framework is to identify basic dimensions and classifications for urban freight transport, to structure the urban freight transport field, and to identify critical success factors and barriers for successful urban freight transport sustainability initiatives, which we present in chapter 3. We propose a structure for the urban freight transport field that contains twelve different initiative types. Chapter 3 Improving sustainability: a review of initiatives This chapter examines 106 urban freight transport sustainability initiatives we traced in literature that aim at improving sustainability of urban freight transport in urban areas. We use the framework and structure developed in chapter 2 to review and analyse the different initiatives. Parts of this chapter have been published in Quak et al. (2008a).
chapter 3Improving sustainability:
a review of initiatives
chapter 2A framework and
classification for urbanfreight transport
sustainability initiatives
chapter 1Introduction
PART IUrban freight transport sustainability initiatives
chapter 5Retailers’ sensitivity to
local sustainabilitypolicies
chapter 4Impacts of local
authorities’ time-windowpolicies
PART IIDealing with local
sustainability policies: the impacts, sensitivity
and opportunities
chapter 6Factory gate pricingopportunities due to
time-window restrictions
chapter 7Concluding
remarks
Figure 1.4 Outline of the thesis PART II DEALING WITH LOCAL SUSTAINABILITY POLICIES: THE IMPACTS, SENSITIVITY, AND OPPORTUNITIES Chapter 4 Impacts of local authorities’ time-window policies This chapter examines the impact of time-windows on retailers’ operational, financial, and environmental performance. In several scenarios we evaluate different time-window schemes, such as the current Dutch time-window regulations, harmonised time-windows, nightly time-windows, and time-windows based on a proposal by the Dutch Committee for Urban Distribution (CSD, 2006). In another scenario we vary the time-window pressure, by

30
Chapter 1
16
changing the number of time-window affected cities and the time-window length in 18 sub scenarios. To find the different performances we employ a multiple case study with 14 different retail chains. This chapter is based on a series of papers by Quak and De Koster (2006a; 2006b; 2006c; 2007a). Chapter 5 Retailers’ sensitivity to local sustainability policies This chapter examines the factors that determine the cost sensitivity of retailers with respect to time-window and vehicle restriction policies. We conduct a cross-case analysis on the multiple cases that were presented in chapter 4 in order to examine how different retailers are affected by similar time-window pressure and which dimensions determine retailer’s sensitivity to time-windows. In the second part of this chapter we explore different retailer’s distribution decisions in more detail in an experiment with two retail chains. We test the three propositions resulting from the experiment and the other results with a third case. Parts of this chapter are published in Quak (2008) and Quak and De Koster (2007a; 2007b). Chapter 6 Factory gate pricing opportunities due to time-window restrictions This chapter examines the possibilities for retailers to combine the primary distribution, the deliveries from suppliers to the retailer’s distribution centre, and the secondary distribution, the deliveries from the retailer’s distribution centre to the retailer’s stores. We look in particular at the possibilities to increase vehicle utilisation, which is generally low due to time-window restrictions, and the possibilities for developing transport in a more sustainable way. Chapter 7 Concluding remarks In the final chapter we summarise the findings from the chapters to answer the research questions. We discuss the opportunities for future research in relation with the limitations of the research presented in this thesis. We specifically highlight one direction for further research; i.e. customising policies for sustainable distribution based on Quak et al. (2008b). At the end of the thesis three appendices are included. In appendix A we provide extra information on the cases, i.e. the different retail chains used in this thesis. Appendix B shows the scenario designs for the experiment in chapter 5. Finally, appendix C provides a list of all abbreviations used in this thesis.
31
PART I URBAN FREIGHT TRANSPORT SUSTAINABILITY INITIATIVES

32

33
19
2 A framework and classification for urban freight transport sustainability initiatives
This chapter develops a framework for evaluating urban freight transport sustainability initiatives. The purpose of the framework is to identify basic dimensions and classifications for urban freight transport, to structure the urban freight transport field, and to identify critical success factors and barriers for successful urban freight transport sustainability initiatives, which we present in chapter 3. Section 2.2 provides the methodology used to develop the framework and the classification of initiatives. Based on a selective literature review (in section 2.3) we develop the basic framework in section 2.4. We distinguish three phases that affect the results of an urban freight transport sustainability initiative: the design, the execution, and the evaluation. In the next section we provide classifications for all eight framework’s basic dimensions, which together form the complete framework. In the final sections of this chapter we divide the initiatives in twelve different initiative types to structure the urban freight transport field. We briefly discuss all twelve initiative types, before the concluding and summarising section. 2.1 Introduction With the increasing visibility and recognition of the unsustainable impacts of urban freight transport the governmental interests as well as the research activities in this area have increased. This has resulted in a substantial number of initiatives from both (local) governments and researchers that aim at improving sustainability of urban freight operations in the late nineties (see e.g. Allen et al., 2000; Ambrosini and Routhier, 2004; Taniguchi et al., 2003). However, after the initial enthusiasm for, what is referred to in literature, city logistics initiatives, e.g. cooperative freight transport systems, public logistics terminals, load factor controls, underground transport systems, intelligent transport systems (Taniguchi et al., 2003), the actual results from some experiments in practice were disappointing (see e.g. Koehler, 2004; Van der Poel, 2000). And at the same time, the unsustainable impacts only became worse over the years, e.g. congestion and pollutant emissions, due to an increase in both passenger and freight transportation. Although the main interest of policy-making bodies and researchers is to develop more sustainable urban freight transport, the developments in the urban freight transport field are diverse. In spite of the common challenges, to combat unsustainable impacts of urban freight transport, such as its contribution to problems of accessibility, congestion, environment, and safety (OECD, 2003), there are big differences in approaches taken in different countries (Ambrosini and Routhier, 2004) and even between different cities in the

34
Chapter 2
20
same country. Summarising, the urban freight transportation field and city logistics field can be characterised by:
o An increasing political and research interest due to increasing problems. o A considerable diversity in the many initiatives and research directions that aim at
improving urban freight transport sustainability. o A striking limited number of successfully implemented initiatives.
Research in urban freight transport is a relative young field, which is growing rapidly over the last few years. The number of contributions to organise or structure the growing but fragmented field is limited, although the issues in the bulleted list ask for a formal structure to base an analysis on. At this moment it is hard to provide substantial insights into the success factors and the barriers of urban freight transport sustainability initiatives, rather than for one initiative at the time, as there are no clear basic dimensions to evaluate these initiatives. Without these dimensions, it is not possible to develop a proper theory on key success factors or barriers for the variety of urban freight transport sustainability initiatives. This would result in the field to remain as scattered as it is today, with various not successfully implemented initiatives. To overcome these problems we propose to design a framework. A framework is defined as “a supporting structure around which something can be build” (Cambridge Advanced Learner’s Dictionary, 2002). The framework we propose provides such a basic understanding of urban freight transport sustainability initiatives, since this enables us to:
o Identify the basic dimensions of urban freight transportation. o Provide a classification for all basic dimensions. o Explain the relations between the dimensions. o Classify the different initiatives according to the framework. o Identify the configurations that are successful and the barriers that lead to failure.
Our main aim in developing the framework, and reviewing urban freight transport sustainability initiatives with it, is to find insights in those factors that explain the success or failure of an initiative. Furthermore, next to structuring the field, and provide insight in research gaps, the findings based on the framework may also be useful for authorities. Many local authorities do not really know how to organise urban freight transport, even though urban freight transport operations are quite similar in different cities, no matter the internal structure of the cities (Dablanc, 2007). Since the movement of goods in different cities is comparable, the sustainability initiatives might be transferable as well. With Urban Freight Transport Sustainability initiatives (UFTS initiatives) we mean actions, including both projects and studies that aim at improving urban freight transport sustainability by making changes in the urban freight transport operations or the urban freight transport context. In most of the cases this implies policy measures, since improving sustainability is especially a governmental objective (Taniguchi et al., 2004). Sustainability, or sustainable development, is a rather wide term that can comprehend many different sub-objectives. We define sustainability later, together with a classification of different sustainability types and levels (see section 2.5.2).

35
A framework and classification for urban freight transport sustainability initiatives
21
To develop the framework, we first identify the basic dimensions. Next we provide a classification for all dimensions and then explain the relationship between the dimensions. We use the framework to develop a structure for urban freight transport sustainability initiatives later in this chapter. Next, we use the framework in chapter 3 to provide insights in the field and to develop theory in the urban freight transport field on barriers and success factors of the initiatives. 2.2 Methodology: building the framework and classify UFTS initiatives From the aims discussed in the introduction it already became clear that, in this and the next chapter, we try to build theory based on a structured review of urban freight transport sustainability initiatives. This attempt is closely related to what Strauss and Corbin (1998) mean with Grounded Theory: “theory that was derived from data, systematically gathered and analysed through the research process”. The data collection, analysis, and theory are not isolated in this method. Basically the researcher lets the theory originate from the data. Grounded Theory is the most suitable methodology for (i) developing the framework, (ii) structuring the field by classifying UFTS initiatives, and (iii) developing theory on UFTS initiatives’ barriers and success factors. This way of working implies that the framework we develop does not aim at being complete in that sense that it includes all possible dimensions, classes, and elements (see Figure 2.1). The aim is to develop the framework in such a way that it is useful for the purposes mentioned in section 2.1. This also applies to the proposed structure of the initiatives, which is based on actual data, i.e. reported UFTS initiatives, rather than it is developed to situate all possible kinds of UFTS initiatives. Grounded Theory found its concepts in data (Strauss and Corbin, 1998). In the following section we discuss the data sources that we use for building the framework. Next, we present the data that we use to classify the UFTS initiatives in order to structure the urban freight transport field.
Initiatives
Dimensions
Classes
Elements
Actions aiming at improving urban freight transport sustainability by making changes in the urban freight transport operations or the urban freight transport context.
Basic building blocks for the framework formed by fundamental questions on urban freight transport initiatives.
Descriptions for the classes. Most classes contain several elements ofwhich one is applicable to the class in one initiative. We do not aimat being complete in presenting all possible elements.
A classification for the dimensions leads to the most important dimension's classes. Classes are building blocks that divide thedimension so that they describe the implication in more detail.
Term Description
Figure 2.1 Structure of used terminologies to develop the framework
36
Chapter 2
22
2.2.1 Data sources for building the framework We use four different data sources for the development of the framework: • The available literature in the urban freight transport and city logistics field. We
examined the literature with the main emphasis to find the most important dimensions for the framework, as well as to initially find commonly used classifications (and their main elements). Different kinds of contributions add to the development of a field, including contributions focusing on reviewing parts of the field, on urban goods movement evaluation methodologies, and on visions or directions for future research and development in the urban goods movement area. We limit ourselves in this selective literature review by selecting papers that only focus on suchlike contributions in combination with urban goods movement or sustainable freight transport. Based on this selective literature review (see section 2.3), we determine the basic dimensions and most important classes in the urban freight transport field. We start this selective literature review with the book Ogden (1992) wrote: “Urban goods movement, a guide to policy and planning”, as this forms a link between the ‘old’ research and ‘today’s’ research on urban freight transport. Currently, many researchers refer to this standard work since this topic regained its popularity in the late nineties. Based on the selective literature review (see section 2.3) we determine the main dimensions for our framework.
• The acquired knowledge and experience during the Ph.D. trajectory. The development of the framework and the review of the initiatives was a continuing process during the complete period of the Ph.D. trajectory. I kept the framework in mind during conferences and the reading of specialised journals and popular press. This also applies to non-academic Dutch initiatives that were carried out or initiated during the Ph.D. trajectory in the field of urban freight transport.
• The UFTS initiatives themselves. The development of the framework was not a static process. After the development of the initial framework, we reviewed the first initiatives. Based on insights from these initiatives on the practicability of the framework, we refined it. This process, the mutual influencing of the framework and the initiatives, continued simultaneously until the final version reported in this thesis. The advantage of this interactive development is that the final framework suits its purpose, as the UFTS initiatives are the ‘input data’ for the framework. Another advantage is that we were able to complete the framework’s dimensions and the classes, in such a way that these are appropriate and sound for reviewing the initiatives. We explain the initiatives and the selection criteria in more depth in the next section.
• The discussions with experts in the field. We discussed the framework with several experts in the urban freight transportation field.
The framework should be parsimonious. We prefer simplicity, because a surplus of details might go at the expense of the clarity of the main results from the dimensions and classes. However, because of the immense variety in initiatives, this is a difficult task. Besides, the number of initiatives that fulfil our selection criteria is limited. We decided to develop a rich framework, which we use in a parsimonious way. In the classification of the initiatives
37
A framework and classification for urban freight transport sustainability initiatives
23
as well as in the review of the initiatives we only use those framework dimensions and classes that are relevant. 2.2.2 Data sources for structuring the field The urban freight transport sustainability initiatives are the data on which we base the classification of initiatives, which results in a structure for the field. We only select UFTS initiatives that meet a number of selection criteria: • The initiative aims at improving sustainability in an urban area by making a change or
several changes in the urban freight transport operations or context. • The initiative is reported in a journal or book that is reviewed or is pointed out by an
expert in the field. • The report (paper, article, etc.) describing the initiative should be profound and written
in English. This implies it should (at least) contain a clear objective and it should inform on the results, as well as on the method that leads to these results.
Since we are looking for initiatives, and not for papers, it is possible that a publication includes several initiatives that answer the selection criteria. In that case we include these initiatives as separate initiatives. We used three main source directions to look for UFTS initiatives:
o A keyword search in electronic databases. o Consultation of experts in the field by e-mail. o Proceedings of scientific conferences focusing on urban freight transport.
To identify relevant articles that could describe an UFTS initiative, we first searched computerised databases (Proquest, Emerald, Business Source Premier, Science Direct, and the Web of Science) for published articles in academic journals between 1995 and 2006. This search is based on a list of keywords and combinations of these keywords: “city logistics”, “urban goods movement”, “urban freight transport”, “urban distribution”, “urban logistics”, “city distribution”, “sustainable freight transport”, and “sustainable transport development”. After excluding all non-relevant hits, e.g. aspects of sustainable freight transport that really exceed the urban level, such as short sea shipping, or publications that focus on social aspects of different demographic situations, this search resulted in a total of 25 academic journal papers, which is quite limited. Eleven of these publications are published in the last three years (2004-2006), which indicates that the interest of the research community increased over the last years. From these 25 papers only 21 reported at least one initiative. We sent an e-mail to 35 academic experts in the field of urban freight transport from 19 different countries during the first months of 2006. The main questions were: “what are the most important initiatives undertaken in your country with regard to urban freight transportation” and “where is this initiative reported”. Based on these main questions, we approached experts and we made sure that we received at least one reply per country. We selected experts who attended city logistics conferences (see next section) or who were
38
Chapter 2
24
authors of the articles found in the keyword search. We received 20 useful replies, including reports, papers, and Internet sources, which resulted in 12 initiatives. Several experts pointed in the direction of BESTUFS (Best Urban Freight Solutions, see www.bestufs.net), which is “an open European network between urban freight transport experts, user groups / associations, the relevant European Commission Directorates, and representatives of national, regional and local transport administrations and transport operators, to encourage the identification and dissemination of City Logistic Solutions that are considered best practices both within Europe and other parts of the world”. Next to publishing yearly handbooks based on a theme, there is also a project database on the BESTUFS-website. We selected 12 initiatives from the BESTUFS-handbooks. Proceedings from conferences focusing on urban freight transportation also answer the selection criteria for UFTS initiatives. We searched for initiatives in proceedings from the four City Logistics conferences (Cairns 1999, Okinawa 2001, Madeira 2003, and Langkawi 2005, resulting in 61 initiatives), the special interest group on urban goods movement of the World Conference on Transport Research (WCTR) (Istanbul 2004, resulting in 7 initia-tives), and the National Urban Freight Conference (NUFC) from Metrans transportation centre (Long Beach 2006, resulting in 4 initiatives). In total this adds up to 106 unique initiatives. For some initiatives we found several sources. We used all sources to find relevant information on the initiatives. Obviously, the initiative was included only once in our selection, no matter how many different sources. 2.3 Selective literature review The first step in understanding urban freight transport is to make clear why the movement of goods takes place. Allen et al. (2000) distinguish three different reasons for urban freight transport activities: (i) core goods collections / deliveries to and from the premises, (ii) non-core goods trips to and from the premises, such as waste collection, postal and money collection and deliveries, and (iii) service related trips. Ogden (1992) also emphasises urban freight transport as the interaction between demand and supply. The supply side is characterised by the road network, non-road network, vehicle fleet, and vehicle movement, whereas the demand features commodity and land use. Many of the urban freight transport problems emerge on the supply side; however the key to understanding urban freight transport is on the demand side. Allen et al. (2000) stress the importance of the supply chain perspective in studying urban freight transport. Without these insights in the actual transport, all deliveries might look the same whereas they differ in many aspects, e.g. single-drop or multiple-drop roundtrips, centralised goods supply (from one distribution centre), decentralised goods supply (from several supplies), or a hybrid system (combination of the other two), and full truckload deliveries (FTL) or less than truckload deliveries (LTL). Woudsma (2001) also emphasises this, since the physical movement of goods influences the interrelationship between the actors and the elements, i.e. goods, network, land use, and vehicles. Both the actors and the elements affect, and are affected
39
A framework and classification for urban freight transport sustainability initiatives
25
by, the environment and the economy that together form the area in which urban goods movement (UGM) takes place. Many actors are involved in urban freight transport in different ways and with varying interests (Ogden, 1992), which typifies urban freight transportation. The multi-actor playing field also shows from Taniguchi et al. (2003), who emphasise that city logistics2 models should predict the behaviour of the stakeholders and the consequences of their actions to each key stakeholder, or actor, i.e. shippers or receivers, freight carriers, residents and administrators. The different types of actors initiating initiatives, also leads to differences in initiatives; Ambrosini and Routhier (2004) discriminate between public sector initiatives and private sector initiatives. The public sector can have several roles; from making legislative and statutory regulations, taking organisational measures, town planning, to establishing technical standards (on vehicles, facilities, or premises). The private sector is especially involved in technological developments, e.g. less-pollutant vehicles. Each stakeholder has different roles, problems, and objectives. Woudsma (2001) argues that urban freight transport research should especially focus on the relationship with congestion. Next to that, Richardson (2005) also labels safety, fuel consumption, and vehicle emissions as key indicators for sustainable transportation. Thompson and Hassall (2006) identify four goals for urban area initiatives: (i) improve health and safety, (ii) reduce community impacts, (iii) reduce freight costs, and (iv) improve supply chain efficiency. Taniguchi et al. (2004) presents three main targets of activities that can be achieved by city logistics: mobility, sustainability, and liveability. These three targets are supported by eight goals that form the directions to address common issues: global competitiveness, efficiency, environmental friendliness, congestion alleviation, security, safety, energy conservation, and labour force. Each of these goals relates to one or more key stakeholders. Ambrosini and Routhier (2004) distinguish two main objectives to be involved in urban goods movement (independent of the political and economic context): development of economic activity and reduction of environmental nuisance. The fundamental stake in UGM for countries not suffering from spatial scarcity is economic. Maintaining the vitality of city centres is the main issue for countries that face a lack of space in their (mostly) historic city centres. The overall objective in policy considerations should be sustainable urban goods transport (OECD, 2003). This is in line with the main objective for governmental actors according to Ogden (1992): minimise total social costs that can be 2 City logistics is (here) defined as “the process for totally optimising the logistics and transport
activities by private companies with support of advanced information systems in urban areas considering the traffic environment, the traffic congestion, the traffic safety and the energy savings within the framework of a market economy” Taniguchi, E., R. G. Thompson, T. Yamada, and R. Van Duin (2001b). City logistics: network modelling and intelligent transport systems. Pergamon, Oxford.

40
Chapter 2
26
subdivided in six objectives: economic, efficiency, road safety, environmental, infrastructure, and urban structure. However, even if the policy objective might be clear, the fact that most problems are dealt with on a local policy level often result in lack of consistency regionally (OECD, 2003). There is a serious lack of analytic tools and data for evaluating policies, with the result that many policies have unexpected side-effects. Many policy measures seem to lack a long term objective and do not take the supply chain in account, which is the basis for the transport. This brings us to the importance of evaluating urban freight transport initiatives. Qualification of the consequences is necessary to evaluate city logistics initiatives. Taniguchi et al. (2003) give an overview of models that can estimate the environmental, social, economic, and financial impacts. Next to these different impacts Ambrosini and Routhier (2004) show a multiplicity of methodologies in the urban freight transport field; varying from operational models, qualitative interviews and discussion groups, combi-nations of large scale quantitative surveys and qualitative interviews, a few descriptive studies, to experiments. Besides, Woudsma (2001) distinguishes also differences in schools in the urban freight transport field: planning (focusing on subjects varying from economic to external impact) and operations research (focusing on tool-development in business decision support). Several authors consciously pay attention to the evaluation of initiatives. Three dimensions should at least be considered in an evaluation: breadth (identifiable groups, i.e. trucks, other road users, and the freight system), width (the geographical area, i.e. link specific, route specific, or area width), and depth (the number of objectives considered) (Ogden, 1992). Thompson and Hassall (2006) establish that current evaluation methods of urban freight transport initiatives lack transparency and consistency. To overcome this problem they develop a methodology based on three steps (i) identification of goals and objectives, (ii) determination of criteria, and (iii) construction of evaluation matrices. This methodology makes a choice between competing urban freight improvement projects, based on logical and weighted criteria. 2.4 The basic framework We distinguish three areas in which dimensions could affect the results of an initiative: the design phase, the execution phase, and the evaluation phase. A closer look at the important points from the literature review shows that these points are actually the answers to several fundamental questions, i.e. the basic dimensions, on urban freight transport. Design phase dimensions Summarising the design phase from the literature review shows the following important points:
• Actors (Ambrosini and Routhier, 2004; Ogden, 1992; Taniguchi et al., 2001b; Woudsma, 2001).
• Drivers for policy and for involvement (Ambrosini and Routhier, 2004; Ogden, 1984; Taniguchi et al., 2004; Thompson and Hassall, 2006).

41
A framework and classification for urban freight transport sustainability initiatives
27
• Geographical planning options (OECD, 2003; Ogden, 1992). • Degree and type of sustainability (OECD, 2003).
These are actually the answers to the following fundamental questions on urban freight transport initiatives, which are to form the basic dimensions for the design phase in the framework:
o What initiative (description) is undertaken? o Why (objective) is this initiative undertaken? o Who (actors involved) is involved in the UFTS initiative? o Why (reasons for involvement) is this actor (/ are these actors) involved in the
initiative? Execution phase dimensions The execution phase follows less intuitive from the selective literature review than the objectives, interests, and actors involved in the design phase, and the evaluation and results in the evaluation phase. However, many of the contributions discussed in section 2.3 have a lot of reservations on the exact design and evaluation phase, depending on both the transport and geographical situation in which an initiative would be carried out. These situations are quite important, since transferability of the initiative to other areas might not be possible if the initiative is really context specific. The execution phase has especially to do with the actual execution of the initiative and the characteristics in which it takes place. Summarising this execution phase from the literature review shows the following important points:
• Geographical elements (Ambrosini and Routhier, 2004; Ogden, 1992; Woudsma, 2001).
• Transport characteristics (Allen et al., 2000; Woudsma, 2001). • Motivation of transport in urban area (Allen et al., 2000; Ogden, 1992; Woudsma,
2001). These are actually the answers to the following fundamental questions on urban freight transport initiatives, which form the basic dimensions for the execution phase in the framework:
o Where (geographical elements) does the initiative take place? o What (transport characteristics) typifies transport operations that are
included in the initiative? Evaluation phase dimensions The importance of the evaluation phase clearly emerges from the selective literature review. The following points summarise important findings from this review:
• Success; achievement of the objective (Richardson, 2005; Thompson and Hassall, 2006).
• Established evaluation criteria (Ogden, 1992; Thompson and Hassall, 2006). • Lessons learned; potential success or fail factors (Allen et al., 2000; OECD, 2003;
Ogden, 1992; Richardson, 2005).

42
Chapter 2
28
This enumeration is made up of answers to two fundamental questions in the evaluation phase of urban freight transport initiatives:
o How (evaluation) is this initiative evaluated; what methods are used for the initiative evaluation?
o What results follow from the initiative? Figure 2.2 shows the framework we propose, based on these fundamental questions that form the basic dimensions. The framework starts with the design phase (at the left), which is followed by the execution phase, in the rectangle with dashed line, and finally concludes with the evaluation phase. For some of the framework’s dimensions the selective literature review shows consistent classifications. For example, several authors list the same key actors that are involved in urban freight transport (initiatives). For other dimensions the discussed literature did not provide classifications. In the next section we provide clear classes for the framework’s dimensions.
WHAT INITIATIVEdescription
WHY objective
WHY INVOLVEDreason for involvement
WHOactors involved
HOWevaluation
WHAT RESULTSWHAT transport characteristics
WHERE geographical elements
Design phase Execution phase Evaluation phase
Figure 2.2 Basic framework 2.5 Framework: the dimensions and their classifications and elements In this section we provide the classes and elements (see Figure 2.1) that describe the basic dimensions of the framework in Figure 2.2. 2.5.1 What initiative: type and description The first question that we answer with this framework is: “what is the initiative?”. This dimension falls apart in two classes: description and type. The ‘description’ briefly describes the initiative in a few catchwords. Descriptions could be for example: the use of a consolidation centre, the obligation of a low-emission zone, time-
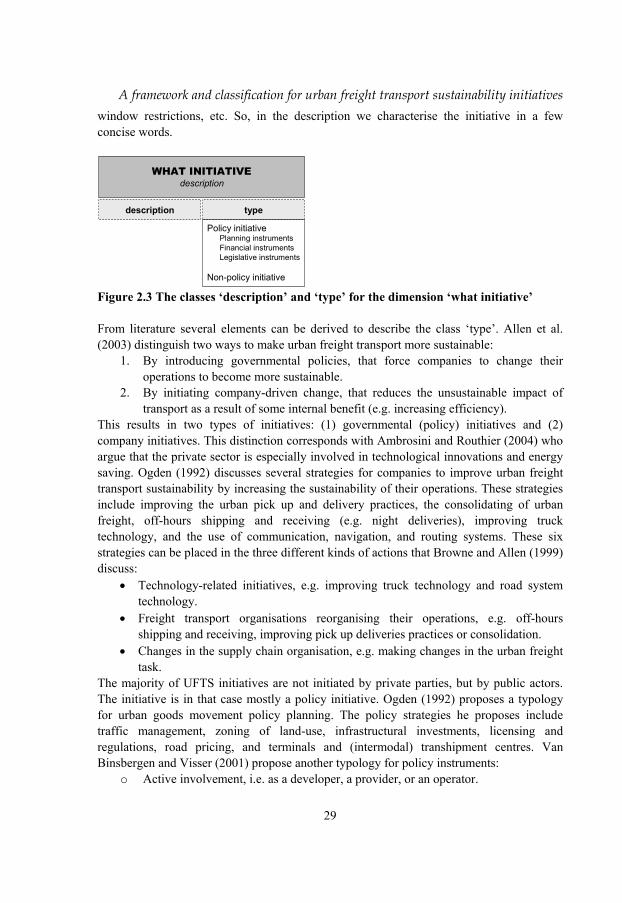
43
A framework and classification for urban freight transport sustainability initiatives
29
window restrictions, etc. So, in the description we characterise the initiative in a few concise words.
WHAT INITIATIVEdescription
typedescription
Policy initiativePlanning instrumentsFinancial instrumentsLegislative instruments
Non-policy initiative Figure 2.3 The classes ‘description’ and ‘type’ for the dimension ‘what initiative’ From literature several elements can be derived to describe the class ‘type’. Allen et al. (2003) distinguish two ways to make urban freight transport more sustainable:
1. By introducing governmental policies, that force companies to change their operations to become more sustainable.
2. By initiating company-driven change, that reduces the unsustainable impact of transport as a result of some internal benefit (e.g. increasing efficiency).
This results in two types of initiatives: (1) governmental (policy) initiatives and (2) company initiatives. This distinction corresponds with Ambrosini and Routhier (2004) who argue that the private sector is especially involved in technological innovations and energy saving. Ogden (1992) discusses several strategies for companies to improve urban freight transport sustainability by increasing the sustainability of their operations. These strategies include improving the urban pick up and delivery practices, the consolidating of urban freight, off-hours shipping and receiving (e.g. night deliveries), improving truck technology, and the use of communication, navigation, and routing systems. These six strategies can be placed in the three different kinds of actions that Browne and Allen (1999) discuss:
• Technology-related initiatives, e.g. improving truck technology and road system technology.
• Freight transport organisations reorganising their operations, e.g. off-hours shipping and receiving, improving pick up deliveries practices or consolidation.
• Changes in the supply chain organisation, e.g. making changes in the urban freight task.
The majority of UFTS initiatives are not initiated by private parties, but by public actors. The initiative is in that case mostly a policy initiative. Ogden (1992) proposes a typology for urban goods movement policy planning. The policy strategies he proposes include traffic management, zoning of land-use, infrastructural investments, licensing and regulations, road pricing, and terminals and (intermodal) transhipment centres. Van Binsbergen and Visser (2001) propose another typology for policy instruments:
o Active involvement, i.e. as a developer, a provider, or an operator.

44
Chapter 2
30
o Planning instruments, i.e. infrastructural planning and spatial planning. o Financial instruments, i.e. that deal with taxes and pricing or financial support. o Legislative instruments, i.e. licensing and regulation. o Communication and consultation instruments. o Agreements and covenants.
Figure 2.3 shows the classification we propose for ‘type’. Some UFTS initiatives combine more than one type; for example some city logistics initiatives, such as cooperative freight transport systems and public logistics terminals, are a combination of policy and supply chain changes (see e.g. Taniguchi and Van der Heijden, 2000). 2.5.2 Why: sustainability type and level Every initiative starts with an objective, a raison d’être, without which the initiative would not have started in the first place. We discuss this dimension, the ‘why-question’, in this section. OECD (2003) states that the objective for urban freight transport initiatives should be the development of an urban goods transport system on a sustainable sound basis. This implies including all three sustainability issues, i.e. environmental, economical, and social sustainability, on the short and the long-term. Therefore, we limit ourselves to sustainability initiatives only. Although we now have only one objective to start an initiative, sustainability does not have the same meaning in all contexts. Marshall and Toffel (2005), for example, claim that it had well over 100 different definitions by the mid-1990’s. Sustainability has evolved in an ‘umbrella term’ in which sustainability has become the synonym for something goods, and unsustainability for something bads. To make sure the term sustainability does not become meaningless, Marshall and Toffel (2005) propose an unsustainability hierarchy with four levels (see Figure 2.4).
Level 1Actions that, if continued at the current or
forecasted rate, endanger the survival of humans
Level 2Actions that significantly reduce life
expectancy or other basic health indicators
Level 3Actions that may cause species
extinction or that violate human rights
Level 4Actions that
reduce quality of lifeor are inconsistent withother values, beliefs oraesthetic preferences
Figure 2.4 Unsustainability hierarchy (Marshall and Toffel, 2005) In the introduction we already discussed another classification for sustainability, which is frequently used in transport contexts, i.e. the triple-bottom line, including all three

45
A framework and classification for urban freight transport sustainability initiatives
31
sustainability issues: environmental, economical, and social sustainability, also known as the triple-P (people, profit, and planet) (see e.g. Feitelson, 2002; Nicolas et al., 2003; Richardson, 2005). To describe sustainability we use these two classes (see Figure 2.5): ‘sustainability level’, which is based on Marshall and Toffel’s (2005) hierarchy and ‘sustainability type’, which is based on the triple-bottom-line. The three elements of the triple-bottom-line are further specified based on Kennedy et al. (2005), Ogden (1992), Richardson (2005), Taniguchi et al. (2004), and Van Binsbergen and Visser (2001). Social sustainability includes issues on safety, health, noise, intimidation, and quality of life. Economic sustainability includes issues on competitiveness, efficiency, effectiveness, city accessibility, and congestion. Finally, environmental sustainability includes, but is not limited to, issues on fuel consumption, pollution, and waste.
sustainability typesustainability level
WHYsustainability
-Level 1
-Level 2
-Level 3
-Level 4
-Social
-Economical
-Environmental
Figure 2.5 The classes ‘sustainability level’ and ‘sustainability type’ for the dimension
‘why’ 2.5.3 Who: the actors There are many different stakeholders in urban freight transportation who have different and sometimes even conflicting interests (Taniguchi et al., 2001b). The most crucial actors involved in the movement of goods are the shippers and receivers, who are located at the origin and destination of the transported goods, the freight carriers, who actually move the goods, the residents, who live or work in the city, or use the city’s facilities, and the administrators, who are neutral and try to resolve conflicts between the other stakeholders (Taniguchi et al., 2003). Other authors distinguish similar key stakeholders or actors (see e.g. Ogden, 1992; Woudsma, 2001). We propose an actor-classification that discerns the actor-groups based on their decision-making power in the urban goods movement field. In the following classification (based on Ogden, 1992; Taniguchi et al., 2003; Van Binsbergen and Visser, 2001; Woudsma, 2001) the decision-making power of actor-groups decreases: • Governmental actors. The governmental actors are mainly determined by:
o Higher governments, such as the national government and the European Commission.
o Local authorities, such as the city authorities and road and traffic authorities.

46
Chapter 2
32
• Professionals. Professional actors are involved in urban goods movement because of practicing their profession. The most important actors in this group are: o Shippers, at the origin of the transported goods. o Carriers, transporting the goods. o Receivers, at the destination of the transported goods. o Terminal operators and firms active in modes other than road transport. These groups consist of very heterogenic stakeholders, as we discussed in section 1.4 (see also Figure 1.2); usually the relation between shipper, receiver and carrier is different if the receiver is part of a retail chain than if the receiver is not, e.g. an independent retailer. In the first case a private carrier is usually responsible for the transport, whereas in the latter it is a for-hire carrier.
• Impactees. This group is affected by the urban goods movement system, while not being directly involved in it. We distinguish three main groups: o Residents, the actors that live in the cities. o Users, the group of actors that uses urban facilities, such as the shopping centre,
(movie)theatres, museums, bars, restaurants, etc. o People working in the urban area. These groups are affected differently by urban goods movement; they have in common that they face the externalities, such as the increasing traffic congestion, and decreasing traffic safety. In spite of their limited decision-making power, governments tend to pay more attention to the wishes of the impactees (their voters) than to that of the professionals (Ogden, 1992; Van Binsbergen and Visser, 2001).
Figure 2.6 shows the typology for the who-question, the actors that are involved in the urban freight transport initiatives.
actors involved
WHOactors involved
-Governments
-Professionals
-Impactees
Figure 2.6 The class ‘actors involved’ for the dimension ‘who’ 2.5.4 Why involved: reasons of involvement, type and role All three actor groups can be involved in UFTS initiatives. Actors are involved either voluntary or compulsory (Browne et al., 2005a). The actors who are involved involuntary have only one role; bearing. For those actors that are involved voluntarily we can distinguish several roles. De Brito (2003) discerns three actor roles: managing / organising, executing, and accommodating. Van Binsbergen and Visser (2001) argue that active actors in the public sector can have three roles: developer (of technology), provider (of financial

47
A framework and classification for urban freight transport sustainability initiatives
33
means), and operator (e.g. traffic management). Based on De Brito (2003) and Van Binsbergen and Visser (2001) we propose the following elements for the voluntary-involved actor roles:
o Funding. o Initiating (or developing). o Managing / organising. o Executing. o Accommodating. o Using.
The reason why actors are involved in an UFTS initiative can vary between (see Figure 2.7): • Sustainability. The reason the initiative started in the first place. In this case the actor’s
objective corresponds with the initiative’s objective. This is for example the case if the actor is the initiator. The type of involvement is voluntary.
• Economics (profit). An actor, mostly a professional, can be involved because of economic motives. For example, a truck manufacturer that joins an initiative for low-emission trucks. The manufacturer might not be involved because of sustainability reasons, but especially to sell new clean trucks to transporters that have to use them because of the initiative (or legislation, see next bullet point). This reason differs from sustainability, which also includes an economical component, as the actor’s only interest is making money. This does not automatically correspond to economical sustainable development.
• Legislation. Involuntarily involved actors are usually obliged by legislation to be involved. An example can be the compulsory use of a city consolidation centre, or the compulsory use of low-emission vehicles in a low emission zone.
type and role
WHY INVOLVEDreason for involvement
reason of involvement
-Compulsory
-Voluntary
-Sustainability
-Economics (profit)
-Legislation
Figure 2.7 The classes ‘type and role’ and ‘reason of involvement’ for the dimension ‘why involved’
2.5.5 Where: geographical elements The geographical situation influences results of UFTS initiatives and, maybe even more important in the light of the initiatives review, may also determine the transferability of an initiative to another context or area. Not only the available space (see e.g. Ambrosini and
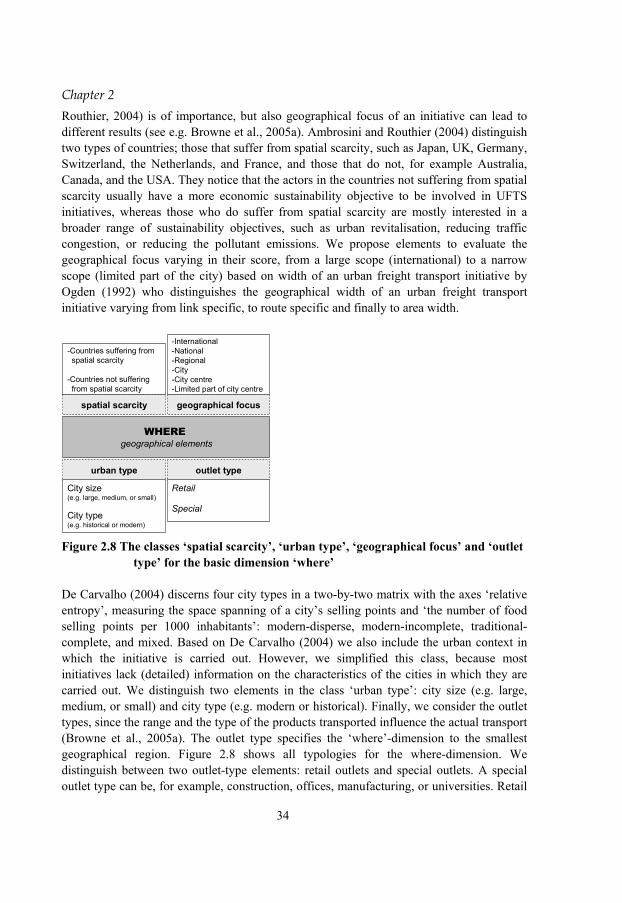
48
Chapter 2
34
Routhier, 2004) is of importance, but also geographical focus of an initiative can lead to different results (see e.g. Browne et al., 2005a). Ambrosini and Routhier (2004) distinguish two types of countries; those that suffer from spatial scarcity, such as Japan, UK, Germany, Switzerland, the Netherlands, and France, and those that do not, for example Australia, Canada, and the USA. They notice that the actors in the countries not suffering from spatial scarcity usually have a more economic sustainability objective to be involved in UFTS initiatives, whereas those who do suffer from spatial scarcity are mostly interested in a broader range of sustainability objectives, such as urban revitalisation, reducing traffic congestion, or reducing the pollutant emissions. We propose elements to evaluate the geographical focus varying in their score, from a large scope (international) to a narrow scope (limited part of the city) based on width of an urban freight transport initiative by Ogden (1992) who distinguishes the geographical width of an urban freight transport initiative varying from link specific, to route specific and finally to area width.
urban type outlet type
City size(e.g. large, medium, or small)
City type(e.g. historical or modern)
WHEREgeographical elements
spatial scarcity geographical focus
Retail
Special
-Countries suffering fromspatial scarcity
-Countries not sufferingfrom spatial scarcity
-International-National-Regional-City-City centre-Limited part of city centre
Figure 2.8 The classes ‘spatial scarcity’, ‘urban type’, ‘geographical focus’ and ‘outlet
type’ for the basic dimension ‘where’ De Carvalho (2004) discerns four city types in a two-by-two matrix with the axes ‘relative entropy’, measuring the space spanning of a city’s selling points and ‘the number of food selling points per 1000 inhabitants’: modern-disperse, modern-incomplete, traditional-complete, and mixed. Based on De Carvalho (2004) we also include the urban context in which the initiative is carried out. However, we simplified this class, because most initiatives lack (detailed) information on the characteristics of the cities in which they are carried out. We distinguish two elements in the class ‘urban type’: city size (e.g. large, medium, or small) and city type (e.g. modern or historical). Finally, we consider the outlet types, since the range and the type of the products transported influence the actual transport (Browne et al., 2005a). The outlet type specifies the ‘where’-dimension to the smallest geographical region. Figure 2.8 shows all typologies for the where-dimension. We distinguish between two outlet-type elements: retail outlets and special outlets. A special outlet type can be, for example, construction, offices, manufacturing, or universities. Retail

49
A framework and classification for urban freight transport sustainability initiatives
35
outlets can vary between food retail, department stores, drug stores, fashion retail (see also chapters 4 - 6), but also hotels and restaurants, post and parcels, book stores, etc. 2.5.6 What: transport characteristics We propose a classification with five classes to describe the transport characteristics in an initiative (see Figure 2.9). First of all, the transport mode; in many urban areas the freight transport is carried out by trucks, since the road network density is high enough to deliver all urban goods to the receivers. Other transportation modes are usually not able to deliver the urban freight to all receivers in the urban areas, although exceptions exist, like waterborne transport in the city of Venice. Some initiatives focus on the possibility of constructing new infrastructure, see e.g. Visser (2001), who discusses the possibilities of underground logistics systems, or the use of infrastructure that is normally only used for passenger transport, such as the cargotram (Koehler, 2001). Without demand, there would be no freight transport, and therefore no necessity for any urban freight transport initiative (Allen et al., 2000; Ogden, 1992). Allen et al. (2000) distinguish different kinds of urban freight demand, which we use in the class ‘transport motivation’. The elements in this class start with core goods deliveries and collections to and from the premises, containing all movements of goods that are essential for the main activity. For example, for a fashion store the main activity is selling clothing, which implies that the delivery of clothes is a core goods delivery. The second element in the class of ‘transport motivation’ contains the non-core goods deliveries and collections to and from premises. This category contains all other goods trips to and from the premises that are not directly essential for the main activities in the premises. Examples of non-core goods urban freight transport operations are waste collection, postal collection and deliveries, and money collection and deliveries. Service-related trips form the third element in this class; service trips are those trips to premises with the purpose to carry out a service activity (e.g. computer equipment services, cleaning services, etc.), as opposed to solely delivering or collecting goods. Because service providers have to bring along equipment and tools to provide the service, they are included as urban freight transport. The fourth category of transport motivations are the home deliveries or collections. This element includes all delivery and collection activities of goods purchased by final customers to and from their home addresses or other areas. Based on Allen et al. (2000), we determine the third class in the ‘what transport characteristics’ dimension: the delivery characteristics. We use three elements to describe this class that all consider the actual drop: (i) the time of the day, (ii) the type of drop, which could be part of a single drop roundtrip also known as full truckloads (FTL) or multiple drop roundtrip also known as less than truckload (LTL), and (iii) the location of the drop, which could be on-street or off-street. The product type is the fourth class of this dimension’s classification. Different product types require different transport conditions and handling, e.g. frozen goods are transported

50
Chapter 2
36
in another vehicle than hanging clothes. For many initiatives product types are relevant to consider. In an initiative that focuses on consolidation of freight at the border of a city, it is for example not possible to combine different temperature flows in one vehicle. Three elements describe the product type (see Figure 2.9): complexity, value, and volume. The complexity of an assortment can be either simple, containing products that are non-perishable, non-fragile, or no special handling is required in storage or transportation, or complex, containing all non-simple products (De Koster, 2003). Product characteristics differ, next to the complexity, in their product value and volume (Van Goor et al., 2003).
delivery characteristics transport motivation
Time of the daye.g. morning, afternoon, evening,night
Drop typee.g. single (FTL) or multiple (LTL)
Location of drope.g. on-street or off-street
WHATtransport characteristics
transport mode supply chain direction
1. Core goods
2. Non-core goods
3. Service related trips
4. Home deliveries
-Road-Rail-Water-Other
-Forward-Reverse logistics-Both
product type
Complexity
Value
Volume
Figure 2.9 The classes ‘transport mode’, ‘delivery characteristics’, ‘transport
motivation’, ‘supply chain directions’ and ‘product type’ for the dimension ‘what transport characteristics’
Finally, we also consider the supply chain direction of the transport. In the case that the goods are moved in the direction from the manufacturer to the final consumer it is considered forward, the opposite direction is reverse logistics (see e.g. De Brito, 2003). If both directions are considered we simply call the supply chain direction ‘both’. Figure 2.9 shows the classification for the dimension ‘what transport characteristics’ and the corresponding elements. 2.5.7 How: evaluation This dimension’s classification contains one class; the method that was used to evaluate the initiative’s results. Ambrosini and Routhier (2004) discern several methods and tools: theoretical models, interviews and discussion groups, surveys and applied models, and experiments. Figure 2.10 shows the classification we propose combining evaluation by using an empirical model, an analytical model, or by a qualitative empirical method. Basically, the academic research in the urban freight transport field entails two different approaches; the (geographical and policy) planning approach and operations research approach (Woudsma, 2001). In the city logistics community we see a similar dichotomy

51
A framework and classification for urban freight transport sustainability initiatives
37
between modelling approaches on the one hand and policy and planning approaches on the other hand (see e.g. Taniguchi et al., 1999a; Visser et al., 1999). This dichotomy is also visible in our classification; the operations research approach corresponds for the greater part with analytical models.
methods
HOWevaluation
- Analytical model
- Empirical model
- Qualitative empirical
Figure 2.10 The class ‘methods’ for the dimension ‘how’ 2.5.8 What results We propose a classification with three classes for the dimension ‘what results’. The first class ‘success’ answers the questions whether the initiative was evaluated as successful in the report, objective-based, and whether the initiative was successfully implemented in the real world, practice-based. The second class, evaluation criteria, is based on the checklist developed by PSD, the former Dutch platform for urban distribution, to evaluate expected impacts of policies in urban freight transport. This checklist is based on five objectives that all have a number of indicators (see e.g. OECD, 2003; Van Binsbergen and Visser, 2001): • Accessibility. Indicators of accessibility are: vehicles / tonne-kilometre, size of the
vehicle movements, time to reach destination, and obstacles. • Environment. The indicators that come with this element are: noise, emissions, vehicle
movement, citizen complaints, consumer complaints, and safety (number of accidents). • Transport efficiency. The indicators that are used to evaluate this element are: the
average loading factor per trip and the fuel usage. • Economic development. The following indicators are used to evaluate this element: size
of office spaces, number of shoppers, number of retail establishments, revenue, costs, and profits.
• Social support. This element is measured by looking at the advantages for all stakeholders, this implies the following indicators: citizens’ opinion, opinion of shopping public, opinion of transport companies, opinion of retailers, and local government opinion.
We include three extra elements for this class to evaluate the initiatives on all relevant aspects: • Logistics costs. This is measured by the actual costs of (one of) the actors that carry out
the urban freight logistical operations. • Ease of implementation. This element indicates the ease of implementation of an
initiative in reality.
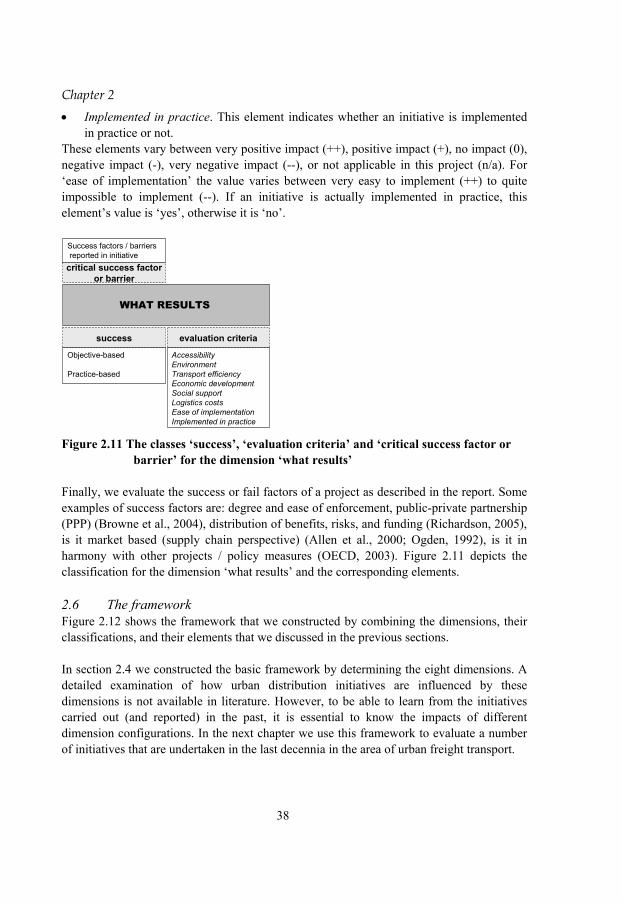
52
Chapter 2
38
• Implemented in practice. This element indicates whether an initiative is implemented in practice or not.
These elements vary between very positive impact (++), positive impact (+), no impact (0), negative impact (-), very negative impact (--), or not applicable in this project (n/a). For ‘ease of implementation’ the value varies between very easy to implement (++) to quite impossible to implement (--). If an initiative is actually implemented in practice, this element’s value is ‘yes’, otherwise it is ‘no’.
success evaluation criteria
WHAT RESULTS
Objective-based
Practice-based
AccessibilityEnvironmentTransport efficiencyEconomic developmentSocial supportLogistics costsEase of implementationImplemented in practice
critical success factoror barrier
Success factors / barriers reported in initiative
Figure 2.11 The classes ‘success’, ‘evaluation criteria’ and ‘critical success factor or
barrier’ for the dimension ‘what results’ Finally, we evaluate the success or fail factors of a project as described in the report. Some examples of success factors are: degree and ease of enforcement, public-private partnership (PPP) (Browne et al., 2004), distribution of benefits, risks, and funding (Richardson, 2005), is it market based (supply chain perspective) (Allen et al., 2000; Ogden, 1992), is it in harmony with other projects / policy measures (OECD, 2003). Figure 2.11 depicts the classification for the dimension ‘what results’ and the corresponding elements. 2.6 The framework Figure 2.12 shows the framework that we constructed by combining the dimensions, their classifications, and their elements that we discussed in the previous sections. In section 2.4 we constructed the basic framework by determining the eight dimensions. A detailed examination of how urban distribution initiatives are influenced by these dimensions is not available in literature. However, to be able to learn from the initiatives carried out (and reported) in the past, it is essential to know the impacts of different dimension configurations. In the next chapter we use this framework to evaluate a number of initiatives that are undertaken in the last decennia in the area of urban freight transport.

53
A framework and classification for urban freight transport sustainability initiatives
39
HOWevaluation
WHAT INITIATIVEdescription
WHYsustainability
WHY INVOLVEDreason for involvement
WHOactors involved
WHAT RESULTS
WHATtransport characteristics
WHEREgeographical elements
type and roleactorsinvolved
type description
sustainabilitylevel
sustainabilitytype
reason ofinvolvement
product type supply chaindirection
transportmode
deliverycharacteristics
transportmotivation
evaluationcriteria
CSF or barrier
success
urban type outlet type
spatialcharacteristics
geographicalfocus methods
Figure 2.12 Framework for evaluating UFTS initiatives 2.7 Structuring UFTS initiatives Based on the review of 106 initiatives we design a structure to classify the urban freight transport sustainability initiatives based on the first four dimensions of the framework: ‘what initiative’, ‘why’, ‘who’, and ‘why involved’. First we distinguish, based on the ‘who’ dimension, two types of initiatives: (i) initiatives initiated by one actor group and carried out by this actor and (ii) initiatives that require more than one actor group. Based on these findings we make a distinction between initiatives as follows:
A. Initiatives that aim at improving sustainability within the context. B. Initiatives that aim at improving sustainability by changing the context.
Class A initiatives, which aim at improving the sustainability within the context, focus on a better utilisation of available infrastructure (e.g. road, vehicles, and warehouses). We discern two different categories of initiatives in this class: those that are initiated by authorities and those that are initiated by actors from the group of professionals. This distinction corresponds to other authors (see e.g. Allen et al., 2000; Ambrosini and Routhier, 2004) and leads to the following subdivision in two categories of class A initiatives: (A1) policy initiatives and (A2) company driven initiatives. Class B initiatives mainly focus on rearranging the context to make transport more sustainable. The initiatives in class B are more radical than those in class A. Usually more actors are involved and they can be characterised as difficult, expensive, and / or complex in comparison with class A initiatives. For class B initiatives we also discern two categories: (B1) physical infrastructure initiatives, those initiatives that rearrange the physical infrastructure that enables urban freight transport operations, and (B2) transport reorganising initiatives, those initiatives that rearrange the way transport operations are carried out. Although the

54
Chapter 2
40
initiatives gathered in the four categories have strong resemblances, they also differ considerably in other characteristics. The four categories, that are mainly determined by the ‘what initiative’, ‘who’, and the initiator in the ‘type and role’ element of ‘why-involved’, again can be classified in even more specific initiative types. The main dimension on which the initiative types in a category differ is the ‘why’ dimensions and in particular the sustainability type issues. The variety in UFTS initiatives requires the high number of different initiative types. In chapter 3 we show all reviewed initiatives fit this proposed structure (Table 2.1). Table 2.1 A structure for urban freight transport sustainability initiatives
Class Category Initiative type Road pricing Licensing and regulation Category A1
Policy initiatives Parking and unloading Carrier cooperation Vehicle routing improvement
Class A Improvements
within the context Category A2
Company driven initiatives Technological vehicle innovation Consolidation centre Underground logistics system Road infrastructure development
Category B1 Physical infrastructure initiatives
Standardisation of load-units Transport auction
Class B Improvements
by changing the context Category B2
Transport reorganising initiatives Intermodal transport 2.8 Initiative types We briefly discuss the twelve different initiative types in this section. In the next chapter we discuss actual initiatives reported in literature in more detail by using the complete framework parsimoniously; we discuss only those dimensions and classes that are relevant for the specific initiative type. 2.8.1 Policy initiatives The main idea of road pricing initiatives by governmental parties is either to earn back the investments and maintenance cost for the infrastructure or to make the scarce road capacity subject to market functioning in order to reduce congestion and pollution. Especially the last one applies as UFTS initiative. Pricing schemes are initiated by local authorities. Legislation obliges users to pay the charge. All road users, both urban freight and passenger transport, have to pay the charge. Implementation is possible; see for example the London Congestion Charge, although public acceptance might be a problem. Licensing and regulation initiatives focus either on improving social sustainability issues in cities or on improving environmental sustainability issues. In the first group we find restricting policy measures such as vehicle restrictions and time-windows, whereas the second group contains policy initiatives such as vehicle load factor controls and low emissions zones. The licensing and regulation initiatives have in common that local

55
A framework and classification for urban freight transport sustainability initiatives
41
authorities restrict urban freight transport operations by carriers. Some of the initiatives in this type therefore focus more on relaxing current restrictions, rather than implementing them. Obviously, the results for relaxing restrictions are opposite to imposing them. The restrictions have in common that they are easy to implement for local authorities. However, these licensing and regulation initiatives usually increase the logistical costs for carriers. The main idea of parking and unloading initiatives is to improve the efficiency of the transportation in urban areas and improve the accessibility. Two problems are the basis for these initiatives; problems that are caused by (un)loading vehicles, for example double parking which hinders the other traffic, and problems of shortage of unloading areas, which is either due to a too low number of available areas, or due to illegal parked passenger cars on the unloading areas. The reported parking and unloading initiatives are usually initiated by researchers. Usually, these initiatives are easy to implement, the positive impact on the accessibility is limited, due to the narrow geographical focus of the initiative. 2.8.2 Company driven initiatives Carrier cooperation initiatives involve different, competitive companies that operate parcel pick up and deliveries in one city. Different carriers cooperate by consolidating goods at a terminal, or by using a neutral carrier, to prevent two half filled vehicles visiting the same area of a town. After all, one full vehicle would result in fewer kilometres, what improves the accessibility and reduces the pollution. These initiatives are in general located in historical cities, with major congestion problems, e.g. Tokyo. Typically these initiatives target on LTL deliveries or parcels. Cooperation between competitors is difficult to realise in reality, although cooperating carriers might profit from it. A vehicle routing improvement initiative basically comes down to the idea that a vehicle routing plan that is not feasible in reality due to unexpected events, that were not considered during the design of the plan, is very costly. These initiatives usually aim at making the vehicle routing plan correspond better to reality, by including e.g. historical data, variations in travel times, real-time traffic information, congestion estimates, etc. The main objective for improving routing and scheduling is economic. The improvements described are usually not tested in real world problems. Implementation is easy, since only one actor is involved. Many innovations, e.g. cleaner or quieter truck engines, take place in industry. Usually these initiatives are not reported in academic literature. Technological vehicle innovation initiatives are easy to implement; the carrier’s operations do not change, only the vehicle type used. 2.8.3 Physical infrastructure initiatives Consolidation centre initiatives are a special form of cooperation, including several types of centres, such as city distribution centres, urban freight platforms, freight villages, etc. These centres have in common that flows from outside the city are consolidated. The

56
Chapter 2
42
objective is to bundle inner-city transportation activities. A consolidation centre, especially in combination with electric vehicles for transport in the city, is good for the environment. The main idea behind consolidation centres is as follows: the freight transport to and from cities is split in two parts, the part inside the city and the part outside the city. One can benefit from the advantages of large vehicles for long-haul transport outside the city without having these large trucks and the related problems in the city. Next, smaller trucks transport the goods to outlets in the city after transhipment in a consolidation centre. The idea is to prevent that only partly filled vehicles or large vehicles enter the city. This could for example be the case if a (large) vehicle visits stores in several cities in one roundtrip. Implementation is difficult; next to high initial cost for developing the centre, extra transhipment increases logistics costs for the shipper. Underground logistics system initiatives mainly focus on evaluating the feasibility, the potential, and the design choices in developing an underground logistics system. Underground logistics systems do not (yet) exist. An underground logistics system reduces, or even makes disappear, almost all negative impacts of urban freight transport. The high construction cost and unknown risks make implementation difficult. Road infrastructure development initiatives can usually be found in modern cities and in countries not suffering from spatial scarcity. In these areas implementation is not too difficult. Actual road infrastructure developments are usually not reported in academic contributions. Standardisation of load-unit initiatives are closely related to initiative types such as intermodal transport and the use of consolidation centres, since it makes transhipment easier and cheaper. There could be a role for the government in these projects, because they are only feasible if implemented on a large scale. The container can also be used for splitting the transport to the city and in the city; large vehicles carry multiple city containers to the city and then, in the city, small vehicles deliver a few city containers to the stores. As a result, optimisation of long-haul and inner city operations is possible, which leads to positive environmental and accessibility effects. Different kinds of products can be transported, e.g. special containers for fresh products, as long as their outside sizes are conform the standard. Implementation is difficult, because many different actors are supposed to make initial investments in city containers and transport means. 2.8.4 Transport reorganising initiatives Transport auction initiatives mainly focus on offering transport orders in an auction to make the overall transport system more efficient. Because carriers can bid on shipments, for example a pick up, at areas where their vehicle already had to go to make a delivery, it should overall result in fewer kilometres. The auction initiatives increase the drive for efficiency, with the result that both shippers’ cost can decrease and carriers’ profits can increase. Although some of these initiatives are implemented in reality, they are not used on a large scale.

57
A framework and classification for urban freight transport sustainability initiatives
43
Intermodal transport initiatives are very dissimilar; examples are the cargotram in a city, but also large distance intermodal transport that is only transferred to road vehicles in the urban area. The main idea is that other than road modes are more sustainable than road transport. Usually the scale advantages only outweigh the cost-adding transhipments between modes on long transport distances. In chapter three we categorise all 106 urban freight transport sustainability initiatives that answered the selection criteria from section 2.2.2 based on the twelve initiative types. 2.9 Conclusions and summary This chapter provides a framework that can be used to structure the urban freight transportation field by identifying the main dimensions, providing a useful classification, and explaining the relationship between these dimensions. The basic dimensions and their classifications are:
o What initiative – described by type and description (see Figure 2.3). o Why (sustainability) – described by sustainability level and sustainability type (see
Figure 2.5). o Who (actors involved) – described by actors involved (see Figure 2.6). o Why (reason for involvement) – described by reason of involvement and type and
role (see Figure 2.7). o Where (geographical elements) – described by spatial characteristics, geographical
focus, urban type, and outlet type (see Figure 2.8). o What (transport characteristics) – described by product type, supply chain
direction, transport mode, delivery characteristics, and transport motivation (see Figure 2.9).
o How (evaluation) – described by methods (see Figure 2.10). o What results – described by evaluation criteria, success, and critical success
factors or barriers (see Figure 2.11). We distinguish two main classes of sustainability initiatives, those that aim at improving sustainability by making improvements within the context and those that aim at improving sustainability by changing the urban freight transport context. These classes can be subdivided in four categories of urban freight transport sustainability initiatives (see Table 2.1): (A1) policy initiatives, (A2) company driven initiatives, (B1) physical infrastructure initiatives, and (B2) transport reorganising initiatives. The four categories are divided in twelve initiative types. In the next chapter we show that all examined initiatives can be categorised in one of the twelve initiative types.

58

59
45
3 Improving sustainability: a review of initiatives
This chapter examines 106 initiatives from the literature on improving sustainability in urban areas. We use the framework and classification developed in chapter 2 to review the initiatives. This chapter is organised as follows: the first section is an introduction. In this section we briefly discuss the classification of initiatives, based on chapter 2. The next two sections discuss the sustainability improvement initiatives within the current urban freight transportation context. We distinguish three different types of policy initiatives and three different types of company driven initiatives. The next two sections discuss initiatives that focus on improving sustainability by changing the current urban freight transportation context. We discern four types that can be categorised as physical infrastructure initiatives and two different types of transport reorganising initiatives. Finally, in section 3.6 we discuss the main results. The last section contains this chapter’s conclusions and the remaining research challenges in the urban freight transportation field. 3.1 Introduction In this chapter we discuss 106 UFTS initiatives using the framework developed in the previous chapter. This review uses the initiative types we discussed in sections 2.7 and 2.8. Table 3.1 shows the number of initiatives that meet the selection criteria (see section 2.2) per initiative type that we use in this chapter’s review. Table 3.1 Number of initiatives in review Category Initiative type Number of initiatives
Road pricing 7 Licensing and regulation 21 Policy initiatives Parking and unloading 8 Carrier cooperation 12 Vehicle routing improvement 14 Company driven
initiatives Technological vehicle innovation 5 Consolidation centre 15 Underground logistics system 5 Road infrastructure development 4
Physical infrastructure initiatives
Standardisation of load-units 4 Transport auction 3 Transport reorganising
initiatives Intermodal transport 8 Dablanc (2007) agues that urban freight transport operations are to a major extent indifferent for differences in the internal structure of (European) cities. And furthermore,

60
Chapter 3
46
local authorities seem not to know how to organise urban freight transport in their cities. This review is therefore not only useful in identifying the configurations that are successful and the barriers that lead to failure for different initiative types, but, following the first argument of Dablanc (2007), these lessons might be transferable to other cities, even though these cities differ. Sections 3.2 and 3.3 treat policy initiatives and company driven initiatives. The three types of policy initiatives, i.e. road pricing, licensing and regulation, and parking and unloading, mainly focus on reallocating infrastructure or land. The company initiatives focus on improving either the current operations, by improving their own operations or by cooperation in the operations with their competitors, or the current means. Section 3.4 discusses physical infrastructure initiatives and section 3.5 discusses transport reorganising initiatives. 3.2 Policy initiatives The initiatives in this section have in common that the main actor, the policy-maker, is a governmental player. We distinguish three different categories of policy initiatives aiming at improving sustainability in urban areas. The first group reports 7 pricing initiatives in section 3.2.1 based on 9 references. Next, 5 groups of licensing and regulation initiatives are discussed in section 3.2.2, including in total 21 initiatives:
o Vehicle (weight) regulations including 6 initiatives. o Vehicle load factors including 2 initiatives. o Low emissions zones including 4 initiatives. o Time restrictions (or time-windows) including 5 initiatives. o Dedicated infrastructure including 4 initiatives.
Finally, we discuss 8 parking and unloading initiatives in section 3.2.3 3.2.1 Road pricing (7 initiatives) The main idea of road pricing is to make the scarce road capacity subject to market functioning with the idea to better spread the traffic volume over time to reduce congestion. A reduction in congestion and an improved traffic flow lead to less pollutant emissions, which could be an underlying objective for road pricing. Usually road pricing affects all traffic participants and not only urban freight transportation, although the road prices might discriminate between passenger and freight transportation. Table 3.2 shows the main results of all road pricing initiatives. Many of the reported initiatives are not implemented in practice; Allen et al. (2004) and Anderson et al. (2005) examine an artificial initiative in which road pricing is established in the cities of Birmingham, Hampshire, and Norfolk. The researchers use the expected response to the congestion charge of seven companies that are affected differently to examine the operational, financial, and environmental impact of this initiative. These impacts depend on the fee, the size of the geographical area in which this fee is charged, and the realised
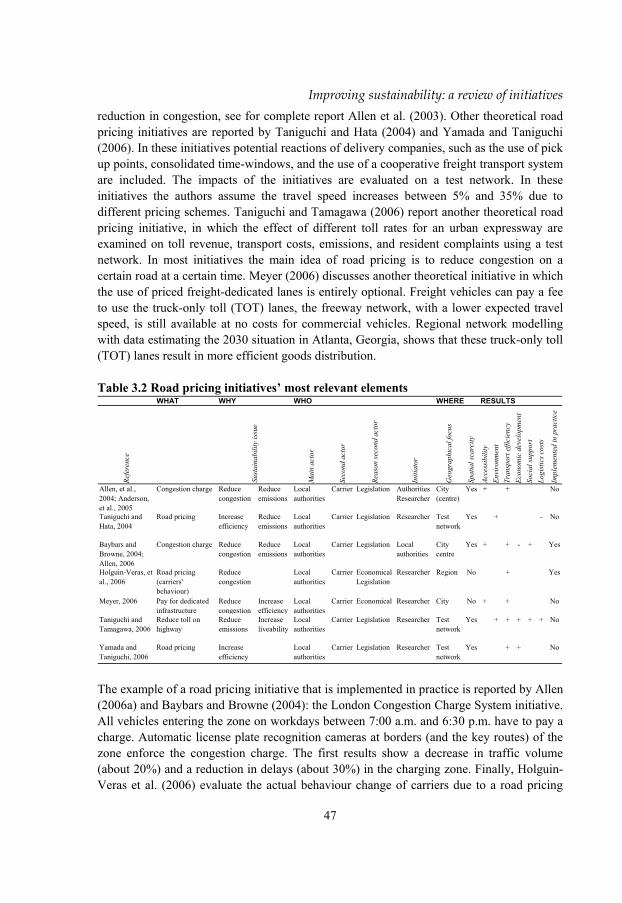
61
Improving sustainability: a review of initiatives
47
reduction in congestion, see for complete report Allen et al. (2003). Other theoretical road pricing initiatives are reported by Taniguchi and Hata (2004) and Yamada and Taniguchi (2006). In these initiatives potential reactions of delivery companies, such as the use of pick up points, consolidated time-windows, and the use of a cooperative freight transport system are included. The impacts of the initiatives are evaluated on a test network. In these initiatives the authors assume the travel speed increases between 5% and 35% due to different pricing schemes. Taniguchi and Tamagawa (2006) report another theoretical road pricing initiative, in which the effect of different toll rates for an urban expressway are examined on toll revenue, transport costs, emissions, and resident complaints using a test network. In most initiatives the main idea of road pricing is to reduce congestion on a certain road at a certain time. Meyer (2006) discusses another theoretical initiative in which the use of priced freight-dedicated lanes is entirely optional. Freight vehicles can pay a fee to use the truck-only toll (TOT) lanes, the freeway network, with a lower expected travel speed, is still available at no costs for commercial vehicles. Regional network modelling with data estimating the 2030 situation in Atlanta, Georgia, shows that these truck-only toll (TOT) lanes result in more efficient goods distribution. Table 3.2 Road pricing initiatives’ most relevant elements
WHAT WHY WHO WHERE RESULTS
Refe
renc
e
Mai
n ac
tor
Seco
nd a
ctor
Reas
on se
cond
act
or
Initi
ator
Geo
grap
hica
l foc
us
Spat
ial s
carc
ity
Acce
ssib
ility
Envi
ronm
ent
Tran
spor
t effi
cien
cyEc
onom
ic d
evel
opm
ent
Soci
al su
ppor
tLo
gist
ics c
osts
Impl
emen
ted
in p
ract
ice
Allen, et al., 2004; Anderson, et al., 2005
Congestion charge Reduce congestion
Reduce emissions
Local authorities
Carrier Legislation Authorities Researcher
City (centre)
Yes + + No
Taniguchi and Hata, 2004
Road pricing Increase efficiency
Reduce emissions
Local authorities
Carrier Legislation Researcher Test network
Yes + - No
Baybars and Browne, 2004; Allen, 2006
Congestion charge Reduce congestion
Reduce emissions
Local authorities
Carrier Legislation Local authorities
City centre
Yes + + - + Yes
Holguin-Veras, et al., 2006
Road pricing (carriers' behaviour)
Reduce congestion
Local authorities
Carrier Economical Legislation
Researcher Region No + Yes
Meyer, 2006 Pay for dedicated infrastructure
Reduce congestion
Increase efficiency
Local authorities
Carrier Economical Researcher City No + + No
Taniguchi and Tamagawa, 2006
Reduce toll on highway
Reduce emissions
Increase liveability
Local authorities
Carrier Legislation Researcher Test network
Yes + + + + + No
Yamada and Taniguchi, 2006
Road pricing Increase efficiency
Local authorities
Carrier Legislation Researcher Test network
Yes + + No
Sust
aina
bilit
y is
sue
The example of a road pricing initiative that is implemented in practice is reported by Allen (2006a) and Baybars and Browne (2004): the London Congestion Charge System initiative. All vehicles entering the zone on workdays between 7:00 a.m. and 6:30 p.m. have to pay a charge. Automatic license plate recognition cameras at borders (and the key routes) of the zone enforce the congestion charge. The first results show a decrease in traffic volume (about 20%) and a reduction in delays (about 30%) in the charging zone. Finally, Holguin-Veras et al. (2006) evaluate the actual behaviour change of carriers due to a road pricing
62
Chapter 3
48
initiative in the New York and New Jersey region based on a survey. Holguin-Veras et al. (2006) argue road pricing is not successful for moving freight transport from peak to off-peak periods. The success mainly depends on the balance of power between the carrier and the receiver. If the carrier is most powerful, the carrier might simply charge the receiver extra. If the receiver is most powerful, the carrier has no other possibility than to continue delivering during peak hours without charging the receiver. Carriers can only deliver in an off-peak period if the receivers are willing to receive goods during these hours, which is currently more expensive than the charged fee. For-hire carriers are less sensitive to price-steering mechanisms, since they have less power in determining the time of arrival at receivers than private carriers. Road pricing initiatives – preliminary insights and discussion Pricing initiatives are initiated to reduce congestion and to reduce pollutant emissions (see Table 3.2). The results depend on the type of charge, the amount charged, the alternatives, and the enforcement. Except for Meyer (2006) the pricing initiatives presented in Table 3.2 all target on all traffic, i.e. both passenger and goods transport. Holguin-Veras et al. (2006) examine the carriers’ behaviour in a road pricing initiative. The reported increase in accessibility is mainly due to a decrease in passenger transport, since there is hardly a decrease in or a movement in time of urban freight transportation (Holguin-Veras et al., 2006). In most cases carriers do not change their behaviour, because of customer requirements, or the possibility to charge the receiver with the toll fee. Meyer (2006) introduces a pricing initiative that only focuses on urban freight transport, and that makes it possible to distinguish between different carriers. The truck-only toll lanes, a good instrument to keep urban areas accessible for freight transport, connect a fee to better accessibility. This is the only pricing initiative in which the carrier really has a choice, i.e. using the TOT-lane or the free network (Meyer, 2006). The other road pricing initiatives do not provide a reasonable alternative, next to paying the charge or to deliver in off-peak hours, which is usually not accepted by the receivers. Overall, the results of three initiatives show that pricing strategies have especially positive impacts on the accessibility of the city. Almost all initiatives show an increase in the overall transport efficiency due to changes in passenger transport (see Table 3.2). Enforcement, which does not delay traffic, such as the camera supervision in London, adds to likelihood of success (Allen, 2006a). Finally, in areas where congestion is mainly due to urban freight traffic, road pricing initiatives might not be the best policy measure to reduce it, due to the lack of available alternatives for urban freight transport. Next, social support for pricing initiatives is difficult to achieve; however it is likely to increase if the gains from pricing are used to improve alternatives, such as public transport, and if the congestion really decreases. Figure 3.1 shows the archetype road pricing initiative. This archetype is based on all reviewed road pricing initiatives. Table 3.2 shows some dimension values, others are only presented in the archetype, since these values are similar for the vast majority of initiatives. In this chapter, the archetype figures for all initiative types are based on the complete tables with all dimension values for all initiatives. We present only the most relevant and
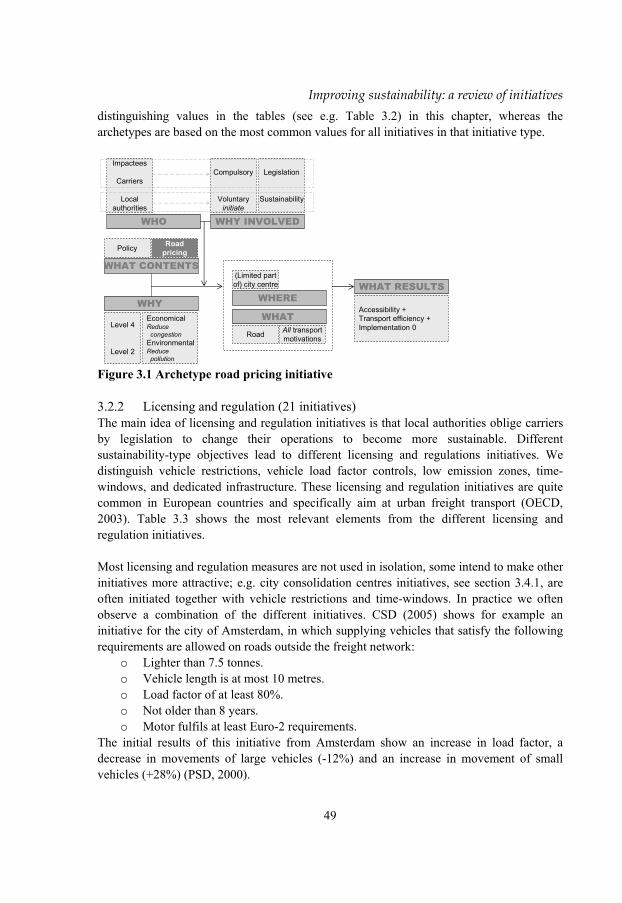
63
Improving sustainability: a review of initiatives
49
distinguishing values in the tables (see e.g. Table 3.2) in this chapter, whereas the archetypes are based on the most common values for all initiatives in that initiative type.
WHAT CONTENTS
WHY
WHY INVOLVEDWHO
WHAT RESULTS
WHAT
WHERE
Policy Roadpricing
Level 4
Level 2
EconomicalReducecongestion
EnvironmentalReducepollution
All transportmotivationsRoad
Accessibility +Transport efficiency +Implementation 0
(Limited partof) city centre
Impactees
Carriers
Localauthorities
Compulsory
Voluntaryinitiate
Legislation
Sustainability
Figure 3.1 Archetype road pricing initiative 3.2.2 Licensing and regulation (21 initiatives) The main idea of licensing and regulation initiatives is that local authorities oblige carriers by legislation to change their operations to become more sustainable. Different sustainability-type objectives lead to different licensing and regulations initiatives. We distinguish vehicle restrictions, vehicle load factor controls, low emission zones, time-windows, and dedicated infrastructure. These licensing and regulation initiatives are quite common in European countries and specifically aim at urban freight transport (OECD, 2003). Table 3.3 shows the most relevant elements from the different licensing and regulation initiatives. Most licensing and regulation measures are not used in isolation, some intend to make other initiatives more attractive; e.g. city consolidation centres initiatives, see section 3.4.1, are often initiated together with vehicle restrictions and time-windows. In practice we often observe a combination of the different initiatives. CSD (2005) shows for example an initiative for the city of Amsterdam, in which supplying vehicles that satisfy the following requirements are allowed on roads outside the freight network:
o Lighter than 7.5 tonnes. o Vehicle length is at most 10 metres. o Load factor of at least 80%. o Not older than 8 years. o Motor fulfils at least Euro-2 requirements.
The initial results of this initiative from Amsterdam show an increase in load factor, a decrease in movements of large vehicles (-12%) and an increase in movement of small vehicles (+28%) (PSD, 2000).
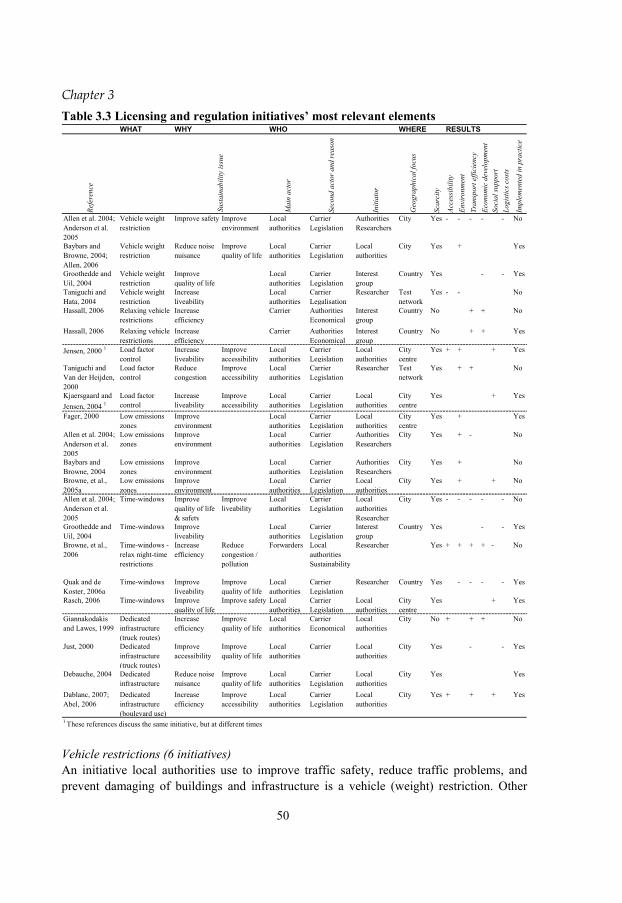
64
Chapter 3
50
Table 3.3 Licensing and regulation initiatives’ most relevant elements WHAT WHY WHO WHERE RESULTS
Refe
renc
e
Mai
n ac
tor
Seco
nd a
ctor
and
reas
on
Initi
ator
Geo
grap
hica
l foc
us
Scar
city
Acce
ssib
ility
Envi
ronm
ent
Tran
spor
t effi
cien
cyEc
onom
ic d
evel
opm
ent
Soci
al su
ppor
tLo
gist
ics c
osts
Impl
emen
ted
in p
ract
ice
Allen et al. 2004; Anderson et al. 2005
Vehicle weight restriction
Improve safety Improve environment
Local authorities
Carrier Legislation
Authorities Researchers
City Yes - - - - - No
Baybars and Browne, 2004; Allen, 2006
Vehicle weight restriction
Reduce noise nuisance
Improve quality of life
Local authorities
Carrier Legislation
Local authorities
City Yes + Yes
Groothedde and Uil, 2004
Vehicle weight restriction
Improve quality of life
Local authorities
Carrier Legislation
Interest group
Country Yes - - Yes
Taniguchi and Hata, 2004
Vehicle weight restriction
Increase liveability
Local authorities
Carrier Legalisation
Researcher Test network
Yes - - No
Hassall, 2006 Relaxing vehicle restrictions
Increase efficiency
Carrier Authorities Economical
Interest group
Country No + + No
Hassall, 2006 Relaxing vehicle restrictions
Increase efficiency
Carrier Authorities Economical
Interest group
Country No + + Yes
Jensen, 2000 1 Load factor control
Increase liveability
Improve accessibility
Local authorities
Carrier Legislation
Local authorities
City centre
Yes + + + Yes
Taniguchi and Van der Heijden, 2000
Load factor control
Reduce congestion
Improve accessibility
Local authorities
Carrier Legislation
Researcher Test network
Yes + + No
Kjaersgaard and Jensen, 2004 1
Load factor control
Increase liveability
Improve accessibility
Local authorities
Carrier Legislation
Local authorities
City centre
Yes + Yes
Fager, 2000 Low emissions zones
Improve environment
Local authorities
Carrier Legislation
Local authorities
City centre
Yes + Yes
Allen et al. 2004; Anderson et al. 2005
Low emissions zones
Improve environment
Local authorities
Carrier Legislation
Authorities Researchers
City Yes + - No
Baybars and Browne, 2004
Low emissions zones
Improve environment
Local authorities
Carrier Legislation
Authorities Researchers
City Yes + No
Browne, et al., 2005a
Low emissions zones
Improve environment
Local authorities
Carrier Legislation
Local authorities
City Yes + + No
Allen et al. 2004; Anderson et al. 2005
Time-windows Improve quality of life & safety
Improve liveability
Local authorities
Carrier Legislation
Local authorities Researcher
City Yes - - - - - No
Groothedde and Uil, 2004
Time-windows Improve liveability
Local authorities
Carrier Legislation
Interest group
Country Yes - - Yes
Browne, et al., 2006
Time-windows - relax night-time restrictions
Increase efficiency
Reduce congestion / pollution
Forwarders Local authorities Sustainability
Researcher Yes + + + + - No
Quak and de Koster, 2006a
Time-windows Improve liveability
Improve quality of life
Local authorities
Carrier Legislation
Researcher Country Yes - - - - Yes
Rasch, 2006 Time-windows Improve quality of life
Improve safety Local authorities
Carrier Legislation
Local authorities
City centre
Yes + Yes
Giannakodakis and Lawes, 1999
Dedicated infrastructure (truck routes)
Increase efficiency
Improve quality of life
Local authorities
Carrier Economical
Local authorities
City No + + + No
Just, 2000 Dedicated infrastructure (truck routes)
Improve accessibility
Improve quality of life
Local authorities
Carrier Local authorities
City Yes - - Yes
Debauche, 2004 Dedicated infrastructure
Reduce noise nuisance
Improve quality of life
Local authorities
Carrier Legislation
Local authorities
City Yes Yes
Dablanc, 2007; Abel, 2006
Dedicated infrastructure (boulevard use)
Increase efficiency
Improve accessibility
Local authorities
Carrier Legislation
Local authorities
City Yes + + + Yes
1 These references discuss the same initiative, but at different times
Sust
aina
bilit
y is
sue
Vehicle restrictions (6 initiatives) An initiative local authorities use to improve traffic safety, reduce traffic problems, and prevent damaging of buildings and infrastructure is a vehicle (weight) restriction. Other

65
Improving sustainability: a review of initiatives
51
objectives associated with vehicle restrictions are environmental improvement and an increase in quality of life by reducing nuisance considered to be caused by large vehicles. These restrictions force carriers to use smaller and / or less heavy vehicles to supply stores in the city. Allen et al. (2004) and Anderson et al. (2005) examine an artificial vehicle weight restriction initiative in three cities in the UK, based on the expected response of seven companies, see for complete report Allen et al. (2003). The objective is to reduce the number of large vehicles in the city that are responsible for social unsustainable impacts, such as intimidation, safety problems, vibration, and noise, by limiting access to the city centre for trucks heavier than a certain gross weight. The outcomes are company-dependent; obviously, companies using small vehicles are not affected, and companies using large vehicles face a considerable cost increase. Vehicle restrictions increase the amount of pollutant emissions. Vehicle restrictions, such as weight and length restrictions, are also evaluated by Groothedde and Uil (2004) who that find these restrictions increase costs for Dutch retail considerably. Another type of vehicle restriction is the London Lorry Control Scheme, also known as London Lorry Ban (Allen, 2006b; Baybars and Browne, 2004). This scheme restricts vehicles over 18 tonnes from using most roads in Greater London during evenings, nights and most times during weekends, in order to minimise noise nuisance. Taniguchi and Hata (2004) examine an artificial initiative; a large truck ban for vehicles heavier than 4 tonnes on a test network. Taniguchi and Hata (2004) examine possible counter reactions of delivery companies on these vehicle restrictions, such as the use of pick up points, consolidated time-windows, and the use of a cooperative freight transport system. A related initiative is relaxing the current vehicle restrictions; Hassall (2006) examines what happens if vehicle restrictions are relaxed in Australia. In one case study he discusses the effect of the introduction of the B-Double truck on the urban context, which was only possible after relaxing the current vehicle regulation. In another case study he discusses changes in vehicle restrictions, in which vehicle weight and dimension regulations no longer apply in case a vehicle fulfils a set of vehicle performance criteria, e.g. on vehicle controllability. Vehicle load factor controls (2 initiatives) Local authorities mainly use vehicle load factor controls to improve the accessibility and the liveability in urban areas. The main objective of enforcing a high load factor is to decrease the number of vehicles entering the city centre due to stimulating consolidation outside the city centre in order to increase vehicle utilisation. Jensen (2000) and Kjaersgaard and Jensen (2004) report such an initiative from Copenhagen, in which heavy vehicles need a certificate to enter the (medieval) city centre. This certificate is granted for those carriers that utilise on average 60% of their vehicle capacity and that use vehicles with engines younger than 8 years. Jensen (2000) presents expected results (see Table 3.3), which are not confirmed by Kjaersgaard and Jensen (2004). Taniguchi and Van der Heijden

66
Chapter 3
52
(2000) examine the financial and environmental impacts of different load factor controls between 0.35 and 0.4, for pick up and delivery activities on a test network. Low emission zones (4 initiatives) Local authorities use low emission zones (LEZ) initiatives to improve the air quality by excluding pollutant vehicles. The idea is to allow only vehicles that fulfil engine requirements in the low emission zone. Allen et al. (2004) and Anderson et al. (2005) find in an artificial initiative that LEZ have a positive effect on the local environment. Baybars and Browne (2004) discuss a feasibility study on a low emission zone in London (see for complete report Watkiss et al. (2003) and more information http://www.tfl.gov.uk/tfl/low-emission-zone). Such a LEZ initiative would lead to considerable pollution decreases, especially if the zone contains the Greater London area and also includes coaches and buses next to the heavy lorries. Browne et al. (2005a) show that companies with larger fleets are affected less by LEZ than smaller companies; companies with large fleets have shorter vehicle replacement cycles and it is easier for these companies to redeploy the more pollutant vehicles to non LEZ areas. In case more areas than London were to use LEZ, the costs for carriers would increase. Overall, there is widespread support for a low emission zone in London (Browne et al., 2005a). Next to these British initiatives, Fager (2000) reports on environmental zones in Stockholm. In this initiative, also implemented in Göteborg and Malmö, vehicles need special ‘environmental class stickers’ to enter the low emission zone. The use of this low emission zone has led to a serious reduction of local pollutants (particulates 10-15%, hydrocarbons 5-10% and NOx 1-8%). Local authorities can combine licensing and regulation initiatives, see e.g. Jensen (2000) and Kjaersgaard and Jensen (2004) who present an initiative that combines low emission zone-aspects and vehicle load factor controls. Table 3.3 shows that most LEZ initiatives are not implemented in practice. This is changing though; e.g. in London an LEZ initiative commences in 2008. Utrecht was the first Dutch city to start a LEZ initiative in 2007. Other Dutch cities will follow in the coming years (see covenant to stimulate clean trucks in cities in section 1.3). Time-windows (5 initiatives) Local authorities use time-windows, or time-access restrictions, to improve social sustainability issues, such as the attractiveness of a city centre by reducing inconvenience caused by large trucks, at times many people are in the cities. Inconvenience can vary from noise, visual intrusion, safety concerns, etc. Allen et al. (2004) and Anderson et al. (2005) find in an artificial initiative that time-windows would result in an increase in vehicle roundtrips and kilometres for distributing companies, and that it would result in extra pollutant emissions. They argue that the impacts of time-windows might be lower, if distribution activities take place during the night. However, the increase in travel speed during the night should outweigh extra costs such as higher drivers’ wages, noise nuisance, and the ability and willingness to receive goods during nights. Browne et al. (2006) review literature on night-time delivery restrictions. Some studies in this review show considerable cost increases for retailers due to night-time restrictions. Relaxing night-time delivery restrictions has negative impacts for residents due to noise nuisance and disturbance by

67
Improving sustainability: a review of initiatives
53
lights. On the other hand it has positive impacts for retailers, i.e. lower distribution costs, although investments in noise abatement of equipment might increase costs first, and higher journey reliability, for shoppers, i.e. improved goods availability in early mornings, for residents, i.e. less pollution and less traffic during day, and for other road users, i.e. less large vehicles. Groothedde and Uil (2004) find that current time-window restrictions increase cost for Dutch retail yearly by € 270 million. Quak and de Koster (2006a) demonstrate the financial and environmental impact of varying time-window pressure on different Dutch retail chains. This is discussed in depth in chapters 4 and 5. Rasch (2006) discusses a time-window initiative in the city of Enschede and the enforcement by a bollard system with vehicle identification by video. This access restriction, for all traffic, creates a pleasant city and shopping environment. Time-windows regulations are quite inefficient if enforcement is lacking. Next to explicit time-window regulations, many (European) cities also have access restrictions for large vehicles during the nights. Dedicated infrastructure (4 initiatives) Local authorities usually restrict routes for trucks in dedicated infrastructure initiatives, resulting in a freight network. The main idea to oblige vehicles to use specific routes is to increase traffic safety and quality of life in an urban area, optimise journeys for goods vehicles, or to preserve infrastructure that was not designed for heavy vehicles. Debauche (2004) discusses an initiative to establish dedicated truck routes in Brussels. In this initiative mandatory corridors for heavy vehicles are proposed and residential areas are restricted for large trucks. Signalling, so that drivers know what the dedicated routes are, and enforcement are important. An advantage of dedicated infrastructure is that investments for freight transportation are only needed on a limited part of the infrastructure network. Giannakodakis and Lawes (1999) discuss the design of a freight network for the city of Adelaide. Freight routes are here used to optimise the mobility during peak periods, so that the operations can be performed safe and efficient. A similar initiative is undertaken in the city of Bremen (Just, 2000). Truck routes are voluntary in the first stage of the initiative. Just (2000) estimates that using the freight routes would result in an increase of both trip length and travelled time. In a second stage the routes might become mandatory. Abel (2006) and Dablanc (2007) discuss an innovative organisation of infrastructure usage in Barcelona. Two lanes on some of its main boulevards are dedicated for traffic in the peak hours, in the off peak hours they are used for making deliveries, and during the nights these lanes are dedicated to the residents who may park there, see also Geroliminis and Daganzo (2006). Another example of a dedicated infrastructure project, in line with the one discussed from Barcelona, is the use of bus lanes by urban freight transport vehicles (PSD, 2002a). Important is that supplying vehicles do not hinder public transport. Finally, the truck-only toll lanes in Atlanta, discussed in section 3.2.1 offer the advantages of dedicated freight lanes for a certain toll (Meyer, 2006). Licensing and regulation initiatives – preliminary insights and discussion Some of these initiatives, such as time-windows and vehicle restrictions have been used by municipalities for over twenty years (Dablanc, 2007). These restrictions do not take into
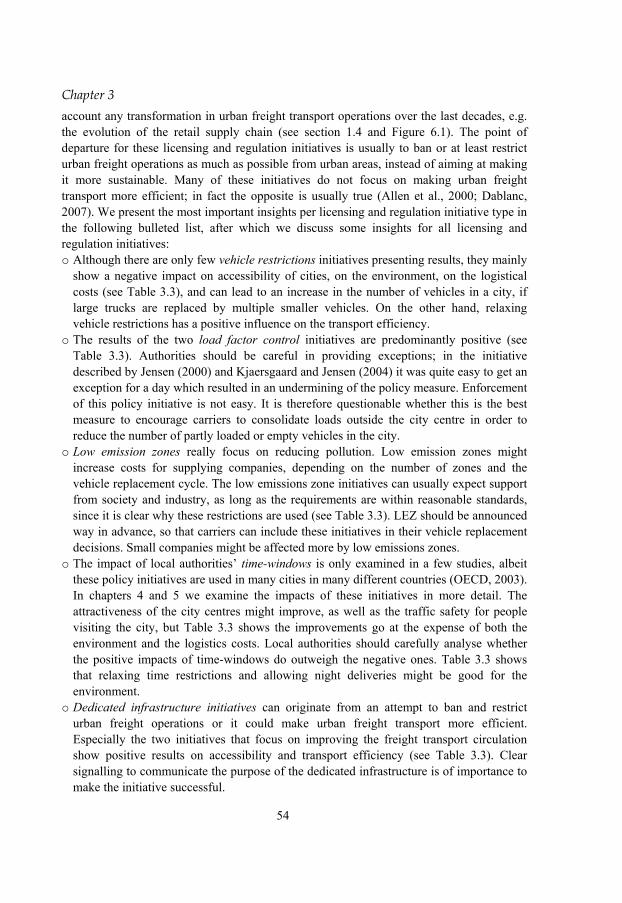
68
Chapter 3
54
account any transformation in urban freight transport operations over the last decades, e.g. the evolution of the retail supply chain (see section 1.4 and Figure 6.1). The point of departure for these licensing and regulation initiatives is usually to ban or at least restrict urban freight operations as much as possible from urban areas, instead of aiming at making it more sustainable. Many of these initiatives do not focus on making urban freight transport more efficient; in fact the opposite is usually true (Allen et al., 2000; Dablanc, 2007). We present the most important insights per licensing and regulation initiative type in the following bulleted list, after which we discuss some insights for all licensing and regulation initiatives: o Although there are only few vehicle restrictions initiatives presenting results, they mainly
show a negative impact on accessibility of cities, on the environment, on the logistical costs (see Table 3.3), and can lead to an increase in the number of vehicles in a city, if large trucks are replaced by multiple smaller vehicles. On the other hand, relaxing vehicle restrictions has a positive influence on the transport efficiency.
o The results of the two load factor control initiatives are predominantly positive (see Table 3.3). Authorities should be careful in providing exceptions; in the initiative described by Jensen (2000) and Kjaersgaard and Jensen (2004) it was quite easy to get an exception for a day which resulted in an undermining of the policy measure. Enforcement of this policy initiative is not easy. It is therefore questionable whether this is the best measure to encourage carriers to consolidate loads outside the city centre in order to reduce the number of partly loaded or empty vehicles in the city.
o Low emission zones really focus on reducing pollution. Low emission zones might increase costs for supplying companies, depending on the number of zones and the vehicle replacement cycle. The low emissions zone initiatives can usually expect support from society and industry, as long as the requirements are within reasonable standards, since it is clear why these restrictions are used (see Table 3.3). LEZ should be announced way in advance, so that carriers can include these initiatives in their vehicle replacement decisions. Small companies might be affected more by low emissions zones.
o The impact of local authorities’ time-windows is only examined in a few studies, albeit these policy initiatives are used in many cities in many different countries (OECD, 2003). In chapters 4 and 5 we examine the impacts of these initiatives in more detail. The attractiveness of the city centres might improve, as well as the traffic safety for people visiting the city, but Table 3.3 shows the improvements go at the expense of both the environment and the logistics costs. Local authorities should carefully analyse whether the positive impacts of time-windows do outweigh the negative ones. Table 3.3 shows that relaxing time restrictions and allowing night deliveries might be good for the environment.
o Dedicated infrastructure initiatives can originate from an attempt to ban and restrict urban freight operations or it could make urban freight transport more efficient. Especially the two initiatives that focus on improving the freight transport circulation show positive results on accessibility and transport efficiency (see Table 3.3). Clear signalling to communicate the purpose of the dedicated infrastructure is of importance to make the initiative successful.

69
Improving sustainability: a review of initiatives
55
Two important points apply to all licensing and regulation initiatives: • Enforcement. One of the most important enablers for the success of these initiatives is
enforcement and the ease of enforcement. For load factor control initiatives enforcement is quite difficult in contrast to other licensing and regulation initiatives, which could be a barrier for successful implementation. Enforcement is necessary, especially in the initiatives that focus on restricting operations, to make sure carriers actually change their behaviour.
• Harmonisation. Although many regulations are very local, as is their focus, it is of importance to harmonise the regulations between cities. For example, different LEZ initiatives should use the same vehicle emission requirements; otherwise carriers need a specific vehicle for each city. This applies to all licensing and regulation initiatives. To prevent extra and unnecessary costs for carriers, local authorities should gear their requirements to one another. There could be a role for higher governments to provide a national framework. This actor group is currently not involved in licensing and regulation initiatives.
Figure 3.2 shows the archetype licensing and regulation initiative based on the initiatives (see Table 3.3) that are reviewed using the framework.
WHAT CONTENTS
WHY
WHY INVOLVEDWHO
WHAT RESULTS
WHAT
WHERE
Policy Licensing& regulation
Core & non-core goodsRoad
Logistics costs -Ease of implementation +
City Spatialscarcity
City typehistorical HOW
Empirical modelQuantitative empirical
Level 4
Level 2
SocialImprove liveability
& quality of lifeEnvironmentalReduce
pollution
Carriers
Localauthorities
Compulsory
Voluntaryinitiate
Legislation
Sustainability
Figure 3.2 Archetype licensing and regulation initiative 3.2.3 Parking and unloading (8 initiatives) Parking and unloading initiatives focus on two kinds of related problems; problems caused by a shortage of available unloading areas and accessibility problems that are caused by (un)loading vehicles. In order to reduce the number of illegally parked (un)loading vehicles, Ishida et al. (2006) examine two initiatives that create shared space for unloading in the Akihabara district (part of Tokyo). In the first experiment several off-road parking areas are created. The second experiment reserves some on-street unloading areas. The experiment shows that the majority of freight carriers are willing to use the special parking areas, even if they have to
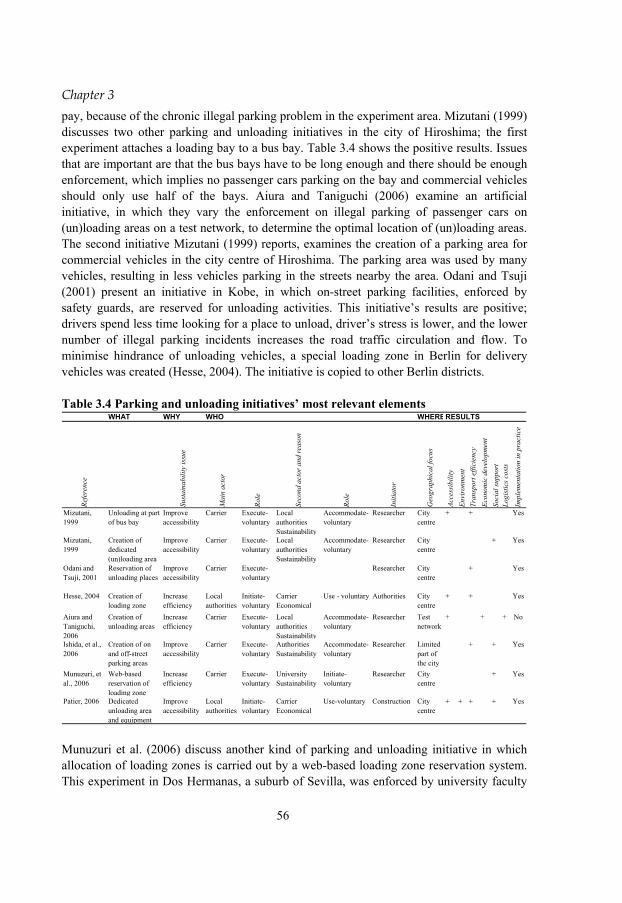
70
Chapter 3
56
pay, because of the chronic illegal parking problem in the experiment area. Mizutani (1999) discusses two other parking and unloading initiatives in the city of Hiroshima; the first experiment attaches a loading bay to a bus bay. Table 3.4 shows the positive results. Issues that are important are that the bus bays have to be long enough and there should be enough enforcement, which implies no passenger cars parking on the bay and commercial vehicles should only use half of the bays. Aiura and Taniguchi (2006) examine an artificial initiative, in which they vary the enforcement on illegal parking of passenger cars on (un)loading areas on a test network, to determine the optimal location of (un)loading areas. The second initiative Mizutani (1999) reports, examines the creation of a parking area for commercial vehicles in the city centre of Hiroshima. The parking area was used by many vehicles, resulting in less vehicles parking in the streets nearby the area. Odani and Tsuji (2001) present an initiative in Kobe, in which on-street parking facilities, enforced by safety guards, are reserved for unloading activities. This initiative’s results are positive; drivers spend less time looking for a place to unload, driver’s stress is lower, and the lower number of illegal parking incidents increases the road traffic circulation and flow. To minimise hindrance of unloading vehicles, a special loading zone in Berlin for delivery vehicles was created (Hesse, 2004). The initiative is copied to other Berlin districts. Table 3.4 Parking and unloading initiatives’ most relevant elements
WHAT WHY WHO WHERERESULTS
Refe
renc
e
Sust
aina
bilit
y is
sue
Mai
n ac
tor
Role
Seco
nd a
ctor
and
reas
on
Role
Initi
ator
Geo
grap
hica
l foc
us
Acce
ssib
ility
Envi
ronm
ent
Tran
spor
t effi
cien
cyEc
onom
ic d
evel
opm
ent
Soci
al su
ppor
tLo
gist
ics c
osts
Impl
emen
tatio
n in
pra
ctic
eMizutani, 1999
Unloading at part of bus bay
Improve accessibility
Carrier Execute-voluntary
Local authorities Sustainability
Accommodate-voluntary
Researcher City centre
+ + Yes
Mizutani, 1999
Creation of dedicated (un)loading area
Improve accessibility
Carrier Execute-voluntary
Local authorities Sustainability
Accommodate-voluntary
Researcher City centre
+ Yes
Odani and Tsuji, 2001
Reservation of unloading places
Improve accessibility
Carrier Execute-voluntary
Researcher City centre
+ Yes
Hesse, 2004 Creation of loading zone
Increase efficiency
Local authorities
Initiate-voluntary
Carrier Economical
Use - voluntary Authorities City centre
+ + Yes
Aiura and Taniguchi, 2006
Creation of unloading areas
Increase efficiency
Carrier Execute-voluntary
Local authorities Sustainability
Accommodate-voluntary
Researcher Test network
+ + + No
Ishida, et al., 2006
Creation of on and off-street parking areas
Improve accessibility
Carrier Execute-voluntary
Authorities Sustainability
Accommodate-voluntary
Researcher Limited part of the city
+ + Yes
Munuzuri, et al., 2006
Web-based reservation of loading zone
Increase efficiency
Carrier Execute-voluntary
University Sustainability
Initiate-voluntary
Researcher City centre
+ Yes
Patier, 2006 Dedicated unloading area and equipment
Improve accessibility
Local authorities
Initiate-voluntary
Carrier Economical
Use-voluntary Construction City centre
+ + + + Yes
Munuzuri et al. (2006) discuss another kind of parking and unloading initiative in which allocation of loading zones is carried out by a web-based loading zone reservation system. This experiment in Dos Hermanas, a suburb of Sevilla, was enforced by university faculty

71
Improving sustainability: a review of initiatives
57
and focused on less-than-truckload (LTL) carriers. The system in itself is feasible, but carriers are not willing to pay for it. Besides, it only works if there is sufficient enforcement of both the system, and of the other regulations, i.e. time-windows and illegal parking. Another initiative originates from the temporarily not accessibility of the city centre of Bordeaux, because of the construction of a tramway (Patier, 2006). Therefore, delivering vehicles could park just outside the centre, where two delivery-workers were available to help unloading the vehicles. At this site, handling equipment, such as a trolley, is at the driver’s deposal to make the final delivery by foot. The system proved to be efficient for its users. Because of its success other parts of Bordeaux already use the system and it is going to be used in a larger area when the tramway construction is completed. Parking and unloading initiatives – preliminary insights and discussion Initiatives on parking and unloading activities are usually quite easy to implement on the short term at limited expenses. It is therefore not surprising that most initiatives are implemented in reality (see Table 3.4). The main reason to initiate parking and unloading initiatives is to reduce congestion. Carriers are involved on a voluntary basis since it solves problems they face. Local authorities are responsible for making the changes in parking and unloading areas. Six out of the eight initiatives reviewed in this section are initiated by researchers. These initiatives are especially useful for historical city centres in countries suffering from spatial scarcity.
WHAT CONTENTS
WHY
WHY INVOLVEDWHO
HOW
WHAT RESULTS
WHAT
WHERE
Policy Parking &unloading
Core & non-core goodsRoad
Accessibility +Ease of implementation +
City centre Spatialscarcity
Level 4 EconomicalImprove
accessibilityImprove
efficiency
City typehistorical
Quantitative empirical
Carriers
Localauthorities
Voluntaryexecute
Voluntaryaccommodate
Economical
Sustainability
Figure 3.3 Archetype parking and unloading initiative The overall sustainability impacts might be quite low. Only those cities that face problems due to vehicles that are actually unloading e.g. illegal parking, congestion due to on-street unloading of vehicles, extra vehicle kilometres because of drivers making rounds to find suitable parking areas, should consider these types of initiatives. The initiatives discussed in this section show some interesting lessons. First of all, enforcement is important again. Especially initiatives that aim at reducing illegal parking of freight trucks only succeed if passenger vehicles do not park at the unloading areas. Enforcement to prevent freight

72
Chapter 3
58
vehicles from double parking is also necessary to make sure the initiative’s alternative is used. Without enforcement the initiative is doomed to make no difference. Many actors respond positively to this type of initiatives, because the results are directly visible, see also the positive social support in Table 3.4. Depending on the geographical characteristics of a city, possibilities are to use parts of bus bays, dedicated areas, or other areas that serve the purpose and are available in the city centre. Reservation systems might be useful in cases there are no areas available, or if some groups have difficulties to use the available areas, see Munuzuri et al. (2006) and Odani and Tsuji (2001). Figure 3.3 shows the archetype of parking and unloading initiatives that follows from reviewing all initiatives (see also Table 3.4) by means of the framework. 3.3 Company driven initiatives Company driven initiatives have in common that the initiator is a private company. Sustainability improvement is in some initiatives more a by-product than the main objective, which is usually more economic. First we discuss 12 initiatives on carrier cooperation, in the following section we discuss 14 initiatives that focus on improving sustainability by vehicle routing improvement initiatives, and section 3.3.3 shows 5 initiatives focusing on improving sustainability by technological vehicle innovations. 3.3.1 Carrier cooperation (12 initiatives) The main idea of carrier cooperation initiatives, requiring cooperation between different, usually competitive companies, is to increase efficiency in order to improve city-accessibility, reduce congestion, and reduce pollution. These initiatives usually aim at pick up and delivery operations within cities. Private companies have an economic incentive to cooperate, i.e. to increase the efficiency of their operations. Different carriers can cooperate by consolidating goods, or by using a neutral carrier, to prevent two half filled vehicles visiting the same area of a town. After all, one full truck instead of two half full trucks results in a decrease in the total number of kilometres. Most of the studies on cooperation are initiated by Japanese researchers, whereas the carrier is expected to be the main actor that actually cooperates with its competitors (see Table 3.5). Only few of the carrier cooperation initiatives have actually been implemented: an exception is the initiative in the German city Kassel. One neutral carrier collects goods two times a day from 10 cooperating carriers and combines these in roundtrips that go into the city (Koehler, 1999; 2001). This neutral carrier was paid for by the other ten carriers. The many stakeholders in this initiative met regularly at a round-table consultation. Although the first results were positive, the actual economic effects and the effects on traffic were marginal (Koehler, 2001; 2004) and after a while the interest in the experiment declined. Nemoto (2004) designs an Internet matching system to make the cooperative system work in practice. However, only a limited number of shippers used the system, so there are no significant results from this initiative. The system closely relates to the transport auction

73
Improving sustainability: a review of initiatives
59
initiatives (section 3.5.1). Yoshimoto (2004) discusses web-based transport exchange systems to increase cooperation. However, these systems are currently not used on a large scale. Ieda et al. (2001) explain causes for the lack of carrier cooperation in practice, using a game theoretical approach. They find that the social reputation of a carrier is one of the most important motivations to cooperate. Carriers only cooperate when it really contributes to improvements of traffic and environmental conditions. Takahashi et al. (2004) examine an initiative with a public transhipment centre from where potential cooperation can continue. The carriers joining the actual initiative eventually only delivered a small percentage of their goods using the cooperative delivery system. Next, Takahashi et al. (2004) assume complete cooperation of carriers in a simulation analysis. The simulation results show an increase in vehicles’ load factor, reduction in working time and reduction in pollutant emissions. Table 3.5 Carrier cooperation initiatives’ most relevant elements
WHAT WHY WHO RESULTS
Refe
renc
e
Mai
n ac
tor
Seco
nd a
ctor
and
reas
on
Initi
ator
Acce
ssib
ility
Envi
ronm
ent
Tran
spor
t effi
cien
cy
Econ
omic
dev
elop
men
t
Soci
al su
ppor
t
Logi
stic
s cos
ts
Impl
emen
tatio
n in
pra
ctic
e
Koehler, 1999; 2001 Cooperation (one neutral carrier)
Increase efficiency
Reduce congestion
Carrier Many together
+ + - Yes
Yamada, et al., 1999 Cooperative freight transport system
Reduce emissions
Decrease societal nuisance
Shipper Carrier
Researcher + + No
Taniguchi and Van der Heijden, 2000
Cooperative freight transport system
Reduce emissions
Reduce congestion
Carrier Researcher + + + + No
Ieda, et al., 2001 Multi carrier joint delivery system
Reduce congestion
Reduce emissions
Carrier Researcher + + No
Yamada, et al., 2001 Cooperative freight transport system
Economic incentive
Reduce emissions
Carrier Researcher + + - No
Ljungberg and Gebresenbet, 2004
Coordinated goods distribution
Increase efficiency
Reduce pollutant and congestion
Researcher Carriers Economical
Researcher + + + No
Nemoto, 2004 Cooperative freight transport system (web-based)
Reduce congestion
Increase efficiency
Shipper Carrier Economical
Researcher + - + Yes
Takahashi, et al., 2004
Cooperative freight transport system
Reduce congestion
Decrease emissions
Carrier Local authorities Sustainability
Many together
+ + Yes
Yamada and Taniguchi, 2004
Cooperative freight transport system
Reduce congestion
Decrease emissions
Carrier Society Sustainability
Researcher + + - No
Yoshimoto, 2004 Cooperative web-based system
Increase efficiency
Shipper Carrier
Researcher +- No
Qureshi and Hanaoka, 2006
Cooperative delivery system
Increase efficiency
Reduce emissions
Carrier Local authorities Sustainability
Local authorities
+ + + No
Yamada and Taniguchi, 2006
Cooperative freight transport system
Increase efficiency
Reduce pollutant and congestion
Carrier Society Sustainability
Researcher + + No
Sust
aina
bilit
y is
sue
Most other carrier cooperation initiatives in this review are also examined in an artificial setting. Ljungberg and Gebresenbet (2004) notice the current distribution operations in Uppsala are inefficient. A coordinated goods distribution system might result in more efficient deliveries for retail and transport operators, an improvement in vehicle utilisation,

74
Chapter 3
60
and an improvement of both the current traffic conditions as well as the environmental conditions. Taniguchi and Van der Heijden (2000) estimate the impact of two carriers sharing customers on a test network, so that they both only pick up and deliver in one neighbourhood, instead of the base scenario in which they both deliver and pick up in both neighbourhoods. Yamada and Taniguchi (2004) and Yamada et al. (2001) use a computer simulation to examine several types of cooperation between eight carriers, who are not only able to cooperate but also to share a logistics terminal. Yamada and Taniguchi (2006) examine the impacts of a co-operative freight system with road pricing and the use of advanced vehicle routing and scheduling systems. Qureshi and Hanaoka (2006) discuss three theoretical cooperative delivery systems in Bangkok in which allocation occurs from a common consolidation centre to the participating carriers. Carrier cooperation initiatives – preliminary insights and discussion Nine of the initiatives in Table 3.5 are initiated by researchers and, except for one, are not implemented in practice. These initiatives expect the carriers to initiate the cooperation on a voluntary basis. However, the logistics costs for these carriers rise in three initiatives, whereas only two initiatives show a drop in these costs (see Table 3.5). Two implemented initiatives (see Nemoto, 2004; Takahashi et al., 2004) suffer from a limited number of participants. A real incentive for carriers to cooperate is lacking, except for the company’s social and environmental reputation. The other initiative that was implemented in practice (see Table 3.5) is presented by Koehler (1999; 2001; 2004). This initiative came to an end, due to lack of continuing carrier-interest, after some initial successes. This is the only initiative in Table 3.5 from which results are reported for a longer period in time. We learn from this initiative to be careful with the initial results of an initiative; the risk exists that the results are positively biased due to the short period the initiative runs. As far as results are reported (see Table 3.5) they show that carrier cooperation initiatives have positive impacts on the accessibility of cities, on the environment, and on the transport efficiency. Basically, we conclude that cooperation in the final delivery theoretically proves to be successful, but that in practice there are some major barriers for it to succeed. First, willingness to cooperate with a competitor and to share valuable information is lacking. Especially in case drivers are also salespersons, the willingness to cooperate with competitors is quite low. To make it more likely for these initiatives to succeed, some potential success factors are: make sure companies do not loose their identity (Ieda et al., 2001; Qureshi and Hanaoka, 2006), include total social costs (Nemoto, 2004), financial support from the public sector (Yamada et al., 2001), include all relevant parties in, for example, roundtable discussions (Koehler, 1999), make all gains clearly visible (Koehler, 2001), and appeal to the carrier’s environmental and social reputation (Ieda et al., 2001). Yamada et al. (1999) conclude public freight terminals play an important role for successful cooperation. This kind of cooperation is more radical; therefore we discuss the cooperation in combination with shared consolidation centres in section 3.4.1.
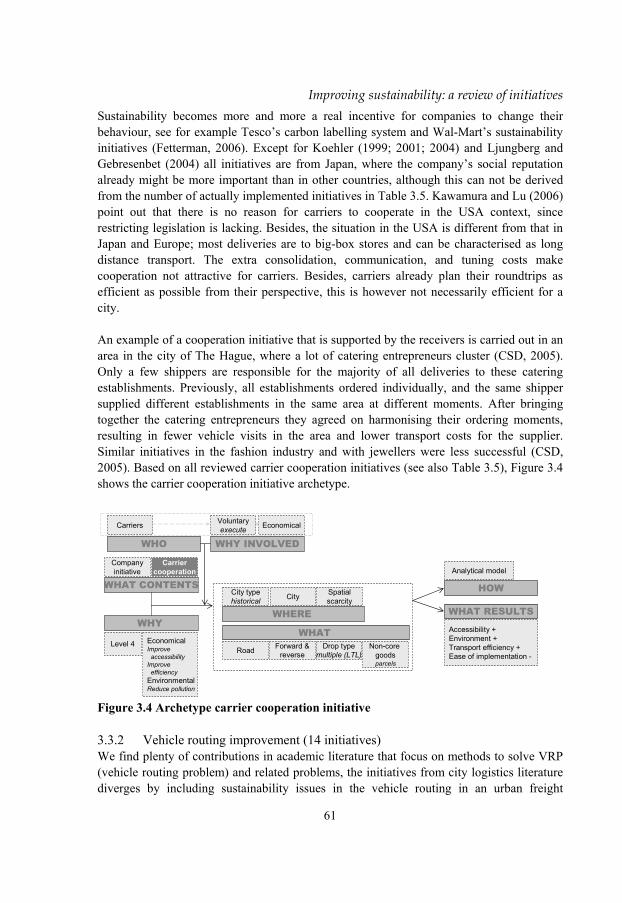
75
Improving sustainability: a review of initiatives
61
Sustainability becomes more and more a real incentive for companies to change their behaviour, see for example Tesco’s carbon labelling system and Wal-Mart’s sustainability initiatives (Fetterman, 2006). Except for Koehler (1999; 2001; 2004) and Ljungberg and Gebresenbet (2004) all initiatives are from Japan, where the company’s social reputation already might be more important than in other countries, although this can not be derived from the number of actually implemented initiatives in Table 3.5. Kawamura and Lu (2006) point out that there is no reason for carriers to cooperate in the USA context, since restricting legislation is lacking. Besides, the situation in the USA is different from that in Japan and Europe; most deliveries are to big-box stores and can be characterised as long distance transport. The extra consolidation, communication, and tuning costs make cooperation not attractive for carriers. Besides, carriers already plan their roundtrips as efficient as possible from their perspective, this is however not necessarily efficient for a city. An example of a cooperation initiative that is supported by the receivers is carried out in an area in the city of The Hague, where a lot of catering entrepreneurs cluster (CSD, 2005). Only a few shippers are responsible for the majority of all deliveries to these catering establishments. Previously, all establishments ordered individually, and the same shipper supplied different establishments in the same area at different moments. After bringing together the catering entrepreneurs they agreed on harmonising their ordering moments, resulting in fewer vehicle visits in the area and lower transport costs for the supplier. Similar initiatives in the fashion industry and with jewellers were less successful (CSD, 2005). Based on all reviewed carrier cooperation initiatives (see also Table 3.5), Figure 3.4 shows the carrier cooperation initiative archetype.
WHAT CONTENTS
WHY
WHY INVOLVEDWHO
HOW
WHAT RESULTS
WHAT
WHERE
VoluntaryexecuteCarriers
Companyinitiative
Carriercooperation
Economical
Analytical model
Forward &reverse
Drop typemultiple (LTL)Road
SpatialscarcityCity
Accessibility +Environment +Transport efficiency +Ease of implementation -
Non-core goodsparcels
Level 4 EconomicalImprove
accessibilityImprove
efficiencyEnvironmentalReduce pollution
City typehistorical
Figure 3.4 Archetype carrier cooperation initiative 3.3.2 Vehicle routing improvement (14 initiatives) We find plenty of contributions in academic literature that focus on methods to solve VRP (vehicle routing problem) and related problems, the initiatives from city logistics literature diverges by including sustainability issues in the vehicle routing in an urban freight

76
Chapter 3
62
transport context. The vehicle routing improvement initiatives result from the difference between the operational vehicle roundtrip planning made beforehand and the dynamic reality in which the actual operations are carried out. Currently, especially congestion, leads to infeasibilities in executing the plan. The idea of a planning that incorporates real-life problems better is that this would result in less kilometres and penalty costs. This would definitely have positive impacts on carriers’ costs and the environment. The reported initiatives in Table 3.6 have in common that they are not implemented in practice. Obviously, the use of vehicle routing software itself is quite common in practice. Table 3.6 Vehicle routing improvement initiatives’ most relevant elements
WHAT WHY WHO WHERE RESULTS
Refe
renc
e
Mai
n ac
tor
Role
Initi
ator
Scar
city
Acce
ssib
ility
Envi
ronm
ent
Tran
spor
t effi
cien
cyEc
onom
ic d
evel
opm
ent
Logi
stic
s cos
ts
Impl
emen
tatio
n in
pra
ctic
e
Taniguchi, et al., 1999
VRPTW improvement - include travel time variability
Economic Carrier Executing-voluntary
Researcher Yes + No
Thompson and Taniguchi, 1999
VRPTW improvement - include travel time variability
Economic Carrier Executing-voluntary
Researcher No + No
Taniguchi and Van der Heijden, 2000
Use of AVRSS Reduce pollution
Reduce congestion
Carrier Executing-voluntary
Researcher Yes + + + + No
Taniguchi, et al., 2001b
VRPTW improvement - include travel time variability
Economic Reduce pollution
Carrier Executing-voluntary
Researcher Yes + + + + No
Taniguchi, et al., 2001a
VRPTW improvement - include travel time variability
Economic Carrier Executing-voluntary
Yes + + + No
Thompson, et al., 2001
VRPTW improvement - include travel time variability
Economic Carrier Executing-voluntary
Researcher No + No
Hassall, 2004 Network improvement Reduce fuel consumption
Increase efficiency
Carrier Executing-voluntary
No + + Yes
Marquez, et al., 2004 Increase vehicle load factor Reduce pollution
Carrier Executing-voluntary
Researcher No + + No
Yamada, et al., 2004 VRPTW improvement - cost reliability road network
Economic Carrier Executing-voluntary
Researcher Yes + No
Taniguchi and Shimamoto, 2004
VRPTW improvement - include travel time variability
Reduce congestion
Reduce pollution
Carrier Executing-voluntary
Researcher Yes + + + No
Ando and Taniguchi, 2006
VRPTW improvement - include travel time variability
Economic Increase efficiency
Carrier Executing-voluntary
Researcher Yes + + No
Hassall, 2006 Network improvement Economic Increase efficiency
Shipper/ Carrier
Initiator-voluntary
No + + Yes
Wild and Gluecker, 2006
VRPTW improvement - real time traffic information
Economic Increase efficiency
Carrier Executing-voluntary
Researcher Yes + No
Yamada and Taniguchi, 2006
Use of AVRSS Economic Increase efficiency
Carrier Initiator-voluntary
Yes + + No
Susta
inab
ility
issu
es
Most of these initiatives extend the traditional VRPTW (Vehicle Routing Problem with Time Windows) by including an extra dimension to reflect reality in urban areas better. Taniguchi et al. (1999b) and Thompson and Taniguchi (1999) include variable travel times in their method to solve the VRPTW. This probabilistic model performs better in congested areas. Taniguchi et al. (2001c) include real-time and forecasted travel times in the probabilistic model. Taniguchi and Ando (2006) introduce probe vehicle data of travel times in the model. Yamada et al. (2004) focus on the cost reliability of the road network. Thompson (2004) presents another method that deals with uncertainty of travel times based on the time between a carrier arriving at a customer and the end of the time-window.

77
Improving sustainability: a review of initiatives
63
Taniguchi and Van der Heijden (2000) examine the impact of different penetration rates of an Advanced Vehicle Routing and Scheduling System (AVRSS) among carriers on the road traffic. Yamada and Taniguchi (2006) examine the impact of different schemes, in which carriers use an AVRSS. Taniguchi et al. (2001a) and Taniguchi and Shimamoto (2004) include real time information on the variable travel times in their dynamic vehicle routing and scheduling model. Wild and Gluecker (2006) present a planning solution that includes traffic information in both the planning and execution phase of the roundtrip planning. Next to improving the operational routing, it is also possible to become more efficient by improving the distribution structure, e.g. the type of network used to deliver goods. Hassall, (2004; 2006) discusses the sustainable impacts of restructuring the distribution network of the Australian Postal Corporation. Marquez et al. (2004) discuss the results of an initiative in which they examine the impact of routing improvement by increasing load factors in a controlled setting. Vehicle routing improvement initiatives – preliminary insights and discussion From the initiatives presented in Table 3.6, only the network improvement strategies (see Hassall, 2004; 2006) have actually been implemented.
WHAT CONTENTS
WHY
WHY INVOLVEDWHO
HOW
WHAT RESULTSWHAT
WHERE
Companyinitiative
Vehiclerouting
improvement
Road
City typetest network
Environment +Transport efficiency +Ease of implementation +
Core & non-core goods
VoluntaryexecuteCarriers Economical
Analytical model
Level 4 EconomicalImproveefficiency
Figure 3.5 Archetype vehicle routing improvement initiative The other 12 initiatives basically try to increase the likeliness of the vehicle routing plan’s feasibility in practice. Infeasibilities are quite costly, e.g. late arrivals and penalty costs, resulting in extra kilometres, which add to the congestion and increase pollutant emissions. These 12 VRP-related initiatives compare a roundtrip planning that takes no event, e.g. congestion, in account to a planning that incorporates such an event. Next, the stimulated evaluation, in which events occur, obviously shows a better performance for the planning that includes suchlike events. The results are an increase in transport efficiency, resulting in, if reported, less environmental burden (see Table 3.6). Initiatives that focus on incorporating real time information, see for example Wild and Gluecker (2006), do not try to improve the routings based on the likelihood of an event to occur, but try to come up with the best possible solution in real-time after such an event occurs. Figure 3.5 shows the

78
Chapter 3
64
archetype vehicle routing improvement initiative, which we derived from all reviewed vehicle routing improvement initiatives (see also Table 3.6). 3.3.3 Technological vehicle innovation (5 initiatives) Only a few initiatives that focus on technological vehicle innovations to improve sustainability in urban areas satisfy our selection criteria. This does not imply that there are almost no technological vehicle innovations, but many of these innovations, such as cleaner or quieter truck engines, have been implemented, but not reported upon in academic literature (see for example www.piek.org for information on quieter material, or Duinkerken et al. (2003) and Van der Meer (2003) for different kind of city-trucks). The few initiatives that we discuss in this section mainly deal with assessing the impact of technological vehicle innovations (see also Table 3.7). Table 3.7 Technological vehicle innovation initiatives’ most relevant elements
WHAT WHY WHO WHERE RESULTS
Refe
renc
e
Mai
n ac
tor
Role
Seco
nd a
ctor
Reas
on a
nd ro
le se
cond
ac
tor
Geo
grap
hica
l foc
us
Scar
city
Acce
ssib
ility
Envi
ronm
ent
Tran
spor
t effi
cien
cyEc
onom
ic d
evel
opm
ent
Soci
al su
ppor
t
Impl
emen
ted
in p
ract
ice
Ma, 1999 Low emission vehicle
Decrease noise nuisance
Reduce pollution
Researcher Initiate voluntary
Carrier Legislation Bear compulsory
Crossing Yes + No
Gragnani, et al., 2004
New technology vehicle (cleaner fuel)
Reduce pollution
Higher government
Fund voluntary
Local authorities Carriers
Sustainability Execute voluntary
City Yes + No
Marquez, et al., 2004
Improved fuel efficiency
Reduce pollution
Local authorities
Initiate voluntary
Carrier Legislation Execute voluntary
City No + No
Patier, 2006 Urban vehicle and electronic trolley
Improve accessibility
Reduce pollution
Carrier Initiate voluntary
City centre
Yes + + + + + Yes
Patier, 2006 Electric delivery tricycle
Improve accessibility
Reduce pollution
Carrier Initiate voluntary
Shipper Accommodate voluntary
City centre
Yes + + + Yes
Sust
aina
bilit
y is
sues
Promoting the use of low emission vehicles reduces the pollution as well as the noise in an artificial initiative setting (Ma, 1999). Marquez et al. (2004) evaluate the impacts of improved fuel efficiency (see also Taylor et al., 2005). Gragnani et al. (2004) discuss the use of vehicles with cleaner fuels in the context of a starting project on urban freight distribution in Italy. An initiative in Strasbourg uses the “Chronocity” a special truck that carries two electric trolleys (see Figure 3.6) for postal deliveries in the city centres by foot with a trolley (Patier, 2006). The initiative is copied to other French cities. Chronopost, the user of the Chronocity, estimates a serious decrease in pollutants. Another initiative is the use of the electric tricycle in Paris (Patier, 2006). In this initiative the goods, mainly express and organic freight, are transhipped at the border of the city centre from trucks to the tricycles. This initiative is also transferred to different French cities. Comparable initiatives are carried out in the Netherlands with bike-couriers (CSD, 2005) and in York (Browne et al., 2005b). The experiences are positive; reduction in pollution, no parking problems, and acceptance by shop keepers and residents.
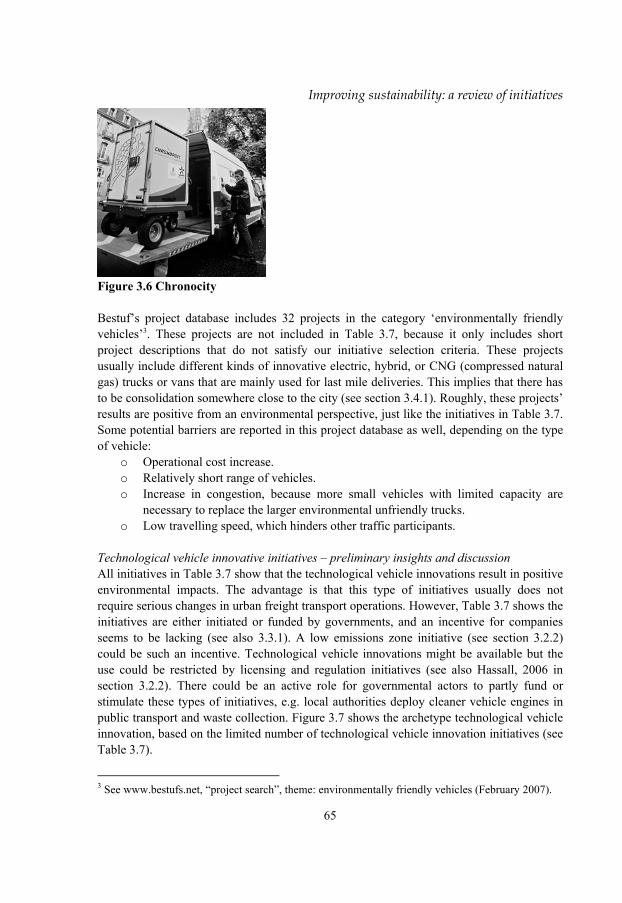
79
Improving sustainability: a review of initiatives
65
Figure 3.6 Chronocity Bestuf’s project database includes 32 projects in the category ‘environmentally friendly vehicles’3. These projects are not included in Table 3.7, because it only includes short project descriptions that do not satisfy our initiative selection criteria. These projects usually include different kinds of innovative electric, hybrid, or CNG (compressed natural gas) trucks or vans that are mainly used for last mile deliveries. This implies that there has to be consolidation somewhere close to the city (see section 3.4.1). Roughly, these projects’ results are positive from an environmental perspective, just like the initiatives in Table 3.7. Some potential barriers are reported in this project database as well, depending on the type of vehicle:
o Operational cost increase. o Relatively short range of vehicles. o Increase in congestion, because more small vehicles with limited capacity are
necessary to replace the larger environmental unfriendly trucks. o Low travelling speed, which hinders other traffic participants.
Technological vehicle innovative initiatives – preliminary insights and discussion All initiatives in Table 3.7 show that the technological vehicle innovations result in positive environmental impacts. The advantage is that this type of initiatives usually does not require serious changes in urban freight transport operations. However, Table 3.7 shows the initiatives are either initiated or funded by governments, and an incentive for companies seems to be lacking (see also 3.3.1). A low emissions zone initiative (see section 3.2.2) could be such an incentive. Technological vehicle innovations might be available but the use could be restricted by licensing and regulation initiatives (see also Hassall, 2006 in section 3.2.2). There could be an active role for governmental actors to partly fund or stimulate these types of initiatives, e.g. local authorities deploy cleaner vehicle engines in public transport and waste collection. Figure 3.7 shows the archetype technological vehicle innovation, based on the limited number of technological vehicle innovation initiatives (see Table 3.7).
3 See www.bestufs.net, “project search”, theme: environmentally friendly vehicles (February 2007).

80
Chapter 3
66
Based on the Bestufs’ projects we conclude that increasing congestion would definitely not add to the social acceptance of these new vehicles, but also not to the cooperativeness of carriers. This also applies for the low travelling speed and the relatively short range of some vehicles. Since environmental improvement might not be as visible as the hindrance, the chance exists that the initiative might not be accepted.
WHAT CONTENTS
WHY
WHY INVOLVEDWHO
WHAT RESULTSWHAT
Companyinitiative
Technologicalvehicle
innovations
Road Environment +Ease of implementation +
VoluntaryinitiateCarriers Sustainability
Level 2 EnvironmentalReduce
pollution
Figure 3.7 Archetype technological vehicle innovation initiative 3.4 Physical infrastructure initiatives We distinguish four different initiative types that try to improve sustainability by changing the physical infrastructure used for urban freight transport. The first two are considered typical city logistics initiatives (Taniguchi and Van der Heijden, 2000) and are sometimes even used as a synonym for city logistics, i.e. underground logistics systems and the use of consolidation centres. The latter is for example an independent project theme, called urban freight platforms, in the Bestufs project database with 35 projects (or proposals) from Japan, Australia and countries all over Europe. The other two initiative types aim more at improving the urban freight operations by improving (parts of) the physical infrastructure: i.e. road infrastructure development initiatives and standardisation of load-unit initiatives. In the next section we discuss 15 initiatives on city consolidation centres. In section 3.4.2 we discuss 5 initiatives on underground logistics systems. The 4 initiatives on road infrastructure development to improve sustainability in urban areas are discussed in the following section. Section 3.4.4 presents 4 initiatives that focus on the development and the potentials of standardised load-units. 3.4.1 Consolidation centre initiatives (15 initiatives) This initiative type includes all initiatives that use a facility, in which flows from outside the city are consolidated with the objective to bundle inner-city transportation activities. The main difference with carrier cooperation initiatives is the use of a shared facility for transfer and bundling activities. The idea of consolidation centre initiatives is to split up the freight transport in two parts: the part inside the city and the part outside the city (see Figure 3.8). Transhipping at the city border, resulting in a split up in the transport, makes it possible to benefit from the advantages of large vehicles for long haul transport outside the city without having disadvantages of these large trucks in the urban area, e.g. pollution and

81
Improving sustainability: a review of initiatives
67
traffic unsafety. Next, smaller trucks transport the goods to outlets in the city after transhipment in a consolidation centre. An extra advantage is that the small trucks can be fully loaded in the consolidation centre, which results in a minimum number of vehicles entering the city. Depending on the load factor of the large vehicles that are replaced by the small ones, it may take more small vehicles to replace the large vehicles, which could increase the number of vehicles in the city. In some initiatives environmental friendly vehicles are used to make the final delivery from the consolidation centre to the stores.
city
Retail DC
Supplier
Cityconsolidationcentre
Store
Figure 3.8 The city consolidation centre concept The first consolidation centre initiatives were already examined in the seventies. For example, McDermott (1975; 1980) discusses the potential benefits and disadvantages from operating an urban consolidation terminal for carriers and shippers as well as for consumers, society, and authorities. Carriers would benefit from consolidation, because they do not have to carry out the inefficient operations in cities, such as several small pick ups and deliveries and queuing for (un)loading in the city. Next, a terminal could reduce the number of vehicles in the central business district (CBD), save fuel usage, reduce congestion, and improve the quality of life. In spite of these positive impacts, we found that only a few of these initiatives are realised in practice and did not terminate in a few years. This corresponds to the findings Browne et al. (2005b) report in their extensive literature review on urban consolidation centre schemes. One of the best known implemented consolidation centre initiatives is the one in Monaco (see e.g. Patier, 2006; Van Binsbergen and Visser, 2001). The government initiated it in 1989 in combination with strict regulations on trucks and with provision of large subsidies; the price customers pay per delivery from the urban distribution centre (UDC) is lower than the governmental subsidy per delivery. Next, Monaco’s typical characteristics add to the initiative success (see Table 3.8), but make the results not transferable to other cities. Monaco is next to a city also a sovereign state, which enables the complete insertion of the UDC-concept in Monaco’s global policy. Besides, the government has a comfortable financial position, which makes huge financial support possible. Another implemented UDC initiative comes from La Rochelle (Patier, 2006). An UDC was set up in 2001 with a considerable starting subsidy. From the UDC electric vehicles supply the historical city centre of La Rochelle. Some problems occurred in the initiative, i.e. although regulation forbids heavy vehicles to enter, the enforcement is lacking. Next, the capacity of the electric vehicle is limited, resulting in

82
Chapter 3
68
more vehicle trips and an increase in urban congestion. Furthermore, it turned out to be legally not allowed to deny access for non-UDC users, as long as they satisfy the vehicle restrictions and time-windows. And finally, no one responded on the tendering for the UDC management. A comparable initiative failed in Leiden (Schoemaker, 2002). The city distribution centre (CDC) opened in 1997 to improve quality of life in the historical centre of Leiden (see also Van der Poel, 2000). Deliveries from the CDC were allowed outside the time-windows and were carried out by small, noiseless, and clean electric vehicles. However, these vehicles’ maximum speed of 25 kilometres per hour turned out to be a major disadvantage, because it hindered other traffic and it resulted in social opposition against the CDC. Next, the number of customers for Leiden’s CDC was by no means sufficient to reach the break-even volume, even after the surrounding cities were added to the working area of the CDC. For example, parcel delivery companies decided not to join in the initiative, basically because they were not willing to collaborate with their competitors. The project stopped in 2000. Schoemaker (2002) mentions some failure factors for the project, i.e.: • The CDC was located too far away from the highway and from the city centre. • The supporting policy measures, i.e. time-windows and vehicle restrictions, were
considered unfair ways to keep the municipality’s unprofitable CDC alive, instead of making the city more attractive, resulting in opposition against the CDC.
• Reluctance in the transport industry to use the CDC; e.g. already thin margins on transport, for complex goods using the CDC was legally not allowed, valuable goods were not allowed to be transhipped in the CDC because of insurance companies.
• Electric cars slowed down all traffic. • More city distribution centres were started; companies could start their own CDC if they
fulfilled some regulations and receive the same advantages as the municipality’s CDC. • Financially not feasible due to lacking volume. In another initiative three intermodal freight centres (IFC) were developed in Berlin for three reasons: offer accessible sites for freight transport operations, offer transhipment possibilities for intermodal transport, and make more sustainable urban deliveries possible, i.e. use smaller vans instead of heavy trucks (Hesse, 2004). Local authorities’ motive was to initiate carrier cooperation by bringing together different companies in one location, without any obligation. After some years it turned out that companies settle in the IFC, however there is no intermodality and no cooperation. Furthermore, the short distance traffic increased in the neighbourhood of the IFCs. After some initial successes many German cooperation and city distribution centre initiatives were terminated after the first phase or even earlier. Browne et al. (2005b) find that of the approximately 200 planned or realised schemes in Germany at most five are actually operating in 2005. In search for cooperation and city distribution centre initiative’s success factors, Koehler (2004) finds two successful initiatives that have a freight traffic centre incorporated: Nürnberg city logistics initiative, Isolde, and Regensburg city logistics project, Reglog. These initiatives have the following success factors in common (Koehler, 2004):
o Restricted traffic conditions in the cities.
83
Improving sustainability: a review of initiatives
69
o Mediator. o Scientific support in initial phase. o Integration of a freight traffic centre in the initiative. o Enforcement of regulations by local authorities. o Early involvement of all actors. o Collection of waste to utilise vehicles better by including the loads for the
return trips to the freight centre. The ‘area-wide inter-carrier consolidation system’ (AIC) is the consolidation centre initiative that lasts for the longest period: in 1978 twenty-nine carriers initiated this initiative in Tenjin, a central business district in Fukuoka (Taniguchi, 2002). They agreed to pay a limited charge per parcel to finance the system, in which carriers bring their cargo to a terminal from which delivery roundtrips to the city centre start three times a day. The picked up goods are brought from the city centre to another terminal from where the participating companies can collect the goods. Nemoto (1997) finds that the total impacts are minor, because the AIC related traffic is only a small portion of the total traffic in Tenjin and besides the AIC only covers a limited part of the Tenjin area. Next to these initiatives implemented in practice, several researchers evaluate theoretical city consolidation centres initiatives. The obliged use of an UDC in the city of Groningen results in more vehicle movements for the food retail, but in fewer vehicle movements for the supply of book stores (Boerkamps and Van Binsbergen, 1999). In the case that the historical city centre of Sienna, which is already under access control and other vehicle limiting measures, is supplied from two logistics platforms considerable savings in emissions and fuel usage could be realised (Valentini et al., 2001). Some initiatives even consider a set of centres located at several areas outside the city. For example, Castro et al. (1999) find that theoretically 16 distribution facilities around Tokyo result in lowest transportation and facility cost trade-off. Takahashi and Hyodo (1999) conclude that the centres currently used in Tokyo decrease overall freight transportation costs, but that it could reduce further if an extra centre was added and if they were located at other areas. Furthermore, they argue that especially clothes, furniture, foods, and stationery are potentials to be shipped via a centre. A centre in the area of Taipei with both distribution and storage services is best from a financial feasibility point of view. The centre can reduce illegal parking of freight vehicles, reduce empty trucks, and reduce traffic density (Wang and Chu, 2001). Ambrosini et al. (2004) evaluate two theoretical initiatives in which two UDCs are used in the Lyon region. They assume, based on other studies, that about 20% of the freight voluntarily passes through one of the centres. In the second initiative the two centres cooperate. The first initiative shows hardly any difference with the situation in which there are no UDCs, whereas the cooperation variant results in a considerable decrease in total kilometres travelled. Crainic et al. (2004) propose for Rome a set of satellites, e.g. parking areas, where freight from outside the city is transferred and consolidated on small environment-friendly vehicles

84
Chapter 3
70
that enter the city. They present a model to evaluate such a system, the satellite location problem. The results show that the system with over 30 satellites reduces the number of truck kilometres in the city at the cost of more kilometres of the environmental friendly vehicles, without serious impacts on the delivery performance. Table 3.8 Consolidation centre initiatives’ most relevant elements
WHAT WHY WHO RESULTS
Refe
renc
e
Mai
n ac
tor a
nd ro
le
Seco
nd a
ctor
and
reas
on
Role
Initi
ator
Acce
ssib
ility
Envi
ronm
ent
Tran
spor
t effi
cien
cyEc
onom
ic d
evel
opm
ent
Soci
al su
ppor
tLo
gist
ics c
osts
Impl
emen
ted
in p
ract
ice
McDermott, 1975; 1980
Urban consolidation centres
Increase efficiency
Improve accessibility
Carrier Use Terminal operator Economic
Manage voluntary
Researcher + + - No
Nemoto, 1997; Taniguchi, 2002
Inter-carrier consolidation with use of terminals
Reduce congestion
Improve environment
Carriers Initiate
Local authorities Sustainability
Fund (deficits only)
Carriers + + + Yes
Boerkamps and Van Binsbergen, 1999
Urban distribution centres
Reduce pollution
Improve efficiency
Authorities Organize
Carriers Legislation
Compulsory-bearing
Researcher - +- +- - +- No
Castro, et al., 1999
Number and location of facilities
Improve accessibility
Reduce pollution
Carriers Researcher + No
Takahashi and Hyodo, 1999
Regional physical distribution centres
Increase efficiency
Improve accessibility
Carriers Researcher + No
Valentini, et al., 2001
Urban logistics platforms
Reduce pollution
Increase traffic safety
Local authorities Organize
Carriers Legislation
Compulsory-bearing
Researcher + No
Wang and Chu, 2001
Public freight terminal
Improve accessibility
Reduce nuisance
Authorities Organize
Carriers Researcher 0 0 + No
Schoemaker, 2002; Van der Poel, 2000
Urban distribution centres (and electronic vehicles)
Improve liveability
Improve environment
Local authorities Fund/Initiate
Carriers 1)Legislation 2)Economical
1) Compulsory 2) Execute voluntary
Local authorities
- - - - - Yes
Ambrosini, et al., 2004
Urban distribution centres
Improve accessibility
Improve environment
Carriers Execute
Authorities Sustainability
Initiate/Manage voluntary
National government
+ + No
Crainic, et al., 2004
Satellite platforms (environment-friendly vehicles)
Improve quality of life
Reduce pollution
Researcher Initiate
Carriers Legislation
Compulsory bearing
Researcher + + No
Hesse, 2004 Intermodal freight centres
Improve environment
Improve efficiency
Authorities Initiate
Carriers Economic
Execute voluntary
Local authorities
- Yes
Koehler, 2004 Coordinate and bundle (freight traffic centres)
Increase efficiency
Improve environment
Carriers Organize
Authorities Sustainability
Enforcement Financing (subsidy)
Carriers + + Yes
Regan and Golob, 2005
Urban freight facilities
Reduce congestion
Decrease pollution
Carriers Use Authorities Sustainability
(partly) Fund voluntary
Researcher + No
Patier, 2006; Van Binsbergen and Visser, 2001
Urban distribution centres
Increase efficiency
Government Initiate
Carriers Legislation
Compulsory bearing
Government + + + - Yes
Patier, 2006 Urban distribution centres (and electronic vehicles)
Improve environment
Authorities Initiate
Carriers Legislation
Compulsory bearing
Several actors
- + - - Yes
Sust
aina
bilit
y is
sues
Many initiatives lack to answer the question which trucking companies would be interested in using urban freight facilities. Regan and Golob (2005) find, based on a survey among Californian trucking companies, that about one fifth of the companies would use these facilities. Especially long distance carriers and companies proving service to rail terminals are most likely to use the facilities. For-hire carriers are more likely to be positive about the use of urban freight facilities than private carriers. Who would pay for the facilities is not examined in this paper.
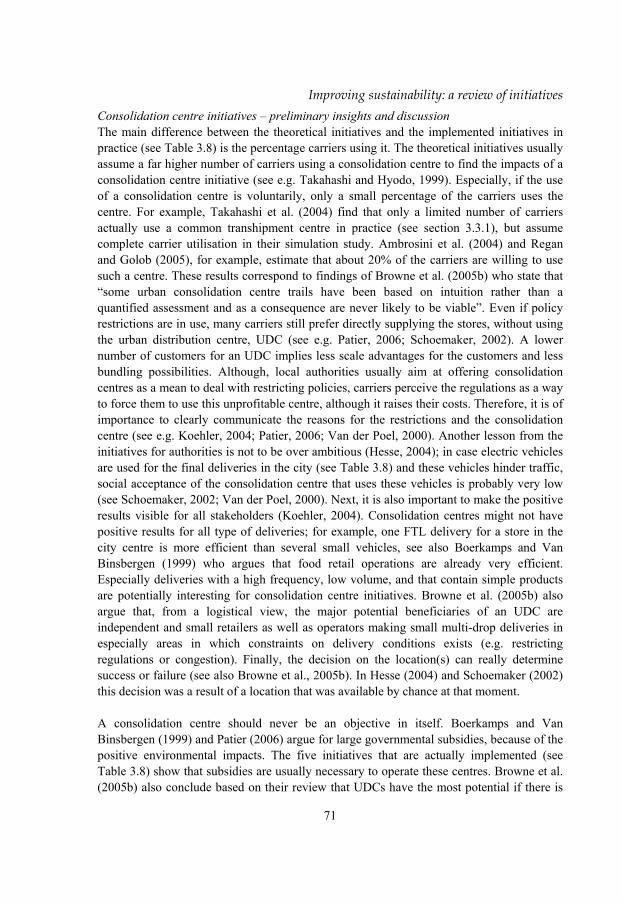
85
Improving sustainability: a review of initiatives
71
Consolidation centre initiatives – preliminary insights and discussion The main difference between the theoretical initiatives and the implemented initiatives in practice (see Table 3.8) is the percentage carriers using it. The theoretical initiatives usually assume a far higher number of carriers using a consolidation centre to find the impacts of a consolidation centre initiative (see e.g. Takahashi and Hyodo, 1999). Especially, if the use of a consolidation centre is voluntarily, only a small percentage of the carriers uses the centre. For example, Takahashi et al. (2004) find that only a limited number of carriers actually use a common transhipment centre in practice (see section 3.3.1), but assume complete carrier utilisation in their simulation study. Ambrosini et al. (2004) and Regan and Golob (2005), for example, estimate that about 20% of the carriers are willing to use such a centre. These results correspond to findings of Browne et al. (2005b) who state that “some urban consolidation centre trails have been based on intuition rather than a quantified assessment and as a consequence are never likely to be viable”. Even if policy restrictions are in use, many carriers still prefer directly supplying the stores, without using the urban distribution centre, UDC (see e.g. Patier, 2006; Schoemaker, 2002). A lower number of customers for an UDC implies less scale advantages for the customers and less bundling possibilities. Although, local authorities usually aim at offering consolidation centres as a mean to deal with restricting policies, carriers perceive the regulations as a way to force them to use this unprofitable centre, although it raises their costs. Therefore, it is of importance to clearly communicate the reasons for the restrictions and the consolidation centre (see e.g. Koehler, 2004; Patier, 2006; Van der Poel, 2000). Another lesson from the initiatives for authorities is not to be over ambitious (Hesse, 2004); in case electric vehicles are used for the final deliveries in the city (see Table 3.8) and these vehicles hinder traffic, social acceptance of the consolidation centre that uses these vehicles is probably very low (see Schoemaker, 2002; Van der Poel, 2000). Next, it is also important to make the positive results visible for all stakeholders (Koehler, 2004). Consolidation centres might not have positive results for all type of deliveries; for example, one FTL delivery for a store in the city centre is more efficient than several small vehicles, see also Boerkamps and Van Binsbergen (1999) who argues that food retail operations are already very efficient. Especially deliveries with a high frequency, low volume, and that contain simple products are potentially interesting for consolidation centre initiatives. Browne et al. (2005b) also argue that, from a logistical view, the major potential beneficiaries of an UDC are independent and small retailers as well as operators making small multi-drop deliveries in especially areas in which constraints on delivery conditions exists (e.g. restricting regulations or congestion). Finally, the decision on the location(s) can really determine success or failure (see also Browne et al., 2005b). In Hesse (2004) and Schoemaker (2002) this decision was a result of a location that was available by chance at that moment. A consolidation centre should never be an objective in itself. Boerkamps and Van Binsbergen (1999) and Patier (2006) argue for large governmental subsidies, because of the positive environmental impacts. The five initiatives that are actually implemented (see Table 3.8) show that subsidies are usually necessary to operate these centres. Browne et al. (2005b) also conclude based on their review that UDCs have the most potential if there is

86
Chapter 3
72
enough external funding, as self-financing UDCs do not exist in practice. Another way to compensate for these extra costs might be by offering extra services, e.g. pick up points for customers or storage facilities. Overall, we conclude that initial investments, ownership, and operating responsibilities of the centre are issues that have to be dealt with in an early phase of a consolidation centre initiative. Congestion might increase due to the larger number of small vehicles necessary to deliver the same volume to the stores in a city. Overall, consolidation centres seem to be most feasible, if feasible at all, for historical cities that have restrictive and inhibitive conditions for urban freight transportation anyway, next to potential governmental restrictions. Carriers, currently responsible for making deliveries in urban areas, are used to do so without a consolidation centre. They have to be convinced about the reason to change the current situation in order to give the initiative a chance. Figure 3.9 shows the consolidation centre initiative archetype, based on the reviewed initiatives (see Table 3.8) using the framework.
WHAT CONTENTS
WHY
WHY INVOLVEDWHO
WHAT RESULTS
WHAT
WHERE
Physical infrastructure
Consolidationcentre
Forward &reverse
Product typeSimpleRoad
City typeHistorical
SpatialscarcityCity
Accessibility + -Environment +Transport efficiency + -Logistics costs -Implementation -Core & non-
core goodsLevel 2
Level 4
EnvironmentalReduce
pollutionEconomicalImprove efficiencyImprove
accessibility
TerminaloperatorCarriers
Localauthorities
Voluntaryorganise
Compulsory
Voluntaryinitiate / fund
Economical
Legislation
Sustainability
Figure 3.9 Archetype consolidation centre initiative 3.4.2 Underground logistics system initiatives (5 initiatives) One of the most radical and expensive initiative types is the underground logistics system initiative. These initiatives would make almost all negative impacts of urban freight transport disappear, without compromising the positive impacts. In this section we only focus on the movement of goods in underground logistics systems. Howgego and Roe (1998) provide an overview of relevant literature on the use of pipelines in urban areas for the distribution of goods. This overview goes back over one century in time, for example a large pneumatic capsule system in London as early as 1860 is discussed. They also examine the potential of tube-based transportation in urban areas to alleviate current urban freight problems. Howgego and Roe (1998) evaluate the possibilities for a proposed tube-based system to transport grocery products from a central distribution depot to retail outlets on commercial, economic, and social benefits and disbenefits. They conclude that benefits outweigh most disbenefits, although the high initial costs remain a problem.

87
Improving sustainability: a review of initiatives
73
Ooishi and Taniguchi (1999) provide a cost-benefit analysis for the construction of an underground logistics system in Tokyo. This system makes use of special trucks that are able to use the regular roads outside the system and special railways within the system. Ooishi and Taniguchi (1999) conclude that an underground freight transport system reduces, or even solves, a lot of urban problems, such as congestion and air quality problems. However, such a system would not be self-supportive. It would only be reasonable if social benefits are considered. Boerkamps and Van Binsbergen (1999) evaluate the impacts of an underground logistics system for the city Groningen with a quantitative model for both food and book store retail chains. The system makes use of pipeline transportation from a logistical park outside the city to district interchanges. The use of an underground logistics system would reduce emissions considerably. Versteegt et al. (2001) design two underground freight transport systems: one between the flower auction in Aalsmeer and the airport Schiphol and another for a shopping mall in Tilburg. Simulation was used to support the feasibility study for this city distribution system for Tilburg and for decisions on quantification of the number of AGVs (automatic guided vehicles), employees, storage, etc. New underground freight transport systems lead to positive effects, such as an attractive city and improvements in the quality of the transport, however there are also great risks; not only from a technological and logistical point of view, but also from a social and administrative point of view (Visser, 2001). The financial investments are high, but the gains, i.e. reduction in emissions, improved traffic safety, and a reduction in hindrance, are also considerable. Table 3.9 Underground logistics systems initiatives’ most relevant elements
WHAT WHY WHO WHAT RESULTS
Refe
renc
e
Mai
n ac
tor
Role
Seco
nd a
ctor
and
role
Initi
ator
Tran
spor
t mod
e
Acce
ssib
ility
Envi
ronm
ent
Tran
spor
t effi
cien
cyEc
onom
ic d
evel
opm
ent
Soci
al su
ppor
tLo
gist
ics c
osts
Impl
emen
ted
in p
ract
ice
Howgego and Roe, 1998
Pipeline Improve accessibility
Reduce pollution and noise
Researcher Studying feasibility
Researcher Pipeline + + + No
Boerkamps and Van Binsbergen, 1999
Underground logistics system
Reduce pollution
Increase efficiency
Authorities Carrier Use
Researcher Pipeline + + - - No
Ooishi and Taniguchi, 1999
Underground freight transportation system
Improve accessibility
Reduce nuisance
Local authorities
Carrier Use
Researcher Road and conveyance
+ + + No
Versteegt, et al., 2001
Underground freight transportation system
Improve accessibility
Reduce pollution and noise
Researcher Initiate voluntary
Researcher Underground road (AGV)
No
Visser, 2001 Underground freight transportation system
Improve accessibility
Reduce pollution
Authorities Fund voluntary
Carrier Use
Researcher (Combi)-road, rail, automatic transport
+ + + + No
Sust
aina
bilit
y is
sues
Underground logistics systems initiatives – preliminary insights and discussion All Table 3.9’s feasibilities studies have in common that they show great benefits from underground logistics systems in the form of reduced (or even disappeared) environmental and societal impacts. However these impacts come at very high initial costs. How other

88
Chapter 3
74
stakeholders should be involved, and who is responsible for actually transporting the goods in these systems is not always clear. Although Howgego and Roe (1998) presents some examples of underground systems in the past, this type of system is currently not in use in reality. The most important lessons are that such systems are only possible with huge governmental subsidies (Boerkamps and Van Binsbergen, 1999). From a cots-benefit point of view, the high investments only make sense if all gains are considered, i.e. environmental, social, and economical gains, over the lifespan of such a system (Ooishi and Taniguchi, 1999). Furthermore, there are great risks in developing an underground logistics system, e.g. collapsing or damaging the historical city centre above ground, unknown cost for usage and maintenance, and many other risks that are difficult to estimate at the moment. However, the few initiatives show the potential is enormous, not only for sustainability issues, but also from a logistical point of view, e.g. extra storage and 24-hours a day delivery possibilities (Howgego and Roe, 1998; Visser, 2001). Figure 3.10 shows the archetype underground logistics system initiative that we constructed based on all reviewed underground logistics system initiatives (see also Table 3.9).
WHAT CONTENTS
WHY
WHY INVOLVEDWHO
HOW
WHAT RESULTSWHAT
WHERE
Physical infrastructure
Undergroundlogistics system
Forward &reverse
Location of drop
Off-street
Spatialscarcity City centre
Accessibility + Environment +Implementation --
Core & non-core goodsLevel 2
Level 4
EnvironmentalReducepollution
EconomicalImproveaccessibility
SystemoperatorCarriers
Authorities
Voluntaryorganise
use
Voluntaryinitiate / fund
Economical
Sustainability
Analytical model
Figure 3.10 Archetype underground logistics systems initiative 3.4.3 Road infrastructure development initiatives (4 initiatives) The initiatives discussed in this section focus on changing the existing physical road infrastructure. In contrast to the dedicated infrastructure initiatives, the initiatives in this section focus on the development of new infrastructure. Many sustainability problems are related to the use of road infrastructure, so usually initiatives that increase the number of roads are not the first to consider for sustainability initiatives. Marquez et al. (2004) evaluate the impacts of two infrastructural initiatives. In the first initiative the impacts of an orbital road around Sydney are examined. A ring road would lead to a decrease in local and global emissions (see also Table 3.10). Next Marquez et al. (2004) assume that this orbital road leads to a relocation of industry from the inner-city to western Sydney. The local pollution in the form of PM10 increases. Kawamura et al. (2004) evaluate a hypothetical
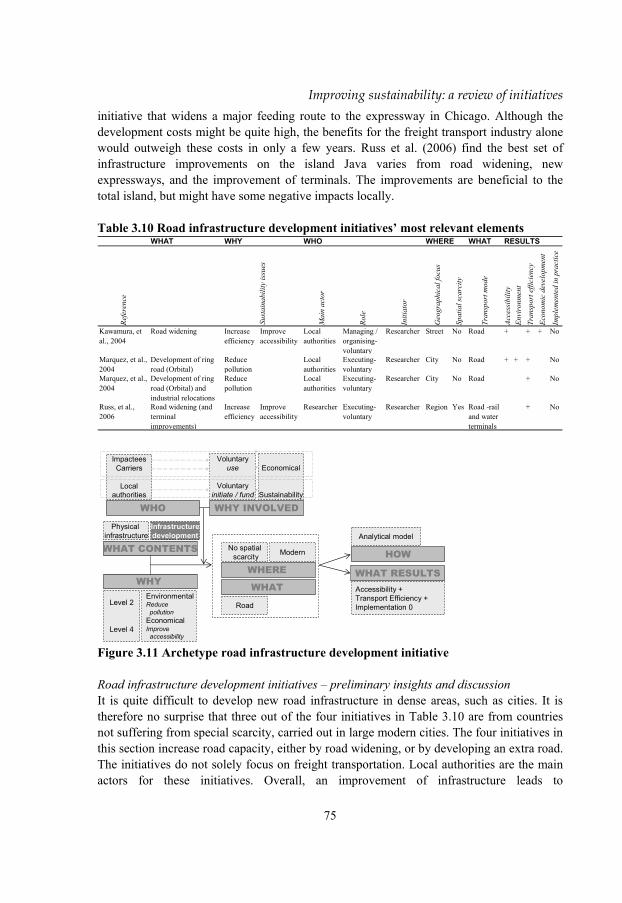
89
Improving sustainability: a review of initiatives
75
initiative that widens a major feeding route to the expressway in Chicago. Although the development costs might be quite high, the benefits for the freight transport industry alone would outweigh these costs in only a few years. Russ et al. (2006) find the best set of infrastructure improvements on the island Java varies from road widening, new expressways, and the improvement of terminals. The improvements are beneficial to the total island, but might have some negative impacts locally. Table 3.10 Road infrastructure development initiatives’ most relevant elements
WHAT WHY WHO WHERE WHAT RESULTS
Refe
renc
e
Mai
n ac
tor
Role
Initi
ator
Geo
grap
hica
l foc
us
Spat
ial s
carc
ity
Tran
spor
t mod
e
Acce
ssib
ility
Envi
ronm
ent
Tran
spor
t effi
cien
cyEc
onom
ic d
evel
opm
ent
Impl
emen
ted
in p
ract
ice
Kawamura, et al., 2004
Road widening Increase efficiency
Improve accessibility
Local authorities
Managing / organising-voluntary
Researcher Street No Road + + + No
Marquez, et al., 2004
Development of ring road (Orbital)
Reduce pollution
Local authorities
Executing-voluntary
Researcher City No Road + + + No
Marquez, et al., 2004
Development of ring road (Orbital) and industrial relocations
Reduce pollution
Local authorities
Executing-voluntary
Researcher City No Road + No
Russ, et al., 2006
Road widening (and terminal improvements)
Increase efficiency
Improve accessibility
Researcher Executing-voluntary
Researcher Region Yes Road -rail and water terminals
+ No
Sust
aina
bilit
y is
sues
WHAT CONTENTS
WHY
WHY INVOLVEDWHO
HOW
WHAT RESULTSWHAT
WHERE
Physical infrastructure
Infrastructuredevelopment
No spatialscarcity
Accessibility + Transport Efficiency + Implementation 0Road
Modern
Level 2
Level 4
EnvironmentalReduce
pollutionEconomicalImprove
accessibility
Analytical model
ImpacteesCarriers
Localauthorities
Voluntaryuse
Voluntaryinitiate / fund
Economical
Sustainability
Figure 3.11 Archetype road infrastructure development initiative Road infrastructure development initiatives – preliminary insights and discussion It is quite difficult to develop new road infrastructure in dense areas, such as cities. It is therefore no surprise that three out of the four initiatives in Table 3.10 are from countries not suffering from special scarcity, carried out in large modern cities. The four initiatives in this section increase road capacity, either by road widening, or by developing an extra road. The initiatives do not solely focus on freight transportation. Local authorities are the main actors for these initiatives. Overall, an improvement of infrastructure leads to

90
Chapter 3
76
improvements in accessibility and transport efficiency on the short term. Based on these four initiatives (see Table 3.10), Figure 3.11 shows the archetype infrastructure development initiative. 3.4.4 Standardisation of load-units initiatives (4 initiatives) The development of standardised load units for distribution of goods over land is inspired by the success of the sea container. A standard ‘land container’ would be beneficial to initiatives that rely on an efficient transfer of freight. Innovative distribution concepts, such as shuttle concepts for road-bound distribution, rail-bound systems for the combined transport of passenger and freight transport, and waterborne concepts would also be more likely to be realised due to standard load-unit initiatives. The main condition to make these concepts work is that a standardised city box should be used by large actors in order to make it the standard. Without such a standard the positive impacts of the proposed concepts, like cost savings and an increase in the quality of life, are unlikely to occur (Rijsenbrij, 2004). Table 3.11 Standardisation of load-unit initiatives’ most relevant elements
WHAT WHY WHO WHAT RESULTS
Refe
renc
e
Mai
n ac
tor
Role
Seco
nd a
ctor
Initi
ator
Tran
spor
t mod
e
Acce
ssib
ility
Envi
ronm
ent
Tran
spor
t effi
cien
cyEc
onom
ic d
evel
opm
ent
Soci
al su
ppor
tLo
gist
ics c
osts
Impl
emen
ted
in p
ract
ice
Van Binsbergen, et al., 1999
Development of load unit
Improve efficiency
Improve accessibility
Researcher Intermodal No
Rijsenbrij, 2004 Standardised box
Improve efficiency
Improve accessibility and quality of life
Carrier Executing-voluntary
Government Sustainability Fund-voluntary (research)
Authorities Road, water, and rail
+ + + + No
Ruesch, 2004 Standardised box
Improve efficiency
Reduce pollution
Carrier Initiator-voluntary
Terminal & other modes operators Economic
Carrier Road rail + - - Yes
Rijsenbrij, 2006 City-box concept
Improve efficiency
Improve accessibility and quality of life
Carrier Executing-voluntary
Government Sustainability Fund-voluntary (research)
Authorities Road + + + + No
Sust
aina
bilit
y is
sues
The main issue is not so much the load-unit’s technological development, but the necessity to set a standard that is accepted by all stakeholders, to really profit from advantages. Large scale utilisation would definitely result in major changes in current infrastructure, e.g. vehicles, consolidation possibilities, store depots, etc. Currently, several different in-land load-units are used. Van Binsbergen et al. (1999) propose a set of new load units (three levels of modular boxes) that are a compromise between different stakeholders’ requirements, so that it is possible to make it a standard. An initiative in which a standard load-unit is the central issue is the “stadsbox”-initiative. Rijsenbrij (2006) presents the results of a simulation (with real life data) of this initiative with standardised city-boxes (see for more information Groothedde et al., 2003a). The idea is that the city-box is used on a large scale and that not only the city-boxes are standardised, but also the city distribution
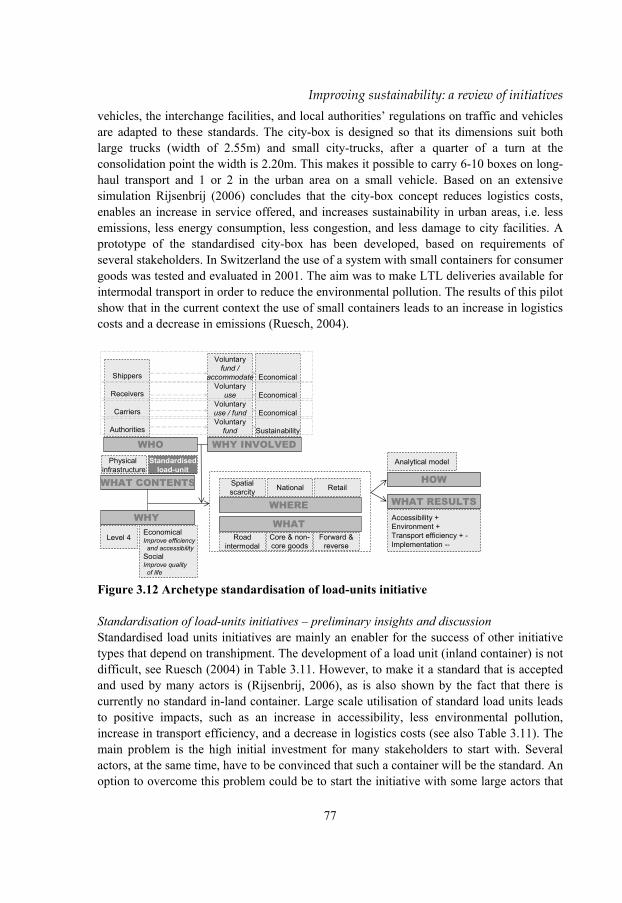
91
Improving sustainability: a review of initiatives
77
vehicles, the interchange facilities, and local authorities’ regulations on traffic and vehicles are adapted to these standards. The city-box is designed so that its dimensions suit both large trucks (width of 2.55m) and small city-trucks, after a quarter of a turn at the consolidation point the width is 2.20m. This makes it possible to carry 6-10 boxes on long-haul transport and 1 or 2 in the urban area on a small vehicle. Based on an extensive simulation Rijsenbrij (2006) concludes that the city-box concept reduces logistics costs, enables an increase in service offered, and increases sustainability in urban areas, i.e. less emissions, less energy consumption, less congestion, and less damage to city facilities. A prototype of the standardised city-box has been developed, based on requirements of several stakeholders. In Switzerland the use of a system with small containers for consumer goods was tested and evaluated in 2001. The aim was to make LTL deliveries available for intermodal transport in order to reduce the environmental pollution. The results of this pilot show that in the current context the use of small containers leads to an increase in logistics costs and a decrease in emissions (Ruesch, 2004).
Economical
Economical
Economical
Sustainability
WHAT CONTENTS
WHY
WHY INVOLVEDWHO
HOW
WHAT RESULTS
WHAT
WHERE
Physical infrastructure
Standardisedload-unit
Spatialscarcity
Accessibility + Environment +Transport efficiency + -Implementation --
Roadintermodal
National Retail
Core & non-core goods
Forward &reverse
Level 4EconomicalImprove efficiency
and accessibility SocialImprove quality
of life
Shippers
Receivers
Carriers
Authorities
Voluntaryfund /
accommodateVoluntary
useVoluntaryuse / fundVoluntary
fund
Analytical model
Figure 3.12 Archetype standardisation of load-units initiative Standardisation of load-units initiatives – preliminary insights and discussion Standardised load units initiatives are mainly an enabler for the success of other initiative types that depend on transhipment. The development of a load unit (inland container) is not difficult, see Ruesch (2004) in Table 3.11. However, to make it a standard that is accepted and used by many actors is (Rijsenbrij, 2006), as is also shown by the fact that there is currently no standard in-land container. Large scale utilisation of standard load units leads to positive impacts, such as an increase in accessibility, less environmental pollution, increase in transport efficiency, and a decrease in logistics costs (see also Table 3.11). The main problem is the high initial investment for many stakeholders to start with. Several actors, at the same time, have to be convinced that such a container will be the standard. An option to overcome this problem could be to start the initiative with some large actors that
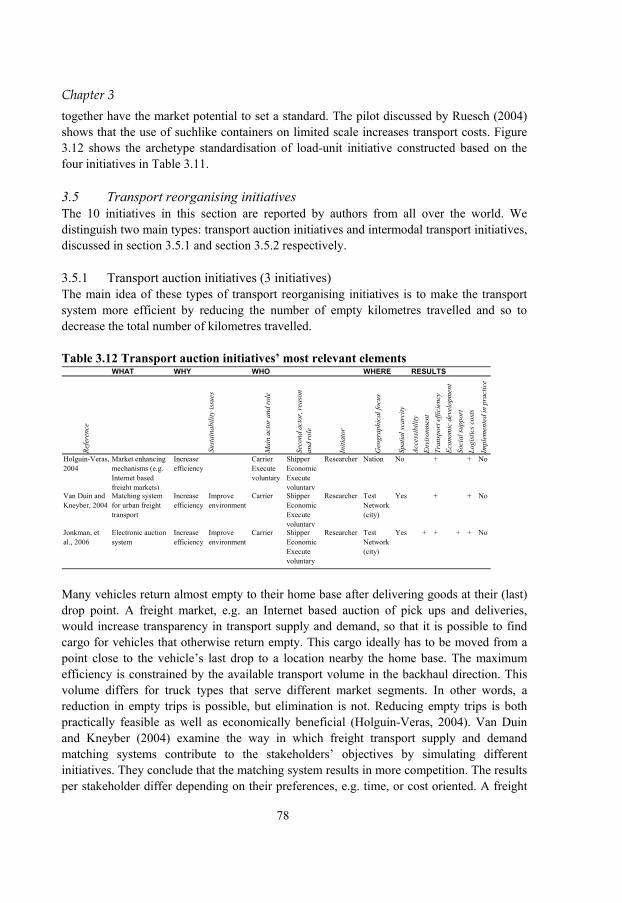
92
Chapter 3
78
together have the market potential to set a standard. The pilot discussed by Ruesch (2004) shows that the use of suchlike containers on limited scale increases transport costs. Figure 3.12 shows the archetype standardisation of load-unit initiative constructed based on the four initiatives in Table 3.11. 3.5 Transport reorganising initiatives The 10 initiatives in this section are reported by authors from all over the world. We distinguish two main types: transport auction initiatives and intermodal transport initiatives, discussed in section 3.5.1 and section 3.5.2 respectively. 3.5.1 Transport auction initiatives (3 initiatives) The main idea of these types of transport reorganising initiatives is to make the transport system more efficient by reducing the number of empty kilometres travelled and so to decrease the total number of kilometres travelled. Table 3.12 Transport auction initiatives’ most relevant elements
WHAT WHY WHO WHERE RESULTS
Refe
renc
e
Mai
n ac
tor a
nd ro
le
Seco
nd a
ctor
, rea
son
and
role
Initi
ator
Geo
grap
hica
l foc
us
Spat
ial s
carc
ity
Acce
ssib
ility
Envi
ronm
ent
Tran
spor
t effi
cien
cyEc
onom
ic d
evel
opm
ent
Soci
al su
ppor
tLo
gist
ics c
osts
Impl
emen
ted
in p
ract
ice
Holguin-Veras, 2004
Market enhancing mechanisms (e.g. Internet based freight markets)
Increase efficiency
Carrier Execute voluntary
Shipper Economic Execute voluntary
Researcher Nation No + + No
Van Duin and Kneyber, 2004
Matching system for urban freight transport
Increase efficiency
Improve environment
Carrier Shipper Economic Execute voluntary
Researcher Test Network (city)
Yes + + No
Jonkman, et al., 2006
Electronic auction system
Increase efficiency
Improve environment
Carrier Shipper Economic Execute voluntary
Researcher Test Network (city)
Yes + + + + No
Susta
inab
ility
issu
es
Many vehicles return almost empty to their home base after delivering goods at their (last) drop point. A freight market, e.g. an Internet based auction of pick ups and deliveries, would increase transparency in transport supply and demand, so that it is possible to find cargo for vehicles that otherwise return empty. This cargo ideally has to be moved from a point close to the vehicle’s last drop to a location nearby the home base. The maximum efficiency is constrained by the available transport volume in the backhaul direction. This volume differs for truck types that serve different market segments. In other words, a reduction in empty trips is possible, but elimination is not. Reducing empty trips is both practically feasible as well as economically beneficial (Holguin-Veras, 2004). Van Duin and Kneyber (2004) examine the way in which freight transport supply and demand matching systems contribute to the stakeholders’ objectives by simulating different initiatives. They conclude that the matching system results in more competition. The results per stakeholder differ depending on their preferences, e.g. time, or cost oriented. A freight
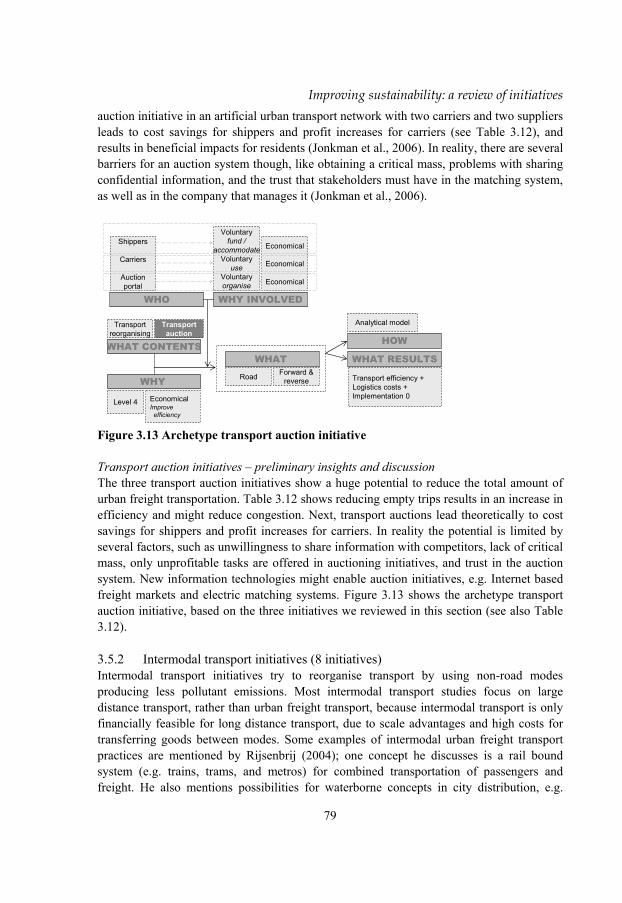
93
Improving sustainability: a review of initiatives
79
auction initiative in an artificial urban transport network with two carriers and two suppliers leads to cost savings for shippers and profit increases for carriers (see Table 3.12), and results in beneficial impacts for residents (Jonkman et al., 2006). In reality, there are several barriers for an auction system though, like obtaining a critical mass, problems with sharing confidential information, and the trust that stakeholders must have in the matching system, as well as in the company that manages it (Jonkman et al., 2006).
WHAT CONTENTS
WHY
WHY INVOLVEDWHO
HOW
WHAT RESULTSWHAT
Transportreorganising
Transportauction
Transport efficiency +Logistics costs +Implementation 0
Road Forward &reverse
Level 4 EconomicalImprove
efficiency
Shippers
Carriers
Auctionportal
Voluntaryfund /
accommodateVoluntary
useVoluntaryorganise
Economical
Economical
Economical
Analytical model
Figure 3.13 Archetype transport auction initiative Transport auction initiatives – preliminary insights and discussion The three transport auction initiatives show a huge potential to reduce the total amount of urban freight transportation. Table 3.12 shows reducing empty trips results in an increase in efficiency and might reduce congestion. Next, transport auctions lead theoretically to cost savings for shippers and profit increases for carriers. In reality the potential is limited by several factors, such as unwillingness to share information with competitors, lack of critical mass, only unprofitable tasks are offered in auctioning initiatives, and trust in the auction system. New information technologies might enable auction initiatives, e.g. Internet based freight markets and electric matching systems. Figure 3.13 shows the archetype transport auction initiative, based on the three initiatives we reviewed in this section (see also Table 3.12). 3.5.2 Intermodal transport initiatives (8 initiatives) Intermodal transport initiatives try to reorganise transport by using non-road modes producing less pollutant emissions. Most intermodal transport studies focus on large distance transport, rather than urban freight transport, because intermodal transport is only financially feasible for long distance transport, due to scale advantages and high costs for transferring goods between modes. Some examples of intermodal urban freight transport practices are mentioned by Rijsenbrij (2004); one concept he discusses is a rail bound system (e.g. trains, trams, and metros) for combined transportation of passengers and freight. He also mentions possibilities for waterborne concepts in city distribution, e.g.
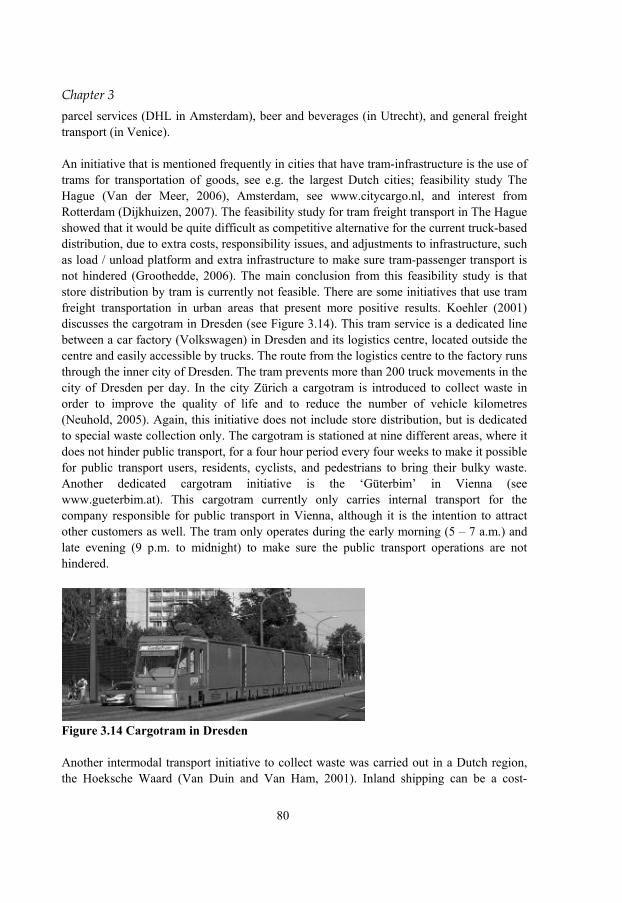
94
Chapter 3
80
parcel services (DHL in Amsterdam), beer and beverages (in Utrecht), and general freight transport (in Venice). An initiative that is mentioned frequently in cities that have tram-infrastructure is the use of trams for transportation of goods, see e.g. the largest Dutch cities; feasibility study The Hague (Van der Meer, 2006), Amsterdam, see www.citycargo.nl, and interest from Rotterdam (Dijkhuizen, 2007). The feasibility study for tram freight transport in The Hague showed that it would be quite difficult as competitive alternative for the current truck-based distribution, due to extra costs, responsibility issues, and adjustments to infrastructure, such as load / unload platform and extra infrastructure to make sure tram-passenger transport is not hindered (Groothedde, 2006). The main conclusion from this feasibility study is that store distribution by tram is currently not feasible. There are some initiatives that use tram freight transportation in urban areas that present more positive results. Koehler (2001) discusses the cargotram in Dresden (see Figure 3.14). This tram service is a dedicated line between a car factory (Volkswagen) in Dresden and its logistics centre, located outside the centre and easily accessible by trucks. The route from the logistics centre to the factory runs through the inner city of Dresden. The tram prevents more than 200 truck movements in the city of Dresden per day. In the city Zürich a cargotram is introduced to collect waste in order to improve the quality of life and to reduce the number of vehicle kilometres (Neuhold, 2005). Again, this initiative does not include store distribution, but is dedicated to special waste collection only. The cargotram is stationed at nine different areas, where it does not hinder public transport, for a four hour period every four weeks to make it possible for public transport users, residents, cyclists, and pedestrians to bring their bulky waste. Another dedicated cargotram initiative is the ‘Güterbim’ in Vienna (see www.gueterbim.at). This cargotram currently only carries internal transport for the company responsible for public transport in Vienna, although it is the intention to attract other customers as well. The tram only operates during the early morning (5 – 7 a.m.) and late evening (9 p.m. to midnight) to make sure the public transport operations are not hindered.
Figure 3.14 Cargotram in Dresden Another intermodal transport initiative to collect waste was carried out in a Dutch region, the Hoeksche Waard (Van Duin and Van Ham, 2001). Inland shipping can be a cost-

95
Improving sustainability: a review of initiatives
81
efficient alternative for the currently road-based waste collection. In a real-life demonstration it is shown that a special designed self-unloading ship is technologically possible. The environmental benefits are disappointing, because of the much longer lifecycle of ships than trucks, their engines are more pollutant. In case new ships are used this initiative has positive effects on the environment. Intermodal transport can reduce road freight transport and the corresponding environmental burden in urban areas (Ruesch, 2004). Some special conditions are required to make intermodal transport competitive with road transport on relatively short distance. Ruesch (2004) discusses two techniques that make the transfer between modes easier, but even with these systems, intermodal transport is only feasible on short distance (<100 km) under special conditions, such as waste transport, high volumes, or a heavy vehicle fee. Finally, Dinwoodie (2006) argues that in order to transfer urban freight transport to the rail, subsidies are necessary to develop infrastructure that assists consolidation at intermodal urban distribution centres. This might be more effective in reducing congestion than the current habit to provide subsidy for modal transfers. Table 3.13 Intermodal transport initiatives’ most relevant elements
WHAT WHY WHO WHERE WHAT RESULTS
Refe
renc
e
Mai
n ac
tor
Role
Seco
nd a
ctor
and
reas
on
Initi
ator
Urb
an ty
pe
Tran
spor
t mod
e
Tran
spor
t ele
men
t
Acce
ssib
ility
Envi
ronm
ent
Tran
spor
t effi
cien
cyEc
onom
ic d
evel
opm
ent
Soci
al su
ppor
tLo
gist
ics c
osts
Impl
emen
ted
in p
ract
ice
Koehler, 2001
Cargotram Improve accessibility
Increase efficiency
Receiver shipper Volkswagen
Manage voluntary
Tramoperator Economical
Receiver & shipper
Medium historical
Rail road
Core + + + Yes
Van Duin and Van Ham, 2001
Inland shipping
Improve accessibility
Economic Carrier-waste collector
Execute voluntary
(Local) authorities Sustainability
Researcher Road barge
Waste + + + - + No
Rijsenbrij, 2004
Water-borne city logistics
Improve efficiency & accessibility
Increase quality of life
Carrier Use voluntary
Researcher historical Road barge
Core Yes
Rijsenbrij, 2004
Rail-combi passengers and freight transport
Improve efficiency & accessibility
Increase quality of life
Researcher Initiate voluntary
Government Sustainability
Researcher Rail Core No
Ruesch, 2004
Cargo domino system
Increase quality of life
Carrier Initiate voluntary
Carrier Large historical
Rail road
Yes
Ruesch, 2004
ACTS Increase quality of life
Carrier Initiate voluntary
Carrier Large historical
Rail road
Waste + + + + Yes
Neuhold, 2005
Cargotram Reduce pollution
Reduce noise
Carrier-waste collector
Organise voluntary
Tramoperator Economical
Waste collector
Large historical
Rail road
Waste + + + Yes
Dinwoodie, 2006
Rail transport
Improve accessibility
Reduce pollution
Local authorities
Fund voluntary
Carrier Economical (subsidies)
Researcher Rail road
Core No
Susta
inab
ility
issu
es
Intermodal transport initiatives – preliminary insights and discussion Table 3.13 shows that only a few of the considered intermodal transport initiatives actually report results; if this is the case these initiatives show environmental as well as accessibility improvements. Normally, the scale advantages of bundling transport outweigh the extra costs for the transfers between modes only on a longer distance. Therefore, intermodal
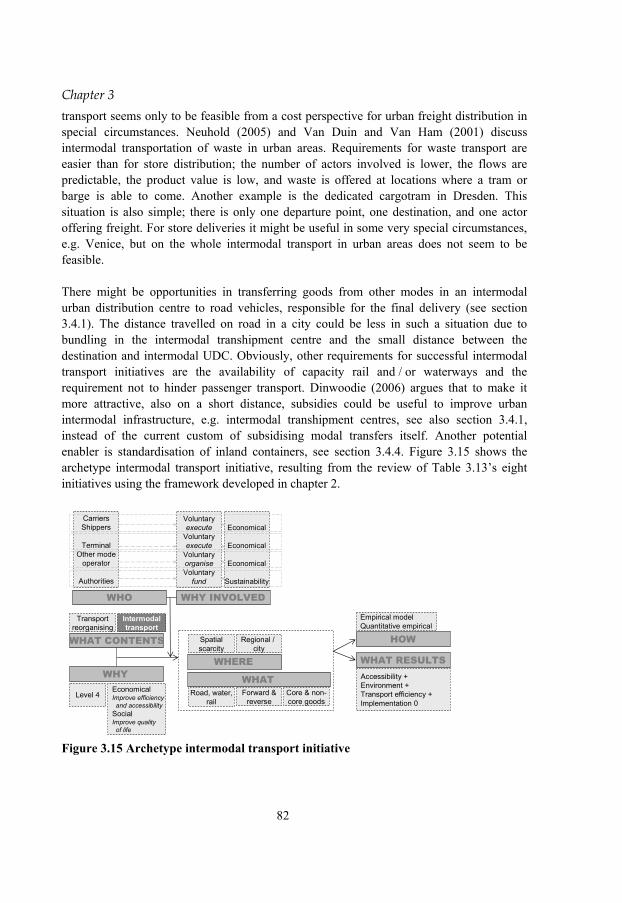
96
Chapter 3
82
transport seems only to be feasible from a cost perspective for urban freight distribution in special circumstances. Neuhold (2005) and Van Duin and Van Ham (2001) discuss intermodal transportation of waste in urban areas. Requirements for waste transport are easier than for store distribution; the number of actors involved is lower, the flows are predictable, the product value is low, and waste is offered at locations where a tram or barge is able to come. Another example is the dedicated cargotram in Dresden. This situation is also simple; there is only one departure point, one destination, and one actor offering freight. For store deliveries it might be useful in some very special circumstances, e.g. Venice, but on the whole intermodal transport in urban areas does not seem to be feasible. There might be opportunities in transferring goods from other modes in an intermodal urban distribution centre to road vehicles, responsible for the final delivery (see section 3.4.1). The distance travelled on road in a city could be less in such a situation due to bundling in the intermodal transhipment centre and the small distance between the destination and intermodal UDC. Obviously, other requirements for successful intermodal transport initiatives are the availability of capacity rail and / or waterways and the requirement not to hinder passenger transport. Dinwoodie (2006) argues that to make it more attractive, also on a short distance, subsidies could be useful to improve urban intermodal infrastructure, e.g. intermodal transhipment centres, see also section 3.4.1, instead of the current custom of subsidising modal transfers itself. Another potential enabler is standardisation of inland containers, see section 3.4.4. Figure 3.15 shows the archetype intermodal transport initiative, resulting from the review of Table 3.13’s eight initiatives using the framework developed in chapter 2.
WHAT CONTENTS
WHY
WHY INVOLVEDWHO
HOW
WHAT RESULTS
WHAT
WHERE
Transportreorganising
Intermodaltransport
Accessibility +Environment +Transport efficiency +Implementation 0
Road, water,rail
Forward &reverse
Core & non-core goods
Spatialscarcity
Regional / city
Level 4EconomicalImprove efficiency
and accessibility SocialImprove quality
of life
Economical
Economical
Economical
Sustainability
CarriersShippers
TerminalOther mode
operator
Authorities
Voluntaryexecute
Voluntaryexecute
VoluntaryorganiseVoluntary
fund
Empirical modelQuantitative empirical
Figure 3.15 Archetype intermodal transport initiative

97
Improving sustainability: a review of initiatives
83
3.6 Analysis and discussion of UFTS initiatives In this section we discuss the main results per initiative category based on what Flood (1999a) introduces as ‘systemic thinking’. Flood (1999b) mentions interrelatedness and boundary judgments as central issues in systemic thinking. Interrelatedness means that “everything is interrelated with everything else”. To deal with the complexity that follows from this interrelatedness, boundary judgements determine the action area, i.e. those stakeholders, issues, and dilemmas that are considered in an initiative and those left out. Flood (1999b) introduces four ‘windows’ to look at an action area, the UFTS initiative: 1. Systems of processes include two central concerns: efficiency and reliability. The actor
who is the initiator defines the action area. We roughly distinguish five main systems of processes, based on the framework’s actor-typology, the ‘who’-dimension, that differ considerably in their scale: • From the national governmental point of view all (freight) transport processes and their
direct impacts on a national level might be included, in which one city is only a small part.
• From the local authorities’ point of view all goods transport activities in a city (centre) might be included.
• From a shipper’s point of view the organisation of the transport to the stores in multiple cities might be included, if the shipper is part of a retail chain (see Figure 1.2).
• From a carrier’s point of view its logistical operations, for example handling and storage at a distribution centre or transport to the stores, might be included. These processes, depending on the carrier, are carried out on regional, national, or even international scale. The logistical processes usually exceed the boundaries of one city.
• From the receiver’s point of view the action area is usually limited to processes at one location, e.g. a store.
2. Systems of structure describe the entire set of rules and regulations in an UFTS initiative. A structure’s effectiveness depends on the emphasis on rules and procedures.
3. Systems of meaning show the type of ‘agreement’ between the different actors in an UFTS initiative. Flood (1999b) distinguishes three types of agreements: consensus (strong agreement), accommodation (finding a common ground, whilst preserving other differences in opinion), and toleration (tension between actors).
4. Systems of knowledge-power show the fairness of an UFTS initiative. For example, who benefits from the UFTS initiative and who does not.
3.6.1 Policy initiatives The local authorities are the main actor in road pricing initiatives and licensing and regulation initiatives. This implies the initiatives’ action area is bounded to transport activities in one city. In most of these initiatives the carrier is the second actor. Only a limited part of the carriers’ logistical operations is included in the initiative. The objective of the initiative, improving sustainability in a city, is usually not noticed in the logistical operations (or performance) of the carriers. The sustainability improvement from the local authorities’ point of view often results in a deterioration of the carriers’ logistical

98
Chapter 3
84
performance. Therefore, many initiatives strongly depend on regulations and sanctions to force carriers to cooperate. For example, enforcement is mentioned as success factor in 54% of the implemented licensing and regulation initiatives (see Table 3.3). For road pricing, parking and unloading, and some dedicated infrastructure initiatives, carriers and local authorities share the same problem perception, i.e. congestion or reduced city accessibility. If this is the case, i.e. the UFTS initiative’s objective (‘why’-dimension) corresponds to the reason to be involved (‘why-involved’ dimension), then the initiative’s results appear to be more positive. So enforcement is not the only success factor. The policy initiatives show the knowledge-levels of local authorities of logistical operations, which are largely carried out outside the boundaries of the initiative, are usually limited. On the other hand, carriers usually also lack knowledge about the sustainability objective of initiatives. The lack of interaction between local authorities and carriers (see e.g. Figure 1.2) prevents an increase in understanding of each others’ issues. Receivers could form a link between the local authorities and the carriers and so start interaction. They completely act within the local authorities’ narrow bounded initiative’s action area and are also part of the carrier’s logistical operations. However, the archetypes in Figure 3.1 through Figure 3.3 show receivers are usually not involved in policy initiatives. Higher governments could also stretch the initiative’s action area, which is defined by local authorities. This would open up possibilities for harmonisation of different city initiatives, so that these initiatives are more in line with the regional logistical operations. However, in most policy initiatives higher governments do not play a role (see Table 3.2 through Table 3.4). Table 3.3 shows that licensing and regulation initiatives score mainly negative in the results, except for the three initiatives in which the restrictions are relaxed. Especially time-windows and vehicle restrictions are frequently used (Dablanc, 2007; OECD, 2003). In spite of the popularity of these policy measures only little is known about their impacts outside the initiative boundaries defined by the local authorities, see section 3.2.2 (Allen et al., 2003). We examine the impacts of these restrictions on a larger scale action area (e.g. the global environment and the different carriers’ logistical operations) in more detail in the chapters 4 and 5. 3.6.2 Company driven initiatives The main actor in most company driven initiatives is the carrier. This implies that the initiative’s action area corresponds to the carriers’ logistical operations. However, two thirds of the reviewed initiatives are initiated by researchers (see Table 3.5 through Table 3.7). Researchers stretch the boundaries of the action area; carrier cooperation initiatives contain several carriers’ logistical operations in one city (centre), whereas researchers include sustainability as an issue in the logistical operations in most company driven initiatives. Only one of the researcher-initiated initiatives has been implemented in practice. Apparently there is a serious lack in (direct) interaction between academia and the carriers. Especially carrier cooperation and vehicle routing improvement initiatives focus on
99
Improving sustainability: a review of initiatives
85
improvements in the logistical operations and have only an economic incentive rather than a sustainable incentive (see Table 3.5 and Table 3.6). Based on the limited number of implemented initiatives in practice, a real incentive for carriers appears to be lacking. This type of initiative asks for unanimity between the logistical operations of more than one carrier. Kawamura and Lu (2006) argue this type of cooperation, due to costs for reaching agreement, can be quite costly from a business perspective, which is the opposite of an incentive. One of the few implemented initiatives, the cooperation in the German city Kassel, was not successful in the end (Koehler, 2004). Only 23% of the reported initiatives in Table 3.5 through Table 3.7 have been implemented in practice. An explanation for this low percentage could be that private stakeholders are not always aware of the fact that urban freight transport is organised unsustainably or that they are able to make it more sustainable. In the previous section we already argued that sustainability is not an issue in the view of most carriers. Some of the policy initiatives, discussed in the previous section, aim at making it an issue, e.g. load factor controls to initiate carrier cooperation and low emission zones to initiate technological vehicle innovations. Koehler (2004) argues that a mediator could stretch up the initiative’s boundaries so that sustainability becomes an issue in logistical operations of carriers as well (see also the example of the receivers in the catering industry in The Hague in section 3.3.1). 3.6.3 Physical infrastructure initiatives Similar to the policy initiatives, local authorities are the driving force for physical infrastructure initiatives. Similar to company driven initiatives, most initiatives are initiated by researchers. As a result, the challenges for this category are similar to the previous categories. Some of these initiatives, i.e. underground logistics systems, are so radical that it is not even clear what kind of interaction will occur between the different actors. Again we notice the local authorities define an initiative’s action area which does not correspond to the larger geographical area in which the carriers’ logistical operations take place. In some initiatives the local authorities also play a more private role, e.g. they offer or finance transport services from the urban distribution centre (UDC) or manage the UDC (see e.g. Van der Poel, 2000). The authorities’ legislative role could appear to favour the authorities’ transport services. In these initiatives, interaction between the local authorities and the carriers appears to be limited. Some consolidation centre initiatives force carriers to make use of an UDC without considering the implications for the carriers’ logistical performance. Other (non compulsory) centre initiatives show better knowledge of logistical operations. They offer a ‘service’ to those carriers and receivers that can improve their performance by using it; e.g. making it easy for intermodal long-haul transport to tranship to road transport for the final deliveries, or for carriers with low volume and high frequency deliveries of simple products. The standardisation of load-units initiatives aim at bridging the regional carriers’ logistical operations and the narrow bounded local urban freight transport initiatives by making this switch easier. An important question is why the physical infrastructure initiatives do not come from private actors. Is this because of the high initial costs only, or are these initiatives financially not feasible on the long term? Only 23% of the physical infrastructure initiatives is implemented in practice and of these actually

100
Chapter 3
86
implemented initiatives the majority (4 out of 7) were hardly successful (see Table 3.8 through Table 3.11). Therefore, the high uncertainties of the results form a barrier. On the other hand these initiatives show more potential to increase sustainability than any other discussed initiative category. Public private partnerships (PPP) are mentioned in several physical infrastructure initiatives as potential success factor (see e.g. Browne et al., 2004; Dablanc, 2007; Hesse, 2004; Heuer, 2004; Ishida et al., 2006). 3.6.4 Transport reorganising initiatives The initiatives in this review show that intermodal transport initiatives only make sense in a local action area, e.g. the city, under special circumstances (see Table 3.13). Examples are specific geographical circumstances, e.g. many waterways in Venice, or a specific flow, e.g. dedicated point-to-point flow for the cargotram in Dresden, or a specific product type, for example waste collection (Van Duin and Van Ham, 2001). The transport auctioning initiatives aim at redesigning the interaction between the carriers and the shippers. Researchers initiate this type of initiative. Table 3.12 shows that currently private companies seem not to be too keen on cooperating on a large scale in these initiatives in practice. The improvements for the individual actors are highest if only ‘non-profitable’ orders are brought in for auction (see also Takahashi et al., 2004). As a result at the higher level, with several shippers and carriers, i.e. the auction, no large scale positive results have been realised in practice. 3.7 Conclusions With the framework, developed in chapter 2, it is possible to structure the urban freight transport field. With the framework we were able to map and classify all 106 UFTS initiatives in 4 categories and 12 initiative types and to design 12 initiative archetypes. Many UFTS initiatives were not successfully implemented in practice. In the final section of this chapter we discuss lessons learned and remaining challenges. Local authorities’ knowledge of carriers’ logistical operations appears to be inadequate, whereas carriers only know little about local authorities’ sustainability issues. Next, there is little interaction between the local authorities and the carriers, which prevents the actors from obtaining insights in each others’ problems. An initiative is doomed to fail in case the initiator is not able to realise the implications of an initiative outside its own defined (narrow-bounded) action area. The relation between the ‘why-involved’, the ‘why’, and the ‘who’ dimensions (i.e. the roles of the actors and their incentives, especially that of the initiator and the main actor) is the most important in explaining the degree in which initiatives are implemented successfully in practice. Active involvement of the main actor shows whether there is a real incentive for that actor to change its behaviour in an initiative, also on the longer term. If the reason for the initiative (see ‘why’ dimensions), which is the initiator’s objective, does not match the ‘why-involved’ dimension, the initiative is doomed to be unsuccessful. Many of the policy initiatives and company driven initiatives expect carriers to change their behaviour. Although carriers are responsible for the urban freight
101
Improving sustainability: a review of initiatives
87
transport operations, they seem to lack either the power or the willingness to make urban freight operations more sustainable. Initiatives are not implemented successfully in practice unless the initiative results in an improvement in the logistical operations. An initiative, in which this is not the case, appears only to be implemented successfully if the actors are forced to change their behaviour due to legislation, see e.g. policy initiatives. These initiatives are considered unfair by the carriers and raise resistance, which makes enforcement necessary to let them function in practice. Obviously, it would be better to entice an actor to be involved. This is only possible if sufficient knowledge is available about the initiative’s impacts on the carriers’ logistical performance. There are other ways to let actors cooperate in an initiative than the current emphasis on regulations and the corresponding need for control and sanctions. Increasing the involvement by common-sense-making among the actors is the first step. By increasing the actual knowledge of each others actions and problems and so stretching the boundaries of the initiative’s action area, it might be possible to find solutions in which an improvement for the one actor does not lead to deterioration for the other, but to an improvement as well. Interaction between the different actors would widen their bounded action area and increase mutual knowledge and understanding. Already in the design phase of an initiative, the initiator should find stimuli for all actors that are expected to change their behaviour. This is only possible if the initiator possesses knowledge of the involved actors and the areas they act in. Currently, the lack of real stimuli in the design of the initiative results in a strong emphasis on legislation. To actually change actors’ behaviour, an initiative could aim at an actor that is able to increase the interaction between the different actors and their actions, e.g. receivers or the higher government. Usually receivers’ boundary judgements also prevent them from linking carriers and local authorities. The independent receiver feels closely related to the action area defined by local authorities, i.e. the city, while the retail chain receiver is really part of the carriers’ logistical operations (see also Figure 1.2). Sometimes receivers are not aware that they are responsible for the unsustainable transport operations. The higher government considers many urban freight transport issues to be local and is therefore not involved. Some initiatives that focus on bundling and transhipment at city borders are examples of how inadequate knowledge could result in unsuccessful initiatives. Implicitly these initiatives aim at LTL deliveries to urban areas. Increasing local authorities’ knowledge of the logistical operations, resulting in a distinction between FTL and LTL deliveries, could prevent an undesired side-effect of such an initiative. If FTL deliveries are also included in these initiatives, a decrease in efficiency of these deliveries and an increase in the number of vehicles could be the result. The initiative might work for LTL deliveries, but turns out to be unsuccessful due to the negative effects for FTL deliveries. Interaction is not only lacking between local authorities and carriers, but also between both of these actors and academia. Observing the urban freight transport field we can state that there is a gap between research and practice. Issues on cooperation, consolidation, transport reorganisation and routing improvement are typical academic playing fields. Although many of these studies can be useful to practice, most of the research contributions appear in reviewed articles and books and transition to practice is seldom realised. Next, many
102
Chapter 3
88
initiatives that are presented only show preliminary results. However, especially the longer term effects of an initiative are interesting for others and could provide valuable lessons. Currently, after the first results, the initiative is either terminated or continued. In the last case the preliminary results were probably positive. The interest or the available budget drops after a while, and no new long-term evaluations are carried out. This limited time horizon may cause positively biased initiative results. Examples of failed initiatives and the lessons, the factors that were the basis for failure, or the barriers are hardly available in the reviewed literature. An exception is Koehler (2004) who discusses the problems in the end, after the initial positive effects of the Kassel initiative. Schoemaker (2000) and Van der Poel (2002) also discuss the failed UDC in Leiden. Finally, most initiatives lack detailed information on the two dimensions in the execution phase, i.e. ‘where’ and ‘what’ (see Figure 2.2). As a result, it is difficult to relate the other dimensions and the initiative’s results to the geographical circumstances and the transport organisation. Therefore, predicting the transferability of the initiative to other regions or lines of industry than the one reported is hardly possible due to the absence of detailed information of these two dimensions.

103
PART II DEALING WITH LOCAL
SUSTAINABILITY POLICIES: THE IMPACTS, SENSITIVITY, AND
OPPORTUNITIES

104
105
91
4 Impacts of local authorities’ time-window policies
This chapter examines the impact of time-windows on retailers’ operational, financial, and environmental performance. In six main scenarios we evaluate different time-window schemes, such as the current Dutch time-window regulations, harmonised time-windows, nightly time-windows, and time-windows based on a proposal by the Dutch Committee for Urban Distribution (CSD, 2006). In another scenario we vary the time-window pressure, by changing the number of time-window affected cities and the time-window length in 18 sub scenarios. To find the different performances we use a case study with 14 different retail chains (see for more information Appendix A). This chapter is set up as follows: the first section is an introduction. In this section we briefly discuss how time-window regulations fit in the urban freight transport context, after which this chapter’s research questions are stated. In the second section we discuss the current Dutch time-window policies, based on interviews with municipalities’ policy-makers. In the third section we formulate our research model, which is also used in the first part of chapter 5, and develop the relevant constructs. Section 4.4 deals with the methodology, i.e. the case selection procedure and the research protocol, used in this chapter. We also discuss validation and reliability issues here. The fifth section deals with different time-window scenarios, after which section 4.6 shows the results. The last section contains this chapter’s conclusions. 4.1 Introduction Marshall and Toffel (2005) structure sustainability-issues in a four-level hierarchy, in which the successive levels refer to increasingly higher order sustainability needs (Figure 2.4). Transport impacts multiple levels of Marshall and Toffel’s hierarchy. Several authors (e.g. Feitelson, 2002; Nicolas et al., 2003; Richardson, 2005) distinguish three sustainability issues: environmental sustainability, economic sustainability, and social sustainability, also known as the triple-bottom-line or triple-P: people, profit, and planet. A popular policy measure to improve the social sustainability in urban areas, especially in Europe, is the use of time-access restrictions (OECD, 2003). A time-access restriction, or time-window, forces the distribution activities to take place within a specified period of the day. The objective of time-windows is to improve the shopping climate in shopping areas by reducing the perceived impacts caused by large vehicles, such as visual intrusion, intimidation, safety infringement, vibration and noise (Allen et al., 2004) and to separate the freight carriers from the shopping public who use cars to visit the shopping areas (Munuzuri et al., 2005).

106
Chapter 4
92
Apparently, time-window restrictions are effective, as the OECD (2003) report shows that they gain in popularity in many, especially Western European, countries. In the Netherlands, for example, only 41% of the municipalities used time-windows in 1998; this increased to 53% in 2002. In particular, the larger municipalities use time-windows: 71% of the top 100 largest municipalities and all top-20 municipalities in the Netherlands use them. More recent research shows that in 2006 96% of the 31 largest Dutch municipalities use time-windows (BCI, 2006). Simultaneously, the average time-window length decreases (PSD, 2002b). Many carriers consider time-windows to be one of their most urgent problems in distributing goods in urban areas (Crum and Vossen, 2000). Groothedde and Uil (2004) estimate that time-windows increase the yearly cost to Dutch retailers by about 270 million euros. As local authorities have substantial autonomy, time-window restrictions differ between municipalities and are not harmonised. Carriers operate in several cities and are therefore confronted with a wide range of local restrictions (Munuzuri et al., 2005). The Dutch Minister of Transport decided, in line with the policy framework of the OECD (2003), to explore the possibilities of a more centrally governed time-window policy (Lemstra, 2004). In the report Lemstra advises to harmonise time-windows regionally. He also suggests to look at the actual lengths of delivery time-windows at the stores, which depend on both the local authorities’ time-windows as well as the retailers’ self-imposed time-windows. This actual time-window should be large enough to supply the outlets, to profit from the positive sides of time-windows and to reduce the negative impacts. Based on Lemstra’s advice, the Minister established the Committee for Urban Distribution (CSD) in early 2005. This committee has as objective to promote the cooperation between public and private parties in the supply of urban areas. Furthermore, the committee is looking for measures that are most profitable for both the society and business. This last objective has led to a reference model for urban distribution, which includes directives for vehicle restrictions and a directive for time-windows (CSD, 2006). One of the scenarios in this chapter examines the impacts of the time-window scheme proposed in the reference model. In spite of the wide use of time-windows and the extensive discussions, little is known about the impact of time-window pressure on retailers’ distribution costs and their environmental consequences (Anderson et al., 2005). In this chapter we address this issue, using a multiple (14 in total) case study approach. Although all the cases are Dutch, we consider the results to be valid for the entire Western European context. As mentioned earlier, time-windows are not a Dutch phenomenon only, but are widely used in especially Western Europe. Furthermore, the Dutch context is representative of the Western European context: all retailers use trucks as a major transport mode to supply their stores and most of the store supply comes from retail warehouses. Furthermore, the costs structure, consisting of, for example, driver’s wages, vehicle maintenance costs, and fuel costs, is also comparable in Western European countries. Some of the retailers involved in this study actually operate in multiple European countries and indicated to us that they did not see serious differences in their distribution and logistics operations between these countries.

107
Impacts of local authorities’ time-window policies
93
This chapter is explorative in nature, as we explore retailers’ operations reactions as well as financial and environmental performance to varying Time-window pressure. We adopt a multiple case study method to address the research questions (Eisenhardt, 1989; Yin, 2003). We follow the case research steps as proposed by Voss et al. (2002). In this multiple case study we use a scenario analysis, employing vehicle routing software to calculate realistic retailer delivery routes, to assess the impact of Time-window pressure on the dependent constructs Operational, Financial, and Environmental Distribution performance taking into account a retailer’s characteristics, restraints and choices. This research specifically aims at answering the following two research questions:
1. What is the impact of increasing time-window pressure on a retailer’s financial and environmental performance?
2. What are the effects of different time-window policy schemes on (i) retailers’ costs, (ii) local and global pollution, considering time-window objectives, such as (iii) the city centre’s attractiveness and safety as well as the nuisance for residents?
The first research question focuses on the exact effects of changes in Time-window pressure on Distribution performance. Previous research (e.g. Allen et al., 2003; Groothedde and Uil, 2004) shows that time-window restrictions cause an increase in distribution costs. However, how exactly this effect changes in the case the time-window pressure varies, is still an unknown area. The second research question examines the impact of different time-window schemes that are mentioned in policy documents, but are not (yet) implemented in practice and for which the impacts are still unknown (see e.g. CSD, 2006; PSD, 2001b). In order to carefully measure the impact of Time-window pressure on the retailers’ Distribution performance, the choice of unit of analysis should reflect a retail organisation’s distribution process to the stores. The large majority of product flows to the stores are supplied via the retailers’ distribution centres (De Koster and Neuteboom, 2001). We therefore select the retailer’s physical distribution process during one representative week between one distribution centre and the stores that are supplied from that centre as our unit of analysis, or case definition (Voss et al., 2002). 4.2 Time-window policies in the Netherlands Interviews with city policy-making officials responsible for their municipality’s time-window policy give insights in Dutch local authorities’ objectives to use time-window policies in the Netherlands. Our interviews show that Dutch cities’ objectives correspond with those discussed in literature (Allen et al., 2004; Munuzuri et al., 2005). The original sample for the interviews was the 50 largest Dutch cities; Table 4.1 shows the final sample of 33 cities of which the policy-making official for time-window regulations cooperated in these interviews. Reasons for cities not to cooperate were that they did not use time-window policies (6), they did not have time to cooperate (2), or the person responsible for urban distribution policies left the municipality and there was no replacement yet (3). The remaining municipalities did not reply to the invitation for the interview and the following

108
Chapter 4
94
reminders. The interviews were conducted in early 2006, mainly by e-mail and telephone. We focused in these interviews on four elements:
1. The main objective to use time-window policies. 2. The effects of time-windows on this objective. 3. The measurement of these effects. 4. The official’s opinion on the effects of time-windows on the:
o Environment o Noise o Safety o Quality of shopping environment o Accessibility o Economic development.
This section briefly summarises the main results of these interviews. Almost all (over 90%) of the 33 interviewed policy-making officials mentioned improving the shopping climate and the attractiveness of the centre as (one of) their main objectives to use time-windows. Reasons to improve a city centre’s attractiveness turned out to be twofold: • It is considered a local authorities’ task to provide their residents with an attractive
centre and it increases the ‘quality of life’ for city residents. • Different cities are competing for visitors, as the density of cities is high in the
Netherlands, and people can choose between different nearby city centres for shopping. Other reasons to use time-windows were mentioned less frequently. Some policy-making officials mentioned reducing the inconvenience (noise, stench, traffic blockades by unloading vehicles) or improving the safety of pedestrians in shopping areas. Finally, some officials expressly cite reducing noise nuisance for residents in the early morning as an important objective (about 10% of the responding officials). Table 4.1 Cities of which we interviewed policy-making officials responsible for time-
window policies Alkmaar Breda Groningen Leidschendam-Voorburg Amersfoort Deventer Haarlem Maastricht Utrecht Amstelveen Dordrecht Helmond Nijmegen Veenendaal Amsterdam Ede Hengelo Oss Venlo Apeldoorn Eindhoven Hilversum Roosendaal Zeist Arnhem Enschede Leeuwarden Rotterdam Zwolle Bergen op Zoom Gouda Leiden Sittard-Geleen The vast majority of the officials argue, as answer on the second question about the actual effects of time-window policies on the objective, that time-windows did improve the attractiveness of their shopping centres and the quality of their shopping environments, although none of them (objectively) measured or examined it. They argue that anyone can see that the city centre is more attractive without (large) vehicles. A similar argument applies to the effects on the other objectives mentioned to use time-windows. In most cases

109
Impacts of local authorities’ time-window policies
95
there is no measurement of these effects, but officials argue that the effects can simply be observed by looking at the time-window area. Table 4.2 Official’s opinion on the effects of time-windows Official’s opinion on the effects of time-windows on:
posi
tive
neut
ral
nega
tive
othe
r
Local environment 6 8 3 Global environment 3 10 6 Noise nuisance reduction 7 3 1 10 (overall positive, but during the time-
window period negative) Safety (e.g. accidents and pedestrian and cyclists safety)
15 1 also subjective safety feeling increases
Quality of shopping environment
24 1
Accessibility 6 6 2 3 (during time-window negative, outside time-windows positive)
Economic development 8 4 1 Table 4.2 shows the opinion of the policy-making officials on the effects of time-windows on different urban area issues. Some officials explicitly stated that this was not merely their own opinion, but it was based on what they learned from entrepreneurs and the city centre’s residents. Although not explicitly stated as objectives, officials are also positive on safety and noise nuisance reduction; there are less people in the area during the time-window period, since the city centres are usually not so crowded during the morning hours, the nuisance decreases and the safety increases. 4.3 Theoretical foundation and construct development Many textbooks use schemes which show the relations between competitive strategy, distribution networks, and distribution performance (see e.g. Chopra and Meindl, 2004; Stock and Lambert, 2001; Van Goor et al., 2003). However, only little literature uses constructs that measure distribution organisation and (financial and environmental) performance. Validated constructs available from literature (as reviewed by Chen and Paulraj, 2004; Keller et al., 2002) can not be used in this study. Therefore, we base our research model and the resulting variables on the framework of Van Goor et al. (2003), see Figure 4.1. This framework shows that external factors, not part of the Logistical concept, influence the decision possibilities in a company’s Logistical concept. This concept, in turn, determines the distribution performance; if the distribution performance is not at the desired level, changes can be made in the Logistical concept in the long run. The external factors can be changed as well, if other possibilities are required in the Logistical concept (see Figure 4.1). Allen et al. (2004) argue that only little research on urban goods distribution studies the

110
Chapter 4
96
likely impact of urban freight policies on distribution operations and the likely or possible reactions of retailers. Urban policies are usually not considered in designing the company’s Logistical concept, as can also be derived from their absence in Figure 4.1. The Logistical concept determines how a company organises its distribution for all its activities and locations. Since a retail chain usually delivers goods to stores in different cities, it faces different local policy measures moderating the impact of the Logistical concept on the distribution performance.
Supply chainstrategy
Network structureNetwork typologyInventory levels
Transport organisation
Logistical planningInformation organisationHandling organisation
FinancialEnvironmentalOperational
Distribution performance
External factorsCompetitive strategy
Supply characteristicsDemand characteristicsCustomer service levelsProduct characteristics
Logisticalconcept
Figure 4.1 Drivers for distribution performance, based on Van Goor et al. (2003) Our research framework (Figure 4.2) does not include external factors, such as the company’s competitive strategy and product characteristics, which indirectly influence the retailers’ distribution performance (Van Goor et al., 2003). Heizer and Render (1999) distinguish three basic competitive strategies: competing on differentiation (e.g. Benetton), competing on costs (e.g. Wal-Mart), and competing on response (e.g. Zara). Product characteristics differ in their product volume and value (Van Goor et al., 2003) as well as in their complexity. A retailer’s assortment can be simple, i.e. containing products that are non-perishable, non-fragile, requiring no special handling in storage or transportation, or complex (De Koster, 2003). These external factors have an immediate effect on the possibilities a retailer has to design its supply chain strategy, its network structure, and its logistical planning. Supply chain strategy Retailers deal with their supply and demand characteristics in their supply chain strategy (Fisher, 1997; Lee, 2002). The supply chain strategy has to find a balance between responsiveness and efficiency (Chopra and Meindl, 2004). In this thesis, the supply chain strategy is efficient, responsive, or a mix of these two (Chopra and Meindl, 2004; Fisher, 1997; Randall et al., 2003). Basically, the supply chain strategy follows from the retailer’s

111
Impacts of local authorities’ time-window policies
97
competitive strategy. Retailers competing on costs focus on efficiency in their supply chain strategy and retailers competing on response usually concentrate on responsiveness in their supply chain strategy. Retail chains competing on differentiation have different product group focus; they follow a mix between responsiveness and efficiency.
Network structure•Distance stores – DC•Locations in shopping centres•Delivery frequency•Drop size•Vehicle capacity
Logistical planning•Self-imposed time-windows•Unloading time per vehicle
FinancialDistribution costs (euros)Environmental•CO2 emissions (grams)•CO emissions (grams)•NOx emissions (grams)•PM10 emissions (grams)
Operational•Total driving time•Number of vehicle kilometres•Load factor•Vehicle utilisation
Distribution performance
Logisticalconcept
Supply chainstrategy
Vehiclerouting
Time-window pressure•Number of time-window restricted areas•Time-window length
Retailers’ reactions
Figure 4.2 Research framework: constructs and their dimensions Network structure The network structure consists of three main elements: the network typology, the inventory levels, and the transport organisation (Ballou, 1992; Chopra and Meindl, 2004; Van Goor et al., 2003). The network typology reflects a retailer’s facility decisions, i.e. the number and locations of the facilities (Chopra and Meindl, 2004). Since our unit of analysis is restricted to all deliveries from one distribution centre, only location decisions differ between cases. We therefore propose measuring network typology by two dimensions: • Distance between distribution centre and stores, measured by the average distance
between the retailer’s stores and the considered retailer’s distribution centre. • Percentage of stores located in shopping areas, as local time-window restrictions
normally only apply to stores located in shopping areas. Addresses and zip-codes of shopping areas were obtained from Groothedde and Uil (2004).
The inventory levels in the stores are primarily determined by the delivery frequency and the quantity per delivery, the drop size (Stock and Lambert, 2001; Waller, 1995). The inventory policy strongly influences the transport organisation: transportation economies are possible by large volume shipments (in full truckloads, FTL), but then larger inventories have to be stored in the distribution centre or in the stores, which leads to higher inventory costs (Stock and Lambert, 2001). Our case definition implies that we consider only two inventory location types per case: the retailer’s distribution centre and the retailer’s stores. Therefore we propose measuring inventory levels by two dimensions:

112
Chapter 4
98
• Delivery frequency, measured by the average number of deliveries per store per week. • Drop size, measured as the fraction of vehicle capacity used for an average drop. This
implies that the drop size partly depends on the vehicle capacity. FTL (full truckload)-deliveries are characterised by a drop size of one, as LTL (less than truckloads) are characterised by a value lower than one. The number of stops per roundtrip is therefore directly related to the drop size, i.e. the value for stops per roundtrips equals the (multiplicative) inverse of the drop size value.
Finally, all retailers use trucks as only transport mode. We therefore use only one dimension to measure transport organisation: • Vehicle capacity, in order to measure vehicle capacity, we follow McKinnon et al.
(2003), who distinguish six different vehicle types, sorted on increasing load capacity: 1. Small rigid (2 axles and under 7.5 tonnes). 2. Medium rigid (2 axles and between 7.5 and 18 tonnes). 3. Large rigid (2 axles and over 18 tonnes). 4. City semi-trailer (3 axles). 5. Articulated vehicle (at least 4 axles). 6. Drawbar combination.
Many retailers use different vehicle types. If ni is the number of vehicles of type i,
vehicle capacity is measured by ∑∑ ×
ii
ii
n
ni.
Logistical planning Figure 4.2 shows an interaction between Network structure and Logistical planning. For example, if distances between distribution centres and stores become larger, transport costs increase and replenishment quantities will increase. This Logistical planning is especially determined by information and handling organisation (Van Goor et al., 2003). For retail chain organisations in Western Europe, information technology is not a main discriminator from competitors. Even hard-discounters like Aldi have moved to point-of-sale information systems and barcode technologies in their stores (Dawson, 2005). Controlling replenishment flows to the stores is also not a main distinction, as nearly all retailers use a mix of push and pull control (Chopra and Meindl, 2004). New assortments and promotional products are often pushed (divided over the stores using a central mechanism), whereas the normal assortment is usually pulled by store sales. Handling organisation is an important part of the logistical planning (Chopra, 2003). In our definition of the unit of analysis, handling activities are limited to truck (un)loading at the retailer’s stores. Munuzuri et al. (2005) argue that the time it takes to make a delivery might influence the effect that urban freight regulations have on retailers. Therefore, we include the dimension: • Unloading time per vehicle. This dimension is the average time (in minutes) used per
vehicle to load and unload at the stores during a roundtrip. This mainly depends on: o Stopping time per stop. o If people in the store help out unloading.

113
Impacts of local authorities’ time-window policies
99
o Collection of returns, product carriers, and waste. o The vehicle capacity (large vehicles usually take more time to park). o The number of deliveries per roundtrip (see drop size). o The distribution materials retailers use. o Requirements for the driver (e.g. it takes more time if the driver has to deliver the
goods directly to the store racks than in case the driver is allowed to leave the goods in a store’s depot).
For example, one retailer in this study uses a detachable swap body (a special type large rigid) that can be left at the store (see Appendix A). This implies no combined trips and short loading and unloading times at stores and distribution centre (De Koster and Neuteboom, 2001; Geerards and De Vrij, 1999). The unloading time also includes a fixed time per stop, in which a driver parks the truck and reports that he has arrived.
Some retailers use self-imposed time-windows to plan the loading and unloading at the stores, for example, to make sure extra staff is available. Other retailers supply their stores at times no staff is available at all - during the night or early morning. In order to deliver during the night, truck drivers possess a key to a store’s depot. We measure the planned (un)loading time at the stores by: • Self-imposed time-windows, measured by a three-point ordinal scale:
1. Narrow; the self-imposed time-windows limit the store distribution to a smaller period of the day than the normal store’s opening hours.
2. Medium; the self-imposed time-windows allow deliveries to take place only during the period staff is present in the stores. This period corresponds to a large extent to the opening hours of a store, although the self-imposed time-windows usually start earlier, i.e. at 7 a.m. or 8 a.m., whereas the stores open only at 9 a.m. or 9.30 a.m.
3. Wide; the self-imposed time-windows allow the retailer to deliver also outside the hours staff is present, for example, during (parts of) the night.
Retailers’ experiences in Distribution performance can lead to modifications in the Supply chain strategy, Network structure, or the Logistical planning (Chopra and Meindl, 2004). On the long-term it can even lead to changes in the competitive strategy (Stock and Lambert, 2001). Since this study focuses on a shorter term these feedback effects are not included in our research framework (see Figure 4.2). Most of the discussed activities (particularly warehousing and transport) in the Network structure and the Logistical planning can be outsourced (De Koster, 2002; Van Goor et al., 2003). In general, retailers keep full process control and develop at most an arm’s length relationship with logistical service providers (Paché, 1998). Even if transport to the stores is outsourced, it is to asset-dedicated vendors and the shipments are not combined with shipments of others, as the trucks are fully loaded when they leave the distribution centre (Razzaque and Sheng, 1998).
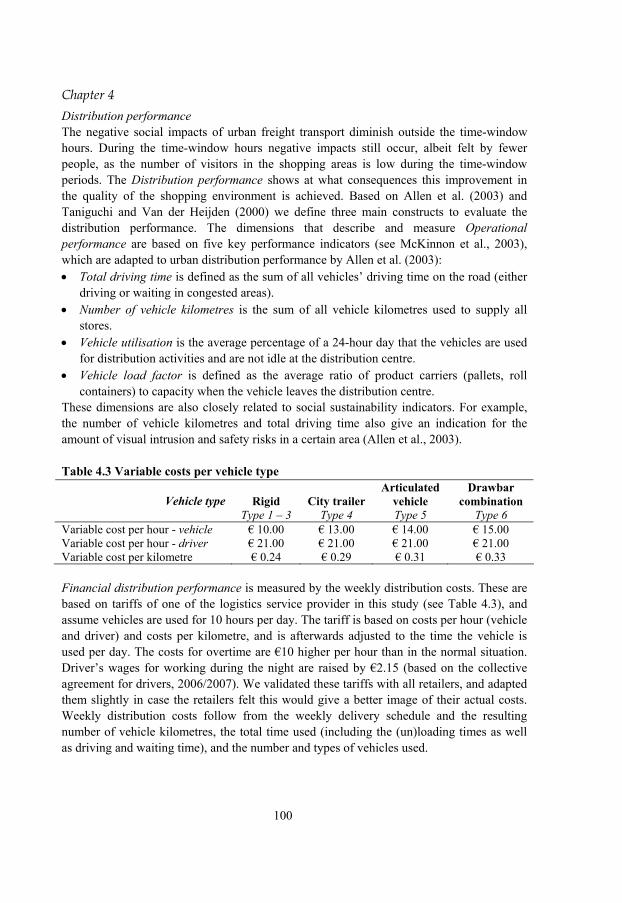
114
Chapter 4
100
Distribution performance The negative social impacts of urban freight transport diminish outside the time-window hours. During the time-window hours negative impacts still occur, albeit felt by fewer people, as the number of visitors in the shopping areas is low during the time-window periods. The Distribution performance shows at what consequences this improvement in the quality of the shopping environment is achieved. Based on Allen et al. (2003) and Taniguchi and Van der Heijden (2000) we define three main constructs to evaluate the distribution performance. The dimensions that describe and measure Operational performance are based on five key performance indicators (see McKinnon et al., 2003), which are adapted to urban distribution performance by Allen et al. (2003): • Total driving time is defined as the sum of all vehicles’ driving time on the road (either
driving or waiting in congested areas). • Number of vehicle kilometres is the sum of all vehicle kilometres used to supply all
stores. • Vehicle utilisation is the average percentage of a 24-hour day that the vehicles are used
for distribution activities and are not idle at the distribution centre. • Vehicle load factor is defined as the average ratio of product carriers (pallets, roll
containers) to capacity when the vehicle leaves the distribution centre. These dimensions are also closely related to social sustainability indicators. For example, the number of vehicle kilometres and total driving time also give an indication for the amount of visual intrusion and safety risks in a certain area (Allen et al., 2003). Table 4.3 Variable costs per vehicle type
Rigid City trailer Articulated
vehicle Drawbar
combination Vehicle type Type 1 – 3 Type 4 Type 5 Type 6
Variable cost per hour - vehicle € 10.00 € 13.00 € 14.00 € 15.00 Variable cost per hour - driver € 21.00 € 21.00 € 21.00 € 21.00 Variable cost per kilometre € 0.24 € 0.29 € 0.31 € 0.33 Financial distribution performance is measured by the weekly distribution costs. These are based on tariffs of one of the logistics service provider in this study (see Table 4.3), and assume vehicles are used for 10 hours per day. The tariff is based on costs per hour (vehicle and driver) and costs per kilometre, and is afterwards adjusted to the time the vehicle is used per day. The costs for overtime are €10 higher per hour than in the normal situation. Driver’s wages for working during the night are raised by €2.15 (based on the collective agreement for drivers, 2006/2007). We validated these tariffs with all retailers, and adapted them slightly in case the retailers felt this would give a better image of their actual costs. Weekly distribution costs follow from the weekly delivery schedule and the resulting number of vehicle kilometres, the total time used (including the (un)loading times as well as driving and waiting time), and the number and types of vehicles used.

115
Impacts of local authorities’ time-window policies
101
The Environmental performance is expressed in the weekly quantity of the global pollutant CO2 emissions and the local pollutant emissions CO, NOx, and PM10 (both from emissions as well as from tire and brake wear). Carbon dioxide influences climate change and is responsible for global warming (Hill, 2001) and can therefore be classified at level 2 of the unsustainability hierarchy (see Figure 2.4). We have to be careful in interpreting the effects of local emissions, like PM10. These effects depend on many other factors, for example, the weather conditions and the physical shape of a shopping area, which may have an impact on the time emissions are retained within the area (Van der Gon, 2006). We assume the total amount of local emissions can be used as good indication for the local environmental impacts of the use of time-windows. Based on the vehicle’s average speed during a roundtrip, the average vehicle weight during a roundtrip, the type of vehicle (articulated or rigid), the engine type (EURO I-IV), and the number of vehicle kilometres we calculated all emissions, using emission tables of NERA (2000), for the retailers’ distribution roundtrips. Time-window pressure Changes in Time-window pressure may force retailers to alter their vehicle routing that is determined by the independent constructs Supply chain strategy, Network structure, and Logistical planning (see Figure 4.2), as the vehicle routing may not satisfy the governmental time-window demands. For example, because of an increase in the number of time-window affected cities, the retailer has to change the order of its visits in roundtrips. The construct Time-window pressure (see Figure 4.2) indicates the local authorities’ time-window policies as they impact the outcome of the independent constructs. We manipulate this construct in a scenario analysis. Time-window pressure is determined by two dimensions: • The number of time-window restricted areas. In the scenarios, we vary the number of
cities of which the shopping areas are affected by time-windows. • The time-window length. This is the length of the time-window, in which (large)
vehicles are allowed in the time-window area. We vary the time-window length in different scenarios.
We incorporated the retailers’ changes as a result of varying Time-window pressure by the retailers’ reactions, which is discussed in a separate section. Besides the theoretical derivation of the constructs and their dimensions, we validated all constructs by confronting several logistics managers (outside the case sample), experts from academia and the former PSD (Dutch Platform on City Distribution) with them. This led to a slightly sharper formulation of the constructs and their dimensions, as finally formulated in Figure 4.2. 4.4 Methodology Case research lends itself to exploratory investigations and is especially useful to answer questions on why, what and how with full understanding of the phenomenon (Meredith,
116
Chapter 4
102
1998). Case study research allows researchers to study a phenomenon in its natural setting. It allows researchers to generate meaningful theory from the empirical observed practice (Voss et al., 2002). This study is explorative in nature, as we explore retailers’ operations reactions and cost sensitivity to Time-window pressure and determine the dimensions that drive the retailer’s Time-window pressure sensitivity (see chapter 5). We use a multiple case study (Eisenhardt, 1989; Yin, 2003) and follow the case research steps as proposed by Voss et al. (2002): case selection, research steps and protocol development, and field research. We have chosen to use the data of real companies that show a variety of truck types, delivery schedules, self-imposed time-windows, unloading facilities at stores, and other characteristics that are hard to replicate in artificial case construction. This empirical richness certainly adds to the sense of reality of this study’s results. Case selection We have chosen to select large retail chains with many stores that are likely to be affected by different time-windows in multiple cities. Stores of large retail chains form a substantial part of the stores in shopping centres in the Netherlands, making it possible to examine many stores per shopping centre with a relatively limited number of cases. Since we are interested in local authorities’ urban freight policies, and these policies usually only apply to shopping centres, we limit the cases to retailers whose stores are at least partially located in city centres, and not solely in peripheries. Most cities contain a similar collection of stores, with the largest share for supermarkets, department stores, fashion stores, and specialist stores, like pharmacies, drug stores, and perfumeries (Boerkamps, 2001). Our theoretical replication procedure (see Voss et al., 2002; Yin, 2003) aims at selecting cases that are affected differently by the same time-window measure, but are similar in other contextual factors; e.g. they are all active (at least) in the same region, the Netherlands, and face the same policy context, have customers with similar spending power, have similar marketing activities, etc. We selected three food retailers (of which one forms two cases), four department store retailers, five fashion retailers, and one drug store retailer. Within a sector, we aimed at selecting retailers that differ especially in their company strategy to cover the complete range of different retailers per sector from the low end to the high end of the market. This resulted in three strategy types for most sectors, viz. a hard discounter, a retailer focusing on cost, and one on response or differentiation. Three of the five fashion chains focus on response, but have different products or target groups. We have only one drug store chain, but since this sector is dominated by low cost strategy chains one is sufficient. Table 4.4 shows the dimension values for the base scenario for all cases. Next, we selected the cases so that they differ in their Logistical concept dimension values. The cases are labelled as follows: the first two characters represent the retailer type, drug store (DR), department store (DS), fashion (FA), and food (FO). Next, for the food retailers the small character represents the flow type; d stands for dry groceries, f for fresh products, and df for both. The next character represents the retailer’s strategy: cost leader (C), differentiation (D), and response (R). The last two characters represent the case number. Appendix A provides more information on the different cases.
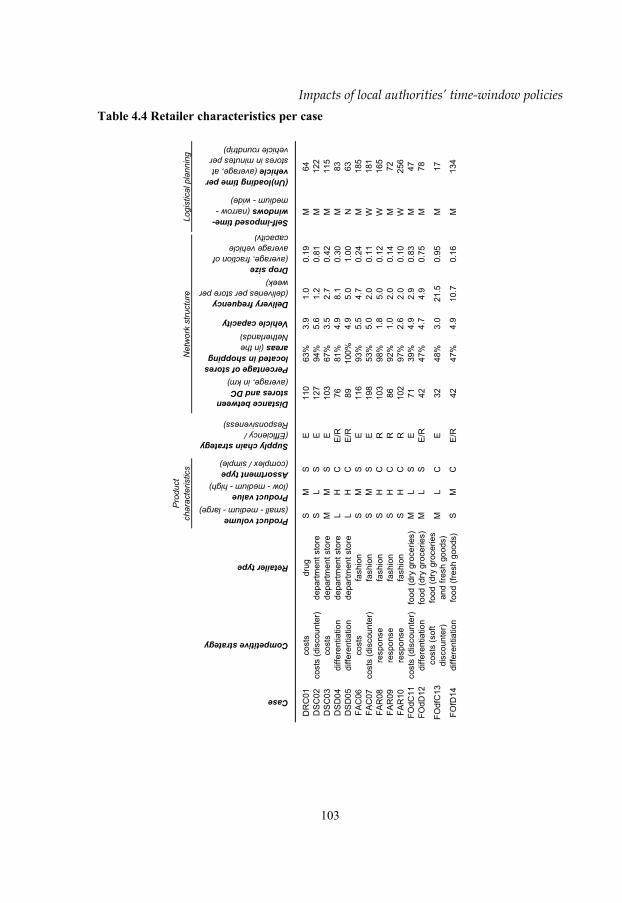
117
Impacts of local authorities’ time-window policies
103
Table 4.4 Retailer characteristics per case
Case
Competitive strategy
Retailer type
Product volume (small - medium - large)Product value (low - medium - high)Assortment type (complex / simple)
Supply chain strategy (Efficiency / Responsiveness)
Distance between stores and DC (average, in km)Percentage of stores located in shopping areas (in the Netherlands)Vehicle capacity
Delivery frequency (deliveries per store per week)Drop size (average, fraction of average vehicle capacity)
Self-imposed time-windows (narrow - medium - wide)
(Un)loading time per vehicle (average, at stores in minutes per vehicle roundtrip)
DR
C01
cost
sdr
ugS
MS
E11
063
%3.
91.
00.
19M
64D
SC
02co
sts
(dis
coun
ter)
depa
rtmen
t sto
reS
LS
E12
794
%5.
61.
20.
81M
122
DS
C03
cost
sde
partm
ent s
tore
MM
SE
103
67%
3.5
2.7
0.42
M11
5D
SD
04di
ffere
ntia
tion
depa
rtmen
t sto
reL
HC
E/R
7681
%4.
98.
10.
30M
83D
SD
05di
ffere
ntia
tion
depa
rtmen
t sto
reL
HC
E/R
8910
0%4.
95.
01.
00N
63FA
C06
cost
sfa
shio
nS
MS
E11
693
%5.
54.
70.
24M
185
FAC
07co
sts
(dis
coun
ter)
fash
ion
SM
SE
198
53%
5.0
2.0
0.11
W18
1FA
R08
resp
onse
fash
ion
SH
CR
103
98%
1.8
5.0
0.12
W16
5FA
R09
resp
onse
fash
ion
SH
CR
8692
%1.
02.
00.
14M
72FA
R10
resp
onse
fash
ion
SH
CR
102
97%
2.6
2.0
0.10
W25
6FO
dC11
cost
s (d
isco
unte
r)fo
od (d
ry g
roce
ries)
ML
SE
7139
%4.
92.
90.
83M
47FO
dD12
diffe
rent
iatio
nfo
od (d
ry g
roce
ries)
ML
SE
/R42
47%
4.7
4.9
0.75
M78
FOdf
C13
cost
s (s
oft
disc
ount
er)
food
(dry
gro
cerie
s an
d fre
sh g
oods
)M
LC
E32
48%
3.0
21.5
0.95
M17
FOfD
14di
ffere
ntia
tion
food
(fre
sh g
oods
)S
MC
E/R
4247
%4.
910
.70.
16M
134
Pro
duct
ch
arac
teris
tics
Logi
stic
al p
lann
ing
Net
wor
k st
ruct
ure
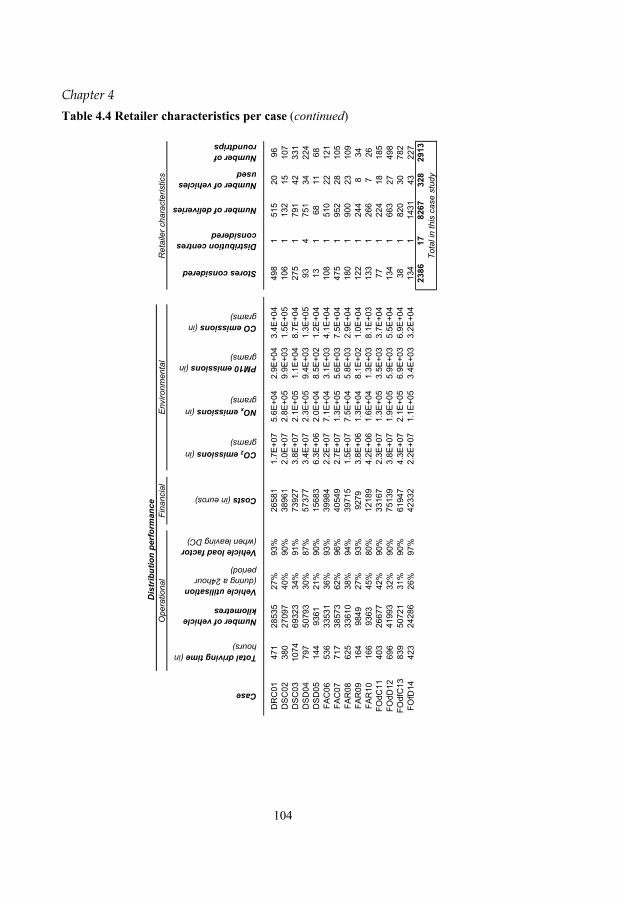
118
Chapter 4
104
Table 4.4 Retailer characteristics per case (continued)
Fina
ncia
l
Case
Total driving time (in hours)
Number of vehicle kilometres
Vehicle utilisation (during a 24hour period)
Vehicle load factor (when leaving DC)
Costs (in euros)
CO2 emissions (in grams)
NOx emissions (in grams)
PM10 emissions (in grams)
CO emissions (in grams)
Stores considered
Distribution centres considered
Number of deliveries
Number of vehicles used
Number of roundtrips
DR
C01
471
2853
527
%93
%26
581
1.7E
+07
5.6E
+04
2.9E
+04
3.4E
+04
498
151
520
96D
SC
0238
027
097
40%
90%
3896
12.
0E+0
72.
8E+0
59.
9E+0
31.
5E+0
510
61
132
1510
7D
SC
0310
7469
323
34%
91%
7392
73.
8E+0
72.
1E+0
51.
1E+0
48.
7E+0
427
51
791
4233
1D
SD
0479
750
793
30%
87%
5737
73.
4E+0
72.
3E+0
59.
4E+0
31.
3E+0
593
475
134
224
DS
D05
144
9361
21%
90%
1568
36.
3E+0
62.
0E+0
48.
5E+0
21.
2E+0
413
168
1168
FAC
0653
633
531
36%
93%
3998
42.
2E+0
77.
1E+0
43.
1E+0
34.
1E+0
410
81
510
2212
1FA
C07
717
3857
362
%96
%40
549
2.7E
+07
1.3E
+05
5.6E
+03
7.5E
+04
475
195
228
105
FAR
0862
533
610
38%
94%
3971
51.
5E+0
77.
5E+0
45.
8E+0
32.
9E+0
418
01
900
2310
9FA
R09
164
9849
27%
93%
9279
3.8E
+06
1.3E
+04
8.1E
+02
1.0E
+04
122
124
48
34FA
R10
166
9363
45%
80%
1218
94.
2E+0
61.
6E+0
41.
3E+0
38.
1E+0
313
31
266
726
FOdC
1140
326
677
42%
90%
3316
72.
3E+0
71.
3E+0
53.
5E+0
33.
7E+0
477
122
418
185
FOdD
1269
641
993
32%
90%
7513
93.
8E+0
71.
9E+0
55.
9E+0
35.
5E+0
413
41
663
2749
8FO
dfC
1383
950
721
31%
90%
6194
74.
3E+0
72.
1E+0
56.
9E+0
36.
9E+0
438
182
030
782
FOfD
1442
324
286
26%
97%
4233
22.
2E+0
71.
1E+0
53.
4E+0
33.
2E+0
413
41
1431
4322
723
8617
8267
328
2913
Ope
ratio
nal
Dis
trib
utio
n pe
rfor
man
ce
Tota
l in
this
cas
e st
udy
Env
ironm
enta
lR
etai
ler c
hara
cter
istic
s

119
Impacts of local authorities’ time-window policies
105
We included only those foreign stores that were really interweaved with Dutch stores in one roundtrip since we only manipulate Time-window pressure in the Netherlands. This applies to German and Belgian stores of cases DSC02, DSC03, and FAC07 (see Table 4.4). All retailers use a weekly repetitive distribution scheme, except cases DSD04 and DSC02, which use 2- and 4-week repeating schemes, respectively. The scenario results are all recalculated per week. For retailer DSD04 we considered all stores supplied from the one national distribution centre, including the deliveries from the three regional distribution centres to the same stores. DSD04’s nightly cross-dock activities between the different distribution centres are not considered in this study. Although cases FOfD14 and FOdD12 (see Table 4.4) are owned by the same mother company and supply the same stores, their assortment type differs and therefore they have separate delivery flows. As mentioned earlier, we only consider the deliveries from a retailer’s distribution centre to its stores. Although some retailers use direct deliveries for special goods, this percentage is at most 10% of all delivered goods. Research protocol In order to improve the data reliability we developed a research protocol before we started to collect data (Yin, 2003). This research protocol ensures that the data collection procedures can be repeated with the same results. All information was received in full, except for cost information, which some retailers were not willing to provide, because of confidentiality. Our research data acquisition process (the research protocol) consists of four steps: 1. Open interviews with the retailer’s distribution or logistics manager, to collect general
company information, information on the current distribution operations, and the likely reaction to different time-window policy measures. The interviews focused on the following subjects: • Current distribution strategy, including:
o Organisation of distribution to the stores. o Choices (and explanation of choices) in the distribution strategy. o In- or outsourcing activities. o Transport conditions. o Return logistics (from stores to distribution centre). o Service levels.
• The retailer’s experiences with governmental urban access measures and the problems that the retailer faces in distribution in urban areas.
• Likely reaction on urban access policy measures. We presented the different scenarios to the retailers and asked for their likely reaction, based on their current distribution strategy and their reaction on current time-windows.
• If possible, we also interviewed retailers’ physical distribution specialists and discussed their distribution planning and restrictions extensively.
2. A questionnaire to collect detail operational data, including information on:

120
Chapter 4
106
• The distribution centre, e.g. location, opening hours, layout, number of dock doors (for ingoing as well as outgoing vehicles), store ordering patterns, push and pull flows.
• The stores, e.g. locations, sales floor area, turnover indication, loading and unloading process and times, self-imposed restrictions (and the reasons), governmental (or other external) restrictions, supply flow data expressed in product carriers (roll containers, pallets) per week, staff presence, and number of deliveries per week.
• The vehicle fleet, e.g. vehicle types, number of vehicles per type, (un)loading process and times per vehicle at the DC and stores, capacity, weight, length, height, number of axles, engine type (EURO I-IV), driver’s working times (normal as well as maximum overworking times), driver’s breaks, and operating costs (fixed and variable per hour and kilometre).
• The product carriers (type: e.g. pallets, or roll cages), and average (un)loading time per product carrier.
3. Company documents and additional information. Company documents contain (at least) the retailer’s entire transport planning for one week. Next to that, all distribution centres were visited.
4. Finally, in the case of indistinctness or if extra information was necessary we contacted the retailers by telephone or by e-mail.
Vehicle route calculation To calculate the impact of the different Time-window pressure scenarios (defined in section 4.5) on the retailers’ distribution costs and the environmental burden, we have to solve a number of vehicle routing problems with time-windows (VRPTW). This problem has been studied widely in literature (see e.g. Braysy and Gendreau, 2005a; 2005b). Based on the retailers’ reactions we planned new roundtrips for all scenarios. In some scenarios, extra vehicles have to be added to supply all stores in time. Extra vehicles operate at the same costs as the current vehicle fleet. The first step in making a new planning is minimising the necessary vehicle fleet. To solve the VRPTW for each retailer we use SHORTREC 7.0 software, developed by Ortec Consultants (see e.g. Hall, 2004). SHORTREC 7.0 uses two algorithms; a route construction algorithm: a greedy order-to-route assignment algorithm to generate initial roundtrips (a sequential insertion algorithm see Figure 4.3), and an iterative 2-OPT-like improvement algorithm. This algorithm aims at finding cost-savings, based on both distance and time, by executing consecutively several improvement procedures. The sequence of the improvement procedures can vary. It is also possible to call upon the same procedures again, after some improvement procedures are executed. The following improvement procedures are included in SHORTREC 7.0 and (a combination of these procedures) always follow on the base solution from the construction algorithm: • Optimisation within a roundtrip (the optimal order sequence is calculated for every
roundtrip).
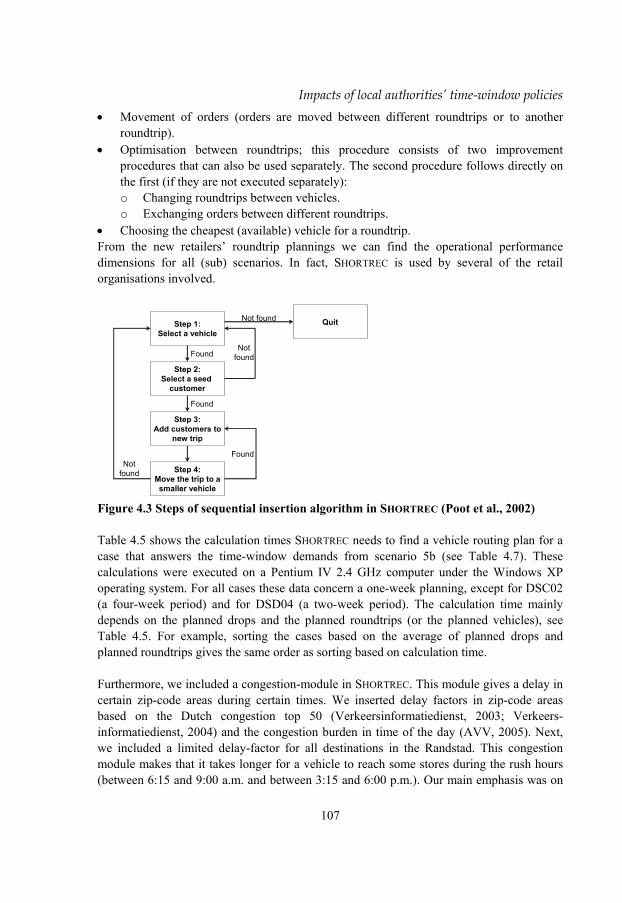
121
Impacts of local authorities’ time-window policies
107
• Movement of orders (orders are moved between different roundtrips or to another roundtrip).
• Optimisation between roundtrips; this procedure consists of two improvement procedures that can also be used separately. The second procedure follows directly on the first (if they are not executed separately): o Changing roundtrips between vehicles. o Exchanging orders between different roundtrips.
• Choosing the cheapest (available) vehicle for a roundtrip. From the new retailers’ roundtrip plannings we can find the operational performance dimensions for all (sub) scenarios. In fact, SHORTREC is used by several of the retail organisations involved.
Step 1:Select a vehicle
Step 2:Select a seed
customer
Step 3:Add customers to
new trip
Step 4:Move the trip to asmaller vehicle
Found
Found
Found
Notfound
Notfound
QuitNot found
Figure 4.3 Steps of sequential insertion algorithm in SHORTREC (Poot et al., 2002) Table 4.5 shows the calculation times SHORTREC needs to find a vehicle routing plan for a case that answers the time-window demands from scenario 5b (see Table 4.7). These calculations were executed on a Pentium IV 2.4 GHz computer under the Windows XP operating system. For all cases these data concern a one-week planning, except for DSC02 (a four-week period) and for DSD04 (a two-week period). The calculation time mainly depends on the planned drops and the planned roundtrips (or the planned vehicles), see Table 4.5. For example, sorting the cases based on the average of planned drops and planned roundtrips gives the same order as sorting based on calculation time. Furthermore, we included a congestion-module in SHORTREC. This module gives a delay in certain zip-code areas during certain times. We inserted delay factors in zip-code areas based on the Dutch congestion top 50 (Verkeersinformatiedienst, 2003; Verkeers-informatiedienst, 2004) and the congestion burden in time of the day (AVV, 2005). Next, we included a limited delay-factor for all destinations in the Randstad. This congestion module makes that it takes longer for a vehicle to reach some stores during the rush hours (between 6:15 and 9:00 a.m. and between 3:15 and 6:00 p.m.). Our main emphasis was on
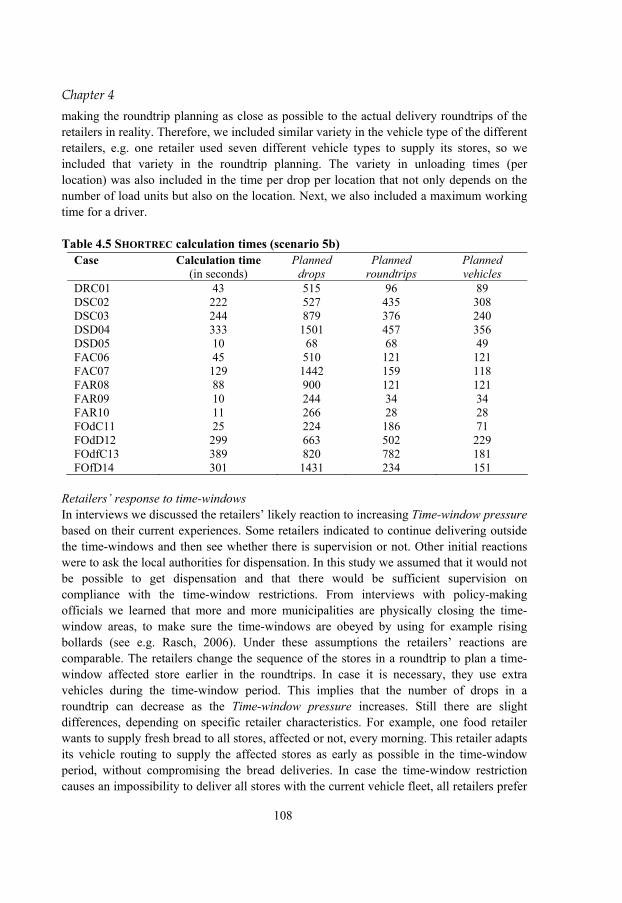
122
Chapter 4
108
making the roundtrip planning as close as possible to the actual delivery roundtrips of the retailers in reality. Therefore, we included similar variety in the vehicle type of the different retailers, e.g. one retailer used seven different vehicle types to supply its stores, so we included that variety in the roundtrip planning. The variety in unloading times (per location) was also included in the time per drop per location that not only depends on the number of load units but also on the location. Next, we also included a maximum working time for a driver. Table 4.5 SHORTREC calculation times (scenario 5b)
Case Calculation time (in seconds)
Planned drops
Planned roundtrips
Planned vehicles
DRC01 43 515 96 89 DSC02 222 527 435 308 DSC03 244 879 376 240 DSD04 333 1501 457 356 DSD05 10 68 68 49 FAC06 45 510 121 121 FAC07 129 1442 159 118 FAR08 88 900 121 121 FAR09 10 244 34 34 FAR10 11 266 28 28 FOdC11 25 224 186 71 FOdD12 299 663 502 229 FOdfC13 389 820 782 181 FOfD14 301 1431 234 151
Retailers’ response to time-windows In interviews we discussed the retailers’ likely reaction to increasing Time-window pressure based on their current experiences. Some retailers indicated to continue delivering outside the time-windows and then see whether there is supervision or not. Other initial reactions were to ask the local authorities for dispensation. In this study we assumed that it would not be possible to get dispensation and that there would be sufficient supervision on compliance with the time-window restrictions. From interviews with policy-making officials we learned that more and more municipalities are physically closing the time-window areas, to make sure the time-windows are obeyed by using for example rising bollards (see e.g. Rasch, 2006). Under these assumptions the retailers’ reactions are comparable. The retailers change the sequence of the stores in a roundtrip to plan a time-window affected store earlier in the roundtrips. In case it is necessary, they use extra vehicles during the time-window period. This implies that the number of drops in a roundtrip can decrease as the Time-window pressure increases. Still there are slight differences, depending on specific retailer characteristics. For example, one food retailer wants to supply fresh bread to all stores, affected or not, every morning. This retailer adapts its vehicle routing to supply the affected stores as early as possible in the time-window period, without compromising the bread deliveries. In case the time-window restriction causes an impossibility to deliver all stores with the current vehicle fleet, all retailers prefer

123
Impacts of local authorities’ time-window policies
109
using extra vehicles over contracting out the entire distribution process. Although some retailers currently use third-party logistics providers to supply their stores, they keep the full process control. Moving the store to the city periphery is also not an option, just as combining loads with other retailers, due to the extra efforts and costs this would take. At this moment three retailers deliver goods during parts of the night (see Table 4.4, the retailers with wide self-imposed time-windows). In response to scenario 4, in which time-windows restrictions are moved to the night, most of the other retailers indicated they were not willing to supply their stores during the night, for criminality and safety reasons. Higher drivers’ wages and increasing unloading times, depending on the amount of staff used to unload the vehicle during the day and other extra activities for the driver, are consequences of supplying the stores during the night. Extra costs for the time the driver unloads the vehicle are (partly) compensated by lower costs for staff during the day. For FAC06, FAC07, FAR09, and FAR10 the driver is already solely responsible for unloading at the stores; they therefore do not face an increase in unloading times. For the other retailers the extra unloading time differs. Investments in low noise-equipment to reduce nightly noise levels are not included (see Browne et al., 2006). An option to deliver with two drivers, to speed up the unloading and to increase the safety of the driver as well as the cargo is not favoured by the retailers. Table 4.6 Case study validity and reliability issues Type of validity
Methods of addressing validity and reliability issues in this case study
Construct validity
• Constructs are determined by main decisions (according to literature) retailers have to make in designing the issue in question
• Independent experts feedback • Triangulation of questionnaire and interview data with the retailer’s transport
planning • Model is validated with retailers (interviews) as well as with transport
planning (company documents) • Draft versions of complete case report were verified with all retailers
Internal validity
• Straightforward classification of cases for cross-case analysis (see chapter 5) • Theoretical embedded conceptual framework based on relationships
established in prior research External validity
• Theoretical replication in case selection • Generalisible results to areas with same contextual situation. We consider the
results valid for (at least) the entire Western European context. The retailer’s structure is comparable over Western Europe, as are the cost structure and time-window policies.
Reliability • Development of standard questionnaire • Development of case protocol
Source: based on Yin (2003)

124
Chapter 4
110
Validation and reliability We distinguish two types of validation. The first is model validation; we validated each retailer’s current one week planning by recalculating it with SHORTREC 7.0. The maximum difference was at most 5% in the number of vehicle kilometres, the total time used for the distribution, the number of vehicles used, and the total transport costs to supply all stores. In addition, the detailed results were also checked with the retailers’ planners. We also evaluated the results of all scenarios with the planners. We conclude that the model used is valid and that the results from solving the VRPTW are sufficiently reliable to base conclusions on. Second, we address the general issues in validity and reliability (see e.g. Voss et al., 2002; Yin, 2003) as summarised in Table 4.6. 4.5 Scenario definition We design six main time-window policy scenarios (see Table 4.7). Notice that the time-windows affect cities, and that the number of stores affected per retailer might differ per scenario. Table 4.7 only shows the average percentage of stores affected per scenario for all 14 cases. The scenarios’ design is discussed in more detail in the remaining parts of this section. Table 4.7 Time-window policy scenario definitions Scenario Time-window policy Average time-window length and
percentage stores affected by time-windows
Scenario 0
Base scenario No time-window policies
0 hours (0% stores affected)
Scenario 1
Increasing Time-window pressure The construct Time-window pressure is varied on its dimensions, the time-window length and the number of time-window restricted areas, in 18 sub scenarios
Sub scenario dependent (see Table 4.8)
Scenario 2 The current time-window policies 5 hours 20 minutes (46% stores affected) Scenario 3 Harmonised time-window policies 4 hours and 53 minutes (49% stores
affected) Scenario 4 Nightly time-window policies 6 hours (49% stores affected) Scenario 5a Time-window policies based on
reference model (including peak-regulation)
10.5 hours (5 during the morning, and 5.5 during the evening. The evening is hardly used by the retailers, so actual length is close to 5 hours) (46% stores affected)
Scenario 5b Time-window policies based on reference model (excluding peak-regulation)
18.5 hours (5.5 hours are not used for deliveries; between noon-5:30 p.m.) (46% stores affected)
4.5.1 Scenario 0 – Base scenario Based on the retailer’s current operations (today’s-scenario), we design the base scenario by removing all governmental time-windows that apply to the stores (scenario 0). We evaluate all other scenarios, in which different time-window schemes are introduced, by

125
Impacts of local authorities’ time-window policies
111
comparing the results to this base scenario. In the base scenario all retailers’ characteristics are similar to the current situation. This implies that we do not change these characteristics e.g. the retailers’ self-imposed time-windows, or the different vehicle types that are used at the moment, due to vehicle restrictions. 4.5.2 Scenario 1 – Varying Time-window pressure We design scenario 1 to answer the first research question. In scenario 1 we vary both dimensions of Time-window pressure; the number time-windows restricted areas and the time-window length. We distinguish 18 sub scenarios (see Table 4.8). A row in Table 4.8 represents different time-window lengths, whereas a column represents an increasing number of cities with such a time-window restriction, based on the city size (number of inhabitants). In 2002, time-windows in the Netherlands started on average at 6.53 a.m. and ended at 11.18 a.m. (PSD, 2002b). We distinguish three time-window lengths: scenarios 1A (from 6.00 a.m. to noon), 1B (from 6.30 a.m. to 11.00 a.m.), and 1C (from 7.00 a.m. to 10.00 a.m.). These variations allow us to find the impact of relaxing the current Time-window pressure to some degree, as total removal is unlikely in reality. It also shows the effects of the current trend of decreasing time-window length over the last years. Figure 4.4 shows that varying the number of cities with time-windows in the sub scenarios implies that retailers are influenced differently. This scenario covers the most plausible range of time-window restrictions in which the retailers’ reactions are still reliable; if the time-window length would be less than three hours some retailers indicated that they would no longer be able to supply their stores. A time-window length of more than 6 hours (scenario 1A), would be more or less equal to most of the retailer’s self-imposed time-windows, so similar to today’s scenario. Table 4.8 Varying Time-window pressure in scenario 1
Number of time-window affected areas cities affected
Time-window length O
nly
5 la
rges
t ci
ties i
n th
e N
ethe
rlan
ds
Onl
y 10
larg
est
citie
s in
the
Net
herl
ands
Onl
y 25
larg
est
citie
s in
the
Net
herl
ands
Onl
y 50
larg
est
citie
s in
the
Net
herl
ands
Onl
y 10
0 la
rges
t ci
ties i
n th
e N
ethe
rlan
ds
Onl
y 25
0 la
rges
t ci
ties i
n th
e N
ethe
rlan
ds
6.00 a.m. – noon 1A1 1A2 1A3 1A4 1A5 1A6 6.30 a.m. – 11.00 a.m. 1B1 1B2 1B3 1B4 1B5 1B6 7.00 a.m. – 10.00 a.m. 1C1 1C2 1C3 1C4 1C5 1C6 4.5.3 Scenario 2 – Current time-window policies The difference between today’s scenario (scenario 2) and scenario 0 reflects the consequences of today’s time-window restrictions on the retailers’ distribution. The current time-window policies are based on PSD (2002b). In this study PSD (2002b) listed all time-window policies of the 278 largest Dutch municipalities. In most municipalities the time-window restrictions only apply to stores in city centres, or even only to the pedestrian areas.

126
Chapter 4
112
We included this by applying the time-window restrictions to stores that are located in the ZIP-code area of the city centre, as determined by Groothedde and Uil (2004).
0%
10%
20%
30%
40%
50%
60%
70%
80%
90%
100%
DR
C01
DSC
02
DSC
03
DSD
04
DSD
05
FAC
06
FAC
07
FAR
08
FAR
09
FAR
10
FOdC
11
FOdD
12
FOdf
R13
FOfD
14
Stor
es a
ffect
ed b
y tim
e-w
indo
ws
50%
60%
70%
80%
90%
100%scenario 1-6: 250 largest cities affected by time-windowsscenario 1-5, 3 and 4: 100 largest cities affected by time-windowsscenario 1-4: 50 largest cities affected by time-windowsscenario 1-3: 25 largest cities affected by time-windowsscenario 1-2: 10 largest cities affected by time-windowsscenario 1-1: 5 largest cities affected by time-windows
Figure 4.4 Case specific cumulative percentage of stores affected by Time-window
pressure in sub scenarios 4.5.4 Scenario 3 – Harmonisation of time-window policies In practice, different municipalities employ different time-windows that often overlap. National governments are interested to harmonise the different local regulations (Lemstra, 2004; OECD, 2003), since the current chaos of different regulations is one of the most uttered complaints about current local authorities’ urban freight transport regulations. Time-windows can be harmonised in different ways (PSD, 2001b). Obviously, a carrier would like to see time-window harmonisation in such a way that it could visit all neighbouring municipalities at that time it would suit its planned roundtrip. This is not possible in reality; the number of carriers is high and their roundtrips differ, due to the different depots they start from, different customer locations, and so on. They would all like different ways of harmonisation. A solution could be to determine which city centres benefits most from using strict time-windows, and which city centres would benefit least. The next step would then be to allow the centres that benefit most to use strict time-windows. Unfortunately, most local authorities would argue that their centre benefits most and it is outside this study’s scope to determine which city centres benefit most from using time-windows. Therefore, we propose a straightforward way to harmonise time-window policies: based on city size (measured by its population). We define scenario 3 with time-window length gradually decreasing with the city size: the shopping areas in the 5 largest cities in the Netherlands have a time-window of only three hours (which is similar to sub scenario 1C1, from 7-10 a.m.), the 6th to the 25th largest cities have a time-window of 4.5 hours (similar to sub scenarios 1B2 and 1B3, from 6.30-11.00 a.m.), and the 26th to the 100th largest cities have a time-window of 6 hours (similar to sub scenarios 1A4 and 1A5, from 6.00 a.m.-noon). Smaller cities do not use time-window restrictions in this scenario.

127
Impacts of local authorities’ time-window policies
113
4.5.5 Scenario 4 – Nightly time-window policies In scenario 4 the Time-window pressure is similar to that of scenario 1A5. However, the time-window period in scenario 4 differs in time of the day; vehicles are only allowed to supply stores during the night, from midnight to 6:00 a.m. We assume all other deliveries are also moved to off-peak periods in this scenario. This means the same stores are affected by time-windows in this scenario as in scenario 3, and obviously the Time-window pressure is similar to that in scenario 1A5. The main objective to use time-windows is to improve social sustainability issues. One extreme way to do this is to have time-windows during the night. Browne et al. (2006) review current nighttime delivery restrictions. They find that in several European countries (e.g. France, the Netherlands, and the United Kingdom) nighttime deliveries are not allowed in some cities (especially at areas where people live closely to stores). In the Netherlands a national law exists, i.e. peak-regulation, that restricts the maximum peak level in the noise between 11:00 p.m. and 7:00 a.m. to 60 dB(A). Normal distribution activities exceed this limit (Browne et al., 2006; PIEK, 2006). The reason we still include this scenario is to see what the effect would be of moving Time-window pressure to another period of the day. As the deliveries take place in a less congested period, we expect this to reduce the travel times and possibly the number of kilometres, since there is no congestion during the night. This would have a positive environmental effect and lead to less costs for the retailers. It also contributes to the improvement of the shopping climate. On the other hand, the drivers’ wages are higher, the unloading times at the stores might increase (no store staff present), and some retailers fear for the safety of the drivers and the cargo (theft and vandalism). It also increases the noise nuisance for residents living nearby or above stores during the night (Allen et al., 2003; Browne et al., 2006). 4.5.6 Scenario 5 – Reference model time-windows The Dutch committee for urban distribution (CSD) suggests in its reference model another scheme for time-window policies in the Netherlands (CSD, 2006): • Before a municipality starts to use time-windows it should first show the necessity of it
by a problem analysis. • Time-windows are only to be used in core shopping centres that are pedestrian areas. • Supplying vehicles are not allowed between noon and 5.30 p.m. and in case of late
night shopping between noon and 9 p.m. • The receivers should allow supplying vehicles during the time-window period for at
least four hours in a row, so they can not demand stricter time-windows for their stores than successive four hours. This might imply that they have to change their self-imposed time-windows, or that staff has to be available before the actual opening hours of the store.
• Dispensation is possible for special products (e.g. fresh products). • The retailers / entrepreneurs in the centre should make arrangements to improve the
traffic flow (e.g. removal of street furniture or commercial signs during time-window periods).

128
Chapter 4
114
Scenario 5a implies that vehicles are not allowed between noon and 5.30 p.m. The time-windows apply to all centres that use time-windows in the current situation (see scenario 2). In this scenario the retailer’s self-imposed time-windows have a minimum length of at least 4 hours (during the morning). The actual time-window length for most retailers is actually five hours, since most retailers in the case sample do not want to deliver their stores during the evening and the night (see also scenario 4). Scenario 5b is similar to scenario 5a, except that we did not include the peak-norms. The retailers can supply their stores at all times, except for the period between noon and 5.30 p.m. The period that can be used to supply the stores includes the night. Most retailers do not supply stores during the night though, so the difference between scenario 5a and 5b is mainly caused by the possibilities for retailers to supply the time-window affected stores also before 7.00 a.m. In the case sample this considerably broadens the time-window length for 7 of the 14 retailers. The other retailers indicated that they would not supply (the majority of) their stores before 7.00 a.m. Many retailers argued that they would not deliver during the evening hours, at times no staff is available to receive goods or to open the stores’ depots, as they do not want their drivers to open stores (or depots), because of the safety of the drivers, goods, and the stores. 4.6 Results Previous studies (e.g. Allen et al., 2004; Groothedde and Uil, 2004) only focus on the immediate effects of time-window policies. The within-case analysis in this section shows some interesting insights in how these effects are realised. To answer this chapter’s first research question we use a within-case analysis (Eisenhardt, 1989). To answer the second research question we compare the costs from scenarios 2, 3, 4 and 5 with the base scenario. 4.6.1 Varying Time-window pressure We only present the overall aggregate results (i.e. summed over all retailers) for different Time-window pressure combinations of scenario 1, although the individual results differ much between the cases (see for example Figure 4.8). We elaborate on these variations in chapter 5. The graphs in Figure 4.5 all show one Operational performance dimension for both Time-window pressure dimensions. The x-axis shows the number of time-window restricted areas, as the percentage of stores affected. The time-window length is presented by three lines; the dotted line shows scenario 1A (time-window length of 6 hours), the straight line scenario 1B (time-window length of 4.5 hours), and the dashed line scenario 1C (time-window length of 3 hours). Figure 4.6 shows the Financial performance for both Time-window pressure dimensions. Figure 4.7 presents the four dimensions of Environmental performance. We also included scenario 3 in these figures that is depicted by a single rhomboid point. Obviously, an increase in Time-window pressure, by either an increase in the number of time-window restricted areas or a decrease in the time-window length, causes a rise in
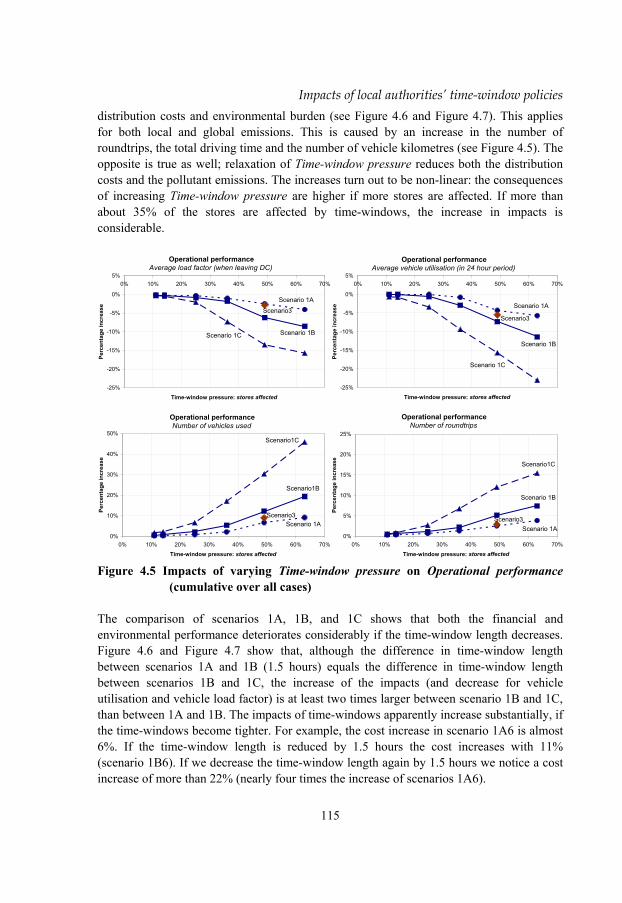
129
Impacts of local authorities’ time-window policies
115
distribution costs and environmental burden (see Figure 4.6 and Figure 4.7). This applies for both local and global emissions. This is caused by an increase in the number of roundtrips, the total driving time and the number of vehicle kilometres (see Figure 4.5). The opposite is true as well; relaxation of Time-window pressure reduces both the distribution costs and the pollutant emissions. The increases turn out to be non-linear: the consequences of increasing Time-window pressure are higher if more stores are affected. If more than about 35% of the stores are affected by time-windows, the increase in impacts is considerable.
Operational performanceNumber of vehicles used
Scenario 1A
Scenario1B
Scenario1C
Scenario3
0%
10%
20%
30%
40%
50%
0% 10% 20% 30% 40% 50% 60% 70%
Time-window pressure: stores affected
Perc
enta
ge in
crea
se
Operational performanceAverage load factor (when leaving DC)
Scenario 1A
Scenario 1BScenario 1C
Scenario3
-25%
-20%
-15%
-10%
-5%
0%
5%0% 10% 20% 30% 40% 50% 60% 70%
Time-window pressure: stores affected
Perc
enta
ge in
crea
se
Operational performanceNumber of roundtrips
Scenario 1A
Scenario 1B
Scenario1C
Scenario3
0%
5%
10%
15%
20%
25%
0% 10% 20% 30% 40% 50% 60% 70%
Time-window pressure: stores affected
Perc
enta
ge in
crea
se
Operational performanceAverage vehicle utilisation (in 24 hour period)
Scenario 1A
Scenario 1B
Scenario 1C
Scenario3
-25%
-20%
-15%
-10%
-5%
0%
5%0% 10% 20% 30% 40% 50% 60% 70%
Time-window pressure: stores affected
Perc
enta
ge in
crea
se
Figure 4.5 Impacts of varying Time-window pressure on Operational performance
(cumulative over all cases) The comparison of scenarios 1A, 1B, and 1C shows that both the financial and environmental performance deteriorates considerably if the time-window length decreases. Figure 4.6 and Figure 4.7 show that, although the difference in time-window length between scenarios 1A and 1B (1.5 hours) equals the difference in time-window length between scenarios 1B and 1C, the increase of the impacts (and decrease for vehicle utilisation and vehicle load factor) is at least two times larger between scenario 1B and 1C, than between 1A and 1B. The impacts of time-windows apparently increase substantially, if the time-windows become tighter. For example, the cost increase in scenario 1A6 is almost 6%. If the time-window length is reduced by 1.5 hours the cost increases with 11% (scenario 1B6). If we decrease the time-window length again by 1.5 hours we notice a cost increase of more than 22% (nearly four times the increase of scenarios 1A6).
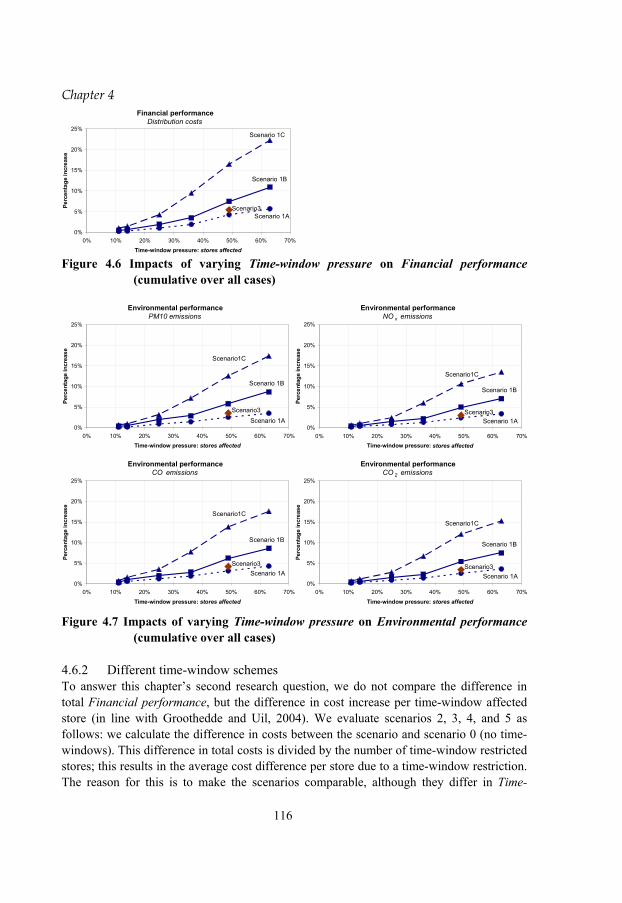
130
Chapter 4
116
Financial performanceDistribution costs
Scenario 1A
Scenario 1B
Scenario 1C
Scenario3
0%
5%
10%
15%
20%
25%
0% 10% 20% 30% 40% 50% 60% 70%
Time-window pressure: stores affected
Perc
enta
ge in
crea
se
Figure 4.6 Impacts of varying Time-window pressure on Financial performance
(cumulative over all cases)
Environmental performancePM10 emissions
Scenario 1A
Scenario 1B
Scenario1C
Scenario3
0%
5%
10%
15%
20%
25%
0% 10% 20% 30% 40% 50% 60% 70%
Time-window pressure: stores affected
Perc
enta
ge in
crea
se
Environmental performanceCO emissions
Scenario 1A
Scenario 1B
Scenario1C
Scenario3
0%
5%
10%
15%
20%
25%
0% 10% 20% 30% 40% 50% 60% 70%
Time-window pressure: stores affected
Perc
enta
ge in
crea
se
Environmental performanceNO x emissions
Scenario 1A
Scenario 1B
Scenario1C
Scenario3
0%
5%
10%
15%
20%
25%
0% 10% 20% 30% 40% 50% 60% 70%Time-window pressure: stores affected
Perc
enta
ge in
crea
se
Environmental performanceCO 2 emissions
Scenario 1A
Scenario 1B
Scenario1C
Scenario3
0%
5%
10%
15%
20%
25%
0% 10% 20% 30% 40% 50% 60% 70%
Time-window pressure: stores affected
Perc
enta
ge in
crea
se
Figure 4.7 Impacts of varying Time-window pressure on Environmental performance
(cumulative over all cases) 4.6.2 Different time-window schemes To answer this chapter’s second research question, we do not compare the difference in total Financial performance, but the difference in cost increase per time-window affected store (in line with Groothedde and Uil, 2004). We evaluate scenarios 2, 3, 4, and 5 as follows: we calculate the difference in costs between the scenario and scenario 0 (no time-windows). This difference in total costs is divided by the number of time-window restricted stores; this results in the average cost difference per store due to a time-window restriction. The reason for this is to make the scenarios comparable, although they differ in Time-

131
Impacts of local authorities’ time-window policies
117
window pressure. Direct comparison between the different scenarios might be possible, however it is not straightforward because of the differences in Time-window pressure. For example, in the scenario 3 and 4 (harmonisation and nightly time-windows) more stores are affected by a time-window than in scenario 2 and 5. This alone would result in extra costs for scenario 3 and 4, since increasing Time-window pressure leads to an overall increase in costs. This is also the case for the time-window length (see Figure 4.6). We discuss the Financial performance of the scenarios (see Figure 4.8), then the Environmental performance (see Figure 4.9), and finally the social performance (see Table 4.9). Next we evaluate the performance of the different scenarios individually. Figure 4.8 shows the cost increase for a time-window affected store for all 14 cases individually for scenarios 2, 3, 4, and 5. This figure shows that on average the cost increase per time-window affected store is least for scenario 5 (reference model). The scenario average is depicted by the height of the shaded box that covers the cases (see Figure 4.8). Scenario 5b performs even better than scenario 5a. In scenario 4, we see an increase in costs that exceeds all other scenarios. There is only a slight difference between scenario 2 and 3 in cost increase for the retailers. Interpreting these results is only possible in combination with Table 4.7. This table shows Time-window pressure is highest in scenario 3 (both in average time-window length and number of cities affected by time-windows). Scenario 1 shows an increase in Time-window pressure leads to an increase in costs. Hence, this suggests that the harmonisation scenario (scenario 3) performs better than scenario 2, even more than the difference in the average would suggest. In the next chapter we elaborate on the differences in performance between the retailers.
Figure 4.8 Percentage cost increase of time-window affected store compared to non-
affected store for scenarios 2, 3, 4, and 5 (per case and accumulated) Figure 4.9 shows the environmental impacts of the different time-window schemes. Scenario 5 shows by far the best environmental results for all indicators. Furthermore, the
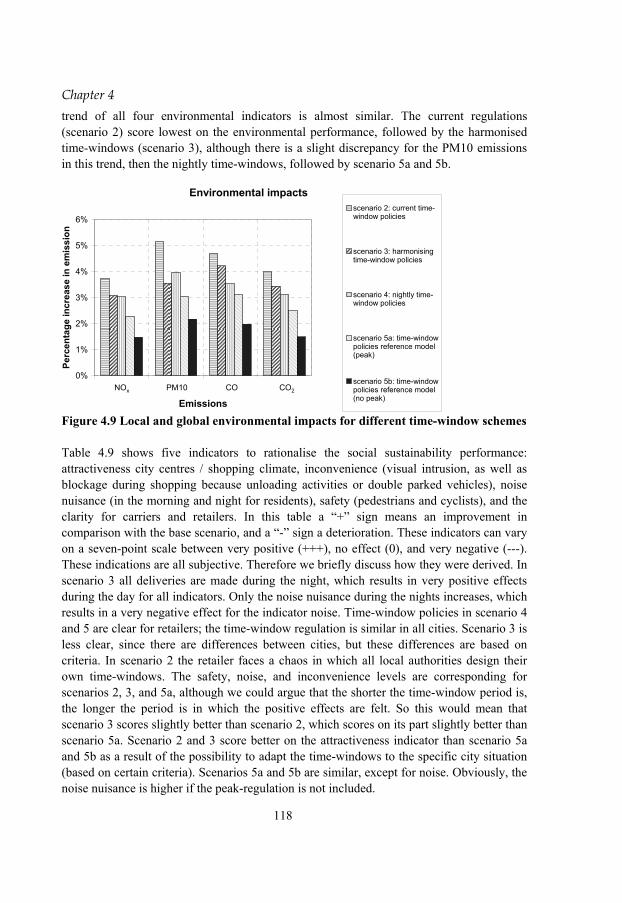
132
Chapter 4
118
trend of all four environmental indicators is almost similar. The current regulations (scenario 2) score lowest on the environmental performance, followed by the harmonised time-windows (scenario 3), although there is a slight discrepancy for the PM10 emissions in this trend, then the nightly time-windows, followed by scenario 5a and 5b.
Environmental impacts
0%
1%
2%
3%
4%
5%
6%
NOx PM10 CO CO2
Emissions
Perc
enta
ge in
crea
se in
em
issi
on
scenario 2: current time-window policies
scenario 3: harmonisingtime-window policies
scenario 4: nightly time-window policies
scenario 5a: time-windowpolicies reference model(peak)
scenario 5b: time-windowpolicies reference model(no peak)
NOx PM10 CO CO2
Figure 4.9 Local and global environmental impacts for different time-window schemes Table 4.9 shows five indicators to rationalise the social sustainability performance: attractiveness city centres / shopping climate, inconvenience (visual intrusion, as well as blockage during shopping because unloading activities or double parked vehicles), noise nuisance (in the morning and night for residents), safety (pedestrians and cyclists), and the clarity for carriers and retailers. In this table a “+” sign means an improvement in comparison with the base scenario, and a “-” sign a deterioration. These indicators can vary on a seven-point scale between very positive (+++), no effect (0), and very negative (---). These indications are all subjective. Therefore we briefly discuss how they were derived. In scenario 3 all deliveries are made during the night, which results in very positive effects during the day for all indicators. Only the noise nuisance during the nights increases, which results in a very negative effect for the indicator noise. Time-window policies in scenario 4 and 5 are clear for retailers; the time-window regulation is similar in all cities. Scenario 3 is less clear, since there are differences between cities, but these differences are based on criteria. In scenario 2 the retailer faces a chaos in which all local authorities design their own time-windows. The safety, noise, and inconvenience levels are corresponding for scenarios 2, 3, and 5a, although we could argue that the shorter the time-window period is, the longer the period is in which the positive effects are felt. So this would mean that scenario 3 scores slightly better than scenario 2, which scores on its part slightly better than scenario 5a. Scenario 2 and 3 score better on the attractiveness indicator than scenario 5a and 5b as a result of the possibility to adapt the time-windows to the specific city situation (based on certain criteria). Scenarios 5a and 5b are similar, except for noise. Obviously, the noise nuisance is higher if the peak-regulation is not included.
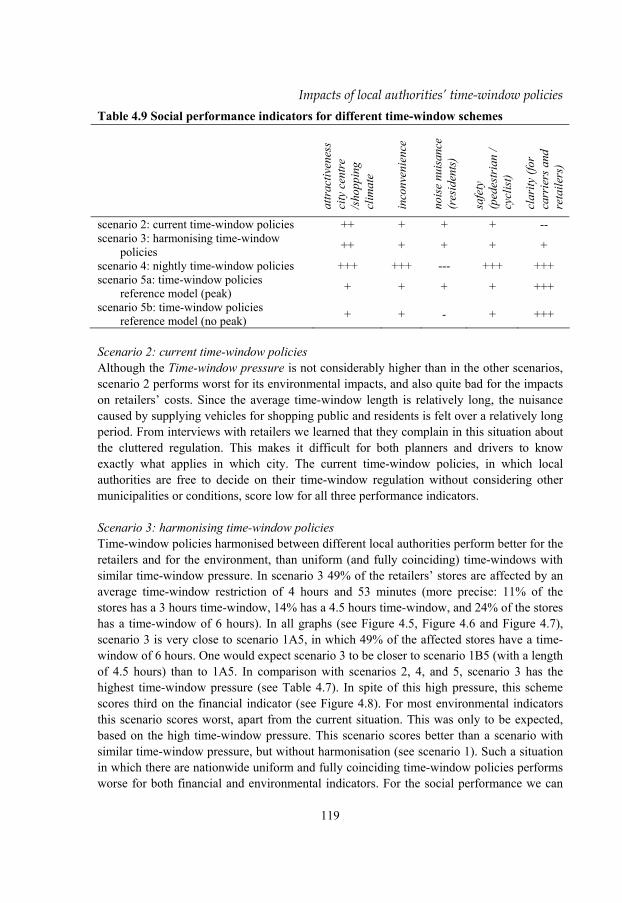
133
Impacts of local authorities’ time-window policies
119
Table 4.9 Social performance indicators for different time-window schemes
attr
activ
enes
s ci
ty c
entr
e /s
hopp
ing
clim
ate
inco
nven
ienc
e
nois
e nu
isan
ce
(res
iden
ts)
safe
ty
(ped
estr
ian
/ cy
clis
t)
clar
ity (f
or
carr
iers
and
re
taile
rs)
scenario 2: current time-window policies ++ + + + -- scenario 3: harmonising time-window
policies ++ + + + +
scenario 4: nightly time-window policies +++ +++ --- +++ +++ scenario 5a: time-window policies
reference model (peak) + + + + +++
scenario 5b: time-window policies reference model (no peak) + + - + +++
Scenario 2: current time-window policies Although the Time-window pressure is not considerably higher than in the other scenarios, scenario 2 performs worst for its environmental impacts, and also quite bad for the impacts on retailers’ costs. Since the average time-window length is relatively long, the nuisance caused by supplying vehicles for shopping public and residents is felt over a relatively long period. From interviews with retailers we learned that they complain in this situation about the cluttered regulation. This makes it difficult for both planners and drivers to know exactly what applies in which city. The current time-window policies, in which local authorities are free to decide on their time-window regulation without considering other municipalities or conditions, score low for all three performance indicators. Scenario 3: harmonising time-window policies Time-window policies harmonised between different local authorities perform better for the retailers and for the environment, than uniform (and fully coinciding) time-windows with similar time-window pressure. In scenario 3 49% of the retailers’ stores are affected by an average time-window restriction of 4 hours and 53 minutes (more precise: 11% of the stores has a 3 hours time-window, 14% has a 4.5 hours time-window, and 24% of the stores has a time-window of 6 hours). In all graphs (see Figure 4.5, Figure 4.6 and Figure 4.7), scenario 3 is very close to scenario 1A5, in which 49% of the affected stores have a time-window of 6 hours. One would expect scenario 3 to be closer to scenario 1B5 (with a length of 4.5 hours) than to 1A5. In comparison with scenarios 2, 4, and 5, scenario 3 has the highest time-window pressure (see Table 4.7). In spite of this high pressure, this scheme scores third on the financial indicator (see Figure 4.8). For most environmental indicators this scenario scores worst, apart from the current situation. This was only to be expected, based on the high time-window pressure. This scenario scores better than a scenario with similar time-window pressure, but without harmonisation (see scenario 1). Such a situation in which there are nationwide uniform and fully coinciding time-window policies performs worse for both financial and environmental indicators. For the social performance we can

134
Chapter 4
120
only state that it differs per municipality. The large municipalities, which supposedly have most shopping public and residents, have tight time-windows (of only 3 hours) and face a reduction in inconvenience caused by supplying vehicles, whereas many smaller municipalities are confronted with a slight decrease in social performance. Of course, a harmonisation scenario that would come up with different criteria to allow municipalities to use strict, medium and wide time-windows would have more or less similar results. Scenario 4: nightly time-window policies Scenario 4, moving time-window restrictions from the morning to the night, appears to raise costs for most retailers. Table 4.10 compares scenario 4 to scenario 1A5, that has a similar Time-window pressure with 49% of the stores affected and a time-window length of six hours. Although the driving time in scenario 4 is lower for all retailers, the total time needed for distribution is higher for most retailers since the drivers now have to unload the vehicles alone, rather than with the help of store staff. As a result, some retailers can even combine fewer deliveries in one vehicle roundtrip in scenario 4 than in scenario 1A5, due to the permitted driver’s working hours. This is true for all retailers with low unloading times in the original situation (see Table 4.4, retailers with unloading time smaller than 120 minutes per roundtrip) except for FOdfC13 that uses swap bodies. Only those retailers with wide self-imposed time-windows and with large unloading times perform better in the case that the time-window restrictions are moved to the night. Table 4.10 Effects of moving time-windows from the morning to the night per case Case Distribution
costs CO2
emissions Driving
time Total time
DRC01 + 0 -- ++ DSC02 + + -- ++ DSC03 + 0 - 0 DSD04 ++ + -- ++ DSD05 ++ 0 -- ++ FAC06 + 0 -- -- FAC07 - 0 -- - FAR08 0 - -- - FAR09 - - -- ++ FAR10 - - -- -- FOdC11 ++ 0 -- + FOdD12 + + -- ++ FOdfC13 + 0 -- - FOfD14 ++ + -- ++ Accumulated + 0 -- ++
Scenario 4 (night deliveries) compared to scenario 1A5. -- decrease >5% - decrease >1% + increase >1%
++ increase >5% 0 difference <1%
The environmental impact is lower for this scenario than for most others, since the large supplying vehicles are moved from the morning rush hours (and the corresponding congestion) to the calmer nights. The interpretation of the social impacts is two-sided for this scheme. On the one hand the shopping public is no longer hindered by the supplying vehicles at all, so from their perspective the social performance increases. The residents, on the other hand, are confronted with an increase of nuisance during the night. So from their
135
Impacts of local authorities’ time-window policies
121
perspective this scenario definitely decreases the social performance. A last remark is that many retailers do not really like the idea of night deliveries. Most retailers indicated that they were absolutely not willing to supply their stores during the night, for several reasons, including:
• Criminality and safety concerns (the driver is alone and therefore an easy target especially for stores or vehicles with high-value products).
• Disreputable characters hanging around in city centres during the night. • No goods receipts, which increases vulnerability to fraud. • Many stores lack separate depots and the driver is not allowed to open a store
during the night (for safety reasons). Scenario 5: time-window policies according to the reference model Scenario 5 scores best for both the environmental impacts and the retailers’ costs in comparison to the other time-window policy schemes. This is no surprise since Time-window pressure in this scenario is lower than in all other scenarios, both for the number of time-window affected stores as well as the time-window length. The nuisance, or the social performance, of this scenario would be worse than that in all other scenarios. The period in which both residents (especially in the evening) and the shopping public are exposed to consequences of large vehicles is longer than in the other scenarios. A positive comment on this proposal of the committee for urban distribution is that it would have better financial consequences for retailers and better environmental consequences than the current regulation. Besides, it would transform the chaos of different local regulations to a clear nationwide similar situation. The fact that this scheme forces retailers to have self-imposed time-windows of at least 4 consecutive hours, reduces transport costs for retailers as well as the environmental burden. Scenario 5b scores even better for the retailers than scenario 5a, which is not surprising since the Time-window pressure is lower. This lower cost increase and the lower environmental burden is especially caused by the extra time in the morning to supply the stores, since most of the retailers do not use the evenings and nights to supply their stores. For retailers that also supply during the nights (and / or evenings) the results of this scenario are far better than those of scenario 5a. 4.7 Conclusions This chapter’s results may help municipality policy decision-makers. Relaxation of time-windows (e.g. going from a time-window length of three hours in scenario 1C to a time-window length of 4.5 hours in scenario 1B) immediately results in a relief of the environmental burden and a cost decrease for the retailers. In order to achieve social sustainability effects without unnecessarily increasing the environmental burden and the retailers’ costs, municipalities should consider harmonising their time-windows. Many municipalities implement time-window restrictions to improve social sustainability elements like noise reduction, visual intrusion, and hinder for citizens. Obviously, outside the time-window period the human exposure to truck related noise, emissions, and stench is

136
Chapter 4
122
reduced to zero and the pedestrian safety is improved in the time-window area, as there simply are no trucks. Virtually all 33 interviewed municipalities agree that these objectives are met. However, the improvement of these social sustainability issues in the shopping areas goes along with deteriorating the environmental performance and the retailers’ operational and financial performance. During the time-window hours negative impacts still occur in time-window areas, albeit felt by fewer people, as the time-windows obviously mostly do not correspond with busy shopping hours. Normally the time-window period corresponds with the morning rush, so it may add to accessibility problems during that period. Time-windows cause an increase in the amount of global and local emissions. Time-windows also cause an increase in retailers’ distribution costs. In the case time-window lengths decrease, the financial and environmental performances deteriorate more than proportionally. Put differently, relaxation of the time-window length would immediately relieve retailers’ cost increase, as well as the environmental burden. The increase in costs and emissions depends on the exact Time-window pressure. If less than 30% of the stores are affected, increases are in general moderate (between 2% and 6%). However, if 60% of the stores are affected, cost increases vary from 5% (a time-window length of 6 hours) to 20% (a time-window length of 3 hours) and emission increases vary between 4% and 15% respectively. The impacts of time-windows increase substantially, if the time-window length decreases. For example, the impact of a similar decrease in time-window length (the difference between scenario 1A6 and 1B6 and between scenario 1B6 and 1C6 is both 3 hours) results in more than doubling of the cost impact, i.e. the cost increase differs only 5% between scenario 1A6 and 1B6, but it differs 11% between scenario 1B6 and 1C6. Governmental bodies considering time-window restrictions should therefore be careful in determining the time-window length. The current time-window scheme, in which local authorities design their time-window policies autonomously from others, scores badly on financial, environmental, and social performance. Nightly time-windows would stop the nuisance for shopping public and decrease congestion during the morning rush hours by making better use of the infrastructure over 24 hours. On the other hand, moving time-window restrictions from the morning to the night results in a cost increase for most retailers, this is mainly due to the longer unloading times and higher hourly drivers’ wages. It would also add to the noise nuisance for residents living nearby stores. It would only be a good idea to start thinking about moving the freight transport to outlets in urban areas to the night if the noise nuisance is low, the safety of the goods and driver can be guaranteed, and the unloading speed of the vehicles increases. The scenario in which time-window policies of different municipalities are harmonised shows that it is possible to have a select number of cities with really strict time-windows, without increasing retailers’ costs and deteriorating global and local environmental pollution. In order for this policy to work, sufficient cities should have wide time-windows. Harmonisation of time-windows between different municipalities results in lower costs for the retailers and lower environmental impacts than independent, coinciding
137
Impacts of local authorities’ time-window policies
123
time-windows. Finally, the scheme as suggested by the Dutch committee for urban distribution (scenario 5) shows that by having a clear policy that uses relatively wide time-windows for the entire country, negative impacts on the environment and the retailers’ financial performance could be relatively low, without letting slide the social performance, e.g. the nuisance for residents and shopping public, the attractiveness of a centre, and the liveability in a centre. For the moment, a combination of scenarios 3 and 5, harmonising time-window policies, based on criteria following from an obliged problem analysis in combination with a nationwide time-window scheme would be the best compromise for all different performance indicators. Although we investigated only one time-window harmonisation policy, our model can be used to further study other possibilities for harmonising time-windows or other local authorities’ sustainability policy measures as well. As with most empirical studies, there are some limitations of the present research. The multiple case study approach limits the generalisibility of this study’s findings. Although we use 14 cases, the size of this sample is too small to consider any statistical analysis. Even though all cases are Dutch, we consider the results to be valid for the entire Western European context. The findings may not hold for a broader context. They can be used in further research with a larger sample size, to be tested and refined. The case sample used in this case study already contains over 2300 stores that are supplied with over 8200 drops in almost 3000 roundtrips during one week (see Table 4.4 and Table 4.5). To collect detailed data of a sample sufficiently large for hypotheses testing would be an enormous effort.

138

139
125
5 Retailers’ sensitivity to local sustainability policies
This chapter examines the factors that determine the cost sensitivity of retailers with respect to time-windows and vehicle restrictions. After the introduction, we continue on the case study that was presented in the previous chapter. Based on a cross-case analysis we examine how different retailers are affected by similar Time-window pressure. We first examine whether this can be explained by differences in retailer type or by differences in supply chain strategy. Next, we also include the Network structure and Logistical planning dimensions in the cross-case analysis. In the second part of this chapter we explore these dimensions in more detail in an experiment. We present our research model, which is slightly adjusted for the experiment on distribution decisions and local authorities’ urban policy measures. Section 5.4 explains the methodology used for this experiment; an experimental design in combination with two cases, after which we discuss the cases’ variables and their values. Section 5.5 presents the results of the experiment. Next, we formulate propositions based on two cases, which are tested with a third case. In the final section we discuss the policy implications of the results and the conclusions of this chapter. 5.1 Introduction In spite of their common use in Western Europe, only little is known on the actual impact of time-window and vehicle restriction policies on companies’ costs and the environment. In the previous chapter we examined the impacts of varying Time-window pressure on the environmental performance and the retailers’ financial performance. Previous studies (e.g. Allen et al., 2004; Groothedde et al., 2003b) only focus on the immediate effects of time-window policies, whereas we presented the results of varying Time-window pressure cumulative over all cases (see Figure 4.5, Figure 4.6, and Figure 4.7). These figures do not show that the impact of similar Time-window pressure varies considerably for the different cases. It is yet unknown which dimensions within the logistics organisation cause retailers to be more sensitive to governmental time-window pressure. In this chapter we first focus on the factors that determine a retailer’s cost sensitivity to time-window policies. This part is explorative in nature, as we explore retailers’ operations reactions and cost sensitivity to Time-window pressure and determine the dimensions that drive the retailer’s Time-window pressure sensitivity. The research question we answer in the first part of this chapter is:
1. Which dimensions related to a retailer’s network structure and logistical planning determine its performance sensitivity to time-windows?
In the remaining part of this chapter we extend on the findings by quantifying the financial and environmental impacts of not only time-windows but also vehicle restrictions. We also quantify drivers for financial and environmental performance of actual distribution

140
Chapter 5
126
decisions in relation with time-windows and vehicle restrictions for different Logistical concepts. Next to time-windows, vehicle restrictions are the most common urban freight transport policy measures in the Netherlands (BCI, 2006). The main objective of both policy measures is to reduce the citizens’ inconvenience, by restricting transport to times only few residents feel the impact (time-windows) or to vehicles causing less intrusion (vehicle restrictions) (Allen et al., 2003). Basically, both time-windows and vehicle restrictions focus on improving the people-component of the sustainability triple-P; people, profit and planet (Feitelson, 2002; Nicolas et al., 2003; Richardson, 2005). Vehicle restrictions can apply to length, width, height, axle pressure, weight, engine type, and load factor (Munuzuri et al., 2005; Rijsenbrij, 2004). They usually aim at avoiding traffic problems, due to roundabouts, narrow streets, etc. However in the urban freight transportation context they are also considered to improve liveability by reducing perceived large vehicles’ impacts, such as pollution, intimidation, safety concerns, vibrations, stench, and noise (Anderson et al., 2005; Munuzuri et al., 2005). Our main research questions for the second part of this chapter are:
2. How do vehicle restrictions influence a retailer’s performance and the environment and how is this affected by time-window regulations, the retailer’s geographical store dispersion and the weekly fluctuations in volume to be transported?
3. Which decisions in the logistical concept are most cost-efficient to cope with time-windows and vehicle restrictions for different retailer types and how do these decisions influence the environment?
In chapter 4 our main objective was to find the impact of time-window regulations on distribution performance. Basically, we examined the deterministic relationship between Time-window pressure and Distribution performance. For the more probabilistic relation between Logistical concept, Time-window pressure, and Distribution performance that we examine in this chapter the preferred research strategy is an experiment, the second-best a survey, and a case study is only the third option (see Dul and Hak, 2007). We first explore which factors are relevant in determining the retailers’ sensitivity to time-window regulation (research question 1) with a comparative case study with real-life companies. We adopt a multiple case study method (see Eisenhardt, 1989; Yin, 2003). The case study in this chapter is a continuation of the one presented in chapter 4 and based on the same research framework (see Figure 4.2). We use the same constructs that are developed in section 4.3 and the same set of cases. The methodology discussed in section 4.4 also applies to this case study. We use a scenario analysis, employing vehicle routing software to calculate realistic retailer delivery routes, to assess the impact of Time-window pressure on the dependent constructs Operational, Financial, and Environmental distribution performance taking into account retailers’ characteristics, restraints and choices. By grouping the cases per dimension of the independent constructs Network structure and Logistical planning, we show which dimensions are particularly responsible for a retailer’s performance sensitivity to Time-window pressure. Based on the results of this case study we design an artificial experiment to answer the remaining two research questions of this chapter by evaluating different distribution

141
Retailers’ sensitivity to local sustainability policies
127
decisions and different policy measures for two cases. In this experimental design we look for causalities between the retailer’s decisions and its performance by examining the impacts of changes in relevant dimensions of the Logistical concept. A dimension’s relevance follows from the correlations between Logistical concept dimensions and the retailer’s performance under Time-window pressure from the case study (in the first part of this chapter). To obtain a good estimate of the Operational, Environmental and Financial distribution performance, we solve the operational vehicle routing problem for each combination of decisions, policies, and control variables. The research framework and the constructs developed in the previous chapter are used. We adjusted two constructs that were hard to vary in the experiment slightly. We also include two control variables in the experiment: the weekly delivery volume, based on actual (and therefore relatively slight) fluctuations in volume, and the geographical store dispersion, which affect performance but can not be changed (on the short term). We select two cases for the experiment, so that they differ in their average drop size (and the related number of deliveries combined in one vehicle roundtrip). This dimension is to a large extent determined by external factors. The drop size is used as selection criterion, since it can vary considerably: between really small drop sizes and full truckload sizes. It is also not feasible to vary it for one retailer in an experiment between these extremes, without changing its weekly transported volume considerably. 5.2 Retailers’ sensitivity to time-windows: results from cross-case analysis To answer this chapter’s first research question we use a cross-case analysis (Eisenhardt, 1989). We examine the independent constructs successively. First, we examine the effects of varying Time-window pressure for different retailer types for a constant time-window length of three hours (scenario 1C as defined in Table 4.8). Figure 5.1 shows the cost increase patterns for the different retailer types as the number of time-window affected stores increases. The pattern does not change by varying the time-window length, but the impact magnitude obviously does. For scenarios 1A and 1B the cost increase is, in line with Figure 4.6, lower than that for scenario 1C, however the pattern is similar. Figure 5.1 shows that especially the fashion retailers are affected by an increase in Time-window pressure. The impacts for the other retail types are similar. These results do not show what might cause these differences in cost sensitivity to varying Time-window pressure. In order to do that we subsequently examine the three constructs that together form the Logistical concept, i.e. Supply chain strategy, Network structure, and Logistical planning. The supply chain strategy has to find a balance between efficiency and responsiveness. Table 4.4 shows the supply chain strategy of the different cases. Figure 5.2 shows the impact of varying Time-window pressure for the cases grouped to their supply chain strategy, resulting in three groups: retailers focusing on efficiency in their supply chain, on responsiveness, or a mix of both. Once more, we only present the results for a time-window length of 3 hours (scenario 1C). The pattern is similar for other time-window lengths (i.e. scenarios 1A and 1B). As governmental time-window pressure increases, the cost increase of retailers using a responsive supply chain strategy is slightly higher than that of retailers

142
Chapter 5
128
that use an efficient supply chain strategy. Efficiency-orientated retailers (representatives can be found in any sector in our study) are affected more than the retailers with a mixed supply chain strategy.
RETAILER TYPECosts - scenario 1C
Drug
Department store
Food
Fashion
0%
10%
20%
30%
40%
50%
60%
0% 10% 20% 30% 40% 50% 60% 70% 80%
Time-window pressure: stores affected
Perc
enta
ge in
crea
se
Figure 5.1 Impacts of varying Time-window pressure for different Retailer types
SUPPLY CHAIN STRATEGYCosts - scenario 1C
Efficiency
Efficiency / Responsiveness
Responsiveness
0%
10%
20%
30%
40%
50%
60%
70%
80%
0% 20% 40% 60% 80% 100%
Time-window pressure: stores affected
Perc
enta
ge in
crea
se
(N = 7)
(N = 3)
(N = 4)
Figure 5.2 Impacts of varying Time-window pressure for different Supply chain
strategies The factors that may cause these differences between the cases might be explained by the constructs Network structure and Logistical planning. Unfortunately, the dimension values of these constructs are, except for self-imposed time-windows, not discrete. Therefore it is not possible to plot these dimension values directly, like we did for retailer type (in Figure 5.1) and Supply chain strategy (in Figure 5.2). By grouping the cases per dimension of the independent constructs Network structure and Logistical planning, we show which dimensions are particularly responsible for a retailer’s performance sensitivity to varying Time-window pressure. We distinguish four case groups for all Network structure and Logistical planning dimensions (see Table 5.1), so that all groups contain at least three cases, on which the dimension values vary from very low to very high (see Table 5.1).
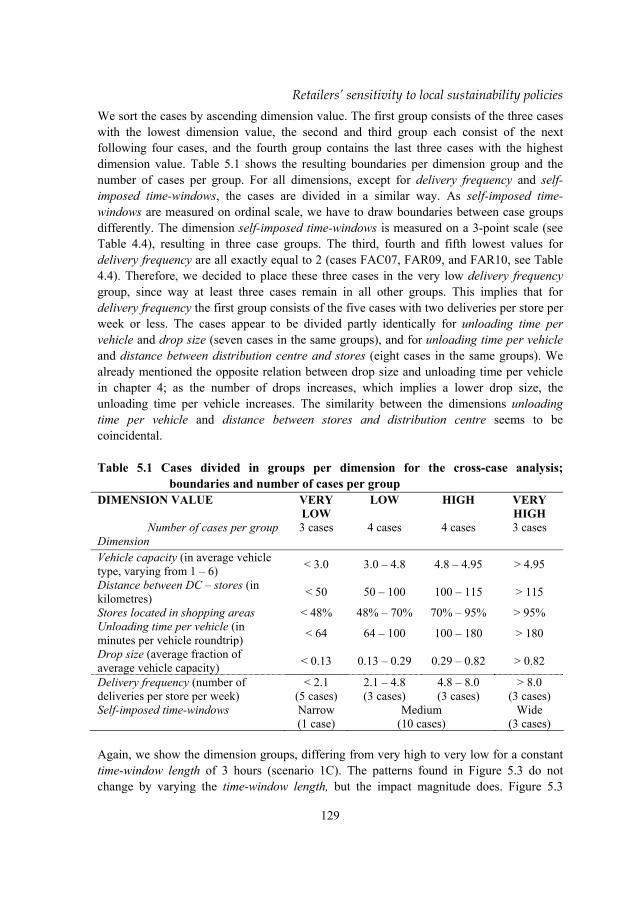
143
Retailers’ sensitivity to local sustainability policies
129
We sort the cases by ascending dimension value. The first group consists of the three cases with the lowest dimension value, the second and third group each consist of the next following four cases, and the fourth group contains the last three cases with the highest dimension value. Table 5.1 shows the resulting boundaries per dimension group and the number of cases per group. For all dimensions, except for delivery frequency and self-imposed time-windows, the cases are divided in a similar way. As self-imposed time-windows are measured on ordinal scale, we have to draw boundaries between case groups differently. The dimension self-imposed time-windows is measured on a 3-point scale (see Table 4.4), resulting in three case groups. The third, fourth and fifth lowest values for delivery frequency are all exactly equal to 2 (cases FAC07, FAR09, and FAR10, see Table 4.4). Therefore, we decided to place these three cases in the very low delivery frequency group, since way at least three cases remain in all other groups. This implies that for delivery frequency the first group consists of the five cases with two deliveries per store per week or less. The cases appear to be divided partly identically for unloading time per vehicle and drop size (seven cases in the same groups), and for unloading time per vehicle and distance between distribution centre and stores (eight cases in the same groups). We already mentioned the opposite relation between drop size and unloading time per vehicle in chapter 4; as the number of drops increases, which implies a lower drop size, the unloading time per vehicle increases. The similarity between the dimensions unloading time per vehicle and distance between stores and distribution centre seems to be coincidental. Table 5.1 Cases divided in groups per dimension for the cross-case analysis;
boundaries and number of cases per group DIMENSION VALUE VERY
LOW LOW HIGH VERY
HIGH Number of cases per group 3 cases 4 cases 4 cases 3 cases
Dimension Vehicle capacity (in average vehicle type, varying from 1 – 6) < 3.0 3.0 – 4.8 4.8 – 4.95 > 4.95
Distance between DC – stores (in kilometres) < 50 50 – 100 100 – 115 > 115
Stores located in shopping areas < 48% 48% – 70% 70% – 95% > 95% Unloading time per vehicle (in minutes per vehicle roundtrip) < 64 64 – 100 100 – 180 > 180
Drop size (average fraction of average vehicle capacity) < 0.13 0.13 – 0.29 0.29 – 0.82 > 0.82
Delivery frequency (number of deliveries per store per week)
< 2.1 (5 cases)
2.1 – 4.8 (3 cases)
4.8 – 8.0 (3 cases)
> 8.0 (3 cases)
Self-imposed time-windows Narrow (1 case)
Medium (10 cases)
Wide (3 cases)
Again, we show the dimension groups, differing from very high to very low for a constant time-window length of 3 hours (scenario 1C). The patterns found in Figure 5.3 do not change by varying the time-window length, but the impact magnitude does. Figure 5.3

144
Chapter 5
130
shows that if the values are high the cost sensitivity of the retailers is high is well for all dimensions, except for the delivery frequency and the drop size, which show an opposite pattern. For vehicle capacity we did not find a pattern.
UNLOADING TIME PER VEHICLECosts - scenario 1C
Very low
Low
High
Very high
0%
10%
20%
30%
40%
50%
60%
0% 10% 20% 30% 40% 50% 60% 70% 80%
Time-window pressure: stores affected
Perc
enta
ge c
ost i
ncre
ase
DISTANCE BETWEEN DC AND STORESCosts - scenario 1C
Very low
Low
High Very high
0%
10%
20%
30%
40%
50%
60%
0% 10% 20% 30% 40% 50% 60% 70% 80%
Time-window pressure: stores affected
Perc
enta
ge c
ost i
ncre
ase
DELIVERY FREQUENCYCosts - scenario 1C
Very low
Low
High
Very high 0%
10%
20%
30%
40%
50%
60%
0% 10% 20% 30% 40% 50% 60% 70% 80%
Time-window pressure: stores affected
Perc
enta
ge c
ost i
ncre
ase
DROP SIZECosts - scenario 1C
Very low
Low
High
Very high 0%
10%
20%
30%
40%
50%
60%
0% 10% 20% 30% 40% 50% 60% 70% 80%
Time-window pressure: stores affected
Perc
enta
ge c
ost i
ncre
ase
SELF-IMPOSED TIME-WINDOWSCosts - scenario 1C
Narrow Medium
Wide
0%
10%
20%
30%
40%
50%
60%
0% 20% 40% 60% 80% 100%
Time-window pressure: stores affected
Perc
enta
ge c
ost i
ncre
ase
STORES LOCATED IN SHOPPING AREASCosts - scenario 1C
Very low Low
High
Very high
0%
10%
20%
30%
40%
50%
60%
0% 20% 40% 60% 80% 100%
Time-window pressure: stores affected
Perc
enta
ge c
ost i
ncre
ase
Figure 5.3 Impacts of varying Time-window pressure for different Network structure
and Logistical planning dimensions Figure 5.3 shows that the retailer’s cost sensitivity to time-windows is positively related to dimensions in Network structure and Logistical planning on:
o The distance between stores and the distribution centre. o The (un)loading time per vehicle. o The self-imposed time-windows. o The percentage of stores located in shopping areas.
and negatively related to dimensions in Network structure on:

145
Retailers’ sensitivity to local sustainability policies
131
o The drop size. o The delivery frequency.
Most of the results in Figure 5.3 are intuitive. The cost impact of the Time-window pressure increases as distance between the DC and the stores increases, because the retailers have less time to visit the stores during the time-window period due to the longer distance to reach the stores in the first place. Retailers with a small drop size are affected most by time-windows. Retailers with small drop sizes combine many different stores per roundtrip in one vehicle. If the Time-window pressure increases they face a considerable increase in the number of roundtrips resulting in a decrease in the number of stores that can be combined in one roundtrip or at least in a less efficient roundtrip. To make these extra roundtrips, an increase in the vehicle fleet and number of kilometres is necessary, which immediately leads to a cost increase. Retailers with a short unloading time per vehicle, including the one using swap bodies, are affected least by increasing Time-window pressure. For an identical percentage of time-window affected stores, retailers with many stores located in shopping areas have a slightly higher cost increase than retailers with fewer stores in such shopping areas. This might seem unexpected, as these retail groups experience the same Time-window pressure, however it is caused by the fact that the stores located in shopping areas have on average longer (un)loading times, due to e.g. little truck manoeuvre space, congestion in narrow (unloading) streets, and the fact that some of the shopping centres include pedestrian areas in which no vehicles are allowed or in which vehicles simply can not enter. The higher the delivery frequency the lower the cost increase caused by increasing Time-window pressure. Retailers with a high delivery frequency have in general short distances between the DC and the stores. The retailers that have a very high delivery frequency have either so many affected stores every day that they can combine these stores in a roundtrip during the time-window period, or they have mainly point-to-point deliveries (full truckloads), in which case the number of vehicle kilometres hardly changes by an increase in Time-window pressure. 5.3 Dealing with urban policy measures: theoretical foundation and construct
adjustment The case study in section 5.2 focuses on correlations between Network structure dimensions and Logistical planning dimensions with Distribution performance. Based on the findings in this section, we look for possibilities for retailers to decrease their sensitivity to both time-windows and vehicle restrictions. By varying the dimension values in a retailer’s Logistical concept in an experiment we examine causalities between these dimensions and a retailer’s performance. Essentially we use the research framework we designed in the previous chapter (see Figure 4.2). However, some dimensions can not be varied easily by a retailer and are therefore not really suitable for an experiment. Therefore we slightly adjust the research framework. Since the number of locations in the shopping centre can not be varied on the short term, and changing it would be rather arbitrary, we do
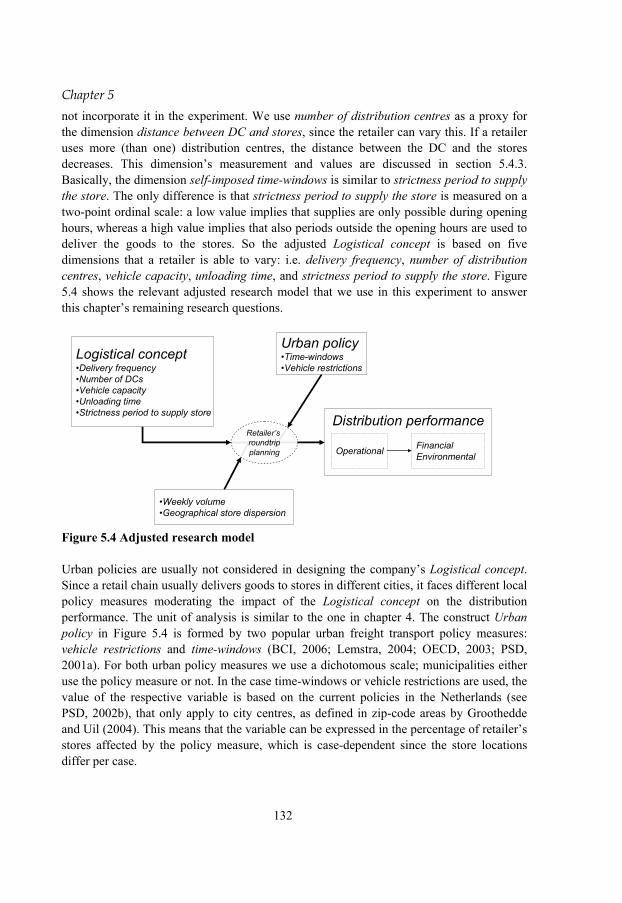
146
Chapter 5
132
not incorporate it in the experiment. We use number of distribution centres as a proxy for the dimension distance between DC and stores, since the retailer can vary this. If a retailer uses more (than one) distribution centres, the distance between the DC and the stores decreases. This dimension’s measurement and values are discussed in section 5.4.3. Basically, the dimension self-imposed time-windows is similar to strictness period to supply the store. The only difference is that strictness period to supply the store is measured on a two-point ordinal scale: a low value implies that supplies are only possible during opening hours, whereas a high value implies that also periods outside the opening hours are used to deliver the goods to the stores. So the adjusted Logistical concept is based on five dimensions that a retailer is able to vary: i.e. delivery frequency, number of distribution centres, vehicle capacity, unloading time, and strictness period to supply the store. Figure 5.4 shows the relevant adjusted research model that we use in this experiment to answer this chapter’s remaining research questions.
Logistical concept•Delivery frequency•Number of DCs•Vehicle capacity•Unloading time•Strictness period to supply store
Urban policy•Time-windows •Vehicle restrictions
Distribution performance
Operational FinancialEnvironmental
•Weekly volume•Geographical store dispersion
Retailer’s roundtripplanning
Figure 5.4 Adjusted research model Urban policies are usually not considered in designing the company’s Logistical concept. Since a retail chain usually delivers goods to stores in different cities, it faces different local policy measures moderating the impact of the Logistical concept on the distribution performance. The unit of analysis is similar to the one in chapter 4. The construct Urban policy in Figure 5.4 is formed by two popular urban freight transport policy measures: vehicle restrictions and time-windows (BCI, 2006; Lemstra, 2004; OECD, 2003; PSD, 2001a). For both urban policy measures we use a dichotomous scale; municipalities either use the policy measure or not. In the case time-windows or vehicle restrictions are used, the value of the respective variable is based on the current policies in the Netherlands (see PSD, 2002b), that only apply to city centres, as defined in zip-code areas by Groothedde and Uil (2004). This means that the variable can be expressed in the percentage of retailer’s stores affected by the policy measure, which is case-dependent since the store locations differ per case.

147
Retailers’ sensitivity to local sustainability policies
133
Finally, the last adjustment of the research framework is that we also include two control variables in the experiment. We control Distribution performance (see Figure 5.4) for weekly volume and geographical store dispersion. Weekly volume can have three different values: high, medium, and low. The difference between these values depends on the case. Some retailers face larger differences in the volume delivered to the stores per week than others. Retail chain stores are usually located quite heterogeneously. For example the region in which the retail chain began its business usually has a higher store-density than other regions. To control for the geographical store dispersion we also designed an alternative store-dispersion, in which we artificially located the stores more homogeneously over the country. We discuss this in more detail in the section 5.4.3. 5.4 Experiment with retailers’ distribution strategy 5.4.1 Case selection for the experiment We use the case study method and steps as proposed by Voss et al. (2002): case selection, protocol development, data collection, and analysis (based on the experiment). For the experiment we select two cases (retail chains) using a theoretical replication procedure (Voss et al., 2002; Yin, 2003); we select the cases so that they differ in their average drop size and in the (related) number of deliveries that are combined in one vehicle roundtrip. The drop size choice is usually determined by factors external to the Logistical concept (see for example Figure 4.1). Drop size partly determines the retailer’s cost sensitivity to time-windows (see section 5.2). Therefore, retailers with different drop sizes might cope differently with time-windows and vehicle restrictions. We opted for a fashion-store chain with a relatively low drop size and relatively many drops combined in one vehicle roundtrip and a department store chain with a relatively large drop size and relatively few drops combined in one vehicle roundtrip. For both retailers the drop size changes if the variable delivery frequency is varied in the experiment. The complexity of some of a supermarket chains’ goods (e.g. frozen and fresh), make it difficult to compare them with other chains and also to vary decisions like delivery frequency in the Logistical concept. We collected data for both cases based on a four-step research protocol (based on Yin, 2003, see chapter 4). We use two cases in the experiment that were also part of the case study in chapter 4 and section 5.2. Fashion retailer, FAR10, forms the first case in the experiment and department store retailer, DSC03, the second case. We test the propositions following from results of the other two cases in a third case, a drug store retailer (DRC01), which is situated between the others in terms of its average drop size and its average number of drops per vehicle roundtrip. 5.4.2 Experimental design To find the effects of the independent variable, Logistical concept, on the dependent variable, Distribution performance, the independent variable should be varied (Sekaran, 2003). We use experimentation to examine the impacts of Logistical concepts of several retailers and two different policy measures on the Environmental and Financial performance. To limit computation time, we base the experiment on a 2k-factorial design
148
Chapter 5
134
(Law, 2006). This design requires the variable values to be limited to two levels only. In our analysis all variable values are normalised, so that the low value corresponds to a value of -1, and the high value to +1 in the experiment. We vary five values of the variables of the Logistical concept, the two variables of Urban policy, and one control variable geographical store dispersion between a high and low value. The control variable weekly volume is an exception, which is varied between high, medium, and low. This variable is not part of the factorial design, but we calculate all scenarios from the factorial design for all three volume values. This implies we have a total of eight variables for the factorial design, which results in 28 possible variable combinations per weekly volume value. To decrease the computation time further we can reduce the number of variable combinations by using a 2k-p fractional factorial design (Law, 2006), which is a selected subset of the full 2k-design, without compromising the interpretability of the main results and the interactions effects. A risk in reducing the number of variable combinations is that the effect of one variable is confounded with the interaction effect of several other variables. This means that for example the algebraic expression of the main effect of variable 1 is identical to that of the interaction effect of variables 2, 3 and 4. To remove this risk, Law (2006) introduces a resolution for a 2k-p fractional factorial design. This resolution (denominated in Roman numbers) guarantees that two effects are not confounded with each other if the sum of their ‘ways’ is strictly less than the design’s resolution. Since we want to be able to interpret the unconfounded two-way interaction effects, this means we need a resolution V design (2 + 2 < 5; which satisfies the sum of their ‘ways’-condition). This choice assumes that three-way interaction effects are negligible. Based on this study’s results described in section 5.5 we see that these interactions are indeed negligible. The value for p follows from the resolution. Following the rules for constructing a 2k-p fractional factorial design (Law, 2006, p. 638), we find that for k = 8, and aiming at a resolution V, we need a p that equals 2, resulting in a 28
V2 − fractional factorial design. Appendix B shows all variable values for all
64 scenarios, or in other words the complete 28V2 − fractional factorial design that we used in
this chapter’s experiment. We examine 26 = 64 variable combinations, each representing a different scenario, for both cases and for three different values of weekly volume. As a result, we study 192 scenarios per case. General issues concerning validity and reliability of case studies are addressed in chapter 4. The experimental design with model-building techniques performs quite well from an internal validity perspective (Sekaran, 2003), since this enables control over the manipulation and the environment. 5.4.3 Variable values Table 5.2 shows the variable values for both cases. Gray-shaded cells represent the current retailer’s choice. In the experiment, we need realistic values for the non-current choice of each variable for both retailers. These values (non-shaded) were determined in consultation with the retailers and are based on values of other retailers (see Table 4.4 and Appendix A).
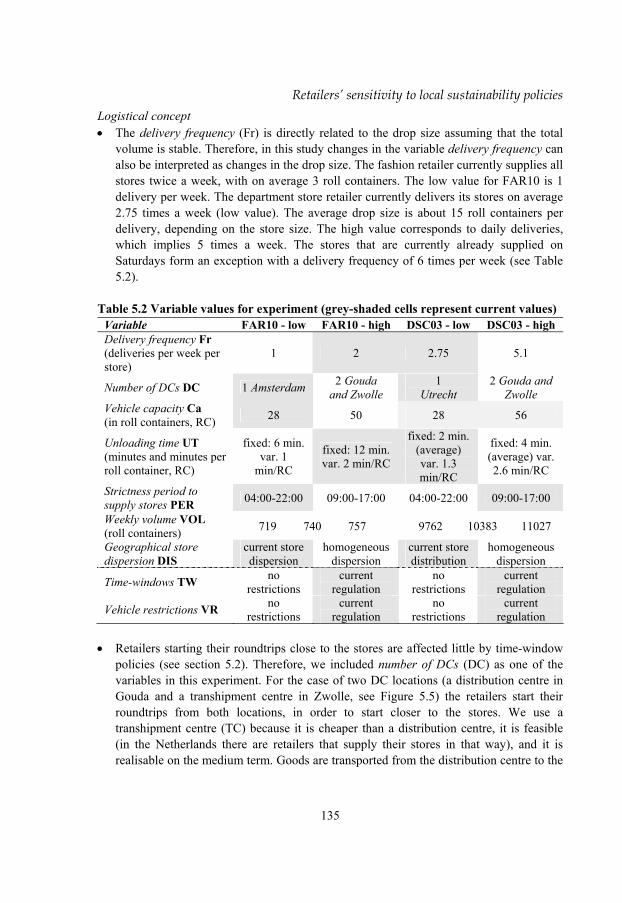
149
Retailers’ sensitivity to local sustainability policies
135
Logistical concept • The delivery frequency (Fr) is directly related to the drop size assuming that the total
volume is stable. Therefore, in this study changes in the variable delivery frequency can also be interpreted as changes in the drop size. The fashion retailer currently supplies all stores twice a week, with on average 3 roll containers. The low value for FAR10 is 1 delivery per week. The department store retailer currently delivers its stores on average 2.75 times a week (low value). The average drop size is about 15 roll containers per delivery, depending on the store size. The high value corresponds to daily deliveries, which implies 5 times a week. The stores that are currently already supplied on Saturdays form an exception with a delivery frequency of 6 times per week (see Table 5.2).
Table 5.2 Variable values for experiment (grey-shaded cells represent current values)
Variable FAR10 - low FAR10 - high DSC03 - low DSC03 - high Delivery frequency Fr (deliveries per week per store)
1 2 2.75 5.1
Number of DCs DC 1 Amsterdam 2 Gouda and Zwolle
1 Utrecht
2 Gouda and Zwolle
Vehicle capacity Ca (in roll containers, RC) 28 50 28 56
Unloading time UT (minutes and minutes per roll container, RC)
fixed: 6 min. var. 1
min/RC
fixed: 12 min. var. 2 min/RC
fixed: 2 min. (average) var. 1.3 min/RC
fixed: 4 min. (average) var. 2.6 min/RC
Strictness period to supply stores PER 04:00-22:00 09:00-17:00 04:00-22:00 09:00-17:00
Weekly volume VOL (roll containers) 719 740 757 9762 10383 11027 Geographical store dispersion DIS
current store dispersion
homogeneous dispersion
current store distribution
homogeneous dispersion
Time-windows TW no restrictions
current regulation
no restrictions
current regulation
Vehicle restrictions VR no restrictions
current regulation
no restrictions
current regulation
• Retailers starting their roundtrips close to the stores are affected little by time-window
policies (see section 5.2). Therefore, we included number of DCs (DC) as one of the variables in this experiment. For the case of two DC locations (a distribution centre in Gouda and a transhipment centre in Zwolle, see Figure 5.5) the retailers start their roundtrips from both locations, in order to start closer to the stores. We use a transhipment centre (TC) because it is cheaper than a distribution centre, it is feasible (in the Netherlands there are retailers that supply their stores in that way), and it is realisable on the medium term. Goods are transported from the distribution centre to the
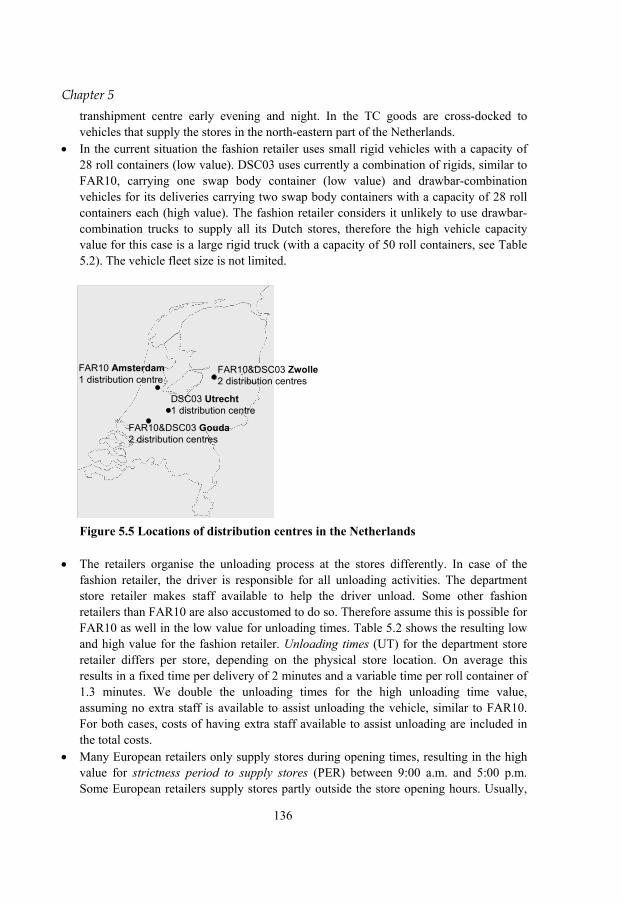
150
Chapter 5
136
transhipment centre early evening and night. In the TC goods are cross-docked to vehicles that supply the stores in the north-eastern part of the Netherlands.
• In the current situation the fashion retailer uses small rigid vehicles with a capacity of 28 roll containers (low value). DSC03 uses currently a combination of rigids, similar to FAR10, carrying one swap body container (low value) and drawbar-combination vehicles for its deliveries carrying two swap body containers with a capacity of 28 roll containers each (high value). The fashion retailer considers it unlikely to use drawbar-combination trucks to supply all its Dutch stores, therefore the high vehicle capacity value for this case is a large rigid truck (with a capacity of 50 roll containers, see Table 5.2). The vehicle fleet size is not limited.
FAR10&DSC03 Zwolle2 distribution centres
FAR10&DSC03 Gouda2 distribution centres
FAR10 Amsterdam1 distribution centre
DSC03 Utrecht1 distribution centre
Figure 5.5 Locations of distribution centres in the Netherlands
• The retailers organise the unloading process at the stores differently. In case of the
fashion retailer, the driver is responsible for all unloading activities. The department store retailer makes staff available to help the driver unload. Some other fashion retailers than FAR10 are also accustomed to do so. Therefore assume this is possible for FAR10 as well in the low value for unloading times. Table 5.2 shows the resulting low and high value for the fashion retailer. Unloading times (UT) for the department store retailer differs per store, depending on the physical store location. On average this results in a fixed time per delivery of 2 minutes and a variable time per roll container of 1.3 minutes. We double the unloading times for the high unloading time value, assuming no extra staff is available to assist unloading the vehicle, similar to FAR10. For both cases, costs of having extra staff available to assist unloading are included in the total costs.
• Many European retailers only supply stores during opening times, resulting in the high value for strictness period to supply stores (PER) between 9:00 a.m. and 5:00 p.m. Some European retailers supply stores partly outside the store opening hours. Usually,

151
Retailers’ sensitivity to local sustainability policies
137
these retailers start to supply stores already early in the morning, or continue after opening hours. This results in the value of low strictness period to supply stores starting at 4:00 a.m. and ending at 10:00 p.m.
Control variables The weekly volume (VOL) has three values, all based on actual volumes of the retailers, which vary between the weeks. The fashion retailer has only slight weekly differences in volume; mainly caused by differences in volume of winter and summer clothes. The department store retailer tries to level the weekly differences, resulting in the use of the same scheme for average weeks. This scheme is an average between the slow and the busy week scheme. In our experiment we use all three schemes, implying serious variation between the three weeks (see Table 5.2). The amount of goods shipped per week for the department store retailer is considerably higher (in total and per store) than for the fashion retailer.
FAR10 DSC03
Low value geographical store distribution (current situation)
High value geographical store distribution (more equally divided)
A
DC
B
Store density
Low
High
Store density
Low
High
Figure 5.6 Geographical store dispersion The second control variable, geographical store dispersion (DIS), examines the impact of the retailer’s store dispersion. Currently stores are rather dispersed for both retailers (see Figure 5.6A and Figure 5.6B). For the high factor value of this control variable we assigned new addresses to the stores, so that the stores are divided more equally over the Netherlands, under the condition that the average distance between the DC and the stores would be identical to that in the current store dispersion. The stores are assigned to new locations as follows: first we divided the Netherlands in 335 equally-sized regions. We randomly assigned stores to regions such that the average distance between DC and stores remains unaltered; close-by regions have a higher probability to contain a store than remote regions. We then randomly assigned a store to a zip-code area in that region. Finally, we
152
Chapter 5
138
assign the flows to the stores as follows: the flows of the store located in the largest municipality (in the current store dispersion) are assigned to a location in the largest municipality (based on the number of inhabitants) in the new store dispersion. We do the same for the second largest municipality, and so on. Figure 5.6C and Figure 5.6D show this new, more homogeneous store dispersion for both retailers. Urban policy measures Two variables determine Urban policy: time-windows and vehicle restrictions. Both policy measures only apply to city centres. This implies both retailers are affected differently, because of differences in their store locations. To make the two different states of geographical store dispersion comparable, the policy measures for the high variable value (homogeneous store dispersion) are assigned similarly to the stores as in the current situation. The largest stores in the new situation face the policy measures that correspond to those of the largest store in the current situation. The low value for time-windows means that both retailers do not face any governmental time-window restriction. The high time-window values represent the current situation and (coincidentally) affect both retailers similarly; about 70% of their stores are affected by a time-window restriction. A low value for vehicle restrictions means that retailers can deliver all their stores with their normal vehicle fleet (being either large or small-capacity trucks, depending on the value of vehicle capacity). The vehicle restriction’s high value, the current regulation, affects 26% of the fashion retailer’s stores and 28% of the department store retailer’s stores. The current vehicle restrictions (see e.g. PSD, 2002b) can apply to vehicle length, width, height, axle pressure, weight, engine type, and load factor. We do not distinguish between these different restrictions; in this study the retailer uses a small rigid vehicle that answers most commonly used restrictions regarding weight, length, and height. The capacity of this small vehicle is 18 roll containers. Next to the normal vehicle fleet, the retailer has to use this small vehicle to supply a vehicle restriction affected store. In reality both retailers try to minimise the number of vehicles differing from their normal fleet. Therefore, in calculating vehicle routes we first minimise the number of these small rigids (just enough to supply all vehicle restriction affected stores). 5.4.4 Distribution performance To calculate the retailers’ performance in the different scenarios, based on different combinations of the variables, we have to solve a vehicle routing problem with time-windows (VRPTW) 192 times for both cases. We again use the standard vehicle routing software SHORTREC 7.0, developed by Ortec consultants (see section 4.4) to solve the VRPTW for each scenario. In this study we do not aim at finding an (almost) optimal solution, but at approximating the retailers’ actual roundtrip planning as good as possible. For all scenarios and in consultation with the retailers we calculate a feasible and realistic roundtrip planning using SHORTREC. From the scenario roundtrips we derive the Operational performance, and from that the Financial and Environmental performance for the distribution from the distribution centres to the stores. The total financial performance

153
Retailers’ sensitivity to local sustainability policies
139
includes the transport costs (from distribution centre to the stores), the transhipment costs (between the distribution centre in Gouda and the transhipment centre in Zwolle, in case number of DCs is high), handling costs at the transhipment centre (all based on the tariffs of one of the retailer’s logistics service providers, see Table 5.3) and the (extra) unloading costs at the stores in case extra staff, apart from the driver, is made available (based on retailer’s cost-indications for staff, see Table 5.3). The cost for extra staff is based on the actual unloading times; we assume that these staffs have other duties during the day. The variable costs per vehicle type correspond with those used in chapter 4 (see Table 4.3). Table 5.3 Costs per action type (other than costs per vehicle) Action type Costs Handling (TC) during night (per person, per hour) € 32 Unloading at stores (per person, per hour) € 30 For both cases we estimate the regression equations for the Financial (euros) and Environmental performance (CO2 and PM10 emissions) based on the 192 scenarios per case. We use the total amount of local emissions as an indication for the local environmental impacts. The regression equations describe the relationship between the retailer’s Logistical concept, the Urban policy, the geographical store dispersion, the weekly volume, and the Distribution performance. The independent variables are not mutually correlated, since the retailer is able to change the design variables independently. We use the software package SPSS 14 to estimate the regression equations, based on least square estimates. All presented main and interaction effects in the regression equations as well as the figures in section 5.5 are significant at the 1% level. 5.5 Results from the experiment 5.5.1 Descriptive statistics Table 5.4 summarises the descriptive statistics of both cases for all 192 scenarios. Table 5.4 Descriptive statistics (for a period of one week)
FAR10 DSC03 Mean Range Mean Range
Distance (in 1000 km) 9.6 11.6 78.5 77.1 Total time used (in 10 hours) 21.6 24.8 175.1 155.0 Driving time (in 10 hours) 16.1 21.9 124.3 138.7 Number of vehicles used 27.8 51 214.2 331 Roundtrips 32.2 44 370.0 340 Deliveries per roundtrip 6.5 11.5 3.2 5.7 Vehicle load factor (when leaving DC) 0.79 0.68 0.91 0.25 CO2 emissions (1000 kilogram) 5.1 6.9 40.0 31.5 PM10 emissions (kilogram) 1.0 1.3 8.1 8.7 Costs (in € 1000) 10.6 11.2 83.6 61.6

154
Chapter 5
140
The table’s first 6 indicators show the Operational performance for both cases, followed by the Environmental performance and Financial performance. The indicators are based on one week’s operations. 5.5.2 Financial performance The following regression equation estimates the drivers of the fashion retailer’s total weekly costs:
Total costs FAR10 (in € 1000) = 10.6 + 2.1xFr + 0.9xTW + 0.6xPER + 0.4xVR + 0.4xTWxFr + 0.4xTWxPER + 0.3xFrxCa + 0.3xCa + 0.3xTWxCa + 0.3xDC + 0.3xFrxPER + 0.2xUT + 0.2xCaxPER + 0.2xDCxCa + 0.2xDIS + 0.2xVOL - 0.1xFrxDIS + 0.1xTWxUT + 0.1xVRxDC + 0.1xFrxUT + 0.1xCaxUT - 0.1xTWxDIS + 0.1xUTxPER +0.1xVRxFr
R2 = 0.993 (Adjusted R2 = 0.991)
The factors in the regression analysis are all normalised. The effect from moving from a low factor value (-1) to a high factor value (1) is easily found in the regression equation; for example the main effect of time-windows is the difference between a low value for time-windows (-1) and the high value (1), so time-windows increase costs for this retailer by about € 1800 per week. This equation shows that costs decrease most if the delivery frequency changes from twice (current situation) to once a week; this would result in (direct) weekly savings of € 4200. If time-windows are present, savings are even higher. The interaction effects in the regression equation may be significant, but they are small in comparison with most main effects. Only the choice of vehicle capacity depends mainly on the values of the other variables. If FAR10 only considers the main effect of vehicle capacity, it would be wise to use small vehicles, especially in case of time-windows. However, this does not hold in case the retailer uses a low delivery frequency, a long period to supply at the stores, one distribution centre, and short unloading times at the stores. The interaction effect of vehicle capacity with time-windows equals the direct effect of vehicle capacity. Both urban policy measures increase costs. The following regression equation estimates the drivers of the department store retailer’s total weekly costs:
Total costs DSC03 (in € 1000) = 83.6 - 6.6xCa + 5.8xVR + 4.8xDC + 4.1xVOL + 4.0xFr + 2.5xTW + 1.6xUT + 1.5xVRxCa + 1.5xPER + 1.4xDIS + 0.9xFrxCa + 0.9xDCxDIS + 0.8xTWxCa + 0.8xDCxCa + 0.7xTWxFr + 0.6xCaxUT + 0.6xCaxPER + 0.6xVRxFr + 0.6xUTxPER + 0.5xTWxPER + 0.4xTWxUT + 0.4xVRxDIS + 0.3xVOLxDC + 0.3xTWxDC + 0.2xDCxPER R2 = 0.993 (Adjusted R2 = 0.990)
This equation shows that the choice of capacity is most important for this retailer considering its costs. The magnitudes of the interaction effects are rather small, in comparison with those of the main effects for this retailer. Again both urban policy measures increase costs.

155
Retailers’ sensitivity to local sustainability policies
141
Figure 5.7 shows the standardised regression coefficients (betas) for both cases for all significant main and interaction effects (significant at the 1% level). The larger differences in weekly volume for DSC03 obviously result in larger effects. More interesting is the fact that there is only one (quite limited) significant effect interacting with weekly volume. So the impact of policy measures and distribution decisions is similar, even if the weekly volume varies. Variations in weekly volume, often less than 15% for retail chains that (partly) push goods to the stores, do not have an impact on the most cost-efficient distribution strategy. The impact of the other control variable, geographical store dispersion, is similar for both cases, but limited in magnitude. A more heterogeneous store dispersion, in which the average distance between the stores is higher, results in more kilometres per roundtrip (an increase of about 6% in kilometres) and increases cost slightly. The interaction effects of geographical store dispersion with other variables are very small in comparison with the main effects. We conclude that the impacts of policy measures and distribution decisions are hardly influenced by differences in geographical store dispersion.
-0.8
-0.6
-0.4
-0.2
0.0
0.2
0.4
0.6
0.8
1.0
OL W VR
DC Fr Ca
UT s- IS VR C Fr Ca
UT R S
DC Fr Ca
UT
ER IS Fr Ca
UT
ER IS Ca
UT
ER IS UT
ER IS ER IS IS W VR
DC Fr Ca
UT
ER IS
Stan
dard
ized
Coe
ffici
ents
(Bet
a)
FAR10
DSC03
Veh
icle
cap
acity
-Ca
Wee
kly
volu
me-
VOL
Tim
e-w
indo
ws-
TWVe
hicl
e re
stric
tions
-VR
Num
ber o
f DC
s-D
CD
eliv
ery
frequ
ency
-Fr
Unl
oadi
ng ti
me-
UT
Stric
tnes
s pe
riod
to s
uppl
y st
ores
-PER
Geo
grap
hica
l sto
re d
ispe
rsio
n-D
ISTW
x V
RTW
x D
CTW
x F
rTW
x C
aTW
x U
TTW
x P
ERTW
x D
ISVR
x D
CVR
x F
rVR
x C
aVR
x U
TVR
x P
ERVR
x D
ISD
C x
Fr
DC
x C
aD
C x
UT
DC
x P
ERD
C x
DIS
Fr x
Ca
Fr x
UT
Fr x
PER
Fr x
DIS
Ca
x U
TC
a x
PER
Ca
x D
ISU
T x
PER
UT
x D
ISPE
R x
DIS
VO
L x
TWV
OL
x VR
VOL
x D
CV
OL
x Fr
VOL
x C
aVO
L x
UT
VOL
x P
ERVO
L x
DIS
Sta
ndar
dise
d co
effic
ient
s (B
etas
)
Figure 5.7 Comparison between cases: standardised financial performance drivers 5.5.3 Environmental performance The next two regression equations show the environmental performance drivers (both for the local pollutant PM10 and the global pollutant CO2) for FAR10.
Total emissions PM10 FAR10 (in 10 gram) = 102.1 + 19.1xFr - 13.9xCa +10.4xTW + 6.5xPER + 5.4xTWxFr + 4.5xTWxPER + 4.1xVR + 3.7xFrxPER + 3.0xDCxCa + 2.0xVRxDC + 1.9xUT + 1.9xTWxUT + 1.9xVRxCa + 1.9xVOL -1.8xFrxDIS + 1.7xDIS + 1.5xTWxCa + 1.4xDC
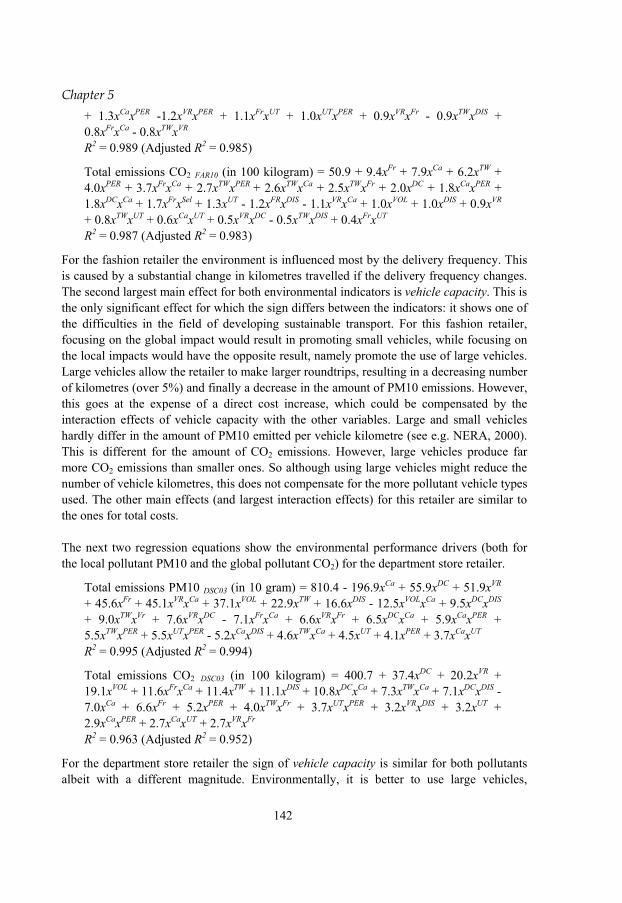
156
Chapter 5
142
+ 1.3xCaxPER -1.2xVRxPER + 1.1xFrxUT + 1.0xUTxPER + 0.9xVRxFr - 0.9xTWxDIS + 0.8xFrxCa - 0.8xTWxVR R2 = 0.989 (Adjusted R2 = 0.985)
Total emissions CO2 FAR10 (in 100 kilogram) = 50.9 + 9.4xFr + 7.9xCa + 6.2xTW + 4.0xPER + 3.7xFrxCa + 2.7xTWxPER + 2.6xTWxCa + 2.5xTWxFr + 2.0xDC + 1.8xCaxPER + 1.8xDCxCa + 1.7xFrxSel + 1.3xUT - 1.2xFRxDIS - 1.1xVRxCa + 1.0xVOL + 1.0xDIS + 0.9xVR + 0.8xTWxUT + 0.6xCaxUT + 0.5xVRxDC - 0.5xTWxDIS + 0.4xFrxUT R2 = 0.987 (Adjusted R2 = 0.983)
For the fashion retailer the environment is influenced most by the delivery frequency. This is caused by a substantial change in kilometres travelled if the delivery frequency changes. The second largest main effect for both environmental indicators is vehicle capacity. This is the only significant effect for which the sign differs between the indicators: it shows one of the difficulties in the field of developing sustainable transport. For this fashion retailer, focusing on the global impact would result in promoting small vehicles, while focusing on the local impacts would have the opposite result, namely promote the use of large vehicles. Large vehicles allow the retailer to make larger roundtrips, resulting in a decreasing number of kilometres (over 5%) and finally a decrease in the amount of PM10 emissions. However, this goes at the expense of a direct cost increase, which could be compensated by the interaction effects of vehicle capacity with the other variables. Large and small vehicles hardly differ in the amount of PM10 emitted per vehicle kilometre (see e.g. NERA, 2000). This is different for the amount of CO2 emissions. However, large vehicles produce far more CO2 emissions than smaller ones. So although using large vehicles might reduce the number of vehicle kilometres, this does not compensate for the more pollutant vehicle types used. The other main effects (and largest interaction effects) for this retailer are similar to the ones for total costs. The next two regression equations show the environmental performance drivers (both for the local pollutant PM10 and the global pollutant CO2) for the department store retailer.
Total emissions PM10 DSC03 (in 10 gram) = 810.4 - 196.9xCa + 55.9xDC + 51.9xVR + 45.6xFr + 45.1xVRxCa + 37.1xVOL + 22.9xTW + 16.6xDIS - 12.5xVOLxCa + 9.5xDCxDIS + 9.0xTWxVr + 7.6xVRxDC - 7.1xFrxCa + 6.6xVRxFr + 6.5xDCxCa + 5.9xCaxPER + 5.5xTWxPER + 5.5xUTxPER - 5.2xCaxDIS + 4.6xTWxCa + 4.5xUT + 4.1xPER + 3.7xCaxUT R2 = 0.995 (Adjusted R2 = 0.994)
Total emissions CO2 DSC03 (in 100 kilogram) = 400.7 + 37.4xDC + 20.2xVR + 19.1xVOL + 11.6xFrxCa + 11.4xTW + 11.1xDIS + 10.8xDCxCa + 7.3xTWxCa + 7.1xDCxDIS - 7.0xCa + 6.6xFr + 5.2xPER + 4.0xTWxFr + 3.7xUTxPER + 3.2xVRxDIS + 3.2xUT + 2.9xCaxPER + 2.7xCaxUT + 2.7xVRxFr R2 = 0.963 (Adjusted R2 = 0.952)
For the department store retailer the sign of vehicle capacity is similar for both pollutants albeit with a different magnitude. Environmentally, it is better to use large vehicles,
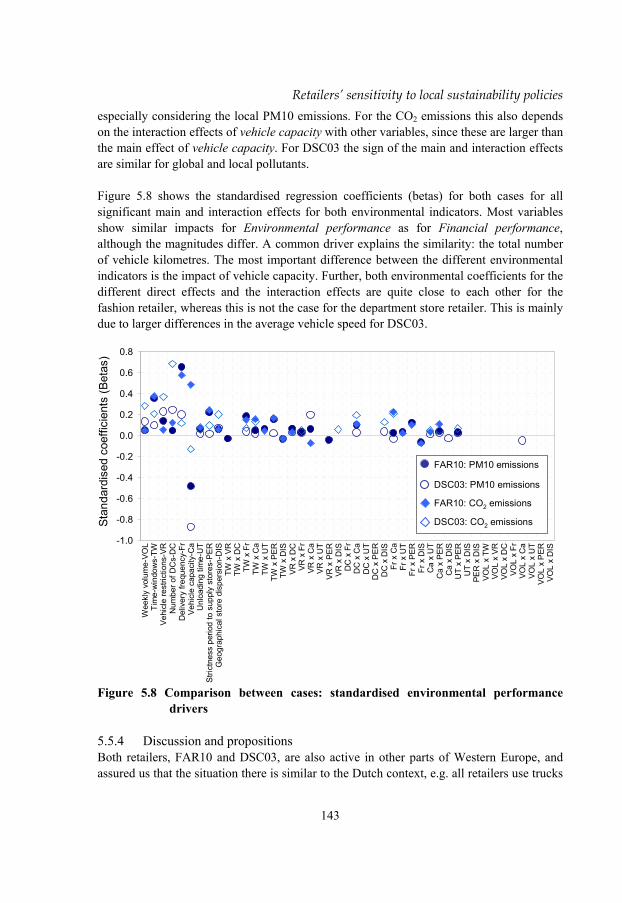
157
Retailers’ sensitivity to local sustainability policies
143
especially considering the local PM10 emissions. For the CO2 emissions this also depends on the interaction effects of vehicle capacity with other variables, since these are larger than the main effect of vehicle capacity. For DSC03 the sign of the main and interaction effects are similar for global and local pollutants. Figure 5.8 shows the standardised regression coefficients (betas) for both cases for all significant main and interaction effects for both environmental indicators. Most variables show similar impacts for Environmental performance as for Financial performance, although the magnitudes differ. A common driver explains the similarity: the total number of vehicle kilometres. The most important difference between the different environmental indicators is the impact of vehicle capacity. Further, both environmental coefficients for the different direct effects and the interaction effects are quite close to each other for the fashion retailer, whereas this is not the case for the department store retailer. This is mainly due to larger differences in the average vehicle speed for DSC03.
-1.0
-0.8
-0.6
-0.4
-0.2
0.0
0.2
0.4
0.6
0.8
r r R r R R R R R r R
Stan
dard
ized
Coe
ffici
ents
(Bet
a)
Vehi
cle
capa
city
-Ca
Wee
kly
volu
me-
VOL
Tim
e-w
indo
ws-
TWVe
hicl
e re
stric
tions
-VR
Num
ber o
f DC
s-D
CD
eliv
ery
frequ
ency
-Fr
Unl
oadi
ng ti
me-
UT
Stric
tnes
s pe
riod
to s
uppl
y st
ores
-PER
Geo
grap
hica
l sto
re d
ispe
rsio
n-D
ISTW
x V
RTW
x D
CTW
x F
rTW
x C
aTW
x U
TTW
x P
ERTW
x D
ISV
R x
DC
VR x
Fr
VR x
Ca
VR x
UT
VR x
PER
VR x
DIS
DC
x F
rD
C x
Ca
DC
x U
TD
C x
PER
DC
x D
ISFr
x C
aFr
x U
TFr
x P
ERFr
x D
ISC
a x
UT
Ca
x PE
RC
a x
DIS
UT
x PE
RU
T x
DIS
PER
x D
ISVO
L x
TWVO
L x
VRVO
L x
DC
VOL
x Fr
VOL
x C
aVO
L x
UT
VOL
x P
ERVO
L x
DIS
FAR10: PM10 emissions
DSC03: PM10 emissions
FAR10: CO2 emissions
DSC03: CO2 emissionsStan
dard
ised
coe
ffici
ents
(Bet
as)
Figure 5.8 Comparison between cases: standardised environmental performance
drivers 5.5.4 Discussion and propositions Both retailers, FAR10 and DSC03, are also active in other parts of Western Europe, and assured us that the situation there is similar to the Dutch context, e.g. all retailers use trucks
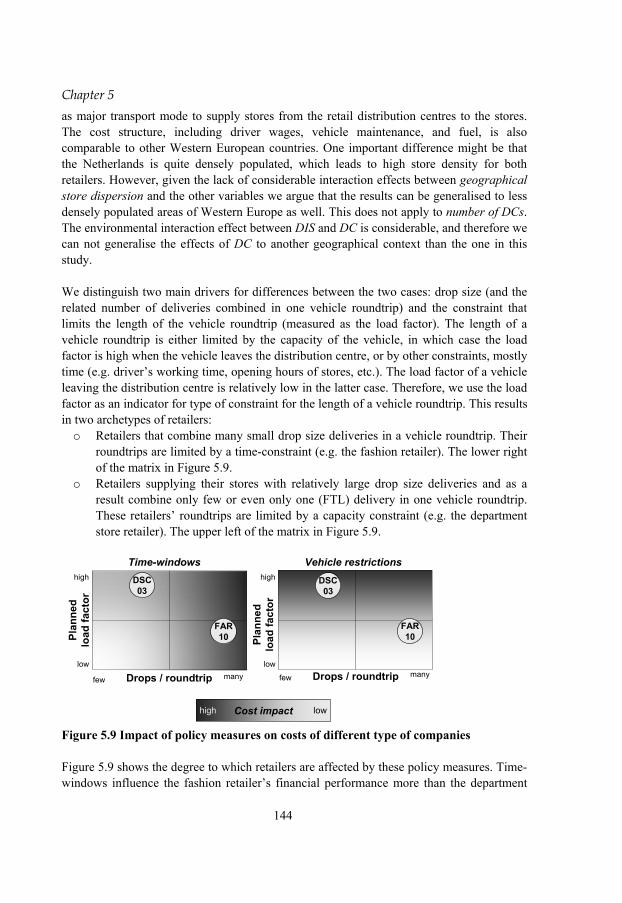
158
Chapter 5
144
as major transport mode to supply stores from the retail distribution centres to the stores. The cost structure, including driver wages, vehicle maintenance, and fuel, is also comparable to other Western European countries. One important difference might be that the Netherlands is quite densely populated, which leads to high store density for both retailers. However, given the lack of considerable interaction effects between geographical store dispersion and the other variables we argue that the results can be generalised to less densely populated areas of Western Europe as well. This does not apply to number of DCs. The environmental interaction effect between DIS and DC is considerable, and therefore we can not generalise the effects of DC to another geographical context than the one in this study. We distinguish two main drivers for differences between the two cases: drop size (and the related number of deliveries combined in one vehicle roundtrip) and the constraint that limits the length of the vehicle roundtrip (measured as the load factor). The length of a vehicle roundtrip is either limited by the capacity of the vehicle, in which case the load factor is high when the vehicle leaves the distribution centre, or by other constraints, mostly time (e.g. driver’s working time, opening hours of stores, etc.). The load factor of a vehicle leaving the distribution centre is relatively low in the latter case. Therefore, we use the load factor as an indicator for type of constraint for the length of a vehicle roundtrip. This results in two archetypes of retailers: o Retailers that combine many small drop size deliveries in a vehicle roundtrip. Their
roundtrips are limited by a time-constraint (e.g. the fashion retailer). The lower right of the matrix in Figure 5.9.
o Retailers supplying their stores with relatively large drop size deliveries and as a result combine only few or even only one (FTL) delivery in one vehicle roundtrip. These retailers’ roundtrips are limited by a capacity constraint (e.g. the department store retailer). The upper left of the matrix in Figure 5.9.
Cost impact lowhigh
Plan
ned
load
fact
or
low
high
Plan
ned
load
fact
or
few manylow
high
Drops / roundtrip
Case2
Case1
Time-windows Vehicle restrictions
few manyDrops / roundtrip
Case2
Case1
FAR10
FAR10
DSC03
DSC03
Figure 5.9 Impact of policy measures on costs of different type of companies Figure 5.9 shows the degree to which retailers are affected by these policy measures. Time-windows influence the fashion retailer’s financial performance more than the department

159
Retailers’ sensitivity to local sustainability policies
145
store retailer’s (see Figure 5.7). Vehicle restrictions have an opposite effect: they affect the department store retailer’s financial performance more than the fashion retailer’s. This mainly results from the contrast in the number of deliveries per vehicle roundtrip. Time-windows make it difficult to combine several store deliveries in one roundtrip. FAR10 combines many deliveries per roundtrip (see Table 5.4). If, for example, only a few of these stores are affected by a time-window, this results in extra kilometres. After all, the original roundtrip (no time-windows) was most kilometre-efficient. On the other hand, if a vehicle only visits two stores in a roundtrip, the order does not influence the number of kilometres. Vehicle restrictions force the retailer with large drop sizes to make almost exclusively FTL deliveries (because of the small vehicle capacity) or worse: visit a store twice. The retailer using small drop size deliveries is still able to combine several deliveries in a roundtrip. The small rigids’ load factor is relatively high for FAR10 (with its small drop size) and relatively low for DSC03, which is opposite to the regular fleet’s load factor for the cases. The position of the cases in Figure 5.9 is based on the current situation; obviously the position is different if the Logistical concept or the policy context changes. For example, increasing Time-window pressure can lead to a lower planned load factor and to fewer drops per roundtrip. This would move the retailer’s position in the matrix (see Figure 5.9) to the lower left direction. This leads to the following propositions (see Figure 5.9): Proposition I Time-windows have a larger cost impact on retailers that combine many
deliveries in one roundtrip than on retailers combining few deliveries in one roundtrip.
Proposition II Vehicle restrictions have a larger cost impact on retailers whose roundtrips are limited by the capacity of the vehicle (high load factor) than on retailers whose roundtrips are constrained by other than capacity constraints.
The impact of the period to supply stores is higher for FAR10 than for DSC03. The explanation is similar to that of the time-windows and vehicle capacity. In case it is difficult to have a high load factor, due to time-windows or a high delivery frequency it is better to have a long period to supply the stores for FAR10. This does not apply for DSC03, since it is able to achieve a high load factor anyway. This leads to the following proposition: Proposition III It is more cost-efficient for retailers whose roundtrips are limited by non-
capacity constraints to increase the period to supply the stores than for retailers whose roundtrips are constrained by the capacity of the vehicle.
Other decisions can also be discussed in the light of Figure 5.9’s matrix and its two dimensions. Decisions on the adequate vehicle capacity differ considerably for both cases. For DSC03 it is better to use large vehicles, although the cost-advantage decreases slightly if it faces policy restrictions. The department store’s average vehicle load factor is 0.91 for both low and high vehicle capacity (see also Table 5.4). FAR10 has an average vehicle load factor of only 0.71 using large vehicles and 0.86 using small vehicles. Time constraints prevent a higher load factor. The driver can not visit an extra store, although some vehicle capacity is idle when it leaves the distribution centre to start its roundtrip. In terms of the

160
Chapter 5
146
matrix in Figure 5.9, this implies that retailers located in the upper part, a high planned load factor, better use large vehicles. If, due to e.g. increasing time-window pressure, a retailer moves down in the matrix, small capacity trucks become more attractive. For both types of retailers it is more cost-efficient to have a low delivery frequency, long periods to supply the stores, short unloading times, and a low number of distribution centres. However, the degree of cost-efficiency varies for different types of retailers, e.g. it is more cost-efficient to use one distribution centre for DSC03 than for FAR10. This follows from different improvements related to starting from two locations instead of one. The fashion retailer is able to reduce its kilometres by 18% using a transhipment centre (TC), while this is only 11% for the department store retailer. Using a transhipment centre is more cost-efficient for a retailer with many drops per roundtrip, such as FAR10, than for DSC03 although the percentage of stores supplied from the TC is similar for both cases. By starting closer to the stores, such a retailer is able to increase the load factor, in contrast to a retailer with only a few drops per roundtrip. Visiting the stores with a low delivery frequency reduces costs for especially the FAR10 that is currently delivering in small quantities. If FAR10 faces time-window policies, reducing the delivery frequency is definitely worthwhile considering in view of delivery costs, since the impact of this decision, which moves a retailer to the upper left in the matrix, is opposite to the effect of time-windows. A low delivery frequency leads to a high position in the matrix, which would result in the choice for large vehicles (see the results for FAR10, Figure 5.7). 5.5.5 Testing propositions and verifying results We test the propositions and verify the results discussed in the previous section with a third case, a drug store retailer (DRC01, see Appendix A). This retailer is positioned in between the other two cases in the matrix, namely in the upper right corner: many drops per roundtrip and a high vehicle load factor (see Table 5.5). The two control variables, weekly volume and geographical store dispersion, influence the performance, a higher weekly volume and a more homogeneous store dispersion add to costs. However, the interaction effects between retailers’ decisions in the Logistical concept and the two control variables are negligible (see Figure 5.7 and Figure 5.8). Therefore, we do not include these two variables in this test and only examine the five variables in the Logistical concept and the two Urban policy variables. Therefore a 37
IV2 − fractional factorial design is sufficient (see Law, 2006). Appendix B shows all variable values for all 16 scenarios, the complete
37IV2 − fractional factorial design that we use to test the propositions. The resolution of this
design does not allow interpreting the interaction effects. The policy measures are varied similar to the other two cases. However, because many stores are located outside the core shopping centres, the percentage of affected stores is only half that of the other cases. DRC01’s values for delivery frequency, number of DCs, unloading times, and strictness period to supply stores correspond to FAR10 (see Table 5.2) and the values for vehicle capacity corresponds to DSC03. In the current situation the drug store retailer uses a delivery frequency of one delivery per week and has one distribution centre, about 20

161
Retailers’ sensitivity to local sustainability policies
147
kilometres northwest from Amsterdam (see Figure A.1). This retailer currently supplies its almost 500 stores in 100 roundtrips per week. Table 5.5 shows the descriptive statistics of this case. Figure 5.10 shows the main effects of all three cases. For the drugstore retailer we only examined 16 scenarios, resulting in low or non significance of the effects. However, we still show the effects to give an indication of the direction. For the drug store retailer only vehicle capacity and delivery frequency are significant at the 1% level and vehicle restrictions at the 10% level, whereas for the other two cases all effects shown in Figure 5.10 are significant at the 1% level. Table 5.5 Descriptive statistics for DRC01 (one week)
Mean Range Distance (in 1000km) 33.2 22.9 Total time used (in 10hours) 80.5 56.4 Driving time (in 10hours) 55.8 36.5 Roundtrips 125.6 92 Deliveries per roundtrip 6.7 10.8 Vehicle load factor (when leaving DC) 0.90 0.27 Costs (in 1000 Euro) 38.4 18.9
Based on DRC01’s position in Figure 5.9’s matrix, in the upper right part, we expect it to be influenced more or less similar to FAR10 on time-windows and to DSC03 on vehicle restrictions. However, because of the much lower policy pressure, this is not exactly the case. After all, from chapter 4 we learned that if time-window pressure increases, the impact increases even more. The smaller difference in policy pressure, DRC01’s high and low value for both policy measures are closer to each other than for the other cases, explains the lower cost impact than for the other two cases, as well as the lower (or lacking) significance. However, the result of this difference in time-window pressure causes that propositions I and II can not be tested properly with this data. The results and the argumentation on the results provide reasons to confirm both propositions. The position of DRC01 for the strictness period to supply the stores seems to confirm proposition III, although DRC01’s PER-effect is not significant.
-0.8
-0.6
-0.4
-0.2
0.0
0.2
0.4
0.6
0.8
1.0
TW VR DC Fr Ca UT PER
Stan
dard
ized
coe
ffici
ents
(Bet
a)
statistically insignificant effect at 1% level
statistically significant effect at 1% level
FAR10
DSC03
DRC01
DRC01
Sta
ndar
dise
d co
effic
ient
s (B
etas
)
Figure 5.10 Main effects on costs compared with a third case

162
Chapter 5
148
The other decision impacts correspond to the expectations; the financial impact of changing the delivery frequency is the same for FAR10 and DRC01, which follows from the similarity in their horizontal position in Figure 5.9’s matrix (i.e. similarity in their drop size). For the high capacity vehicles and for the low capacity vehicles, DRC01 is able to leave the distribution centre with a high vehicle load factor, respectively 0.88 and 0.91. Therefore, the effect of vehicle capacity corresponds to that of DSC03. For unloading time (although not significant) the impacts are quite similar to the other cases. The only effect for which DRC01 deviates from the other two cases is for number of distribution centres. Although, this is not a significant effect, it explains why the direction of this effect could be opposite from the earlier discussed cases. By adding a transhipment centre DRC01 is able to reduce its total distance travelled from the starting point (either the distribution or transhipment centre) by 23%. For DRC01 the average distance from distribution centre to the stores decreases from 85 kilometres (in the case it uses only one DC) to 53 kilometres (in the case it uses two centres, one in Gouda and one Zwolle). For the other two cases the reduction in average distance was only 15 kilometres. Based on the expected effect of number of DCs we argue that it might be cost-efficient to use an extra transhipment centre for retailers combining many drops in a roundtrip and with stores located far away from the distribution centre. This would be interesting to examine in future research. This also applies for an extension of the number of scenarios and cases to validate the propositions based on the matrix in Figure 5.9. The results of DRC01 indicate that the drivers for the financial impacts are not limited to the line of industry of the first two cases, but also hold in a broader context. 5.6 Conclusions A retailer’s cost sensitivity to time-windows appears to be lowest in case all activities performed during the time-window period are carried out expeditiously. We can conclude that in order to be relatively insensitive to increasing time-window pressure, a retailer has to use the time-window period as efficiently as possible. The positive impacts of time-windows on social sustainability issues, such as improving liveability, city centre’s attractiveness, and shopping climate (see chapter 4), go at the expense of the environmental performance. Vehicle restrictions also have a negative environmental effect. Retailers could lower their delivery frequency to lessen the environmental burden of their transport. This is especially the case for retailers that combine many store deliveries in one roundtrip, i.e. supply stores with small drop size deliveries. Basically, most decisions that are cost-efficient for retailers are also desirable from an environmental point of view, e.g. reducing the number of kilometres is cost-efficient for retailers and also best to lower transport emissions. The impacts are determined by the retailers’ average drop size per delivery and the average load factor of the vehicle when its leaves the distribution centre. The load factor depends on the constraint that limits the length of a vehicle roundtrip, either time or capacity. The results clearly indicate that both time-windows and vehicle restrictions result in a cost increase for retailers. The magnitude of the cost increase depends on distribution characteristics of the retailers, as stated by the following propositions:
163
Retailers’ sensitivity to local sustainability policies
149
I. Time-windows have a larger cost impact on retailers that combine many deliveries in one roundtrip than on retailers combining few deliveries in one roundtrip.
II. Vehicle restrictions have a larger cost impact on retailers whose roundtrips are limited by the capacity of the vehicle (high load factor) than on retailers whose roundtrips are constrained by other than capacity constraints.
For retailers whose roundtrips are constrained by the capacity of the vehicle it is definitely wise to use large capacity trucks. On the other hand, for these retailers it is less important to use a long period to supply the stores, as the third proposition states:
III. It is more cost-efficient for retailers whose roundtrips are limited by non-capacity constraints to increase the period to supply the stores than for retailers whose roundtrips are constrained by the capacity of the vehicle.
Using a lower delivery frequency is especially cost-efficient for retailers whose roundtrips are restricted by other than capacity constraints and that combine many deliveries in one vehicle roundtrip. Time-windows and vehicle restrictions together do not (significantly) influence the retailer’s financial performance more than the policy measures individually. The geographical store dispersion and the weekly volume hardly influence the impact of time-windows and vehicle restrictions. This is also true for the interaction between the volume and the geographical store dispersion with retailer’s distribution decisions. Therefore, we argue this study’s results are also applicable for other retail chains. Obviously, the magnitude of these effects changes; extra volume as well as a more homogeneous geographical store dispersion only result in a cost increase. This study can be used by managers in discussions with local authorities in order to develop more sustainable urban freight transport and discuss policy packages which should be less restrictive in order to achieve the goals of both local authorities and retailers. This study’s results give some clear insights for local authorities as well, as it shows that different retailers might respond differently to urban transport policy measures and affect the environment differently, although in the policy measures they are treated similarly. Next, this study provides transportation and operations managers with clear insights into the organisation of urban area store distribution, in order to cope with increasingly restrictive time-window policies, vehicle restrictions, and negative transport effects. The impact of increasing time-window pressure varies for different retailers. The retailers who succeed in making very short stops, for example, by using detachable swap bodies or by reserving extra staff to help unload the vehicles, are affected less than retailers that have a long (un)loading time. Retailers that have a short travel distance between the stores and the distribution centre are affected less by time-windows than those that have to travel a long distance. These dimensions show that supplying more stores during the time-window hours, enabled by short distances, short unloading times, and larger drop sizes, reduces sensitivity to increasing time-window pressure. Furthermore, retailers that use their vehicles most during a 24-hour period in the current situation are affected worst by time-windows. However, some trade-offs have to be made: most actions a retailer can undertake to reduce

164
Chapter 5
150
time-window pressure sensitivity increase its distribution costs (or decrease the retailer’s service level). As a consequence, tighter time-windows than the governmental ones decrease time-window sensitivity, but potentially lead to an increase in transportation costs. Shortening the distance between the distribution centre and the stores can improve time-window insensitivity, but adding extra distribution centres may add costs. Locating stores outside shopping areas contradicts many retailers’ corporate strategies. Using the vehicles as efficiently as possible during a day may be cost-efficient, but it leads to an increase in time-window sensitivity. It appears to be difficult to combine insensitivity to time-window pressure and cost-efficiency.
165
151
6 Factory gate pricing opportunities due to time-window restrictions
In this chapter we examine one way for a retail chain to counter time-window effects. We look in particular at the possibilities to increase vehicle utilisation, because the research in the previous chapters indicated that this utilisation can be low due to time-window restrictions. This chapter examines the possibilities for retailers to combine the primary distribution, i.e. the deliveries from suppliers to the retailer’s distribution centre, and the secondary distribution, i.e. the deliveries from the retailer’s distribution centre to the retailer’s stores. In the introduction we motivate and position the research in this chapter and formulate the research questions. We discuss literature on factory gate pricing and backhauling. We then introduce the cases studied, the methods used and the relevant literature. After designing scenarios, we introduce a Matlab tool, called Matlog, which we use in this chapter to evaluate the performances of the different cases in the different scenarios. After presenting the results in section 6.5, we end this chapter with concluding remarks. 6.1 Introduction The results in chapter 4 show that time-window regulations lead to problems for retailers in their operational performance. Figure 4.6 clearly demonstrates that if the time-window pressure increases, retailers need more vehicles to make more vehicle roundtrips to carry out the same number of deliveries. The resulting decrease in vehicle load factor (when leaving the distribution centre) and the decrease in vehicle utilisation during the day are problems that strike especially retailers owning a vehicle fleet themselves. Their large(r) vehicle fleet, due to time-windows, is not utilised for the majority of the day, but is idle at the retailer’s distribution centre. In the current chapter we are looking for opportunities for the retailers to counter some impacts of time-window restrictions, i.e. to improve their vehicle fleet utilisation during the day and to increase their vehicle load factor. Chapters 2 and 3 show some sustainability initiatives focusing on improving these problems. Carrier cooperation is a form of horizontal cooperation, in which competing companies cooperate to increase the efficiency of their operations by bundling transport, i.e. increase the vehicle load factor and the vehicle utilisation. Auction initiatives aim at reducing the number of empty vehicle kilometres (see chapter 3). In these chapters we also showed some practical issues that arise in horizontal cooperation. In chapter 6 we are searching for (i) transport activities that are not affected by time-window regulations, since a part of the vehicle fleet is idle at the depot at the period outside the time-windows, (ii) transport activities that reduce the empty trips back to the retailer’s distribution centre, and (iii) transport activities that do not increase the retailer’s costs. We examine the possibilities for a form of vertical

166
Chapter 6
152
cooperation, between the retailer and the suppliers, so that the retailer can use the supplied cargo to fill its vehicles during the return trips after store deliveries are carried out at times city centres are affected by time-window regulations. In this chapter we specifically aim at answering the following two research questions:
1. What is the effect of backhauling on the retailer’s vehicle utilisation and efficient use of extra vehicles?
2. What is the effect of backhauling on the retailer’s (empty) kilometres? To answer these research questions we conduct an exploratory case study for two retail chains: DRC01 and DSD04 (see chapter 4 and appendix A). The unit of analysis in this chapter is no longer limited to the distribution from the retailer’s distribution centre to the retailer’s stores only, but includes backhauling activities from the retailer’s suppliers to the retailer’s distribution centre as well. 6.2 Factory gate pricing and backhauling Nowadays, the majority of retail supply chains are organised similarly; suppliers deliver to a retail distribution centre, from where retailers supply their stores. From a retailer’s point of view this organisation is quite efficient. However, the result is that the retail supply chain is separated in two autonomous parts: • The primary distribution includes all deliveries from suppliers to the retailer’s
distribution centre. • The secondary distribution includes all deliveries from a retailer’s distribution centre to
the retailer’s stores. Figure 6.1 shows how this dichotomy has evolved over the last decades (see also section 1.4).
Primarydistribution
Secondarydistribution
Supplier ConsolidationHUB
Retail store
Retaildistribution
centrePre 1970’s
Supplier controlstage
1980’sCentralisation
stage
2000’s (?)Relationship
stage
1990’sJust-in-Time
stage
Supplier orchestration
Retailer orchestration
Traditional situation
Factory Gate Pricing situation
Figure 6.1 The evolution of the retail supply chain (adapted from Aujla et al., 2003;
Fernie et al., 2000)

167
Factory gate pricing opportunities due to time-window restrictions
153
Currently, retailers are getting interested in orchestrating the entire retail supply chain, and not only the secondary distribution. Over the past two decades retailers continually managed to improve efficiency in their secondary distribution. Maintaining margins and operating costs, as well as improved technology which enables more complex flows and processes have led to an increasing interest of retailers in backhauling operations (Finegan, 2002). McKinnon and Ge (2006) mention two examples of why empty running of vehicles has decreased over time: (i) supplier collection, in which a vehicle, after making its store deliveries, is routed via a supplier to pick up goods to transport those to the retailer’s distribution centre and (ii) factory gate pricing, a concept in which the retailer is responsible for both the organisation and the cost of collecting goods from the suppliers. Factory gate pricing integrates primary distribution and secondary distribution (see Figure 6.1) which increases the potential for retailers to maximise their backhaul opportunities. The “Factory Gate Price” is the product price excluding the primary distribution costs. Although this might sound simple, for many suppliers it is quite difficult to calculate such a price (Finegan, 2002). Next to the complexity of finding the right price, many suppliers also fear that retailers will try to use this information to put even more pressure on the price of the goods. Factory gate pricing (FGP) is more than only backhauling. In addition to backhaul operations, FGP offers visibility of the transport costs in combination with efficient vehicle use by means of route planning (Finegan, 2002). This is only possible if information is shared between different supply chain players, which improves the responsiveness of the total supply chain. Potter et al. (2007) includes these elements in their definition for factory gate pricing: “the use of an ex-works price for a product plus the organisation and optimisation of transport by the purchaser to the point of delivery”. Literature shows many opportunities for retailers in case they would use FGP, next to the improved asset-utilisation (Potter et al., 2003; Van der Vlist, 2004). This also corresponds to the research objective of this chapter. First of all, the use of FGP results in a decrease in the total transport, due to a reduction in kilometres following from combining primary and secondary distribution and from economies of scale. The asymmetry in the network densities of retailers and suppliers, usually the incoming flow at a retailer is bigger than the outgoing flow at a supplier, results in more combination possibilities in the routing (Finegan, 2002; Le Blanc et al., 2006; Potter et al., 2007). Obviously, this asymmetry leads to lower transportation costs in case the retailer orchestrates the primary distribution, which is even strengthened by the fact that daily fixed vehicle-cost can be spread over more trips (Potter et al., 2007). Secondly, because the retailer orchestrates both primary and secondary distribution, the supply chain transparency increases, which can result in better transportation – inventory trade-off decisions (Finegan, 2002; Le Blanc et al., 2006; Potter et al., 2007). Next, since the retailer is responsible for the supplies to its distribution centre, FGP leads to a better control for incoming goods (Van der Vlist, 2004) and improved delivery reliability (Potter et al., 2003). Another argument for a retailer to use FGP could be that it is not paying for the transport of its competitors (Van der Vlist, 2004). Finally, the use of FGP could also have some societal positive impacts: less transport lowers the
168
Chapter 6
154
pressure of freight transport on already congested areas, and it decreases the amount of pollutant emissions (Potter et al., 2007). Backhauling also has drawbacks (McKinnon and Ge, 2006). First of all, backhauling activities may damage the quality and efficiency of the secondary distribution, e.g. a vehicle might be late because of queuing or waiting times at a supplier, which makes it difficult to schedule it for a new roundtrip on the same day. Another problem might arise due to incompatibility of vehicles and cargo; e.g. fresh goods can not be collected in a vehicle that delivered dry groceries. The fact that purchasing and logistics are often not in the same retailer’s department, makes co-ordination between primary and secondary distribution also more complex than it seems at the first sight (Aujla et al., 2003). Organisational difficulties might occur as well: excluding the transport price from the purchased goods might be difficult, both in the supplier’s ability and willingness. For example, usually clear insights in the transport costs are lacking, suppliers are making profit on the transport, or excluding transport reduces the supplier’s turnover, which has to be explained in the supplier’s balance sheet. Next, corresponding to the argument of not being willing to pay for competitors’ transport, the remaining primary transport, that is not taken care of by a retailer, could become more expensive, since the supplier’s network gets less dense and the combination possibilities reduce (Involvation, 2003; Vos et al., 2004). Le Blanc et al. (2006) find that the remaining primary transport costs comparatively increase indeed, but only slightly. Another barrier might result from long-term contracts between suppliers and logistics service providers (LSP) which makes it difficult to move parts of the transport activities from this LSP to the retailer. For suppliers with own assets, the utilisation of their assets may decrease due to factory gate pricing (Involvation, 2003). In case the retailer’s supplier base varies much over time it is quite difficult to efficiently include the pick ups at various suppliers in a roundtrip scheme. Furthermore, for suppliers there are other negative effects as well, e.g. the supplier’s internal process time-windows have to be adapted to the order-pick process (Vos et al., 2004). Many suppliers also fear that retailers will use the increased price transparency to force suppliers to decrease their product prices even more (Finegan, 2002). Finally, backhauling is quite difficult for retailers because they sometimes also collect returns and waste at the stores, which makes the available capacity for backhauling unknown and trucks are sometimes not clean (Van der Vlist, 2004). Basically, Aujla et al. (2003) discern two ways for retailers to drive the suppliers to change: either by force or by persuasion. Nowadays, retailers use both methods. To introduce FGP they use a form of force in their first announcement. Next a more collaborative style is used to induce suppliers to cooperate positively, by emphasising the positive impacts, such as meeting customers needs better, faster, and cheaper. Aujla et al. (2003) and Finegan (2002) present some promising results of actually implemented FGP initiatives from UK grocery retailers, e.g. Tesco and Sainsbury’s. Le Blanc et al. (2006) distinguish between three possible FGP savings: (i) those resulting from coordination of transportation and inventory, (ii) synchronisation in time of suppliers located close to each other, and (iii) the integration of primary and secondary distribution.

169
Factory gate pricing opportunities due to time-window restrictions
155
In this chapter we study the third possibility and include the second possibility implicitly. This contrasts to Le Blanc et al. (2006), who focus especially on the first two possible savings. We assume the delivery frequency in both primary and secondary distribution to be fixed, based on the current delivery frequency. 6.3 Case study 6.3.1 Case selection We select the cases based on the case selection criteria mentioned in chapter 4. Besides, the cases in this chapter have to answer several additional selection requirements: • A substantial part of the retailer’s suppliers is located in the Netherlands. • The geographical supplier density should be higher (from a retailer’s perspective) than
the geographical retailer (client) density (from the supplier’s perspective). • The retailer orchestrates its secondary distribution, which is affected by governmental
time-window regulations. Large retail chains usually orchestrate their secondary distribution. Involvation (2003) and Vos et al. (2004) argue factory gate pricing is especially feasible for drug store retailers, DIY-stores, furniture stores, supermarkets, and department stores in the Netherlands. FGP is not so interesting for fashion retailers, since the majority of their suppliers are not located in the Netherlands. Therefore, the interesting industry branches to select cases from are supermarkets, drug store retailers, and department store retailers, since DIY-stores and furniture stores are hardly located in city centres and are therefore not affected by time-window regulations. We select one drug store retailer and one department store retailer for the exploratory case study in this chapter. The backhaul potential might be lower for food retail chains, since full backhauling might be difficult because of hygiene; vehicles have to be clean to pick up certain fresh food products. Our unit of analysis in this chapter is an individual retailer, in contrast to a retail industry (see e.g. Le Blanc et al., 2006) and we examine, unlike previous research (see e.g. Aujla et al., 2003; Finegan, 2002; Le Blanc et al., 2006; Potter et al., 2007), other lines of business than the grocery retail. 6.3.2 Data collection The two cases that we selected for this research were already used in chapters 4 and 5, i.e. the drug store retailer DRC01 and the department store retailer DSD04 (see appendix A). DSD04 reorganised its distribution concept between the data collection (2004), which is discussed in chapter 4 and appendix A, and the data collection (late 2006) for the case study in this chapter. Besides, next to the data on the secondary distribution, used in chapter 4 and 5, we also had to collect data on the primary distribution for the case study in this chapter. We discussed the developments over the last years with DRC01 and conclude that the data as collected for the secondary distribution could be used in this case study again. So, we only collect (new) data for DRC01 on the primary distribution, in contrast to DSD04. To update DSD04’s secondary distribution data we used the same research protocol as reported in chapter 4 (see section 4.4). The main difference between the new situation and

170
Chapter 6
156
the situation described in chapter 4 is that DSD04 closed one of its four distribution centres. This does not change anything for the fashion flow from the one distribution centre located centrally in the Netherlands. The remaining products, all non-fashion goods, are stored in two distribution centres now. Basically, we collected the following data on the secondary distribution of both cases:
o One week operational data (DRC01) / two week operational data (DSD04). o All deliveries from the retail distribution centre to stores on roll container level. o Detailed information on the vehicle fleet, stores, returns, and the retail distribution
centre (see chapter 4). o The amount of returns from the stores, which limits the available vehicle capacity
for pick ups. These returns contain especially empty roll containers and clean waste; the total amount is estimated by the retailers between 3% and 10% of the store delivery. In this study we assumed a fixed return amount of 10% of the store delivery, to make sure the remaining free capacity for supplier pick ups is actually available, and not filled with returns.
For both cases we collected the following data on the primary distribution: o All deliveries from origins located in the Netherlands from suppliers to the
retailer’s distribution centre during one representative month in either volume or (vehicle) load units. This excludes all direct deliveries to stores, like small cosmetics and some fresh products, and all mail and parcel deliveries.
o Origin of all deliveries. o Product types. o Current frequency of deliveries.
Based on the collected data, Table 6.1 shows the (un)loading times we used in the vehicle routing in this chapter. Table 6.1 Loading and unloading times Activity Fixed time per stop
(in minutes) Variable time (per roll container)
(in minutes) (Un)loading at store 5 1.5 Loading at supplier 15 2 Loading at DC 30 0 Unloading at DC 30 0 6.3.3 Case description DRC01 DRC01’s characteristics are already discussed in chapter 4 and appendix A. In the current situation about 38% of all store deliveries of DRC01 are affected by time-window regulations. Figure 6.2 shows the store locations of DRC01, the supplier locations, and the distribution centre location. The almost 500 stores are supplied once a week. The 176 suppliers take care of 622 deliveries to the distribution centre in a 4-week period. Figure 6.2 shows that there are far more store locations than supplier locations for DRC01. During the studied 4-week period DRC01 makes 2060 store deliveries and receives 622 deliveries

171
Factory gate pricing opportunities due to time-window restrictions
157
from its (Dutch) suppliers. The average delivery size in the primary distribution is 13 load-units. The secondary distribution is characterised by a small delivery size of on average 7 load-units per store. On average slightly more than five stores are combined in one vehicle roundtrip.
distribution centre
supplierO
store+
Figure 6.2 DRC01’s store, DC, and supplier locations DSD04 DSD04 forms three cases in this chapter, which we define briefly in this section and discuss in more detail in the next sections. For DSD04 almost 58% of the 60 stores is affected by a time-window. Fashion goods and the remaining goods are separated completely by DSD04. DSD04’s fashion related primary and secondary distribution forms an independent case in this chapter: DSD04-F, i.e. the ‘F’ for fashion (see Figure 6.3). Two other cases are based on the data of the remaining non-fashion products of DSD04: DSD04-R1 (see Figure 6.4) and DSD04-R2 (see Figure 6.5). The ‘R’ represents the remaining (non-fashion) goods. Case DSD04-R1 follows the distribution as it is currently organised by DSD04: the stores are mainly supplied from the two regional distribution centres and the suppliers have to deliver the goods to the distribution centre where their product group is stored. We propose another case based on the same data, i.e. DSD04-R2. In this case the stores are supplied from the distribution centre that is located closest to the store and the suppliers are allowed to deliver their goods to the nearest distribution centre. In 2006 DSD04 closed one of its

172
Chapter 6
158
three distribution centres storing non-fashion products. Therefore, the situation in this chapter slightly differs from that in the previous chapters. The remaining assortment is now stored in two distribution centres, based on product groups. DSD04-F For DSD04-F some private label products are imported from other countries but the premium labels are usually supplied from stock points in the Netherlands. In that sense DSD04-F distinguishes itself from the fashion retailers discussed in the previous chapters, which mainly sell private label clothing. The distribution centre is used for storage of fashion goods (see Figure 6.3). The number of store deliveries exceeds the number of supplier pick ups just as for DRC01: i.e. DSD04-F has 60 stores that are supplied 5 times a week (300 store deliveries) and 100 suppliers, with in total 169 weekly deliveries to the fashion distribution centre. The average store delivery size is relatively small, although larger than for DRC01, i.e. 10 roll container equivalents. On average 5 stores are combined in a vehicle roundtrip. The average delivery size in the primary distribution is 5.5 load-units.
distribution centre
supplierO
store+
Figure 6.3 DSD04-F’s store, DC, and supplier locations DSD04-R1 Stores in their own districts are supplied from the two regional distribution centres that store non-fashion goods. Some stores in the southern part of the Netherlands, located too

173
Factory gate pricing opportunities due to time-window restrictions
159
far away from these two centres, are supplied from the fashion distribution centre (see Figure 6.4).
All stores, suppliers, and DCs Stores and suppliers servedfrom DC-north
Stores and suppliers servedfrom DC-west
Stores and suppliers servedfrom DC-central (fashion)
distribution centre
supplierO
store+
Figure 6.4 DSD04-R1’s store, DC, and supplier locations (per DC and total) Fashion and remaining goods are not combined in vehicle roundtrips. In this situation the suppliers have to supply directly to the right distribution centre in which their products are stored, regardless of the location of the supplier (see Figure 6.4). During the nights goods are transhipped between the distribution centres so that vehicles can start their roundtrips to the stores in their district early in the morning. DSD04-R1 has to supply 60 stores in the secondary distribution with the frequency of 5 times in two weeks. For DSD04-R1 27 stores are supplied from DC-north, 21 from DC-west and 12 from DC-central (see Figure 6.4). Next, DSD04-R1 receives 474 deliveries in DC-north from 242 suppliers and 80

174
Chapter 6
160
deliveries in DC-west from 40 suppliers every two weeks. In comparison with DSD04-F and DRC01, DSD04-R1 and DSD04-R2 are characterised by many supplier locations relative to store locations. The number of primary distribution pick ups is almost twice the number of secondary distribution store deliveries. Another difference is the drop size in the secondary distribution, which is larger than for the other cases, on average two stores are combined in one vehicle roundtrip, with an average drop size of 28 roll containers. The average pick up size in the primary distribution is 7 load-units. DSD04-Rn also supplies some other locations that are not its own stores, i.e. restaurants and some other retail stores. In total DSD04-Rn makes 498 deliveries in 2 weeks, and picks up 554 orders from its suppliers in this period.
All stores, suppliers, and DCs Stores and suppliers servedfrom DC-north
Stores and suppliers servedfrom DC-west
Stores and suppliers servedfrom DC-central (fashion)
distribution centre
supplierO
store+
Figure 6.5 DSD04-R2’s store, DC, and supplier locations (per DC and total)

175
Factory gate pricing opportunities due to time-window restrictions
161
DSD04-R2 Figure 6.5 shows the stores and suppliers per distribution centre for this proposed case (DSD04-R2). In this case the stores are supplied from and the suppliers are allowed to deliver to the closest distribution centre. During the night or early evening, at moments the vehicle fleet is idle at the depot, the products which suppliers delivered at the distribution centre are transhipped to the distribution centre where the product group is stored. Next, similar to DSD04-R1, transhipment between the three DCs takes place during the night to enable the secondary distribution roundtrips next morning. For DSD04-R2 7 stores are supplied from DC-north, 22 from DC-west and 31 from DC-central (see Figure 6.5). DSD04-R2 receives 60 deliveries from 30 suppliers in DC-north, 163 deliveries from 80 suppliers in DC-west, and 331 deliveries from 169 suppliers in DC-central every two weeks (see also Figure 6.5). Other characteristics correspond to DSD04-R1 and are discussed earlier. 6.4 Methodology In this section we describe the different scenarios and we discuss our methodology for solving the vehicle routing problems in these scenarios. 6.4.1 Scenarios We design two main scenarios per case: the base scenario and the FGP scenario. In the base scenario we calculate the current situation for each case. This implies that we estimate the travelled distance and time separately for the primary distribution and the secondary distribution. We calculate only time and distance; cost can be derived from these two performance indicators. The time-window pressure varied between (i) no time-windows and (ii) current time-window policies, based on PSD (2002b), which only apply to city centres, as defined in zip-code areas by Groothedde and Uil (2004). This distinction is similar to the Urban policy dimension time-windows in chapter 5 (see section 5.3). In section 6.4.4 we discuss how we estimate the base scenario. We compare the FGP scenario with the base scenario in order to answer the research questions. Table 6.2 shows the four scenarios we examine in this chapter for all cases. In the FGP scenario we design a vehicle routing in which primary and secondary distribution orders are combined. In section 6.4.5 we discuss how we estimate the performance of the FGP scenario. Table 6.2 Scenarios Scenario No governmental time-windows Governmental time-windows Base scenario Base no TW scenario Base TW scenario FGP scenario FGP no TW scenario FGP TW scenario In the secondary distribution the stores have a self-imposed time-window and some stores are also affected by a governmental time-window. The strictest time-window is normative for the stores, e.g. if a store is affected by a governmental time-window that starts at 6.00 a.m. and ends at 11.00 a.m., and has a self-imposed time-window between 8.00 a.m. and 17.00 p.m., the time-window for this store was set between 8.00 a.m. and 11.00 a.m. For

176
Chapter 6
162
the primary distribution, we set the time-windows based on the frequency of the supply; e.g. if a supplier supplies the retailer on a weekly basis, and this happens at the moment on Tuesday, the time-window is set in such a way, that the order has to be picked up during the week, with Tuesday as middle day in the seven day time-window. This does not optimise the frequencies, nor does it take in account the relation between transport costs and inventory. It simply sets the date so that the backhauling activity is executed at that date that a vehicle also visits a store nearby, given the current delivery frequency. 6.4.2 Vehicle routing with backhauling activities The problem that we examine in this study is a periodic vehicle routing problem (PVRP), see e.g. Baptista et al. (2002), Francis and Smilowitz (2006), and Francis et al. (2006). We design non-coinciding time-windows, for clients (stores or suppliers) that have to be visited more than once per period. For example, if there are pick ups every week at a supplier, this implies for the retailer it has 4 separate orders with a time-window of 1 week in our 4-week dataset, so that the first time-window is week 1, the second is week 2, etc. This implies that during the construction of vehicle routes savings can be made by synchronising pick ups of close by suppliers over time. However, the current delivery frequencies are respected. There exists a vast amount of literature that examines the type of vehicle routing problems we face in this study; VRPTW (vehicle routing problem with time-windows) see e.g. Cordeau et al. (2002) and VRPPD (vehicle routing problem with pick up and delivery) see e.g. Desaulniers et al. (2002). The problem we face in this chapter can be described as VRPPD with time windows (VRPPDTW), which is basically an extension of the VRPTW (Desaulniers et al., 2002). In VRPPD it is necessary to take into account that the goods from the suppliers must fit into the delivering vehicle. This restriction makes the planning problem more difficult. In our study, all store deliveries start from one depot and all pick ups from suppliers have to be returned to the same depot, so there are no direct interchanges of goods between the stores and the suppliers. The main objective is to minimise the total time used, with the restriction that the vehicle must have sufficient capacity for transporting the goods to be delivered to the stores and those to be picked up at suppliers. We assume that practical limitations, for example many vehicles are rear-loaded, and rearrangement of the loads during the roundtrips is not deemed economical or feasible, are not a problem in this study. The majority of the pick ups takes place at the end of the roundtrip, at the period stores are affected by time-window restrictions, which implies sufficient capacity is available. In our study pick ups are allowed at any time during the vehicle roundtrip, as long as sufficient capacity is available. 6.4.3 Matlog: the Dutch network and VRP solving procedures The estimate of the secondary distribution is comparable with the retailer’s performance estimates in chapters 4 and 5. However, we use Matlog to solve the vehicle routing problem with time-windows. Matlog is a logistics engineering Matlab toolbox, developed by Kay (2006) and free for download. This toolbox contains a function for solving the vehicle routing problem with time-windows and allows us to include pick ups at suppliers in the design of the vehicle routing plan. Matlog includes data of U.S. cities, the U.S. highway
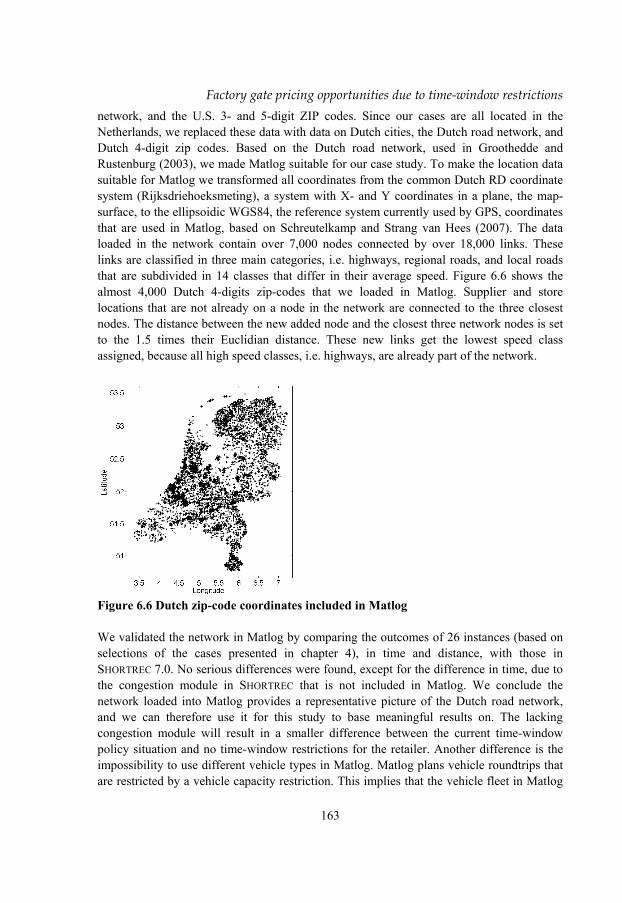
177
Factory gate pricing opportunities due to time-window restrictions
163
network, and the U.S. 3- and 5-digit ZIP codes. Since our cases are all located in the Netherlands, we replaced these data with data on Dutch cities, the Dutch road network, and Dutch 4-digit zip codes. Based on the Dutch road network, used in Groothedde and Rustenburg (2003), we made Matlog suitable for our case study. To make the location data suitable for Matlog we transformed all coordinates from the common Dutch RD coordinate system (Rijksdriehoeksmeting), a system with X- and Y coordinates in a plane, the map-surface, to the ellipsoidic WGS84, the reference system currently used by GPS, coordinates that are used in Matlog, based on Schreutelkamp and Strang van Hees (2007). The data loaded in the network contain over 7,000 nodes connected by over 18,000 links. These links are classified in three main categories, i.e. highways, regional roads, and local roads that are subdivided in 14 classes that differ in their average speed. Figure 6.6 shows the almost 4,000 Dutch 4-digits zip-codes that we loaded in Matlog. Supplier and store locations that are not already on a node in the network are connected to the three closest nodes. The distance between the new added node and the closest three network nodes is set to the 1.5 times their Euclidian distance. These new links get the lowest speed class assigned, because all high speed classes, i.e. highways, are already part of the network.
Figure 6.6 Dutch zip-code coordinates included in Matlog We validated the network in Matlog by comparing the outcomes of 26 instances (based on selections of the cases presented in chapter 4), in time and distance, with those in SHORTREC 7.0. No serious differences were found, except for the difference in time, due to the congestion module in SHORTREC that is not included in Matlog. We conclude the network loaded into Matlog provides a representative picture of the Dutch road network, and we can therefore use it for this study to base meaningful results on. The lacking congestion module will result in a smaller difference between the current time-window policy situation and no time-window restrictions for the retailer. Another difference is the impossibility to use different vehicle types in Matlog. Matlog plans vehicle roundtrips that are restricted by a vehicle capacity restriction. This implies that the vehicle fleet in Matlog
178
Chapter 6
164
is homogeneous. We therefore simplified the operations of the retailers so that they use only the most common vehicle type of their vehicle fleet (see Table 4.4). This implies for both cases that the smaller vehicle types are not used in the vehicle routing planning, so the vehicle routing plans differ from those in chapters 4 and 5 created by SHORTREC in the sense that less kilometres and time are needed to supply all stores. Another important difference is that Matlog plans only roundtrips, whereas SHORTREC also plans the vehicles that perform the roundtrips. For long roundtrips, e.g. more than 6 hours, there is no real difference, in contrast to the shorter roundtrips, affected by time-windows. For example, in a situation with four orders that all fill half a vehicle, SHORTREC and Matlog both plan two roundtrips. However, if two orders are affected by a time-window, SHORTREC probably plans these two orders in the first roundtrip of one vehicle, even if this means more vehicle kilometres, and plans the other two orders in a second roundtrip of that vehicle. In Matlog, there is no difference between the situations, since it does not plan vehicles; it plans the two most kilometre-efficient roundtrips. In the execution of Matlog’s vehicle routing plans this would result in the use of two vehicles but a lower number of kilometres. In contrast to Matlog, we first minimised necessary number of vehicles in SHORTREC. Insertion heuristic We used Clarke and Wright’s savings algorithm (see Clarke and Wright, 1964), to find an initial solution for the VRP. The procedure for the insertion algorithm (Savings) is as follows (Bodin et al., 1983; Laporte and Semet, 2002): Step 0 Set the depot node to node 0. Step 1 Compute savings sij = ci0 + c0j - cij for i, j = 1, 2, … , n , i ≠ j, for n orders, and for
costs cij, which denotes the time necessary to travel from i to j (in this chapter the costs are expressed in time).
Step 2 Rank the savings sij and order them from largest to smallest. Step 3 Start with the largest saving sij from the savings list; include (i , j) in a route (as
long as no constraints are violated) if: • neither i nor j has already been assigned to a route. A new route is then
initiated including i and j. • or, exactly one of the two nodes (so either i or j) has already been included in a
route, but this one node is not interior in this route (which implies that the node is either the first node in the route after the depot or last one before the depot), then the link (i , j) is included in that route.
• or, both of the two nodes (so i and j) have already been included in two different existing routes and i nor j is interior in the routes, then the two routes are merged.
Step 4 As long as the savings list is not empty, return to step 3 and use the next largest saving sij of the list. If all savings have been considered, i.e. the savings list is exhausted, stop. If a node i is not assigned to a route at this moment, a route (0, i ,0) is created, which implies that this route starts at the depot, then visits the unassigned node, and returns to the depot again.
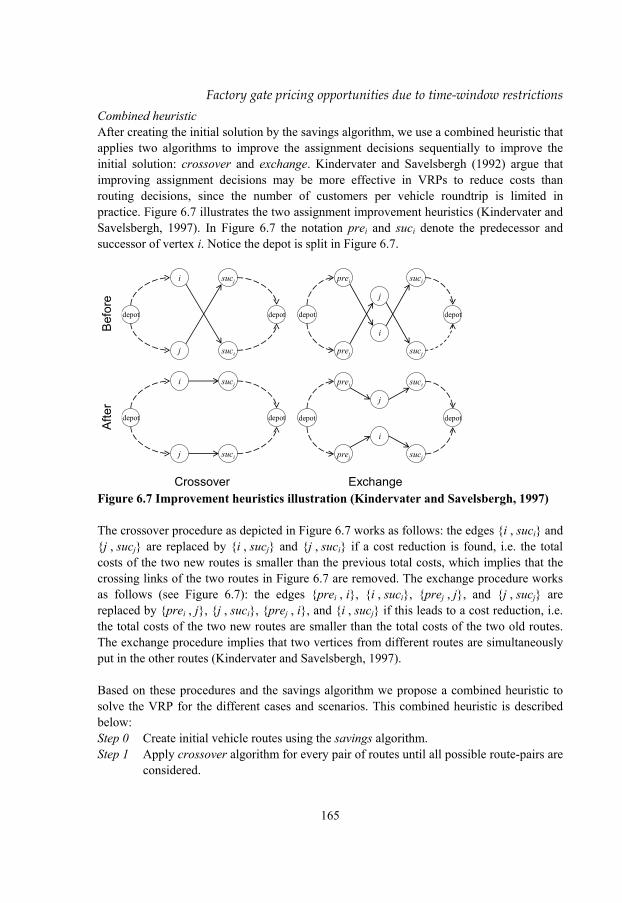
179
Factory gate pricing opportunities due to time-window restrictions
165
Combined heuristic After creating the initial solution by the savings algorithm, we use a combined heuristic that applies two algorithms to improve the assignment decisions sequentially to improve the initial solution: crossover and exchange. Kindervater and Savelsbergh (1992) argue that improving assignment decisions may be more effective in VRPs to reduce costs than routing decisions, since the number of customers per vehicle roundtrip is limited in practice. Figure 6.7 illustrates the two assignment improvement heuristics (Kindervater and Savelsbergh, 1997). In Figure 6.7 the notation prei and suci denote the predecessor and successor of vertex i. Notice the depot is split in Figure 6.7.
depot
prei
prej
suci
sucj
depot
j
i
depot
prei
prej
suci
sucj
depot
j
i
Exchange
depot
sucj
suci
depot
i
j
Crossover
depot
sucj
suci
depot
i
j
Bef
ore
Afte
r
Figure 6.7 Improvement heuristics illustration (Kindervater and Savelsbergh, 1997) The crossover procedure as depicted in Figure 6.7 works as follows: the edges {i , suci} and {j , sucj} are replaced by {i , sucj} and {j , suci} if a cost reduction is found, i.e. the total costs of the two new routes is smaller than the previous total costs, which implies that the crossing links of the two routes in Figure 6.7 are removed. The exchange procedure works as follows (see Figure 6.7): the edges {prei , i}, {i , suci}, {prej , j}, and {j , sucj} are replaced by {prei , j}, {j , suci}, {prej , i}, and {i , sucj} if this leads to a cost reduction, i.e. the total costs of the two new routes are smaller than the total costs of the two old routes. The exchange procedure implies that two vertices from different routes are simultaneously put in the other routes (Kindervater and Savelsbergh, 1997). Based on these procedures and the savings algorithm we propose a combined heuristic to solve the VRP for the different cases and scenarios. This combined heuristic is described below: Step 0 Create initial vehicle routes using the savings algorithm. Step 1 Apply crossover algorithm for every pair of routes until all possible route-pairs are
considered.

180
Chapter 6
166
Step 2 Apply exchange algorithm for every pair of routes until all possible route-pairs are considered.
STOP This combined heuristic calls upon another procedure to check feasibility every time an improvement is made. This procedure, ‘rteTC’, is a Matlog m-script that calculates the total costs (objective-function) of a route and checks the route’s feasibility. Our objective function was to minimise the total time used for the roundtrips. The ‘rteTC’ procedure checks feasibility for each route for the three following constraints: Constraint 1: Capacity – All pick up orders, delivery orders, store returns, and the vehicle
capacity are, in consultation with the retailers, converted to roll container equivalents. Basically, this capacity constraint is a combination of three constraints. A route is feasible if and only if it satisfies (i) delivery feasibility, which means that the total number of roll containers delivered to stores must not violate the vehicle capacity C, (ii) pick up feasibility, which means that the vehicle has enough capacity to pick up goods during the route, and (iii) the load feasibility examines whether the vehicle capacity is exceeded at any point at the route. First we define d as the vector of store deliveries and p as the vector of all pick ups, including both the returns at the stores and the pick ups at the supplier. O = {o0 , o1 , …, on} is the complete set of client order locations for each order individually including both pick up and store delivery orders, in which o0 is the depot.
Sub (i) delivery feasibility – given a route Rte = {o0 , o1 , … , o0}, the total number of roll containers delivered to all stores visited during the route between the depot o0 and the current node ok is ∑
∈
=),( 0
)(ki ooRoikd doC , in which R (o0 , ok) denotes the order
locations on the route from the depot o0 to (and including) order location ok. The delivery feasibility is expressed as follows: Cd ≤ C. Sub (ii) pick up feasibility – given a route Rte = {o0 , o1 , … , o0}, the total number of roll containers picked up at stores (returns) and at suppliers visited during the route between the depot o0 and the current node ok is ∑
∈
=),( 0
)(ki ooRo
ikp poC , in which
R (o0 , ok) denotes the order locations on the route from the depot o0 to (and including) order location ok. The delivery feasibility is expressed as follows: Cp ≤ C. Sub (iii) load feasibility – let L(ok) be the load factor of a vehicle leaving location ok and L(o0) the initial load of the vehicle when it leaves the depot to start with the route. The vehicle’s load at any point ok of the roundtrip L(ok) is expressed as follows: )()()()( 0 kdkpk oCoLoCoL −+= . The capacity constraint now implies that
a route is feasible if and only if L(ok) ≤ C at any point ok in the route. Constraint 2: Time-windows – Time-window feasibility; a route is infeasible if a delivery,
pick up, start from or return to the depot is outside the time-window. For each route a forward scan determines the earliest finish time, then a reverse scan determines the latest start time given the earliest finish, and finally, if a route consists of more than one

181
Factory gate pricing opportunities due to time-window restrictions
167
customer, a second forward scan is executed to delay unavoidable waits due to different time-windows as much as possible to the end of the route in case unexpected events occur during the actual execution of the route.
Constraint 3: Maximum vehicle roundtrip time – Time infeasibility; the maximum length for a route was set to 11 hours. In case a roundtrip, including loading and unloading at the retailer’s depot, takes more time, it is infeasible.
This way of checking feasibility goes at the expense of the calculation time, which is quite high for solving the large VRP-problems. All improvements are checked for feasibility, during the construction procedure as well as during the improvement procedures, which implies that a route is never infeasible. This adds to the already long computation times of the vehicle routings for the different scenarios, see Table 6.3. The planning horizon is the minimum period before a similar planning recurs, e.g. this is most for the FGP scenario of DRC01 4 weeks, and least for the base scenario of DSD04-F 1 day. The computation times in Table 6.3 come from a Pentium IV 2.4 GHz computer the Windows XP operating system, in Matlab version 7.3.0.267 (R2006b). The calculation time mainly depends on the number of orders to plan, the total number of orders planned per roundtrip, and the planning horizon. Table 6.3 Computation time (Matlog)
scenario Base TW scenario FGP TW scenario case
seconds planned orders-roundtrips
planned period (days)
seconds planned orders-roundtrips
planned period (days)
DRC01 10391 515-86 7 >99999 2682-378 24 DSD04-F 299 78-17 1 39191 560-91 7 DSD04-R1-DC-north 14 43-22 2 40518 689-152 14 DSD04-R1-DC-west 25 54-42 2 1832 350-210 14 DSD04-R1-DC-central 4 22-18 2 78 110-88 14 DSD04-R2-DC- north 3 14-7 2 748 130-40 14 DSD04-R2-DC-west 13 43-29 2 11127 378-145 14 DSD04-R2-DC-central 26 62-42 2 45669 641-211 14 The duration of a roundtrip from Matlog includes the driving time, the unloading time at stores, and the loading time at suppliers and the unloading and loading time between different roundtrips at the retailer’s distribution centre (see Table 6.1). We use Excel’s solver to calculate the daily number of vehicles that are necessary to carry out the roundtrips planned by Matlog (because Matlog only plans routes), with the following constraints:
• The maximum time per day to use a vehicle is at most 11 hours. • In case a roundtrip is affected by a governmental time-window another roundtrip
can only be planned in this vehicle if the other roundtrip is not affected by a time-window or if the sum of these affected roundtrip lengths combined in a vehicle is less than 6 hours.

182
Chapter 6
168
6.4.4 Estimation of primary distribution in base scenario In the base scenario we separately estimate the performance of the primary and secondary distribution. The retailer’s secondary distribution is calculated with Matlog. The results are verified with the secondary distribution as was calculated by SHORTREC (see chapter 4). In the base scenario the suppliers are responsible for the primary distribution. Currently, suppliers can combine different deliveries in one roundtrip. Because of the large number of suppliers it was unfeasible in this study to collect the exact number of kilometres travelled for all supplier deliveries. We therefore estimate the number of kilometres travelled in the primary distribution in the base scenario with three regression models:
A. Direct deliveries from supplier to distribution centre. This is the most negative scenario, which can be considered to give an upper bound on the real number of kilometres.
B. Educated guess. This scenario is based on the detailed information of a small sample of suppliers, for which the supply is either a direct delivery (model A) or a consolidation delivery (model C).
C. Full consolidation of suppliers by their logistics service providers. The most positive scenario, which can be considered to give a lower bound on the real number of kilometres.
In these models we used the following explanatory variables: the volume transported (from supplier to the retailer’s DC) (VOL), the supplier density (DENS), and the distance between supplier and the distribution centre (DIST). VOL is measured by the total volume per order in load-units. DENS is measured by the average distance between the supplier and the 10 closest suppliers delivering goods to the same retailer’s distribution centre. DIST is the distance between the supplier’s location, i.e. the location from where the goods are sent to the retailer’s DC, and the retailer’s distribution centre. The values for the three independent variables follow from the data collection (see section 6.3.2) for each order. We selected a sample of suppliers from which we collect extra data to estimate the independent variable for model B and C, i.e. the number of kilometres travelled (KM). Based on this sample we then estimate the model parameters for the regression models. The extra data that we collected contains information on:
(i) The carriers that perform the actual transport operations between the supplier and the retailer’s distribution centre, e.g. either a private carrier or for-hire carrier.
(ii) The carrier’s location(s), in case a logistics service provider (LSP) was responsible for the transport.
(iii) The pick up and delivery operations, e.g. the number of clients that are combined in the delivery-trip to the retailer’s distribution centre and in the collection-trip from the supplier, and the consolidation activities.
First, we collected in consultation with the retailers a sample containing 123 suppliers from DRC01’s suppliers and 94 of DSD04’s suppliers. We collected information on the carrier and its locations (see i and ii) from these suppliers, based on information from the retailer, the Internet, and by contacting the suppliers by telephone. This sample contains 70% of
183
Factory gate pricing opportunities due to time-window restrictions
169
DRC01’s suppliers and 25% of DSD04’s. Of DRC01’s 123 suppliers only 6 organised their own transport, and 40 different LSPs organised the transport operations for the remaining suppliers. The largest LSP is responsible for the transport of 21% of DSC01’s suppliers and 18% of DSD04’s suppliers. Next, we reduced our sample, due to time feasibility reasons, in consultation with DRC01 to estimate the third point, the pick up and delivery operations. We contacted 20 suppliers, from which the contact information was provided by DRC01, by telephone to learn more on their transport organisation between the supplier location and the retailer’s distribution centre. This limited sample contains 5 suppliers from largest 25% suppliers (measured in volume), 5 from the next 25%, etc. In case a LSP was responsible for the operations we contacted the LSP, based on contact information of the supplier. Based on this information, including among other things the vehicle load factor and the number of orders combined in one vehicle roundtrip, we distinguish three different types of deliveries:
1. A direct trip from the supplier to the retailer’s distribution centre. 2. A separated collection trip and delivery trip with usually consolidation in the
LSP’s distribution centre. 3. A separated collection trip and delivery trip with transhipment between different
LSP’s distribution centres. Now, we estimate model A - direct deliveries - based on the complete set of supplier orders. The total number of kilometres equals two times the distance between the supplier and the retailer’s distribution centre, i.e. the trip to the distribution centre and the return trip. Obviously, DIST is the only variable in this model. The distance travelled for supplier-order i in model A follows from KMi = 2 DISTi. So, the total distance travelled in model A to deliver all N orders to the retailer’s distribution centre is estimated by:
∑=
=N
iiModelA DISTKM
12 .
Since all distances between the suppliers and the DC are known, the adjusted R2 of model A equals 1.0. For model C - full consolidation - we estimated the total distance travelled based on the large sample. Based on the three different types of deliveries and the information of the small sample on how roundtrips are organised, we estimated the number of kilometres in this model as follows: in the second and third type, the orders are combined with other orders in an artificial roundtrip with a vehicle load factor of one. The number of kilometres in the artificial roundtrip is estimated by multiplying the average distance of the five nearest located suppliers with a random number (between 1 and 5) of artificial orders to fill the vehicle plus two times the distance between the supplier location and the LSP’s distribution centre. The total number of kilometres in a roundtrip is divided per order based on volume percentage. This explains why VOL plays an important role in model B and C. The direct deliveries are estimated similar to a pick up roundtrip. The transhipment in the third type is carried out with FTL amounts. In this model we assumed that the volume of the order
184
Chapter 6
170
determines the number of kilometres from roundtrip that are on the account of that order. The total distance travelled in model C to deliver all N orders to the retailer’s distribution centre is estimated by:
i
N
iiiModelC VOLDENSDISTKM 4.59.07.01.12
1+++−= ∑
=
.
The adjusted R2 of model C is 0.499. Finally, for model B - educated guess - we estimate the vehicle load factor and the number of orders combined in one roundtrip for the limited sample based on the suppliers’ information. However, since the load factor and number of combined customers varies per roundtrip this supplier information also only contains a rough estimate. For this sample we know whether an order would be supplied directly from a supplier to the retailer (e.g. own transport, or almost FTL deliveries), via one LSP distribution centre, or via more than one LSP distribution centre. Next, we estimate the roundtrips similar to model C based on these guesses. The total distance travelled in model B to deliver all N orders to the retailer’s distribution centre is estimated by:
i
N
iiiModelB VOLDENSDISTKM 4.41.19.02.7
1+++−=∑
=
.
The adjusted R2 of model C is 0.662. 6.4.5 FGP scenario: secondary distribution and backhauling included In the FGP scenario all orders from suppliers and stores are planned in vehicle roundtrips with Matlog (see section 6.4.3). Based on the vehicle roundtrips we can find the total distance travelled and the total time needed. Next, we determine the number of vehicles necessary to perform all roundtrips per day, similar to the secondary distribution in the base scenario. It is possible that complete pick up roundtrips are planned, in which no store delivery is made. In case a pick up order exceeds the vehicle capacity, we split up this order in two smaller orders, so that the size of the pick up order would not lead to infeasibility of the planning. 6.5 Results We present the results in two sections. In section 6.5.1 we discuss the differences between the base scenario and the FGP scenario. The next section discusses the difference between the scenarios in which there are no governmental time-windows and those in which there are time-windows. 6.5.1 Results of combining primary and secondary distribution Figure 6.8 through Figure 6.11 show the total number of kilometres travelled in one week for all cases for both the primary and secondary distribution and the retailer’s total time needed for the transport under their responsibility.

185
Factory gate pricing opportunities due to time-window restrictions
171
Results DRC01 Figure 6.8 shows the results of the four scenarios for DRC01. DRC01 hardly travels more kilometres if it combines the primary and secondary distribution. The total time needed, including travel time, unloading time at the stores and the distribution centre, as well as the loading time at the suppliers and the distribution centre increases more than the distance. This is mainly due to extra loading times at suppliers and the extra unloading times at the retailer’s distribution centre. This leads to an increase in costs for the retailer. The retailer should find a ‘factory gate price’ that compensates for this cost increase. Besides, the price should provide an extra cost-incentive for the retailer to change its distribution structure. For this retailer the number of pick ups is about one third of the total number of deliveries. Apparently, this ratio and the relatively limited volume per pick up make it rather easy to include the pick ups at suppliers into the store delivery roundtrips. DRC01 already visits the entire country for its secondary distribution. This results in the limited increase in kilometres travelled in the FGP scenario in comparison to the base scenario: DRC01 does not have to make any serious detours to pick up goods at the suppliers (see also Figure 6.2). The enormous decrease in the total number of kilometres from the base scenario to the FGP scenario, between 38% and 50% depending on the primary distribution model, implies a huge reduction in pollutant emissions. The relatively limited time-window pressure results in only slight differences between the TW and no TW scenarios for both time (2% increase in total time needed in time-window scenario) and kilometres needed (3% increase in total number of kilometres travelled). In section 6.5.2 we show that time-window regulations do have a considerable impact on the number of extra vehicles needed and the vehicle utilisation during the day.
0
10
20
30
40
50
60
DRC01 - BasenoTW
DRC01 - BaseTW
DRC01 - FGPnoTW
DRC01 - FGPTW
Case and scenario
Tota
l dis
tanc
e tr
avel
led
(in 1
000
kilo
met
res)
in o
ne w
eek
Primary distribution- model A
Primary distribution- model B
Primary distribution- model C
Combined primaryand secondarydistribution
Secondarydistribution
0
2
4
6
8
DRC01 - BasenoTW
DRC01 - BaseTW
DRC01 - FGPnoTW
DRC01 - FGPTW
Case and scenario
Ret
aile
r's to
tal t
ime
(in 1
00 h
ours
) in
one
wee
k
Figure 6.8 Results DRC01 (one week) Results DSD04-F DSD04-F shows similar results as DRC01 (see Figure 6.9). This could be expected, since the characteristics of these two cases correspond, i.e. the number of store deliveries dominates the number of pick ups, for every delivery 0.56 pick up has to be made, and the retailer already supplies stores all over the country from one distribution centre. This retailer also has stores all over the country, so it only makes relatively small detours to include supplier pick ups in its roundtrip planning (see Figure 6.3).

186
Chapter 6
172
DSD04-F faces only an increase of 7% in its number of kilometres travelled after including the primary distribution in its secondary distribution under the current time-window regulation. The total number of kilometres travelled decreases between 35% and 53%, depending on the primary distribution model and the scenarios. So, including backhauling activities in the retailer’s store deliveries definitely results in a more sustainable transport organisation. However, since the number of kilometres and time increases for the retailer, and as a result the costs, this has to be compensated by a lower factory gate price for the goods bought from the suppliers. Figure 6.9 shows that the time and distance effects of time-windows are larger for this retailer, which results from a higher time-window pressure.
0
10
20
30
40
50
DSD04-F -Base noTW
DSD04-F -Base TW
DSD04-F -FGP noTW
DSD04-F -FGP TW
Case and scenario
Tota
l dis
tanc
e tr
avel
led
(in 1
000
kilo
met
res)
in o
ne w
eek
Primary distribution- model A
Primary distribution- model B
Primary distribution- model C
Combined primaryand secondarydistribution
Secondarydistribution
0
2
4
6
8
DSD04-F -Base noTW
DSD04-F -Base TW
DSD04-F -FGP noTW
DSD04-F -FGP TW
Case and scenario
Ret
aile
r's to
tal
time
(in 1
00 h
ours
) in
one
wee
k
Figure 6.9 Results DSD04-F (one week) Results DSD04-R1 and DSD04-R2 Cases DSD04-R1 and DSD04-R2 differ from the two cases discussed earlier. For every delivery this retailer makes, it has to pick up 1.11 orders at a supplier. This can be explained by the far larger store delivery size in comparison to the average pick up size at the supplier, i.e. 28 roll containers and 7 roll containers respectively. In contrast to the earlier discussed cases, in the factory gate pricing scenario of DSD04-Rn some roundtrips are planned that consist of pick ups at suppliers only. The different pick up and delivery ratio partly explains the large increase in kilometres travelled for DSD04-R1 (see Figure 6.10). The suppliers are not always located close to the store locations (see Figure 6.4). DSD04-R1 supplies stores in the neighbourhood of DC-north from this distribution centre, but goods from all over the country are picked up by vehicles travelling from this distribution centre. The detours from DC-north and DC-west to pick up goods at the suppliers are also responsible for the increase of 30% between the base and FGP scenarios for DSD04-R1 in the number of kilometres the retailer travels. Although time-window pressure is high for this case, the impact is, as for kilometres and time, limited. This can be explained by the relatively large drop size of the deliveries and the resulting small number of combined drops in a vehicle roundtrip in the secondary distribution. There is an effect on the vehicle

187
Factory gate pricing opportunities due to time-window restrictions
173
utilisation during the day and the number of vehicles used, which we discuss in section 6.5.2. The shift in responsibility for the primary distribution from the suppliers to the retailer results in a decrease in the total number of travelled kilometres, between 19% and 45%, depending on the primary distribution model.
0
20
40
60
80
100
DSD04-R1 -Base noTW
DSD04-R1 -Base TW
DSD04-R1 -FGP noTW
DSD04-R1 -FGP TW
Case and scenario
Tota
l dis
tanc
e tr
avel
led
(in 1
000
kilo
met
res)
in o
ne w
eek
Primary distribution- model A
Primary distribution- model B
Primary distribution- model C
Combined primaryand secondarydistribution
Secondarydistribution
0
5
10
15
DSD04-R1 -Base noTW
DSD04-R1 -Base TW
DSD04-R1 -FGP noTW
DSD04-R1 -FGP TW
Case and scenario
Ret
aile
r's to
tal t
ime
(in 1
00 h
ours
) in
one
wee
k
Figure 6.10 Results DSD04-R1 (one week) Finally, Figure 6.11 shows the results for DSD04-R2. This graph also shows the kilometres and time used for transhipment between the three distribution centres. The increase in kilometres for the retailer from the base scenarios to the FGP scenarios is limited: only 3 to 4%. Overall, this shift from the base scenario to the FGP scenario decreases the total number of kilometres travelled, between 30% and 39%. In this case DSD04-R2 does not have to make the detours to visit its suppliers during store deliveries (see Figure 6.5). The pick up-delivery ratio is quite high which results in some roundtrips in which only pick ups are made. However, the number of these roundtrips is lower in this case than for DSD04-R1. Since the retailer is responsible for the transhipment between the distribution centres in all scenarios, and the number of goods to be transhipped is similar in all scenarios, this value is constant for the four scenarios presented in Figure 6.11.
0
5
10
15
DSD04-R2 -Base noTW
DSD04-R2 -Base TW
DSD04-R2 -FGP noTW
DSD04-R2 -FGP TW
Case and scenario
Ret
aile
r's to
tal t
ime
(in 1
00 h
ours
) in
one
wee
k
0
20
40
60
80
100
DSD04-R2 -Base noTW
DSD04-R2 -Base TW
DSD04-R2 -FGP noTW
DSD04-R2 -FGP TW
Case and scenario
Tota
l dis
tanc
e tr
avel
led
(in 1
000
kilo
met
res)
in o
ne w
eek
Primary distribution- model A
Primary distribution- model B
Primary distribution- model C
Transhipmentbetween DCs
Combined primaryand secondarydistribution
Secondarydistribution
Figure 6.11 Results DSD04-R2 (one week)

188
Chapter 6
174
The shift in responsibility for the primary distribution does not only lead to a decrease in travelled kilometres, Figure 6.12 shows that this shift provides also an incentive for DSD04 to change its distribution network structure. Figure 6.12 shows the differences between DSD04-R1 and DSD04-R2 for the situation in which the current time-window policies are effective. DSD04 proposes the DSD04-R1 structure, which is best from its own perspective in the current situation. After all, since DSD04 is only responsible for its secondary distribution, this structure leads to the lowest number of kilometres. Although not presented in a graph in this chapter, we see a similar result for the time. This implies that in the current situation the chosen structure leads to the lowest costs for DSD04-R for distributing its non-fashion goods.
0
20
40
60
80
100
DSD04-R1 - Base TW DSD04-R2 - Base TW
Case and scenario
Tota
l dis
tanc
e tr
avel
led
(in 1
000
kilo
met
res)
in o
ne w
eek
Primary distribution- model A
Primary distribution- model B
Primary distribution- model C
Transhipmentbetween DCs
Combined primaryand secondarydistribution
Secondarydistribution
0
20
40
60
80
100
DSD04-R1 - FGP TW DSD04-R2 - FGP TW
Case and scenario
Tota
l dis
tanc
e tr
avel
led
(in 1
000
kilo
met
res)
in o
ne w
eek
Figure 6.12 Differences in kilometres travelled due to network improvement for
DSD04-R (one week) However, to minimise total travel distance, it would be better if DSD04 would allow goods to be delivered to the distribution centre located closest to the supplier location (see Figure 6.12). For suppliers this would reduce costs, and for society it leads to fewer kilometres and therefore fewer pollutant emissions. The transhipments between the distribution centres are transferred to off-peak hours, i.e. the night, during which there is no congestion. However, since it increases retailer’s costs, we conclude that there is currently no real incentive for the retailer to use the distribution structure that is best for society. In case the retailer is responsible for both primary and secondary transport, it has a clear objective to use the DSD04-R2 structure, though. This would decrease both the time necessary and distance travelled, and therefore the costs for the retailer. Figure 6.12 also shows clearly a win-win situation: making the retailer responsible for the primary distribution could reduce costs for the suppliers and the retailer as well as the burden for society. 6.5.2 Time-window regulations in the secondary distribution In this section we analyse the change in vehicle utilisation and number of vehicles used. Figure 6.13 shows the change in number of vehicles used in the different scenarios, compared to base scenarios, in which the retailer is only responsible for the secondary distribution. The number of vehicles increases due to time-windows. This implies that the

189
Factory gate pricing opportunities due to time-window restrictions
175
number of vehicles used by the retailer increases from the base no TW scenario to the base TW scenario. Since the retailer already faces this increase, it needs fewer extra vehicles to include the primary distribution in its secondary distribution in the TW situation, as compared to the no TW situation.
0%
5%
10%
15%
20%
25%
30%
35%
DRC01 DSD04-F DSD04-R1 DSD04-R2
Perc
enta
ge in
crea
se in
veh
icle
s increase innumber ofvehicles usedfrom Base noTWto FGP noTW
increase innumber ofvehicles usedfrom BaseTW toFGP TW
Figure 6.13 Increase in number of vehicles after including primary distribution in
secondary distribution The retailer faces a serious decrease in its vehicle utilisation during the day due to time-window regulations. Given the fact that these regulations exist, Figure 6.14 shows that the retailer could be able to reach a similar level in its vehicle utilisation by including the primary distribution activities in its secondary distribution.
0,2
0,3
0,4
0,5
0,6
0,7
0,8
Base noTW Base TW FGP TW
Vehi
cle
utili
satio
n(d
urin
g 24
-hou
r per
iod) DRC01
DSD04-F
DSD04-R1
DSD04-R2
Figure 6.14 Vehicle utilisation during 24-hour period 6.5.3 Limitations of this study In section 6.4.3 we already discussed the two main causes for the smaller effects of time-windows in comparison to chapters 4 and 5. There are no congestion related delays during the time-window period and Matlog does not plan vehicles, but roundtrips. The use of

190
Chapter 6
176
Matlog has led to some simplifications of reality. First of all, the package assumes an unlimited homogeneous vehicle fleet. And secondly, location-specific vehicle restrictions are not taken in account. These limitations could be dealt with by considerably modifying and extending the VRP functions in Matlog. Literature shows how we could include these extensions. First, a limited (or fixed) number of vehicles in a heterogeneous fleet, called heterogeneous fixed fleet VRP (HFFVRP), can be solved by a heuristic proposed by Tarantilis et al. (2004). Second the TDVRP (time dependent VRP) deals with travel times between locations that depend on the time of the day, see for example Malandraki and Daskin (1992). The third limitation could be solved by extending the VRP to a site-dependent vehicle routing problem (SDVRP), see Cordeau and Laporte (2001). Including one or more of these elements will lead to an increase in the already long computation times. Our simplifications have led to a slight underestimation of time and kilometres necessary. This is similar for all scenarios. However, if the time-window pressure is higher, this underestimation is larger (see also results in chapters 4 and 5). If we consider the number of time-window affected order locations as an indication for the time-window pressure, the underestimation of the kilometres and time in the base TW scenario is highest, followed by that in the FGP TW scenario. This implies, for example, that a comparison between the base no TW scenario and the base TW scenario shows a time-window effect that underestimates the real effects. However, since this chapter does not focus on the effects of time-windows, but on the FGP opportunities and the impacts on vehicle utilisation, this underestimation does not seriously influence the results. The increase in kilometres travelled by a retailer in a time-window situation if the retailer uses FGP, in comparison to the base scenario, is a slight underestimation. Therefore, the simplifications might have led to a rather cautious estimate of the FGP opportunities. The estimation of the primary distribution in the current situation with the three regression models provides only an indication of the actual number of kilometres. A more extensive sample including more (or all) suppliers and the actual trips necessary to make the deliveries would increase the accuracy of this estimation. An improvement of the accuracy of the estimates for the current primary distribution would enable us to find the impact of factory gate pricing on the environmental pollutant emissions and the congestion levels. On top of these limitations, some general barriers exist for implementing FGP. In this chapter we assume that practical FGP barriers, such as determining the factory gate price and pick up possibilities at suppliers, are no problem. Next, we assume full availability of the pick ups at the suppliers. However, currently some suppliers have difficulties in delivering the complete order on time. The case DSD04-R2 is based on actual data, but an artificial case nonetheless. In this study we did not include potential physical barriers for DSD04-R2, e.g. the space available in DSD04’s current distribution centres. In DSD04-R2 suppliers deliver many non-fashion goods to the fashion distribution centre, centrally located in the Netherlands. However, we did not take practical limitations in account, such as the available space in this distribution centre, the number of dock-doors, etc.
191
Factory gate pricing opportunities due to time-window restrictions
177
6.6 Conclusions Including primary distribution pick ups in the retailer’s secondary distribution increases both travel time and distance for the retailer. This increase is rather small, and should be compensated by the lower factory gate price for the products to make it interesting for the retailer. If the retailer faces time-window restrictions the increase in the number of vehicles necessary to travel these extra kilometres is much smaller than in the unrestricted case. The total number of vehicle kilometres decreases considerably if the retailer includes the primary distribution in its secondary distribution. This definitely results in a substantial decrease in pollutant emissions and in making the retailer’s operations more sustainable. This decrease is even more substantial for the case where a retailer has several distribution centres and if the pick ups from the supplier are transported to the nearest located distribution centre from where they are transhipped in FTL-trips between the distribution centres. However, in the current situation an incentive for retailer DSD04 is lacking to reduce the number of kilometres in the primary transport. Backhauling reduces the total number of vehicle kilometres considerably. This is especially the case for retailers for whom the volume delivered to the stores is larger than the volume collected at the suppliers. Obviously, this is only possible if not all supplier deliveries are included in the backhauling activities. This could be the case for retailers that receive their goods partly from suppliers in the Netherlands and partly from suppliers outside the Netherlands. A relatively small size of the orders picked up at the suppliers also contributes to the reduction in the total number of vehicle kilometres. This makes it relatively easy to include the orders in the secondary distribution. The considerable reduction in total travelled kilometres also results from the locations of the stores in the secondary distribution. The cases in this study had stores dispersed over the country, which implies no serious detours are necessary to visit suppliers. An exception is DSD04-R1 that divides the secondary distribution regionally, but not the primary distribution. The high observed reduction in total travelled kilometres is also due to the fact that retailers only deliver and pick up simple goods in this study. Backhauling is also a good opportunity for retailers to improve the vehicle utilisation during the day if this is low due to governmental time-window restrictions. It reduces the number of empty kilometres and, if the factory gate price for the goods is sufficiently lower than the current price, also the retailer’s costs. Because of these time-window restrictions, the retailer needs only a limited number of extra vehicles to include primary transport in its secondary transport activities. The number of kilometres travelled for the retailer also increases only slightly if it combines primary and secondary transport.

192
193
179
7 Concluding remarks
7.1 Introduction All chapters include conclusions, contributions and limitations. In this final chapter we do not aim at repeating the previous chapters. We briefly summarise the main findings; for a summary of the entire thesis we refer to the end of this thesis (see page 217). Next, the limitations of this research are discussed in relation with the recommendations for further research. In the recommendations for further research we specifically highlight one direction for further research; i.e. customising policies for sustainable distribution. 7.2 Key findings Urban freight transport is essential in our modern civilisation. However, it is also a major source of unsustainability in urban areas. In spite of the many efforts of policy-makers and researchers to develop urban freight transport in a more sustainable way, the actual results are disappointing. To make matters worse, the policy initiatives that are most commonly used, time-windows and vehicle restrictions, are not undisputed and their impacts are not fully understood. By providing an in-depth review of initiatives, we have not only demonstrated that the unsuccessful implementation is due to lack of knowledge about different carriers’ logistical operations at many local authorities, but we have also shown that the interaction between the local authorities and the carriers is lacking. Assumed improvements in carriers’ logistical performance by researchers, are frequently not achieved in practice. An initiative is doomed to fail in case the initiator is not able to recognise the implications of an initiative outside the narrow-bounded initiative’s action area and the initiative results in deterioration of the performance of the actor that is supposed to change its behaviour. By increasing the actual knowledge of each others’ problems and issues in urban freight transportation, and so stretching the boundaries of an initiative’s action area, it might be possible to find solutions in which improvements for both the carriers and the local authorities are achieved; a win-win situation. Higher governments and receivers could play a role in increasing the interaction between carriers and local authorities, but are currently hardly involved in urban freight transport sustainability initiatives. Dutch local authorities do not measure the impact of time-windows. We found that time-window restrictions improve social sustainability issues in city centres, however at the cost of both local and global environmental performance and the retailers’ financial performance. If time-window lengths decrease, the financial and environmental performances deteriorate more than proportionally. The currently used time-window scheme, in which local authorities design their time-window policies autonomously from others, performs badly on financial, environmental, and social performance. Harmonisation

194
Chapter 7
180
of time-windows between different municipalities results in lower costs for the retailers and lower environmental impacts. Vehicle restrictions also have a negative environmental effect, as well as an increase in costs for retailers. Time-windows and vehicle restrictions together do not influence the retailer’s financial performance more than the policy measures individually. The total increase of the costs and emissions depends on the retailer’s logistical concept. Time-windows have a larger cost impact on retailers who combine many deliveries in one roundtrip than on retailers who combine only a few deliveries in one roundtrip. Vehicle restrictions have a larger cost impact on retailers whose roundtrips are limited by the capacity of the vehicle than on retailers whose roundtrips are constrained by other than capacity constraints. It appears to be difficult to combine insensitivity to time-window pressure and cost-efficiency. Most decisions that are cost-efficient for retailers are also desirable from an environmental point of view. As a result of time-window restrictions, retailers have to increase their vehicle fleet. Backhauling turns out to be a good opportunity for retailers to improve the vehicle utilisation during the day if this is low due to governmental time-window restrictions. In that situation, including the primary distribution in a retailer’s secondary distribution, both travel time and distance for a retailer slightly increases. However, the total number of travelled vehicle kilometres decreases considerably, which definitely results in a substantial decrease in pollutant emissions and an increase in the sustainability of the distribution operations. 7.3 Summary of findings The first research question “What are the basic dimensions in urban freight transport sustainability initiatives, how are they related, and which configurations are successful?” is eventually answered in chapter 3. Chapter 2 provides a framework that can be used to structure the urban freight transportation field by identifying the main dimensions with useful classifications and by explaining the relationship between these dimensions (see Figure 2.12). The main data to develop this framework contains the available literature, the acquired knowledge during this Ph.D. trajectory, 106 UFTS (urban freight transport sustainability) initiatives, and discussions with experts. In the design phase of an initiative the basic dimensions and their classifications are: what initiative, described by type and description, why (sustainability), described by sustainability level and sustainability type, who (actors involved), described by actors involved, and why (reason for involvement), described by reason and type of involvement and role. The execution phase of an initiative can be captured by two dimensions: where (geographical elements), described by spatial characteristics, geographical focus, urban type, and outlet type, and what (transport characteristics), described by product type, supply chain direction, transport mode, delivery characteristics, and transport motivation. The evaluation phase also contains two dimensions: how (evaluation), described by methods, and what results, described by evaluation criteria, success, and critical success factors or barriers. We used the framework to structure the urban freight transport field in two main classes of sustainability initiatives, (A) those that aim at improving sustainability by making improvements within the context and (B) those that aim at improving sustainability by changing the urban freight transport

195
Concluding remarks
181
context. Next, these classes are further divided in four categories and twelve initiative types, see Table 2.1. In chapter 3 we show that all 106 reviewed initiatives can be categorised in one of these twelve initiative types. We found these 106 initiatives based on a keyword search in electronic databases, consultation of experts, and relevant proceedings of conferences. Initiatives qualify for UFTS initiative if they satisfy the criteria presented in section 2.2.2. The number of successfully implemented initiatives is limited; only 24% of the initiatives is implemented in practice for a longer period than just an experiment. Most licensing and regulation initiatives are rather restricting, e.g. vehicle restrictions, time-windows, load factor controls, and low emission zones, which explains that enforcement is a necessity for successful implementation and obedience. Without strict enforcement, these initiatives are doomed to have no (or only a limited) impact. Evaluations of policy initiatives do usually not include long-term impacts. Harmonisation of different local policies would relieve the extra costs for carriers resulting from many policy initiatives. Although company-driven initiatives, i.e. carrier cooperation and vehicle routing improvement initiatives, show efficiency gains, the number of implemented initiatives in this category is low. Physical infrastructure initiatives are characterised on the one hand by huge investment cost and high uncertainties in the results, but on the other hand by potentially enormous sustainability improvements in all three sustainability elements; economical, social, and environmental. Public private partnership could be useful for these types of initiatives. Finally, transport reorganising initiatives go beyond the urban context; intermodal transport is only feasible in urban areas under special circumstances or if it contains longer distance transport. The transport auction initiatives are not implemented in practice, but could reduce the number of kilometres theoretically. Only few UFTS initiatives are implemented successfully in practice. Local authorities’ knowledge of logistical operations of carriers, who are supposed to change their behaviour in many initiatives, is inadequate. Usually carriers do know only little about sustainability issues in urban areas. Since the interaction between local authorities and carriers is lacking, these actors’ mutual understanding of each others’ issues does not increase. An initiative is doomed to fail in case the initiator is not able to recognise the implications of an initiative outside the narrow-bounded initiative’s action area and in case the initiative does not result in an improvement in the carriers’ logistical performance if a carrier is supposed to change its behaviour. Changes in sustainability are usually not noticed in carriers’ logistical performance. This makes enforcement of rules and regulation in UFTS initiatives necessary to ensure cooperation of carriers. There are other ways to enhance cooperation. By increasing the actual knowledge of each others issues and so stretching the boundaries of the initiative’s action area, it might be possible to find solutions in which improvements apply to all actors. Increasing knowledge of carriers about sustainability issues in urban areas would probably increase the willingness to cooperate. Usually receivers own action area boundary judgements prevent them from linking local authorities and carriers in an initiative.
196
Chapter 7
182
The urban freight transport field shows a gap between research and practice. Most of the research contributions appear in reviewed articles and books. Transition to practice is seldom realised. Next, many initiatives that are presented only show preliminary results. However, especially the longer term impacts of an initiative are interesting for others and could provide valuable lessons. This limited time horizon may cause positively biased initiative results. Finally, for most initiatives it is difficult to predict the transferability to other regions or lines of industry. The second question “what is the impact of local sustainability policies on a retailer’s distribution organisation and distribution costs and on the environment?” was answered in chapter 4 based on the research framework in Figure 4.2. We use a multiple case study with 14 retail chains from several lines of industry; 4 food retail chains, 5 fashion retail chains, 1 drug store retail chain, and 4 department store retail chains (see appendix A and Table 4.4 for retailer characteristics). We use a research protocol to collect detailed case data on the retailers store deliveries, distribution strategy, experiences with local regulations, stores, DC, and the vehicle fleet. Next we use standard vehicle routing software to calculate realistic vehicle roundtrips for different retail chains in different policy scenarios. Based on interviews with 33 policy-making officials in Dutch cities we found the main objectives to use time-windows in the Netherlands. This chapter shows that time-window restrictions improve social sustainability issues in shopping areas, however this goes along with increasing local and global emissions, and a deterioration of the retailers’ financial performance. During the time-window hours negative impacts still occur in time-window areas, albeit felt by fewer people, as the time-windows obviously do not correspond with busy shopping hours. If time-window lengths decrease, the financial and environmental performances deteriorate more than proportionally. The total percentage increase in costs and emissions depends on the retailer’s logistical concept and the exact time-window pressure. The current time-window scheme, in which local authorities design their time-window policies autonomously from others, performs badly on financial, environmental, and social performance. Nightly delivery time-windows would stop the nuisance for the shopping public and decrease congestion during the morning rush hours. On the other hand, this scheme results in extra cost increase for most retailers, mainly caused by longer unloading times and higher hourly driver wages, without relieving the environmental burden. It would also add to the noise nuisance for residents living nearby stores. Harmonisation of time-windows between different municipalities results in lower costs for the retailers and lower environmental impacts than independent, coinciding time-windows (see Figure 4.6). The time-window scheme proposed by the Dutch committee for urban distribution, the reference model, shows that by having a clear policy for the entire country in which relatively large time-windows are used, the negative impacts on the environment and the retailers’ cost could be relatively low, without deteriorating the social performance, the attractiveness of a centre, and the liveability in a centre. Next, chapter 5 shows, based on an experiment with two retail chains, that vehicle restrictions also have a negative environmental effect, as well as a cost increase for retailers. Time-windows and vehicle

197
Concluding remarks
183
restrictions together do not significantly influence the retailer’s financial performance more than the policy measures individually. Next, the third research question “which factors in the organisation of a retailer’s distribution process determine its performance sensitivity to local sustainability policies?” is examined in the fifth chapter. We first examine the retailer’s sensitivity to time-windows based on the cross-case analysis of the multiple case study used in chapter 4. Next, we design an experiment with two retail chains, i.e. a drug store retailer and a department store retailer, to explore the impacts of changes in the dimensions of a retailer’s logistical concept in combination with vehicle restrictions and time-windows in more detail. Chapter 5 shows that a retailer’s cost sensitivity to time-windows appears to be lowest in case all activities performed during the time-window period are carried out expeditiously; i.e. those retailers that have short stops (using swap bodies or extra staff to unload) are affected less by increasing time-window pressure. Other dimensions that contribute to low time-window sensitivity are a large drop size and a short distance between the stores and the distribution centre. Basically, most decisions that are cost-efficient for retailers are also desirable from an environmental point of view, e.g. retailers could lower their delivery frequency to lessen the environmental burden of their transport. This is especially the case for retailers that combine many store deliveries in one roundtrip. The results clearly indicate that both time-windows and vehicle restrictions result in a cost increase, but the magnitude of the cost increase depends on distribution characteristics. For the retailers, the impacts are mainly determined by the average drop size per delivery and the average load factor of the vehicle when it leaves the distribution centre. The load factor depends on the constraint that limits the length of a vehicle roundtrip, either time or capacity. Time-windows have a larger cost impact on retailers that combine many deliveries in one roundtrip than on retailers combining few deliveries in one roundtrip. Vehicle restrictions have a larger cost impact on retailers whose roundtrips are limited by the capacity of the vehicle than on retailers whose roundtrips are constrained by other than capacity constraints. For retailers whose roundtrips are constrained by the vehicle capacity it is definitely wise to use large capacity trucks. It is more cost-efficient for retailers whose roundtrips are limited by non-capacity constraints to increase the period to supply the stores than for retailers whose roundtrips are constrained by the vehicle capacity. Using a lower delivery frequency is especially cost-efficient for retailers whose roundtrips are restricted by other than capacity constraints and that combine many deliveries in one vehicle roundtrip. The geographical store dispersion and the weekly volume hardly influence the impact of time-windows and vehicle restrictions nor the retailer’s distribution strategy decisions. Using the vehicles as efficiently as possible during a day may be cost-efficient, but it leads to an increase in time-window sensitivity. It appears to be difficult to combine insensitivity to time-window pressure and cost-efficiency. The last research question “how could retailers deal with local sustainability policies and increase the sustainability of their transport operations?” came up for discussion in the sixth chapter. We examine four cases based on two retail chains. We collect data for both
198
Chapter 7
184
the primary distribution, i.e. all deliveries to the retailer’s DC during 4 weeks from suppliers located in the Netherlands, and the secondary distribution similar to the multiple case study (in chapter 4 and 5). Based on vehicle routes calculated using the Matlab toolbox Matlog and three regression models to estimate the current primary distribution, this chapter shows including primary distribution pick ups in a retailer’s secondary distribution increases both travel time and distance for a retailer. This increase is quite low, and the resulting extra costs should be compensated by the lower factory gate price for the products to make it interesting for a retailer. The total number of travelled vehicle kilometres decreases considerably if a retailer includes the primary distribution in its secondary distribution. This definitely results in a substantial decrease in pollutant emissions and in making a retailer’s operations more sustainable. In the case that a retailer has several distribution centres the decrease can be even more if the pick ups from the suppliers are transported to the nearest located distribution centre. From here it can be transhipped in FTL-trips between the distribution centres. However, in the current situation an incentive for a retailer is lacking to reduce the number of kilometres in the primary transport. A relative small size of the pick up orders at the suppliers makes it relatively easy to include the orders in the secondary distribution. Since the cases in chapter 6 had stores located all over the country, the retailers never had to make serious detours to visit a supplier, except for the case in which the retailer divided the secondary distribution geographically and the primary distribution based on product types. Including the primary distribution in the secondary distribution roundtrip planning results in a decrease in empty kilometres for a retailer. Transporting only simple goods makes combining primary and secondary transport easier. Backhauling turns out to be a good opportunity for retailers to improve the vehicle utilisation during the day if this is low due to governmental time-window restrictions. Because of time-window restrictions, a retailer would need only a limited number of extra vehicles to include the primary distribution in its secondary distribution activities. 7.4 Limitations and recommendations for further research We refer for the specific chapter limitations to the separate chapters. Although we tried to be as complete as possible, there might be initiatives that are not included in the review in chapter 3. The initiative review contains mainly initiatives that were published in scientific journals and proceedings. Long-term implemented policy and private initiatives may not have satisfied the selection criteria and are therefore not taken in account. These implemented initiatives in practice are probably initiated by other actors than researchers; otherwise it would have been published. We are not able to estimate the magnitude of the number of initiatives that were not included, although we believe we included the majority of UFTS initiatives based on the criteria discussed in section 2.2.2. However, extra implemented long-term initiatives would be useful, since they (1) are actually implemented, (2) can confirm the results on the relation between the initiator and main actor and the success of an initiative in practice, and (3) are unknown to the scientific community, since no expert pointed these initiatives out, and are therefore of interest. To include these initiatives in future research, consultation with governmental parties during the selection of

199
Concluding remarks
185
initiatives, as well as various private parties might be useful (e.g. vehicle manufactures, but also street managers of city centres). In the second part of this thesis we did not include other policy measures than time-windows and vehicle restrictions in the examination of the impacts of policy measures on sustainability, the retailer’s sensitivity and the backhauling possibilities. Although these policy measures are used most often by Dutch municipalities, other local sustainability policy measures gain popularity, such as road pricing and low emission zones. Including other policy measures, as well as examining the relationship between and the combined impact of several different policy measures (see also section 3.2) would be useful in future research. This could prevent similar problems as with time-windows and vehicle restrictions for policy measures that will be implemented in cities in the near future. Low emission zones are going to be used more frequently in the coming years (e.g. in Dutch cities, based on the covenant to stimulate clean trucks in cities, see section 1.3, and in London in 2008). Although some recent research exists on the impacts of these policy measures (see e.g. Browne et al., 2005a and Holguin-Veras et al., 2006), there are still some interesting research questions open here in combination with the likely company reaction. For example, how to set up a road pricing scheme that really changes urban freight transport in a more sustainable way? Other policy initiatives could be examined in a similar way as we examined the impacts of time-windows and the retailer’s sensitivity to time-windows; based on a set of retail chains and their likely reaction on a policy measure. The focus in this thesis was on a national level, whereas to evaluate policy measures for a single city it would be better to focus only on one city to make sure all types of transport are included. This type of data collection already happens in the Netherlands, i.e. delivery profiles (‘bevoorradingsprofielen’). In future research the regional or national focus could be combined with the local focus of the delivery profiles to enable the evaluation of local policies for local actors as well regional actors (see also section 3.6). We discussed the differences between independent retailers and retail chains in the introduction of this thesis. In the second part of this thesis we only consider retail chains, since the degree in which retail chains determine the shopping centres in the Netherlands is high (Van der Kind, 2000). Independent retail stores are supplied differently from retail chains. To evaluate local authorities’ policy measures it would be better to include all types of urban freight transport. This would mean that next to retail chains other types, such as independent retailers, but for example also the hotel and catering industry, should be considered. In future research it would be interesting to include cases based on logistics service providers as well. These carriers might be affected differently by local regulations. For example, it might be easier for them to redeploy their fleet outside the time-window periods, due to more variation in their customer-base. The deliveries to hotel and catering outlets are also interesting to include in future research. These outlets are usually located in city centres. The deliveries to these outlets are organised in a different way than those of retail chains; wholesalers and other suppliers are responsible for the deliveries that are

200
Chapter 7
186
usually not carried out during the morning, but in the afternoon and evening. Deliveries to hotels are usually not consolidated, which results in a high number of deliveries (see e.g. Browne et al. 2007b). 7.4.1 Customising policies for sustainable distribution Based on the previous chapters on UFTS initiatives and local urban policy measures, we discuss another idea for future research in this section; developing customised policy solutions (see Quak et al., 2008b). From the previous chapters we learned that to develop urban freight transport in a more sustainable way it is important to encourage interaction between the main actors. The first research challenge is therefore to make the stakes of all main actors visible for all other actors. And subsequently, to develop a situation in which all stakes are taken in account, in order to find a solution that enables all actors to profit from developing a more sustainable urban freight transport system. In other words, we aim at finding an answer on the question whether it is possible to find a better urban freight transport solution for the sustainability triple-bottom-line; i.e. environmental, social, and economical sustainability. In this section we develop an idea for more customised policies that are able to discriminate between different logistical operations and include real incentives that are also noticeable for carriers in their performance. Chapter 3 shows the action area of an initiative should include the carriers’ logistical operations as well as the local authorities’ sustainability issues. This idea for further research enables (structured) interaction between these actors at relatively low costs and efforts, especially in comparison with class B initiatives. And, maybe even more important, it makes the implications for all actors visible. Note that technologies such as mobile GPS navigation systems (e.g. TomTom) provide opportunities for customisation that were not conceivable a few years ago. This research idea originates from current practices in industry, i.e. revenue management. We first introduce revenue management practices briefly, before discussing how customised policy solutions could help organising urban freight transport more sustainable, rather than restricting it as much as possible. The success of many companies, especially those with inflexible perishable capacity and high fixed costs, relies on their ability to extract the maximum profit from a fixed amount of goods or services. For example, the total costs of airlines are nearly unaffected by the number of seats sold. In order to maximise revenues, they use sophisticated demand management techniques. The core of revenue management is to exploit differences in product valuations between customers, over time and for different product variants (Marmorstein et al., 2003). In order for revenue management to be beneficial some business characteristics need to be in place (Talluri and Van Ryzin, 2004). First of all, customers need to exhibit different purchasing preferences. This typically reflects the differences in willingness to pay. This is the case in urban freight transport; chapter 5 shows that retail chains are affected differently by time-windows. It is likely that the willingness of retailers (i.e. carriers) to pay depends on the degree in which their costs increase due to time-windows. Secondly, demand should be uncertain. Which is the case in urban freight transport; the total number of vehicles in a city centre on a given time is very uncertain and
201
Concluding remarks
187
is influenced by many factors. Thirdly, the availability of capacity is relatively inflexible. This is certainly the case for (urban) freight transport. Infrastructural capacity in the urban environment is very inflexible. It is virtually impossible to adjust capacity based on demand. In the revenue management literature (see for example Talluri and Van Ryzin, 2004), one typically considers two control types, i.e. quantity control and price control. Quantity based control manages the availability decisions, e.g. how much capacity to reserve for a specific customer class or segment, while price based control is concerned with the dynamic pricing of products, e.g. what price to charge on a specific time for a specific customer segment and for a specific product. In urban areas we see some initiatives that resemble price based control; i.e. parking policies already discriminate on district and time. Some Internet grocers are successful examples of customisation in industry, see e.g. Albert.nl and Peapod; they try to differentiate the delivery service in terms of delivery frequency dependent on the customer’s zip code. Based on the actual demand, it is possible to quickly and easily adjust the corresponding delivery fee in a certain region in order to actively influence demand. For example, if someone in a specific area has placed an order, customers in the same area might get a discount if they order in the same time-slot. The cost-savings are shared with the customer; a win-win situation. On the other hand, in peak-demand periods such as Christmas, when the demand is really high and the available capacity is not sufficient, the company is able to steer this demand, by increasing the price per delivery. Another possibility is to differentiate prices during the week. Many customers like to receive their groceries for example on Friday in the early evening, because they are at home at that moment and they like to have all groceries in home before the weekend. In other words, the demand for that time-slot is high. This is not the case for the Monday afternoon. By differentiating prices between these periods, an Internet grocer can influence demand for the available time-slots. Customising policy solutions Although time-window policies take in account some stakeholders and their objectives, a lot of them are currently not really dealt with, see e.g. the increase in costs as well as environmental burden (chapter 4) and the obliged use of the morning rush hour for urban freight transport. The current way of designing time-window policies is quite generic and does not take private logistical systems in account (chapter 3). Therefore, we propose a customised way of designing urban freight transport policies. The main idea is that the different actors interact; roughly it implies that local authorities provide exceptions on the standard (generic) regulations. Other actors can then bid for these exceptions. Before this can happen it is important to examine all stakes from impactees, professionals and governments, so that the system we are discussing here depends on the input of all relevant stakeholders. The main idea is that in negotiations the weights of all preferences can be determined. For example, the current time-window scheme could be seen as a standard product. However, more customised time-window products are available as well. These different customised time-slots come at a ‘premium price’. The main idea is that it is possible to acquire such a customised exception. The charge that is paid to set the exception

202
Chapter 7
188
should be used to ‘compensate’ the stakeholders that are affected by the customised exception, in order to minimise the increase in inconvenience for these stakeholders. For example, customised time-windows would meet some of the major objections of the current time-window policy scheme. If a carrier really wants an exception, it can bid for a time-slot outside the ‘normal’ time-window period. This system interaction could lead to a form of harmonisation that is best for each carrier independently. Customised time-windows could reduce the extra costs carriers face due to current time-window regulations. It is also possible to differentiate within a city centre, e.g. if a carrier can unload without hindering others, for example at the backdoor or inside, it might be possible to offer that carrier a lower ‘price’ to acquire a time-window exception, than if it would hinder others. This price is not necessarily a monetary value, it can also directly compensate the ‘costs’, e.g. quiet material to supply early in the morning, or low emission engines to get an exception. The nice thing about this idea is that it provides flexibility for those stakeholders that really need it. Furthermore, other parties can be compensated for the increased inconvenience by the ‘price’ the carrier has to pay for this flexibility, in order to improve all sustainability aspects and stakeholder interests. Since this customised time-slot is really tied to a particular area it might also be possible to pass on the charge to the receiver, or even to directly charge the receiver. This idea fits in class A (see chapter 2 and 3); improving sustainability by making changes in the context. Holguin-Veras et al. (2006) show that the majority of carriers does not change their behaviour based on road pricing initiatives, because the receiver determines the delivery conditions in carrier–receiver relationships. This receiver does not always notice the pricing incentive, since transport is part of the purchase price of the goods (see chapter 3). To change carriers’ behaviour, there should sometimes also be an incentive for the receiver to change its behaviour. However, most receivers do not feel the necessity to change the current situation. Time-window regulations especially seem to attend to their interests. Many receivers do not notice potential extra costs for distribution due to time-windows nor due to pricing, because these costs are only a limited part of the total costs the receivers pay the shippers and these costs are usually not specified. To make the transition from the current regulation to the new customised solution it is essential that the stakeholders are sensitive to different offers. Therefore, a research challenge is to find an incentive for all stakeholders, including the receiver. In other words, it is of importance to determine the boundaries of the initiative’s action area so that all stakeholders are visible and their stakes are taken in account. An idea could be to make the receiver responsible for reserving the time-slots in which its carriers are allowed to make their deliveries. The receivers that are part of retail chains form a substantial part of the stores in Dutch city centres and these receivers already have an incentive. Retail chains, and especially those that attract other retail activities, could also use such a revenue management idea in their location choice and the negotiation with local authorities. By comparing the different distribution costs for different locations a retailer could get dispensation for regulations in one location where distribution costs are higher, if the authorities would prefer the retail chain to settle there.
203
Concluding remarks
189
Customised policies should also have advantages for the local authorities. The current time-window regulations might increase distribution costs as well as environmental burden; it relieves the city centre from nuisance by large vehicles and increases social sustainability. By pricing the time-slots the municipalities are able to steer so that the area is closed at times they really do not want vehicles to enter. By setting the available slots to a limit the local authorities could also minimise the number of exceptions at certain times. In this way local authorities could also steer on accessibility issues. Local authorities might possibly ask something in return from the carrier, who reduces costs due to this new time-window that better fits its planning. This ‘something’ is deliberately vague. Obviously, it could be a kind of monetary value. However, there are also other options; think about requirements to the engine type (less pollutant vehicles would for example be allowed in a wider time-window), or the noise level (quieter vehicles would for example also be allowed in the early morning). These types of requirements are not new, but to organise it in a structured way and to provide something in return for answering the requirements is. The customised time-window regulations system would give authorities an instrument to be more flexible and include changes in the carriers’ logistical performance in their policy considerations. Although we discuss mainly time-window restrictions here in this section, it can easily be extended to a system that contains all urban freight transport policy measures. This in itself would help carriers in planning their roundtrips (i.e. easily available information), let alone if it is possible to acquire customised exceptions on policy regimes that fit the roundtrip planning. Remarks on customising urban freight transport policies The exact ‘charge’ and ‘gain’ for all involved stakeholders follows after considering the interests. The issues differ per city and per stakeholder. This might be a process of negotiation and giving and taking of all involved stakeholders. In practice, this would be quite complex. Currently, the major problems are the lack of coordination between the specific policies between cities and the lack of interaction between the stakeholders. The proposed system can be in the form of a national framework that allows for regional flexibility. The overall costs are estimated to be quite low, especially in comparison with initiatives that change the context (see chapter 3). Next, this way of customising urban freight transport policies also offers opportunities to other stakeholders, e.g. the national government is especially interested in congestion issues. By differentiating time-slots, it might also be possible to steer urban freight transport, so that it does not use the most congested highways during rush hours. The second research challenge, after bringing all stakeholders together and by negotiation and common-sense-making determining the stakes, could be to develop a weighted objective function. To compare the current situation with a situation in which policy solutions are customised, a weighted objective function should be found that incorporates and quantifies the different stakeholders’ interests and sustainability issues. Next, other practical research problems could be dealt with as well, for example: what kind of charge should be used in which situation, how should this charge vary in time, how many exceptions (customised products) should be offered, how should the bidding on exceptions be organised, how should the enforcement be organised, etc.

204

205
191
storedistribution centre
Appendix A Retail chain characteristics
This appendix provides extra information on the retail chains used in the multiple case study in chapter 4 and the first part of chapter 5. Table 4.4 summarises the main characteristics of all fourteen retail chains. The cases are used in different chapters (i.e. chapters 4, 5, and 6). The characteristics discussed in this appendix are, unless mentioned otherwise, based on the situation in 2004-2005. Drug store retailer DRC01 DRC01 is a drug store retailer. This retailer’s assortment includes consumables for health, beauty, personal hygiene, baby goods, make-up consumables, perfumes, and gifts from its own label as well as from several premium labels. The stores are located in city centres and in more peripheral areas (see Figure A.1). DRC01 has about 500 stores and also supplies some other retail chains’ stores from its distribution centre. Especially the smaller stores (slightly more than half of the stores) are franchised. Some products, e.g. small cosmetics, are supplied directly to the stores by suppliers. A dedicated carrier takes care of the
transport between the distribution centre and the stores. All stores are supplied once a week with roll containers. The carrier picks up waste in empty roll containers at the stores during the delivering roundtrips. The special offers (communicated in weekly door-to-door leaflets) start in every store at the same day. Because the stores are supplied only once a week, some stores have to store these (weekly) special offers several days. Most stores have a depot, which size is included in the design of the weekly repetitive distribution scheme.
Figure A.1 Dutch store and DC locations DRC01 Department store retailer DSC02 DSC02 is a department store retailer mainly focusing on costs, whose assortment can be described as trendy gifts, living decoration products and a limited number of food products. The retailer is family-owned and has over 100 stores in the Netherlands (see Figure A.2) and some stores in Germany. All stores are supplied at least once a week, with a maximum of three times a week for the larger stores. The goods are pushed from the distribution centre to the stores. During the week the retailer collects goods at store locations in the distribution centre. Based on the number of collected goods during a week in the DC, stores are combined in one vehicle roundtrip or not. The vehicle load factor is high, since the retailer fills the vehicles completely and leaves the goods that do not fit in the vehicle at the

206
Appendix A
192
storedistribution centre
storedistribution centre
DC to be delivered next time. Special offers, from the door-to-door leaflets, have priority, because the availability of these goods is vital during the period they are offered. In the case goods really accumulate at the store locations in the DC an extra delivery is carried out to that store. The regular transport is carried out by a dedicated carrier. If more transport is needed than regularly DSC02 hires extra capacity at the market. The carrier also picks up some waste and returns from the stores during its delivery roundtrips.
Figure A.2 Dutch store and DC locations DSC02 Department store retailer DSC03 DSC03 is a department store retailer focusing on products for everyday use. DSC03 is the largest non-food retailer in the Netherlands. It sells “convenient, attractive, and practical items of high quality, at affordable prices”. The retailer only sells own label articles. About half of the 275 stores (see also Figure A.3) in the Netherlands is company-owned and the other half is franchised. DSC03 also possesses some stores in Luxemburg, Belgium, and Germany. All stores are supplied from one DC, except for some fresh products. This retailer makes a distinction between push and pull articles. Push articles are mostly non-
core products, such as special-offer, brochure, or seasonal products, which are ‘pushed’ to the stores, in contrast to the pull articles. The pull articles are allocated based on sales information. The stores are supplied in a weekly repetitive distribution scheme between 2 and 4 times a week, depending on store type and size. Food products are delivered from another centre and bakery products are supplied from the central bakery. The vehicle fleet consists of several vehicle types, but most vehicles carry one or two swap body containers. DSC03 delivers all days of the week, except Sundays.
Figure A.3 Dutch store and DC locations DSC03 Department store retailer DSD04 The target audience of the department store retailer, DSD04, is quite broad, but the emphasis is on women between 30 and 60 years, their children, and their partners. DSD04’s assortment can roughly be divided in fashion products, supplied from the one DC centrally located in the Netherlands, see Figure A.4, and the remaining products, including categories such as: electronics, books, CDs and DVDs, outdoor, sports, travel, office, games, food, furniture, etc. The fashion goods flow is completely separated from the other products flows. The remaining products are supplied from three other DCs. This retailer has about 70

207
Retail chain characteristics
193
storedistribution centre
storedistribution centre
stores, mainly located in city centres. It also supplies some stores and restaurants (in total 23) of another retailer in its delivery roundtrips (see Figure A.4). All DCs store different product groups. All stores are supplied on a daily basis (not in weekends) with fashion articles. The remaining articles are delivered once every two days (not in weekends), which results in a two-weekly recurring distribution scheme. During the evenings and nights
consolidation trips are carried out between the three category specific distribution centres. The next day the stores that are located in the same region as the DC are supplied from one regional of the three regional DCs with the complete assortment (except for fashion articles). Large stores are supplied more frequently to a maximum of two times a day (for the non-fashion assortment only). Special-offer products, brochure articles or seasonal products, and new fashion articles are pushed to the stores. The remaining products are easier to forecast and are replenished based on sales information.
Figure A.4 Dutch store and DC locations DSD04 Department store retailer DSD05 DSD05 is a department store retailer with a complete portfolio of brands (i.e. premium brands and own labels) for products concerning fashion, cosmetics, accessories, living, media, sports, travel, and restaurant activities. Parts of the assortment are exclusively designed for this retail chain. DSD05’s format can be found in the middle / high market segment. This retailer has 13 stores (see Figure A.5). Usually the store inventory is quite low, because of the high value-density of the products. Expensive off-season products that were not sold during the right season are returned from the stores to the DC to be stored
there until the season starts again next year. Stores are replenished based on point-of-sales systems. The larger stores are supplied twice (or even three times) a day, the smaller ones only two or three times a week. Because of the pull system, the vehicle load factor can be relatively low. However, this does not result in a lower delivery frequency. A dedicated carrier is responsible for the transport between the DC and the stores. The driver does not unload its vehicle because it is sealed. Before opening hours staff is already available to unload the vehicle and put everything in place in the store before it opens.
Figure A.5 Dutch store and DC locations DSD05

208
Appendix A
194
storedistribution centre
storedistribution centre
Fashion retailer FAC06 FAC06 is a fashion retailer that offers its customers quality clothing for an affordable price. FAC06 has 108 stores in the Netherlands. This retail chain has also stores in Germany, Belgium, Luxemburg, France, Swiss, Spain, Portugal, Austria, Czech Republic, Hungary, Poland, and Russia. The Dutch stores (see Figure A.6) are supplied on a daily basis, but not
during weekends. This retailer uses drawbar combination trucks for most roundtrips. FAC06 decouples these combinations at the city border, so that in cities only the easy manageable driving unit is used. The unloading process at some stores is mechanised. The majority of the goods are transported hanging from the vehicle to the store by special rails. Sometimes a conveyer belt is also available to ease the unloading of boxes. From all goods that enter the Dutch DC about 70% is directly pushed to the stores. The other 30% is used as replenishment on the basis of sales information. There is a limited flow between different stores via the DC.
Figure A.6 Dutch store and DC locations FAC06 Fashion retailer FAC07 FAC07 sells household textiles and basic clothing. This retailer is a hardcore discounter selling affordable textiles. Basically, the formula is characterised by a high level of uniformity and by the lowest possible prices. FAC07 has 475 stores in the Netherlands (see
for locations Figure A.7). This retailer is also located in Germany, Belgium, France, and Luxemburg. FAC07 is Europe’s largest textile supermarket. Efficiency considerations resulted in supplying the stores during 24 hours a day. The idea is that all vehicles are active all day. The goods are pushed from the distribution centre, which results in a very high vehicle load factor. Based on a strict timetable all stores are supplied twice a week. The drivers possess a key to the stores, so that they can put the roll containers in the store if no staff is available (outside opening hours).
Figure A.7 Dutch store and DC locations FAC07 Fashion retailer FAR08 FAR08 is a retail organisation that supports two different fashion retail formulas, with a different product assortment, stores, and target audiences, from one DC. In the distribution operations there is no distinction between the two formulas; therefore it is one case in this study. One formula focuses on young, professional women, the other formula aims at

209
Retail chain characteristics
195
storedistribution centre
storedistribution centre
following fashion trends for all women. The first formula, with 56 stores, is positioned slightly higher than the middle segment, the second formula, with 124 stores, in the middle segment (see Figure A.8). Most stores are located in city centres. This retailer aims at offering complete sets of clothes (e.g. different types of matching trousers and blouses). FAR08 delivers new clothes to all stores every day (except for weekends), resulting in a small drop size. The idea of this way of replenishing the stores is to attract women to frequently visit the stores, because there is always a (partly) new collection. Products are usually no longer than one month available in the stores. Next to the daily new deliveries, there is also a limited number of replenishment deliveries based on the sales. About 70% of the goods that enter FAR08’s DC are distributed to the stores the next day (push flow). The other 30% (pull flow) is allocated to the different stores based on sales. Because of the aim
of offering matching sets of clothes it also happens that the allocation division reallocates some incomplete sets of different stores, so that one store can offer complete sets. The driver is responsible for the deliveries. This retailer also uses some ‘outlet stores’ in which products are sold that did not sell (as) well (as expected) in the regular stores for discount prices. The allocation division decides which products have to be returned from the stores to the DC. A dedicated carrier supplies all stores with small vehicles.
Figure A.8 Dutch store and DC locations FAR08 Fashion retailer FAR09 FAR09 is specialised in own label ladies’ underwear, nightwear, and swimwear. Next to 122 stores in the Netherlands (see Figure A.9), FAR09 has in stores in Belgium, Luxemburg, Germany, Denmark, and France. Two third of the Dutch stores is owned by the retailer and the remaining stores by franchisers. FAR09 is market leader in the Benelux for body fashion. For some foreign stores the goods are transferred at a transhipment centre and from there the transport is combined with another fashion retailer. FAR08, taking care
of its own transport, delivers its Dutch stores twice a week, based on a weekly repetitive distribution scheme. This retailer only supplies its stores at Tuesdays, Wednesdays, Thursdays, and Fridays. A limited number of the stores is supplied outside opening hours. The driver possesses a key of these stores. We distinguish two different flows: a pull flow (based on point-of-sale information) for ‘never-out-of-stock’ articles (about 45% of the volume), and a push flow which differs every two weeks. The average drop size is quite small.
Figure A.9 Dutch store and DC locations FAR09
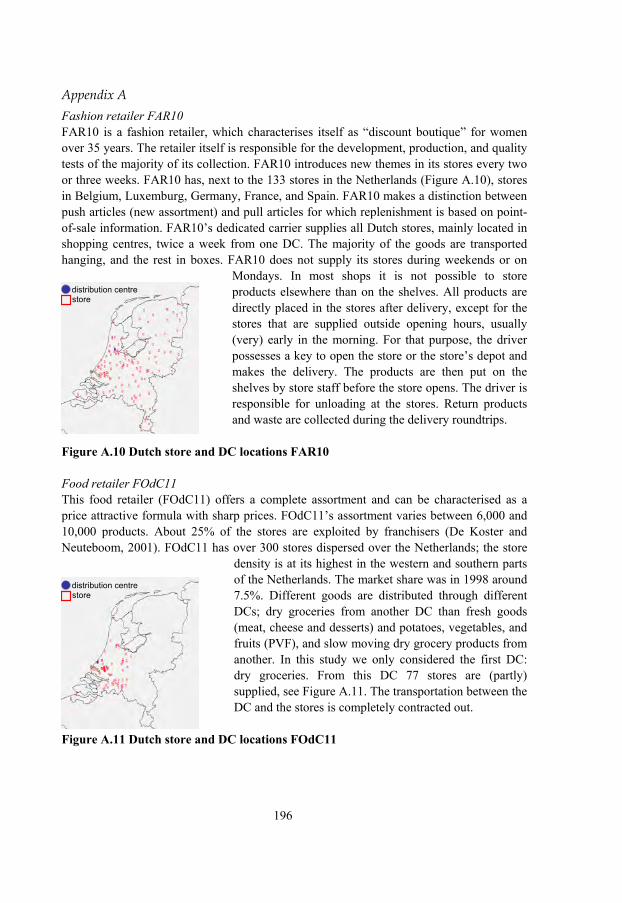
210
Appendix A
196
storedistribution centre
storedistribution centre
Fashion retailer FAR10 FAR10 is a fashion retailer, which characterises itself as “discount boutique” for women over 35 years. The retailer itself is responsible for the development, production, and quality tests of the majority of its collection. FAR10 introduces new themes in its stores every two or three weeks. FAR10 has, next to the 133 stores in the Netherlands (Figure A.10), stores in Belgium, Luxemburg, Germany, France, and Spain. FAR10 makes a distinction between push articles (new assortment) and pull articles for which replenishment is based on point-of-sale information. FAR10’s dedicated carrier supplies all Dutch stores, mainly located in shopping centres, twice a week from one DC. The majority of the goods are transported hanging, and the rest in boxes. FAR10 does not supply its stores during weekends or on
Mondays. In most shops it is not possible to store products elsewhere than on the shelves. All products are directly placed in the stores after delivery, except for the stores that are supplied outside opening hours, usually (very) early in the morning. For that purpose, the driver possesses a key to open the store or the store’s depot and makes the delivery. The products are then put on the shelves by store staff before the store opens. The driver is responsible for unloading at the stores. Return products and waste are collected during the delivery roundtrips.
Figure A.10 Dutch store and DC locations FAR10 Food retailer FOdC11 This food retailer (FOdC11) offers a complete assortment and can be characterised as a price attractive formula with sharp prices. FOdC11’s assortment varies between 6,000 and 10,000 products. About 25% of the stores are exploited by franchisers (De Koster and Neuteboom, 2001). FOdC11 has over 300 stores dispersed over the Netherlands; the store
density is at its highest in the western and southern parts of the Netherlands. The market share was in 1998 around 7.5%. Different goods are distributed through different DCs; dry groceries from another DC than fresh goods (meat, cheese and desserts) and potatoes, vegetables, and fruits (PVF), and slow moving dry grocery products from another. In this study we only considered the first DC: dry groceries. From this DC 77 stores are (partly) supplied, see Figure A.11. The transportation between the DC and the stores is completely contracted out.
Figure A.11 Dutch store and DC locations FOdC11

211
Retail chain characteristics
197
storedistribution centre
Food retailer FOdD12 and food retailer FOfD14 FOdD12 and FOfD14 are based on the same two formulas. These cases have the same stores and DCs. However, their dry grocery flow is completely separated from their fresh flow, which results in two separate distribution processes. Therefore, since our unit of analysis is “a retailer’s physical distribution process during one representative week between one DC and the stores that are supplied from that centre” we deal with these flows as separate cases. We only examined one distribution centre, and all orders and stores that are supplied from this DC. We combined two slightly different formulas, whereas these two formulas are considered the same in the distribution centre. FOdD12 and FOfD14 have 430 stores, of which 134 are considered in this case study (see Figure A.12). Their formulas include full-service supermarkets (with an assortment of 12,000 to 18,000 products) and
full-service superstores (with an assortment of 22,000 products). Over 50% of all stores are exploited by franchisers. The market share in 1998 was approximately 12.5% (De Koster and Neuteboom, 2001). The DC that is considered in this study processes fast moving dry groceries, fast moving fresh products (such as cheese, meat and desserts) and potatoes, vegetables, and fruits (PVF). Frozen products are supplied from another distribution centre and are therefore not considered. The deliveries are carried out by separated vehicles for dry groceries and fresh products.
Figure A.12 Dutch store and DC locations FOdD12 and FOfD14 Food retailer FOdfC13 This food retailer (FOdfC13) is a strong regionally oriented supermarket chain. FOdfC13 has 38 stores, mainly in South-Holland, and one DC (see Figure A.13). The formula can be described as a price competitive supermarket, a so-called soft discounter, with a wide assortment of over 12,000 articles. FOdfC13 emphasises on quality and fresh products. The market share of this supermarket in the Netherlands was around 2% in 1998 (De Koster and Neuteboom, 2001). All logistics activities are centralised in the DC; dry groceries, butchery activities, bakery activities, potatoes, vegetables, and fruit (PVF), and other fresh goods. For transporting the products from the DC to the stores FOdfC13 uses detachable swap bodies for about two third of its stores. This swap body is a detachable container that can be left at a specific location, after which the truck leaves (see Figure A.14). The remaining stores can not be supplied by the detachable swap body concept, because the store locations do not allow the detachable swap body operations. Every swap body is provided with a cooling system so that both dry groceries and fresh products can be transported in a swap body. Dry groceries are placed in the back of the swap body and covered under some kind of tarpaulin to isolate the airflows; some are even covered with a special wrap to protect them. Frozen products are transported in special closed rolling containers. Usually a truck drops the swap body off at a store and picks one up with returns, such as waste and

212
Appendix A
198
storedistribution centre
depository goods (De Koster and Neuteboom, 2001; Geerards and De Vrij, 1999). The use of these swap bodies offers some significant advantages: the number of trucks can be
limited, since trucks do not have to wait until the loading and unloading is finished, and it leads to more flexibility. Swap bodies do not have to be loaded or unloaded immediately and swap bodies can be used for temporary storage. In a few stores the dropping off (and picking up) of the swap bodies is carried out inside in order to minimise the inconvenience. Another advantage of swap bodies is the simplification of the transportation; every swap body is for a specific store (De Koster and Neuteboom, 2001).
Figure A.13 Dutch store and DC locations FOdfC13
Figure A.14 Detachable swap body
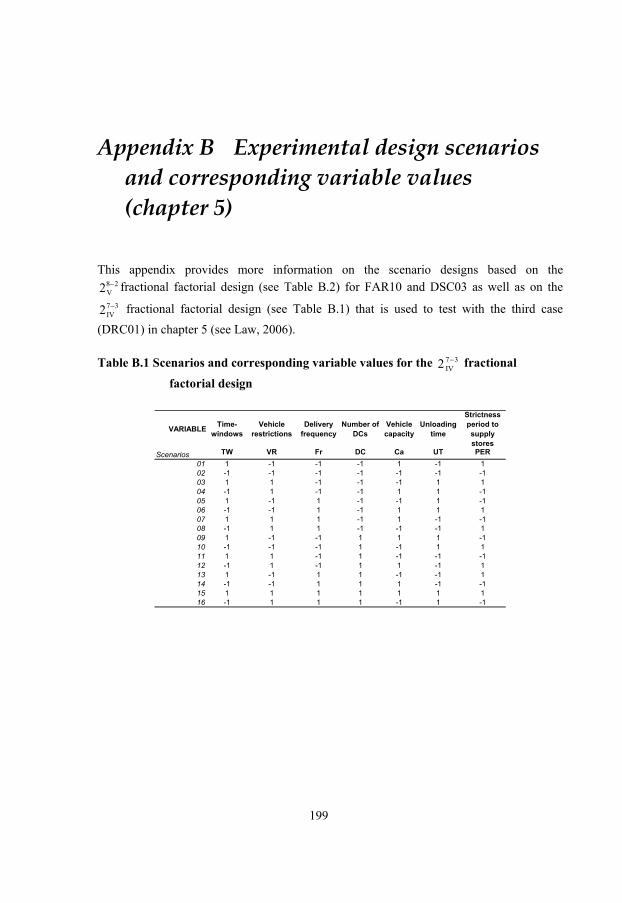
213
199
Appendix B Experimental design scenarios and corresponding variable values (chapter 5)
This appendix provides more information on the scenario designs based on the 28
V2 − fractional factorial design (see Table B.2) for FAR10 and DSC03 as well as on the 37
IV2 − fractional factorial design (see Table B.1) that is used to test with the third case (DRC01) in chapter 5 (see Law, 2006). Table B.1 Scenarios and corresponding variable values for the 37
IV2 − fractional
factorial design
VARIABLE Time-windows
Vehicle restrictions
Delivery frequency
Number of DCs
Vehicle capacity
Unloading time
Strictness period to supply stores
TW VR Fr DC Ca UT PER01 1 -1 -1 -1 1 -1 102 -1 -1 -1 -1 -1 -1 -103 1 1 -1 -1 -1 1 104 -1 1 -1 -1 1 1 -105 1 -1 1 -1 -1 1 -106 -1 -1 1 -1 1 1 107 1 1 1 -1 1 -1 -108 -1 1 1 -1 -1 -1 109 1 -1 -1 1 1 1 -110 -1 -1 -1 1 -1 1 111 1 1 -1 1 -1 -1 -112 -1 1 -1 1 1 -1 113 1 -1 1 1 -1 -1 114 -1 -1 1 1 1 -1 -115 1 1 1 1 1 1 116 -1 1 1 1 -1 1 -1
Scenarios

214
Appendix B
200
Table B.2 Scenarios and corresponding variable values for the 28V2 − fractional factorial
design
VARIABLE Time-windows
Vehicle restrictions
Delivery frequency
Number of DCs
Vehicle capacity
Unloading time
Strictness period to supply stores
Geographical store
dispersion
TW VR Fr DC Ca UT PER DIS01 1 -1 -1 -1 -1 -1 -1 -102 -1 -1 -1 -1 -1 -1 1 103 1 1 -1 -1 -1 -1 1 104 -1 1 -1 -1 -1 -1 -1 -105 1 -1 -1 1 -1 -1 1 -106 -1 -1 -1 1 -1 -1 -1 107 1 1 -1 1 -1 -1 -1 108 -1 1 -1 1 -1 -1 1 -109 1 -1 1 -1 -1 -1 1 -110 -1 -1 1 -1 -1 -1 -1 111 1 1 1 -1 -1 -1 -1 112 -1 1 1 -1 -1 -1 1 -113 1 -1 1 1 -1 -1 -1 -114 -1 -1 1 1 -1 -1 1 115 1 1 1 1 -1 -1 1 116 -1 1 1 1 -1 -1 -1 -117 1 -1 -1 -1 1 -1 -1 118 -1 -1 -1 -1 1 -1 1 -119 1 1 -1 -1 1 -1 1 -120 -1 1 -1 -1 1 -1 -1 121 1 -1 -1 1 1 -1 1 122 -1 -1 -1 1 1 -1 -1 -123 1 1 -1 1 1 -1 -1 -124 -1 1 -1 1 1 -1 1 125 1 -1 1 -1 1 -1 1 126 -1 -1 1 -1 1 -1 -1 -127 1 1 1 -1 1 -1 -1 -128 -1 1 1 -1 1 -1 1 129 1 -1 1 1 1 -1 -1 130 -1 -1 1 1 1 -1 1 -131 1 1 1 1 1 -1 1 -132 -1 1 1 1 1 -1 -1 133 1 -1 -1 -1 -1 1 -1 134 -1 -1 -1 -1 -1 1 1 -135 1 1 -1 -1 -1 1 1 -136 -1 1 -1 -1 -1 1 -1 137 1 -1 -1 1 -1 1 1 138 -1 -1 -1 1 -1 1 -1 -139 1 1 -1 1 -1 1 -1 -140 -1 1 -1 1 -1 1 1 141 1 -1 1 -1 -1 1 1 142 -1 -1 1 -1 -1 1 -1 -143 1 1 1 -1 -1 1 -1 -144 -1 1 1 -1 -1 1 1 145 1 -1 1 1 -1 1 -1 146 -1 -1 1 1 -1 1 1 -147 1 1 1 1 -1 1 1 -148 -1 1 1 1 -1 1 -1 149 1 -1 -1 -1 1 1 -1 -150 -1 -1 -1 -1 1 1 1 151 1 1 -1 -1 1 1 1 152 -1 1 -1 -1 1 1 -1 -153 1 -1 -1 1 1 1 1 -154 -1 -1 -1 1 1 1 -1 155 1 1 -1 1 1 1 -1 156 -1 1 -1 1 1 1 1 -157 1 -1 1 -1 1 1 1 -158 -1 -1 1 -1 1 1 -1 159 1 1 1 -1 1 1 -1 160 -1 1 1 -1 1 1 1 -161 1 -1 1 1 1 1 -1 -162 -1 -1 1 1 1 1 1 163 1 1 1 1 1 1 1 164 -1 1 1 1 1 1 -1 -1
Scenarios

215
201
Appendix C List of abbreviations
AGV Automatic guided vehicles AIC Area-wide inter-carrier consolidation system AVV Adviesdienst Verkeer en Vervoer (Transport Research Centre: part of the
Dutch Rijkswaterstaat organisation) BESTUFS Best urban freight solutions CBD Central business district CCC City consolidation centre CDC City distribution centre CNG Compressed natural gas CO Carbon monoxide CO2 Carbon dioxide CSF Critical success factor CSD Commissie stedelijke distributie (Dutch committee for urban distribution) DC Distribution centre DETR Department of environment, transport and regions (UK) DIY-store Do-it-yourself store ECMT European Conference of Ministers of Transport EEA European Environment Agency FGP Factory gate pricing FTL Full truckload GPD Gross domestic product HFFVRP Heterogeneous fixed fleet vehicle routing problem JIT Just in time LEZ Low emission zone LSP Logistics service provider LTL Less-than-truckload NOx Nitrogen oxides NUFC National urban freight transport conference OECD Organization for economic co-operation and development PM Particulate matter PPP Public-private partnership PSD Platform stedelijke distributie (Dutch platform for urban distribution) PVF Potatoes, vegetables and fruits PVRP Periodic vehicle routing problem SDVRP Site dependent vehicle routing problem TDVRP Time dependent vehicle routing problem TOT Truck-only toll TW Time-window UDC Urban distribution centre UFT Urban freight transport UFTS initiative Urban freight transport sustainability initiative

216
Appendix C
202
UGM Urban goods movement ULS Underground logistics system VOC Volatile organic compound VRP Vehicle routing problem VRPPD Vehicle routing problem with pick-up and delivery VRPTW Vehicle routing problem with time windows WCTR World conference on transport research

217
203
References
Abel, H. (2006). Urban Freight Management in Barcelona (Spain), in H. Abel and R. Karrer (eds.), BESTUFS - Best Practice Handbook 2006, BESTUFS II, TREN/04/FP6TR/S07.31723/506384.
Aiura, N. and E. Taniguchi (2006). Planning on-street loading-unloading spaces considering the behaviour of pickup-delivery vehicles and parking enforcement, in E. Taniguchi and R. G. Thompson (eds.), Recent advances in city logistics; proceedings of the 4rd international conference on City Logistics, 107-116, Elsevier, Amsterdam.
Allen, J. (2006a). London congestion charging system, in H. Abel and R. Karrer (eds.), BESTUFS - Best Practice Handbook 2006, BESTUFS II,
TREN/04/FP6TR/S07.31723/506384. Allen, J. (2006b). London lorry control system, in H. Abel and R. Karrer (eds.), BESTUFS - Best
Practice Handbook 2006, BESTUFS II, TREN/04/FP6TR/S07.31723/506384. Allen, J., S. Anderson, M. Browne, and P. Jones (2000). A framework for considering policies to
encourage sustainable urban freight traffic and goods / service flows. Transport Studies Group, University of Westminster, London.
Allen, J., M. Browne, G. Tanner, S. Anderson, G. Chrisodoulou, and P. Jones (2004). Analysing the Potential Impacts of Sustainable Distribution Measures in UK urban areas, in E. Taniguchi and R. G. Thompson (eds.), Logistics Systems for Sustainable Cities, proceedings of the 3rd international conference on City Logistics, 251-262, Elsevier, Amsterdam.
Allen, J., G. Tanner, M. Browne, S. Anderson, G. Chrisodoulou, and P. Jones (2003). Modelling policy measures and company initiatives for sustainable urban distribution; Final Technical Report. Transport Studies Group, University of Westminster, London.
Ambrosini, C. and J. L. Routhier (2004). Objectives, Methods and Results of Surveys Carried out in the Field of Urban Freight Transport: An International Comparison. Transport Reviews, 24 (1), 57-77.
Ambrosini, C., J. L. Routhier, and F. Toilier (2004). How do urban policies work on urban goods transport flows, in WCTR'04, Topic area: B5 Urban Goods Movement, CDrom, Istanbul.
Anderson, S., J. Allen, and M. Browne (2005). Urban logistics - how can it meet policy makers' sustainability objectives? Journal of Transport Geography, 13 (1), 71-81.
Aujla, E., K. Hainsworth, and T. Patel (2003). Factory Gate, Open Book and Beyond. Institute of Grocery Distribution, Letchmore Heath.
AVV (2005). Filemonitor 2004. AVV (Adviesdienst Verkeer en Vervoer), Rotterdam. Ballou, R. H. (1992). Business Logistics Management. Prentice Hall International, London. Banister, D. (2000). Sustainable urban development and transport: A Eurovision for 2020.
Transport Reviews, 20 (1), 113-130. Banister, D., D. Stead, P. Steen, J. Akerman, K. Dreborg, P. Nijkamp, and R. Schleicher-
Tappeser (2000). European Transport Policy and Sustainable Mobility. Spon Press, London.
Baptista, S., R. C. Oliveira, and E. Zuquete (2002). A period vehicle routing case study. European Journal of Operational Research, 139 (2), 220-229.

218
References
204
Baybars, M. and M. Browne (2004). Developments in urban distribution in London, in E. Taniguchi and R. G. Thompson (eds.), Logistics Systems for Sustainable Cities, proceedings of the 3rd international conference on City Logistics, 295-308, Elsevier, Amsterdam.
BCI (2006). Quick scan stedelijke distributie G-31 (Quick scan urban distribution). Commissie Stedelijke Distributie, The Hague.
Bodin, L., B. Golden, A. Assad, and M. Ball (1983). Routing and scheduling of vehicles and crews: The state of the art. Computers and Operations Research, 10 (2), 63-211.
Boerkamps, J. (2001). State-of-the-art of city logistics in the Netherlands: research framework and research activities, in E. Taniguchi and R. G. Thompson (eds.), City Logistics II, 241-254, Institute of Systems Science Research, Kyoto.
Boerkamps, J. and A. Van Binsbergen (1999). Goodtrip - A new approach for modelling and evaluating urban goods distribution, in E. Taniguchi and R. G. Thompson (eds.), City logistics I, 175-186, Institute of Systems Science Research, Kyoto.
Braysy, O. and M. Gendreau (2005a). Vehicle Routing Problem with Time Windows, Part I: Route Construction and Local Search Algorithms. Transportation Science, 39 (1), 104-118.
Braysy, O. and M. Gendreau (2005b). Vehicle Routing Problem with Time Windows, Part II: Metaheuristics. Transportation Science, 39 (1), 119-139.
Browne, M. (1999). United Kingdom, in ECMT (ed.), Freight transport and the city; roundtable 109, OECD Publications Service, Paris.
Browne, M. and J. Allen (1999). The impact of sustainability policies on urban freight transport and logistics systems, in H. Meermans, E. Van de Voorde, and W. Winkelmans (eds.), 8th World Conference on Transport Research (WCTR), Volume 1 Transport Modes and Systems, 505-518, Elsevier, Antwerp.
Browne, M. and J. Allen (2006). Urban freight data collection - synthesis report. TREN/04/FP6TR/S07.31723/506384, BESTUFS II.
Browne, M., J. Allen, and S. Anderson (2005a). Low emission zones: the likely effects on the freight transport sector. International Journal of Logistics - Research and Applications, 8 (4), 269-281.
Browne, M., J. Allen, S. Anderson, and A. Woodburn (2006). Night-time delivery restrictions: A review, in E. Taniguchi and R. G. Thompson (eds.), Recent advances in city logistics: proceedings of the 4th international conference on city logistics, 245-258, Elsevier, Amsterdam.
Browne, M., J. Allen, T. Nemoto, J. Visser, and D. Wild (2007a). City access restrictions and the implications for goods deliveries, in E. Taniguchi and R. G. Thompson (eds.), City Logistics V, 15-31, Institute for City Logistics, Crete, Greece.
Browne, M., T. Nemoto, J. Visser, and T. Whiteing (2004). Urban freight movements and public-private partnerships, in E. Taniguchi and R. G. Thompson (eds.), Logistics Systems for Sustainable Cities, proceedings of the 3rd international conference on City Logistics, 17-36, Elsevier, Amsterdam.
Browne, M., M. Piotrowska, J. Allen, and A. Woodburn (2007b). The potential use of urban consolidation centres in the hotel industry in London, in E. Taniguchi and R. G. Thompson (eds.), City Logistics V, 79-92, Institute for City Logistics, Crete, Greece.
Browne, M., M. Sweet, A. Woodburn, and J. Allen (2005b). Urban freight consolidation centres - final report. Transport Studies Group, University of Westminster, London.
Button, K. J. and A. D. Pearman (1981). The economics of urban freight transport. The MacMillan Press ltd, London.
219
References
205
Castro, J. T., H. Kuse, and M. Kubo (1999). Study on location planning of distribution facilities, in E. Taniguchi and R. G. Thompson (eds.), City logistics I, 147-163, Institute of Systems Science Research, Kyoto.
Chen, I. J. and A. Paulraj (2004). Towards a theory of supply chain management: the constructs and measurements. Journal of Operations Management, 22 (2), 119-150.
Chopra, S. (2003). Designing the distribution network in a supply chain. Transportation Research Part E, 23 (2), 123-140.
Chopra, S. and P. Meindl (2004). Supply chain management - strategy, planning, and operations. Pearson Prentice Hall, New Jersey.
Clarke, G. and J. W. Wright (1964). Scheduling of vehicles from a central depot to a number of delivery points. Operations Research, 12 (4), 568-581.
Commission of the European Communities (2001a). European Transport Policy for 2020: Time to Decide. Office for Official Publications of the European Communities, Luxemburg.
Commission of the European Communities (2001b). A Sustainable Europe for a Better World: A European Strategy for Sustainable Development. Office for Official Publication of the European Communities, Luxemburg.
Cordeau, J. F., G. Desaulniers, J. Desrosier, M. Solomon, and F. Soumis (2002). VRP with Time Windows, in P. Toth and D. Vigo (eds.), The vehicle routing problem, 157-194, SIAM Monographs on Discrete Mathematics and Applications, Philadelphia.
Cordeau, J. F. and G. Laporte (2001). A tabu search algorithm for the site dependent vehicle routing problem with time windows. INFOR, 39 (3), 292-298.
Crainic, T. G., N. Ricciardi, and G. Storchi (2004). Advanced freight transportation systems for congested urban areas. Transportation Research Part C: Emerging Technologies, 12 (2), 119-137.
Crum, B. and M. Vossen (2000). Knelpunten in de binnenstadsdistributie, inventarisatie van de beschikbare kennis en ervaringen. Research voor Beleid, Leiden.
CSD (2005). Voorbeeldenboek. Commissie Stedelijke Distributie, The Hague. CSD (2006). Referentiemodel (Referencemodel). Commissie Stedelijke Distributie, The Hague. Dablanc, L. (2007). Goods transport in large European cities: Difficult to organize, difficult to
modernize. Transportation Research Part A, 41 (3), 280-285. Dawson, J. (2005). Output Considerations in Retail Productivity. International Review of Retail,
Distribution & Consumer Research 15 (3), 337-349. De Brito, M. P. (2003). Managing reverse logistics or reversing logistics management?, Ph.D.
thesis, ERIM, Rotterdam. De Carvalho, J. M. C. (2004). Systems theory, complexity and supply organizational models to
enrich city logistics: An approach, in E. Taniguchi and R. G. Thompson (eds.), Logistics Systems for Sustainable Cities, proceedings of the 3rd international conference on City Logistics, 179-190, Elsevier, Amsterdam.
De Koster, M. B. M. (2002). The logistics behind the enter click, in A. Klose, M. Grazia Speranza, and L. H. Van Wassenhoven (eds.), Quantitative approaches to distribution logistics and supply chain management, 131-148, Springer, Berlin.
De Koster, M. B. M. (2003). Distribution strategies for online retailers. IEEE Transactions on Engineering Management, 50 (4), 448-457.
De Koster, M. B. M. and A. J. Neuteboom (2001). The logistics of supermarket chains: a comparison of seven chains in the Netherlands. Elsevier Business Information, Doetichem.
Debauche, W. (2004). A study on the setting up of lorry-dedicated routes in the Brussels Capital Region, in E. Taniguchi and R. G. Thompson (eds.), Logistics Systems for Sustainable Cities, proceedings of the 3rd international conference on City Logistics, 333-348, Elsevier, Amsterdam.

220
References
206
Desaulniers, G., J. Desrosier, A. Erdmann, M. Solomon, and F. Soumis (2002). VRP with Pickup and Delivery, in P. Toth and D. Vigo (eds.), The vehicle routing problem, 225-244, SIAM Monographs on Discrete Mathematics and Applications, Philadelphia.
DETR (1998). A New Deal for Transport: Better for Everyone. The Stationery Office, London. DETR (1999). Sustainable Distribution: A Strategy. DETR, London. DHV (2006). Steden schoner en stiller. Ministerie van VROM, VNG en DHV, The Hague. Dijkhuizen, B. (2007). Vrachttram maakt eerste meters door Amsterdamse binnenstad.
LogistiekKrant, March 8th, 2007. Dinwoodie, J. (2006). Rail freight and sustainable urban distribution: potential and practice.
Journal of Transport Geography, 14 309-320. Drewes Nielsen, L., P. H. Jespersen, T. Petersen, and L. G. Hansen (2003). Freight transport
growth––a theoretical and methodological framework. European Journal of Operational Research, 144 (2), 295-305.
Duinkerken, M. B., K. F. Drenth, I. L. L. Jaspers, A. J. Klein Breteler, J. C. Rijsenbrij, H. J. L. Schilperoort, and M. J. Willekes (2003). Stedelijke distributie in de retailketen; Hoofdrapportage. Connekt, Delft.
Dul, J. and T. Hak (2007). Case Study Methodology in Business Research. Elsevier, Amsterdam. ECMT (1999). Freight transport and the city: report of the hundred and ninth round table on
transport economics. OECD Publications Service, Paris. EEA (2001). TERM 2001: Indicators tracking transport and environment integration in the
European Union. Office for Official Publication of the European Communities, Luxemburg.
EIM (2004). Look, Listen, Learn. Stichting Studiecentrum Marktontwikkeling, The Hague. Eisenhardt, K. M. (1989). Building theory from case study research. Academy of Management
Review, 14 (4), 532-550. Fager, M. (2000). Environmental zones and other regulations in Stockholm, in M. Ruesch and
C. Gluecker (eds.), BESTUFS - Best Practice Handbook 2000, BESTUFS, 1999-TN.10003. Feitelson, E. (2002). Introducing environmental equity dimensions into the sustainable transport
discourse: issues and pitfalls. Transportation Research part D, 7 (2), 99-118. Fernie, J., F. Pfab, and C. Marchant (2000). Retail grocery logistics in the UK. International
Journal of Logistics Management, 11 (2), 83-90. Fetterman, M. (2006). Wal-Mart grows 'green' strategies. USA Today, 9/25/2006. Finegan, N. (2002). Backhauling and factory gate pricing. IGD Business Publication, Watford. Fisher, M. L. (1997). What is the right supply chain for your product? Harvard Business Review,
75 (2), 83-93. Flood, R. L. (1999a). Knowing of the Unknowable. Systemic Practice and Action Research, 12
(3), 247-256. Flood, R. L. (1999b). Rethinking The Fifth Discipline – Learning within the unknowable.
Routledge, London. Francis, P. and K. Smilowitz (2006). Modeling techniques for periodic vehicle routing
problems. Transportation Research Part B: Methodological, 40 (10), 872-884. Francis, P., K. Smilowitz, and M. Tzur (2006). The period vehicle routing problem with service
choice. Transportation Science, 40 (4), 439-454. Geerards, J. and B. De Vrij (1999). Kostenbesparing met wissellaadbakken in de distributie, in J.
P. Duijker, M. B. M. De Koster, and M. J. Ploos van Amstel (eds.), Praktijkboek Magazijnen en Distributiecentra, 3.5.E1-16, 1-16, Kluwer, Deventer.
Geroliminis, N. and C. F. Daganzo (2006). A review of green logistics schemes used in cities around the world, in Metrans, National Urban Freight Conference (NUFC), Long Beach, California.

221
References
207
Giannakodakis, G. and P. Lawes (1999). Developing a freight network for Adelaide, in E. Taniguchi and R. G. Thompson (eds.), City Logistics I, 235-243, Institute of Systems Science Research, Kyoto.
Gragnani, S., G. Valenti, and M. P. Valentini (2004). City logistics in Italy: A national project, in E. Taniguchi and R. G. Thompson (eds.), Logistics Systems for Sustainable Cities, proceedings of the 3rd international conference on City Logistics, 279-294, Elsevier, Amsterdam.
Groothedde, B. (2006). Verkenning goederenvervoer per locaal spoor - Haaglanden. TNO Mobiliteit en Logistiek, Delft.
Groothedde, B., A. Oome, J. C. Rijsenbrij, H. J. L. Schilperoort, C. A. Verweij, and M. J. Willekes (2003a). Stadsbox: een strategische oplossing voor nationale en stedelijke distributie; Hoofdrapport fase 2. Connekt, Delft.
Groothedde, B. and M. Rustenburg (2003). De economische haalbaarheid van de stadsbox in stedelijke distributie. TNO Inro, Delft.
Groothedde, B., M. Rustenburg, and K. Uil (2003b). De invloed van venstertijden en voertuigbeperkingen op de distributiekosten in de Nederlandse detailhandel. TNO Inro, Delft.
Groothedde, B. and K. Uil (2004). Restrictions in City-Distribution and a Possible Alternative Using the Citybox, in P. H. L. Bovy (ed.), A World of Transport, Infrastructure and Logistics, 8th TRAIL Congress 2004, 1-16, DUP Science, Delft.
Hall, R. (2004). Vehicle Routing Software Survey. OR/MS Today, 31 (3), 1-13. Hassall, K. (2004). Dispelling the e-commerce and urban transport environmental doomsday
forecasts: A counter intuitive Australian case study - The postal transport network restructure, 1995 - 2000, in E. Taniguchi and R. G. Thompson (eds.), Logistics Systems for Sustainable Cities, proceedings of the 3rd international conference on City Logistics, 397-404, Elsevier, Amsterdam.
Hassall, K. (2006). Introducing high productivity vehicles into Australia: Two case studies with different regulatory mechanisms, in E. Taniguchi and R. G. Thompson (eds.), Recent advances in city logistics: proceedings of the 4th international conference on city logistics, 163-178, Elsevier, Amsterdam.
Heizer, J. and B. Render (1999). Principles of Operations Management. Prentice Hall, New Jersey.
Hesse, M. (2004). Logistics and Freight Transport Policy in Urban Areas: A Case Study of Berlin-Brandenburg/Germany. European Planning Studies, 12 (7), 1035-1053.
Heuer, J. P. (2004). Summary of the OECD Report 'Delivering the Goods - 21ste Century Challenges to Urban Goods Transport', in E. Taniguchi and R. G. Thompson (eds.), Logistics Systems for Sustainable Cities, proceedings of the 3rd international conference on City Logistics, 431-440, Elsevier, Madeira, Portugal.
Hicks, S. K. (1977). Urban freight, in D. A. Hensher (ed.), Urban Transport Economics, 100-130, Cambridge University Press, Cambridge.
Hill, M. (2001). Sustainability, greenhouse gas emissions and international operations management. International Journal of Operations & Production Management, 21 (12), 1503 - 1520.
Himanen, V., M. Lee-Gosselin, and A. Perrels (2004). Impacts of Transport on Sustainability: Towards an Integrated Transatlantic Evidence Base. Transport Reviews, 24 (6), 691-705.
Holguin-Veras, J. (2004). On the estimation of the maximum efficiency of the trucking industry: Implications for city logistics, in E. Taniguchi and R. G. Thompson (eds.), Logistics Systems for Sustainable Cities, proceedings of the 3rd international conference on City Logistics, 123-134, Elsevier, Amsterdam.

222
References
208
Holguin-Veras, J., Q. Wang, N. Xu, K. Ozbay, M. Cetin, and J. Polimeni (2006). The impacts of time of day pricing on the behavior of freight carriers in a congested urban area: Implications to road pricing. Transportation Research Part A: Policy and Practice, 40 (9), 744-766.
Howgego, T. and M. Roe (1998). The use of pipelines for the urban distribution of goods. Transport Policy, 5 (2), 61-72.
Ieda, H., A. Kimura, and Y. Yin (2001). Why don't multi-carrier joint delivery services in urban areas become popular? Agaming simulation of carriers' behaviour, in E. Taniguchi and R. G. Thompson (eds.), City Logistics II, 155-168, Institute of Systems Science Research, Kyoto.
Involvation (2003). Zicht op Factory Gate Pricing. Involvation, De Bilt. Ishida, H., E. Taniguchi, T. Hyodo, A. Sasaki, H. Ando, and K. Ikeda (2006). Experiment report
transportation demand management experiment in Akihabara 2004, in E. Taniguchi and R. G. Thompson (eds.), Recent advances in city logistics: proceedings of the 4th international conference on city logistics, 389-400, Elsevier, Amsterdam.
Jensen, B. (2000). City distribution in Copenhagen, in M. Ruesch and C. Gluecker (eds.), BESTUFS - Best Practice Handbook 2000, BESTUFS, 1999-TN.10003.
Jonkman, P., E. Taniguchi, and T. Yamada (2006). Evaluation of a freight auction in an urban transport network, in E. Taniguchi and R. G. Thompson (eds.), Recent advances in city logistics: proceedings of the 4th international conference on city logistics, 207-220, Elsevier, Amsterdam.
Just, U. (2000). Recommended Urban Truck Routes - Bremen Approach, in M. Ruesch and C. Gluecker (eds.), BESTUFS - Best Practice Handbook 2000, BESTUFS, 1999-TN.10003.
Kawamura, K. and Y. Lu (2006). Effectiveness and feasibility of innovative freight strategies for the U.S. urban areas, in E. Taniguchi and R. G. Thompson (eds.), Recent advances in city logistics: proceedings of the 4th international conference on city logistics, 269-282, Elsevier, Amsterdam.
Kawamura, K., A. Seetharaman, and S. D. Bhatta (2004). Assessment of the relationship between vehicle type mix and the benefit of freight projects, in E. Taniguchi and R. G. Thompson (eds.), Logistics Systems for Sustainable Cities, proceedings of the 3rd international conference on City Logistics, 53-66, Elsevier, Amsterdam.
Kay, M. G. (2006). Matlog - a logistics engineering MATLAB toolbox. http://www.ise.ncsu.edu/kay/matlog/index.htm.
Keller, S. B., K. Savitskie, T. P. Stank, D. F. Lynch, and A. E. Ellinger (2002). A summary and analysis of multi-item scales used in logistics research. Journal of Business Logistics, 23 (2), 83-281.
Kennedy, C., E. Miller, A. Shalaby, H. Maclean, and J. Coleman (2005). The Four Pillars of Sustainable Urban Transportation. Transport Reviews, 25 (4), 393-414.
Kindervater, G. A. P. and M. W. P. Savelsbergh (1992). Local Search in Physical Distribution Management. Erasmus University, Rotterdam.
Kindervater, G. A. P. and M. W. P. Savelsbergh (1997). Vehicle routing: handling edge exchanges, in E. H. L. Aarts and J. K. Lenstra (eds.), Local search in Combinatorial Optimization, 337-360, Wiley, Chichester.
Kjaersgaard, S. and H. E. Jensen (2004). Sustainable city logistic solutions, in E. Taniguchi and R. G. Thompson (eds.), Logistics Systems for Sustainable Cities, proceedings of the 3rd international conference on City Logistics, 441-448, Elsevier, Amsterdam.
Koehler, U. (1999). City logistics in Kassel, in E. Taniguchi and R. G. Thompson (eds.), City Logistics I, 261-271, Institute of Systems Science Research, Kyoto.
223
References
209
Koehler, U. (2001). City Logistics in Germany, in E. Taniguchi and R. G. Thompson (eds.), City Logistics II, 203-214, Institute of Systems Science Research, Kyoto.
Koehler, U. (2004). New ideas for the city-logistics project in Kassel, in E. Taniguchi and R. G. Thompson (eds.), Logistics Systems for Sustainable Cities, proceedings of the 3rd international conference on City Logistics, 321-332, Elsevier, Amsterdam.
Laporte, G. and F. Semet (2002). Classical heuristics for the capacitated VRP, in P. Toth and D. Vigo (eds.), The vehicle routing problem, 109-128, SIAM Monographs on Discrete Mathematics and Applications, Philadelphia.
Law, A. M. (2006). Simulation Modeling and Analysis. McGrawHill, Boston. Le Blanc, H. M., F. Cruijssen, H. A. Fleuren, and M. B. M. de Koster (2006). Factory gate
pricing: An analysis of the Dutch retail distribution. European Journal of Operational Research, 174 (3), 1950-1967.
Lee, H. L. (2002). Aligning Supply Chain Strategies with Product Uncertainties. California Management Review, 44 (3), 105-119.
Lemstra, W. (2004). Stedelijke distributie: Samen gaan voor resultaat. Ministerie van Verkeer en Waterstaat, Den Haag.
Ljungberg, D. and G. Gebresenbet (2004). Mapping out the potential for coordinated goods distribution in city centres: The case of Uppsala. International Journal of Transport Management, 2 (3-4), 161-172.
Ma, L. (1999). Modelling for traffic-generated environmental pollution analysis, in E. Taniguchi and R. G. Thompson (eds.), City logistics I, 133-147, Institute of Systems Science Research, Kyoto.
Malandraki, C. and M. S. Daskin (1992). Time dependent vehicle routing problems: formulations, properties and heuristic algorithms. Transportation Science, 26 (3), 185-200.
Marmorstein, H., J. Rossomme, and D. Sarel (2003). Unleashing the power of yield management in the Internet era: Opportunities and challenges. California Management Review, 45 (3), 47-167.
Marquez, L., N. Smith, D. Kilsby, M. Taylor, and R. Zito (2004). Assessing impacts of greenhouse gas abatement measures on urban freight, in E. Taniguchi and R. G. Thompson (eds.), Logistics Systems for Sustainable Cities, proceedings of the 3rd international conference on City Logistics, 191-206, Elsevier, Amsterdam.
Marshall, J. D. and M. W. Toffel (2005). Framing the Elusive Concept of Sustainability: A Sustainability Hierarchy. Environmental Science & Technology, 39 (3), 673-682.
May, A. D., A. F. Jopson, and B. Matthews (2003). Research challenges in urban transport policy. Transport Policy, 10 (3), 157-164.
May, A. D. and M. Taylor (2002). KonSULT - developing an international knowledgebase on urban transport policy, in 25th Australian Transport Research Forum, Incorporating the BTRE Transport Policy Colloquium, Canberra, Australia.
McDermott, D. R. (1975). An Alternative Framework for Urban Goods Distribution: Consolidation. Transportation Journal, 15 (1), 29-39.
McDermott, D. R. (1980). Urban Goods Movement: State of the Art and Future Possibilities. Transportation Journal, 20 (2), 34-40.
McKinnon, A. C. (2007). Decoupling of Road Freight Transport and Economic Growth Trends in the UK: An Exploratory Analysis. Transport Reviews, 27 (1), 37-64.
McKinnon, A. C. and Y. Ge (2006). The potential for reducing empty running by trucks: a retrospective analysis. International Journal of Physical Distribution & Logistics Management, 36 (5), 391-410.
McKinnon, A. C., Y. Ge, and D. Leuchars (2003). Analysis of Transport Efficiency in the UK Food Supply Chain. Logistics Research Centre Heriot-Watt University, Edinburgh.
224
References
210
Meredith, J. (1998). Building operations management theory through case and field research. Journal of Operations Management, 16 (4), 441-454.
Meyer, M. D. (2006). Feasibility of a Metropolitan Truck-only Toll Lane Network: The Case of Atlanta, Georgia, in Metrans. National Urban Freight Conference (NUFC), Long Beach, California.
Mizutani, T. (1999). Measures to enhance the efficiency of urban freight transportation in Hiroshima city, in E. Taniguchi and R. G. Thompson (eds.), City Logistics I, 289-301, Institute of Systems Science Research, Kyoto.
Munuzuri, J., J. Larraneta, J. N. Ibanez, and G. Montero (2006). Pilot demonstration of a web-based load zone reservation system, in E. Taniguchi and R. G. Thompson (eds.), Recent advances in city logistics: proceedings of the 4th international conference on city logistics, 401-416, Elsevier, Amsterdam.
Munuzuri, J., J. Larraneta, L. Onieva, and P. Cortes (2005). Solutions applicable by local administrations for urban logistics improvement. Cities, 22 (1), 15-28.
Nemoto, T. (1997). Area-wide inter-carrier consolidation of freight in urban areas. Transport Logistics, 1 (2), 87-101.
Nemoto, T. (2004). An experimental cooperative parcel pick-up system using the Internet in the central business district in Tokyo, in E. Taniguchi and R. G. Thompson (eds.), Logistics Systems for Sustainable Cities, proceedings of the 3rd international conference on City Logistics, 309-320, Elsevier, Amsterdam.
NERA (2000). Report on Lorry Track and Environmental Costs. National Economic Research Associates, AEA Technology and The Transport Research Laboratory, London.
Neuhold, G. (2005). Cargotram (Switzerland), in H. Abel and R. Karrer (eds.), BESTUFS - Best Practice Handbook 2005, BESTUFS II, TREN/04/FP6TR/S07.31723/506384.
Nicolas, J. P., P. Pocheta, and H. Poimboeuf (2003). Towards sustainable mobility indicators: application to the Lyons conurbation. Transport Policy, 10 (3), 197-208.
Odani, M. and T. Tsuji (2001). An experiment to demonstrate the effectiveness of on-street parking facilities for delivery vehicles, in E. Taniguchi and R. G. Thompson (eds.), City Logistics II, 351-366, Institute of Systems Science Research, Kyoto.
OECD (2003). Delivering the goods - 21st century challenges to urban goods transport. OECD working group on urban freight logistics, Paris.
OECD (2007). OECD Territorial Reviews: Randstad Holland, Netherlands. OECD Territorial Development Policy Committee, Paris.
Ogden, K. W. (1984). A framework for urban freight policy analysis. Transportation Planning and Technology, 8 (4), 253-265.
Ogden, K. W. (1992). Urban Goods Movement: A Guide to Policy and Planning. Ashgate, Aldershot.
Ooishi, R. and E. Taniguchi (1999). Effects and profitability of constructing the new underground freight transport system, in E. Taniguchi and R. G. Thompson (eds.), City Logistics I, 303-316, Institute of Systems Science Research, Kyoto.
Paché, G. (1998). Retail logistics in France: The coming of vertical disintegration. International Journal of Logistics Management, 9 (1), 85-93.
Patier, D. (2006). New concept and organisation for the last mile: The French experiments and their results, in E. Taniguchi and R. G. Thompson (eds.), Recent advances in city logistics: proceedings of the 4th international conference on city logistics, 361-374, Elsevier, Amsterdam.
PIEK (2006). Quieter loading and unloading near homes (TLN, KNV and EVO). http://www.piek.org/engels/leaflets_start_eng.htm (accessed on: 2006-04-06).
225
References
211
Poot, A., G. Kant, and A. P. M. Wagelmans (2002). A savings based method for real-life vehicle routing problems. Journal of the Operational Research Society, 53 (1), 57-68.
Potter, A., C. Lalwani, S. Disney, and H. Velho (2003). Modelling the impact of factory gate pricing on transport and logistics, in Proceedings of the 8th International Symposium of Logistics, 625-631, Sevilla.
Potter, A., R. Mason, and C. Lalwani (2007). Analysis of factory gate pricing in the UK grocery supply chain. International Journal of Retail & Distribution Management, 35 (10), 821-834.
PSD (2000). Effectmeting Stedelijke Distributie Amsterdam. Oranjewoud, Deventer. PSD (2001a). PSD-voertuigenmatrix. Platform Stedelijke Distributie, Den Haag. PSD (2001b). Voorstel regionale afstemming venstertijden. Platform Stedelijke Distributie, Den
Haag. PSD (2002a). Medegebruik busbanen voor goederenvervoer in Nederlandse binnensteden.
Platform Stedelijke Distributie, Den Haag. PSD (2002b). Van B naar A. Platform Stedelijke Distributie, Den Haag. Quak, H.J. (2007a). Case Study 3: Theory-testing research: testing a deterministic relation. The
influences of urban time access windows on retailers’ distribution costs, in J. Dul and T. Hak (eds.), Case Study Methodology in Business Research, 142-151, Elsevier, Amsterdam.
Quak, H.J. (2007b). Case Study 4: Theory-testing research: testing a probabilistic relation. The influence of a retailer’s distribution strategy on a retailer’s sensitivity to urban time access windows, in J. Dul and T. Hak (eds.), Case Study Methodology in Business Research, 159-169, Elsevier, Amsterdam.
Quak, H. J. (2008). Distribution strategies in urban areas - An Experiment with Two Dutch Retail Chains, in M. B. M. De Koster and W. Delfmann (eds.), Supply Chain Management – European perspectives (vol. 3) (forthcoming), Helsinki University Press, Helsinki.
Quak, H.J. and M.B.M. de Koster (2006a). Retailer’s distribution and local time window policies, in E. Taniguchi and R. G. Thompson (eds.), Recent advances in city logistics: proceedings of the 4th international conference on city logistics, 463-478, Elsevier, Amsterdam.
Quak, H. J. and M. B. M. De Koster (2006b). The Impacts of Time Windows and Vehicle Weight Restrictions on Food Retailers and the Environment. European Journal of Transport and Infrastructure Research, 6 (2), 131-150.
Quak, H. J. and M. B. M. De Koster (2006c). Urban distribution: the impacts of different governmental time-window schemes, in 9th TRAIL Congress 2006, CD-rom, Rotterdam. (ERS-2006-053-LIS, Erasmus Research Institute of Management).
Quak, H. J. and M. B. M. De Koster (2007a). Exploring retailers' sensitivity to local sustainability policies. Journal of Operations Management, 25 (6), 1103-1122.
Quak, H. J. and M. B. M. De Koster (2007b). Retailer's sensitivity to time-window policies, in M. B. M. De Koster and W. Delfmann (eds.), Managing Supply Chains - Challenges and Opportunities, 227-245, CBS Press, Copenhagen.
Quak, H. J., J. H. R. Van Duin, and J. Visser (2008a). City logistics over the years... Lessons learned, research directions and interests, in E. Taniguchi and R. G. Thompson (eds.), Innovations in City Logistics: proceedings of the 5th international conference on city logistics, (forthcoming), NOVA Science Publisher, New York.
Quak, H. J., J. Van Nunen, and N. Agatz (2008b). Customized policies for sustainable urban distribution, in E. Taniguchi and R. G. Thompson (eds.), Innovations in City Logistics: proceedings of the 5th international conference on city logistics, (forthcoming), NOVA Science Publisher, New York.
226
References
212
Qureshi, A. G. and S. Hanaoka (2006). Analysis of the effects of a cooperative delivery system in Bangkok, in E. Taniguchi and R. G. Thompson (eds.), Recent advances in city logistics: proceedings of the 4th international conference on city logistics, 293-306, Elsevier, Amsterdam.
Randall, T. R., R. M. Morgan, and A. R. Morton (2003). Efficient versus Responsive Supply Chain Choice: An Empirical Examination of Influential Factors. Journal of Product Innovation Management, 20 (6), 430-443.
Rasch, A. (2006). Access restrictions Enschede (Netherlands), in H. Abel and R. Karrer (eds.), BESTUFS - Best Practice Handbook 2006, BESTUFS II,
TREN/04/FP6TR/S07.31723/506384. Razzaque, M. A. and C. C. Sheng (1998). Outsourcing of logistics functions: a literature survey.
International Journal of Physical Distribution & Logistics Management, 28 (2), 89-107. Regan, A. C. and T. F. Golob (2005). Trucking industry demand for urban shared use freight
terminals. Transportation, 32 (1), 23-36. Richardson, B. C. (2005). Sustainable transport: analysis frameworks. Journal of Transport
Geography, 13 (1), 29-39. Rijsenbrij, J. C. (2004). New concepts for city logistics, in E. Taniguchi and R. G. Thompson
(eds.), Logistics Systems for Sustainable Cities, proceedings of the 3rd international conference on City Logistics, 349-364, Elsevier, Amsterdam.
Rijsenbrij, J. C. (2006). Benefits from changes in scale in sustainable city logistics, in E. Taniguchi and R. G. Thompson (eds.), Recent advances in city logistics: proceedings of the 4th international conference on city logistics, 317-330, Elsevier, Amsterdam.
Ruesch, M. (2004). Urban rail and intermodal freight strategies in the Zurich area: A case study from Switzerland, in E. Taniguchi and R. G. Thompson (eds.), Logistics Systems for Sustainable Cities, proceedings of the 3rd international conference on City Logistics, 365-380, Elsevier, Amsterdam.
Russ, B. F., T. Yamada, J. Castro, and T. Ito (2006). Modelling multimodal freight transport: Impacts of network improvement in urban areas on inter-regional freight transport, in E. Taniguchi and R. G. Thompson (eds.), Recent advances in city logistics: proceedings of the 4th international conference on city logistics, 177-190, Elsevier, Amsterdam.
Schoemaker, J. (2002). Stadsdistributiecentrum Leiden, in D. Egger and M. Ruesch (eds.), BESTUFS - Best Practice Handbook 2002, BESTUFS, 1999-TN.10003.
Schreutelkamp, F. H. and G. L. Strang van Hees (2007). Benaderingsformules voor de transformatie tussen RD- en WGS84-kaartcoördinaten. sterrenwacht ‘Sonnenborgh’ te Utrecht, afdeling Geodesie, TU Delft, www.dekoepel.nl/pdf/Transformatieformules.pdf
Sekaran, U. (2003). Research methods for business, a skill-building approach. John Wiley & Sons, Inc., New York.
Smith, W. (1875). A dictionary of Greek and Roman Antiquities. John Murray, London. Stock, J. R. and D. M. Lambert (2001). Strategic Logistics Management. McGraw-Hill, New
York. Strauss, A. and J. Corbin (1998). Basics of qualitative research - techniques and procedures for
developing grounded theory. SAGE Publications, Thousand Oaks. Takahashi, Y. and T. Hyodo (1999). A simulation study on the effect of physical distribution
facilities in Toyo metropolitan region, in E. Taniguchi and R. G. Thompson (eds.), City logistics I, 163-173, Institute of Systems Science Research, Kyoto.
Takahashi, Y., N. G. Sinarimbo, T. Hyodo, and R. Koike (2004). A study on traffic and environmental effects of cooperative delivery system in CBD: case study in Maunouchi area, in WCTR'04, Topic area: B5 Urban Goods Movement, CDrom, Istanbul.

227
References
213
Talluri, K. T. and G. J. Van Ryzin (2004). The Theory and Practice of Revenue Management. Springer, New York.
Taniguchi, E. (2002). Tenjin Joint Distribution System, Fukuoka, in D. Egger and M. Ruesch (eds.), BESTUFS - Best Practice Handbook 2002, BESTUFS, 1999-TN.10003.
Taniguchi, E. and H. Ando (2006). An experimental study on the performance of probabilistic vehicle routing and scheduling, in E. Taniguchi and R. G. Thompson (eds.), Recent advances in city logistics; proceedings of the 4rd international conference on City Logistics, 59-74, Elsevier, Amsterdam.
Taniguchi, E. and K. Hata (2004). An evaluation methodology for urban freight policy measures with effects of e-commerce, in WCTR'04, Topic area: B5 Urban Goods Movement, CDrom, Istanbul.
Taniguchi, E., Y. Kanazaki, M. Yoshii, and S. Nishimura (2001a). Realistic application of ITS based probabilistic vehicle routing and scheduling, in E. Taniguchi and R. G. Thompson (eds.), City Logistics II, 127-139, Institute of Systems Science Research, Kyoto.
Taniguchi, E. and H. Shimamoto (2004). Intelligent transportation system based dynamic vehicle routing and scheduling with variable travel times. Transportation Research Part C: Emerging Technologies, 12 (3-4), 235-250.
Taniguchi, E. and D. Tamagawa (2006). Evaluating toll measures of urban expressway considering the behaviour of several stakeholders associated with urban freight transport, in E. Taniguchi and R. G. Thompson (eds.), Recent advances in city logistics: proceedings of the 4th international conference on city logistics, 221-233, Elsevier, Amsterdam.
Taniguchi, E., R. G. Thompson, and T. Yamada (1999a). Modelling city logistics, in E. Taniguchi and R. G. Thompson (eds.), City logistics I, 3-37, Institute of Systems Science Research, Kyoto.
Taniguchi, E., R. G. Thompson, and T. Yamada (2003). Predicting the effects of city logistics. Transport Reviews, 23 (4), 489-515.
Taniguchi, E., R. G. Thompson, and T. Yamada (2004). Visions for city logistics, in E. Taniguchi and R. G. Thompson (eds.), Logistics Systems for Sustainable Cities, proceedings of the 3rd international conference on City Logistics, 1-16, Elsevier, Amsterdam.
Taniguchi, E., R. G. Thompson, T. Yamada, and R. Van Duin (2001b). City logistics: network modelling and intelligent transport systems. Pergamon, Oxford.
Taniguchi, E. and R. E. C. M. Van der Heijden (2000). An evaluation methodology for city logistics. Transport Reviews, 20 (1), 65-90.
Taniguchi, E., T. Yamada, and D. Tamagawa (1999b). Probabilistic vehicle routing and scheduling on variable travel times with dynamic traffic simulation, in E. Taniguchi and R. G. Thompson (eds.), City logistics I, 85-99, Institute of Systems Science Research, Kyoto.
Taniguchi, E., T. Yamada, and M. Tamaishi (2001c). Dynamic vehicle routing and scheduling with real time information, in E. Taniguchi and R. G. Thompson (eds.), City Logistics II, 111-126, Institute of Systems Science Research, Kyoto.
Tapio, P. (2005). Towards a theory of decoupling: degrees of decoupling in the EU and the case of road traffic in Finland between 1970 and 2001. Transport Policy, 12 (2), 137-151.
Tarantilis, C. D., C. T. Kiranoudis, and V. S. Vassiliadis (2004). A threshold accepting metaheuristic for the heterogeneous fixed fleet vehicle routing problem. European Journal of Operational Research, 152 (1), 148-158.
Taylor, M. A. P., R. Zito, N. Smith, and G. M. D’Este (2005). Modelling the impacts of transport policies to reduce greenhouse gas emissions from urban freight transport in Sydney. Journal of the Eastern Asia Society for Transportation Studies, 6, 3135 - 3150.
228
References
214
Thompson, R. G. (2004). Intelligent vehicle routing and scheduling, in E. Taniguchi and R. G. Thompson (eds.), Logistics Systems for Sustainable Cities, proceedings of the 3rd international conference on City Logistics, 97-110, Elsevier, Amsterdam.
Thompson, R. G. and K. Hassall (2006). A methodology for evaluating urban freight projects, in E. Taniguchi and R. G. Thompson (eds.), Recent advances in city logistics: proceedings of the 4th international conference on city logistics, 283-292, Elsevier, Amsterdam.
Thompson, R. G. and E. Taniguchi (1999). Routing of commercial vehicles using stochastic programming, in E. Taniguchi and R. G. Thompson (eds.), City logistics I, 73-83, Institute of Systems Science Research, Kyoto.
Valentini, M. P., P. Lacquaniti, and G. Valenti (2001). Methodology and results of a study on logistic schemes in Siena, in E. Taniguchi and R. G. Thompson (eds.), City Logistics II, 185-200, Institute of Systems Science Research, Kyoto.
Van Binsbergen, A., R. Konings, and T. Klein Breteler (1999). Load-units for urban freight distribution, in E. Taniguchi and R. G. Thompson (eds.), City Logistics I, 273-287, Institute of Systems Science Research, Kyoto.
Van Binsbergen, A. and J. Visser (2001). Innovation steps towards efficient goods distribution systems for urban areas. Ph.D. thesis, DUP Science, Delft.
Van der Gon, H. A. C. (2006). Personal communication (March 21 2006). Van der Kind, R. P. (2000). Retailmarketing. EPN, Houten. Van der Meer, T. (2003). Chaos stadsdistributie is moeilijk oplosbaar. LogistiekKrant,
September 5, 2003. Van der Meer, T. (2006). Vrachttram Den Haag van de baan. LogistiekKrant, July 7, 2006. Van der Poel, W. (2000). Leyden Car(e) Free, an integral approach to a better environment in
an old city centre. Gemeente Leiden, Leiden. Van der Vlist, P. (2004). Supply chain synchronization - retailing beyond ECR. Deloitte,
Amsterdam. Van der Vlist, P. (2007). Synchronizing the retail supply chain. Ph.D. thesis, ERIM, Rotterdam. Van Duin, J.H.R. and H.J. Quak (2007). City logistics: a chaos between research and policy
making? A review, in: C.A. Brebbia and V. Dolezel (eds.), Urban Transport XIII - Urban Transport and the Environment in the 21st Century, 135-146, WIT Press, Southampton.
Van Duin, J. H. R. and J. C. Kneyber (2004). Towards a matching system for the auction of transport orders, in E. Taniguchi and R. G. Thompson (eds.), Logistics Systems for Sustainable Cities, proceedings of the 3rd international conference on City Logistics, 163-178, Elsevier, Amsterdam.
Van Duin, R. and H. Van Ham (2001). Intermodal transportation for short distances - chances for a waste collection system?, in E. Taniguchi and R. G. Thompson (eds.), City Logistics II, 69-81, Institute of Systems Science Research, Kyoto.
Van Goor, A. R., M. J. Ploos van Amstel, and W. Ploos van Amstel (1996). Fysieke distributie. Stenfert Kroese, Houten.
Van Goor, A. R., M. J. Ploos van Amstel, and W. Ploos van Amstel (2003). European distribution and supply chain logistics. Stenfert Kroese, Groningen.
Verkeersinformatiedienst (2003). File top 50 http://www.verkeersinformatiedienst.nl/top50.html.
Verkeersinformatiedienst (2004). File top 50. http://www.verkeersinformatiedienst.nl/top50.html.
Versteegt, C., A. Verbreack, and S. Geerdes (2001). Simulation as a supporting tool for multidisciplinary design of underground freight transport systems, in E. Taniguchi and R. G. Thompson (eds.), City Logistics II, 83-97, Institute of Systems Science Research, Kyoto.

229
References
215
Visser, J. (2001). Underground logistics systems for goods distribution in urban areas: perspectives in the Netherlands, in E. Taniguchi and R. G. Thompson (eds.), City Logistics II, 287-302, Institute of Systems Science Research, Kyoto.
Visser, J. and A. Van Binsbergen (1999). Urban freight transport policy and the role of modelling, in E. Taniguchi and R. G. Thompson (eds.), City Logistics I, 187-202, Institute of Systems Science Research, Kyoto.
Visser, J., A. Van Binsbergen, and T. Nemoto (1999). Urban freight transport policy and planning, in E. Taniguchi and R. G. Thompson (eds.), City logistics I, 39-69, Institute of Systems Science Research, Kyoto.
Vleugel, J. M. and M. Janic (2004). Route choice and the impact of 'logistics routes', in E. Taniguchi and R. G. Thompson (eds.), Logistics Systems for Sustainable Cities, proceedings of the 3rd international conference on City Logistics, 221-234, Elsevier, Amsterdam.
Vos, S., H. Fleuren, M. Van den Boogaart, and M. B. M. De Koster (2004). De gevolgen en haalbaarheid van Factory Gate Pricing in Nederland, in J. P. Duijker, M. B. M. De Koster, and M. J. Ploos van Amstel (eds.), Praktijkboek Magazijnen en Distributiecentra, 1.6. I -01, 1-26, Kluwer, Deventer.
Voss, C., N. Tsikriktsis, and M. Frohlich (2002). Case research in operations management. International Journal of Operations and Production Management, 22 (2), 195-219.
Waller, A. G. (1995). Computer systems for distribution planning International Journal of Physical Distribution & Logistics Management, 25 (4), 35-45.
Wang, J. Y. and S. W. Chu (2001). Planning public freight terminals in the Taipei Metropolitan are, in E. Taniguchi and R. G. Thompson (eds.), City Logistics II, 405-419, Institute of Systems Science Research, Kyoto.
Watkiss, P., J. Allen, S. Anderson, S. Beevers, M. Browne, D. Carslaw, P. Emerson, P. Fairclough, J. Francsics, D. Freeman, H. Haydock, S. Hidri, G. Hitchcock, T. Parker, S. Pye, A. Smith, R. Ye, and T. Young (2003). The London Low Emission Zone Feasibility Study. AEA Technology Environment, London.
Wild, D. and C. Gluecker (2006). Keeping of delivery time windows by considering actual and expected traffic situations in transport planning, in E. Taniguchi and R. G. Thompson (eds.), Recent advances in city logistics: proceedings of the 4th international conference on city logistics, 133-146, Elsevier, Amsterdam.
Woudsma, C. (2001). Understanding the Movement of Goods, Not People: Issues, Evidence and Potential. Urban Studies, 38 (13), 2439-2455.
Yamada, T. and E. Taniguchi (2004). Modelling the effects of urban co-operative freight transport, in WCTR'04, Topic area: B5 Urban Goods Movement, CDrom, Istanbul.
Yamada, T. and E. Taniguchi (2006). Modelling the effects of city logistics schemes, in E. Taniguchi and R. G. Thompson (eds.), Recent advances in city logistics; proceedings of the 4rd international conference on City Logistics, 75-90, Elsevier, Amsterdam.
Yamada, T., E. Taniguchi, and Y. Itoh (2001). Co-operative vehicle routing model with optimal location of logistics terminals, in E. Taniguchi and R. G. Thompson (eds.), City Logistics II, 139-155, Institute of Systems Science Research, Kyoto.
Yamada, T., E. Taniguchi, M. Noritake, and A. Horie (1999). Attitudes of companies towards introducing co-operative freight transport systems, in E. Taniguchi and R. G. Thompson (eds.), City Logistics I, 219-232, Institute of Systems Science Research, Kyoto.
Yamada, T., Y. Yoshimura, and K. Mori (2004). Road network reliability analysis using vehicle routing and scheduling procedures, in E. Taniguchi and R. G. Thompson (eds.), Logistics Systems for Sustainable Cities, proceedings of the 3rd international conference on City Logistics, 111-122, Elsevier, Amsterdam.

230
References
216
Yin, R. K. (2003). Case study research; design and methods. SAGE Publications, Thousand Oaks.
Yoshimoto, R. (2004). Web-based transport exchange systems in Japan and its implications to traffic volume, in E. Taniguchi and R. G. Thompson (eds.), Logistics Systems for Sustainable Cities, proceedings of the 3rd international conference on City Logistics, 421-430, Elsevier, Amsterdam.
231
217
Summary
Chapter 1 Introduction In the first chapter we discuss the research questions, the contributions, and the relevance of the research carried out and reported in this thesis. Urban freight transport is essential for the functioning of our modern urban civilisation. However, the unsustainable impacts seem to have the upper hand in people’s perception of urban freight transport, since it has negative impacts on all three sustainability issues; environmental, economical, and social sustainability, i.e. the sustainability triple-bottom-line. To reduce the unsustainable impacts of urban freight transport many local governments develop policies. However, these regulations often focus more on banning or at least restricting urban freight transport than on contributing to making it more sustainable. The majority of Dutch stores in the city centres are part of a retail chain. Therefore, especially retail chains are confronted with difficulties in supplying their stores in urban areas due to restricting policy measures. PART I URBAN FREIGHT TRANSPORT SUSTAINABILITY INITIATIVES Chapter 2 A framework and classification for urban freight transport sustainability issues In chapter 2 we develop a framework for urban freight transport. First, we identify the basic dimensions of urban freight transport, we provide a classification per dimension, and explain the relations between the dimensions. Next, we use this framework to structure the urban freight transport field. We developed the framework based on several data sources. A selective review of literature on urban freight transport and city logistics provided us with the initial basic dimensions. These dimensions were accentuated and improved by the knowledge and experience acquired in the field during the Ph.D. trajectory, the UFTS (urban freight transport sustainability) initiatives that we reviewed using the framework, and discussions regarding the framework with experts in the field. We selected 106 UFTS initiatives based on a keyword search in electronic databases, consultation of experts, and by using proceedings of scientific conferences. The basic dimensions in the framework for urban freight transport are subdivided across three phases of the initiative. The design phase consists of four basic dimensions: • The initiative’s description and the type of initiative, i.e. what initiative. • The main objective of the initiative, what sustainability level and what sustainability
type are the goal of the initiative, i.e. why (sustainability). • Who are the main actors involved in the initiative, i.e. who (actors involved). • Why are these actors involved, how are they involved and why, i.e. why (reason
involvement). The following phase, the execution phase, includes two basic dimensions:

232
Summary
218
• What is the context in which the initiative takes place, i.e. where (geographical elements).
• What are the actual transport operations that are the core of urban freight transport, i.e. what (transport characteristics).
And the final phase, the evaluation phase, contains also two basic dimensions: • What methods are used to evaluate the initiative, i.e. how (evaluation). • What are the critical success factors and the barriers, i.e. what results. Based on the framework and the 106 UFTS initiatives we structure the urban freight transport field. First we divide the initiatives in two classes: (A) initiatives aimed at improving sustainability by making improvements within the context, and (B) initiatives aimed at improving sustainability by changing the urban freight transport context. Both classes contain two categories; (A1) policy initiatives, (A2) company driven initiatives, (B1) physical infrastructure initiatives, and (B2) transport reorganising initiatives. The categories are further divided into twelve initiative types. Chapter 3 Improving sustainability: a review of initiatives This chapter provides a review of 106 urban freight transport sustainability initiatives. We extracted a total of twelve initiative types, based on a literature study: In category A1 – policy initiatives: o Road pricing initiatives focus on all traffic. Two successfully implemented initiatives
led to an increase in the transport system efficiency. Urban freight transport operations are affected, but are not always changed. Mainly positive sustainability results are reported.
o Licensing and regulation initiatives include vehicle restrictions, vehicle load factor controls, low emission zones, time-windows that restrict urban freight transport for social or environmental sustainability reasons, and dedicated infrastructure initiatives. These initiatives are usually very local and are not harmonised with other cities. Enforcement is a necessity to oblige obedience. Many of these initiatives are implemented or are about to be implemented in practice. The sustainability results vary.
o Parking and unloading initiatives are usually easy to implement in practice. Enforcement of parking regulations is important. Although the impacts are limited, only positive sustainability results are reported.
In category A2 – company driven initiatives: o Carrier cooperation initiatives are usually either theoretically or unsuccessfully
implemented in practice. Carriers lack a real incentive to cooperate with competitors or to incur extra costs due to communications and transfers. This initiative type shows mainly positive sustainability results, although logistics cost may rise.
o The vehicle routing improvement initiatives found in this literature review are usually not tested in practice. They are easy to implement and have positive impacts on sustainability indicators.
233
Summary
219
o Technological vehicle innovation initiatives are not often reported in literature, however two reported initiatives are implemented in practice. These initiatives have positive environmental sustainability impacts. This initiative type does not considerably change urban freight operations, but makes them more sustainable.
In category B1 – physical infrastructure initiatives: o Consolidation centre initiatives exist both theoretically as well as in practice. The
number of carriers using a city consolidation centre in practice is, however, limited. Initiatives seem only to be successfully implemented with governmental subsidies. Results vary between positive and negative sustainability impacts.
o Underground logistics system initiatives do not exist in reality. These initiatives have huge initial costs, but could have high positive sustainability impacts.
o The reported road infrastructure development initiatives are not implemented in practice. These initiatives could have positive sustainability impacts.
o Standardisation of load-units initiatives are usually not implemented in practice and make sense only if used on large scale, i.e. positive sustainability impacts. The difficulty is not to develop a load-unit, but to make it a standard.
And in category B2 – transport reorganising initiatives: o Transport auction initiatives show possibilities in increasing sustainability by reducing
transport, but are not implemented in practice on a large scale. o Intermodal transport initiatives contain different types, e.g. the cargotram, shipping and
rail transport are examined. The initiatives implemented in practice show that under special circumstances intermodal transport can be sustainable, profitable, and feasible in urban areas.
The relation between the initiators, the incentives and the main actors is the most important in explaining the degree to which initiatives are successfully implemented in practice. If the main actor is not the initiator, an initiative can only be successful if this main actor is actively involved, implying a real incentive, or obliged by legislation to be active. Local authorities’ knowledge of carriers’ logistical operations appears to be inadequate, whereas carriers only know little about local authorities’ sustainability issues. Next, there is little interaction between the local authorities and the carriers, which prevents these actors from obtaining insights into each others problems. Two actor-groups that could increase this interaction, i.e. higher governments and receivers, are hardly involved in urban freight transport sustainability initiatives. An initiative is doomed to fail if the initiator is not able, e.g. does not possess enough knowledge, to realise the implications of an initiative outside its self-defined (narrow-bounded) action area of the initiative. In many initiatives a real incentive for the actors that will have to change their behaviour is lacking. Observing the urban freight transport field we can state that there is a gap between academic research and practice.
234
Summary
220
PART II DEALING WITH LOCAL SUSTAINABILITY POLICIES: THE IMPACTS, SENSITIVITY, AND OPPORTUNITIES Chapter 4 Impacts of local authorities’ time-window policies In this chapter we examine the impacts of local authorities’ time-window policies on retailers’ operations, financial, and environmental performance. First, we examine time-window policies in the Netherlands based on information from 33 policy-making officials across different Dutch municipalities. Time-windows are mainly used to ban delivering trucks from city centres in order to increase the attractiveness of the city centres and the quality of life in the cities. Time-windows are believed to have positive social sustainability impacts, but this is not measured. Next, we discuss the theoretical foundation and construct development. Basically, the logistical concept, containing the supply chain strategy, the network structure, and the logistical planning, determines the distribution performance, which consists of operational, financial and environmental performance. This relation is affected by the time-window pressure. This construct consists of two dimensions: number of time-window restricted areas and the time-window length. We selected 14 cases for a multiple case study, based on Dutch retail chains that are affected by time-window policies, from four lines of industry, i.e. one drug store retail chain, four department store retail chains, five fashion retail chains, and four food retail chains. With SHORTREC we calculated realistic vehicle roundtrips for all cases for six main scenarios. Scenario 0 is the base scenario in which no time-window regulations exist. In scenario 1 we varied the time-window pressure in 18 sub scenarios, whereas the other scenarios reflect a single time-window policy scheme. Scenario 2 contains the current time-window restrictions. In scenario 3 time-windows are harmonised based on city-size. In scenario 4 time-windows allow only freight traffic in the off-peak (night) period. Scenario 5 examines the reference model’s time-window scheme proposed by the Dutch committee for urban distribution. Time-window regulations increase both local and global pollution and increase retailers’ costs as well. Increasing time-window pressure leads to a more than proportionally growth of both environmental burden and retailers’ costs. Obviously, relaxation of the time-window pressure has the opposite impact. The current time-window policy scheme performs badly. Harmonisation of time-windows would reduce the negative impacts, but for some cities this also implies stricter time-windows, which reduces the social sustainability in these cities. Time-windows during the night increase costs and emissions, mainly due to the extra time drivers need to unload their vehicles alone. The proposed time-window scheme in the reference model, with the lowest time-window pressure, performs best on all three sustainability issues; i.e. people, planet, and profit. Chapter 5 Retailers’ sensitivity to local sustainability policies This chapter builds on chapter 4; we find that different retailers are affected differently by time-window restrictions. However, the cause of these differences is still unknown. Based on a cross-case analysis for the different dimensions of the retailers’ logistical concept we examine the factors that determine the retailer’s cost sensitivity to time-windows. Next, we adjust the research model slightly to examine how retailers could decrease their sensitivity

235
Summary
221
to time-windows and vehicle restrictions in an experiment. The relation between the logistical concept and the distribution performance is influenced by urban policy, including time-windows and vehicle restrictions, and we include two control variables: weekly volume and geographical store dispersion. We select two cases, one fashion retailer and one department store retailer so that they differ in their drop size, for which we calculate their distribution performance. We vary the independent and intervening variables in 192 scenarios based on a fractional factorial design. The two cases are affected differently by time-windows and vehicle restrictions. The way to cope with these restrictions is similar for the cases, but their most efficient way of organising the distribution is slightly different. We found two dimensions that explain these differences; (1) the planned load factor, i.e. the constraint that limits the vehicle roundtrip, either capacity or time, and (2) the drop size and the related number of deliveries combined in one vehicle roundtrip, i.e. varying from FTL to LTL. Based on the results of the experiment we propose the following three propositions: 1. Time-windows have a larger cost impact on retailers that combine many deliveries in
one roundtrip than on retailers combining few deliveries in one roundtrip. 2. Vehicle restrictions have a larger cost impact on retailers whose roundtrips are limited
by the capacity of the vehicle (high load factor) than on retailers whose roundtrips are constrained by other than capacity constraints.
3. It is more cost-efficient for retailers whose roundtrips are limited by non-capacity constraints to increase the period to supply the stores than for retailers whose roundtrips are constrained by the capacity of the vehicle.
We test these propositions as well as the other results from the experiment with a third case, a drug store retail chain. The retailer’s cost sensitivity to time-windows is lowest if it uses the time-window period as efficiently as possible. Lowering the delivery frequency would reduce costs most for retailers, as well as the environmental burden. From the experiment we learned that the cost-efficient decisions a retailer can take in its logistical concept are also better for the environment. Time-windows and vehicle restrictions together seem not to influence a retailer’s performance more than the policy measures do individually. Chapter 6 Factory gate pricing opportunities due to time-window restrictions Time-window regulations result in a decrease in vehicle utilisation during the day for a retailer and a decrease of the vehicle load factor. In this chapter we examine the possibilities for a retailer to overcome these problems and increase the sustainability of its transport at the same time. We examine the opportunities if a retailer combines the secondary distribution, the deliveries from the retailer’s DC to the stores, with the primary distribution, the deliveries from the suppliers to the retailer’s DC, i.e. factory gate pricing (FGP). FGP implies that the retailer is responsible for the organisation and optimisation of all transport from the suppliers to the stores for an ex-works price of the products at the supplier. We examine the opportunities based on two retail chains, a drug store retail chain and a department store retail chain. The last one forms three cases; one for its fashion goods, one for the current distribution structure in which non-fashion good suppliers have to deliver the products to the functional DC, even if this DC is located far away, and a
236
Summary
222
proposed distribution structure in which all stores are supplied from and all suppliers’ products are brought to the closest located DC for non-fashion products. For these four cases we varied the time-window policy scheme, either the current policy regime or no time-window restrictions, and the responsibility for the primary distribution, either the suppliers are responsible or the retailer is, in four scenarios. We use a Matlab toolbox, called Matlog, to plan realistic vehicle routes, in order to estimate performance for the secondary distribution and for the scenario in which the retailer is responsible for the combined primary and secondary distribution. For the scenarios in which the suppliers are responsible for the primary distribution, we estimate the total travelled distance by three regression models based on the volume, the supplier density, and the distance between the supplier and the retailer’s DC. Including primary distribution pick ups in the retailer’s secondary distribution increases both travel time and distance for the retailer. However, this increase is limited; besides the total number of travelled vehicle kilometres decreases considerably. This definitely results in a substantial decrease in pollutant emissions and in making the retailer’s operations more sustainable. In the case that a retailer has several distribution centres, the decrease can be even more if the pick ups from the supplier are transported to the closest distribution centre from where they are transhipped in FTL-trips between the distribution centres. Finally, backhauling is a good opportunity for retailers to improve the vehicle utilisation during the day if this is low due to governmental time-window restrictions. Next, it reduces the number of empty kilometres and, if the factory gate price is sufficiently lower than the current price for the goods, it could also reduce the retailer’s costs. Because of these time-window restrictions, the retailer needs only a limited number of extra vehicles to include primary transport in its secondary transport activities. Chapter 7 Concluding remarks In this concluding chapter we discuss the findings, contributions, and limitations of this thesis. In this summary we talk about only one idea that was dealt with in the section on recommendations for further research – customising policies for sustainable urban distribution. The idea is based on an industry practice, revenue management. Revenue management is the practice of managing demand in a manner that increases profitability. The key idea is customising the product offering to exploit the market’s heterogeneity. In this chapter we discuss how future research could answer whether it is possible to find a better urban freight transport solution for the sustainability triple-bottom-line (i.e. environmental, social, and economical sustainability) by developing a set of standard and customised regulations. We briefly go into the implications of more customised time-window policies for the different stakeholders.

237
223
Samenvatting (summary in Dutch)
Hoofdstuk 1 Inleiding In het eerste hoofdstuk bespreken we de onderzoeksvragen, de bijdragen en de relevantie van dit promotieonderzoek. Stedelijke distributie is essentieel voor het functioneren van onze moderne stedelijke samenleving. Toch heeft stedelijke distributie in de beleving van de bevolking vooral een negatieve invloed op de kwaliteit van de leefomgeving. Stedelijke distributie heeft een negatief effect op de drie kenmerken van duurzame ontwikkeling; namelijk op het gebied van milieu, economie en maatschappij. Veel vooral lokale overheden ontwikkelen beleid om de niet-duurzame effecten van stedelijke distributie te verminderen. Over het algemeen richt dit beleid zich meer op het verbieden of het verminderen van stedelijke distributie dan op het ontwikkelen van duurzaam stedelijk goederenvervoer. De meerderheid van Nederlandse winkels in stadscentra maakt deel uit van grote detailhandelsketens. Vooral deze ketens worden bij de belevering van winkels in stedelijke gebieden geconfronteerd met (beperkende) beleidsmaatregelen. DEEL I INITIATIEVEN VOOR DUURZAME STEDELIJKE DISTRIBUTIE Hoofdstuk 2 Een raamwerk en classificering voor duurzaamheidsvraagstukken binnen
stedelijke distributie In dit hoofdstuk ontwikkelen we een raamwerk voor stedelijke distributie. We benoemen de basisdimensies van stedelijke distributie, verstrekken een classificering per basisdimensie en verklaren de relaties tussen de basisdimensies. Het raamwerk is ontwikkeld op basis van verschillende gegevensbronnen. Een selectief overzicht van literatuur op het gebied van stedelijk goederenvervoer en logistiek heeft ons van de initiële basisdimensies voorzien. Deze dimensies zijn verbeterd en herzien op basis van de verworven kennis, de opgedane ervaring tijdens dit promotietraject, initiatieven voor duurzame stedelijke distributie (DSD initiatieven) uit de literatuur en discussies met deskundigen. Op basis van een onderzoek op trefwoorden in elektronische databases en door deskundigen te raadplegen hebben we 106 DSD initiatieven geselecteerd. De basisdimensies in het raamwerk worden onderverdeeld in drie initiatieffasen: de ontwerpfase, de uitvoeringsfase en de evaluatiefase. De ontwerpfase bestaat uit vier basisdimensies: − De beschrijving en het type van het initiatief; welk initiatief. − De belangrijkste doelstelling van het initiatief, welk duurzaamheidsniveau en welk
duurzaamheidstype worden nagestreefd met het initiatief; waarom (duurzaamheid). − De belangrijkste actoren die betrokken zijn bij het initiatief; wie (actoren in kwestie). − De reden van de betrokkenheid van deze actoren, hoe ze zijn betrokken en waarom;
waarom (reden betrokkenheid). De volgende fase, de uitvoeringsfase, bestaat uit twee basisdimensies:

238
Samenvatting (summary in Dutch)
224
− De context waarin het initiatief plaatsvindt; waar (geografische elementen). − De daadwerkelijke vervoerverrichtingen, de kern van stedelijke distributie; wat
(vervoerkenmerken). En de eindfase, de evaluatiefase, bestaat ook uit twee basisdimensies: − Methodes die worden gebruikt om het initiatief te evalueren; hoe (evaluatie). − De kritieke succes- en faalfactoren; welke resultaten. We structureren het veld van stedelijke distributie op basis van het raamwerk en de 106 DSD initiatieven. Eerst verdelen we de initiatieven in twee klassen; (A) initiatieven die als doel hebben de duurzaamheid te verhogen door verbeteringen binnen de context en (B) initiatieven die als doel hebben de duurzaamheid te verhogen door de context waarin stedelijke distributie plaatsvindt te veranderen. Beide klassen bevatten twee categorieën; (A1) beleidsinitiatieven, (A2) bedrijfsgedreven initiatieven, (B1) initiatieven op het gebied van fysieke infrastructuur en (B2) initiatieven die vervoer anders organiseren. De categorieën zijn verdeeld in twaalf initiatieftypen, die we in hoofdstuk 3 gebruiken. Hoofdstuk 3 Het verbeteren van duurzaamheid: een overzicht van initiatieven In dit hoofdstuk bespreken we 106 DSD initiatieven, gegroepeerd in 12 initiatieftypen: Categorie A1 - beleidsinitiatieven: − Initiatieven met betrekking tot het beprijzen van wegen. Twee met succes uitgevoerde
initiatieven leiden tot een verhoging van de efficiëntie van het vervoersysteem. Dit type initiatief verandert niet altijd iets in het stedelijke goederenvervoer door gebrek aan alternatieven. De resultaten op het gebied van duurzaamheid zijn hoofdzakelijk positief.
− Initiatieven met betrekking tot vergunningen en regelgeving bevatten voertuig-beperkingen, vereisten aan de beladingsgraad van voertuigen, milieuzones en venstertijden. Al deze initiatieven beperken stedelijke distributie met het doel de leefbaarheid of het milieu te verbeteren in de steden. Daarnaast bevat dit type specifieke infrastructuur-initiatieven. De initiatieven hebben gemeenschappelijk dat zij doorgaans zeer lokaal zijn en niet zijn afgestemd met andere steden. Veel van deze initiatieven worden al uitgevoerd in de praktijk of staan op het punt te worden uitgevoerd. De resultaten op het gebied van duurzaamheid variëren.
− Initiatieven met betrekking tot regulering van parkeren en uitladen van wagens zijn in de praktijk doorgaans eenvoudig te implementeren. Het is wel van belang de parkeerregels te handhaven. Hoewel de effecten van regulering beperkt zijn, worden alleen positieve resultaten op het gebied van duurzaamheid gemeld.
In categorie A2 - bedrijfsgedreven initiatieven: − Initiatieven met betrekking tot samenwerking tussen vervoerders zijn in de regel
theoretisch en niet succesvol in de praktijk. Een echte stimulans voor de vervoerders om zich over problemen heen te zetten die kunnen ontstaan door samen te werken met concurrenten ontbreekt. Dit initiatieftype toont hoofdzakelijk positieve resultaten op het gebied van duurzaamheid, hoewel de logistieke kosten kunnen toenemen.

239
Samenvatting (summary in Dutch)
225
− Initiatieven met betrekking tot het verbeteren van de routes van voertuigen komen vooral voor in de literatuur en worden meestal niet in de praktijk gebracht. Ze zijn gemakkelijk te implementeren en hebben positieve effecten op duurzaamheid.
− Initiatieven met betrekking tot technologische voertuiginnovatie worden niet vaak beschreven in de literatuur. De twee gevonden initiatieven die in de praktijk zijn geïmplementeerd hebben positieve invloed op het milieu. Dit initiatieftype verandert stedelijke goederenvervoer niet, maar maakt het wel duurzamer.
In categorie B1 - initiatieven op het gebied van fysieke infrastructuur: − Initiatieven met betrekking tot consolidatie centra komen zowel in theorie als in praktijk
voor. In de praktijk is het aantal vervoerders dat een stedelijk consolidatie centrum gebruikt beperkt. Dit type initiatief is meestal alleen succesvol als er overheidssubsidies beschikbaar zijn. De resultaten op het gebied van duurzaamheid verschillen.
− Initiatieven met betrekking tot ondergrondse logistieke systemen bestaan niet in de praktijk. Deze initiatieven hebben enorme initiële kosten, maar kunnen tegelijkertijd een enorme positieve invloed hebben op duurzaamheid.
− Initiatieven met betrekking tot de ontwikkeling van weginfrastructuur die we hebben gevonden in de literatuur zijn niet in de praktijk uitgevoerd. De gevonden theoretische initiatieven hebben positieve resultaten op het gebied van duurzaamheid.
− Initiatieven met betrekking tot standaardisatie van laadeenheden worden doorgaans niet uitgevoerd. Dergelijke initiatieven zijn alleen zinvol als de standaardisatie op grote schaal wordt doorgevoerd. De moeilijkheid is niet zo zeer om een laadeenheid te ontwerpen, maar wel om deze in de praktijk tot standaard te ontwikkelen.
En in categorie B2 - initiatieven die vervoer anders organiseren: − Initiatieven met betrekking tot het veilen van het vervoer tonen de mogelijkheid om
duurzaamheid te verbeteren doordat de hoeveelheid vervoer vermindert. Dergelijke initiatieven zijn in de praktijk niet op grote schaal uitgevoerd.
− Initiatieven met betrekking tot intermodaal vervoer bevatten verschillende typen, bijvoorbeeld de cargotram, het gebruik van schepen en goederentreinen. De uitgevoerde initiatieven tonen in de praktijk aan dat intermodaal vervoer in stedelijke gebieden onder bijzondere omstandigheden duurzaam, voordelig en uitvoerbaar kan zijn.
De relatie tussen de initiatiefnemers, de stimulans om te participeren in initiatieven en de belangrijkste actoren verklaart de mate van succes van de initiatieven in de praktijk. Als de initiatiefnemer niet de belangrijkste actor is, kan een initiatief alleen succesvol in de praktijk worden uitgevoerd als er een voordeel te behalen is voor de actor die verondersteld wordt zijn gedrag te wijzigen. Een andere optie is deze actor wettelijk te dwingen zich aan te passen. Bij lokale overheden is de kennis van de logistieke operaties van vervoerders beperkt. Dit geldt overigens ook voor de kennis van de vervoerders met betrekking tot duurzaamheidskwesties in steden. Bovendien is er nauwelijks communicatie over en weer tussen vervoerders en lokale overheden, waardoor deze publieke en private actoren ook weinig inzicht krijgen in elkaars problemen. Een initiatief is gedoemd te mislukken als de initiatiefnemer de consequenties van een initiatief buiten het door hem begrensde actiegebied van een initiatief niet kan inschatten. Hogere overheden zijn nauwelijks
240
Samenvatting (summary in Dutch)
226
betrokken bij DSD initiatieven. De initiatieven die in academische literatuur worden beschreven zijn in de praktijk niet altijd even succesvol. DEEL II LOKALE BELEIDSMAATREGELEN OP HET GEBIED VAN DUURZAAMHEID: DE EFFECTEN, DE GEVOELIGHEID EN DE KANSEN Hoofdstuk 4 Effecten van het venstertijd-beleid van gemeenten In dit hoofdstuk onderzoeken we de effecten van het venstertijd-beleid van gemeenten op de operationele, de financiële en de milieuprestaties van detailhandelsketens. We hebben het Nederlandse venstertijd-beleid onderzocht op basis van informatie van 33 beleids-ambtenaren uit verschillende Nederlandse gemeenten. Venstertijden worden hoofdzakelijk gebruikt om vrachtwagens uit stadscentra te weren, de aantrekkelijkheid van deze centra te vergroten en de leefkwaliteit in steden te verhogen. Verwacht wordt dat venstertijden een positieve invloed hebben op sociale duurzaamheid, maar dit wordt niet gemeten. Dit geldt ook voor de negatieve effecten op de economische duurzaamheid en het milieu. Daarna bespreken we de theoretische basis en de conceptontwikkeling. Deze worden ook in hoofdstuk 5 gebruikt. Het logistieke concept omvat de logistieke planning, de supply chain strategie en de netwerkstructuur. Dit concept bepaalt de operationele, financiële en milieutechnische distributieprestaties van detailhandelsketens. De venstertijddruk heeft invloed op de relatie tussen het logistieke concept en de prestaties. Twee dimensies bepalen de venstertijddruk: het aantal venstertijd-gebieden en de lengte van de venstertijden. We hebben 14 cases geselecteerd voor een geval studie gebaseerd op Nederlandse detailhandelsketens; 1 drogisterijketen, 4 warenhuisketens, 5 modeketens en 4 supermarktketens. De cases worden verschillend beïnvloed door de venstertijddruk. Met SHORTREC hebben we voor alle cases realistische voertuigroutes berekend, in zes scenario’s. In scenario 1 varieerden we de venstertijddruk in 18 subscenario’s. De andere scenario’s behandelen één venstertijdregeling; scenario 0 is het basisscenario waarin geen venstertijd-beperkingen bestaan. Scenario 2 bevat de huidige venstertijd-beperkingen en in scenario 3 zijn de venstertijden gebaseerd op de grootte van een stad. In scenario 4 staan de venstertijden alleen tijdens de nacht vrachtverkeer toe en scenario 5 onderzoekt de regelgeving van venstertijden zoals die wordt voorgesteld door de Commissie Stedelijke Distributie. Venstertijden hebben een negatief effect op zowel lokale als globale milieuverontreiniging en verhogen eveneens de kosten voor de detailhandelsketens. Het verhogen van de venstertijddruk leidt tot een meer dan proportionele stijging van zowel milieuoverlast als distributiekosten. Het huidige venstertijd-beleid presteert slecht. Afstemming van venstertijden tussen verschillende steden zou de negatieve effecten kunnen verminderen. Voor sommige steden impliceert dit echter een ruimer venstertijd, met als gevolg dat de sociale duurzaamheid en leefkwaliteit in deze steden vermindert. Verplichte venstertijden tijdens de nacht hebben hogere kosten en emissies tot gevolg, hoofdzakelijk door de extra tijd die chauffeurs nodig hebben om de voertuigen alleen te lossen. In het referentiemodel van de Commissie Stedelijke Distributie is de venstertijddruk het laagst. Dit scenario presteert het best op alle drie de duurzaamheidskwesties; “people, planet en profit” (mensen, planeet en winst).

241
Samenvatting (summary in Dutch)
227
Hoofdstuk 5 De gevoeligheid van detailhandelsketens voor lokale beleidsmaatregelen op het gebied van duurzaamheid
Dit hoofdstuk gaat verder waar hoofdstuk 4 geëindigd is: detailhandelsketens worden verschillend door venstertijd-beperkingen beïnvloed. Het is nog onbekend wat de oorzaak is van deze verschillen. Door middel van een cross-case analyse met de verschillende dimensies van het logistieke concept bepalen we de factoren die de kostengevoeligheid van een detailhandelsketen voor venstertijden veroorzaken. Vervolgens passen we het onder-zoeksmodel aan zodat het geschikt is voor een experiment en we kunnen onderzoeken hoe detailhandelsketens hun gevoeligheid voor venstertijden en voertuigbeperkingen kunnen verminderen. Het beleid op het gebied van stedelijke distributie, in het aangepaste model weergegeven door venstertijden en voertuigbeperkingen, heeft invloed op de relatie tussen het logistieke concept en de distributieprestaties. We introduceren twee controlevariabelen: het wekelijkse volume en de geografische winkelspreiding. Voor het vervolg van dit hoofdstuk selecteren we twee cases, een modeketen en een warenhuisketen, waarvoor de grootte van de leveringen verschilt. We berekenen de distributieprestaties, door in 192 scenario’s voor beide cases de verschillende variabelen op basis van een gedeeltelijk factor-ontwerp te variëren. Venstertijden en voertuigbeperkingen beïnvloeden de cases verschil-lend. Ondanks dat we in deze cases op een zelfde manier omgaan met deze beperkingen, is de meest efficiënte manier om de distributie te organiseren verschillend. Twee dimensies verklaren deze verschillen; ten eerste de geplande beladingsgraad (de beperking die de rondrit van een voertuig bepaalt, namelijk de capaciteit of tijd) en ten tweede de levergrootte en het verwante aantal leveringen dat in één rondrit wordt gecombineerd. Gebaseerd op de resultaten van het experiment komen we tot de volgende drie proposities: 1. Venstertijden hebben meer invloed op de kosten van detailhandelsketens die veel
leveringen in één rondrit combineren dan op detailhandelsketens die weinig leveringen in een rondrit combineren.
2. Voertuigbeperkingen hebben een grotere invloed op de kosten van detailhandelsketens waarvan de lengte van de rondritten bepaald wordt door de voertuigcapaciteit dan op detailhandelsketens waarvan de lengte van de ritten door andere restricties wordt bepaald (bijvoorbeeld tijd).
3. Het is rendabeler voor detailhandelsketens waarvan de ritten door niet-capaciteitsbeperkingen worden bepaald om de tijdsperiode om de winkels te beleveren te verlengen, dan voor detailhandelsketens waarvan de lengte van de ritten door de capaciteit van het voertuig worden bepaald.
We testen deze proposities evenals de andere resultaten van het experiment met een derde case, een drogisterijketen. De kostengevoeligheid voor venstertijden is het laagst als de detailhandelsketens de venstertijdperiode zo efficiënt mogelijk gebruikt. De kosten voor de ketens en de belasting van het milieu verminderen het meest door een verlaging van de beleveringsfrequentie. Het experiment leert ons dat de voor detailhandelsketens kosten-efficiënte besluiten in het logistieke concept van een detailhandelsketen vaak ook beter zijn voor het milieu. Venstertijden en voertuigbeperkingen samen beïnvloeden de prestaties van een detailhandelsketen niet meer dan de beleidsmaatregelen apart.

242
Samenvatting (summary in Dutch)
228
Hoofdstuk 6 Kansen voor Factory Gate Pricing door venstertijd-beperkingen Gemeentelijke venstertijden hebben voor detailhandelsketens tot gevolg dat de beladings-graad van de voertuigen daalt en dat de wagens per dag kortere tijd gebruikt worden. In dit hoofdstuk onderzoeken we de mogelijkheden voor een detailhandelsketen om hier iets aan te doen en tegelijkertijd de duurzaamheid van de distributie te verhogen. We onderzoeken de kansen voor een detailhandelsketen als deze de secundaire distributie, de leveringen vanaf hun distributiecentrum (DC) aan hun winkels, met de primaire distributie, de leveringen van de leveranciers aan het DC van de detailhandelsketen, combineert. Factory Gate Pricing (FGP) impliceert dat de detailhandelsketen verantwoordelijk is voor de organisatie en de optimalisatie van al het vervoer tussen de leveranciers en de winkels. De productprijs die de detailhandelsketen betaalt aan de leverancier is ‘aan de fabriekspoort’, d.w.z. geen andere kosten dan de kale productkosten, zoals transportkosten, worden meegenomen in de prijs. We onderzoeken de kansen voor twee detailhandelsketens. Een drogisterijketen vormt één case en we gebruiken drie cases op basis van een warenhuisketen. Deze drie cases bestaan uit één case voor de modestroom en twee voor de overige goederen; waarvan één op basis van de huidige distributiestructuur waarin de leveranciers de producten aan functionele DC’s moeten leveren. De andere op basis van een voorgestelde distributiestructuur waarin alle winkelbeleveringen vanuit het dichtstbijzijnde DC worden uitgevoerd en alle leveranciers producten vervoeren naar het dichtstbijzijnde DC. Voor deze vier cases variëren we het venstertijd-beleid tussen het huidige beleid en geen venstertijd-beperkingen. Daarnaast variëren we ook wie verantwoordelijk is voor de primaire distributie: de leveranciers of de detailhandelsketen. We gebruiken een Matlab toolbox, Matlog, om realistische voertuigroutes te plannen. We gebruiken Matlog om de prestaties in te schatten in de secundaire distributie en in het scenario waarin de detailhandelsketen voor de gecombineerde primaire en secundaire distributie verant-woordelijk is. Voor de scenario’s waarin de leveranciers verantwoordelijk zijn voor de primaire distributie, schatten we de totale gereisde afstand in met drie regressiemodellen. Deze zijn gebaseerd op het volume, de leveranciersdichtheid en de afstand tussen de leverancier en het DC van de detailhandelsketen. Door de primaire distributie te combineren met de secundaire distributie moet de detailhandelsketen meer kilometers maken dan in de situatie waarin die alleen voor de secundaire distributie verantwoordelijk was. De gecombineerde distributie kost bovendien meer tijd. Deze toename is echter beperkt; het totale aantal gereisde voertuigkilometers vermindert aanzienlijk. Dit resulteert in een wezenlijke daling van vervuilende emissies, wat de distributie van de detailhandelsketen duurzamer maakt. In het geval dat een detailhandelsketen verscheidene distributiecentra heeft, kan de daling zelfs nog groter zijn als de leverancier aan het dichtstbijzijnde DC mag leveren. Backhauling is ook een goede kans voor detailhandelsketens om het voertuiggebruik tijdens de dag te verbeteren als dit laag is door venstertijd-beperkingen. Bovendien vermindert het aantal lege voertuigkilometers en, als de productprijs (de factory gate price) lager is dan de huidige prijs voor de goederen, kan het de kosten van de detailhandelsketen ook verminderen. Vanwege de toename van benodigde voertuigen door venstertijd-beperkingen, heeft de detailhandelsketen slechts een beperkt

243
Samenvatting (summary in Dutch)
229
aantal extra voertuigen nodig om de primaire distributie met de secundaire distributie te combineren. Hoofdstuk 7 Afsluitende opmerkingen In dit afsluitende hoofdstuk bespreken we de bevindingen, de bijdragen en de beperkingen van dit proefschrift. In deze samenvatting beperken we ons tot slechts één idee dat in aanbevelingen voor vervolgonderzoek wordt besproken; beleidsoplossingen op maat voor duurzame stedelijke distributie. Revenue-management is de praktijk van het managen van de vraag op een dusdanige manier dat de rentabiliteit wordt verhoogd. We bespreken hoe toekomstig onderzoek de vraag zou kunnen beantwoorden of het mogelijk is een betere oplossing te vinden voor alle kenmerken van een duurzame ontwikkeling in de stedelijke distributie (milieu, maatschappij en economie), door een reeks standaardmaatregelen en beleidsmaatregelen op maat te ontwikkelen waarop verschillende actoren kunnen bieden. We behandelen kort de implicaties van venstertijd-oplossingen op maat voor de verschillende betrokkenen.

244

245
231
About the author
Hans (Henricus Joannes) Quak was born in Bergschenhoek on December 16, 1978. He attended the Marnix Gymnasium in Rotterdam, at which he obtained a diploma in 1997. From 1997 to 2002 Hans studied Business Administration at the Erasmus University Rotterdam after which he started as a Ph.D. candidate in the Management of Technology and Innovation Department within the same university in January 2003. His Ph.D. trajectory was supported by the Erasmus Research Institute of Management (ERIM). He presented his work at several international conferences and seminars, including the City Logistics conferences in 2005 (Langkawi) and 2007 (Crete), the Conference of Production and Operations Management in Boston (2006), the third International Workshop on Freight Transport and Logistics in 2006 (Altea), and four CEMS seminars in Riezlern (2004 - 2007). The article “Exploring retailers’ sensitivity to local sustainability policies”, on which parts of chapter 4 and 5 are based, is published in the Journal of Operations Management. Next, he is the author of two chapters in the book Case Study Methodology in Business Research by Dul and Hak (2007). Other papers have been published or accepted for publication in reviewed books and refereed conference proceedings. The teaching experience of Hans includes two research projects, Leaping Logistics and Roaring Retailing, in the International Business Administration program. Hans is currently working as a logistics consultant at TNO Mobility and Logistics in Delft.

246
247
233
ERIM Ph.D. Series Research in Management
ERASMUS RESEARCH INSTITUTE OF MANAGEMENT (ERIM) ERIM Electronic Series Portal: http://hdl.handle.net/1765/1
Althuizen, N.A.P., Analogical Reasoning as a Decision Support Principle for Weakly Structured Marketing Problems, Promotor: Prof. dr. ir. B. Wierenga, EPS-2006-095-MKT, ISBN 90-5892-129-8, http://hdl.handle.net/1765/8190
Alvarez, H.L., Distributed Collaborative Learning Communities Enabled by Information Communication Technology, Promotor: Prof. dr. K. Kumar, EPS-2006-080-LIS, ISBN 90-5892-112-3, http://hdl.handle.net/1765/7830
Appelman, J.H., Governance of Global Interorganizational Tourism Networks: Changing Forms of Co-ordination between the Travel Agency and Aviation Sector, Promotors: Prof. dr. F.M. Go & Prof. dr. B. Nooteboom, EPS-2004-036-MKT, ISBN 90-5892-060-7, http://hdl.handle.net/1765/1199
Baquero, G, On Hedge Fund Performance, Capital Flows and Investor Psychology, Promotor: Prof. dr. M.J.C.M. Verbeek, EPS-2006-094-F&A, ISBN 90-5892-131-X, http://hdl.handle.net/1765/8192
Berens, G., Corporate Branding: The Development of Corporate Associations and their Influence on Stakeholder Reactions, Promotor: Prof. dr. C. B. M. van Riel, EPS-2004-039-ORG, ISBN 90-5892-065-8, http://hdl.handle.net/1765/1273
Berghe, D.A.F. van den, Working Across Borders: Multinational Enterprises and the Internationalization of Employment, Promotors: Prof. dr. R.J.M. van Tulder & Prof. dr. E.J.J. Schenk, EPS-2003-029-ORG, ISBN 90-5892-05-34, http://hdl.handle.net/1765/1041
Berghman, L.A., Strategic Innovation Capacity: A Mixed Method Study on Deliberate Strategic Learning Mechanisms, Promotor: Prof. dr. P. Mattyssens, EPS-2006-087-MKT, ISBN 90-5892-120-4, http://hdl.handle.net/1765/7991
248
ERIM Ph.D. Series Research in Management
234
Bijman, W.J.J., Essays on Agricultural Co-operatives: Governance Structure in Fruit and Vegetable Chains, Promotor: Prof. dr. G.W.J. Hendrikse, EPS-2002-015-ORG, ISBN: 90-5892-024-0, http://hdl.handle.net/1765/867
Bispo, A., Labour Market Segmentation: An investigation into the Dutch hospitality industry, Promotors: Prof. dr. G.H.M. Evers & Prof. dr. A.R. Thurik, EPS-2007-108-ORG, ISBN: 90-5892-136-9, http://hdl.handle.net/1765/10283
Blindenbach-Driessen, F., Innovation Management in Project-Based Firms, Promotor: Prof. dr. S.L. van de Velde, EPS-2006-082-LIS, ISBN: 90-5892-110-7, http://hdl.handle.net/1765/7828
Boer, C.A., Distributed Simulation in Industry, Promotors: Prof. dr. A. de Bruin & Prof. dr. ir. A. Verbraeck, EPS-2005-065-LIS, ISBN: 90-5892-093-3, http://hdl.handle.net/1765/6925
Boer, N.I., Knowledge Sharing within Organizations: A situated and Relational Perspective, Promotor: Prof. dr. K. Kumar, EPS-2005-060-LIS, ISBN: 90-5892-086-0, http://hdl.handle.net/1765/6770
Brito, M.P. de, Managing Reverse Logistics or Reversing Logistics Management? Promotors: Prof. dr. ir. R. Dekker & Prof. dr. M. B. M. de Koster, EPS-2004-035-LIS, ISBN: 90-5892-058-5, http://hdl.handle.net/1765/1132
Brohm, R., Polycentric Order in Organizations: A Dialogue between Michael Polanyi and IT-Consultants on Knowledge, Morality, and Organization, Promotors: Prof. dr. G. W. J. Hendrikse & Prof. dr. H. K. Letiche, EPS-2005-063-ORG, ISBN: 90-5892-095-X, http://hdl.handle.net/1765/6911
Campbell, R.A.J., Rethinking Risk in International Financial Markets, Promotor: Prof. dr. C.G. Koedijk, EPS-2001-005-F&A, ISBN: 90-5892-008-9, http://hdl.handle.net/1765/306
Chen, Y., Labour Flexibility in China’s Companies: An Empirical Study, Promotors: Prof. dr. A. Buitendam & Prof. dr. B. Krug, EPS-2001-006-ORG, ISBN: 90-5892-012-7, http://hdl.handle.net/1765/307
Damen, F.J.A., Taking the Lead: The Role of Affect in Leadership Effectiveness, Promotor: Prof. dr. D.L. van Knippenberg, EPS-2007-107-ORG, http://hdl.handle.net/1765/10282
Daniševská, P., Empirical Studies on Financial Intermediation and Corporate Policies, Promotor: Prof. dr. C.G. Koedijk, EPS-2004-044-F&A, ISBN 90-5892-070-4, http://hdl.handle.net/1765/1518
Delporte-Vermeiren, D.J.E., Improving the Flexibility and Profitability of ICT-enabled Business Networks: An Assessment Method and Tool, Promotors: Prof. mr. dr. P.H.M. Vervest & Prof. dr. ir. H.W.G.M. van Heck, EPS-2003-020-LIS, ISBN: 90-5892-040-2, http://hdl.handle.net/1765/359
Derwall, J.M.M., The Economic Virtues of SRI and CSR, Promotor: Prof. dr. C.G. Koedijk, EPS-2007-101-STR, ISBN: 90-5892-132-8, http://hdl.handle.net/1765/8986

249
ERIM Ph.D. Series Research in Management
235
Dijksterhuis, M., Organizational Dynamics of Cognition and Action in the Changing Dutch and US Banking Industries, Promotors: Prof. dr. ir. F.A.J. van den Bosch & Prof. dr. H.W. Volberda, EPS-2003-026-STR, ISBN: 90-5892-048-8, http://hdl.handle.net/1765/1037
Elstak, M.N., Flipping the Identity Coin: The Comparative Effect of Perceived, Projected and Desired Organizational Identity on Organizational Identification and Desired Behavior, Promotor: Prof. dr. C.B.M. van Riel, EPS-2008-117-ORG, ISBN: 90-5892-148-2, http://hdl.handle.net/1765/1
Fenema, P.C. van, Coordination and Control of Globally Distributed Software Projects, Promotor: Prof. dr. K. Kumar, EPS-2002-019-LIS, ISBN: 90-5892-030-5, http://hdl.handle.net/1765/360
Fleischmann, M., Quantitative Models for Reverse Logistics, Promotors: Prof. dr. ir. J.A.E.E. van Nunen & Prof. dr. ir. R. Dekker, EPS-2000-002-LIS, ISBN: 35-4041-711-7, http://hdl.handle.net/1765/1044
Flier, B., Strategic Renewal of European Financial Incumbents: Coevolution of Environmental Selection, Institutional Effects, and Managerial Intentionality, Promotors: Prof. dr. ir. F.A.J. van den Bosch & Prof. dr. H.W. Volberda, EPS-2003-033-STR, ISBN: 90-5892-055-0, http://hdl.handle.net/1765/1071
Fok, D., Advanced Econometric Marketing Models, Promotor: Prof. dr. P.H.B.F. Franses, EPS-2003-027-MKT, ISBN: 90-5892-049-6, http://hdl.handle.net/1765/1035
Ganzaroli , A., Creating Trust between Local and Global Systems, Promotors: Prof. dr. K. Kumar & Prof. dr. R.M. Lee, EPS-2002-018-LIS, ISBN: 90-5892-031-3, http://hdl.handle.net/1765/361
Gilsing, V.A., Exploration, Exploitation and Co-evolution in Innovation Networks, Promotors: Prof. dr. B. Nooteboom & Prof. dr. J.P.M. Groenewegen, EPS-2003-032-ORG, ISBN 90-5892-054-2, http://hdl.handle.net/1765/1040
Ginkel, W.P. van, The Use of Distributed Information in Decision Making Groups: The Role of Shared Task Representations, Promotor: Prof. dr. D. van Knippenberg, EPS-2007-097-ORG, http://hdl.handle.net/1765/8424
Govers, R., Virtual Tourism Destination Image: Global Identities Constructed, Perceived and Experienced, Promotors: Prof. dr. F.M. Go & Prof. dr. K. Kumar, EPS-2005-069-MKT, ISBN 90-5892-107-7, http://hdl.handle.net/1765/6981
Graaf, G. de, Tractable Morality: Customer Discourses of Bankers, Veterinarians and Charity Workers, Promotors: Prof. dr. F. Leijnse & Prof. dr. T. van Willigenburg, EPS-2003-031-ORG, ISBN: 90-5892-051-8, http://hdl.handle.net/1765/1038
Groot, E.A. de, Essays on Economic Cycles, Promotors: Prof. dr. Ph.H.B.F. Franses & Prof Prof. dr. H.R. Commandeur, EPS-2006-091-MKT, ISBN: 90-5892-123-9, http://hdl.handle.net/1765/8216
Gutkowska, A.B., Essays on the Dynamic Portfolio Choice, Promotor: Prof. dr. A.C.F. Vorst, EPS-2006-085-F&A, ISBN: 90-5892-118-2, http://hdl.handle.net/1765/7994

250
ERIM Ph.D. Series Research in Management
236
Hagemeijer, R.E., The Unmasking of the Other, Promotors: Prof. dr. S.J. Magala & Prof. dr. H.K. Letiche, EPS-2005-068-ORG, ISBN: 90-5892-097-6, http://hdl.handle.net/1765/6963
Hartigh, E. den, Increasing Returns and Firm Performance: An Empirical Study, Promotor: Prof. dr. H.R. Commandeur, EPS-2005-067-STR, ISBN: 90-5892-098-4, http://hdl.handle.net/1765/6939
Hermans. J.M., ICT in Information Services; Use and Deployment of the Dutch Securities Trade, 1860-1970. Promotor: Prof. dr. drs. F.H.A. Janszen, EPS-2004-046-ORG, ISBN 90-5892-072-0, http://hdl.handle.net/1765/1793
Heugens, P.P.M.A.R., Strategic Issues Management: Implications for Corporate Performance, Promotors: Prof. dr. ir. F.A.J. van den Bosch & Prof. dr. C.B.M. van Riel, EPS-2001-007-STR, ISBN: 90-5892-009-7, http://hdl.handle.net/1765/358
Heuvel, W. van den, The Economic Lot-Sizing Problem: New Results and Extensions, Promotor: Prof. dr. A.P.L. Wagelmans, EPS-2006-093-LIS, ISBN: 90-5892-124-7, http://hdl.handle.net/1765/1805
Hooghiemstra, R., The Construction of Reality: Cultural differences in self-serving behaviour in accounting narratives, Promotors: Prof. dr. L.G. van der Tas RA & Prof. dr. A.Th.H. Pruyn, EPS-2003-025-F&A, ISBN: 90-5892-047-X, http://hdl.handle.net/1765/871
Hu, Y., Essays on the Governance of Agricultural Products: Cooperatives and Contract Farming, Promotors: Prof. dr. G.W.J. Hendrkse & Prof. Dr. B. Krug, EPS-2007-113-ORG, ISBN: 90-5892-145-1, http://hdl.handle.net/1765/1
Huij, J.J., New Insights into Mutual Funds: Performance and Family Strategies, Promotor: Prof. dr. M.C.J.M. Verbeek, EPS-2007-099-F&A, ISBN: 90-5892-134-4, http://hdl.handle.net/1765/9398
Huurman, C.I., Dealing with Electricity Prices, Promotor: Prof. dr. C.D. Koedijk, EPS-2007-098-F&A, ISBN: 90-5892-130-1, http://hdl.handle.net/1765/9399
Iastrebova, K, Manager’s Information Overload: The Impact of Coping Strategies on Decision-Making Performance, Promotor: Prof. dr. H.G. van Dissel, EPS-2006-077-LIS, ISBN 90-5892-111-5, http://hdl.handle.net/1765/7329
Iwaarden, J.D. van, Changing Quality Controls: The Effects of Increasing Product Variety and Shortening Product Life Cycles, Promotors: Prof. dr. B.G. Dale & Prof. dr. A.R.T. Williams, EPS-2006-084-ORG, ISBN 90-5892-117-4, http://hdl.handle.net/1765/7992
Jansen, J.J.P., Ambidextrous Organizations, Promotors: Prof. dr. ir. F.A.J. Van den Bosch & Prof. dr. H.W. Volberda, EPS-2005-055-STR, ISBN 90-5892-081-X, http://hdl.handle.net/1765/6774
Jong, C. de, Dealing with Derivatives: Studies on the Role, Informational Content and Pricing of Financial Derivatives, Promotor: Prof. dr. C.G. Koedijk, EPS-2003-023-F&A, ISBN: 90-5892-043-7, http://hdl.handle.net/1765/1043

251
ERIM Ph.D. Series Research in Management
237
Keizer, A.B., The Changing Logic of Japanese Employment Practices: A Firm-Level Analysis of Four Industries, Promotors: Prof. dr. J.A. Stam & Prof. dr. J.P.M. Groenewegen, EPS-2005-057-ORG, ISBN: 90-5892-087-9, http://hdl.handle.net/1765/6667
Kijkuit, R.C., Social Networks in the Front End: The Organizational Life of an Idea, Promotor: Prof. dr. B. Nooteboom, EPS-2007-104-ORG, ISBN 90-5892-137-6, http://hdl.handle.net/1765/10074
Kippers, J., Empirical Studies on Cash Payments, Promotor: Prof. dr. Ph.H.B.F. Franses, EPS-2004-043-F&A, ISBN 90-5892-069-0, http://hdl.handle.net/1765/1520
Kole, E., On Crises, Crashes and Comovements, Promotors: Prof. dr. C.G. Koedijk & Prof. dr. M.J.C.M. Verbeek, EPS-2006-083-F&A, ISBN 90-5892-114-X, http://hdl.handle.net/1765/7829
Kooij-de Bode, J.M., Distributed Information and Group Decision-Making: Effects of Diversity and Affect, Promotor: Prof. dr. D.L. van Knippenberg, EPS-2007-115-ORG, http://hdl.handle.net/1765/1
Knapp, S., The Econometrics of Maritime Safety: Recommendations to Enhance Safety at Sea, Promotor: Prof. dr. Ph.H.B.F. Franses, EPS-2007-096-ORG, ISBN 90-5892-127-1, http://hdl.handle.net/1765/7913
Koppius, O.R., Information Architecture and Electronic Market Performance, Promotors: Prof. dr. P.H.M. Vervest & Prof. dr. ir. H.W.G.M. van Heck, EPS-2002-013-LIS, ISBN: 90-5892-023-2, http://hdl.handle.net/1765/921
Kotlarsky, J., Management of Globally Distributed Component-Based Software Development Projects, Promotor: Prof. dr. K. Kumar, EPS-2005-059-LIS, ISBN: 90-5892-088-7, http://hdl.handle.net/1765/6772
Kuilman, J., The Re-Emergence of Foreign Banks in Shanghai: An Ecological Analysis, Promotor: Prof. dr. B. Krug, EPS-2005-066-ORG, ISBN: 90-5892-096-8, http://hdl.handle.net/1765/6926
Langen, P.W. de, The Performance of Seaport Clusters: A Framework to Analyze Cluster Performance and an Application to the Seaport Clusters of Durban, Rotterdam and the Lower Mississippi, Promotors: Prof. dr. B. Nooteboom & Prof. drs. H.W.H. Welters, EPS-2004-034-LIS, ISBN: 90-5892-056-9, http://hdl.handle.net/1765/1133
Le Anh, T., Intelligent Control of Vehicle-Based Internal Transport Systems, Promotors: Prof. dr. M.B.M. de Koster & Prof. dr. ir. R. Dekker, EPS-2005-051-LIS, ISBN 90-5892-079-8, http://hdl.handle.net/1765/6554
Le-Duc, T., Design and Control of Efficient Order Picking Processes, Promotor: Prof. dr. M.B.M. de Koster, EPS-2005-064-LIS, ISBN 90-5892-094-1, http://hdl.handle.net/1765/6910
Leeuwen, E.P. van, Recovered-Resource Dependent Industries and the Strategic Renewal of Incumbent Firm: A Multi-Level Study of Recovered Resource Dependence Management and Strategic Renewal in the European Paper and Board Industry, Promotors: Prof. dr. ir. F.A.J. Van den Bosch & Prof. dr. H.W. Volberda, EPS-2007-109-STR, ISBN 90-5892-140-6, http://hdl.handle.net/1765/10183

252
ERIM Ph.D. Series Research in Management
238
Lentink, R.M., Algorithmic Decision Support for Shunt Planning, Promotors: Prof. dr. L.G. Kroon & Prof. dr. ir. J.A.E.E. van Nunen, EPS-2006-073-LIS, ISBN 90-5892-104-2, http://hdl.handle.net/1765/7328
Liang, G., New Competition: Foreign Direct Investment and Industrial Development in China, Promotor: Prof. dr. R.J.M. van Tulder, EPS-2004-047-ORG, ISBN 90-5892-073-9, http://hdl.handle.net/1765/1795
Liere, D.W. van, Network Horizon and the Dynamics of Network Positions: A Multi-Method Multi-Level Longitudinal Study of Interfirm Networks, Promotor: Prof. dr. P.H.M. Vervest, EPS-2007-105-LIS, ISBN 90-5892-139-0, http://hdl.handle.net/1765/10181
Loef, J., Incongruity between Ads and Consumer Expectations of Advertising, Promotors: Prof. dr. W.F. van Raaij & Prof. dr. G. Antonides, EPS-2002-017-MKT, ISBN: 90-5892-028-3, http://hdl.handle.net/1765/869
Londoño, M. del Pilar, Institutional Arrangements that Affect Free Trade Agreements: Economic Rationality Versus Interest Groups, Promotors: Prof. dr. H.E. Haralambides & Prof. dr. J.F. Francois, EPS-2006-078-LIS, ISBN: 90-5892-108-5, http://hdl.handle.net/1765/7578
Maeseneire, W., de, Essays on Firm Valuation and Value Appropriation, Promotor: Prof. dr. J.T.J. Smit, EPS-2005-053-F&A, ISBN 90-5892-082-8, http://hdl.handle.net/1765/6768
Mandele, L.M., van der, Leadership and the Inflection Point: A Longitudinal Perspective, Promotors: Prof. dr. H.W. Volberda & Prof. dr. H.R. Commandeur, EPS-2004-042-STR, ISBN 90-5892-067-4, http://hdl.handle.net/1765/1302
Meer, J.R. van der, Operational Control of Internal Transport, Promotors: Prof. dr. M.B.M. de Koster & Prof. dr. ir. R. Dekker, EPS-2000-001-LIS, ISBN: 90-5892-004-6, http://hdl.handle.net/1765/859
Mentink, A., Essays on Corporate Bonds, Promotor: Prof. dr. A.C.F. Vorst, EPS-2005-070-F&A, ISBN: 90-5892-100-X, http://hdl.handle.net/1765/7121
Meyer, R.J.H., Mapping the Mind of the Strategist: A Quantitative Methodology for Measuring the Strategic Beliefs of Executives, Promotor: Prof. dr. R.J.M. van Tulder, EPS-2007-106-STR, ISBN: 978-90-5892-141-3, http://hdl.handle.net/1765/10182
Miltenburg, P.R., Effects of Modular Sourcing on Manufacturing Flexibility in the Automotive Industry: A Study among German OEMs, Promotors: Prof. dr. J. Paauwe & Prof. dr. H.R. Commandeur, EPS-2003-030-ORG, ISBN: 90-5892-052-6, http://hdl.handle.net/1765/1039
Moerman, G.A., Empirical Studies on Asset Pricing and Banking in the Euro Area, Promotor: Prof. dr. C.G. Koedijk, EPS-2005-058-F&A, ISBN: 90-5892-090-9, http://hdl.handle.net/1765/6666
Mol, M.M., Outsourcing, Supplier-relations and Internationalisation: Global Source Strategy as a Chinese Puzzle, Promotor: Prof. dr. R.J.M. van Tulder, EPS-2001-010-ORG, ISBN: 90-5892-014-3, http://hdl.handle.net/1765/355

253
ERIM Ph.D. Series Research in Management
239
Mom, T.J.M., Managers’ Exploration and Exploitation Activities: The Influence of Organizational Factors and Knowledge Inflows, Promotors: Prof. dr. ir. F.A.J. Van den Bosch & Prof. dr. H.W. Volberda, EPS-2006-079-STR, ISBN: 90-5892-116-6, http://hdl.handle.net/1765
Mulder, A., Government Dilemmas in the Private Provision of Public Goods, Promotor: Prof. dr. R.J.M. van Tulder, EPS-2004-045-ORG, ISBN: 90-5892-071-2, http://hdl.handle.net/1765/1790
Muller, A.R., The Rise of Regionalism: Core Company Strategies Under The Second Wave of Integration, Promotor: Prof. dr. R.J.M. van Tulder, EPS-2004-038-ORG, ISBN 90-5892-062-3, http://hdl.handle.net/1765/1272
Noeverman, J., Management Control Systems, Evaluative Style, and Behaviour: Exploring the Concept and Behavioural Consequences of Evaluative Style, Promotors: Prof. dr. E.G.J. Vosselman & Prof. dr. A.R.T. Williams, EPS-2007-120-F&A, ISBN: 90-5892-151-2, http://hdl.handle.net/1765/1
Oosterhout, J., van, The Quest for Legitimacy: On Authority and Responsibility in Governance, Promotors: Prof. dr. T. van Willigenburg & Prof.mr. H.R. van Gunsteren, EPS-2002-012-ORG, ISBN: 90-5892-022-4, http://hdl.handle.net/1765/362
Paape, L., Corporate Governance: The Impact on the Role, Position, and Scope of Services of the Internal Audit Function, Promotors: Prof. dr. G.J. van der Pijl & Prof. dr. H. Commandeur, EPS-2007-111-MKT, ISBN: 90-5892-143-7, http://hdl.handle.net/1765/10417
Pak, K., Revenue Management: New Features and Models, Promotor: Prof. dr. ir. R. Dekker, EPS-2005-061-LIS, ISBN: 90-5892-092-5, http://hdl.handle.net/1765/362/6771
Pattikawa, L.H, Innovation in the Pharmaceutical Industry: Evidence from Drug Intriduction in the U.S., Promotors: Prof. dr. H.R.Commandeur, EPS-2007-102-MKT, ISBN: 90-5892-135-2, http://hdl.handle.net/1765/9626
Peeters, L.W.P., Cyclic Railway Timetable Optimization, Promotors: Prof. dr. L.G. Kroon & Prof. dr. ir. J.A.E.E. van Nunen, EPS-2003-022-LIS, ISBN: 90-5892-042-9, http://hdl.handle.net/1765/429
Pietersz, R., Pricing Models for Bermudan-style Interest Rate Derivatives, Promotors: Prof. dr. A.A.J. Pelsser & Prof. dr. A.C.F. Vorst, EPS-2005-071-F&A, ISBN 90-5892-099-2, http://hdl.handle.net/1765/7122
Popova, V., Knowledge Discovery and Monotonicity, Promotor: Prof. dr. A. de Bruin, EPS-2004-037-LIS, ISBN 90-5892-061-5, http://hdl.handle.net/1765/1201
Pouchkarev, I., Performance Evaluation of Constrained Portfolios, Promotors: Prof. dr. J. Spronk & Dr. W.G.P.M. Hallerbach, EPS-2005-052-F&A, ISBN 90-5892-083-6, http://hdl.handle.net/1765/6731
Puvanasvari Ratnasingam, P., Interorganizational Trust in Business to Business E-Commerce, Promotors: Prof. dr. K. Kumar & Prof. dr. H.G. van Dissel, EPS-2001-009-LIS, ISBN: 90-5892-017-8, http://hdl.handle.net/1765/356
254
ERIM Ph.D. Series Research in Management
240
Rinsum, M. van, Performance Measurement and Managerial Time Orientation, Promotor: Prof. dr. F.G.H. Hartmann, EPS-2006-088-F&A, ISBN: 90-5892-121-2, http://hdl.handle.net/1765/7993
Romero Morales, D., Optimization Problems in Supply Chain Management, Promotors: Prof. dr. ir. J.A.E.E. van Nunen & Dr. H.E. Romeijn, EPS-2000-003-LIS, ISBN: 90-9014078-6, http://hdl.handle.net/1765/865
Roodbergen, K.J., Layout and Routing Methods for Warehouses, Promotors: Prof. dr. M.B.M. de Koster & Prof. dr. ir. J.A.E.E. van Nunen, EPS-2001-004-LIS, ISBN: 90-5892-005-4, http://hdl.handle.net/1765/861
Schramade, W.L.J., Corporate Bonds Issuers, Promotor: Prof. dr. A. De Jong, EPS-2006-092-F&A, ISBN: 90-5892-125-5, http://hdl.handle.net/1765/8191
Schweizer, T.S., An Individual Psychology of Novelty-Seeking, Creativity and Innovation, Promotor: Prof. dr. R.J.M. van Tulder. EPS-2004-048-ORG, ISBN: 90-5892-07-71, http://hdl.handle.net/1765/1818
Six, F.E., Trust and Trouble: Building Interpersonal Trust Within Organizations, Promotors: Prof. dr. B. Nooteboom & Prof. dr. A.M. Sorge, EPS-2004-040-ORG, ISBN 90-5892-064-X, http://hdl.handle.net/1765/1271
Slager, A.M.H., Banking across Borders, Promotors: Prof. dr. R.J.M. van Tulder & Prof. dr. D.M.N. van Wensveen, EPS-2004-041-ORG, ISBN 90-5892-066–6, http://hdl.handle.net/1765/1301
Sloot, L., Understanding Consumer Reactions to Assortment Unavailability, Promotors: Prof. dr. H.R. Commandeur, Prof. dr. E. Peelen & Prof. dr. P.C. Verhoef, EPS-2006-074-MKT, ISBN 90-5892-102-6, http://hdl.handle.net/1765/7438
Smit, W., Market Information Sharing in Channel Relationships: Its Nature, Antecedents and Consequences, Promotors: Prof. dr. ir. G.H. van Bruggen & Prof. dr. ir. B. Wierenga, EPS-2006-076-MKT, ISBN 90-5892-106-9, http://hdl.handle.net/1765/7327
Sonnenberg, M., The Signalling Effect of HRM on Psychological Contracts of Employees: A Multi-level Perspective, Promotor: Prof. dr. J. Paauwe, EPS-2006-086-ORG, ISBN 90-5892-119-0, http://hdl.handle.net/1765/7995
Speklé, R.F., Beyond Generics: A closer Look at Hybrid and Hierarchical Governance, Promotor: Prof. dr. M.A. van Hoepen RA, EPS-2001-008-F&A, ISBN: 90-5892-011-9, http://hdl.handle.net/1765/357
Teunter, L.H., Analysis of Sales Promotion Effects on Household Purchase Behavior, Promotors: Prof. dr. ir. B. Wierenga & Prof. dr. T. Kloek, EPS-2002-016-MKT, ISBN: 90-5892-029-1, http://hdl.handle.net/1765/868
Tims, B., Empirical Studies on Exchange Rate Puzzles and Volatility, Promotor: Prof. dr. C.G. Koedijk, EPS-2006-089-F&A, ISBN: 90-5892-113-1, http://hdl.handle.net/1765/8066
255
ERIM Ph.D. Series Research in Management
241
Valck, K. de, Virtual Communities of Consumption: Networks of Consumer Knowledge and Companionship, Promotors: Prof. dr. ir. G.H. van Bruggen & Prof. dr. ir. B. Wierenga, EPS-2005-050-MKT, ISBN 90-5892-078-X, http://hdl.handle.net/1765/6663
Valk, W. van der, Buyer-Seller Interaction Patterns During Ongoing Service Exchange, Promotors: Prof. dr. J.Y.F. Wynstra & Prof. dr. ir. B. Axelsson, EPS-2007-116-MKT, ISBN 90-5892-146-8, http://hdl.handle.net/1765/1
Verheul, I., Is There a (Fe)male Approach? Understanding Gender Differences in Entrepreneurship, Prof. dr. A.R. Thurik, EPS-2005-054-ORG, ISBN 90-5892-080-1, http://hdl.handle.net/1765/2005
Vis, I.F.A., Planning and Control Concepts for Material Handling Systems, Promotors: Prof. dr. M.B.M. de Koster & Prof. dr. ir. R. Dekker, EPS-2002-014-LIS, ISBN: 90-5892-021-6, http://hdl.handle.net/1765/866
Vlaar, P.W.L., Making Sense of Formalization in Interorganizational Relationships: Beyond Coordination and Control, Promotors: Prof. dr. ir. F.A.J. Van den Bosch & Prof. dr. H.W. Volberda, EPS-2006-075-STR, ISBN 90-5892-103-4, http://hdl.handle.net/1765/7326
Vliet, P. van, Downside Risk and Empirical Asset Pricing, Promotor: Prof. dr. G.T. Post, EPS-2004-049-F&A, ISBN 90-5892-07-55, http://hdl.handle.net/1765/1819
Vlist, P. van der, Synchronizing the Retail Supply Chain, Promotors: Prof. dr. ir. J.A.E.E. van Nunen & Prof. dr. A.G. de Kok, EPS-2007-110-LIS, ISBN 90-5892-142-0, http://hdl.handle.net/1765/10418
Vries-van Ketel E. de, How Assortment Variety Affects Assortment Attractiveness: A Consumer Perspective, Promotors: Prof. dr. G.H. van Bruggen & Prof.dr.ir. A.Smidts, EPS-2006-072-MKT, ISBN 90-5892-101-8, http://hdl.handle.net/1765/7193
Vromans, M.J.C.M., Reliability of Railway Systems, Promotors: Prof. dr. L.G. Kroon, Prof. dr. ir. R. Dekker & Prof. dr. ir. J.A.E.E. van Nunen, EPS-2005-062-LIS, ISBN: 90-5892-089-5, http://hdl.handle.net/1765/6773
Vroomen, B.L.K., The Effects of the Internet, Recommendation Quality and Decision Strategies on Consumer Choice, Promotor: Prof. dr. Ph.H.B.F. Franses, EPS-2006-090-MKT, ISBN: 90-5892-122-0, http://hdl.handle.net/1765/8067
Waal, T. de, Processing of Erroneous and Unsafe Data, Promotor: Prof. dr. ir. R. Dekker, EPS-2003-024-LIS, ISBN: 90-5892-045-3, http://hdl.handle.net/1765/870
Watkins Fassler, K., Macroeconomic Crisis and Firm Performance, Promotors: Prof. dr. J. Spronk & Prof. dr. D.J. van Dijk, EPS-2007-103-F&A, ISBN 90-5892-138-3, http://hdl.handle.net/1765/10065
Wennekers, A.R.M., Entrepreneurship at Country Level: Economic and Non-Economic Determinants, Promotor: Prof. dr. A.R. Thurik, EPS-2006-81-ORG, ISBN 90-5892-115-8, http://hdl.handle.net/1765/7982

256
ERIM Ph.D. Series Research in Management
242
Wielemaker, M.W., Managing Initiatives: A Synthesis of the Conditioning and Knowledge-Creating View, Promotors: Prof. dr. H.W. Volberda & Prof. dr. C.W.F. Baden-Fuller, EPS-2003-28-STR, ISBN 90-5892-050-X, http://hdl.handle.net/1765/1042
Wijk, R.A.J.L. van, Organizing Knowledge in Internal Networks: A Multilevel Study, Promotor: Prof. dr. ir. F.A.J. van den Bosch, EPS-2003-021-STR, ISBN: 90-5892-039-9, http://hdl.handle.net/1765/347
Zhang, X., Strategizing of Foreign Firms in China: An Institution-based Perspective, Promotor: Prof. dr. B. Krug, EPS-2007-114-ORG, ISBN: 90-5892-147-5, http://hdl.handle.net/1765/1
Zhu, Z., Essays on China’s Tax System, Promotors: Prof. dr. B. Krug & Prof. dr. G.W.J. Hendrikse, EPS-2007-112-ORG, ISBN: 90-5892-144-4, http://hdl.handle.net/1765/10502

257

258

259

260

HANS QUAK
Sustainability ofUrban Freight TransportRetail Distribution and Local Regulations in Cities
Erasmus University Rotterdam RSM Erasmus University Erasmus School of EconomicsP.O. Box 1738, 3000 DR RotterdamThe Netherlands
Tel. +31 10 408 11 82Fax +31 10 408 96 40E-mail [email protected] www.erim.eur.nl
HA
NS
QU
AK
- Su
stain
ab
ility o
f Urb
an
Freig
ht Tra
nsp
ort
ERIM PhD SeriesResearch in Management
Era
smu
s R
ese
arc
h I
nst
itu
te o
f M
an
ag
em
en
t-
ER
IM
124
ER
IM
De
sig
n &
la
you
t: B
&T
On
twe
rp e
n a
dvi
es
(w
ww
.b-e
n-t
.nl)
Pri
nt:
Ha
vek
a
(w
ww
.ha
vek
a.n
l)SUSTAINABILITY OF URBAN FREIGHT TRANSPORT
Retail Distribution and Local Regulations in Cities
Although our urbanised civilisation requires freight transport in order to sustain it,
urban freight transport is especially recognised for its unsustainable impacts. To reduce
the unsustainable impacts of urban freight transport, many local governments develop
policies that focus sometimes more on banning or restricting urban freight transport than
on making it more sustainable. In the first part of this thesis we develop a framework to
structure the urban freight transport field and to review urban freight transport
sustainability initiatives. The number of initiatives that is successfully implemented in
practice turns out to be quite low. In the review and the following analysis, we try to find
the barriers for successful implementation of the initiatives in practice. In the second part
we examine the impacts of the most commonly used local sustainability policies. Six time-
window scenarios and their impacts on the economical, environmental and social
sustainability are examined based on a multiple case study. Time-window regulations
increase both the environmental burden and distribution costs. Retail chains are affected
differently by time-window pressure and vehicle restrictions due to differences in their
logistical concept. Based on an experiment we examine the effects of retailers’ logistical
decisions in combination with local sustainability policies. Next, we examine the degree to
which retailers are able to deal with problems caused by time-windows. Combining the
primary and secondary distribution, i.e. factory gate pricing, results in more sustainable
distribution operations for the retailer and in less sensitivity towards time-window
regulations
ERIM
The Erasmus Research Institute of Management (ERIM) is the Research School (Onder -
zoek school) in the field of management of the Erasmus University Rotterdam. The founding
participants of ERIM are RSM Erasmus University and the Erasmus School of Econo mics.
ERIM was founded in 1999 and is officially accredited by the Royal Netherlands Academy
of Arts and Sciences (KNAW). The research undertaken by ERIM is focussed on the
management of the firm in its environment, its intra- and interfirm relations, and its busi -
ness processes in their interdependent connections.
The objective of ERIM is to carry out first rate research in manage ment, and to offer an
advanced doctoral pro gramme in Research in Management. Within ERIM, over three
hundred senior researchers and PhD candidates are active in the different research
programmes. From a variety of acade mic backgrounds and expertises, the ERIM commu nity
is united in striving for excellence and working at the fore front of creating new business
knowledge.
B&T28618 - Erim omslag Quak 21jan08