sustainability and earth resources: life cycle assessment modeling
TRANSCRIPT
Sustainability and Earth Resources: Life CycleAssessment Modeling
T. O’Shea,1,3 J. S. Golden1,2,3* and L. Olander31Nicholas School of the Environment, Duke University, Durham, NC, USA
2Duke Center for Sustainability and Commerce, Duke University, Durham, NC, USA3Nicholas Institute for Environmental Policy Solutions, Duke University, Durham, NC, USA
ABSTRACTCorporations are facing increasing risks associated with ecosystems from both natural drivers,such as climate change, as well as institutional drivers resulting from retailers and brands,increasingly making supplier decisions based on life cycle reporting and indexing. Theseefforts reflect a transition from traditional firm sustainability to a more quantitative productfocus, within which the importance and weight of earth resources and ecosystems isdramatically increasing. This paper provides an overview of the limitations traditional lifecycle assessment (LCA) methods and presents emerging developments to improve onLCA for resources and ecosystems. This includes LCA efforts to account for spatial relevance,indices of stress, stocks and flows and integrated valuation of services and trade-offs. Copyright© 2012 John Wiley & Sons, Ltd and ERP Environment.
Received 22 December 2011; revised 22 May 2012; accepted 29 May 2012
Keywords: sustainability; supply chain; environmental policy; LCA; earth resources; ecosystems
Introduction
BY2030, THE TOTAL GLOBAL POPULATION IS EXPECTED TO INCREASE FROM THE CURRENT 6 BILLION TO 9 BILLION AND THE
global middle class is projected to grow from 1 billion now to 4 billion (Golden et al., 2011; Wilson &Dragusanu, 2008). The coupled expansion of global population and consumption not only exacerbatesthe challenge of leading a global consumer society into a sustainable direction, but also highlights the
importance of protecting future supply chain resources in a more effective manner. Increased demand, fluctuatingenergy prices, geopolitical instability, and climatic impacts have increased global market prices for many earthresources, both renewable and non-renewable (Trostle, 2008). These risks have significant implications for theproduction and costs of future goods and services.
Global supply chains and procurement practices play a pivotal and increasingly important role in sustainability(Meehan and Byrde, 2011; Seuring, 2011) by directing the spatial and temporal variability of resource extractionand disturbances to ecological systems. Increasingly, the awareness by industry of the critical role of healthyecosystems in maintaining the environmental health and economic sustainability of societies is growing, aswitnessed by the development of industry consortia and aligned programs to quantify the environmental and socialimpacts of the supply chain (Golden et al., 2010; Bakshi and Small, 2011).
*Correspondence to: Dr Jay S. Golden, Director Duke Center for Sustainability and Commerce, Box 90467, 140 Science Drive – Room 102 H, Paul MGross Chemical Laboratory, Durham, NC 27708–0467, USA. E-mail: [email protected]
Copyright © 2012 John Wiley & Sons, Ltd and ERP Environment
Business Strategy and the EnvironmentBus. Strat. Env. (2012)Published online in Wiley Online Library(wileyonlinelibrary.com) DOI: 10.1002/bse.1745
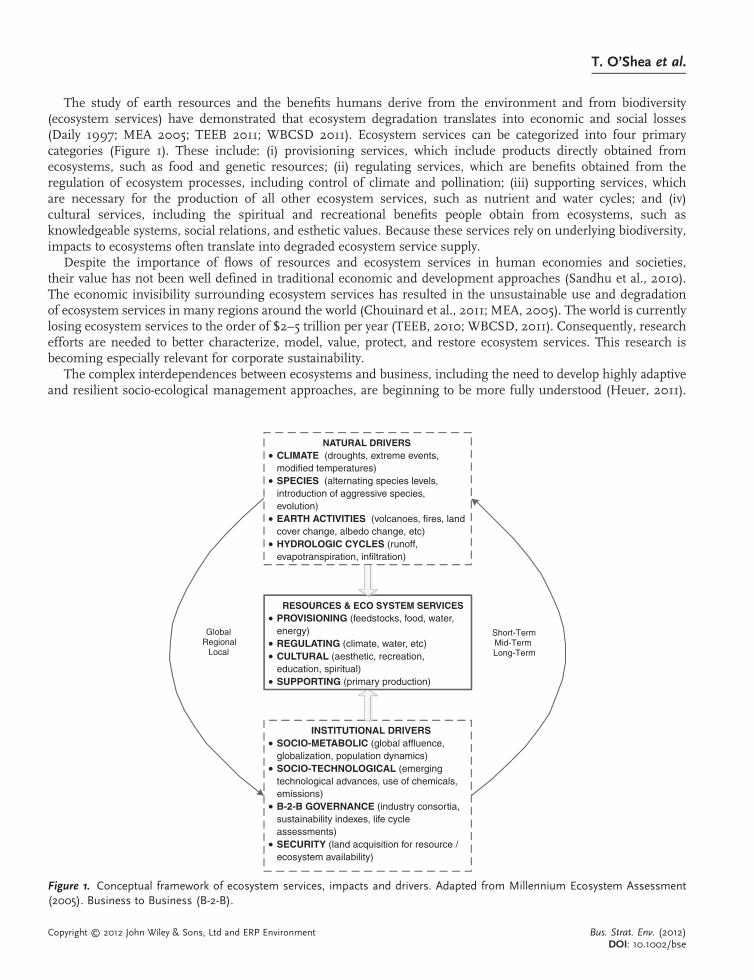
The study of earth resources and the benefits humans derive from the environment and from biodiversity(ecosystem services) have demonstrated that ecosystem degradation translates into economic and social losses(Daily 1997; MEA 2005; TEEB 2011; WBCSD 2011). Ecosystem services can be categorized into four primarycategories (Figure 1). These include: (i) provisioning services, which include products directly obtained fromecosystems, such as food and genetic resources; (ii) regulating services, which are benefits obtained from theregulation of ecosystem processes, including control of climate and pollination; (iii) supporting services, whichare necessary for the production of all other ecosystem services, such as nutrient and water cycles; and (iv)cultural services, including the spiritual and recreational benefits people obtain from ecosystems, such asknowledgeable systems, social relations, and esthetic values. Because these services rely on underlying biodiversity,impacts to ecosystems often translate into degraded ecosystem service supply.
Despite the importance of flows of resources and ecosystem services in human economies and societies,their value has not been well defined in traditional economic and development approaches (Sandhu et al., 2010).The economic invisibility surrounding ecosystem services has resulted in the unsustainable use and degradationof ecosystem services in many regions around the world (Chouinard et al., 2011; MEA, 2005). The world is currentlylosing ecosystem services to the order of $2–5 trillion per year (TEEB, 2010; WBCSD, 2011). Consequently, researchefforts are needed to better characterize, model, value, protect, and restore ecosystem services. This research isbecoming especially relevant for corporate sustainability.
The complex interdependences between ecosystems and business, including the need to develop highly adaptiveand resilient socio-ecological management approaches, are beginning to be more fully understood (Heuer, 2011).
RESOURCES & ECO SYSTEM SERVICESPROVISIONING (feedstocks, food, water,energy)REGULATING (climate, water, etc)CULTURAL (aesthetic, recreation,education, spiritual)SUPPORTING (primary production)
INSTITUTIONAL DRIVERSSOCIO-METABOLIC (global affluence,globalization, population dynamics)SOCIO-TECHNOLOGICAL (emergingtechnological advances, use of chemicals,emissions)B-2-B GOVERNANCE (industry consortia,sustainability indexes, life cycleassessments)SECURITY (land acquisition for resource /ecosystem availability)
NATURAL DRIVERSCLIMATE (droughts, extreme events,modified temperatures)SPECIES (alternating species levels, introduction of aggressive species, evolution)EARTH ACTIVITIES (volcanoes, fires, landcover change, albedo change, etc)HYDROLOGIC CYCLES (runoff,evapotranspiration, infiltration)
GlobalRegional
Local
Short-TermMid-TermLong-Term
Figure 1. Conceptual framework of ecosystem services, impacts and drivers. Adapted from Millennium Ecosystem Assessment(2005). Business to Business (B-2-B).
T. O’Shea et al.
Copyright © 2012 John Wiley & Sons, Ltd and ERP Environment Bus. Strat. Env. (2012)DOI: 10.1002/bse
Although resources and ecosystems have been largely ignored in traditional ‘hard’measures that are used to informbusiness decision-making, members of the business community are beginning to realize that the value of ecosystemservices has a real impact on longer-term supply chain engagement and near-term business performance.
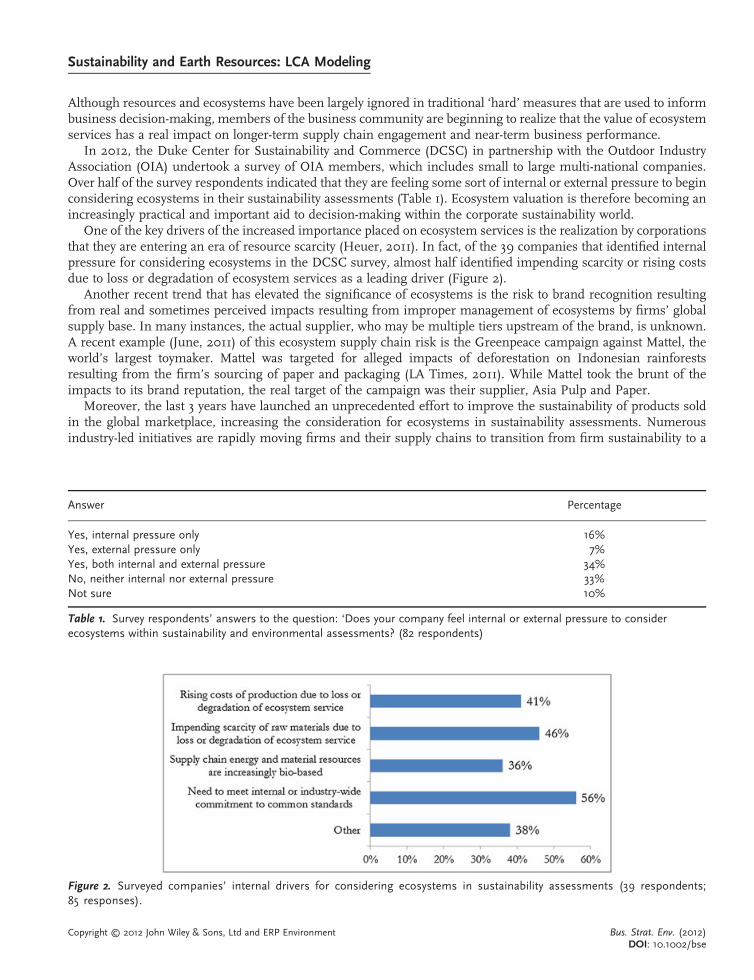
In 2012, the Duke Center for Sustainability and Commerce (DCSC) in partnership with the Outdoor IndustryAssociation (OIA) undertook a survey of OIA members, which includes small to large multi-national companies.Over half of the survey respondents indicated that they are feeling some sort of internal or external pressure to beginconsidering ecosystems in their sustainability assessments (Table 1). Ecosystem valuation is therefore becoming anincreasingly practical and important aid to decision-making within the corporate sustainability world.
One of the key drivers of the increased importance placed on ecosystem services is the realization by corporationsthat they are entering an era of resource scarcity (Heuer, 2011). In fact, of the 39 companies that identified internalpressure for considering ecosystems in the DCSC survey, almost half identified impending scarcity or rising costsdue to loss or degradation of ecosystem services as a leading driver (Figure 2).
Another recent trend that has elevated the significance of ecosystems is the risk to brand recognition resultingfrom real and sometimes perceived impacts resulting from improper management of ecosystems by firms’ globalsupply base. In many instances, the actual supplier, who may be multiple tiers upstream of the brand, is unknown.A recent example (June, 2011) of this ecosystem supply chain risk is the Greenpeace campaign against Mattel, theworld’s largest toymaker. Mattel was targeted for alleged impacts of deforestation on Indonesian rainforestsresulting from the firm’s sourcing of paper and packaging (LA Times, 2011). While Mattel took the brunt of theimpacts to its brand reputation, the real target of the campaign was their supplier, Asia Pulp and Paper.
Moreover, the last 3 years have launched an unprecedented effort to improve the sustainability of products soldin the global marketplace, increasing the consideration for ecosystems in sustainability assessments. Numerousindustry-led initiatives are rapidly moving firms and their supply chains to transition from firm sustainability to a
Answer Percentage
Yes, internal pressure only 16%Yes, external pressure only 7%Yes, both internal and external pressure 34%No, neither internal nor external pressure 33%Not sure 10%
Table 1. Survey respondents’ answers to the question: ‘Does your company feel internal or external pressure to considerecosystems within sustainability and environmental assessments? (82 respondents)
Figure 2. Surveyed companies’ internal drivers for considering ecosystems in sustainability assessments (39 respondents;85 responses).
Sustainability and Earth Resources: LCA Modeling
Copyright © 2012 John Wiley & Sons, Ltd and ERP Environment Bus. Strat. Env. (2012)DOI: 10.1002/bse
more quantitative product sustainability focus, and several companies have identified the need to meet sustainabilitycommitments as a reason to consider ecosystems (Golden et al., 2011). Such initiatives include the development ofWalmart’s Sustainability Index, as well as the creation and adoption of the Eco Index by global apparel (SustainableApparel Coalition) and outdoor industries (the OIA). Simultaneously, national governments are also developingregulatory frameworks and programs to address environmental impacts from a systems’ lens rather than from astrictly mechanistic approach. Such initiatives include the French government’s Granelle II law, which requiresthe quantification of the impacts of products on climate and natural resources, and the United States’ ExecutiveOrder 13514 (issued by President Obama on 5 October 2009), which requires federal agencies to reach certaintargets for greenhouse gas reduction, solid waste diversion, paper recycling, and energy efficiency (Golden et al., 2011).
The combination of circumstantial drivers and improvements in technical sustainability standards are encourag-ing the impacts on ecosystems to be quantified and internally accounted for and considered (Chouinard et al., 2011;Bakshi and Small, 2011). This is happening through the utilization of life cycle assessment (LCA) methodologies.However, as presented by Korhonen and Seager (2008), current sustainability efforts by firms are focused oneco-efficiency and reductions in costs, burdens, and risks and do not consider resiliency. The issue of resiliency,or the ability of resources and services to achieve a state of equilibrium, is of significant importance due to bothnatural and institutional drivers for the consumption and management of resources (Figure 1).
The Millennium Ecosystem Assessment (2005) has determined that the majority of the world’s valuableecosystem services are being degraded or used unsustainably, and many stakeholders are beginning to identify thisas both a significant risk and an opportunity for businesses (McKinsey & Co., 2010; WBCSD, 2011; BSR, 2011). Withincreasing evidence that a disregard for ecosystems in life cycle calculations may encourage unsustainable relianceon deteriorating ecosystem services (Zhang et al., 2010b), alternative approaches are emerging to more fullyincorporate ecosystem services into LCA.
The focus of this paper is to present the current state of how ecosystem services are being incorporated into LCAand to encourage the research and business community to further improve upon the frameworks in an effort tominimize unintended consequences to nature and commerce.
Limitations of Current Life Cycle Assessment Methods
LCA is a tool that is being increasingly utilized to yield an environmental profile of product systems. It is designedto assess the environmental burden and material and energy consumption of a product across its entire life,accounting for resource extraction, manufacturing, distribution, use, and post-use (Rebitzer et al., 2004; ISO,2006; UNEP and SETAC, 2007). LCA is fundamentally an engineering tool, assessing technical systems andhighlighting ‘hotspots’ where potential changes may be made for improvement of the environmental impact ofproduct systems. At the same time, it is also a multi-disciplinary tool, modeling impacts on the natural environmentand people’s relations to such impacts (Baumann and Tillman, 2004).
LCA employs a standardized framework to describe the environmental aspects and potential impacts through-out the life cycle of a product or service. This framework comprises four steps (ISO, 2006; Baumann andTillman, 2004; UNEP, 2009): (i) scope and definition of the goals, in which the product or service to be studiedand the purpose of the LCA are specified; (ii) life cycle inventory, in which the life cycle model is constructedand the emissions produced and resources used during the life cycle are calculated; (iii) impact assessment,in which the emissions and resources are related to various environmental problems through the acts ofclassification and characterization; and (iv) improvement analysis, in which the findings of the inventory andimpact assessment are combined consistent with the defined goal and scope in order to reach conclusionsand recommendations.
Although its framework is standardized, LCA methodology is constantly evolving as engineering decision-making and interpretive analysis improve our understanding and application of LCA results. As a very commonapproach for assessing the broader environmental impact of production processes, LCA is often the subject ofintense research activity, especially over the last several years (Zhang et al., 2010a). For example, recognizing
T. O’Shea et al.
Copyright © 2012 John Wiley & Sons, Ltd and ERP Environment Bus. Strat. Env. (2012)DOI: 10.1002/bse
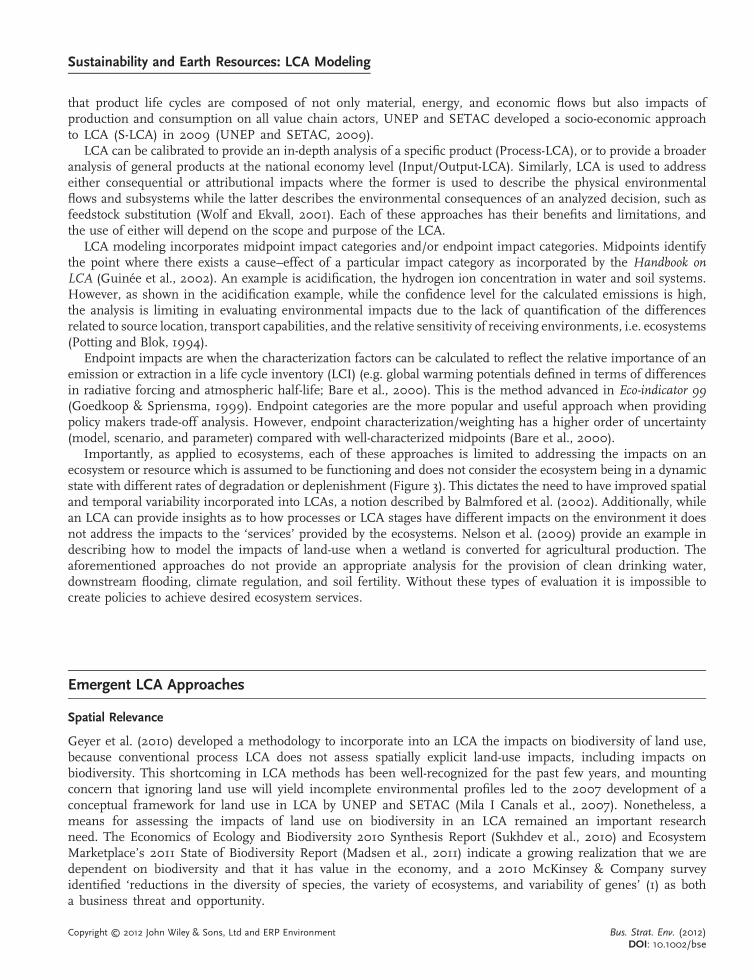
that product life cycles are composed of not only material, energy, and economic flows but also impacts ofproduction and consumption on all value chain actors, UNEP and SETAC developed a socio-economic approachto LCA (S-LCA) in 2009 (UNEP and SETAC, 2009).
LCA can be calibrated to provide an in-depth analysis of a specific product (Process-LCA), or to provide a broaderanalysis of general products at the national economy level (Input/Output-LCA). Similarly, LCA is used to addresseither consequential or attributional impacts where the former is used to describe the physical environmentalflows and subsystems while the latter describes the environmental consequences of an analyzed decision, such asfeedstock substitution (Wolf and Ekvall, 2001). Each of these approaches has their benefits and limitations, andthe use of either will depend on the scope and purpose of the LCA.
LCA modeling incorporates midpoint impact categories and/or endpoint impact categories. Midpoints identifythe point where there exists a cause–effect of a particular impact category as incorporated by the Handbook onLCA (Guinée et al., 2002). An example is acidification, the hydrogen ion concentration in water and soil systems.However, as shown in the acidification example, while the confidence level for the calculated emissions is high,the analysis is limiting in evaluating environmental impacts due to the lack of quantification of the differencesrelated to source location, transport capabilities, and the relative sensitivity of receiving environments, i.e. ecosystems(Potting and Blok, 1994).
Endpoint impacts are when the characterization factors can be calculated to reflect the relative importance of anemission or extraction in a life cycle inventory (LCI) (e.g. global warming potentials defined in terms of differencesin radiative forcing and atmospheric half-life; Bare et al., 2000). This is the method advanced in Eco-indicator 99(Goedkoop & Spriensma, 1999). Endpoint categories are the more popular and useful approach when providingpolicy makers trade-off analysis. However, endpoint characterization/weighting has a higher order of uncertainty(model, scenario, and parameter) compared with well-characterized midpoints (Bare et al., 2000).
Importantly, as applied to ecosystems, each of these approaches is limited to addressing the impacts on anecosystem or resource which is assumed to be functioning and does not consider the ecosystem being in a dynamicstate with different rates of degradation or deplenishment (Figure 3). This dictates the need to have improved spatialand temporal variability incorporated into LCAs, a notion described by Balmfored et al. (2002). Additionally, whilean LCA can provide insights as to how processes or LCA stages have different impacts on the environment it doesnot address the impacts to the ‘services’ provided by the ecosystems. Nelson et al. (2009) provide an example indescribing how to model the impacts of land-use when a wetland is converted for agricultural production. Theaforementioned approaches do not provide an appropriate analysis for the provision of clean drinking water,downstream flooding, climate regulation, and soil fertility. Without these types of evaluation it is impossible tocreate policies to achieve desired ecosystem services.
Emergent LCA Approaches
Spatial Relevance
Geyer et al. (2010) developed a methodology to incorporate into an LCA the impacts on biodiversity of land use,because conventional process LCA does not assess spatially explicit land-use impacts, including impacts onbiodiversity. This shortcoming in LCA methods has been well-recognized for the past few years, and mountingconcern that ignoring land use will yield incomplete environmental profiles led to the 2007 development of aconceptual framework for land use in LCA by UNEP and SETAC (Mila I Canals et al., 2007). Nonetheless, ameans for assessing the impacts of land use on biodiversity in an LCA remained an important researchneed. The Economics of Ecology and Biodiversity 2010 Synthesis Report (Sukhdev et al., 2010) and EcosystemMarketplace’s 2011 State of Biodiversity Report (Madsen et al., 2011) indicate a growing realization that we aredependent on biodiversity and that it has value in the economy, and a 2010 McKinsey & Company surveyidentified ‘reductions in the diversity of species, the variety of ecosystems, and variability of genes’ (1) as botha business threat and opportunity.
Sustainability and Earth Resources: LCA Modeling
Copyright © 2012 John Wiley & Sons, Ltd and ERP Environment Bus. Strat. Env. (2012)DOI: 10.1002/bse
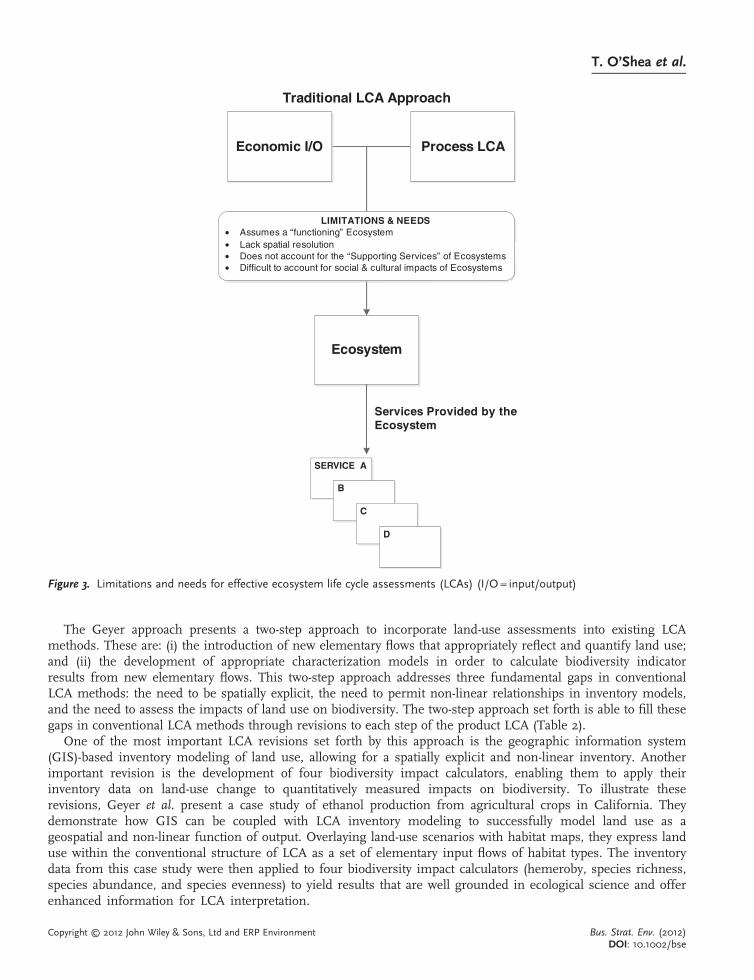
The Geyer approach presents a two-step approach to incorporate land-use assessments into existing LCAmethods. These are: (i) the introduction of new elementary flows that appropriately reflect and quantify land use;and (ii) the development of appropriate characterization models in order to calculate biodiversity indicatorresults from new elementary flows. This two-step approach addresses three fundamental gaps in conventionalLCA methods: the need to be spatially explicit, the need to permit non-linear relationships in inventory models,and the need to assess the impacts of land use on biodiversity. The two-step approach set forth is able to fill thesegaps in conventional LCA methods through revisions to each step of the product LCA (Table 2).
One of the most important LCA revisions set forth by this approach is the geographic information system(GIS)-based inventory modeling of land use, allowing for a spatially explicit and non-linear inventory. Anotherimportant revision is the development of four biodiversity impact calculators, enabling them to apply theirinventory data on land-use change to quantitatively measured impacts on biodiversity. To illustrate theserevisions, Geyer et al. present a case study of ethanol production from agricultural crops in California. Theydemonstrate how GIS can be coupled with LCA inventory modeling to successfully model land use as ageospatial and non-linear function of output. Overlaying land-use scenarios with habitat maps, they express landuse within the conventional structure of LCA as a set of elementary input flows of habitat types. The inventorydata from this case study were then applied to four biodiversity impact calculators (hemeroby, species richness,species abundance, and species evenness) to yield results that are well grounded in ecological science and offerenhanced information for LCA interpretation.
Ecosystem
SERVICE A
B
C
D
Services Provided by the Ecosystem
Process LCAEconomic I/O
Traditional LCA Approach
LIMITATIONS & NEEDS • Assumes a “functioning” Ecosystem• Lack spatial resolution • Does not account for the “Supporting Services” of Ecosystems • Difficult to account for social & cultural impacts of Ecosystems
Figure 3. Limitations and needs for effective ecosystem life cycle assessments (LCAs) (I/O = input/output)
T. O’Shea et al.
Copyright © 2012 John Wiley & Sons, Ltd and ERP Environment Bus. Strat. Env. (2012)DOI: 10.1002/bse
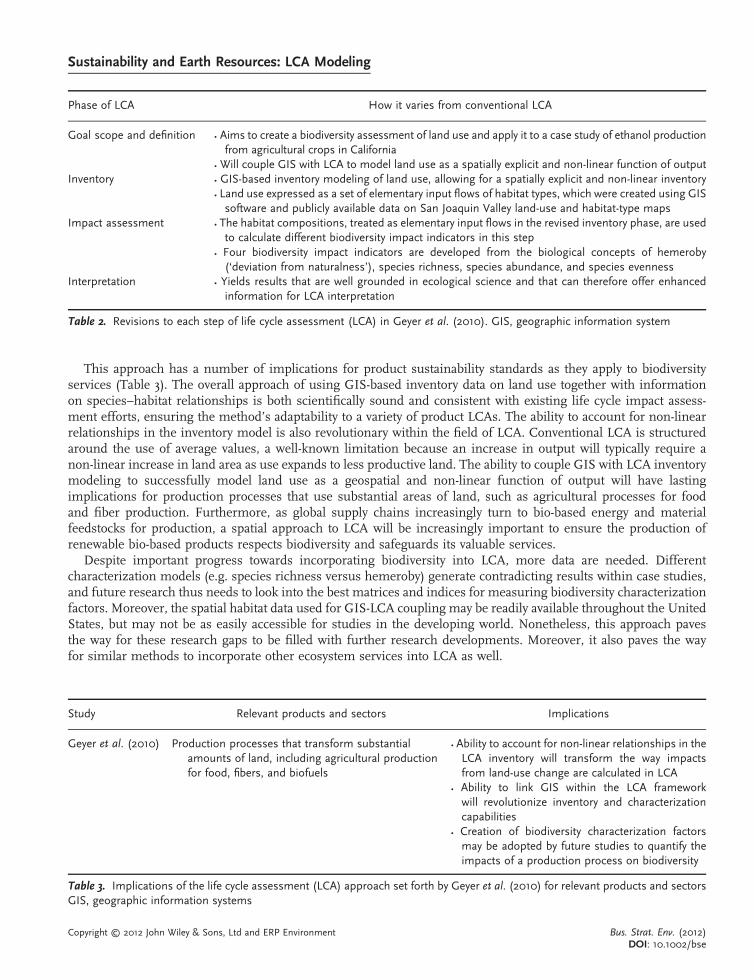
This approach has a number of implications for product sustainability standards as they apply to biodiversityservices (Table 3). The overall approach of using GIS-based inventory data on land use together with informationon species–habitat relationships is both scientifically sound and consistent with existing life cycle impact assess-ment efforts, ensuring the method’s adaptability to a variety of product LCAs. The ability to account for non-linearrelationships in the inventory model is also revolutionary within the field of LCA. Conventional LCA is structuredaround the use of average values, a well-known limitation because an increase in output will typically require anon-linear increase in land area as use expands to less productive land. The ability to couple GIS with LCA inventorymodeling to successfully model land use as a geospatial and non-linear function of output will have lastingimplications for production processes that use substantial areas of land, such as agricultural processes for foodand fiber production. Furthermore, as global supply chains increasingly turn to bio-based energy and materialfeedstocks for production, a spatial approach to LCA will be increasingly important to ensure the production ofrenewable bio-based products respects biodiversity and safeguards its valuable services.
Despite important progress towards incorporating biodiversity into LCA, more data are needed. Differentcharacterization models (e.g. species richness versus hemeroby) generate contradicting results within case studies,and future research thus needs to look into the best matrices and indices for measuring biodiversity characterizationfactors. Moreover, the spatial habitat data used for GIS-LCA coupling may be readily available throughout the UnitedStates, but may not be as easily accessible for studies in the developing world. Nonetheless, this approach pavesthe way for these research gaps to be filled with further research developments. Moreover, it also paves the wayfor similar methods to incorporate other ecosystem services into LCA as well.
Study Relevant products and sectors Implications
Geyer et al. (2010) Production processes that transform substantialamounts of land, including agricultural productionfor food, fibers, and biofuels
• Ability to account for non-linear relationships in theLCA inventory will transform the way impactsfrom land-use change are calculated in LCA
• Ability to link GIS within the LCA frameworkwill revolutionize inventory and characterizationcapabilities
• Creation of biodiversity characterization factorsmay be adopted by future studies to quantify theimpacts of a production process on biodiversity
Table 3. Implications of the life cycle assessment (LCA) approach set forth by Geyer et al. (2010) for relevant products and sectorsGIS, geographic information systems
Phase of LCA How it varies from conventional LCA
Goal scope and definition • Aims to create a biodiversity assessment of land use and apply it to a case study of ethanol productionfrom agricultural crops in California
• Will couple GIS with LCA to model land use as a spatially explicit and non-linear function of outputInventory • GIS-based inventory modeling of land use, allowing for a spatially explicit and non-linear inventory
• Land use expressed as a set of elementary input flows of habitat types, which were created using GISsoftware and publicly available data on San Joaquin Valley land-use and habitat-type maps
Impact assessment • The habitat compositions, treated as elementary input flows in the revised inventory phase, are usedto calculate different biodiversity impact indicators in this step
• Four biodiversity impact indicators are developed from the biological concepts of hemeroby(‘deviation from naturalness’), species richness, species abundance, and species evenness
Interpretation • Yields results that are well grounded in ecological science and that can therefore offer enhancedinformation for LCA interpretation
Table 2. Revisions to each step of life cycle assessment (LCA) in Geyer et al. (2010). GIS, geographic information system
Sustainability and Earth Resources: LCA Modeling
Copyright © 2012 John Wiley & Sons, Ltd and ERP Environment Bus. Strat. Env. (2012)DOI: 10.1002/bse
Indices of Stress
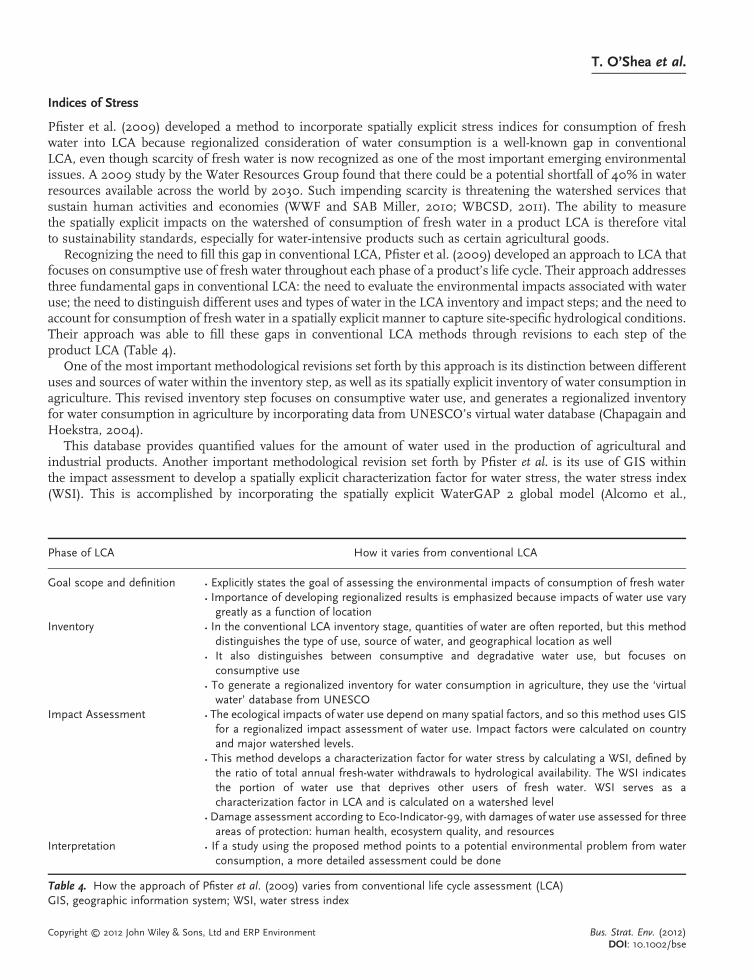
Pfister et al. (2009) developed a method to incorporate spatially explicit stress indices for consumption of freshwater into LCA because regionalized consideration of water consumption is a well-known gap in conventionalLCA, even though scarcity of fresh water is now recognized as one of the most important emerging environmentalissues. A 2009 study by the Water Resources Group found that there could be a potential shortfall of 40% in waterresources available across the world by 2030. Such impending scarcity is threatening the watershed services thatsustain human activities and economies (WWF and SAB Miller, 2010; WBCSD, 2011). The ability to measurethe spatially explicit impacts on the watershed of consumption of fresh water in a product LCA is therefore vitalto sustainability standards, especially for water-intensive products such as certain agricultural goods.
Recognizing the need to fill this gap in conventional LCA, Pfister et al. (2009) developed an approach to LCA thatfocuses on consumptive use of fresh water throughout each phase of a product’s life cycle. Their approach addressesthree fundamental gaps in conventional LCA: the need to evaluate the environmental impacts associated with wateruse; the need to distinguish different uses and types of water in the LCA inventory and impact steps; and the need toaccount for consumption of fresh water in a spatially explicit manner to capture site-specific hydrological conditions.Their approach was able to fill these gaps in conventional LCA methods through revisions to each step of theproduct LCA (Table 4).
One of the most important methodological revisions set forth by this approach is its distinction between differentuses and sources of water within the inventory step, as well as its spatially explicit inventory of water consumption inagriculture. This revised inventory step focuses on consumptive water use, and generates a regionalized inventoryfor water consumption in agriculture by incorporating data from UNESCO’s virtual water database (Chapagain andHoekstra, 2004).
This database provides quantified values for the amount of water used in the production of agricultural andindustrial products. Another important methodological revision set forth by Pfister et al. is its use of GIS withinthe impact assessment to develop a spatially explicit characterization factor for water stress, the water stress index(WSI). This is accomplished by incorporating the spatially explicit WaterGAP 2 global model (Alcomo et al.,
Phase of LCA How it varies from conventional LCA
Goal scope and definition • Explicitly states the goal of assessing the environmental impacts of consumption of fresh water• Importance of developing regionalized results is emphasized because impacts of water use varygreatly as a function of location
Inventory • In the conventional LCA inventory stage, quantities of water are often reported, but this methoddistinguishes the type of use, source of water, and geographical location as well
• It also distinguishes between consumptive and degradative water use, but focuses onconsumptive use
• To generate a regionalized inventory for water consumption in agriculture, they use the ‘virtualwater’ database from UNESCO
Impact Assessment • The ecological impacts of water use depend on many spatial factors, and so this method uses GISfor a regionalized impact assessment of water use. Impact factors were calculated on countryand major watershed levels.
• This method develops a characterization factor for water stress by calculating a WSI, defined bythe ratio of total annual fresh-water withdrawals to hydrological availability. The WSI indicatesthe portion of water use that deprives other users of fresh water. WSI serves as acharacterization factor in LCA and is calculated on a watershed level
• Damage assessment according to Eco-Indicator-99, with damages of water use assessed for threeareas of protection: human health, ecosystem quality, and resources
Interpretation • If a study using the proposed method points to a potential environmental problem from waterconsumption, a more detailed assessment could be done
Table 4. How the approach of Pfister et al. (2009) varies from conventional life cycle assessment (LCA)GIS, geographic information system; WSI, water stress index
T. O’Shea et al.
Copyright © 2012 John Wiley & Sons, Ltd and ERP Environment Bus. Strat. Env. (2012)DOI: 10.1002/bse
2003), which consists of both hydrological and socio-economic data and quantifies annual freshwater availabilityand withdrawals for different users at the watershed level across the world. The WSI is thus defined by the ratioof total annual fresh-water withdrawals to site-specific hydrological availability, indicating the portion of wateruse in the production process that deprives other regional users of fresh water. The WSI calculation is then cor-rected for increased effective water stress by introducing a variation factor to calculate modified water availabilityfor watersheds with strongly regulated flows (Pfister et al., 2009).
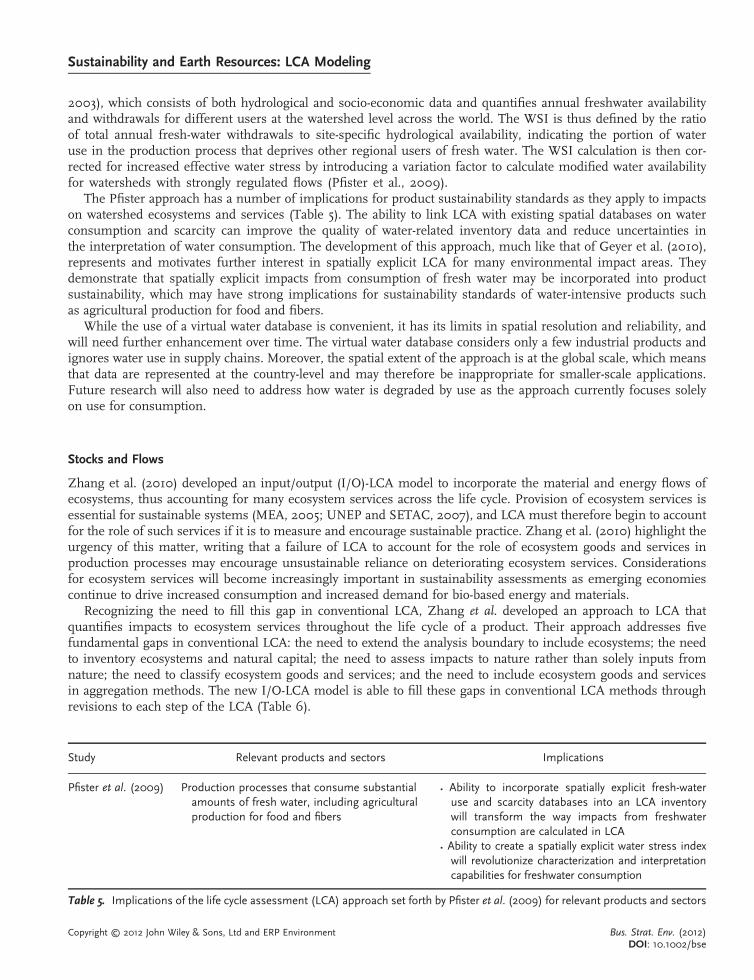
The Pfister approach has a number of implications for product sustainability standards as they apply to impactson watershed ecosystems and services (Table 5). The ability to link LCA with existing spatial databases on waterconsumption and scarcity can improve the quality of water-related inventory data and reduce uncertainties inthe interpretation of water consumption. The development of this approach, much like that of Geyer et al. (2010),represents and motivates further interest in spatially explicit LCA for many environmental impact areas. Theydemonstrate that spatially explicit impacts from consumption of fresh water may be incorporated into productsustainability, which may have strong implications for sustainability standards of water-intensive products suchas agricultural production for food and fibers.
While the use of a virtual water database is convenient, it has its limits in spatial resolution and reliability, andwill need further enhancement over time. The virtual water database considers only a few industrial products andignores water use in supply chains. Moreover, the spatial extent of the approach is at the global scale, which meansthat data are represented at the country-level and may therefore be inappropriate for smaller-scale applications.Future research will also need to address how water is degraded by use as the approach currently focuses solelyon use for consumption.
Stocks and Flows
Zhang et al. (2010) developed an input/output (I/O)-LCA model to incorporate the material and energy flows ofecosystems, thus accounting for many ecosystem services across the life cycle. Provision of ecosystem services isessential for sustainable systems (MEA, 2005; UNEP and SETAC, 2007), and LCA must therefore begin to accountfor the role of such services if it is to measure and encourage sustainable practice. Zhang et al. (2010) highlight theurgency of this matter, writing that a failure of LCA to account for the role of ecosystem goods and services inproduction processes may encourage unsustainable reliance on deteriorating ecosystem services. Considerationsfor ecosystem services will become increasingly important in sustainability assessments as emerging economiescontinue to drive increased consumption and increased demand for bio-based energy and materials.
Recognizing the need to fill this gap in conventional LCA, Zhang et al. developed an approach to LCA thatquantifies impacts to ecosystem services throughout the life cycle of a product. Their approach addresses fivefundamental gaps in conventional LCA: the need to extend the analysis boundary to include ecosystems; the needto inventory ecosystems and natural capital; the need to assess impacts to nature rather than solely inputs fromnature; the need to classify ecosystem goods and services; and the need to include ecosystem goods and servicesin aggregation methods. The new I/O-LCA model is able to fill these gaps in conventional LCA methods throughrevisions to each step of the LCA (Table 6).
Study Relevant products and sectors Implications
Pfister et al. (2009) Production processes that consume substantialamounts of fresh water, including agriculturalproduction for food and fibers
• Ability to incorporate spatially explicit fresh-wateruse and scarcity databases into an LCA inventorywill transform the way impacts from freshwaterconsumption are calculated in LCA
• Ability to create a spatially explicit water stress indexwill revolutionize characterization and interpretationcapabilities for freshwater consumption
Table 5. Implications of the life cycle assessment (LCA) approach set forth by Pfister et al. (2009) for relevant products and sectors
Sustainability and Earth Resources: LCA Modeling
Copyright © 2012 John Wiley & Sons, Ltd and ERP Environment Bus. Strat. Env. (2012)DOI: 10.1002/bse
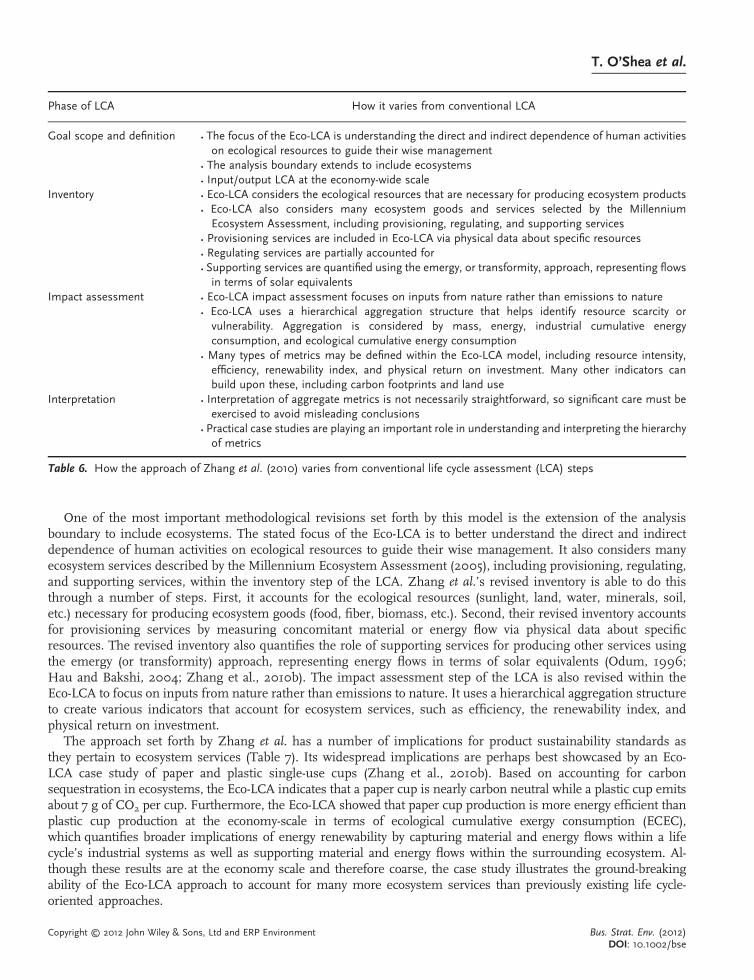
One of the most important methodological revisions set forth by this model is the extension of the analysisboundary to include ecosystems. The stated focus of the Eco-LCA is to better understand the direct and indirectdependence of human activities on ecological resources to guide their wise management. It also considers manyecosystem services described by the Millennium Ecosystem Assessment (2005), including provisioning, regulating,and supporting services, within the inventory step of the LCA. Zhang et al.’s revised inventory is able to do thisthrough a number of steps. First, it accounts for the ecological resources (sunlight, land, water, minerals, soil,etc.) necessary for producing ecosystem goods (food, fiber, biomass, etc.). Second, their revised inventory accountsfor provisioning services by measuring concomitant material or energy flow via physical data about specificresources. The revised inventory also quantifies the role of supporting services for producing other services usingthe emergy (or transformity) approach, representing energy flows in terms of solar equivalents (Odum, 1996;Hau and Bakshi, 2004; Zhang et al., 2010b). The impact assessment step of the LCA is also revised within theEco-LCA to focus on inputs from nature rather than emissions to nature. It uses a hierarchical aggregation structureto create various indicators that account for ecosystem services, such as efficiency, the renewability index, andphysical return on investment.
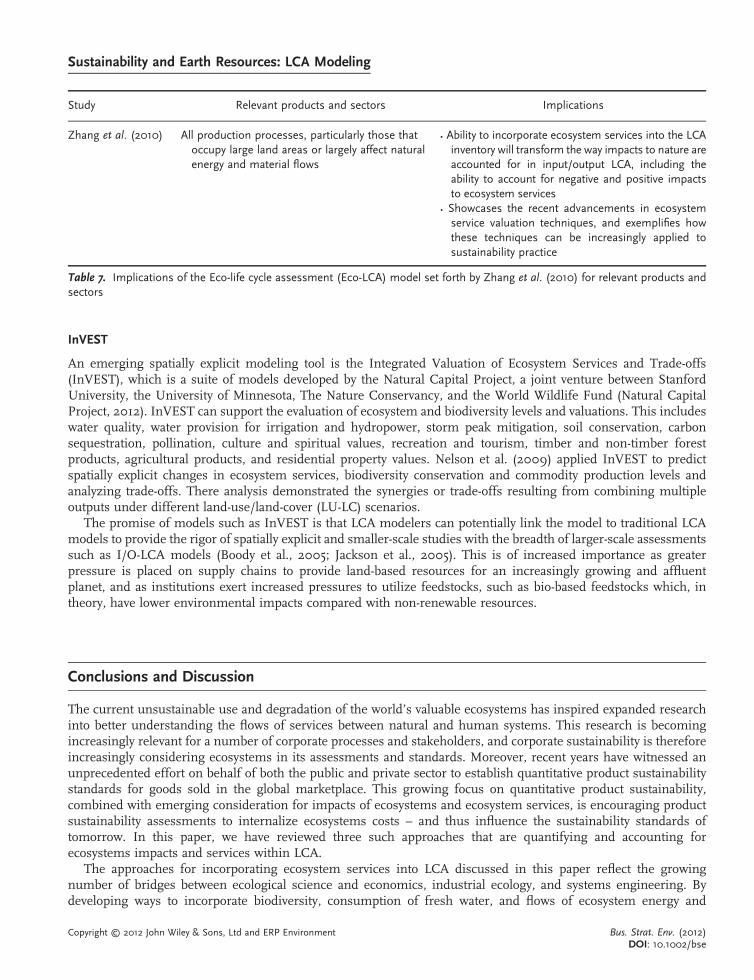
The approach set forth by Zhang et al. has a number of implications for product sustainability standards asthey pertain to ecosystem services (Table 7). Its widespread implications are perhaps best showcased by an Eco-LCA case study of paper and plastic single-use cups (Zhang et al., 2010b). Based on accounting for carbonsequestration in ecosystems, the Eco-LCA indicates that a paper cup is nearly carbon neutral while a plastic cup emitsabout 7 g of CO2 per cup. Furthermore, the Eco-LCA showed that paper cup production is more energy efficient thanplastic cup production at the economy-scale in terms of ecological cumulative exergy consumption (ECEC),which quantifies broader implications of energy renewability by capturing material and energy flows within a lifecycle’s industrial systems as well as supporting material and energy flows within the surrounding ecosystem. Al-though these results are at the economy scale and therefore coarse, the case study illustrates the ground-breakingability of the Eco-LCA approach to account for many more ecosystem services than previously existing life cycle-oriented approaches.
Phase of LCA How it varies from conventional LCA
Goal scope and definition • The focus of the Eco-LCA is understanding the direct and indirect dependence of human activitieson ecological resources to guide their wise management
• The analysis boundary extends to include ecosystems• Input/output LCA at the economy-wide scale
Inventory • Eco-LCA considers the ecological resources that are necessary for producing ecosystem products• Eco-LCA also considers many ecosystem goods and services selected by the MillenniumEcosystem Assessment, including provisioning, regulating, and supporting services
• Provisioning services are included in Eco-LCA via physical data about specific resources• Regulating services are partially accounted for• Supporting services are quantified using the emergy, or transformity, approach, representing flowsin terms of solar equivalents
Impact assessment • Eco-LCA impact assessment focuses on inputs from nature rather than emissions to nature• Eco-LCA uses a hierarchical aggregation structure that helps identify resource scarcity orvulnerability. Aggregation is considered by mass, energy, industrial cumulative energyconsumption, and ecological cumulative energy consumption
• Many types of metrics may be defined within the Eco-LCA model, including resource intensity,efficiency, renewability index, and physical return on investment. Many other indicators canbuild upon these, including carbon footprints and land use
Interpretation • Interpretation of aggregate metrics is not necessarily straightforward, so significant care must beexercised to avoid misleading conclusions
• Practical case studies are playing an important role in understanding and interpreting the hierarchyof metrics
Table 6. How the approach of Zhang et al. (2010) varies from conventional life cycle assessment (LCA) steps
T. O’Shea et al.
Copyright © 2012 John Wiley & Sons, Ltd and ERP Environment Bus. Strat. Env. (2012)DOI: 10.1002/bse
InVEST
An emerging spatially explicit modeling tool is the Integrated Valuation of Ecosystem Services and Trade-offs(InVEST), which is a suite of models developed by the Natural Capital Project, a joint venture between StanfordUniversity, the University of Minnesota, The Nature Conservancy, and the World Wildlife Fund (Natural CapitalProject, 2012). InVEST can support the evaluation of ecosystem and biodiversity levels and valuations. This includeswater quality, water provision for irrigation and hydropower, storm peak mitigation, soil conservation, carbonsequestration, pollination, culture and spiritual values, recreation and tourism, timber and non-timber forestproducts, agricultural products, and residential property values. Nelson et al. (2009) applied InVEST to predictspatially explicit changes in ecosystem services, biodiversity conservation and commodity production levels andanalyzing trade-offs. There analysis demonstrated the synergies or trade-offs resulting from combining multipleoutputs under different land-use/land-cover (LU-LC) scenarios.
The promise of models such as InVEST is that LCA modelers can potentially link the model to traditional LCAmodels to provide the rigor of spatially explicit and smaller-scale studies with the breadth of larger-scale assessmentssuch as I/O-LCA models (Boody et al., 2005; Jackson et al., 2005). This is of increased importance as greaterpressure is placed on supply chains to provide land-based resources for an increasingly growing and affluentplanet, and as institutions exert increased pressures to utilize feedstocks, such as bio-based feedstocks which, intheory, have lower environmental impacts compared with non-renewable resources.
Conclusions and Discussion
The current unsustainable use and degradation of the world’s valuable ecosystems has inspired expanded researchinto better understanding the flows of services between natural and human systems. This research is becomingincreasingly relevant for a number of corporate processes and stakeholders, and corporate sustainability is thereforeincreasingly considering ecosystems in its assessments and standards. Moreover, recent years have witnessed anunprecedented effort on behalf of both the public and private sector to establish quantitative product sustainabilitystandards for goods sold in the global marketplace. This growing focus on quantitative product sustainability,combined with emerging consideration for impacts of ecosystems and ecosystem services, is encouraging productsustainability assessments to internalize ecosystems costs – and thus influence the sustainability standards oftomorrow. In this paper, we have reviewed three such approaches that are quantifying and accounting forecosystems impacts and services within LCA.
The approaches for incorporating ecosystem services into LCA discussed in this paper reflect the growingnumber of bridges between ecological science and economics, industrial ecology, and systems engineering. Bydeveloping ways to incorporate biodiversity, consumption of fresh water, and flows of ecosystem energy and
Study Relevant products and sectors Implications
Zhang et al. (2010) All production processes, particularly those thatoccupy large land areas or largely affect naturalenergy and material flows
• Ability to incorporate ecosystem services into the LCAinventory will transform the way impacts to nature areaccounted for in input/output LCA, including theability to account for negative and positive impactsto ecosystem services
• Showcases the recent advancements in ecosystemservice valuation techniques, and exemplifies howthese techniques can be increasingly applied tosustainability practice
Table 7. Implications of the Eco-life cycle assessment (Eco-LCA) model set forth by Zhang et al. (2010) for relevant products andsectors
Sustainability and Earth Resources: LCA Modeling
Copyright © 2012 John Wiley & Sons, Ltd and ERP Environment Bus. Strat. Env. (2012)DOI: 10.1002/bse
resources into LCA, these methodological innovations are establishing more accurate ways to represent and accountfor impacts on ecosystems and ecosystem services in quantified sustainability assessments. The recent work ofresearchers to couple LCA with GIS also suggests a continued evolution of spatial considerations within the LCAframework. While these methods present a variety of innovative approaches, further research and data will beneeded to refine them and make them operational.
The implications of these methodological improvements for quantified product sustainability assessments aretremendous, and industry actors should therefore anticipate increased consideration for ecosystem impacts andservices in quantified product sustainability standards. These implications are important for all productionprocesses, but especially important for those that utilize large amounts of land, fresh water, and non-renewableenergy sources. As life cycle-oriented sustainability assessments continue to expand upon quantifiable metrics forimpacts on ecosystems and ecosystem services, they will increase consideration for ecosystems within quantifiedproduct sustainability standards, encouraging more holistic approaches to sustainable products.
Acknowledgements
This work was supported by the Sustainability Consortium and the Nicholas Institute for Environmental Policy Solutions at DukeUniversity.
References
Alcomo J, Doll P, Henrichs T, Kaspar F, Lehner B, Rosch T, Siebert S. 2003. Development and testing of the WaterGAP2 global model of wateruse and availability. Journal of Hydrological Sciences 48(3): 317–337. DOI: 10.1623/hysj.48.3.317.45290
Bakshi B, Small MJ. 2011. Incorporating Ecosystem Services into Life Cycle Assessment. Journal of Industrial Ecology 15(4). DOI: 10.1111/j.1530-9290.2011.00364.x
Bare J, Hoffstetter P, Pennington D, Udo de Haes H. 2000. Life Cycle Impact Assessment Workshop Summary. Midpoints versus Endpoints:The Sacrifices and Benefits. Int. J. Life Cycle Impact Assessment. 5(6): 319 – 326.
Balmford A Bruner A, Cooper P. 2002. Economic reasons for conserving wild nature. Science 297: 950–53.Baumann H, Tillman A-M. 2004. The Hitch Hiker’s Guide to LCA: An Orientation in Life Cycle Assessment Methodology and Application.
Studentlitteratur AB: Lund.Boody G, Vondracek D, Andow M. 2005. Multifunctional agriculture in the United States. BioScience 55: 27–38BSR, May 2011. New Business Decision-Making Aids in an Era of Complexity, Scrutiny, and Uncertainty. BSR’s Ecosystem Services, Tools &
Markets Working Group. Accessed July 16, 2011. http://www.bsr.org/en/our-insights/report-view/new-business-decision-making-aids-in-an-era-of-complexity
Chapagain AK, Hoekstra AY. 2004. Water Footprint of Nations: Volume 1: Main Report. UNESCO-IHE (16). http://www.waterfootprint.org/Reports/Report16Vol1.pdf. Accessed 16 July 2011.
Chouinard Y, Ellison J, & R. Ridgeway. (2011). The Big Idea: The Sustainable Economy. Harvard Business Review 89(10): 52–62.Daily GC. 1997. Nature’s services: societal dependence on natural ecosystems. Washington, DC: Island Press.Ellison, Ridgeway R. 2011. http://hbr.org/2011/10/the-sustainable-economy/ar/1Geyer R, Stoms DM, Lindner JP, Davis FW, Wittstock B. 2010a. Coupling GIS and LCA for biodiversity assessments of land use: Part I: Inventory
modeling. International Journal of Life Cycle Assessment. 15: 454–467. DOI: 10.1007/s11367-010-0170-9Geyer R, Stoms DM, Lindner JP, Davis FW, Wittstock B. 2010b. Coupling GIS and LCA for biodiversity assessments of land use: Part II: Impact
Assessment. International Journal of Life Cycle Assessment. 15: 692–703. DOI: 10.1007/s11367-010-0199-9Golden JS, Dooley KJ, Anderies JM, Thomspson BH, Gereffi G, Pratson L. 2010. Sustainable Product Indexing: Navigating the Challenge of
Ecolabelling. Ecology and Society 15(3): 8.Golden JS, Subramanian V, Zimmerman JB. 2011. Sustainability and Commerce Trends: Industry Consortia as the Drivers for Green Product
Design. Journal of Industrial Ecology. First published online 14, October 2011. DOI: 10.1111/j.1530-9290.2011.00381.xGoedkoop M, Spriensma R. 1999. The Eco-indicator 99. A damage oriented method for life cycle assessment. Methodology report. Amersfoort,
Netherlands: PRe´ Consultants.Guinee J (Ed). 2002. Handbook of Life Cycle Assessment. Kluwer Academic Publishers. Dordrecht: The Netherlands. ISBN 1-4020-0228-9.Hau JL, Bakshi BR. 2004. Expanding exergy analysis to account for ecosystem products and services. Environmental Science and Technology 38:
3768–3777. DOI: 10.1021/es034513sHeuer M. 2011. Ecosystem Cross-Sector Collaboration: Conceptualizing and Adaptive Approach to Sustainability Governance. Business Strategy
and the Environment 20: 211-22. DOI: 10.1002/bse.673
T. O’Shea et al.
Copyright © 2012 John Wiley & Sons, Ltd and ERP Environment Bus. Strat. Env. (2012)DOI: 10.1002/bse
International Organization for Standardization (ISO). 2006. Environmental Management – Life Cycle Assessment - Principles and Framework.ISO 14040: 2006. Accessed November 15, 2011. http://www.iso.org/iso/catalogue_detail?csnumber=37456
Jackson R, Jobbagy E, Avissar R. 2005. Trading water for carbon with biological carbon sequestration. Science 310: 19–47Korhonen J, Seager T. 2008. Beyond Eco-Efficiency: A Resilience Perspective. Bus. Strat. Env. 17: 411–419.Los Angeles Times. 2011. Greenpeace campaign targets Mattel. Los Angeles Times Greenspace. June 7, 2011. Access November 16, 2011. http://
latimesblogs.latimes.com/greenspace/2011/06/greenpeace-campaign-targets-mattel.htmlMadsen B, Carroll N, Kandy D, Bennett G. 2011. Update: State of Biodiversity Markets. Ecosystem Marketplace. Washington, DC: Forest Trends.
Accessed July 16, 2011. http://www.ecosystemmarketplace.com/reports/2011_update_sbdmMcKinsey&Company. 2010. McKinsey Global Survey results: The next environmental issue for business.McKinsey Quarterly. August 2010. Accessed
August 6, 2011. http://www.mckinseyquarterly.com/The_next_environmental_issue_for_business_McKin sey_Global_Survey_results_2651Meehan J, Bryde D. 2011. Sustainable procurement practice. Business Strategy and the Environment 20(#2): 94–106.Mila i Canals L, Bauer C, Depestele J, Dubreuil A, Freiermuth-Knuchel R, Gaillard G, Michelsen O, Muller-Wenk R, & B. Rydgren. 2007. Land
Use in LCA: Key Elements in a Framework for Land Use Impact Assessment Within LCA. International Journal of Life Cycle Assessment. 12(1).5–15. DOI: 10.1065/lca2006.05.250
Millennium Ecosystem Assessment. 2005. Ecosystems and Human Well-Being: Current State and Trends. Washington, DC: Island Press.Accessed July 19, 2011. http://www.maweb.org/en/Condition.aspx
Natural Capital Project. 2012. Accessed May 19, 2012 http://www.naturalcapitalproject.org/pubs/Web_BusinessBrochure.pdfNelson E, Mendoza F, Regetz J, Polasky S, Tallis H, Cameron R, Chan K, Daily G, Goldestein J, Kareiva P, Lonsdorf E, Naidoo R, Ricketts T, Shaw
M. 2009. Modeling multiple ecosystem services, biodiversity conservation, commodity production, and tradeoffs and landscape scales.Front Ecol Environn 7(1): 4–11
Odum HT. 1996. Environmental Accounting: Emergy and Environmental Decision Making. John Wiley and Sons: New York.Pfister S, Koehler A, Hellweg S. 2009. Assessing the Environmental Impacts of Freshwater Consumption in LCA. Environmental Science and
Technology 43(11): 4098–4104. DOI: 10.1021/es802423ePotting J, Blok K. 2004. Spatial aspects of life-cycle impact assessment. In: Udode Haes HA, Jensen AA, Klo¨ pffer W, Lindfors LG, (eds.) Society
of Environmental Toxicology and Chemistry (SETAC): Integrating impact assessment into LCA. Belgium; 91–8.Rebitzer G, Ekvall T, Frischnecht R, Hunkeler D, Norris G, Rydberg T, Schmidt W, Suh S, Weidema B, Pennington D. 2004. Life Cycle
Assessment: Part 1 Framework, Goal and Scope Definition, Inventory Analysis, and Applications. Environment International 30: 701–720.Sandhu S, Ozanne L, Smallman C, Cullen R. 2010. Consumer driven corporate environmentalism: Fact or fiction? Business Strategy and the
Environment 19(#6): 356–366.Seuring S. 2011. Supply chain management for sustainable products – insights from research applying mixed methodologies. Business Strategy
and the Environment 20(# 7): 471–484.Sukhdeve P, Wittmer H, Schroter-Schlaack C, Nesshover C, Bishop J, ten Brink P, Gundimeda H, Kumar P, Simmons B. 2010. Mainstreaming
the Economics of Nature: A Synthesis of the Approach, Conclusions, and Recommendations of TEEB. 20 October 2010.The Economics of Ecology and Biodiversity (TEEB). 2011. TEEB for Business. http://www.teebweb.org/Portals/25/Documents/TEEB%20for%
20Business/TEEB%20for%20Bus%20Exec%20English.pdfTrostle R. 2008. Global Agricultural Supply and Demand: Factors Contributing to the Recent Increase in Food Commodity Prices. Economic
Research Service. United States Department of Agriculture WRS-0801.UNEP and SETAC. 2007. Life Cycle Management: How business uses it to decrease footprint, create opportunities, and make value chains more
sustainable. Geneva: United Nations Environment Programme. Accessed August 6, 2011. http://www.unep.fr/shared/publications/pdf/DTIx1208xPA-LifeCycleApproach-Howbusinessusesit.pdf
UNEP and SETAC. 2009. Guidelines for Social Life Cycle Assessment of Products. Geneva: United Nations Environment Programme. AccessedAugust 6, 2011. http://www.unep.fr/shared/publications/pdf/DTIx1164xPA-guidelines_sLCA.pdf
Wilson D, Dragusanu R. 2008. The Expanding Middle: The Exploding World Middle Class and Falling Global Inequality. Goldman Sachs GlobalEconomics Paper No. 170 Accessed November 16, 2011 http://www.ryanallis.com/wp-content/uploads/2008/07/expandingmiddle.pdf.
Wolf MA, Ekvall T. 2001. Life Cycle Inventory (LCI) Modelling and Attributional / Consequential Issues. SETAC Globe. Vol. 12, #10 October 6,2011. Accessed on May 18, 2012 http://www.setac.org/globe/2011/october/modelling.html
World Business Council for Sustainable Development. 2011. Guide to Corporate Ecosystem Valuation: A Framework for Improving CorporateDecision-Making. Geneva: WBCSD. Accessed August 6, 2011. http://www.wbcsd.org/pages/edocument/edocumentdetails.aspx?id=104&nosearchcontextkey=
World Wildlife Fund and SABMiller. 2010. Water Futures: Working Together for a Secure Water Future. SABMiller and WWF-UK. AccessedJuly 16, 2011. http://www.sabmiller.com/files/reports/water_future_report.pdf
Zang Y, Singh S, Bakshi BR. 2010a. Accounting for Ecosystem Services in Life Cycle Assessment, Part I: A Critical Review. Environmental Scienceand Technology 44(7): 2232–2242. DOI: 10.1021/es9021156
Zang Y, Singh S, & B.R. Bakshi. 2010b. Accounting for Ecosystem Services in Life Cycle Assessment, Part II: Toward an Ecologically Based LCA.Environmental Science and Technology. 44(7): 2624–2631. DOI: 10.1021/es900548a
Sustainability and Earth Resources: LCA Modeling
Copyright © 2012 John Wiley & Sons, Ltd and ERP Environment Bus. Strat. Env. (2012)DOI: 10.1002/bse