surveys of the beaufort's dyke explosives disposal site ... · surveys of the beaufort's...
TRANSCRIPT
Not to be quoted without permission of the Marine Laboratory,Aberdeen
Fisheries Research Services Report No 15/96
SURVEYS OF THE BEAUFORT'S DYKE EXPLOSIVESDISPOSAL SITE, NOVEMBER 1995 - JULY 1996
FINAL REPORT
November 1996

The Scottish Office Agriculture, Environment and Fisheries DepartmentMarine Laboratory
Victoria RoadAberdeen
SURVEYS OF THE BEAUFORT'S DYKE EXPLOSIVESDISPOSAL SITE, NOVEMBER 1995 - JULY 1996
FINAL REPORT - NOVEMBER 1996
EXECUTIVE SUMMARY
Background
In November 1995, the Scottish Office Agriculture, Environment andFisheries Department (SOAEFD) commissioned a survey of theBeaufort's Dyke explosives disposal site. The survey was undertaken by theMarine Laboratory, Aberdeen, using the Department's research vesselFRV Clupea. Samples of seabed sediment and commercially exploited fishand shellfish species were collected from the area, to determine whethermunitions dumping operations after both World Wars had resulted inchemical contamination. Side-scan sonar and underwater televisionsurveys were undertaken in the northern sector of the explosives disposalsite, and in immediately adjacent areas to the north and east of the site, todetermine the distribution and densities of dumped munitions.
Following consideration of the interim report of the 1995 survey(Marine Laboratory Fisheries Research Services Report No 1/96, publishedJanuary 1996), Ministers commissioned further surveys of theBeaufort's Dyke explosives disposal site and adjacent areas in theNorth Channel, Firth of Clyde and Irish Sea; and the Hydrographic Officepromulgated a chart correcting Notice to Mariners advising seafarers thatdumped munitions lay outside the charted boundary of the explosivesdisposal site. The additional surveys were undertaken by theMarine Laboratory, Aberdeen in March, May and July 1996, again usingthe SOAEFD research vessel FRV Clupea. Further samples of seabedsediment and commercially exploited fish and shellfish species werecollected, to confirm that the levels of heavy metals detected in samplesfrom the explosives disposal site were similar to the levels found elsewherein the North Channel and northern Irish Sea. Side-scan sonar,magnetometer, underwater television and pulse induction surveys wereundertaken, to confirm the distribution and densities of dumped munitionsthroughout the survey area.
This final report combines the results of the surveys undertaken in1995 and 1996, incorporating the information published in the interimreport.
i
Results
• Screening of surface seabed sediment samples collected fromwithin, and immediately adjacent to, the Beaufort's Dyke explosivesdisposal site confirmed that the samples did not contain thechemical warfare agents phosgene or mustard gas, or containelemental phosphorus. Analysis of the same samples for explosiveand propellant residues confirmed that the samples did not containnitroglycerine, 2,4,6 trinitrotoluene, RDX or tetryl.
• Analysis of the surface seabed sediment samples confirmed that thelevels of heavy metals throughout the survey area were within theranges reported in seabed sediments from other Scottish coastalareas, and similar to the levels previously reported in sedimentsfrom the Irish Sea. It is likely that the levels of heavy metals arerelated to anthropogenic and/or geological sources in the Irish Seaarea. There was no evidence of additional contamination related tomunitions dumping operations.
• Analysis of the edible flesh of commercially exploited fish andshellfish species collected from an area adjacent to theBeaufort's Dyke explosives disposal site confirmed that the samplesdid not contain nitroglycerine, 2,4,6 trinitrotoluene, RDX or tetryl.
• Analysis of the edible flesh of commercially exploited fish andshellfish samples collected from a wider survey area confirmed thatthe levels of heavy metals were within the ranges reported incommercial catches from around the United Kingdom coastline,and that the levels would not compromise public health.
• Side-scan sonar, underwater television, and pulse induction surveysconfirmed that the centre of distribution of dumped munitions andmunitions-related materials was located within, and immediatelyadjacent to, the northeast sector of the Beaufort's Dyke explosivesdisposal site.
• Medium to high densities of dumped munitions, munitions-relatedmaterials and unidentified man-made debris were confirmed in thearea adjacent to the northeast sector of the charted explosivesdisposal site. In this area, munitions and munitions-relatedmaterials were located a considerable distance outside the chartedboundary of the site.
ii
• Low to medium densities of unidentified man-made debris wereconfirmed in two smaller areas to the west and southwest of thecharted boundary of the explosives disposal site.
• Medium to high densities of dumped munitions, munitions-relatedmaterials and unidentified man-made debris were confirmed in anarea crossed by the submarine gas pipeline installed between theRhins of Galloway and Northern Ireland.
• Low to medium densities of dumped munitions, munitions-relatedmaterials and unidentified man-made debris were confirmed in anarea crossed by the proposed routing corridor for submarineelectricity cables linking Scotland and Northern Ireland. Lowdensities were confirmed to be predominant over the proposedroutes of the electricity cables within that corridor.
• Dumped munitions and munitions-related materials were not foundin the area crossed by the submarine gas pipeline installed betweenWigtown Bay and the Republic of Ireland. The densities ofunidentified man-made debris in this area were very low, andsimilar to the densities found elsewhere in the northern Irish Sea.
Conclusions
The results confirm the conclusions of the interim report, published inJanuary 1996.
The results of the explosive and propellant residue and heavy metalanalyses indicate that munitions dumping operations after both WorldWars have not resulted in chemical contamination of the surface seabedsediments or the edible flesh of commercially exploited fish and shellfishspecies.
The results of the side-scan sonar, underwater television, and pulseinduction surveys confirm that the centre of distribution of dumpedmunitions and munitions-related materials is located within, andimmediately adjacent to, the northeast sector of the explosives disposalsite. Large quantities of dumped munitions and munitions-relatedmaterials are located in the area adjacent to the northeast sector of thecharted explosives disposal site. Moderate quantities of unidentified man-made debris, probably related to munitions dumping operations, arelocated in two smaller areas adjacent to the west and southwestboundaries of the charted explosives disposal site.
iii
SURVEYS OF THE BEAUFORT'S DYKE EXPLOSIVESDISPOSAL SITE, NOVEMBER 1995 - JULY 1996
FINAL REPORT - NOVEMBER 1996
INTRODUCTION
As licensing authority for deposits in the sea, under Part II of the Food andEnvironment Protection Act 1985, the Scottish Office Agriculture,Environment and Fisheries Department (SOAEFD) undertakes extensivemonitoring in relation to sea disposal activities in Scottish waters. As partof a continuing programme of regional surveys covering all sea disposalsites in Scottish waters, the Department was scheduled to undertake asurvey of the North Channel and Solway Firth areas in spring 1996.
During the summer and autumn of 1995, there was considerablepublic and media interest in the Beaufort's Dyke explosives disposal site.That interest was heightened by the stranding of large numbers ofphosphorous devices on the Scottish coastline, initially in areas in theFirth of Clyde, and latterly in areas around the Mull of Kintyre and on Jura,Islay and Gigha. (Smaller numbers of the phosphorous devices were alsostranded on the Northern Irish and Republic of Ireland coastlines).Although the phosphorous devices were dealt with expeditiously andeffectively by the relevant emergency services, the United KingdomGovernment decided to bring forward part of the proposed regional surveyof the North Channel area.
The interim report of the first survey was published in January 1996(Marine Laboratory Fisheries Research Services Report No 1/96).Following consideration of that report, Ministers commissioned furthersurveys to extend the scope and area of coverage of the initial survey; andthe Hydrographic Office promulgated a chart correcting Notice to Marinersadvising seafarers that dumped munitions lay outside the charted boundaryof the explosives disposal site.
This final report combines the results of the 1995 survey andadditional surveys undertaken in 1996, incorporating the informationpublished in the interim report.
SURVEY OBJECTIVES
1
The survey programme had two objectives. The first objective was todetermine whether munitions dumping operations at the Beaufort's Dykeexplosives disposal site had resulted in chemical contamination of surfaceseabed sediments in the vicinity of the site, or had resulted in chemicalcontamination of commercially exploited fish and shellfish species found inthe North Channel or adjacent areas of the Firth of Clyde and northernIrish Sea. The second objective was to determine the distribution anddensities of dumped munitions on the sea bed throughout the surveyarea, particularly in areas outside the charted boundary of the explosivesdisposal site.
SURVEY PROTOCOL
The survey programme was undertaken during the periods13-23 November 1995, 21-26 March 1996, 29 April-17 May 1996 and17-29 July 1996, using the SOAEFD research vessel FRV Clupea. Thebathymetry and nature of the sea bed sediments were mapped usingRoxAnn©.
Samples of seabed sediment and fish and shellfish were collectedfrom selected locations throughout the survey area, and analysed todetermine the levels of explosive and propellant residues and trace metals.The seabed sediment samples were collected using a Day grab. Thecommercially exploited fish and shellfish samples were obtained using abottom trawl. Trawling operations undertaken by FRV Clupea weresupplemented using a chartered commercial trawler, the MFV Valaura (BA256).
Side-scan sonar, magnetometer, underwater television and pulseinduction surveys were undertaken, and the data used to map thedistribution and densities of munitions, munitions-related materials andunidentified man-made debris. The side-scan sonar survey wasundertaken using a towed near-bottom transducer system. Themagnetometer survey was undertaken using a towed near-surface sensorsystem. The underwater television survey was undertaken using colourtelevision and still cameras mounted on both a drop frame and a towedsledge. The pulse induction survey was undertaken using the TSS 340"Pipetracker" system, mounted at the rear of the towed underwatertelevision sledge.
SURVEY AREA
2
Beaufort's Dyke is a comparatively deep trench located betweenthe Rhins of Galloway and Northern Ireland. The trench is morethan 50 kilometres (km) in length, and is approximately 3.5 km wide at itsbroadest point. The charted water depth in the trench is in excessof 200 metres (m), and the deepest areas are in excess of 300 m. Centredon the trench is the Beaufort's Dyke explosives disposal site, which wasused for the dumping of redundant munitions after both World Wars. Themajority of the explosives disposal site is confined to water depths inexcess of 100 m, although it extends into slightly shallower waters on theScottish side of the trench. Within the explosives disposal site, there is aspoil ground routinely used for the disposal of dredged material from LochRyan port facilities. The Beaufort's Dyke spoil ground was also used for thedisposal of materials excavated from the sea bed during the installation ofthe Premier Transco submarine gas pipeline between theRhins of Galloway and Northern Ireland. All disposal operations within theBeaufort's Dyke spoil ground are authorised by SOAEFD and theDepartment of Transport.
To the north and west of the explosives disposal site, the sea bedshelves fairly gradually, and charted water depths in the survey area aregenerally within the range 100-150 m. The submarine gas pipelinebetween the Rhins of Galloway and Northern Ireland, and the proposedrouting corridor for the Northern Ireland Electricity submarine electricitycables linking Scotland and Northern Ireland, cross the survey area to thenorth of the explosives disposal site. To the east of the explosives disposalsite, the sea bed shelves fairly steeply and charted water depths in thesurvey area are generally within the range 25-100 m. To the south andsoutheast of the explosives disposal site, the sea bed again shelves fairlysteeply. To the south, the charted water depths in the survey area aregenerally in the range 75-125 m. To the southeast, in the northern IrishSea, the charted water depths in the survey area are generally within therange 25-50 m. The Bord Gais Eireann submarine gas pipeline betweenWigtown Bay and the Republic of Ireland crosses the survey area in thenorthern Irish Sea.
The boundary and principal features of the survey area are shownin Figure 1.
MATERIALS AND METHODS
1. Seabed Bathymetry and Sediment Type
3
Echo-sounders are routinely used to provide seabed depth, or bathymetry,data. They can also be used to provide information on the roughness andhardness of the sea bed. The tail of the first seabed echo (the soundreflected directly from the sea bed to the echo-sounder) is used to defineroughness. The second seabed echo (the sound reflected from the sea bedto the sea surface, then back to the sea bed and finally back to the echo-sounder) provides information on hardness. The parameters of roughnessand hardness can be used to characterise the nature of the sea bedsediments. A soft smooth sea bed will be predominantly mud; a rougher,slightly harder, sea bed will be predominantly sand; and a very hard seabed will be predominantly cobbles, boulders or rock. RoxAnn© is oneexample of the systems developed to characterise seabed sediments usingdata derived from a standard echo-sounder.
A RoxAnn© survey was undertaken to confirm the seabedbathymetry in the survey area, and to provide information in relation to theseabed sediment types in the area. The nominal transect line spacingthroughout the survey area was approximately one kilometre.
2. Seabed Sediment Chemistry
Grab sampling was attempted over a grid of 117 sampling stations.Additional sampling was attempted at a further 11 sampling stations in thevicinity of the Beaufort's Dyke spoil ground. Surface seabed sedimentsamples were obtained from a total of 105 sampling stations.
Wherever possible, subsamples were collected from each grab fortotal organic carbon and organic nitrogen analyses; particle size analyses;and trace metal analyses. Replicate subsamples were collected fromthe 41 sampling stations within, and immediately adjacent to, theexplosives disposal site for explosive and propellant residue analyses.Additional control, or reference, samples of surface seabed sediment werecollected from locations in the Moray Firth, and subsampled for explosiveand propellant residue analyses. All the subsamples were deep frozen andreturned to the Marine Laboratory, Aberdeen.
The seabed sediment subsamples collected for explosive andpropellant residue analyses were submitted, deep frozen, to theDefence Evaluation and Research Agency (DERA) Porton Down. Prior toall chemical analyses, the subsamples were screened by DERA PortonDown for the presence of chemical warfare agents and white phosphorus.The subsamples were screened using gas chromatography (GC) with aflame photometric detector in the sulphur and phosphorus modes. Thesubsamples were then passed to DERA Fort Halstead, and analysed to
4
determine the levels of explosive and propellant materials that were likelyto be present in the dumped munitions. The subsamples were analysedusing GC with selective chemiluminescence detection (GC/TEA), followinga standard method accredited by the National Accreditation ofMeasurement and Sampling (NAMAS). Tetryl (CE) was added to thestandard mixture used for instrument calibration. Full details of thetreatment and analysis of the subsamples submitted to DERA are containedin Analytical Report CBDE/CES/FEL/CR9604, which is annexed to thisreport at Appendix 1.
The seabed sediment subsamples retained by the MarineLaboratory, Aberdeen were analysed following standard procedures usedin international marine monitoring programmes. The concentrations oftotal organic carbon and organic nitrogen were measured using anelemental analyser, following treatment with hydrochloric acid to removecarbonate material. Particle size analyses were undertaken using acombination of laser granulometry (for particles of less than 0.5 millimetresdiameter) and dry sieving (for coarser particles). Samples for trace metalanalyses were freeze-dried and sieved through a two millimetre(mm) mesh. Material passing through the mesh was then digested in aquaregia and hydrofluoric acid to achieve complete dissolution. Theconcentrations of aluminium, arsenic, cadmium, chromium, copper, lead,mercury, nickel and zinc in the digests were determined by atomicabsorption spectrometry, using graphite furnace (arsenic) and cold vapour(mercury) techniques where appropriate. The accuracy and precision ofthe trace metal analyses were assessed using the certified referencematerial MESS-2, obtained from the National Research Council of Canada.
5
3. Fish and Shellfish Chemistry
Trawling operations were undertaken in four areas, at the northern andsouthern ends of the Beaufort's Dyke trench, at a location to the north ofthe Isle of Man and at a location to the west of the Isle of Man.
Samples of commercially exploited fish and shellfish species weretaken from each trawl for heavy metal analyses. Replicate samples weretaken from two of the trawls undertaken at the northern end of theBeaufort's Dyke trench, for explosive and propellant residue analyses.Where necessary, fish or shellfish from separate trawls undertaken in thesame area were pooled, to obtain representative samples for chemicalanalysis. Additional control, or reference, samples of fish and shellfishwere obtained from locations in the North Sea, for explosive andpropellant residue analyses. All the fish and shellfish samples were deepfrozen and returned to the Marine Laboratory, Aberdeen.
The samples collected for explosive and propellant residue analyseswere submitted, deep frozen, to DERA Fort Halstead, and subsampleswere analysed to determine the levels of explosive and propellant materialsthat were likely to be present in the dumped munitions. The subsampleswere analysed using GC/TEA, following a standard method accredited byNAMAS. Tetryl (CE) was added to the standard mixture used forinstrument calibration. Full details of the treatment and analysis of thesamples submitted to DERA are contained in Analytical ReportCBDE/CES/FEL/CR9622, which is annexed to this report at Appendix 2.
Subsamples of the edible flesh of the fish and shellfish samplesretained by the Marine Laboratory, Aberdeen were analysed to determinethe levels of heavy metals. The analyses were undertaken followingstandard procedures used in international marine monitoring programmes.The subsamples were dissolved in hot concentrated nitric acid, and theconcentrations of arsenic, cadmium, copper, lead, mercury, and zinc inthe digests were determined by atomic absorption spectrometry. Whereappropriate, graphite furnace (arsenic, cadmium and lead) and cold vapour(mercury) techniques were employed. The accuracy and precision of theanalytical methods were assessed using the certified reference materialDORM-1, obtained from the National Research Council of Canada.
4. Side-scan Sonar Investigations
Side-scan sonar transducers emit a beam of sound to investigate the seabed, in much the same way that a torch emits a beam of light. The beamof sound is directed to the sea bed from a towed transducer. Echoes are
6
received from the sea bed, and from objects lying on the sea bed. Largerobjects produce a greater echo, and a greater area of “shadow” behind theobject. Analysis of the echoes and areas of shadow allows the operator todifferentiate between different types of objects lying on the sea bed.
A side-scan sonar survey was undertaken using a towed near-bottom transducer, to determine the distribution of man-made debris onthe surface of the sea bed. Side-scan sonar operations were restricted towater depths of less than 175 m, to obtain acceptable resolution of targetson the sea bed. In deeper waters, it was not possible to maintain thetowed transducer at a constant height above the sea bed, and theresolution decreased as the height increased. Where data were obtainedin water depths of greater than 175 m, the analyses are less reliable. Themajority of the deeper water areas were within the charted boundary ofthe explosives disposal site, and it was considered unnecessary to confirmthe distribution of debris in those areas. At the shoreward boundary of thesurvey area, side-scan sonar operations were normally restricted to waterdepths of greater than approximately 30 m, to avoid damaging the towedtransducer. However, survey operations were extended into shallowerwater during periods of very calm weather.
5. Magnetometer Investigations
Magnetometers are routinely deployed during side-scan sonar surveysundertaken by the Ministry of Defence (MOD), to assist in the location oflarge ferromagnetic objects, such as wrecks. Although the magnetic fieldfrom an object falls off rapidly with distance, changes in magnetic fieldstrength associated with large objects on the sea bed can be detected usinga sensor deployed just below the surface of the sea. Magnetometersurveys undertaken using a towed near-surface sensor system would beunlikely to detect individual items of ordnance located on the sea bed, butmight detect dense accumulations of ordnance. In shallower waters, theymight also detect fairly moderate accumulations of ordnance, and could beof benefit when trying to differentiate between accumulations of ordnanceand regular-shaped boulders.
During the November 1995 survey, it was noted that a number ofboulder fields were present in the survey area, and it was not possible toundertake sufficient underwater television investigations to confirm that allof the side-scan sonar targets were munitions or munitions-relatedmaterials. A magnetometer survey was therefore undertaken duringsubsequent surveys, to complement the side-scan sonar investigations.
7
The magnetometer survey was undertaken using a protonmagnetometer and towed near-surface sensor provided by MOD. Themagnetometer and side-scan sonar surveys were undertakensimultaneously, with the exception of two fairly small areas where themagnetometer survey had to be deferred because severe weatherconditions resulted in the magnetometer sensor cable fouling the side-scansonar transducer cable. In those areas, the magnetometer survey wassubsequently completed, as far as possible, by following the survey trackrecorded during the side-scan sonar survey.
6. Underwater Television Investigations
An underwater television survey was undertaken to confirm the nature,distribution and densities of man-made debris on the surface of the seabed, concentrating on locations outside the charted boundary of theexplosives disposal site.
In coastal waters where the sea bed was predominantly boulders orrock, the underwater television survey was undertaken using colourtelevision and still cameras mounted on a drop frame, which was loweredto the sea bed astern of the survey vessel. The survey vessel was thenallowed to drift through the survey area, whilst maintaining the drop frameat a constant height above the sea bed. A total of 29 locations wereinvestigated in this manner. Underwater visibility was extremely variable,depending upon the location of the site, the nature of the sea bed and thestate of the tide, but it was possible to obtain an acceptable quality videorecord at 23 of the locations investigated using the drop frame system.
In other areas, the underwater television survey was undertakenusing colour television and still cameras mounted on a sledge, which wastowed across the sea bed behind the survey vessel. A total of 59 locationswere investigated in this manner. Underwater visibility was very poor attwo of the locations, and an acceptable quality video record was obtainedat 57 of the locations investigated using the towed sledge system.
7. Pulse Induction Investigations
The TSS 340 "Pipetracker" is routinely used by the offshore oil and gasindustry to survey submarine pipelines. The system is based on a series ofcoils, which are usually mounted on a Remotely Operated Vehicle (ROV).When a current is passed through the coils, it induces a current in anyconductor that lies within the range of the electromagnetic field of thecoils. The induced current can be measured, and the system used todetect most metallic objects. In contrast, magnetometers can only be used
8
to detect ferromagnetic objects. The TSS 340 system has an detectionrange in seawater of approximately 1.5-2.0 m. The system is capable ofdetecting objects buried beneath the surface of the sea bed, although thishas an effect on the range of detection.
A pulse induction survey was undertaken to confirm the distributionand densities of metallic debris at selected locations throughout the surveyarea. The survey concentrated on locations outside the charted boundaryof the explosives disposal site. To facilitate direct comparison of theunderwater television and pulse induction records, three pulse inductioncoils were attached to the rear of the towed underwater television sledge,approximately 600 mm from all metallic components of the sledge.Laboratory trials confirmed that the pulse induction system was notaffected by the metallic components of the sledge. The coils were locatedat a height of approximately 400 mm above the sea bed. Mounted at thisheight, the coils would be expected to detect metallic debris on the seabed, and to detect metallic debris buried to a depth of approximately 0.5-1.0 m beneath the surface of the sea bed. Prior to the survey, a series ofcombined underwater television and pulse induction trials wereundertaken in Loch Ryan, to calibrate the response of the pulse inductionsystem to a number of metal cylinders deployed beneath the central coil.
The pulse induction system was deployed during 51 of theunderwater television survey transects completed using the towed sledge.The system appeared to be susceptible to vibration and impact shock,resulting from collisions with natural and artificial obstructions, and it wasnecessary to re-start and re-calibrate the system during the course of anumber of survey transects. A fault in the system, possibly related tovibration or impact shock, resulted in the failure of the central coil duringthe latter part of the survey. Replacement of the central coil did not solvethe problem, and it was necessary to complete the survey using the twolateral coils. An acceptable pulse induction record was obtained for 50 ofthe completed survey transects, including two transects undertaken atlocations where it was not possible to obtain an acceptable qualityunderwater television record.
RESULTS
1. Seabed Bathymetry and Sediment Type
The completed RoxAnn© survey track is shown in Figure 2. The totallength of the survey track was approximately 950 km, and seabed depth
9
and sediment type data were collected from a total of 41,000 samplepoints.
Seabed bathymetry and sediment type were computed from theRoxAnn© survey data, using a surface mapping technique which analyseseach data point and uses the variability to define the interpolation function(Kriging). The gridded data were then contoured and mapped. Thecontour maps of seabed bathymetry and sediment type are shown inFigures 3 and 4 respectively.
The seabed bathymetry clearly indicates the limits of theBeaufort's Dyke trench, which lies near the centre of the explosivesdisposal site. The seabed sediment types found in the survey area rangedfrom mud to rock formations. Within the explosives disposal site, theseabed sediments were predominantly sand, with variable amounts ofmud, gravel, boulders and rock. The seabed bathymetry and sedimenttype data were used to support the trawl, underwater television and pulseinduction surveys.
2. Seabed Sediment Chemistry
The grid of seabed sediment sampling stations and the locations ofcollection of the seabed sediment samples are shown in Figure 5.
The surface seabed sediment samples ranged from coarse silt(less than 63 micrometres) to granules (2-4 mm). The majority of thesediments were medium to coarse sands, mixed with variable amounts ofsilt, small stones, and bivalve and gastropod shell fragments. The particlesize data were consistent with the indicative seabed sediment typesdescribed during the RoxAnn© survey. The physical nature of thesediments, and the total organic carbon and nitrogen concentrations, weretypical of near-shore coastal environments.
Screening analyses confirmed that the seabed sediment samples didnot contain phosgene, mustard gas or white phosphorus. The onlymaterials detected were, in the sulphur mode, elemental sulphur, possiblyrelated to anoxic conditions in the seabed sediment samples; and, in thephosphorus mode, tributyl phosphate, probably derived from the samplejars. The identity of these materials was established by GC analysis ofselected samples using a mass selective detector. Explosive and propellantresidue analyses confirmed that the seabed sediments did not containnitroglycerine, 2,4,6 trinitrotoluene, RDX or tetryl. Further information inrelation to the results of the screening and explosive and propellantanalyses is contained in Appendix 1.
1 0
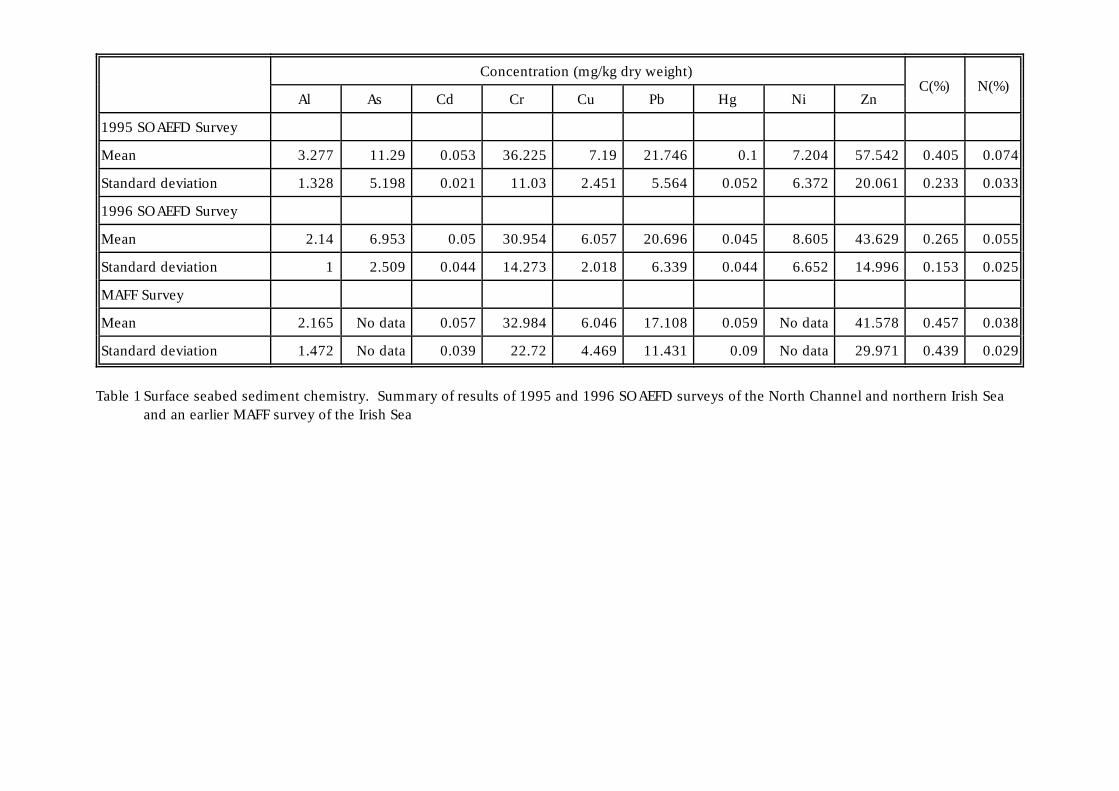
The mean concentrations of a range of trace metals in the surfaceseabed sediments are shown in Figures 6a-6i inclusive. The levels of heavymetals in samples from the explosives disposal site were similar to thelevels in samples from elsewhere in the North Channel area, and there wasno obvious geographical pattern that could be related to the explosivesdisposal site. The means and ranges of the concentrations of arsenic,chromium, copper, lead, mercury, nickel and zinc in samples collectedfrom the North Channel during the 1995 and 1996 SOAEFD surveys weresimilar, and were within the ranges previously reported in surface seabedsediments from other Scottish coastal areas.
The results of the 1995 and 1996 SOAEFD surveys, and the resultsof a earlier Irish Sea survey undertaken by the Ministry of AgricultureFisheries and Food (MAFF), Fisheries Laboratory, Burnham-on-Crouch, aresummarised in Table 1. The levels of heavy metals detected in samplescollected during the SOAEFD surveys were similar to the levels detected insamples collected during the MAFF survey. Presentation of the data ashistograms confirmed the similarities between the three surveys. Examplehistograms for cadmium and chromium are shown in Figure 7.Examination of the correlations between the concentrations of heavymetals and the concentrations of aluminium, to compensate for thedifferences in particle size distribution and mineralogy of the samples,confirmed that the distributions of heavy metal concentrations in thesurface seabed sediment samples from the North Channel area and theIrish Sea were similar. Water movements in this area will tend to movefiner sediments into the North Channel from the Irish Sea, and the seabedsediment chemistry was consistent with that process.
3. Fish and Shellfish Chemistry
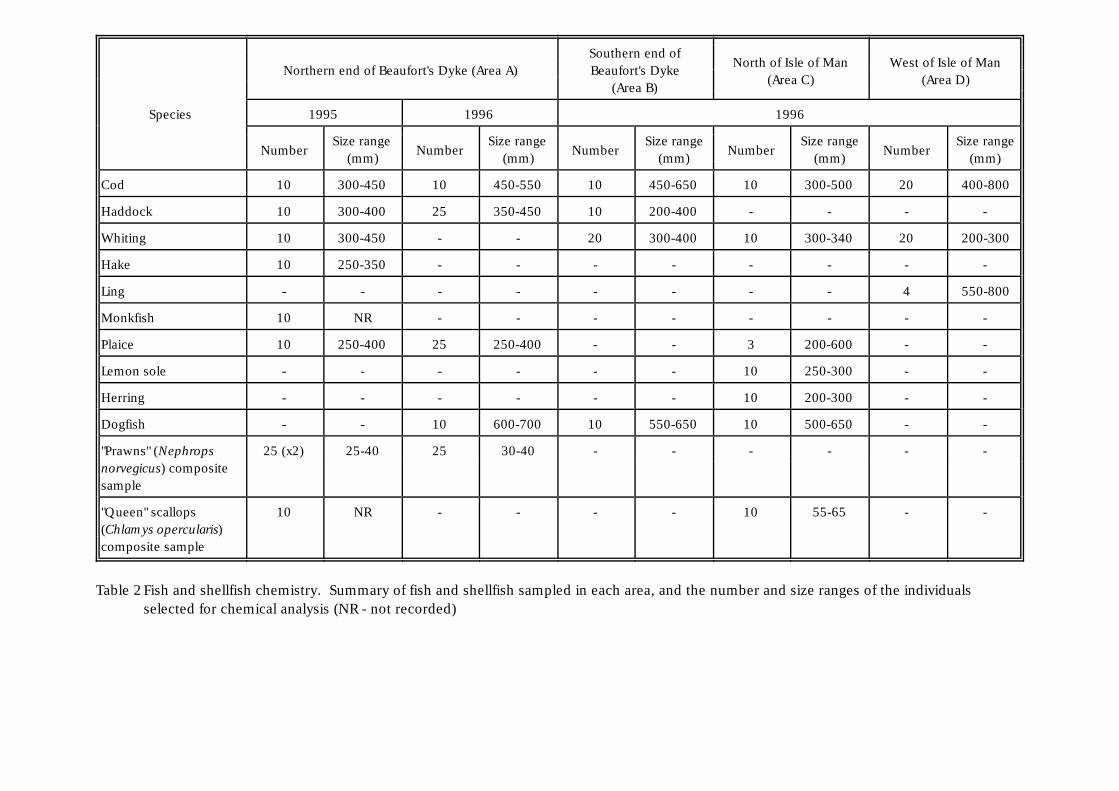
The four trawl sampling areas, and the locations of individual trawlsundertaken within those areas, are shown in Figure 8. The fish andshellfish species sampled in each area, and the number and size ranges ofthe individuals selected for chemical analysis, are summarised in Table 2.
Explosive and propellant residue analyses confirmed that the edibleflesh of the fish and shellfish samples did not contain nitroglycerine,2,4,6 trinitrotoluene, RDX or tetryl. Further information in relation to theresults of the explosive and propellant analyses is contained in Appendix 2.
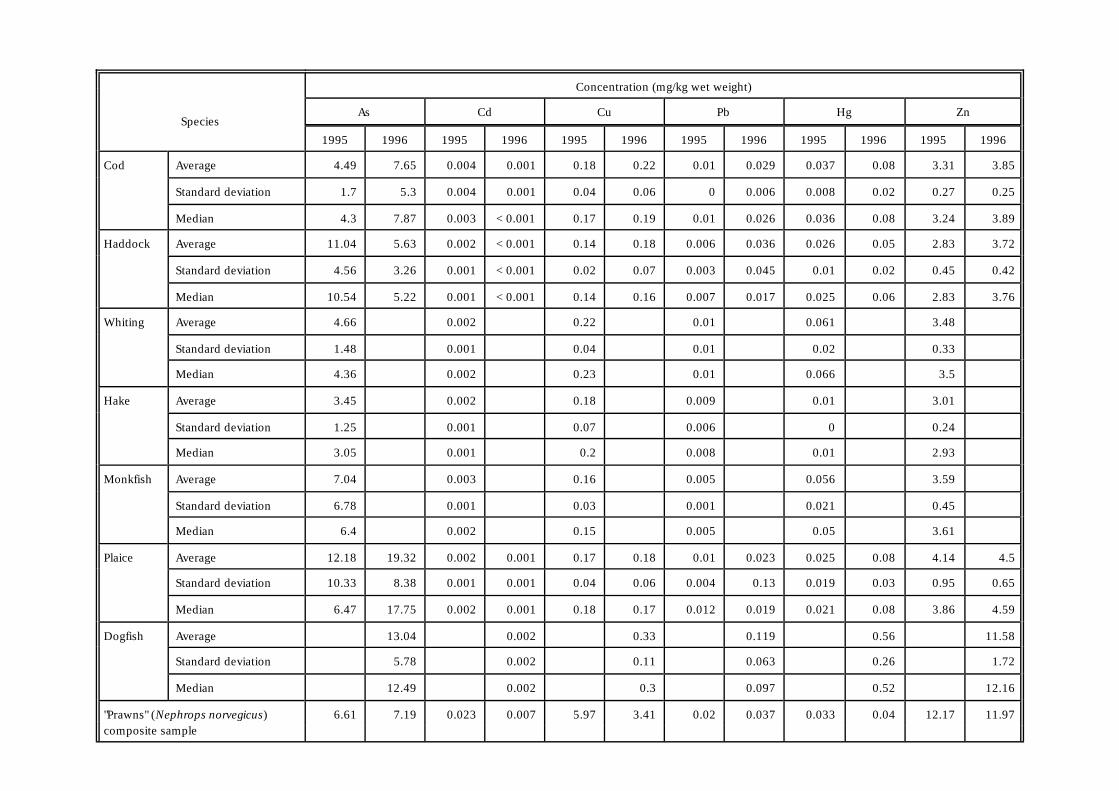
The mean concentrations of heavy metals in the edible flesh of fishand shellfish samples are shown in Tables 3-6 inclusive. The meanconcentrations of cadmium, copper, lead and zinc in fish and shellfish
1 1
from all four areas were generally within the ranges previously reported incommercial catches from various areas around the Scottish coastline.The levels in shellfish were higher than the levels in fish, which is normal.The mean concentrations of lead and zinc in dogfish exceeded levelspreviously reported for Scottish waters, but were similar to the levelsreported in dogfish from inshore areas of the Irish Sea.
The mean concentrations of mercury in shellfish were low, andwithin the ranges previously reported in commercial catches from variousareas round the Scottish coastline. The mean concentrations of mercury infish tended to be at the higher end of the ranges previously reported forScottish waters, but were similar to the levels reported in fish from the IrishSea. Mercury concentrations in fish are known to be a function of anumber of factors, including age, diet, sex, reproductive state andexposure to contamination. The levels of mercury in the fish samplesreflected some of these factors. The effect of diet is evident in thecontrasting mercury concentrations in herring and dogfish. Herring arepelagic feeders and contain low levels of mercury, whereas dogfish arescavengers and accumulate quite high levels of mercury. Differencesbetween the mercury levels in fish samples from the northern end of theBeaufort's Dyke trench and fish samples from the northern Irish Sea arelikely to be related to established inputs of mercury to the Mersey Estuaryand Liverpool Bay.
The concentrations of arsenic in fish and shellfish variedconsiderably, and the standard deviations tended to be high. There wasno obvious, consistent, geographical pattern, and there were markeddifferences between the levels found in samples of the same species thatwere collected from the northern end of the Beaufort's Dyke trench duringthe 1995 and 1996 surveys. The origin of the variability in the arseniclevels may be related to some of the factors listed for mercury. Theconcentrations of arsenic in the fish and shellfish samples, and theirvariability, were generally consistent with the relatively small amount ofpublished information for Scottish waters. The concentrations of arsenicwere within the ranges previously reported in commercial catches from theIrish Sea.
The MAFF Fisheries Laboratory at Burnham-on-Crouch has recentlyundertaken a study of arsenic in dabs collected from around the coast ofEngland and Wales. The concentrations of arsenic in dabs from the IrishSea were not significantly higher that the concentrations in dabs from otherstudy areas, and the majority of the arsenic was confirmed to beaccumulated in the benign organic form. The levels of arsenic found in theMAFF study do not, therefore, compromise public health. Levels of
1 2
organic arsenic in fish and shellfish were not determined in the presentstudy.
4. Side-scan Sonar Investigations
The completed side-scan sonar survey track is shown in Figure 2.The side-scan sonar transducer surveyed an area approximately 200 mwide over the entire survey track. The side-scan sonar records wereanalysed to detect and enumerate regular-shaped targets on the sea bed,such as boxes or drums.
Extracts from typical side-scan sonar records are shownin Figures 9a-9c inclusive. The extracts show differing densities ofregular-shaped targets on the surface of the sea bed. Figure 9a shows aclear, smooth, sandy sea bed, in an area where no targets were detected.Figure 9b shows a small number of regular-shaped targets on a sandy seabed. The three highlighted targets are 1.5-4.0 m in length, and extendapproximately 0.25-0.4 m above the sea bed. Figure 9c shows a largenumber of regular-shaped targets (approximately 300) scattered over thesea bed.
The counts of regular-shaped targets were used to estimate therelative densities of items of man-made debris on the surface of the seabed. The approximately 950 km of survey track was divided into1,900 sections, each of 0.5 km, and every section was examined andassigned a density class. The estimates were based on direct measurementof the survey swathe width and enumeration of targets over all or part ofeach 0.5 km section of the survey track. It was not feasible to accuratelycount every target by eye, because the definition varied in response tochanges in factors such as water depth, transducer height, sea state andseabed type. Automated counting systems were considered to beunreliable, because the target shapes were variable, and because therewere many examples of multiple targets that were touching or piled on thesea bed. The relative densities derived for each 0.5 km section of thesurvey track were mapped to a grid using Kriging interpolation. Thegridded data were then contoured and mapped. The contour map of therelative densities of side-scan sonar targets is shown in Figure 10.
The contoured relative density data indicated that the centre ofdistribution of regular-shaped targets was located within, and immediatelyadjacent to, the northeast sector of the explosives disposal site; and thatnumerous targets were located outside the charted boundary of the site.Medium to high densities of regular-shaped targets were noted adjacent tothe northeast sector of the charted explosives disposal site, within an area
1 3
extending approximately 9.25 km from the northeast corner of the site.The densities within this area tended to decrease with distance from thenortheast corner of the site. Low to medium densities were noted at anumber of additional locations to the west, northwest, north, northeast andeast of the northeast sector of the explosives disposal site; adjacent to thewestern boundary of the site, at approximately the same latitude asCopeland Island; and adjacent to the southwest corner of the site. Lowdensities were noted adjacent to the southeast corner of the explosivesdisposal site, and at a number of additional locations outside the chartedboundary of the site.
Medium to high densities of regular-shaped targets were noted inan area crossed by the submarine gas pipeline installed between theRhins of Galloway and Northern Ireland; and low to medium densitieswere noted in an area crossed by the proposed routing corridor forsubmarine electricity cables linking Scotland and Northern Ireland. Therewere very few regular-shaped targets in the area crossed by the submarinegas pipeline installed between Wigtown Bay and the Republic of Ireland.
The contour map of the relative densities of side-scan sonar targetswas used to identify a number of areas that required further investigationduring the combined underwater television and pulse induction surveys.The areas identified included locations that were outside the boundary ofthe survey area
5. Magnetometer Investigations
The completed magnetometer survey track was effectively the same as theside-scan sonar survey track shown in Figure 2. The magnetometer datawere examined to look for fluctuations or transitions in magnetic fieldstrength that could be indicative of the presence of ferromagneticmaterials; and to establish whether variations in the absolute magnetic fieldstrength could be used to identify areas where large quantities of dumpedmunitions were present on the sea bed.
A number of transitions in magnetic field strength were noted in thesurvey area, but it was not possible to correlate them with the confirmeddistribution of munitions and munitions-related materials derived from the1995 underwater television survey. It was concluded that transitionanalysis, the method normally used for wreck detection, was unsuitable forordnance detection, because the munitions and munitions-relatedmaterials were widely distributed over a large area and the changes indensity were too small to produce changes in magnetic field strength thatcould be detected at the sea surface.
1 4
The absolute magnetic field strength was noted to be greater in thevicinity of the northeast sector of the explosives disposal site, where therewere confirmed accumulations of munitions and munitions-relatedmaterials. However, the magnitude of the absolute magnetic field strengthwas compatible with natural increases that occur when moving towards thenorth pole. It was also noted that there were no specific peaks in theabsolute magnetic field strength in the vicinity of confirmed accumulationsof munitions and munitions-related materials. It was concluded that,because there was not an obvious spatial relationship between themagnetometer data and the other data sets, the observed changes inabsolute magnetic field strength were probably accounted for by changesin the earth's magnetic field or unidentified geological sources.
The magnetometer records were considered to be of limited value,and the data set was excluded from further analyses.
6. Underwater Television Investigations
The locations of the completed drop frame and towed sledge underwatertelevision survey transects are shown in Figure 11.
a) Nature of materials on the sea bed
Large numbers of marine animals, cobbles, boulders, rocks and items ofman-made debris were observed on the sea bed. Cobbles are detachedstones with a diameter of greater than approximately 65 mm and less thanapproximately 250 mm, lying on, or partially embedded in, the sea bed.Boulders are detached stones with a diameter of greater thanapproximately 250 mm. Rocks are exposed sections of the geologicalformations. The man-made debris was separated into three categories,munitions and munitions-related materials; seabed litter; and unidentifieddebris. It was noted that the boulders and the more substantial items ofman-made debris were often colonised by a variety of sessile marineanimals, indicating that they had not been disturbed for some time.
Munitions included cartridges, hand grenades, land mines, shells,bombs, bomb casings and depth charges. Munitions-related materialsincluded boxes, and crates or racks containing munitions. Some of theboxes had been disturbed, and munitions were clearly visible within theboxes. It was assumed that all the boxes observed on the sea bed wererelated to munitions dumping operations. Munitions and munitions-related materials were noted throughout the explosives disposal site, and ata number of locations outside the charted boundary of the site. Many of
1 5
the munitions and munitions-related materials were in a fairly advancedstate of decay, indicating that a proportion of the dumped ordnance willeventually degrade in the marine environment. Although some of theboxes appeared to be made of wood, the majority of the munitions andmunitions-related materials appeared to be metallic, or to include metalliccomponents. Examples of the underwater television records obtainedduring the 1995 survey were reviewed by MOD, to confirm theidentification of munitions and munitions-related materials.
Seabed litter included domestic garbage, such as bottles, cans,crockery, cutlery, jars, "plastic" materials, fibrous materials and tins; fishinggear, such as nets and associated ropes or wires; and unattributableman-made debris, such as bars, beams, blocks or brick-shaped objects,girders, pipes, rods, ropes, tubes and wires. Domestic garbage was notedthroughout the survey area, but appeared to be more prevalent in thevicinity of established shipping routes. The majority of the domesticgarbage appeared to be non-metallic in nature. Fishing gear was alsonoted throughout the survey area, but was more prevalent in areas wherethere were uncharted natural or artificial obstructions adjacent toestablished fishing grounds. The majority of the fishing gear includedmetallic components, such as wires. Unattributable man-made debris wasalso noted throughout the survey area. Items such as ropes and wires weremore prevalent in areas adjacent to established fishing grounds, and it islikely that these items were related to fishing gear. Items such as bars,beams, girders, pipes and tubes were more prevalent in areas thatcontained identified munitions or munitions-related materials, and it ispossible that these items were related to munitions dumping activity. Themajority of the more substantial unattributable man-made debris appearedto be metallic in nature.
Unidentified man-made debris was noted throughout the surveyarea, but was more prevalent in areas that contained identified munitionsor munitions-related materials. In such areas, it was considered likely thatthe majority of the unidentified man-made debris was related to munitionsdumping operations.
b) Distribution and densities of materials on the sea bed
The approximate density of cobbles (absent, present or abundant)observed during each five minute section of each underwater televisionrecord was estimated. The numbers of boulders and items of man-madedebris observed during each five minute section were counted. Boulderswith maximum dimensions of less than 1,000 mm (one metre) and greaterthan 1,000 mm were counted separately. The same size categories, less
1 6
than 250 mm, 250-1,000 mm and greater than 1,000 mm, were appliedwhen counting items of man-made debris.
The counts of boulders and items of man-made debris over eachfive minute section of the underwater television survey record were usedto calculate the densities of boulders of each size category, the densities ofidentified munitions and munition-related materials of each size category,and the densities of other types of man-made debris of each size categoryper 100 m of each survey transect.
It was noted that the distributions of smaller munitions andmunitions-related materials (less than 250 mm) and larger munitions andmunitions-related materials (greater than 250 mm) were the same, and thatthe densities were related. It is likely that the smaller items had beendisplaced from larger containers, such as boxes, racks and crates. Theside-scan sonar survey did not detect cobbles or the smaller items ofman-made debris. All targets with a maximum dimension of lessthan 250 mm were therefore excluded prior to further analysis of the data.
It was also noted that the densities of larger identified munitionsand munitions-related materials (greater than 250 mm) and the densities oflarger items of unidentified man-made debris (greater than 250 mm) wererelated. The densities of larger items of unidentified man-made debriswere consistently very low in areas that did not contain dumped munitionsand munitions-related materials; and consistently higher in areas thatcontained dumped munitions and munitions-related materials. It wasreasonable to assume that the small quantities of unidentified man-madedebris observed in areas such as the northern Irish Sea were not related tomunitions dumping operations, but that the majority of the unidentifiedman-made debris observed in the vicinity of the explosives disposal sitewas related to munitions dumping operations. The densities of largermunitions, munitions-related materials and unidentified man-made debris(greater than 250 mm) were therefore combined prior to further analysis ofthe data.
It was further noted that the densities of larger munitions,munitions-related materials and unidentified man-made debris (greaterthan 250 mm) were comparatively low over most of the survey area, andequivalent to target encounter rates of less than three targets per hourduring 57 of the 89 one hour sections of the underwater television record.The densities for the size categories 250-1,000 mm and greaterthan 1,000 mm were therefore combined prior to further analysis of thedata.
1 7
The combined linear densities of larger munitions, munitions-related materials and unidentified man-made debris (greater than 250 mm)were converted to densities per unit area, to permit comparison with theside-scan sonar data. The observation swathe width of both the dropframe and the towed sledge underwater television systems wasapproximately 1.25 m, but the absolute swathe width would depend uponthe target size. For example, a large object with a maximum dimension ofgreater than one metre, such as a box, would be within the field of view ofthe underwater television camera providing its centre lay approximately1.5 m either side of the camera; whereas a small object with a maximumdimension of less than 250 mm, such as a cartridge, would only be visiblewhen it was almost completely within the field of view of the camera. Theabsolute swathe width was therefore assumed to be equal to theobservation swathe width plus the mean target size. Based on thisassumption, the combined linear densities of all targets greater than250 mm were converted to densities per unit area.
The combined densities of all larger munitions, munitions-relatedmaterials and unidentified man-made debris (greater than 250 mm)per square kilometre were too low to permit analysis of the densitydistribution during the course of the each underwater television surveytransect, but were sufficient to permit comparisons between individualsurvey transects. The mean target densities were therefore calculated for astandard two kilometre survey track with a swathe width of one metre.The combined mean target densities for each survey transect aresummarised in Figure 12.
Analysis of the underwater television records confirmed that thecentre of distribution of munitions, munitions-related materials andunidentified man-made debris was located within, and immediatelyadjacent to, the northeast sector of the explosives disposal site, indicatingthat this area was the centre of munitions dumping activity. Largequantities of munitions, munitions-related materials and unidentified man-made debris were also confirmed to be located outside the chartedboundary of the explosives disposal site.
High densities of dumped munitions, munitions-related materialsand unidentified man-made debris were confirmed within the northeastsector of the explosives disposal site. Medium to high densities wereconfirmed at a number of additional locations within the charted boundaryof the site.
Medium to high densities of munitions, munitions-related materialsand unidentified man-made debris were confirmed adjacent to the
1 8
northeast sector of the charted explosives disposal site, within an areaextending approximately 8.5 km from the northeast corner of the site.Within this area, the densities were confirmed to decrease with distancefrom the northeast corner of the site. Low to medium densities ofmunitions, munitions-related materials and unidentified man-made debriswere confirmed to the northwest of the charted boundary of the explosivesdisposal site, and further to the north, northeast and east of the chartedboundary of the site. Low to medium densities of munitions,munitions-related materials and unidentified man-made debris wereconfirmed at a number of additional locations outside the chartedboundary of the site.
Investigation of locations adjacent to the western boundary of theexplosives disposal site, at approximately the same latitude asCopeland Island, confirmed low to medium densities of unidentifiedman-made debris, but also confirmed low densities of identified munitionsand munitions-related materials. It is, nevertheless, considered likely thatthe comparatively high levels of unidentified man-made debris observed inthis area were related to munitions dumping activity. Investigation oflocations adjacent to the southwest corner of the explosives disposal siteconfirmed a similar picture, but identified munitions or munitions-relatedmaterials were recovered from this area during grab and trawl sampling. Itis therefore likely that the comparatively high levels of unidentifiedman-made debris observed in this area were related to munitions dumpingactivity. Investigation of locations adjacent to the southeast corner of theexplosives disposal site confirmed low densities of unidentified man-madedebris, and very low densities of identified munitions and munitions-related materials.
Investigation of locations in the northern Irish Sea confirmed verylow densities of unidentified man-made debris. Munitions and munitions-related materials were not found in this area, and the very low densities ofunidentified debris were considered to represent a "background" level forthis type of man-made debris.
Medium to high densities of munitions, munitions-related materialsand unidentified man-made debris were confirmed in an area crossed bythe submarine gas pipeline installed between the Rhins of Galloway andNorthern Ireland. Low to medium densities were confirmed in an areacrossed by the proposed routing corridor for submarine electricity cableslinking Scotland and Northern Ireland, but low densities were confirmed tobe predominant over the proposed routes of the electricity cables withinthat corridor. Very low densities of unidentified man-made debris were
1 9
confirmed in the area crossed by the submarine gas pipeline installedbetween Wigtown Bay and the Republic of Ireland.
7. Pulse Induction Investigations
The calibration trials confirmed that the pulse induction system detectedthe smallest cylinders (200 mm long x 50 mm diameter), and the level ofthe response of the central coil indicated that the system would probablydetect considerably smaller metallic targets located on the surface of thesea bed. The resolution would be expected to decrease for buried metallicdebris, but the level of the response of the lateral coils indicated that thesystem would probably detect the smallest cylinders at a burial depth ofapproximately 0.5 m, and that the system would probably detect largermetallic targets at a burial depth of up to 1 m.
During the course of the calibration trials, the sledge passed over anumber of items of man-made debris, including a wooden box. The pulseinduction system detected all of the man-made debris that appeared toinclude metallic components. The level of the response to the woodenbox indicated that the contents were unlikely to be metallic. The pulseinduction system also detected a number of targets that were not observedon the underwater television record, indicating that the targets were eitheroutside the observation swathe width of the underwater television systemor buried beneath the surface of the sea bed. Upon completion of thecalibration trials, a threshold response level of 0.25 millivolts (mV) wasselected to exclude the smaller targets that would not be detected usingside-scan sonar.
The locations of the completed pulse induction survey transects areshown in Figure 11. The output from the pulse induction system wasrecorded at approximately one second intervals for the duration of eachsurvey transect. Each target resulted in a sequential increase, peak anddecrease in the detected voltage. The peak for each target wasdetermined, and the target assigned a maximum detection value. Targetswere then separated into four size categories, equivalent to maximumdetection values of less than 0.25 mV, 0.25-1.0 mV, 1.0-10 mV andgreater than 10 mV, and counted.
The counts of metallic contacts for each pulse induction surveytransect record were used to calculate the linear densities of targets of eachsize category. A small amount of smoothing was required to reduce theimpact of electrical noise on peak detection, and this may have resulted inthe combination of multiple peaks with a separation interval of less than
2 0
four seconds (approximately equivalent to a linear separation on the seabed of 0.75 m).
It was noted that the distributions of the smallest metallic targets(maximum detection value of less than 0.25 mV) and the larger metallictargets (maximum detection value of greater than 0.25 mV) were the same,and that the densities were related. It was therefore acceptable to excludethe smallest targets prior to further analysis of the data.
It was also noted that the densities of larger metallic targets(maximum detection value of greater than 0.25 mV) were comparativelylow over most of the survey area. The linear densities for the sizecategories 0.25-1.0 mV, 1.0-10 mV and greater than 10 mV weretherefore combined prior to further analysis of the data.
It was further noted that the highest density of larger metallic targets(maximum detection value of greater than 0.25 mV) was equivalent to amean linear separation on the sea bed of approximately 30 m. It wastherefore unlikely that any combination of multiple peaks resulting fromthe smoothing of the data would have materially affected the targetdensities.
The combined linear densities of larger metallic targets (maximumdetection value of greater than 0.25 mV) were converted to densities perunit area, to permit comparison with the side-scan sonar data. Thedetection swathe width was determined by measuring the linear detectioninterval for each size category of target (the distance that the system movedalong the sea bed track during the increase, peak and decrease of theresponse cycle), and assuming that the swathe width detection intervalwould be the same. The detection swathe width range for all targets with amaximum detection value of greater than 0.25 mV was estimated to be2.4-4.5 m, depending upon the target size. Based on these estimates, thecombined linear densities of all metallic targets with a maximum detectionvalue of greater than 0.25 mV were converted to densities per unit area.The combined mean target densities for a standard two kilometre surveytrack with a swathe width of one metre are summarised in Figure 13.
Preliminary analysis of the pulse induction records confirmed thatthe pattern of distribution of larger metallic targets (maximum detectionvalue of greater than 0.25 mV) was similar to the pattern of distribution oflarger munitions, munitions-related materials and unidentified man-madedebris (greater than 250 mm) derived from analysis of the underwatertelevision records. Further analysis of the pulse induction records wasundertaken during combination of the data sets.
2 1
8. Combination of Side-scan Sonar, Underwater Television andPulse Induction Data
Side-scan sonar did not detect smaller items of man-made debris(less than 250 mm). It is also possible that underwater television did notdetect some of the very small, isolated, metallic targets that were detectedby the pulse induction system, because it was physically impossible to seethe targets; and that pulse induction did not detect all of the smaller targetsthat were observed in dense concentrations on the sea bed, because themultiple peaks were combined. The exclusion of smaller targets with amaximum dimension of less than 250 mm or a maximum pulse inductiondetection value of less than 0.25 mV removed these discrepancies.
In some areas, analysis of the side-scan sonar records may haveresulted in an over-estimate of the densities of larger munitions,munitions-related materials and unidentified man-made debris (greaterthan 250 mm), either because it was impossible to discriminate betweenthose items and other types of debris, or because there were largenumbers of regular-shaped boulders on the sea bed. Analysis of theunderwater television and pulse induction records confirmed that themajority of the regular-shaped targets detected by side-scan sonar weremunitions, munitions-related materials or unidentified man-made debris.It was concluded that any over-estimate of the densities of largermunitions, munitions-related materials and unidentified man-made debrisderived from analysis of the side-scan sonar records would be small, andwould not materially affect combination of the data sets.
Underwater television did not detect metallic targets that were lyingon the surface of the sea bed totally outside the observation swathe widthof the underwater television system. The linear densities of targets derivedfrom analysis of the underwater television and pulse induction recordswere therefore converted to densities per unit area, taking account of thediffering survey swathe widths, to permit direct comparison with the side-scan sonar data.
Side-scan sonar and underwater television did not detect metallictargets that were buried beneath the surface of the sea bed. It wastherefore necessary to examine the underwater television and pulseinduction data sets, to determine whether burial was an important factor.The detection swathe width of each pulse induction coil was estimated tobe between 2.4 m and 4.5 m, depending upon the size category of thetarget. As the central coil was positioned directly behind the underwatertelevision camera, it would normally provide coverage of approximately
2 2
the same swathe width as the visual system. The lateral coils, positioned0.6 m to either side of the central coil, would provide overlappingcoverage for detection of even the smallest objects that lay within theobservation swathe width of the underwater television system, in additionto providing coverage of outlying areas. The central coil of the pulseinduction system failed during the thirty seventh combined underwatertelevision and pulse induction survey transect, and it was necessary tocomplete the survey using the two lateral coils. Whilst there was no loss ofcoverage within the observation swathe width of the underwater televisionsystem, because the lateral coils provided overlapping coverage, it was notpossible to directly compare the output of the central coil with theassociated underwater television record.
Where it was possible to directly compare the output of the centralcoil and the underwater television record, the densities of targets were verylow, as the combined underwater television and pulse induction surveywas started in the northern Irish Sea and then moved progressively northtoward the northern end of the Beaufort's Dyke. Encounter rates weretherefore as low as four targets per survey transect, and it was not feasibleto undertake a statistically valid comparison of data sets. However, thecalibration trials had confirmed that all targets on the surface of the sea bedwithin the observation swathe width of the underwater television systemwere detected by the central coil, and this was noted to be the case duringthe first 36 combined underwater television and pulse induction surveytransects. It was therefore reasonable to assume that targets that weredetected beneath the central coil, but were not visible on the surface ofthe sea bed, were buried within the observation swathe width of theunderwater television system.
To supplement these observations, the mean target densitiesderived from analysis of the underwater television and pulse inductionrecords were examined, to determine whether there were markeddifferences between the average target encounter rates. Comparative datawas available for 48 of the combined underwater television and pulseinduction survey transects. The mean target densities derived from analysisof the underwater television records for those transects are shown inFigure 14. Comparison with the mean target densities derived fromanalysis of the pulse induction records (Fig. 13) confirmed good agreementbetween the survey methods, and indicated that the average targetencounter rates were very similar. The slope of a linear regression analysisof the two data sets was not significantly different from unity, and theintercept of the slope was not significantly different from zero. There wereno instances of large numbers of pulse induction targets in areas wheresurface targets were not observed on the underwater television records.
2 3
It was concluded that the majority of the metallic targets detectedusing pulse induction were related to munitions dumping operations; thatthe majority of the larger items of man-made debris were located on thesurface of the sea bed, and only a comparatively small number ofunidentified targets were buried beneath the surface of the sea bed; andthat the distributions of surface and buried man-made debris were verysimilar. It is therefore unlikely that there are accumulations of buriedmunitions or munitions-related materials at locations where ordnance isnot present on the surface of the sea bed.
Analysis of the data sets for the combined underwater televisionand pulse induction survey transects confirmed a statistically validrelationship between the two survey methods. The mean target densitiesderived from analysis of the underwater television and/or pulse inductionrecords were therefore taken as validated estimates of abundance. Theunderwater television and pulse induction data sets provided a total of 89measurements of mean target density, but there was insufficientunderwater television and/or pulse induction coverage to accurately mapthe target distribution. The side-scan sonar data set provided1,900 estimates of relative density for the entire survey area.
The mean densities of side-scan sonar targets at the locations of theunderwater television and/or pulse inductions survey transects werecalculated using Kriging interpolation. The side-scan sonar target densitieswere then compared with the underwater television and/or pulse inductiontarget densities. A relationship between the side-scan sonar target densitiesand the underwater television and/or pulse induction target densities wasobtained by least squares regression, and the equation used to calculateside-scan sonar target densities for the entire survey area.
The scaled data sets could then have been combined, but mappingwould have been inappropriate because the 1,900 side-scan sonar datapoints would have dominated the map and the 89 underwater televisionand/or pulse induction data points would have provided a negligiblecontribution. It was therefore necessary to use the 89 underwatertelevision and/or pulse induction data points as the primary source ofvalidated data, and to interpolate the side-scan sonar target densitieswhere underwater television and/or pulse induction measurements werenot available. To achieve this, all side-scan sonar data points within twokilometres of any of the underwater television and/or pulse inductionsurvey transects were excluded, to ensure that the underwater televisionand/or pulse induction measurements were honoured. That leftapproximately 70% of the original side-scan sonar data set, concentrated in
2 4
areas where underwater television and/or pulse induction measurementswere not available. The selected data sets were then combined andgridded using Kriging interpolation. The gridded data of computeddensities per square kilometre were then contoured and mapped. Thecontour map of the densities of munitions, munitions-related materials andunidentified items of man-made debris per square kilometre is shownin Figure 15.
Combination of the side-scan sonar, underwater television andpulse induction data sets confirmed that the centre of distribution ofdumped munitions, munitions-related materials and unidentified man-made debris was located within, and immediately adjacent to, thenortheast sector of the Beaufort's Dyke explosives disposal site. Largequantities of dumped munitions, munitions-related materials andunidentified man-made debris were indicated within an area extendingapproximately 5.1 km to the west; 6.0 km to the northwest; 8.4 km to thenorth; 3.3 km to the northeast and east; and 8.4 km to the southeast of thenortheast corner of the charted explosives disposal site.
Moderate quantities of dumped munitions, munitions-relatedmaterials and unidentified man-made debris were indicated within asmaller area extending approximately 3.6 km outside the westernboundary of the charted explosives disposal site, at approximately thesame latitude as Copeland Island, but the underwater television recordsconfirmed that there were comparatively low densities of identifiedmunitions and munitions-related materials in this area. Moderatequantities of munitions, munitions-related materials and unidentified man-made debris were also indicated within an area extending approximately7.9 km to the south of the southwest corner of the charted explosivesdisposal site. Again, the underwater television records confirmedcomparatively low densities of identified munitions and munitions-relatedmaterials, but munitions and munitions-related materials were recoveredfrom this area during grab and trawl sampling.
Small quantities of munitions, munitions-related materials andunidentified man-made debris were indicated within a number ofadditional areas outside the charted boundary of the explosives disposalsite, mainly in areas that were adjacent to, or linked with, the areasdetailed above. The densities of munitions, munitions-related materialsand unidentified man-made debris in these areas were equivalent toencounter rates of less than five targets per kilometre of survey track.
Elsewhere throughout the survey area, with the exception of onevery small area in the northern Irish Sea, the densities of munitions,
2 5
munitions-related materials and unidentified man-made debris wereindicated to be very low, and equivalent to encounter rates of one, or lessthan one, target per kilometre of survey track. The underwater televisionrecords indicated that target densities of this magnitude were probably the"background" level of unidentified man-made debris, and there was noevidence to suggest that the debris was related to munitions dumpingoperations.
The densities of munitions, munitions-related materials andunidentified man-made debris in the exceptional area in the northernIrish Sea cannot be explained. There was no evidence to suggest that anyof the debris observed in the northern Irish Sea was related to munitionsdumping operations, and it must be assumed that the "background" level ofunidentified man-made debris was greater in this exceptional area.
CONCLUSIONS
1. Seabed Bathymetry and Sediment Type
The seabed bathymetry and sediment type data was compatible withsurvey data provided by the Hydrographer of the Navy. The surfaceseabed sediments in the survey area ranged from silt to rock formations.Within the explosives disposal site, the surface seabed sediments werepredominantly medium to coarse sands, with variable amounts of silt, smallstones (granules and pebbles), bivalve and gastropod shell debris, cobblesand boulders.
2. Seabed Sediment Chemistry
Phosgene, mustard gas, phosphorus, nitroglycerine, 2,4,6 trinitrotoluene,RDX and tetryl were not detected in any of the seabed sediment samplessubmitted to DERA.
The mean concentrations of heavy metals in the surface seabedsediments were within the ranges previously reported in samples fromother Scottish coastal environments, and similar to the levels reported inthe Irish Sea. It is likely that the levels of heavy metals are related toanthropogenic and/or geological sources in the Irish Sea area. There wasno evidence of additional contamination related to munitions dumpingoperations.
3. Fish and Shellfish Chemistry
2 6
Nitroglycerine, 2,4,6 trinitrotoluene, RDX and tetryl were not detected inany of the fish and shellfish samples submitted to DERA.
The mean concentrations of heavy metals in the edible flesh of fishand shellfish were within the ranges previously reported in commercialcatches from various areas around the United Kingdom coastline, and donot compromise public health. The levels of heavy metals in the NorthChannel were generally lower than the levels in adjacent areas of thenorthern Irish Sea. It is likely that the levels of lead and zinc in dogfish arerelated to dietary factors, and that the levels of mercury in a number of fishspecies are related to anthropogenic sources in the Mersey Estuary andLiverpool Bay. There was no evidence of additional contamination relatedto munitions dumping operations.
The levels of arsenic in the edible flesh of fish and shellfish wereextremely variable, which is consistent with the data previously reportedfor Scottish waters. A recent MAFF study of arsenic levels in dabs from theIrish Sea area has confirmed that the arsenic is predominantly accumulatedin the benign organic form, and that the levels do not compromise publichealth. Although the levels of organic arsenic in fish and shellfish were notdetermined in the present study, it is reasonable to assume that themajority of the arsenic will be accumulated in the organic form.
4. Side-scan Sonar, Underwater Television and Pulse InductionInvestigations
Analysis of the side-scan sonar, underwater television, and pulse inductionrecords confirmed that the centre of distribution of dumped munitions andmunitions-related materials was located within, and immediately adjacentto, the northeast sector of the Beaufort's Dyke explosives disposal site; andthat large quantities of dumped munitions, munitions-related materials andunidentified man-made debris were located outside the charted boundaryof the site.
Medium to high densities of dumped munitions, munitions-relatedmaterials and unidentified man-made debris were confirmed in the areaadjacent to the northeast sector of the charted explosives disposal site. Inthis area, munitions and munitions-related materials were located aconsiderable distance outside the charted boundary of the site. Low tomedium densities of unidentified man-made debris, probably related tomunitions dumping operations, were confirmed in two smaller areas, tothe west and southwest of the charted boundary of the explosives disposalsite.
2 7
Medium to high densities of dumped munitions, munitions-relatedmaterials and unidentified man-made debris were confirmed in an areacrossed by the submarine gas pipeline installed between theRhins of Galloway and Northern Ireland. Low to medium densities ofdumped munitions, munitions-related materials and unidentified man-made debris were confirmed in an area crossed by the proposed routingcorridor for submarine electricity cables linking Scotland and NorthernIreland, but low densities were confirmed to be predominant over theproposed routes of the electricity cables within that corridor. These resultswere compatible with the results of previous, local, surveys undertaken byPremier Transco and Northern Ireland Electricity.
Dumped munitions and munitions-related materials were not foundin the area crossed by the submarine gas pipeline installed betweenWigtown Bay and the Republic of Ireland. In this area, the densities ofunidentified man-made debris were similar to the densities foundelsewhere in the northern Irish Sea, and there was no evidence to suggestthat the debris was related to munitions dumping operations.
5. Magnetometer Investigations
The magnetometer data set was considered to be of limited value, becausethe pattern of magnetic field strength could be accounted for by changes inthe earth's magnetic field or local geological sources.
SOAEFD, Marine LaboratoryAberdeen
21 November 1996
2 8
Concentration (mg/kg dry weight)C(%) N(%)
Al As Cd Cr Cu Pb Hg Ni Zn
1995 SOAEFD Survey
Mean 3.277 11.29 0.053 36.225 7.19 21.746 0.1 7.204 57.542 0.405 0.074
Standard deviation 1.328 5.198 0.021 11.03 2.451 5.564 0.052 6.372 20.061 0.233 0.033
1996 SOAEFD Survey
Mean 2.14 6.953 0.05 30.954 6.057 20.696 0.045 8.605 43.629 0.265 0.055
Standard deviation 1 2.509 0.044 14.273 2.018 6.339 0.044 6.652 14.996 0.153 0.025
MAFF Survey
Mean 2.165 No data 0.057 32.984 6.046 17.108 0.059 No data 41.578 0.457 0.038
Standard deviation 1.472 No data 0.039 22.72 4.469 11.431 0.09 No data 29.971 0.439 0.029
Table 1 Surface seabed sediment chemistry. Summary of results of 1995 and 1996 SOAEFD surveys of the North Channel and northern Irish Seaand an earlier MAFF survey of the Irish Sea
Species
Northern end of Beaufort's Dyke (Area A)Southern end ofBeaufort's Dyke
(Area B)
North of Isle of Man(Area C)
West of Isle of Man(Area D)
1995 1996 1996
NumberSize range
(mm) NumberSize range
(mm) NumberSize range
(mm) NumberSize range
(mm) NumberSize range
(mm)
Cod 10 300-450 10 450-550 10 450-650 10 300-500 20 400-800
Haddock 10 300-400 25 350-450 10 200-400 - - - -
Whiting 10 300-450 - - 20 300-400 10 300-340 20 200-300
Hake 10 250-350 - - - - - - - -
Ling - - - - - - - - 4 550-800
Monkfish 10 NR - - - - - - - -
Plaice 10 250-400 25 250-400 - - 3 200-600 - -
Lemon sole - - - - - - 10 250-300 - -
Herring - - - - - - 10 200-300 - -
Dogfish - - 10 600-700 10 550-650 10 500-650 - -
"Prawns" (Nephropsnorvegicus) compositesample
25 (x2) 25-40 25 30-40 - - - - - -
"Queen" scallops(Chlamys opercularis)composite sample
10 NR - - - - 10 55-65 - -
Table 2 Fish and shellfish chemistry. Summary of fish and shellfish sampled in each area, and the number and size ranges of the individualsselected for chemical analysis (NR - not recorded)
Species
Concentration (mg/kg wet weight)
As Cd Cu Pb Hg Zn
1995 1996 1995 1996 1995 1996 1995 1996 1995 1996 1995 1996
Cod Average 4.49 7.65 0.004 0.001 0.18 0.22 0.01 0.029 0.037 0.08 3.31 3.85
Standard deviation 1.7 5.3 0.004 0.001 0.04 0.06 0 0.006 0.008 0.02 0.27 0.25
Median 4.3 7.87 0.003 <0.001 0.17 0.19 0.01 0.026 0.036 0.08 3.24 3.89
Haddock Average 11.04 5.63 0.002 <0.001 0.14 0.18 0.006 0.036 0.026 0.05 2.83 3.72
Standard deviation 4.56 3.26 0.001 <0.001 0.02 0.07 0.003 0.045 0.01 0.02 0.45 0.42
Median 10.54 5.22 0.001 <0.001 0.14 0.16 0.007 0.017 0.025 0.06 2.83 3.76
Whiting Average 4.66 0.002 0.22 0.01 0.061 3.48
Standard deviation 1.48 0.001 0.04 0.01 0.02 0.33
Median 4.36 0.002 0.23 0.01 0.066 3.5
Hake Average 3.45 0.002 0.18 0.009 0.01 3.01
Standard deviation 1.25 0.001 0.07 0.006 0 0.24
Median 3.05 0.001 0.2 0.008 0.01 2.93
Monkfish Average 7.04 0.003 0.16 0.005 0.056 3.59
Standard deviation 6.78 0.001 0.03 0.001 0.021 0.45
Median 6.4 0.002 0.15 0.005 0.05 3.61
Plaice Average 12.18 19.32 0.002 0.001 0.17 0.18 0.01 0.023 0.025 0.08 4.14 4.5
Standard deviation 10.33 8.38 0.001 0.001 0.04 0.06 0.004 0.13 0.019 0.03 0.95 0.65
Median 6.47 17.75 0.002 0.001 0.18 0.17 0.012 0.019 0.021 0.08 3.86 4.59
Dogfish Average 13.04 0.002 0.33 0.119 0.56 11.58
Standard deviation 5.78 0.002 0.11 0.063 0.26 1.72
Median 12.49 0.002 0.3 0.097 0.52 12.16
"Prawns" (Nephrops norvegicus)composite sample
6.61 7.19 0.023 0.007 5.97 3.41 0.02 0.037 0.033 0.04 12.17 11.97
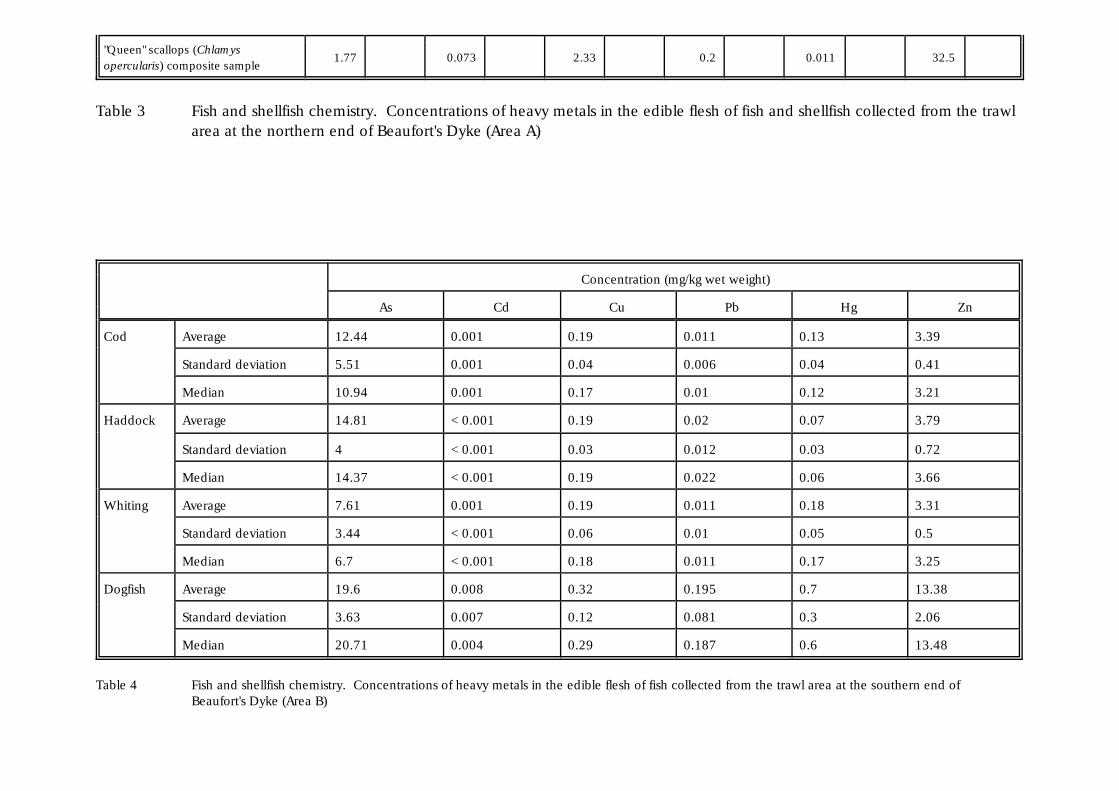
"Queen" scallops (Chlamysopercularis) composite sample
1.77 0.073 2.33 0.2 0.011 32.5
Table 3 Fish and shellfish chemistry. Concentrations of heavy metals in the edible flesh of fish and shellfish collected from the trawlarea at the northern end of Beaufort's Dyke (Area A)
Concentration (mg/kg wet weight)
As Cd Cu Pb Hg Zn
Cod Average 12.44 0.001 0.19 0.011 0.13 3.39
Standard deviation 5.51 0.001 0.04 0.006 0.04 0.41
Median 10.94 0.001 0.17 0.01 0.12 3.21
Haddock Average 14.81 <0.001 0.19 0.02 0.07 3.79
Standard deviation 4 <0.001 0.03 0.012 0.03 0.72
Median 14.37 <0.001 0.19 0.022 0.06 3.66
Whiting Average 7.61 0.001 0.19 0.011 0.18 3.31
Standard deviation 3.44 <0.001 0.06 0.01 0.05 0.5
Median 6.7 <0.001 0.18 0.011 0.17 3.25
Dogfish Average 19.6 0.008 0.32 0.195 0.7 13.38
Standard deviation 3.63 0.007 0.12 0.081 0.3 2.06
Median 20.71 0.004 0.29 0.187 0.6 13.48
Table 4 Fish and shellfish chemistry. Concentrations of heavy metals in the edible flesh of fish collected from the trawl area at the southern end ofBeaufort's Dyke (Area B)
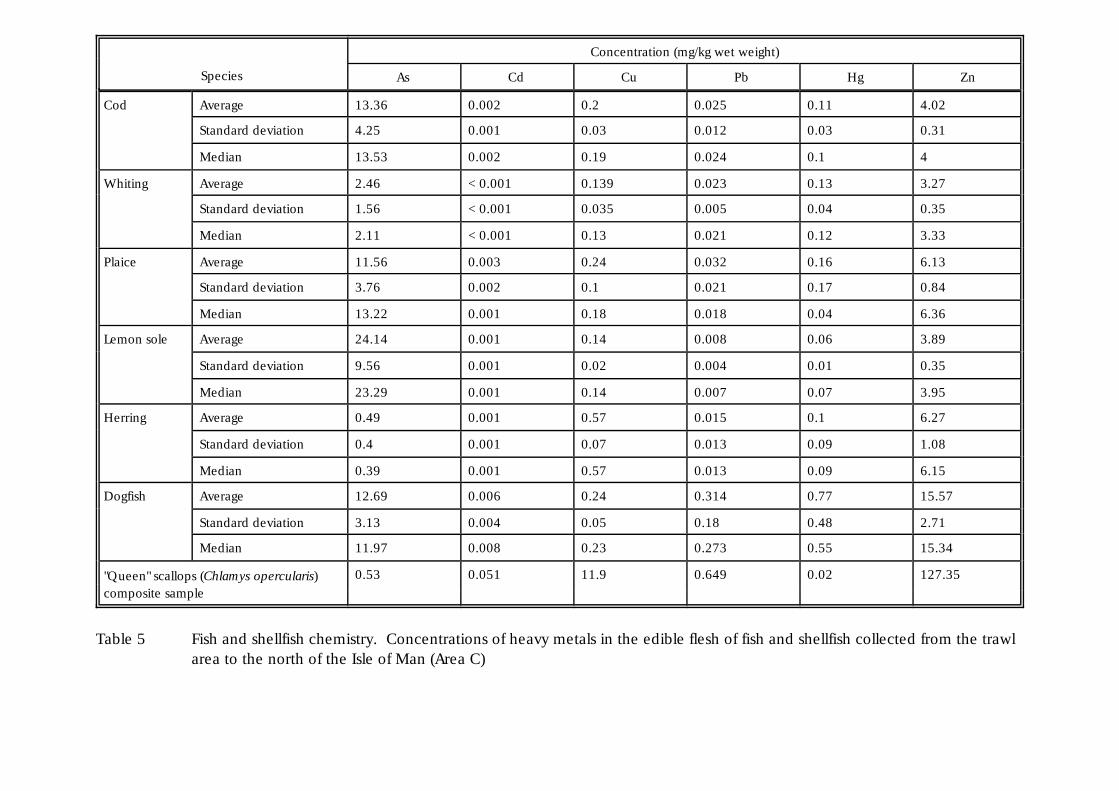
Species
Concentration (mg/kg wet weight)
As Cd Cu Pb Hg Zn
Cod Average 13.36 0.002 0.2 0.025 0.11 4.02
Standard deviation 4.25 0.001 0.03 0.012 0.03 0.31
Median 13.53 0.002 0.19 0.024 0.1 4
Whiting Average 2.46 <0.001 0.139 0.023 0.13 3.27
Standard deviation 1.56 <0.001 0.035 0.005 0.04 0.35
Median 2.11 <0.001 0.13 0.021 0.12 3.33
Plaice Average 11.56 0.003 0.24 0.032 0.16 6.13
Standard deviation 3.76 0.002 0.1 0.021 0.17 0.84
Median 13.22 0.001 0.18 0.018 0.04 6.36
Lemon sole Average 24.14 0.001 0.14 0.008 0.06 3.89
Standard deviation 9.56 0.001 0.02 0.004 0.01 0.35
Median 23.29 0.001 0.14 0.007 0.07 3.95
Herring Average 0.49 0.001 0.57 0.015 0.1 6.27
Standard deviation 0.4 0.001 0.07 0.013 0.09 1.08
Median 0.39 0.001 0.57 0.013 0.09 6.15
Dogfish Average 12.69 0.006 0.24 0.314 0.77 15.57
Standard deviation 3.13 0.004 0.05 0.18 0.48 2.71
Median 11.97 0.008 0.23 0.273 0.55 15.34
"Queen" scallops (Chlamys opercularis)composite sample
0.53 0.051 11.9 0.649 0.02 127.35
Table 5 Fish and shellfish chemistry. Concentrations of heavy metals in the edible flesh of fish and shellfish collected from the trawlarea to the north of the Isle of Man (Area C)
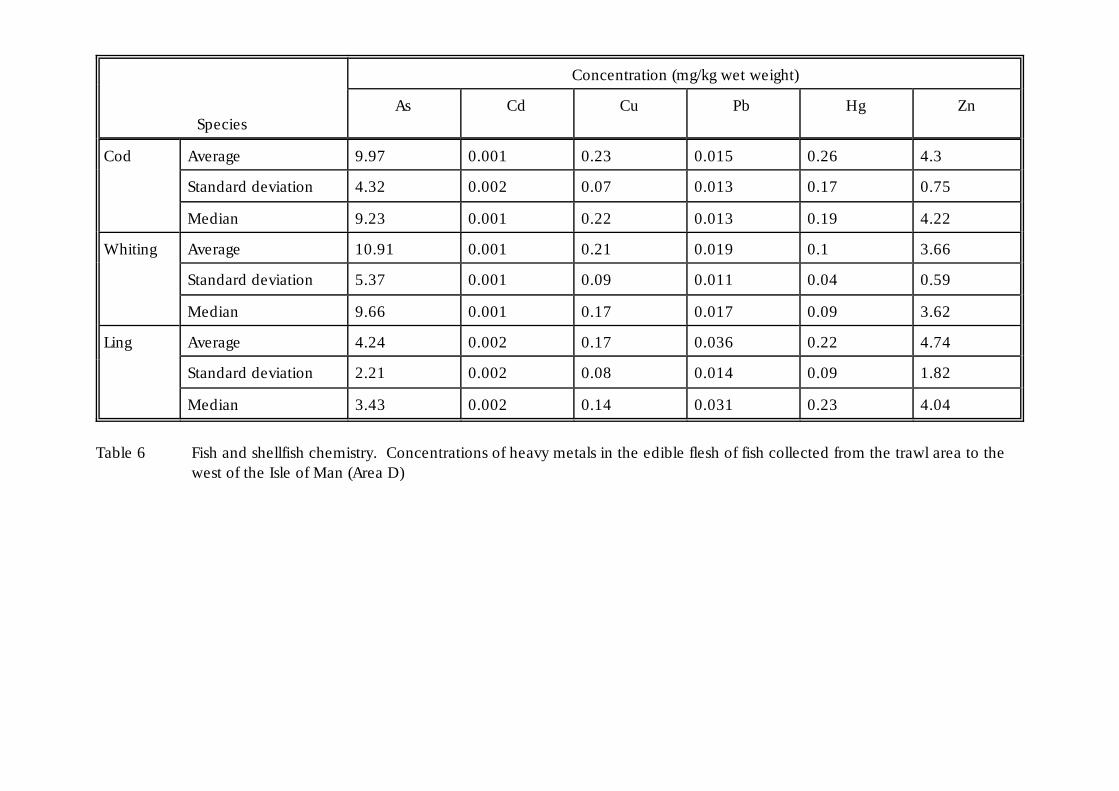
Species
Concentration (mg/kg wet weight)
As Cd Cu Pb Hg Zn
Cod Average 9.97 0.001 0.23 0.015 0.26 4.3
Standard deviation 4.32 0.002 0.07 0.013 0.17 0.75
Median 9.23 0.001 0.22 0.013 0.19 4.22
Whiting Average 10.91 0.001 0.21 0.019 0.1 3.66
Standard deviation 5.37 0.001 0.09 0.011 0.04 0.59
Median 9.66 0.001 0.17 0.017 0.09 3.62
Ling Average 4.24 0.002 0.17 0.036 0.22 4.74
Standard deviation 2.21 0.002 0.08 0.014 0.09 1.82
Median 3.43 0.002 0.14 0.031 0.23 4.04
Table 6 Fish and shellfish chemistry. Concentrations of heavy metals in the edible flesh of fish collected from the trawl area to thewest of the Isle of Man (Area D)
APPENDIX 1
UNCLASSIFIED
DERACES Sector
Fort HalsteadSevenoaks
KentTN14 7BP
Analysis of sea bed sediment samples forchemical weapon and explosives residues.
Beaufort's Dyke area
CBDE/CES/FEL/CR9604
Cover + i + 4 pages
R J Weighill
CBDE/CES/FEL/CR9604 UNCLASSIFIED

January 1996
CBDE/CES/FEL/CR9604 UNCLASSIFIED
UNCLASSIFIED
This document has been prepared for MOD and,unless indicated, may be used and circulated in
accordance with the conditions of the Order underwhich it was supplied.
It may not be used or copied for any non-Governmental
or commercial purpose without the writtenagreement of DERA.
© Crown Copyright (1996)Defence Evaluation and Research AgencyFarnborough, Hampshire, GU14 6TD, UK
CBDE/CES/FEL/CR9604 UNCLASSIFIED
UNCLASSIFIED
Authorisation
Authorised by Dr M Marshall
Title Head Forensic Explosives Laboratory
Date 31 January 1996Issued by Chemical and Electronics Business Sector
Building S12
DRA Fort Halstead
Telephone 01959 514000
CBDE/CES/FEL/CR9604 UNCLASSIFIED
UNCLASSIFIED
1. Introduction
1.1 This report has been prepared by the Defence Evaluation andResearch Agency Forensic Explosives Laboratory for MOD Env Pol(sec) 1 under contract reference D/d of C/EA1. It covers theanalysis of sea bed sediment samples for traces of certain explosivesand chemical weapons.
2. Experimental
2.1 Description of samples and storage conditions
2.1.1 Forty-eight samples were received at Porton Down. The samplesconsisted mainly of a fine sandy mud with included small stonesalthough a small number were of a coarser nature consisting ofsmall sea shells or fragments. Some of the glass jars were found tobe broken when inspected prior to commencement of work and soafter removal of a portion for analysis they were sealed in nylonbags. As they had been previously stored frozen they were placedin a cold room at 5°C before and after analysis at Porton Downthen despatched to Fort Halstead where they were stored in afreezer at -18°C before and after analysis.
2.2 Analysis of samples for chemical weapons
2.2.1 Analysis method: The samples were allowed to thaw for severalhours and then a portion (approx. 50 gram) was removed byweighing into a 100 ml screw cap glass jar. To this was added anequal weight of anhydrous sodium sulphate and the two werethoroughly mixed using a stainless steel spatula. An equal volumeof dichloromethane was added and the sample was extracted byshaking for 10 minutes. A 2 ml aliquot was removed and analysedby gas chromatography (GC) using a flame photometric detector(FPD) in phosphorus and sulphur modes.
2.2.2 Limit of detection: The limit of detection for mustard and forG-agents established by injection of external calibration standards is0.1 ppm.
2.3 Results
1CBDE/CES/FEL/CR9604 UNCLASSIFIED
UNCLASSIFIED
2.3.1 All 48 samples were analysed using the above method and noevidence of CW agent contamination was found. The onlycompounds found were, in the sulphur mode elemental sulphurand in the phosphorus mode tributyl phosphate. These compoundswere present in most samples including the blanks and weretherefore naturally occurring or from the sample jars. The identityof these compounds was established by GC analysis of selectedsamples using a mass selective detector. Identification was bylibrary comparison.
2.4 Analysis of samples for explosives traces
2.4.1 Analysis method: the samples were thawed at room temperaturethen thoroughly mixed in their containers using a steel spatula. After sampling they were returned to the freezer and remain thereat the time of this report. Each jar was sampled takingapproximately 5 grams which was mixed in a fresh disposableplastic beaker with 20 ml of ethyl acetate, shaken by ultrasound forfive minutes then left to stand for two hours. 10 ml of the resultingsupernatant was removed into a disposable centrifuge tube andspun at high speed for five minutes. The supernatant was decantedinto a fresh disposable glass vial and evaporated on a heated waterbath to a volume of 2 ml. Aliquots of the 2 ml sample wereanalysed by Gas Chromatography with selectivechemiluminescence detection (GC/TEA). This method is capable ofdetecting the common high explosives with very high sensitivity. The laboratory standard method, which is accredited by NAMAS,was followed except that tetryl (CE) was added to the standardmixture used for instrument calibration.
2.4.2 Limit of detection: The limit of detection for the explosivesnitroglycerine, 2,4,6 trinitrotoluene, RDX and tetryl (CE) isestimated at 1 µg per gram of sediment. To confirm the efficiencyof the extraction technique two additional 5 g samples taken atrandom were each spiked with 5 µg of nitroglycerine and 5 µg ofTNT. These samples were extracted and analysed using identicaltechniques and both yielded strong responses for both explosives.
2.5 Results
2.5.1 No explosives were detected in any of the 48 samples. One sampleBD/07/025 gave initial responses which were identified by mass
2CBDE/CES/FEL/CR9604 UNCLASSIFIED
UNCLASSIFIED
spectroscopic analysis as probable nitroethylbenzenes, butsubsequent analysis of four further 5 g samples from BD/07/025proved to be negative.
3. Conclusions
3.1 None of the 48 samples of sediment from the sea bed in theBeaufort's Dyke area showed either the presence of the chemicalweapons agents phosgene and mustard gas or the presence of theexplosives nitroglycerine, 2,4,6 trinitrotoluene, RDX or tetryl. Wewere unable to confirm the possible presence of nitroethylbenzenesin one sample, and consider that the responses related to specieswhich were insignificant in the overall bulk of the sample.
3CBDE/CES/FEL/CR9604 UNCLASSIFIED
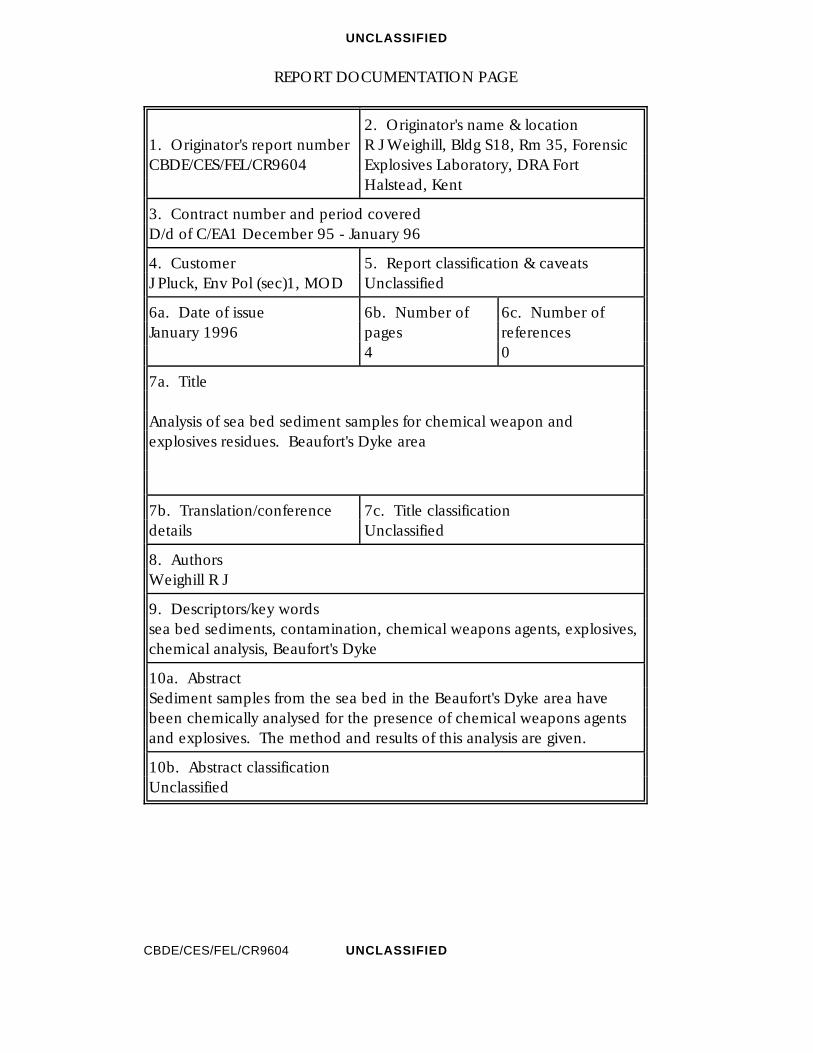
UNCLASSIFIED
REPORT DOCUMENTATION PAGE
1. Originator's report numberCBDE/CES/FEL/CR9604
2. Originator's name & locationR J Weighill, Bldg S18, Rm 35, ForensicExplosives Laboratory, DRA FortHalstead, Kent
3. Contract number and period coveredD/d of C/EA1 December 95 - January 96
4. CustomerJ Pluck, Env Pol (sec)1, MOD
5. Report classification & caveatsUnclassified
6a. Date of issueJanuary 1996
6b. Number ofpages4
6c. Number ofreferences0
7a. Title
Analysis of sea bed sediment samples for chemical weapon andexplosives residues. Beaufort's Dyke area
7b. Translation/conferencedetails
7c. Title classificationUnclassified
8. AuthorsWeighill R J
9. Descriptors/key wordssea bed sediments, contamination, chemical weapons agents, explosives,chemical analysis, Beaufort's Dyke
10a. AbstractSediment samples from the sea bed in the Beaufort's Dyke area havebeen chemically analysed for the presence of chemical weapons agentsand explosives. The method and results of this analysis are given.
10b. Abstract classificationUnclassified
CBDE/CES/FEL/CR9604 UNCLASSIFIED
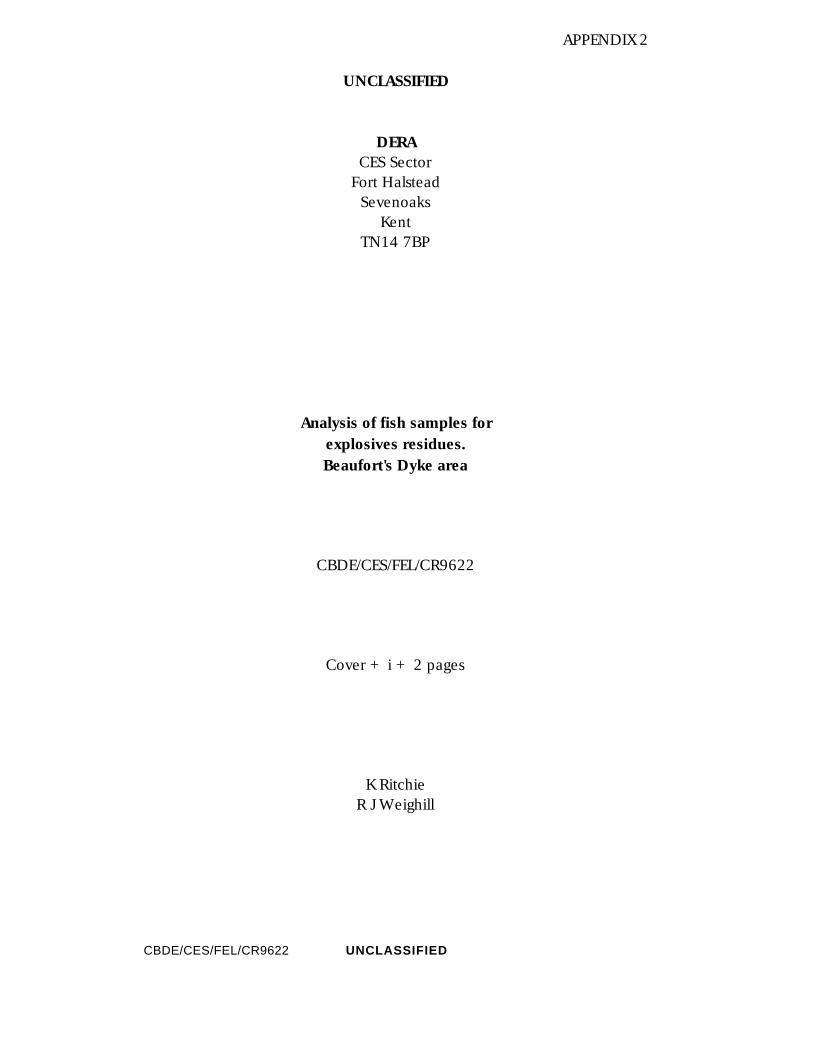
APPENDIX 2
UNCLASSIFIED
DERACES Sector
Fort HalsteadSevenoaks
KentTN14 7BP
Analysis of fish samples forexplosives residues.Beaufort's Dyke area
CBDE/CES/FEL/CR9622
Cover + i + 2 pages
K RitchieR J Weighill
CBDE/CES/FEL/CR9622 UNCLASSIFIED

April 1996
CBDE/CES/FEL/CR9622 UNCLASSIFIED

UNCLASSIFIED
This document has been prepared for MOD and,unless indicated, may be used and circulated in
accordance with the conditions of the Order underwhich it was supplied.
It may not be used or copied for any non-Governmental
or commercial purpose without the writtenagreement of DERA.
© Crown Copyright (1996)Defence Evaluation and Research AgencyFarnborough, Hampshire, GU14 6TD, UK
CBDE/CES/FEL/CR9622 UNCLASSIFIED
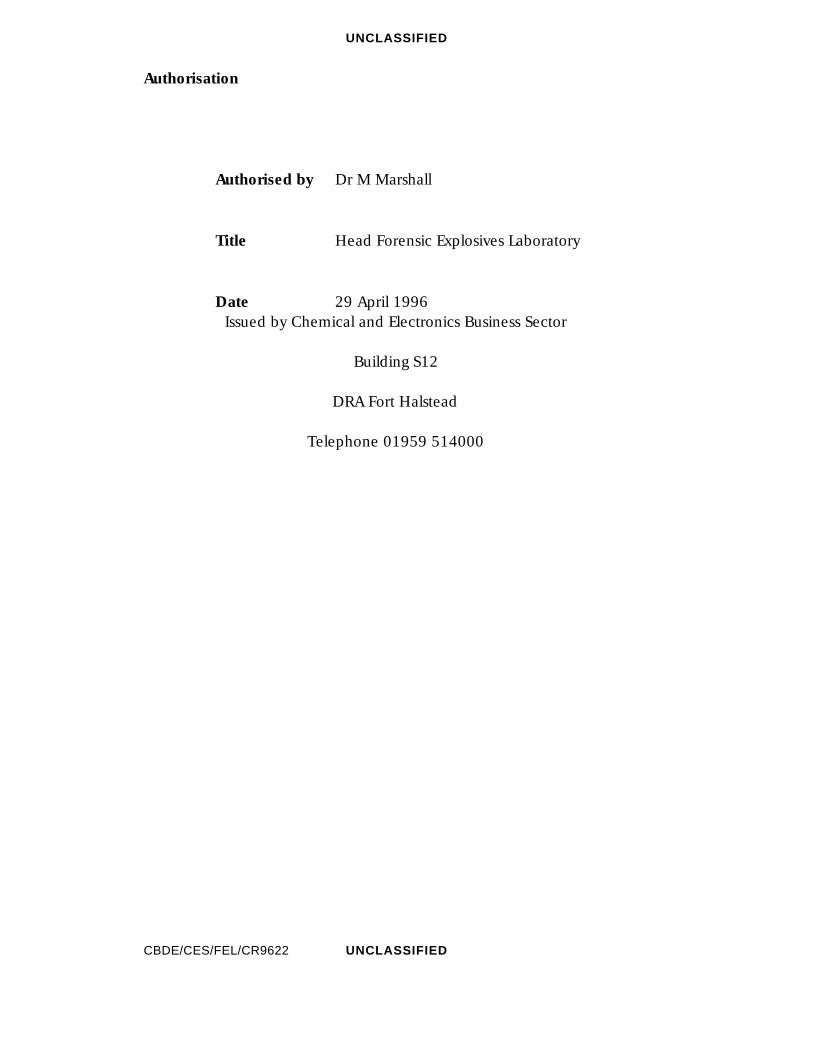
UNCLASSIFIED
Authorisation
Authorised by Dr M Marshall
Title Head Forensic Explosives Laboratory
Date 29 April 1996Issued by Chemical and Electronics Business Sector
Building S12
DRA Fort Halstead
Telephone 01959 514000
CBDE/CES/FEL/CR9622 UNCLASSIFIED
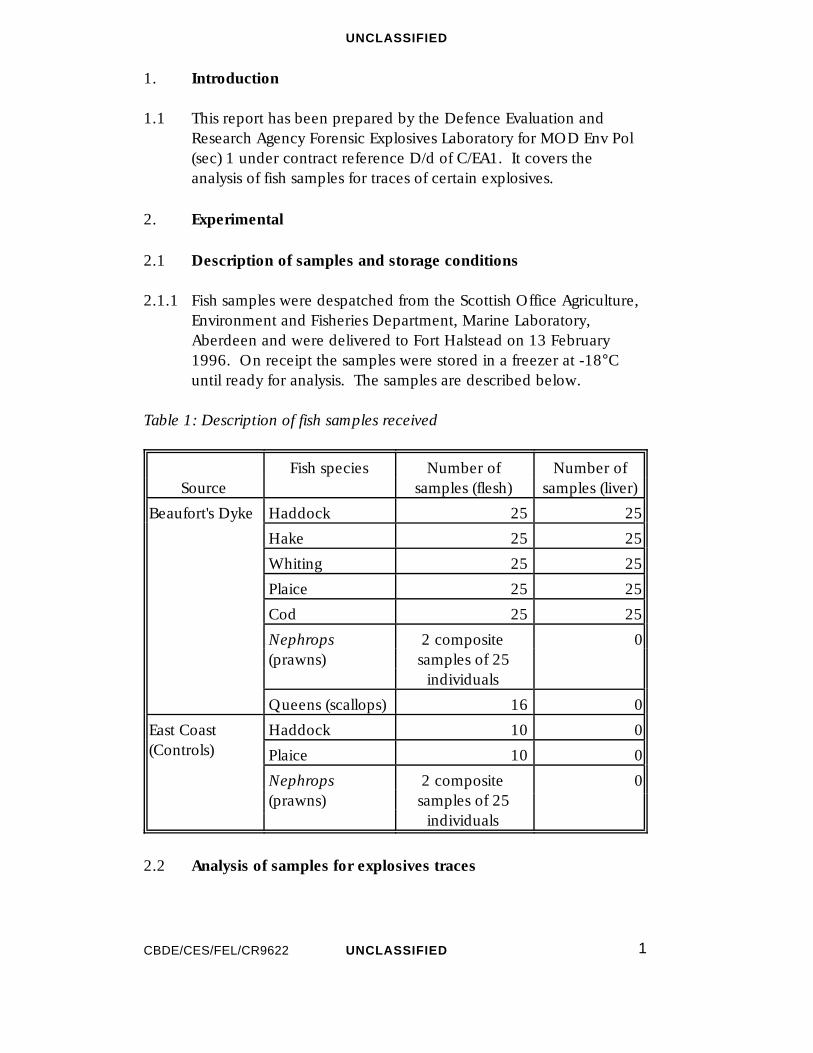
UNCLASSIFIED
1. Introduction
1.1 This report has been prepared by the Defence Evaluation andResearch Agency Forensic Explosives Laboratory for MOD Env Pol(sec) 1 under contract reference D/d of C/EA1. It covers theanalysis of fish samples for traces of certain explosives.
2. Experimental
2.1 Description of samples and storage conditions
2.1.1 Fish samples were despatched from the Scottish Office Agriculture,Environment and Fisheries Department, Marine Laboratory,Aberdeen and were delivered to Fort Halstead on 13 February1996. On receipt the samples were stored in a freezer at -18°Cuntil ready for analysis. The samples are described below.
Table 1: Description of fish samples received
SourceFish species Number of
samples (flesh)Number of
samples (liver)
Beaufort's Dyke Haddock 25 25
Hake 25 25
Whiting 25 25
Plaice 25 25
Cod 25 25
Nephrops(prawns)
2 compositesamples of 25
individuals
0
Queens (scallops) 16 0
East Coast(Controls)
Haddock 10 0
Plaice 10 0
Nephrops(prawns)
2 compositesamples of 25
individuals
0
2.2 Analysis of samples for explosives traces
1CBDE/CES/FEL/CR9622 UNCLASSIFIED
UNCLASSIFIED
2.2.1 Analytical trials: Research was carried out to determine the bestmethod for analysis of both the flesh and liver samples. Homogenisation of the sample by chopping or grinding followed bysolvent extraction of the pulverised sample and analysis of theextract by gas chromatography with selective chemiluminescencedetection (GC/TEA) was chosen as the optimum method. Analyticaltrials were carried out on both the liver and flesh samples. Themethod was suitable for the flesh but some species in the liverextract produced interferences in the CG/TEA system. It becameclear that no analytical technique available in this department wassuitable for the livers and no further work was attempted on thesesamples.
2CBDE/CES/FEL/CR9622 UNCLASSIFIED
UNCLASSIFIED
2.2.2 Sampling protocol: Five individuals of each available species of fishfrom both Beaufort's Dyke and the East Coast were selected atrandom, approximately 5 gram samples of flesh being removedfrom each individual. The five 5 gram portions were combined togive an approximately 25 gram composite of each available speciesfrom the two sites.
2.2.3 For the Nephrops approximately 12 gram was removed from eachof the two composite samples and combined to give anapproximately 25 gram composite from each site.
2.2.4 For the queens five individuals were selected at random andcombined to produce a composite sample.
2.2.5 Analysis method: The individual samples were thawed at roomtemperature then thoroughly mixed in a glass mortar using a glasspestle to give a composite sample for each species. The remainderof the samples remain in the freezer at the time of this report. 20ml of ethyl acetate was added to the mortar and the mixture groundwith the pestle for two minutes then filtered. The filtrate wasdecanted into a fresh disposable vial. Aliquots of the filtrate wereanalysed by gas chromatography with selective chemiluminescencedetection (GC/TEA). This method is capable of detecting thecommon high explosives with very high sensitivity. The laboratorystandard method, which is accredited by NAMAS, was followedexcept that tetryl (CE) was added to the standard mixture used forinstrument calibration.
2.2.6 Limit of detection: The limit of detection for the explosivesnitroglycerine, 2,4,6 trinitrotoluene, RDX and tetryl (CE) isestimated at 1 µg per gram of flesh.
2.3 Results
2.3.1 No explosives were detected in any of the flesh samples either fromBeaufort's Dyke or the East Coast.
3. Conclusions
3.1 None of the flesh samples from fish in the Beaufort's Dyke areashowed the presence of the explosives nitroglycerine, 2,4,6trinitrotoluene, RDX or tetryl.
3CBDE/CES/FEL/CR9622 UNCLASSIFIED

UNCLASSIFIED
3.2 Further research and investment in equipment would be necessaryto develop a method suitable for liver analysis.
4CBDE/CES/FEL/CR9622 UNCLASSIFIED
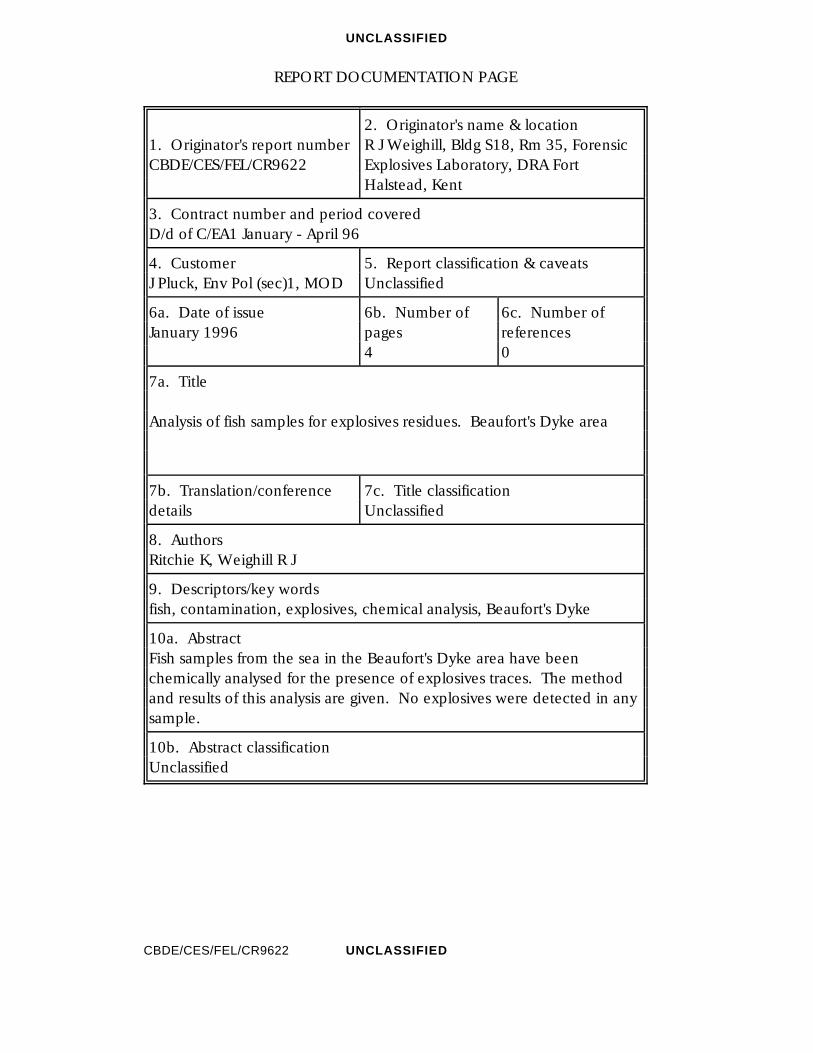
UNCLASSIFIED
REPORT DOCUMENTATION PAGE
1. Originator's report numberCBDE/CES/FEL/CR9622
2. Originator's name & locationR J Weighill, Bldg S18, Rm 35, ForensicExplosives Laboratory, DRA FortHalstead, Kent
3. Contract number and period coveredD/d of C/EA1 January - April 96
4. CustomerJ Pluck, Env Pol (sec)1, MOD
5. Report classification & caveatsUnclassified
6a. Date of issueJanuary 1996
6b. Number ofpages4
6c. Number ofreferences0
7a. Title
Analysis of fish samples for explosives residues. Beaufort's Dyke area
7b. Translation/conferencedetails
7c. Title classificationUnclassified
8. AuthorsRitchie K, Weighill R J
9. Descriptors/key wordsfish, contamination, explosives, chemical analysis, Beaufort's Dyke
10a. AbstractFish samples from the sea in the Beaufort's Dyke area have beenchemically analysed for the presence of explosives traces. The methodand results of this analysis are given. No explosives were detected in anysample.
10b. Abstract classificationUnclassified
CBDE/CES/FEL/CR9622 UNCLASSIFIED
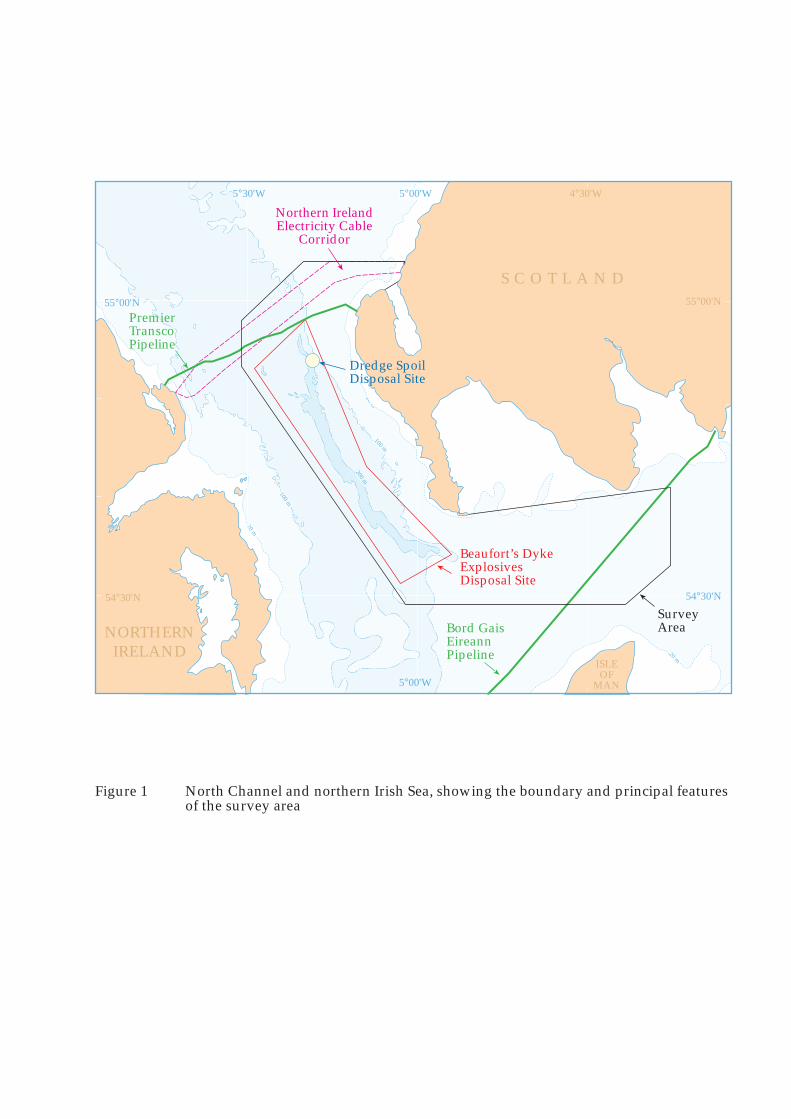
20 m
20 m
20 m
200 m
100 m
100 m
200 m
Northern IrelandElectricity Cable
Corridor
PremierTranscoPipeline
54°30'N
55°00'N
S C O T L A N D
4°30'W
ISLEOF
MAN
54°30'N
NORTHERNIRELAND
5°00'W
Figure 1 North Channel and northern Irish Sea, showing the boundary and principal featuresof the survey area
Bord GaisEireannPipeline
5°00'W
Beaufort’s DykeExplosivesDisposal Site
SurveyArea
55°00'N
5°30'W
Dredge SpoilDisposal Site
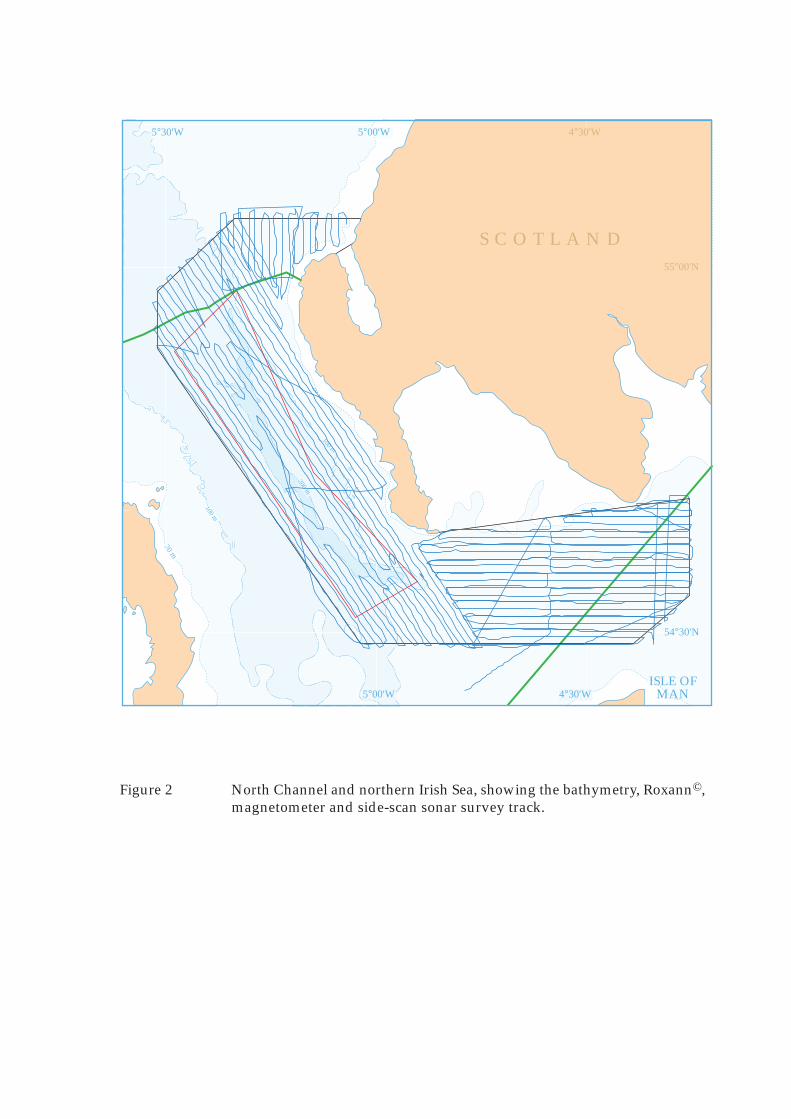
200 m
100 m
100 m
200 m
20 m
20 m
S C O T L A N D
4°30'W
ISLE OFMAN
54°30'N
5°00'W
Figure 2 North Channel and northern Irish Sea, showing the bathymetry, Roxann©,magnetometer and side-scan sonar survey track.
5°00'W
55°00'N
5°30'W
4°30'W
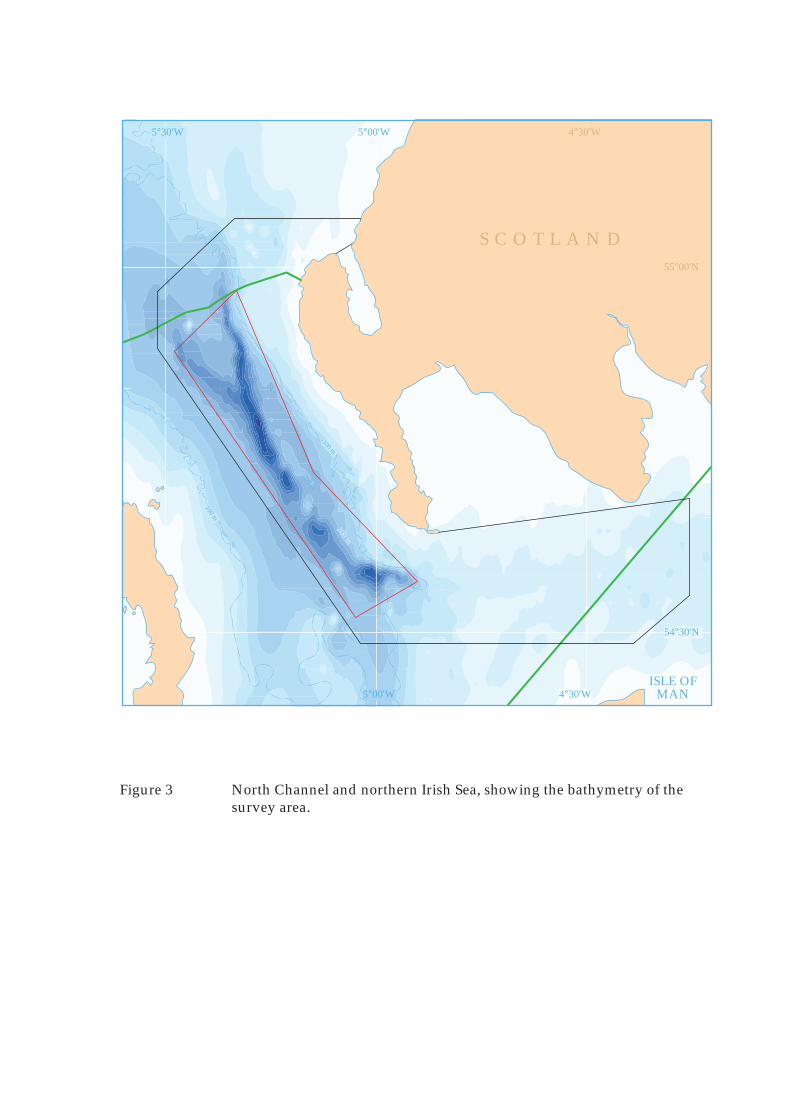
200 m
100 m
100 m
200 m
S C O T L A N D
4°30'W
ISLE OFMAN
54°30'N
5°00'W
Figure 3 North Channel and northern Irish Sea, showing the bathymetry of thesurvey area.
5°00'W
55°00'N
5°30'W
4°30'W
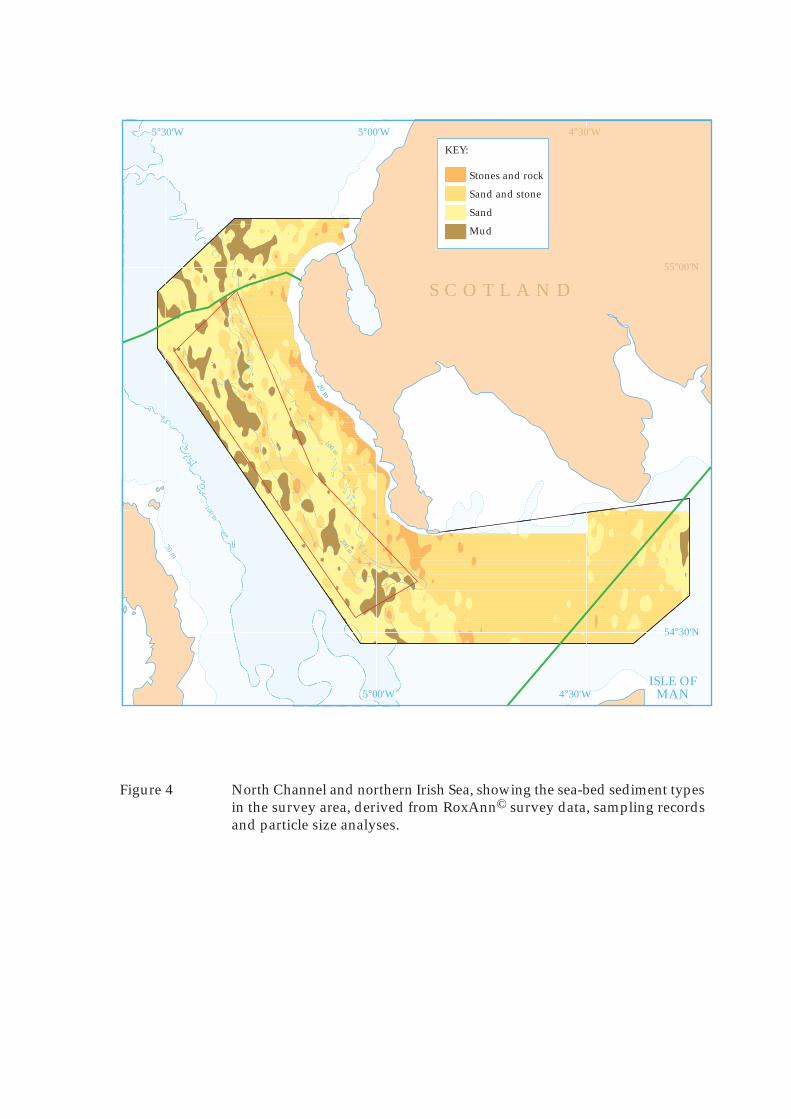
200 m
100 m
100 m
200 m20 m
20 m
100 m
100 m
S C O T L A N D
4°30'W
ISLE OFMAN
54°30'N
5°00'W
Figure 4 North Channel and northern Irish Sea, showing the sea-bed sediment typesin the survey area, derived from RoxAnn© survey data, sampling recordsand particle size analyses.
5°00'W
55°00'N
5°30'W
4°30'W
Stones and rock
Sand and stone
Sand
Mud
KEY:

200 m
100 m
200 m20 m
20 m
100 m
100 m
Figure 5 North Channel and northern Irish Sea, showing the grid of sea-bed sedimentsampling stations and the locations of collection of sea-bed sediment samples.
S C O T L A N D
4°30'W
ISLE OFMAN
54°30'N
5°00'W
5°00'W
55°00'N
5°30'W
4°30'W
1995 survey*
1996 survey
No samples (hard ground)
KEY:
B
NS
* replicate subsamples collected forexplosives and propellant residue analyses
B
B
NS
NS
NS
NS
BB B
B B
B
BBBB
B B B
BBBB
B B B
BBBB
B B B
B
B B
B B B
B
B B
BBB
B B B
BB
B B B
B
BBBB
B
B
BB
BB
BB
B B B
B
B
B
B
B B
B
B
B
B
B
B
B
B
B
B
B
B
B
B
B
B
B
B
B
B
B
B B
B
B
B
B
B
B
B
B
B
B
B
B
NSNS
NSNS
NS
NS
NSNS
NS NS NS NS NS
NS
NS NS
NS
NS
NS
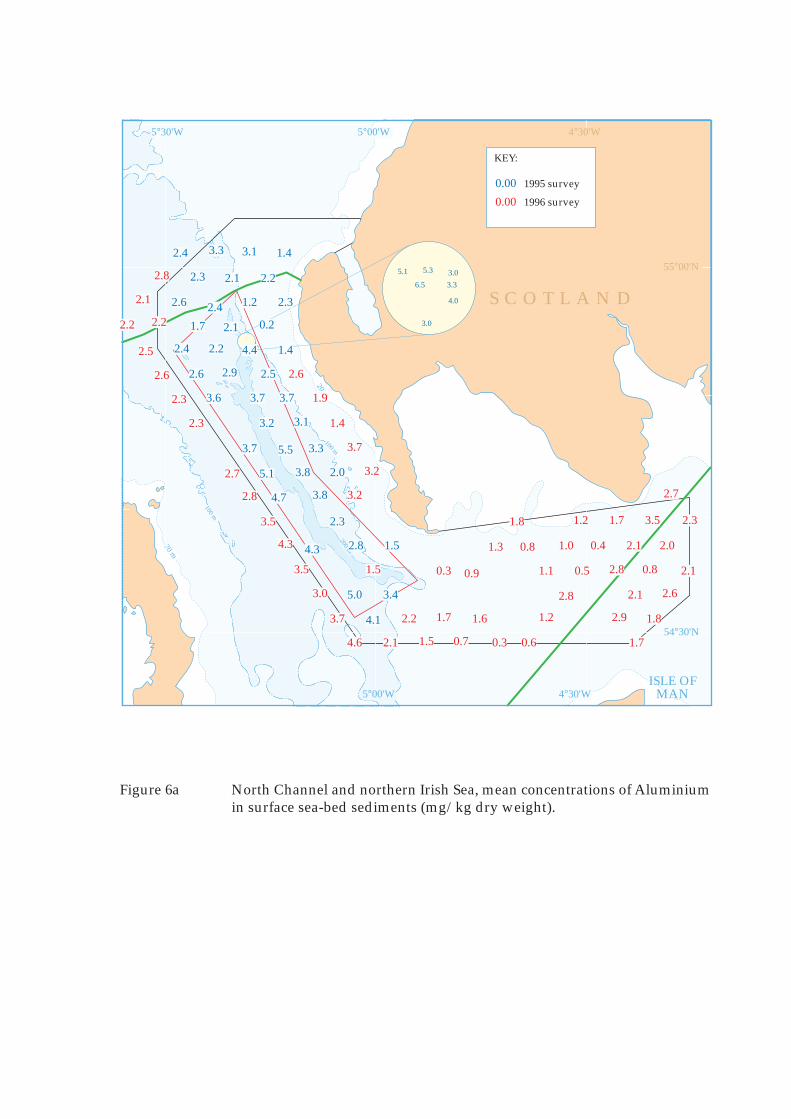
200 m
100 m
200 m20 m
20 m
100 m
100 m
0.00
0.00
Figure 6a North Channel and northern Irish Sea, mean concentrations of Aluminiumin surface sea-bed sediments (mg/kg dry weight).
S C O T L A N D
4°30'W
ISLE OFMAN
54°30'N
5°00'W
5°00'W
55°00'N
5°30'W
4°30'W
1995 survey
1996 survey
KEY:
2.7
2.33.51.71.2
1.0
1.1
0.81.3
0.90.3
2.23.7
4.6 2.1 1.5
1.7
0.7
1.6
1.8
0.3 0.6
1.2
2.8
0.5
0.4
2.8
2.1
0.8
2.0
2.1
2.6
1.8
2.1
2.9
1.7
1.5
3.2
3.2
3.7
1.4
1.9
2.1
2.2 2.2
2.8
2.5
2.6
2.3
2.3
2.7
2.8
3.5
4.3
3.5
3.0
2.6
1.43.13.32.4
2.3 2.1 2.2
2.31.22.42.6
1.7 2.1 0.2
1.44.42.22.4
2.6 2.9 2.5
4.1
5.0 3.4
4.3 2.8 1.5
2.3
4.7 3.8
2.03.85.1
3.7 5.5 3.3
3.13.2
3.6 3.7 3.7
3.0
4.0
3.36.5
5.1 5.3 3.0

200 m
100 m
200 m20 m
20 m
100 m
100 m
0.00
0.00
Figure 6b North Channel and northern Irish Sea, mean concentrations of Arsenic insurface sea-bed sediments (mg/kg dry weight).
S C O T L A N D
4°30'W
ISLE OFMAN
54°30'N
5°00'W
5°00'W
55°00'N
5°30'W
4°30'W
1995 survey
1996 survey
KEY:
5.4
5.44.07.83.5
8.3
5.1
5.18.7
5.24.4
3.87.3
6.6 4.5 5.0
4.3
6.1
6.9
4.0
4.7 4.5
4.6
5.5
5.7
6.0
5.8
6.4
7.8
5.4
6.8
5.3
14.6
7.1
7.9
3.6
5.0
5.4
7.0
4.8
9.8
7.7
7.5
8.4 10.4
8.6
13.4
8.2
7.5
8.0
11.4
6.8
11.4
8.0
7.4
8.5
7.6
10.24.74.40.1
14.4 5.6 5.9
9.76.013.412.5
11.4 6.9 11.4
5.87.210.37.8
9.4 6.9 9.6
8.1
9.5 8.7
11.0 7.6 7.3
10.9
23.3 17.5
12.728.016.2
19.6 11.2 12.4
14.619.3
15.7 15.2 14.5
12.3
14.9
15.420.0
12.7 14.0 16.1

200 m
100 m
200 m20 m
20 m
100 m
100 m
0.00
0.00
Figure 6c North Channel and northern Irish Sea, mean concentrations of Cadmiumin surface sea-bed sediments (mg/kg dry weight).
S C O T L A N D
4°30'W
ISLE OFMAN
54°30'N
5°00'W
5°00'W
55°00'N
5°30'W
4°30'W
1995 survey
1996 survey
KEY:
0.0320.0230.0650.052
0.048 0.074 0.034
0.0200.0390.0460.049
0.089 0.056 0.102
0.0990.0720.0520.030
0.056 0.045 0.020
0.039
0.053 0.036
0.045 0.025 0.045
0.034
0.048 0.050
0.0480.0360.050
0.081 0.062 0.039
0.0420.062
0.056 0.050 0.048
0.040
0.0570.1250.1100.041
0.051
0.061
0.0740.045
0.0890.040
0.0040.056
0.076 0.004 0.020
0.050
0.079
0.048
0.004
0.004 0.004
0.062
0.078
0.086
0.049
0.031
0.004
0.070
0.085
0.060
0.004
0.004
0.004
0.053
0.005
0.004
0.004
0.108
0.026
0.098
0.087
0.020
0.025 0.026
0.017
0.022
0.091
0.018
0.097
0.016
0.010
0.102
0.113
0.118
0.100
0.014
0.048
0.067
0.0310.064
0.053 0.067 0.036

200 m
100 m
200 m20 m
20 m
100 m
100 m
0.00
0.00
Figure 6d North Channel and northern Irish Sea, mean concentrations of Chromiumin surface sea-bed sediments (mg/kg dry weight).
S C O T L A N D
4°30'W
ISLE OFMAN
54°30'N
5°00'W
5°00'W
55°00'N
5°30'W
4°30'W
1995 survey
1996 survey
KEY:
34.2
25.540.125.625.3
24.1
14.6
26.427.3
29.518.7
13.561.2
56.0 33.9 15.9
35.3
4.8
14.1
17.9
7.1 8.4
15.0
29.9
6.6
7.2
25.8
16.0
20.4
36.1
35.0
28.3
29.3
28.5
41.0
19.6
14.4
43.8
52.2
49.3
28.1
33.6
48.1
27.3 49.3
38.7
48.3
47.2
33.9
22.0
25.6
31.0
54.5
49.0
47.5
40.8
38.2
28.831.138.431.7
33.0 42.0 27.6
12.927.128.839.3
36.6 28.6 20.0
38.557.034.129.5
35.7 39.6 25.0
47.8
46.4 24.5
39.0 22.8 24.1
29.2
53.1 42.1
21.152.354.2
35.2 55.8 48.7
41.635.7
43.8 35.1 39.1
29.3
48.8
46.760.7
43.0 51.2 34.5

200 m
100 m
200 m20 m
20 m
100 m
100 m
0.00
0.00
Figure 6e North Channel and northern Irish Sea, mean concentrations of Copper insurface sea-bed sediments (mg/kg dry weight).
S C O T L A N D
4°30'W
ISLE OFMAN
54°30'N
5°00'W
5°00'W
55°00'N
5°30'W
4°30'W
1995 survey
1996 survey
KEY:
6.5
5.210.44.55.7
4.5
6.5
8.36.7
10.45.3
2.46.9
12.9 4.1 3.6
4.3
3.0
3.9
3.2
3.5 3.2
6.0
7.9
4.9
4.5
5.8
5.0
5.4
8.8
7.0
7.4
6.0
6.1
6.9
4.5
3.7
6.6
8.3
7.9
5.8
6.3
6.1
4.6 5.0
5.0
6.8
5.8
6.0
5.6
6.1
8.1
6.0
7.4
7.2
7.6
6.0
6.64.67.45.7
8.2 5.3 4.0
4.46.66.35.9
7.8 6.8 7.0
7.211.37.74.7
6.3 10.0 4.7
7.6
9.8 5.8
8.5 4.8 6.3
5.0
9.3 7.4
3.38.48.0
7.5 11.5 7.1
6.011.2
6.5 7.6 9.7
6.1
8.2
5.314.6
12.5 12.4 5.0

200 m
100 m
200 m20 m
20 m
100 m
100 m
0.00
0.00
Figure 6f North Channel and northern Irish Sea, mean concentrations of Lead insurface sea-bed sediments (mg/kg dry weight).
S C O T L A N D
4°30'W
ISLE OFMAN
54°30'N
5°00'W
5°00'W
55°00'N
5°30'W
4°30'W
1995 survey
1996 survey
KEY:
25.6
21.429.917.07.9
10.8
6.6
14.519.6
31.717.6
13.825.2
32.7 15.7 14.5
18.6
14.1
16.9
17.4
14.9 18.6
18.1
26.7
10.5
7.5
23.6
21.7
19.3
24.1
25.7
23.7
21.8
18.0
22.4
16.9
18.1
23.9
31.6
16.8
19.8
24.4
21.4
21.4 16.5
22.9
20.1
19.1
25.5
26.3
26.3
23.0
27.3
24.8
22.8
36.3
22.6
20.117.418.622.2
23.6 21.6 15.3
15.121.626.324.5
31.4 21.2 11.9
21.828.924.218.1
24.2 28.8 13.1
23.5
27.8 22.4
28.1 18.6 19.6
18.6
28.5 24.7
12.029.727.0
23.4 28.3 20.1
17.429.6
20.8 27.7 21.2
15.4
18.3
10.827.8
29.2 29.6 14.2

200 m
100 m
200 m20 m
20 m
100 m
100 m
0.00
0.00
Figure 6g North Channel and northern Irish Sea, mean concentrations of Mercury insurface sea-bed sediments (mg/kg dry weight).
S C O T L A N D
4°30'W
ISLE OFMAN
54°30'N
5°00'W
5°00'W
55°00'N
5°30'W
4°30'W
1995 survey
1996 survey
KEY:
0.050
0.0500.0900.0200.080
0.070
0.060
0.0900.090
0.0300.010
0.0100.010
0.050 0.010 0.010
0.010
0.010
0.010
0.010
0.010 0.010
0.010
0.010
0.010
0.050
0.010
0.010
0.030
0.080
0.010
0.010
0.010
0.010
0.050
0.050
0.020
0.030
0.090
0.090
0.030
0.060
0.090
0.060 0.050
0.010
0.160
0.080
0.080
0.090
0.060
0.030
0.010
0.010
0.030
0.030
0.062
0.2120.1290.0310.093
0.093 0.154 0.066
0.0280.1210.0590.044
0.050 0.093 0.047
0.0960.0910.0860.081
0.076 0.157 0.093
0.093
0.121 0.045
0.066 0.031 0.091
0.105
0.139 0.119
0.0440.1600.192
0.315 0.098 0.176
0.0580.089
0.099 0.121 0.051
0.059
0.076
0.0640.107
0.179 0.111 0.094

100 m
200 m20 m
20 m
100 m
100 m
0.00
0.00
Figure 6h North Channel and northern Irish Sea, mean concentrations of Nickel insurface sea-bed sediments (mg/kg dry weight).
S C O T L A N D
4°30'W
ISLE OFMAN
54°30'N
5°00'W
5°00'W
55°00'N
5°30'W
4°30'W
1995 survey
1996 survey
KEY:
7.7<0.33.8<0.3
1.5 1.9 <0.3
<0.35.44.56.2
<0.3 30.2 11.5
12.58.16.4<0.3
3.6 12.5 8.2
10.8
8.9 1.2
3.5 1.0 10.2
<0.3
11.0 6.5
<0.311.210.4
6.6 16.6 6.6
8.416.4
9.0 4.6 3.8
8.0
9.718.022.65.9
20.0
9.7
12.918.8
16.95.8
<0.310.0
19.9 0.8 <0.3
1.6
14.0
9.7
<0.3
<0.3 3.0
8.5
9.3
10.3
7.5
16.2
6.5
18.2
18.5
6.4
9.9
4.2
20.8
19.3
<0.3
<0.3
4.5
11.5
11.7
15.5
13.4
9.7
1.3 6.4
7.7
11.7
1.3
5.9
2.0
6.2
3.1
3.1
5.0
6.5
9.3
11.9
2.5
13.0
15.324.8
12.1 15.8 4.4

200 m
100 m
200 m20 m
20 m
100 m
100 m
0.00
0.00
Figure 6i North Channel and northern Irish Sea, mean concentrations of Zinc insurface sea-bed sediments (mg/kg dry weight).
S C O T L A N D
4°30'W
ISLE OFMAN
54°30'N
5°00'W
5°00'W
55°00'N
5°30'W
4°30'W
1995 survey
1996 survey
KEY:
46.3
35.961.933.634.2
28.7
40.9
51.947.0
72.537.8
16.555.6
86.0 28.6 31.6
24.4
17.2
19.7
24.0
20.5 28.6
41.5
53.3
36.7
21.8
32.8
32.6
35.7
55.3
50.0
52.8
38.8
43.4
42.6
28.5
24.0
47.1
60.4
54.9
46.5
44.5
46.3
36.9 50.0
48.5
53.8
48.4
44.6
39.0
48.1
48.2
57.3
67.1
60.9
67.3
42.7
47.137.050.954.2
65.3 62.5 32.2
25.852.673.761.0
88.0 72.2 36.3
57.790.567.744.0
62.5 75.0 27.3
57.0
71.2 46.9
70.5 42.1 45.0
47.6
87.0 73.0
20.674.566.3
57.4 80.7 57.4
48.183.0
54.6 64.1 50.5
47.8
62.8
38.5118.3
84.4 86.8 48.1
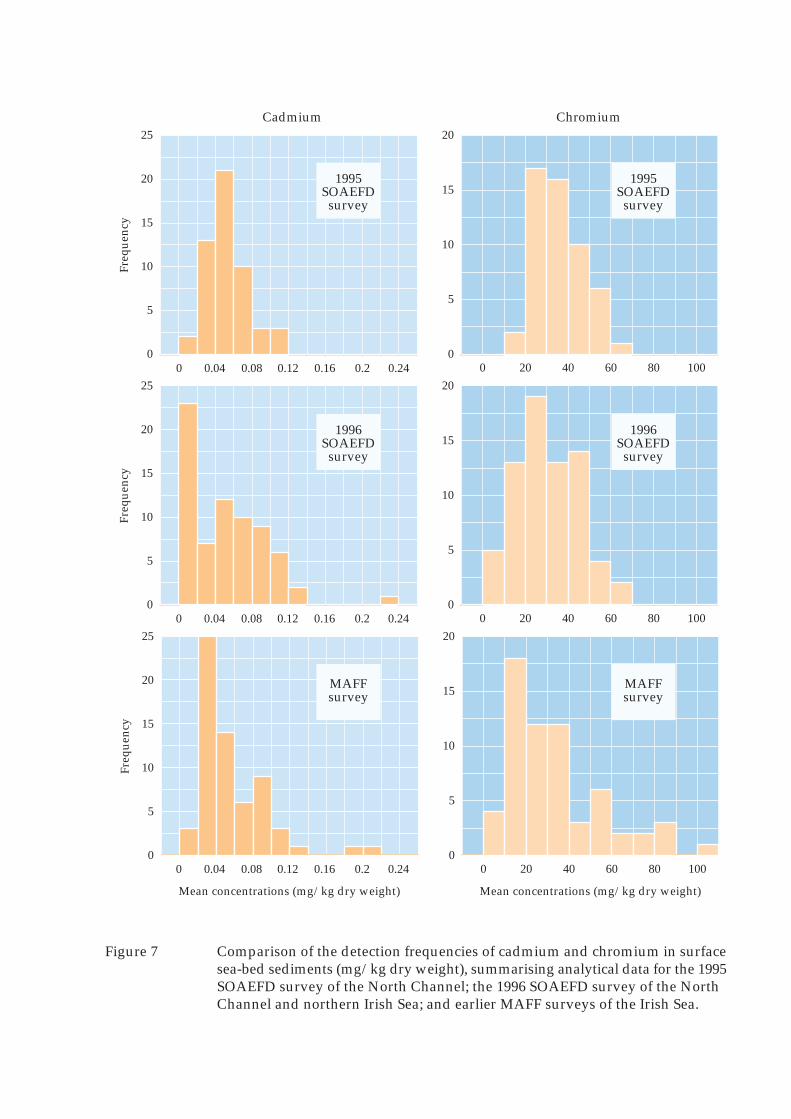
Cadmium Chromium
Figure 7 Comparison of the detection frequencies of cadmium and chromium in surfacesea-bed sediments (mg/kg dry weight), summarising analytical data for the 1995SOAEFD survey of the North Channel; the 1996 SOAEFD survey of the NorthChannel and northern Irish Sea; and earlier MAFF surveys of the Irish Sea.
1995SOAEFD
survey
1996SOAEFD
survey
MAFFsurvey
0 20 40 60 80 1000
5
10
15
20
0 20 40 60 80 1000
5
10
15
20
Mean concentrations (mg/kg dry weight)
0 20 40 60 80 1000
5
10
15
20
0 0.04 0.08 0.12 0.16 0.2 0.24
0 0.04 0.08 0.12 0.16 0.2 0.24
MAFFsurvey
1996SOAEFD
survey
1995SOAEFD
survey
0
5
10
15
20
25
0
5
10
15
20
25
0
5
10
15
20
25
Mean concentrations (mg/kg dry weight)
Freq
uenc
yFr
eque
ncy
Freq
uenc
y
MAFFsurvey
1996SOAEFD
survey
1995SOAEFD
survey
0 0.04 0.08 0.12 0.16 0.2 0.24
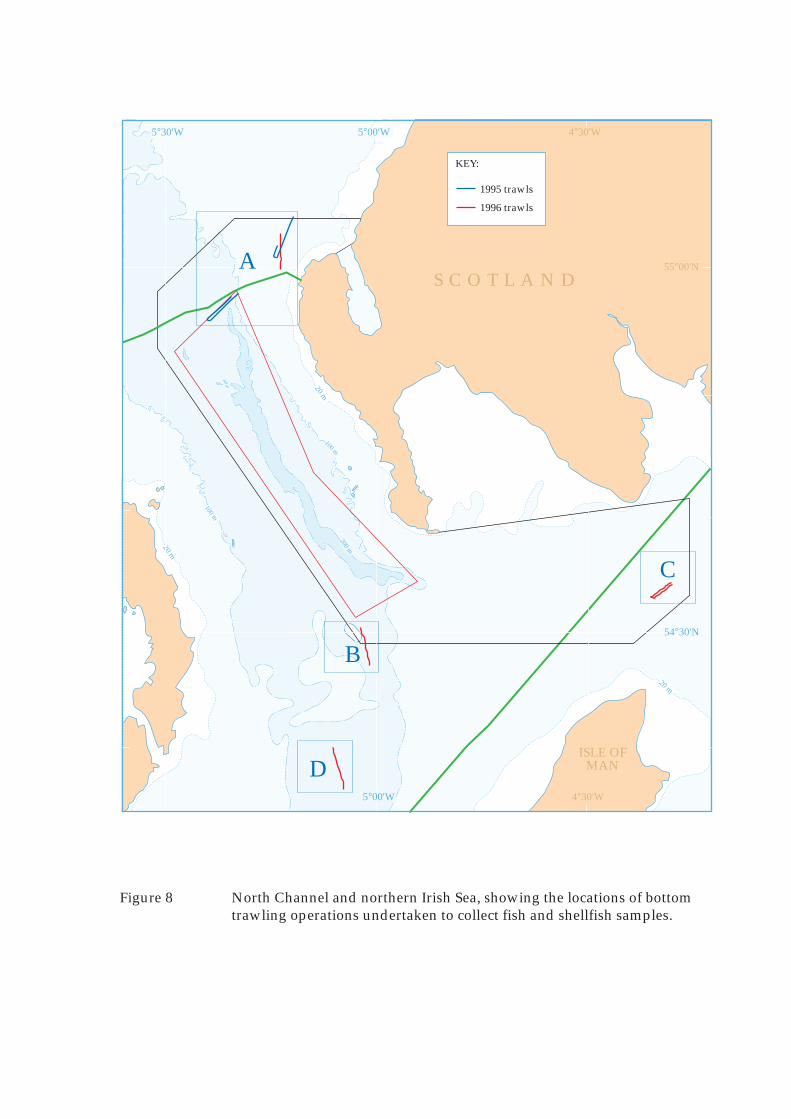
200 m
100 m
200 m
20 m
20 m
20 m
100 m
100 m
S C O T L A N D
4°30'W
ISLE OFMAN
54°30'N
5°00'W
Figure 8 North Channel and northern Irish Sea, showing the locations of bottomtrawling operations undertaken to collect fish and shellfish samples.
5°00'W
55°00'N
5°30'W
4°30'W
1995 trawls
1996 trawls
KEY:
A
B
D
C

Figure 9a Side-scan sonar image of the sea bed (approximately 100 m by 100 m)obtained at 54°51.8'N, 005°13.9'W, showing a clear sea-bed surface.

Figure 9b Side-scan sonar image of of the sea bed (approximately 100 m by 100 m)obtained at 54°57.5'N, 005°14.5'W showing a few regular-shaped objects(targets) on the surface of the sea bed. Three targets are ringed. Target 1is approximately 4 m long and 0.25 m high; targets 2 and 3 areapproximately 1.5 m long and 0.4 m high.
123
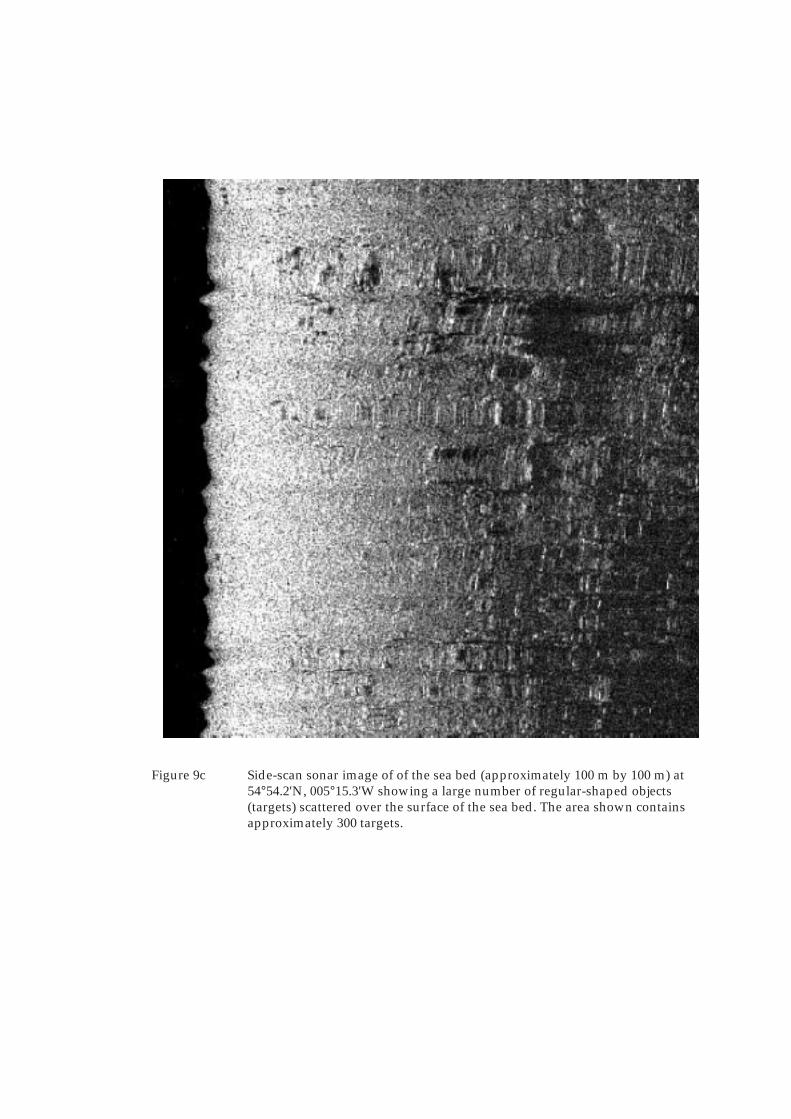
Figure 9c Side-scan sonar image of of the sea bed (approximately 100 m by 100 m) at54°54.2'N, 005°15.3'W showing a large number of regular-shaped objects(targets) scattered over the surface of the sea bed. The area shown containsapproximately 300 targets.

200 m
100 m
200 m20 m
20 m
100 m
100 m
4°30'W
ISLE OFMAN
54°30'N
5°00'W
Figure 10 North Channel and northern Irish Sea, showing the distibution and relativedensities of regular-shaped targets detected using side-scan sonar.
5°00'W
55°00'N
5°30'W
4°30'W
S C O T L A N D
High Densities
KEY:
Medium Densities
Low Densities
‘Background’ Level
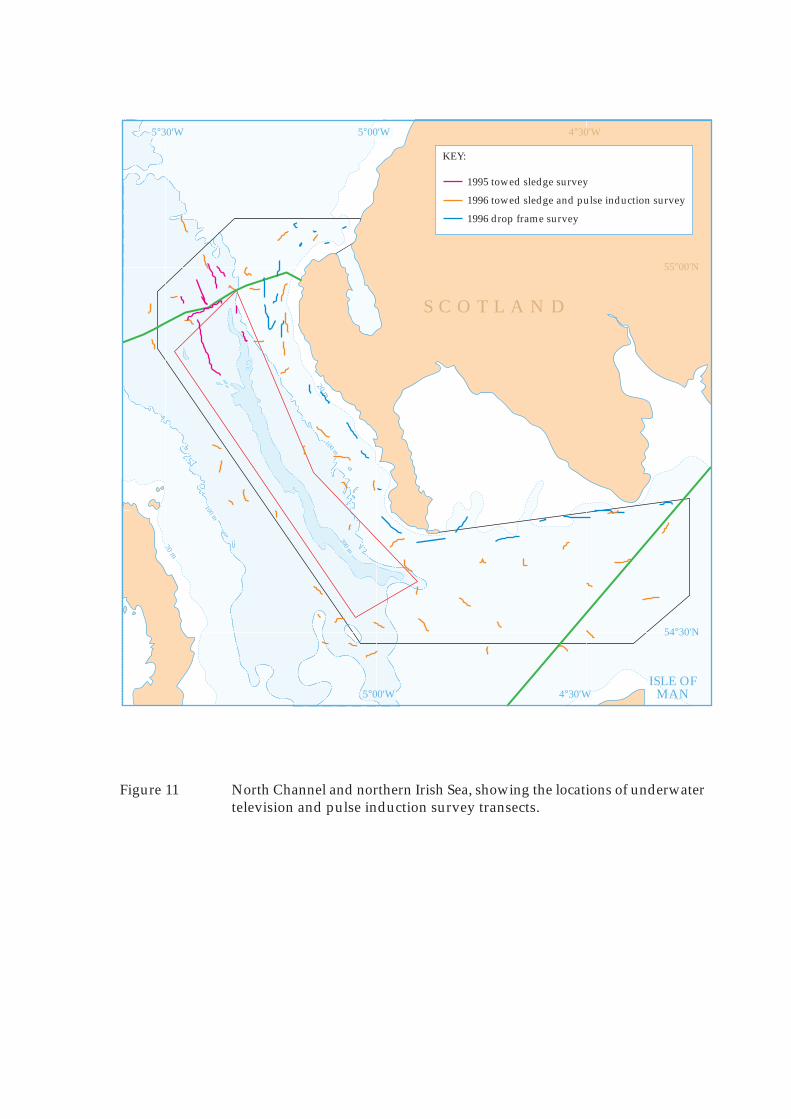
200 m
100 m
200 m20 m
20 m
100 m
100 m
S C O T L A N D
4°30'W
ISLE OFMAN
54°30'N
5°00'W
Figure 11 North Channel and northern Irish Sea, showing the locations of underwatertelevision and pulse induction survey transects.
5°00'W
55°00'N
5°30'W
4°30'W
1995 towed sledge survey
1996 towed sledge and pulse induction survey
1996 drop frame survey
KEY:

200 m
100 m
200 m20 m
20 m
100 m
100 m
1.00 - 10.00
0.01 - 0.10
10.00 - 100.00
0.00 - 0.01
S C O T L A N D
4°30'W
ISLE OFMAN
54°30'N
5°00'W
Figure 12 North Channel and northern Irish Sea, showing the combined mean densitiesof larger munitions, munitions-related materials and unidentified man-madedebris (observed targets with a maximum dimension of greater than 250 mm),for each underwater television survey transect (number of targets/one metreswathe width/two kilometre survey track).
5°00'W
55°00'N
5°30'W
4°30'W
KEY:
0.10 - 1.00
Number of targets

200 m
100 m
100 m200 m
100 m
100 m200 m
200 m
20 m
20 m
20 m
20 m
100 m100 m
2.00 - 5.00
0.20 - 0.50
5.00 - 20.00
0.00 - 0.20
KEY:
0.50 - 2.00
Number of targets
4°30'W
ISLE OFMAN
54°30'N
5°00'W
Figure 14 North Channel and northern Irish Sea, showing the combined mean densitiesof larger munitions, munitions-related materials and unidentified man-madedebris (observed targets with a maximum dimension of greater than 250 mm),for each of the combined underwater television and pulse induction surveytransects (number of targets/one metre swathe width/two kilometre surveytrack).
5°00'W
55°00'N
5°30'W
4°30'W
4°30'W
ISLE OFMAN
54°30'N
5°00'W
5°00'W
55°00'N
5°30'W
4°30'W
Figure 13 North Channel and northern Irish Sea, showing the combined mean densitiesof larger metallic debris (targets with a maximum pulse induction detectionvalue of greater than 0.25 mV), for each pulse induction survey transect(number of targets/one metre swathe width/two kilometre survey track).
2.00 - 5.00
0.20 - 0.50
5.00 - 20.00
0.00 - 0.20
KEY:
0.50 - 2.00
Number of targets

200 m
100 m
100 m
200 m20 m
20 m
100 m
100 m
S C O T L A N D
4°30'W
ISLE OFMAN
54°30'N
5°00'W
Figure 15 North Channel and northern Irish Sea, showing the distribution and densitiesof larger munitions, munitions-related materials and unidentified man-madedebris, derived from combination of the side-scan sonar, underwatertelevision and pulse induction data (number of targets/square kilometre).
5°00'W
55°00'N
5°30'W
4°30'W
30,00010,0003,0001,0003001000
Number of targets/square kilometre
KEY:

20 m
20 m
20 m
200 m
100 m
100 m
200 m
Northern IrelandElectricity Cable
Corridor
PremierTranscoPipeline
54°30'N
55°00'N
S C O T L A N D
4°30'W
ISLEOF
MAN
54°30'N
NORTHERNIRELAND
5°00'W
Figure 1 North Channel and northern Irish Sea, showing the boundary and principal featuresof the survey area
Bord GaisEireannPipeline
5°00'W
Beaufort’s DykeExplosivesDisposal Site
SurveyArea
55°00'N
5°30'W
Dredge SpoilDisposal Site

200 m
100 m
100 m
200 m
20 m
20 m
S C O T L A N D
4°30'W
ISLE OFMAN
54°30'N
5°00'W
Figure 2 North Channel and northern Irish Sea, showing the bathymetry, Roxann©,magnetometer and side-scan sonar survey track.
5°00'W
55°00'N
5°30'W
4°30'W

200 m
100 m
100 m
200 m
S C O T L A N D
4°30'W
ISLE OFMAN
54°30'N
5°00'W
Figure 3 North Channel and northern Irish Sea, showing the bathymetry of thesurvey area.
5°00'W
55°00'N
5°30'W
4°30'W

200 m
100 m
100 m
200 m20 m
20 m
100 m
100 m
S C O T L A N D
4°30'W
ISLE OFMAN
54°30'N
5°00'W
Figure 4 North Channel and northern Irish Sea, showing the sea-bed sediment typesin the survey area, derived from RoxAnn© survey data, sampling recordsand particle size analyses.
5°00'W
55°00'N
5°30'W
4°30'W
Stones and rock
Sand and stone
Sand
Mud
KEY:
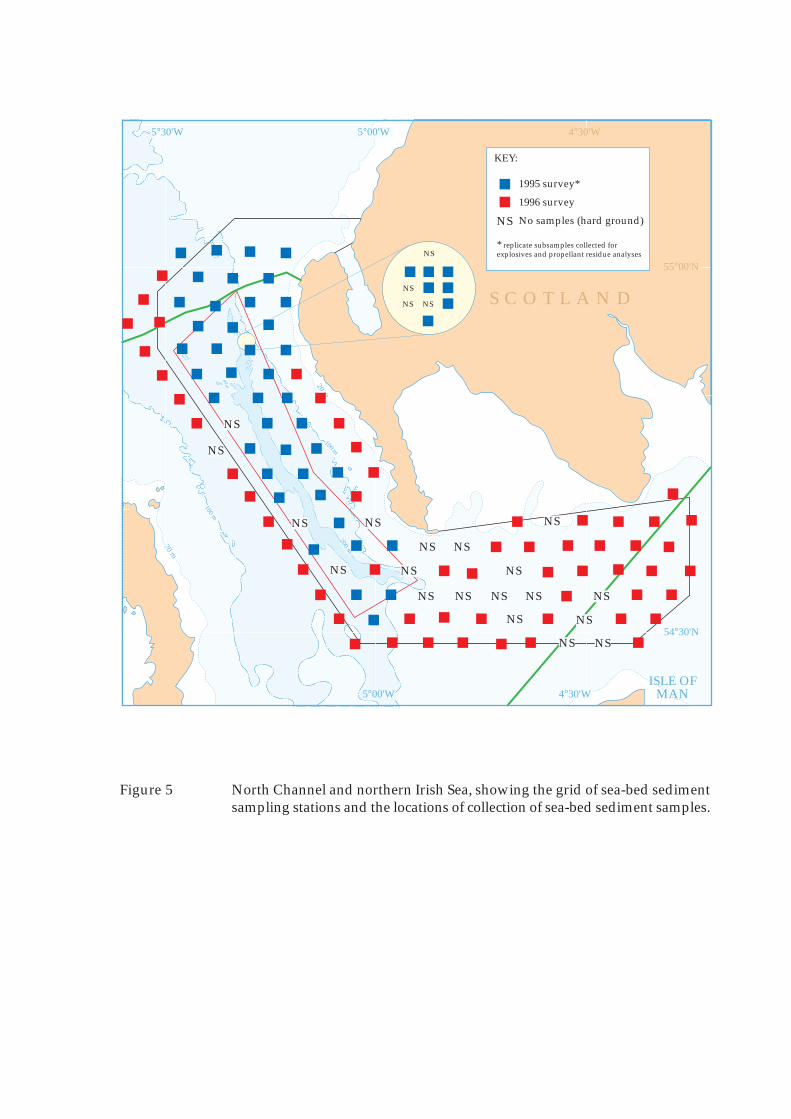
200 m
100 m
200 m20 m
20 m
100 m
100 m
Figure 5 North Channel and northern Irish Sea, showing the grid of sea-bed sedimentsampling stations and the locations of collection of sea-bed sediment samples.
S C O T L A N D
4°30'W
ISLE OFMAN
54°30'N
5°00'W
5°00'W
55°00'N
5°30'W
4°30'W
1995 survey*
1996 survey
No samples (hard ground)
KEY:
B
NS
* replicate subsamples collected forexplosives and propellant residue analyses
B
B
NS
NS
NS
NS
BB B
B B
B
BBBB
B B B
BBBB
B B B
BBBB
B B B
B
B B
B B B
B
B B
BBB
B B B
BB
B B B
B
BBBB
B
B
BB
BB
BB
B B B
B
B
B
B
B B
B
B
B
B
B
B
B
B
B
B
B
B
B
B
B
B
B
B
B
B
B
B B
B
B
B
B
B
B
B
B
B
B
B
B
NSNS
NSNS
NS
NS
NSNS
NS NS NS NS NS
NS
NS NS
NS
NS
NS

200 m
100 m
200 m20 m
20 m
100 m
100 m
0.00
0.00
Figure 6a North Channel and northern Irish Sea, mean concentrations of Aluminiumin surface sea-bed sediments (mg/kg dry weight).
S C O T L A N D
4°30'W
ISLE OFMAN
54°30'N
5°00'W
5°00'W
55°00'N
5°30'W
4°30'W
1995 survey
1996 survey
KEY:
2.7
2.33.51.71.2
1.0
1.1
0.81.3
0.90.3
2.23.7
4.6 2.1 1.5
1.7
0.7
1.6
1.8
0.3 0.6
1.2
2.8
0.5
0.4
2.8
2.1
0.8
2.0
2.1
2.6
1.8
2.1
2.9
1.7
1.5
3.2
3.2
3.7
1.4
1.9
2.1
2.2 2.2
2.8
2.5
2.6
2.3
2.3
2.7
2.8
3.5
4.3
3.5
3.0
2.6
1.43.13.32.4
2.3 2.1 2.2
2.31.22.42.6
1.7 2.1 0.2
1.44.42.22.4
2.6 2.9 2.5
4.1
5.0 3.4
4.3 2.8 1.5
2.3
4.7 3.8
2.03.85.1
3.7 5.5 3.3
3.13.2
3.6 3.7 3.7
3.0
4.0
3.36.5
5.1 5.3 3.0

200 m
100 m
200 m20 m
20 m
100 m
100 m
0.00
0.00
Figure 6b North Channel and northern Irish Sea, mean concentrations of Arsenic insurface sea-bed sediments (mg/kg dry weight).
S C O T L A N D
4°30'W
ISLE OFMAN
54°30'N
5°00'W
5°00'W
55°00'N
5°30'W
4°30'W
1995 survey
1996 survey
KEY:
5.4
5.44.07.83.5
8.3
5.1
5.18.7
5.24.4
3.87.3
6.6 4.5 5.0
4.3
6.1
6.9
4.0
4.7 4.5
4.6
5.5
5.7
6.0
5.8
6.4
7.8
5.4
6.8
5.3
14.6
7.1
7.9
3.6
5.0
5.4
7.0
4.8
9.8
7.7
7.5
8.4 10.4
8.6
13.4
8.2
7.5
8.0
11.4
6.8
11.4
8.0
7.4
8.5
7.6
10.24.74.40.1
14.4 5.6 5.9
9.76.013.412.5
11.4 6.9 11.4
5.87.210.37.8
9.4 6.9 9.6
8.1
9.5 8.7
11.0 7.6 7.3
10.9
23.3 17.5
12.728.016.2
19.6 11.2 12.4
14.619.3
15.7 15.2 14.5
12.3
14.9
15.420.0
12.7 14.0 16.1

200 m
100 m
200 m20 m
20 m
100 m
100 m
0.00
0.00
Figure 6c North Channel and northern Irish Sea, mean concentrations of Cadmiumin surface sea-bed sediments (mg/kg dry weight).
S C O T L A N D
4°30'W
ISLE OFMAN
54°30'N
5°00'W
5°00'W
55°00'N
5°30'W
4°30'W
1995 survey
1996 survey
KEY:
0.0320.0230.0650.052
0.048 0.074 0.034
0.0200.0390.0460.049
0.089 0.056 0.102
0.0990.0720.0520.030
0.056 0.045 0.020
0.039
0.053 0.036
0.045 0.025 0.045
0.034
0.048 0.050
0.0480.0360.050
0.081 0.062 0.039
0.0420.062
0.056 0.050 0.048
0.040
0.0570.1250.1100.041
0.051
0.061
0.0740.045
0.0890.040
0.0040.056
0.076 0.004 0.020
0.050
0.079
0.048
0.004
0.004 0.004
0.062
0.078
0.086
0.049
0.031
0.004
0.070
0.085
0.060
0.004
0.004
0.004
0.053
0.005
0.004
0.004
0.108
0.026
0.098
0.087
0.020
0.025 0.026
0.017
0.022
0.091
0.018
0.097
0.016
0.010
0.102
0.113
0.118
0.100
0.014
0.048
0.067
0.0310.064
0.053 0.067 0.036

200 m
100 m
200 m20 m
20 m
100 m
100 m
0.00
0.00
Figure 6d North Channel and northern Irish Sea, mean concentrations of Chromiumin surface sea-bed sediments (mg/kg dry weight).
S C O T L A N D
4°30'W
ISLE OFMAN
54°30'N
5°00'W
5°00'W
55°00'N
5°30'W
4°30'W
1995 survey
1996 survey
KEY:
34.2
25.540.125.625.3
24.1
14.6
26.427.3
29.518.7
13.561.2
56.0 33.9 15.9
35.3
4.8
14.1
17.9
7.1 8.4
15.0
29.9
6.6
7.2
25.8
16.0
20.4
36.1
35.0
28.3
29.3
28.5
41.0
19.6
14.4
43.8
52.2
49.3
28.1
33.6
48.1
27.3 49.3
38.7
48.3
47.2
33.9
22.0
25.6
31.0
54.5
49.0
47.5
40.8
38.2
28.831.138.431.7
33.0 42.0 27.6
12.927.128.839.3
36.6 28.6 20.0
38.557.034.129.5
35.7 39.6 25.0
47.8
46.4 24.5
39.0 22.8 24.1
29.2
53.1 42.1
21.152.354.2
35.2 55.8 48.7
41.635.7
43.8 35.1 39.1
29.3
48.8
46.760.7
43.0 51.2 34.5

200 m
100 m
200 m20 m
20 m
100 m
100 m
0.00
0.00
Figure 6e North Channel and northern Irish Sea, mean concentrations of Copper insurface sea-bed sediments (mg/kg dry weight).
S C O T L A N D
4°30'W
ISLE OFMAN
54°30'N
5°00'W
5°00'W
55°00'N
5°30'W
4°30'W
1995 survey
1996 survey
KEY:
6.5
5.210.44.55.7
4.5
6.5
8.36.7
10.45.3
2.46.9
12.9 4.1 3.6
4.3
3.0
3.9
3.2
3.5 3.2
6.0
7.9
4.9
4.5
5.8
5.0
5.4
8.8
7.0
7.4
6.0
6.1
6.9
4.5
3.7
6.6
8.3
7.9
5.8
6.3
6.1
4.6 5.0
5.0
6.8
5.8
6.0
5.6
6.1
8.1
6.0
7.4
7.2
7.6
6.0
6.64.67.45.7
8.2 5.3 4.0
4.46.66.35.9
7.8 6.8 7.0
7.211.37.74.7
6.3 10.0 4.7
7.6
9.8 5.8
8.5 4.8 6.3
5.0
9.3 7.4
3.38.48.0
7.5 11.5 7.1
6.011.2
6.5 7.6 9.7
6.1
8.2
5.314.6
12.5 12.4 5.0

200 m
100 m
200 m20 m
20 m
100 m
100 m
0.00
0.00
Figure 6f North Channel and northern Irish Sea, mean concentrations of Lead insurface sea-bed sediments (mg/kg dry weight).
S C O T L A N D
4°30'W
ISLE OFMAN
54°30'N
5°00'W
5°00'W
55°00'N
5°30'W
4°30'W
1995 survey
1996 survey
KEY:
25.6
21.429.917.07.9
10.8
6.6
14.519.6
31.717.6
13.825.2
32.7 15.7 14.5
18.6
14.1
16.9
17.4
14.9 18.6
18.1
26.7
10.5
7.5
23.6
21.7
19.3
24.1
25.7
23.7
21.8
18.0
22.4
16.9
18.1
23.9
31.6
16.8
19.8
24.4
21.4
21.4 16.5
22.9
20.1
19.1
25.5
26.3
26.3
23.0
27.3
24.8
22.8
36.3
22.6
20.117.418.622.2
23.6 21.6 15.3
15.121.626.324.5
31.4 21.2 11.9
21.828.924.218.1
24.2 28.8 13.1
23.5
27.8 22.4
28.1 18.6 19.6
18.6
28.5 24.7
12.029.727.0
23.4 28.3 20.1
17.429.6
20.8 27.7 21.2
15.4
18.3
10.827.8
29.2 29.6 14.2

200 m
100 m
200 m20 m
20 m
100 m
100 m
0.00
0.00
Figure 6g North Channel and northern Irish Sea, mean concentrations of Mercury insurface sea-bed sediments (mg/kg dry weight).
S C O T L A N D
4°30'W
ISLE OFMAN
54°30'N
5°00'W
5°00'W
55°00'N
5°30'W
4°30'W
1995 survey
1996 survey
KEY:
0.050
0.0500.0900.0200.080
0.070
0.060
0.0900.090
0.0300.010
0.0100.010
0.050 0.010 0.010
0.010
0.010
0.010
0.010
0.010 0.010
0.010
0.010
0.010
0.050
0.010
0.010
0.030
0.080
0.010
0.010
0.010
0.010
0.050
0.050
0.020
0.030
0.090
0.090
0.030
0.060
0.090
0.060 0.050
0.010
0.160
0.080
0.080
0.090
0.060
0.030
0.010
0.010
0.030
0.030
0.062
0.2120.1290.0310.093
0.093 0.154 0.066
0.0280.1210.0590.044
0.050 0.093 0.047
0.0960.0910.0860.081
0.076 0.157 0.093
0.093
0.121 0.045
0.066 0.031 0.091
0.105
0.139 0.119
0.0440.1600.192
0.315 0.098 0.176
0.0580.089
0.099 0.121 0.051
0.059
0.076
0.0640.107
0.179 0.111 0.094
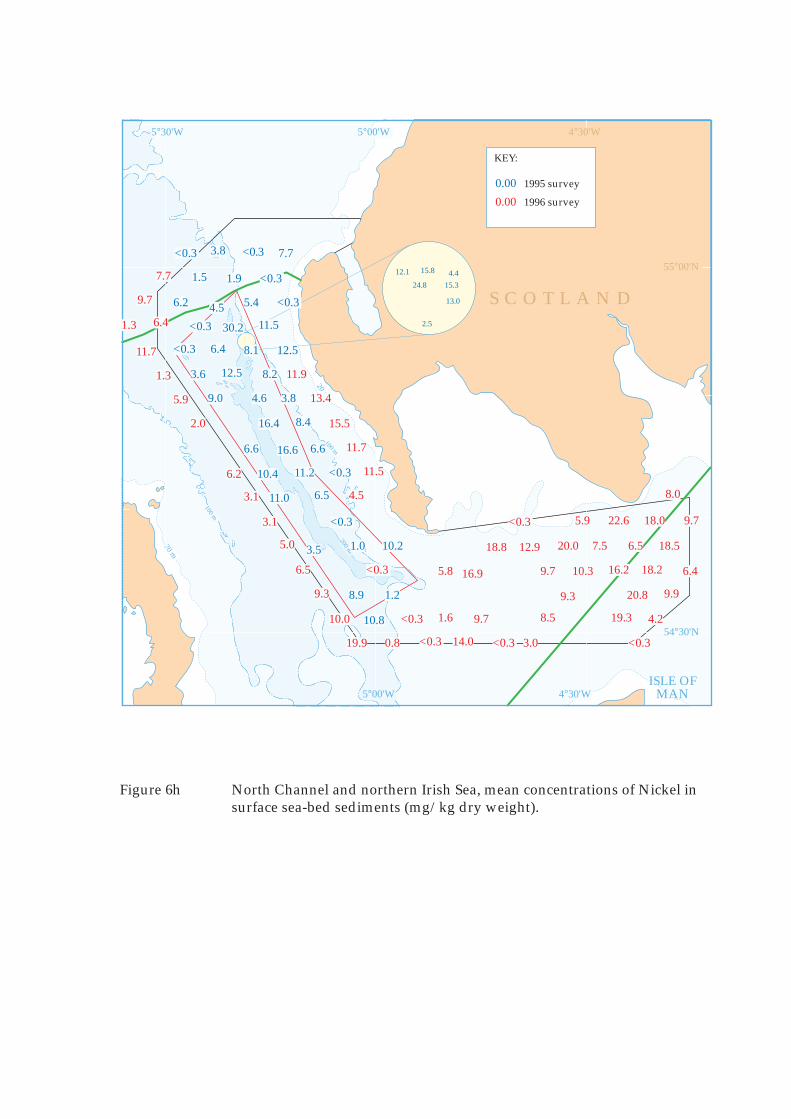
100 m
200 m20 m
20 m
100 m
100 m
0.00
0.00
Figure 6h North Channel and northern Irish Sea, mean concentrations of Nickel insurface sea-bed sediments (mg/kg dry weight).
S C O T L A N D
4°30'W
ISLE OFMAN
54°30'N
5°00'W
5°00'W
55°00'N
5°30'W
4°30'W
1995 survey
1996 survey
KEY:
7.7<0.33.8<0.3
1.5 1.9 <0.3
<0.35.44.56.2
<0.3 30.2 11.5
12.58.16.4<0.3
3.6 12.5 8.2
10.8
8.9 1.2
3.5 1.0 10.2
<0.3
11.0 6.5
<0.311.210.4
6.6 16.6 6.6
8.416.4
9.0 4.6 3.8
8.0
9.718.022.65.9
20.0
9.7
12.918.8
16.95.8
<0.310.0
19.9 0.8 <0.3
1.6
14.0
9.7
<0.3
<0.3 3.0
8.5
9.3
10.3
7.5
16.2
6.5
18.2
18.5
6.4
9.9
4.2
20.8
19.3
<0.3
<0.3
4.5
11.5
11.7
15.5
13.4
9.7
1.3 6.4
7.7
11.7
1.3
5.9
2.0
6.2
3.1
3.1
5.0
6.5
9.3
11.9
2.5
13.0
15.324.8
12.1 15.8 4.4
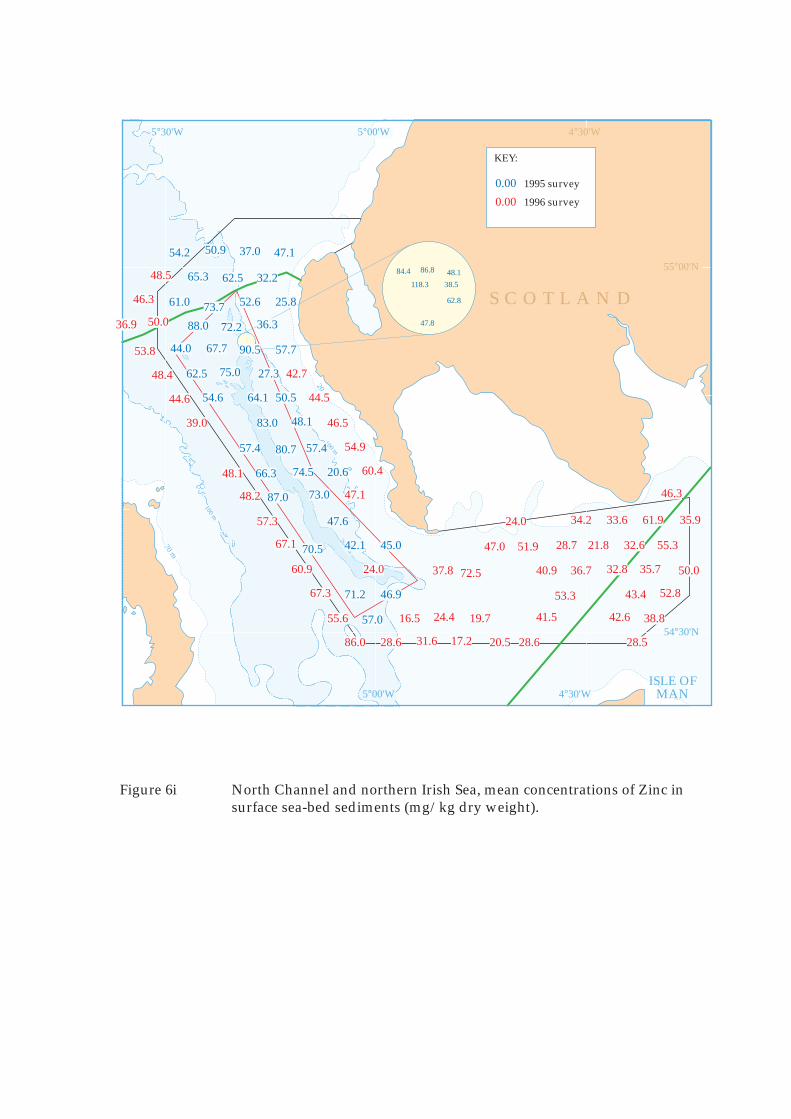
200 m
100 m
200 m20 m
20 m
100 m
100 m
0.00
0.00
Figure 6i North Channel and northern Irish Sea, mean concentrations of Zinc insurface sea-bed sediments (mg/kg dry weight).
S C O T L A N D
4°30'W
ISLE OFMAN
54°30'N
5°00'W
5°00'W
55°00'N
5°30'W
4°30'W
1995 survey
1996 survey
KEY:
46.3
35.961.933.634.2
28.7
40.9
51.947.0
72.537.8
16.555.6
86.0 28.6 31.6
24.4
17.2
19.7
24.0
20.5 28.6
41.5
53.3
36.7
21.8
32.8
32.6
35.7
55.3
50.0
52.8
38.8
43.4
42.6
28.5
24.0
47.1
60.4
54.9
46.5
44.5
46.3
36.9 50.0
48.5
53.8
48.4
44.6
39.0
48.1
48.2
57.3
67.1
60.9
67.3
42.7
47.137.050.954.2
65.3 62.5 32.2
25.852.673.761.0
88.0 72.2 36.3
57.790.567.744.0
62.5 75.0 27.3
57.0
71.2 46.9
70.5 42.1 45.0
47.6
87.0 73.0
20.674.566.3
57.4 80.7 57.4
48.183.0
54.6 64.1 50.5
47.8
62.8
38.5118.3
84.4 86.8 48.1

Cadmium Chromium
Figure 7 Comparison of the detection frequencies of cadmium and chromium in surfacesea-bed sediments (mg/kg dry weight), summarising analytical data for the 1995SOAEFD survey of the North Channel; the 1996 SOAEFD survey of the NorthChannel and northern Irish Sea; and earlier MAFF surveys of the Irish Sea.
1995SOAEFD
survey
1996SOAEFD
survey
MAFFsurvey
0 20 40 60 80 1000
5
10
15
20
0 20 40 60 80 1000
5
10
15
20
Mean concentrations (mg/kg dry weight)
0 20 40 60 80 1000
5
10
15
20
0 0.04 0.08 0.12 0.16 0.2 0.24
0 0.04 0.08 0.12 0.16 0.2 0.24
MAFFsurvey
1996SOAEFD
survey
1995SOAEFD
survey
0
5
10
15
20
25
0
5
10
15
20
25
0
5
10
15
20
25
Mean concentrations (mg/kg dry weight)
Freq
uenc
yFr
eque
ncy
Freq
uenc
y
MAFFsurvey
1996SOAEFD
survey
1995SOAEFD
survey
0 0.04 0.08 0.12 0.16 0.2 0.24
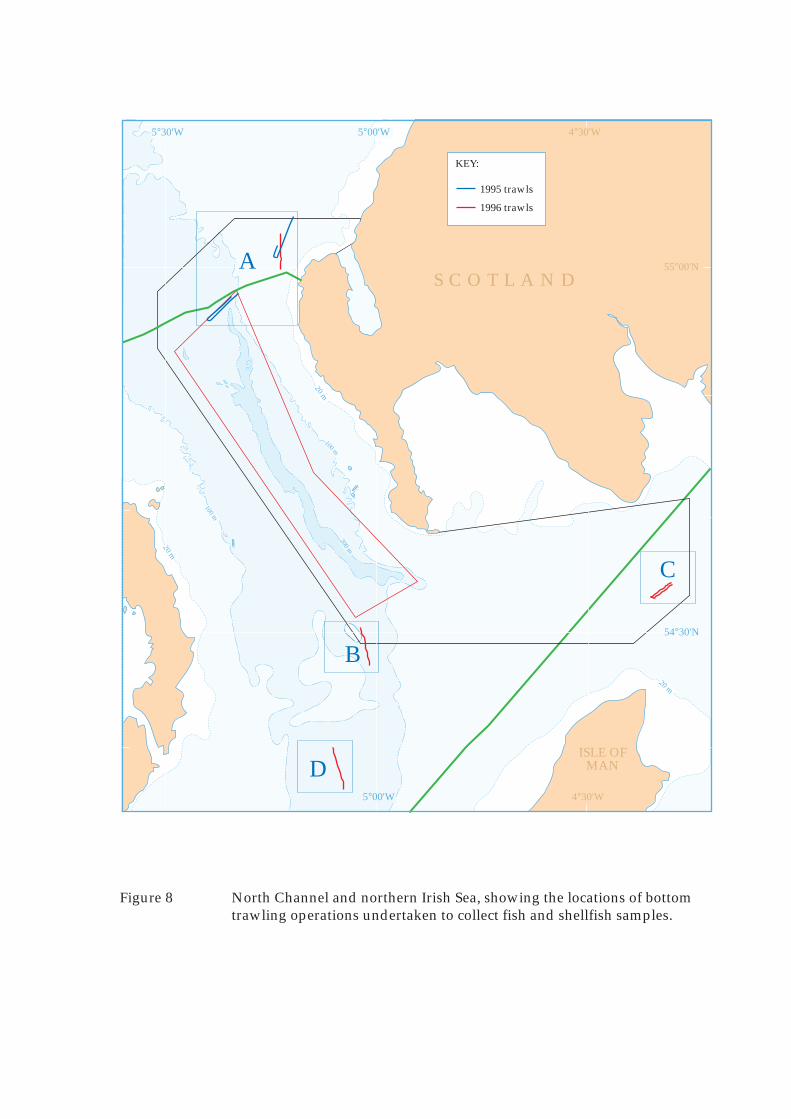
200 m
100 m
200 m
20 m
20 m
20 m
100 m
100 m
S C O T L A N D
4°30'W
ISLE OFMAN
54°30'N
5°00'W
Figure 8 North Channel and northern Irish Sea, showing the locations of bottomtrawling operations undertaken to collect fish and shellfish samples.
5°00'W
55°00'N
5°30'W
4°30'W
1995 trawls
1996 trawls
KEY:
A
B
D
C
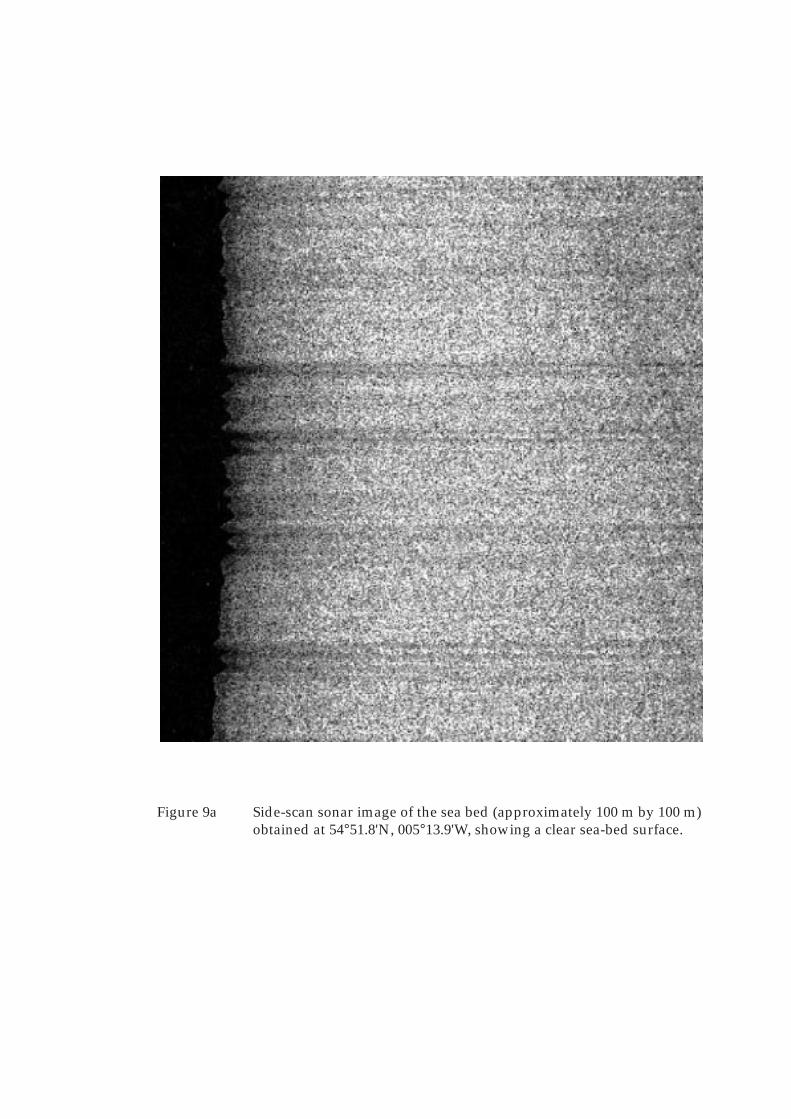
Figure 9a Side-scan sonar image of the sea bed (approximately 100 m by 100 m)obtained at 54°51.8'N, 005°13.9'W, showing a clear sea-bed surface.
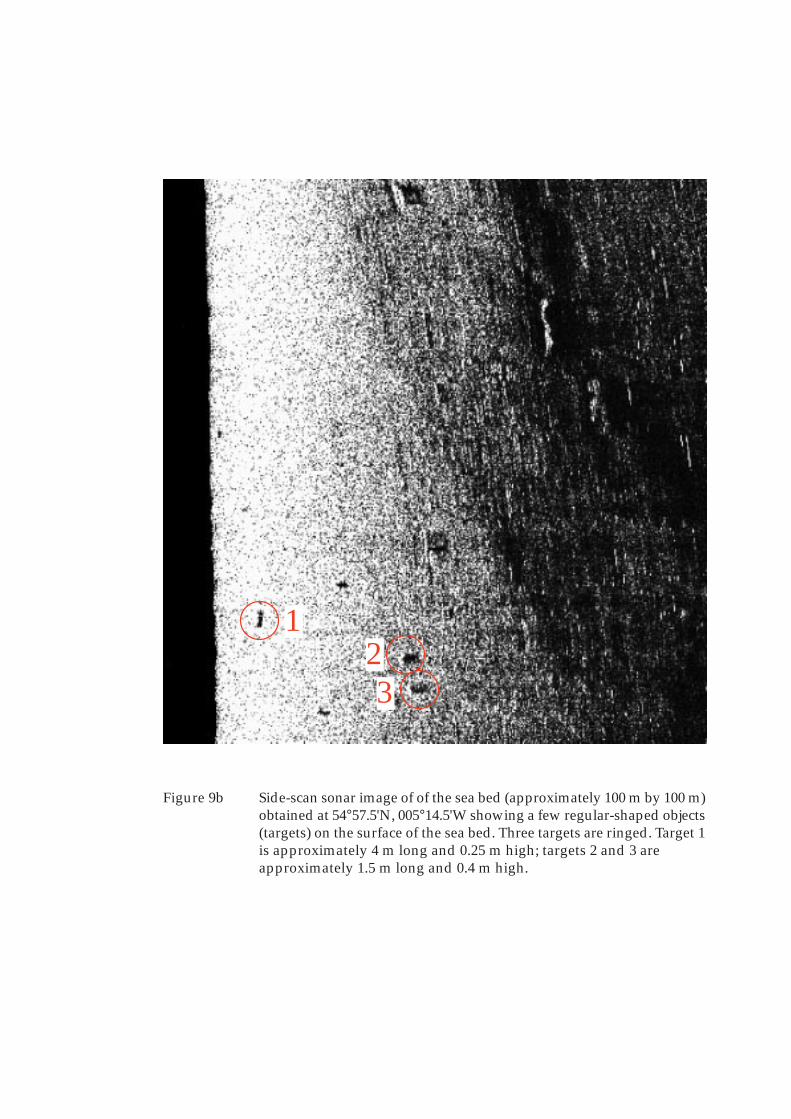
Figure 9b Side-scan sonar image of of the sea bed (approximately 100 m by 100 m)obtained at 54°57.5'N, 005°14.5'W showing a few regular-shaped objects(targets) on the surface of the sea bed. Three targets are ringed. Target 1is approximately 4 m long and 0.25 m high; targets 2 and 3 areapproximately 1.5 m long and 0.4 m high.
123

Figure 9c Side-scan sonar image of of the sea bed (approximately 100 m by 100 m) at54°54.2'N, 005°15.3'W showing a large number of regular-shaped objects(targets) scattered over the surface of the sea bed. The area shown containsapproximately 300 targets.
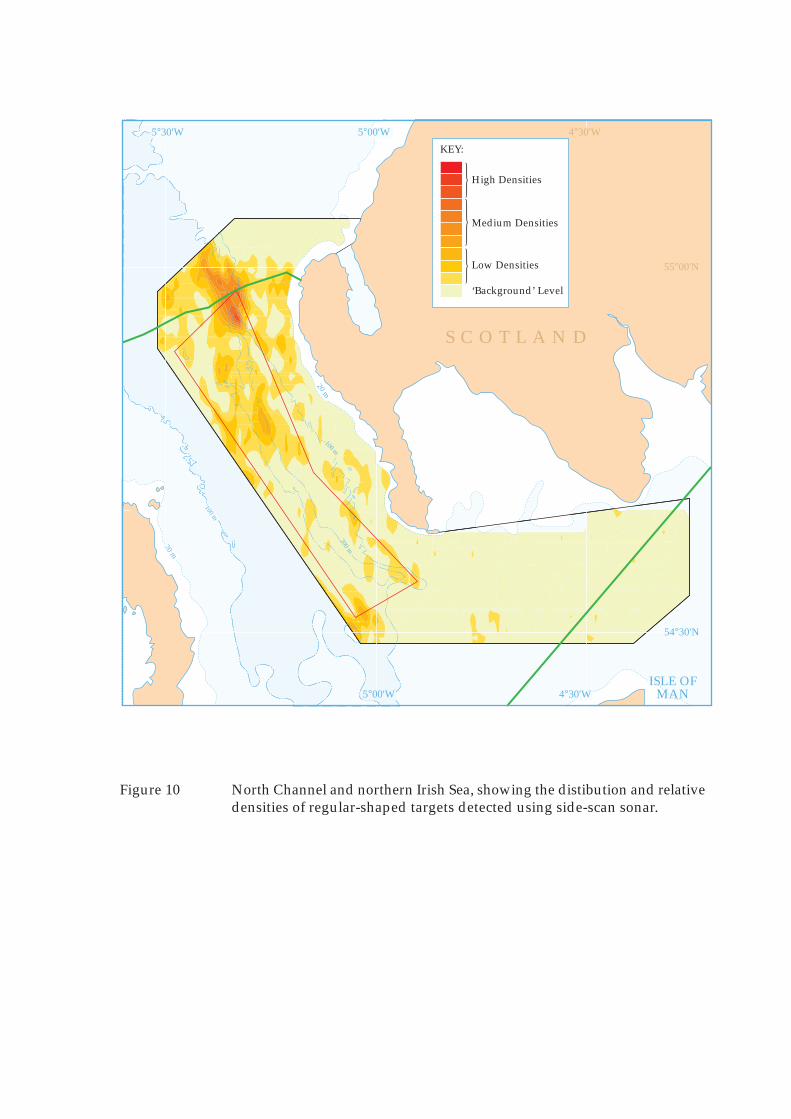
200 m
100 m
200 m20 m
20 m
100 m
100 m
4°30'W
ISLE OFMAN
54°30'N
5°00'W
Figure 10 North Channel and northern Irish Sea, showing the distibution and relativedensities of regular-shaped targets detected using side-scan sonar.
5°00'W
55°00'N
5°30'W
4°30'W
S C O T L A N D
High Densities
KEY:
Medium Densities
Low Densities
‘Background’ Level

200 m
100 m
200 m20 m
20 m
100 m
100 m
S C O T L A N D
4°30'W
ISLE OFMAN
54°30'N
5°00'W
Figure 11 North Channel and northern Irish Sea, showing the locations of underwatertelevision and pulse induction survey transects.
5°00'W
55°00'N
5°30'W
4°30'W
1995 towed sledge survey
1996 towed sledge and pulse induction survey
1996 drop frame survey
KEY:
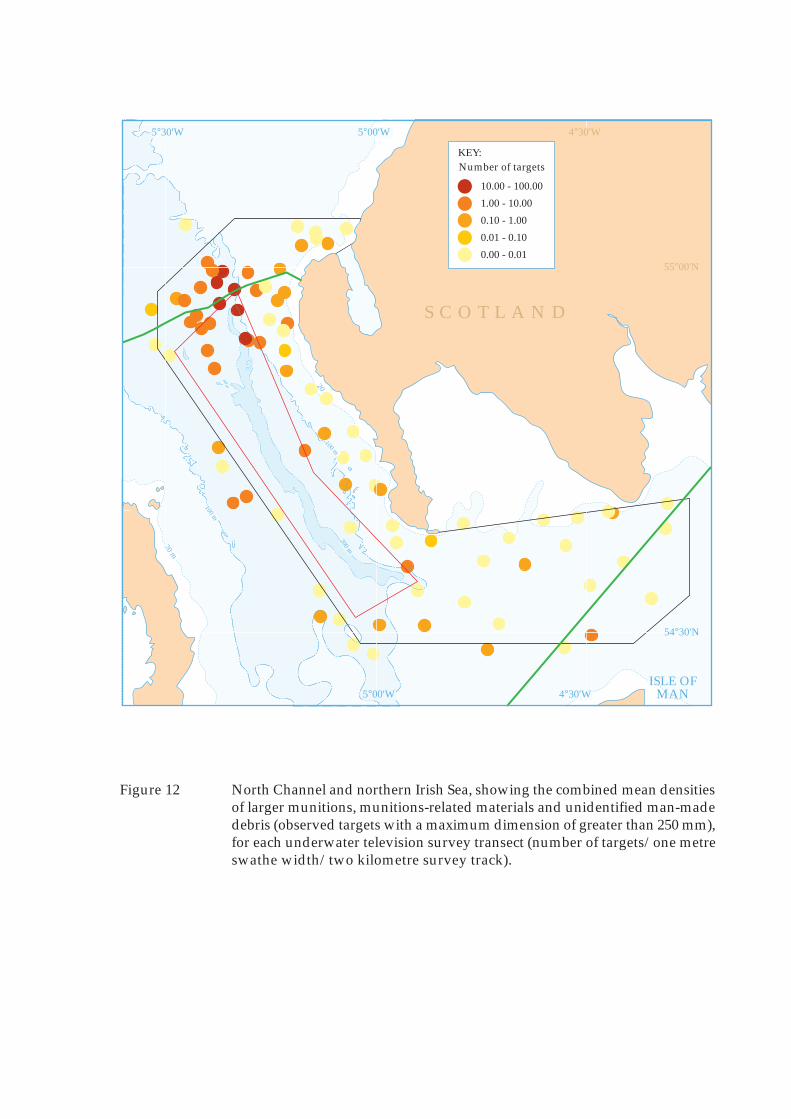
200 m
100 m
200 m20 m
20 m
100 m
100 m
1.00 - 10.00
0.01 - 0.10
10.00 - 100.00
0.00 - 0.01
S C O T L A N D
4°30'W
ISLE OFMAN
54°30'N
5°00'W
Figure 12 North Channel and northern Irish Sea, showing the combined mean densitiesof larger munitions, munitions-related materials and unidentified man-madedebris (observed targets with a maximum dimension of greater than 250 mm),for each underwater television survey transect (number of targets/one metreswathe width/two kilometre survey track).
5°00'W
55°00'N
5°30'W
4°30'W
KEY:
0.10 - 1.00
Number of targets
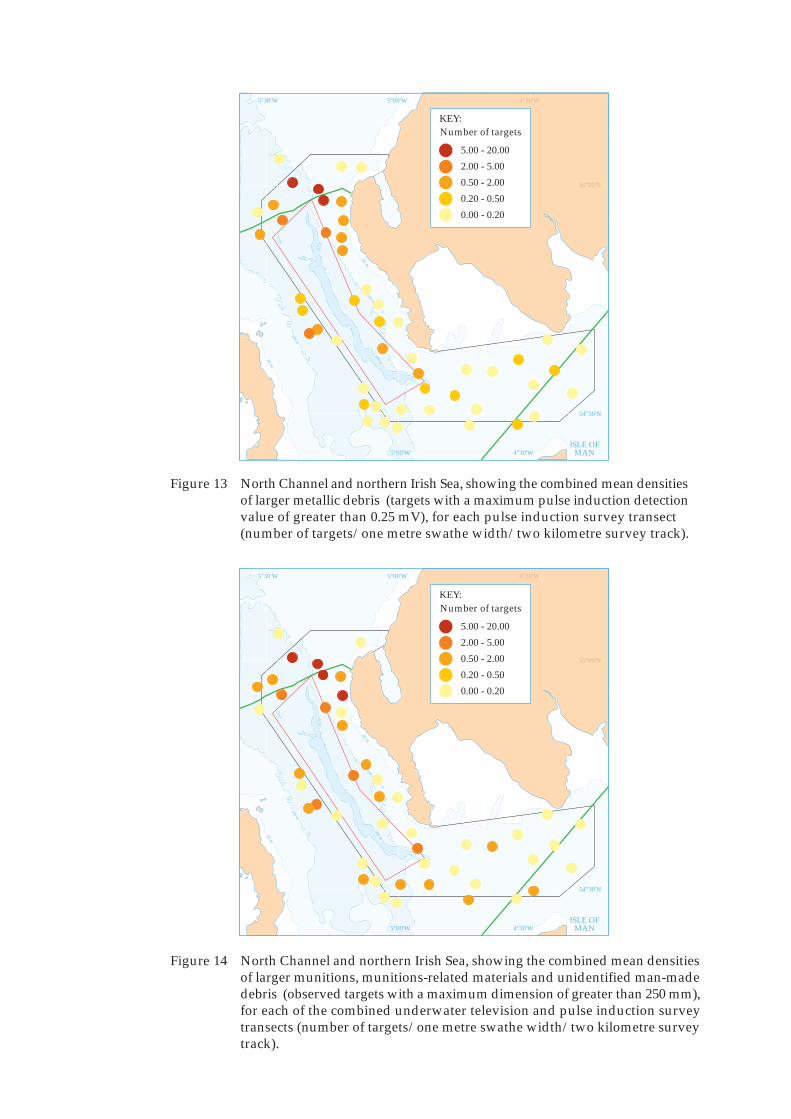
200 m
100 m
100 m200 m
100 m
100 m200 m
200 m
20 m
20 m
20 m
20 m
100 m100 m
2.00 - 5.00
0.20 - 0.50
5.00 - 20.00
0.00 - 0.20
KEY:
0.50 - 2.00
Number of targets
4°30'W
ISLE OFMAN
54°30'N
5°00'W
Figure 14 North Channel and northern Irish Sea, showing the combined mean densitiesof larger munitions, munitions-related materials and unidentified man-madedebris (observed targets with a maximum dimension of greater than 250 mm),for each of the combined underwater television and pulse induction surveytransects (number of targets/one metre swathe width/two kilometre surveytrack).
5°00'W
55°00'N
5°30'W
4°30'W
4°30'W
ISLE OFMAN
54°30'N
5°00'W
5°00'W
55°00'N
5°30'W
4°30'W
Figure 13 North Channel and northern Irish Sea, showing the combined mean densitiesof larger metallic debris (targets with a maximum pulse induction detectionvalue of greater than 0.25 mV), for each pulse induction survey transect(number of targets/one metre swathe width/two kilometre survey track).
2.00 - 5.00
0.20 - 0.50
5.00 - 20.00
0.00 - 0.20
KEY:
0.50 - 2.00
Number of targets
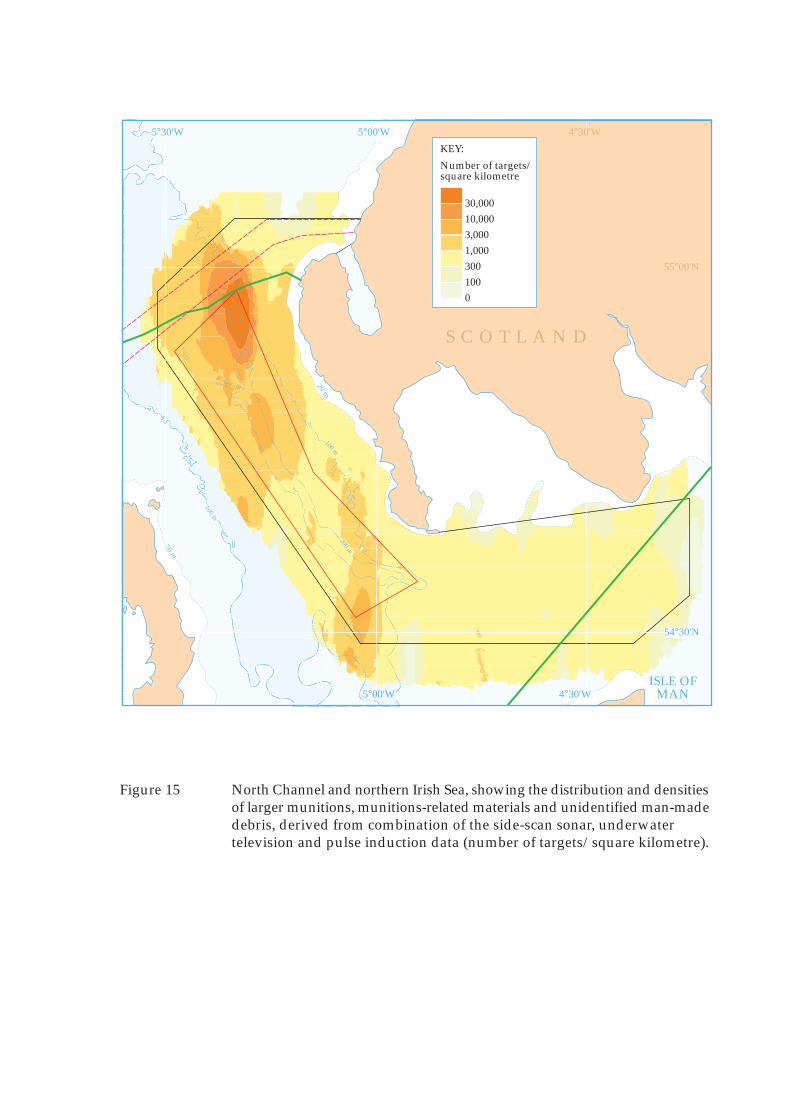
200 m
100 m
100 m
200 m20 m
20 m
100 m
100 m
S C O T L A N D
4°30'W
ISLE OFMAN
54°30'N
5°00'W
Figure 15 North Channel and northern Irish Sea, showing the distribution and densitiesof larger munitions, munitions-related materials and unidentified man-madedebris, derived from combination of the side-scan sonar, underwatertelevision and pulse induction data (number of targets/square kilometre).
5°00'W
55°00'N
5°30'W
4°30'W
30,00010,0003,0001,0003001000
Number of targets/square kilometre
KEY: