survey of industrial and commercial waste generated in ... · iv wales industrial and commercial...
TRANSCRIPT

Survey of Industrial & Commercial Waste Generated in Wales 2012 Rev No FINAL Date
i
Wales Industrial and Commercial Waste Generated Survey 2012 www.naturalresourceswales.gov.uk
Published by: Natural Resources Wales Cambria House 29 Newport Road Cardiff CF24 0TP 0300 065 3000 (Mon-Fri, 8am - 6pm) [email protected] www.naturalresourceswales.gov.uk © Natural Resources Wales All rights reserved. This document may be reproduced with prior permission of Natural Resources Wales
ii
Wales Industrial and Commercial Waste Generated Survey 2012 www.naturalresourceswales.gov.uk
Executive Summary The survey of industrial and commercial (I&C) waste generated in Wales for 2012 calendar year was carried out by RSK Environment Ltd in partnership with Urban Mines, and managed by Natural Resources Wales on behalf of the Welsh Government that funded the project. Ainsworth & Parkinson, Groundwork in Wales and WRc also provided support on the project. The purpose of this study was to produce information on the quantities, origins (by industry sector and geographic region), and fate (management method) of industrial & commercial (I&C) and construction and demolition (C&D) wastes generated by businesses in Wales in 2012. A separate report has been prepared for the results of the construction and demolition survey. This information is required by Welsh Government (WG) for a variety of reasons including:
reporting on waste generation in compliance with the EU Waste Statistics Regulations 2002;
informing the development of national waste policy;
monitoring progress against national waste prevention and recycling targets;
informing waste planners and the regulator; and
providing data to the waste management industry to inform investment decisions. Data was collected from 1,540 business sites of differing sectors and sizes throughout Wales between July 2013 and December 2013. The data was grossed up using population data to regional and national level in Wales. Office for National Statistics data showed that there were 85,695 industrial and commercial business units in Wales in 2012 with 7% in industrial sectors and 93% in commerce. Of these businesses, 63% had fewer than five employees and 2% had one hundred or more employees. The methodology used in this survey was comparable with the previous I&C surveys completed in Wales, of which the most recent provided data for the 2007 calendar year. Analysis of this data concluded that in 2012:
Welsh industrial and commercial sectors generated an estimated 3.7 million tonnes of waste split 55%:45% between industrial and commercial businesses. The precision for the total waste generated was +/- 7.9% at 90% confidence.
An estimated 481 thousand tonnes of industrial waste and 434 thousand tonnes of commercial waste were generated in North Wales. An estimated 1.2 million tonnes of industrial waste and 757 thousand tonnes of commercial waste were generated in South East Wales. An estimated 278 thousand tonnes of industrial waste and 474 thousand tonnes of commercial waste were generated in South West Wales.
The preparation for re-use, recycling & composting rate for the industrial waste was 50% and the land disposal rate was 27%.
iii
Wales Industrial and Commercial Waste Generated Survey 2012 www.naturalresourceswales.gov.uk
The preparation for re-use, recycling & composting rate for the commercial waste was 68% and the land disposal rate was 26%.
The preparation for re-use, recycling & composting rate for the combined total of all industrial and commercial waste was 58% and the land disposal rate was 26%.
When compared to the results of the 2007 waste generation survey:
There is no statistically significant difference in the quantity of industrial waste generated in Wales.
There is no statistically significant difference in the quantity of commercial waste generated in Wales.
There is no statistically significant difference in the preparation for re-use, recycling & composting rate for industrial waste; the rate was 59% in 2007 and 50% in 2012.
There is a statistically significant difference in the preparation for re-use, recycling & composting rate for commercial waste; the rate was 37% in 2007 and 68% in 2012.
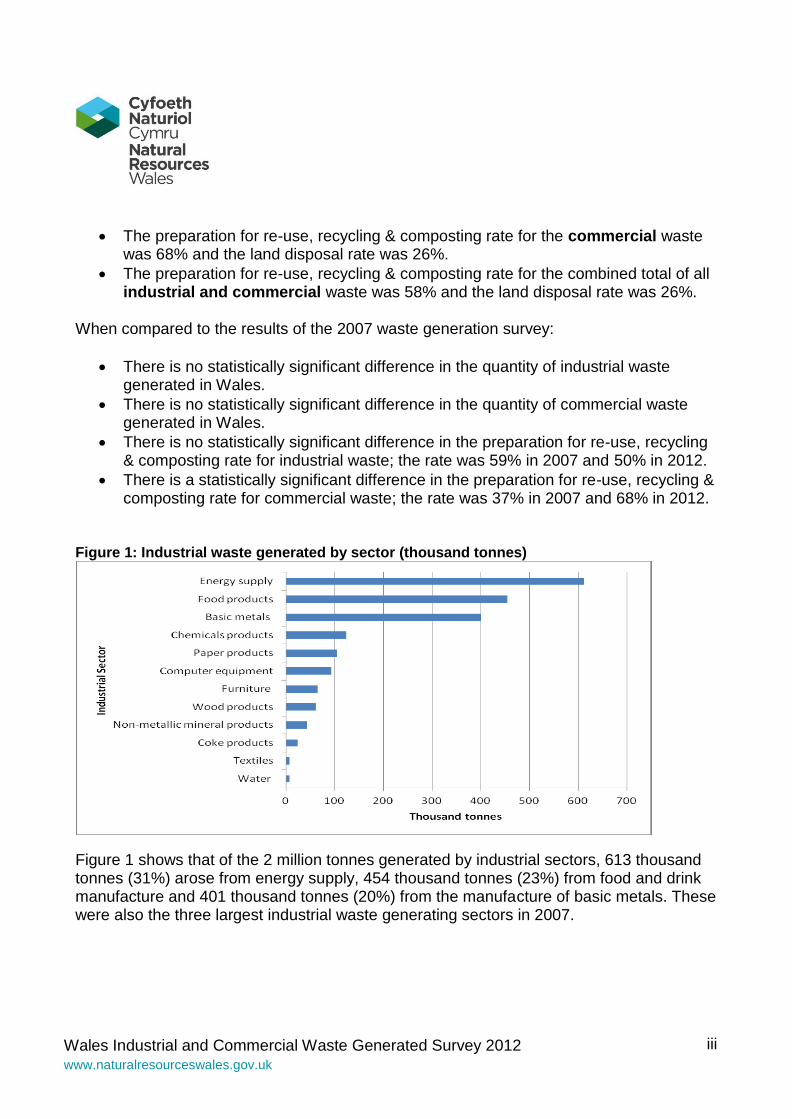
Figure 1: Industrial waste generated by sector (thousand tonnes)
Figure 1 shows that of the 2 million tonnes generated by industrial sectors, 613 thousand tonnes (31%) arose from energy supply, 454 thousand tonnes (23%) from food and drink manufacture and 401 thousand tonnes (20%) from the manufacture of basic metals. These were also the three largest industrial waste generating sectors in 2007.
iv
Wales Industrial and Commercial Waste Generated Survey 2012 www.naturalresourceswales.gov.uk
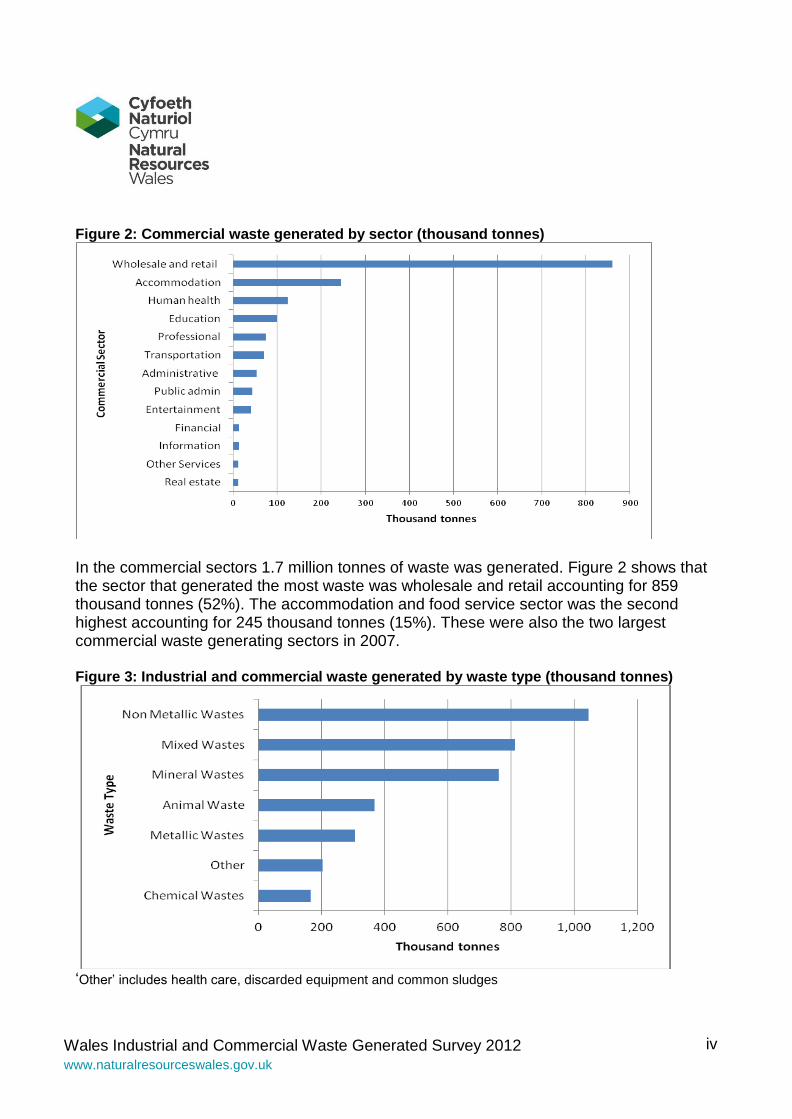
Figure 2: Commercial waste generated by sector (thousand tonnes)
In the commercial sectors 1.7 million tonnes of waste was generated. Figure 2 shows that the sector that generated the most waste was wholesale and retail accounting for 859 thousand tonnes (52%). The accommodation and food service sector was the second highest accounting for 245 thousand tonnes (15%). These were also the two largest commercial waste generating sectors in 2007. Figure 3: Industrial and commercial waste generated by waste type (thousand tonnes)
‘Other’ includes health care, discarded equipment and common sludges
v
Wales Industrial and Commercial Waste Generated Survey 2012 www.naturalresourceswales.gov.uk
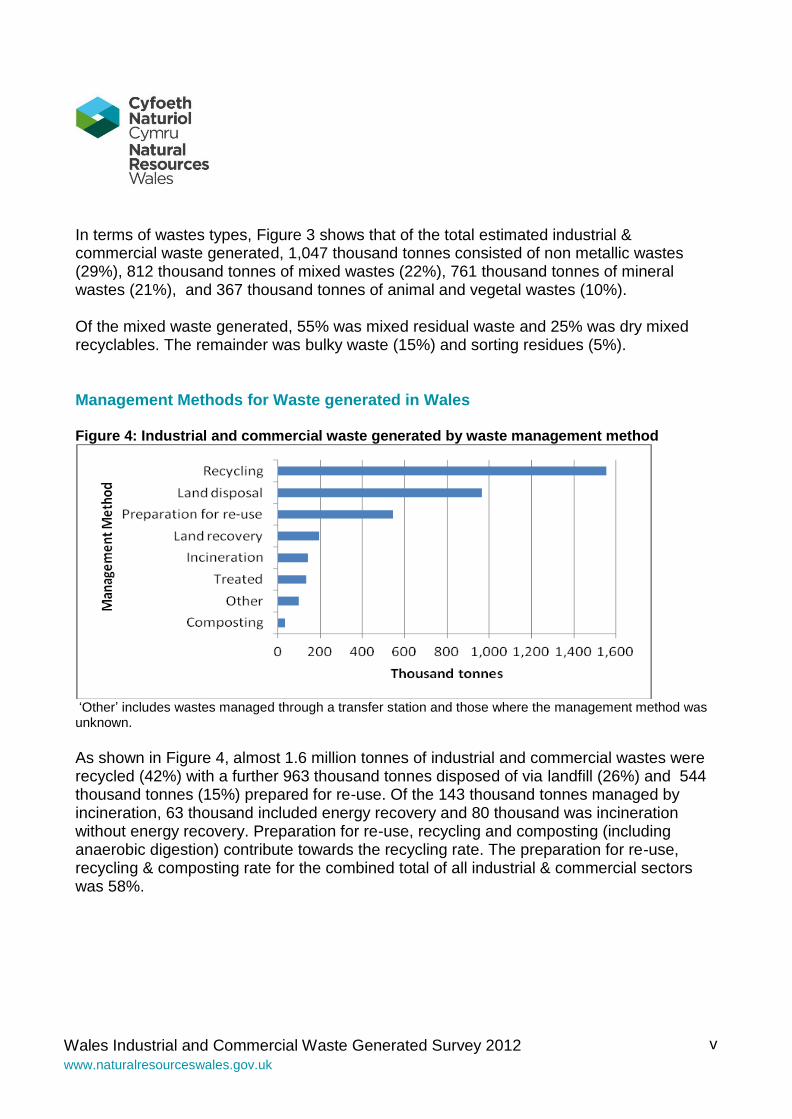
In terms of wastes types, Figure 3 shows that of the total estimated industrial & commercial waste generated, 1,047 thousand tonnes consisted of non metallic wastes (29%), 812 thousand tonnes of mixed wastes (22%), 761 thousand tonnes of mineral wastes (21%), and 367 thousand tonnes of animal and vegetal wastes (10%). Of the mixed waste generated, 55% was mixed residual waste and 25% was dry mixed recyclables. The remainder was bulky waste (15%) and sorting residues (5%). Management Methods for Waste generated in Wales Figure 4: Industrial and commercial waste generated by waste management method
‘Other’ includes wastes managed through a transfer station and those where the management method was unknown.
As shown in Figure 4, almost 1.6 million tonnes of industrial and commercial wastes were recycled (42%) with a further 963 thousand tonnes disposed of via landfill (26%) and 544 thousand tonnes (15%) prepared for re-use. Of the 143 thousand tonnes managed by incineration, 63 thousand included energy recovery and 80 thousand was incineration without energy recovery. Preparation for re-use, recycling and composting (including anaerobic digestion) contribute towards the recycling rate. The preparation for re-use, recycling & composting rate for the combined total of all industrial & commercial sectors was 58%.
vi
Wales Industrial and Commercial Waste Generated Survey 2012 www.naturalresourceswales.gov.uk
Hazardous Waste An estimated 239 thousand tonnes of hazardous waste was generated by industry and commerce in 2012; this equates to 7% of the total waste generation of 3.6 million tonnes. The estimated split was 159 thousand tonnes industrial waste (67%) and 80 thousand tonnes commercial waste (33%). Chemical wastes accounted for 128 thousand tonnes (54%) of the total hazardous waste generated by industry and commerce. The second largest proportion of hazardous waste was health care and biological wastes, with 38 thousand tonnes (16%) generated. The majority of all industrial and commercial hazardous waste generated was reported as being prepared for re-use or recycled (73 thousand tonnes), sent for treatment (70 thousand tonnes) or sent for incineration (65 thousand tonnes). Regional Waste Generation Estimated Regional Waste Generation was as follows: North Wales 0.9 million tonnes (+/- 10.5% at 90% confidence) South East Wales 2.0 million tonnes (+/- 7.5% at 90% confidence) South West Wales 0.8 million tonnes (+/- 9.4% at 90% confidence) The geographical distribution of business sites in Wales is 29% in North Wales, 44% in South East Wales and 29% in South West Wales. Industrial sectors generated the majority of waste in South East Wales (62%) and North Wales (53%). In contrast, the majority of waste generated in South West Wales was from the commercial sectors (63%). Recycling is the dominant waste management method across the regions. South West Wales has the highest preparation for re-use, recycling & composting rate (67%), followed by the North (61%) and the South East (54%). This has changed from 2007 when landfill predominated in South East and South West Wales. Landfill is the second highest waste management method across the regions (South East 33%; South West 21% and North 15%).
Wales Industrial and Commercial Waste Generated Survey 2012 www.naturalresourceswales.gov.uk
Contents
Executive Summary Executive Summary ............................................................................................................. ii Management Methods for Waste generated in Wales ......................................................... v Hazardous Waste ............................................................................................................... vi Regional Waste Generation ................................................................................................ vi
Contents ............................................................................................................................. 1. Introduction ............................................................................................................. 1 1.1. Background and need for the survey ...................................................................... 1
1.2. Overall Aims ........................................................................................................... 2 1.3. Study Area .............................................................................................................. 2 1.4. Project Management ............................................................................................... 3 1.5. Survey Parameters ................................................................................................. 3
2. Survey Design & Methodology................................................................................ 4 2.1. Introduction ............................................................................................................. 4
2.2. Design of the Questionnaire and Sample frame ..................................................... 5 2.2.1. Core Survey Questions ....................................................................................... 6 2.3. Survey Delivery ....................................................................................................... 6
2.4. Classifying Waste ................................................................................................... 6
2.5. Calculating Tonnages ............................................................................................. 7
2.6. Classifying Waste Management Methods ............................................................... 7 2.7. Non-Wastes ............................................................................................................ 9
2.8. Classifying Regions ................................................................................................ 9 2.9. Further Detail .......................................................................................................... 9 3. Survey results ....................................................................................................... 10 3.1. Waste Generation - Nationally .............................................................................. 10
3.2. Regional Waste Generation .................................................................................. 14 3.3. Waste Management .............................................................................................. 17 3.3.1. Waste Management- Nationally ........................................................................ 17 3.3.2. Waste Management- Regionally ....................................................................... 21 3.4. Comparison with previous surveys and targets in ‘Towards Zero Waste’ National waste strategy ................................................................................................................ 23
3.4.1. Comparison of results for industrial waste ......................................................... 23
3.4.2. Comparison of results for commercial waste ..................................................... 24 3.4.3. Comparison of results for total of industrial and commercial waste ................... 26 3.5. Hazardous Waste ................................................................................................. 28 4. Conclusions & Recommendations ........................................................................ 32 4.1. Data Confidence ................................................................................................... 32
4.2. Lessons Learned and Recommendations ............................................................ 33
Wales Industrial and Commercial Waste Generated Survey 2012 www.naturalresourceswales.gov.uk
Figures
Figure 1: Industrial waste generated by sector (thousand tonnes) ..................................... iii Figure 2: Commercial waste generated by sector (thousand tonnes) ................................. iv Figure 3: Industrial and commercial waste generated by waste type (thousand tonnes) .... iv
Figure 4: Industrial and commercial waste generated by waste management method ........ v Figure 5: Geographical Spread of Business Sites Surveyed ............................................... 4 Figure 6: Waste generated in Wales 2012, by Sector (% of total) ..................................... 10
Figure 7: Industrial Waste generated in Wales 2012 by Waste Type (thousands of tonnes) ........................................................................................................................................... 11 Figure 8: Commercial Waste generated in Wales 2012 by waste type (thousands of tonnes) ............................................................................................................................... 12
Figure 9: Industrial waste generated in Wales 2012, by Business Employee Sizeband (% of total) ............................................................................................................................... 13
Figure 10: Commercial waste generated in Wales 2012, by Business Employee Sizeband (% of total) ......................................................................................................................... 13 Figure 11: Waste generated in Wales 2012, in thousands of tonnes, Waste Type by region in the Industrial Sector ....................................................................................................... 15
Figure 12: Waste generated in Wales 2012, in thousands of tonnes, Waste Type by region in the Commercial Sector ................................................................................................... 16 Figure 13 Industrial Waste generated in Wales 2012 by Waste Type and Management .. 18
Figure 14 Commercial waste generated in Wales 2012 by Waste Type and Management ........................................................................................................................................... 20 Figure 15: Hazardous Waste generation by Industrial and Commercial Sector (thousand tonnes) ............................................................................................................................... 28
Tables
Table 1 Waste management activities grouped by Waste Management Method ................ 8 Table 2: Regional Waste generated .................................................................................. 14
Table 3: Waste Management Method in Industrial Sector ................................................. 17
Table 4: Waste Management Method in Commercial Sector ............................................. 19
Table 5: Industrial waste management method by region ................................................. 21 Table 6: Commercial waste management method by region ............................................. 22 Table 7 Comparison of industrial waste generated in Wales in 2007 and 2012 ................ 23 Table 8 Comparison of recycling rate of industrial waste generated in Wales in 2007 and 2012 ................................................................................................................................... 23
Table 9 Comparison of landfill rate of industrial waste generated in Wales in 2007 and 2012 ................................................................................................................................... 24 Table 10 Comparison of commercial waste generated in Wales in 2007 and 2012 .......... 24
Table 11 Comparison of recycling rate of commercial waste generated in Wales in 2007 and 2012 ............................................................................................................................ 25
Wales Industrial and Commercial Waste Generated Survey 2012 www.naturalresourceswales.gov.uk
Table 12 Comparison of landfill rate of commercial waste generated in Wales in 2007 and 2012 ................................................................................................................................... 25 Table 13 Comparison of the total of industrial and commercial waste generated in Wales in 2007 and 2012 ............................................................................................................... 26 Table 14 Comparison of recycling rate of the total industrial and commercial waste generated in Wales in 2007 and 2012 ............................................................................... 26 Table 15 Comparison of landfill rate of the total industrial and commercial waste generated in Wales in 2007 and 2012 ............................................................................... 27 Table 16: Waste generation in Wales 2012, split between Hazardous and Non- hazardous waste by Sector ................................................................................................................. 30
Page 1 of 34 www.naturalresourceswales.gov.uk
Wales Industrial and Commercial Waste Generated Survey 2012
1. Introduction The purpose of this study was to produce information on the quantities, origins (by industry sector and geographic region), and fate (management method) of industrial & commercial (I&C) and construction and demolition (C&D) wastes generated by businesses in Wales in 2012. A separate report has been prepared for the results of the construction and demolition survey. This information is required by Welsh Government (WG) for a variety of reasons including:
reporting on waste generation in compliance with the EU Waste Statistics Regulations 2002;
informing the development of national waste policy;
monitoring progress against national waste prevention and recycling targets;
informing waste planners and the regulator; and
providing data to the waste management industry to inform investment decisions. A separate document of appendices associated with this report contains the detailed results of the survey and technical appendices associated with the work.
1.1. Background and need for the survey Some data on waste generated by permitted industrial facilities is available to NRW via statutory returns. However, this does not necessarily cover all waste generated by those businesses and there are many businesses that do not require an environmental permit. To ensure a comprehensive set of data across all businesses, periodic surveys are required. There are a wide variety of needs for this waste data. These include European reporting purposes, such as the EU Waste Statistics Regulations that require the United Kingdom to report bi-annual data on waste generated by sector and waste type. It is used to provide evidence in support of waste policy development and the targeting of interventions, and to monitor progress against the waste prevention and recycling targets. The current targets for industrial and commercial waste set in the Wales Waste Strategy “Towards Zero Waste” (2010) and associated sector plans are outlined below. Waste prevention targets:
For industrial waste, a reduction of 1.4 per cent every year to 2050 based on 2006/7 baseline; and
For commercial waste, a reduction of 1.4 per cent every year to 2050 based on 2006/7 baseline.
Page 2 of 34 www.naturalresourceswales.gov.uk
Wales Industrial and Commercial Waste Generated Survey 2012
Preparation for re-use, recycling and composting (including anaerobic digestion) targets:
By 2015/16 to achieve a recycling target of 57% for commercial waste;
By 2015/16 to achieve a recycling target of 63% for industrial waste;
By 2019/20 to achieve a recycling target of 67% for both commercial waste and industrial waste; and
By 2024/25 to achieve a recycling target of 70% for both commercial waste and industrial waste.
Energy from Waste ceiling:
By 2024/25 a maximum of 30% of industrial and commercial waste to be managed by Energy from Waste.
Landfill targets:
By 2019/20 to landfill a maximum of 10% of industrial and commercial waste; and
By 2024/25 to landfill a maximum of 5% of industrial and commercial waste.
The information will be used by the Welsh Government and Local Authorities to inform waste planning. It will also provide information to the waste management industry to inform decision making for future investment. Furthermore, it will provide businesses with the information needed to benchmark their current waste practices against other businesses of similar size and sector, and for developing policies to encourage efficient use of resources, waste prevention and the sustainable management of industrial and commercial waste. Surveys of industrial & commercial wastes have been completed periodically with the most recent providing data for the 2007 calendar year. A new survey has been undertaken to assess whether there has been any change in the quantity of waste generated and in the waste management practices of business sectors. The methodology used in this survey is comparable with the 2007 I&C survey completed in Wales, and there have been no definitional changes, therefore it is valid to make comparisons between the results.
1.2. Overall Aims The main aims of the project were to determine how much waste from I&C businesses in Wales was generated by waste type and sector and how that waste was managed during the 2012 calendar year. Information obtained during the survey was also used to estimate additional splits of certain materials such as mixed wastes and paper and cardboard, which had not been estimated in previous surveys.
1.3. Study Area The geographical scope of the study included the whole of Wales, with data provided from businesses at regional level; South East, South West and North Wales. Lists of the local authorities covered by each region are provided in section 2.8.
Page 3 of 34 www.naturalresourceswales.gov.uk
Wales Industrial and Commercial Waste Generated Survey 2012
1.4. Project Management The project was managed overall by NRW, on behalf of the Welsh Government who funded the survey. The survey was contracted to an environmental consultancy, RSK Environment Limited (RSK). RSK utilised Urban Mines to coordinate local sub contractors to complete the site visits and accumulate the survey data. Ainsworth & Parkinson, Groundwork in Wales and WRc also provided support on the project. A steering group was set up in order to agree the survey methodology, make recommendations on key decisions and review draft outputs during the life time of the project. The steering group included:
John Fry - Project Manager, NRW
Dr Cathy O’ Brien - Project Executive, NRW
Rhiannon Phillips - Welsh Government
Emily Finney - Welsh Government
Liz Franks - Welsh Government
Lucy Thomas - Welsh Government
Sarah Mogford - Project Director, RSK
Alison Brough – Project Manager, RSK
Peter Scholes- Managing Director, Urban Mines
Innes Deans - Project Manager, Urban Mines
Andrew Davey - Project Statistician, WRc
Alastair Halliday – Assistant Project Statistician, WRc
Barbara Leach - WRAP
Paul Jennings - Constructing Excellence Wales
Emma Thomas - Constructing Excellence Wales
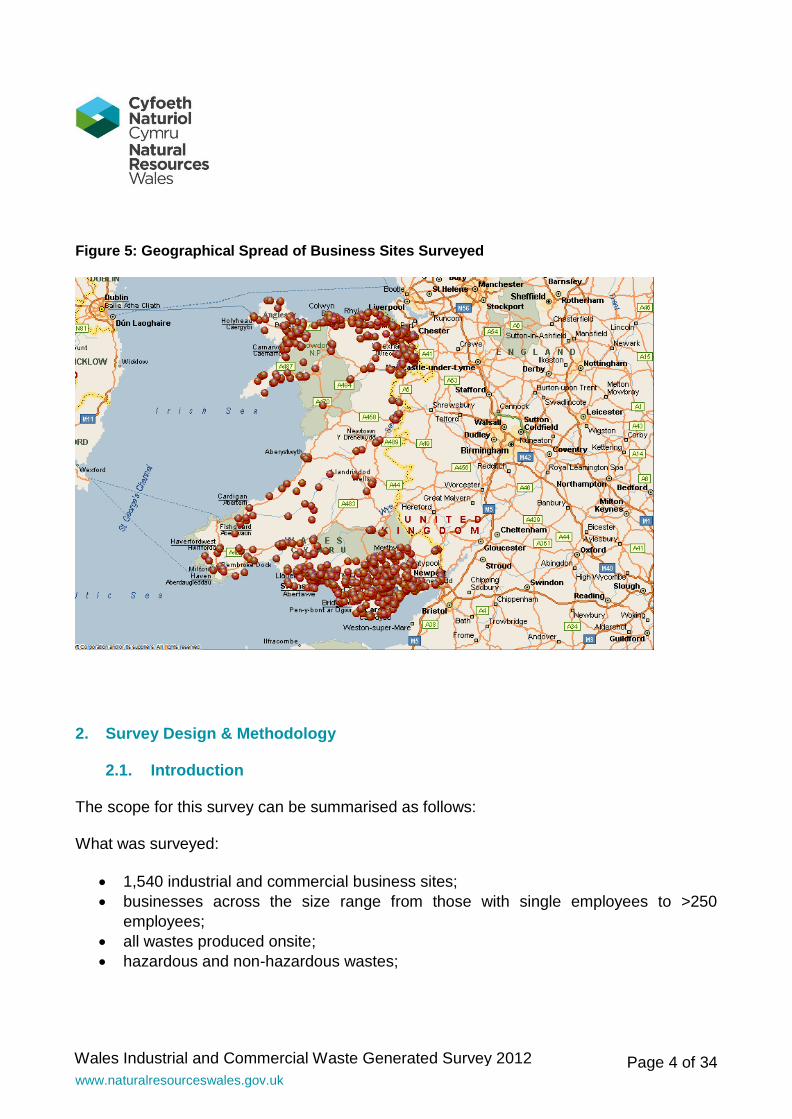
1.5. Survey Parameters The survey of companies was carried out between July 2013 and December 2013, recording wastes generated by business sites for the 2012 calendar year. The survey collected waste generation data from a total of 1,540 industrial and commercial business sites throughout Wales, using a structured interview process and developed questionnaire, based upon the requirements of the sample matrix developed by the project statisticians. The businesses surveyed reflect the geographical spread of business sites across Wales (Figure 5). Surveys were completed in all areas and Local Authorities in Wales. The scheduling of surveyor visits was planned to minimise travel times and the carbon impact of the project.
Page 4 of 34 www.naturalresourceswales.gov.uk
Wales Industrial and Commercial Waste Generated Survey 2012
Figure 5: Geographical Spread of Business Sites Surveyed
2. Survey Design & Methodology
2.1. Introduction The scope for this survey can be summarised as follows: What was surveyed:
1,540 industrial and commercial business sites;
businesses across the size range from those with single employees to >250
employees;
all wastes produced onsite;
hazardous and non-hazardous wastes;
Page 5 of 34 www.naturalresourceswales.gov.uk
Wales Industrial and Commercial Waste Generated Survey 2012
“Non-Wastes” such as blast furnace slag, virgin timber and materials directly re-
used on the same site that it was produced1. Data on non-wastes is not included in
this report;
the waste management method used to dispose of, recycle or recover the waste. What was NOT surveyed:
businesses involved in agriculture, forestry & fishing, mining or quarrying, and
construction2;
businesses involved in waste management and recycling (to avoid potential double
counting), and;
wastes produced by sewerage treatment. The methodology can be summarised as follows:
2.2. Design of the Questionnaire and Sample frame The structure of the primary survey database, and therefore the survey questionnaire, was designed to fulfil EU Waste Statistics Regulation reporting requirements and to produce data compatible with the previous ‘Survey of Industrial and Commercial Waste Arisings in Wales 2007’ so that the two sets of results could be compared. The full list of survey questions is available in Appendix 4. One-off wastes, such as those generated by refurbishment of office buildings or disposal of computer equipment, were recorded with the tonnage apportioned over the number of years between each refurbishment or disposal. The development of the sample matrix and grossing of the cleaned dataset to provide the national and regional estimates was delivered by consultants WRc under a separate contract with NRW. The methodology used for development of the sample matrix and subsequent grossing of the survey results was based on previous surveys to ensure comparability of results. Following the lessons learned from the 2007 survey the sample matrix was reviewed part way through the survey. This allowed for a review of any inconsistencies in the original Office of National Statistics (ONS) dataset and to reflect on actual business recruitment rates. These aspects of the project are discussed in detail in Appendices 2 and 12.
1 Non-Wastes are not classified as wastes as defined under the Waste Framework Directive. All ‘non-wastes’ are excluded from analysis in this report but data is available in the technical appendices. 2 Construction and demolition wastes were surveyed using a different survey methodology and questionnaire; this work is reported separately.

Page 6 of 34 www.naturalresourceswales.gov.uk
Wales Industrial and Commercial Waste Generated Survey 2012
2.2.1. Core Survey Questions
The survey questionnaire was designed to document individual waste streams, their nature (i.e. hazardous or non-hazardous), form (liquid, solid, gas), description (as waste classification) and tonnage, as well as what happened to the waste (waste management method or fate) and where this happened to assess movements. This part of the data is fully compatible with previous waste surveys. Detailed information on the survey questionnaire is available in Appendix 4.
2.3. Survey Delivery Businesses were recruited by telephone and selection was dictated by business size and sector in the sample matrix. Surveys were delivered via a structured face-to-face interview at business sites, using a laptop and database questionnaire, with a subsequent site walk around to identify any waste streams that may have been overlooked during the interview. The project was delivered by RSK acting as the principal contractor. Urban Mines was responsible for developing and establishing the project methodology, systems (software), and day-to-day project management. Ainsworth & Parkinson was responsible for the telephone recruitment of businesses for the survey and for booking survey visit appointments. The face-to-face survey interviews with businesses were carried out by Groundwork in Wales. The Groundwork surveyors used the structured questionnaire and software developed by Urban Mines during the survey visits. Survey data was collated centrally by Urban Mines whom managed the process, trained the surveyors and tele-bookers, and was responsible for data management and security. The survey delivery model was designed to quality assure the data collected both during the delivery of the survey and during the grossing up phase. This was supported via training of the surveyors, design of the survey software to eliminate entry errors, joint survey visits with project managers, a telephone mini-survey of visited companies and screening incoming raw data for outliers.
2.4. Classifying Waste
The Substance Oriented Classification (SOC) method was used to classify the wastes. The 9 SOC groups and 34 SOC sub-groups used are listed in Appendix 6. These are the waste types required for European reporting purposes. This classification method was also used because it classifies waste into a relatively small number of easily identifiable types. The two non-wastes, blast furnace slag and virgin timber (Section 2.7) were added as separate lines so that these could be separated from the main dataset for reporting purposes.
Page 7 of 34 www.naturalresourceswales.gov.uk
Wales Industrial and Commercial Waste Generated Survey 2012
The SOC codes are used in other waste surveys and there is a methodology for mapping European Waste Catalogue (EWC) codes to SOC. Therefore results from this survey can be compared with those generated by other surveys conducted both in the UK and across Europe. In addition to the recording of SOC group and sub-group for each waste stream, a further set of descriptions were added to each waste sub-group so that more detail could be collected. For instance, for the non-metallic waste sub-group “paper & card”, the additional layer of descriptions allowed recording of whether the waste was paper or card or a mixed stream, and whether it was derived from packaging or another source. The full list of additional descriptions recorded is summarised in Appendix 6.
2.5. Calculating Tonnages
A key requirement of the survey was that quantities of each waste stream could be represented as weights and recorded in metric tonnes. Surveyors were instructed to ask for documented evidence of weights wherever possible, for instance from waste transfer notes, contractor invoices, or other business records. This point was stressed during the telephone booking process and in the appointment confirmation email so that businesses could prepare these documents in advance of the visit. Where documented evidence was not available, the surveyor was provided with a tool as part of the survey software to calculate annual tonnages from container volume and disposal frequency. The software used standard container types (summarised in Appendix 8) for volume, and a series of bulk density conversion factors (presented in Appendix 9) from which weights could be calculated by entering number of collections per year. All the conversion factors could be overwritten by the surveyor if the standard conditions were not relevant, and surveyors were instructed to ‘reality check’ the resultant weights with the business representative before accepting them. For some individual items of waste (e.g. a fluorescent tube) a separate list of specific items (see Appendix 10) was also provided as part of the software package.
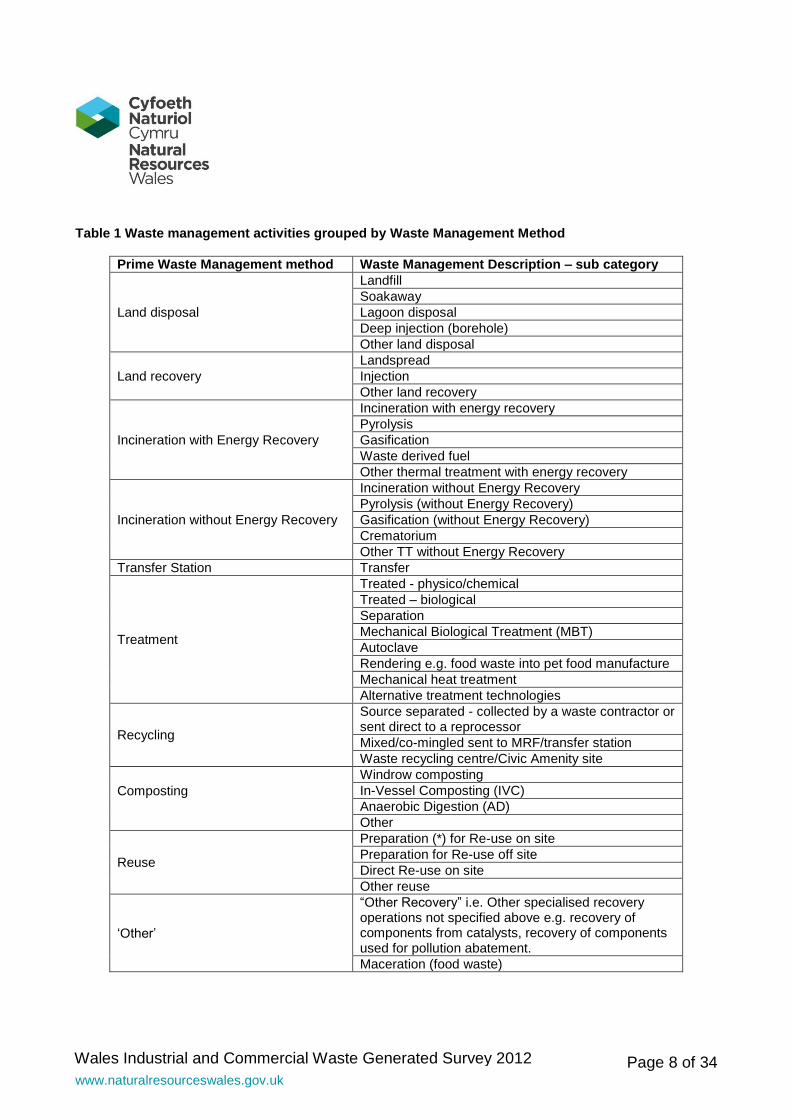
2.6. Classifying Waste Management Methods The waste management methods were grouped as per Table 1 below.
Page 8 of 34 www.naturalresourceswales.gov.uk
Wales Industrial and Commercial Waste Generated Survey 2012
Table 1 Waste management activities grouped by Waste Management Method
Prime Waste Management method Waste Management Description – sub category
Land disposal
Landfill
Soakaway
Lagoon disposal
Deep injection (borehole)
Other land disposal
Land recovery
Landspread
Injection
Other land recovery
Incineration with Energy Recovery
Incineration with energy recovery
Pyrolysis
Gasification
Waste derived fuel
Other thermal treatment with energy recovery
Incineration without Energy Recovery
Incineration without Energy Recovery
Pyrolysis (without Energy Recovery)
Gasification (without Energy Recovery)
Crematorium
Other TT without Energy Recovery
Transfer Station Transfer
Treatment
Treated - physico/chemical
Treated – biological
Separation
Mechanical Biological Treatment (MBT)
Autoclave
Rendering e.g. food waste into pet food manufacture
Mechanical heat treatment
Alternative treatment technologies
Recycling
Source separated - collected by a waste contractor or sent direct to a reprocessor
Mixed/co-mingled sent to MRF/transfer station
Waste recycling centre/Civic Amenity site
Composting
Windrow composting
In-Vessel Composting (IVC)
Anaerobic Digestion (AD)
Other
Reuse
Preparation (*) for Re-use on site
Preparation for Re-use off site
Direct Re-use on site
Other reuse
‘Other’
“Other Recovery” i.e. Other specialised recovery operations not specified above e.g. recovery of components from catalysts, recovery of components used for pollution abatement.
Maceration (food waste)
Page 9 of 34 www.naturalresourceswales.gov.uk
Wales Industrial and Commercial Waste Generated Survey 2012
2.7. Non-Wastes
Blast furnace slag and virgin timber were recorded as part of the survey but are not classified as ‘waste’ under the Waste Framework Directive and therefore are referred to as ‘non-wastes’ in this project. It was decided to collate data on ‘non-wastes’ in the survey to be fully comparable with previous I&C surveys but to exclude these tonnages from the results. In addition, materials that were directly re-used for their original purpose without prior treatment were also recorded in the survey as ‘non-wastes’; these had not been recorded in previous Wales I&C surveys. All ‘non-wastes’ are excluded from analysis in this report but data is available in the Appendix 1 detailed results tables.
2.8. Classifying Regions For the purposes of reporting regional data, local authorities were grouped into the following regions. North Wales: Conwy, Denbighshire, Flintshire, Gwynedd, Isle of Anglesey, Powys (Montgomeryshire) & Wrexham. South East Wales: Blaenau Gwent, Caerphilly, Cardiff, Merthyr Tydfil, Monmouthshire, Newport, Powys (Brecon & Radnorshire), Rhondda Cynon Taf, Torfaen & Vale of Glamorgan. South West Wales: Bridgend, Carmarthenshire, Ceredigion, Neath Port Talbot, Pembrokeshire & Swansea
2.9. Further Detail Detailed notes on how the survey was delivered, and quality assurance methods used, are given in Appendix 3. The data grossing and calculation of survey precision methodologies are provided in Appendix 12, and the lessons learned for future surveys are described in Appendix 11.
Page 10 of 34 www.naturalresourceswales.gov.uk
Wales Industrial and Commercial Waste Generated Survey 2012
3. Survey results
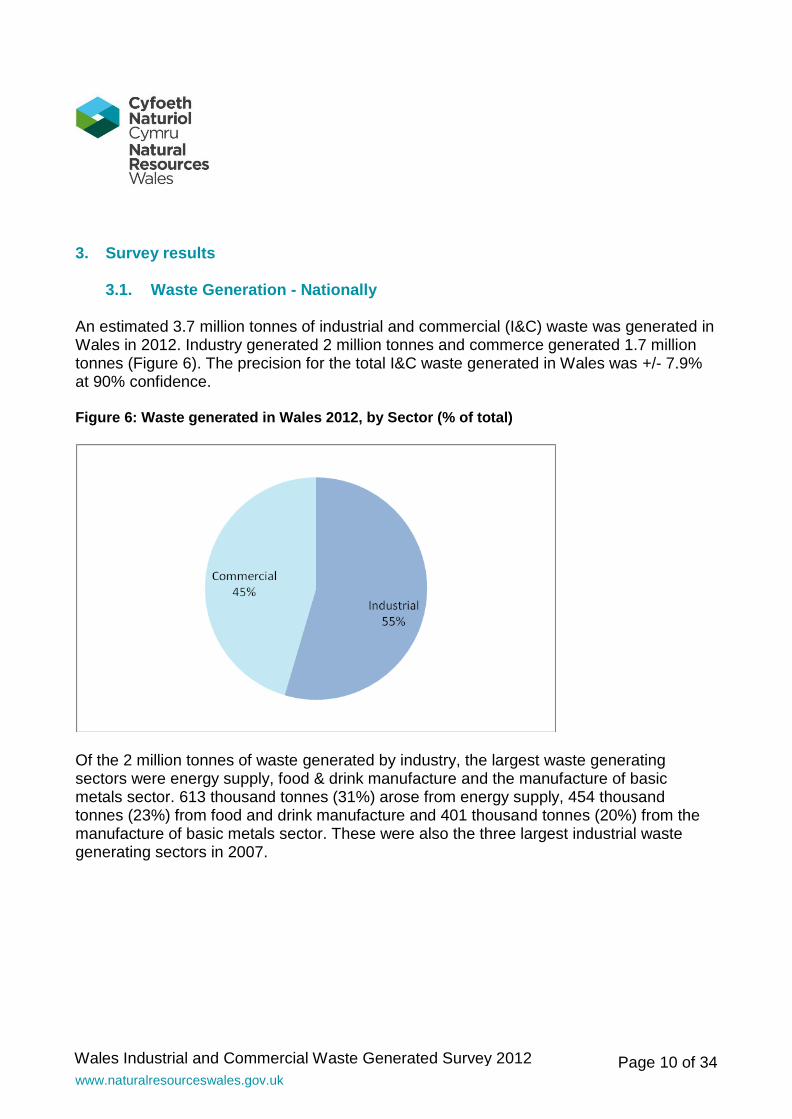
3.1. Waste Generation - Nationally An estimated 3.7 million tonnes of industrial and commercial (I&C) waste was generated in Wales in 2012. Industry generated 2 million tonnes and commerce generated 1.7 million tonnes (Figure 6). The precision for the total I&C waste generated in Wales was +/- 7.9% at 90% confidence. Figure 6: Waste generated in Wales 2012, by Sector (% of total)
Of the 2 million tonnes of waste generated by industry, the largest waste generating sectors were energy supply, food & drink manufacture and the manufacture of basic metals sector. 613 thousand tonnes (31%) arose from energy supply, 454 thousand tonnes (23%) from food and drink manufacture and 401 thousand tonnes (20%) from the manufacture of basic metals sector. These were also the three largest industrial waste generating sectors in 2007.
Page 11 of 34 www.naturalresourceswales.gov.uk
Wales Industrial and Commercial Waste Generated Survey 2012
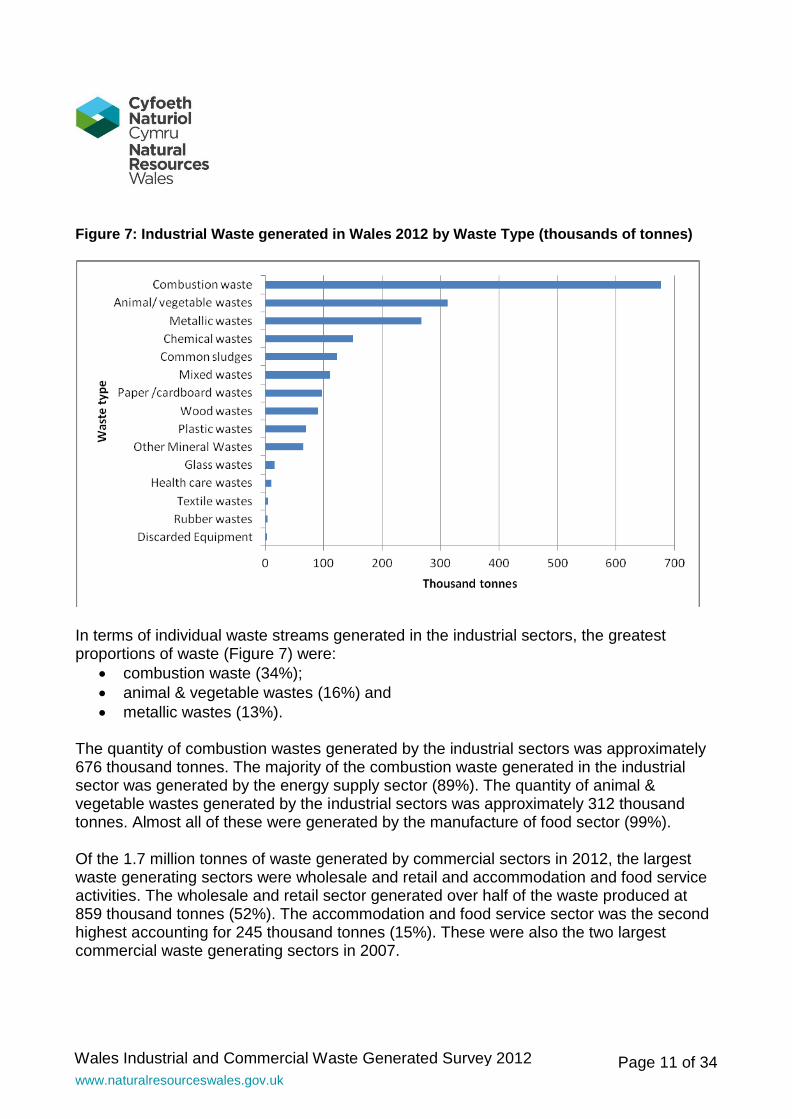
Figure 7: Industrial Waste generated in Wales 2012 by Waste Type (thousands of tonnes)
In terms of individual waste streams generated in the industrial sectors, the greatest proportions of waste (Figure 7) were:
combustion waste (34%);
animal & vegetable wastes (16%) and
metallic wastes (13%). The quantity of combustion wastes generated by the industrial sectors was approximately 676 thousand tonnes. The majority of the combustion waste generated in the industrial sector was generated by the energy supply sector (89%). The quantity of animal & vegetable wastes generated by the industrial sectors was approximately 312 thousand tonnes. Almost all of these were generated by the manufacture of food sector (99%). Of the 1.7 million tonnes of waste generated by commercial sectors in 2012, the largest waste generating sectors were wholesale and retail and accommodation and food service activities. The wholesale and retail sector generated over half of the waste produced at 859 thousand tonnes (52%). The accommodation and food service sector was the second highest accounting for 245 thousand tonnes (15%). These were also the two largest commercial waste generating sectors in 2007.

Page 12 of 34 www.naturalresourceswales.gov.uk
Wales Industrial and Commercial Waste Generated Survey 2012
Figure 8: Commercial Waste generated in Wales 2012 by waste type (thousands of tonnes)
In terms of waste types generated, the greatest proportions of waste (Figure 8) were:
mixed wastes (42%)
paper and cardboard (32%), and
plastic waste (5%). The quantity of mixed wastes generated by the commercial sector was approximately 702 thousand tonnes. It was further estimated that more than half of the mixed waste generated were mixed residual (54%) with the remaining consisting of mixed dry recyclates (26%), bulky waste (16%) and sorting residues (4%). The quantity of paper and cardboard generated by the commercial sector was approximately 537 thousand tonnes, of which 426 thousand tonnes was estimated to be cardboard (79%), 40 thousand tonnes to be paper (7%) and 71 thousand tonnes to be mixed paper & cardboard (13%). The majority of the paper and cardboard waste generated by the commercial sector was estimated to be packaging waste (91%). The wholesale and retail sector generated 380 thousand tonnes of all commercial paper and cardboard waste (71%).
Page 13 of 34 www.naturalresourceswales.gov.uk
Wales Industrial and Commercial Waste Generated Survey 2012
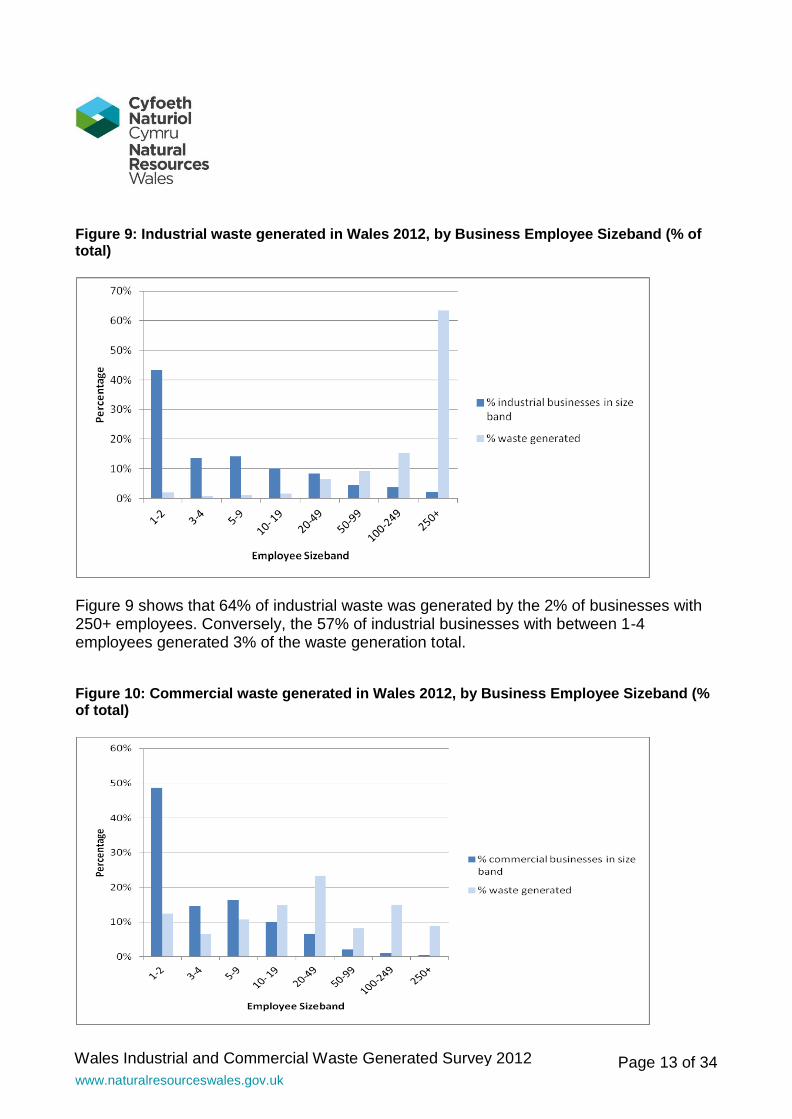
Figure 9: Industrial waste generated in Wales 2012, by Business Employee Sizeband (% of total)
Figure 9 shows that 64% of industrial waste was generated by the 2% of businesses with 250+ employees. Conversely, the 57% of industrial businesses with between 1-4 employees generated 3% of the waste generation total. Figure 10: Commercial waste generated in Wales 2012, by Business Employee Sizeband (% of total)
Page 14 of 34 www.naturalresourceswales.gov.uk
Wales Industrial and Commercial Waste Generated Survey 2012
The pattern is different within the commercial sector as can be seen in Figure 10. The proportion of waste generated across all employee size bands is more evenly spread. Businesses with 1-4 employees generated 19% of the waste and accounted for 64% of all commercial businesses in Wales. The highest proportion of waste (23%) was generated in the 20- 49 employee size band which accounted for 7% of all commercial businesses in Wales.
3.2. Regional Waste Generation Industrial sectors generated the majority of waste in South East Wales (62%) and North Wales (53%). In contrast, the majority of waste generated in South West Wales was from the commercial sectors (63%). Table 2 provides estimates of the waste generated in the three regions in Wales by the industrial and commercial sectors. South East Wales generated the greatest quantity of all waste in both sectors, and accounted for approximately 55% of all industrial and commercial waste generated in Wales. The remaining waste generated was split approximately 25% in North Wales and 20% in South West Wales. Table 2: Regional Waste generated
Sector Quantity of waste produced per region 2012 (thousand tonnes per annum and % of waste stream)
South East Wales
South West Wales
North Wales All Wales
Industrial Thousand tonnes
1,242 278 481 2,001
% 62% 14% 24% 100%
Commercial Thousand tonnes
757 474 434 1,665
% 45% 28% 26% 100%
Total Thousand tonnes
1,999 752 915 3,666
% 55% 20% 25% 100%
Page 15 of 34 www.naturalresourceswales.gov.uk
Wales Industrial and Commercial Waste Generated Survey 2012
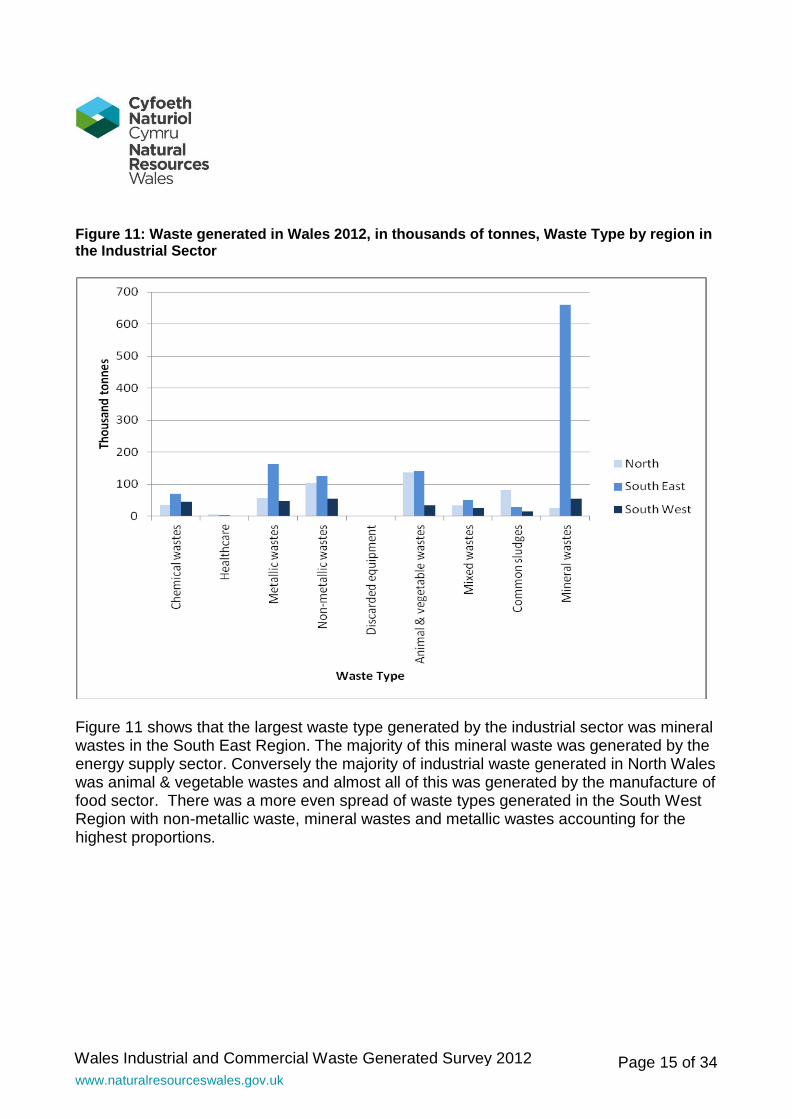
Figure 11: Waste generated in Wales 2012, in thousands of tonnes, Waste Type by region in the Industrial Sector
Figure 11 shows that the largest waste type generated by the industrial sector was mineral wastes in the South East Region. The majority of this mineral waste was generated by the energy supply sector. Conversely the majority of industrial waste generated in North Wales was animal & vegetable wastes and almost all of this was generated by the manufacture of food sector. There was a more even spread of waste types generated in the South West Region with non-metallic waste, mineral wastes and metallic wastes accounting for the highest proportions.
Page 16 of 34 www.naturalresourceswales.gov.uk
Wales Industrial and Commercial Waste Generated Survey 2012
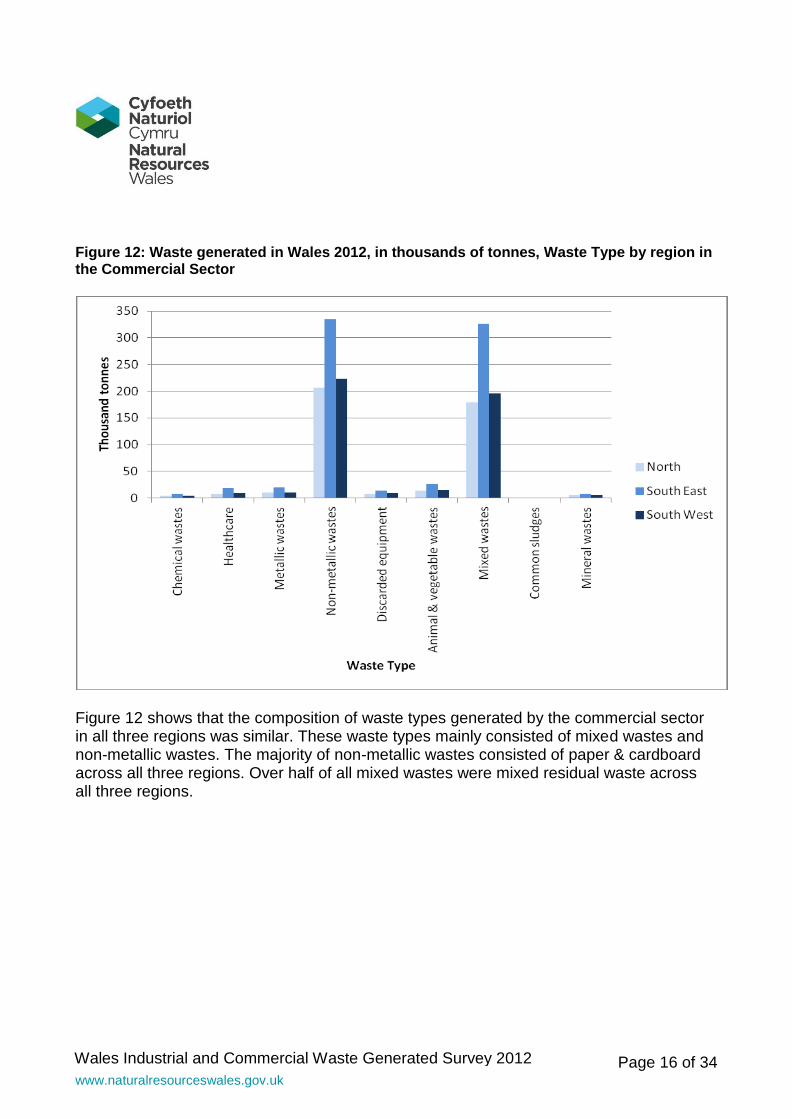
Figure 12: Waste generated in Wales 2012, in thousands of tonnes, Waste Type by region in the Commercial Sector
Figure 12 shows that the composition of waste types generated by the commercial sector in all three regions was similar. These waste types mainly consisted of mixed wastes and non-metallic wastes. The majority of non-metallic wastes consisted of paper & cardboard across all three regions. Over half of all mixed wastes were mixed residual waste across all three regions.

Page 17 of 34 www.naturalresourceswales.gov.uk
Wales Industrial and Commercial Waste Generated Survey 2012
3.3. Waste Management
3.3.1. Waste Management- Nationally
The rate of preparation for re-use, recycling and composting for industrial waste was 50% in 2012 (approximately 1 million tonnes). Almost half of these tonnages consisted of metallic wastes (259 thousand tonnes) and combustion wastes (212 thousand tonnes). Table 3: Waste Management Method in Industrial Sector (proportion of total waste of sector)
Industrial Sector
Preparation for Re-use,
Recycling and Composting Landfill
Recovery (Land recovery &
incineration with energy recovery)
Other*
Water collection & treatment 90% 9% <1% <1%
Basic metals 89% 6% 1% 4%
Computer equipment 75% 11% 2% 11%
Textiles 69% 27% <1% 3%
Paper products 66% 5% 27% 2%
Furniture 66% 13% 4% 17%
Non-metallic mineral products 53% 24% <1% 22%
Wood products 53% 12% 3% 32%
Food products 47% 3% 31% 19%
Chemical products 29% 13% 24% 34%
Energy Supply 23% 71% 5% 1%
Coke products 19% 4% 0% 77%
Total Industrial 50% 27% 12% 11%
*‘Other’ includes incineration without energy recovery, treatment, transfer, don’t know and other
Within industry, preparation for re-use, recycling and composting rates were higher than landfill rates for the majority of sectors as shown in Table 3. The water collection & treatment sector had the highest preparation for re-use, recycling and composting rate (90%) followed by the manufacturing of basic metals sector (89%) and manufacture of computer and equipment (75%) sectors.
Page 18 of 34 www.naturalresourceswales.gov.uk
Wales Industrial and Commercial Waste Generated Survey 2012
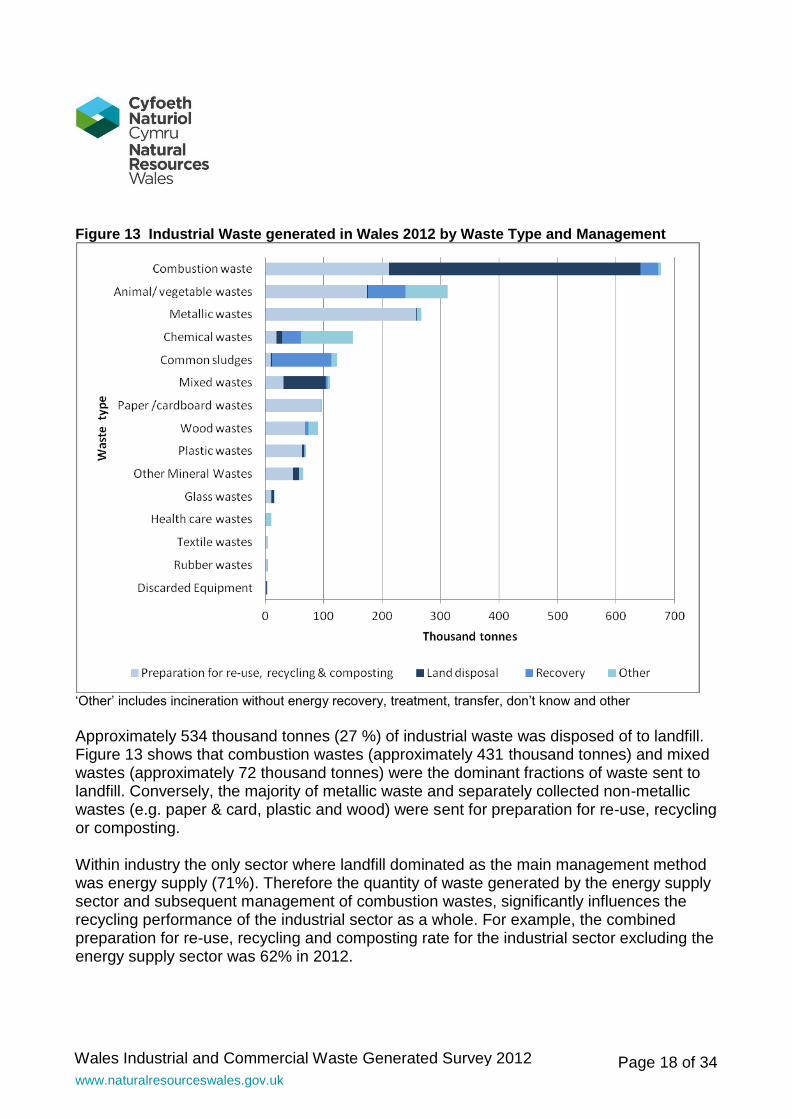
Figure 13 Industrial Waste generated in Wales 2012 by Waste Type and Management
‘Other’ includes incineration without energy recovery, treatment, transfer, don’t know and other
Approximately 534 thousand tonnes (27 %) of industrial waste was disposed of to landfill. Figure 13 shows that combustion wastes (approximately 431 thousand tonnes) and mixed wastes (approximately 72 thousand tonnes) were the dominant fractions of waste sent to landfill. Conversely, the majority of metallic waste and separately collected non-metallic wastes (e.g. paper & card, plastic and wood) were sent for preparation for re-use, recycling or composting. Within industry the only sector where landfill dominated as the main management method was energy supply (71%). Therefore the quantity of waste generated by the energy supply sector and subsequent management of combustion wastes, significantly influences the recycling performance of the industrial sector as a whole. For example, the combined preparation for re-use, recycling and composting rate for the industrial sector excluding the energy supply sector was 62% in 2012.
Page 19 of 34 www.naturalresourceswales.gov.uk
Wales Industrial and Commercial Waste Generated Survey 2012
Table 4: Waste Management Method in Commercial Sector (proportion of total waste of sector)
Commercial Sector
Preparation for Re-use,
Recycling and Composting Landfill
Recovery (Land recovery & incineration
with energy recovery)
Other*
Wholesale and retail 80% 16% 2% 2%
Administrative & support 74% 23% 0% 3%
Transportation & storage 71% 22% <1% 6%
Other services 66% 32% <1% 2%
Information & communication 62% 22% <1% 15%
Financial & insurance 60% 35% 0% 5%
Professional, scientific & technical 59% 30% 1% 10%
Arts, entertainment & recreation 57% 38% <1% 5%
Accommodation & food 56% 36% <1% 8%
Education 56% 43% <1% 1%
Public administration & defence 55% 34% <1% 11%
Real estate 37% 50% 0% 13%
Human health & social work 30% 48% 5% 17%
Total Commercial 68% 26% 1% 5% *‘Other’ includes incineration without energy recovery, treatment, transfer, don’t know and other
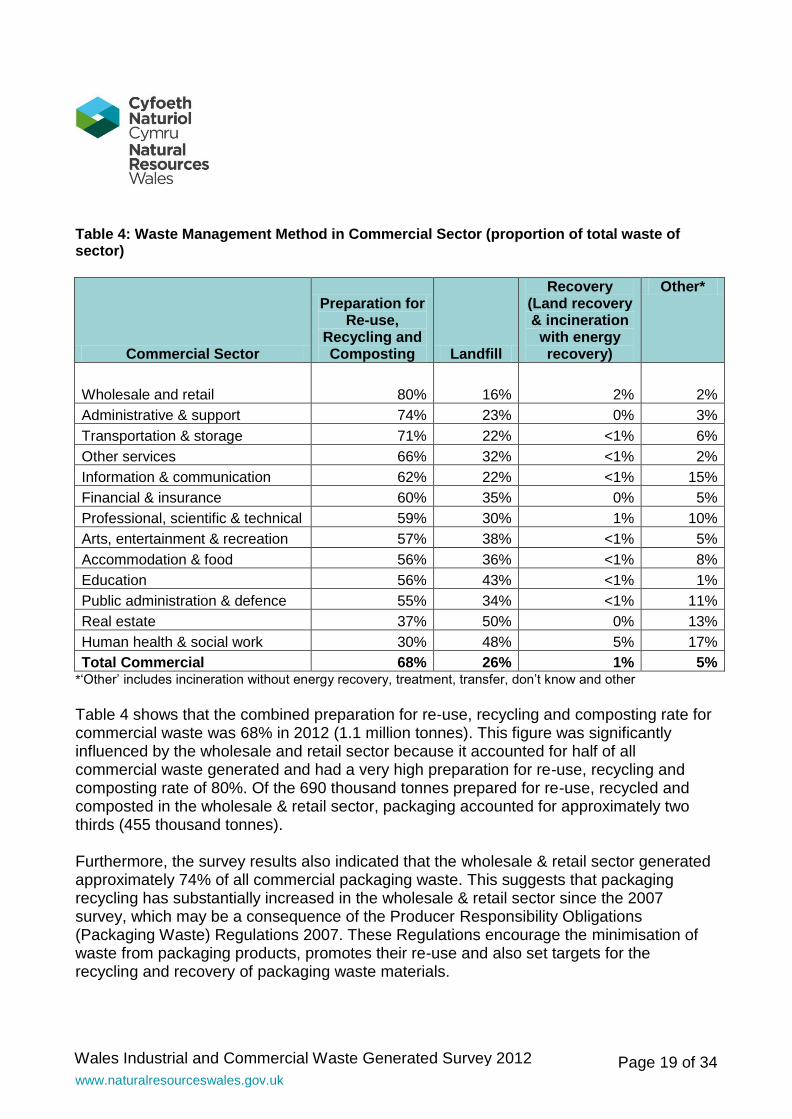
Table 4 shows that the combined preparation for re-use, recycling and composting rate for commercial waste was 68% in 2012 (1.1 million tonnes). This figure was significantly influenced by the wholesale and retail sector because it accounted for half of all commercial waste generated and had a very high preparation for re-use, recycling and composting rate of 80%. Of the 690 thousand tonnes prepared for re-use, recycled and composted in the wholesale & retail sector, packaging accounted for approximately two thirds (455 thousand tonnes). Furthermore, the survey results also indicated that the wholesale & retail sector generated approximately 74% of all commercial packaging waste. This suggests that packaging recycling has substantially increased in the wholesale & retail sector since the 2007 survey, which may be a consequence of the Producer Responsibility Obligations (Packaging Waste) Regulations 2007. These Regulations encourage the minimisation of waste from packaging products, promotes their re-use and also set targets for the recycling and recovery of packaging waste materials.
Page 20 of 34 www.naturalresourceswales.gov.uk
Wales Industrial and Commercial Waste Generated Survey 2012
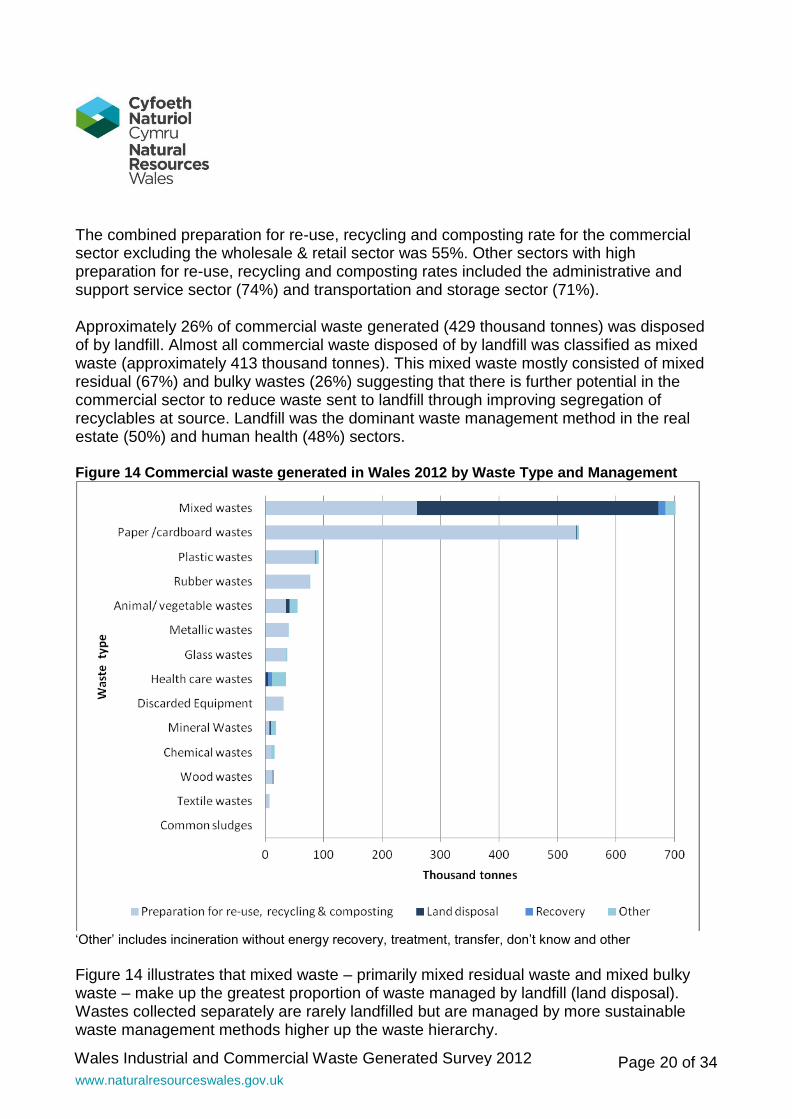
The combined preparation for re-use, recycling and composting rate for the commercial sector excluding the wholesale & retail sector was 55%. Other sectors with high preparation for re-use, recycling and composting rates included the administrative and support service sector (74%) and transportation and storage sector (71%). Approximately 26% of commercial waste generated (429 thousand tonnes) was disposed of by landfill. Almost all commercial waste disposed of by landfill was classified as mixed waste (approximately 413 thousand tonnes). This mixed waste mostly consisted of mixed residual (67%) and bulky wastes (26%) suggesting that there is further potential in the commercial sector to reduce waste sent to landfill through improving segregation of recyclables at source. Landfill was the dominant waste management method in the real estate (50%) and human health (48%) sectors. Figure 14 Commercial waste generated in Wales 2012 by Waste Type and Management
‘Other’ includes incineration without energy recovery, treatment, transfer, don’t know and other
Figure 14 illustrates that mixed waste – primarily mixed residual waste and mixed bulky waste – make up the greatest proportion of waste managed by landfill (land disposal). Wastes collected separately are rarely landfilled but are managed by more sustainable waste management methods higher up the waste hierarchy.
Page 21 of 34 www.naturalresourceswales.gov.uk
Wales Industrial and Commercial Waste Generated Survey 2012
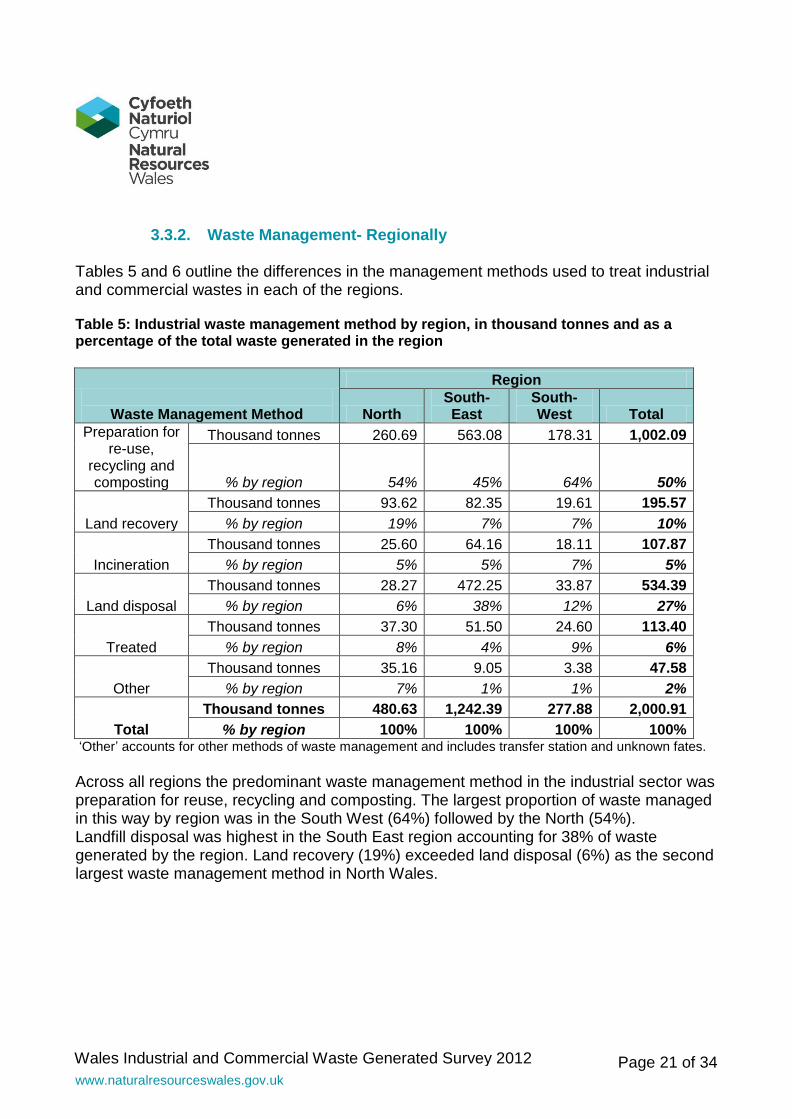
3.3.2. Waste Management- Regionally Tables 5 and 6 outline the differences in the management methods used to treat industrial and commercial wastes in each of the regions. Table 5: Industrial waste management method by region, in thousand tonnes and as a percentage of the total waste generated in the region
Waste Management Method
Region
North South-East
South-West Total
Preparation for re-use,
recycling and composting
Thousand tonnes 260.69 563.08 178.31 1,002.09
% by region 54% 45% 64% 50%
Land recovery
Thousand tonnes 93.62 82.35 19.61 195.57
% by region 19% 7% 7% 10%
Incineration
Thousand tonnes 25.60 64.16 18.11 107.87
% by region 5% 5% 7% 5%
Land disposal
Thousand tonnes 28.27 472.25 33.87 534.39
% by region 6% 38% 12% 27%
Treated
Thousand tonnes 37.30 51.50 24.60 113.40
% by region 8% 4% 9% 6%
Other
Thousand tonnes 35.16 9.05 3.38 47.58
% by region 7% 1% 1% 2%
Total
Thousand tonnes 480.63 1,242.39 277.88 2,000.91
% by region 100% 100% 100% 100% ‘Other’ accounts for other methods of waste management and includes transfer station and unknown fates.
Across all regions the predominant waste management method in the industrial sector was preparation for reuse, recycling and composting. The largest proportion of waste managed in this way by region was in the South West (64%) followed by the North (54%). Landfill disposal was highest in the South East region accounting for 38% of waste generated by the region. Land recovery (19%) exceeded land disposal (6%) as the second largest waste management method in North Wales.
Page 22 of 34 www.naturalresourceswales.gov.uk
Wales Industrial and Commercial Waste Generated Survey 2012
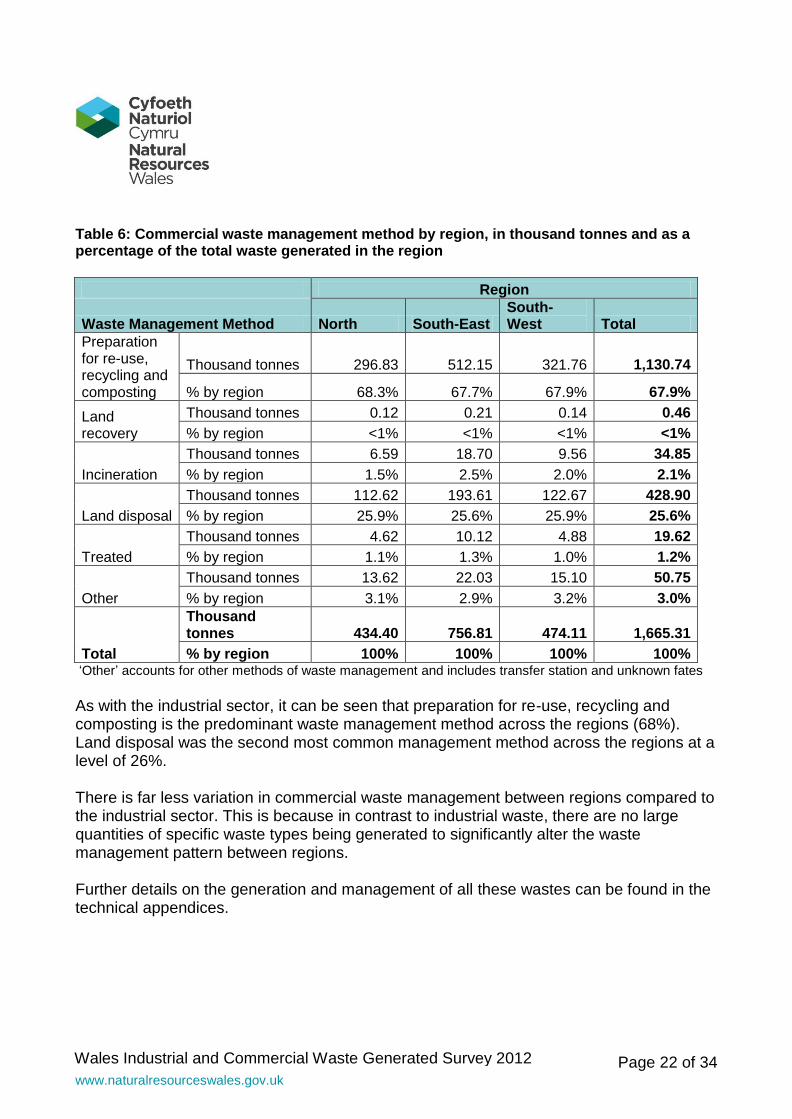
Table 6: Commercial waste management method by region, in thousand tonnes and as a percentage of the total waste generated in the region
Region
Waste Management Method North South-East South-West Total
Preparation for re-use, recycling and composting
Thousand tonnes 296.83 512.15 321.76 1,130.74
% by region 68.3% 67.7% 67.9% 67.9%
Land recovery
Thousand tonnes 0.12 0.21 0.14 0.46
% by region <1% <1% <1% <1%
Incineration
Thousand tonnes 6.59 18.70 9.56 34.85
% by region 1.5% 2.5% 2.0% 2.1%
Land disposal
Thousand tonnes 112.62 193.61 122.67 428.90
% by region 25.9% 25.6% 25.9% 25.6%
Treated
Thousand tonnes 4.62 10.12 4.88 19.62
% by region 1.1% 1.3% 1.0% 1.2%
Other
Thousand tonnes 13.62 22.03 15.10 50.75
% by region 3.1% 2.9% 3.2% 3.0%
Total
Thousand tonnes 434.40 756.81 474.11 1,665.31
% by region 100% 100% 100% 100% ‘Other’ accounts for other methods of waste management and includes transfer station and unknown fates As with the industrial sector, it can be seen that preparation for re-use, recycling and composting is the predominant waste management method across the regions (68%). Land disposal was the second most common management method across the regions at a level of 26%. There is far less variation in commercial waste management between regions compared to the industrial sector. This is because in contrast to industrial waste, there are no large quantities of specific waste types being generated to significantly alter the waste management pattern between regions. Further details on the generation and management of all these wastes can be found in the technical appendices.
Page 23 of 34 www.naturalresourceswales.gov.uk
Wales Industrial and Commercial Waste Generated Survey 2012
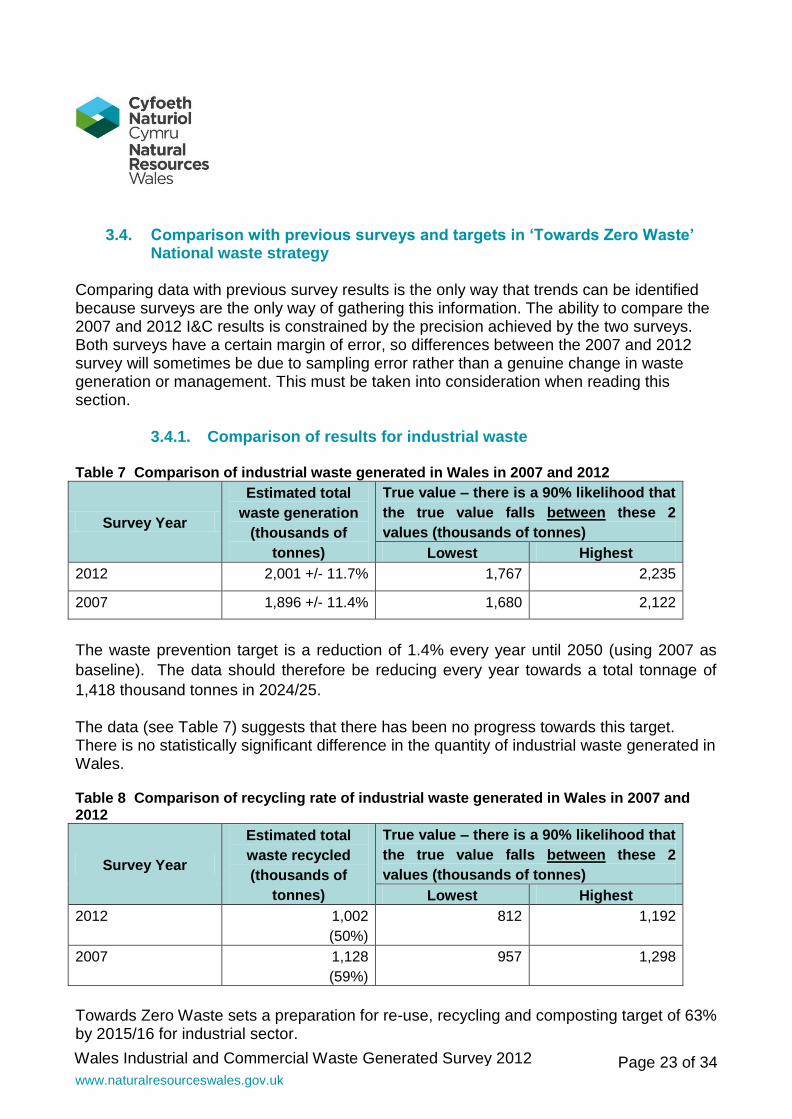
3.4. Comparison with previous surveys and targets in ‘Towards Zero Waste’ National waste strategy
Comparing data with previous survey results is the only way that trends can be identified because surveys are the only way of gathering this information. The ability to compare the 2007 and 2012 I&C results is constrained by the precision achieved by the two surveys. Both surveys have a certain margin of error, so differences between the 2007 and 2012 survey will sometimes be due to sampling error rather than a genuine change in waste generation or management. This must be taken into consideration when reading this section.
3.4.1. Comparison of results for industrial waste Table 7 Comparison of industrial waste generated in Wales in 2007 and 2012
Survey Year
Estimated total
waste generation
(thousands of
tonnes)
True value – there is a 90% likelihood that
the true value falls between these 2
values (thousands of tonnes)
Lowest Highest
2012 2,001 +/- 11.7% 1,767 2,235
2007 1,896 +/- 11.4% 1,680 2,122
The waste prevention target is a reduction of 1.4% every year until 2050 (using 2007 as
baseline). The data should therefore be reducing every year towards a total tonnage of
1,418 thousand tonnes in 2024/25. The data (see Table 7) suggests that there has been no progress towards this target. There is no statistically significant difference in the quantity of industrial waste generated in Wales. Table 8 Comparison of recycling rate of industrial waste generated in Wales in 2007 and 2012
Survey Year
Estimated total
waste recycled
(thousands of
tonnes)
True value – there is a 90% likelihood that
the true value falls between these 2
values (thousands of tonnes)
Lowest Highest
2012 1,002
(50%)
812 1,192
2007 1,128
(59%)
957 1,298
Towards Zero Waste sets a preparation for re-use, recycling and composting target of 63% by 2015/16 for industrial sector.
Page 24 of 34 www.naturalresourceswales.gov.uk
Wales Industrial and Commercial Waste Generated Survey 2012
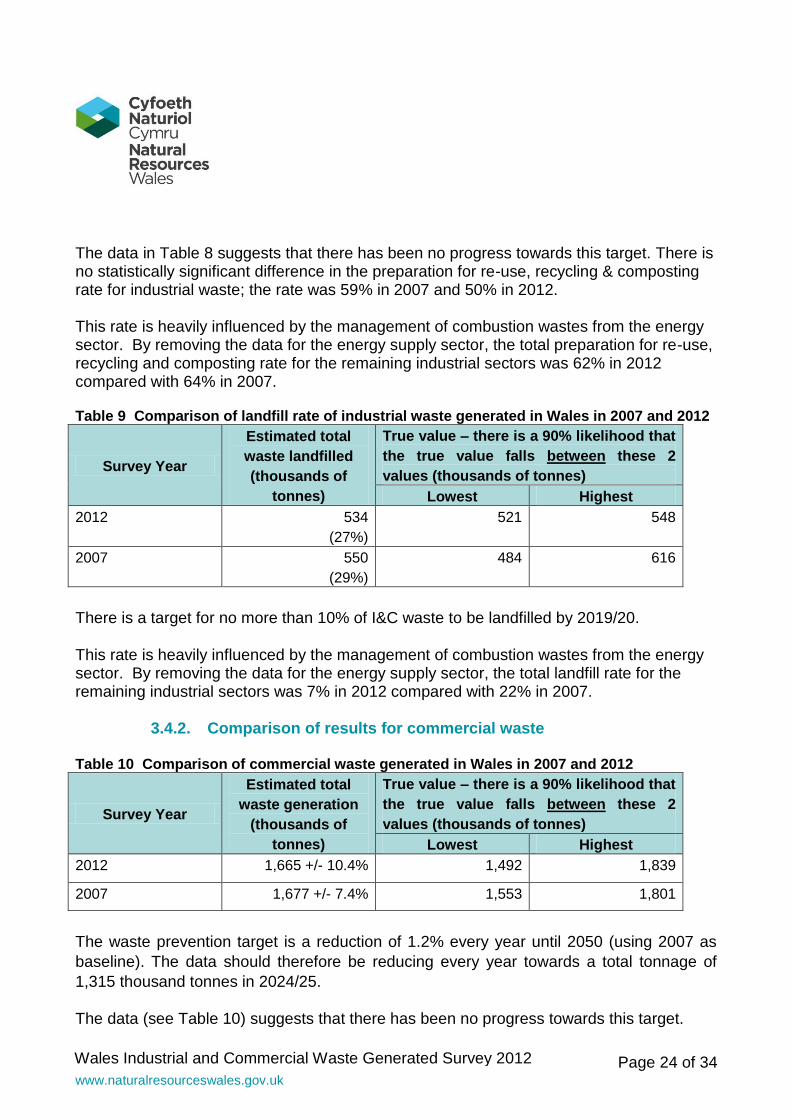
The data in Table 8 suggests that there has been no progress towards this target. There is no statistically significant difference in the preparation for re-use, recycling & composting rate for industrial waste; the rate was 59% in 2007 and 50% in 2012. This rate is heavily influenced by the management of combustion wastes from the energy sector. By removing the data for the energy supply sector, the total preparation for re-use, recycling and composting rate for the remaining industrial sectors was 62% in 2012 compared with 64% in 2007. Table 9 Comparison of landfill rate of industrial waste generated in Wales in 2007 and 2012
Survey Year
Estimated total
waste landfilled
(thousands of
tonnes)
True value – there is a 90% likelihood that
the true value falls between these 2
values (thousands of tonnes)
Lowest Highest
2012 534
(27%)
521 548
2007 550
(29%)
484 616
There is a target for no more than 10% of I&C waste to be landfilled by 2019/20. This rate is heavily influenced by the management of combustion wastes from the energy sector. By removing the data for the energy supply sector, the total landfill rate for the remaining industrial sectors was 7% in 2012 compared with 22% in 2007.
3.4.2. Comparison of results for commercial waste Table 10 Comparison of commercial waste generated in Wales in 2007 and 2012
Survey Year
Estimated total
waste generation
(thousands of
tonnes)
True value – there is a 90% likelihood that
the true value falls between these 2
values (thousands of tonnes)
Lowest Highest
2012 1,665 +/- 10.4% 1,492 1,839
2007 1,677 +/- 7.4% 1,553 1,801
The waste prevention target is a reduction of 1.2% every year until 2050 (using 2007 as
baseline). The data should therefore be reducing every year towards a total tonnage of
1,315 thousand tonnes in 2024/25. The data (see Table 10) suggests that there has been no progress towards this target.
Page 25 of 34 www.naturalresourceswales.gov.uk
Wales Industrial and Commercial Waste Generated Survey 2012
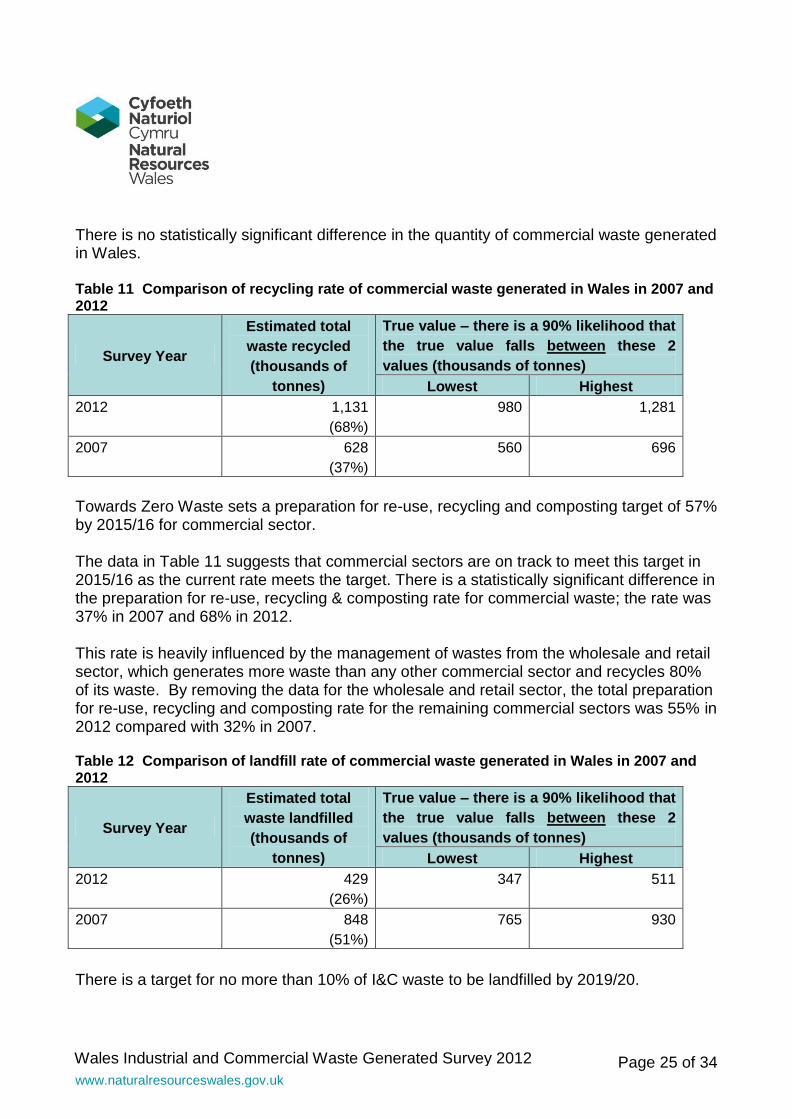
There is no statistically significant difference in the quantity of commercial waste generated in Wales. Table 11 Comparison of recycling rate of commercial waste generated in Wales in 2007 and 2012
Survey Year
Estimated total
waste recycled
(thousands of
tonnes)
True value – there is a 90% likelihood that
the true value falls between these 2
values (thousands of tonnes)
Lowest Highest
2012 1,131
(68%)
980 1,281
2007 628
(37%)
560 696
Towards Zero Waste sets a preparation for re-use, recycling and composting target of 57% by 2015/16 for commercial sector. The data in Table 11 suggests that commercial sectors are on track to meet this target in 2015/16 as the current rate meets the target. There is a statistically significant difference in the preparation for re-use, recycling & composting rate for commercial waste; the rate was 37% in 2007 and 68% in 2012. This rate is heavily influenced by the management of wastes from the wholesale and retail sector, which generates more waste than any other commercial sector and recycles 80% of its waste. By removing the data for the wholesale and retail sector, the total preparation for re-use, recycling and composting rate for the remaining commercial sectors was 55% in 2012 compared with 32% in 2007. Table 12 Comparison of landfill rate of commercial waste generated in Wales in 2007 and 2012
Survey Year
Estimated total
waste landfilled
(thousands of
tonnes)
True value – there is a 90% likelihood that
the true value falls between these 2
values (thousands of tonnes)
Lowest Highest
2012 429
(26%)
347 511
2007 848
(51%)
765 930
There is a target for no more than 10% of I&C waste to be landfilled by 2019/20.
Page 26 of 34 www.naturalresourceswales.gov.uk
Wales Industrial and Commercial Waste Generated Survey 2012
This rate is heavily influenced by the management of wastes from the wholesale and retail sector. By removing the data for this sector, the total landfill rate for the remaining commercial sectors was 36% in 2012 compared with 56% in 2007.
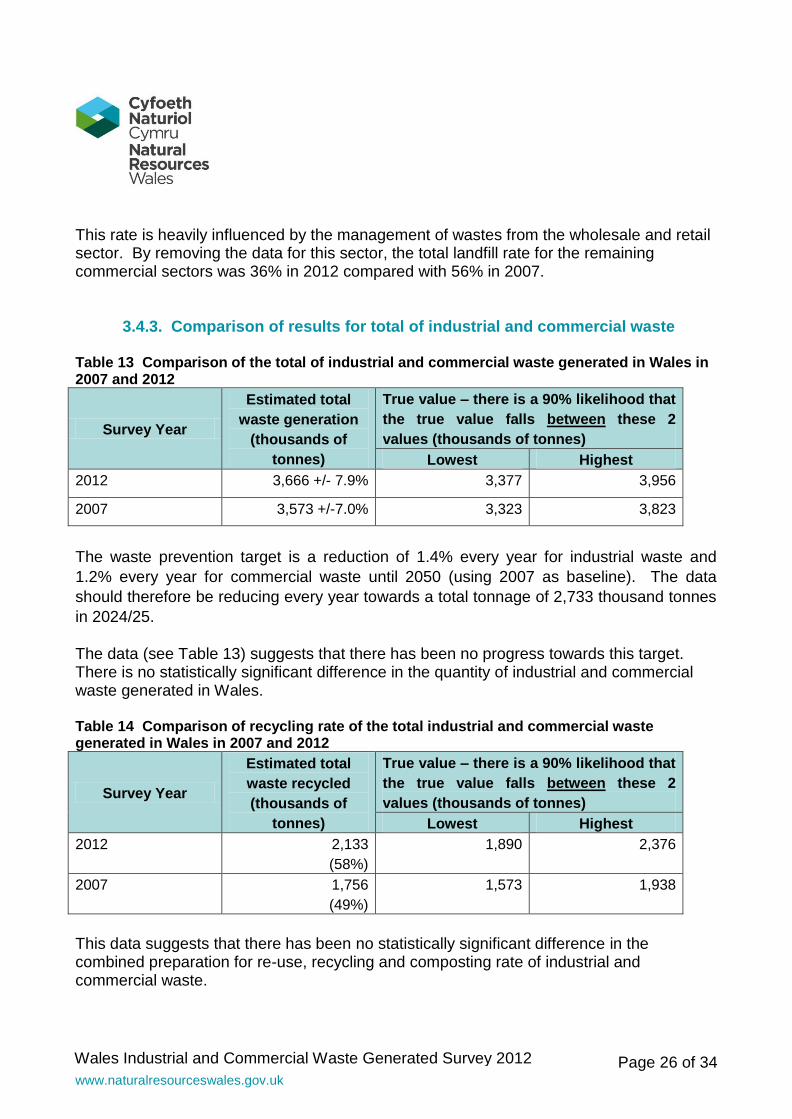
3.4.3. Comparison of results for total of industrial and commercial waste Table 13 Comparison of the total of industrial and commercial waste generated in Wales in 2007 and 2012
Survey Year
Estimated total
waste generation
(thousands of
tonnes)
True value – there is a 90% likelihood that
the true value falls between these 2
values (thousands of tonnes)
Lowest Highest
2012 3,666 +/- 7.9% 3,377 3,956
2007 3,573 +/-7.0% 3,323 3,823
The waste prevention target is a reduction of 1.4% every year for industrial waste and
1.2% every year for commercial waste until 2050 (using 2007 as baseline). The data
should therefore be reducing every year towards a total tonnage of 2,733 thousand tonnes
in 2024/25. The data (see Table 13) suggests that there has been no progress towards this target. There is no statistically significant difference in the quantity of industrial and commercial waste generated in Wales. Table 14 Comparison of recycling rate of the total industrial and commercial waste generated in Wales in 2007 and 2012
Survey Year
Estimated total
waste recycled
(thousands of
tonnes)
True value – there is a 90% likelihood that
the true value falls between these 2
values (thousands of tonnes)
Lowest Highest
2012 2,133
(58%)
1,890 2,376
2007 1,756
(49%)
1,573 1,938
This data suggests that there has been no statistically significant difference in the combined preparation for re-use, recycling and composting rate of industrial and commercial waste.
Page 27 of 34 www.naturalresourceswales.gov.uk
Wales Industrial and Commercial Waste Generated Survey 2012
Table 15 Comparison of landfill rate of the total industrial and commercial waste generated in Wales in 2007 and 2012
Survey Year
Estimated total
waste landfilled
(thousands of
tonnes)
True value – there is a 90% likelihood that
the true value falls between these 2
values (thousands of tonnes)
Lowest Highest
2012 963
(26%)
877 1,050
2007 1,398
(39%)
1,293 1,503
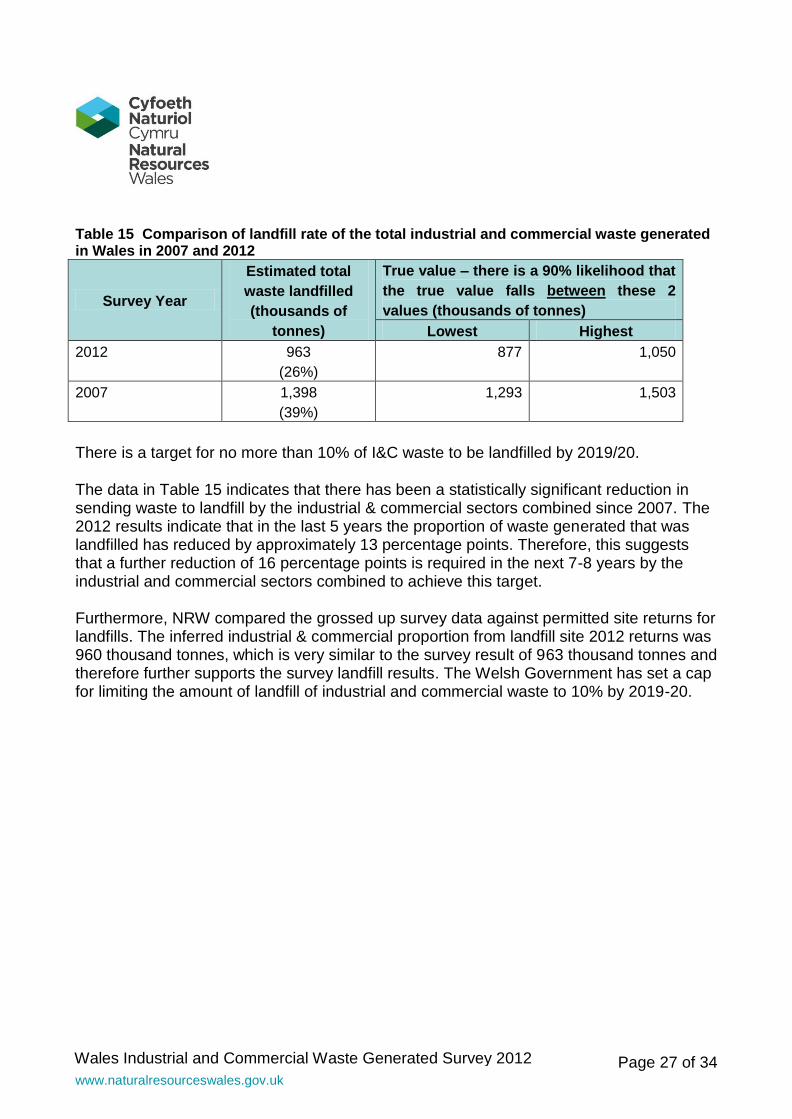
There is a target for no more than 10% of I&C waste to be landfilled by 2019/20. The data in Table 15 indicates that there has been a statistically significant reduction in sending waste to landfill by the industrial & commercial sectors combined since 2007. The 2012 results indicate that in the last 5 years the proportion of waste generated that was landfilled has reduced by approximately 13 percentage points. Therefore, this suggests that a further reduction of 16 percentage points is required in the next 7-8 years by the industrial and commercial sectors combined to achieve this target. Furthermore, NRW compared the grossed up survey data against permitted site returns for landfills. The inferred industrial & commercial proportion from landfill site 2012 returns was 960 thousand tonnes, which is very similar to the survey result of 963 thousand tonnes and therefore further supports the survey landfill results. The Welsh Government has set a cap for limiting the amount of landfill of industrial and commercial waste to 10% by 2019-20.
Page 28 of 34 www.naturalresourceswales.gov.uk
Wales Industrial and Commercial Waste Generated Survey 2012
3.5. Hazardous Waste
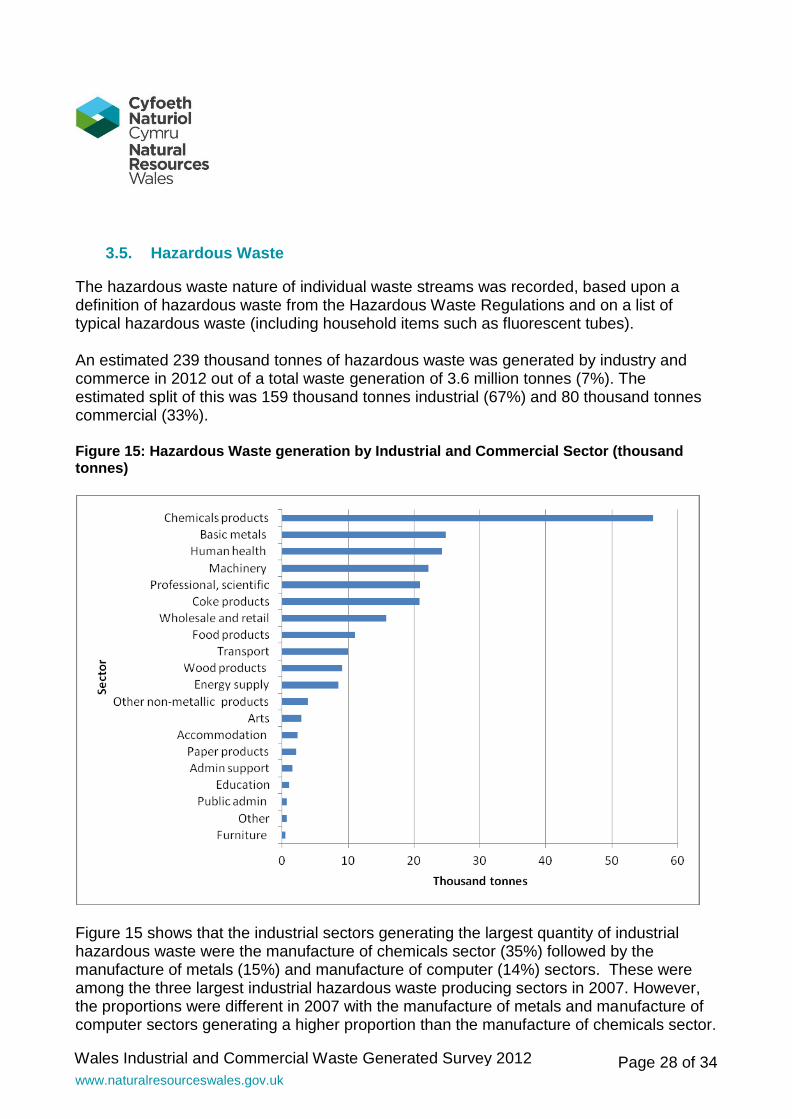
The hazardous waste nature of individual waste streams was recorded, based upon a definition of hazardous waste from the Hazardous Waste Regulations and on a list of typical hazardous waste (including household items such as fluorescent tubes). An estimated 239 thousand tonnes of hazardous waste was generated by industry and commerce in 2012 out of a total waste generation of 3.6 million tonnes (7%). The estimated split of this was 159 thousand tonnes industrial (67%) and 80 thousand tonnes commercial (33%). Figure 15: Hazardous Waste generation by Industrial and Commercial Sector (thousand tonnes)
Figure 15 shows that the industrial sectors generating the largest quantity of industrial hazardous waste were the manufacture of chemicals sector (35%) followed by the manufacture of metals (15%) and manufacture of computer (14%) sectors. These were among the three largest industrial hazardous waste producing sectors in 2007. However, the proportions were different in 2007 with the manufacture of metals and manufacture of computer sectors generating a higher proportion than the manufacture of chemicals sector.
Page 29 of 34 www.naturalresourceswales.gov.uk
Wales Industrial and Commercial Waste Generated Survey 2012
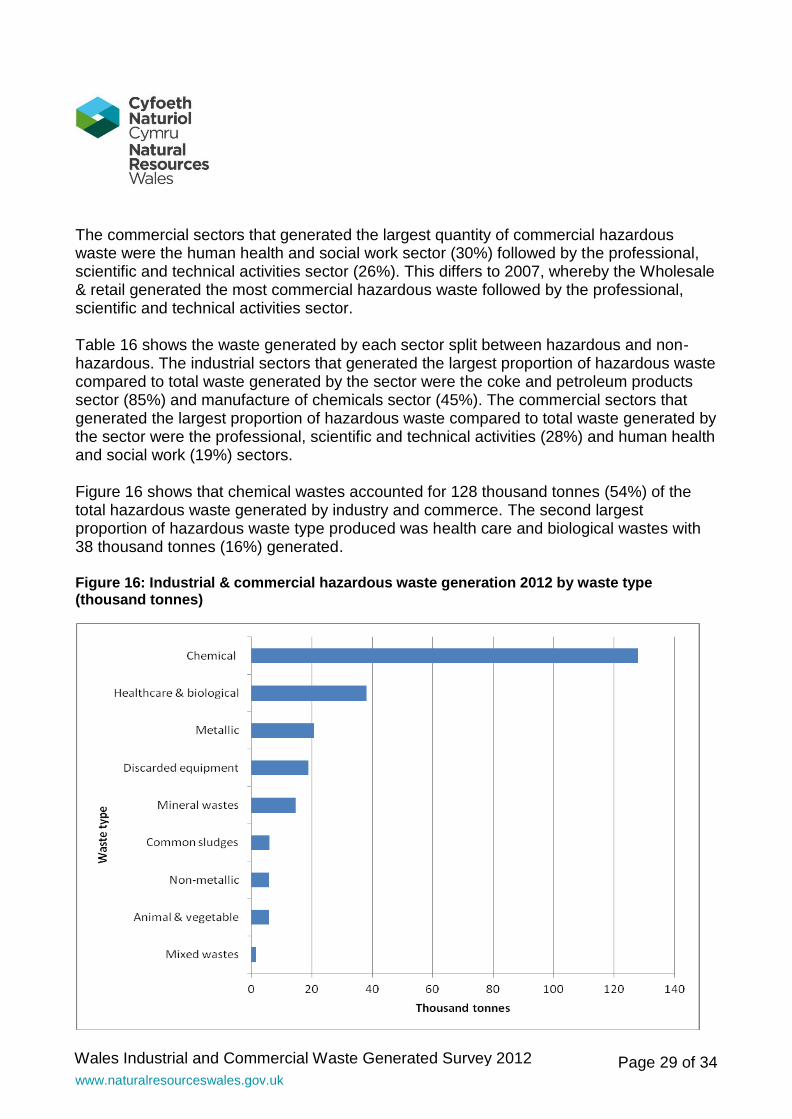
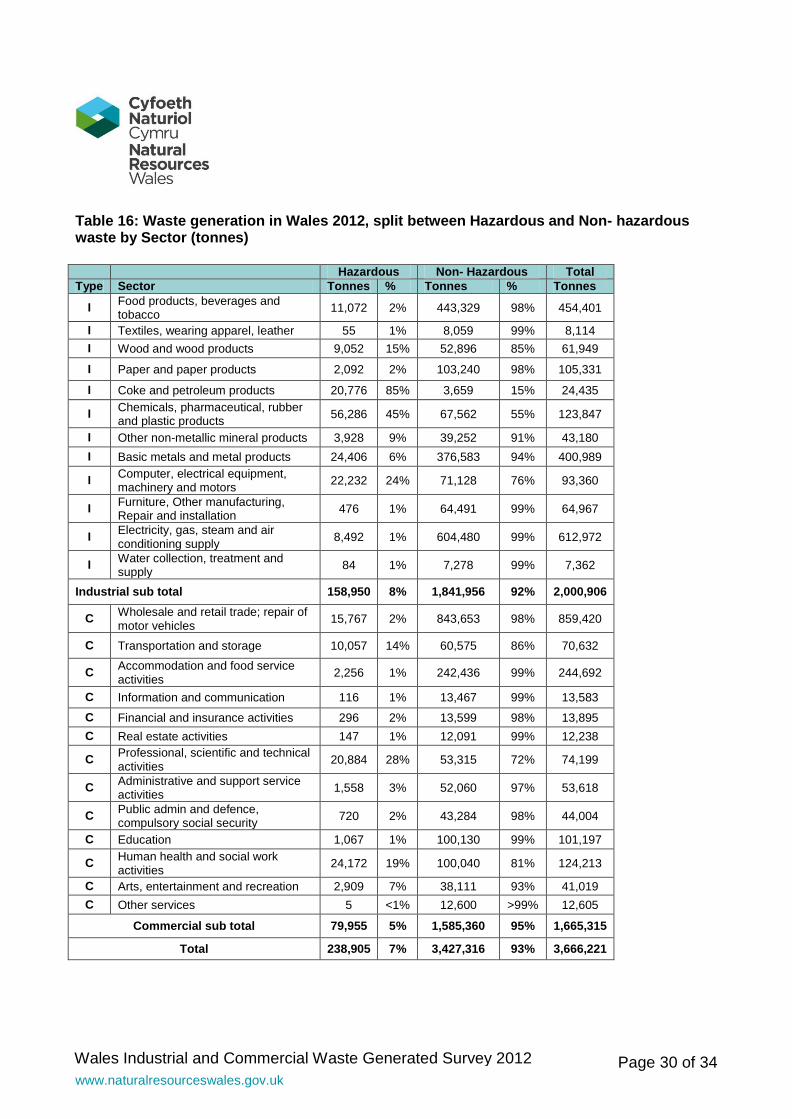
The commercial sectors that generated the largest quantity of commercial hazardous waste were the human health and social work sector (30%) followed by the professional, scientific and technical activities sector (26%). This differs to 2007, whereby the Wholesale & retail generated the most commercial hazardous waste followed by the professional, scientific and technical activities sector. Table 16 shows the waste generated by each sector split between hazardous and non-hazardous. The industrial sectors that generated the largest proportion of hazardous waste compared to total waste generated by the sector were the coke and petroleum products sector (85%) and manufacture of chemicals sector (45%). The commercial sectors that generated the largest proportion of hazardous waste compared to total waste generated by the sector were the professional, scientific and technical activities (28%) and human health and social work (19%) sectors. Figure 16 shows that chemical wastes accounted for 128 thousand tonnes (54%) of the total hazardous waste generated by industry and commerce. The second largest proportion of hazardous waste type produced was health care and biological wastes with 38 thousand tonnes (16%) generated. Figure 16: Industrial & commercial hazardous waste generation 2012 by waste type (thousand tonnes)
Page 30 of 34 www.naturalresourceswales.gov.uk
Wales Industrial and Commercial Waste Generated Survey 2012
Table 16: Waste generation in Wales 2012, split between Hazardous and Non- hazardous waste by Sector (tonnes)
Hazardous Non- Hazardous Total
Type Sector Tonnes % Tonnes % Tonnes
I Food products, beverages and tobacco
11,072 2% 443,329 98% 454,401
I Textiles, wearing apparel, leather 55 1% 8,059 99% 8,114
I Wood and wood products 9,052 15% 52,896 85% 61,949
I Paper and paper products 2,092 2% 103,240 98% 105,331
I Coke and petroleum products 20,776 85% 3,659 15% 24,435
I Chemicals, pharmaceutical, rubber and plastic products
56,286 45% 67,562 55% 123,847
I Other non-metallic mineral products 3,928 9% 39,252 91% 43,180
I Basic metals and metal products 24,406 6% 376,583 94% 400,989
I Computer, electrical equipment, machinery and motors
22,232 24% 71,128 76% 93,360
I Furniture, Other manufacturing, Repair and installation
476 1% 64,491 99% 64,967
I Electricity, gas, steam and air conditioning supply
8,492 1% 604,480 99% 612,972
I Water collection, treatment and supply
84 1% 7,278 99% 7,362
Industrial sub total 158,950 8% 1,841,956 92% 2,000,906
C Wholesale and retail trade; repair of motor vehicles
15,767 2% 843,653 98% 859,420
C Transportation and storage 10,057 14% 60,575 86% 70,632
C Accommodation and food service activities
2,256 1% 242,436 99% 244,692
C Information and communication 116 1% 13,467 99% 13,583
C Financial and insurance activities 296 2% 13,599 98% 13,895
C Real estate activities 147 1% 12,091 99% 12,238
C Professional, scientific and technical activities
20,884 28% 53,315 72% 74,199
C Administrative and support service activities
1,558 3% 52,060 97% 53,618
C Public admin and defence, compulsory social security
720 2% 43,284 98% 44,004
C Education 1,067 1% 100,130 99% 101,197
C Human health and social work activities
24,172 19% 100,040 81% 124,213
C Arts, entertainment and recreation 2,909 7% 38,111 93% 41,019
C Other services 5 <1% 12,600 >99% 12,605
Commercial sub total 79,955 5% 1,585,360 95% 1,665,315
Total 238,905 7% 3,427,316 93% 3,666,221
Page 31 of 34 www.naturalresourceswales.gov.uk
Wales Industrial and Commercial Waste Generated Survey 2012
In terms of hazardous waste generated by the industrial sectors, the majority were chemical wastes (70%) followed by healthcare and biological wastes (6%). Conversely, in terms of hazardous waste generated by the commercial sectors, healthcare and biological wastes accounted for the greatest proportion (35%) followed by chemical wastes (20%) and metallic wastes (17%).
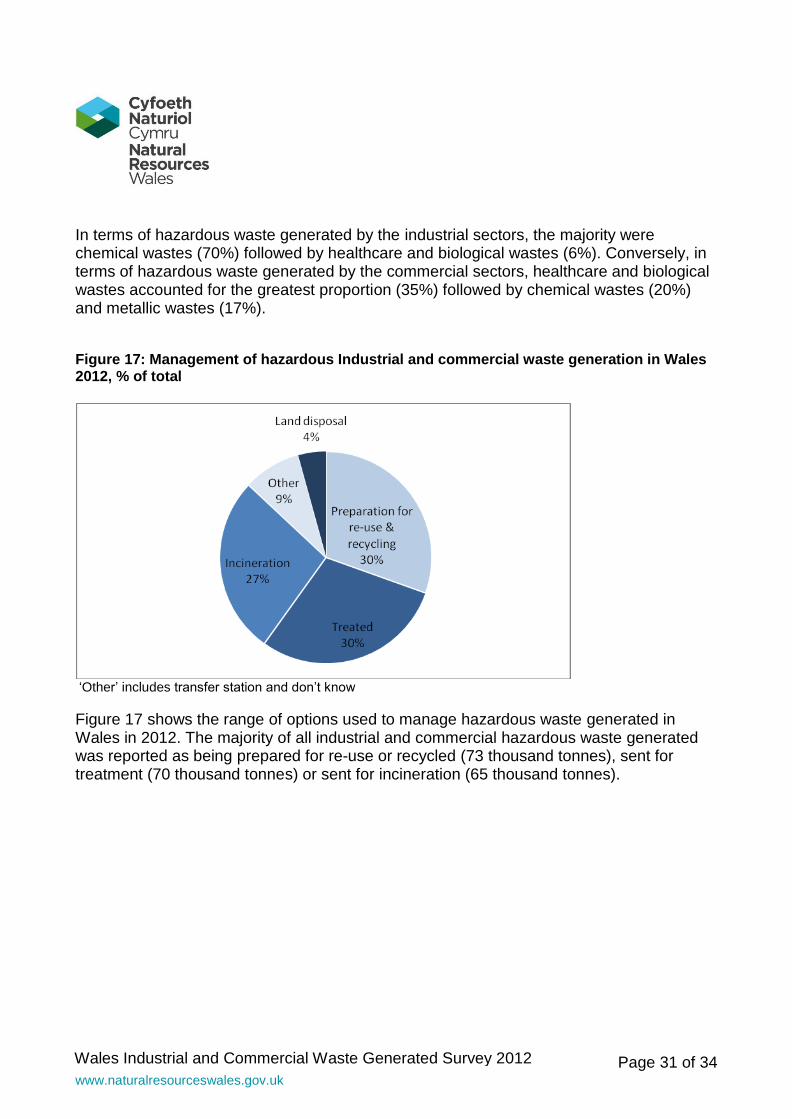
Figure 17: Management of hazardous Industrial and commercial waste generation in Wales 2012, % of total
‘Other’ includes transfer station and don’t know
Figure 17 shows the range of options used to manage hazardous waste generated in Wales in 2012. The majority of all industrial and commercial hazardous waste generated was reported as being prepared for re-use or recycled (73 thousand tonnes), sent for treatment (70 thousand tonnes) or sent for incineration (65 thousand tonnes).
Page 32 of 34 www.naturalresourceswales.gov.uk
Wales Industrial and Commercial Waste Generated Survey 2012
4. Conclusions & Recommendations The survey of the I&C waste generated in Wales 2012 interviewed 1540 businesses, of differing sector and size, in a statistically valid manner. From this data a grossed total of 3.7 million tonnes of waste was estimated as generated in Wales as a whole in 2012. Brief comparison with data from the previous survey in 2007 indicated that there was no statistically significant change in the total industrial and commercial waste generated in Wales when factoring in the precision limits between both surveys. It was also inconclusive as to whether the increase in the quantity of waste prepared for re-use, recycled and composted by the industrial & commercial sectors combined in 2012 was statistically significant compared to 2007 when factoring in the precision limits between both surveys. However, the survey results indicated that the reduction in the quantity of waste sent to landfill by the industrial & commercial sectors combined was statistically significant compared to 2007 and therefore a reduction had occurred.
4.1. Data Confidence
The survey results show that for 79% of the waste quantities recorded, entries were based on business recorded data from written sources, which included invoices (1% of weight recorded), weighbridge notices (11%) and waste transfer notices (5%) or other written sources (61%). Some waste quantities were based on estimates provided by the business being interviewed (20%) where this was not possible. Less than 0.1% of the recorded quantities were reliant on surveyor estimates. Further data checks were completed at the grossing up stage with the surveyors and directly with the businesses concerned. This further checked outlying data when compared to other NRW data sources, data from the previous 2007 survey and generated sensitivity analyses. The inferred industrial & commercial proportion from NRW landfill site 2012 returns was estimated to be 960 thousand tonnes, which is very similar to the survey result of 963 thousand tonnes landfilled. NRW hazardous waste data estimated that 275 thousand tonnes of hazardous waste was generated in Wales in 2012. Combining the hazardous waste generated industrial and commercial survey estimation of 239 thousand tonnes and construction & demolition survey estimation of 38 thousand tonnes (separately reported) produced an estimated total of 276 thousand tonnes from both surveys. This is less than a 1% discrepancy with the NRW hazardous waste dataset and therefore further supports the survey results. The procedures used ensured an effective and consistent data collection process by the surveyors. In addition, the steps to screen and check the collected and grossed data has
Page 33 of 34 www.naturalresourceswales.gov.uk
Wales Industrial and Commercial Waste Generated Survey 2012
ensured the data collected is sufficiently accurate and robust. Details of the precision of the data are published in Appendix 12 of the technical appendices document. However it must also be acknowledged that the results from all surveys are subject to limitations with respect to the quality of estimates produced. Whilst these limitations do not alter the results or the statistical data presented in this report, they should be borne in mind by users of the data.
4.2. Lessons Learned and Recommendations
1. This survey has demonstrated a robust survey delivery and data methodology which can be used for future surveys both within Wales and the rest of the UK. The 2012 results of this survey represent the most reliable and comprehensive set of national data on industrial & commercial waste since 2007. Through investment in such surveys Welsh Government has the benefit of a series of robust waste generation data allowing for comparisons between different years and building a picture of trends and developments over time.
2. The Urban Mines project design and management process, and the software packages on which the survey delivery depended, proved themselves effective by efficiently delivering over 1,500 face to face surveys. In particular, using software to cluster survey visits allowed the efficient use of the surveyors’ time and reduced the carbon footprint of the project.
3. As with previous surveys, this 2012 survey highlighted issues of working with the
ONS VAT and PAYE dataset and the need to reassign business positions in the sample matrix due to changes in either employee number size band or sector identified during the visit. The lack of detail in the supplied data in terms of business contact information was also effectively addressed by allowing sufficient time and resource to research the data gaps.
4. This report and its associated technical appendices contain sufficient detail to allow
reproduction of this methodology in future surveys, to allow data consistency and comparability, and flag up issues which could be addressed in future surveys to further improve delivery such as allowing more time to quality check and gross up data prior to reporting deadlines.
5. For some businesses, such as supermarkets or multi-outlet operations such as post
offices or water utility sites, because of back hauling of waste to distribution centres or central management of waste contracts, data on generation is not held by individual locations. In such cases, data can often be collected centrally from regional or national business managers. However, caution has to be employed in using this data. The source or robustness of this data is not always clear, it has the
Page 34 of 34 www.naturalresourceswales.gov.uk
Wales Industrial and Commercial Waste Generated Survey 2012
potential to dominate generation in individual bricks in the sample frame, and will have a negative impact on the random sampling methodology employed upon which the sampling methodology relies. This needs monitoring closely and augmented significantly by data from other businesses and sources so that the potential negative aspects of corporate data are minimised.
6. We recommend further interpretation and analysis of the data generated by this
survey to help inform and develop policy, develop planning strategy and secure opportunities in improving sustainable waste management in Wales.
7. Planning authorities can use the data at both a national and regional level to inform waste planning.
8. The results of the survey highlight areas where further initiatives and support could
be focused to improve progress with achieving targets set in the National waste strategy ‘Towards Zero Waste’. For example, almost all of the commercial waste landfilled in 2012 was mixed wastes consisting of mixed residual and bulky wastes, indicating that there are further opportunities to improve segregation of recyclable materials in the commercial sectors.
9. These surveys results are not published as Official Statistics. However, any future such surveys will be considered for publication as Official Statistics.