surfactant-enhanced remediation of a trichloroethene-contaminated aquifer. 2. transport of tce
TRANSCRIPT
Surfactant-Enhanced Remediation ofa Trichloroethene-ContaminatedAquifer. 2. Transport of TCED I P A K S A H O O , † , ‡ J A M E S A . S M I T H , * , †
T H O M A S E . I M B R I G I O T T A , § A N DH E A T H E R M . M C L E L L A N † , |
Program of Interdisciplinary Research in ContaminantHydrogeology, Department of Civil Engineering,University of Virginia, Charlottesville, Virginia 22903-2442,and U.S. Geological Survey, 810 Bear Tavern Road, Suite 206,West Trenton, New Jersey 08628
Field studies were conducted under an induced gradientin a trichloroethene (TCE)-contaminated aquifer atPicatinny Arsenal, NJ, to study (a) the rate-limited desorptionof TCE from aquifer sediments to water and (b) the effectof a surfactant (Triton X-100) on the desorption andtransport of TCE. Clean water was injected into thecontaminated aquifer for 206 day. Triton X-100 was addedfor a 36-day period (days 36-71 from the start of cleanwater injection). The effect of Triton X-100 on the desorptionand transport of TCE in the field was examined by observingthe concentrations of these two solutes in four monitoringwells 3-9 m from the injection wells. These data showa small but discernible increase in the TCE concentration intwo of the wells corresponding approximately to the timewhen surfactant reaches the wells; in the other twomonitoring wells, the increase in TCE concentration isnegligible. A solute transport model that assumes localsorption equilibrium and used a laboratory-derived distributioncoefficient could not adequately describe TCE desorptionand transport observed in the aquifer. Two modelformulations that accounted for rate-limited sorptionstwo-site and multisite modelssfit the data well. TCEconcentrations after surfactant injection were underpredictedby the models unless mass transfer rate was increasedto account for the effect of surfactant on the rate of TCEdesorption. The concentration data from the two wellsand the model analysis suggest that the rate of TCE desorptionis increased (by approximately 30%) as a result of TritonX-100 injection.
IntroductionReleases of organic contaminants, including trichloroethene(TCE), have resulted in groundwater contamination at manysites across the United States. These contaminated sites haveresisted cleanup by conventional methods such as pump-and-treat because of the slow rate of pollutant desorptionfrom soil to water (1-6), the presence of residual NAPL, and
physical and chemical heterogeneities at the site. In theabsence of NAPL or significant physical heterogeneity, slowdesorption evidenced by local nonequilibrium is the primarycause of inefficiency in pump-and-treat operations. Severalfield-scale experiments have shown that the transport oforganic compounds in the groundwater is nonequilibriumin nature (7-13). In another study, under forced-gradientflow conditions (using an injection-extraction well system),plots of organic solute concentration versus time exhibitedextended tailing, suggesting rate-limited transport (14).
Nonionic organic solutes primarily partition into soilorganic matter (15) and undergo slow or rate-limiteddesorption (2, 16). It has been postulated that severaldifferent processes cause this sorption-related nonequilib-rium. However, many studies have suggested that slowintraorganic matter diffusion may be the primary cause fornonequilibrium sorption in soil-water systems (17-20).
Soil organic matter can be envisioned as a three-dimensional matrix of polymer chains with a relatively open,flexible structure (17). The diffusional resistance of smallsolute molecules, such as benzene and TCE, in concentratedpolymeric solutions is generally believed to be caused by thetortuous movement of the solute through the polymer matrix(21). Over long time periods, changes in water pH, ionicstrength, or temperature may cause rearrangement of thealkyl and aryl functional groups in soil organic matter (22);this in turn may cause some fraction of the sorbed solute tobe “trapped” as diffusional paths are blocked. The rate ofdesorption varies inversely with the time of exposure tocontamination; long-term field-contaminated soils can beexpected to exhibit slow desorption.
Surfactants can reduce the water/soil organic matterinterfacial tension and cause swelling of the soil organicmatter. When the concentration of a solvent in a polymeris increased, the polymer matrix must undergo configura-tional changes that “swell” or expand the organic polymermedium. The resulting diffusion rate of a small solutemolecule in the polymer solution can, thereby, be increased(20, 23, 24). Recent laboratory sorption-desorption andtransport studies conducted on long-term TCE-contaminatedsoil found that the nonionic surfactant Triton X-100 was ableto cause a modest increase in the desorption rate of TCE (3).Another study that investigated the effect of surfactants onthe rate of carbon tetrachloride desorption from laboratory-contaminated soil reported that Triton X-100 increases themass-transfer coefficient of desorption (18).
Because there are only a few documented field studies ofthe transport of organic compounds with kinetic sorptionand the effects of surfactant on pollutant transport, additionalstudies are needed to elucidate this transport process in thefield. This work reports the results of a field study that wasconducted at a TCE-contaminated aquifer at PicatinnyArsenal, NJ. Since pump-and-treat remediation began atthe site in 1992 (Figure 1), there has been no significantdecrease in groundwater TCE levels in the aquifer in areasmore than 40 m from the withdrawal wells, suggesting thatthere is resistance to desorption. In this study, the transportof TCE with rate-limited sorption and under an inducedgradient in the field is analyzed using a two-site or bicon-tinuum model (with a single mass-transfer coefficient) anda multisite model (with a distribution of mass-transfercoefficients). Additionally, the effect of Triton X-100 on thetransport of TCE in the field is reported here. There are afew reported field studies on the effect of surfactants on theremoval of pure, nonaqueous phase organic contaminantsfrom soil (25); however, to our knowledge, there is no reported
* To whom correspondence should be addressed; e-mail:[email protected]; telephone: (804)924-7991; fax: (804)982-2951.
† University of Virginia.‡ Present address: Department of Geology, University of Illinois,
Champaign, IL.§ U.S. Geological Survey.| Present address: Woodward-Clyde, Inc., Blue Bell, PA.
Environ. Sci. Technol. 1998, 32, 1686-1693
1686 9 ENVIRONMENTAL SCIENCE & TECHNOLOGY / VOL. 32, NO. 11, 1998 S0013-936X(97)00722-0 CCC: $15.00 1998 American Chemical SocietyPublished on Web 04/24/1998

field study using a surfactant to increase the desorption rateof TCE or other organic compounds. This paper is the secondof a two-paper series addressing the results of a field test ofsurfactant-enhanced aquifer remediation at Picatinny Ar-senal, NJ. The first paper (26) focused on the transport ofa nonionic surfactant, Triton X-100, through the unconfined,TCE-contaminated aquifer at the site. The objectives ad-dressed in this paper are (a) to demonstrate the ability ofsurfactant to enhance TCE desorption from sediment in acontaminated aquifer and (b) to test the applicability of thetwo-site and multisite kinetic models in the field.
Materials and MethodsMaterials. Hexane (>99% purity), methanol (>99% purity),and TCE (>99% purity) were obtained from Aldrich and SigmaChemical Co. Triton X-100, a nonionic heterogeneousoctylphenol ethoxylate surfactant, was obtained from UnionCarbide Chemical and Plastics Technology Corp. The averagemolecular weight is 628. From laboratory measurement ofsurface tension at various concentrations of Triton X-100,the critical micelle concentration (cmc) was found to be 130mg/L.
Description of Field Site. Picatinny Arsenal (Figure 1) islocated in a narrow, glaciated valley in north-central NewJersey atop 50-65 m of stratified and unstratified drift, whichin turn overlies a weathered bedrock surface. Three majorhydrogeologic units are formed from the unconsolidatedsediments at the site: a 15-21 m thick unconfined sand-and-gravel aquifer; an 8-21 m thick confining layer composedof fine sand, silt, and clay; and an 8-35 m thick confinedsand-and-gravel aquifer (27). The water table is 2-4 m belowland surface over most of the study area (4). The approximatedirection of groundwater flow in the unconfined aquifer isfrom Building 24 to Green Pond Brook (Figure 1). The
horizontal hydraulic conductivity, K, in the unconfinedaquifer ranges from 0.0001 to 0.0013 m/s, and averagegroundwater velocities range from 0.3 to 0.9 m/day (1, 28).
From 1960 to 1983, Building 24 (Figure 1) was used formetal plating, cleaning, and degreasing operations. TCE wasthe primary solvent used for degreasing. Because of improperdisposal practices, a plume of TCE-contaminated ground-water developed in the unconfined aquifer from Building 24to Green Pond Brook (Figure 1). Over the past decade, severalother studies have thoroughly characterized the site hydro-geology and contamination (1, 4, 27, 29-32). During theinstallation of the seven monitoring and injection wells, soilcores were collected from the study area by hollow stemaugering. These soil cores were composited for use inlaboratory studies.
Field Experimental Methods. The transport of TCE atthe field site was studied using an array of seven 5 cm diameterpoly(vinyl chloride) injection and monitoring wells installedapproximately in the center of the contaminant plume (Figure1). In this region, the unsaturated zone is approximately 3.3m thick, and the unconfined aquifer extends from a depthof 3.3 m to a depth of 16.2 m. Wells 92-14, 92-15, and 92-16were used as injection wells and are screened from a depthof 9.7-16.2 m. Wells 92-13, 92-17, 92-18, and 92-19 aremonitoring wells and are screened from a depth of 12.2-13.8 m. Each of the wells are 3.1 m away from the closestwell except well 92-13, which is 9.3 m north of the injectionwells. The hydraulic conductivity of the study area deter-mined by a series of slug tests ranged from 1.02× 10⁻⁵ to 1.62× 10⁻⁴ m/s (26).
From May 23, 1995 (day 1), to December 26, 1995 (day217), water (from Picatinny Arsenal drinking water supply)was injected into wells 92-14, 92-15, and 92-16 at rates of 2.0,26.5, and 15.0 L/min, respectively. These injection ratesresulted in approximately equal steady-state hydraulic headsfor wells 92-14 (211.49 m) and 92-16 (211.32 m) and a slightlyhigher hydraulic head for well 92-15 (211.69 m). The relativelylow injection rate in well 92-14 needed to produce a hydraulichead roughly equal to the heads in the other two injectionwells probably reflects some clogging of the well screen ora lower local hydraulic conductivity. This observation issupported by the slug-test results (provided in ref 26). OnJune 3, 1995 (day 12), 20 L of water containing 7.5 kg of KBr(250 g/L Br-) was injected into well 92-15 over a 20-minperiod. From June 28, 1995 (day 36), to August 2, 1995 (day71), water discharged into injection well 92-15 containedTriton X-100 at a concentration of 400 mg/L at 26.5 L/min.
Water samples were collected in airtight glass bottles withTeflon-lined caps and zero headspace and were analyzed atan on-site laboratory for TCE, Triton X-100, and Br-. Thesamples were analyzed for TCE by purge-and-trap capillarycolumn gas chromatography with a flame ionization detector.An anti-foaming agent, Dow Corning Antifoam 1510, wasused to prevent foaming in the purge-and-trap process, whichresults from the presence of surfactant in the aqueoussamples. The concentration of Triton X-100 in groundwatersamples was determined by a spectrophotometric method(26, 33, 34). The concentration of Br- in groundwater sampleswas determined using an Orion specific ion electrode anda double junction reference electrode.
Laboratory Experimental Methods. A batch equilibra-tion method was used to determine the equilibrium distri-bution coefficient of TCE between water and the field soil.Prior to use in these batch experiments, TCE in the soil wasremoved by heating the soil sample for 48 h at 105 °C; thesoil was analyzed after incubation, and no TCE was detected.Clean soil (6.0 g) and water or surfactant solutions (12 mL)containing different amounts of TCE were added to 15-mLcentrifuge tubes. After 3 day of shaking at 15 °C, the aqueous
FIGURE 1. Map of the field site, Picatinny Arsenal, NJ, showingthe location of the injection and monitoring wells, the pump-and-treat withdrawal wells, and the region of trichloroethene-contaminated groundwater.
VOL. 32, NO. 11, 1998 / ENVIRONMENTAL SCIENCE & TECHNOLOGY 9 1687

TCE concentration was measured. The partition coefficients(Kd) were obtained by fitting a linear isotherm model to thedata; the Kd of the soil-water system was found to be 0.09L/kg. The organic carbon content in the soil (foc) was 0.1%,which implies that the organic carbon-normalized partitioncoefficient, Koc, for TCE is 90 L/kg, which compares well topreviously measured Koc values for Picatinny Arsenal soil (4).To obtain the initial soil-phase concentration of TCE, drillingcores were analyzed. Analysis of the soil for TCE was doneusing a hot-methanol extraction (4, 35).
Solute Transport SimulationsModel Setup. Steady-state flow and transient solute trans-port were assumed. The flow was assumed to be 2-D, withconstant head boundaries at the upper (northern) and lower(southern) boundaries and no flow boundaries on the sideboundaries far away from the injection wells. There is somevertical flow close to the injection well as water is not injecteduniformly throughout the depth of the aquifer. However, afew feet away from the injection wells the flow shouldapproximate horizontal flow. For TCE transport, a zero-concentration gradient boundary condition was assumed atall boundaries, which were away from the region of interest.Since the concentration gradient and the flow velocity arehigh at the injection wells, a finer mesh was used in thatregion. Also, the time step was allowed to increase withtime (details of the model setup are provided in ref 26).
The initial condition of the TCE in the aquifer wasdetermined by collecting water samples from the seven wellsbefore the start of injection of water into the aquifer. Theinitial average aqueous-phase concentration was 2840 µg/L.Concurrent to this study, the soil-phase TCE concentrationwas measured by the U.S. Geological Survey (Dr. TimothyWilson, written communication, 1996) on soil cores collectedat various depths in the proximity of the test area. The averageTCE concentration in soil at depths of 10-15 m was 800µg/kg. The average TCE concentrations in soil and waterwere used as uniform initial conditions.
The results of the Br- test were used to calibrate thegroundwater flow part of the simulation as well as thedispersivity. The groundwater flow moved north and southfrom the injection wells. The aquifer hydraulic conductivityand porosity were determined to have a value of 1.3 × 10 -4
m/s and 0.28, respectively (26). From the flow and tracerdata modeling, spatially variable dispersivity was suggested;the dispersivity values were found to increase from 0.08 to1.04 m with distance away from the injection wells (26). Theratio of longitudinal to lateral dispersivity was assumed tobe equal to 10.
Parameter Estimation. A parameter estimation routineusing Powell’s direction set method (36) was run in con-junction with SUTRA to calibrate the kinetic parameters byminimizing the squared normalized differences between theobserved and modeled concentrations. The merit functionor error is defined as the sum of the square of the normalizeddeviation and is mathematically given as
This merit function ensures that the percentage error at eachcomparison point is given equal weight. Using just the squareof the deviation instead of the normalized deviation wouldresult in the model fit being biased in favor of the earlier datapoints showing higher concentrations.
Several investigators (37-39) have presented modelsaccounting for rate-limited sorption. In this study, the two-site and the multisite sorption models were used to simulatethe field experiment. The test site is a fairly homogeneous
sand-and-gravel aquifer, and sorption-related nonequilib-rium was considered to predominate over physical hetero-geneity. SUTRA (40), a two-dimensional finite-elementgroundwater model, was modified to incorporate the two-site and the multisite sorption models. Both these sorptionmodels assume a linear first-order mass-transfer expressionto represent the sorption/desorption from the rate-limitedsites.
Two-Site Model. The governing equations incorporatingthe two-site sorption model are
subject to a zero-concentration gradient at all boundariesand to the following initial conditions:
Here F is the fraction of equilibrium sites, D is the dispersioncoefficient, C is the aqueous solute concentration, Ci is theinitial measured aqueous TCE concentration, Si is the initialmeasured sorbed TCE concentration, v is the linear velocity,F is the bulk density, θ is the moisture content or porosity,and Sk is the solute concentration in soil contributed by thesolute sorbed in the kinetic site (with a single-valued rateconstant, k). The above equations apply to the equilibriummodel when F ) 0.
Multisite model. A γ-probability distribution (5) is usedto represent the distribution of kinetic rate constants. A meanrate constant, k, and a coefficient of variation, CV, define thedistribution of the γ-density function. The governing equa-tions incorporating the multisite sorption model are asfollows:
where the subscript κ represents the κth compartment orsorption site, NK is the number of compartments or sites, Sκis the solute concentration in the soil due to site κ, and S isthe total solute concentration in the soil due to all the kineticsites. NK discrete sites are used to represent the continuousdistribution of sites, and each site occupies 1/NK fraction ofthe soil (an NK of 15 was determined to adequately representthe continuous distribution in this case). The representativemass transfer coefficient, kκ, for each of the sites is obtainedfrom a γ probability density function (details are providedin ref 5). The initial conditions are
for every site, κ.
Results and DiscussionThe TCE concentrations in the four monitoring wells areshown in Figures 2-4. Because water was being injectedcontinuously into injection wells 92-14, 92-15, and 92-16,
merit function (error) )
∑[(data - model result)/data]2
(1 +FFKd
θ ) ∂C∂t
+ Fθ∂Sk
∂t) ∇‚(D∇C) - ∇‚(vC) (1)
∂Sk
∂t) k[(1 - F)KdC - Sk] (2)
C(x,y,0) ) Ci
Sk(x,y,0) ) Si
∂C∂t
+ Fθ∂S∂t
) ∇‚(D∇C) - ∇‚(vC) (3)
∂S
∂t) ∑
κ ) 1
NK
kκ[KdC - Sκ] (4)
C(x,y,0) ) Ci
Sκ(x,y,0) )Si
(NK)
1688 9 ENVIRONMENTAL SCIENCE & TECHNOLOGY / VOL. 32, NO. 11, 1998
TCE concentrations in these wells were near zero and arenot shown. All the wells show a gradual decreasing trend inTCE concentration resulting from flushing by freshwater. Allthe TCE concentration curves exhibit extensive tailing, whichcan be indicative of kinetic desorption from soil and/orphysical and chemical flow-field heterogeneities. Becauseof the regional groundwater flow system, the velocity imposedby the injection is lower northward (relative to southward)from the injection wells. Consequently, the concentrationdrop in the wells to the south (92-17, 92-18, and 92-19) isgreater than that in the well to the north (92-13). Theobserved TCE concentrations in well 92-19 are similar tothose of well 92-18 located 3.1 m closer to the injection wells(Figure 1). These data suggest there are flow heterogeneitiesincluding preferential flow pathways in the region between
wells 92-18 and 92-19. Similar results were observed forTriton X-100 and Br- in these wells (26).
Model Results. The transport of TCE is analyzed throughmodel simulation. A uniform hydraulic conductivity andspatially variable dispersivity were assumed for this site. Theobserved local heterogeneities in the flow system describedin the previous section are not incorporated in the simulationsbecause the purpose of this modeling was to investigate thedifferent reactive models and also because of lack of adequatedata for K values. Furthermore, some of the physicalheterogeneity is accounted for by using spatially variabledispersivities. Three sorption models are examined here:equilibrium, two-site, and multisite.
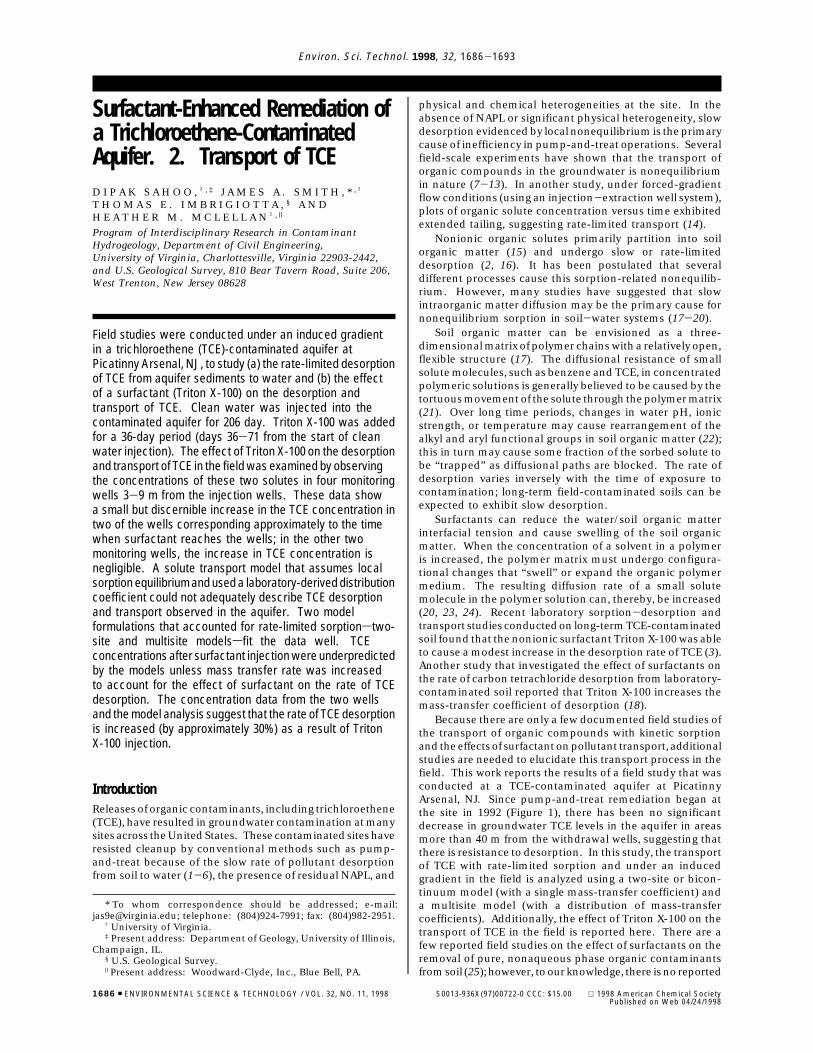
Equilibrium Sorption Modeling. The equilibrium sorptionmodel was run using the Kd value determined from thelaboratory batch sorption experiments described previously(0.09 L/kg). The model prediction is shown in Figure 2 alongwith the observed concentrations of TCE. Consistent withearlier postulation, the equilibrium sorption model does notfit the data accurately. The predicted concentrations droprather sharply and underpredict the long-term TCE con-centration data observed in all the wells.
Next, the performance of kinetic models is examined. Thetwo-site and the multisite models are studied in this context.In contrast to the equilibrium model, which had no field-calibrated parameters, the kinetic models used in this studyeach contain two fitting parameters.
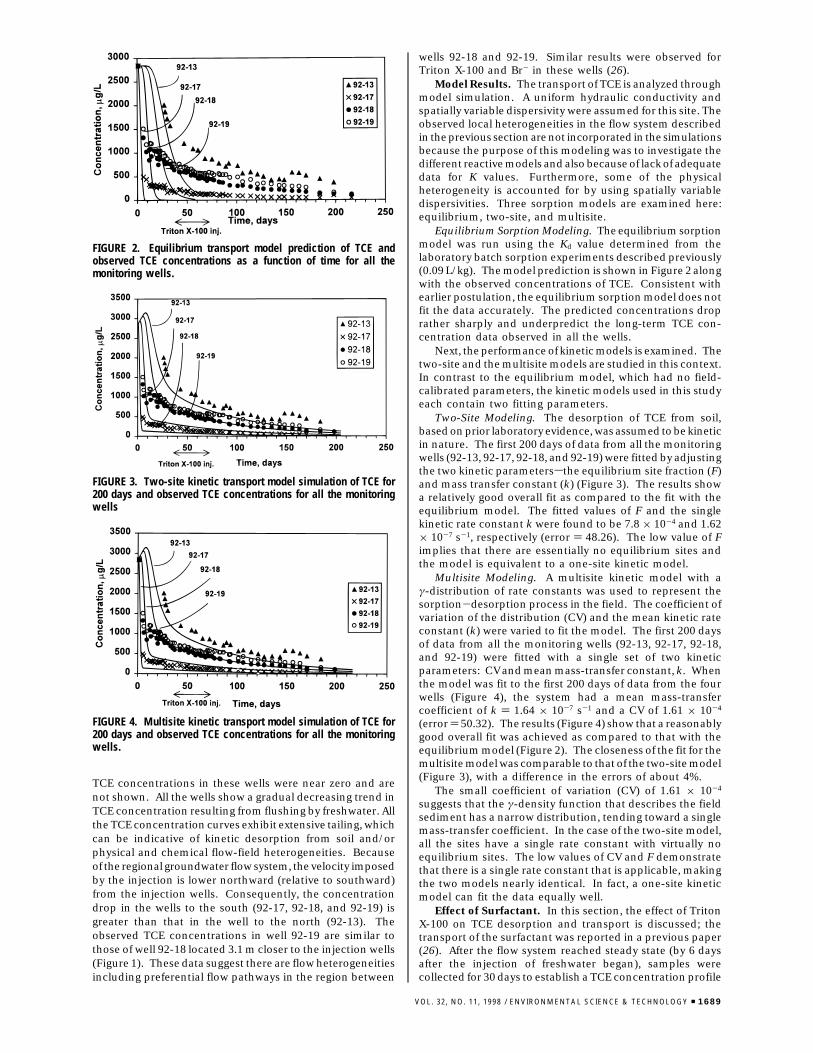
Two-Site Modeling. The desorption of TCE from soil,based on prior laboratory evidence, was assumed to be kineticin nature. The first 200 days of data from all the monitoringwells (92-13, 92-17, 92-18, and 92-19) were fitted by adjustingthe two kinetic parameterssthe equilibrium site fraction (F)and mass transfer constant (k) (Figure 3). The results showa relatively good overall fit as compared to the fit with theequilibrium model. The fitted values of F and the singlekinetic rate constant k were found to be 7.8 × 10⁻⁴ and 1.62× 10⁻⁷ s-1, respectively (error ) 48.26). The low value of Fimplies that there are essentially no equilibrium sites andthe model is equivalent to a one-site kinetic model.
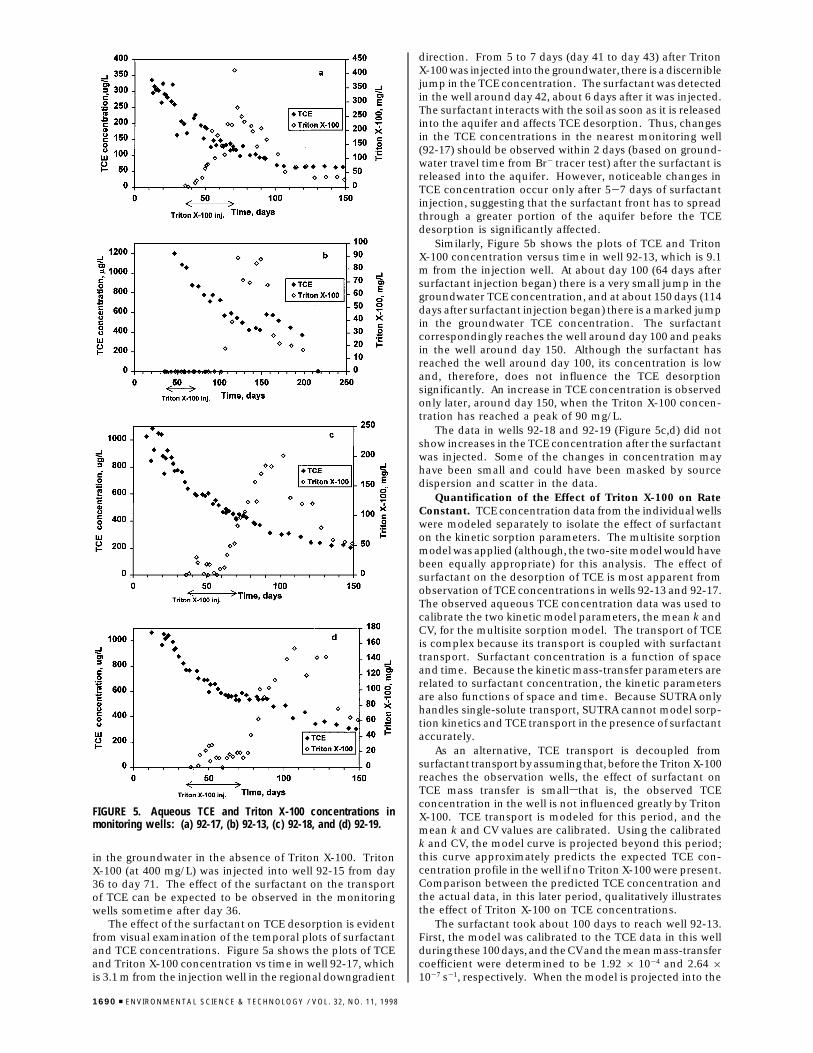
Multisite Modeling. A multisite kinetic model with aγ-distribution of rate constants was used to represent thesorption-desorption process in the field. The coefficient ofvariation of the distribution (CV) and the mean kinetic rateconstant (k) were varied to fit the model. The first 200 daysof data from all the monitoring wells (92-13, 92-17, 92-18,and 92-19) were fitted with a single set of two kineticparameters: CV and mean mass-transfer constant, k. Whenthe model was fit to the first 200 days of data from the fourwells (Figure 4), the system had a mean mass-transfercoefficient of k ) 1.64 × 10⁻⁷ s-1 and a CV of 1.61 × 10⁻⁴
(error ) 50.32). The results (Figure 4) show that a reasonablygood overall fit was achieved as compared to that with theequilibrium model (Figure 2). The closeness of the fit for themultisite model was comparable to that of the two-site model(Figure 3), with a difference in the errors of about 4%.
The small coefficient of variation (CV) of 1.61 × 10⁻⁴
suggests that the γ-density function that describes the fieldsediment has a narrow distribution, tending toward a singlemass-transfer coefficient. In the case of the two-site model,all the sites have a single rate constant with virtually noequilibrium sites. The low values of CV and F demonstratethat there is a single rate constant that is applicable, makingthe two models nearly identical. In fact, a one-site kineticmodel can fit the data equally well.
Effect of Surfactant. In this section, the effect of TritonX-100 on TCE desorption and transport is discussed; thetransport of the surfactant was reported in a previous paper(26). After the flow system reached steady state (by 6 daysafter the injection of freshwater began), samples werecollected for 30 days to establish a TCE concentration profile
FIGURE 2. Equilibrium transport model prediction of TCE andobserved TCE concentrations as a function of time for all themonitoring wells.
FIGURE 3. Two-site kinetic transport model simulation of TCE for200 days and observed TCE concentrations for all the monitoringwells
FIGURE 4. Multisite kinetic transport model simulation of TCE for200 days and observed TCE concentrations for all the monitoringwells.
VOL. 32, NO. 11, 1998 / ENVIRONMENTAL SCIENCE & TECHNOLOGY 9 1689
in the groundwater in the absence of Triton X-100. TritonX-100 (at 400 mg/L) was injected into well 92-15 from day36 to day 71. The effect of the surfactant on the transportof TCE can be expected to be observed in the monitoringwells sometime after day 36.
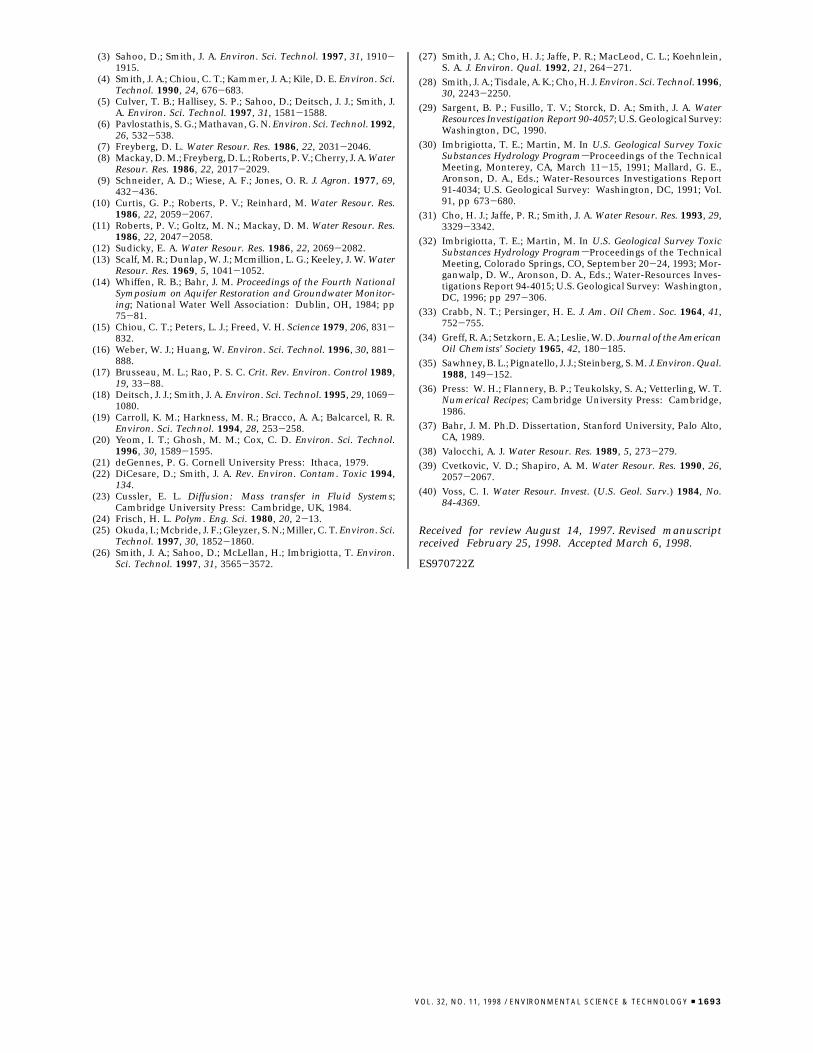
The effect of the surfactant on TCE desorption is evidentfrom visual examination of the temporal plots of surfactantand TCE concentrations. Figure 5a shows the plots of TCEand Triton X-100 concentration vs time in well 92-17, whichis 3.1 m from the injection well in the regional downgradient
direction. From 5 to 7 days (day 41 to day 43) after TritonX-100 was injected into the groundwater, there is a discerniblejump in the TCE concentration. The surfactant was detectedin the well around day 42, about 6 days after it was injected.The surfactant interacts with the soil as soon as it is releasedinto the aquifer and affects TCE desorption. Thus, changesin the TCE concentrations in the nearest monitoring well(92-17) should be observed within 2 days (based on ground-water travel time from Br- tracer test) after the surfactant isreleased into the aquifer. However, noticeable changes inTCE concentration occur only after 5-7 days of surfactantinjection, suggesting that the surfactant front has to spreadthrough a greater portion of the aquifer before the TCEdesorption is significantly affected.
Similarly, Figure 5b shows the plots of TCE and TritonX-100 concentration versus time in well 92-13, which is 9.1m from the injection well. At about day 100 (64 days aftersurfactant injection began) there is a very small jump in thegroundwater TCE concentration, and at about 150 days (114days after surfactant injection began) there is a marked jumpin the groundwater TCE concentration. The surfactantcorrespondingly reaches the well around day 100 and peaksin the well around day 150. Although the surfactant hasreached the well around day 100, its concentration is lowand, therefore, does not influence the TCE desorptionsignificantly. An increase in TCE concentration is observedonly later, around day 150, when the Triton X-100 concen-tration has reached a peak of 90 mg/L.
The data in wells 92-18 and 92-19 (Figure 5c,d) did notshow increases in the TCE concentration after the surfactantwas injected. Some of the changes in concentration mayhave been small and could have been masked by sourcedispersion and scatter in the data.
Quantification of the Effect of Triton X-100 on RateConstant. TCE concentration data from the individual wellswere modeled separately to isolate the effect of surfactanton the kinetic sorption parameters. The multisite sorptionmodel was applied (although, the two-site model would havebeen equally appropriate) for this analysis. The effect ofsurfactant on the desorption of TCE is most apparent fromobservation of TCE concentrations in wells 92-13 and 92-17.The observed aqueous TCE concentration data was used tocalibrate the two kinetic model parameters, the mean k andCV, for the multisite sorption model. The transport of TCEis complex because its transport is coupled with surfactanttransport. Surfactant concentration is a function of spaceand time. Because the kinetic mass-transfer parameters arerelated to surfactant concentration, the kinetic parametersare also functions of space and time. Because SUTRA onlyhandles single-solute transport, SUTRA cannot model sorp-tion kinetics and TCE transport in the presence of surfactantaccurately.
As an alternative, TCE transport is decoupled fromsurfactant transport by assuming that, before the Triton X-100reaches the observation wells, the effect of surfactant onTCE mass transfer is smallsthat is, the observed TCEconcentration in the well is not influenced greatly by TritonX-100. TCE transport is modeled for this period, and themean k and CV values are calibrated. Using the calibratedk and CV, the model curve is projected beyond this period;this curve approximately predicts the expected TCE con-centration profile in the well if no Triton X-100 were present.Comparison between the predicted TCE concentration andthe actual data, in this later period, qualitatively illustratesthe effect of Triton X-100 on TCE concentrations.
The surfactant took about 100 days to reach well 92-13.First, the model was calibrated to the TCE data in this wellduring these 100 days, and the CV and the mean mass-transfercoefficient were determined to be 1.92 × 10⁻⁴ and 2.64 ×10⁻⁷ s-1, respectively. When the model is projected into the
FIGURE 5. Aqueous TCE and Triton X-100 concentrations inmonitoring wells: (a) 92-17, (b) 92-13, (c) 92-18, and (d) 92-19.
1690 9 ENVIRONMENTAL SCIENCE & TECHNOLOGY / VOL. 32, NO. 11, 1998

next 100 days using these parameters, the model under-predicted the observed data during this period (Figure 6).This affirms what was visually observedsthe upward shift ofthe observed data after the surfactant reaches the well.
Next, keeping the CV constant and allowing the mass-transfer coefficient to change, the model was calibrated forthe next 100 days. The model curve shows that after the first100 days a greater mass-transfer constant was required tomatch the later data; the mass-transfer coefficient increases30% in magnitude (k ) 3.45× 10⁻⁷ s-1), and the model curveshows an upward shift (Figure 7). This rather abrupt shiftin the model curve is not to be expected in reality and is anartifact of the modeling method; moreover, the value of k )3.45 × 10⁻⁷ s-1 determined in this model is only anapproximate value. To perform accurate modeling, thekinetic parameters would have to be varied as a function ofsurfactant concentration.
Similarly, for well 92-17 the aqueous TCE data was usedto calibrate the kinetic sorption parameters (k and CV). Thesurfactant took about 6 days from the date of injection toreach this well around day 40. Upon fitting the data for thefirst 36 days (when there was no surfactant in the system),it is found that the CV was 9.3 × 10⁻³ and the mean mass-transfer coefficient was 5.74 × 10⁻⁷ s-1. When the model isprojected into the next 30 days using these parameters, themodel underpredicted the observed data (Figure 8), sug-gesting that a higher mean mass-transfer constant could beoperative in the field in the presence of Triton X-100.
Sensitivity Analysis. Considering the complexity of themodeling, the large number of parameters, and the difficultyin accurately assessing them, it is necessary to determine thesensitivity of the model to these parameters. This will helpidentify the parameters that are critical to the accuracy ofthe model. It is especially important to test the sensitivity
of the model to those parameters that are difficult todetermine with accuracy, such as the kinetic parameters CVand k in the multisite model.
The sensitivity plots for k for wells 92-13 and 92-17 areshown in Figure 9. The sensitivity plots for CV in well 92-13are shown in Figure 10 (at k ) 1.0× 10⁻⁷ and 3.0× 10⁻⁷ s-1).Table 1 shows the percent errors of the concentration profileat various values of k relative to k ) 1.0 × 10⁻⁷ s-1 and CV) 0.5 in well 92-13 and well 92-17. Table 2 shows the percenterrors of the concentration profile at various values of theCV relative to a CV of 0.5 at two different k values (1.0× 10⁻⁷
and 3.0 × 10⁻⁷ s-1) in wells 92-13 and 92-17. The percenterrors are a measure of deviation from an arbitrary referencemodel run. Percent error is calculated as 100 × SSD/SSQ;where SSD is the sum of deviation between the two simulatedconcentrations calculated at the times samples were col-lected. SSQ is the sum of squares of concentration in thereference model run at those points in time. First, it is seen
FIGURE 6. Observed and model (multisite) predicted TCE concen-trations in well 92-13. The model results are based on kinetic rateparameters obtained from fitting the first 100 days of TCE data.
FIGURE 7. Observed and simulated TCE concentrations (usingmultisite model) in well 92-13 obtained by fitting the data separatelyfor the first 100 days and for the period between 100 and 200 days.
FIGURE 8. Observed and model predicted TCE concentrations (usingmultisite model) in well 92-17. The model results are based onkinetic rate parameters obtained from fitting the first 36 days TCEdata.
FIGURE 9. Model-predicted TCE concentrations (multisite model)using varying mean rate constants k (k ) 1.0 × 10⁻⁷, 2.0 × 10-7,3.0× 10-7, and 4.0× 10⁻⁷ s-1) in (a) well 92-13 with and in (b) well92-17.
VOL. 32, NO. 11, 1998 / ENVIRONMENTAL SCIENCE & TECHNOLOGY 9 1691

(Table 1) that the model is more sensitive to k at well 92-17than it is at well 92-13. This is because of the high flushingrate in 92-17 (relative to 92-13); since advection is strong,k, the mass-transfer constant, is controlling. The sensitivity
to CV is quite low when CV is decreased below 0.5 (Table 2).This implies that below a CV of 0.5 a single mass-transfercoefficient (e.g., a one-site model or a two-site model) couldbe used.
Model runs for the field show that a significant increasein the mass-transfer coefficient does not translate into asignificant increase in the TCE concentration in the wells.From Figure 9a it can be seen that at later times the modelis not very sensitive to k. Figure 7 shows that even a significantincrease in the mass-transfer coefficient (30%) results in smallconcentration increases in the wells. This implies thatincreases (or decreases) in mass-transfer rate coefficientswill not result in significantly higher concentrations in thewells. Thus, the effectiveness of Triton X-100 in increasingdesorption rate is not expected to be easily observed fromthe well TCE concentration data.
Summary and Future WorkThe data and modeling results from wells 92-13 and 92-17show consistent evidence of an increase in TCE desorptionthat is attributable to the presence of Triton X-100. Althoughvisual examination of the concentration profile in the wellsdoes not show any sharp jump in concentration due tosurfactant, modeling results show a significant increase inthe mass-transfer rate constant. Together, the results fromlaboratory studies (3) and this field study suggest that TritonX-100 has at least a modest impact on enhancing thedesorption rate. It is clear that even the use of surfactantwill not result in complete cleanup. However, surfactantsmay be used to decrease the time that is needed for cleanupto proceed to an acceptable level (e.g., when the aqueous-phase contaminant concentration is brought below regula-tory limits).
A few recommendations may be made based on thefindings of this and previous studies (3). The partitioncoefficient (Kd) of TCE varies moderately with Triton X-100concentration, and its effect on TCE desorption should beconsidered. The earlier laboratory studies (3) showed theTCE partition coefficient (Kd) increases with Triton X-100concentration and reaches its highest value at about 500mg/L of Triton X-100 before decreasing again. For instance,the TCE partition coefficient in a soil-water system is 12%higher at 400 mg/L of Triton X-100 as compared to that at100 mg/L. Increased Kd slows down the desorption rate bydecreasing the concentration gradient (3). A lower surfactantconcentration in the field close to or less than the cmc maybe more effective and should be tested.
Other surfactants may be more effective in promotingdesorption than Triton X-100. In choosing a differentsurfactant, it should be remembered that a surfactant’s abilityto influence solute desorption is related to its ability to lowersurface tension, its effect on solute sorption coefficient, andthe sorption of the surfactant itself onto the soil.
AcknowledgmentsThis research has been supported by the National Center forEnvironmental Research and Quality Assurance (NCERQA)of the U.S. Environmental Protection Agency and the ToxicSubstances Hydrology Program of the U.S. Geological Survey.Part of the computational support for this research wasobtained from a grant from the IBM Environmental ResearchProgram. However, any opinions, findings, and conclusionsor recommendations expressed in this material are those ofthe authors and do not necessarily reflect the views of theIBM Corporation.
Literature Cited(1) Imbrigiotta, T. E.; Ehlke, T. A.; Martin, M.; Koller, D.; Smith, J.
A. Hydrol. Sci. Technol. 1995, 11, 26-50.(2) Pignatello, J. J.; Xing, B. Environ. Sci. Technol. 1996, 30, 1-11.
FIGURE 10. Model-predicted TCE concentrations (multisite model)at various CV (CV ) 0.0001, 0.5, 2.0) for well 92-13 using (a) meanrate constant k ) 1.0 × 10⁻⁷ s-1 and (b) mean rate constant k )3.0 × 10⁻⁷ s-1.
TABLE 1. Sensitivity of Multisite Model to Variation in MeanKinetic Rate Constant, k, in Wells 92-13 and 92-17 Given asPercent Errora with Respect to Reference Model Run (withMean k ) 1.0 × 10⁻⁷ s-1)b
k (s-1)1.0 × 10⁻⁷
(ref value) 2.0 × 10⁻⁷ 3.0 × 10⁻⁷ 4.0 × 10⁻⁷
percent error(well 92-13)
0.14 0.44 0.81
percent error(well 92-17)
2.40 6.32 10.18
a Percent error ) 100 × SSD/SSQ. SSD is the sum of deviationbetween the two simulated concentrations calculated at the timessamples were collected. SSQ is the sum of squares of concentrationin the reference model run at those points in time. b Coefficient ofvariation is 0.5 for all model runs.
TABLE 2. Sensitivity of Model to Variation in Coefficient ofVariation, CV, in Wells 92-13 and 92-17 Given as PercentError with Respect to Reference Model Run (with CV ) 0.5)
mean rate constant )1.0 × 10⁻⁷ s-1
mean rate constant )1.0 × 10⁻⁷ s-1
CV 0.00010.5
(ref value) 2 0.00010.5
(ref value) 2
percent error(well 92-13)
0.026 1.68 0.104 5.90
percent error(well 92-17)
0.002 0.094 0.007 0.28
1692 9 ENVIRONMENTAL SCIENCE & TECHNOLOGY / VOL. 32, NO. 11, 1998
(3) Sahoo, D.; Smith, J. A. Environ. Sci. Technol. 1997, 31, 1910-1915.
(4) Smith, J. A.; Chiou, C. T.; Kammer, J. A.; Kile, D. E. Environ. Sci.Technol. 1990, 24, 676-683.
(5) Culver, T. B.; Hallisey, S. P.; Sahoo, D.; Deitsch, J. J.; Smith, J.A. Environ. Sci. Technol. 1997, 31, 1581-1588.
(6) Pavlostathis, S. G.; Mathavan, G. N. Environ. Sci. Technol. 1992,26, 532-538.
(7) Freyberg, D. L. Water Resour. Res. 1986, 22, 2031-2046.(8) Mackay, D. M.; Freyberg, D. L.; Roberts, P. V.; Cherry, J. A. Water
Resour. Res. 1986, 22, 2017-2029.(9) Schneider, A. D.; Wiese, A. F.; Jones, O. R. J. Agron. 1977, 69,
432-436.(10) Curtis, G. P.; Roberts, P. V.; Reinhard, M. Water Resour. Res.
1986, 22, 2059-2067.(11) Roberts, P. V.; Goltz, M. N.; Mackay, D. M. Water Resour. Res.
1986, 22, 2047-2058.(12) Sudicky, E. A. Water Resour. Res. 1986, 22, 2069-2082.(13) Scalf, M. R.; Dunlap, W. J.; Mcmillion, L. G.; Keeley, J. W. Water
Resour. Res. 1969, 5, 1041-1052.(14) Whiffen, R. B.; Bahr, J. M. Proceedings of the Fourth National
Symposium on Aquifer Restoration and Groundwater Monitor-ing; National Water Well Association: Dublin, OH, 1984; pp75-81.
(15) Chiou, C. T.; Peters, L. J.; Freed, V. H. Science 1979, 206, 831-832.
(16) Weber, W. J.; Huang, W. Environ. Sci. Technol. 1996, 30, 881-888.
(17) Brusseau, M. L.; Rao, P. S. C. Crit. Rev. Environ. Control 1989,19, 33-88.
(18) Deitsch, J. J.; Smith, J. A. Environ. Sci. Technol. 1995, 29, 1069-1080.
(19) Carroll, K. M.; Harkness, M. R.; Bracco, A. A.; Balcarcel, R. R.Environ. Sci. Technol. 1994, 28, 253-258.
(20) Yeom, I. T.; Ghosh, M. M.; Cox, C. D. Environ. Sci. Technol.1996, 30, 1589-1595.
(21) deGennes, P. G. Cornell University Press: Ithaca, 1979.(22) DiCesare, D.; Smith, J. A. Rev. Environ. Contam. Toxic 1994,
134.(23) Cussler, E. L. Diffusion: Mass transfer in Fluid Systems;
Cambridge University Press: Cambridge, UK, 1984.(24) Frisch, H. L. Polym. Eng. Sci. 1980, 20, 2-13.(25) Okuda, I.; Mcbride, J. F.; Gleyzer, S. N.; Miller, C. T. Environ. Sci.
Technol. 1997, 30, 1852-1860.(26) Smith, J. A.; Sahoo, D.; McLellan, H.; Imbrigiotta, T. Environ.
Sci. Technol. 1997, 31, 3565-3572.
(27) Smith, J. A.; Cho, H. J.; Jaffe, P. R.; MacLeod, C. L.; Koehnlein,S. A. J. Environ. Qual. 1992, 21, 264-271.
(28) Smith, J. A.; Tisdale, A. K.; Cho, H. J. Environ. Sci. Technol. 1996,30, 2243-2250.
(29) Sargent, B. P.; Fusillo, T. V.; Storck, D. A.; Smith, J. A. WaterResources Investigation Report 90-4057; U.S. Geological Survey:Washington, DC, 1990.
(30) Imbrigiotta, T. E.; Martin, M. In U.S. Geological Survey ToxicSubstances Hydrology ProgramsProceedings of the TechnicalMeeting, Monterey, CA, March 11-15, 1991; Mallard, G. E.,Aronson, D. A., Eds.; Water-Resources Investigations Report91-4034; U.S. Geological Survey: Washington, DC, 1991; Vol.91, pp 673-680.
(31) Cho, H. J.; Jaffe, P. R.; Smith, J. A. Water Resour. Res. 1993, 29,3329-3342.
(32) Imbrigiotta, T. E.; Martin, M. In U.S. Geological Survey ToxicSubstances Hydrology ProgramsProceedings of the TechnicalMeeting, Colorado Springs, CO, September 20-24, 1993; Mor-ganwalp, D. W., Aronson, D. A., Eds.; Water-Resources Inves-tigations Report 94-4015; U.S. Geological Survey: Washington,DC, 1996; pp 297-306.
(33) Crabb, N. T.; Persinger, H. E. J. Am. Oil Chem. Soc. 1964, 41,752-755.
(34) Greff, R. A.; Setzkorn, E. A.; Leslie, W. D. Journal of the AmericanOil Chemists' Society 1965, 42, 180-185.
(35) Sawhney, B. L.; Pignatello, J. J.; Steinberg, S. M. J. Environ. Qual.1988, 149-152.
(36) Press: W. H.; Flannery, B. P.; Teukolsky, S. A.; Vetterling, W. T.Numerical Recipes; Cambridge University Press: Cambridge,1986.
(37) Bahr, J. M. Ph.D. Dissertation, Stanford University, Palo Alto,CA, 1989.
(38) Valocchi, A. J. Water Resour. Res. 1989, 5, 273-279.
(39) Cvetkovic, V. D.; Shapiro, A. M. Water Resour. Res. 1990, 26,2057-2067.
(40) Voss, C. I. Water Resour. Invest. (U.S. Geol. Surv.) 1984, No.84-4369.
Received for review August 14, 1997. Revised manuscriptreceived February 25, 1998. Accepted March 6, 1998.
ES970722Z
VOL. 32, NO. 11, 1998 / ENVIRONMENTAL SCIENCE & TECHNOLOGY 9 1693