surface water, groundwater, and solid phase media...
TRANSCRIPT
Surface Water, Groundwater, and Solid Phase Media Investigation Work Plan - Mayflower Mill and Tailings Impoundments Area July 2015 Prepared for: Sunnyside Gold Corporation 5075 South Syracuse Street Suite 800 Denver, CO 80237 Prepared by:
2500 55th Street, Suite 200 Boulder, Colorado 80301
Surface Water, Groundwater, and Solid Phase Media Investigation Work Plan Mayflower Mill and Tailings Impoundments Area July 2015
i
TABLE OF CONTENTS
Page LIST OF TABLES ........................................................................................................... ii LIST OF FIGURES.......................................................................................................... ii LIST OF APPENDICES .................................................................................................. ii LIST OF ACRONYMS .................................................................................................... iii 1.0 INTRODUCTION ............................................................................................... 1-1
2.0 BACKGROUND ................................................................................................ 2-1
3.0 DATA QUALITY OBJECTIVES AND DATA NEEDS ....................................... 3-2 3.1 DQO Step 1 - State the Problem .......................................................................3-2 3.2 DQO Step 2 - Identify the Goals of the Study ....................................................3-3 3.3 DQO Step 3 - Identify Information Inputs ..........................................................3-3 3.4 DQO Step 4 – Define the Boundaries of the Study ............................................3-4 3.5 DQO Step 5 – Develop the Analytic Approach ..................................................3-4 3.6 DQO Step 6 – Specify Performance or Acceptance Criteria ..............................3-5 3.7 DQO Step 7 – Develop the Plan for Obtaining Data ..........................................3-6
4.0 SAMPLING AND ANALYSIS PLAN ................................................................. 4-1 4.1 Target Analytes .................................................................................................4-1
4.1.1 Surface Water Sampling ........................................................................4-1 4.1.2 Pore Water Sampling ............................................................................4-2 4.1.3 Groundwater Sampling ..........................................................................4-2 4.1.4 Sediment Sampling ...............................................................................4-2 4.1.5 Opportunistic Samples ..........................................................................4-3
4.2 Sample Labeling ...............................................................................................4-3 4.2.1 Surface Water, Pore Water and Sediment .............................................4-1 4.2.2 Groundwater .........................................................................................4-2 4.2.3 Other Solid Phase Media .......................................................................4-3 4.2.4 Opportunistic .........................................................................................4-4
5.0 REPORTING ..................................................................................................... 5-5
6.0 REFERENCES .................................................................................................. 6-1
Surface Water, Groundwater, and Solid Phase Media Investigation Work Plan Mayflower Mill and Tailings Impoundments Area July 2015
ii
LIST OF TABLES
Table Title 4-1 Target Analytes for Surface Water and Pore Water Samples
4-2 Target Analytes for Groundwater Samples 4-3 Target Analytes for Solid Phase Samples
4-4 Low-Flow Surface Water Investigation Sample Locations 4-5 Pore Water and Sediment Investigation Sample Locations
LIST OF FIGURES
Figure Title
1-1 Site Location Map 1-2 Site Plan and Study Area 4-1 Proposed Low-Flow Surface Water Sample Locations 4-2 Proposed Pore Water and Sediment Sample Locations
LIST OF APPENDICES
Appendix Title
A Quality Assurance Project Plan (QAPP) B Standard Operating Procedures (SOP) C Health and Safety Plan (HASP)
Surface Water, Groundwater, and Solid Phase Media Investigation Work Plan Mayflower Mill and Tailings Impoundments Area July 2015
iii
LIST OF ACRONYMS
ARSG Animas River Stakeholder Group DQO Data Quality Objective EPA United States Environmental Protection Agency HASP Health and Safety Plan QAPP Quality Assurance Project Plan SAP Sampling and Analysis Plan SOP Standard Operating Procedure TA Target Analyte
Surface Water, Groundwater, and Solid Phase Media Investigation Work Plan Mayflower Mill and Tailings Impoundments Area July 2015
1-1
1.0 INTRODUCTION
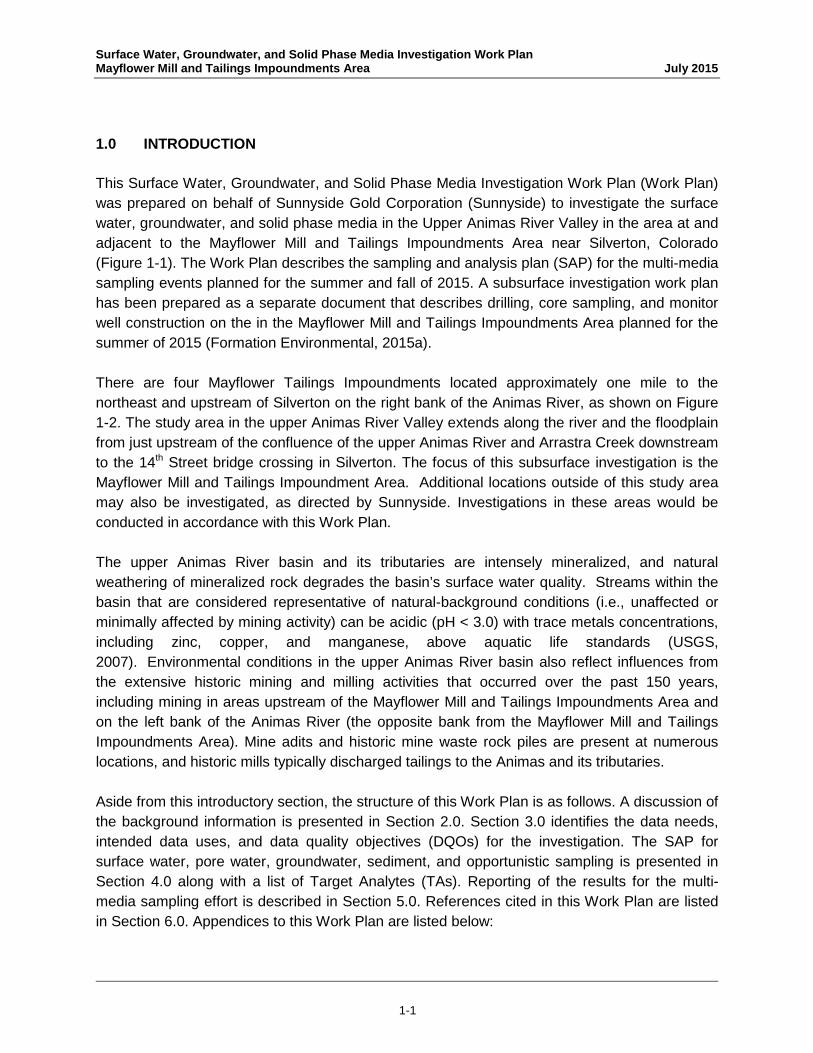
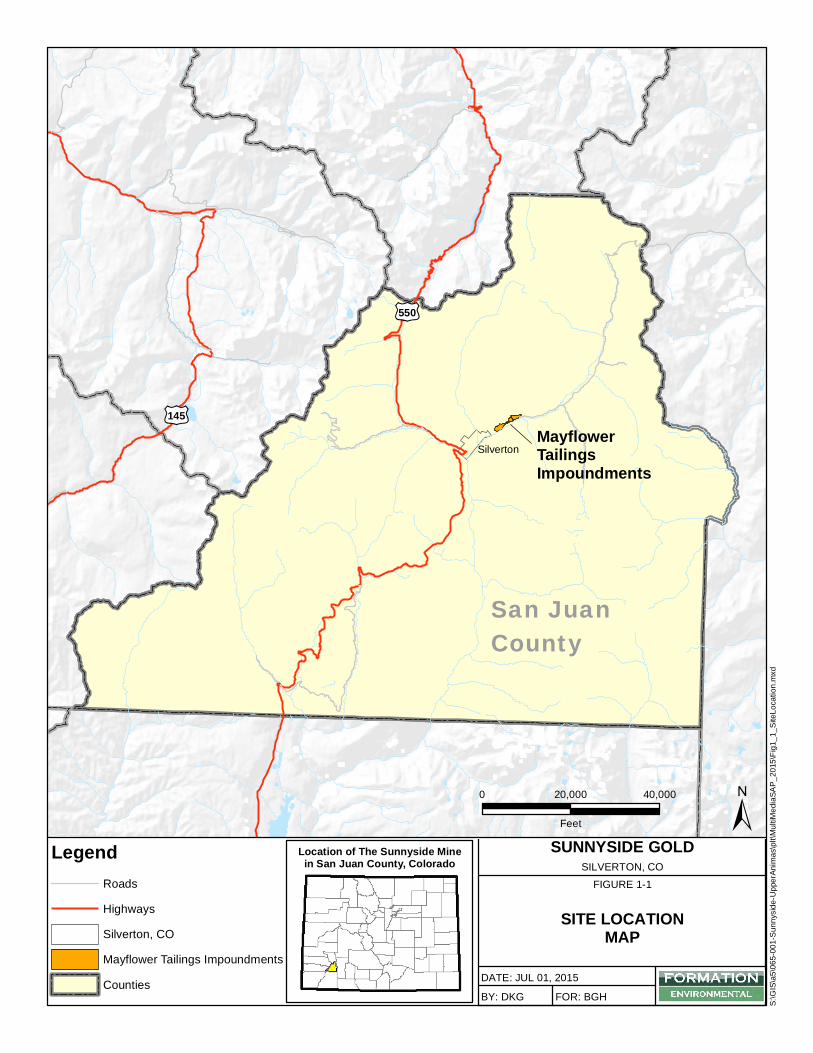
This Surface Water, Groundwater, and Solid Phase Media Investigation Work Plan (Work Plan) was prepared on behalf of Sunnyside Gold Corporation (Sunnyside) to investigate the surface water, groundwater, and solid phase media in the Upper Animas River Valley in the area at and adjacent to the Mayflower Mill and Tailings Impoundments Area near Silverton, Colorado (Figure 1-1). The Work Plan describes the sampling and analysis plan (SAP) for the multi-media sampling events planned for the summer and fall of 2015. A subsurface investigation work plan has been prepared as a separate document that describes drilling, core sampling, and monitor well construction on the in the Mayflower Mill and Tailings Impoundments Area planned for the summer of 2015 (Formation Environmental, 2015a).
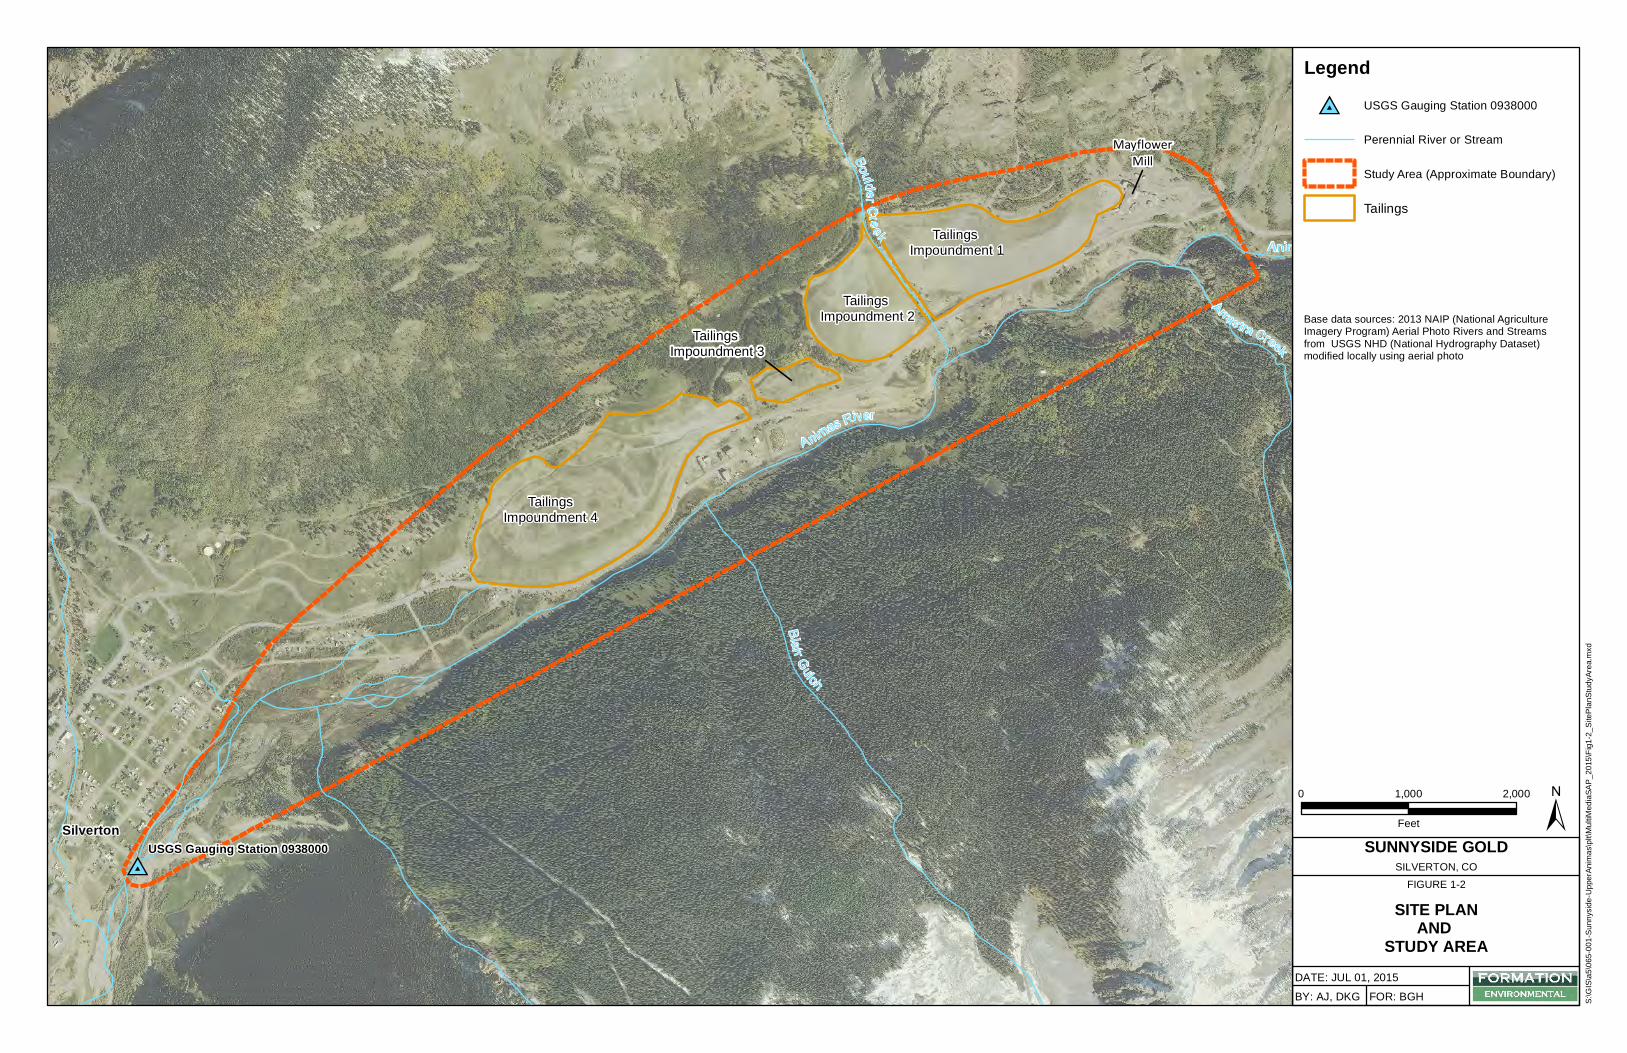
There are four Mayflower Tailings Impoundments located approximately one mile to the northeast and upstream of Silverton on the right bank of the Animas River, as shown on Figure 1-2. The study area in the upper Animas River Valley extends along the river and the floodplain from just upstream of the confluence of the upper Animas River and Arrastra Creek downstream to the 14th Street bridge crossing in Silverton. The focus of this subsurface investigation is the Mayflower Mill and Tailings Impoundment Area. Additional locations outside of this study area may also be investigated, as directed by Sunnyside. Investigations in these areas would be conducted in accordance with this Work Plan.
The upper Animas River basin and its tributaries are intensely mineralized, and natural weathering of mineralized rock degrades the basin’s surface water quality. Streams within the basin that are considered representative of natural-background conditions (i.e., unaffected or minimally affected by mining activity) can be acidic (pH < 3.0) with trace metals concentrations, including zinc, copper, and manganese, above aquatic life standards (USGS, 2007). Environmental conditions in the upper Animas River basin also reflect influences from the extensive historic mining and milling activities that occurred over the past 150 years, including mining in areas upstream of the Mayflower Mill and Tailings Impoundments Area and on the left bank of the Animas River (the opposite bank from the Mayflower Mill and Tailings Impoundments Area). Mine adits and historic mine waste rock piles are present at numerous locations, and historic mills typically discharged tailings to the Animas and its tributaries.
Aside from this introductory section, the structure of this Work Plan is as follows. A discussion of the background information is presented in Section 2.0. Section 3.0 identifies the data needs, intended data uses, and data quality objectives (DQOs) for the investigation. The SAP for surface water, pore water, groundwater, sediment, and opportunistic sampling is presented in Section 4.0 along with a list of Target Analytes (TAs). Reporting of the results for the multi-media sampling effort is described in Section 5.0. References cited in this Work Plan are listed in Section 6.0. Appendices to this Work Plan are listed below:
Surface Water, Groundwater, and Solid Phase Media Investigation Work Plan Mayflower Mill and Tailings Impoundments Area July 2015
1-2
• Appendix A: Quality Assurance Project Plan (QAPP)
• Appendix B: Standard Operating Procedures (SOP)
• Appendix C: Health and Safety Plan (HASP)
Surface Water, Groundwater, and Solid Phase Media Investigation Work Plan Mayflower Mill and Tailings Impoundments Area July 2015
2-1
2.0 BACKGROUND
Background information is described in the Subsurface Investigation Work Plan (Formation Environmental, 2015a) and the High-Flow Surface Water Investigation Work Plan (Formation Environmental, 2015b).
Surface Water, Groundwater, and Solid Phase Media Investigation Work Plan Mayflower Mill and Tailings Impoundments Area July 2015
3-2
3.0 DATA QUALITY OBJECTIVES AND DATA NEEDS
This section identifies the data needs, intended data uses, and DQOs for the multi-media investigation of the study area shown by Figure 1-2. The target analytes (TAs) for the multi-media investigation are described in Section 4.0.
This section is organized to be generally consistent with Environmental Protection Agency’s (EPA’s) guidance for application of its DQO process (EPA, 2006), which includes the seven steps listed below.
1. State the Problem 2. Identify the Goals of the Study 3. Identify Information Inputs 4. Define the Boundaries of the Study 5. Develop the Analytic Approach 6. Specify Performance and Acceptance Criteria 7. Develop the Plan for Collecting Data
Application of the DQO process results in identification of the specific types and quality of data needed to support the goals of the surface water investigation.
The DQOs listed below are in part based on the EPA SAP/QAPP for the Upper Animas Mining District (EPA 2015a) and, where appropriate, additional DQOs have been added to meet the specific objectives for the investigation of the study area.
3.1 DQO Step 1 - State the Problem
Previous investigations in the study area have identified elevated levels of metals in the waters of the upper Animas River in the vicinity of the Mayflower Mill and Tailings Impoundments Area. The materials present in the tailings impoundments may or may not be sources of metals to the river via leaching and subsurface transport by groundwater. However, the current sources of metals and their effects on river water quality remain uncertain. Therefore, additional data are needed to better understand the relationship, if any, between the Mayflower Mill and Tailings Impoundments Area and metals concentrations in surface water of the upper Animas River adjacent to and downstream from this area. More specifically, additional physical and chemical data are needed to evaluate the metals concentrations in the surface water of the upper Animas River and in groundwater at and downgradient from this area as well as left bank sources. Characterization of metals concentrations in nearby Animas River sediments and sediment pore water and soil at selected locations is also needed to better understand the nature and extent of metals contamination within the study area. Additional areas outside of the
Surface Water, Groundwater, and Solid Phase Media Investigation Work Plan Mayflower Mill and Tailings Impoundments Area July 2015
3-3
study area may be investigated, as directed by Sunnyside. Investigations in these areas would be conducted in accordance with this Work Plan.
3.2 DQO Step 2 - Identify the Goals of the Study
The key questions to be answered by the multi-media investigation are as follows:
• How do the concentrations of the TAs change in surface water in response to varying flow conditions (e.g., high flow vs. low flow)?
• How do the concentrations of the TAs change in surface water with location along the reach of interest in the study area?
• How do the concentrations of the TAs change in surface water in relation to known inflows along the reach of interest in the study area?
• What are the concentrations of the TAs in groundwater at and upgradient from the Mayflower Mill and Tailings Impoundments Area and how do concentrations vary with location and depth?
• What are the groundwater conditions (i.e., water bearing zones, depth, flow direction, and hydraulic gradient) in the Mayflower Mill and Tailings Impoundments Area?
• What is the current nature and extent of metals contamination in the Animas River sediments and pore water and how do the concentrations change with location along the reach of interest in the study area?
• What is the nature and extent of metals contamination in soil, mine waste, and tailings in selected locations within the study area?
3.3 DQO Step 3 - Identify Information Inputs
Previous investigations provided preliminary characterization of the surface water flow conditions and surface water quality in the study area in 2002 and 2003 (Kimball et al., 2010). However, since then there have been remedial actions along the Animas River, and the available data may no longer be representative of current conditions. Additionally, there are significant data gaps in the characterization of the groundwater and solid-phase media in the study area. As such, the following types of information are needed to address the study goals listed in DQO Step 2.
Surface Water, Groundwater, and Solid Phase Media Investigation Work Plan Mayflower Mill and Tailings Impoundments Area July 2015
3-4
• Concentrations of the surface water TAs at multiple locations on the upper Animas River reach of interest, including locations of inflowing water along that reach, during both relatively high-flow and low-flow conditions.
• Concentrations of sediment and pore water TAs at multiple locations on the upper Animas River reach of interest.
• Concentrations of groundwater TAs at multiple locations within study area.
• Concentrations of TAs in soil and mine wastes and the leaching potential of these solid-phase media at multiple locations within the study area.
• The available flow and water chemistry data collected by others for the upper Animas River.
• River discharge records for years 2002 through 2015 from the USGS Animas River gauging station 0935800.
• Depth to groundwater measurements at monitoring wells located in the study area.
• Field water quality parameters, observations, and measurements.
3.4 DQO Step 4 – Define the Boundaries of the Study
The spatial boundaries for the study area are shown on Figure 1-2 and extend along the river and the floodplain from just upstream of the confluence of the upper Animas River and Arrastra Creek downstream to the 14th Street bridge crossing. Additional areas outside of the study area may be investigated, as directed by Sunnyside. Investigations in these areas would be conducted in accordance with this Work Plan.
The temporal boundaries for the study begin in 2002 with the low-flow sampling event conducted by the USGS and end with the final sampling event proposed for the summer/fall of 2015.
3.5 DQO Step 5 – Develop the Analytic Approach
The following approach will be used to collect the specific types of new data needed to address the goals of the multi-media investigation. Two or more surface water synoptic sampling events are to be conducted within the reach of the upper Animas River in the study area. The events are to be conducted at relatively high-flow (sampling event was conducted in May 2015 in accordance with the High-Flow Surface Water Investigation Work Plan; Formation, 2015b) and low-flow conditions. Additionally, where feasible, the major inflows in the study area that were
Surface Water, Groundwater, and Solid Phase Media Investigation Work Plan Mayflower Mill and Tailings Impoundments Area July 2015
3-5
identified by the USGS during its 2002 study, including tributary creeks, streams, and seeps, will be sampled.). Selected groundwater monitoring wells will be sampled one or more times. Sediment and sediment pore water will be sampled one or more times in the upper Animas River. Various solid phase media (e.g., soil, tailings, mine waste, mineralized rock, etc.) will be sampled at selected locations in the study area.
The data analyses that will be performed as part of the multi-media investigation are as follows:
1. Compare the high-flow surface water monitoring results to the low-flow monitoring results. Evaluate and describe the observed differences in TA concentrations for the two distinct flow conditions.
2. Compare the upper Animas River data collected during this investigation to historical data published by others (e.g., USGS, Animas River Stake Holder Group [ARSG], and EPA).
3. Use depth-to-water data to determine groundwater flow direction(s) and hydraulic gradient(s) within the study area.
4. Evaluate the concentrations of TAs in groundwater and their spatial distribution. Develop isoconcentration contour maps for selected dissolved phase chemicals of concern, if appropriate.
5. Compare surface water and groundwater results.
Measurement errors (field and laboratory) and related uncertainties for the data collected and the results of the data-analyses described above will be evaluated and described.
3.6 DQO Step 6 – Specify Performance or Acceptance Criteria
Performance and acceptance criteria are defined and controlled through implementation of sampling and analytical methodologies that are designed to ensure that the data generated are of adequate quality for project decision-making purposes. If the quality assurance activities for sample collection and analysis specified in project documents are met, and the analytical precision and accuracy requirements specified in the QAPP (Appendix A) are met, the resulting data will be usable for characterizing the conditions in the study area and addressing the study goals stated herein.
The laboratory analysis methods need to provide quantitative data at concentrations low enough for meaningful comparison to applicable regulatory standards and/or thresholds (e.g., surface water quality standards, etc.). The proposed analytical methods and the target method detection
Surface Water, Groundwater, and Solid Phase Media Investigation Work Plan Mayflower Mill and Tailings Impoundments Area July 2015
3-6
limits and reporting limits typically achieved using the analysis method are specified in the QAPP (Appendix A).
3.7 DQO Step 7 – Develop the Plan for Obtaining Data
The basic sampling and analysis approach described in DQO Step 5 will be implemented in accordance with the more detailed plans presented in Section 4.0. The plans developed for data collection are considered resource effective approaches that provide the quantities and quality of data needed to answer the subsurface investigation questions consistent with the analytical approach (Step 5) and performance criteria (Step 6) described above.
Surface Water, Groundwater, and Solid Phase Media Investigation Work Plan Mayflower Mill and Tailings Impoundments Area July 2015
4-1
4.0 SAMPLING AND ANALYSIS PLAN
This section presents the SAP for the proposed multi-media investigation that has been developed to characterize the study area in the upper Animas River Valley (Figure 1-2). Additional areas outside of the study area may be investigated, as directed by Sunnyside. Investigations in these areas would be conducted in accordance with this Work Plan.
An adaptive management approach will be employed for this study and for future studies. As such, the investigation(s) will rely on an iterative methodology that allows for modification to the SAP as warranted by site conditions.
The QAPP is provided in Appendix A. Standard operating procedures (SOPs) that describe surface water sampling procedures and methodologies are provided in Appendix B.
4.1 Target Analytes
The TAs for this investigation have been identified for surface water, groundwater, sediment pore water, sediment, and other solid phase media such as soil, mine waste, and mineralized rock. The TAs for surface water and sediment pore water are summarized in Table 4-1. The TAs for groundwater are summarized in Table 4-2. The TAs for the sediment and other solid phase media are summarized in Table 4-3.
4.1.1 Surface Water Sampling
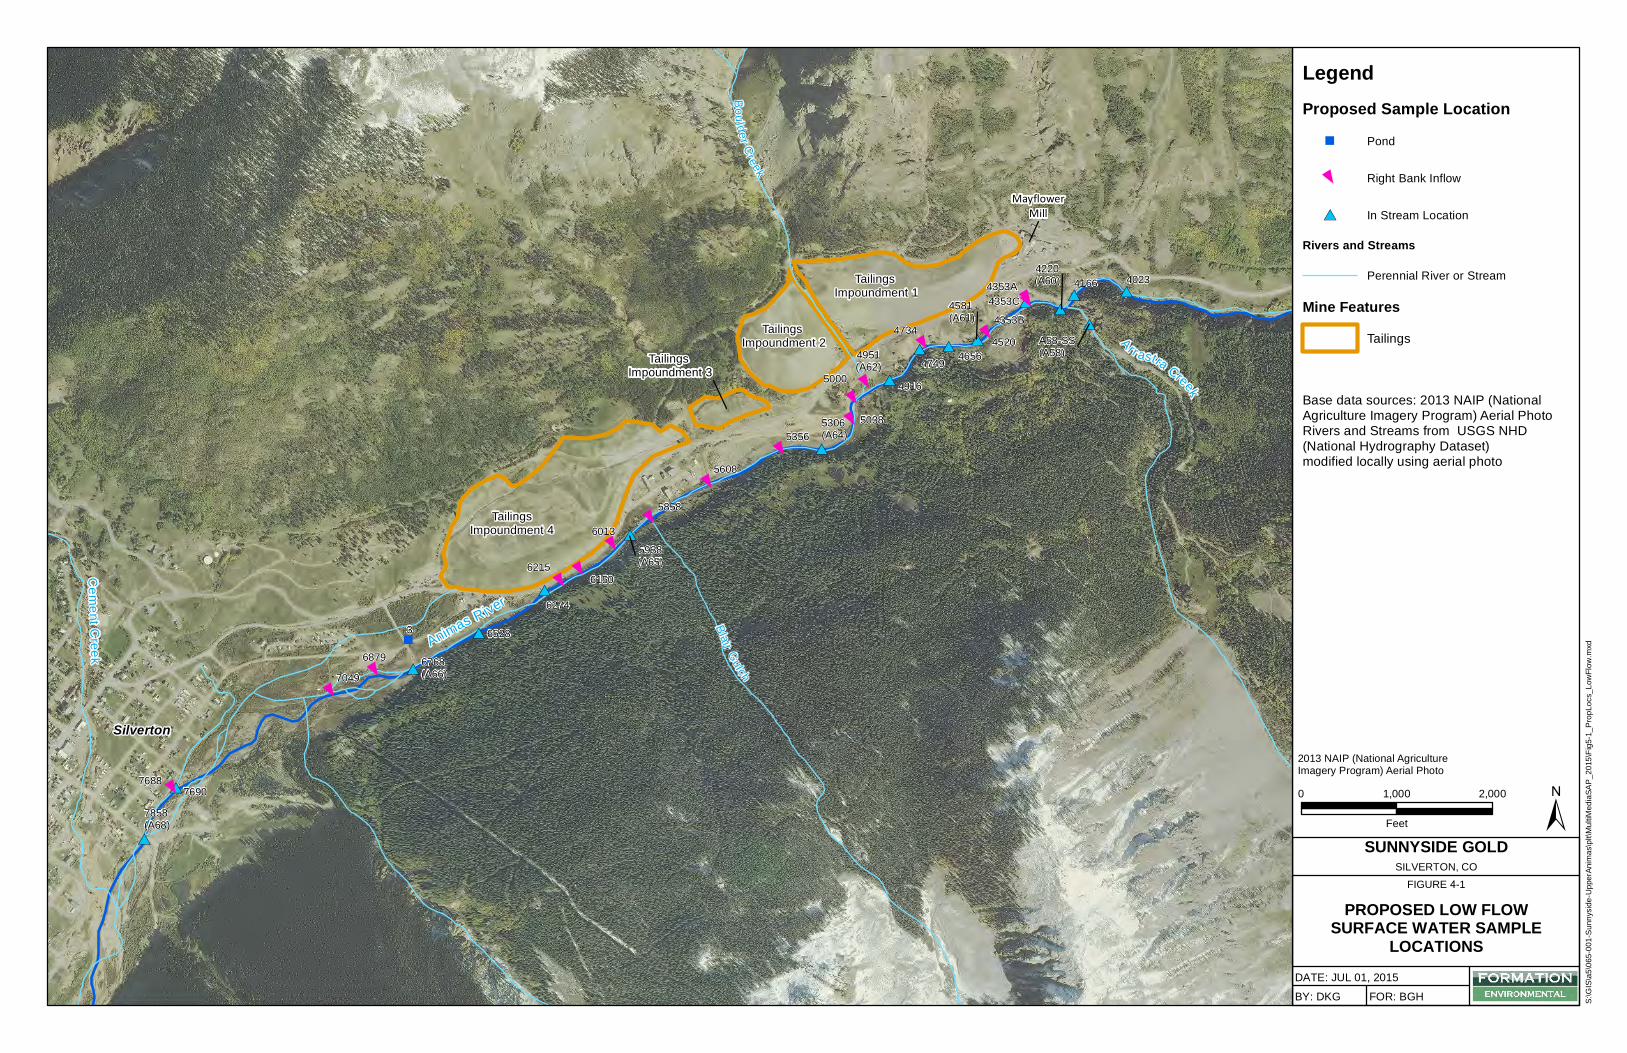
A separate high-flow surface water work plan, which includes the high-flow SAP, has been prepared and was used for the high-flow sampling event conducted in May 2015 (Formation, 2015b). Therefore, the following details the low-flow SAP. The proposed low-flow sampling event locations are listed and described in Table 4-4 and are shown on Figure 4-1. Many of the proposed locations have been historically sampled by the USGS or the ARSG. A brief description of each sample location is presented in Table 4-4. Additional samples may be added to the low-flow SAP, as directed by Sunnyside.
The surface water samples will be analyzed for the full suite of TAs listed in Table 4-1. An unfiltered and a field filtered sample will be collected at each of the sampling locations. Sample filtration methods are described in the surface water sampling SOP (Appendix B).
During the study, the data from USGS gauging station 09538000 will be used to document the stream discharge in the Animas River. Manual field discharge measurements will be performed at selected locations to the extent practical. Field discharge measurement methods are described in the QAPP (Appendix A).
Surface Water, Groundwater, and Solid Phase Media Investigation Work Plan Mayflower Mill and Tailings Impoundments Area July 2015
4-2
The sample collection methods and sample handling, preservation, and custody procedures are described in the QAPP (Appendix A) and the SOPs are included in Appendix B.
4.1.2 Pore Water Sampling
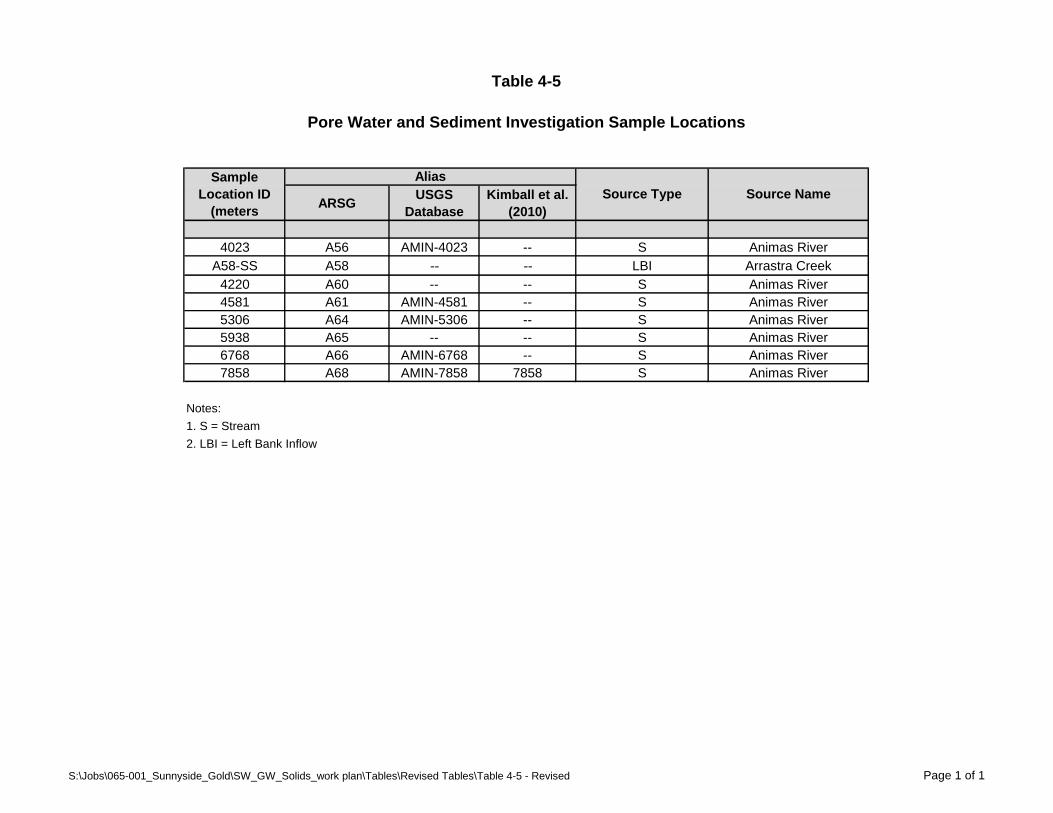
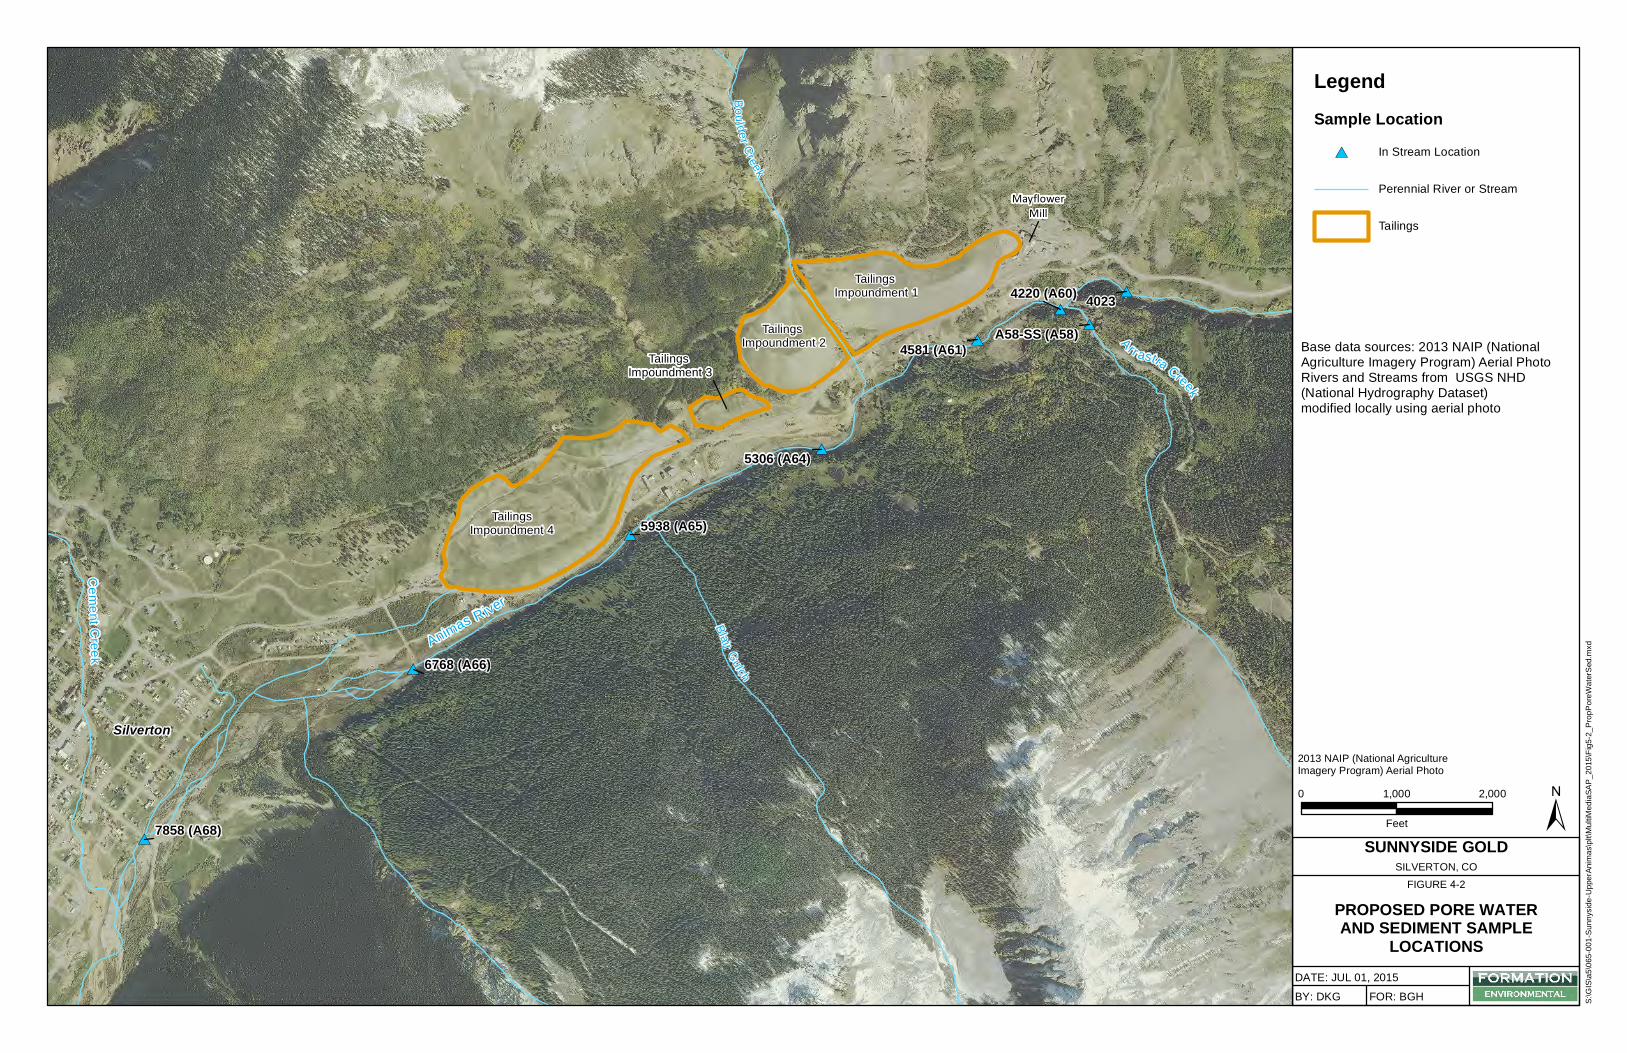
Pore water samples will be collected during the low-flow surface water sampling event. Pore water samples will be collected at selected low-flow sampling locations (e.g., those proposed by the EPA in its Upper Animas Mining District 2015 SAP/QAPP [EPA, 2015]) and will be paired with the sediment sample locations described in Section 4.1.4 of this Work Plan. The proposed low-flow pore water sampling locations are listed and described in Table 4-5 and are shown on Figure 4-2. Additional samples may be added to the low-flow pore water SAP, as needed..
The pore water samples will be analyzed for the full suite of TAs listed in Table 4-1. The data will be used for evaluating potential ecological impacts of the existing contaminants in the hyporheic zone of the streambed.
The sample collection methods and sample handling, preservation, and custody procedures are described in the QAPP (Appendix A) and the SOPs are included in Appendix B.
4.1.3 Groundwater Sampling
Groundwater samples will be collected from selected monitoring wells that will be installed pursuant to the Subsurface Investigation Work Plan (Formation Environmental, 2015a).
The groundwater samples will be analyzed for the full suite of TAs listed in Table 4-2. The sample collection methods and sample handling, preservation, and custody procedures are described in the QAPP (Appendix A) and the SOPs are included in Appendix B.
4.1.4 Sediment Sampling
Sediment samples will be collected during the low-flow surface water sampling event. Sediment samples will be collected at selected low-flow sampling locations (e.g., those proposed by the EPA in Upper Animas Mining District 2015 SAP/QAPP [EPA, 2015]) and will be paired with the sediment pore water sample locations described in Section 4.1.2 of this Work Plan. The proposed sediment locations are listed and described in Table 4-5 and are shown on Figure 4-2. Additional samples may be added to the sediment SAP, as directed by Sunnyside.
The sediment samples will be analyzed for the full suite of TAs listed in Table 4-3. Data will be used for determination of contaminant concentrations in streambed sediments.
Surface Water, Groundwater, and Solid Phase Media Investigation Work Plan Mayflower Mill and Tailings Impoundments Area July 2015
4-3
The sample collection methods and sample handling, preservation, and custody procedures are described in the QAPP (Appendix A) and the SOPs are included in Appendix B.
4.1.5 Opportunistic Samples
In addition to the proposed sample locations describe above, opportunistic surface water samples, groundwater samples, pore water samples, sediment samples and other solid phase media samples (e.g., soils, mine waste, mineralized rock) may also be collected to evaluate TA concentrations.
The opportunistic surface water and pore water samples will be analyzed for the full suite of TAs listed in Table 4-1. The opportunistic groundwater samples will be analyzed for the full suite of TAs listed in Table 4-2. The opportunistic sediment and solid phase media samples will be analyzed for the full suite of TAs listed in Table 4-3.
The sample collection methods and sample handling, preservation, and custody procedures are described in the QAPP (Appendix A) and the SOPs are included in Appendix B.
4.2 Sample Labeling
Each sample that is collected in the field will be labeled for future identification. Sample labels may be filled out as completely as possible by a member of the sampling team prior to the start of the day's field sampling activities. Samples will be labeled with all necessary information on pre-printed waterproof labels using waterproof ink. At a minimum, each sample label shall contain the following information:
• location identification;
• sample identification number (including codes for site location, sample matrix, and sample type, described in further detail below);
• date and time of sample collection;
• analyses required;
• method of preservation, if used;
• sample matrix;
• sample depth, if applicable.
Each sample shall be assigned a unique sample identification number. These numbers are required for tracking the handling, analysis, and verification or validation status of all samples collected during monitoring. Each sample identification number will identify the sampling location and type of sample. Samples to be collected will include planned soil phase media samples and QC samples.
Surface Water, Groundwater, and Solid Phase Media Investigation Work Plan Mayflower Mill and Tailings Impoundments Area July 2015
4-1
4.2.1 Surface Water, Pore Water and Sediment
For the planned surface water, pore water and sediment samples, sample identification numbers will be assigned using several codes as follows with the appropriate media type:
Sampling Event - Location – Media Type
SS0815-4023-SW
The first field in the identification number identifies the project location and event month and year. This example includes the project location, “SS” (Sunnyside) and an event month and year of “0815” (August 2015).
The second field in the identification number identifies the location of the sample. In this example, “4023” indicates the sampling location ID. Location identifiers have already been established and are included in Tables 4-4 and 4-5.
The third field identifies the sample matrix type. The matrix type is defined as “SW” to designate the matrix is surface water. The matrix type for pore water will be defined as “PW”. The matrix type for sediment will be “SED”.
Note that additional codes may be added as the project proceeds. The additions will be communicated immediately to the field staff and data management team.
The required QC samples are described in the QAPP (Appendix A). For QC samples, sample identification numbers will be assigned using the same coding described above, but also including information needed by the Formation project team to recognize the field QC samples, for example:
Sampling Event – Location - Matrix
SS0815-8000-SW
[where 8000 is for a non-existent sample location]
For multiple QC samples, the location ID will be numbered sequentially for each sample (e.g., rinsate blank = 8001, duplicate = 8002, etc.)
Field personnel will record the sample identification code with the type of QC sample (e.g., rinsate blank) and the time of sample collection in field log books.
Samples will be immediately labeled in the field and sample numbers shall be recorded at the time of sampling in field notes and on field data collection forms.
Surface Water, Groundwater, and Solid Phase Media Investigation Work Plan Mayflower Mill and Tailings Impoundments Area July 2015
4-2
4.2.2 Groundwater
For the planned groundwater samples, sample identification numbers will be assigned using several codes as follows with the appropriate media type:
Sampling Event - Location – Media Type
SS0815-MW1-SW
The first field in the identification number identifies the project location and event month and year. This example includes the project location, “SS” (Sunnyside) and an event month and year of “0815” (August 2015).
The second field in the identification number identifies the location of the sample. In this example, “MW1” indicates the sampling location monitoring well ID. Location identifiers have already been established and are included in Tables 4-4 and 4-5.
The third field identifies the sample matrix type. The matrix type is defined as “GW” to designate the matrix is groundwater.
Note that additional codes may be added as the project proceeds. The additions will be communicated immediately to the field staff and data management team.
The required QC samples are described in the QAPP (Appendix A). For QC samples, sample identification numbers will be assigned using the same coding described above, but also including information needed by the Formation project team to recognize the field QC samples, for example:
Sampling Event – Location - Matrix
SS0815-MW100-SW
[where MW100 is for a non-existent sample location]
For multiple QC samples, the location ID will be numbered sequentially for each sample (e.g., rinsate blank = MW100, duplicate = MW101, etc.)
Field personnel will record the sample identification code with the type of QC sample (e.g., rinsate blank) and the time of sample collection in field log books.
Surface Water, Groundwater, and Solid Phase Media Investigation Work Plan Mayflower Mill and Tailings Impoundments Area July 2015
4-3
Samples will be immediately labeled in the field and sample numbers shall be recorded at the time of sampling in field notes and on field data collection forms.
4.2.3 Other Solid Phase Media
For other planned solid phase media samples, sample identification numbers will be assigned using several codes as follows:
Sampling Event – Location - Depth – Matrix Type
SS0815-01-05-SO
The first field in the identification number identifies the project location and event month and year. This example includes the project location, “SS” (Sunnyside) and an event month and year of“0815” (August 2015).
The second field in the identification number identifies the location of the sample. In this example, “01” indicates the sample location.
The third field identifies the sample depth. The depth is indicated in feet below ground surface (bgs) and in this example “05” indicated 5 feet bgs.
The fourth field identifies the sample matrix type. The matrix type is defined as “SO” to designate the matrix is solid.
Note that additional codes may be added as the project proceeds. The additions will be communicated immediately to the field staff and data management team.
The required QC samples are described in the QAPP (Appendix A). For QC samples, sample identification numbers will be assigned using the same coding described above, but also including information needed by the Formation project team to recognize the field QC samples, for example:
Sampling Event – Location - Depth - Matrix
SS0815-100-01-SO
[where 100 and the depth are for a non-existent sample location]
For multiple QC samples, the depth field will be numbered sequentially for each sample (e.g., rinsate blank = 01, duplicate = 02, etc.)
Surface Water, Groundwater, and Solid Phase Media Investigation Work Plan Mayflower Mill and Tailings Impoundments Area July 2015
4-4
Field personnel will record the sample identification code with the type of QC sample (e.g., rinsate blank) and the time of sample collection in field log books.
Samples will be immediately labeled in the field and sample numbers shall be recorded at the time of sampling in field notes and on field data collection forms.
4.2.4 Opportunistic
For opportunistic samples, sample identification numbers will be assigned using the following codes:
Sampling Event - OP - Number
SS0815-OP-01
For opportunistic surface water samples, the first field in the identification number identifies the project location and event month and year. This example includes the project location, “SS” (Sunnyside) and an event month and year of “0815” (August 2015).
The second field in the identification number identifies the sample as an opportunistic sample and the third field identifies the opportunistic sample. Opportunistic samples will be numbered consecutively starting with 1. Field personnel will record the actual sample location and time in field log books.
Surface Water, Groundwater, and Solid Phase Media Investigation Work Plan Mayflower Mill and Tailings Impoundments Area July 2015
5-5
5.0 REPORTING
Upon the completion of the multi-media sampling events, a preliminary report will be prepared to briefly describe the findings of the investigation. These results will be incorporated into an annual report, which will summarize the findings from all phases of investigation conducted during 2015. This report may also include recommendations for additional investigative work.
Surface Water, Groundwater, and Solid Phase Media Investigation Work Plan Mayflower Mill and Tailings Impoundments Area July 2015
6-1
6.0 REFERENCES
EPA, 2002. Guidance for Quality Assurance Project Plans EPA QA/G-5. EPA 240-R-02-009. December.
EPA, 2006. Guidance on Systematic Planning Using the Data Quality Objectives Process. EPA
QA/G-4. February.
EPA, 2015. Sampling and Analysis Plan/Quality Assurance Project Plan, 2015 Sampling Events, Upper Animas Mining District, San Juan County, Colorado. Final Revision 0, June.
Formation Environmental, 2015a. Subsurface Investigation Work Plan, Mayflower Mill and Tailings Impoundments Area. July.
Formation Environmental, 2015b. High-Flow Surface Water Investigation Work Plan, Mayflower Mill and Tailings Impoundments Area. May.
Kimball, B.A., Runkel, R.L., and Walton-Day, K., 2010. An Approach to Quantifying Sources, Seasonal Change, and Biogeochemical Processes Affecting Metal Loading in Streams: Facilitating Decisions for Remediation of Mine Drainage. Applied Geochemistry 25 (2010) 728-740.

Tables
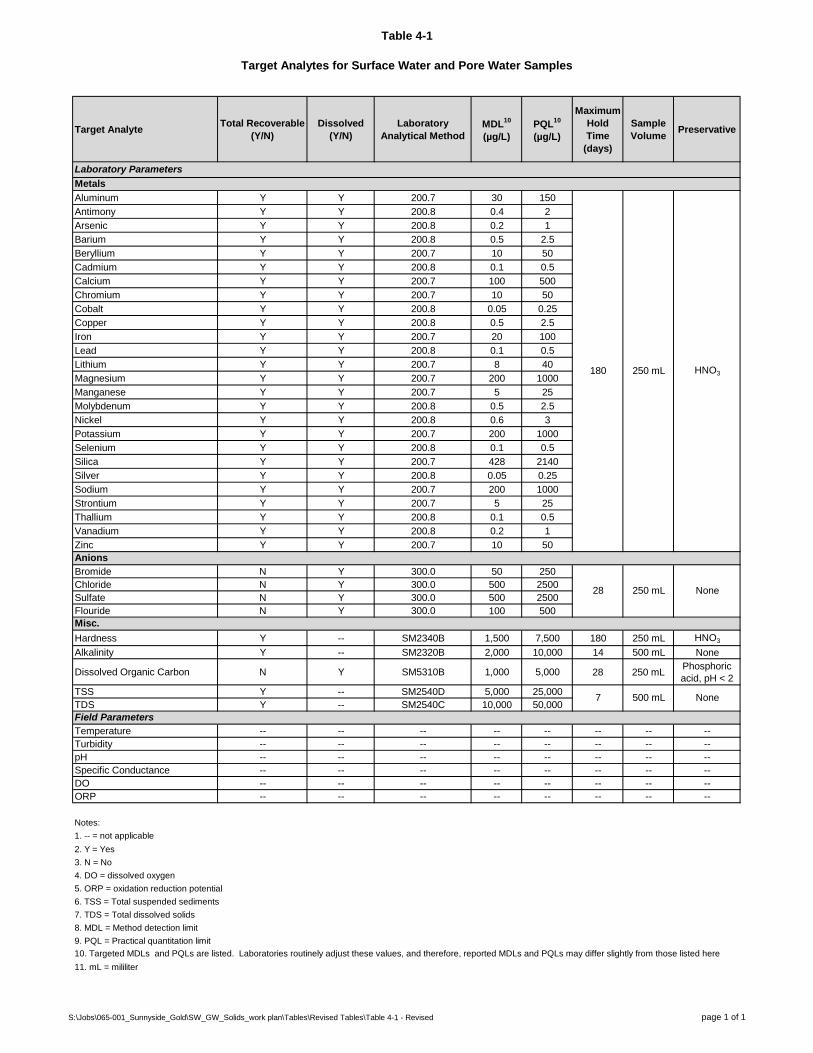
Table 4-1
Target Analytes for Surface Water and Pore Water Samples
Target Analyte Total Recoverable
(Y/N)
Dissolved
(Y/N)
Laboratory
Analytical Method
MDL10
(µg/L)
PQL10
(µg/L)
Maximum
Hold
Time
(days)
Sample
VolumePreservative
Aluminum Y Y 200.7 30 150
Antimony Y Y 200.8 0.4 2
Arsenic Y Y 200.8 0.2 1
Barium Y Y 200.8 0.5 2.5
Beryllium Y Y 200.7 10 50
Cadmium Y Y 200.8 0.1 0.5
Calcium Y Y 200.7 100 500
Chromium Y Y 200.7 10 50
Cobalt Y Y 200.8 0.05 0.25
Copper Y Y 200.8 0.5 2.5
Iron Y Y 200.7 20 100
Lead Y Y 200.8 0.1 0.5
Lithium Y Y 200.7 8 40
Magnesium Y Y 200.7 200 1000
Manganese Y Y 200.7 5 25
Molybdenum Y Y 200.8 0.5 2.5
Nickel Y Y 200.8 0.6 3
Potassium Y Y 200.7 200 1000
Selenium Y Y 200.8 0.1 0.5
Silica Y Y 200.7 428 2140
Silver Y Y 200.8 0.05 0.25
Sodium Y Y 200.7 200 1000
Strontium Y Y 200.7 5 25
Thallium Y Y 200.8 0.1 0.5
Vanadium Y Y 200.8 0.2 1
Zinc Y Y 200.7 10 50
Bromide N Y 300.0 50 250
Chloride N Y 300.0 500 2500
Sulfate N Y 300.0 500 2500
Flouride N Y 300.0 100 500
Hardness Y -- SM2340B 1,500 7,500 180 250 mL HNO3
Alkalinity Y -- SM2320B 2,000 10,000 14 500 mL None
Dissolved Organic Carbon N Y SM5310B 1,000 5,000 28 250 mLPhosphoric
acid, pH < 2
TSS Y -- SM2540D 5,000 25,000
TDS Y -- SM2540C 10,000 50,000
Temperature -- -- -- -- -- -- -- --
Turbidity -- -- -- -- -- -- -- --
pH -- -- -- -- -- -- -- --
Specific Conductance -- -- -- -- -- -- -- --
DO -- -- -- -- -- -- -- --
ORP -- -- -- -- -- -- -- --
Notes:
1. -- = not applicable
2. Y = Yes
3. N = No
4. DO = dissolved oxygen
5. ORP = oxidation reduction potential
6. TSS = Total suspended sediments
7. TDS = Total dissolved solids
8. MDL = Method detection limit
9. PQL = Practical quantitation limit
10. Targeted MDLs and PQLs are listed. Laboratories routinely adjust these values, and therefore, reported MDLs and PQLs may differ slightly from those listed here
11. mL = mililiter
Field Parameters
Misc.
Anions
Metals
Laboratory Parameters
250 mL
250 mL
500 mL
HNO3
None
180
7 None
28
S:\Jobs\065-001_Sunnyside_Gold\SW_GW_Solids_work plan\Tables\Revised Tables\Table 4-1 - Revised page 1 of 1
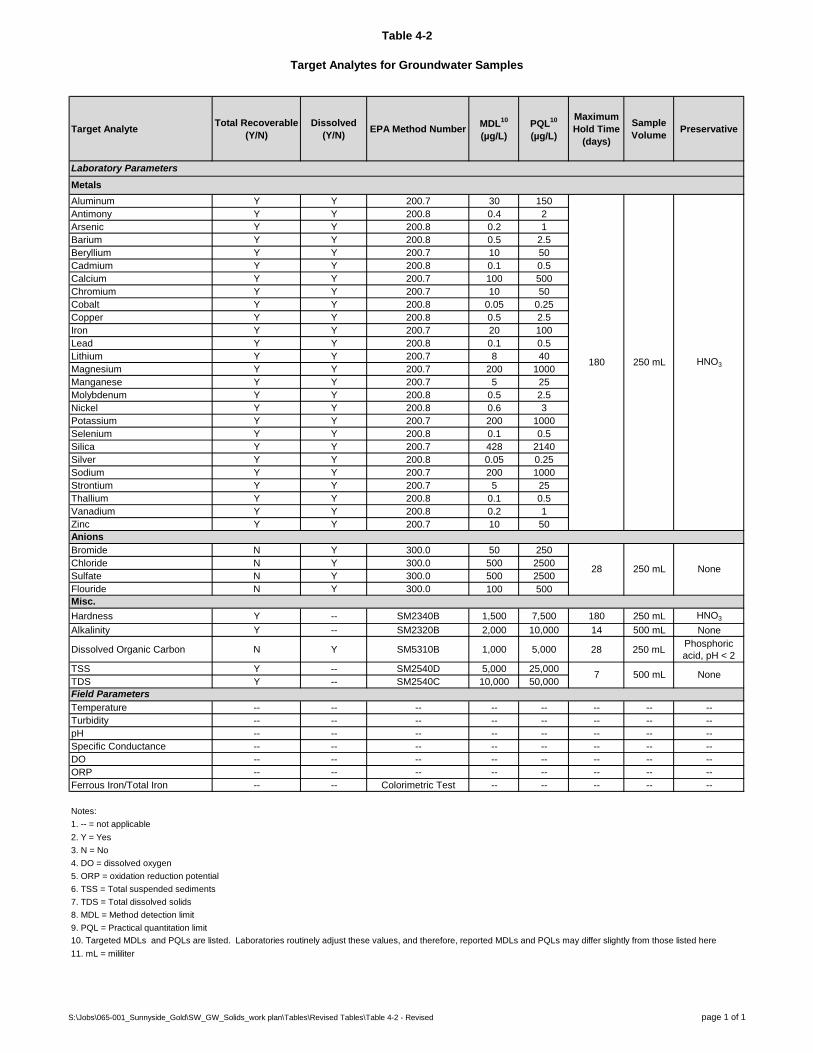
Table 4-2
Target Analytes for Groundwater Samples
Target Analyte Total Recoverable
(Y/N)
Dissolved
(Y/N)EPA Method Number
MDL10
(µg/L)
PQL10
(µg/L)
Maximum
Hold Time
(days)
Sample
VolumePreservative
Aluminum Y Y 200.7 30 150
Antimony Y Y 200.8 0.4 2
Arsenic Y Y 200.8 0.2 1
Barium Y Y 200.8 0.5 2.5
Beryllium Y Y 200.7 10 50
Cadmium Y Y 200.8 0.1 0.5
Calcium Y Y 200.7 100 500
Chromium Y Y 200.7 10 50
Cobalt Y Y 200.8 0.05 0.25
Copper Y Y 200.8 0.5 2.5
Iron Y Y 200.7 20 100
Lead Y Y 200.8 0.1 0.5
Lithium Y Y 200.7 8 40
Magnesium Y Y 200.7 200 1000
Manganese Y Y 200.7 5 25
Molybdenum Y Y 200.8 0.5 2.5
Nickel Y Y 200.8 0.6 3
Potassium Y Y 200.7 200 1000
Selenium Y Y 200.8 0.1 0.5
Silica Y Y 200.7 428 2140
Silver Y Y 200.8 0.05 0.25
Sodium Y Y 200.7 200 1000
Strontium Y Y 200.7 5 25
Thallium Y Y 200.8 0.1 0.5
Vanadium Y Y 200.8 0.2 1
Zinc Y Y 200.7 10 50
Bromide N Y 300.0 50 250
Chloride N Y 300.0 500 2500
Sulfate N Y 300.0 500 2500
Flouride N Y 300.0 100 500
Hardness Y -- SM2340B 1,500 7,500 180 250 mL HNO3
Alkalinity Y -- SM2320B 2,000 10,000 14 500 mL None
Dissolved Organic Carbon N Y SM5310B 1,000 5,000 28 250 mLPhosphoric
acid, pH < 2
TSS Y -- SM2540D 5,000 25,000
TDS Y -- SM2540C 10,000 50,000
Temperature -- -- -- -- -- -- -- --
Turbidity -- -- -- -- -- -- -- --
pH -- -- -- -- -- -- -- --
Specific Conductance -- -- -- -- -- -- -- --
DO -- -- -- -- -- -- -- --
ORP -- -- -- -- -- -- -- --
Ferrous Iron/Total Iron -- -- Colorimetric Test -- -- -- -- --
Notes:
1. -- = not applicable
2. Y = Yes
3. N = No
4. DO = dissolved oxygen
5. ORP = oxidation reduction potential
6. TSS = Total suspended sediments
7. TDS = Total dissolved solids
8. MDL = Method detection limit
9. PQL = Practical quantitation limit
10. Targeted MDLs and PQLs are listed. Laboratories routinely adjust these values, and therefore, reported MDLs and PQLs may differ slightly from those listed here
11. mL = mililiter
Laboratory Parameters
Metals
Anions
Misc.
Field Parameters
500 mL None7
180
250 mL None28
250 mL HNO3
S:\Jobs\065-001_Sunnyside_Gold\SW_GW_Solids_work plan\Tables\Revised Tables\Table 4-2 - Revised page 1 of 1
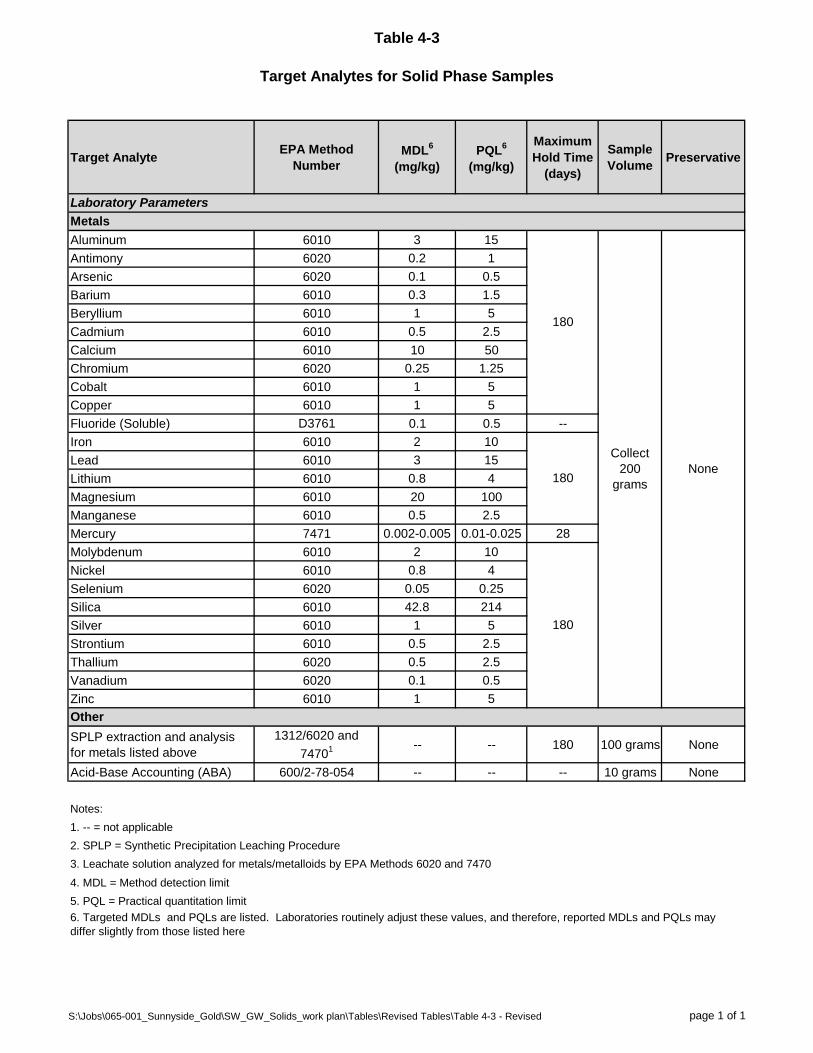
Table 4-3
Target Analytes for Solid Phase Samples
Target Analyte EPA Method
Number
MDL6
(mg/kg)
PQL6
(mg/kg)
Maximum
Hold Time
(days)
Sample
VolumePreservative
Aluminum 6010 3 15
Antimony 6020 0.2 1
Arsenic 6020 0.1 0.5
Barium 6010 0.3 1.5
Beryllium 6010 1 5
Cadmium 6010 0.5 2.5
Calcium 6010 10 50
Chromium 6020 0.25 1.25
Cobalt 6010 1 5
Copper 6010 1 5
Fluoride (Soluble) D3761 0.1 0.5 --
Iron 6010 2 10
Lead 6010 3 15
Lithium 6010 0.8 4
Magnesium 6010 20 100
Manganese 6010 0.5 2.5
Mercury 7471 0.002-0.005 0.01-0.025 28
Molybdenum 6010 2 10
Nickel 6010 0.8 4
Selenium 6020 0.05 0.25
Silica 6010 42.8 214
Silver 6010 1 5
Strontium 6010 0.5 2.5
Thallium 6020 0.5 2.5
Vanadium 6020 0.1 0.5
Zinc 6010 1 5
SPLP extraction and analysis
for metals listed above
1312/6020 and
74701 -- -- 180 100 grams None
Acid-Base Accounting (ABA) 600/2-78-054 -- -- -- 10 grams None
Notes:
1. -- = not applicable
2. SPLP = Synthetic Precipitation Leaching Procedure
3. Leachate solution analyzed for metals/metalloids by EPA Methods 6020 and 7470
4. MDL = Method detection limit
5. PQL = Practical quantitation limit
Metals
Laboratory Parameters
6. Targeted MDLs and PQLs are listed. Laboratories routinely adjust these values, and therefore, reported MDLs and PQLs may
differ slightly from those listed here
Collect
200
grams
180
None
Other
180
180
S:\Jobs\065-001_Sunnyside_Gold\SW_GW_Solids_work plan\Tables\Revised Tables\Table 4-3 - Revised page 1 of 1
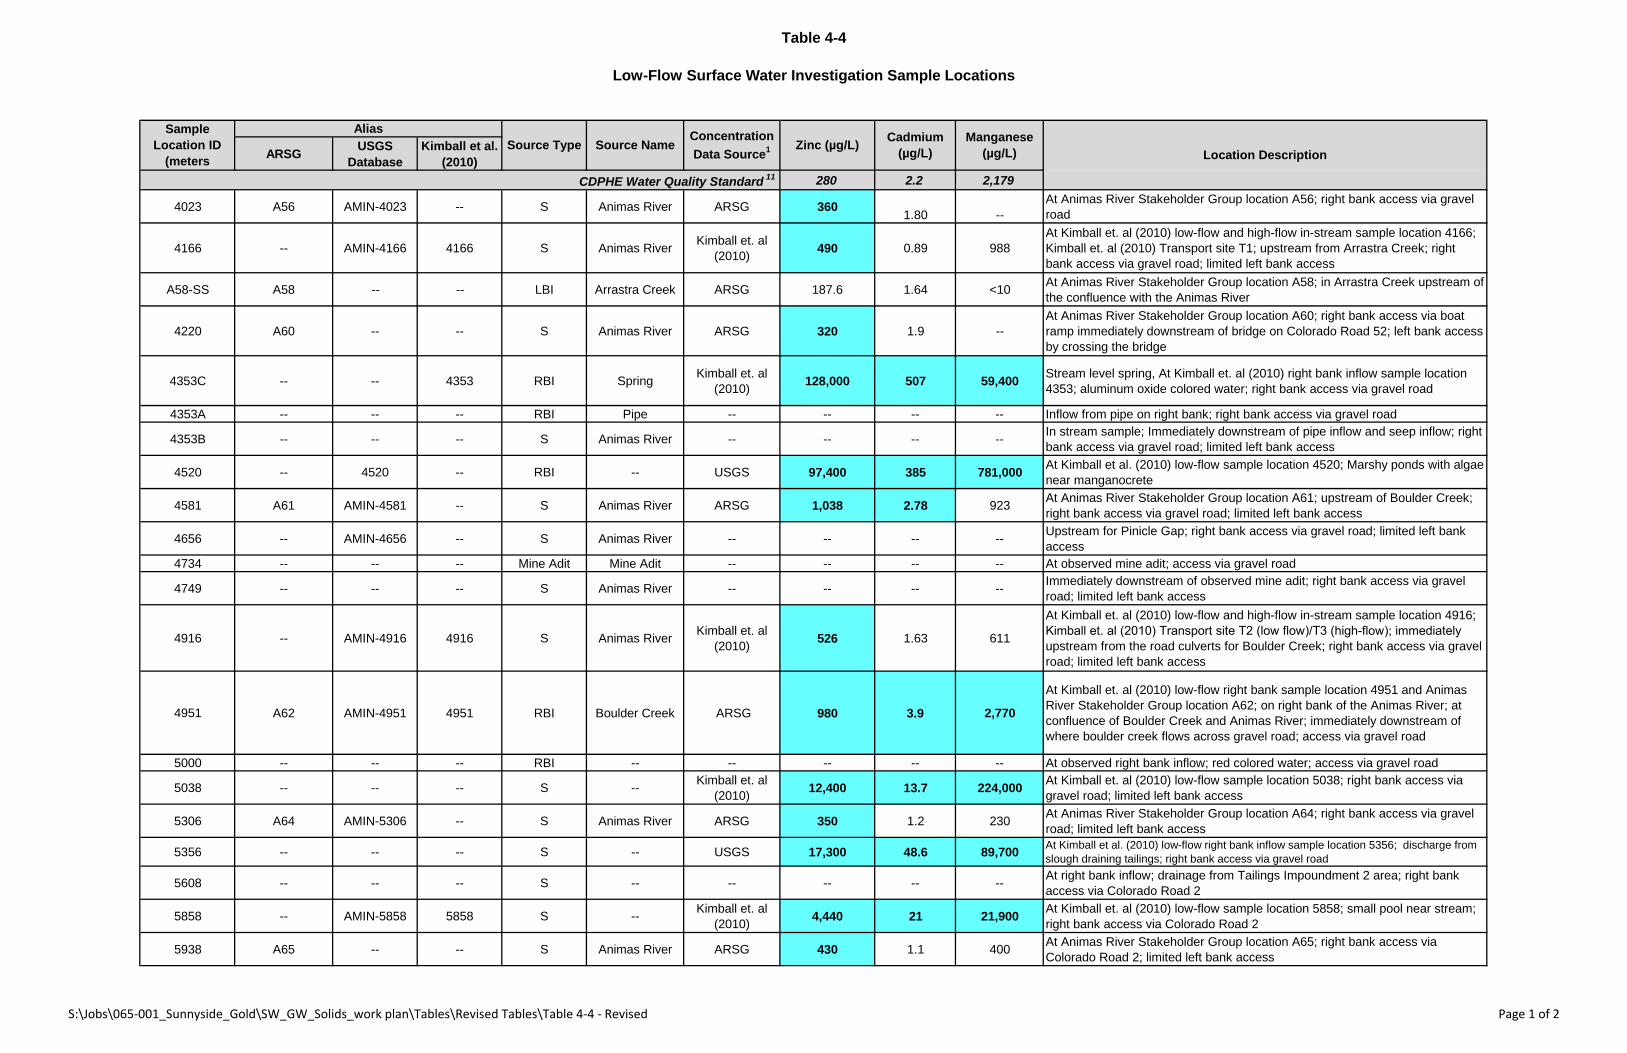
Table 4-4
Low-Flow Surface Water Investigation Sample Locations
ARSGUSGS
Database
Kimball et al.
(2010)
CDPHE Water Quality Standard11 280 2.2 2,179
4023 A56 AMIN-4023 -- S Animas River ARSG 3601.80 --
At Animas River Stakeholder Group location A56; right bank access via gravel
road
4166 -- AMIN-4166 4166 S Animas RiverKimball et. al
(2010)490 0.89 988
At Kimball et. al (2010) low-flow and high-flow in-stream sample location 4166;
Kimball et. al (2010) Transport site T1; upstream from Arrastra Creek; right
bank access via gravel road; limited left bank access
A58-SS A58 -- -- LBI Arrastra Creek ARSG 187.6 1.64 <10At Animas River Stakeholder Group location A58; in Arrastra Creek upstream of
the confluence with the Animas River
4220 A60 -- -- S Animas River ARSG 320 1.9 --
At Animas River Stakeholder Group location A60; right bank access via boat
ramp immediately downstream of bridge on Colorado Road 52; left bank access
by crossing the bridge
4353C -- -- 4353 RBI SpringKimball et. al
(2010)128,000 507 59,400
Stream level spring, At Kimball et. al (2010) right bank inflow sample location
4353; aluminum oxide colored water; right bank access via gravel road
4353A -- -- -- RBI Pipe -- -- -- -- Inflow from pipe on right bank; right bank access via gravel road
4353B -- -- -- S Animas River -- -- -- --In stream sample; Immediately downstream of pipe inflow and seep inflow; right
bank access via gravel road; limited left bank access
4520 -- 4520 -- RBI -- USGS 97,400 385 781,000At Kimball et al. (2010) low-flow sample location 4520; Marshy ponds with algae
near manganocrete
4581 A61 AMIN-4581 -- S Animas River ARSG 1,038 2.78 923At Animas River Stakeholder Group location A61; upstream of Boulder Creek;
right bank access via gravel road; limited left bank access
4656 -- AMIN-4656 -- S Animas River -- -- -- --Upstream for Pinicle Gap; right bank access via gravel road; limited left bank
access
4734 -- -- -- Mine Adit Mine Adit -- -- -- -- At observed mine adit; access via gravel road
4749 -- -- -- S Animas River -- -- -- --Immediately downstream of observed mine adit; right bank access via gravel
road; limited left bank access
4916 -- AMIN-4916 4916 S Animas RiverKimball et. al
(2010)526 1.63 611
At Kimball et. al (2010) low-flow and high-flow in-stream sample location 4916;
Kimball et. al (2010) Transport site T2 (low flow)/T3 (high-flow); immediately
upstream from the road culverts for Boulder Creek; right bank access via gravel
road; limited left bank access
4951 A62 AMIN-4951 4951 RBI Boulder Creek ARSG 980 3.9 2,770
At Kimball et. al (2010) low-flow right bank sample location 4951 and Animas
River Stakeholder Group location A62; on right bank of the Animas River; at
confluence of Boulder Creek and Animas River; immediately downstream of
where boulder creek flows across gravel road; access via gravel road
5000 -- -- -- RBI -- -- -- -- -- At observed right bank inflow; red colored water; access via gravel road
5038 -- -- -- S --Kimball et. al
(2010)12,400 13.7 224,000
At Kimball et. al (2010) low-flow sample location 5038; right bank access via
gravel road; limited left bank access
5306 A64 AMIN-5306 -- S Animas River ARSG 350 1.2 230At Animas River Stakeholder Group location A64; right bank access via gravel
road; limited left bank access
5356 -- -- -- S -- USGS 17,300 48.6 89,700At Kimball et al. (2010) low-flow right bank inflow sample location 5356; discharge from
slough draining tailings; right bank access via gravel road
5608 -- -- -- S -- -- -- -- --At right bank inflow; drainage from Tailings Impoundment 2 area; right bank
access via Colorado Road 2
5858 -- AMIN-5858 5858 S --Kimball et. al
(2010)4,440 21 21,900
At Kimball et. al (2010) low-flow sample location 5858; small pool near stream;
right bank access via Colorado Road 2
5938 A65 -- -- S Animas River ARSG 430 1.1 400At Animas River Stakeholder Group location A65; right bank access via
Colorado Road 2; limited left bank access
Location Description
Sample
Location ID
(meters
Alias
Source Type Source NameConcentration
Data Source1 Zinc (µg/L)
Cadmium
(µg/L)
Manganese
(µg/L)
S:\Jobs\065-001_Sunnyside_Gold\SW_GW_Solids_work plan\Tables\Revised Tables\Table 4-4 - Revised Page 1 of 2
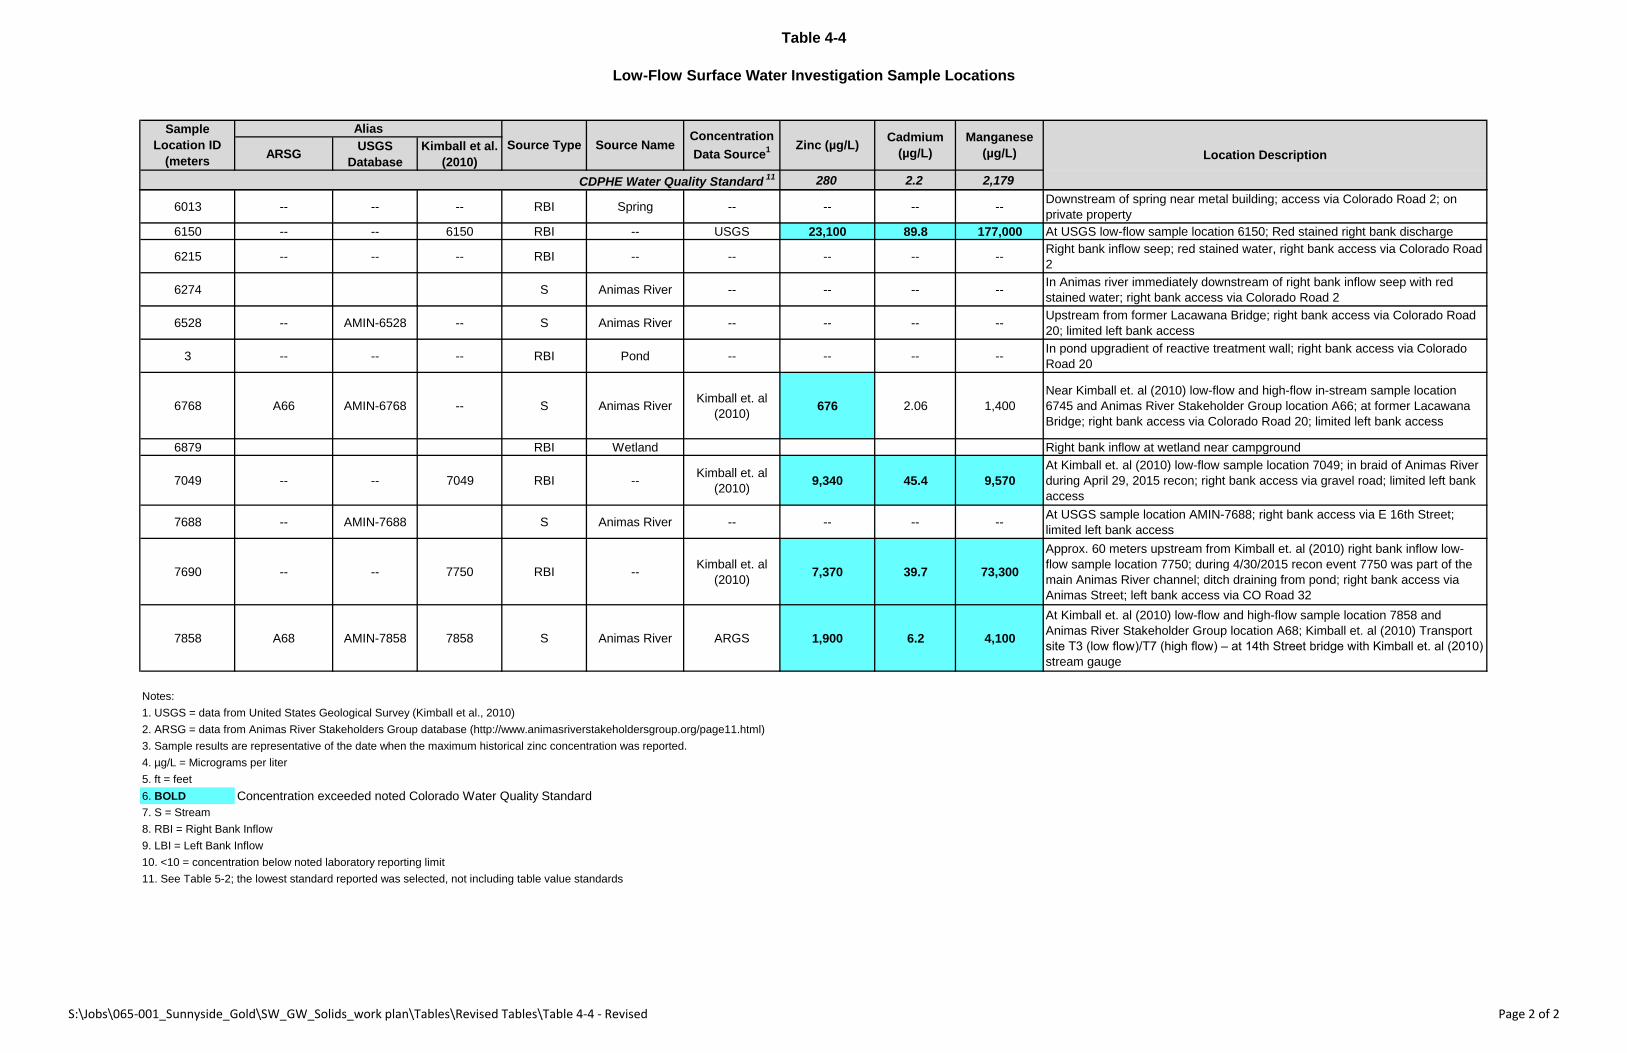
Table 4-4
Low-Flow Surface Water Investigation Sample Locations
ARSGUSGS
Database
Kimball et al.
(2010)
CDPHE Water Quality Standard11 280 2.2 2,179
Location Description
Sample
Location ID
(meters
Alias
Source Type Source NameConcentration
Data Source1 Zinc (µg/L)
Cadmium
(µg/L)
Manganese
(µg/L)
6013 -- -- -- RBI Spring -- -- -- --Downstream of spring near metal building; access via Colorado Road 2; on
private property
6150 -- -- 6150 RBI -- USGS 23,100 89.8 177,000 At USGS low-flow sample location 6150; Red stained right bank discharge
6215 -- -- -- RBI -- -- -- -- --Right bank inflow seep; red stained water, right bank access via Colorado Road
2
6274 S Animas River -- -- -- --In Animas river immediately downstream of right bank inflow seep with red
stained water; right bank access via Colorado Road 2
6528 -- AMIN-6528 -- S Animas River -- -- -- --Upstream from former Lacawana Bridge; right bank access via Colorado Road
20; limited left bank access
3 -- -- -- RBI Pond -- -- -- --In pond upgradient of reactive treatment wall; right bank access via Colorado
Road 20
6768 A66 AMIN-6768 -- S Animas RiverKimball et. al
(2010)676 2.06 1,400
Near Kimball et. al (2010) low-flow and high-flow in-stream sample location
6745 and Animas River Stakeholder Group location A66; at former Lacawana
Bridge; right bank access via Colorado Road 20; limited left bank access
6879 RBI Wetland Right bank inflow at wetland near campground
7049 -- -- 7049 RBI --Kimball et. al
(2010)9,340 45.4 9,570
At Kimball et. al (2010) low-flow sample location 7049; in braid of Animas River
during April 29, 2015 recon; right bank access via gravel road; limited left bank
access
7688 -- AMIN-7688 S Animas River -- -- -- --At USGS sample location AMIN-7688; right bank access via E 16th Street;
limited left bank access
7690 -- -- 7750 RBI --Kimball et. al
(2010)7,370 39.7 73,300
Approx. 60 meters upstream from Kimball et. al (2010) right bank inflow low-
flow sample location 7750; during 4/30/2015 recon event 7750 was part of the
main Animas River channel; ditch draining from pond; right bank access via
Animas Street; left bank access via CO Road 32
7858 A68 AMIN-7858 7858 S Animas River ARGS 1,900 6.2 4,100
At Kimball et. al (2010) low-flow and high-flow sample location 7858 and
Animas River Stakeholder Group location A68; Kimball et. al (2010) Transport
site T3 (low flow)/T7 (high flow) – at 14th Street bridge with Kimball et. al (2010)
stream gauge
Notes:
1. USGS = data from United States Geological Survey (Kimball et al., 2010)
2. ARSG = data from Animas River Stakeholders Group database (http://www.animasriverstakeholdersgroup.org/page11.html)
3. Sample results are representative of the date when the maximum historical zinc concentration was reported.
4. µg/L = Micrograms per liter
5. ft = feet
6. BOLD Concentration exceeded noted Colorado Water Quality Standard
7. S = Stream
8. RBI = Right Bank Inflow
9. LBI = Left Bank Inflow
10. <10 = concentration below noted laboratory reporting limit
11. See Table 5-2; the lowest standard reported was selected, not including table value standards
S:\Jobs\065-001_Sunnyside_Gold\SW_GW_Solids_work plan\Tables\Revised Tables\Table 4-4 - Revised Page 2 of 2
ARSGUSGS
Database
Kimball et al.
(2010)
4023 A56 AMIN-4023 -- S Animas River
A58-SS A58 -- -- LBI Arrastra Creek
4220 A60 -- -- S Animas River
4581 A61 AMIN-4581 -- S Animas River
5306 A64 AMIN-5306 -- S Animas River
5938 A65 -- -- S Animas River
6768 A66 AMIN-6768 -- S Animas River
7858 A68 AMIN-7858 7858 S Animas River
Notes:
1. S = Stream
2. LBI = Left Bank Inflow
Table 4-5
Pore Water and Sediment Investigation Sample Locations
Sample
Location ID
(meters
Alias
Source Type Source Name
S:\Jobs\065-001_Sunnyside_Gold\SW_GW_Solids_work plan\Tables\Revised Tables\Table 4-5 - Revised Page 1 of 1

Figures
Silverton
£¤145
£¤550
S:\G
IS\a
5\06
5-00
1-Su
nnys
ide-
Upp
erAn
imas
\plt\
Mul
tiMed
iaSA
P_20
15\F
ig1_
1_Si
teLo
catio
n.m
xd
DATE: JUL 01, 2015
BY: DKG FOR: BGH
0 20,000 40,000
Feet ±SUNNYSIDE GOLD
FIGURE 1-1SILVERTON, CO
SITE LOCATIONMAP
LegendRoads
Highways
Silverton, CO
Mayflower Tailings Impoundments
Counties
Location of The Sunnyside Minein San Juan County, Colorado
San Juan County
MayflowerTailingsImpoundments
#I
Silverton
MayflowerMill
Tailings Impoundment 1
Tailings Impoundment 2
TailingsImpoundment 4
Tailings Impoundment 3
Blair Gulch
BoulderC
re e k
Animas River
Arrastra Creek
Animas River
USGS Gauging Station 0938000
S:\G
IS\a
5\06
5-00
1-Su
nnys
ide-
Upp
erAn
imas
\plt\
Mul
tiMed
iaSA
P_20
15\F
ig1-
2_Si
tePl
anSt
udyA
rea.
mxd
DATE: JUL 01, 2015
BY: AJ, DKG FOR: BGH
0 1,000 2,000
Feet ±SUNNYSIDE GOLD
FIGURE 1-2SILVERTON, CO
SITE PLANAND
STUDY AREA
Legend#I USGS Gauging Station 0938000
Perennial River or Stream
Study Area (Approximate Boundary)
Tailings
Base data sources: 2013 NAIP (National Agriculture Imagery Program) Aerial Photo Rivers and Streamsfrom USGS NHD (National Hydrography Dataset)modified locally using aerial photo
#*#*#*
#*
#*
#*
#*
#*
#*
#*
#*
"
#*
#*
#*
#*#*
Blair Gulch
Bou lder C
reek
Silverton
MayflowerMill
Tailings Impoundment 1
Tailings Impoundment 2
TailingsImpoundment 4
Arr astra Creek
Cem
ent Creek
Tailings Impoundment 3
Animas R iver
402341664220(A60)
4581(A61)
4916
4951(A62)
5000
50385306(A64)
5608
5858
5938(A65)
6150
6768(A66)7049
7688
7858(A68)
A58-SS(A58)
3
6215
6013
6879
6274
4734
4353A
4353B
4353C
5356
6528
4656
7690
4749
4520
S:\G
IS\a
5\06
5-00
1-Su
nnys
ide-
Upp
erAn
imas
\plt\
Mul
tiMed
iaSA
P_20
15\F
ig5-
1_Pr
opLo
cs_L
owFl
ow.m
xd
DATE: JUL 01, 2015
BY: DKG FOR: BGH
0 1,000 2,000
Feet ±SUNNYSIDE GOLD
FIGURE 4-1SILVERTON, CO
PROPOSED LOW FLOWSURFACE WATER SAMPLE
LOCATIONS
2013 NAIP (National Agriculture Imagery Program) Aerial Photo
LegendProposed Sample Location
" Pond
Right Bank Inflow
#* In Stream Location
Rivers and Streams
Perennial River or Stream
Mine FeaturesTailings
Base data sources: 2013 NAIP (NationalAgriculture Imagery Program) Aerial Photo Rivers and Streams from USGS NHD(National Hydrography Dataset)modified locally using aerial photo
#*#*
#*
#*
#*
#*
#*
#*
Blair Gulch
Bou lder C
reek
Silverton
MayflowerMill
Tailings Impoundment 1
Tailings Impoundment 2
TailingsImpoundment 4
Arr astra Creek
Cem
ent Creek
Tailings Impoundment 3
Animas R iver
40234220 (A60)
4581 (A61)
5306 (A64)
5938 (A65)
6768 (A66)
7858 (A68)
A58-SS (A58)
S:\G
IS\a
5\06
5-00
1-Su
nnys
ide-
Upp
erAn
imas
\plt\
Mul
tiMed
iaSA
P_20
15\F
ig5-
2_Pr
opPo
reW
ater
Sed.
mxd
DATE: JUL 01, 2015
BY: DKG FOR: BGH
0 1,000 2,000
Feet ±SUNNYSIDE GOLD
FIGURE 4-2SILVERTON, CO
PROPOSED PORE WATERAND SEDIMENT SAMPLE
LOCATIONS
2013 NAIP (National Agriculture Imagery Program) Aerial Photo
LegendSample Location
#* In Stream Location
Perennial River or Stream
Tailings
Base data sources: 2013 NAIP (NationalAgriculture Imagery Program) Aerial Photo Rivers and Streams from USGS NHD(National Hydrography Dataset)modified locally using aerial photo
Appendix A – QAPP
Surface Water, Groundwater, and Solid Phase Media Investigation Work Plan Mayflower Mill and Tailings Impoundments Area APPENDIX A - Quality Assurance Project Plan (QAPP) July 2015 Prepared for: Sunnyside Gold Corporation 5075 South Syracuse Street Suite 800 Denver, CO 80237 Prepared by:
2500 55th Street, Suite 200 Boulder, Colorado 80301
Surface Water, Groundwater, and Solid Phase Media Investigation Work Plan Mayflower Mill and Tailings Impoundments Area Appendix A - Quality Assurance Project Plan July 2015
TABLE OF CONTENTS Page
LIST OF TABLES .......................................................................................................... iii LIST OF ACRONYMS .................................................................................................... iv
1.0 INTRODUCTION .................................................................................................. 1
2.0 PROJECT MANAGEMENT.................................................................................. 2 2.1 Problem Definition and Background ..................................................................... 2 2.2 Project Description ............................................................................................... 2 2.3 Project Organization ............................................................................................ 3 2.4 Quality Objectives and Criteria for Measurement Data ......................................... 4
2.4.1 Data Quality Objectives ............................................................................ 5 2.4.2 Measurement Performance Criteria - Definitions ...................................... 5 2.4.3 Measurement Performance Goals ............................................................ 7
2.5 Training Requirements ......................................................................................... 8 2.6 Documentation and Records ................................................................................ 8
2.6.1 Field Logbooks ......................................................................................... 9 2.6.2 Chain of Custody Records ...................................................................... 10 2.6.3 Analytical Laboratory Records ................................................................ 10 2.6.4 Program Quality Records ....................................................................... 10
3.0 DATA GENERATION AND ACQUISITION........................................................ 12 3.1 Sampling Design ................................................................................................ 12
3.1.1 Sampling Locations and Frequencies ..................................................... 12 3.1.2 Surface Water Sampling Methods .......................................................... 12 3.1.3 Pore Water Sampling Methods ............................................................... 13 3.1.4 Groundwater Sampling Methods ............................................................ 14 3.1.5 Sediment Sampling Methods .................................................................. 15 3.1.6 Other Solid Phase Media Sampling Methods ......................................... 15
3.2 Sample Handling, Preservation, and Custody .................................................... 15 3.2.1 Sample Containers, Preservation, and Holding Times ............................ 16 3.2.2 Sample Handling and Chain of Custody ................................................. 17
3.3 Analytical Methods ............................................................................................. 19 3.3.1 Sample Preparation ................................................................................ 19 3.3.2 Target Analyses and Methods ................................................................ 20
3.4 Quality Control ................................................................................................... 20 3.4.1 Field Quality Control Samples ................................................................ 20 3.4.2 Laboratory Quality Control Samples ....................................................... 21
3.5 Instrument/Equipment Calibration and Maintenance .......................................... 24 3.5.1 Field Equipment ..................................................................................... 24
Surface Water, Groundwater, and Solid Phase Media Investigation Work Plan Mayflower Mill and Tailings Impoundments Area Appendix A - Quality Assurance Project Plan July 2015
3.5.2 Laboratory Equipment ............................................................................ 24 3.6 Acceptance Requirements for Supplies and Consumables ................................ 25 3.7 Criteria for Use of Existing, Non-Direct Measurement Data ................................ 25 3.8 Data Management ............................................................................................. 25
4.0 DATA REVIEW, VALIDATION AND USABILITY .............................................. 28 4.1 Field Data Review .............................................................................................. 28 4.2 Laboratory Data Review ..................................................................................... 28
4.2.1 Laboratory Data Reporting Requirements .............................................. 29 4.2.2 Laboratory Electronic Data Deliverable .................................................. 31
4.3 Specific Quality Control Assessment Procedures............................................... 32 4.4 Data Quality Review and Validation ................................................................... 32
4.4.1 Evaluating Field Data ............................................................................. 32 4.4.2 Evaluating Laboratory Chemistry Data ................................................... 32
4.5 Data Usability ..................................................................................................... 35 4.6 Measurement Data Analysis and Reporting ....................................................... 35
5.0 ASSESSMENT AND OVERSIGHT .................................................................... 36 5.1 Field Performance and System Audits ............................................................... 36
5.1.1 Internal Field Audits ................................................................................ 36 5.1.2 External Field Audits .............................................................................. 37
5.2 Laboratory Performance and Systems Audits .................................................... 37 5.2.1 Internal Laboratory Audits ...................................................................... 37 5.2.2 External Laboratory Audits ..................................................................... 37
5.3 Corrective Actions .............................................................................................. 38 5.4 Corrective Action during Data Validation and Data Assessment ........................ 39 5.5 Quality Assurance Reports to Management ....................................................... 39
6.0 QAPP REFERENCES ........................................................................................ 40
Surface Water, Groundwater, and Solid Phase Media Investigation Work Plan Mayflower Mill and Tailings Impoundments Area Appendix A - Quality Assurance Project Plan July 2015
LIST OF TABLES Table Title
A2-1 Precision, Accuracy and Completeness Equations
A2-2 Summary of Calibration and QC Procedures for EPA Method 200.7 (Metals/Metalloids by ICP)
A2-3 Summary of Calibration and QC Procedures for EPA Method 200.8 (Metals/Metalloids by ICP-MS)
A2-4 Summary of Calibration and QC Procedures for EPA Method 245.1 (Mercury by CVAA)
A2-5 Summary of Calibration and QC Procedures for SM 2320B (Alkalinity)
A2-6 Summary of Calibration and QC Procedures for EPA Method 300.0 (Anions)
A3-1 Requirements for Sample Preservation and Preparation Techniques, Sample Volumes, and Holding Times
A3-2 Achievable Laboratory Limits and Screening Criteria – Aqueous Samples
A3-3 Achievable Laboratory Limits and Screening Criteria – Solid-Phase Samples
A3-4 Required Frequencies for Field QC Samples
A3-5 Required Frequencies for Laboratory QC Analyses
A3-6 EDD Specifications for the Laboratory
Surface Water, Groundwater, and Solid Phase Media Investigation Work Plan Mayflower Mill and Tailings Impoundments Area Appendix A - Quality Assurance Project Plan July 2015
LIST OF ACRONYMS CCB Continuing Calibration Blank CCV Continuing Calibration Verification CLP EPA Contract Laboratory Program COC Chain of Custody DO Dissolved Oxygen DQOs Data Quality Objectives EDD Electronic Data Deliverable FISP Federal Interagency Sedimentation Project HASP Health and Safety Plan ICB Initial Calibration Blank ICP Inductively Coupled Plasma ICP-MS Inductively Coupled Plasma-Mass Spectrometer ICV Initial Calibration Verification JSA Job Safety Analysis LCS Laboratory Control Sample LFB Laboratory Fortified Blank MDL Method Detection Limit mg/kg milligrams per kilogram mg/L milligrams per liter MS Matrix Spike MSD Matrix Spike Duplicate ND Not Detected NFGs National Functional Guidelines ORP Oxidation-Reduction Potential PQV Practical Quantitation Verification QA Quality Assurance QAPP Quality Assurance Project Plan QC Quality Control QL Quantitation Limit RPD Relative Percent Difference RSD Relative Standard Deviation SAP Sampling and Analysis Plan SOP Standard Operating Procedure EPA United States Environmental Protection Agency
Surface Water, Groundwater, and Solid Phase Media Investigation Work Plan Mayflower Mill and Tailings Impoundments Area Appendix A - Quality Assurance Project Plan July 2015
1
1.0 INTRODUCTION
This Quality Assurance Project Plan (QAPP) comprises Appendix A of the Surface Water, Groundwater, and Solid Phase Media Investigation Work Plan for the Mayflower Mill and Tailings Impoundments Area (Work Plan). The purpose of this QAPP is to describe the quality assurance and quality control (QA/QC) policies and procedures that will be used during data collection and evaluation conducted in support of the surface water, groundwater, and solid phase media investigation proposed for the study area defined in the Work Plan. Additional areas outside of this study area may be investigated, as directed by the Sunnyside Gold Corporation (Sunnyside). Investigations in these areas would be conducted in accordance with this QAPP.
The QAPP describes the measures that shall be employed during the multi-media investigation to assure that data generated are of a known and defensible quality in relation to the overall objectives of the investigation. These measures will assure that the precision and accuracy of program data are known and documented; sample collection, analysis, and reporting are complete; and samples are representative of tested environmental media. This plan also provides guidance for documentation of information collected in the field, including field quality control data; maintenance of documented sample custody and laboratory analytical procedures; and quality control data for data verification and validation.
The QAPP was prepared in accordance with EPA guidance on Quality Assurance Project Plans (EPA, 2002; EPA QA/G-5) and EPA Requirements for Quality Assurance Project Plans (EPA, 2001; EPA QA/R-5). It is comprised of the following four basic project plan elements:
• project management;
• data generation and acquisition;
• data review, validation, and usability; and
• data assessment and oversight.
The subsections that follow provide the four EPA project plan elements (EPA, 2002), and each presents the topics applicable to that element with appropriate Site-specific content, as needed for planning the investigation of environmental media in the study area.
Surface Water, Groundwater, and Solid Phase Media Investigation Work Plan Mayflower Mill and Tailings Impoundments Area Appendix A - Quality Assurance Project Plan July 2015
2
2.0 PROJECT MANAGEMENT
This section addresses project administrative functions and project concerns, goals, and approaches to be followed during implementation of the surface water, groundwater, and solid phase media investigation.
2.1 Problem Definition and Background
The upper Animas River basin and its tributaries are intensely mineralized, and natural weathering of mineralized rock degrades the basin’s surface water quality. Streams within the basin that are considered representative of natural-background conditions (i.e., unaffected or minimally affected by mining activity) can be acidic (pH < 3.0) with trace metals concentrations, including zinc, copper, and manganese, above aquatic life standards (USGS, 2007). Environmental conditions in the upper Animas River basin also reflect influences from the extensive historic mining and milling activities that occurred over the past 150 years, including mining in areas upstream of the Mayflower Mill and Tailings Impoundments Area and on the left bank of the Animas River (opposite bank as the Mayflower Mill and Tailings Impoundments area). Mine adits and historic mine waste rock piles are present at numerous locations, and historic mills typically discharged tailings to the Animas and its tributaries.
Previous investigations in the study area have identified elevated levels of metals in the waters of the upper Animas River in the vicinity of the Mayflower Mill and Tailings Impoundments Area. The materials present in the tailings impoundments may be sources of metals to the river, via leaching and subsurface transport by groundwater. However, the current sources of metals and their effects on river water quality remain uncertain. Therefore, additional data are needed to better understand the relationship, if any, between the Mayflower Mill and Tailings Impoundments Area and metals concentrations in surface water of the upper Animas River adjacent to and downstream from this area as well as left bank sources. More specifically, additional physical and chemical data are needed to evaluate the metals concentrations in the surface water of the upper Animas River and in groundwater at and downgradient from this area. Characterization of metals concentrations in nearby Animas River sediments and sediment pore water and soil at selected locations is also needed to better understand the nature and extent of metals contamination within the study area.
2.2 Project Description
The Work Plan presents the rationale and scope of data collection and monitoring activities planned to achieve the investigation objectives described above. The data collection activities associated with the surface water, groundwater, and solid media investigation are described in detail in Section 4.0 of the Work Plan.
Surface Water, Groundwater, and Solid Phase Media Investigation Work Plan Mayflower Mill and Tailings Impoundments Area Appendix A - Quality Assurance Project Plan July 2015
3
2.3 Project Organization
The multi-media investigation is being conducted by Sunnyside Gold Corporation (Sunnyside).
Sunnyside’s responsibilities include preparation of project planning documents, collection of data needed to complete the surface water, groundwater, and solid media investigation and data analysis and interpretation as needed to complete the investigation.
Sunnyside’s project team for the investigation includes:
• Formation Environmental LLC (Formation), Boulder, CO (environmental services contractor); and
• ACZ Laboratories (ACZ), Steamboat Springs, CO (analytical laboratory contractor).
Sunnyside Program Manager (Pat Maley, Sunnyside Gold Corporation [Sunnyside]).
Oversees scheduling and management of all technical and non-technical aspects of the project (e.g., field activities, data collection, data analysis, report preparation, scheduling, costing) and serves as primary point of contact with agency representatives.
Sunnyside Site Manager (Larry Perino, Sunnyside).
Reports to Sunnyside’s Program Manager and serves as the local liaison and provides access and historical knowledge for the mine site.
Sunnyside Technical Lead (Linda Schmoll, Ph.D.,Sunnyside).
Reports to Sunnyside’s Program Manager and reviews all technical aspects of the project, including work plans, QAPPs, data analyses, data reports, etc.
Sunnyside Field Representative (Terry Turner, Sunnyside).
Reports to Sunnyside’s Program Manager and oversees all field aspects of the project, including sample collection, measurements, and data collection.
Formation Project Manager (Brian Hansen, P.E., Formation)
Oversees scheduling and management of all technical and non-technical aspects of the project (e.g., field activities, data collection, data analysis, report preparation, scheduling, costing) and reports to the Sunnyside Program Manager. Directs the Field Investigations Manager and Project QA Manager. Ensures that all field personnel understand the scope of work including QA/QC requirements. Responsible for ensuring that the sampling methods and data analyses
Surface Water, Groundwater, and Solid Phase Media Investigation Work Plan Mayflower Mill and Tailings Impoundments Area Appendix A - Quality Assurance Project Plan July 2015
4
reflected in the Sampling and Analysis Plan (SAP) meet the objectives of the Work Plan. Reviews and approves project plans and all project deliverables.
Field Investigations Manager (Nat Beal, P.G., Formation)
Plans and supervises sampling and other field activities and coordinates acquisition of any necessary permits. Schedules and manages various field tasks (e.g., sample collection, measurements, data collection) and is responsible for sample transport to the laboratory. Responsible to the Sunnyside and Formation Project Managers for implementation of field sampling activities, QA/QC measures, and health and safety program requirements defined in the Appendix C of the Work Plan. The Field Investigations Manager is also responsible for ensuring that field staff have appropriate, hands-on training and properly utilize the project Standard Operating Procedures (SOPs; Appendix B of the Work Plan).
Project QA Manager (Kathy Tegtmeyer, Ph.D., Formation)
Responsible for coordinating the development and approval of the QAPP and its supporting procedures and for maintaining the current, approved version of the QAPP for use on the project. The QA Manager participates in the review and approval of all project deliverables, assists with establishing laboratory contracts, acts as a day-to-day liaison with the laboratories, directs field and laboratory audit activities, coordinates any subsequent corrective and preventive actions, if needed, and communicates regularly with the Formation Project Manager and Field Investigations Manager regarding any laboratory or data validation concerns. The QA Manager will also oversee data validation efforts and coordinate the resolution of any necessary corrective actions resulting from data validation activities, including any quality issues that may be resolved during field activities (i.e., resampling to replace unusable samples).
ACZ Project Manager (Max Janicek, ACZ)
Reviews QAPP and ensures laboratory resources are available, reviews final analytical reports produced by the laboratory, coordinates scheduling of laboratory analyses, and supervises in-house chain-of-custody procedures.
2.4 Quality Objectives and Criteria for Measurement Data
This section describes the data needed to address the study objectives as well as the measurement performance criteria established to assess the field and laboratory data quality. Measurement performance criteria are established by defining acceptance criteria and quantitative or qualitative goals (e.g., control limits) for precision, accuracy, representativeness, comparability, and completeness (PARCC). The definitions of PARCC are provided below along with the acceptance criteria for data collected in support of this investigation.
Surface Water, Groundwater, and Solid Phase Media Investigation Work Plan Mayflower Mill and Tailings Impoundments Area Appendix A - Quality Assurance Project Plan July 2015
5
2.4.1 Data Quality Objectives
The data quality objectives (DQOs) for this program are presented in Section 3.0 of the Work Plan. Consistent with EPA guidelines (EPA, 2006), the DQOs describe the systematic planning of data collection activities to assure that the proper type, quality, and quantity of data are collected. The DQOs will be fulfilled by implementation of these QA and QC activities during data collection in support of the investigation:
• Following specific sampling designs (refer to the Work Plan);
• Adherence to standardized procedures for field measurements, sampling, sample handling, and sample chain of custody (COC) procedures;
• Collection and analyses of field and laboratory QC samples, as discussed in Section 3.4.1 and in Section 3.4.2, respectively;
• Analyses of samples in accordance with standard method protocols selected to meet the project’s measurement performance goals (Section 2.4.3) and detectability requirements (Section 3.4.2);
• Adherence to the laboratory analysis methods, and their associated quality control steps, specified for analyses of environmental samples (Section 3.4.2);
• Implementation of laboratory-specific preventative maintenance measures;
• Data review and reduction by the laboratories;
• Data validation; and
• Quality auditing and corrective/preventative action processes, as described in this QAPP.
2.4.2 Measurement Performance Criteria - Definitions
The definitions of PARCC are provided below along with the acceptance criteria for data collected in support of the investigation. Equations for calculation of precision, accuracy, and completeness are also provided in Table A2-1.
Precision
Precision is the level of agreement among repeated measurements of the same characteristic. There are two general forms of uncertainty. The first is the random error component of the data collection process. The second is inherent stochastic variability, which cannot be eliminated but can be described.
Data precision is assessed by determining the agreement between replicate measurements of the same sample and/or measurements of duplicate samples. The overall random error component of precision is a function of the sampling and analytical precision and is assessed by the analysis of field duplicates. The analytical precision is determined by the analysis of field duplicates by laboratories and by replicate analyses of the same sample. An analytical duplicate is the preferred measure of analytical method precision. When analytes are present in samples
Surface Water, Groundwater, and Solid Phase Media Investigation Work Plan Mayflower Mill and Tailings Impoundments Area Appendix A - Quality Assurance Project Plan July 2015
6
at concentrations below or near the quantitation limit, precision may be evaluated using duplicate analyses of laboratory prepared samples such as duplicate laboratory control samples (LCS/LSCD) and duplicate laboratory matrix spike samples (MS/MSD).
Precision can be measured as relative percent difference (RPD) or as relative standard deviation (RSD; also known as a coefficient of variation). Formulae for both are presented in Table A2-1.
Accuracy
Accuracy is the degree of difference between the measured or calculated value and the true value. It is a measure of the bias or systematic error of the entire data collection process. Potential sources of systematic errors include:
• sample collection methods;
• physical or chemical instability of the samples;
• interference effects during sample analysis;
• calibration of the measurement system; and
• contamination.
Data accuracy or analytical bias may be evaluated by the analysis of laboratory control samples (LCS) and/or matrix spike (MS) samples, with results expressed as a percentage recovery measured relative to the true (known) concentration (refer to Table A2-1 for percent recovery calculations).
Field equipment and laboratory blanks may be analyzed to assess artifacts introduced during sampling, transport, and/or analysis that may affect the accuracy of the data. In addition, initial and continuing calibration verification samples (ICV and CCV) and initial and continuing calibration blanks (ICB and CCB) may be used to verify that the sample concentrations are accurately measured by the analytical instrument throughout the analytical run.
Representativeness
Data representativeness is defined as the degree to which data accurately and precisely represent a characteristic of a population, parameter variations at a sampling point, or environmental conditions. Representativeness is a qualitative parameter that is most concerned with the proper design of the sampling program. Representativeness of samples shall be achieved through the careful selection of sampling locations and methods. The sampling program described in Section 4.0 of the Work Plan has been designed to provide samples that are representative of the medium being sampled as well as a sufficient number of samples to meet the project DQOs.
Surface Water, Groundwater, and Solid Phase Media Investigation Work Plan Mayflower Mill and Tailings Impoundments Area Appendix A - Quality Assurance Project Plan July 2015
7
Comparability
Data comparability is defined as the measure of the confidence with which one data set can be compared to another. Comparability is a qualitative parameter but must be considered in the design of the sampling plan and selection of analytical methods, quality control protocols, and data reporting requirements.
Completeness
Completeness refers to the amount of useable data produced during a sampling and analysis program. The procedures established in this QAPP are designed to ensure, to the extent possible, that data shall be valid and usable. To achieve this objective, every effort shall be made to collect each required sample and to avoid sample loss.
2.4.3 Measurement Performance Goals
This section identifies numerical goals for precision, accuracy, and completeness for the various environmental media. Failure to meet these goals shall be considered in the data validation process described in Section 4.0.
Precision
Precision shall be determined on field data and laboratory analysis data by the analysis of field duplicates, laboratory replicates, matrix spike and matrix spike duplicate results and evaluation of the RPD for these various paired measurements. The RPD goals for measures of precision associated with the analytical methods are presented in Tables A2-2 through A2-6.
Accuracy
Sampling accuracy shall be determined by the collection and analysis of equipment blanks, at the frequencies described in Section 3.4.
Laboratory accuracy is determined by the analysis of calibration and method blanks, calibration verification samples, laboratory control samples or standard reference materials, and matrix spike samples. Method blank goals shall be that blanks contain less than the quantitation limit for each target parameter. Accuracy goals for the specific laboratory analysis methods that will be relied on to generate data for the investigation are summarized in Tables A2-2 through A2-6.
Representativeness
Representativeness is addressed by the description of the sampling techniques and the rationale used to select the sampling locations. Sampling methods are established by the SOPs provided in Appendix B of the Work Plan. Sample representativeness is also evaluated using
Surface Water, Groundwater, and Solid Phase Media Investigation Work Plan Mayflower Mill and Tailings Impoundments Area Appendix A - Quality Assurance Project Plan July 2015
8
the RPDs for field duplicate results and by a review of the results of field blanks (i.e., equipment blanks as appropriate to sampling methods).
Representativeness of individual sample analyses will be described on the basis of results obtained from associated laboratory quality control samples. The representativeness of sample analyses will be considered acceptable as long as any detectable concentrations of analytes in associated field and method blanks are less than the quantitation limit.
Comparability
Comparability shall be ensured by analyzing samples obtained in accordance with appropriate SOPs and the referenced standard laboratory analysis methods. All data should be calculated and reported in units consistent with standard reporting procedures so that the results of the analyses can be compared with those of other laboratories, if necessary. In general, data shall be reported in µg/L for water matrices.
Completeness
The project’s completeness goals are 95 percent for analyses of each sample type (i.e., surface water/pore water, groundwater, sediment, and other solid media).
2.5 Training Requirements
Field personnel shall be trained in the requirements of the Work Plan and this QAPP at a project meeting prior to the initiation of field activity. All personnel shall read the Work Plan documents, including this QAPP, prior to the start of field work and shall acknowledge that they have read the documents at the time of the project meeting. In addition, prior to conducting sampling activities, the Field Investigations Manager, or designee, shall review field procedures and sampling requirements in order to better ensure that samples are collected and handled according to Work Plan and QAPP requirements. Field personnel will also be trained in the use of field equipment, decontamination procedures, and COC procedures in accordance with SOPs used for this project (refer to Appendix B of the Work Plan). One hard copy of the current approved version of the Work Plan shall be maintained for ready-reference purposes in the field vehicle or field office. All field team members shall have access to *.pdf format files of the complete Work Plan through their personal laptop computers.
2.6 Documentation and Records
This section describes the management of project documents and records, including this QAPP. All field documentation will be conducted in accordance with the procedures described in SOP No. 1, Field Documentation (Appendix B of the Work Plan).
Surface Water, Groundwater, and Solid Phase Media Investigation Work Plan Mayflower Mill and Tailings Impoundments Area Appendix A - Quality Assurance Project Plan July 2015
9
2.6.1 Field Logbooks
Documentation of observations in the field provides information on conditions at the time of sampling and a permanent record of field activities. Field observations and data collected during sampling activities will be recorded with waterproof ink in a permanently bound weatherproof field log book with consecutively numbered pages, or on field forms associated with the individual SOPs found in Appendix B of the Work Plan. Field forms for recording various types of sampling and measurement activities. The appropriate field forms are located in the applicable SOP (refer to Appendix B of the Work Plan). The SOPs also provide instructions for recording field activities at the time of field measurements or sample collection.
Field notebook and data sheet entries will, at a minimum, include the information listed below:
• Project name and number;
• Sample location;
• Data and time of sample collection;
• Sample identification numbers;
• Description of sample (sample matrix or species);
• Number of samples collected;
• Field measurements;
• Field observations and weather conditions;
• Personnel present;
• Sampler's signature; and
• Field filtration activities and equipment, if performed.
In addition, other ancillary information shall be recorded, including:
• personnel and/or other visitors to the sampling site(s);
• weather conditions;
• presence of livestock or wild game; and
• any unusual events.
Changes or deletions in the field book or on the data sheets will be recorded with a single strike mark through the changed entry, with the sampler’s initials and the date recording the new entry. All entries must remain legible. Sufficient information should be recorded to allow the sampling event to be reconstructed without having to rely on the sampler’s memory.
Completed field forms and logbooks will be copied to the project’s quality records (refer to Section 2.6.4) in addition to copies of outgoing COCs and sample shipping documents.
Surface Water, Groundwater, and Solid Phase Media Investigation Work Plan Mayflower Mill and Tailings Impoundments Area Appendix A - Quality Assurance Project Plan July 2015
10
2.6.2 Chain of Custody Records
Documentation of sample custody must be maintained. Information on the custody, transfer, handling, and shipping of samples shall be recorded by field personnel on a COC form as specified in SOP No. 2 (Appendix B of the Work Plan), and as described in greater detail in Section 3.2.3 below.
A COC form shall be completed for each set of samples collected daily and shall contain the following information:
• sampler's signature and affiliation;
• program name and identification number;
• date and time of collection;
• sample identification number and matrix;
• analyses requested;
• number of containers;
• signature of persons relinquishing custody, dates, and times;
• signature of persons accepting custody, dates, and times;
• method of shipment; and,
• shipping papers/waybill identification number (as appropriate).
A copy of each as-transmitted COC form shall be retained in the program quality records (refer to Section 2.6.4).
2.6.3 Analytical Laboratory Records
Results received from the laboratory will be documented both in report form and in electronic format. Original hard copy and/or electronic reports and data files received from laboratories will be maintained with the program quality records, as described below. Section 4.0 presents the project’s laboratory reporting requirements in detail. The final deliverable (“data package” or “report”) issued to Sunnyside and Formation will include data necessary to complete validation of laboratory results in accordance with specifications included in Section 4.0.
2.6.4 Program Quality Records
Program quality records are defined as completed, legible documents that furnish objective evidence of the quality of items or services, activities affecting quality, or the completeness and quality of data. These records shall be organized and managed by Formation and shall include, at a minimum:
• copies of all bound field logbooks;
Surface Water, Groundwater, and Solid Phase Media Investigation Work Plan Mayflower Mill and Tailings Impoundments Area Appendix A - Quality Assurance Project Plan July 2015
11
• copies of all field documentation forms;
• field copies and original (laboratory) copies of all COC forms;
• incoming and outgoing program correspondence (letters, telephone conversation records, and e-mail messages);
• copies of all laboratory agreements and amendments thereto;
• as-received laboratory data packages (hard copy and/or electronic);
• complete laboratory data validation packages;
• documentation of field and/or laboratory audit findings and any corrective actions;
• draft and final versions of all monthly and quarterly reports; and,
• draft and final delivered versions of the investigation report(s) and supporting procedures such as statistical analyses, numerical models, etc.
The other documentation included in the program’s quality records include the approved Work Plan and QAPP, any approved revisions or addendums to the Work Plan and QAPP, and SOPs referred to for field data collection with any updates, revisions, or addendums to those SOPs approved by the Project Managers and Field Investigations Manager to address specific conditions encountered during the field investigation
Surface Water, Groundwater, and Solid Phase Media Investigation Work Plan Mayflower Mill and Tailings Impoundments Area Appendix A - Quality Assurance Project Plan July 2015
12
3.0 DATA GENERATION AND ACQUISITION
The elements in this section address management of data generation and acquisition activities.
3.1 Sampling Design
The Work Plan provides a detailed description of the sampling design, including the proposed sample locations, and total numbers of samples needed to complete the investigation. Below is a description of the investigation methods. The SOPs included in Appendix B of the Work Plan provide a more detailed description of those procedures, and they also provide information on field documentation and QA activities for the sampling team.
3.1.1 Sampling Locations and Frequencies
Comprehensive sampling activities, including sampling locations, are summarized in the Work Plan. The number and types of samples that will be collected and sampling locations are detailed in Section 4.0 of the Work Plan.
3.1.2 Surface Water Sampling Methods
Surface water samples will be collected in accordance with methods specified in SOP No. 5, Surface Water Sampling (Appendix B of the Work Plan). One or more of the eight sampling methods described in the SOP will be used for the collection of the surface water samples.
During high-flow conditions, it is anticipated that the majority of the surface water samples will be collected using the “Dipper Method”. The Dipper Method utilizes a sample container attached to a pole that is then dipped into the water body and the sample is collected as a “grab sample” from just below the surface of the water. At the seeps and springs and other features that do not have adequate water for the dipper method the direct method will be used.
During low-flow conditions, it is anticipated that majority of the surface water samples will be collected using the “Dipper Method”. At the seeps and springs and other features that do not have adequate water for the dipper method the direct method will be used. The Equal Discharge Increment Technique (EDITQ) may be used, as needed, and will require protocols specified in the “Operators Manual for the US DH-81 Depth-Integrated Suspended-Sediment Sampler” (FISP, Undated). This technique will be employed during the low-flow event at all locations that warrant its use. It will be at the discretion of the field team lead to determine if the sampling location is suitable to perform this type of sampling using the DH-81. This process of using EDITQ will provide equal sample volumes at each stream vertical sample taken from the cross-section of the stream or river.
Surface Water, Groundwater, and Solid Phase Media Investigation Work Plan Mayflower Mill and Tailings Impoundments Area Appendix A - Quality Assurance Project Plan July 2015
13
An adequate sample volume will be collected from each sample location to meet the required volume for the various laboratory analyses described in Section 3.3 of the QAPP. Depending on the sample collection method used, multiple aliquots may need to be collected to form a composite sample of adequate volume for laboratory analysis. Composite samples will be temporarily contained in an inert disposable container. A portion of the sample collected at each location will be field filtered with a 0.45 micron filter and containerized in the appropriate sample bottles. The non-filtered portion of the sample will then be containerized in the appropriate sample bottles. The remainder of the sample will be used for measurement of field parameters. Field parameters will be measured with a water quality instrument(s) in accordance with the procedures described in SOP No. 5, Water Quality Sampling (Appendix B of the Work Plan). Field parameters include: temperature, turbidity, pH, specific conductance, dissolved oxygen (DO), and oxidation reduction potential (ORP). Calibration of the instrument(s) used to measure the field parameters is described in Section 3.6.1 of this QAPP. The water quality meter(s) will be calibrated in accordance with SOP No. 31, Water Quality Meter Calibration (Appendix B of the Work Plan).
During sample collection, care will be taken to minimize disturbance of sediment at the bottom of the water body. Samples will be collected in sequential order from the furthest downstream location to the furthest upstream location, unless the sampler does not enter the water, in which case samples can be collected in the order selected by the sampling team(s) based on field logistics. All non-dedicated sampling equipment will be decontaminated between each sample location in accordance with the procedures described SOP No. 7, Equipment Decontamination (Appendix B of the Work Plan). Documentation for field sampling is described in Section 2.6 of this QAPP and sample, handling, preservation and custody procedures are described below.
Manual stream discharge measurements will be conducted, where feasible, in accordance with the methods described in SOP No. 6, Surface Water Discharge Measurement (Appendix B in the Work Plan). The selection of a discharge measurement method depends on stream flow rate and/or specific channel characteristics.
During high-flow conditions, it may be unsafe for personnel to enter the stream at a particular sample location. The health and safety plan (HASP) for this investigation is included in Appendix C of the Work Plan that includes a job safety analysis (JSA) that describes recommended safe job procedures for stream monitoring. If it is determined, based on the JSA, that conditions are unsafe then a measurement will not be taken.
3.1.3 Pore Water Sampling Methods
Pore Water samples will be collected by inserting a PushPoint® sampler into the hyporheic zone and purging until the pore water runs clear in accordance with Pore Water Sampling, SOP#FLD-10 (ESAT, 2012a; Appendix B of the Work Plan). The syringe used to extract the pore water will be rinsed three times prior to sample collection with water from the location.
Surface Water, Groundwater, and Solid Phase Media Investigation Work Plan Mayflower Mill and Tailings Impoundments Area Appendix A - Quality Assurance Project Plan July 2015
14
An adequate sample volume will be collected from each sample location to meet the required volume for the various laboratory analyses described in Section 3.3 of the QAPP. Given the limited volume of the syringe, multiple aliquots will be collected to form a composite sample of adequate volume for laboratory analysis. Composite samples will be temporarily contained in an inert disposable container. A portion of the sample collected at each location will be field filtered with a 0.45 micron filter and containerized in the appropriate sample bottles. The non-filtered portion of the sample will then be containerized in the appropriate sample bottles. The remainder of the sample will be used for measurement of field parameters. Field parameters will be measured with a water quality instrument(s) in accordance with the procedures described in SOP No. 5, Water Quality Sampling (Appendix B of the Work Plan). Field parameters include: temperature, turbidity, pH, specific conductance, dissolved oxygen (DO), and oxidation reduction potential (ORP). Calibration of the instrument(s) used to measure the field parameters is described in Section 3.6.1 of this QAPP. The water quality meter(s) will be calibrated in accordance with SOP No. 31, Water Quality Meter Calibration (Appendix B of the Work Plan).
During sample collection, care will be taken to minimize disturbance of sediment at the bottom of the water body. Samples will be collected in sequential order from the furthest downstream location to the furthest upstream location, unless the sampler does not enter the water, in which case samples can be collected in the order selected by the sampling team(s) based on field logistics. All non-dedicated sampling equipment will be decontaminated between each sample location in accordance with the procedures described SOP No. 7, Equipment Decontamination (Appendix B of the Work Plan). Documentation for field sampling is described in Section 2.6 of this QAPP and sample, handling, preservation and custody procedures are described below.
Pore water samples will not be collected during high-flow conditions because of health and safety dangers related to entering fast moving water. Therefore, these samples will only be collected during low-flow conditions. The health and safety plan (HASP) for this investigation is included in Appendix C of the Work Plan and includes a job safety analysis (JSA) that describes recommended safe job procedures for stream monitoring.
3.1.4 Groundwater Sampling Methods
Groundwater samples and water level measurements will be collected in accordance with methods specified in SOP No. 4, Groundwater Sampling and Water Level Measurements at Monitoring Wells and Piezometers (Appendix B of the Work Plan). Field parameters will be measured with a water quality instrument(s) in accordance with the procedures described in SOP No. 4, Groundwater Sampling and Water Level Measurements at Monitoring Wells and Piezometers (Appendix B of the Work Plan). Field parameters include: temperature, turbidity, pH, specific conductance, DO, and ORP. Calibration of the instrument(s) used to measure the field parameters is described in Section 3.6.1 of this QAPP. The water quality meter(s) will be calibrated in accordance with SOP No. 31, Water Quality Meter Calibration (Appendix B of the Work Plan). All non-dedicated sampling equipment will be decontaminated between each sample location in accordance with the procedures described SOP No. 7, Equipment
Surface Water, Groundwater, and Solid Phase Media Investigation Work Plan Mayflower Mill and Tailings Impoundments Area Appendix A - Quality Assurance Project Plan July 2015
15
Decontamination (Appendix B of the Work Plan). Documentation for field sampling is described in Section 2.6 of this QAPP and sample, handling, preservation and custody procedures are described below.
3.1.5 Sediment Sampling Methods
Sediment samples will be collected using dedicated Teflon scoops and placed in HDPE containers based on the protocols outlined in Shallow Stream Sediment Sampling SOP# FLD-06 (ESAT, 2012b; Appendix B of the Work Plan). Several sediment subsamples may be collected to achieve the required sample volume. These samples may be collected from a stretch of creek that is upstream and downstream of the actual sampling location. These subsamples will then be combined and homogenized back at the laboratory. No sampling equipment needs to be decontaminated since the Teflon scoops are not re-used across sampling locations.
Sediment samples will not be collected during high-flow conditions because of health and safety dangers related to entering fast moving water. Therefore, these samples will only be collected during low-flow conditions. The HASP for this investigation is included in Appendix C of the Work Plan and includes a JSA that describes recommended safe job procedures for stream monitoring.
3.1.6 Other Solid Phase Media Sampling Methods
Surface or near-surface opportunistic solid phase media samples, including but not limited to soils, mine waste, and mineralized rock, will be collected in accordance with methods specified in the Standard Operating Procedures for Soil Sampling, FLD-05 (ESAT, 2012c; Appendix B of the Work Plan). . Samples will be collected using dedicated Teflon scoops. It is expected that no sampling equipment will need to be decontaminated since the Teflon scoops are not re-used across sampling locations. In the event non-dedicated equipment is needed, all non-dedicated sampling equipment will be decontaminated between each sample location in accordance with the procedures described SOP No. 7, Equipment Decontamination (Appendix B of the Work Plan).
3.2 Sample Handling, Preservation, and Custody
This section describes sample handling requirements and COC procedures from the sample collection step through laboratory analysis and ultimate disposal. Sample custody, packaging, and shipment procedures are described in SOP No. 2, Sample Custody, Packaging and Shipment (Appendix B of the Work Plan).
Surface Water, Groundwater, and Solid Phase Media Investigation Work Plan Mayflower Mill and Tailings Impoundments Area Appendix A - Quality Assurance Project Plan July 2015
16
3.2.1 Sample Containers, Preservation, and Holding Times
Sample Containers
The laboratory will provide new, certified pre-cleaned, prepared sample containers for aqueous sample matrices (i.e., surface water, rinsates, etc.), appropriate to the list of analyses specified on Table A3-1. Solid-phase samples will be contained in sealable, plastic storage bags (e.g., Wirrl Paks or freezer-type Ziplock bags) . After the sample material has been transferred to the plastic bag, the bag will be sealed and labeled and then placed into a second, sealable plastic bag to protect the label.
The mass of material collected and contained for shipping to the laboratory will be sufficient for the list of solid-phase analyses listed in Table A3-1.
Sample Preservation and Storage
Samples are preserved in order to prevent or minimize chemical changes that could occur during transit and storage. Sample containers containing appropriate preservative are used to ensure preservation immediately upon sample collection. The contracted laboratories will provide containers and appropriate preservatives (i.e., “pre-preserved” containers), as needed for the analyses to be requested.
Aqueous samples (e.g., surface water, equipment rinsates) submitted for metals/metalloids analyses require preservation upon collection, as specified in Table A3-1. Preservation requirements are associated with the individual analyses to be performed and the referenced analytical methods.
Solid-phase samples will not require chemical preservation, but they will be maintained at low temperature during storage, handling, and shipping to the laboratory. Sample storage requirements are listed in Table A3-1.
Sample Holding Times
Sample holding times are established to minimize chemical changes in a sample prior to analysis and/or extraction. A holding time is defined as the allowable time between sample collection and analysis recommended to ensure accuracy and representativeness of analysis results, based on the nature of the analyte of interest and chemical stability factors.
Immediately after collection, samples shall be placed in field coolers with wet ice and/or blue ice. If there is no likelihood that a holding time will be violated, samples may be transferred to a locked refrigerator for one or more days of storage prior to shipping to a laboratory. Transfer to the laboratory for analysis should be prompt to minimize the possibility of exceeding holding times.
Surface Water, Groundwater, and Solid Phase Media Investigation Work Plan Mayflower Mill and Tailings Impoundments Area Appendix A - Quality Assurance Project Plan July 2015
17
Holding times for the chemical constituents for which samples will be analyzed are summarized in Table A3-1. Failure to conduct analyses within the required holding times may result in qualification of associated analytical results and shall prompt appropriate corrective and preventive action measures as outlined in Section 4.4.
3.2.2 Sample Handling and Chain of Custody
Sample Handling and Shipping
After collection, sample labels will be completed and the samples will be placed on ice in an insulated cooler. After labeling, each individual sample will be placed in re-closeable freezer-type plastic storage bags. Each sample container will be carefully packaged in a shipping container, typically an ice chest, with Styrofoam® peanuts or other packing material to prevent breakage during shipment. Ice placed in the cooler will be double-bagged to prevent leakage of water. The coolers will be taped shut and the tape will be placed over the custody seal (see below).
Chain of Custody
After samples have been collected, they will be maintained under strict COC protocols. The field sampling personnel will complete a COC form (refer to SOP No. 2, Appendix B of the Work Plan) for each shipping container (i.e., cooler, ice chest or other container) of samples to be delivered to the laboratory for analysis. The sampler is responsible for initiating and filling out the COC form. The COC for a shipping container will list only those samples in that shipping container. Information contained on the triplicate, carbonless COC form will include the following:
• Project number;
• Date and time of collection;
• Sample identification number;
• Sample matrix;
• Analyses requested;
• Number of containers/bags for each sample;
• Sample preservation;
• Field filtration, if applicable;
• Sampler's signature and affiliation;
• Signature of persons relinquishing custody, dates, and times;
• Signature of persons accepting custody, dates, and times;
• Method of shipment;
Surface Water, Groundwater, and Solid Phase Media Investigation Work Plan Mayflower Mill and Tailings Impoundments Area Appendix A - Quality Assurance Project Plan July 2015
18
• Shipping air bill number (if the samples are shipped);
• Condition of samples and cooler temperature upon receipt by laboratory; and
• Any additional instructions to the laboratory.
Any documentation, including COCs, placed inside the cooler during sample shipment, should be placed inside a re-closeable plastic bag.
The sampling personnel whose signature appears on the COC is responsible for the custody of the samples from the time of sample collection until custody of the samples is transferred to a designated laboratory, a courier, or to another project employee for the purpose of transporting the sample to the designated laboratory. The sample is considered to be in custody when the sample is: (1) in the direct possession of the sample custodian; (2) in plain view of the sample custodian or (3) is securely locked in a restricted-access area by the sample custodian. Custody is transferred when both parties to the transfer complete the portion of the COC under "Relinquished by" and "Received by." Signatures, printed names, company names, dates and times are required. Upon transfer of custody, the sampling personnel who relinquished the samples will retain the third sheet (pink copy) of the COC. When the samples are shipped by a common carrier, a Bill of Lading supplied by the carrier will be used to document the sample custody, and its identification number will be entered on the COC. Copies, receipts and carbons of Bills of Lading will be retained as part of the permanent documentation in the project file. It is not necessary for courier personnel to sign the COC.
When the analytical laboratory receives the samples, the COC will be immediately signed along with the date and time of receipt. The top sheet (white copy) or a copy of the COC may be returned with the final analytical report. The laboratory will follow appropriate chain-of-custody procedures when shipping any samples to a subcontracted laboratory for analysis. A copy of all inter-lab COCs will be included with the final analytical report.
Laboratory Sample Handling and Storage
Upon receipt by the laboratory, the samples will be inspected for sample integrity and proper preservation, including temperature. The COC will be reviewed to verify completeness. Any discrepancies between the COC and sample labels and any problems or questions noted upon sample receipt will be communicated immediately to the Formation QA Manager. The laboratory shall provide the Formation QA Manager with a copy of the COC, and associated sample-receipt information, within 2 working days of receipt of samples. The sample-receipt information routinely provided will include: sample receipt date, sample ids transcribed from the COCs, sample matrix type, list of analyses to be performed for each sample, and verification of sample temperatures and preservation requirements. Broken custody seals, damaged sample containers, sample labeling discrepancies between container labels and the COC form, and analytical request discrepancies shall be noted on the COC form. The Formation QA Manager
Surface Water, Groundwater, and Solid Phase Media Investigation Work Plan Mayflower Mill and Tailings Impoundments Area Appendix A - Quality Assurance Project Plan July 2015
19
shall be notified of any such problems; discrepancies or non-conformances shall be resolved and addressed prior to the samples being released to the laboratory for analysis.
The laboratory will store the samples in a specially designated area, which is clean and maintained at the appropriate preservation temperature, if necessary. The laboratory will be responsible for following their internal custody procedures from the time of sample receipt until sample disposal. At a minimum, the following procedures shall also be in place for laboratory storage of samples:
• samples and extracts shall be stored in a secure area controlled by the laboratory’s designated sample custodian;
• samples shall be removed from the shipping container and stored in their original containers unless damaged; damaged samples shall be disposed in an appropriate manner after notifying the Formation QA Manager, and authorization to dispose is received and documented;
• whenever samples are removed from storage, removal shall be documented;
• sample transfers shall be documented on internal COC records;
• samples and extracts shall be stored after completion of analyses in accordance with contractual requirements; and
• Samples shall not be stored with standards or sample extracts.
3.3 Analytical Methods
Samples will be prepared and analyzed using standard laboratory procedures and methods according to performance criteria identified in the following sections.
3.3.1 Sample Preparation
The laboratory analytical parameters and targeted method detection limits and/or quantitation limits and analytical methods for the laboratory analyses of water samples are specified in Table A3-2. The laboratory analytical parameters and targeted method detection limits and/or quantitation limits and analytical methods for analyses of solid-media samples are specified in Table A3-3.
Preparation of water samples shall be in accordance with the method specifications included in Table A3-1, or method 200.2 for total recoverable metals, as well as standard laboratory practices. Preparation of solid-phase samples, including sediment and soil, shall be in accordance with the method specifications included in Table A3-1.
Surface Water, Groundwater, and Solid Phase Media Investigation Work Plan Mayflower Mill and Tailings Impoundments Area Appendix A - Quality Assurance Project Plan July 2015
20
3.3.2 Target Analyses and Methods
The target analytes (TAs) for the project include both laboratory and field parameters and are described in detail in Section 4.1 of the Work Plan. Laboratory parameters for aqueous and solid-phase sample types are listed in Tables A3-2 and A3-3 of this QAPP, respectively.
A copy of the appropriate sample-analysis and method table, by sample type, will be included in each batch of samples submitted to the laboratory for analyses to accurately document the analyses being requested.
3.4 Quality Control
There is potential variability in any sample collection, analysis, or measurement activity. This section describes checks that will be performed to evaluate that variability.
3.4.1 Field Quality Control Samples
Field quality control samples are introduced into the measurement process to provide information on transport, storage and field handling biases and on field sampling precision. Field blank samples and field duplicate samples will be collected. Field blank samples may be identified to the laboratory so that they are not used for preparation of an analytical duplicate or matrix spike sample. Descriptions and frequencies of these QC samples are provided below. Table A3-4 summarizes the minimum required frequencies for the field QC samples.
Equipment-Rinsate Blanks
Analyses of equipment-rinsate blanks quantify artifacts introduced into the sample during collection. Potential sources of bias or cross-contamination include sampling gloves and sampling equipment that may incidentally come into contact with the sample. An equipment rinsate blank consists of analyte-free, reagent-grade water (e.g., ASTM Type II) poured through the sampling equipment, collected in a clean suite of sample bottles, and preserved as needed.
Equipment rinsates shall be collected whenever sampling equipment is reused (and decontaminated) between sampling locations. In such cases, equipment rinsates will be collected at rate of 1 per 10 field samples (see Table A3-4). The equipment rinsate blanks will be analyzed for total metals analyses as well as hardness, fluoride, chloride, sulfate, bromide and dissolved organic carbon, as listed in Table 3-4. Equipment rinsates collected with solid-phase samples will be analyzed for parameters listed in Table A3-4.
Filter Blanks
A filter blank quantifies any artifacts that could be introduced into the sample during filtration. One filter blank will be collected during each separate sampling event at a rate of one filter blank
Surface Water, Groundwater, and Solid Phase Media Investigation Work Plan Mayflower Mill and Tailings Impoundments Area Appendix A - Quality Assurance Project Plan July 2015
21
for each batch of filters used during collection of aqueous samples. The blank sample will consist of one container of filtered water and one container of unfiltered water so that the analysis results can be compared. Analyte-free, reagent-grade water will be poured directly into the sample container for the unfiltered portion, and analyte-free, reagent-grade water will be passed through an unused filter into a separate container for the filtered portion. Both containers will be sent to the laboratory for analyses specified in Table A3-4.
Field Duplicates
Field duplicates are collected to measure the combined sampling and analytical variability associated with the sample results. Duplicate samples are usually collected simultaneously with or immediately after the corresponding original samples have been collected, depending on the sample type and medium and consistent with detailed instructions in the relevant SOPs for sample collection. In all cases, the same sampling protocol is used to collect the original sample and the field duplicate sample. The field duplicate is analyzed for the same suite of analytical parameters as the original sample.
There are no EPA-recommended criteria for evaluation of field duplicate sample comparability; however, the RPD between the original sample and field duplicate can be calculated for each parameter and compared to the project's precision goal. The TA concentrations reported for the field duplicate pairs will be qualified based on the field duplicate RPD results. Possible causes for the observed variability in duplicate samples should be evaluated and explained in the investigation report.
For aqueous samples, field duplicates will be collected at a rate of 1 per 10 samples. These samples will be analyzed for the TAs listed in Table A3-4. The field-duplicate pairs with RPDs greater than 30% (if sample and duplicate concentrations are ≥ 5X QL) will be qualified as estimated (“J” detects and “UJ” for nondetects) and professional judgment will be used regarding flagging other samples in the data set.
For solid-phase media, field duplicates will be collected at a rate of 1 per 10 samples. These samples will be analyzed for the TAs listed in Table A3-4. For the solid media samples, field-duplicate pairs with RPDs greater than 50% will be qualified as estimated.
3.4.2 Laboratory Quality Control Samples
Laboratory quality control samples are introduced into the measurement process to evaluate laboratory performance and sample measurement bias. Control samples may be prepared from environmental samples or be generated from standard materials in the laboratory. The appropriate type and frequency of laboratory QC samples will be dependent on the sample matrix, analytical method, and the laboratory’s SOP. Laboratory QC samples will be analyzed in addition to the calibration samples with each QC batch.
Surface Water, Groundwater, and Solid Phase Media Investigation Work Plan Mayflower Mill and Tailings Impoundments Area Appendix A - Quality Assurance Project Plan July 2015
22
Table A3-5 summarizes the minimum required frequencies for the laboratory QC samples. A laboratory method blank, laboratory control sample, analytical duplicate, and a pair of matrix spike samples should be run in each laboratory QC batch at a frequency of 1 each per 20 field samples shown in Table A3-5. Field staff responsible for collection and shipping of samples to the laboratory shall designate the samples to be used for laboratory QC analyses on the COC forms. In the event that such instructions are not included, the laboratory shall always utilize samples submitted from the investigation for preparation of laboratory duplicates and matrix spike samples used for batch QC analyses.
Method Blanks
Method blanks shall be used for the laboratory processes. A method blank is a volume of deionized water that is carried through the entire sample preparation and analysis procedure. The method blank volume or weight shall be approximately equal to the sample volumes or sample weights being processed. Method blanks are used to monitor interference caused by constituents in solvents and reagents and on glassware and other sampling equipment.
Project target analytes must not be detected in laboratory method blanks at concentrations greater than the Quantitation Limit (QL). Method blank contamination, if found, will be addressed in accordance with the response actions given in Tables A2-2 through A2-6, as appropriate to the analytical methods. Method blanks will be evaluated during the data validation process, and associated sample results may be qualified on the basis of blank contamination.
Laboratory Control Samples
A laboratory control sample (LCS)/laboratory fortified blank (LFB), or a blank spike, is an aqueous or solid control sample of known composition that is analyzed using the same sample preparation, reagents, and analytical methods employed for the program samples. An LCS/LFB is obtained from an outside source or is prepared in the laboratory by spiking reagent water or a clean solid matrix for a stock solution that is different than that used for the calibration standards. The LCS/LFB is the primary indicator of process control used to demonstrate whether the sample preparation and analytical steps are in control, apart from sample matrix effects. LCS/LFB samples will be run with all samples at the frequencies specified herein.
Analytical Duplicates
Analytical duplicates are samples that are split at some step in the measurement process and then carried through the remaining steps of the process. Duplicate analyses provide information on the precision of the operations involved.
Surface Water, Groundwater, and Solid Phase Media Investigation Work Plan Mayflower Mill and Tailings Impoundments Area Appendix A - Quality Assurance Project Plan July 2015
23
• Analytical duplicates are a pair of subsamples from a field sample that are taken through the entire preparation and analysis procedure; any difference between the results indicates the precision of the entire method in the given matrix.
• Under certain method protocols (refer to Tables A2-2 through A2-6), the matrix spike is duplicated, to provide a matrix spike duplicate, and serves as the analytical duplicate sample.
Analyses of analytical duplicates and/or matrix spike duplicates monitor the precision of the analytical process.
Matrix Spikes
A matrix spike is prepared by adding an analyte to a subsample of a field sample before sample preparation and analysis. For multi-analyte methods, a representative suite of the analytes is used in the matrix spike. From the concentrations of the analyte in the spiked and unspiked samples, a percent recovery is calculated. Many samples show matrix effects in which other sample components interfere with the determination of the analyte. The value of the percent recovery indicates the extent of the interference.
Laboratory matrix spike samples are used to evaluate potential sample matrix effects on the accurate quantitation of an analyte using the prescribed analytical method. Percent recoveries of target analytes from matrix spike samples should fall within the prescribed control limits. Matrix interference and other effects may cause low or high percent recoveries in investigative samples; matrix effects may be noted at the same time that recoveries from laboratory control samples indicate acceptable method performance.
Site-specific samples shall be used to prepare the MS/MSD samples. Field sampling personnel will collect extra volume and designate on the COC forms the samples that are to be used for the MS/MSD. Every effort will be made to ensure that these samples are representative of the general sample matrix of samples collected on that sampling data. Equipment rinsates and filter blanks are not designated for MS/MSD.
The laboratories will be instructed to use spike concentrations that are consistent with criteria provided in the National Functional Guidelines for Inorganic Data Validation (EPA, 2004) and any specific instructions provided in the referenced analytical methods.
Performance Evaluation Samples
Program-specific laboratory performance evaluations via performance evaluation samples are not anticipated as part of this investigation, but may be included later if analytical or validation exercises indicate the presence of potential laboratory QA issues.
Surface Water, Groundwater, and Solid Phase Media Investigation Work Plan Mayflower Mill and Tailings Impoundments Area Appendix A - Quality Assurance Project Plan July 2015
24
3.5 Instrument/Equipment Calibration and Maintenance
In order to ensure continual quality performance of any instruments or equipment, calibration and maintenance shall be performed and recorded as described in this section.
3.5.1 Field Equipment
Preventative maintenance of field equipment will include routine inspection and either calibration or testing as specified in the relevant SOP or manufacturer’s instructions.
All field equipment will be cleaned and safely stored between each use, and any routine maintenance recommended by the equipment manufacturer will also be performed. Equipment will be inspected and the calibration checked (if applicable) before it is transported to a field setting for use. Equipment will be inspected before use and field instruments that fail calibration requirements will be tagged as “nonfunctional” or “defective” and returned to the manufacturer or other supplier for repair or replacement.
3.5.2 Laboratory Equipment
Instruments used by the laboratory will be maintained in accordance with the laboratory’s Quality Assurance Plan and method requirements. All analytical measurement instruments and equipment used by the laboratories shall be controlled by a formal calibration and preventive maintenance program. In addition, each laboratory’s preventive maintenance program shall include the following, as a minimum:
• a listing of the instruments and equipment;
• the frequency of maintenance considering manufacturer’s recommendations and previous experience with the equipment; and
• a file for each instrument containing a list of spare parts maintained, external contracts, and a listing of the items to be checked or serviced during maintenance.
The laboratory will keep maintenance records and make them available for review, if requested, during laboratory audits. Laboratory preventative maintenance will include routine equipment inspection and calibration at the beginning of each day or each analytical batch, per the laboratory’s internal SOPs and method requirements.
Calibration Methods
Physical and chemical calibrations shall be performed within each laboratory as specified by the EPA Methods, instrument manufacturer’s guidelines, and this project’s calibration requirements for the requested EPA methods, which are summarized in Tables A2-2 through A2-6. When laboratory measurement instruments do not meet the calibration criteria of the laboratory’s Quality Assurance Plan and/or EPA method, then the calibration data will be reviewed using the
Surface Water, Groundwater, and Solid Phase Media Investigation Work Plan Mayflower Mill and Tailings Impoundments Area Appendix A - Quality Assurance Project Plan July 2015
25
NFGs (EPA, 2004) and will be qualified accordingly. Calibration records and demonstration of acceptable calibration results will be required elements of the laboratory’s data reporting. Records of calibration, repairs, or replacement will be filed and maintained by the designated laboratory personnel performing QC activities. These records will be filed at the location where the work is performed and will be subject to QA audit.
Calibration procedures for a specific laboratory instrument will consist of initial calibration (blank and standards), initial calibration verification (ICV) and continuing calibration verification (CCV). All analyses will be governed by the appropriate laboratory SOPs, and appropriate calibration procedures and frequencies can be found in each SOP.
For a summary of the calibration procedures for individual methods, refer to Tables A2-2 through A2-6. Calibration and quality control sample procedures for trace metals analysis by EPA Method 200.8 (inductively coupled plasma-mass spectrometer [ICPMS]) are provided in Table A2-2, for trace metals analysis by EPA Method 200.7 (inductively coupled plasma [ICP]) in Table A2-3, and for mercury by EPA Method 245.1 (cold-vapor atomic absorption [CVAA]) in Table A2-4. Calibration and quality control sample procedures for alkalinity by Method SM2320B are provided in Table A2-5. Calibration and quality control sample procedures for bromide and sulfate by EPA Method 300.0 are provided in Table A2-6.
Calibration and quality control procedures for trace metals analysis of solid-phase samples, including sediment and soil, are specified in Tables A2-2 through A2-4 of the Subsurface Investigation Work Plan, Appendix A, Quality Assurance Project Plan (Formation 2015).
3.6 Acceptance Requirements for Supplies and Consumables
All supplies and consumables received for a project (e.g., sample bottles, calibration standards) will be checked for damage and other deficiencies that would affect their performance. All inspections should be documented and a copy of the inspection should be kept in the project’s file.
3.7 Criteria for Use of Existing, Non-Direct Measurement Data
Previous investigations may provide environmental data that are relevant to this investigation. These data are summarized in the Subsurface Investigation Work Plan (Formation Environmental, 2015) and will be used to the fullest extent practicable in the on-going investigation and considering the data quality.
3.8 Data Management
The program quality records will be maintained by Sunnyside’s contractor, Formation, in its Boulder, CO office. These records, either electronic or hard copy in form, shall include:
Surface Water, Groundwater, and Solid Phase Media Investigation Work Plan Mayflower Mill and Tailings Impoundments Area Appendix A - Quality Assurance Project Plan July 2015
26
• Project work plans, including this QAPP, with any approved modifications, updates, and addendums;
• Field documentation (including well logs, GPS data on monitoring locations including surveyed elevations of monitoring wells);
• COC records;
• Laboratory documentation (results received from the laboratory will be documented both in report form and in an electronic format);
• Data validation reports;
• Data Summary Reports; and
• Final project reports/deliverables.
Hard-copy field and laboratory records shall be maintained in the project’s central data file, where original field and laboratory documents are filed chronologically for future reference. These records are also scanned to produce electronic copies in *.pdf format. The electronic versions of these records are maintained on Formation’s central server system with backup scheduled on a daily basis.
A key element of the project’s data management process is maintenance of an electronic database that is used to store relevant environmental sampling data, including existing data considered usable to support the investigation (i.e., non-direct measurement data), in a consistent, readily retrievable format. Microsoft® Access will be used for the data structure and query support, and a designated Database Manager will ensure the security and integrity of electronically stored data. The project’s electronic database will be maintained on a central server system with data backup scheduled on a daily basis.
The project database will serve as a source of data for the data presentation and analysis tasks performed to support the surface water, groundwater, and solid media investigation. The database will incorporate, at a minimum, sample collection information (e.g., sample identification, location, date and time of sample collected, matrix) and laboratory analytical fields specified in the project EDD requirements (Table A3-6).
Prior to incorporation of field and laboratory data into the project database, the data and supporting documentation shall be subject to appropriate review, as described below in Section 4.0, to ensure the accuracy and completeness of original data records. Field data that has been reviewed in a hard-copy format will be entered into electronic data files for upload to the project database. All manual data entry into an electronic format will be reviewed by a separate party before such data are incorporated into the project’s database (see Section 4.1). Laboratory EDDs and related data packages will be reviewed as part of the data validation process, as described in Sections 4.2 and 4.4.
Surface Water, Groundwater, and Solid Phase Media Investigation Work Plan Mayflower Mill and Tailings Impoundments Area Appendix A - Quality Assurance Project Plan July 2015
27
Following these review steps, field and laboratory electronic data files will be imported to the project database. The data validator(s) (refer to Section 4.4) will add qualifiers and related information to the EDD file/database, for reference by all data users. The EPA flags, Reason Codes, and final, qualified data will be uploaded from electronic files that the data validators populate and return to Sunnyside/Formation, as discussed in Section 4.0. Standardized data import formats and procedures will be used to upload both field and laboratory data into the electronic database. At this time, standardized station identifiers, parameter names, numerical formats, and units of measure are applied to the original information to facilitate comparability across all datasets and within the database.
Surface Water, Groundwater, and Solid Phase Media Investigation Work Plan Mayflower Mill and Tailings Impoundments Area Appendix A - Quality Assurance Project Plan July 2015
28
4.0 DATA REVIEW, VALIDATION AND USABILITY
The following sections address the final project checks conducted to confirm that the data obtained meet the project objectives and to estimate the effect of any deviations on data usability.
4.1 Field Data Review
Raw field data shall be entered in field notebooks; and/or sample collection record forms. The field records shall be reviewed for completeness by the Field Investigations Manager, or his/her designated Field Supervisor, at the end of each day. The overall quality of the field data from any given sampling round shall be further evaluated during the process of data reduction and reporting.
Field data reduction procedures will be minimal in scope compared to those implemented in the laboratory setting. Field data review will include verification that QC checks are recorded properly in the field logbooks and/or data sheets and that any necessary and appropriate corrective actions were implemented and recorded. Such data will be written into field logbook and/or data sheets immediately after measurements are taken. If errors are made, results will be legibly crossed out, initialed and dated by the field member, and corrected in a space adjacent to the original (erroneous) entry. Later, the appropriate Field Supervisor will proof the field logbooks and/or data sheets to determine whether any transcription errors have been made by the field crew. If transcription errors have been made, the appropriate Field Supervisor and field crew will address the errors to provide resolution.
Field measurement data will be entered into electronic files for import to the project’s database. Data entries will be made from the reviewed field data sheets or logbooks, and all data entries will be reviewed by a separate party before the electronic file is provided to the database manager. Electronic files of field measurement data will be maintained as part of the project’s quality records.
4.2 Laboratory Data Review
Internal, laboratory-data reduction procedures will be according to the laboratory’s Quality Management Plan. At a minimum, paper records shall be maintained by the analysts to document sample identification number and the sample tag number with sample results and other details, such as the analytical method used (SOP #), name of analyst, the date of analysis, matrix sampled, reagent concentrations, instrument settings, and the raw data. These records shall be signed and dated by the analyst. Copies of any strip chart printouts (such as gas chromatograms) will be maintained on file. Periodic review of these records by the laboratory QA Manager takes place prior to final data reporting to Sunnyside.
Surface Water, Groundwater, and Solid Phase Media Investigation Work Plan Mayflower Mill and Tailings Impoundments Area Appendix A - Quality Assurance Project Plan July 2015
29
QC data (e.g., laboratory duplicates, LCS/LFB, MSs, and MSDs) will be compared to the method and project-specific acceptance criteria. Data considered to be acceptable will be entered into the laboratory computer system. Data summaries will be sent to the laboratory QA Officer for review. If approved, data are logged into the project database format. The laboratory shall appropriately flag unacceptable data in the data package.
4.2.1 Laboratory Data Reporting Requirements
The laboratories shall prepare complete data packages for transmittal of results and associated quality control information to Sunnyside and Formation in general accordance with the following instructions, which are based on the EPA’s contract laboratory program (CLP) Statement of Work. Deviations from these specifications may be acceptable provided the report presents all of the requested types of information in an organized, consistent, and readily reviewable format. Laboratories providing data packages for this project shall be responsible for reviewing the following requirements, notifying Formation of any differences between their reports and these requirements, and confirming the acceptability of their intended report content and format with Formation before any laboratory data reports are generated for this project.
Each report will be paginated and organized with a table of contents. A cross reference that correlates the client or field identification as provided on the chain-of-custody document with the laboratory’s sample identification will be included.
For each batch of sample results consisting of 20 or fewer samples analyzed together and sharing common QC data, the laboratory data will be presented on a form equivalent to the EPA CLP “Form 1” (see below). Case narratives will be prepared which will include information concerning data that fell outside laboratory acceptance limits, and any other anomalous conditions encountered during sample analysis.
CLP Form 1 contains all required data for field samples. The Form 1 (or equivalent reporting mechanism) will provide the following information:
• Field sample identification;
• Laboratory sample identification;
• Sample result, with appropriate units, MDL, and QL. [analyte concentrations equal to or greater than the method detection limit (MDL) will be reported. Concentrations between the MDL and QL will be flagged as an estimated value (“J”) by the laboratory. Parameters that are not detected or not present at concentrations equal to or greater than the MDL are flagged by the laboratory as “U” and interpreted to be not detected at a value equal to or greater than the MDL. Any non-detected value (“U” flagged) will be reported with its QL and MDL.];
• Sample collection and receipt dates;
• Sample preparation date/time;
Surface Water, Groundwater, and Solid Phase Media Investigation Work Plan Mayflower Mill and Tailings Impoundments Area Appendix A - Quality Assurance Project Plan July 2015
30
• Analysis date/time;
• Dilution factor;
• Preparation batch number or identification;
• Analysis batch number or identification;
• Sample matrix and instrument;
• Percent moisture determination; and
• For solid-matrix samples, identify basis of reporting (i.e., wet-weight or dry-weight basis).
The following additional information will be provided with the Form 1s, as applicable for the reported analytical methods. QC batch will be clearly associated with each sample (on the CLP Form specified, or an equivalent reporting mechanism):
• Case narrative;
• Chain-of-custody;
• Summary of all field sample results (Form 1s, or equivalent, as described above);
• Sample results and preparation blank;
• Initial calibration verification (ICV), and continuing calibration verification (CCV);
• Initial calibration blanks (ICB), continuing calibration blank (CCB), and preparation blanks;
• Low-Level Calibration Check Sample Summary, if necessary
• Inductively coupled plasma (ICP) interference check sample or spectral interference check sample (CLP Form IVA-IN);
• Matrix spike (MS) or analytical spike, and when applicable matrix spike duplicate (MSD) or analytical spike duplicate, sample recovery and, when applicable, MS/MSD relative percent difference (RPD);
• Laboratory duplicate precision, where applicable;
• Laboratory control sample (LCS)/laboratory fortified blank (LFB) recovery;
• MDLs;
• ICP interelement correction factors;
• ICP and ICPMS linear ranges;
• Preparation log;
• Analysis run Log;
• ICPMS tunes;
• ICPMS internal standards relative intensity summary;
• Sample log-in sheet; and
• Deliverables inventory sheet.
Surface Water, Groundwater, and Solid Phase Media Investigation Work Plan Mayflower Mill and Tailings Impoundments Area Appendix A - Quality Assurance Project Plan July 2015
31
In addition to this standard data package, the laboratory may be requested to deliver a “Level 4” data package, as detailed below. When requested by the Project Manager, the laboratory’s Level 4 Data Package is to include all items specified above plus instrument raw data and/or documentation of the following additional information:
• Calibration standards (including source, preparation date).
• Blanks (ICB, CCB, and preparation).
• ICV, CCV standards.
• Low-Level Calibration Check Sample or Practical Quantitation Verification Standards.
• Interference check samples.
• LCS/LFB.
• Diluted and undiluted samples.
• Dilution factors.
• Sample volumes.
• Laboratory duplicates.
• Matrix spikes (source, concentration, volume).
• Method of standard addition results.
• Instrument identification.
• Analysis date and time.
• All inorganic methods: full raw data printouts from instruments.
• Full run log for each analysis. and
• ICPMS to include: internal standard recoveries, tune data (atomic mass unit [amu] and peak width), and molecular interference check data.
4.2.2 Laboratory Electronic Data Deliverable
Each data package, as described above, shall be accompanied by an electronic data deliverable (EDD) prepared by the laboratory. The content and format of laboratory EDDs are specified in Table A3-6. Additional laboratory QC data can be included in the EDD as long as the data fields specified in Table A3-6 are also maintained. The last six fields in the table are to be entered by the data validator.
EDDs will be cross checked against corresponding hard-copy data reports to confirm consistency in results reported in these two separate formats. This cross check will take place as part of the data quality review and validation process described in Section 4.4.
Surface Water, Groundwater, and Solid Phase Media Investigation Work Plan Mayflower Mill and Tailings Impoundments Area Appendix A - Quality Assurance Project Plan July 2015
32
4.3 Specific Quality Control Assessment Procedures
The accuracy, precision, completeness, and representativeness of analytical data will be described relative to the project’s control limits through a process of field and laboratory data quality review and data validation. Results from these reviews will be documented in routine Data Summary Reports prepared for all data users, and any qualification of the data resulting from that review will also be incorporated into the project's electronic database so that all data users are aware of any uncertainties associated with individual results.
4.4 Data Quality Review and Validation
Data validation is the process of verifying that qualitative and quantitative information generated relative to a given sample is complete and accurate. Data validation procedures shall be performed for both field and laboratory operations as described below and in SOP No. 20, Data Review and Validation (Appendix B of the Work Plan).
4.4.1 Evaluating Field Data
The results of field quality control sample analyses associated with each laboratory data package will be reviewed to allow for evaluation of equipment blanks and other field QC samples and further indications of the data quality. If a problem is identified through the review of field QC data, all related field samples will be identified, and if possible, corrective actions can be instituted and documented. If data are compromised due to a problem identified via field QC sample review, appropriate data qualifications will be used to identify the data for future data users.
The handling, preservation, and storage of samples collected during the sampling program will be monitored on an on-going basis. The project laboratories will document sample receipt including proper containers and preservation at the time samples are logged into their individual laboratory. The sample receipt records (a required data package deliverable) as well as the COC documentation will also be assessed during data validation. Sample handling, storage or preservation problems identified during data validation will result in appropriate qualification of data.
4.4.2 Evaluating Laboratory Chemistry Data
The purpose of chemistry data-quality review and validation is to verify that the data are of known quality, technically valid, defensible, and usable for their intended purpose. The objectives of the data validation process will be to:
• Verify completeness of data packages and corresponding EDDs;
• Assess compliance to project specific procedures and programs;
• Evaluate system process control through review of control charts (if applicable);
Surface Water, Groundwater, and Solid Phase Media Investigation Work Plan Mayflower Mill and Tailings Impoundments Area Appendix A - Quality Assurance Project Plan July 2015
33
• Verify that no systematic errors exist within the data sets;
• Assess field QC samples to determine if sampling has adversely impacted the reported results and, therefore, usability;
• Assess both method and laboratory performance through tabulation of QC outliers; and
• Provide measures of data quality in terms of precision, accuracy, and completeness so that overall usability can be determined.
Data validation will be performed using the general protocols and processes described in the following documents and in SOP No. 20, Data Review and Validation (Appendix B of the Work Plan), as applicable to the method calibration and QC limits specified on Tables A2-2 through 2-6 and to the extent possible when non-CLP methods are used:
• Contract Laboratory Program National Functional Guidelines for Inorganic Data Review (NFG; EPA, 2004); and
• Guidance for Labeling Externally Validated Laboratory Analytical Data for Superfund Use (USPEA, 2009).
The data packages will be evaluated and qualified for quantitative QC elements (e.g., spike recoveries, method and field blank contamination, initial and continuing calibration blanks, instrument tunes, interference check samples, duplicate sample %RSD, and instrument stability and performance [e.g., initial and continuing calibration results, instrument tuning and internal standard areas]) using summary forms (described above). This validation procedure is equivalent to a “Stage 2B Validation,” as defined in the EPA guidance for labeling externally validated data (EPA, 2009).1 Specific QC elements that will be reviewed include:
• Presence and completeness of COC and sample receipt documentation;
• Sample Index (correlation of field sample ID to laboratory sample ID);
• Laboratory Case Narrative (method deviations and QC anomalies);
• Analytical holding times;
• Method blank;
• Matrix spike recoveries;
• Matrix spike/matrix spike duplicate RPD values;
• Field duplicate RPD values;
• Laboratory duplicate RPD values;
• Summaries of initial and continuing calibration;
• Summaries of instrument blanks (e.g., initial calibration blank, CCB, if specified in method);
1 EPA, 2009. Page 6: “A verification and validation based on completeness and compliance checks of sample receipt conditions and BOTH sample-related and instrument-related QC results…”
Surface Water, Groundwater, and Solid Phase Media Investigation Work Plan Mayflower Mill and Tailings Impoundments Area Appendix A - Quality Assurance Project Plan July 2015
34
• Review of reagent/preparation blanks (inorganics);
• Review of Laboratory Control Standards (LCS);
• Instrument stability and performance (e.g., serial dilution);
• Summaries of internal standards;
• Completeness of laboratory documentation for sample receipt, sample analysis, and sample result reporting;
• Interference check samples (ICP analysis); and
• Serial dilutions (ICP analysis), if any.
Formation will indicate data qualifiers applied to individual results and reasons for application of those qualifiers. Definitions of the data qualifiers that may be applied to individual results as a result of data validation are as follows:
U The analyte was analyzed for, but was not detected above the level of the reported sample QL.
J The result is an estimated quantity. The associated numerical value is the approximated concentration of the analyte in the sample.
J+ The result is an estimated quantity, but the result may be biased high.
J- The result is an estimated quantity, but the result may be biased low.
R The result is unusable. The sample result is rejected due to serious deficiencies in meeting quality control criteria. The analyte may or may not be present in the sample.
UJ The analyte was analyzed for, but was not detected. The reported QL is approximate and may be inaccurate or imprecise.
Formation will add the following data to that EDD upon completion of validation:
Field Header “Validation Qualifier”: Populate with validation qualifiers specified above and in template reports.
Field Header “Validation Qual Reason”: Populate with a specific reason for qualification if EPA codes are not used.
Field Header “Val Status”: Populate with a code to indicate if the data has been validated or not.
Surface Water, Groundwater, and Solid Phase Media Investigation Work Plan Mayflower Mill and Tailings Impoundments Area Appendix A - Quality Assurance Project Plan July 2015
35
Field Header “Val Person”: Populate with a code to specify the validation contractor and validator.
Field Header “Val Protocol”: Populate with a code to refer to for validation procedures (QAPP or NFG, etc.) used.
Field Header “Val Notes”: Populate with additional information that is specific to a sample.
Formation will perform a Manual Validation, as defined in the EPA guidance for labeling externally validated data (EPA, 2009), on the data packages generated by the laboratories.
4.5 Data Usability
Laboratory packages summarizing the data generated for this investigation will be validated as described above. Once validated, the data will be loaded into a project database managed by Formation. Data usability will be determined by Formation based on the results of data validation and overall comparison to DQOs.
4.6 Measurement Data Analysis and Reporting
Measurement data will be reported in consistent units for each sample matrix to maintain comparability and facilitate data analyses. Concentrations in liquid samples shall be expressed in terms of weight per unit volume such as milligram per liter (mg/L). The number of significant figures in the field and laboratory data presented in the final report shall be consistent with the limits of uncertainty inherent in the measurement or analytical method.
Statistical analyses and other evaluations may be performed that consider the validated data set. The original detected values for parameters with results below the QL may be used as appropriate to the selected statistical methods. Statistical methods may include published methods found in statistical handbooks, textbooks, and EPA or other agency statistical guidance documents.
Surface Water, Groundwater, and Solid Phase Media Investigation Work Plan Mayflower Mill and Tailings Impoundments Area Appendix A - Quality Assurance Project Plan July 2015
36
5.0 ASSESSMENT AND OVERSIGHT
Assessments of data collection and reporting activities are designed to verify that sampling and analyses are performed in accordance with the procedures established in the Work Plan and QAPP. The audits of field and laboratory activities include two independent parts: internal and external audits. Internal audits will be performed by Sunnyside, Formation, or a contracted laboratory. External audits may be performed by the Lead Agency or supporting agencies. Procedures used to conduct internal and external audits shall be consistent with those described in EPA Guidance on Technical Audits and Related Assessments (EPA QA/G-7; EPA, 2000).
Performance and systems audits of field and laboratory data collection and reporting procedures are described in this section. Data assessments, such as data verification and validation, were presented in Section 4.0.
5.1 Field Performance and System Audits
Formation’s QA Manager, or designee, may conduct an onsite systems and performance audit of field sampling practices at any time during the field data collection activities. Any non-conformances observed in the audit shall be documented and resolved. Additional systems audits or surveillance may be conducted during the remaining field investigations at the discretion of the Formation Project Manager or Formation QA Manager. One field audit per field season is recommended but not required.
5.1.1 Internal Field Audits
Internal audits of field activities including sampling and field measurements, will be conducted by the Formation QA Manager, or designee. These audits will verify that procedures established in the Work Plan and QAPP, including referenced SOPs (Appendix B of the Work Plan), are being followed.
The internal field audits (systems and performance audits) will include examination of field measurement and sampling records and field instrument operating records; sample collection, handling, decontamination, and packaging activities; and documentation of sampling activities in compliance with the established procedures for each field activity audited. Follow-up audits may be conducted to correct deficiencies, and to verify that QA procedures are maintained throughout the investigation. The results of field audits will be documented. The completed field audit report will be kept on file by the Formation QA Manager. After a field audit is conducted, the results of the audit will be shared by the auditor with the field teams prior to additional sampling to enhance sampling performance where applicable.
Surface Water, Groundwater, and Solid Phase Media Investigation Work Plan Mayflower Mill and Tailings Impoundments Area Appendix A - Quality Assurance Project Plan July 2015
37
Findings of these audits will be summarized in an audit report that is given to the Formation Project Manager, Field Investigations Manager, and appropriate Field Supervisor in charge of the audited activities. The audited party will submit a reply addressing each finding cited in the report, the corrective action (if necessary) to be taken, and a schedule for implementation. The Field Investigations Manager is responsible for ensuring that corrective actions are taken.
5.1.2 External Field Audits
External field audits may be conducted by representatives from the Agencies. External field audits may be conducted at any time during the field operations. These audits may or may not be announced and are at the discretion of the Agencies.
External field audits will be conducted according to the field activity information presented in the field SOPs or in the sampling procedures outlined in the Work Plan. Results of the external field audit may document the need for a change to procedures in the Work Plan and/or QAPP and result in the need for an amendment to the Work Plan and/or QAPP.
5.2 Laboratory Performance and Systems Audits
5.2.1 Internal Laboratory Audits
The internal laboratory audit will be conducted by the QA Officer at each laboratory utilized for the investigation. Audits will be performed in accordance with the laboratory’s Quality Management Plan.
The internal laboratory system audits will be conducted on an annual basis while the internal lab performance audits will be conducted on a quarterly basis, or as specified in the laboratory’s Quality Management Plan.
The internal laboratory system audits will include an examination of laboratory documentation on sample receiving, sample log-in, sample storage, COC procedures, sample preparation and analysis, instrument operating records, etc. The performance audits will involve preparing blind QC samples and submitting them along with project samples to the laboratory for analysis throughout the project. The QA Officer from each laboratory utilized for this investigation will evaluate the analytical results of these blind performance samples to ensure the laboratory maintains acceptable QC performance.
5.2.2 External Laboratory Audits
An external laboratory audit may be conducted by representatives from the Agencies at any time. An external laboratory audit may be conducted prior to the initiation of the sampling and
Surface Water, Groundwater, and Solid Phase Media Investigation Work Plan Mayflower Mill and Tailings Impoundments Area Appendix A - Quality Assurance Project Plan July 2015
38
analysis activities. These audits may or may not be announced, may be conducted at any time and are at the discretion of the Agencies.
External laboratory audits will include (but not be limited to) review of laboratory analytical procedures, laboratory on-site audits, and/or submission of performance evaluation samples to the laboratory for analysis. Typically, the external laboratory audit will be conducted in the lab so that the staff may be questioned regarding laboratory procedure. A recently produced sample data package will be compared with their SOP to ensure compliance with applicable standards.
5.3 Corrective Actions
Corrective action is the process of identifying, recommending, approving and implementing measures to counter unacceptable procedures or out-of-QC performance which can affect data quality. Corrective action can occur during field activities, laboratory analyses, data validation and data assessment.
Non-conforming equipment, items, activities, conditions and unusual incidents that could affect data quality and attainment of the project’s quality objectives will be identified, controlled and reported in a timely manner. For the purpose of this QAPP, a nonconformance is defined as a malfunction, failure, deficiency, or deviation that renders the quality of an item unacceptable or indeterminate in meeting the project’s quality objectives.
Corrective action in the laboratory may occur prior to, during and after initial analyses. If the analytical results from laboratory QC samples fall outside of the measurement performance criteria, the laboratory should initiate corrective actions immediately. If the laboratory cannot correct the situation that caused the nonconformance and an out-of-control situation continues to occur or is expected to occur, then the laboratory will immediately contact the Formation QA Manager and request instructions regarding how to proceed with sample analyses. A number of conditions such as broken sample containers, multiple phases, low/high pH readings and potentially high concentration samples may be identified during sample log-in or just prior to analysis. Following consultation with lab analysts and section leaders, it may be necessary for the Laboratory Project Manager (or designated QA Officer) to approve the implementation of corrective action. These conditions may include dilution of samples, additional sample extract cleanup, automatic re-injection/re-analysis when certain QC criteria are not met, etc.
Completion of any corrective action should be evidenced by data once again falling within prescribed measurement performance criteria. If an error in laboratory procedures or sample collection and handling procedures cannot be found, the results will be reviewed by the Formation QA Manager and Formation Project Manager to assess whether reanalysis or re-sampling is required.
Surface Water, Groundwater, and Solid Phase Media Investigation Work Plan Mayflower Mill and Tailings Impoundments Area Appendix A - Quality Assurance Project Plan July 2015
39
Any corrective actions taken will be documented in writing by either the Laboratory Project Manager or the Formation QA Manager, as appropriate, and reported to the Formation Project Manager. Corrective action records will be included in the program’s quality records.
5.4 Corrective Action during Data Validation and Data Assessment
The Formation QA Manager may identify the need for corrective action during either the data validation or later data assessment/analysis activities. Potential types of corrective action may include re-sampling by the field team, reanalysis of samples by the laboratory, or re-submission of data packages with corrected clerical errors. The appropriate and feasible corrective actions are dependent upon the ability to mobilize the field team and whether the data to be collected is necessary to meet the required QA objectives (e.g., the holding time for samples is not exceeded, etc.). Corrective actions of this type will be documented by the Formation QA Manager.
5.5 Quality Assurance Reports to Management
The deliverables associated with the tasks identified in the Work Plan will contain QA discussions of data quality information collected during the task is summarized. Those reports will be the responsibility of the Formation Project Manager and QA Manager.
The QA discussions will contain, on a routine basis, the results of field and laboratory audits, information generated on the achievement of specific DQOs and a summary of any corrective actions that were implemented and their immediate results on the project. Detailed references to any QAPP modifications will also be highlighted.
Surface Water, Groundwater, and Solid Phase Media Investigation Work Plan Mayflower Mill and Tailings Impoundments Area Appendix A - Quality Assurance Project Plan July 2015
40
6.0 QAPP REFERENCES
EPA, 2000. Guidance on Technical Audits and Related Assessments, EPA QA/G-7.
EPA, 2001. Requirements for Quality Assurance Project Plans, EPA QA/R-5.
EPA, 2002. Guidance for Quality Assurance Project Plans EPA QA/G-5. EPA 240-R-02-009. December.
EPA, 2004. EPA Contract Laboratory Program National Functional Guidelines for Inorganic Data Review. EPA 540-R-04-004. October.
EPA, 2005. Guidance for Developing Ecological Soil Screening Levels, OSWER Directive 9285.7-55. Revised February 2005. http://www.epa.gov/ecotox/ecossl/
EPA, 2006. Guidance on Systematic Planning Using the Data Quality Objectives Process, EPA QA/G-4, EPA/240/B-06/001. February.
EPA, 2009. EPA Guidance for Labeling Externally Validated Laboratory Analytical Data for Superfund Use. EPA 540-R-08-005. January.
ESAT, 2012a. Pore Water Sampling, SOP#FLD-10. TechLaw Inc. ESAT Region 8. Dated March 30.
ESAT, 2012b. Shallow Stream Sediment Sampling SOP#FLD-06. TechLaw Inc. ESAT Region 8. Dated March 30.
ESAT, 2012c. Standard Operating Procedures for Soil Sampling, FLD-05. TechLaw Inc. ESAT Region 8. Dated March 30.
FISP, Undated. Operator’s Manual for the US DH-81 Depth-Integrating Suspended Sediment Sampler. Federal Interagency Sedimentation Project (FISP). http://water.usgs.gov/fisp/docs/Instructions_US_DH-81_010612.pdf
Formation Environmental LLC (Formation), 2015. Subsurface Investigation Work Plan, Mayflower Mill and Tailings Impoundments, prepared in July.
MacDonald et al., 2000. Development and Evaluation of Consensus-based Sediment Quality Guidelines for Freshwater Ecosystems, Environmental Chemistry and Toxicology, vol. 39, pp 20-31.
Surface Water, Groundwater, and Solid Phase Media Investigation Mayflower Mill and Tailings Impoundments Area Appendix A - Quality Assurance Project Plan July 2015
QUALITY ASSURANCE PROJECT PLAN TABLES
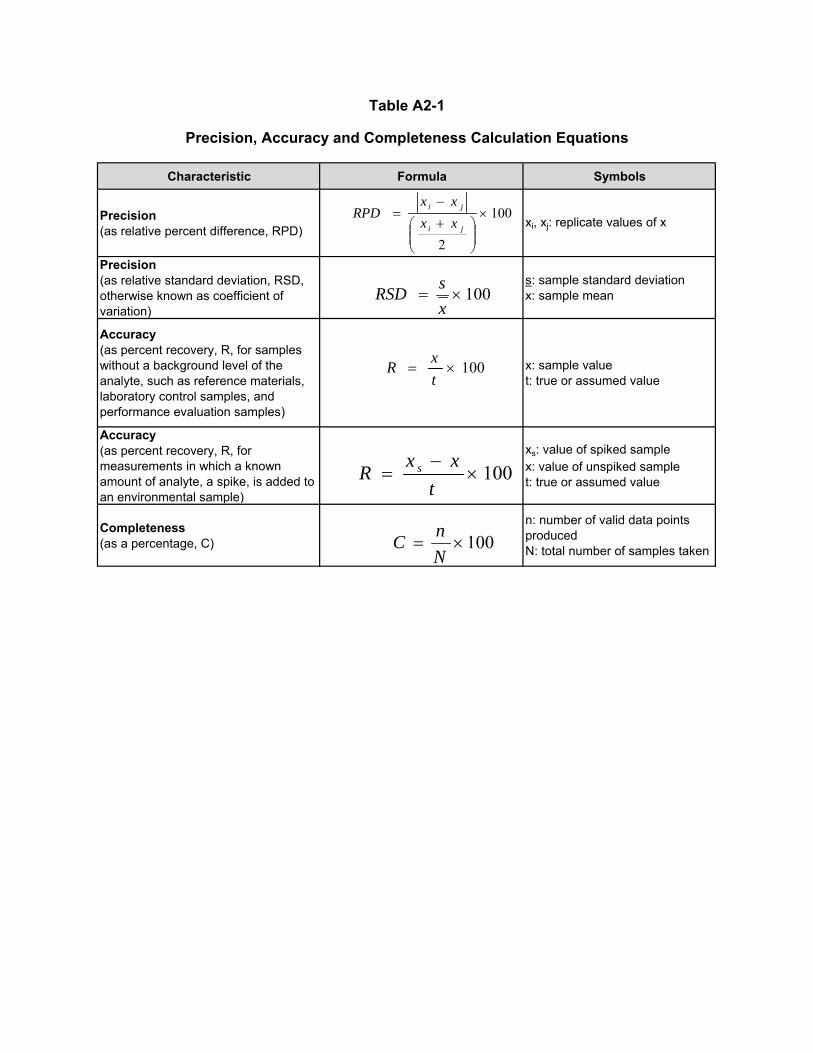
Characteristic Formula Symbols
Precision(as relative percent difference, RPD)
xi, xj: replicate values of x
Precision(as relative standard deviation, RSD, otherwise known as coefficient of variation)
s: sample standard deviationx: sample mean
Accuracy(as percent recovery, R, for samples without a background level of the analyte, such as reference materials, laboratory control samples, and performance evaluation samples)
x: sample valuet: true or assumed value
Accuracy(as percent recovery, R, for measurements in which a known amount of analyte, a spike, is added to an environmental sample)
xs: value of spiked samplex: value of unspiked samplet: true or assumed value
Completeness(as a percentage, C)
n: number of valid data points producedN: total number of samples taken
Table A2-1
Precision, Accuracy and Completeness Calculation Equations
100
2
ji
ji
xx
xxRPD
100x
sRSD
100t
xR
100
t
xxR s
100N
nC
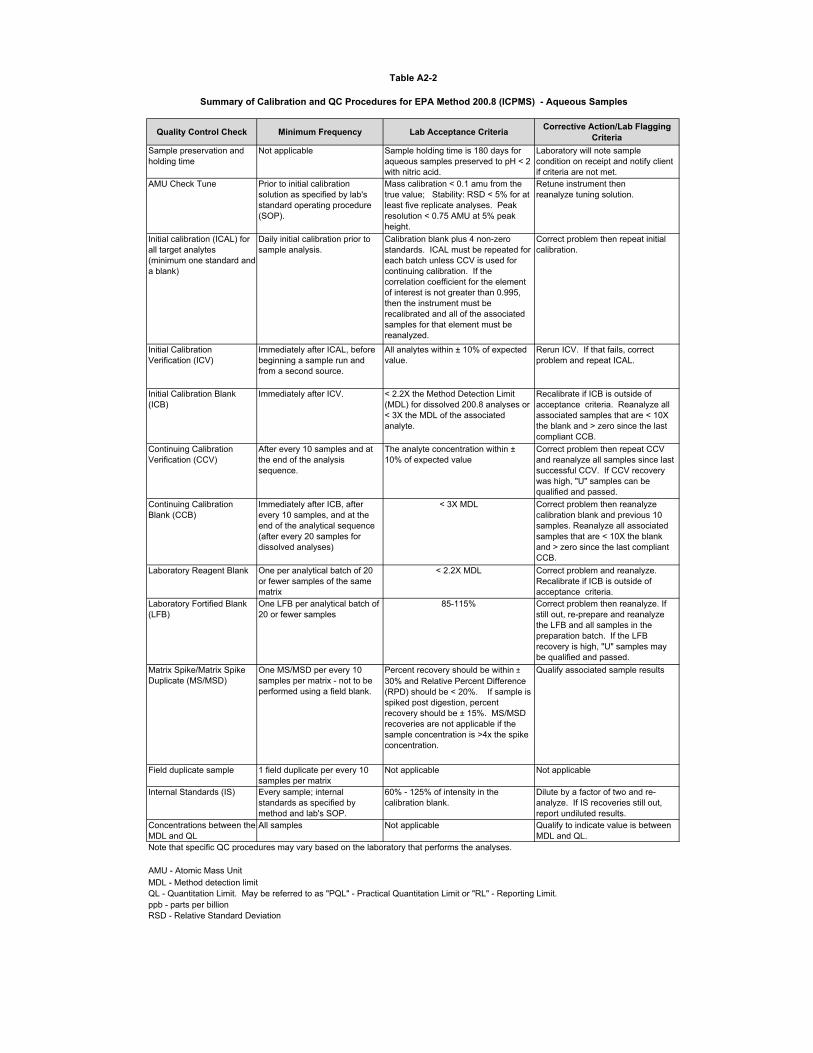
Quality Control Check Minimum Frequency Lab Acceptance CriteriaCorrective Action/Lab Flagging
Criteria
Sample preservation and holding time
Not applicable Sample holding time is 180 days for aqueous samples preserved to pH < 2 with nitric acid.
Laboratory will note sample condition on receipt and notify client if criteria are not met.
AMU Check Tune Prior to initial calibration solution as specified by lab's standard operating procedure (SOP).
Mass calibration < 0.1 amu from the true value; Stability: RSD < 5% for at least five replicate analyses. Peak resolution < 0.75 AMU at 5% peak height.
Retune instrument thenreanalyze tuning solution.
Initial calibration (ICAL) for all target analytes (minimum one standard and a blank)
Daily initial calibration prior to sample analysis.
Calibration blank plus 4 non-zero standards. ICAL must be repeated for each batch unless CCV is used for continuing calibration. If the correlation coefficient for the element of interest is not greater than 0.995, then the instrument must be recalibrated and all of the associated samples for that element must be reanalyzed.
Correct problem then repeat initial calibration.
Initial Calibration Verification (ICV)
Immediately after ICAL, before beginning a sample run and from a second source.
All analytes within ± 10% of expected value.
Rerun ICV. If that fails, correct problem and repeat ICAL.
Initial Calibration Blank (ICB)
Immediately after ICV. < 2.2X the Method Detection Limit (MDL) for dissolved 200.8 analyses or < 3X the MDL of the associated analyte.
Recalibrate if ICB is outside of acceptance criteria. Reanalyze all associated samples that are < 10X the blank and > zero since the last compliant CCB.
Continuing Calibration Verification (CCV)
After every 10 samples and at the end of the analysis sequence.
The analyte concentration within ± 10% of expected value
Correct problem then repeat CCV and reanalyze all samples since last successful CCV. If CCV recovery was high, "U" samples can be qualified and passed.
Continuing Calibration Blank (CCB)
Immediately after ICB, after every 10 samples, and at the end of the analytical sequence (after every 20 samples for dissolved analyses)
< 3X MDL Correct problem then reanalyze calibration blank and previous 10 samples. Reanalyze all associated samples that are < 10X the blank and > zero since the last compliant CCB.
Laboratory Reagent Blank One per analytical batch of 20 or fewer samples of the same matrix
< 2.2X MDL Correct problem and reanalyze. Recalibrate if ICB is outside of acceptance criteria.
Laboratory Fortified Blank (LFB)
One LFB per analytical batch of 20 or fewer samples
85-115% Correct problem then reanalyze. If still out, re-prepare and reanalyze the LFB and all samples in the preparation batch. If the LFB recovery is high, "U" samples may be qualified and passed.
Matrix Spike/Matrix Spike Duplicate (MS/MSD)
One MS/MSD per every 10 samples per matrix - not to be performed using a field blank.
Percent recovery should be within ± 30% and Relative Percent Difference (RPD) should be < 20%. If sample is spiked post digestion, percent recovery should be ± 15%. MS/MSD recoveries are not applicable if the sample concentration is >4x the spike concentration.
Qualify associated sample results
Field duplicate sample 1 field duplicate per every 10 samples per matrix
Not applicable Not applicable
Internal Standards (IS) Every sample; internal standards as specified by method and lab's SOP.
60% - 125% of intensity in the calibration blank.
Dilute by a factor of two and re-analyze. If IS recoveries still out, report undiluted results.
Concentrations between the MDL and QL
All samples Not applicable Qualify to indicate value is between MDL and QL.
AMU - Atomic Mass Unit
ppb - parts per billionQL - Quantitation Limit. May be referred to as "PQL" - Practical Quantitation Limit or "RL" - Reporting Limit.
Table A2-2
Summary of Calibration and QC Procedures for EPA Method 200.8 (ICPMS) - Aqueous Samples
Note that specific QC procedures may vary based on the laboratory that performs the analyses.
RSD - Relative Standard Deviation
MDL - Method detection limit
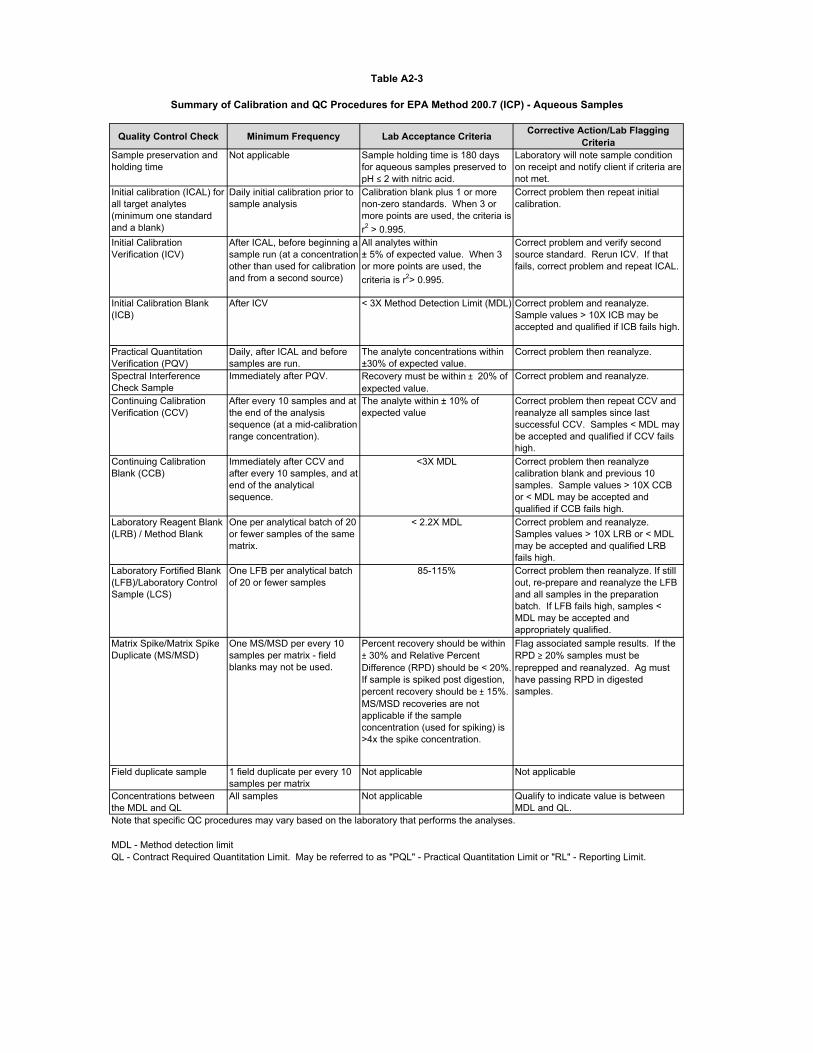
Quality Control Check Minimum Frequency Lab Acceptance CriteriaCorrective Action/Lab Flagging
CriteriaSample preservation and holding time
Not applicable Sample holding time is 180 days for aqueous samples preserved to pH ≤ 2 with nitric acid.
Laboratory will note sample condition on receipt and notify client if criteria are not met.
Initial calibration (ICAL) for all target analytes (minimum one standard and a blank)
Daily initial calibration prior to sample analysis
Calibration blank plus 1 or more non-zero standards. When 3 or more points are used, the criteria is r2 > 0.995.
Correct problem then repeat initial calibration.
Initial Calibration Verification (ICV)
After ICAL, before beginning a sample run (at a concentration other than used for calibration and from a second source)
All analytes within ± 5% of expected value. When 3 or more points are used, the criteria is r2> 0.995.
Correct problem and verify second source standard. Rerun ICV. If that fails, correct problem and repeat ICAL.
Initial Calibration Blank (ICB)
After ICV < 3X Method Detection Limit (MDL) Correct problem and reanalyze. Sample values > 10X ICB may be accepted and qualified if ICB fails high.
Practical Quantitation Verification (PQV)
Daily, after ICAL and before samples are run.
The analyte concentrations within ±30% of expected value.
Correct problem then reanalyze.
Spectral Interference Check Sample
Immediately after PQV. Recovery must be within ± 20% of expected value.
Correct problem and reanalyze.
Continuing Calibration Verification (CCV)
After every 10 samples and at the end of the analysis sequence (at a mid-calibration range concentration).
The analyte within ± 10% of expected value
Correct problem then repeat CCV and reanalyze all samples since last successful CCV. Samples < MDL may be accepted and qualified if CCV fails high.
Continuing Calibration Blank (CCB)
Immediately after CCV and after every 10 samples, and at end of the analytical sequence.
<3X MDL Correct problem then reanalyze calibration blank and previous 10 samples. Sample values > 10X CCB or < MDL may be accepted and qualified if CCB fails high.
Laboratory Reagent Blank (LRB) / Method Blank
One per analytical batch of 20 or fewer samples of the same matrix.
< 2.2X MDL Correct problem and reanalyze. Samples values > 10X LRB or < MDL may be accepted and qualified LRB fails high.
Laboratory Fortified Blank (LFB)/Laboratory Control Sample (LCS)
One LFB per analytical batch of 20 or fewer samples
85-115% Correct problem then reanalyze. If still out, re-prepare and reanalyze the LFB and all samples in the preparation batch. If LFB fails high, samples < MDL may be accepted and appropriately qualified.
Matrix Spike/Matrix Spike Duplicate (MS/MSD)
One MS/MSD per every 10 samples per matrix - field blanks may not be used.
Percent recovery should be within ± 30% and Relative Percent Difference (RPD) should be < 20%. If sample is spiked post digestion, percent recovery should be ± 15%. MS/MSD recoveries are not applicable if the sample concentration (used for spiking) is >4x the spike concentration.
Flag associated sample results. If the RPD ≥ 20% samples must be reprepped and reanalyzed. Ag must have passing RPD in digested samples.
Field duplicate sample 1 field duplicate per every 10 samples per matrix
Not applicable Not applicable
Concentrations between the MDL and QL
All samples Not applicable Qualify to indicate value is between MDL and QL.
Table A2-3
Summary of Calibration and QC Procedures for EPA Method 200.7 (ICP) - Aqueous Samples
Note that specific QC procedures may vary based on the laboratory that performs the analyses.
QL - Contract Required Quantitation Limit. May be referred to as "PQL" - Practical Quantitation Limit or "RL" - Reporting Limit.MDL - Method detection limit
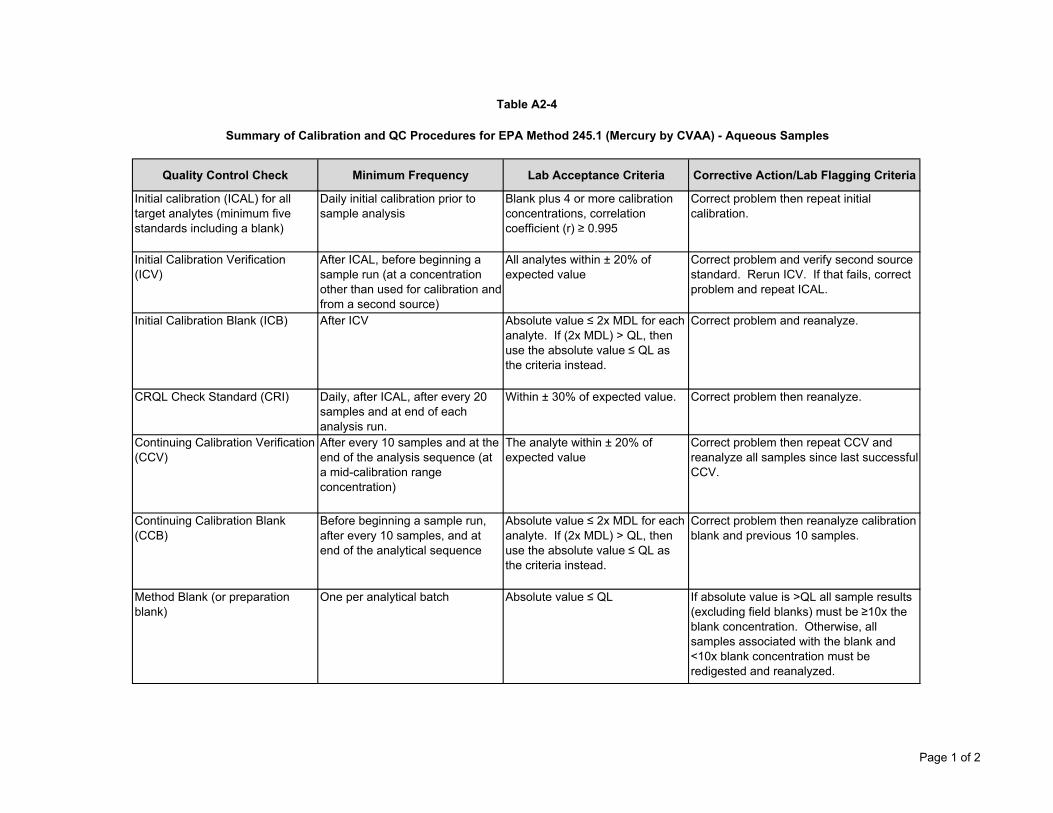
Quality Control Check Minimum Frequency Lab Acceptance Criteria Corrective Action/Lab Flagging Criteria
Initial calibration (ICAL) for all target analytes (minimum five standards including a blank)
Daily initial calibration prior to sample analysis
Blank plus 4 or more calibration concentrations, correlation coefficient (r) ≥ 0.995
Correct problem then repeat initial calibration.
Initial Calibration Verification (ICV)
After ICAL, before beginning a sample run (at a concentration other than used for calibration and from a second source)
All analytes within ± 20% of expected value
Correct problem and verify second source standard. Rerun ICV. If that fails, correct problem and repeat ICAL.
Initial Calibration Blank (ICB) After ICV Absolute value ≤ 2x MDL for each analyte. If (2x MDL) > QL, then use the absolute value ≤ QL as the criteria instead.
Correct problem and reanalyze.
CRQL Check Standard (CRI) Daily, after ICAL, after every 20 samples and at end of each analysis run.
Within ± 30% of expected value. Correct problem then reanalyze.
Continuing Calibration Verification (CCV)
After every 10 samples and at the end of the analysis sequence (at a mid-calibration range concentration)
The analyte within ± 20% of expected value
Correct problem then repeat CCV and reanalyze all samples since last successful CCV.
Continuing Calibration Blank (CCB)
Before beginning a sample run, after every 10 samples, and at end of the analytical sequence
Absolute value ≤ 2x MDL for each analyte. If (2x MDL) > QL, then use the absolute value ≤ QL as the criteria instead.
Correct problem then reanalyze calibration blank and previous 10 samples.
Method Blank (or preparation blank)
One per analytical batch Absolute value ≤ QL If absolute value is >QL all sample results (excluding field blanks) must be ≥10x the blank concentration. Otherwise, all samples associated with the blank and <10x blank concentration must be redigested and reanalyzed.
Table A2-4
Summary of Calibration and QC Procedures for EPA Method 245.1 (Mercury by CVAA) - Aqueous Samples
Page 1 of 2
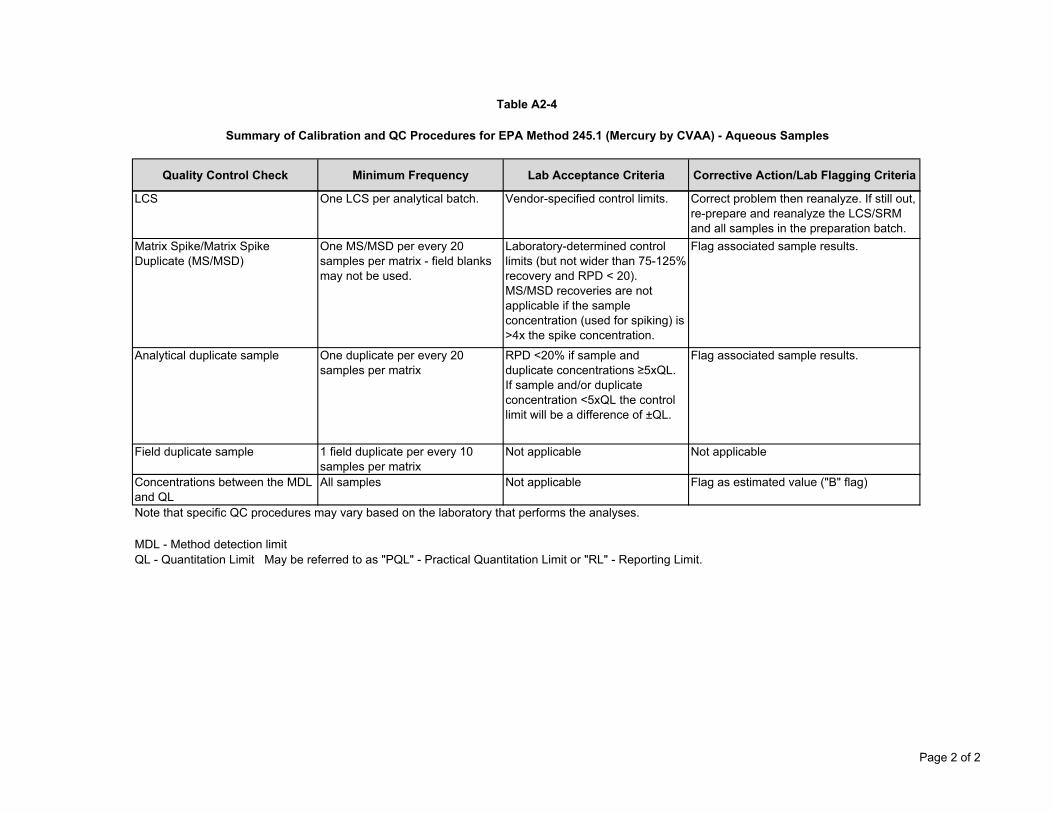
Quality Control Check Minimum Frequency Lab Acceptance Criteria Corrective Action/Lab Flagging Criteria
Table A2-4
Summary of Calibration and QC Procedures for EPA Method 245.1 (Mercury by CVAA) - Aqueous Samples
LCS One LCS per analytical batch. Vendor-specified control limits. Correct problem then reanalyze. If still out, re-prepare and reanalyze the LCS/SRM and all samples in the preparation batch.
Matrix Spike/Matrix Spike Duplicate (MS/MSD)
One MS/MSD per every 20 samples per matrix - field blanks may not be used.
Laboratory-determined control limits (but not wider than 75-125% recovery and RPD < 20). MS/MSD recoveries are not applicable if the sample concentration (used for spiking) is >4x the spike concentration.
Flag associated sample results.
Analytical duplicate sample One duplicate per every 20 samples per matrix
RPD <20% if sample and duplicate concentrations ≥5xQL. If sample and/or duplicate concentration <5xQL the control limit will be a difference of ±QL.
Flag associated sample results.
Field duplicate sample 1 field duplicate per every 10 samples per matrix
Not applicable Not applicable
Concentrations between the MDL and QL
All samples Not applicable Flag as estimated value ("B" flag)
MDL - Method detection limitQL - Quantitation Limit May be referred to as "PQL" - Practical Quantitation Limit or "RL" - Reporting Limit.
Note that specific QC procedures may vary based on the laboratory that performs the analyses.
Page 2 of 2
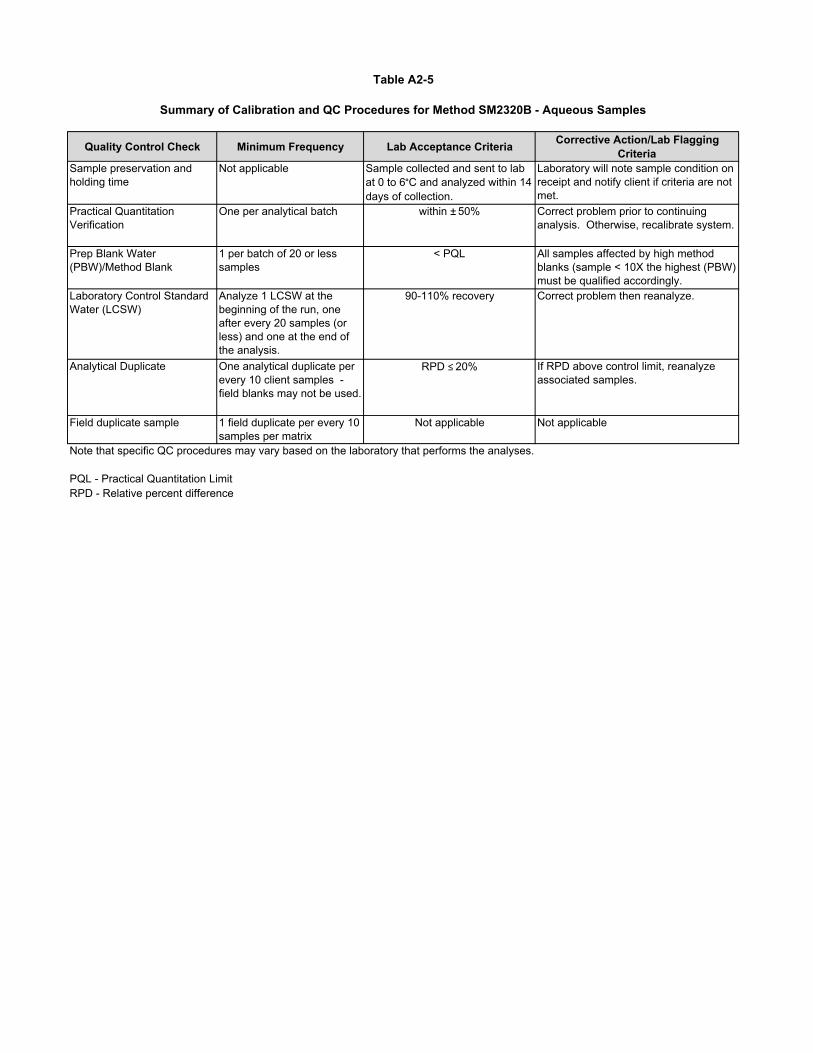
Quality Control Check Minimum Frequency Lab Acceptance CriteriaCorrective Action/Lab Flagging
CriteriaSample preservation and holding time
Not applicable Sample collected and sent to lab at 0 to 6°C and analyzed within 14 days of collection.
Laboratory will note sample condition on receipt and notify client if criteria are not met.
Practical Quantitation Verification
One per analytical batch within ± 50% Correct problem prior to continuing analysis. Otherwise, recalibrate system.
Prep Blank Water (PBW)/Method Blank
1 per batch of 20 or less samples
< PQL All samples affected by high method blanks (sample < 10X the highest (PBW) must be qualified accordingly.
Laboratory Control Standard Water (LCSW)
Analyze 1 LCSW at the beginning of the run, one after every 20 samples (or less) and one at the end of the analysis.
90-110% recovery Correct problem then reanalyze.
Analytical Duplicate One analytical duplicate per every 10 client samples - field blanks may not be used.
RPD ≤ 20% If RPD above control limit, reanalyze associated samples.
Field duplicate sample 1 field duplicate per every 10 samples per matrix
Not applicable Not applicable
Note that specific QC procedures may vary based on the laboratory that performs the analyses.
RPD - Relative percent difference
Table A2-5
Summary of Calibration and QC Procedures for Method SM2320B - Aqueous Samples
PQL - Practical Quantitation Limit
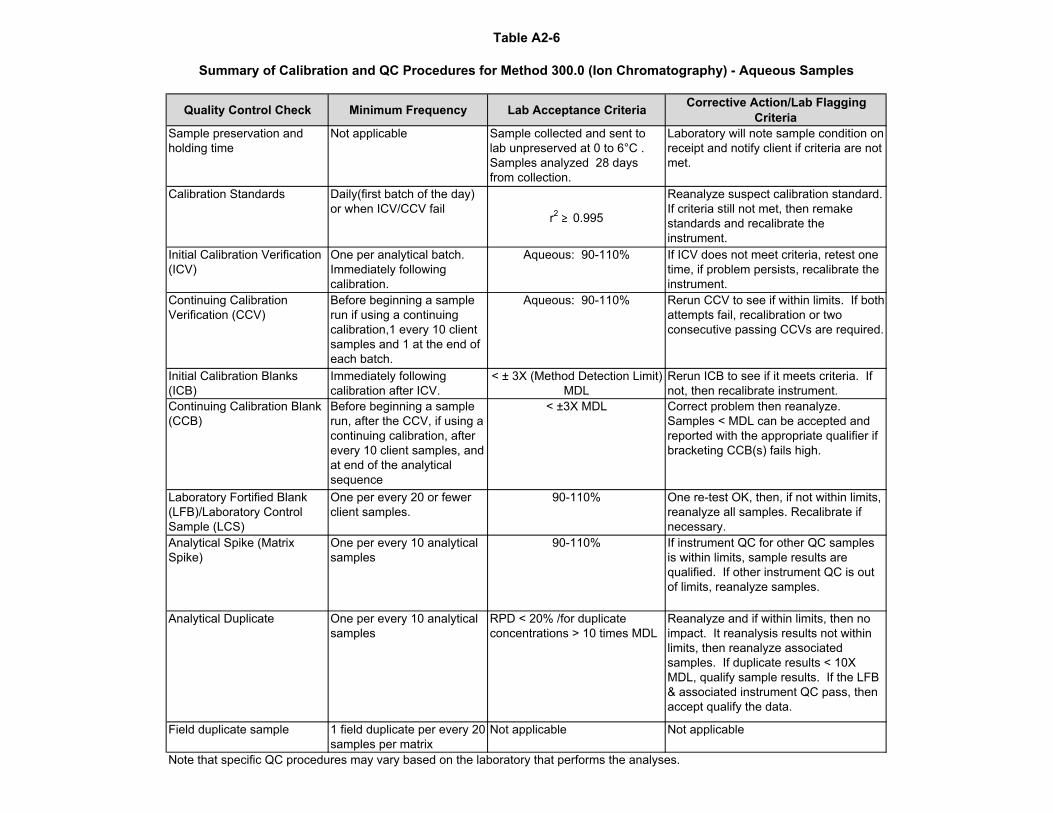
Quality Control Check Minimum Frequency Lab Acceptance CriteriaCorrective Action/Lab Flagging
CriteriaSample preservation and holding time
Not applicable Sample collected and sent to lab unpreserved at 0 to 6°C . Samples analyzed 28 days from collection.
Laboratory will note sample condition on receipt and notify client if criteria are not met.
Calibration Standards Daily(first batch of the day) or when ICV/CCV fail
r2 ≥ 0.995
Reanalyze suspect calibration standard. If criteria still not met, then remake standards and recalibrate the instrument.
Initial Calibration Verification (ICV)
One per analytical batch. Immediately following calibration.
Aqueous: 90-110% If ICV does not meet criteria, retest one time, if problem persists, recalibrate the instrument.
Continuing Calibration Verification (CCV)
Before beginning a sample run if using a continuing calibration,1 every 10 client samples and 1 at the end of each batch.
Aqueous: 90-110% Rerun CCV to see if within limits. If both attempts fail, recalibration or two consecutive passing CCVs are required.
Initial Calibration Blanks (ICB)
Immediately following calibration after ICV.
< ± 3X (Method Detection Limit) MDL
Rerun ICB to see if it meets criteria. If not, then recalibrate instrument.
Continuing Calibration Blank (CCB)
Before beginning a sample run, after the CCV, if using a continuing calibration, after every 10 client samples, and at end of the analytical sequence
< ±3X MDL Correct problem then reanalyze. Samples < MDL can be accepted and reported with the appropriate qualifier if bracketing CCB(s) fails high.
Laboratory Fortified Blank (LFB)/Laboratory Control Sample (LCS)
One per every 20 or fewer client samples.
90-110% One re-test OK, then, if not within limits, reanalyze all samples. Recalibrate if necessary.
Analytical Spike (Matrix Spike)
One per every 10 analytical samples
90-110% If instrument QC for other QC samples is within limits, sample results are qualified. If other instrument QC is out of limits, reanalyze samples.
Analytical Duplicate One per every 10 analytical samples
RPD < 20% /for duplicate concentrations > 10 times MDL
Reanalyze and if within limits, then no impact. It reanalysis results not within limits, then reanalyze associated samples. If duplicate results < 10X MDL, qualify sample results. If the LFB & associated instrument QC pass, then accept qualify the data.
Field duplicate sample 1 field duplicate per every 20 samples per matrix
Not applicable Not applicable
Table A2-6
Summary of Calibration and QC Procedures for Method 300.0 (Ion Chromatography) - Aqueous Samples
Note that specific QC procedures may vary based on the laboratory that performs the analyses.
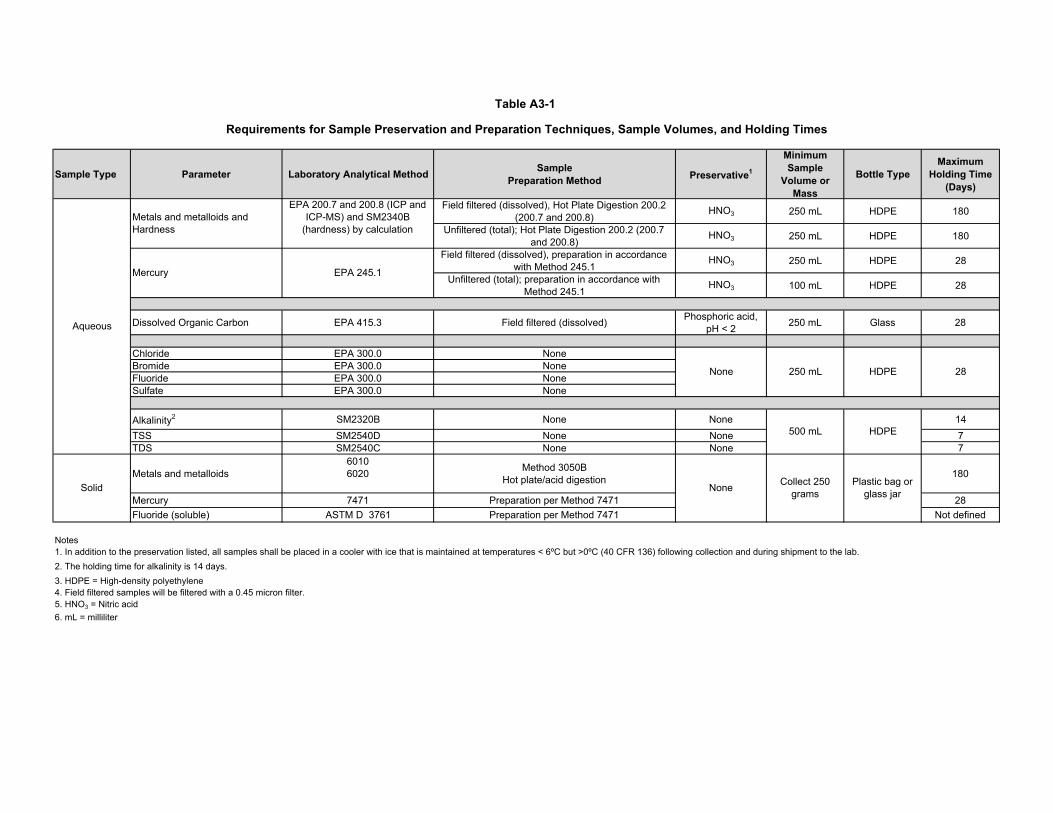
Sample Type Parameter Laboratory Analytical MethodSample
Preparation Method Preservative1
Minimum Sample
Volume or Mass
Bottle TypeMaximum
Holding Time (Days)
Field filtered (dissolved), Hot Plate Digestion 200.2 (200.7 and 200.8)
HNO3 250 mL HDPE 180
Unfiltered (total); Hot Plate Digestion 200.2 (200.7 and 200.8)
HNO3 250 mL HDPE 180
Field filtered (dissolved), preparation in accordance with Method 245.1
HNO3 250 mL HDPE 28
Unfiltered (total); preparation in accordance with Method 245.1
HNO3 100 mL HDPE 28
Dissolved Organic Carbon EPA 415.3 Field filtered (dissolved) Phosphoric acid, pH < 2 250 mL Glass 28
Chloride EPA 300.0 NoneBromide EPA 300.0 NoneFluoride EPA 300.0 NoneSulfate EPA 300.0 None
Alkalinity2 SM2320B None None 14TSS SM2540D None None 7TDS SM2540C None None 7
Metals and metalloids60106020 Method 3050B
Hot plate/acid digestion 180
Mercury 7471 Preparation per Method 7471 28Fluoride (soluble) ASTM D 3761 Preparation per Method 7471 Not defined
Notes1. In addition to the preservation listed, all samples shall be placed in a cooler with ice that is maintained at temperatures < 6ºC but >0ºC (40 CFR 136) following collection and during shipment to the lab.2. The holding time for alkalinity is 14 days. 3. HDPE = High-density polyethylene4. Field filtered samples will be filtered with a 0.45 micron filter. 5. HNO3 = Nitric acid6. mL = milliliter
Table A3-1
Requirements for Sample Preservation and Preparation Techniques, Sample Volumes, and Holding Times
500 mL HDPE
Aqueous
28
Metals and metalloids and Hardness
EPA 200.7 and 200.8 (ICP and ICP-MS) and SM2340B
(hardness) by calculation
Solid Collect 250 gramsNone Plastic bag or
glass jar
Mercury EPA 245.1
None 250 mL HDPE
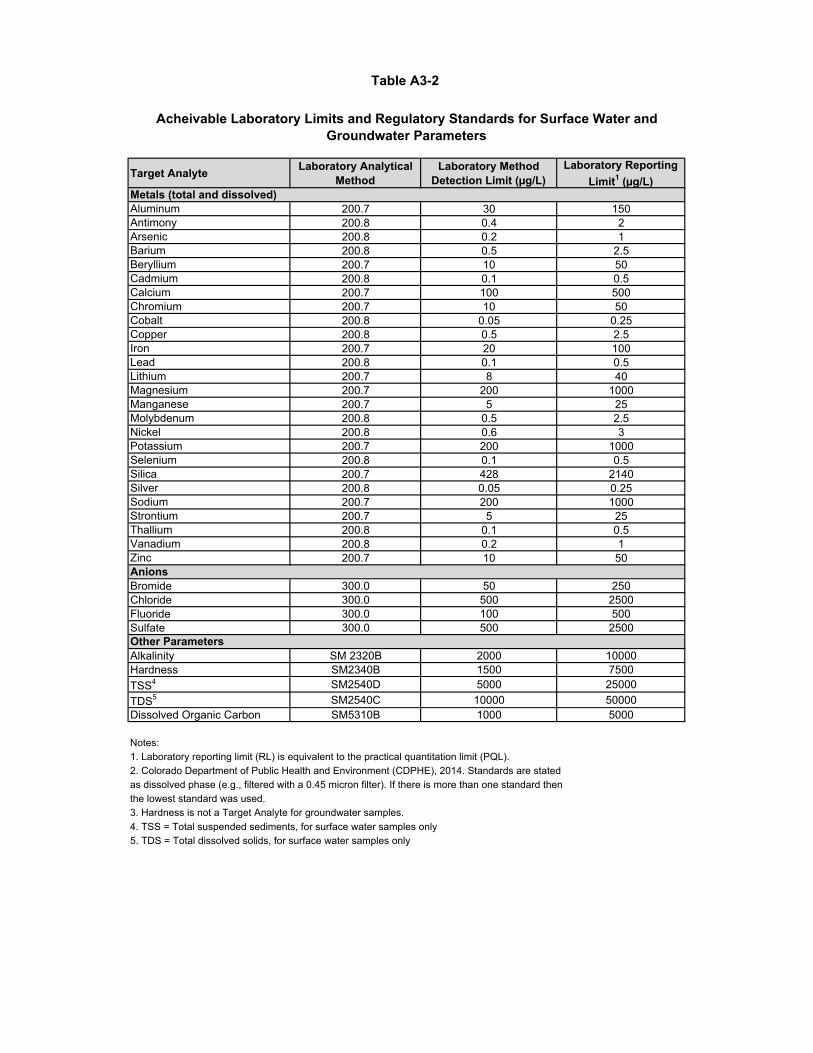
Target Analyte Laboratory Analytical
MethodLaboratory Method
Detection Limit (µg/L) Laboratory Reporting
Limit1 (µg/L)
Aluminum 200.7 30 150Antimony 200.8 0.4 2Arsenic 200.8 0.2 1Barium 200.8 0.5 2.5Beryllium 200.7 10 50Cadmium 200.8 0.1 0.5Calcium 200.7 100 500Chromium 200.7 10 50Cobalt 200.8 0.05 0.25Copper 200.8 0.5 2.5Iron 200.7 20 100Lead 200.8 0.1 0.5Lithium 200.7 8 40Magnesium 200.7 200 1000Manganese 200.7 5 25Molybdenum 200.8 0.5 2.5Nickel 200.8 0.6 3Potassium 200.7 200 1000Selenium 200.8 0.1 0.5Silica 200.7 428 2140Silver 200.8 0.05 0.25Sodium 200.7 200 1000Strontium 200.7 5 25Thallium 200.8 0.1 0.5Vanadium 200.8 0.2 1Zinc 200.7 10 50
Bromide 300.0 50 250Chloride 300.0 500 2500Fluoride 300.0 100 500Sulfate 300.0 500 2500
Alkalinity SM 2320B 2000 10000Hardness SM2340B 1500 7500TSS4 SM2540D 5000 25000TDS5 SM2540C 10000 50000Dissolved Organic Carbon SM5310B 1000 5000
Notes:1. Laboratory reporting limit (RL) is equivalent to the practical quantitation limit (PQL).2. Colorado Department of Public Health and Environment (CDPHE), 2014. Standards are stated as dissolved phase (e.g., filtered with a 0.45 micron filter). If there is more than one standard then the lowest standard was used. 3. Hardness is not a Target Analyte for groundwater samples.4. TSS = Total suspended sediments, for surface water samples only5. TDS = Total dissolved solids, for surface water samples only
Table A3-2
Acheivable Laboratory Limits and Regulatory Standards for Surface Water and Groundwater Parameters
Metals (total and dissolved)
Other Parameters
Anions
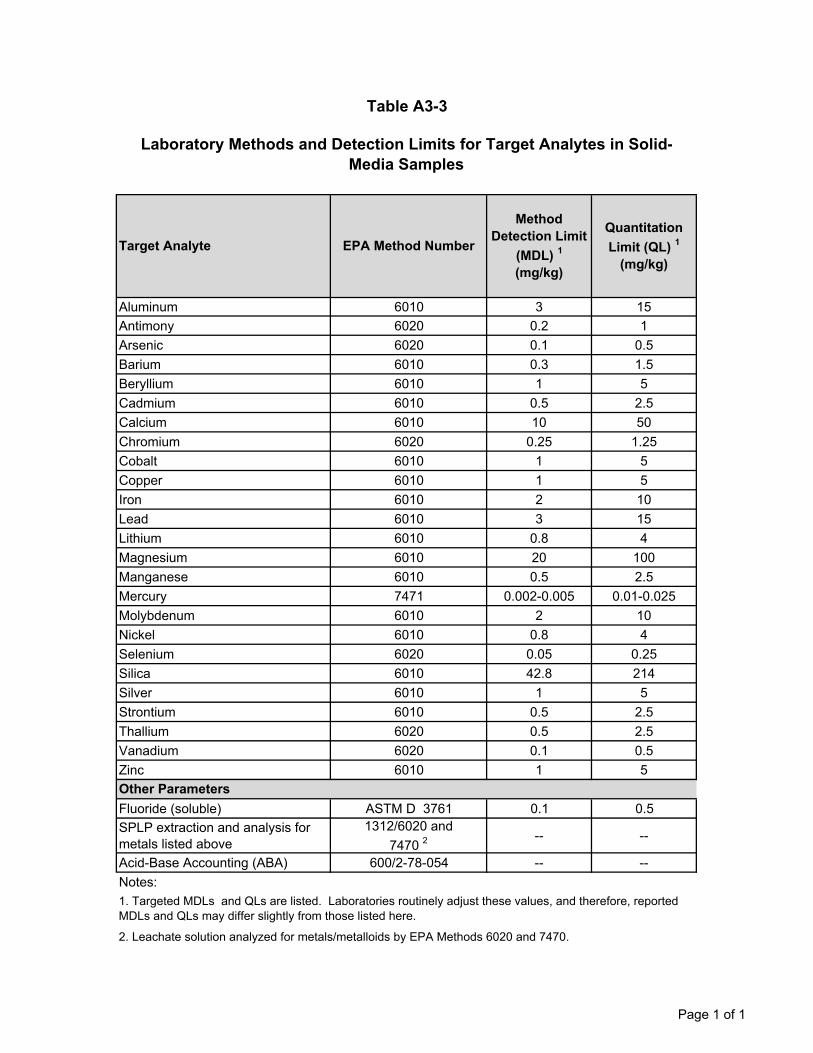
Aluminum 6010 3 15Antimony 6020 0.2 1Arsenic 6020 0.1 0.5Barium 6010 0.3 1.5Beryllium 6010 1 5Cadmium 6010 0.5 2.5Calcium 6010 10 50Chromium 6020 0.25 1.25Cobalt 6010 1 5Copper 6010 1 5Iron 6010 2 10Lead 6010 3 15Lithium 6010 0.8 4Magnesium 6010 20 100Manganese 6010 0.5 2.5Mercury 7471 0.002-0.005 0.01-0.025Molybdenum 6010 2 10Nickel 6010 0.8 4Selenium 6020 0.05 0.25Silica 6010 42.8 214Silver 6010 1 5Strontium 6010 0.5 2.5Thallium 6020 0.5 2.5Vanadium 6020 0.1 0.5Zinc 6010 1 5
Fluoride (soluble) ASTM D 3761 0.1 0.5SPLP extraction and analysis for metals listed above
1312/6020 and 7470 2
-- --
Acid-Base Accounting (ABA) 600/2-78-054 -- --Notes:
2. Leachate solution analyzed for metals/metalloids by EPA Methods 6020 and 7470.
1. Targeted MDLs and QLs are listed. Laboratories routinely adjust these values, and therefore, reported MDLs and QLs may differ slightly from those listed here.
Table A3-3
Laboratory Methods and Detection Limits for Target Analytes in Solid-Media Samples
Target Analyte EPA Method Number
Method Detection Limit
(MDL) 1
(mg/kg)
Quantitation
Limit (QL) 1
(mg/kg)
Other Parameters
Page 1 of 1
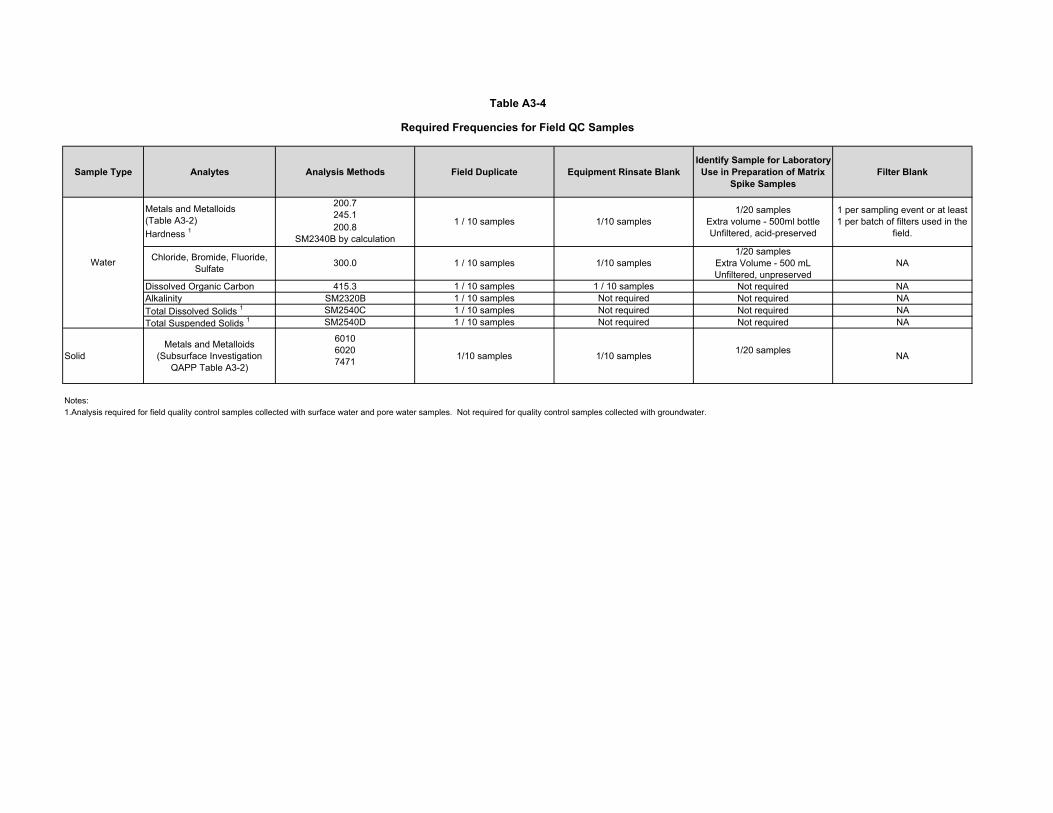
Sample Type Analytes Analysis Methods Field Duplicate Equipment Rinsate BlankIdentify Sample for Laboratory
Use in Preparation of Matrix Spike Samples
Filter Blank
200.7245.1200.8
SM2340B by calculation
Dissolved Organic Carbon 415.3 1 / 10 samples 1 / 10 samples Not required NAAlkalinity SM2320B 1 / 10 samples Not required Not required NATotal Dissolved Solids 1 SM2540C 1 / 10 samples Not required Not required NATotal Suspended Solids 1 SM2540D 1 / 10 samples Not required Not required NA
SolidMetals and Metalloids
(Subsurface Investigation QAPP Table A3-2)
601060207471 1/10 samples 1/10 samples 1/20 samples NA
Notes:1.Analysis required for field quality control samples collected with surface water and pore water samples. Not required for quality control samples collected with groundwater.
Required Frequencies for Field QC Samples
Table A3-4
Metals and Metalloids (Table A3-2) Hardness 1
1/10 samplesWater
1 / 10 samples1 per sampling event or at least 1 per batch of filters used in the
field.
NA300.0 1 / 10 samples
1/10 samples1/20 samples
Extra volume - 500ml bottleUnfiltered, acid-preserved
1/20 samplesExtra Volume - 500 mLUnfiltered, unpreserved
Chloride, Bromide, Fluoride, Sulfate
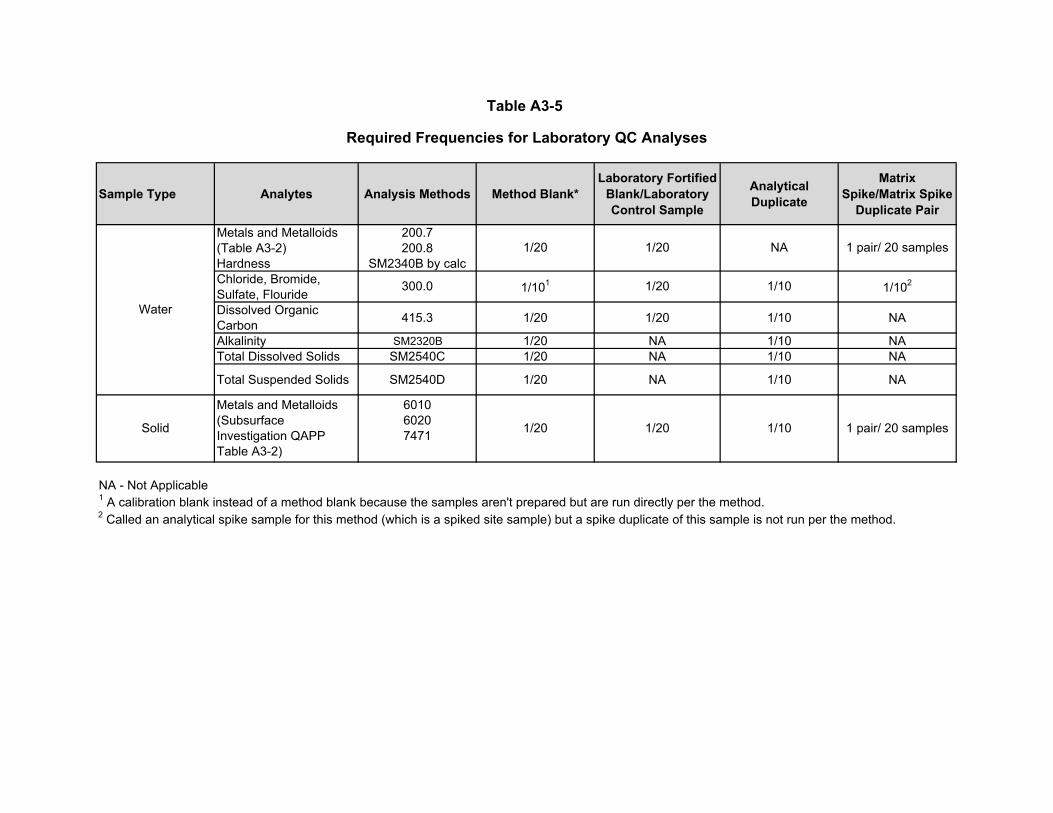
Sample Type Analytes Analysis Methods Method Blank*Laboratory Fortified
Blank/Laboratory Control Sample
Analytical Duplicate
Matrix Spike/Matrix Spike
Duplicate Pair
200.7200.8
Hardness SM2340B by calcChloride, Bromide,Sulfate, FlourideDissolved Organic Carbon 415.3 1/20 1/20 1/10 NA
Alkalinity SM2320B 1/20 NA 1/10 NATotal Dissolved Solids SM2540C 1/20 NA 1/10 NA
Total Suspended Solids SM2540D 1/20 NA 1/10 NA
NA - Not Applicable1 A calibration blank instead of a method blank because the samples aren't prepared but are run directly per the method. 2 Called an analytical spike sample for this method (which is a spiked site sample) but a spike duplicate of this sample is not run per the method.
1/102300.0
Table A3-5
Required Frequencies for Laboratory QC Analyses
Metals and Metalloids (Table A3-2)
Water
1/20 1/20 NA 1 pair/ 20 samples
1/101 1/20 1/10
Solid
Metals and Metalloids (Subsurface Investigation QAPP Table A3-2)
601060207471 1/20 1/20 1/10 1 pair/ 20 samples
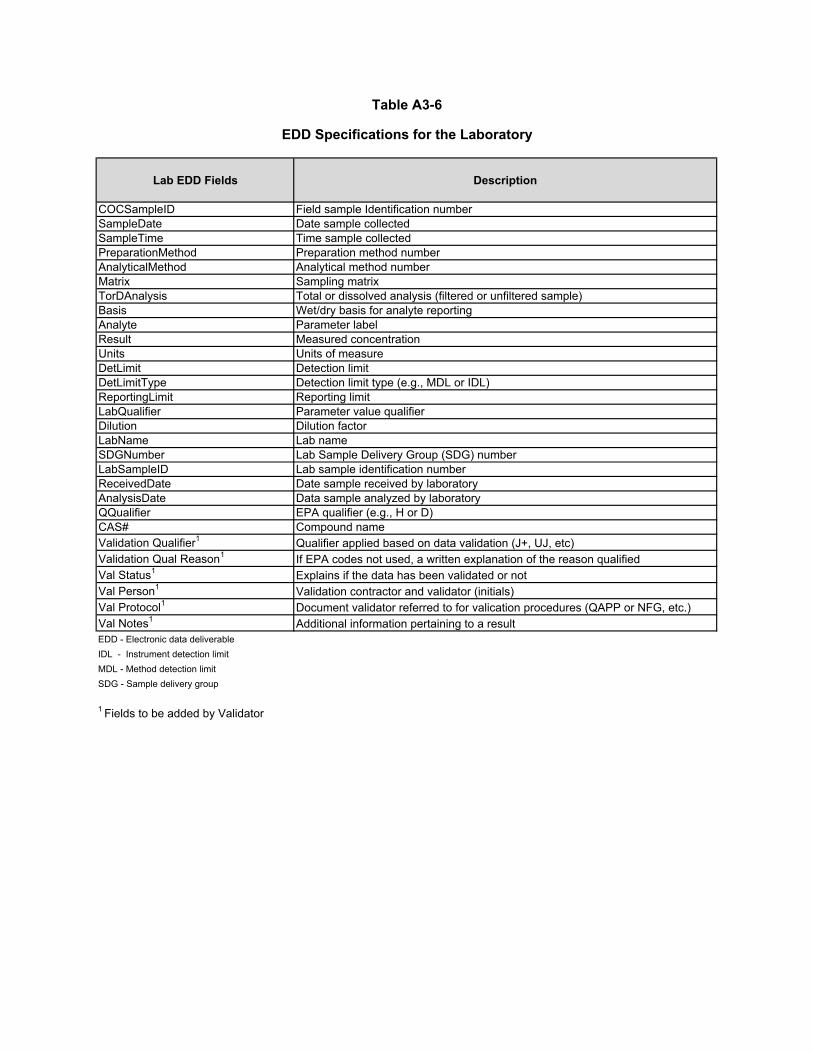
Lab EDD Fields Description
COCSampleID Field sample Identification numberSampleDate Date sample collectedSampleTime Time sample collectedPreparationMethod Preparation method numberAnalyticalMethod Analytical method numberMatrix Sampling matrixTorDAnalysis Total or dissolved analysis (filtered or unfiltered sample)Basis Wet/dry basis for analyte reportingAnalyte Parameter labelResult Measured concentrationUnits Units of measureDetLimit Detection limitDetLimitType Detection limit type (e.g., MDL or IDL)ReportingLimit Reporting limitLabQualifier Parameter value qualifierDilution Dilution factorLabName Lab nameSDGNumber Lab Sample Delivery Group (SDG) numberLabSampleID Lab sample identification numberReceivedDate Date sample received by laboratoryAnalysisDate Data sample analyzed by laboratoryQQualifier EPA qualifier (e.g., H or D)CAS# Compound nameValidation Qualifier1 Qualifier applied based on data validation (J+, UJ, etc)Validation Qual Reason1 If EPA codes not used, a written explanation of the reason qualifiedVal Status1 Explains if the data has been validated or notVal Person1 Validation contractor and validator (initials)Val Protocol1 Document validator referred to for valication procedures (QAPP or NFG, etc.)Val Notes1 Additional information pertaining to a resultEDD - Electronic data deliverableIDL - Instrument detection limitMDL - Method detection limitSDG - Sample delivery group
1 Fields to be added by Validator
Table A3-6
EDD Specifications for the Laboratory
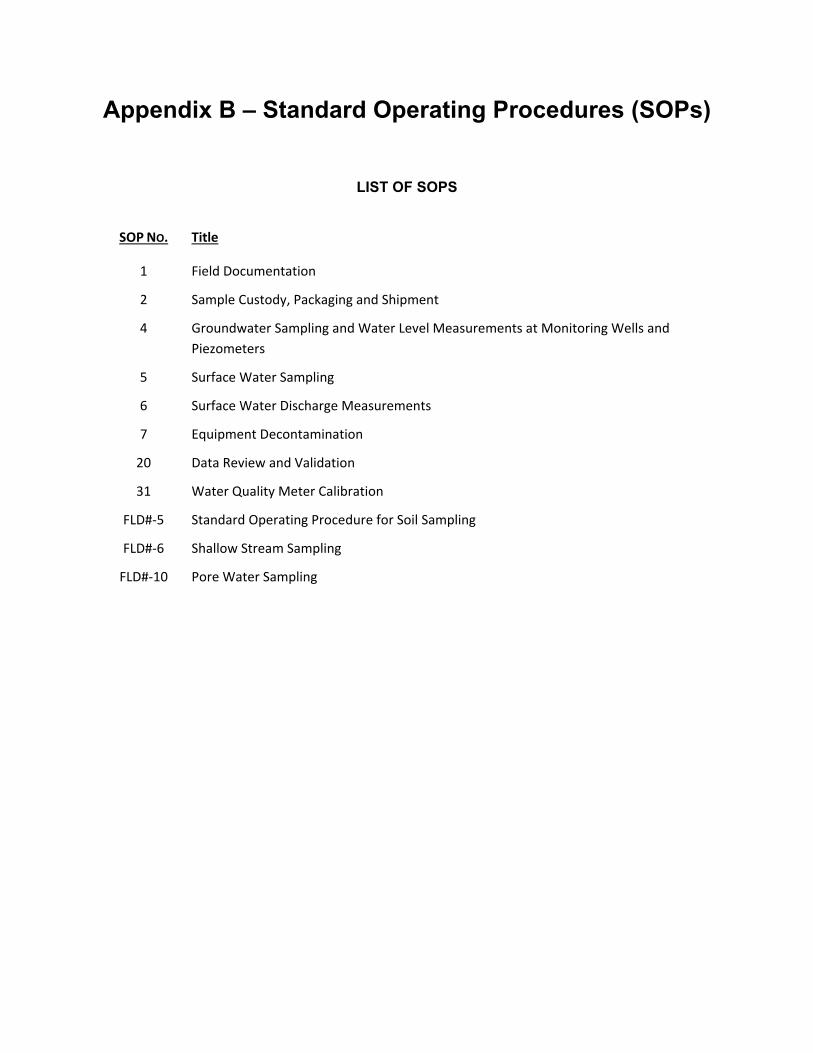
Appendix B – Standard Operating Procedures (SOPs)
LIST OF SOPS
SOP NO. Title
1 Field Documentation
2 Sample Custody, Packaging and Shipment
4 Groundwater Sampling and Water Level Measurements at Monitoring Wells and
Piezometers
5 Surface Water Sampling
6 Surface Water Discharge Measurements
7 Equipment Decontamination
20 Data Review and Validation
31 Water Quality Meter Calibration
FLD#‐5 Standard Operating Procedure for Soil Sampling
FLD#‐6 Shallow Stream Sampling
FLD#‐10 Pore Water Sampling
SOP No. 1 Field Documentation
SOP No. 1 Rev. No. 5
Date: March 2015 Page 1 of 4
STANDARD OPERATING PROCEDURE No. 1
FIELD DOCUMENTATION
1.0 SCOPE AND APPLICABILITY
The following Standard Operating Procedure (SOP) describes the protocol for
documenting field monitoring activities. The procedures presented herein are intended
to be general in nature and are applicable when referenced by site-specific or project-
specific planning documents. Appropriate modifications to the procedures may be made
to accommodate project-specific protocols when approved in writing or via email by the
Project Manager or detailed in a project work plan, sampling plan, or quality assurance
project plan.
The objective of this SOP is to establish a consistent method and format to document
daily field activities. The resultant field notes and records are intended to provide
sufficient information that can be used to recreate the field activities and the collection of
environmental data.
2.0 BASIS FOR METHODOLOGY
The methods and procedures described in this SOP were developed from these
sources:
ANSI/ASQC E-4 (1994) American National Standards Institute/American Society for Quality Control Specifications and Guidelines for Quality Systems for Environmental Data Collection and Environmental Technology Programs.
ASTM D 6089 (2010) American Society for Testing and Materials (ASTM) ASTM D 6089 Standard Guide for Documenting a Ground-Water Sampling Event.
EPA QA/G6 (2007) U.S. Environmental Protection Agency Guidance for
Preparation of Standard Operating Procedures (SOPs). EPA/600/B-07/001. Office of Environmental Information, Washington, DC, April.
EPA QA/G5 (2002) U.S. Environmental Protection Agency EPA Guidance for Quality Assurance Project Plans. EPA/240/R-02/009. Office of Environmental Information, Washington, DC, December.

SOP No. 1 Rev. No. 5
Date: March 2015 Page 2 of 4
3.0 PROCEDURES
3.1 Daily Field Activities
The field representative actually performing the environmental monitoring or sampling
will record all field activities in the field notebook for each day of field work.
Documentation will include:
A. Project identification; B. Date; C. Time on job (beginning and ending time); D. Weather conditions; E. Activity description; F. List of personnel and visitors on site; G. Safety equipment used and monitoring performed; H. Waste storage inventory (if any); I. Chronological record of activities and events; J. Comments and variances from project work plan; K. Content of telephone conversations; L. Calibration parameters; and M. Signature of the field representative.
The field representative will document all details that would be necessary to recreate the
day's activities and events at a later time. The field notebook will be used to document
field activities and information that may not be specified on other field record forms.
Other activity-specific documentation requirements to be recorded on field record forms
are discussed in the Standard Operating Procedure for each activity.
SOP No. 1 Rev. No. 5
Date: March 2015 Page 3 of 4
4.0 DOCUMENTATION
4.1 Field Record Forms
In addition to the field notebook, field personnel will complete specific field record forms
(which may be in paper or electronic format) applicable to the field activities being
conducted. The procedures for completion of activity-specific field record forms are
presented in the applicable Standard Operating Procedures. Additional field record
forms and applicable procedures may be created for project-specific activities, as
necessary.
4.2 Records Management
All original field forms and copies of field notebooks will be filed with the appropriate
project records in the project files. Specific field record forms filled out using an
electronic device will be printed and filed with the appropriate project records.
5.0 QUALITY ASSURANCE/QUALITY CONTROL
All completed field forms will be reviewed by the Project Manager or project-designated
reviewer. Any necessary corrections will be made in pen with a single-line strike out that
is initialed and dated.
6.0 REFERENCES
American National Standards Institute/American Society for Quality Control, 1994.
Specifications and Guidelines for Quality Systems for Environmental Data Collection and Environmental Technology Programs. ANSI/ASQC E-4.
American Society for Testing and Materials (ASTM), 2010. ASTM D 6089-97. Standard
Guide for Documenting a Ground-Water Sampling Event. American Society for Testing and Materials available online at http://www.astm.org/
U.S. Environmental Protection Agency (USEPA), 2007. EPA QA/G6, Guidance for
Preparing Standard Operating Procedures (SOPs). EPA/600/B-07/001. Office of Environmental Information, Washington, DC, April. Available online at http://www.epa.gov/QUALITY/qs-docs/g6-final.pdf
U.S. Environmental Protection Agency (USEPA), 2002. EPA QA/G5, EPA Guidance for
Quality Assurance Project Plans. EPA/240/R-02/009. Office of Environmental

SOP No. 1 Rev. No. 5
Date: March 2015 Page 4 of 4
Information, Washington, DC., December. Available online at http://www.epa.gov/QUALITY/qs-docs/g5-final.pdf
SOP No. 2 Sample Custody, Packaging and Shipment
SOP No. 2 Rev. No. 4
Date: March 2015 Page 1 of 7
STANDARD OPERATING PROCEDURE No. 2
SAMPLE CUSTODY, PACKAGING, AND SHIPMENT
1.0 SCOPE AND APPLICABILITY
The following Standard Operating Procedure (SOP) describes the protocol for sample
custody and packaging and shipment of samples. The procedures presented herein are
intended to be general in nature and are applicable when referenced by site-specific or
project-specific planning documents. Appropriate modifications to the procedures may
be made when approved in writing or via email by the Project Manager.
This SOP applies to any liquid or solid sample that is being transported by the sampler,
a courier, or an overnight delivery service.
2.0 BASIS FOR METHODOLOGY
The methods and procedures described in this SOP were developed from these
sources:
49 CFR 173. Shippers – Shippers – General Requirements for Shipping.United States Code of Federal Regulations available online athttp://www.gpoaccess.gov/cfr/index.html
49 CFR 178. Specifications for Packaging. United States Code of FederalRegulations available online at http://www.gpoaccess.gov/cfr/index.html
ASTM D 4220-95 (2000). Standard Practices for Preserving andTransporting Soil Samples, American Society for Testing and Materialsavailable online at http://www.astm.org/
ASTM D 4840-99 (2010). Standard Guide for Sampling Chain-of-CustodyProcedures. American Society for Testing and Materials available onlineat http://www.astm.org/
SOP No. 2 Rev. No. 4
Date: January 2015 Page 2 of 7
3.0 PROCEDURES
The objectives of this packaging and shipping SOP are to minimize the potential for
sample breakage, leakage, or cross contamination; to provide for preservation at the
proper temperature; and to provide a clear record of sample custody from collection to
analysis.
3.1 Packaging Materials
The following is a list of materials that will be needed to facilitate proper sample
packaging:
Chain-of-Custody (COC)/Request for Analysis (RA) forms;
Analyte List;
Coolers (insulated ice chests) or other shipping containers as appropriate tosample type;
Transparent packaging tape;
Duct tape or similar (for sealing cooler drain);
Zip-lock type bags (note: this is used as a generic bag type, not a specificbrand name);
Large garbage bags;
Protective wrapping and packaging material;
Contained ice (packaged and sealed to prevent leakage when melted) or“Blue Ice”; and
Chain-of-Custody seals.
3.2 Sample Custody from Field Collection to Laboratory
After samples have been collected, they will be maintained under chain-of-custody
procedures. These procedures are used to document the transfer of custody of the
samples from the field to the designated analytical laboratory. The same chain-of-
custody procedures will be used for the transfer of samples from one laboratory to
another, if required.
SOP No. 2 Rev. No. 4
Date: January 2015 Page 3 of 7
The field sampling personnel will complete a COC/RA form and provide an Analyte List
for each separate container of samples to be shipped or delivered to the laboratory for
chemical or physical (geotechnical) analysis. Information contained on the form will
include:
1. Project identification;
2. Date and time of sampling;
3. Sample identification;
4. Sample matrix type;
5. Sample preservation method(s);
6. Number and types of sample containers;
7. Sample hazards (if any);
8. Requested analysis(es);
9. Method of shipment;
10. Carrier/waybill number (if any);
11. Signature of sampling personnel;
12. Name of Project Manager;
13. Signature, name and company of the person relinquishing and the personreceiving the samples when custody is being transferred;
14. Date and time of sample custody transfer;
15. Condition of samples upon receipt by laboratory; and
16. Chain of Custody identification number.
The samples will be carefully packaged into shipping containers/ice chests.
The sampling personnel whose signature appears on the COC/RA form is responsible
for the custody of a sample from the time of sample collection until the custody of the
sample is transferred to a designated laboratory, a courier, or to another employee for
the purpose of transporting a sample to the designated laboratory. A sample is
SOP No. 2 Rev. No. 4
Date: January 2015 Page 4 of 7
considered to be in their custody when the custodian: (1) has direct possession of it; (2)
has plain view of it; or (3) has securely locked it in a restricted access area.
Custody is transferred when both parties to the transfer complete the portion of the
COC/RA form under "Relinquished by" and "Received by." Signatures, printed names,
company or organization names, and date and time of custody transfer are required.
Upon transfer of custody, the sampling personnel who relinquished the samples will
retain a copy of the COC/RA form.
3.3 Sample Custody within Laboratory
The designated laboratory will assume sample custody upon receipt of the samples and
COC/RA form. Sample custody within the analytical laboratory will be the responsibility
of designated laboratory personnel. The laboratory will document the transfer of sample
custody and receipt by the laboratory by signing the correct portion of the COC/RA form.
Upon receipt, the laboratory sample custodian will note the condition of the samples, by
checking the following items:
1. Agreement of the number, identification and description of samplesreceived by comparison with the information on the COC/RA form; and
2. Condition of samples (any bottle breakage; leakage, cooler temperature,etc.).
If any problems are discovered, the laboratory sample custodian will note this
information on the "Laboratory Comments/Condition of Samples" section of the COC/RA
form, and will notify the sampling personnel or Project Manager immediately. The
Project Manager will decide on the final disposition of the problem samples.
The laboratory will retain a copy of the COC/RA form and return an electronic copy to
the originator with the final laboratory report of analytical results. The original of the
COC/RA form will be retained as part of the permanent documentation in the project file.
A record of the history of the sample within the laboratory containing sample status and
storage location information will be maintained in a logbook, or a computer sample
tracking system, at the laboratory. The following information will be recorded for every
sample access event:
SOP No. 2 Rev. No. 4
Date: January 2015 Page 5 of 7
1. Sample identification;
2. Place of storage;
3. Date(s) and time(s) of sample removal and return to storage;
4. Accessor's name and title;
5. Reason for access; and
6. Comments/observations (if any).
The laboratory will provide a copy of the logbook or computer file information pertaining
to a sample upon request.
3.4 Sample Custody during Inter-Laboratory Transfer
If samples must be transferred from one laboratory to another, the same sample custody
procedures described above will be followed. The designated laboratory person (sample
custodian) will complete a COC/RA form and sign as the originator. The laboratory
relinquishing the sample custody will retain a copy of the completed form. The
laboratory receiving sample custody will sign the form, indicating transfer of custody,
retain a copy, and return the original record to the originator with the final laboratory
report of analytical results. The COC/RA form will be retained as part of the permanent
documentation in the project file.
3.5 Packaging and Shipping Procedure
All sample containers will be properly labeled and all samples will be logged on the
COC/RA form in accordance with the procedures explained.
All samples will be packed in the cooler so as to minimize the possibility of breakage,
cross-contamination, and leakage. Before placing the sample containers into the cooler,
all sample bottle caps will be checked and tightened if necessary. A large garbage bag
will be placed as a liner inside the cooler and duct tape (or similar) will be used to seal
off any drain openings on the inside and/or outside of the cooler. Bottles made of
breakable material (e.g., glass) will also be wrapped in protective material (e.g., bubble
wrap, plastic gridding, or foam) prior to placement in the cooler. Each sample set or soil
SOP No. 2 Rev. No. 4
Date: January 2015 Page 6 of 7
tube liner (for a California, Shelby Tube or Split-spoon Sampler) will be placed into a zip-
lock bag to protect from cross-contamination and to keep the sample labels dry. Sample
containers will be placed upright in the cooler. Stacking glass sample bottles directly on
top of each other will be avoided.
If required by the method, samples will be preserved to 4°C prior to the analysis. Water
ice or “blue ice” will be used to keep the sample temperatures at 4°C. The ice will be
placed in two zip-lock bags if the samples are to be transported by someone other than
the sampler (e.g., a courier or overnight delivery service). The zip-lock bags of ice will
be placed in between, on the bottom, and/or on top of the sample containers so as to
maximize the contact between the containers and the bagged ice. If the sampler is
transporting the samples to the laboratory shortly after sample collection, the water ice
may be poured over and between the sample bottles in the cooler.
If there is any remaining space at the top of the cooler, packing material (e.g., Styrofoam
pellets or bubble wrap) will be placed to fill the open space of the cooler. After filling the
cooler, the garbage bag will be sealed, a copy of the COC/RA form and Analyte List will
be placed in a zip-lock bag and taped to the inside of the cooler lid, the top of the cooler
will be closed, and the cooler will be shaken to verify that the contents are secure.
Additional packaging material will be added if necessary.
When transport to the laboratory by the sampler is not feasible, sample shipment will
occur via courier or overnight express shipping service that guarantees shipment
tracking and next morning delivery (e.g., Federal Express Priority Overnight or UPS Next
Day Air). The same procedures will be followed to pack and fill the cooler and provide
the COC/RA form and Analyte List, as if the sampler were transporting the samples to
the laboratory. The cooler will be taped shut with packaging tape. Packaging tape will
completely encircle the cooler, and chain-of-custody seals will be signed and placed
across the front and side of the container opening.
Copies of all shipment records provided by the courier or overnight delivery service will
be retained and maintained in the project file.
SOP No. 2 Rev. No. 4
Date: January 2015 Page 7 of 7
4.0 DOCUMENTATION AND RECORDS MANAGEMENT
Daily Field Records or a field notebook with field notes will be kept describing the
packaging procedures and the method of shipment. Copies of all shipping records and
chain-of-custody records will be retained in the project file.
5.0 QUALITY ASSURANCE
The Project Manager or designated reviewer will check and verify that documentation
has been completed and filed per this procedure.
6.0 REFERENCES
49 CFR 173. Shippers – General Requirements for Shipments and Packagings. United States Code of Federal Regulations. Available online at http://www.gpoaccess.gov/cfr/index.html
49 CFR 178. Specifications for Packaging. United States Code of Federal Regulations. Available online at http://www.gpoaccess.gov/cfr/index.html
ASTM D 4220-95 (2000). Standard Practices for Preserving and Transporting Soil Samples, ASTM International, West Conshohocken, PA, 2000. Available online at http://www.astm.org/
ASTM D 4840-99 (2010). Standard Guide for Sampling Chain-of-Custody Procedures, ASTM International, West Conshohocken, PA, 2010. Available online at http://www.astm.org/
SOP No. 4 Groundwater Sampling and Water Level Measurements at Mentoring Wells and Piezometers
SOP No. 4 Rev. No. 5
Date: July 2015 Page 1 of 19
STANDARD OPERATING PROCEDURE No.
4
GROUNDWATER SAMPLING AND WATER LEVEL MEASUREMENTS AT MONITORING WELLS AND PIEZOMETERS
1.0 SCOPE AND APPLICABILITY
This Standard Operating Procedure (SOP) describes the protocol to be followed during
measurement of water levels and depths of monitoring wells and piezometers, and for
water quality sampling from monitoring wells. The procedures presented herein are
intended to be general in nature and are applicable when referenced by site-specific or
project-specific planning documents. Appropriate modifications to the procedures may
be made to accommodate project-specific protocols when approved in writing or via
email by the Project Manager.
The objectives of the groundwater sampling procedures are to minimize changes in
groundwater chemistry during sample collection and to maximize the probability of
obtaining a representative, reproducible groundwater sample.
2.0 BASIS FOR METHODOLOGY
The methods and procedures described in this SOP were developed from these
sources:
USEPA Standard Operating Procedure for the Standard/Well-VolumeMethod for Collecting a Ground-Water Sample from Monitoring Wells forSite Characterization.
USEPA Region 1 (2010) Low Stress (low flow) Purging and SamplingProcedure for the Collection of Ground Water Samples from MonitoringWells. EQASOP-GW-001. Region 1 Low-Stress (Low-Flow) SOP,Revision Number 3, July 30, 1996, Revised January 19, 2010.
USEPA (2002) Ground-Water Sampling Guidelines for Superfund andRCRA Project Managers, Ground Water Forum Issue Paper. U.SEnvironmental Protection Agency, Technology Innovative Office, Office ofSolid Waste and Emergency Response, Washington D.C., EPA 542-S-02-001.
U.S. Geological Survey (USGS) (variously dated) National Field Manual
SOP No. 4 Rev. No. 5
Date: July 2015 Page 2 of 19
for the Collection of Water-Quality Data: U.S. Geological Survey Techniques of Water-Resources Investigations, Book 9, Handbooks for Water-Resources Investigations, Chapters A1-A9.
3.0 WATER LEVEL AND WELL DEPTH MEASURMENT PROCEDURES
Prior to performing water level and well depth measurements, the construction details
and previous measurements for each well or piezometer shall be reviewed by the field
geologist or other field personnel so any anomalous measurements may be identified.
Well construction details and previous measurements shall be available in the field for
review.
In general, water-level measurements shall be performed before groundwater is
removed from the well by purging or sampling.
3.1 Equipment
Equipment that may be necessary to perform measurements (depending on
measurements to be performed):
Well/piezometer construction details;
An electronic water-level meter with accuracy of 0.01 foot;
Water Level Monitoring Record Sheet, Groundwater Sampling Record or
field notebook; and
Weighted surveyor’s rope (measured to the nearest 0.1 foot).
3.2 Measuring Point
A measuring point (MP) shall be selected and marked for each monitoring well and
piezometer in which water level measurements will be made. Generally, the MP will be
on the north side of the top of the well casing. The MP will be permanently marked
using an indelible marker or a notch cut into the PVC casing. When the top-of-casing
elevation of a monitoring well or piezometer is surveyed, the licensed surveyor shall
measure the MP elevation and reference this measurement to an appropriate datum
(such as feet above mean sea level).
SOP No. 4 Rev. No. 5
Date: July 2015 Page 3 of 19
3.3 Water Level Measurements
When water levels are measured to describe the groundwater potentiometric surface,
the water level will be measured prior to purging. All wells to be gauged during a
monitoring event and used to construct the potentiometric surface should have water
levels measured within the same 24-hour period, as practical. All water level
measurements will be recorded to the nearest 0.01 foot. Instruments used for each
measurement will be noted on the Groundwater Sampling Record (attached form or
similar). Water levels are measured using the electronic probe method, as discussed
below.
An electronic probe consists of a contact electrode attached to the end of an insulated
electrical cable, and a reel which houses an ammeter, a buzzer, or other closed circuit
indicator. The indicator shows a closed circuit and flow of current when the electrode
touches the water surface.
The procedure for measuring water levels with an electric probe is as follows:
1. Switch on and test that the battery is charged and set the sensitivity dial
to the middle position.
2. Lower the probe into the well until the ammeter or buzzer indicates a closed circuit. Raise and lower the probe slightly until the shortest length of cable that gives the maximum response on the indicator is found.
3. With the cable in this fixed position, note the depth to water from the
Measuring Point (MP).
4. Repeat as necessary until at least two identical duplicate measurements are obtained.
Calibration of the electronic probe will be checked at regular intervals as part of regular
maintenance measuring the position of the electrode to check that the calibration marks
on the electronic probe correspond to those on a weighted surveyor’s rope or other
suitable measuring device.
SOP No. 4 Rev. No. 5
Date: July 2015 Page 4 of 19
3.4 Well Depth Measurements
The total depth of a well shall be measured by sounding with a weighted surveyor’s rope
or other suitable measuring device. For shallow wells, the electronic water-level probe
may also be used as a measuring device. Procedures to be followed are specified
below.
A. For calibration, measure the distance between the zero mark on the end of the measuring tape and the bottom of the weight to the nearest 0.1 foot at the beginning of each well depth measurement activity day, and whenever the apparatus is altered.
B. To measure well depth, lower a weighted tape into the well until the tape
becomes slack or there is a noticeable decrease in weight, which indicates the bottom of the well. Care should be taken to lower the tape slowly to avoid damage to the bottom of the well by the weight. Raise the tape slowly until it just becomes taut, and with the tape in this fixed position, note the tape reading opposite the MP to the nearest 0.1 foot. Add the values from the distance from the end of the tape to the end of the weight together, round this number to nearest 0.1 foot, and record the resulting value as "Total Depth (feet [ft], below measuring point [BMP])" on the Groundwater Sampling Record or field notebook.
3.5 Documentation and Records Management
Water levels observed in wells selected for the groundwater level monitoring program
will be tabulated on the Groundwater Sampling Record form during each monitoring
period (in print or electronic format – see attached form) or in the field notebook. The
date and time of each measurement will also be recorded in the field. All water level
measurements shall be recorded to the nearest 0.01 foot, and all depth measurements
shall be noted to the nearest 0.1 foot.
Water level data will be recorded as feet BMP so that water level elevations may be
calculated from the depth-to-water measurement (from the MP) and the surveyed
elevation of the MP at each well or piezometer. The MP will also be described and
documented in the Groundwater Sampling Record and/or field notebook (i.e., top of PVC
casing, top of protective casing, or below ground surface).
Well depth measurements may also be recorded on the Groundwater Sampling Record.
SOP No. 4 Rev. No. 5
Date: July 2015 Page 5 of 19
4.0 GROUNDWATER SAMPLE COLLECTION PROCEDURES
4.1 Low Flow Sample Collection
For wells that are sampled for regulatory compliance, a low flow sample collection
technique shall be employed whenever possible to ensure that representative
groundwater samples are collected from each well. Additionally, low flow sampling is to
be the preferred method for groundwater sampling unless site specific conditions
warrant a volume-based approach or a non-purge approach such as a HydraSleeveTM
(as discussed in Sections 4.2 and 4.3, respectively).
A. Measure the depth to water (water level must be measured to nearest 0.01
feet) relative to a reference MP on the well casing with an electronic water level indicator or steel tape and recorded.
B. For wells with non-dedicated equipment (i.e., no dedicated tubing, pump, or docking station), place the pump at the wellhead and slowly lower the pump and tubing down into the well until the location of the pump intake is set to the midpoint of the screened interval, unless otherwise specified in the monitoring plan. Care should be taken to minimize disturbance to the water column during insertion of the pump. A variable rate submersible centrifugal or positive displacement type pump (i.e., bladder or piston pump) will be used for purging and sampling; however, if the water table is less than 20 ft below ground surface (bgs) a peristaltic pump may be employed as long as the constituents measured are not influenced by negative pressures. The pump and associated tubing used shall be constructed of inert materials and compatible with the parameter(s) to be collected. The placement of the pump intake should be positioned with a calibrated sampling pump hose, sounded with a weighted-tape or using a pre-measured hose. Refer to the available well information to determine the depth and length of the screened interval. The pump should be adequately supported once it has been lowered to ensure that it will not shift during purging. Record the depth of the pump intake after lowering the pump into location. For wells with dedicated pumping equipment, pump depth should be confirmed and equipment condition recorded.
C. Measure the water level (nearest 0.01 feet) and record the information on the
Groundwater Sampling Record and/or in the field notebook. The water level indicator should remain in the well to allow for periodic measurement of the water level during purging.
D. Connect the discharge line from the pump to a flow-through cell to measure
field water quality parameters. If turbidity measurements are to be collected using a separate instrument from that employed to monitor water quality in the flow through cell, a “T” connection is needed prior to the flow-through cell to allow for the collection of water for turbidity measurements. The discharge line from the flow-through cell must be directed to a container to hold the
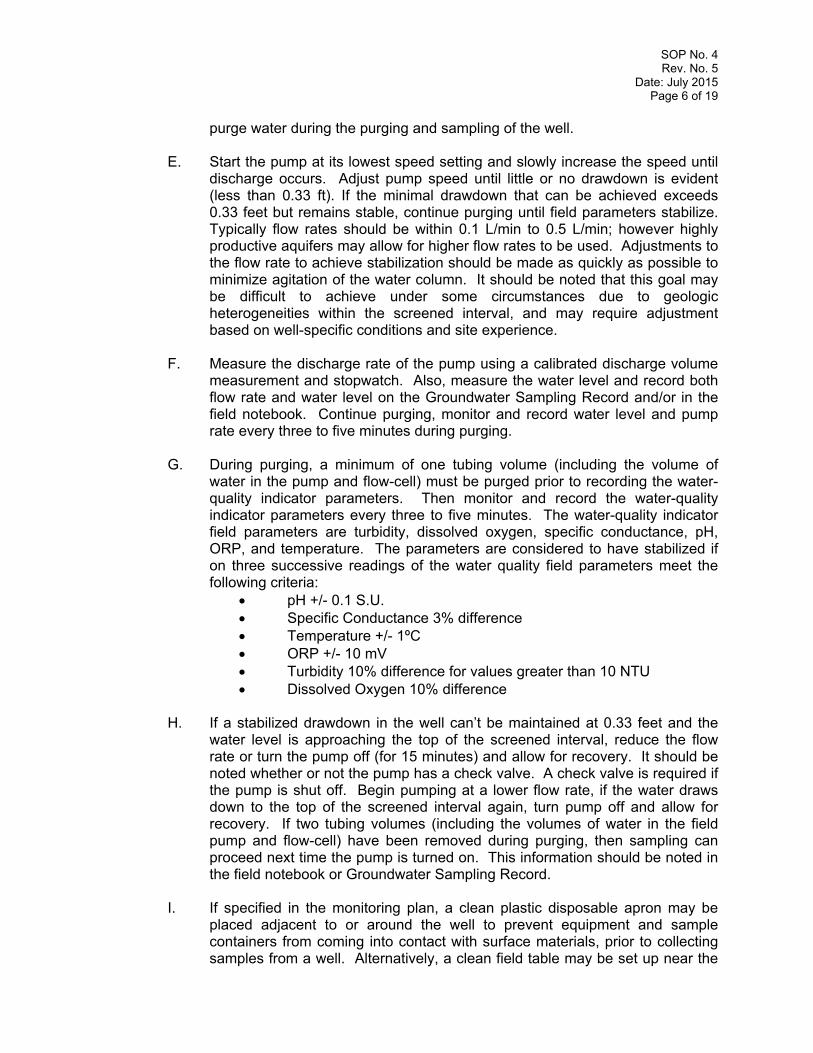
SOP No. 4 Rev. No. 5
Date: July 2015 Page 6 of 19
purge water during the purging and sampling of the well.
E. Start the pump at its lowest speed setting and slowly increase the speed until discharge occurs. Adjust pump speed until little or no drawdown is evident (less than 0.33 ft). If the minimal drawdown that can be achieved exceeds 0.33 feet but remains stable, continue purging until field parameters stabilize. Typically flow rates should be within 0.1 L/min to 0.5 L/min; however highly productive aquifers may allow for higher flow rates to be used. Adjustments to the flow rate to achieve stabilization should be made as quickly as possible to minimize agitation of the water column. It should be noted that this goal may be difficult to achieve under some circumstances due to geologic heterogeneities within the screened interval, and may require adjustment based on well-specific conditions and site experience.
F. Measure the discharge rate of the pump using a calibrated discharge volume
measurement and stopwatch. Also, measure the water level and record both flow rate and water level on the Groundwater Sampling Record and/or in the field notebook. Continue purging, monitor and record water level and pump rate every three to five minutes during purging.
G. During purging, a minimum of one tubing volume (including the volume of
water in the pump and flow-cell) must be purged prior to recording the water-quality indicator parameters. Then monitor and record the water-quality indicator parameters every three to five minutes. The water-quality indicator field parameters are turbidity, dissolved oxygen, specific conductance, pH, ORP, and temperature. The parameters are considered to have stabilized if on three successive readings of the water quality field parameters meet the following criteria:
pH +/- 0.1 S.U. Specific Conductance 3% difference Temperature +/- 1ºC ORP +/- 10 mV Turbidity 10% difference for values greater than 10 NTU Dissolved Oxygen 10% difference
H. If a stabilized drawdown in the well can’t be maintained at 0.33 feet and the
water level is approaching the top of the screened interval, reduce the flow rate or turn the pump off (for 15 minutes) and allow for recovery. It should be noted whether or not the pump has a check valve. A check valve is required if the pump is shut off. Begin pumping at a lower flow rate, if the water draws down to the top of the screened interval again, turn pump off and allow for recovery. If two tubing volumes (including the volumes of water in the field pump and flow-cell) have been removed during purging, then sampling can proceed next time the pump is turned on. This information should be noted in the field notebook or Groundwater Sampling Record.
I. If specified in the monitoring plan, a clean plastic disposable apron may be
placed adjacent to or around the well to prevent equipment and sample containers from coming into contact with surface materials, prior to collecting samples from a well. Alternatively, a clean field table may be set up near the
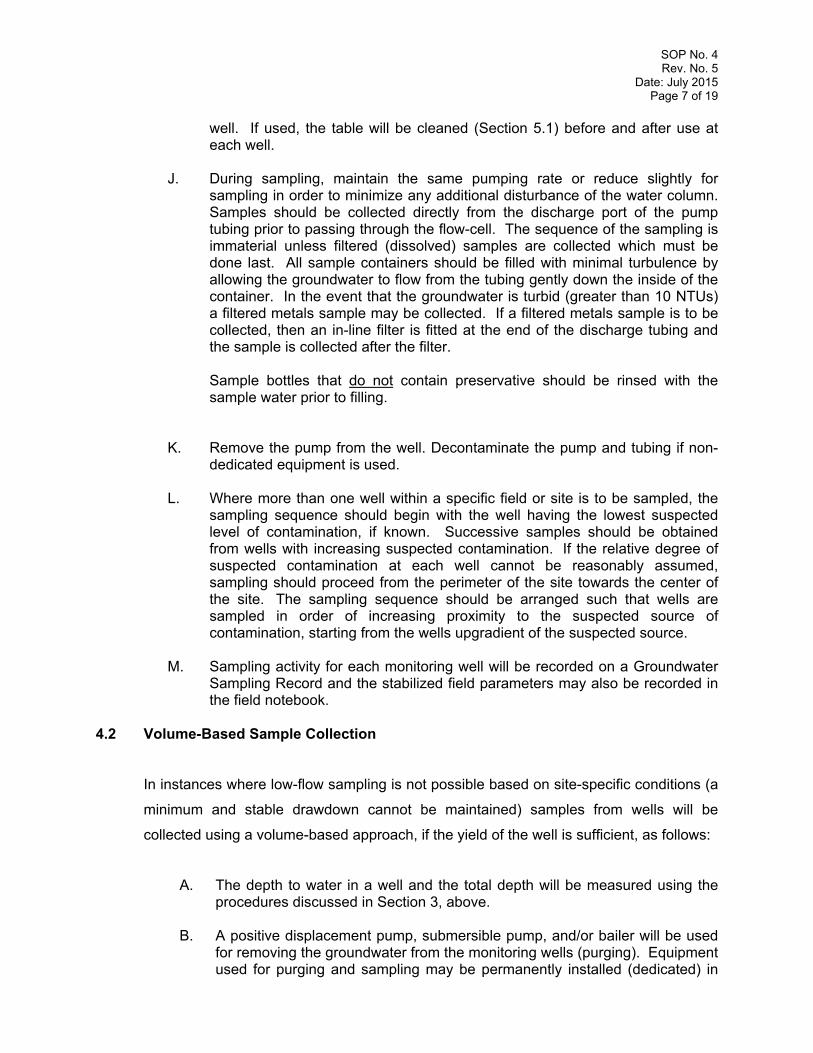
SOP No. 4 Rev. No. 5
Date: July 2015 Page 7 of 19
well. If used, the table will be cleaned (Section 5.1) before and after use at each well.
J. During sampling, maintain the same pumping rate or reduce slightly for sampling in order to minimize any additional disturbance of the water column. Samples should be collected directly from the discharge port of the pump tubing prior to passing through the flow-cell. The sequence of the sampling is immaterial unless filtered (dissolved) samples are collected which must be done last. All sample containers should be filled with minimal turbulence by allowing the groundwater to flow from the tubing gently down the inside of the container. In the event that the groundwater is turbid (greater than 10 NTUs) a filtered metals sample may be collected. If a filtered metals sample is to be collected, then an in-line filter is fitted at the end of the discharge tubing and the sample is collected after the filter. Sample bottles that do not contain preservative should be rinsed with the sample water prior to filling.
K. Remove the pump from the well. Decontaminate the pump and tubing if non-dedicated equipment is used.
L. Where more than one well within a specific field or site is to be sampled, the
sampling sequence should begin with the well having the lowest suspected level of contamination, if known. Successive samples should be obtained from wells with increasing suspected contamination. If the relative degree of suspected contamination at each well cannot be reasonably assumed, sampling should proceed from the perimeter of the site towards the center of the site. The sampling sequence should be arranged such that wells are sampled in order of increasing proximity to the suspected source of contamination, starting from the wells upgradient of the suspected source.
M. Sampling activity for each monitoring well will be recorded on a Groundwater
Sampling Record and the stabilized field parameters may also be recorded in the field notebook.
4.2 Volume-Based Sample Collection
In instances where low-flow sampling is not possible based on site-specific conditions (a
minimum and stable drawdown cannot be maintained) samples from wells will be
collected using a volume-based approach, if the yield of the well is sufficient, as follows:
A. The depth to water in a well and the total depth will be measured using the procedures discussed in Section 3, above.
B. A positive displacement pump, submersible pump, and/or bailer will be used
for removing the groundwater from the monitoring wells (purging). Equipment used for purging and sampling may be permanently installed (dedicated) in
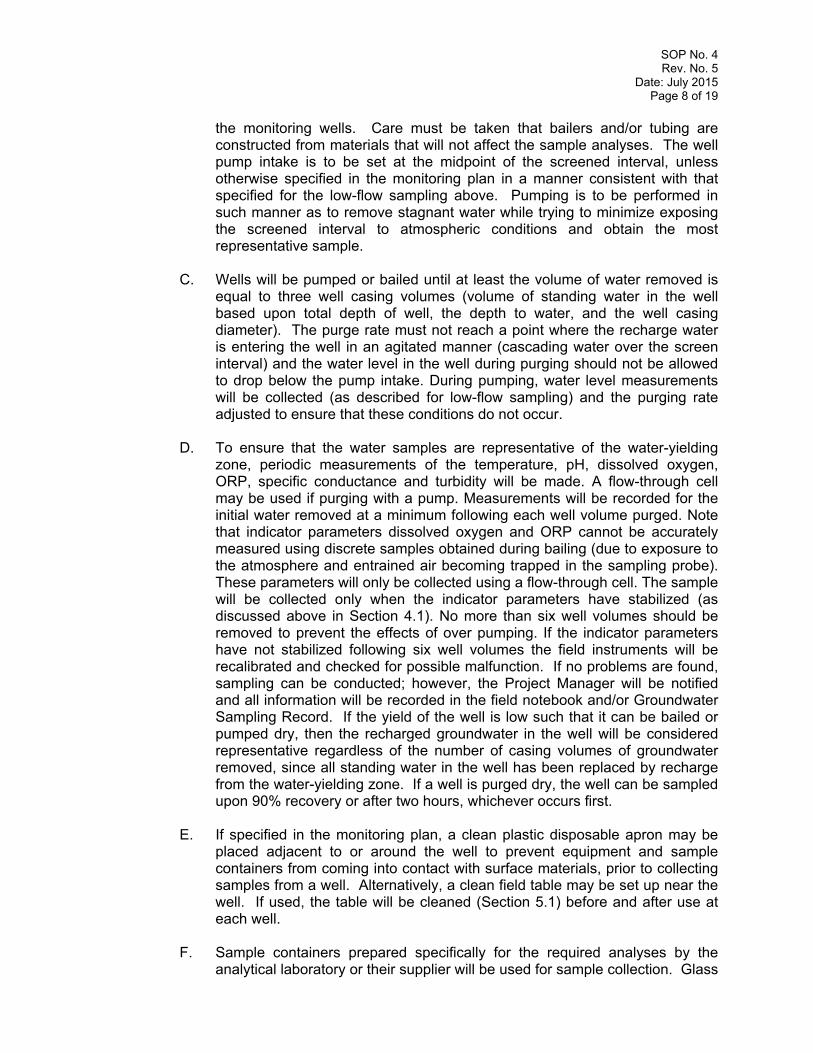
SOP No. 4 Rev. No. 5
Date: July 2015 Page 8 of 19
the monitoring wells. Care must be taken that bailers and/or tubing are constructed from materials that will not affect the sample analyses. The well pump intake is to be set at the midpoint of the screened interval, unless otherwise specified in the monitoring plan in a manner consistent with that specified for the low-flow sampling above. Pumping is to be performed in such manner as to remove stagnant water while trying to minimize exposing the screened interval to atmospheric conditions and obtain the most representative sample.
C. Wells will be pumped or bailed until at least the volume of water removed is
equal to three well casing volumes (volume of standing water in the well based upon total depth of well, the depth to water, and the well casing diameter). The purge rate must not reach a point where the recharge water is entering the well in an agitated manner (cascading water over the screen interval) and the water level in the well during purging should not be allowed to drop below the pump intake. During pumping, water level measurements will be collected (as described for low-flow sampling) and the purging rate adjusted to ensure that these conditions do not occur.
D. To ensure that the water samples are representative of the water-yielding zone, periodic measurements of the temperature, pH, dissolved oxygen, ORP, specific conductance and turbidity will be made. A flow-through cell may be used if purging with a pump. Measurements will be recorded for the initial water removed at a minimum following each well volume purged. Note that indicator parameters dissolved oxygen and ORP cannot be accurately measured using discrete samples obtained during bailing (due to exposure to the atmosphere and entrained air becoming trapped in the sampling probe). These parameters will only be collected using a flow-through cell. The sample will be collected only when the indicator parameters have stabilized (as discussed above in Section 4.1). No more than six well volumes should be removed to prevent the effects of over pumping. If the indicator parameters have not stabilized following six well volumes the field instruments will be recalibrated and checked for possible malfunction. If no problems are found, sampling can be conducted; however, the Project Manager will be notified and all information will be recorded in the field notebook and/or Groundwater Sampling Record. If the yield of the well is low such that it can be bailed or pumped dry, then the recharged groundwater in the well will be considered representative regardless of the number of casing volumes of groundwater removed, since all standing water in the well has been replaced by recharge from the water-yielding zone. If a well is purged dry, the well can be sampled upon 90% recovery or after two hours, whichever occurs first.
E. If specified in the monitoring plan, a clean plastic disposable apron may be
placed adjacent to or around the well to prevent equipment and sample containers from coming into contact with surface materials, prior to collecting samples from a well. Alternatively, a clean field table may be set up near the well. If used, the table will be cleaned (Section 5.1) before and after use at each well.
F. Sample containers prepared specifically for the required analyses by the
analytical laboratory or their supplier will be used for sample collection. Glass
SOP No. 4 Rev. No. 5
Date: July 2015 Page 9 of 19
sample bottles should be filled to near the top. To account for slight expansion due to temperature changes, leave headspace approximately equivalent to the volume of liquid which would fill the bottle's cap. Plastic sample bottles should be filled completely. Splashing of the water in the sample container and exposure to the atmosphere shall be minimized during sampling. The container cap will be screwed on tightly immediately after filling the sample container. Under this protocol, samples should be collected in order of decreasing volatility (i.e., most volatile samples will be collected first). Sample filtration, if necessary, is discussed in Section 4.5 of this SOP.
Sample bottles that do not contain preservative should be rinsed with the
sample water prior to filling. G. Where more than one well within a specific field or site is to be sampled, the
sampling sequence should begin with the well having the lowest suspected level of contamination, if known. Successive samples should be obtained from wells with increasing suspected contamination. If the relative degree of suspected contamination at each well cannot be reasonably assumed, sampling should proceed from the perimeter of the site towards the center of the site. The sampling sequence should be arranged such that wells are sampled in order of increasing proximity to the suspected source of contamination, starting from the wells upgradient of the suspected source.
H. Sampling activity for each monitoring well will be recorded on a Groundwater
Sampling Record and the stabilized field parameters may also be recorded in the field notebook.
4.3 Non-Purge Sample Collection Using a HydraSleeveTM
In monitoring wells with very low yield and/or where low-flow sampling or volume-based
purging is not practical, a non-purge method, sampling using a HydraSleeveTM, may be
used to collect groundwater samples by the following procedure:
A. The depth to water in a well and the total well depth will be measured using the procedures discussed in Section 3, above. This measurement can be used to determine the preferred position of the HydraSleeve within the well screen.
B. Determine the necessary length of HydraSleeves needed for the specific well screen length and/or water column height to recover the necessary sample volume. HydraSleeves are manufactured in standard lengths of 30, 36, and 60 inches. However, up to three 30-inch HydraSleeves may be installed in series on a single tether (using plastic cable ties) to achieve more volume. Alternatively, a TurboSleeve may be used, which is a larger HydraSleeve that allows recovery of more sample volume. Per manufacturer’s recommendations, the TurboSleeve should be allowed to equilibrate in the
SOP No. 4 Rev. No. 5
Date: July 2015 Page 10 of 19
well for 24 hours before retrieval to allow for full compression of the sleeve for full sample recovery (see step G below).
C. Measure the correct amount of tether cord needed to suspend the
HydraSleeve in the well so the weight will not rest on the bottom of the well and the desired depth is achieved.
D. Remove the HydraSleeve from its packaging, unfold and hold it by its top.
Crimp the top of the HydraSleeve by folding the hard polyethylene reinforcing strips at the holes.
E. Attach the spring clip to the holes to ensure the top of the HydraSleeve will
remain open until the sampler is retrieved. Attach the tether to the spring clip with a strong knot (or tether can be attached to one of the holes at the top of the HydraSleeve).
F. Fold the flaps with the two holes at the bottom of the HydraSleeve together
and slide the weight clip through the holes. Attach the weight to the bottom of the weight clip to ensure the HydraSleeve will descend to the desired depth.
G. To deploy the HydraSleeve, carefully lower the HydraSleeve on its tether to
the desired depth in the water column. Hydrostatic pressure will keep the self-sealing check valve at the top of the HydraSleeve closed and ensure that it remains flat and empty and will only fill with groundwater from the desired interval when it is retrieved.
H. To retrieve the HydraSleeve to collect groundwater samples, pull up the
tether 30 to 45 inches (36 to 54 inches for longer HydraSleeves) in one smooth motion at a rate of about one inch per second or faster. This motion will open the top check valve and allow the HydraSleeve to fill. When the HydraSleeve is full, the top check valve will close and the full weight of the HydraSleeve can be felt by the sampler. Continue to pull the HydraSleeve upward to the top of the well to retrieve. Two persons are needed to retrieve a TurboSleeve, if used, due to its length and flexibility.
I. Once recovered, decant and discard the small volume of water trapped in the
HydraSleeve above the top check valve.
J. To fill sample bottles, remove the discharge tube from its sleeve. While holding the HydraSleeve at the check valve, puncture the HydraSleeve just below the check valve with the pointed end of the discharge tube. Discharge the water into the sample bottles as needed.
K. Any leftover water from the HydraSleeve can be poured into a separate
vessel for the measurement of groundwater field parameters as needed.
L. Dispose each used HydraSleeve after use at an individual well.
4.4 Non-Purge Sample Collection by Bailer
SOP No. 4 Rev. No. 5
Date: July 2015 Page 11 of 19
In monitoring wells with very low yield where low-flow sampling or volume-based purging
is not practical and sampling with HydraSleevesTM is not feasible, sampling by bailer
without purging the well may be used to collect groundwater samples.
Sampling by bailer may be used by the following procedure:
A. The depth to water in a well and the total depth will be measured using the procedures discussed in Section 3, above. This measurement can be used to determine the height of water and the volume of groundwater within the well screen.
B. A clean, sufficiently weighted PVC or polyethylene bailer will be used attached to a pre-measured length of either coated stainless steel cable or nylon rope tether for each well to be sampled by bailing.
C. The bailer will be slowly lowered through the water column to the well screen
interval on the pre-measured tether. Slow and consistent movement of the bailer downward through the well allows the water within the well to pass through the bailer.
D. When the desired depth within the well screen interval is reached, the downward movement of the bailer will immediately be reversed and the bailer slowly retrieved to the surface. This action allows the bailer to collect water representative of conditions within the well screen interval while minimizing generation of turbid conditions within the well.
E. Steel cable or rope will not be allowed to touch the ground surface during
retrieval. A reel, tub, tarp, or plastic sheeting can be used to prevent contact with the ground.
F. Upon retrieval of the bailer, sample bottles for total and dissolved metals
analysis will be filled first, followed by the remaining sample bottles for other parameters. If more sample volume is needed, the bailer will again be slowly lowered to the screen interval and retrieved as necessary until required sample bottles have been filled.
G. If a filtered metals sample is to be collected, the necessary volume can be
filtered from one clean, non-preserved sample bottle as needed.
H. Field parameters will be measured in the instrument cup or other rinsed container following collection of sample bottles. A small aliquot of sample volume will be poured from the bailer for the collection of field parameters.
I. If the well bails dry but additional sample volume is required, the volume will be removed from the well via bailer if such recharge occurs in the well within 24 hours.
SOP No. 4 Rev. No. 5
Date: July 2015 Page 12 of 19
4.5 Sample Filtration
When required, a field-filtered water sample will be collected using a disposable, in-line
0.45 micron (m) filter. The water sample will be pumped through the filter attached
directly to the discharge tubing. A peristaltic pump and a clean section of Tygon
(polyvinylchloride) tubing, silicone tubing, or other appropriate method may be used if
the sample is collected via bailer. The filter cartridge will be rinsed according to the
manufacturer’s recommendations. If there are no recommendations available, for
rinsing pass through a minimum aliquot of 100 ml of sample water prior to collection of
sample in to the containers. Both the filter and tubing will be disposed between
samples.
4.6 Sample Containers and Volumes
The sample containers will be appropriate to the analytical method and will be obtained
from the water analysis laboratory or other approved source. Different containers will be
required for specific groups of analytes in accordance with USEPA Methods, project-
specific requirements, and/or other local jurisdictional guidance. The sampler will
confirm with the laboratory performing the analyses that appropriate bottleware and
preservatives are used and ensure that a sufficient volume of sample is collected.
4.7 Sample Labeling
Sample containers will be labeled with self-adhesive tags. Each sample will be labeled
with the following information using waterproof ink:
Project identification; Lab Name; Sample identification; Date and time samples were obtained; Matrix; Requested analyses and method; Bottle type; Treatment (preservative added, filtered, etc.); Lab QC (if applicable); and Initials of sample collector(s).
SOP No. 4 Rev. No. 5
Date: July 2015 Page 13 of 19
4.8 Sample Preservation and Storage
If required by the project or analytical method, water samples submitted for chemical
analysis will be stored at 4 ºC in ice-cooled, insulated containers immediately after
collection. Preservation and storage methods depend on the chemical constituents to
be analyzed and should be discussed with the laboratory prior to sample
collection. USEPA and/or other local jurisdictional requirements and/or the requirements
of a project-specific plan (e.g., sampling and analysis plan, work plan, quality assurance
project plan, etc.) shall be adhered to in preservation and storage of water samples.
4.9 Sample Custody
Samples shall be handled and transported according to the sample custody procedures
d i s c u s s e d i n S O P N o . 2 ( S A M P L E C U S T O D Y , P A C K A G I N G , A N D
S H I P MENT). Sampling personnel shall document each sample on the Chain-of-
Custody Record
4.10 Field Measurements
Specific conductance, pH, dissolved oxygen, ORP, temperature, and turbidity
measurements will be performed on water samples at the time of sample collection. The
only exceptions will be for DO and ORP when the samples are collected via bailer or in
those instances where a flow-through cell cannot be used. Data obtained from these (or
other) field water quality measurements will be recorded on the appropriate sampling
records or in the field notebook. Separate aliquots of water shall be used to make field
measurements (i.e., sample containers for laboratory analysis shall not be reopened).
For groundwater samples, field measurement intervals will be as presented above. If
the parameters have not stabilized, check to insure that the field instruments are
operating correctly and remain calibrated. Recalibrate the instruments if needed, if an
instrument cannot be calibrated it will be labeled needing repair and removed from
service. Field measurements and purging will continue until three consecutive readings
have stabilized to within the following limits or until a maximum of six casing volumes
have been removed:
pH +/- 0.1 S.U.;
SOP No. 4 Rev. No. 5
Date: July 2015 Page 14 of 19
Specific Conductance 3% difference; Temperature +/- 1ºC; ORP +/- 10 mV; Turbidity 10% difference for values greater than 10 NTU; and Dissolved Oxygen 10% difference.
4.10.1 Temperature Measurement
Temperature will be measured directly from the water source or from a separate sample
aliquot. Temperature measurements will be made with a mercury-filled thermometer,
bimetallic-element thermometer, or electronic thermistor. All measurements will be
recorded in degrees Celsius (oC). When a flow-through cell is used the temperature can
be measured directly via a multi-parameter instrument as per the manufacturer’s
instructions.
4.10.2 pH Measurement
A pH measurement will be made by dipping the probe directly into the water source or
into a separate sample aliquot. Prior to measurement, the container in which the field
parameter sample will be collected will be acclimated to the approximate temperature of
the sample. This can be accomplished by immersing the container in water removed
from a well during the purging process. The pH measurement will be made as soon as
possible after collection of the field parameter sample, preferably within a few minutes,
using a pH electrode. The value displayed on the calibrated instrument will be recorded
after the reading has stabilized. If the value falls outside of the calibrated range, then
the pH meter will be recalibrated using the appropriate buffer solutions. When a flow-
through cell is used, the pH can be measured directly via a multi-parameter instrument
as per the manufacturer’s instructions.
4.10.3 Dissolved Oxygen
Dissolved oxygen (DO) will be measured by using a suitable multi-parameter meter that
can be placed into a flow-through cell and sealed such that exposure to the atmosphere
is prevented. DO measurements will be reported in milligrams per liter (mg/L). The
instrument will be calibrated in accordance with SOP No. 31 ( W A T E R Q U A L I T Y
METER CALIBRATION).
SOP No. 4 Rev. No. 5
Date: July 2015 Page 15 of 19
4.10.4 Oxidation Reduction Potential
Oxidation Reduction Potential (ORP) will be measured by using a suitable multi-
parameter meter that can be placed into a flow-through cell and sealed such that
exposure to the atmosphere is prevented. ORP measurements will be reported in mV.
The instrument will be calibrated in accordance with SOP No. 31 (WATER QUALITY
METER CALIBRATION).
4.10.5 Specific Conductance Measurement
Specific conductance will be measured by dipping the probe directly into the water
source or into a separate sample aliquot. The probe must be immersed to the
manufacturer's recommended depth. Specific conductance will be reported in
micromhos/cm or microsiemens/cm at 25 ºC. If the meter is not equipped with an
automatic temperature compensation function, then the field value will be adjusted at a
later time using the temperature data and the following formula:
SC25 = SCT/ [1 + {(T - 25) x 0.025}]
where: SC25 = specific conductance at 25 ºC SCT = specific conductance measured at temperature T (ºC) T = sample temperature (ºC)
The value displayed on the calibrated instrument will be recorded after the reading has
stabilized. If the value falls outside of the calibrated "range" set by the range dial on the
instrument, then the range setting will be changed to a position that gives maximum
definition. If the specific conductance value falls outside of the calibrated range of the
conductivity standard solution, then the instrument will be recalibrated using the
appropriate standard prior to measurement. When a flow-through cell is used the
specific conductance can be measured directly via a multi-parameter instrument as per
the manufacturer’s instructions.
SOP No. 4 Rev. No. 5
Date: July 2015 Page 16 of 19
4.10.6 Turbidity
Turbidity will be measured by using a field portable nephlometer separate from the multi-
parameter meter used for DO and ORP and capable of reading down to 0.1 NTU.
Turbidity will be measured directly from the water source or from a separate sample
aliquot. The instrument will be calibrated at least daily prior to initiating field activities
and periodically throughout the day or as recommended by the instrument manufacturer.
Turbidity measurements will be reported in nephlometric turbidity units (NTU). When a
flow-through cell is used, the turbidity can be measured directly via a multi-parameter
(e.g., YSI Sonde 6920) instrument, if so equipped, as per the manufacturer’s
instructions.
4.10.7 Equipment Calibration
Equipment used to measure field parameters will be calibrated daily in the field in
accordance with SOP No. 31 (WATER QUALITY METER CALIBRATION) prior to any
measurements being taken.
5.0 DOCUMENTATION
5.1 Groundwater Sampling Record
Each sampling event for each monitoring well will be recorded on a Groundwater
Sampling Record form (which may be in paper or electronic format) or in the field
notebook.
The documentation should include the following:
Project identification; Location identification; Sample identification(s) (including quality control samples); Date and time of sampling; Purging and sampling methods; Sampling depth; Name(s) of sample collector(s); Inventory of sample bottles collected including sample preservation (if any),
number, and types of sample bottles; Total volume of water purged;
SOP No. 4 Rev. No. 5
Date: July 2015 Page 17 of 19
Results of field measurements and observations (time, cumulative purge volume,temperature, pH, specific conductance, turbidity, sediment, color, purge rate);
Equipment cleaning record; Description and identification of field instruments and equipment; and Equipment calibration record; and Number of photos (if any were taken).
When the sampling activity is completed, the Groundwater Sampling Record (whether in
print or electronic format) will be checked by the Project Manager or his/her designee,
and the original record will be placed in the project file.
6.0 QUALITY ASSURANCE/QUALITY CONTROL
6.1 Equipment Decontamination/Cleaning
Steel surveyor’s tapes, electric well probes, and other measuring tapes shall be cleaned
prior to use and after measurements in each well are completed. Cleaning shall be
accomplished by either: (1) washing with a laboratory-grade detergent/water solution,
rinsing with clean, potable, municipal water, final rinsing with distilled or deionized water,
or (2) steam cleaning followed by rinsing with distilled or deionized water.
Sample bottles and bottle caps will be pre-cleaned and prepared by the analytical
laboratory or their supplier using standard USEPA-approved protocols. Sample bottles
and bottle caps will be protected from dust or other contamination between time of
receipt by the sampler(s) and time of actual usage at the sampling site.
Groundwater sampling equipment may be dedicated to a particular well at a project site.
Prior to installation of this equipment, all equipment surfaces that will be placed in the
well or may come in contact with groundwater will be cleaned to prevent the introduction
of contaminants.
Sampling equipment that will be used at multiple wells or sampling locations will be
cleaned after sampling at each location is completed in accordance with the SOP
entitled EQUIPMENT DECONTAMINATION (SOP No. 7).
SOP No. 4 Rev. No. 5
Date: July 2015 Page 18 of 19
Equipment such as submersible electric pumps, which cannot be disassembled for
cleaning, will be cleaned by circulating a laboratory-grade detergent (e.g., Alconox) and
potable water solution through the assembly, followed by clean potable water from a
municipal supply, and then by distilled or deionized water. Equipment cleaning methods
will be recorded on the Groundwater Sampling Record.
6.2 Technical and Records Reviews
The Project Manager or designated reviewer will check and verify that documentation
has been completed and filed per this procedure.
In addition, all calculations of water-level elevations must be reviewed before they are
submitted to the project file and used to describe site conditions. The calculation review
should be performed by technical personnel familiar with this procedure. Evidence of
the completed review and any necessary corrections to calculations should also be
submitted to the project file.
7.0 REFERENCES
U.S. Environmental Protection Agency (USEPA), Region 9. Standard Operating
Procedure for the Standard/Well-Volume Method for Collecting a Ground-Water Sample from Monitoring Wells for Site Characterization. Available online at: www.epa.gov/region9/qa/pdfs/finalgwsamp_sop.pdf.
USEPA, 2010. Low Stress (Low Flow) Purging and Sampling Procedure for the
Collection of Ground Water Samples from Monitoring Wells. EQASOP-GW-001 Region 1 Low-Stress (Low-Flow) SOP, Revision Number 3, July 30, 1996, Revised January 19, 2010. http://www.epa.gov/region1/lab/qa/pdfs/EQASOP-GW001.pdf
USEPA, 2002, Ground-Water Sampling Guidelines for Superfund and RCRA Project
Managers, Ground Water Forum Issue Paper. U.S Environmental Protection Agency, Technology Innovative Office, Office of Solid Waste and Emergency Response, Washington D.C., Douglas Yeskis, EPA Region 5, Chicago IL, and Bernard Zavala, EPA Region 10, Seattle, WA, EPA 542-S-02-001. May 2002. http://www.epa.gov/superfund/remedytech/tsp/download/gw_sampling_guide.pdf
U.S. Geological Survey (USGS), variously dated. National Field Manual for the
Collection of Water-Quality Data: U.S. Geological Survey Techniques of Water-Resources Investigations, Book 9, Chapters A1-A9. Available online at http://pubs.water.usgs.gov/twri9A.
SOP No. 5 Surface Water Sampling
SOP No. 5 Rev. No. 4
Date: March 2015 Page 1 of 9
STANDARD OPERATING PROCEDURE No. 5
SURFACE WATER SAMPLING
1.0 SCOPE AND APPLICABILITY
This Standard Operating Procedure (SOP) describes the protocol to be followed during
sampling of surface water. The procedures presented herein are intended to be general
in nature and are applicable when referenced by site-specific or project-specific planning
documents. Appropriate modifications to the procedures may be made to accommodate
project-specific protocols when approved in writing or via email by the Project Manager.
The objectives of the water quality sampling procedures are to minimize changes in
surface water chemistry during sample collection and to maximize the probability of
obtaining a representative, reproducible surface water sample.
2.0 BASIS FOR METHODOLOGY
The methods and procedures described in this SOP were developed from these
sources:
U.S. Geological Survey (USGS) (variously dated) National Field Manual for the Collection of Water-Quality Data: U.S. Geological Survey Techniques of Water-Resources Investigations, Book 9, Handbooks for Water-Resources Investigations, Chapters A1-A9.
U.S. Environmental Protection Agency (USEPA) (2003) USEPA Region 8
SOP EH-#1 Technical Standards Operating Procedure – Surface Water Sampling East Helena Site, Montana.
3.0 PROCEDURES
3.1 Sample Collection
Individual samples from surface water sampling stations will be collected as follows:
SOP No. 5 Rev. No. 4
Date: March 2015 Page 2 of 9
A. Where multiple sampling stations exist along a moving water source (i.e., a creek or drainage channel), the downstream station will be sampled first. A moving water sample will be taken from the portion of the water with maximum flow at any given sampling station unless otherwise specified. If the sampling point is inaccessible from shore, the sampling personnel will enter the water from a point downstream of the sampling point, taking care not to disturb the water.
B. A standing water sample will be taken at a point in the body of water at least
three feet from the shore, if possible, or unless otherwise specified. C. A surface water sample will be collected according to one of the following, or
similar, techniques.
1. Direct Method -- Sample bottle or disposable container (e.g., cubitainer) is uncapped and inverted, submerged to the specified depth, turned upright pointing upstream, removed from the water, and then capped (if actual sample bottle used). Add preservative, if any, after sample collection.
2. Dipper Method -- Sample bottle or container attached to a pole is
dipped in the water, raised above the water, and then capped (if actual sample bottle used).
3. Bailer Method -- An appropriate sampling bailer with a ball check valve
is submerged to the desired sample depth, either directly or by suspending the bailer on a rope from a pole.
4. Syringe Method (for very shallow water) -- A disposable plastic filtering
syringe may be used to collect very shallow surface water without disturbing the sediment. The syringe will be disposed of after each use.
5. Peristaltic Pump Method -- The sample is collected through a section of
new, clean, flexible Tygon (polyvinylchloride) or silicone tubing. The tubing intake will be secured manually or by attaching weights. This procedure may be modified to collect the sample through a Teflon tube into a sample flask by running the pump on a vacuum.
6. Kemmerer Bottle -- Use a properly decontaminated Kemmerer bottle.
Set the sampling device so that the upper and lower stoppers are pulled away from the body, allowing water to enter the tube. Lower the pre-set sampling device to the predetermined depth. Avoid disturbing the bottom. Once at the required depth, send the weighted messenger down the suspension line, closing the device. Retrieve the sampler and discharge the first 10-20 mL from the drain to clear water that may not be representative of the sample. Repeat as needed to collect the needed volume.
SOP No. 5 Rev. No. 4
Date: March 2015 Page 3 of 9
7. Van Dorn Sampler -- Set the device so that the end stoppers are pulled away from the body allowing surface water to enter the tube. Lower the sampler to the predetermined depth. Once at the required depth send the weighted messenger down the suspension line, closing the sampling device. Retrieve the sampler and decant the first 10-20 mL from the drain to clear water that may not be representative of the sample from the valve. Repeat as needed until the required volume to fill sample bottles is collected.
8. Bacon Bomb Sampler -- Lower the bacon bomb sampler carefully to the
desired depth, allowing for the trigger to remain slack at all times. When the desired depth is reached, pull the trigger line until taught. This will allow the sampler to fill. Release the trigger line and retrieve the sampler. Decant the first 10-20 mL from the drain to clear water that may not be representative of the sample from the valve. Repeat as needed until the required volume to fill sample bottles is collected.
D. For the direct and dipper methods, the mouth of the sample collection
container will be oriented downstream. The first collected water will be used to rinse the sampling equipment. Sample bottles that do not contain preservative should be rinsed with the sample water prior to filling. Subse-quent water collected will be used to fill the analytical sample bottles until all bottles are filled. Field measurement of parameters will be taken once for each sampling station at the time of sample collection. Field parameters (pH, specific conductance, temperature, dissolved oxygen (DO), oxidation-reduction potential (ORP), odor, turbidity, and/or sediment) will be measured from a separate container (instruments will not contact the analytical samples) or directly from the water body sampled downgradient of the sample collection location.
E. To mark the exact sampling location, either: (1) a stake or pole identifying the
sampling station should be placed at or near the sampling station for future identification of the location, or (2) the sample location will be recorded in a Global Positioning System (GPS) device and coordinates will be downloaded at the end of the field event. Personnel will record a brief description of the stake or pole location in relation to permanent landmarks, and the sampling location in relation to the stake or pole (example: stake is approximately 100 feet west along Markley Creek from Somersville Road, on north-side shore. Sampling point is 25 feet south of stake, in middle of Markley Creek), or the GPS coordinates of the location. Personnel will include a sketch map of the sampling station in the Surface Water Sampling Record (attached form or similar).
3.2 Sample Filtration
When required, a field-filtered water sample will be collected using a disposable, in-line
0.45 micron (m) filter. The water sample will be pumped through the filter attached
SOP No. 5 Rev. No. 4
Date: March 2015 Page 4 of 9
directly to the discharge tubing. A peristaltic pump and a clean section of Tygon
(polyvinylchloride) tubing, silicone tubing, or other appropriate method may be used.
The filter cartridge will be rinsed according to the manufacturer’s recommendations. If
there are no recommendations for rinsing, pass through a minimum aliquot of 100 ml of
sample water prior to collection of sample into the containers. Both the filter and tubing
will be disposed between samples.
3.3 Sample Containers and Volumes
The sample containers will be appropriate to the analytical method and will be obtained
from the water analysis laboratory or other approved source. Different containers will be
required for specific groups of analytes in accordance with U.S. EPA Methods, project-
specific requirements, and/or other local jurisdictional guidance. The sampler will
confirm with the laboratory performing the analyses that appropriate bottleware and
preservatives are used and ensure that a sufficient volume of sample is collected.
3.4 Sample Preservation and Storage
If required by the project or analytical method, water samples submitted for chemical
analysis will be stored at 4ºC in ice-cooled, insulated containers immediately after
collection. Preservation and storage methods depend on the chemical constituents to
be analyzed and should be discussed with the water analysis laboratory prior to sample
collection. EPA and/or other local jurisdictional requirements and/or the requirements of
a project-specific plan (e.g., sampling and analysis plan, work plan, quality assurance
project plan, etc.) shall be adhered to in preservation and storage of water samples.
3.5 Field Measurements
Specific conductance, pH, turbidity, DO, ORP, and temperature measurements will be
performed on water samples at the time of sample collection. Data obtained from these
(or other) field water quality measurements will be recorded on the appropriate sampling
records and/or in the field notebook. Separate aliquots of water shall be used to make
field measurements (i.e., sample containers for laboratory analysis shall not be
SOP No. 5 Rev. No. 4
Date: March 2015 Page 5 of 9
reopened). For surface water sampling, the parameters will be measured once and
recorded.
3.5.1 Temperature Measurement
Temperature will be measured directly from the water source or from a separate sample
aliquot. Temperature measurements will be made with a mercury-filled thermometer,
bimetallic-element thermometer, multiprobe, or electronic thermistor. All measurements
will be recorded in degrees Celsius (ºC) after the reading has stabilized.
3.5.2 Turbidity
Turbidity will be measured by using a field portable nephlometer or integrated turbidity
sensor on a multi-parameter meter (e.g., YSI Sonde 6920) capable of reading down to
0.1 NTU. The instrument will be calibrated at least daily or according to the
manufacturer’s recommendations prior to initiating field activities and periodically
throughout the day or as recommended by the instrument manufacturer. Turbidity
measurements will be reported in nephlometric turbidity units (NTU).
3.5.3 pH Measurement
A pH measurement will be made by dipping the probe directly into the water source or
into a separate sample aliquot. Prior to measurement, the container in which the field
parameter sample will be collected will be acclimated to the approximate temperature of
the sample. This can be accomplished by immersing the container in water collected
from the sampling location. The value displayed on the calibrated instrument will be
recorded after the reading has stabilized. If the value falls outside of the calibrated
range, then the pH meter will be recalibrated using the appropriate buffer solutions.
3.5.4 Specific Conductance Measurement
Specific conductance will be measured by dipping the probe directly into the water
source or into a separate sample aliquot. The probe must be immersed to the
manufacturer's recommended depth. Specific conductance will be reported in
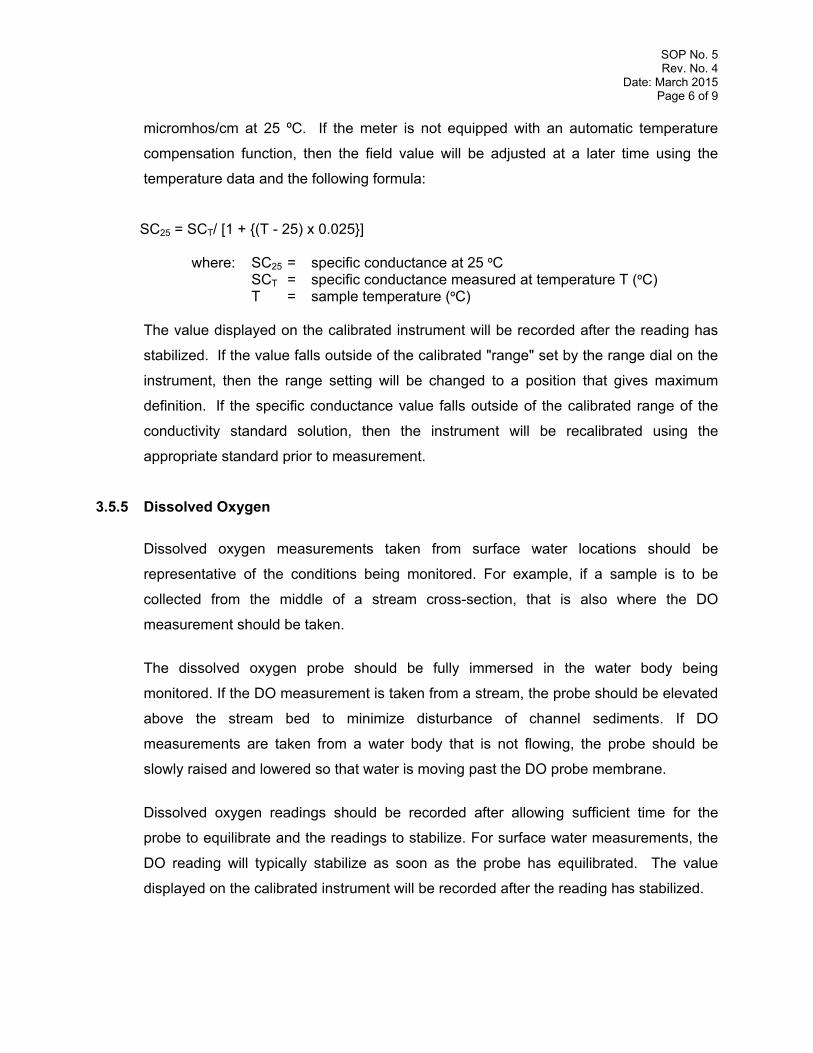
SOP No. 5 Rev. No. 4
Date: March 2015 Page 6 of 9
micromhos/cm at 25 ºC. If the meter is not equipped with an automatic temperature
compensation function, then the field value will be adjusted at a later time using the
temperature data and the following formula:
SC25 = SCT/ [1 + {(T - 25) x 0.025}]
where: SC25 = specific conductance at 25 ºC SCT = specific conductance measured at temperature T (ºC)
T = sample temperature (ºC)
The value displayed on the calibrated instrument will be recorded after the reading has
stabilized. If the value falls outside of the calibrated "range" set by the range dial on the
instrument, then the range setting will be changed to a position that gives maximum
definition. If the specific conductance value falls outside of the calibrated range of the
conductivity standard solution, then the instrument will be recalibrated using the
appropriate standard prior to measurement.
3.5.5 Dissolved Oxygen
Dissolved oxygen measurements taken from surface water locations should be
representative of the conditions being monitored. For example, if a sample is to be
collected from the middle of a stream cross-section, that is also where the DO
measurement should be taken.
The dissolved oxygen probe should be fully immersed in the water body being
monitored. If the DO measurement is taken from a stream, the probe should be elevated
above the stream bed to minimize disturbance of channel sediments. If DO
measurements are taken from a water body that is not flowing, the probe should be
slowly raised and lowered so that water is moving past the DO probe membrane.
Dissolved oxygen readings should be recorded after allowing sufficient time for the
probe to equilibrate and the readings to stabilize. For surface water measurements, the
DO reading will typically stabilize as soon as the probe has equilibrated. The value
displayed on the calibrated instrument will be recorded after the reading has stabilized.
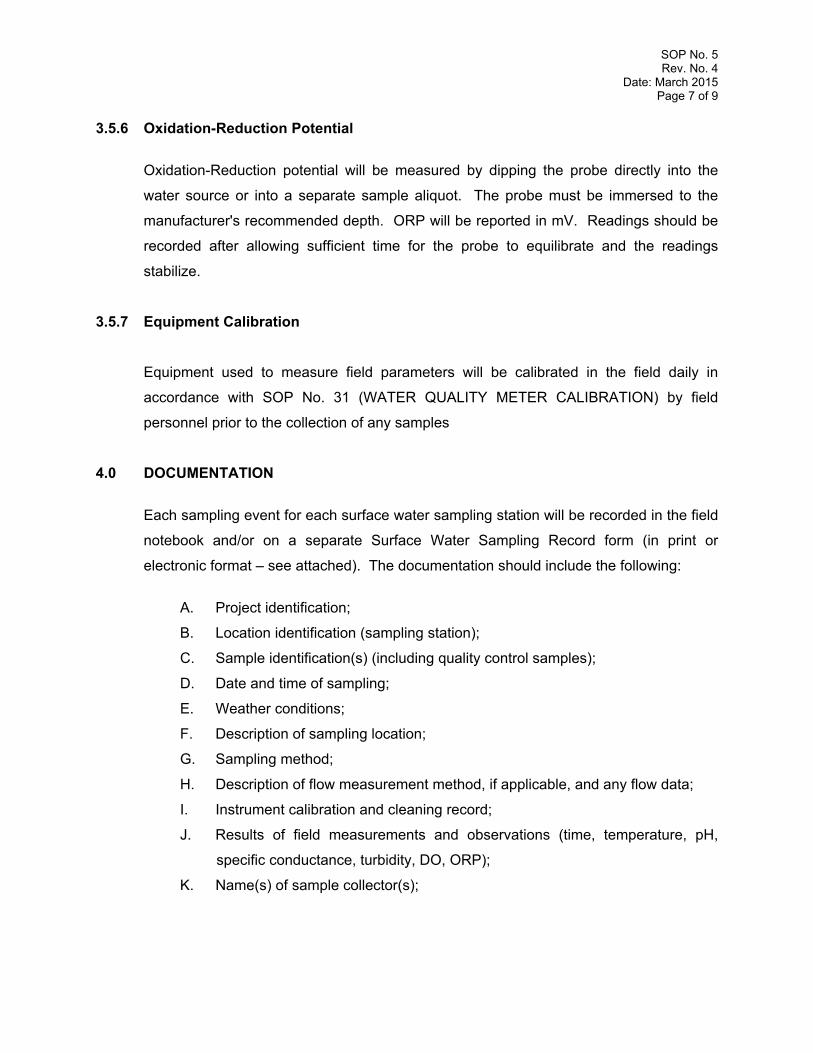
SOP No. 5 Rev. No. 4
Date: March 2015 Page 7 of 9
3.5.6 Oxidation-Reduction Potential
Oxidation-Reduction potential will be measured by dipping the probe directly into the
water source or into a separate sample aliquot. The probe must be immersed to the
manufacturer's recommended depth. ORP will be reported in mV. Readings should be
recorded after allowing sufficient time for the probe to equilibrate and the readings
stabilize.
3.5.7 Equipment Calibration
Equipment used to measure field parameters will be calibrated in the field daily in
accordance with SOP No. 31 (WATER QUALITY METER CALIBRATION) by field
personnel prior to the collection of any samples
4.0 DOCUMENTATION
Each sampling event for each surface water sampling station will be recorded in the field
notebook and/or on a separate Surface Water Sampling Record form (in print or
electronic format – see attached). The documentation should include the following:
A. Project identification;
B. Location identification (sampling station);
C. Sample identification(s) (including quality control samples);
D. Date and time of sampling;
E. Weather conditions;
F. Description of sampling location;
G. Sampling method;
H. Description of flow measurement method, if applicable, and any flow data;
I. Instrument calibration and cleaning record;
J. Results of field measurements and observations (time, temperature, pH,
specific conductance, turbidity, DO, ORP);
K. Name(s) of sample collector(s);
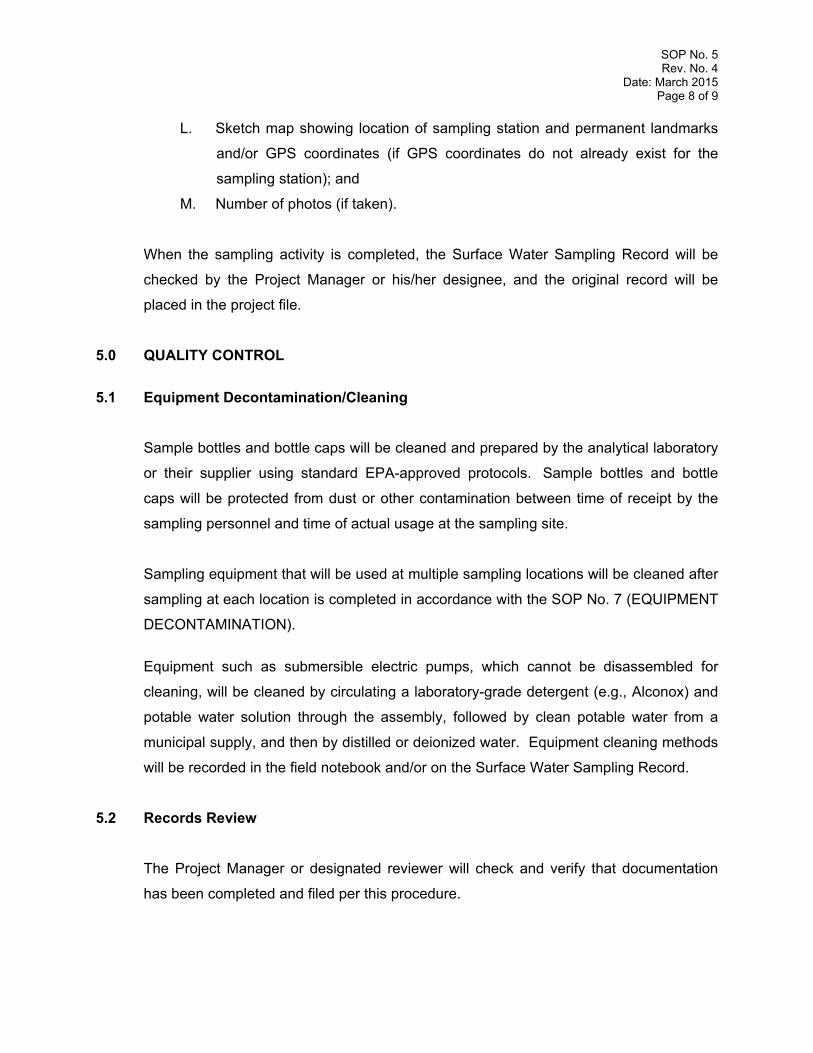
SOP No. 5 Rev. No. 4
Date: March 2015 Page 8 of 9
L. Sketch map showing location of sampling station and permanent landmarks
and/or GPS coordinates (if GPS coordinates do not already exist for the
sampling station); and
M. Number of photos (if taken).
When the sampling activity is completed, the Surface Water Sampling Record will be
checked by the Project Manager or his/her designee, and the original record will be
placed in the project file.
5.0 QUALITY CONTROL
5.1 Equipment Decontamination/Cleaning
Sample bottles and bottle caps will be cleaned and prepared by the analytical laboratory
or their supplier using standard EPA-approved protocols. Sample bottles and bottle
caps will be protected from dust or other contamination between time of receipt by the
sampling personnel and time of actual usage at the sampling site.
Sampling equipment that will be used at multiple sampling locations will be cleaned after
sampling at each location is completed in accordance with the SOP No. 7 (EQUIPMENT
DECONTAMINATION).
Equipment such as submersible electric pumps, which cannot be disassembled for
cleaning, will be cleaned by circulating a laboratory-grade detergent (e.g., Alconox) and
potable water solution through the assembly, followed by clean potable water from a
municipal supply, and then by distilled or deionized water. Equipment cleaning methods
will be recorded in the field notebook and/or on the Surface Water Sampling Record.
5.2 Records Review
The Project Manager or designated reviewer will check and verify that documentation
has been completed and filed per this procedure.
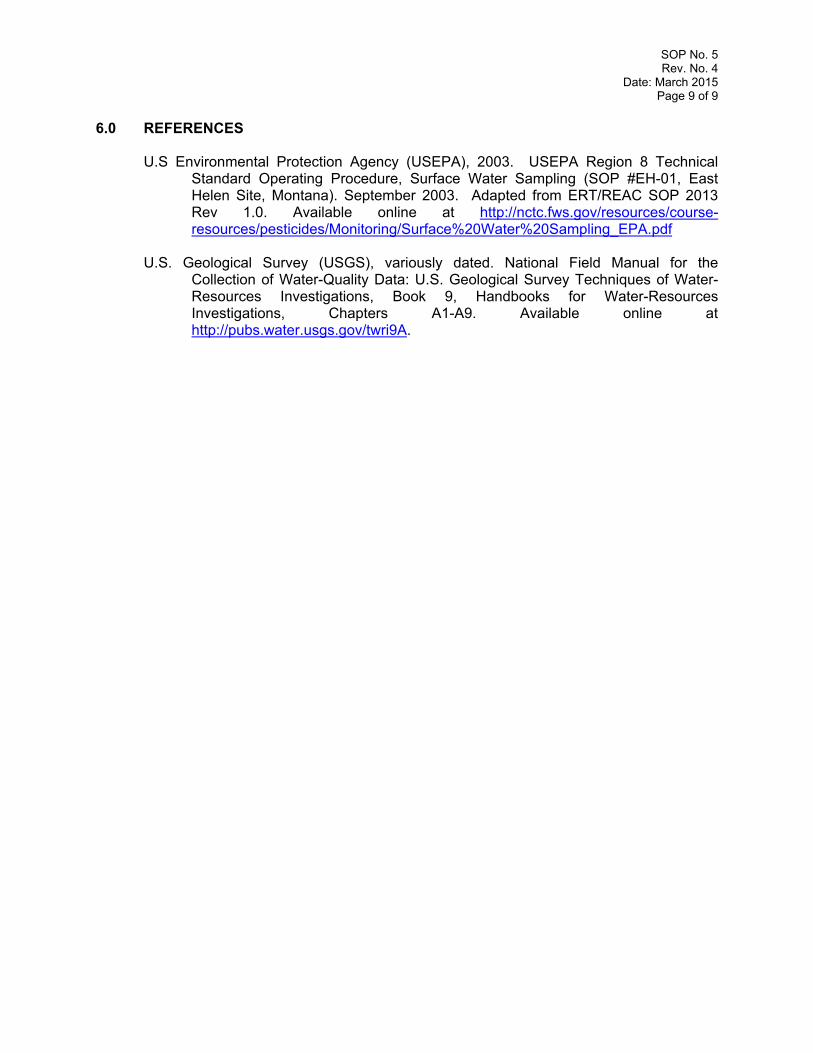
SOP No. 5 Rev. No. 4
Date: March 2015 Page 9 of 9
6.0 REFERENCES U.S Environmental Protection Agency (USEPA), 2003. USEPA Region 8 Technical
Standard Operating Procedure, Surface Water Sampling (SOP #EH-01, East Helen Site, Montana). September 2003. Adapted from ERT/REAC SOP 2013 Rev 1.0. Available online at http://nctc.fws.gov/resources/course-resources/pesticides/Monitoring/Surface%20Water%20Sampling_EPA.pdf
U.S. Geological Survey (USGS), variously dated. National Field Manual for the
Collection of Water-Quality Data: U.S. Geological Survey Techniques of Water-Resources Investigations, Book 9, Handbooks for Water-Resources Investigations, Chapters A1-A9. Available online at http://pubs.water.usgs.gov/twri9A.
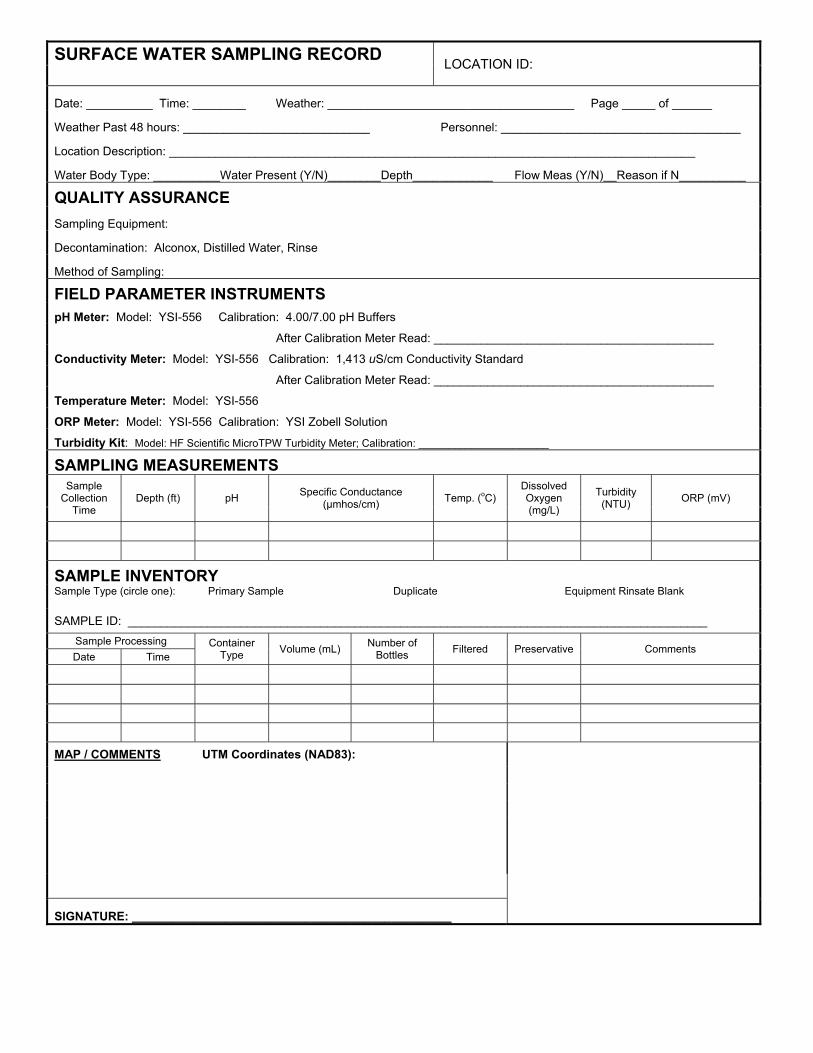
SURFACE WATER SAMPLING RECORD LOCATION ID:
Date: __________ Time: ________ Weather: _____________________________________ Page _____ of ______
Weather Past 48 hours: ____________________________ Personnel: ____________________________________
Location Description: _______________________________________________________________________________
Water Body Type: __________Water Present (Y/N)________Depth____________ Flow Meas (Y/N)__Reason if N__________
QUALITY ASSURANCE
Sampling Equipment:
Decontamination: Alconox, Distilled Water, Rinse
Method of Sampling:
FIELD PARAMETER INSTRUMENTS
pH Meter: Model: YSI-556 Calibration: 4.00/7.00 pH Buffers
After Calibration Meter Read: __________________________________________
Conductivity Meter: Model: YSI-556 Calibration: 1,413 uS/cm Conductivity Standard
After Calibration Meter Read: __________________________________________
Temperature Meter: Model: YSI-556
ORP Meter: Model: YSI-556 Calibration: YSI Zobell Solution
Turbidity Kit: Model: HF Scientific MicroTPW Turbidity Meter; Calibration: ______________________
SAMPLING MEASUREMENTS Sample
Collection Time
Depth (ft) pH Specific Conductance (µmhos/cm) Temp. (oC)
Dissolved Oxygen (mg/L)
Turbidity (NTU) ORP (mV)
SAMPLE INVENTORY Sample Type (circle one): Primary Sample Duplicate Equipment Rinsate Blank
SAMPLE ID: _______________________________________________________________________________________ Sample Processing Container
Type Volume (mL) Number of Bottles Filtered Preservative Comments
Date Time
MAP / COMMENTS UTM Coordinates (NAD83):
SIGNATURE: ________________________________________________
SOP No. 6 Surface Water Discharge Measurement
SOP No. 6 Rev. No. 5
Date: March 2015 Page 1 of 16
STANDARD OPERATING PROCEDURE No. 6
SURFACE WATER DISCHARGE MEASUREMENT
1.0 SCOPE AND APPLICABILITY
This Standard Operating Procedure (SOP) describes the protocol for collecting discharge
measurements in streams, ditches, springs, seeps, etc. The procedures presented herein
are intended to be general in nature and are applicable when referenced by site-specific or
project-specific planning documents. Appropriate revisions may be made to accommodate
site-specific conditions or project-specific protocols when approved in writing or via email by
the Project Manager.
The objective of this SOP is to provide a consistent method for describing a current, and
three methods for measuring discharge: (1) volumetric method, (2) area-velocity method,
and (3) flume method. Discharge is defined as the volume rate of water flow, including any
substances suspended or dissolved in the water. Discharge will be expressed in cubic feet
per second (cfs) or gallons per minute (gpm). Note that the protocol for collection of surface
water samples is included in SOP No. 5 (WATER QUALITY SAMPLING).
2.0 BASIS FOR METHODOLOGY
The methods and procedures described in this SOP were developed from these sources:
Rantz, S.E. et al. (1982) Measurement and Computation of Streamflow: Volume 1,
Measurement of Stage and Discharge, U.S. Geological Survey Water Supply Paper 2175. U.S. Government Printing Office, Washington, D.C.
U.S. Department of the Interior Geological Survey (USGS) (1977) National Handbook of Recommended Methods for Water-Data Acquisition. Office of Water Data Coordination, U.S. Geological Survey, Reston, VA.
U.S. Environmental Protection Agency (USEPA) (1986) Engineering Support Branch
Standard Operating Procedures and Quality Assurance Manual. Environmental Services Division, Region IV, Athens, GA.
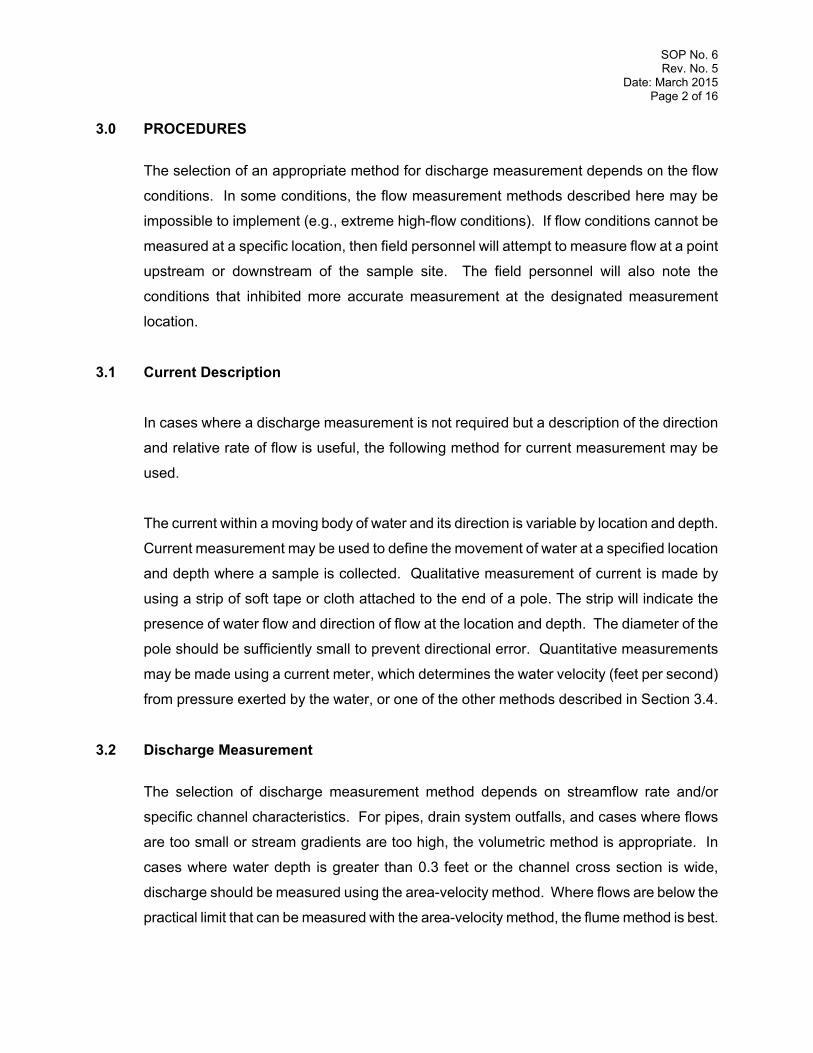
SOP No. 6 Rev. No. 5
Date: March 2015 Page 2 of 16
3.0 PROCEDURES
The selection of an appropriate method for discharge measurement depends on the flow
conditions. In some conditions, the flow measurement methods described here may be
impossible to implement (e.g., extreme high-flow conditions). If flow conditions cannot be
measured at a specific location, then field personnel will attempt to measure flow at a point
upstream or downstream of the sample site. The field personnel will also note the
conditions that inhibited more accurate measurement at the designated measurement
location.
3.1 Current Description
In cases where a discharge measurement is not required but a description of the direction
and relative rate of flow is useful, the following method for current measurement may be
used.
The current within a moving body of water and its direction is variable by location and depth.
Current measurement may be used to define the movement of water at a specified location
and depth where a sample is collected. Qualitative measurement of current is made by
using a strip of soft tape or cloth attached to the end of a pole. The strip will indicate the
presence of water flow and direction of flow at the location and depth. The diameter of the
pole should be sufficiently small to prevent directional error. Quantitative measurements
may be made using a current meter, which determines the water velocity (feet per second)
from pressure exerted by the water, or one of the other methods described in Section 3.4.
3.2 Discharge Measurement
The selection of discharge measurement method depends on streamflow rate and/or
specific channel characteristics. For pipes, drain system outfalls, and cases where flows
are too small or stream gradients are too high, the volumetric method is appropriate. In
cases where water depth is greater than 0.3 feet or the channel cross section is wide,
discharge should be measured using the area-velocity method. Where flows are below the
practical limit that can be measured with the area-velocity method, the flume method is best.
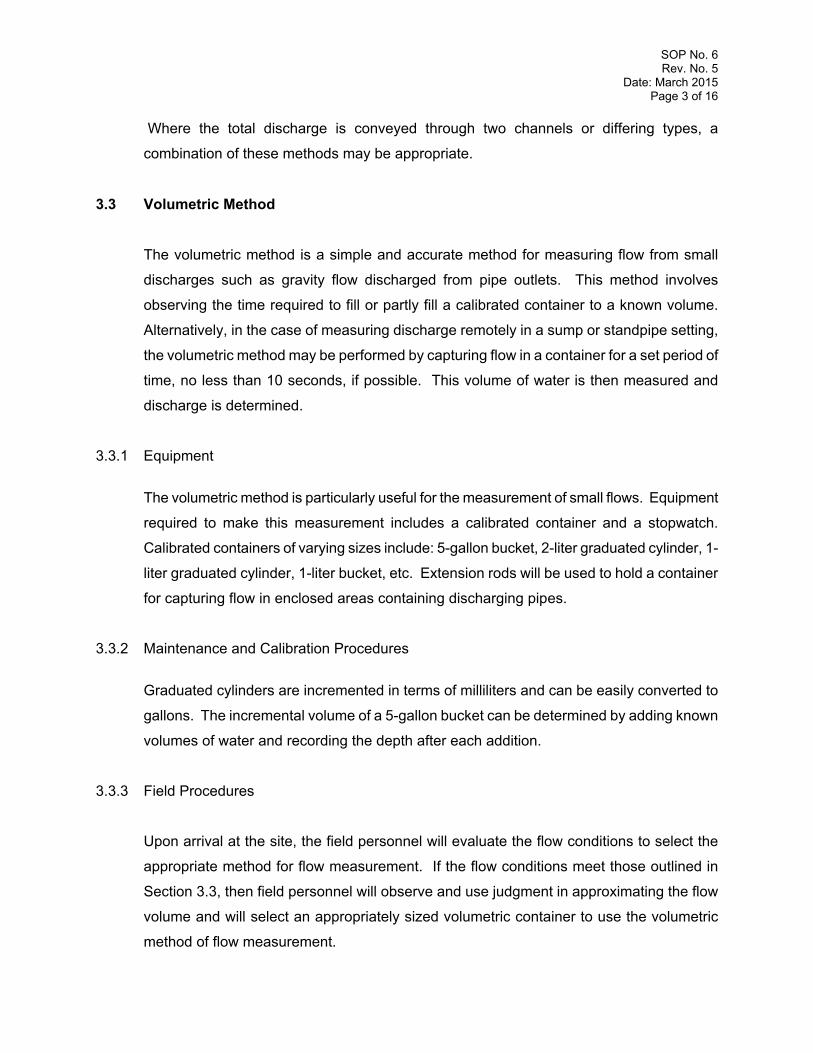
SOP No. 6 Rev. No. 5
Date: March 2015 Page 3 of 16
Where the total discharge is conveyed through two channels or differing types, a
combination of these methods may be appropriate.
3.3 Volumetric Method
The volumetric method is a simple and accurate method for measuring flow from small
discharges such as gravity flow discharged from pipe outlets. This method involves
observing the time required to fill or partly fill a calibrated container to a known volume.
Alternatively, in the case of measuring discharge remotely in a sump or standpipe setting,
the volumetric method may be performed by capturing flow in a container for a set period of
time, no less than 10 seconds, if possible. This volume of water is then measured and
discharge is determined.
3.3.1 Equipment
The volumetric method is particularly useful for the measurement of small flows. Equipment
required to make this measurement includes a calibrated container and a stopwatch.
Calibrated containers of varying sizes include: 5-gallon bucket, 2-liter graduated cylinder, 1-
liter graduated cylinder, 1-liter bucket, etc. Extension rods will be used to hold a container
for capturing flow in enclosed areas containing discharging pipes.
3.3.2 Maintenance and Calibration Procedures
Graduated cylinders are incremented in terms of milliliters and can be easily converted to
gallons. The incremental volume of a 5-gallon bucket can be determined by adding known
volumes of water and recording the depth after each addition.
3.3.3 Field Procedures
Upon arrival at the site, the field personnel will evaluate the flow conditions to select the
appropriate method for flow measurement. If the flow conditions meet those outlined in
Section 3.3, then field personnel will observe and use judgment in approximating the flow
volume and will select an appropriately sized volumetric container to use the volumetric
method of flow measurement.
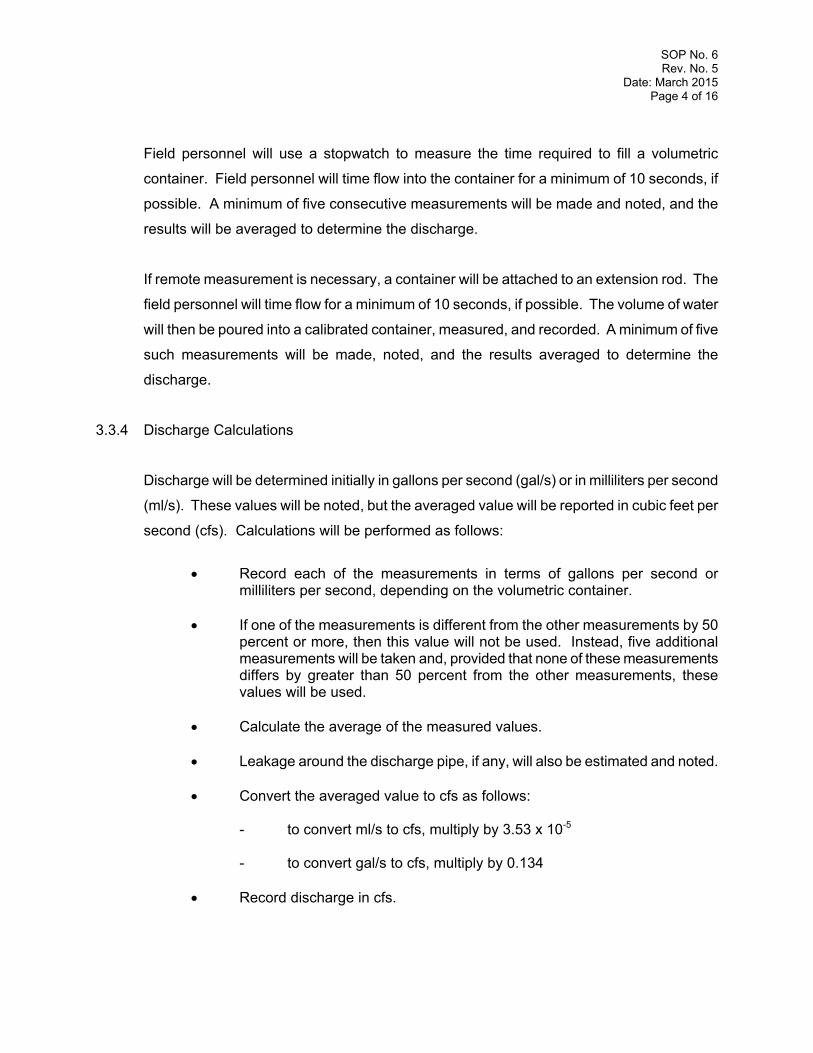
SOP No. 6 Rev. No. 5
Date: March 2015 Page 4 of 16
Field personnel will use a stopwatch to measure the time required to fill a volumetric
container. Field personnel will time flow into the container for a minimum of 10 seconds, if
possible. A minimum of five consecutive measurements will be made and noted, and the
results will be averaged to determine the discharge.
If remote measurement is necessary, a container will be attached to an extension rod. The
field personnel will time flow for a minimum of 10 seconds, if possible. The volume of water
will then be poured into a calibrated container, measured, and recorded. A minimum of five
such measurements will be made, noted, and the results averaged to determine the
discharge.
3.3.4 Discharge Calculations
Discharge will be determined initially in gallons per second (gal/s) or in milliliters per second
(ml/s). These values will be noted, but the averaged value will be reported in cubic feet per
second (cfs). Calculations will be performed as follows:
Record each of the measurements in terms of gallons per second or
milliliters per second, depending on the volumetric container. If one of the measurements is different from the other measurements by 50
percent or more, then this value will not be used. Instead, five additional measurements will be taken and, provided that none of these measurements differs by greater than 50 percent from the other measurements, these values will be used.
Calculate the average of the measured values. Leakage around the discharge pipe, if any, will also be estimated and noted. Convert the averaged value to cfs as follows:
- to convert ml/s to cfs, multiply by 3.53 x 10⁻⁵ - to convert gal/s to cfs, multiply by 0.134
Record discharge in cfs.
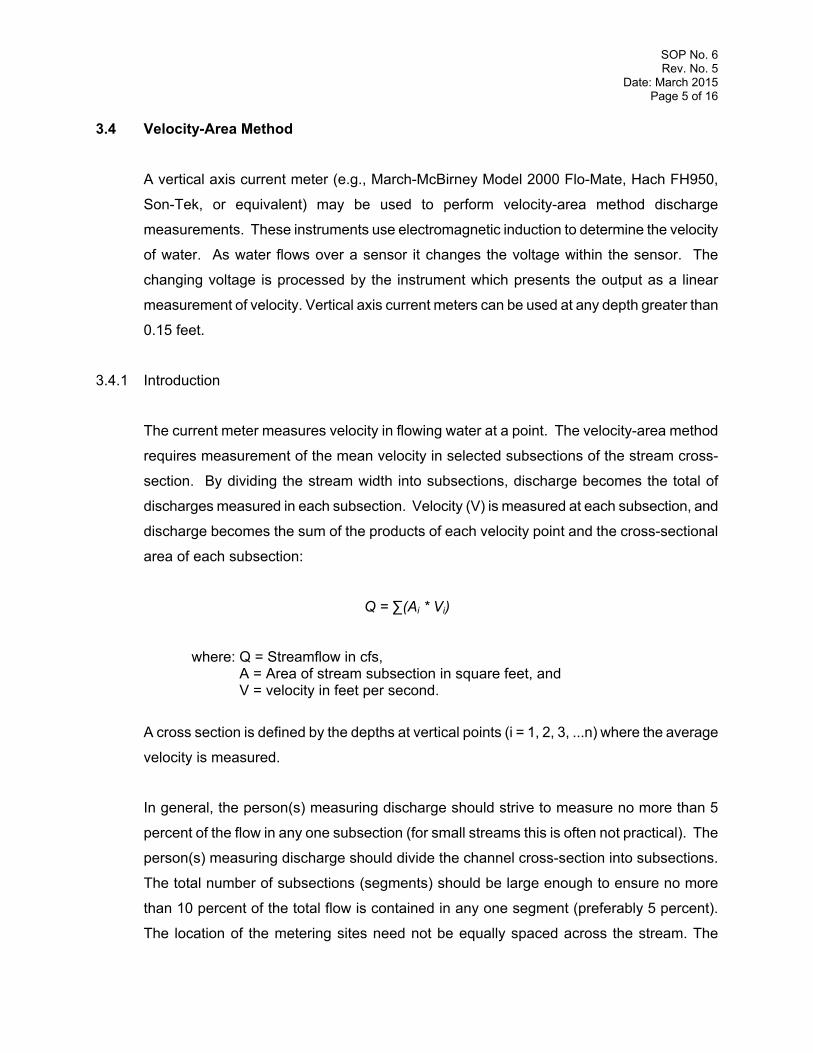
SOP No. 6 Rev. No. 5
Date: March 2015 Page 5 of 16
3.4 Velocity-Area Method
A vertical axis current meter (e.g., March-McBirney Model 2000 Flo-Mate, Hach FH950,
Son-Tek, or equivalent) may be used to perform velocity-area method discharge
measurements. These instruments use electromagnetic induction to determine the velocity
of water. As water flows over a sensor it changes the voltage within the sensor. The
changing voltage is processed by the instrument which presents the output as a linear
measurement of velocity. Vertical axis current meters can be used at any depth greater than
0.15 feet.
3.4.1 Introduction
The current meter measures velocity in flowing water at a point. The velocity-area method
requires measurement of the mean velocity in selected subsections of the stream cross-
section. By dividing the stream width into subsections, discharge becomes the total of
discharges measured in each subsection. Velocity (V) is measured at each subsection, and
discharge becomes the sum of the products of each velocity point and the cross-sectional
area of each subsection:
Q = ∑(Ai * Vi)
where: Q = Streamflow in cfs, A = Area of stream subsection in square feet, and
V = velocity in feet per second.
A cross section is defined by the depths at vertical points (i = 1, 2, 3, ...n) where the average
velocity is measured.
In general, the person(s) measuring discharge should strive to measure no more than 5
percent of the flow in any one subsection (for small streams this is often not practical). The
person(s) measuring discharge should divide the channel cross-section into subsections.
The total number of subsections (segments) should be large enough to ensure no more
than 10 percent of the total flow is contained in any one segment (preferably 5 percent).
The location of the metering sites need not be equally spaced across the stream. The
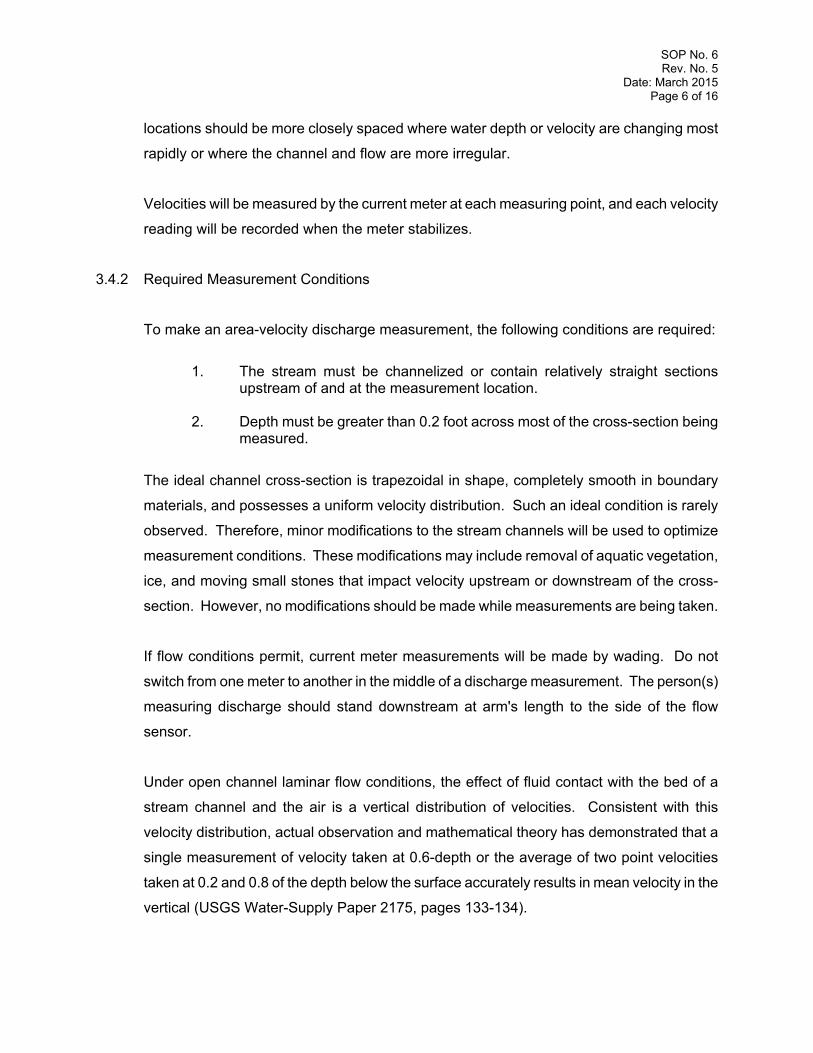
SOP No. 6 Rev. No. 5
Date: March 2015 Page 6 of 16
locations should be more closely spaced where water depth or velocity are changing most
rapidly or where the channel and flow are more irregular.
Velocities will be measured by the current meter at each measuring point, and each velocity
reading will be recorded when the meter stabilizes.
3.4.2 Required Measurement Conditions
To make an area-velocity discharge measurement, the following conditions are required:
1. The stream must be channelized or contain relatively straight sections
upstream of and at the measurement location.
2. Depth must be greater than 0.2 foot across most of the cross-section being measured.
The ideal channel cross-section is trapezoidal in shape, completely smooth in boundary
materials, and possesses a uniform velocity distribution. Such an ideal condition is rarely
observed. Therefore, minor modifications to the stream channels will be used to optimize
measurement conditions. These modifications may include removal of aquatic vegetation,
ice, and moving small stones that impact velocity upstream or downstream of the cross-
section. However, no modifications should be made while measurements are being taken.
If flow conditions permit, current meter measurements will be made by wading. Do not
switch from one meter to another in the middle of a discharge measurement. The person(s)
measuring discharge should stand downstream at arm's length to the side of the flow
sensor.
Under open channel laminar flow conditions, the effect of fluid contact with the bed of a
stream channel and the air is a vertical distribution of velocities. Consistent with this
velocity distribution, actual observation and mathematical theory has demonstrated that a
single measurement of velocity taken at 0.6-depth or the average of two point velocities
taken at 0.2 and 0.8 of the depth below the surface accurately results in mean velocity in the
vertical (USGS Water-Supply Paper 2175, pages 133-134).
SOP No. 6 Rev. No. 5
Date: March 2015 Page 7 of 16
If the stream is generally less than 2.5 feet deep, the six-tenths (0.6) method will be used. If
the stream is generally greater than 2.5 feet, the two- and eight-tenths (0.2 and 0.8) method,
also known as the two-point method, will be used. A complete discussion concerning how
to set the wading rod to place the current meter at proper depths is contained in Section
3.4.5, Field Procedures.
In the 0.6-depth method, an observation of velocity made in the vertical at 0.6 of the depth
below the surface is used as the mean velocity in the vertical. In the two-point method of
measuring velocities, observations are made in each vertical at 0.2 and 0.8 of the depth
below the surface. The average of the two observations is taken as the mean velocity in the
vertical.
A depth of 1.25 feet will accommodate the 0.6-depth method without causing the meter to
be set closer than 0.5 feet from the stream bed; if the meter is set any closer to the stream
bed, it will under-register the velocity.
3.4.3 Equipment
Current meters and depth and width measuring devices are needed for measurement of
discharge. The equipment includes:
Top-setting wading rod and current meter Width-measuring devices, either engineer's tape or tagline Stakes for width-measuring devices Calculator
Top-Setting Wading Rod. The depth-measuring device that will be used is the wading rod.
The current meter is attached to the wading rod. The top-setting wading rod has a 2-inch
hexagonal main rod for measuring depth and a 3/8-inch diameter round rod for setting the
position of the current meter.
Current Meter. Vertical axis current meter, for example, Marsh-McBirney Model 2000 Flo-
Mate, Hach FH950, or Son-Tek.
SOP No. 6 Rev. No. 5
Date: March 2015 Page 8 of 16
Engineer's Tape or Tagline. Tape measures or premarked taglines are used for stream
width measurements. Orientation normal to the flow patterns of the stream and elimination
of most of the sag, through support or tension, are recommended for improved accuracy.
3.4.4 Maintenance and Calibration Procedures
The Marsh-McBirney Model 2000 Flo-Mate and Hach FH950 will have a zero check
performed on the sensor to ensure accurate readings are obtained. First clean the sensor.
Then place the sensor in a five gallon bucket of water. Keep it at least three inches away
from the sides and bottom of the bucket. To make sure the water is not moving, wait 10 to
15 minutes after positioning the sensor and before taking any zero readings. If needed,
follow the manufacturer recommendations to zero adjust the sensor.
To ensure reliable observations of velocity, it is necessary that the current meter be kept in
good condition. Before and after each discharge measurement, the meter will be examined
for damage, wear, or faulty alignment. During measurements, the meter will be observed
periodically when it is out of the water to be sure that the sensor is free of debris.
Meters will be cleaned daily when in use. If measurements are made in sediment-laden
water, the meter will be cleaned immediately after each measurement.
3.4.5 Field Procedures
Upon arrival at the site, field personnel will evaluate the flow conditions to determine which
measurement method is appropriate. Based on flow conditions, the appropriate flow meter
(e.g., Marsh-McBirney Model 2000 Flo-Mate meter, Hach FH950, or Son-Tek) will be
selected to perform an area-velocity measurement.
At each measurement point (or section) across the stream cross-section, depth is measured
prior to measurement of velocity. Place the wading rod about 0.5 feet downstream from the
tagline. Place the wading rod in the stream so the base plate rests on the streambed. The
depth of water is read from the graduated main rod. The main rod is graduated into 0.1-foot
SOP No. 6 Rev. No. 5
Date: March 2015 Page 9 of 16
increments. These increments are indicated by a single score in the metal. Half-foot
increments are marked by two scores in the metal, and each foot is marked by three scores
in the metal. A vernier scale on the upper handle of the rod corresponds to 0.1-foot
increments, and has 1 through 9 in raised numbers next to raised marks. A sliding,
adjustable rod, known as the setting rod, to which the meter is attached, has single scored
marks that are aligned with values on the vernier scale.
In high-velocity areas, it is recommended that depth be read as the value between depth on
the upstream side of the rod and depth on the downstream side of the rod. Depth is
measured to the nearest 0.02 foot. This depth is used to set the vertical location of the
current meter.
The setting rod is then adjusted downward so that the scored mark of the setting rod that
corresponds to the range of depth in feet (e.g., if depth = 0.46, range in feet = 0; or if depth
= 1.72, range in feet = 1) is aligned with the stream depth value transposed to the vernier
scale. This automatically positions the meter for use in the 0.6 method as the meter is then
six-tenths of the total depth from the surface of the water.
For using the two-point method of velocity measurement, the depth of water is divided by 2.
This value is set so that the meter will be at the 0.8-depth position from the water surface.
The depth of water is then multiplied by two, and this value is set. The meter will then be at
the 0.2-depth position measured down from the water surface. These two positions
represent the conventional 0.2- and 0.8-depth positions. If depths are less than 0.3 foot, the
0.5 method may be used. The observation depth recorded will then be 0.5 of the total
depth.
If water quality or sediments are sampled in conjunction with discharge measurement,
samples will be collected prior to making discharge measurements.
SOP No. 6 Rev. No. 5
Date: March 2015 Page 10 of 16
The following steps are to be followed in discharge measurement:
Evaluate the measurement location. Choose a location where flow is least turbulent. If the prescribed location is in a stream reach with highly turbulent flow conditions, try to select a location immediately upstream or downstream. Flow should be visible from bank to bank. Eddies and slack water must not be present.
Remove aquatic vegetation, ice, or other minor flow impediments. When such modifications are made, exercise great care to avoid unnecessary movement of sediments and allow flow to stabilize before the current meter measurement begins.
Position a tape about 1 foot above the surface of the water. Secure the tape so that it remains taut and perpendicular to the channel.
Select a starting point at either the left bank (left edge of water, LEW) or the right bank (right edge of water, REW). LEW and REW are determined when facing downstream.
Note the distance in feet, and the stream direction, that this cross-section lies from
the prescribed location. For example, the note may read "25 feet downstream" or "15 feet upstream."
Measure the width of the stream. Select the number of subsections in which to measure velocity attempting to measure no more than 10 percent of the total flow in any one section, if possible.
After determining the distance desired between measuring points, commonly referred to as sections, measurement can begin. Record the bank at which measurements start on the discharge measurement notes as "REW ", using REW or LEW depending upon whether starting at the right or the left edge of the water.
Note the distance to the beginning edge of water from the initial point. The initial point is an arbitrary point on the tape, preferably zero, which lies on the shoreside of the stream. All station locations are recorded as distances from the initial point.
Proceed to the first station beyond the edge of water. Record the distance from the initial point on the discharge measurement notes. Place the wading rod into the stream so the base plate rests on the stream bed.
Stand downstream of the tagline or tape and face upstream. Do not stand behind or
close to the meter. Raise the current meter on the wading rod so that it is well above the surface of the water.
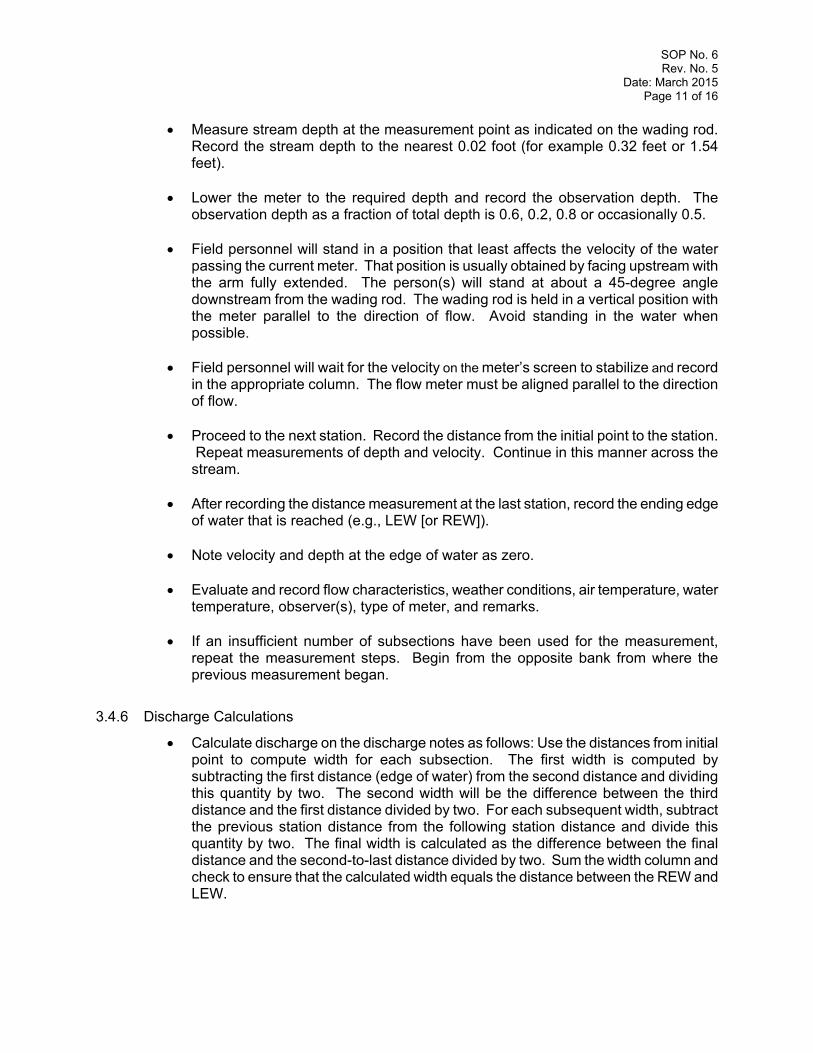
SOP No. 6 Rev. No. 5
Date: March 2015 Page 11 of 16
Measure stream depth at the measurement point as indicated on the wading rod. Record the stream depth to the nearest 0.02 foot (for example 0.32 feet or 1.54 feet).
Lower the meter to the required depth and record the observation depth. The observation depth as a fraction of total depth is 0.6, 0.2, 0.8 or occasionally 0.5.
Field personnel will stand in a position that least affects the velocity of the water passing the current meter. That position is usually obtained by facing upstream with the arm fully extended. The person(s) will stand at about a 45-degree angle downstream from the wading rod. The wading rod is held in a vertical position with the meter parallel to the direction of flow. Avoid standing in the water when possible.
Field personnel will wait for the velocity on the meter’s screen to stabilize and record
in the appropriate column. The flow meter must be aligned parallel to the direction of flow.
Proceed to the next station. Record the distance from the initial point to the station. Repeat measurements of depth and velocity. Continue in this manner across the stream.
After recording the distance measurement at the last station, record the ending edge of water that is reached (e.g., LEW [or REW]).
Note velocity and depth at the edge of water as zero.
Evaluate and record flow characteristics, weather conditions, air temperature, water temperature, observer(s), type of meter, and remarks.
If an insufficient number of subsections have been used for the measurement, repeat the measurement steps. Begin from the opposite bank from where the previous measurement began.
3.4.6 Discharge Calculations
Calculate discharge on the discharge notes as follows: Use the distances from initial point to compute width for each subsection. The first width is computed by subtracting the first distance (edge of water) from the second distance and dividing this quantity by two. The second width will be the difference between the third distance and the first distance divided by two. For each subsequent width, subtract the previous station distance from the following station distance and divide this quantity by two. The final width is calculated as the difference between the final distance and the second-to-last distance divided by two. Sum the width column and check to ensure that the calculated width equals the distance between the REW and LEW.
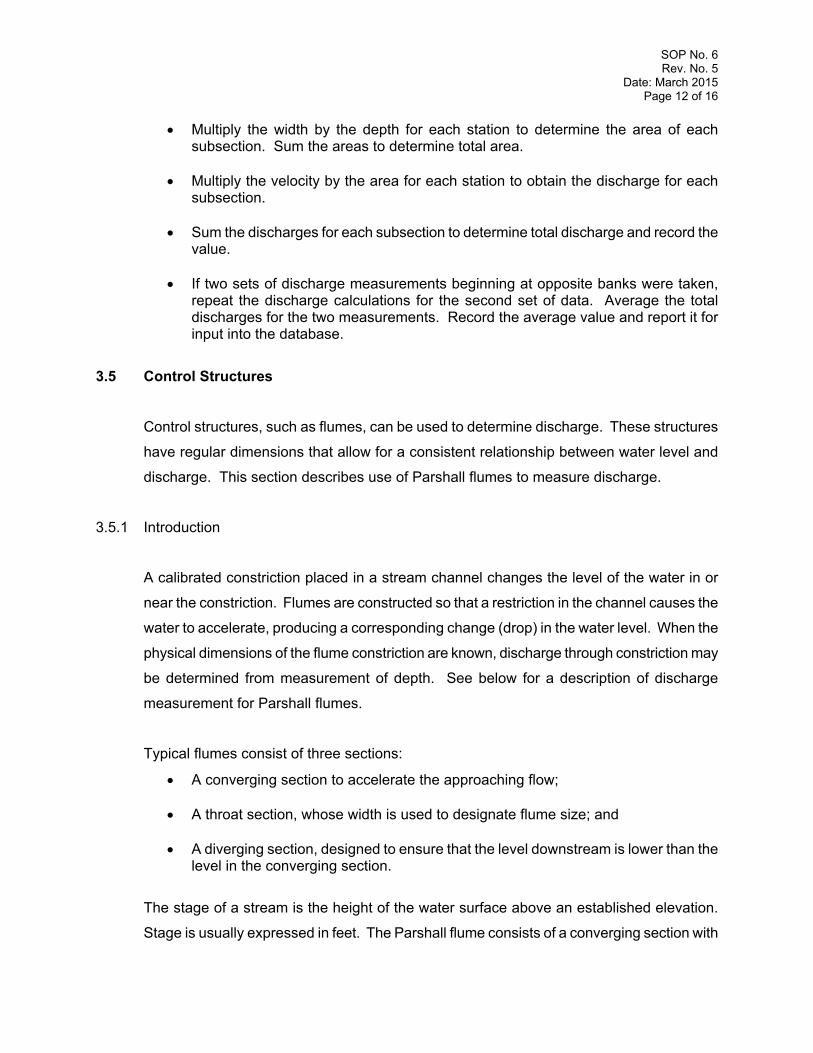
SOP No. 6 Rev. No. 5
Date: March 2015 Page 12 of 16
Multiply the width by the depth for each station to determine the area of each subsection. Sum the areas to determine total area.
Multiply the velocity by the area for each station to obtain the discharge for each subsection.
Sum the discharges for each subsection to determine total discharge and record the value.
If two sets of discharge measurements beginning at opposite banks were taken, repeat the discharge calculations for the second set of data. Average the total discharges for the two measurements. Record the average value and report it for input into the database.
3.5 Control Structures
Control structures, such as flumes, can be used to determine discharge. These structures
have regular dimensions that allow for a consistent relationship between water level and
discharge. This section describes use of Parshall flumes to measure discharge.
3.5.1 Introduction
A calibrated constriction placed in a stream channel changes the level of the water in or
near the constriction. Flumes are constructed so that a restriction in the channel causes the
water to accelerate, producing a corresponding change (drop) in the water level. When the
physical dimensions of the flume constriction are known, discharge through constriction may
be determined from measurement of depth. See below for a description of discharge
measurement for Parshall flumes.
Typical flumes consist of three sections:
A converging section to accelerate the approaching flow;
A throat section, whose width is used to designate flume size; and
A diverging section, designed to ensure that the level downstream is lower than the level in the converging section.
The stage of a stream is the height of the water surface above an established elevation.
Stage is usually expressed in feet. The Parshall flume consists of a converging section with
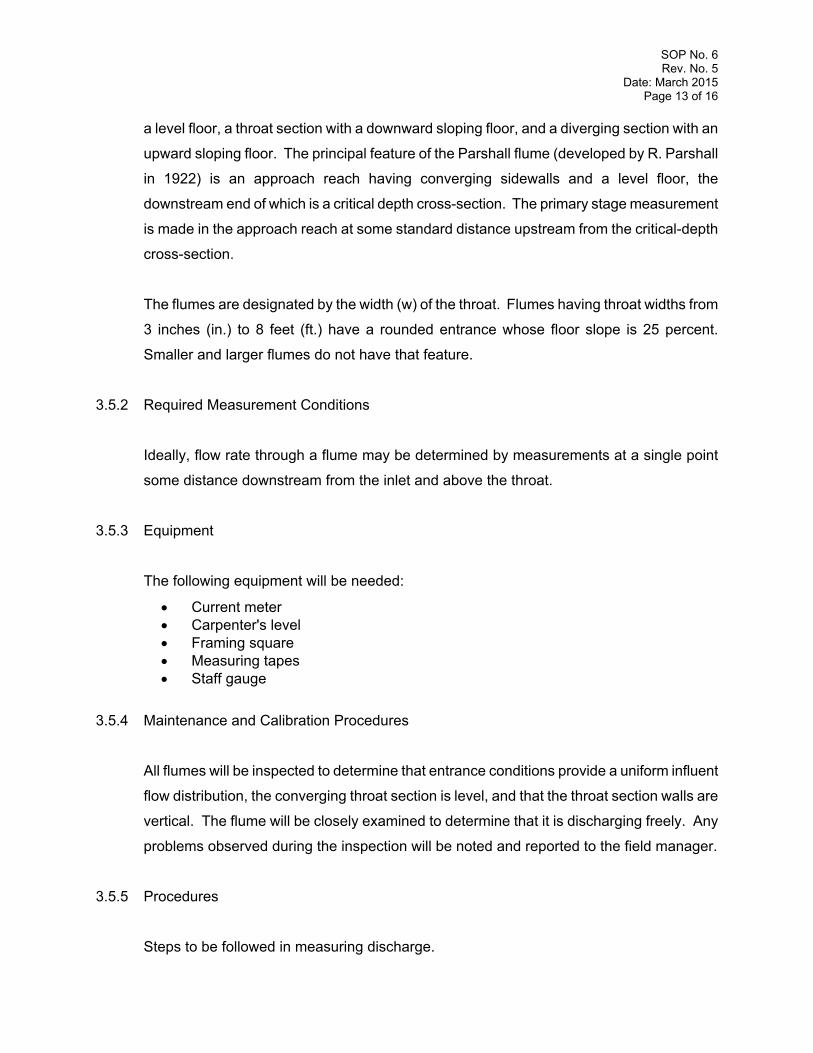
SOP No. 6 Rev. No. 5
Date: March 2015 Page 13 of 16
a level floor, a throat section with a downward sloping floor, and a diverging section with an
upward sloping floor. The principal feature of the Parshall flume (developed by R. Parshall
in 1922) is an approach reach having converging sidewalls and a level floor, the
downstream end of which is a critical depth cross-section. The primary stage measurement
is made in the approach reach at some standard distance upstream from the critical-depth
cross-section.
The flumes are designated by the width (w) of the throat. Flumes having throat widths from
3 inches (in.) to 8 feet (ft.) have a rounded entrance whose floor slope is 25 percent.
Smaller and larger flumes do not have that feature.
3.5.2 Required Measurement Conditions
Ideally, flow rate through a flume may be determined by measurements at a single point
some distance downstream from the inlet and above the throat.
3.5.3 Equipment
The following equipment will be needed:
Current meter Carpenter's level Framing square Measuring tapes Staff gauge
3.5.4 Maintenance and Calibration Procedures
All flumes will be inspected to determine that entrance conditions provide a uniform influent
flow distribution, the converging throat section is level, and that the throat section walls are
vertical. The flume will be closely examined to determine that it is discharging freely. Any
problems observed during the inspection will be noted and reported to the field manager.
3.5.5 Procedures
Steps to be followed in measuring discharge.
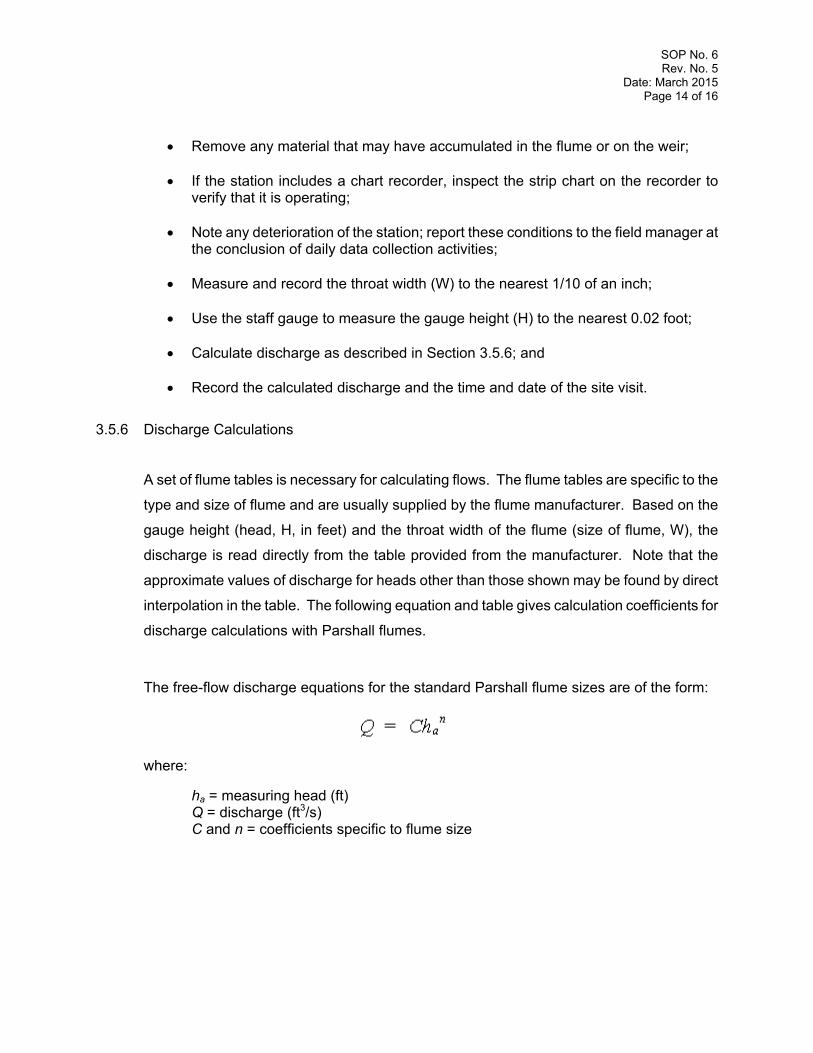
SOP No. 6 Rev. No. 5
Date: March 2015 Page 14 of 16
Remove any material that may have accumulated in the flume or on the weir;
If the station includes a chart recorder, inspect the strip chart on the recorder to
verify that it is operating;
Note any deterioration of the station; report these conditions to the field manager at the conclusion of daily data collection activities;
Measure and record the throat width (W) to the nearest 1/10 of an inch;
Use the staff gauge to measure the gauge height (H) to the nearest 0.02 foot;
Calculate discharge as described in Section 3.5.6; and
Record the calculated discharge and the time and date of the site visit.
3.5.6 Discharge Calculations
A set of flume tables is necessary for calculating flows. The flume tables are specific to the
type and size of flume and are usually supplied by the flume manufacturer. Based on the
gauge height (head, H, in feet) and the throat width of the flume (size of flume, W), the
discharge is read directly from the table provided from the manufacturer. Note that the
approximate values of discharge for heads other than those shown may be found by direct
interpolation in the table. The following equation and table gives calculation coefficients for
discharge calculations with Parshall flumes.
The free-flow discharge equations for the standard Parshall flume sizes are of the form:
where:
ha = measuring head (ft) Q = discharge (ft3/s) C and n = coefficients specific to flume size
SOP No. 6 Rev. No. 5
Date: March 2015 Page 15 of 16
Coefficients (C) and exponents (n) for Parshall flume discharge calculations are listed in the following table.
Throat width Coefficient (C) Exponent (n)
1 in 0.338 1.55
2 in 0.676 1.55
3 in 0.992 1.55
6 in 2.06 1.58
9 in 3.07 1.53
1 ft 3.95 1.55
2 ft 8.00 1.55
3 ft 12.00 1.57
4 ft 16.00 1.58
5 ft 20.00 1.59
6 ft 24.00 1.59
7 ft 28.00 1.60
8 ft 32.00 1.61
10 ft 39.38 1.60
12 ft 46.75 1.60
15 ft 57.81 1.60
20 ft 76.25 1.60
25 ft 94.69 1.60
30 ft 113.13 1.60
40 ft 150.00 1.60
50 ft 186.88 1.60
3.6 Documentation
Information required by this SOP will be documented in detail in a field notebook and/or on
a Surface Water Flow Record form (attached form or similar available in paper or electronic
format). This information includes the calibration data for flow measurement devices and
field discharge measurement data.
Documentation will also include the type of flow measurement device, including a model
number; a detailed description of measurement location and weather conditions during the
measurement; and calculations.
SOP No. 6 Rev. No. 5
Date: March 2015 Page 16 of 16
4.0 QUALITY ASSURANCE/QUALITY CONTROL
4.1 Calculation Check
All calculations will be reviewed for accuracy and conformance with these procedures. The
calculation review will be performed by a technically qualified individual before results are
reported or interpreted. The calculation check shall be documented by recording the
reviewer’s initials and date of review on the calculation sheet. A copy of the reviewed
calculations should be included in the project file.
4.2 Records Review and Management
The Project Manager or designated reviewer will verify that documentation has been
completed and filed per this procedure.
5.0 REFERENCES
Rantz, S.E. et al., 1982. Measurement and Computation of Streamflow: Volume 1,
Measurement of Stage and Discharge, U.S. Geological Survey Water Supply Paper 2175. U.S. Government Printing Office, Washington, D.C.
U.S. Department of the Interior Geological Survey (USGS), 1977. National Handbook of Recommended Methods for Water-Data Acquisition. Office of Water Data Coordination, U.S. Geological Survey, Reston, VA.
U.S. Environmental Protection Agency (USEPA), 1986. Engineering Support Branch
Standard Operating Procedures and Quality Assurance Manual. Environmental Services Division, Region IV, Athens, GA.
SOP No. 7 Equipment Decontamination
SOP No. 7 Rev. No. 4
Date: March 2015 Page 1 of 5
STANDARD OPERATING PROCEDURE No. 7
EQUIPMENT DECONTAMINATION
1.0 SCOPE AND APPLICABILITY
This Standard Operating Procedure (SOP) describes the methods to be used for
decontamination of all reusable field equipment that could become contaminated during
use and/or sampling. Field equipment may include split spoons, reusable bailers,
trowels, scissors, shovels, hand augers, or any other type of equipment used during field
activities. Decontamination is performed as a quality assurance measure and a safety
precaution; it prevents cross contamination between samples and also helps to maintain
a clean working environment. The procedures presented herein are intended to be
general in nature and are applicable when referenced by site-specific or project-specific
planning documents. Appropriate revisions may be made to accommodate site-specific
conditions or project-specific protocols when approved in writing or via email by the
Project Manager.
Decontamination is achieved primarily by rinsing with liquids which may include: soap
and/or detergent solutions, potable water, distilled weak acid solution, and/or methanol
or other solvent. Equipment may be allowed to air dry after being cleaned or may be
wiped dry with chemical-free towels or paper towels if immediate re-use is necessary.
At most project sites, decontamination of equipment that is re-used between sampling
locations will be accomplished between each sample collection point. Waste produced
by decontamination procedures, including waste liquids, solids, rags, gloves, etc., should
be collected and disposed of properly, based upon the nature of contamination. Specific
details for the handling of decontamination wastes are addressed in SOP No. 3
(STORAGE AND DISPOSAL OF SOIL, DRILLING FLUIDS, AND WATER GENERATED
DURING FIELD WORK) or may be specified by a project plan.
SOP No. 7 Rev. No. 4
Date: March 2015 Page 2 of 5
2.0 BASIS FOR METHODOLOGY
The methods and procedures described in this SOP were developed from these
sources:
ASTM D5088. Standard Practice for Decontamination of Field Equipment Used at Waste Sites. American Society for Testing and Materials (ASTM) International, West Conshohocken, PA, 2008.
Parker and Ranney, 1997a. Decontaminating Ground Water Sampling Devices, CRREL Special Report 97-25, U.S. Army Engineer Cold Regions Research and Engineering Laboratory, Hanover, NH.
Parker and Ranney, 1997b. Decontaminating Materials Used in Ground Water Sampling Devices, CRREL Special Report 97-24, U.S. Army Engineer Cold Regions Research and Engineering Laboratory, Hanover, NH.
3.0 PROCEDURES
3.1 Responsibilities
It is the responsibility of the field sampling supervisor to ensure that proper
decontamination procedures are followed and that all waste materials produced by
decontamination are properly managed. It is the responsibility of the project safety
officer to draft and enforce safety measures that provide the best protection for all
persons involved directly with sampling and/or decontamination.
It is the responsibility of any subcontractors (e.g., drilling contractors) to follow the
proper, designated decontamination procedures that are stated in their contracts and
outlined in the Site-Specific Health and Safety Plan. It is the responsibility of all
personnel involved with sample collection or decontamination to maintain a clean
working environment and ensure that any contaminants are not negligently introduced to
the environment.
SOP No. 7 Rev. No. 4
Date: March 2015 Page 3 of 5
3.2 Supporting Materials
Materials needed for equipment decontamination include:
Cleaning liquids: laboratory grade soap and/or detergent solutions (Alconox,
etc.), potable water, distilled water, methanol, weak nitric acid solution, etc.
Personal protective safety gear as defined in the Site-Specific Health and Safety
Plan
Chemical-free towels or paper towels
Disposable nitrile gloves
Waste storage containers: drums, boxes, plastic bags, etc.
Cleaning containers: plastic and/or stainless steel pans and buckets
Cleaning brushes
Aluminum foil
3.3 Methods
The extent of known contamination will determine the degree of decontamination
required. If the extent of contamination cannot be readily determined, cleaning should
be done according to the assumption that the equipment is highly contaminated.
Decontamination procedures should account for the types of contaminants known or
suspected to be present. In general, high levels of organic contaminants should include
an organic solvent wash step, and high levels of metals contamination should include a
weak acid rinse step.
The procedures listed below constitute the full field decontamination procedure. If
different or more elaborate procedures are required for a specific project, they may be
specified in the project planning documents. Such variations in decontamination
protocols may include all, part, or an expanded scope of the decontamination procedure
stated herein.
1. Remove gross contamination from the equipment by dry brushing, and
rinse with potable water. 2. Wash with laboratory-grade detergent solution.
SOP No. 7 Rev. No. 4
Date: March 2015 Page 4 of 5
3. Rinse with potable water.
4. Rinse with methanol (optional, for equipment potentially contaminated byorganic compounds).
5. Rinse with acid solution (optional, for equipment potentially contaminatedby metals).
6. Rinse with distilled or deionized water.
7. Repeat entire procedure or any parts of the procedure as necessary.
8. Air dry.
4.0 DOCUMENTATION
Field notes will be kept describing the decontamination procedures followed. The field
notes will be recorded according to procedures described in S O P N o . 1 ( F I E L D
DOCUMENTATION).
5.0 QUALITY CONTROL
To assess the adequacy of decontamination procedures, field rinsate blanks may be
required. The specific number of field rinsate blanks will be defined in the project-
specific Sampling and Analysis Plan (SAP) or Quality Assurance Project Plan (QAPP).
Rinsate blanks with elevated or detected contaminants will be evaluated by the Project
Manager, who will relay the results to the field personnel. Such results may be indicative
of inadequate decontamination procedures that require corrective actions (e.g.,
retraining).
6.0 REFERENCES
ASTM D5088-02 (2008). Standard Practice for Decontamination of Field Equipment Used at Waste Sites. American Society for Testing and Materials (ASTM) International, West Conshohocken, PA, 2008. Available online at http://www.astm.org/

SOP No. 7 Rev. No. 4
Date: March 2015 Page 5 of 5
Parker and Ranney, 1997a. Decontaminating Ground Water Sampling Devices, CRREL Special Report 97-25, U.S. Army Engineer Cold Regions Research and Engineering Laboratory, Hanover, NH.
Parker and Ranney, 1997b. Decontaminating Materials Used in Ground Water
Sampling Devices, CRREL Special Report 97-24, U.S. Army Engineer Cold Regions Research and Engineering Laboratory, Hanover, NH.
SOP No. 20 Data Review and Validation
SOP No. 20 DRAFT Rev. 1
Date: March 2015 Page 1 of 15
STANDARD OPERATING PROCEDURE No. 20
DATA REVIEW AND VALIDATION
1.0 SCOPE AND APPLICABILITY
This Standard Operating Procedure (SOP) describes the procedures for the evaluation
of data generated through inorganic laboratory analysis of samples. These procedures
apply to three levels of data evaluation: data completeness check, data review and data
validation.
The QAPP, Sampling and Analysis Plan (SAP) and/or any other relevant site-specific or
project-specific documents must be reviewed before this SOP is used to evaluate data.
The individual performing the data evaluation shall be familiar with the analytical
methods and other procedures used for the project. Familiarity with project and
laboratory quality control requirements is critical to appropriate use of this procedure. A
general description of the different levels of data evaluation is provided below and
discussed in detail in Section 4.0 of this SOP.
1.1 Data Completeness Check
Data completeness checks may be performed on both Level 2 standard data reports and
Level 4 USEPA Contract Laboratory Program (CLP)-like laboratory reports as specified
in the project planning documents and/or by the project team or regulatory agencies.
These completeness checks may be performed as part of a data review or validation or
may be performed as a stand-alone evaluation. Completeness checks only document
the presence or absence of applicable QC data in the laboratory data package, and no
qualification of sample results is necessary based on this data evaluation.
1.2 Data Review
Data review includes a review of laboratory quality assurance (QA) and quality control
(QC) sample results provided in Level 2, or equivalent, standard laboratory reports.
Data review can also be performed on CLP-like Level 4 data packages if required. In
addition to sample results, Level 2 laboratory reports provide QA/QC summaries that
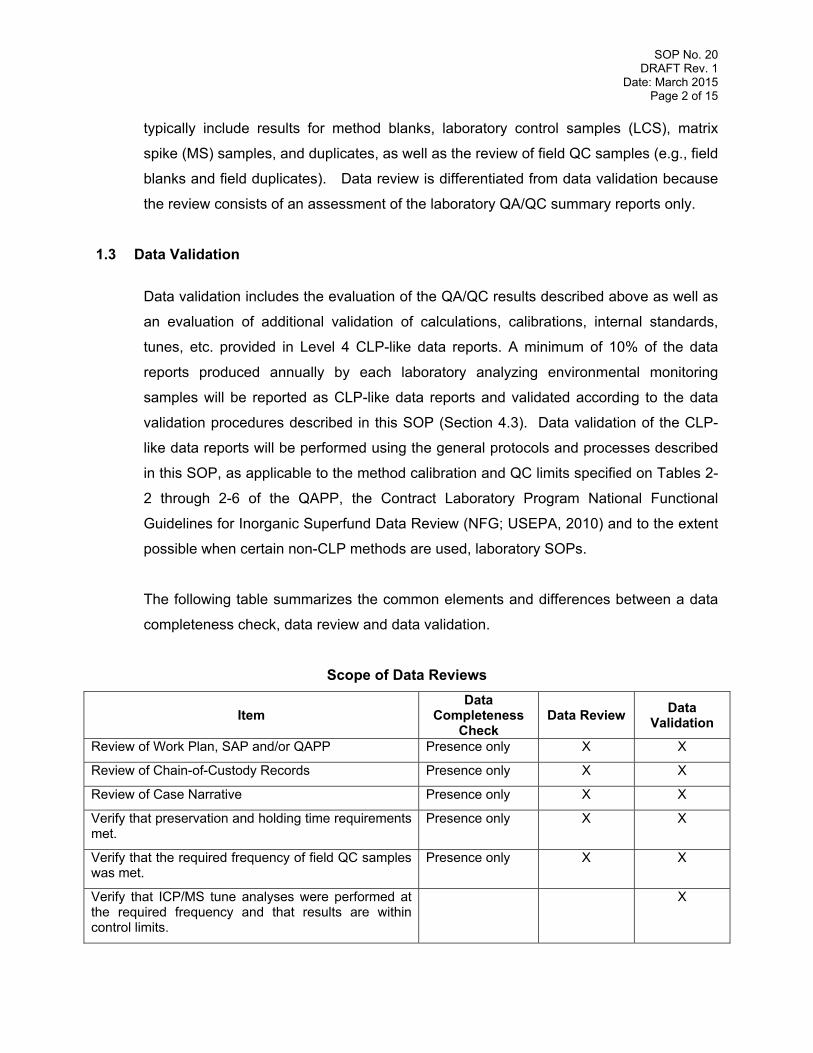
SOP No. 20 DRAFT Rev. 1
Date: March 2015 Page 2 of 15
typically include results for method blanks, laboratory control samples (LCS), matrix
spike (MS) samples, and duplicates, as well as the review of field QC samples (e.g., field
blanks and field duplicates). Data review is differentiated from data validation because
the review consists of an assessment of the laboratory QA/QC summary reports only.
1.3 Data Validation
Data validation includes the evaluation of the QA/QC results described above as well as
an evaluation of additional validation of calculations, calibrations, internal standards,
tunes, etc. provided in Level 4 CLP-like data reports. A minimum of 10% of the data
reports produced annually by each laboratory analyzing environmental monitoring
samples will be reported as CLP-like data reports and validated according to the data
validation procedures described in this SOP (Section 4.3). Data validation of the CLP-
like data reports will be performed using the general protocols and processes described
in this SOP, as applicable to the method calibration and QC limits specified on Tables 2-
2 through 2-6 of the QAPP, the Contract Laboratory Program National Functional
Guidelines for Inorganic Superfund Data Review (NFG; USEPA, 2010) and to the extent
possible when certain non-CLP methods are used, laboratory SOPs.
The following table summarizes the common elements and differences between a data
completeness check, data review and data validation.
Scope of Data Reviews
Item Data
Completeness Check
Data Review Data
Validation
Review of Work Plan, SAP and/or QAPP Presence only X X
Review of Chain-of-Custody Records Presence only X X
Review of Case Narrative Presence only X X
Verify that preservation and holding time requirements met.
Presence only X X
Verify that the required frequency of field QC samples was met.
Presence only X X
Verify that ICP/MS tune analyses were performed at the required frequency and that results are within control limits.
X
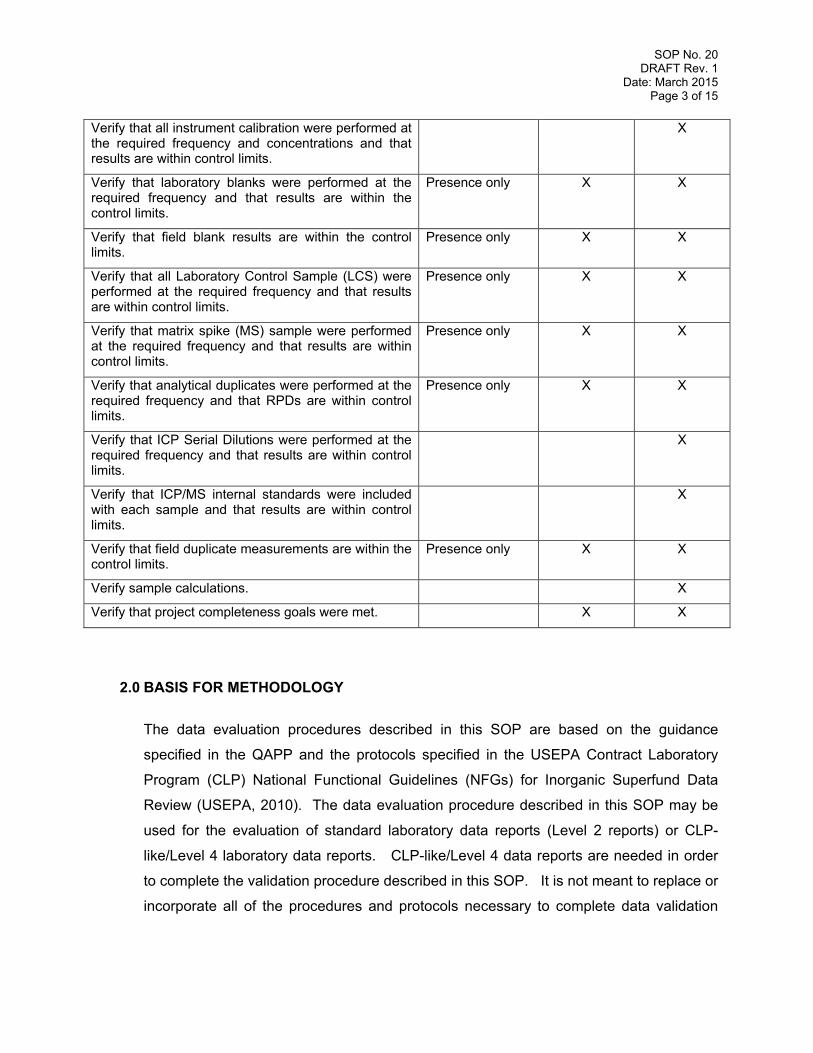
SOP No. 20 DRAFT Rev. 1
Date: March 2015 Page 3 of 15
Verify that all instrument calibration were performed at the required frequency and concentrations and that results are within control limits.
X
Verify that laboratory blanks were performed at the required frequency and that results are within the control limits.
Presence only X X
Verify that field blank results are within the control limits.
Presence only X X
Verify that all Laboratory Control Sample (LCS) were performed at the required frequency and that results are within control limits.
Presence only X X
Verify that matrix spike (MS) sample were performed at the required frequency and that results are within control limits.
Presence only X X
Verify that analytical duplicates were performed at the required frequency and that RPDs are within control limits.
Presence only X X
Verify that ICP Serial Dilutions were performed at the required frequency and that results are within control limits.
X
Verify that ICP/MS internal standards were included with each sample and that results are within control limits.
X
Verify that field duplicate measurements are within the control limits.
Presence only X X
Verify sample calculations. X
Verify that project completeness goals were met. X X
2.0 BASIS FOR METHODOLOGY
The data evaluation procedures described in this SOP are based on the guidance
specified in the QAPP and the protocols specified in the USEPA Contract Laboratory
Program (CLP) National Functional Guidelines (NFGs) for Inorganic Superfund Data
Review (USEPA, 2010). The data evaluation procedure described in this SOP may be
used for the evaluation of standard laboratory data reports (Level 2 reports) or CLP-
like/Level 4 laboratory data reports. CLP-like/Level 4 data reports are needed in order
to complete the validation procedure described in this SOP. It is not meant to replace or
incorporate all of the procedures and protocols necessary to complete data validation
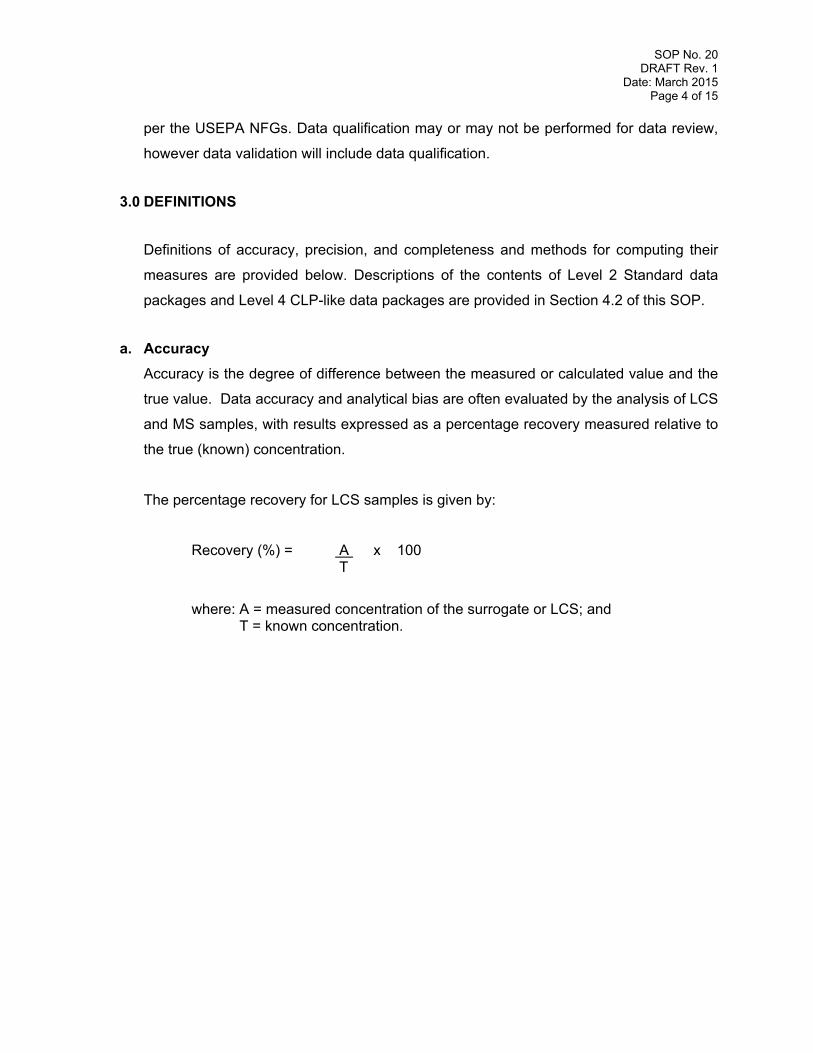
SOP No. 20 DRAFT Rev. 1
Date: March 2015 Page 4 of 15
per the USEPA NFGs. Data qualification may or may not be performed for data review,
however data validation will include data qualification.
3.0 DEFINITIONS
Definitions of accuracy, precision, and completeness and methods for computing their
measures are provided below. Descriptions of the contents of Level 2 Standard data
packages and Level 4 CLP-like data packages are provided in Section 4.2 of this SOP.
a. Accuracy
Accuracy is the degree of difference between the measured or calculated value and the
true value. Data accuracy and analytical bias are often evaluated by the analysis of LCS
and MS samples, with results expressed as a percentage recovery measured relative to
the true (known) concentration.
The percentage recovery for LCS samples is given by:
Recovery (%) = A x 100 T
where: A = measured concentration of the surrogate or LCS; and T = known concentration.
SOP No. 20 DRAFT Rev. 1
Date: March 2015 Page 5 of 15
The percentage recovery for MS samples is given by:
Recovery (%) = A - B x 100 T
where: A = measured concentration of the spiked sample; B = concentration of unspiked sample; and T = amount of spike added.
Laboratory blanks, and often, field blanks are analyzed to quantify artifacts introduced
during sampling, transport, or analysis that may affect the accuracy of the data.
b. Precision
Precision is the level of agreement between duplicate measurements of the same
characteristic. Laboratory precision, or analytical error, is assessed by determining the
agreement of results for replicate measurements of the same sample. Field precision is
assessed by determining the agreement for results for two independent samples
collected from the same site at the same time. Precision may be evaluated using
LCS/LCSD samples, MS/MSD samples, analytical duplicate samples and/or field
duplicate samples. The comparison is made by calculating the relative percent
difference (RPD) as given by:
RPD (%) = | 2 (S1 - S2) | x 100 S1 + S2
where: S1 = measured sample concentration; and S2 = measured duplicate concentration.
c. Completeness
Completeness is the percentage of usable data measurements obtained, as a proportion
of the number of data measurements planned for the project. Completeness is affected
by such factors as sample bottle breakage and acceptance/non-acceptance of analytical
results. Percentage completeness (C) is given by:
C (%) = V x 100 P
SOP No. 20 DRAFT Rev. 1
Date: March 2015 Page 6 of 15
where: V = number of usable data measurements obtained; and P = number of data measurements planned.
d. Data Qualifier Flags
As a result of the data review or validation procedures (but not data completeness
checks), data qualifier flags may be applied to individual analytical results if qualification
for project data usability is appropriate. Definitions of the flags applied for data
qualification are as follows:
Flag Definition
J The result is an estimated quantity. The associated numerical value is the approximate concentration of the analyte in the sample.
J+ The result is an estimated quantity, but the result may be biased high.
J- The result is an estimated quantity, but the result may be biased low.
R The data are unusable. The sample results are rejected due to serious deficiencies in meeting QC criteria. The analyte may or may not be present in the sample.
U The analyte was analyzed for, but was not detected above the level of the reported sample quantitation limit.
UJ The analyte was analyzed for, but was not detected. The reported quantitation limit is approximate and may be inaccurate or imprecise.
An explanation regarding the assignment of qualifiers in accordance with the review
procedures is detailed below in Section 4.2.
4.0 PROCEDURES
The data evaluation documentation requirements and procedures for data completeness
checks, data review, and data validation are described below in the following sections.
SOP No. 20 DRAFT Rev. 1
Date: March 2015 Page 7 of 15
4.1 Data Completeness Check Procedure
Data completeness checks can be performed as a stand-alone evaluation or as part of a
full data review or validation. A data completeness check is performed to verify that the
laboratory data provided are complete. The following shall be reviewed for Level 2
Standard data reports and Level 4 CLP-like data reports.
Level 2 Standard data reports shall include the following information for each sample:
Field and laboratory sample identification;
Sample result, method detection limit, and reporting limit, with appropriate units;
Dilution factor
Sample collection, receipt, and analysis dates;
Analytical method(s) references; and
Laboratory qualifiers and definitions.
In addition, Level 2 Standard data reports shall include the following information in a
QA/QC summary:
Method blank results for each analyte;
LCS results and laboratory control limits for each analyte;
MS results and laboratory control limits for each analyte, if applicable;
Analytical duplicate results and laboratory control limits for each target analyte (LCSD and/or MSD results may be provided instead of analytical duplicate results); and
Confirmation of instrument calibration; and
Copies of the signed COCs.
Level 4 CLP-like laboratory reports shall include the following information for each
sample, at a minimum:
Field and laboratory sample identification;
Sample result, method detection limit, and reporting limit, with appropriate units;
Sample collection and receipt dates;
Sample preparation and analysis date/time;
Dilution factor;
Preparation and analysis batch numbers or identification;
SOP No. 20 DRAFT Rev. 1
Date: March 2015 Page 8 of 15
Sample matrix;
Analytical method(s) references;
Percent moisture determination; and
For solid-matrix samples, identify basis of reporting (i.e., wet-weight or dry-weight basis).
The following additional information will also be provided in Level 4 CLP-like data
reports, as applicable for the reported analytical methods:
Case narrative;
Copies of the signed COCs;
Laboratory method/preparation blank;
Initial calibration verification (ICV), and continuing calibration verification (CCV);
Initial calibration blanks (ICB), and continuing calibration blank (CCB);
Interference check sample, if applicable;
Matrix spike (MS), and when applicable matrix spike duplicate (MSD), sample recovery and, when applicable, MS/MSD relative percent difference (RPD);
Post-digest spike sample recovery;
Laboratory duplicate;
Laboratory control sample (LCS) recovery;
ICP and ICPMS serial dilution percent differences;
MDLs;
ICP inter-element correction factors;
ICP and ICPMS linear ranges;
Preparation log;
Analysis run log;
Instrument raw data for verification;
ICPMS tunes;
ICPMS internal standards relative intensity summary;
Sample log-in sheet; and
Deliverables inventory sheet.
SOP No. 20 DRAFT Rev. 1
Date: March 2015 Page 9 of 15
4.2 Data Review Procedure
The data review procedure for review of a Level 2 Standard data report is as follows.
Data may or may not be qualified during data review depending on the project
specifications. A. Review copies of the Chain-of-Custody records (COCs). Verify that all
necessary information was provided on each COC and that all necessary
signatures are present. Review laboratory records of sample temperature
upon receipt and preservation information, if available, to verify that samples
were properly preserved. Professional judgment may be used to determine if
data qualification is necessary due to temperature exceedances and/or
preservation deviations. Verify that all samples listed on the COCs were
analyzed for the appropriate parameters. Note any problems documented on
the COCs by either the laboratory or the sampler.
B. Briefly review and summarize the laboratory case narrative, if present. Note
any data that are indicated as outside of control limits.
C. For each sample and each parameter, verify that the analyses were
performed within the recommended holding time. For sample analyses
performed outside the recommended holding times, sample results may be
qualified as described in the QAPP or USEPA NFGs (2010), though
professional judgment and project-specified requirements should be used.
D. Identify any field QC samples and verify that the field QC samples specified
in the Work Plan, QAPP or other relevant project documents have been
collected at the correct frequency.
E. Review the results of all field/equipment blanks and the laboratory method
blanks. If an analyte was detected in a blank, the corresponding sample
concentrations will be compared to the blank concentrations. Sample results
may be qualified as described in the QAPP or USEPA NFGs (2010), though
SOP No. 20 DRAFT Rev. 1
Date: March 2015 Page 10 of 15
professional judgment should be used to carefully evaluate the effect of blank
concentrations on the sample data.
F. Check the matrices, units, detection limits and reporting limits to verify that
they are reported correctly and meet the project-specific requirements, if
provided.
G. Review all LCS (and LCSD, if available) recoveries and verify that they were
within the project-specified control limits. If project-specific control limits are
not provided, use the laboratory’s control limits. LCS materials may not be
available for all matrices. Sample results may be qualified as described in the
QAPP or USEPA NFGs (2010), though professional judgment and project-
specified requirements should be used.
H. Review all MS (and MSD, if available) recoveries and verify that they were
within the project-specified control limits. If project-specific control limits are
not provided, use the laboratory’s control limits. If analyzed and reported,
post-digestion spike information should also be reviewed. Sample results
may be qualified as described in the QAPP or USEPA NFGs (2010), though
professional judgment and project-specified requirements should be used.
For MS results that do not meet the control limits, the reviewer may choose to
apply qualifiers to all samples of the same matrix associated with the MS, if
the reviewer considers the samples sufficiently similar.
If an analytical duplicate was analyzed, compare the laboratory calculated
RPD and compare this to the project-specified control limits. If a project-
specific control limit is not available, use the laboratory’s control limits.
However, if one or both of the results are less than five times the PQL, use
PQL as the control limit for aqueous samples and 2x PQL as the control
limit for non-aqueous (i.e., soil, sediment, tissue) sample matrices unless
project-specific control limits are provided. If the analytical duplicate results
fall outside of the control limits, sample results may be qualified as described
in the QAPP or USEPA NFGs (2010), though professional judgment and
SOP No. 20 DRAFT Rev. 1
Date: March 2015 Page 11 of 15
project-specified requirements should be used, LCS/LCSDs and/or MS/MSDs
may be analyzed in place of, or in addition to, an analytical duplicate. The
RPDs for LCS/LCSD and MS/MSD pairs shall be evaluated in the same
manner as described above for analytical duplicates.
I. If field duplicates were analyzed, calculate the RPD for each parameter and
compare the RPDs to project-specified control limits. If project-specific
control limits are not available, use 30 percent for aqueous samples and 50
percent for soil/solid/vegetation tissue samples. However, if one or both of
the results are less than five times the PQL, use PQL as the control limit for
aqueous samples and 2x PQL as the control limit for non-aqueous (i.e.,
soil, sediment, tissue) sample matrices unless project-specific control limits
are provided. If the field duplicate results fall outside of the control limits, the
associated field duplicate results should be qualified in the same manner
described above for analytical duplicates as described in the QAPP or
USEPA NFGs (2010), though professional judgment and project-specified
requirements should be used. Professional judgment will be used to
determine whether additional sample results, in addition to the field duplicate
sample results, should also be qualified.
J. Determine whether the project’s analytical completeness goal was met. Note
any rejected data.
The data reviewer may also provide a brief summary of the accuracy,
precision and completeness of the data set. The qualifier flags assigned to
the data will be summarized in a table and/or entered into the electronic data
deliverable, as specified in the project’s QAPP or SAP.
4.3 Data Validation Procedure
A minimum of 10% of the data reports produced annually by each laboratory analyzing
environmental monitoring samples from Smoky Canyon Mine will be reported as CLP-like
data reports and validated according to the data validation procedures described in this
SOP. The data validation procedure shall include all of the above steps in the data
SOP No. 20 DRAFT Rev. 1
Date: March 2015 Page 12 of 15
review procedure with additional steps as outlined below. These additional steps include
the recalculation of instrument and sample results from the laboratory instrument
responses for a subset of the data. These recalculated results are compared to the
laboratory reported results to confirm that the instrument outputs were correctly reported.
Also, additional QC summary reports will be reviewed including the ICP/MS tune
summary, the instrument calibrations, the interference check sample summary, the serial
dilution sample summary, and the internal standard relative intensity summary. Data will
be qualified during the data validation procedure with the appropriate qualifiers as
specified in the QAPP and consistent with USEPA’s NFG (2010). A more complete
description of the additional steps to be followed in data validation is presented below.
A. Verify sample calculations for a few of each sample results and identify and
document any calculation errors if any are present. The raw instrument
output will be reviewed to confirm that the analyte concentrations were
reported correctly.
B. Verify that the ICP/MS tune analysis data requirements were met and results
were within QC limits. Review the raw data for a subset of the tune results
and confirm that the raw data matches the results summarized on the ICP-
MS Tune summary form. If the ICP/MS tune analysis results fall outside of
the control limits, the associated sample results should be qualified as
described in the QAPP or USEPA NFGs (2010).
C. Verify that the instrument calibration was performed at the required
frequency, that results are within QC limits, and review associated standards,
including initial and continuing calibration standards and blanks. For a subset
of the analytes, recalculate the percent recoveries for calibration standards
using the data on the Initial and continuing calibration verification summary
form and verify that the concentrations reported on this form are consistent
with those in the instrument output. For ICVs/CCVs that have percent
recoveries outside of control limits and for calibration blanks for which
analytes are detected, review the run logs to confirm which samples were
affected by out of control CCVs and CCBs. Associated sample results should
be qualified as described in the QAPP or USEPA NFGs (2010) though
professional judgment and project-specified requirements should be used.
SOP No. 20 DRAFT Rev. 1
Date: March 2015 Page 13 of 15
D. Verify that Interference Check Sample data requirements were met and
results are within QC limits. Recalculate a subset of the percent recoveries
and review the raw data to verify that the results from the instrument output
match those reported on the Interference Check Sample summary form. If
the interference check sample results fall outside of the control limits, the
associated sample results should be qualified as described in the QAPP or
USEPA NFGs (2010).
E. Verify that ICP serial dilutions requirements were met and results are within
QC limits. Recalculate percent differences for a subset of the results and
verify that instrument outputs match values reported in the summary form.
Where percent differences exceed the control limit and sample results are
greater than 50 times the method detection limit, the associated sample
results should be qualified as described in the QAPP or USEPA NFGs
(2010).
F. Verify that ICP/MS internal standard requirements were met and results
within QC limits. Review raw data and recalculate a subset of the relative
intensities of the internal standards and compare them to those reported on
the internal standard relative intensity summary form. The associated sample
results should be qualified as described in the QAPP or USEPA NFGs
(2010).
Qualify all sample data associated with QC or calibration that do not meet the project
specifications or QC limit using the appropriate qualifiers as defined in Section 3.4 Data
Qualifiers. Use the guidance for data qualification from the project specific guidelines in
the QAPP or guidance in the USEPA NFG (2010).
5.0 DOCUMENTATION
The data evaluation procedures and results will be documented through completion of a
checklist, worksheet or summary document, subject to review and approval by the
appropriate project representative(s). The data evaluation documents will be provided to
the Project Manager and included in the project file containing the associated laboratory
result reports.
SOP No. 20 DRAFT Rev. 1
Date: March 2015 Page 14 of 15
Include the project name, project number, laboratory name, laboratory project number,
field sample IDs, sample matrix, and analytical parameters and methods used on the
data evaluation documentation forms. Specify the relevant project-planning documents
and reference the protocol that was used to perform the data evaluation (such as this
SOP).
A data review checklist is provided in Attachment A and a data validation checklist is
provided in Attachment B. The table in Section 1.3 or list of report contents in Section
4.1 can be used as the basis for a checklist of the data completeness check.
6.0 DATA USE
Qualifier flags are assigned to describe the degree to which individual values provide
accurate and precise results. The general criteria for assigning flags and their meaning
in terms of future data use are as follows:
Values assigned J flags (J, J+, or J-) are considered estimated results. QC data supplied with those values indicate that they may not be accurate or precise within the limits specified in the QAPP or a project-specific document, but that the magnitude of the potential imprecision or inaccuracy is not great enough to reject the value for project data uses.
Values assigned R flags do not meet the requirements for accuracy, precision, representativeness, or reproducibility specified to provide quantitative data for the project data uses. The R flag indicates that serious deficiencies were encountered preventing the generation of usable data for the project objectives.
Values assigned U flags indicate that a concentration of the analyte cannot be confirmed due to the presence of an interferant or the presence of the analyte in associated blanks. UJ flags may be applied to indicate that the presence of the analyte cannot be confirmed and the value of the reported quantitation limit for the sample may not be accurate or precise. Values flagged with U or UJ are fully usable and should be considered undetected.
Values without flags assigned have met all of the project data quality objectives and are suitable for all project data uses.
7.0 QUALITY ASSURANCE/QUALITY CONTROL
The data evaluation documents will be reviewed internally for conformance to the
procedures described herein. Once any questions or comments resulting from that
SOP No. 20 DRAFT Rev. 1
Date: March 2015 Page 15 of 15
review have been resolved, the data evaluation documents will be considered final and
any data qualifiers will be assigned to the results that are ultimately included in the
project's electronic database.
8.0 REFERENCES
U.S. Environmental Protection Agency (USEPA), 2010. USEPA Contract Laboratory
Program National Functional Guidelines for Inorganic Superfund Data Review. EPA 540-R-10-011. January.
SOP No. 31 Water Quality Meter Calibration
SOP No 31 Rev. No. 0
Date: March 2015 Page 1 of 4
STANDARD OPERATING PROCEDURE No. 31
WATER QUALITY METER CALIBRATION
1.0 SCOPE AND APPLICABILITY
This Standard Operating Procedure (SOP) describes the protocol to be followed for
calibration of the field water quality sampling multi-parameter instrument used during
environmental monitoring and sampling activities. The procedures presented herein are
intended to be general in nature and are applicable when referenced by site-specific or
project-specific planning documents. Appropriate modifications to the procedures may
be made to accommodate project-specific protocols when approved in writing or via
email by the Project Manager or detailed in a project work plan, sampling plan, or quality
assurance project plan.
The objective of calibrating field instruments is to establish the accuracy and reliability of
the instrument and to ensure that field readings are consistent with other measurements.
2.0 BASIS FOR METHODOLOGY
The methods and procedures described in this SOP were developed from this source:
U.S. Geological Survey (USGS) (variously dated) National Field Manual for the
Collection of Water-Quality Data: U.S. Geological Survey Techniques of Water-Resources Investigations, Book 9, Handbooks for Water-Resources Investigations, Chapters A1-A9.
SOP No 31 Rev. No. 1
Date: January 2015 Page 2 of 5
3.0 EQUIPMENT AND SUPPLIES
3.1 Multi-Parameter Sensors
Multi-parameter sensors can vary between manufacturers of instruments and as
technology advances. The following are the sensors generally used on multi-parameter
instruments for collecting water quality parameters: water temperature, pH, specific
electrical conductance (SC), oxidation-reduction potential (ORP), and dissolved oxygen
(DO). Turbidity is generally measured using a separate meter, but there are some
instruments for which the turbidity sensor is included with the multi-meter sensor cluster.
pH – sensor has a range between 2 to 12, or 0 to 14 pH units
Water Temperature – sensor has a range of at least -5 to +45 degrees Celsius
SC – sensor is temperature compensating, and measures in microsiemens per
centimeter (uS/cm) or mS/cm
DO – 2 types of sensors (polarographic and optical) both sensors range from
0.05 to 20 milligrams per liter (mg/L)
ORP – sensor uses a platinum electrode, and measures in millivolts (mV)
3.2 Calibration Supplies
The following supplies are needed to calibrate a multi-parameter instrument: specific
sensor buffers, standards, and calibration solutions, field notebooks, deionized water,
bucket(s), disposable gloves, scrub brushes, and paper tissues.
4.0 CALIBRATION PROCEDURE
The multi-parameter instrument will be calibrated in the field once daily by personnel
according to manufacturer’s instructions prior to the collection of any samples. All
calibration details will be recorded in a field notebook including, but not limited to:
instrument type, instrument serial number, readings prior to calibration, buffers used,
readings after calibration, names of personnel calibrating, and date and time of
calibration. The following are general guidelines to follow when calibrating a multi-
parameter instrument:
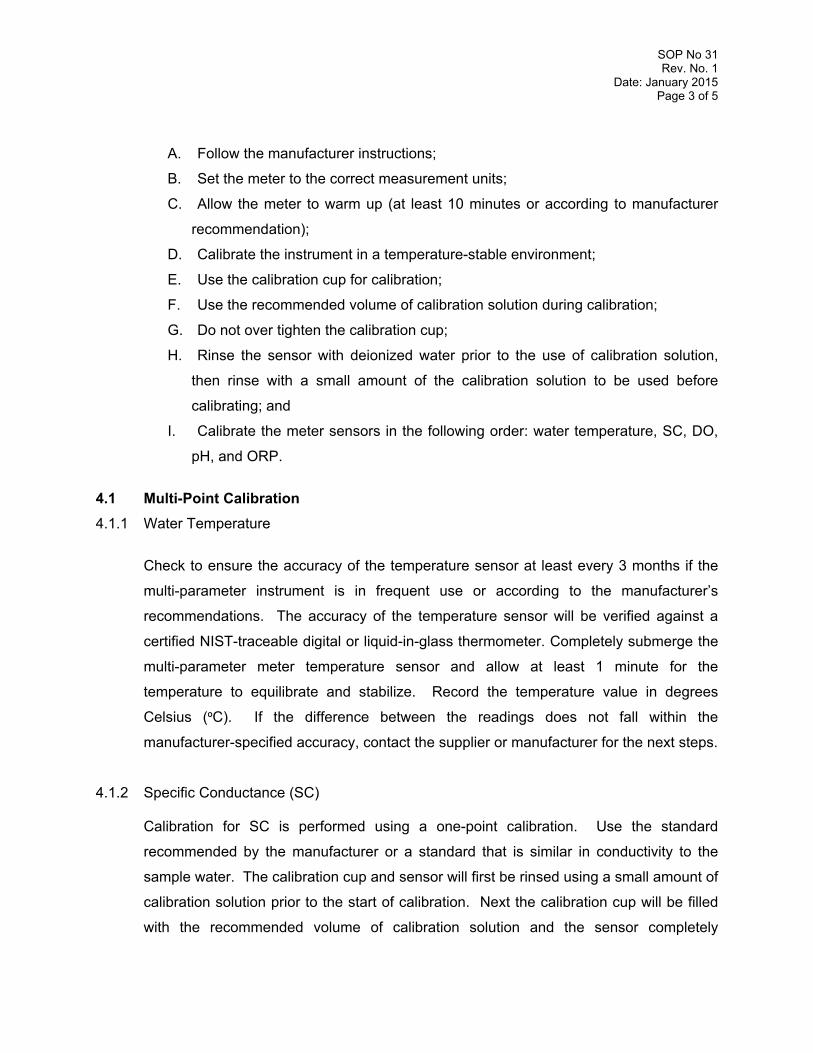
SOP No 31 Rev. No. 1
Date: January 2015 Page 3 of 5
A. Follow the manufacturer instructions;
B. Set the meter to the correct measurement units;
C. Allow the meter to warm up (at least 10 minutes or according to manufacturer
recommendation);
D. Calibrate the instrument in a temperature-stable environment;
E. Use the calibration cup for calibration;
F. Use the recommended volume of calibration solution during calibration;
G. Do not over tighten the calibration cup;
H. Rinse the sensor with deionized water prior to the use of calibration solution,
then rinse with a small amount of the calibration solution to be used before
calibrating; and
I. Calibrate the meter sensors in the following order: water temperature, SC, DO,
pH, and ORP.
4.1 Multi-Point Calibration
4.1.1 Water Temperature
Check to ensure the accuracy of the temperature sensor at least every 3 months if the
multi-parameter instrument is in frequent use or according to the manufacturer’s
recommendations. The accuracy of the temperature sensor will be verified against a
certified NIST-traceable digital or liquid-in-glass thermometer. Completely submerge the
multi-parameter meter temperature sensor and allow at least 1 minute for the
temperature to equilibrate and stabilize. Record the temperature value in degrees
Celsius (ºC). If the difference between the readings does not fall within the
manufacturer-specified accuracy, contact the supplier or manufacturer for the next steps.
4.1.2 Specific Conductance (SC)
Calibration for SC is performed using a one-point calibration. Use the standard
recommended by the manufacturer or a standard that is similar in conductivity to the
sample water. The calibration cup and sensor will first be rinsed using a small amount of
calibration solution prior to the start of calibration. Next the calibration cup will be filled
with the recommended volume of calibration solution and the sensor completely
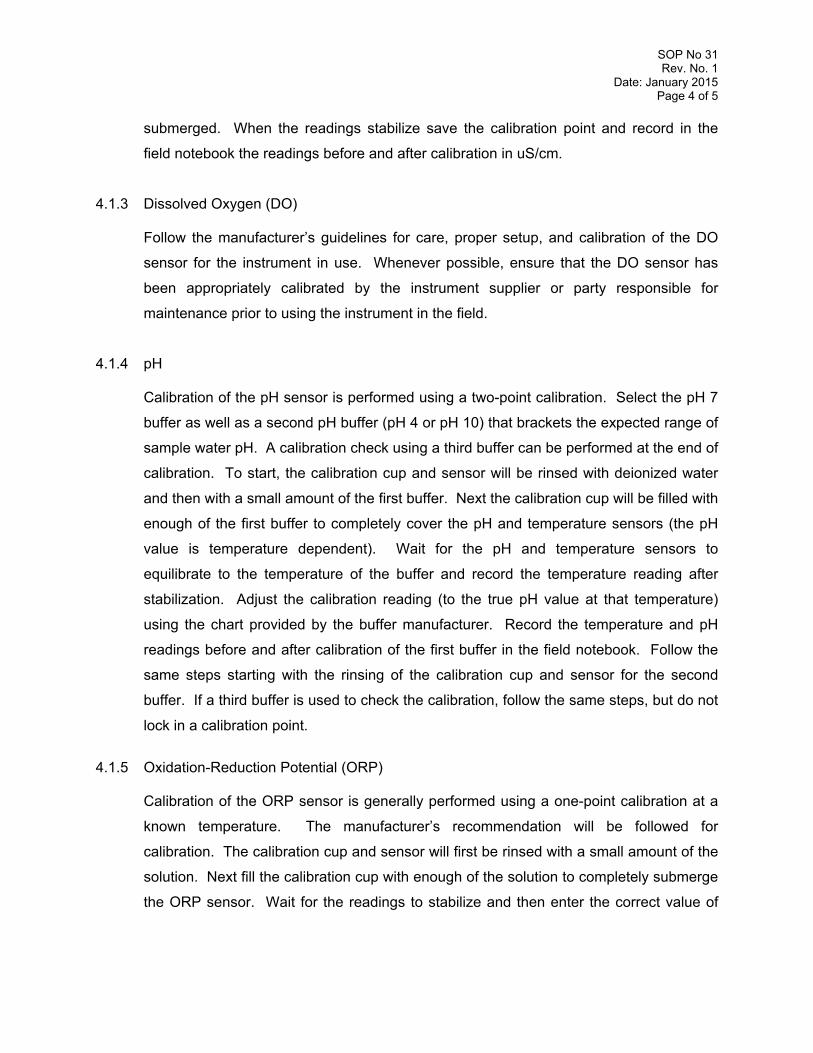
SOP No 31 Rev. No. 1
Date: January 2015 Page 4 of 5
submerged. When the readings stabilize save the calibration point and record in the
field notebook the readings before and after calibration in uS/cm.
4.1.3 Dissolved Oxygen (DO)
Follow the manufacturer’s guidelines for care, proper setup, and calibration of the DO
sensor for the instrument in use. Whenever possible, ensure that the DO sensor has
been appropriately calibrated by the instrument supplier or party responsible for
maintenance prior to using the instrument in the field.
4.1.4 pH
Calibration of the pH sensor is performed using a two-point calibration. Select the pH 7
buffer as well as a second pH buffer (pH 4 or pH 10) that brackets the expected range of
sample water pH. A calibration check using a third buffer can be performed at the end of
calibration. To start, the calibration cup and sensor will be rinsed with deionized water
and then with a small amount of the first buffer. Next the calibration cup will be filled with
enough of the first buffer to completely cover the pH and temperature sensors (the pH
value is temperature dependent). Wait for the pH and temperature sensors to
equilibrate to the temperature of the buffer and record the temperature reading after
stabilization. Adjust the calibration reading (to the true pH value at that temperature)
using the chart provided by the buffer manufacturer. Record the temperature and pH
readings before and after calibration of the first buffer in the field notebook. Follow the
same steps starting with the rinsing of the calibration cup and sensor for the second
buffer. If a third buffer is used to check the calibration, follow the same steps, but do not
lock in a calibration point.
4.1.5 Oxidation-Reduction Potential (ORP)
Calibration of the ORP sensor is generally performed using a one-point calibration at a
known temperature. The manufacturer’s recommendation will be followed for
calibration. The calibration cup and sensor will first be rinsed with a small amount of the
solution. Next fill the calibration cup with enough of the solution to completely submerge
the ORP sensor. Wait for the readings to stabilize and then enter the correct value of
SOP No 31 Rev. No. 1
Date: January 2015 Page 5 of 5
the solution at the current temperature. Record the ORP readings before and after
calibration in mV, as well as the solution values used in the field notebook.
4.2 One-Point Calibration
Calibration may be performed using the In-Situ Quick Cal Solution when an In-Situ
smarTROLLTM MP handheld water quality meter is used. The Quick Cal Solution
performs a one-point calibration of all smarTrollTM MP sensors (pH, ORP, SC, and DO)
at the same time. The manufacturer’s recommendations will be followed for calibration
as well as the following use and storage guidelines:
Shake well before use;
Allow to warm to room temperature before using;
Store in refrigerator (needs to be stored in dark and cool environment);
Use within three weeks after opening (document on bottle and calibration
records when opened);
Unopened shelf life is six months (check and document expiration date of
bottle); and
One-time use only (i.e. solution should not be re-used following single
calibration).
5.0 DOCUMENTATION
The Project Manager or designated reviewer will check and verify that documentation of
instrument calibration has been completed and the calibration records are filed in the
project records.
6.0 REFERENCES
U.S. Geological Survey (USGS), variously dated. National Field Manual for the
Collection of Water-Quality Data: U.S. Geological Survey Techniques of Water-Resources Investigations, Book 9, Handbooks for Water-Resources Investigations, Chapters A1-A9. Available online at http://pubs.water.usgs.gov/twri9A.
EPA SOP FLD#-5 Standard Operating Procedure for Soil Sampling
Standard Operating Procedures Document No.: FLD-05.00 TechLaw, Inc. Revision No.:0 ESAT Region 8 Revision Date: N/A Contract No.: EP-W-06-033 Page 2 of 11
Effective Date: 03/30/2012 Replaces SOP: N/A
TABLE OF CONTENTS 1.0 PURPOSE ..................................................................................................................................... 3 2.0 SCOPE AND APPLICATION ......................................................................................................... 3 3.0 SUMMARY OF METHOD .............................................................................................................. 3 4.0 ACRONYMS AND DEFINITIONS .................................................................................................. 3 5.0 HEALTH AND SAFETY ................................................................................................................. 4 6.0 CAUTIONS .................................................................................................................................... 4 7.0 INTERFERENCES ........................................................................................................................ 4 8.0 PERSONNEL QUALIFICATIONS .................................................................................................. 4 9.0 EQUIPMENT ................................................................................................................................. 5 10.0 STANDARDS AND REAGENTS ................................................................................................... 5 11.0 PROCEDURES ............................................................................................................................. 5
11.1 Preparation ....................................................................................................................... 5 11.2 Sample Collection ............................................................................................................. 6
11.2.1 Surface Soil Samples ......................................................................................... 6 11.2.2 Sampling at Depth with Augers and Thin Wall Tube Samplers ........................... 7 11.2.3 Sampling at Depth with a Trier ............................................................................ 8 11.2.4 Sampling at Depth with a Split Spoon (Barrel) Sampler ...................................... 9
11.3 Sample Sieving ................................................................................................................. 9 12.0 DATA RECORDS AND MANAGEMENT ..................................................................................... 10 13.0 QUALITY CONTROL AND ASSURANCE ................................................................................... 11 14.0 REFERENCES ............................................................................................................................ 11 Appendix A: Soil Sampling Equipment Appendix B: Auger and Trier Diagrams Appendix C: Hand Auger Operating Instructions
Standard Operating Procedures Document No.: FLD-05.00 TechLaw, Inc. Revision No.:0 ESAT Region 8 Revision Date: N/A Contract No.: EP-W-06-033 Page 3 of 11
Effective Date: 03/30/2012 Replaces SOP: N/A 1.0 PURPOSE
The purpose of this standard operating procedure (SOP) is to provide a guideline for the collection of representative soil samples in the field. The collection and analysis of soil samples serves to establish whether pollutants are present in the soils and helps determine the required action level(s) with regard to public and environmental health and welfare. 2.0 SCOPE AND APPLICATION
These are standard operating procedures which may be varied or changed as required, dependent upon site conditions, equipment limitations or limitations imposed by the procedure. In all instances, the ultimate procedures employed should be documented and included with the final report. Mention of trade names or commercial products does not constitute Techlaw, inc. endorsement or recommendation for use. 3.0 SUMMARY OF METHOD
Soil samples may be collected using a variety of methods and equipment. The methods and equipment used are dependent on the depth of the desired sample, the type of sample required (disturbed vs. undisturbed), and the soil type. Near-surface soils may be easily sampled using a spade, trowel, and scoop. Sampling at greater depths may be performed using a hand auger, continuous flight auger, a trier, a split-spoon, or a backhoe if necessary. 4.0 ACRONYMS AND DEFINITIONS
COC Chain of Custody
GPS Global Positioning System HASP Health and Safety Plan HAZWOPER Hazardous Waste Operations and Emergency Response OSHA Occupation Safety and Health Administration QA Quality Assurance QAPP Quality Assurance Project Plan SAP Sampling and Analysis Plan SOP Standard Operating Procedure EPA United States Environmental Protection Agency ESAT Environmental Services Assistance Team
Chain of Custody (COC) – A chronological document that tracks transfer of samples between entities from collection to disposal Composite Sampling – Sampling from several points or intervals and consolidating them into a larger sample Discrete Sampling - Sampling from a single location Health and Safety Plan (HASP) – A site-specific plan that outlines potential hazards and procedural/equipment recommendations
Standard Operating Procedures Document No.: FLD-05.00 TechLaw, Inc. Revision No.:0 ESAT Region 8 Revision Date: N/A Contract No.: EP-W-06-033 Page 4 of 11
Effective Date: 03/30/2012 Replaces SOP: N/A
Standard Operating Procedure (SOP) - A set of written instructions that document a routine or repetitive activity followed by an organization (EPA, 2007)
5.0 HEALTH AND SAFETY
When working with potentially hazardous materials or in hazardous situations, personnel must understand and comply with the site-specific Sampling and Analysis Plan and Quality Assurance Project Plan (SAP/QAPP) and Health and Safety Plan (HASP) before the sampling event begins. More specifically, when sampling waste rock piles or fluvial deposit zones containing known or suspected hazardous substances, adequate personal protective equipment such as nitrile gloves, safety glasses, and protective footwear are necessary to prevent exposure. When traversing tailings piles, hazardous situations exist that require the sampling personnel to wear adequate safety equipment including gloves and non-slip footwear. Never perform sampling activities if it cannot be done so in a safe manner (tailing piles are too steep, lightning is occurring, etc). 6.0 CAUTIONS
There are cautions to be considered before deployment on a soil sampling event. If the samples are to be collected in an urban area at depth, the underground utility lines must be identified. In addition, if sampling at a remote waste rock pile, always use the buddy system when traversing steep gradients that may present fall hazards. Always review the site-specific HASP for potential safety hazards. 7.0 INTERFERENCES
There are two primary interferences or potential problems associated with soil sampling. These include cross-contamination of samples and improper sample collection. Cross-contamination problems can be eliminated or minimized through the use of dedicated sampling equipment. If this is not possible or practical, then decontamination of sampling equipment is necessary. Improper sample collection can involve disturbance of the matrix (i.e. walking on specific areas that will ultimately be sampled) resulting in compaction of the sample or inadequate homogenization of the samples where required, resulting in variable, non-representative results. 8.0 PERSONNEL QUALIFICATIONS
Any personnel involved with field sampling activities must be cleared for health and safety. Clearance includes medical monitoring, respirator fit testing, and Occupational Safety and Health Administration (OSHA) Hazardous Waste Operations and Emergency Response (HAZWOPER) 40-hour training. Personnel who will be collecting soil samples should familiarize themselves with this and other pertinent SOPs such as the Sample Equipment Decontamination SOP FLD 02.00, the Sample Preservation SOP FLD 03.00, the Sample Custody and Labeling SOP FLD 11.00, and the General Field Sampling Protocols SOP FLD 12.00.
Standard Operating Procedures Document No.: FLD-05.00 TechLaw, Inc. Revision No.:0 ESAT Region 8 Revision Date: N/A Contract No.: EP-W-06-033 Page 5 of 11
Effective Date: 03/30/2012 Replaces SOP: N/A 9.0 EQUIPMENT
Equipment needed for collection of soil samples may include:
HASP Gear - Gloves, proper footwear, safety glasses, etc. Mapping and Location Tools – Global Positioning System (GPS) units, site/local area maps, compass, tape measure, survey stakes, pin flags, camera, 2-way radios Documentation Tools – Field log book, field data sheet, COC(s), labels, clear tape, pens, permanent marker, waterproof paper Sampling Tools – Plastic, TeflonTM, or other appropriate composition scoop (analysis dependent), shovel, spade, trowel, measuring cup or graduated cylinder, field scale, bucket auger, post hole auger, homogenization container w/ mixing tool, bucket, rinse bottle, purified water, paper towels Sample Containers – Ziploc™ baggies, glass jars, labels, clear tape, pens, permanent marker, cooler(s), ice, thermometer
See Appendix A for a detailed list of soil sampling equipment. 10.0 STANDARDS AND REAGENTS
Reagents are not used for the preservation of soil samples. Decontamination solutions are specified in the Sampling Equipment Decontamination SOP# FLD-02 and the site-specific work plan. 11.0 PROCEDURES
11.1 Preparation
1. Determine the extent of the sampling effort, the sampling methods to be employed, and the types and amounts of equipment and supplies required.
2. Obtain the necessary sampling and monitoring equipment.
3. Decontaminate or pre-clean equipment, and ensure that it is in working order. 4. Prepare schedules, and coordinate with staff, client, and regulatory agencies where
necessary. It is also important to obtain access agreements if sampling is to occur on private property.
5. Perform a general site survey prior to site entry in accordance with the site-specific HASP. 6. Use stakes, flagging, or buoys to identify and mark all sampling locations followed by a GPS
point (see GPS Trimble® GeoXT 2008 series SOP FLD 07.00). Specific site factors, including extent and nature of contaminant should be considered when selecting sample location. If required, the proposed locations may be adjusted based on site access, property boundaries, and surface obstructions. All staked locations will be utility-cleared by the property owner
Standard Operating Procedures Document No.: FLD-05.00 TechLaw, Inc. Revision No.:0 ESAT Region 8 Revision Date: N/A Contract No.: EP-W-06-033 Page 6 of 11
Effective Date: 03/30/2012 Replaces SOP: N/A
prior to soil sampling. It is the responsibility of the sampler to verify with the property owner that utility lines have been marked. If there is no property owner and there is concern for underground utility lines, it is the responsibility of the samplers to contact the state agency or contractor that can provide a marking service.
11.2 Sample Collection
In general, there are two primary ways to collect a soil sample. Composite sampling involves taking several subsamples from a designated sample location and consolidating into one larger sample. Discrete sampling is defined as taking one sample from a single location. Composite and discrete sampling can be achieved by the sample techniques listed below.
11.2.1 Surface Soil Samples
Collection of samples from near-surface soil can be accomplished with tools such as spades, shovels, trowels, and scoops. Remove surface material to the required depth and use a stainless steel or plastic scoop to collect the sample. This method can be used in most soil types but is limited to sampling near-surface areas. Accurate, representative samples can be collected with this procedure depending on the care and precision demonstrated by the sample team member. A stainless steel scoop, lab spoon, or plastic spoon will suffice in most other applications. The use of a flat, pointed mason trowel to cut a block of the desired soil can be helpful when undisturbed profiles are required. Care should be exercised to avoid use of devices plated with chrome or other materials. Plating is particularly common with garden implements such as potting trowels. There are four depth classes that are typically used in Region 8: 0-2” range, 0-6” range, 6-12” range, and 12-18” range. The 0-2” and 0-6” range can usually be sampled with one of the tools listed above, but the deeper ranges generally require the use of one the tools described in sections 11.2.2 and 11.2.3. The following procedure is used to collect surface soil samples: 1. Carefully remove the top layer of soil or debris to the desired sample depth with a pre-
cleaned spade.
2. Using a pre-cleaned, stainless steel scoop, plastic spoon, or trowel, remove and discard a thin layer of soil from the area which came in contact with the spade.
3. If volatile organic analysis is to be performed, transfer the sample directly into an
appropriate, labeled sample container with a stainless steel lab spoon or equivalent and secure the cap tightly. Place the remainder of the sample into a stainless steel, plastic, or other appropriate homogenization container, and mix thoroughly to obtain a homogenous sample representative of the entire sampling interval. Then, either place the sample into appropriate, labeled containers and secure the caps tightly; or, if composite samples are to be collected, place a sample from another sampling interval or location into the homogenization container and mix thoroughly. When compositing is complete, place the sample into appropriate, labeled containers and secure the
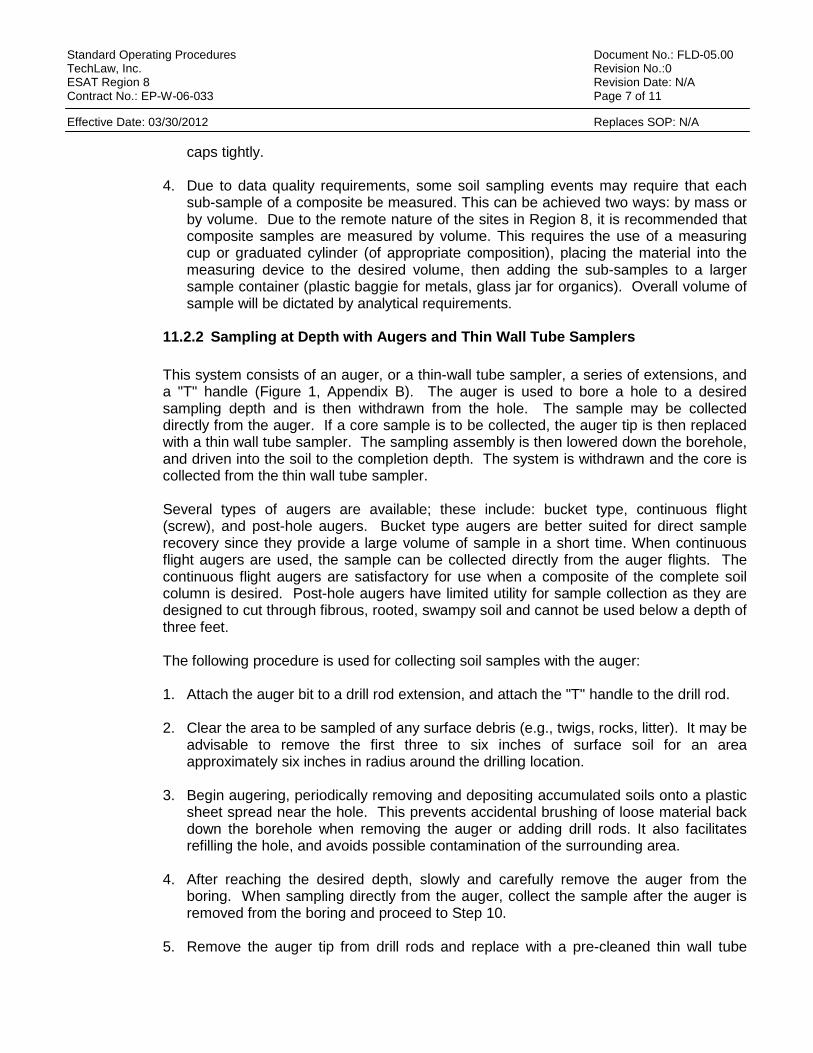
Standard Operating Procedures Document No.: FLD-05.00 TechLaw, Inc. Revision No.:0 ESAT Region 8 Revision Date: N/A Contract No.: EP-W-06-033 Page 7 of 11
Effective Date: 03/30/2012 Replaces SOP: N/A
caps tightly.
4. Due to data quality requirements, some soil sampling events may require that each sub-sample of a composite be measured. This can be achieved two ways: by mass or by volume. Due to the remote nature of the sites in Region 8, it is recommended that composite samples are measured by volume. This requires the use of a measuring cup or graduated cylinder (of appropriate composition), placing the material into the measuring device to the desired volume, then adding the sub-samples to a larger sample container (plastic baggie for metals, glass jar for organics). Overall volume of sample will be dictated by analytical requirements.
11.2.2 Sampling at Depth with Augers and Thin Wall Tube Samplers
This system consists of an auger, or a thin-wall tube sampler, a series of extensions, and a "T" handle (Figure 1, Appendix B). The auger is used to bore a hole to a desired sampling depth and is then withdrawn from the hole. The sample may be collected directly from the auger. If a core sample is to be collected, the auger tip is then replaced with a thin wall tube sampler. The sampling assembly is then lowered down the borehole, and driven into the soil to the completion depth. The system is withdrawn and the core is collected from the thin wall tube sampler. Several types of augers are available; these include: bucket type, continuous flight (screw), and post-hole augers. Bucket type augers are better suited for direct sample recovery since they provide a large volume of sample in a short time. When continuous flight augers are used, the sample can be collected directly from the auger flights. The continuous flight augers are satisfactory for use when a composite of the complete soil column is desired. Post-hole augers have limited utility for sample collection as they are designed to cut through fibrous, rooted, swampy soil and cannot be used below a depth of three feet. The following procedure is used for collecting soil samples with the auger: 1. Attach the auger bit to a drill rod extension, and attach the "T" handle to the drill rod.
2. Clear the area to be sampled of any surface debris (e.g., twigs, rocks, litter). It may be
advisable to remove the first three to six inches of surface soil for an area approximately six inches in radius around the drilling location.
3. Begin augering, periodically removing and depositing accumulated soils onto a plastic
sheet spread near the hole. This prevents accidental brushing of loose material back down the borehole when removing the auger or adding drill rods. It also facilitates refilling the hole, and avoids possible contamination of the surrounding area.
4. After reaching the desired depth, slowly and carefully remove the auger from the
boring. When sampling directly from the auger, collect the sample after the auger is removed from the boring and proceed to Step 10.
5. Remove the auger tip from drill rods and replace with a pre-cleaned thin wall tube
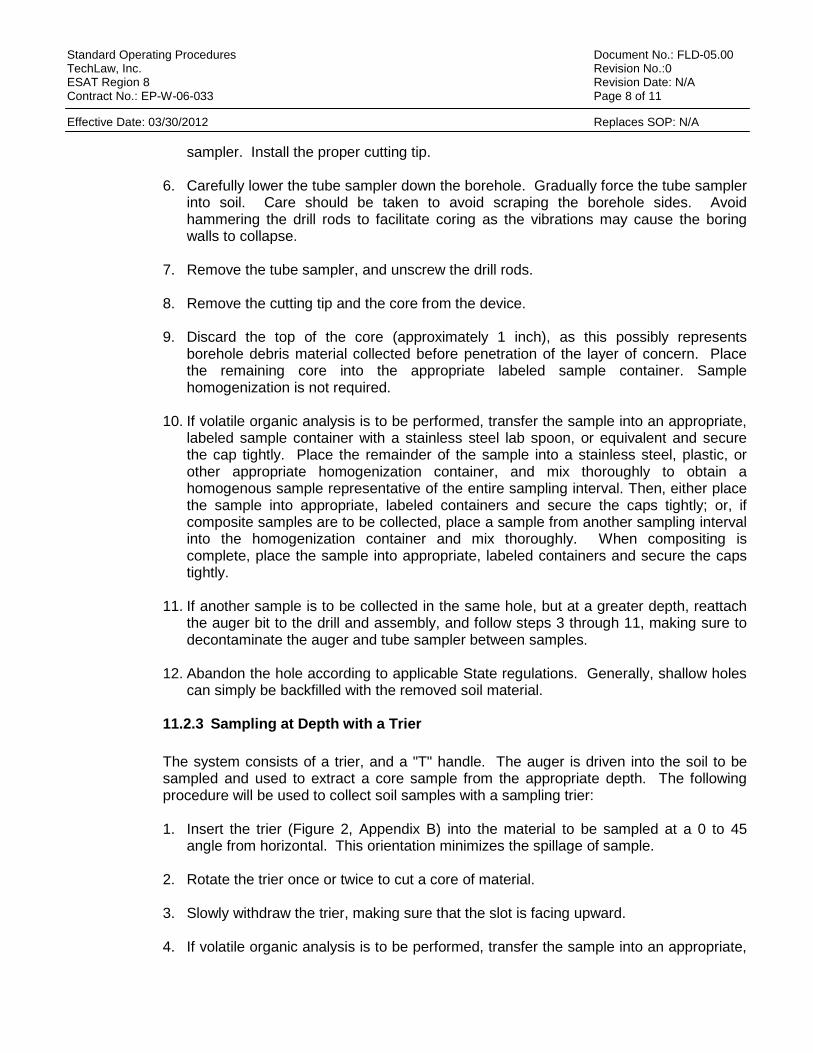
Standard Operating Procedures Document No.: FLD-05.00 TechLaw, Inc. Revision No.:0 ESAT Region 8 Revision Date: N/A Contract No.: EP-W-06-033 Page 8 of 11
Effective Date: 03/30/2012 Replaces SOP: N/A
sampler. Install the proper cutting tip.
6. Carefully lower the tube sampler down the borehole. Gradually force the tube sampler into soil. Care should be taken to avoid scraping the borehole sides. Avoid hammering the drill rods to facilitate coring as the vibrations may cause the boring walls to collapse.
7. Remove the tube sampler, and unscrew the drill rods.
8. Remove the cutting tip and the core from the device.
9. Discard the top of the core (approximately 1 inch), as this possibly represents
borehole debris material collected before penetration of the layer of concern. Place the remaining core into the appropriate labeled sample container. Sample homogenization is not required.
10. If volatile organic analysis is to be performed, transfer the sample into an appropriate, labeled sample container with a stainless steel lab spoon, or equivalent and secure the cap tightly. Place the remainder of the sample into a stainless steel, plastic, or other appropriate homogenization container, and mix thoroughly to obtain a homogenous sample representative of the entire sampling interval. Then, either place the sample into appropriate, labeled containers and secure the caps tightly; or, if composite samples are to be collected, place a sample from another sampling interval into the homogenization container and mix thoroughly. When compositing is complete, place the sample into appropriate, labeled containers and secure the caps tightly.
11. If another sample is to be collected in the same hole, but at a greater depth, reattach the auger bit to the drill and assembly, and follow steps 3 through 11, making sure to decontaminate the auger and tube sampler between samples.
12. Abandon the hole according to applicable State regulations. Generally, shallow holes
can simply be backfilled with the removed soil material.
11.2.3 Sampling at Depth with a Trier
The system consists of a trier, and a "T" handle. The auger is driven into the soil to be sampled and used to extract a core sample from the appropriate depth. The following procedure will be used to collect soil samples with a sampling trier: 1. Insert the trier (Figure 2, Appendix B) into the material to be sampled at a 0 to 45
angle from horizontal. This orientation minimizes the spillage of sample.
2. Rotate the trier once or twice to cut a core of material.
3. Slowly withdraw the trier, making sure that the slot is facing upward.
4. If volatile organic analysis is to be performed, transfer the sample into an appropriate,
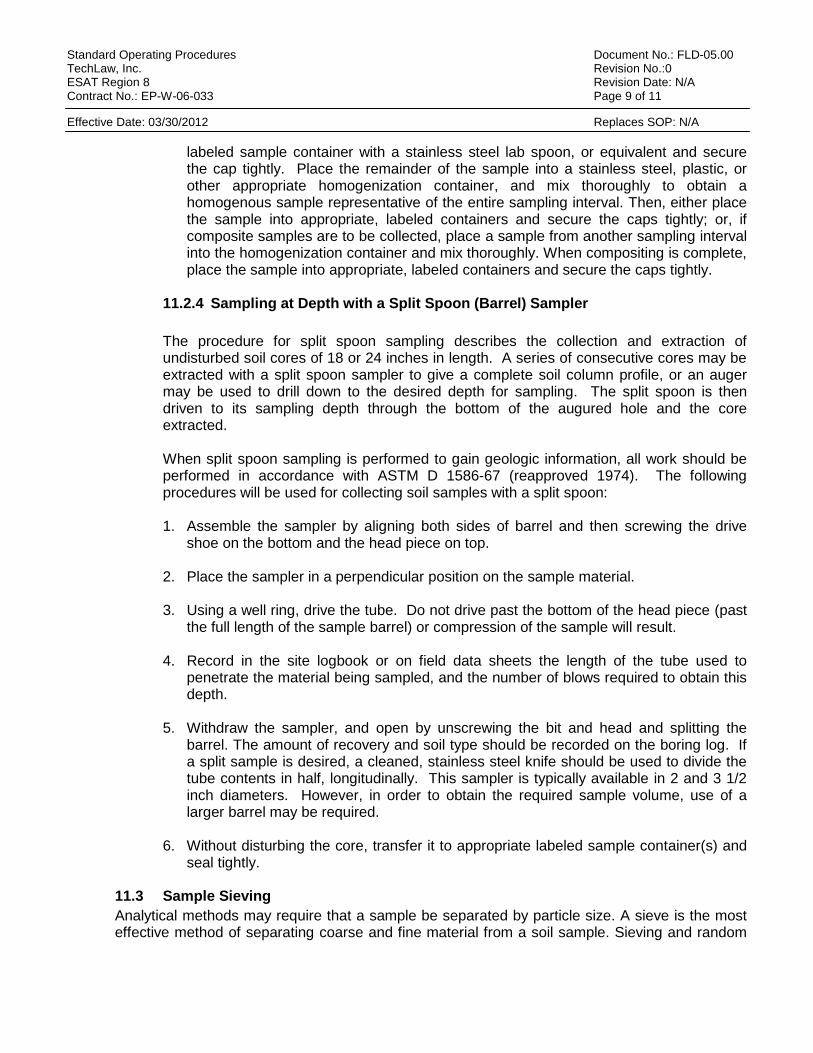
Standard Operating Procedures Document No.: FLD-05.00 TechLaw, Inc. Revision No.:0 ESAT Region 8 Revision Date: N/A Contract No.: EP-W-06-033 Page 9 of 11
Effective Date: 03/30/2012 Replaces SOP: N/A
labeled sample container with a stainless steel lab spoon, or equivalent and secure the cap tightly. Place the remainder of the sample into a stainless steel, plastic, or other appropriate homogenization container, and mix thoroughly to obtain a homogenous sample representative of the entire sampling interval. Then, either place the sample into appropriate, labeled containers and secure the caps tightly; or, if composite samples are to be collected, place a sample from another sampling interval into the homogenization container and mix thoroughly. When compositing is complete, place the sample into appropriate, labeled containers and secure the caps tightly.
11.2.4 Sampling at Depth with a Split Spoon (Barrel) Sampler
The procedure for split spoon sampling describes the collection and extraction of undisturbed soil cores of 18 or 24 inches in length. A series of consecutive cores may be extracted with a split spoon sampler to give a complete soil column profile, or an auger may be used to drill down to the desired depth for sampling. The split spoon is then driven to its sampling depth through the bottom of the augured hole and the core extracted. When split spoon sampling is performed to gain geologic information, all work should be performed in accordance with ASTM D 1586-67 (reapproved 1974). The following procedures will be used for collecting soil samples with a split spoon:
1. Assemble the sampler by aligning both sides of barrel and then screwing the drive
shoe on the bottom and the head piece on top.
2. Place the sampler in a perpendicular position on the sample material.
3. Using a well ring, drive the tube. Do not drive past the bottom of the head piece (past the full length of the sample barrel) or compression of the sample will result.
4. Record in the site logbook or on field data sheets the length of the tube used to
penetrate the material being sampled, and the number of blows required to obtain this depth.
5. Withdraw the sampler, and open by unscrewing the bit and head and splitting the
barrel. The amount of recovery and soil type should be recorded on the boring log. If a split sample is desired, a cleaned, stainless steel knife should be used to divide the tube contents in half, longitudinally. This sampler is typically available in 2 and 3 1/2 inch diameters. However, in order to obtain the required sample volume, use of a larger barrel may be required.
6. Without disturbing the core, transfer it to appropriate labeled sample container(s) and
seal tightly.
11.3 Sample Sieving
Analytical methods may require that a sample be separated by particle size. A sieve is the most effective method of separating coarse and fine material from a soil sample. Sieving and random
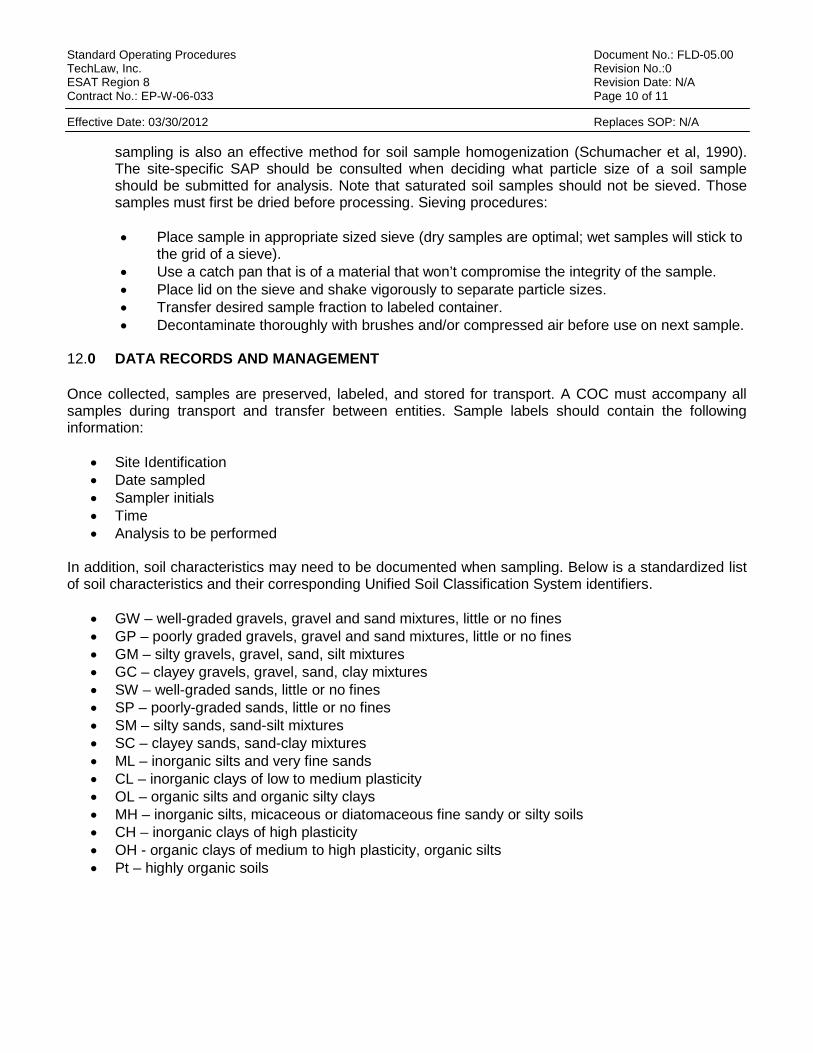
Standard Operating Procedures Document No.: FLD-05.00 TechLaw, Inc. Revision No.:0 ESAT Region 8 Revision Date: N/A Contract No.: EP-W-06-033 Page 10 of 11
Effective Date: 03/30/2012 Replaces SOP: N/A
sampling is also an effective method for soil sample homogenization (Schumacher et al, 1990). The site-specific SAP should be consulted when deciding what particle size of a soil sample should be submitted for analysis. Note that saturated soil samples should not be sieved. Those samples must first be dried before processing. Sieving procedures: • Place sample in appropriate sized sieve (dry samples are optimal; wet samples will stick to the grid of a sieve). • Use a catch pan that is of a material that won’t compromise the integrity of the sample. • Place lid on the sieve and shake vigorously to separate particle sizes. • Transfer desired sample fraction to labeled container. • Decontaminate thoroughly with brushes and/or compressed air before use on next sample.
12.0 DATA RECORDS AND MANAGEMENT
Once collected, samples are preserved, labeled, and stored for transport. A COC must accompany all samples during transport and transfer between entities. Sample labels should contain the following information:
• Site Identification • Date sampled • Sampler initials • Time • Analysis to be performed
In addition, soil characteristics may need to be documented when sampling. Below is a standardized list of soil characteristics and their corresponding Unified Soil Classification System identifiers.
• GW – well-graded gravels, gravel and sand mixtures, little or no fines • GP – poorly graded gravels, gravel and sand mixtures, little or no fines • GM – silty gravels, gravel, sand, silt mixtures • GC – clayey gravels, gravel, sand, clay mixtures • SW – well-graded sands, little or no fines • SP – poorly-graded sands, little or no fines • SM – silty sands, sand-silt mixtures • SC – clayey sands, sand-clay mixtures • ML – inorganic silts and very fine sands • CL – inorganic clays of low to medium plasticity • OL – organic silts and organic silty clays • MH – inorganic silts, micaceous or diatomaceous fine sandy or silty soils • CH – inorganic clays of high plasticity • OH - organic clays of medium to high plasticity, organic silts • Pt – highly organic soils
Standard Operating Procedures Document No.: FLD-05.00 TechLaw, Inc. Revision No.:0 ESAT Region 8 Revision Date: N/A Contract No.: EP-W-06-033 Page 11 of 11
Effective Date: 03/30/2012 Replaces SOP: N/A 13.0 QUALITY CONTROL AND ASSURANCE
There are no specific quality assurance (QA) activities which apply to the implementation of these procedures. However, the following QA procedures apply:
1. All data must be documented on field data sheets or within site logbooks. 2. All instrumentation must be operated in accordance with operating instructions as supplied by the
manufacturer, unless otherwise specified in the work plan. An instruction manual for the operation of the hand auger equipment is provided in Appendix C of this SOP. Equipment checkout and calibration activities must occur prior to sampling/operation, and they must be documented.
3. Always consult the SAP for duplicate sample frequency requirements. 4. Document any deviations from SOP’s, work plan, SAP/QAPP, etc.
14.0 REFERENCES
EPA Guidance for Preparing Standard Operating Procedures, EPA QA/G-6, April 2007. Mason, B.J., Preparation of Soil Sampling Protocol: Technique and Strategies. 1983 EPA-600/4-83-020. Barth, D.S. and B.J. Mason, Soil Sampling Quality Assurance User's Guide. 1984 EPA-600/4-84-043. U.S. EPA. Characterization of Hazardous Waste Sites. A Methods Manual: Volume II. Available Sampling Methods, Second Edition. 1984 EPA-600/4-84-076. de Vera, E.R., B.P. Simmons, R.D. Stephen, and D.L. Storm. Samplers and Sampling Procedures for Hazardous Waste Streams. 1980 EPA-600/2-80-018. ASTM D 1586-67 (reapproved 1974), ASTM Committee on Standards, Philadelphia, PA. U.S. EPA, Environmental Response Team, standard operating procedures—Soil Sampling: U.S. Environmental Protection Agency, 1994, SOP #2012 Shumacher, B.A, Shines, K.C., Burton J.V., and Papp, M.L. (1990) “A Comparison of Soil Sample Homogenization Techniques.”
EPA SOP FLD#-6 Shallow Stream Sediment Sampling
Standard Operating Procedures Document No.: FLD-06.00 TechLaw, Inc. Revision No.: 0 ESAT Region 8 Revision Date: N/A Contract No.: EP-W-06-033 Page 2 of 10
Effective Date: 3/30/2012 Replaces SOP: N/A
TABLE OF CONTENTS 1 .0 PURPOSE ...................................................................................................................................... 3 2.0 SCOPE AND APPLICABILITY ....................................................................................................... 3 3.0 SUMMARY OF METHOD ............................................................................................................... 3 4.0 ACRONYMS AND DEFINITIONS ................................................................................................... 4 5.0 HEALTH AND SAFETY .................................................................................................................. 4 6.0 CAUTIONS ..................................................................................................................................... 5 7.0 INTERFERENCES ......................................................................................................................... 5 8.0 PERSONNEL QUALIFICATIONS ................................................................................................... 5 9.0 EQUIPMENT AND SUPPLIES ....................................................................................................... 5 10.0 STANDARDS AND REAGENTS .................................................................................................... 6 11.0 PROCEDURES .............................................................................................................................. 6
11.1 Sample Preservation, Containers, Handling and Storage .................................................. 6 11.2 Preparation ........................................................................................................................ 6 11.3 Sample Collection .............................................................................................................. 7
11.3.1 Composite Sampling ............................................................................................ 7 11.3.2 Discrete Sampling ................................................................................................ 8
12.0 DATA RECORDS AND MANAGEMENT ........................................................................................ 8 13.0 QUALITY CONTROL AND ASSURANCE ...................................................................................... 8 14.0 REFERENCES ............................................................................................................................... 9 Table 9.0-1: Sediment Sampling Equipment ........................................................................................... 10
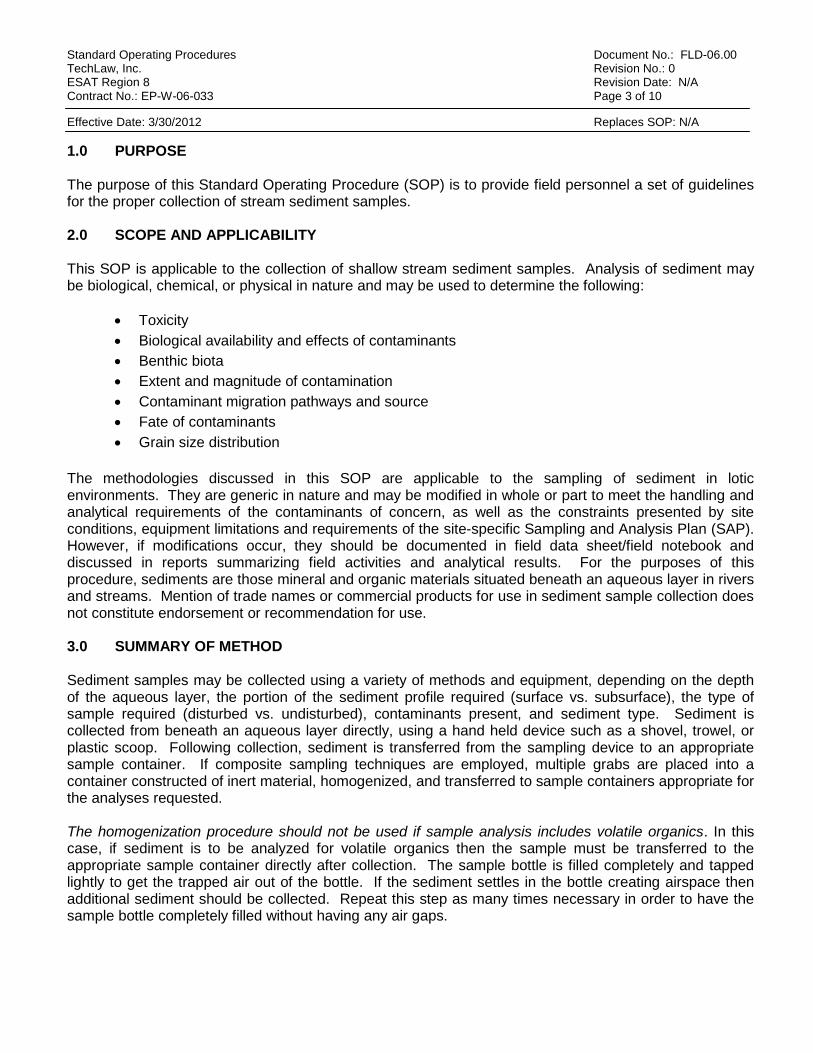
Standard Operating Procedures Document No.: FLD-06.00 TechLaw, Inc. Revision No.: 0 ESAT Region 8 Revision Date: N/A Contract No.: EP-W-06-033 Page 3 of 10
Effective Date: 3/30/2012 Replaces SOP: N/A 1.0 PURPOSE The purpose of this Standard Operating Procedure (SOP) is to provide field personnel a set of guidelines for the proper collection of stream sediment samples. 2.0 SCOPE AND APPLICABILITY This SOP is applicable to the collection of shallow stream sediment samples. Analysis of sediment may be biological, chemical, or physical in nature and may be used to determine the following:
• Toxicity • Biological availability and effects of contaminants • Benthic biota • Extent and magnitude of contamination • Contaminant migration pathways and source • Fate of contaminants • Grain size distribution
The methodologies discussed in this SOP are applicable to the sampling of sediment in lotic environments. They are generic in nature and may be modified in whole or part to meet the handling and analytical requirements of the contaminants of concern, as well as the constraints presented by site conditions, equipment limitations and requirements of the site-specific Sampling and Analysis Plan (SAP). However, if modifications occur, they should be documented in field data sheet/field notebook and discussed in reports summarizing field activities and analytical results. For the purposes of this procedure, sediments are those mineral and organic materials situated beneath an aqueous layer in rivers and streams. Mention of trade names or commercial products for use in sediment sample collection does not constitute endorsement or recommendation for use. 3.0 SUMMARY OF METHOD Sediment samples may be collected using a variety of methods and equipment, depending on the depth of the aqueous layer, the portion of the sediment profile required (surface vs. subsurface), the type of sample required (disturbed vs. undisturbed), contaminants present, and sediment type. Sediment is collected from beneath an aqueous layer directly, using a hand held device such as a shovel, trowel, or plastic scoop. Following collection, sediment is transferred from the sampling device to an appropriate sample container. If composite sampling techniques are employed, multiple grabs are placed into a container constructed of inert material, homogenized, and transferred to sample containers appropriate for the analyses requested. The homogenization procedure should not be used if sample analysis includes volatile organics. In this case, if sediment is to be analyzed for volatile organics then the sample must be transferred to the appropriate sample container directly after collection. The sample bottle is filled completely and tapped lightly to get the trapped air out of the bottle. If the sediment settles in the bottle creating airspace then additional sediment should be collected. Repeat this step as many times necessary in order to have the sample bottle completely filled without having any air gaps.
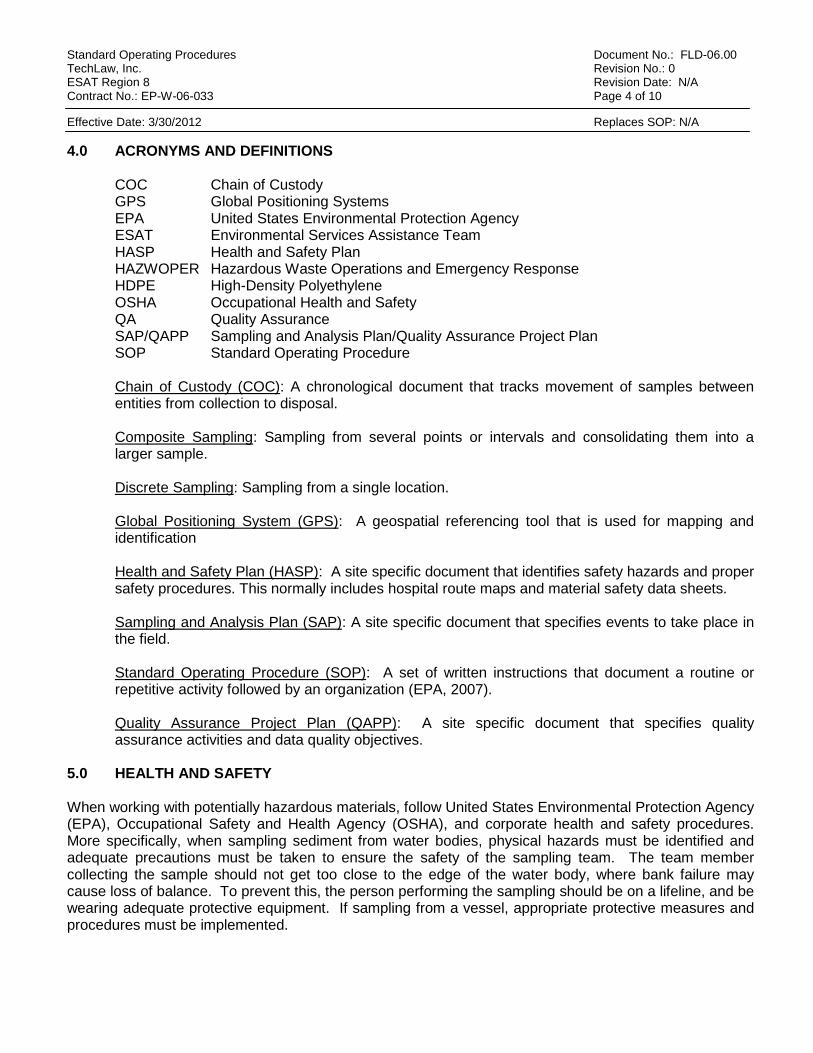
Standard Operating Procedures Document No.: FLD-06.00 TechLaw, Inc. Revision No.: 0 ESAT Region 8 Revision Date: N/A Contract No.: EP-W-06-033 Page 4 of 10
Effective Date: 3/30/2012 Replaces SOP: N/A 4.0 ACRONYMS AND DEFINITIONS COC Chain of Custody GPS Global Positioning Systems EPA United States Environmental Protection Agency ESAT Environmental Services Assistance Team HASP Health and Safety Plan HAZWOPER Hazardous Waste Operations and Emergency Response HDPE High-Density Polyethylene OSHA Occupational Health and Safety QA Quality Assurance SAP/QAPP Sampling and Analysis Plan/Quality Assurance Project Plan SOP Standard Operating Procedure Chain of Custody (COC): A chronological document that tracks movement of samples between entities from collection to disposal. Composite Sampling: Sampling from several points or intervals and consolidating them into a larger sample. Discrete Sampling: Sampling from a single location. Global Positioning System (GPS): A geospatial referencing tool that is used for mapping and
identification Health and Safety Plan (HASP): A site specific document that identifies safety hazards and proper
safety procedures. This normally includes hospital route maps and material safety data sheets. Sampling and Analysis Plan (SAP): A site specific document that specifies events to take place in
the field. Standard Operating Procedure (SOP): A set of written instructions that document a routine or repetitive activity followed by an organization (EPA, 2007). Quality Assurance Project Plan (QAPP): A site specific document that specifies quality assurance activities and data quality objectives. 5.0 HEALTH AND SAFETY When working with potentially hazardous materials, follow United States Environmental Protection Agency (EPA), Occupational Safety and Health Agency (OSHA), and corporate health and safety procedures. More specifically, when sampling sediment from water bodies, physical hazards must be identified and adequate precautions must be taken to ensure the safety of the sampling team. The team member collecting the sample should not get too close to the edge of the water body, where bank failure may cause loss of balance. To prevent this, the person performing the sampling should be on a lifeline, and be wearing adequate protective equipment. If sampling from a vessel, appropriate protective measures and procedures must be implemented.
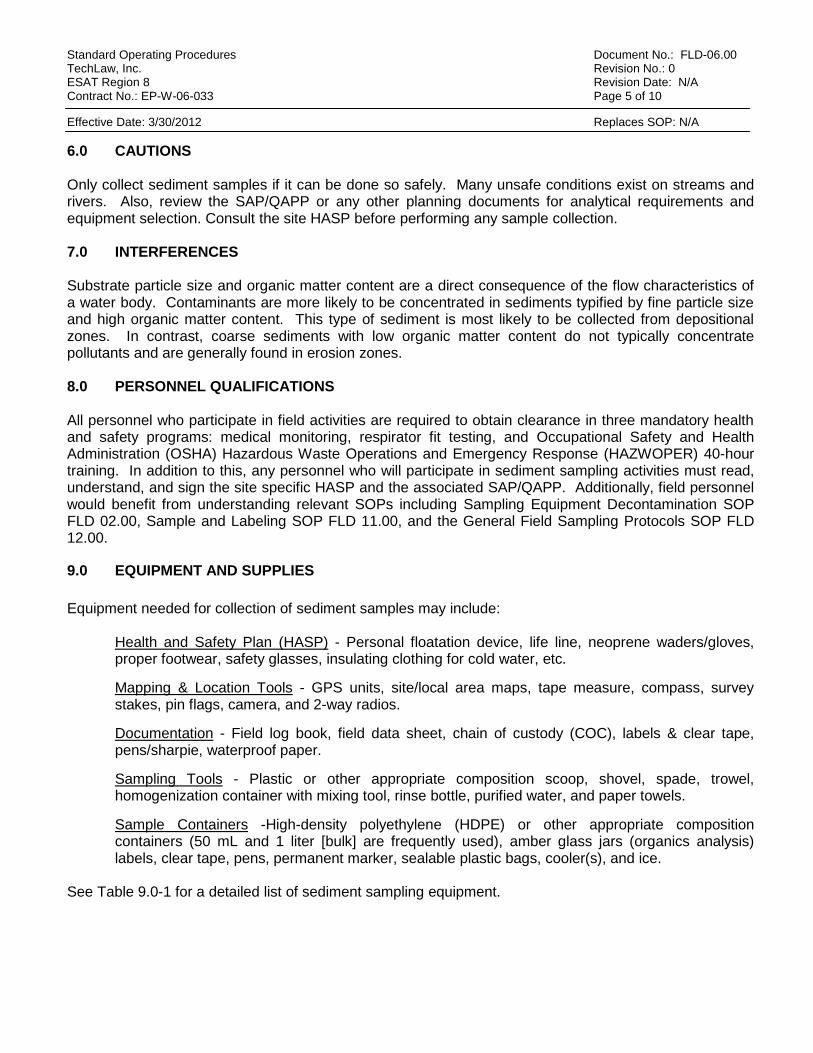
Standard Operating Procedures Document No.: FLD-06.00 TechLaw, Inc. Revision No.: 0 ESAT Region 8 Revision Date: N/A Contract No.: EP-W-06-033 Page 5 of 10
Effective Date: 3/30/2012 Replaces SOP: N/A 6.0 CAUTIONS Only collect sediment samples if it can be done so safely. Many unsafe conditions exist on streams and rivers. Also, review the SAP/QAPP or any other planning documents for analytical requirements and equipment selection. Consult the site HASP before performing any sample collection. 7.0 INTERFERENCES Substrate particle size and organic matter content are a direct consequence of the flow characteristics of a water body. Contaminants are more likely to be concentrated in sediments typified by fine particle size and high organic matter content. This type of sediment is most likely to be collected from depositional zones. In contrast, coarse sediments with low organic matter content do not typically concentrate pollutants and are generally found in erosion zones. 8.0 PERSONNEL QUALIFICATIONS All personnel who participate in field activities are required to obtain clearance in three mandatory health and safety programs: medical monitoring, respirator fit testing, and Occupational Safety and Health Administration (OSHA) Hazardous Waste Operations and Emergency Response (HAZWOPER) 40-hour training. In addition to this, any personnel who will participate in sediment sampling activities must read, understand, and sign the site specific HASP and the associated SAP/QAPP. Additionally, field personnel would benefit from understanding relevant SOPs including Sampling Equipment Decontamination SOP FLD 02.00, Sample and Labeling SOP FLD 11.00, and the General Field Sampling Protocols SOP FLD 12.00.
9.0 EQUIPMENT AND SUPPLIES
Equipment needed for collection of sediment samples may include:
Health and Safety Plan (HASP) - Personal floatation device, life line, neoprene waders/gloves, proper footwear, safety glasses, insulating clothing for cold water, etc. Mapping & Location Tools - GPS units, site/local area maps, tape measure, compass, survey stakes, pin flags, camera, and 2-way radios. Documentation - Field log book, field data sheet, chain of custody (COC), labels & clear tape, pens/sharpie, waterproof paper. Sampling Tools - Plastic or other appropriate composition scoop, shovel, spade, trowel, homogenization container with mixing tool, rinse bottle, purified water, and paper towels. Sample Containers -High-density polyethylene (HDPE) or other appropriate composition containers (50 mL and 1 liter [bulk] are frequently used), amber glass jars (organics analysis) labels, clear tape, pens, permanent marker, sealable plastic bags, cooler(s), and ice.
See Table 9.0-1 for a detailed list of sediment sampling equipment.
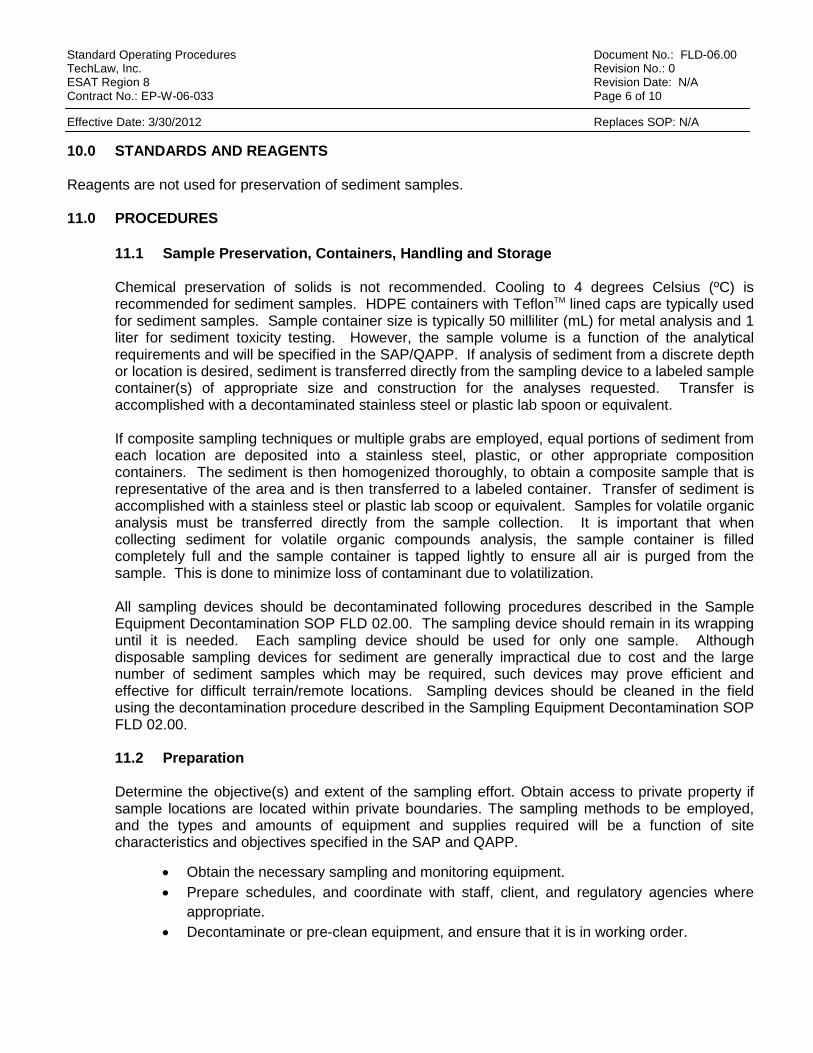
Standard Operating Procedures Document No.: FLD-06.00 TechLaw, Inc. Revision No.: 0 ESAT Region 8 Revision Date: N/A Contract No.: EP-W-06-033 Page 6 of 10
Effective Date: 3/30/2012 Replaces SOP: N/A 10.0 STANDARDS AND REAGENTS Reagents are not used for preservation of sediment samples. 11.0 PROCEDURES
11.1 Sample Preservation, Containers, Handling and Storage
Chemical preservation of solids is not recommended. Cooling to 4 degrees Celsius (ºC) is recommended for sediment samples. HDPE containers with TeflonTM lined caps are typically used for sediment samples. Sample container size is typically 50 milliliter (mL) for metal analysis and 1 liter for sediment toxicity testing. However, the sample volume is a function of the analytical requirements and will be specified in the SAP/QAPP. If analysis of sediment from a discrete depth or location is desired, sediment is transferred directly from the sampling device to a labeled sample container(s) of appropriate size and construction for the analyses requested. Transfer is accomplished with a decontaminated stainless steel or plastic lab spoon or equivalent.
If composite sampling techniques or multiple grabs are employed, equal portions of sediment from each location are deposited into a stainless steel, plastic, or other appropriate composition containers. The sediment is then homogenized thoroughly, to obtain a composite sample that is representative of the area and is then transferred to a labeled container. Transfer of sediment is accomplished with a stainless steel or plastic lab scoop or equivalent. Samples for volatile organic analysis must be transferred directly from the sample collection. It is important that when collecting sediment for volatile organic compounds analysis, the sample container is filled completely full and the sample container is tapped lightly to ensure all air is purged from the sample. This is done to minimize loss of contaminant due to volatilization.
All sampling devices should be decontaminated following procedures described in the Sample Equipment Decontamination SOP FLD 02.00. The sampling device should remain in its wrapping until it is needed. Each sampling device should be used for only one sample. Although disposable sampling devices for sediment are generally impractical due to cost and the large number of sediment samples which may be required, such devices may prove efficient and effective for difficult terrain/remote locations. Sampling devices should be cleaned in the field using the decontamination procedure described in the Sampling Equipment Decontamination SOP FLD 02.00.
11.2 Preparation
Determine the objective(s) and extent of the sampling effort. Obtain access to private property if sample locations are located within private boundaries. The sampling methods to be employed, and the types and amounts of equipment and supplies required will be a function of site characteristics and objectives specified in the SAP and QAPP.
• Obtain the necessary sampling and monitoring equipment. • Prepare schedules, and coordinate with staff, client, and regulatory agencies where
appropriate. • Decontaminate or pre-clean equipment, and ensure that it is in working order.
Standard Operating Procedures Document No.: FLD-06.00 TechLaw, Inc. Revision No.: 0 ESAT Region 8 Revision Date: N/A Contract No.: EP-W-06-033 Page 7 of 10
Effective Date: 3/30/2012 Replaces SOP: N/A
• Perform a general site survey prior to site entry in accordance with the site-specific HASP.
• Use stakes, flagging, or buoys in addition to using a GPS (Refer to SOP FLD 07.00) to identify and mark all sampling locations. Specific site factors including flow regime, basin morphology, sediment characteristics, depth of overlying aqueous layer, contaminant source, and extent and nature of contamination should be considered when selecting sample locations. If required, the proposed locations may be adjusted based on site access, property boundaries, and surface obstructions.
11.3 Sample Collection
Selection of a sampling device is most often contingent upon the depth of water at the sampling location and the physical characteristics of the sediment to be sampled. The following procedure consists of sampling surface sediment with a scoop, trowel or shovel from beneath a shallow aqueous layer:
For the purpose of this method, surface sediment is considered to range from 0 to 1 inch in depth and a shallow aqueous layer is considered to range from 0 to 12 inches in depth. Collection of surface sediment from beneath a shallow aqueous layer can be accomplished with tools such as spades, shovels, trowels, and scoops. Although this method can be used to collect both unconsolidated/consolidated sediment, it is limited somewhat by the depth and movement of the aqueous layer. Deep and rapidly flowing water may render this method less accurate than other methods such as utilizing a handheld dredge or coring device. However, representative samples can be collected with this procedure in shallow sluggish water provided care is demonstrated by the sample team lead. A plastic scoop will suffice in most applications. Care should be exercised to avoid the use of devices plated with chrome or other materials.
The following procedure will be used to collect sediment with a scoop, shovel, or trowel:
1. Using a decontaminated sampling implement, collect the desired thickness and volume
of sediment from the sampling area.
2. Transfer the sample into an appropriate sample or homogenization container. Ensure that non-dedicated containers have been adequately decontaminated.
3. Surface water should be decanted from the sample or homogenization container prior
to sealing or transfer; care should be taken to retain the fine sediment fraction during this procedure.
11.3.1 Composite Sampling
Composite sampling consists of taking several sub-samples from a location and consolidating them into a larger sample. If data quality objectives dictate that each sub-sample of a composite be measured, it can be done two ways; by mass or by volume. For remote site field sampling activities (such as ones that typically occur in Region 8), it is
Standard Operating Procedures Document No.: FLD-06.00 TechLaw, Inc. Revision No.: 0 ESAT Region 8 Revision Date: N/A Contract No.: EP-W-06-033 Page 8 of 10
Effective Date: 3/30/2012 Replaces SOP: N/A
recommended that sub-samples be measured by volume. This can be done with a graduated beaker/measuring cup or cylinder. Place the sub-sample in the measuring device, record the measurement, and transfer the sub-sample into a larger container where the complete composite sample will be processed.
Composite representative sample collection can also be accomplished without measurement of sub-samples. For sediment collection that does not require sub-sample measurement, larger amounts of sample can be collected in areas where sediment is more readily available. This method is used very frequently in high-gradient streams such as those found in the region. 11.3.2 Discrete Sampling
Discrete sampling consists of taking a sample from a single location. This method requires that the selected location for a sediment sample have sufficient amount of material for the analytical requirements. In general, sediment samples in a stream are difficult to obtain from a single location; therefore composite samples are more commonly collected.
12.0 DATA RECORDS AND MANAGEMENT Once collected, samples are labeled and stored for transport (at 4°C). A COC must accompany all samples during transport and transfer between entities. Sample labels should contain the following information:
• Site Identification • Date sampled • Sampler initials • Time • Analysis to be performed
13.0 QUALITY CONTROL AND ASSURANCE There are no specific quality assurance (QA) activities which apply to the implementation of these procedures. However, the following QA procedures apply:
1. All data must be documented on field data sheets or within site logbooks. 2. All instrumentation must be operated in accordance with operating instructions as supplied by
the manufacturer, unless otherwise specified in the SAP and QAPP. Equipment inspection must occur prior to sampling, and they must be documented.
3. QA samples should be sampled at a standardized frequency. Field duplicates are generally
sampled at a rate of 1:20.
Standard Operating Procedures Document No.: FLD-06.00 TechLaw, Inc. Revision No.: 0 ESAT Region 8 Revision Date: N/A Contract No.: EP-W-06-033 Page 9 of 10
Effective Date: 3/30/2012 Replaces SOP: N/A 14.0 REFERENCES
EPA Guidance for Preparing Standard Operating Procedures, EPA QA/G-6, April 2007. Mason, B.J., Preparation of Soil Sampling Protocol: Technique and Strategies. 1983 EPA-600/4-83-020. Barth, D.S. and B.J. Mason, Soil Sampling Quality Assurance User's Guide. 1984 EPA-600/4-84-043. U.S. EPA. Characterization of Hazardous Waste Sites - A Methods Manual: Volume II. Available Sampling Methods, Second Edition. 1984 EPA600/4-84-076. de Vera, E.R., B.P. Simmons, R.D. Stephen, and D.L. Storm. Samplers and Sampling Procedures for Hazardous Waste Streams. 1980 EPA-600/2-80-018. U.S. EPA, Environmental Response Team, standard operating procedures—Sediment Sampling: U.S. Environmental Protection Agency, 1994, SOP #2016.
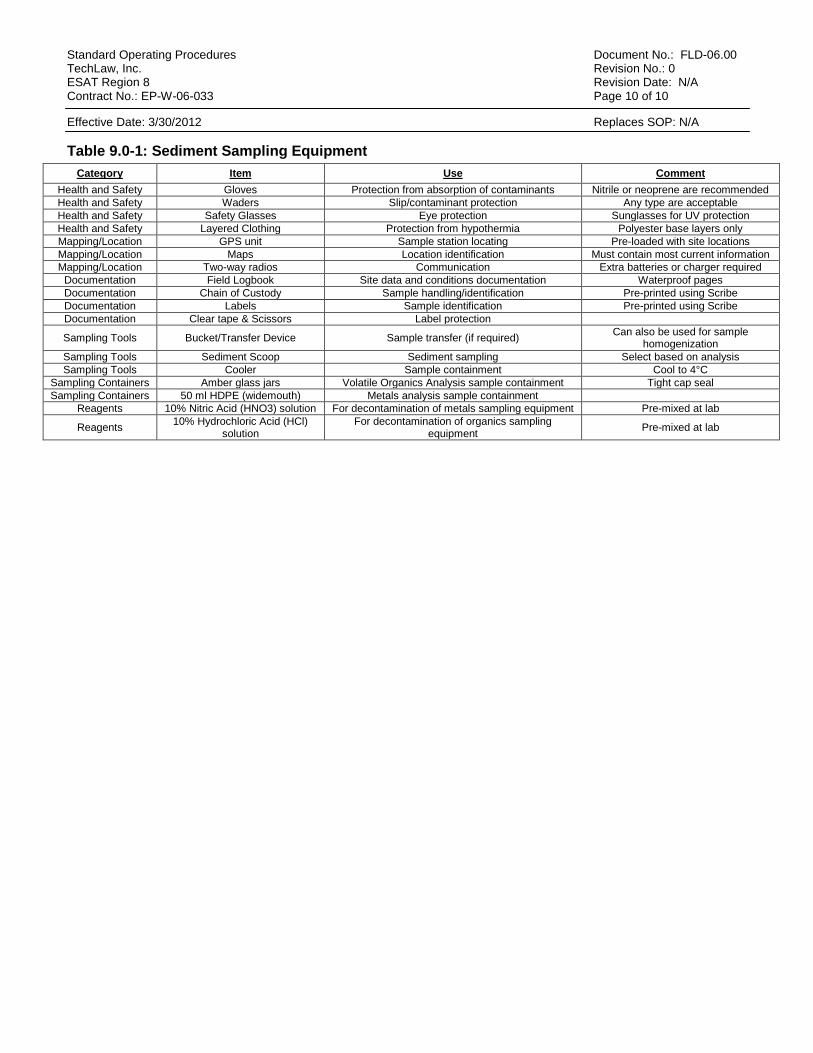
Standard Operating Procedures Document No.: FLD-06.00 TechLaw, Inc. Revision No.: 0 ESAT Region 8 Revision Date: N/A Contract No.: EP-W-06-033 Page 10 of 10
Effective Date: 3/30/2012 Replaces SOP: N/A Table 9.0-1: Sediment Sampling Equipment
Category Item Use Comment
Health and Safety Gloves Protection from absorption of contaminants Nitrile or neoprene are recommended Health and Safety Waders Slip/contaminant protection Any type are acceptable Health and Safety Safety Glasses Eye protection Sunglasses for UV protection Health and Safety Layered Clothing Protection from hypothermia Polyester base layers only Mapping/Location GPS unit Sample station locating Pre-loaded with site locations Mapping/Location Maps Location identification Must contain most current information Mapping/Location Two-way radios Communication Extra batteries or charger required
Documentation Field Logbook Site data and conditions documentation Waterproof pages Documentation Chain of Custody Sample handling/identification Pre-printed using Scribe Documentation Labels Sample identification Pre-printed using Scribe Documentation Clear tape & Scissors Label protection
Sampling Tools Bucket/Transfer Device Sample transfer (if required) Can also be used for sample homogenization
Sampling Tools Sediment Scoop Sediment sampling Select based on analysis Sampling Tools Cooler Sample containment Cool to 4°C
Sampling Containers Amber glass jars Volatile Organics Analysis sample containment Tight cap seal Sampling Containers 50 ml HDPE (widemouth) Metals analysis sample containment
Reagents 10% Nitric Acid (HNO3) solution For decontamination of metals sampling equipment Pre-mixed at lab
Reagents 10% Hydrochloric Acid (HCl) solution
For decontamination of organics sampling equipment Pre-mixed at lab
EPA SOP FLD#-10 Pore Water Sampling
Standard Operating Procedures Document No.: FLD-10.00 TechLaw, Inc. Revision No.: 0 ESAT Region 8 Revision Date: N/A Contract No.: EP-W-06-033 Page 2 of 14
Effective Date: 3/30/2012 Replaces SOP: N/A
TABLE OF CONTENTS 1.0 PURPOSE ..................................................................................................................................... 3 2.0 SCOPE AND APPLICABILITY ...................................................................................................... 3 3.0 SUMMARY OF METHOD .............................................................................................................. 3 4.0 ACRONYMS AND DEFINITIONS .................................................................................................. 3 5.0 HEALTH AND SAFETY ................................................................................................................. 4 6.0 SAMPLE MANAGEMENT ............................................................................................................. 4 7.0 INTERFERENCES ........................................................................................................................ 4
7.1 Potential Volatile Organic Analysis (VOA) Sampling Interferences .................................... 4 7.2 Potential Dissolved Metals or Dissolved Organic Compound Sampling Interferences ....... 5 7.3 Special Precautions for Trace Contaminant Pore Water Sampling .................................... 5
8.0 PERSONNEL QUALIFICATIONS .................................................................................................. 6 9.0 EQUIPMENT AND SUPPLIES ...................................................................................................... 6 10.0 STANDARDS AND REAGENTS ................................................................................................... 6 11.0 PROCEDURES ............................................................................................................................. 7
11.1 PushPoint® Sampler Basic Operation .............................................................................. 7 11.2 Peristaltic Pump/Vacuum Jug Collection ........................................................................... 8 11.3 Syringe ............................................................................................................................. 8 11.4 Sample Handling and Preservation Requirements ............................................................ 8
12.0 DATA RECORDS AND MANAGEMENT ....................................................................................... 9 13.0 QUALITY CONTROL AND ASSURANCE ..................................................................................... 9 14.0 REFERENCES ............................................................................................................................ 10 15.0 FIGURES .................................................................................................................................... 10
Figure 1 - Pore Water PushPoint® .............................................................................................. 11 Figure 2 - PushPoint® deployed with a Sampling Platform .......................................................... 12 Figure 3 - PushPoint® Being Deployed into the Sediment ........................................................... 13 Figure 4 - PushPoint® deployed with a Sampling Platform using a Peristaltic Pump to Sample .. 14
Standard Operating Procedures Document No.: FLD-10.00 TechLaw, Inc. Revision No.: 0 ESAT Region 8 Revision Date: N/A Contract No.: EP-W-06-033 Page 3 of 14
Effective Date: 3/30/2012 Replaces SOP: N/A 1.0 PURPOSE The purpose of this Standard Operating Procedure (SOP) is to describe the procedures, methods, and considerations to be used when obtaining a pore water sample using PushPoint® samplers. 2.0 SCOPE AND APPLICABILITY This document describes procedures for pore water sampling using PushPoint® samplers and is based on the Operators Manual and Applications Guide provided by MHE Products (Ver. 2.01,2/15). It is intended to be used by field personnel when collecting and handling samples in the field. All deviations from this SOP must be noted in the site-dedicated field logbook. 3.0 SUMMARY OF METHOD Sediment pore water is collected using a pore water extractor, called a PushPoint® (Figure 1) which is made out of stainless steel tubing developed by MHE Products. The sampling end of the PushPoint® is inserted into the sediment to the desired depth, and pore water is extracted using a syringe or peristaltic pump. 4.0 ACRONYMS AND DEFINITIONS COC Chain of Custody DOC Dissolved Organic Compounds DOT United States Department of Transportation DQO Data Quality Objective EPA United States Environmental Protection Agency ESAT Environmental Services Assistance Team HASP Health and Safety Plan HAZWOPER Hazardous Waste Operations and Emergency Response IATA International Air Transportation Association OSHA Occupational Safety and Health Administration QA/QC Quality Assurance/Quality Control QAPP Quality Assurance Project Plan SAP Sampling and Analysis Plan SOP Standard Operating Procedure SVOC Semi-Volatile Organic Compound VOA Volatile Organic Analysis VOC Volatile Organic Compound
Health and Safety Plan (HASP): A site-specific document outlining potential safety hazards and hazard mitigation techniques. Occupational Safety and Health Administration (OSHA): An agency that regulates health and safety standards in the United States. Standard Operating Procedure (SOP): A set of written instructions that document a routine or repetitive activity followed by an organization (EPA, 2007).
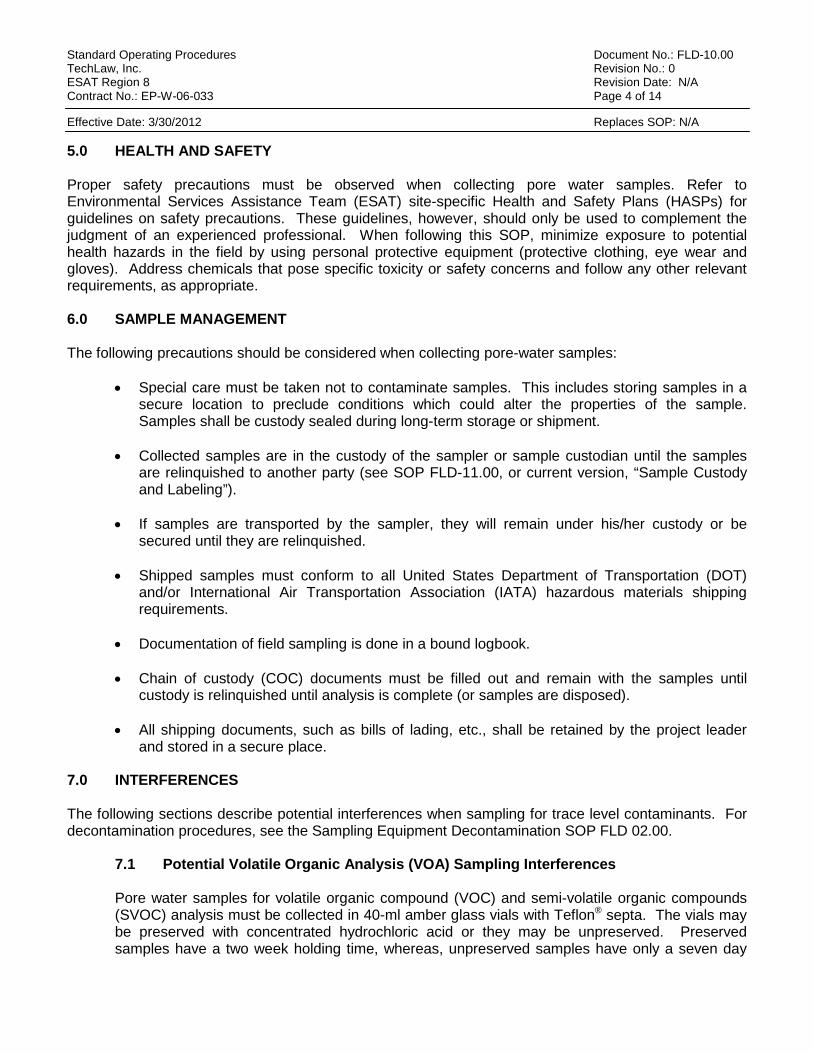
Standard Operating Procedures Document No.: FLD-10.00 TechLaw, Inc. Revision No.: 0 ESAT Region 8 Revision Date: N/A Contract No.: EP-W-06-033 Page 4 of 14
Effective Date: 3/30/2012 Replaces SOP: N/A 5.0 HEALTH AND SAFETY Proper safety precautions must be observed when collecting pore water samples. Refer to Environmental Services Assistance Team (ESAT) site-specific Health and Safety Plans (HASPs) for guidelines on safety precautions. These guidelines, however, should only be used to complement the judgment of an experienced professional. When following this SOP, minimize exposure to potential health hazards in the field by using personal protective equipment (protective clothing, eye wear and gloves). Address chemicals that pose specific toxicity or safety concerns and follow any other relevant requirements, as appropriate. 6.0 SAMPLE MANAGEMENT The following precautions should be considered when collecting pore-water samples:
• Special care must be taken not to contaminate samples. This includes storing samples in a secure location to preclude conditions which could alter the properties of the sample. Samples shall be custody sealed during long-term storage or shipment.
• Collected samples are in the custody of the sampler or sample custodian until the samples
are relinquished to another party (see SOP FLD-11.00, or current version, “Sample Custody and Labeling”).
• If samples are transported by the sampler, they will remain under his/her custody or be
secured until they are relinquished. • Shipped samples must conform to all United States Department of Transportation (DOT)
and/or International Air Transportation Association (IATA) hazardous materials shipping requirements.
• Documentation of field sampling is done in a bound logbook. • Chain of custody (COC) documents must be filled out and remain with the samples until
custody is relinquished until analysis is complete (or samples are disposed). • All shipping documents, such as bills of lading, etc., shall be retained by the project leader
and stored in a secure place.
7.0 INTERFERENCES The following sections describe potential interferences when sampling for trace level contaminants. For decontamination procedures, see the Sampling Equipment Decontamination SOP FLD 02.00.
7.1 Potential Volatile Organic Analysis (VOA) Sampling Interferences
Pore water samples for volatile organic compound (VOC) and semi-volatile organic compounds (SVOC) analysis must be collected in 40-ml amber glass vials with Teflon® septa. The vials may be preserved with concentrated hydrochloric acid or they may be unpreserved. Preserved samples have a two week holding time, whereas, unpreserved samples have only a seven day
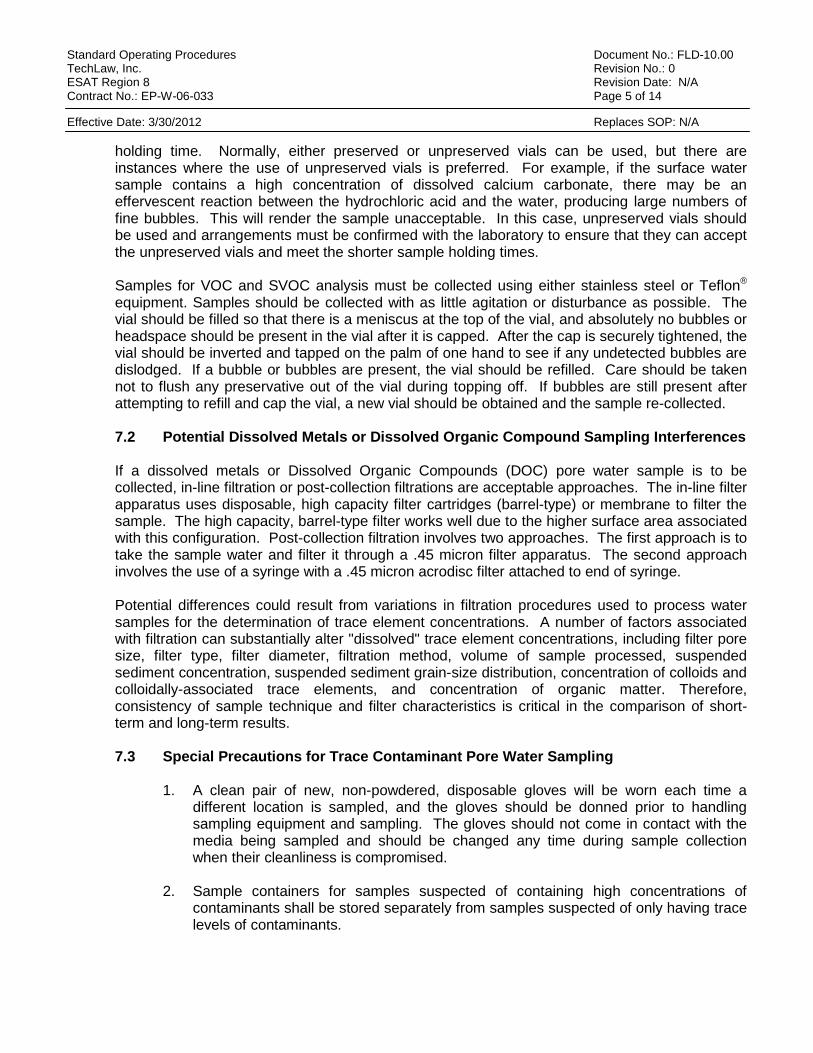
Standard Operating Procedures Document No.: FLD-10.00 TechLaw, Inc. Revision No.: 0 ESAT Region 8 Revision Date: N/A Contract No.: EP-W-06-033 Page 5 of 14
Effective Date: 3/30/2012 Replaces SOP: N/A
holding time. Normally, either preserved or unpreserved vials can be used, but there are instances where the use of unpreserved vials is preferred. For example, if the surface water sample contains a high concentration of dissolved calcium carbonate, there may be an effervescent reaction between the hydrochloric acid and the water, producing large numbers of fine bubbles. This will render the sample unacceptable. In this case, unpreserved vials should be used and arrangements must be confirmed with the laboratory to ensure that they can accept the unpreserved vials and meet the shorter sample holding times.
Samples for VOC and SVOC analysis must be collected using either stainless steel or Teflon® equipment. Samples should be collected with as little agitation or disturbance as possible. The vial should be filled so that there is a meniscus at the top of the vial, and absolutely no bubbles or headspace should be present in the vial after it is capped. After the cap is securely tightened, the vial should be inverted and tapped on the palm of one hand to see if any undetected bubbles are dislodged. If a bubble or bubbles are present, the vial should be refilled. Care should be taken not to flush any preservative out of the vial during topping off. If bubbles are still present after attempting to refill and cap the vial, a new vial should be obtained and the sample re-collected.
7.2 Potential Dissolved Metals or Dissolved Organic Compound Sampling Interferences
If a dissolved metals or Dissolved Organic Compounds (DOC) pore water sample is to be collected, in-line filtration or post-collection filtrations are acceptable approaches. The in-line filter apparatus uses disposable, high capacity filter cartridges (barrel-type) or membrane to filter the sample. The high capacity, barrel-type filter works well due to the higher surface area associated with this configuration. Post-collection filtration involves two approaches. The first approach is to take the sample water and filter it through a .45 micron filter apparatus. The second approach involves the use of a syringe with a .45 micron acrodisc filter attached to end of syringe.
Potential differences could result from variations in filtration procedures used to process water samples for the determination of trace element concentrations. A number of factors associated with filtration can substantially alter "dissolved" trace element concentrations, including filter pore size, filter type, filter diameter, filtration method, volume of sample processed, suspended sediment concentration, suspended sediment grain-size distribution, concentration of colloids and colloidally-associated trace elements, and concentration of organic matter. Therefore, consistency of sample technique and filter characteristics is critical in the comparison of short-term and long-term results.
7.3 Special Precautions for Trace Contaminant Pore Water Sampling
1. A clean pair of new, non-powdered, disposable gloves will be worn each time a
different location is sampled, and the gloves should be donned prior to handling sampling equipment and sampling. The gloves should not come in contact with the media being sampled and should be changed any time during sample collection when their cleanliness is compromised.
2. Sample containers for samples suspected of containing high concentrations of
contaminants shall be stored separately from samples suspected of only having trace levels of contaminants.
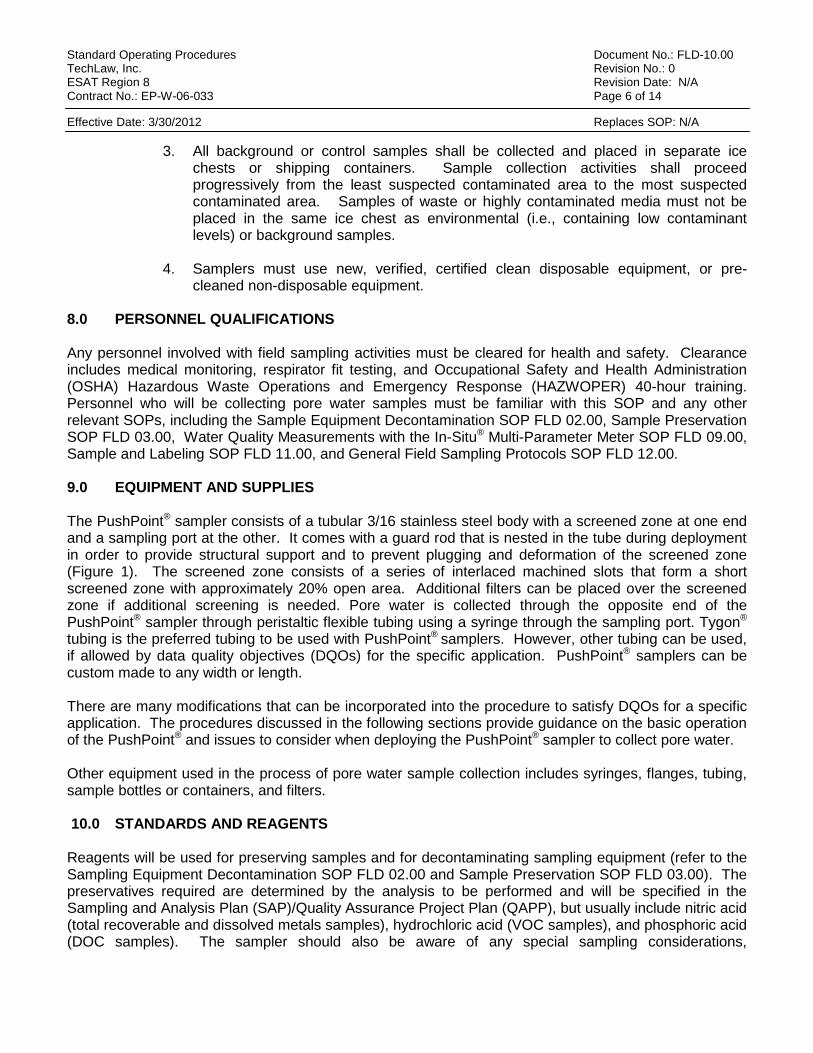
Standard Operating Procedures Document No.: FLD-10.00 TechLaw, Inc. Revision No.: 0 ESAT Region 8 Revision Date: N/A Contract No.: EP-W-06-033 Page 6 of 14
Effective Date: 3/30/2012 Replaces SOP: N/A
3. All background or control samples shall be collected and placed in separate ice chests or shipping containers. Sample collection activities shall proceed progressively from the least suspected contaminated area to the most suspected contaminated area. Samples of waste or highly contaminated media must not be placed in the same ice chest as environmental (i.e., containing low contaminant levels) or background samples.
4. Samplers must use new, verified, certified clean disposable equipment, or pre-
cleaned non-disposable equipment. 8.0 PERSONNEL QUALIFICATIONS Any personnel involved with field sampling activities must be cleared for health and safety. Clearance includes medical monitoring, respirator fit testing, and Occupational Safety and Health Administration (OSHA) Hazardous Waste Operations and Emergency Response (HAZWOPER) 40-hour training. Personnel who will be collecting pore water samples must be familiar with this SOP and any other relevant SOPs, including the Sample Equipment Decontamination SOP FLD 02.00, Sample Preservation SOP FLD 03.00, Water Quality Measurements with the In-Situ® Multi-Parameter Meter SOP FLD 09.00, Sample and Labeling SOP FLD 11.00, and General Field Sampling Protocols SOP FLD 12.00. 9.0 EQUIPMENT AND SUPPLIES The PushPoint® sampler consists of a tubular 3/16 stainless steel body with a screened zone at one end and a sampling port at the other. It comes with a guard rod that is nested in the tube during deployment in order to provide structural support and to prevent plugging and deformation of the screened zone (Figure 1). The screened zone consists of a series of interlaced machined slots that form a short screened zone with approximately 20% open area. Additional filters can be placed over the screened zone if additional screening is needed. Pore water is collected through the opposite end of the PushPoint® sampler through peristaltic flexible tubing using a syringe through the sampling port. Tygon®
tubing is the preferred tubing to be used with PushPoint® samplers. However, other tubing can be used, if allowed by data quality objectives (DQOs) for the specific application. PushPoint® samplers can be custom made to any width or length. There are many modifications that can be incorporated into the procedure to satisfy DQOs for a specific application. The procedures discussed in the following sections provide guidance on the basic operation of the PushPoint® and issues to consider when deploying the PushPoint® sampler to collect pore water. Other equipment used in the process of pore water sample collection includes syringes, flanges, tubing, sample bottles or containers, and filters. 10.0 STANDARDS AND REAGENTS Reagents will be used for preserving samples and for decontaminating sampling equipment (refer to the Sampling Equipment Decontamination SOP FLD 02.00 and Sample Preservation SOP FLD 03.00). The preservatives required are determined by the analysis to be performed and will be specified in the Sampling and Analysis Plan (SAP)/Quality Assurance Project Plan (QAPP), but usually include nitric acid (total recoverable and dissolved metals samples), hydrochloric acid (VOC samples), and phosphoric acid (DOC samples). The sampler should also be aware of any special sampling considerations,
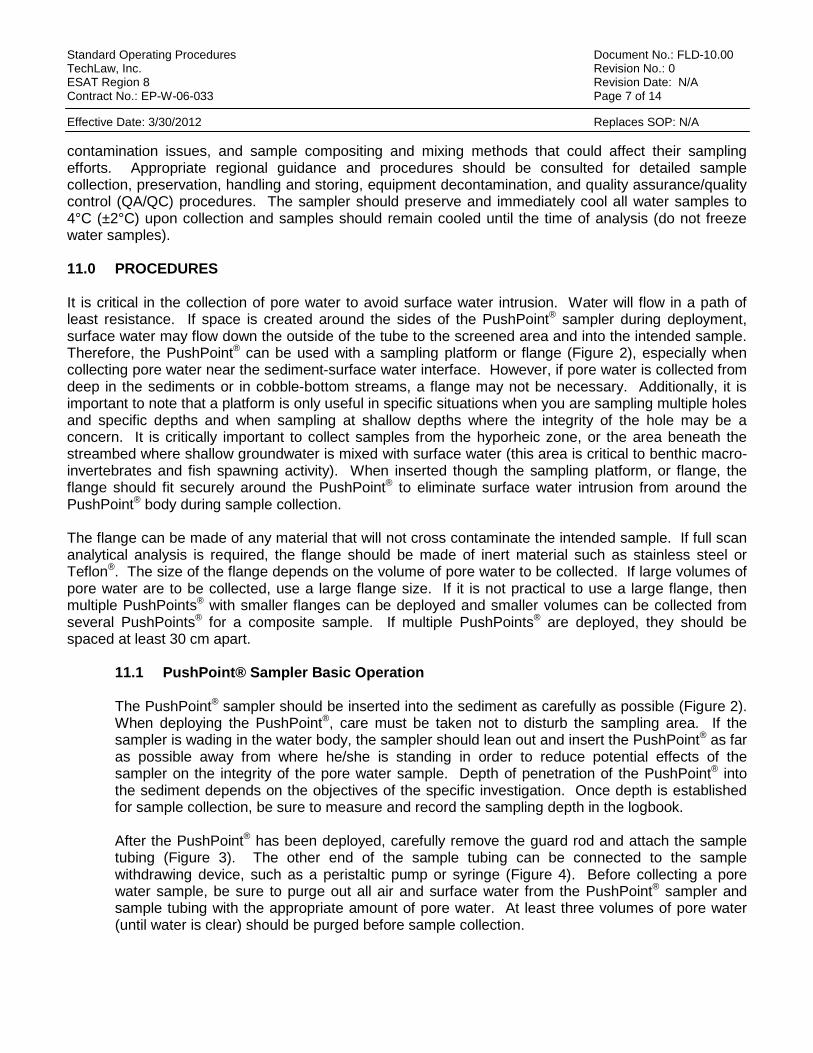
Standard Operating Procedures Document No.: FLD-10.00 TechLaw, Inc. Revision No.: 0 ESAT Region 8 Revision Date: N/A Contract No.: EP-W-06-033 Page 7 of 14
Effective Date: 3/30/2012 Replaces SOP: N/A contamination issues, and sample compositing and mixing methods that could affect their sampling efforts. Appropriate regional guidance and procedures should be consulted for detailed sample collection, preservation, handling and storing, equipment decontamination, and quality assurance/quality control (QA/QC) procedures. The sampler should preserve and immediately cool all water samples to 4°C (±2°C) upon collection and samples should remain cooled until the time of analysis (do not freeze water samples). 11.0 PROCEDURES It is critical in the collection of pore water to avoid surface water intrusion. Water will flow in a path of least resistance. If space is created around the sides of the PushPoint® sampler during deployment, surface water may flow down the outside of the tube to the screened area and into the intended sample. Therefore, the PushPoint® can be used with a sampling platform or flange (Figure 2), especially when collecting pore water near the sediment-surface water interface. However, if pore water is collected from deep in the sediments or in cobble-bottom streams, a flange may not be necessary. Additionally, it is important to note that a platform is only useful in specific situations when you are sampling multiple holes and specific depths and when sampling at shallow depths where the integrity of the hole may be a concern. It is critically important to collect samples from the hyporheic zone, or the area beneath the streambed where shallow groundwater is mixed with surface water (this area is critical to benthic macro-invertebrates and fish spawning activity). When inserted though the sampling platform, or flange, the flange should fit securely around the PushPoint® to eliminate surface water intrusion from around the PushPoint® body during sample collection. The flange can be made of any material that will not cross contaminate the intended sample. If full scan analytical analysis is required, the flange should be made of inert material such as stainless steel or Teflon®. The size of the flange depends on the volume of pore water to be collected. If large volumes of pore water are to be collected, use a large flange size. If it is not practical to use a large flange, then multiple PushPoints® with smaller flanges can be deployed and smaller volumes can be collected from several PushPoints® for a composite sample. If multiple PushPoints® are deployed, they should be spaced at least 30 cm apart.
11.1 PushPoint® Sampler Basic Operation
The PushPoint® sampler should be inserted into the sediment as carefully as possible (Figure 2). When deploying the PushPoint®, care must be taken not to disturb the sampling area. If the sampler is wading in the water body, the sampler should lean out and insert the PushPoint® as far as possible away from where he/she is standing in order to reduce potential effects of the sampler on the integrity of the pore water sample. Depth of penetration of the PushPoint® into the sediment depends on the objectives of the specific investigation. Once depth is established for sample collection, be sure to measure and record the sampling depth in the logbook. After the PushPoint® has been deployed, carefully remove the guard rod and attach the sample tubing (Figure 3). The other end of the sample tubing can be connected to the sample withdrawing device, such as a peristaltic pump or syringe (Figure 4). Before collecting a pore water sample, be sure to purge out all air and surface water from the PushPoint® sampler and sample tubing with the appropriate amount of pore water. At least three volumes of pore water (until water is clear) should be purged before sample collection.
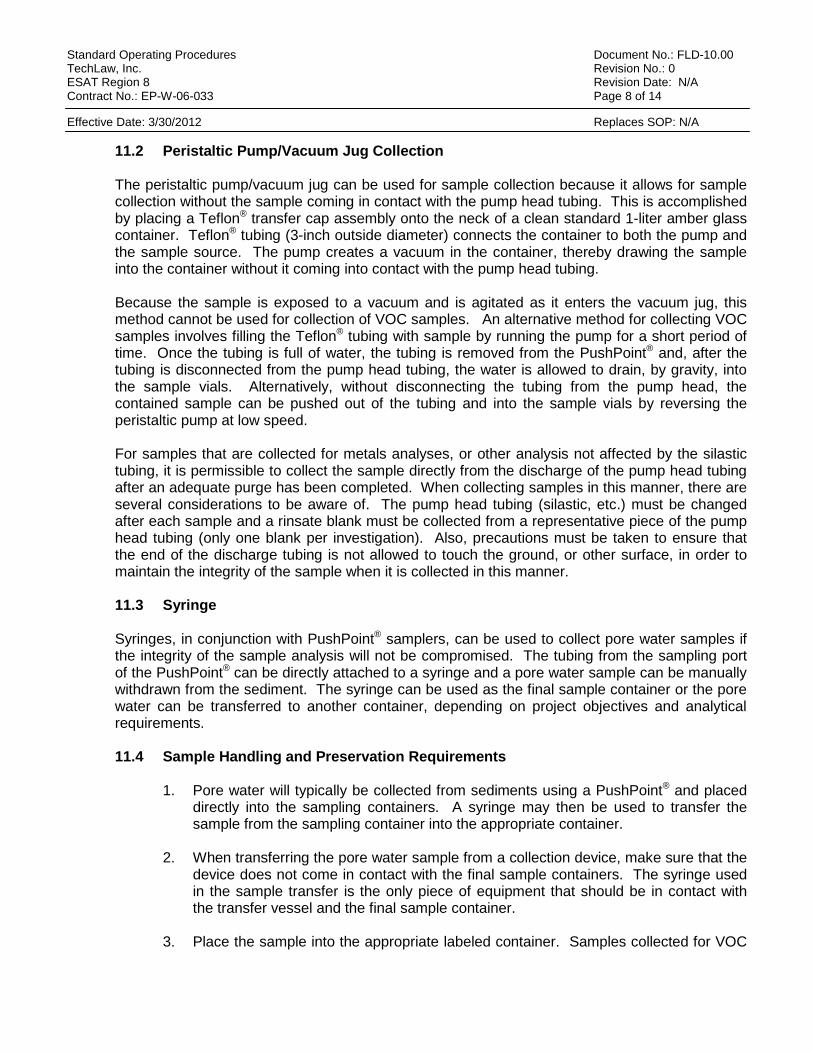
Standard Operating Procedures Document No.: FLD-10.00 TechLaw, Inc. Revision No.: 0 ESAT Region 8 Revision Date: N/A Contract No.: EP-W-06-033 Page 8 of 14
Effective Date: 3/30/2012 Replaces SOP: N/A
11.2 Peristaltic Pump/Vacuum Jug Collection
The peristaltic pump/vacuum jug can be used for sample collection because it allows for sample collection without the sample coming in contact with the pump head tubing. This is accomplished by placing a Teflon® transfer cap assembly onto the neck of a clean standard 1-liter amber glass container. Teflon® tubing (3-inch outside diameter) connects the container to both the pump and the sample source. The pump creates a vacuum in the container, thereby drawing the sample into the container without it coming into contact with the pump head tubing. Because the sample is exposed to a vacuum and is agitated as it enters the vacuum jug, this method cannot be used for collection of VOC samples. An alternative method for collecting VOC samples involves filling the Teflon® tubing with sample by running the pump for a short period of time. Once the tubing is full of water, the tubing is removed from the PushPoint® and, after the tubing is disconnected from the pump head tubing, the water is allowed to drain, by gravity, into the sample vials. Alternatively, without disconnecting the tubing from the pump head, the contained sample can be pushed out of the tubing and into the sample vials by reversing the peristaltic pump at low speed. For samples that are collected for metals analyses, or other analysis not affected by the silastic tubing, it is permissible to collect the sample directly from the discharge of the pump head tubing after an adequate purge has been completed. When collecting samples in this manner, there are several considerations to be aware of. The pump head tubing (silastic, etc.) must be changed after each sample and a rinsate blank must be collected from a representative piece of the pump head tubing (only one blank per investigation). Also, precautions must be taken to ensure that the end of the discharge tubing is not allowed to touch the ground, or other surface, in order to maintain the integrity of the sample when it is collected in this manner. 11.3 Syringe
Syringes, in conjunction with PushPoint® samplers, can be used to collect pore water samples if the integrity of the sample analysis will not be compromised. The tubing from the sampling port of the PushPoint® can be directly attached to a syringe and a pore water sample can be manually withdrawn from the sediment. The syringe can be used as the final sample container or the pore water can be transferred to another container, depending on project objectives and analytical requirements.
11.4 Sample Handling and Preservation Requirements
1. Pore water will typically be collected from sediments using a PushPoint® and placed
directly into the sampling containers. A syringe may then be used to transfer the sample from the sampling container into the appropriate container.
2. When transferring the pore water sample from a collection device, make sure that the
device does not come in contact with the final sample containers. The syringe used in the sample transfer is the only piece of equipment that should be in contact with the transfer vessel and the final sample container.
3. Place the sample into the appropriate labeled container. Samples collected for VOC
Standard Operating Procedures Document No.: FLD-10.00 TechLaw, Inc. Revision No.: 0 ESAT Region 8 Revision Date: N/A Contract No.: EP-W-06-033 Page 9 of 14
Effective Date: 3/30/2012 Replaces SOP: N/A
analysis must not have any headspace (see Section 7.1). All other sample containers must be filled with an allowance for ullage.
4. All samples requiring preservation must be preserved as soon as practically possible
after sample collection. If preserved VOA vials are used, these will be preserved with concentrated hydrochloric acid prior to departure for the field investigation. All other chemical preservatives required for the remaining suite of analytes will be specified in the site-specific SAP. The adequacy of sample preservation will be checked after the addition of the preservative for all samples, except for the samples collected for VOC analysis. If it is determined that a sample is not acceptably preserved, additional preservative should be added to achieve adequate preservation. Preservation requirements for surface water samples will be specified in the site-specific SAP/QAPP and the Sample Preservation SOP FLD 03.00.
12.0 DATA RECORDS AND MANAGEMENT Once collected, samples are preserved, labeled, and stored for transport. A chain of custody form must accompany all samples during transport and transfer between entities. Sample labels should contain the following information:
• Site identification • Date sampled • Location identification • Sampler initials • Time • Analysis to be performed • Preservative
Any other pertinent data should be recorded in the site dedicated field logbook. 13.0 QUALITY CONTROL AND ASSURANCE The following general QA procedures apply:
1. All data must be documented on field data sheets or within site logbooks. 2. In general, concurrent (duplicate) sample collection at a frequency of 10% is required for most
sampling activities. Field blanks at a frequency of one per day are also generally required. Consult the corresponding SAP/QAPP for specific QA/QC sampling frequency. Below is a list of usual pore water QA/QC sample types and the inaccuracy they are intended to detect:
• Duplicate sample – two samples collected at the same location at the same time,
intended to detect variability inherent in collection, processing, and handling procedures • Field blank – checks cross-contamination during sample collection, preservation, and
shipment as well as in the laboratory. • Rinsate blank – detects equipment contamination due to inadequate decontamination
Standard Operating Procedures Document No.: FLD-10.00 TechLaw, Inc. Revision No.: 0 ESAT Region 8 Revision Date: N/A Contract No.: EP-W-06-033 Page 10 of 14
Effective Date: 3/30/2012 Replaces SOP: N/A
procedures
3. All instrumentation should be operated in accordance with operating instructions as supplied by the manufacturer unless otherwise specified in the work plan or SAP/QAPP. Equipment calibration activities should be conducted and documented prior to sampling and/or operation of equipment.
4. Document any deviations from SOPs, work plan, SAP/QAPP, etc. 14.0 REFERENCES
EPA Guidance for Preparing Standard Operating Procedures, EPA QA/G-6, April 2007. MHE Products, PushPoint® Sampler (US Pat. # 6,470,967), Operators Manual and Applications Guide, Ver. 2.01, 2/15.
15.0 FIGURES Figures 1-4 show equipment operation and basic sampling techniques.
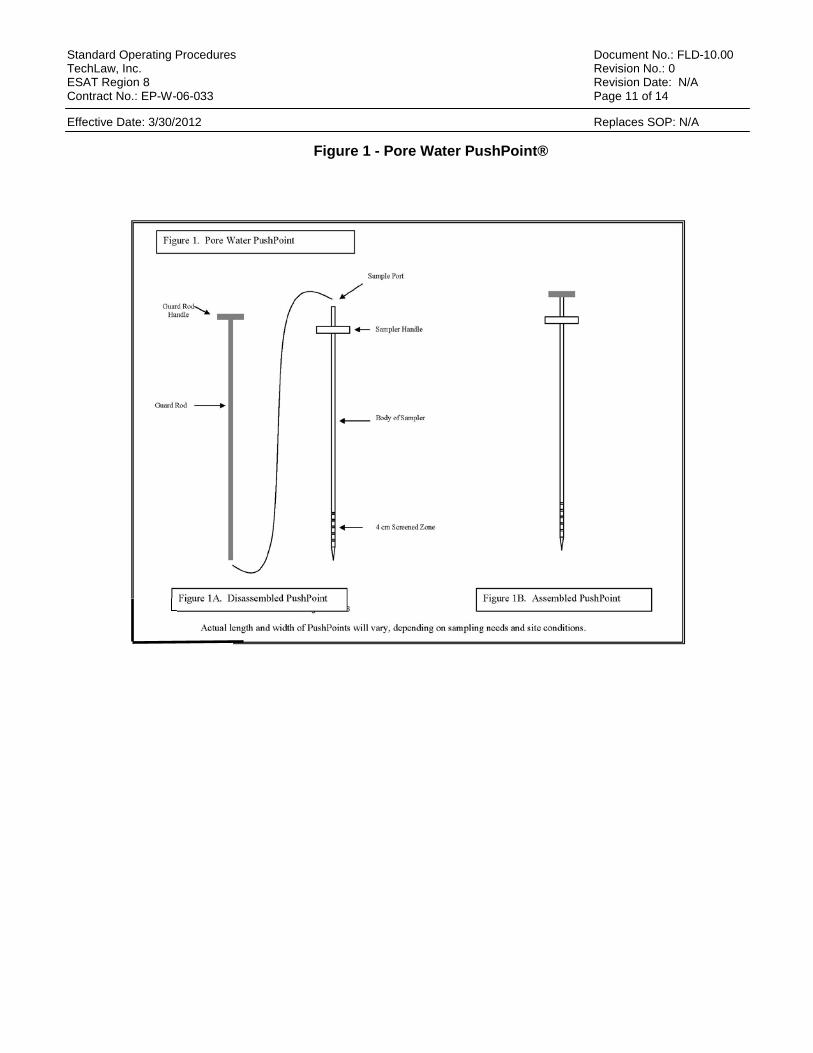
Standard Operating Procedures Document No.: FLD-10.00 TechLaw, Inc. Revision No.: 0 ESAT Region 8 Revision Date: N/A Contract No.: EP-W-06-033 Page 11 of 14
Effective Date: 3/30/2012 Replaces SOP: N/A
Figure 1 - Pore Water PushPoint®
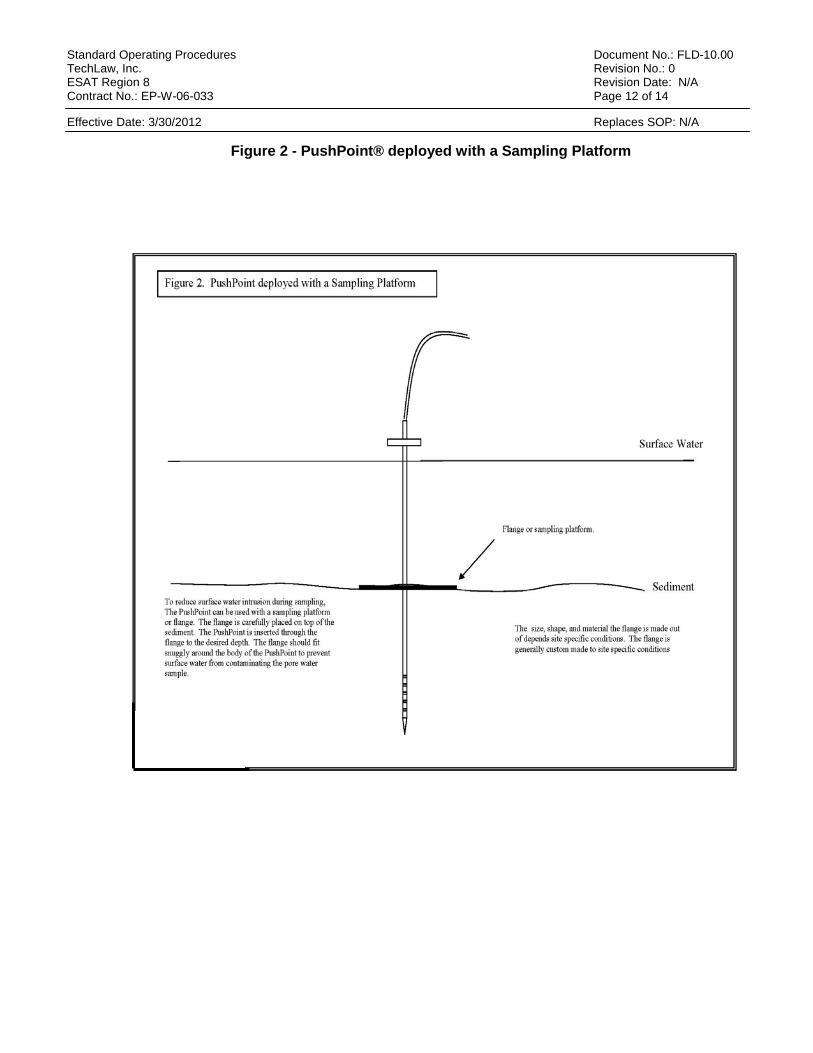
Standard Operating Procedures Document No.: FLD-10.00 TechLaw, Inc. Revision No.: 0 ESAT Region 8 Revision Date: N/A Contract No.: EP-W-06-033 Page 12 of 14
Effective Date: 3/30/2012 Replaces SOP: N/A
Figure 2 - PushPoint® deployed with a Sampling Platform
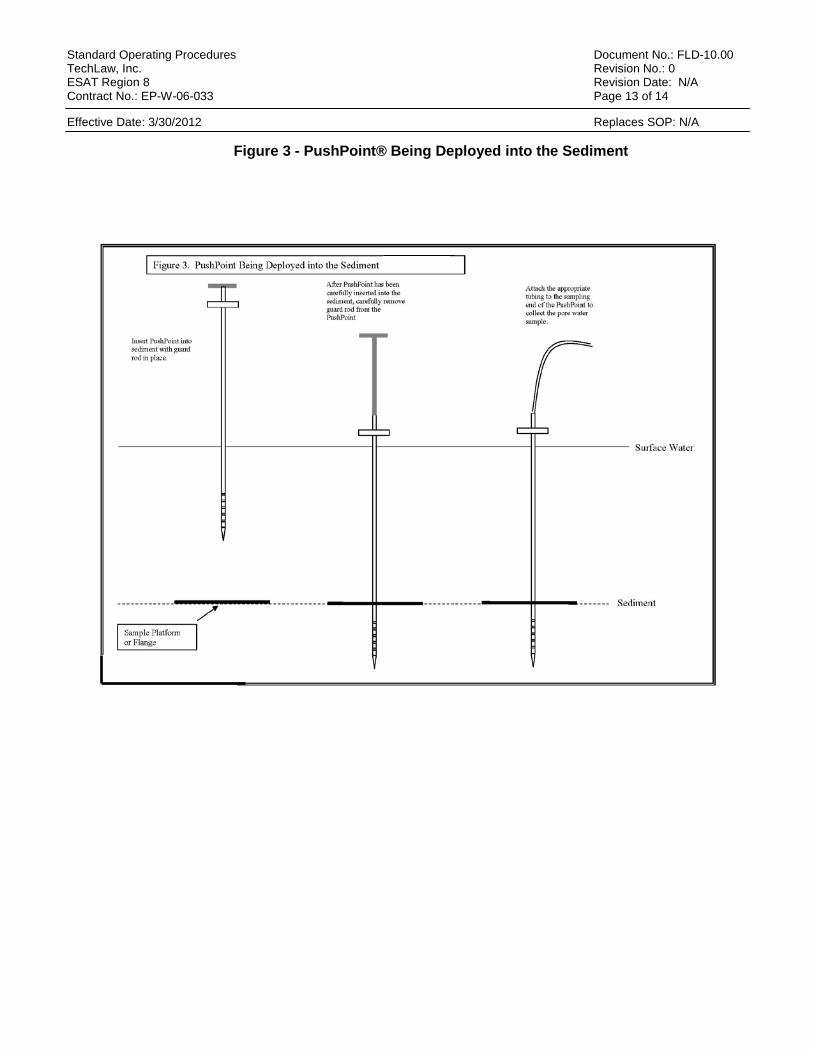
Standard Operating Procedures Document No.: FLD-10.00 TechLaw, Inc. Revision No.: 0 ESAT Region 8 Revision Date: N/A Contract No.: EP-W-06-033 Page 13 of 14
Effective Date: 3/30/2012 Replaces SOP: N/A
Figure 3 - PushPoint® Being Deployed into the Sediment
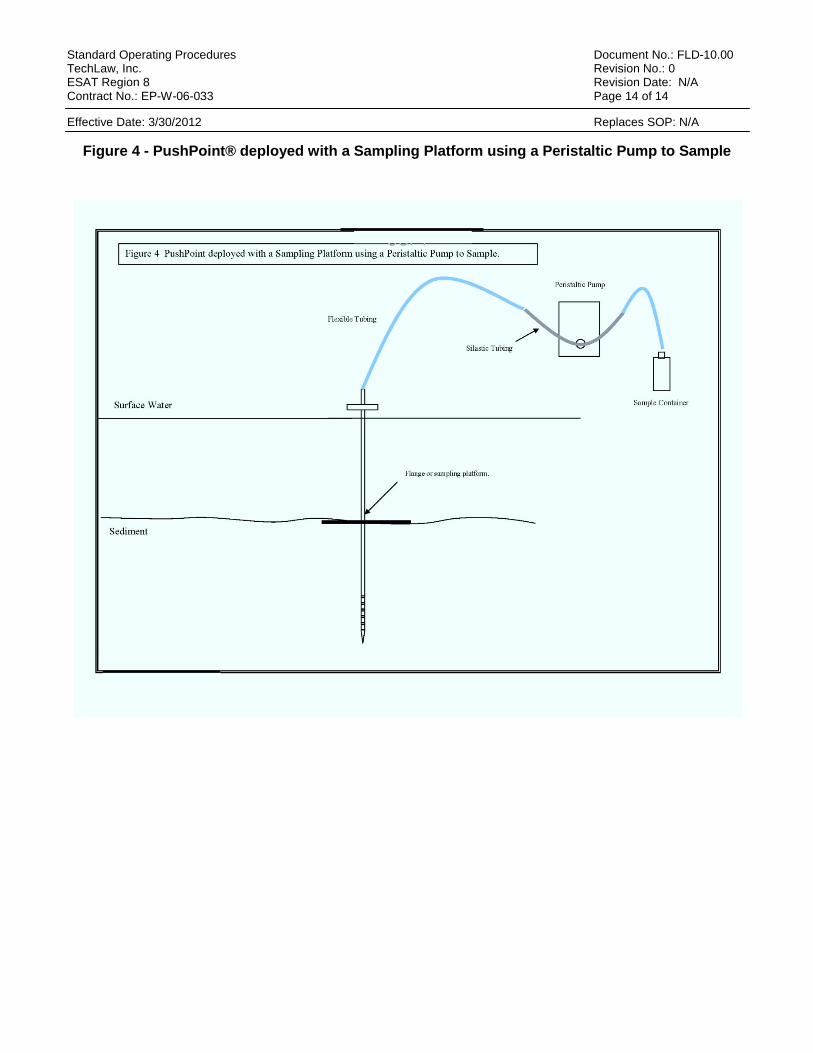
Standard Operating Procedures Document No.: FLD-10.00 TechLaw, Inc. Revision No.: 0 ESAT Region 8 Revision Date: N/A Contract No.: EP-W-06-033 Page 14 of 14
Effective Date: 3/30/2012 Replaces SOP: N/A
Figure 4 - PushPoint® deployed with a Sampling Platform using a Peristaltic Pump to Sample
Appendix C – HASP
(To Be Provided at a Later Date)