surface monitoring for geologic carbon sequestration
TRANSCRIPT
Surface Monitoring for Geologic Carbon SequestrationVol. 2: Monitoring Methods, Instrumentation, and Case Studies

It is well known that carbon dioxide (CO2) is a green-house gas that contributes to climate change. CO2 is emitted into the atmosphere whenever fossil fuels are burned. The largest sources of man-made CO2 emissions are coal- and gas-fired power plants and automotive transportation. Carbon Capture and Geologic Sequestration has been identified as a way to mitigate CO2 emissions to the atmosphere.
Geologic formations suitable for underground CO2 storage have been identified around the world. Typically, these formations are depleted oil and gas reservoirs, coal beds, and deep saline aquifers. The potential global capacity for geologic storage of CO2 is large and could cor-respond to hundreds of years of anthropogenic CO2 emissions. The ability of many of these reservoirs to store natural gas and naturally-occurring CO2 over millions of years helps to prove the credibility of deep underground storage.
However leak-tight an underground storage formation may seem, it remains the responsibility of the project owner to prove no leakage of CO2 is occurring. While ambient levels of CO2 are harmless, concen-trated CO2 can be fatal to plants and animals, including humans. The public needs to be assured that no leaks exist that would endanger their health or negate the benefits of the carbon storage project. Surface monitoring above geologic storage formations is effective proof of stor-age formation integrity.
LI-COR® Biosciences published Volume 1 of Surface Monitoring for Geologic Carbon Sequestration in 2009; this updated edition briefly describes two methods for geologic sequestration surface monitoring, as well as the challenges associated with each method. Also described is instrumentation available from LI-COR Biosciences that has been used to effectively monitor for CO2 leaks from geologic storage forma-tions. At the end of this note we present two new case studies of surface monitoring projects already underway that use the LI-8100/LI-8100A Automated Soil CO2 Flux System and/or LI-7500/A Open Path CO2/H2O Analyzer for Carbon Capture and Storage surface monitoring.
1 - Introduction
Introduction
Instrumentation for Surface Monitoring The LI-8100 was introduced in 2003 to address the need for a robust, dedicated system for measuring soil CO2 flux over a wide variety of environmental conditions. Drawing upon more than a decade of experience in making soil CO2 flux measure-ments, LI-COR designed a system that addresses both temporal and spatial variability with integrated survey and long-term chamber designs, as well as a multiplexer (LI-8150) that allows long-term measurements with as many as 16 chambers. For conducting measurements over a number of locations, 10 cm (8100-102) and 20 cm (8100-103) survey chambers allow rapid, repeatable measurements to obtain accurate determination of spatial variability. Long-term diel measurements can be auto-mated at a single location for weeks or months at a time using the 8100-104 or 8100-104C long-term chambers, which, when combined with the LI-8150 Multiplexer, provides assessment of both temporal and spatial variability. Innovations like cham-ber drive mechanisms that automatically move the chamber away from the soil environment being measured, a pressure vent design that allows chamber pressure to track the ambient pressure under windy or calm conditions, perforated baseplates to minimize perturbations to the soil enviroment, and cham-bers that close automatically to eliminate variations caused by manual chamber placement ensure that soil CO2 flux measure-ments are accurate and repeatable. In 2010, LI-COR released the LI-8100A, which expanded the LI-8100’s capabilities by extending the CO2 measurement range to 20,000 ppm, allow-ing for soil CO2 flux measurements in high CO2 environments. The LI-8100A also added Ethernet connectivity for two-way communication with networked computers, and remote setup, data collection, and diagnostics by simply logging onto any LI-8100A connected to a local network. Setup and operation are also possible with many Wi-Fi enabled devices using a Win-dows® Mobile application.
For measuring CO2 fluxes above surfaces using micrometeo-rological methods such as Eddy Covariance, LI-COR offers the LI-7500A Open Path CO2/H2O Analyzer, which features the fast response times and low power requirements needed to make flux measurements between vegetation and the atmo-sphere, primarily on field station towers. In addition, a new Enclosed CO2/H2O Analyzer, the LI-7200, is also available, which combines the advantages of both open and closed path analyzers. The LI-7200 is based on the design of the LI-7500A, uses low power, and can be mounted in the same manner as the LI-7500A; however, the LI-7200 encloses the optical path by using a short intake tube, which eliminates CO2 and H2O losses during rain events.
Monitoring, Verification, and AccountingThe purpose of Monitoring, Verification, and Accounting (MVA) is to provide an accurate accounting of stored CO2 and a high level of confidence that the CO2 remains sequestered permanently. A successful effort enables sequestration project developers to ensure human health and safety and prevent damage to the host ecosystem. MVA requires an entire host of tools to effectively understand the CO2 movement within the storage formation. One such tool is understanding and quanti-fying potential surface leakage sites. An active surface monitor-ing campaign helps to quantify natural ecosystem background fluxes, which makes understanding and quantifying leakage areas easier. Surface monitoring is also an effective way to con-vince the public that leaks are not occurring.
Surface MonitoringMethods for soil CO2 flux measurement
There are two primary methods to quantify the rate of CO2 release from the ground to the atmosphere. One method is chamber-based, which includes an open-chamber and closed-chamber method. The other method is micrometeorological, which includes the Eddy Covariance method, Bowen-Ratio energy balance method and aerodynamic method (Verma [1]).
Chamber-based soil CO2 flux measurement
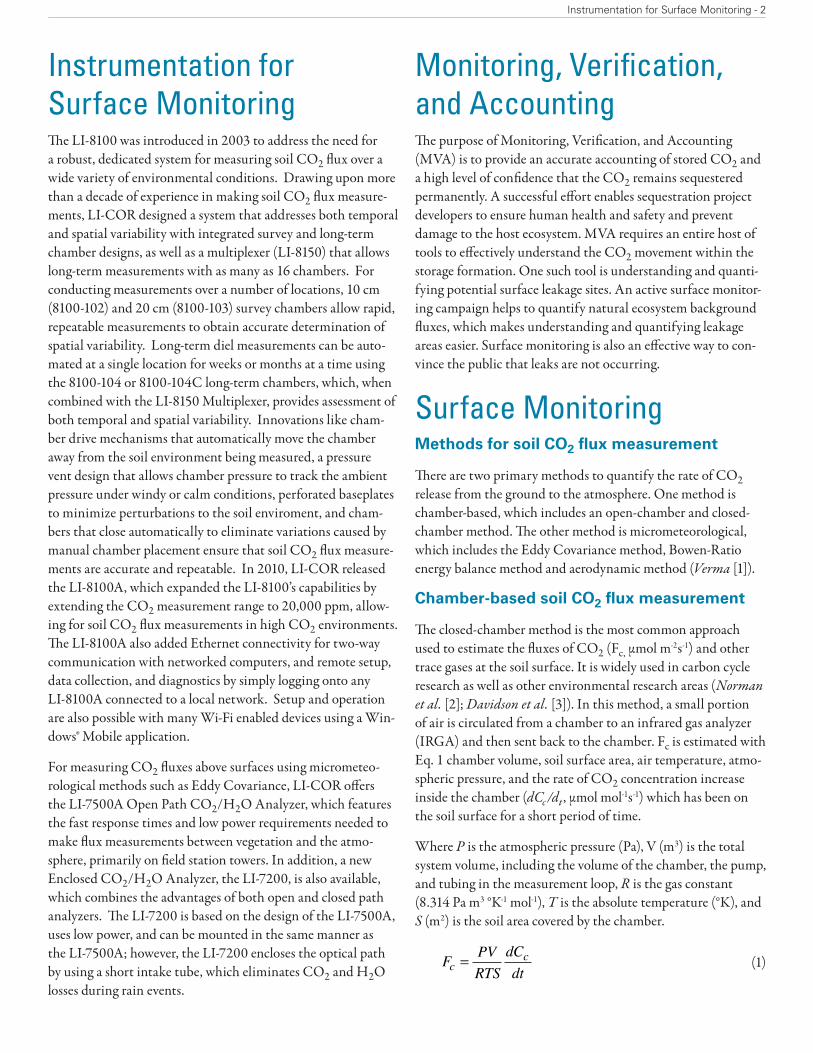
The closed-chamber method is the most common approach used to estimate the fluxes of CO2 (Fc, µmol m-2s-1) and other trace gases at the soil surface. It is widely used in carbon cycle research as well as other environmental research areas (Norman et al. [2]; Davidson et al. [3]). In this method, a small portion of air is circulated from a chamber to an infrared gas analyzer (IRGA) and then sent back to the chamber. Fc is estimated with Eq. 1 chamber volume, soil surface area, air temperature, atmo-spheric pressure, and the rate of CO2 concentration increase inside the chamber (dCc /dt , µmol mol-1s-1) which has been on the soil surface for a short period of time.
Where P is the atmospheric pressure (Pa), V (m3) is the total system volume, including the volume of the chamber, the pump, and tubing in the measurement loop, R is the gas constant (8.314 Pa m3 °K-1 mol-1), T is the absolute temperature (°K), and S (m2) is the soil area covered by the chamber.
Instrumentation for Surface Monitoring - 2
(1)F PVRTS
dCdtcc=
ON/OFFAutomated Soil
CO 2 Flux System
ON/OFF
POWERIRGA READYACTIVE
LOW BATTERY
READY
ON/OFFON/OFF
DiaphragmPump
To Chamber
From ChamberFilter
AnalyzerBench
Analyzer Control Unit
20 cm SurveyChamber
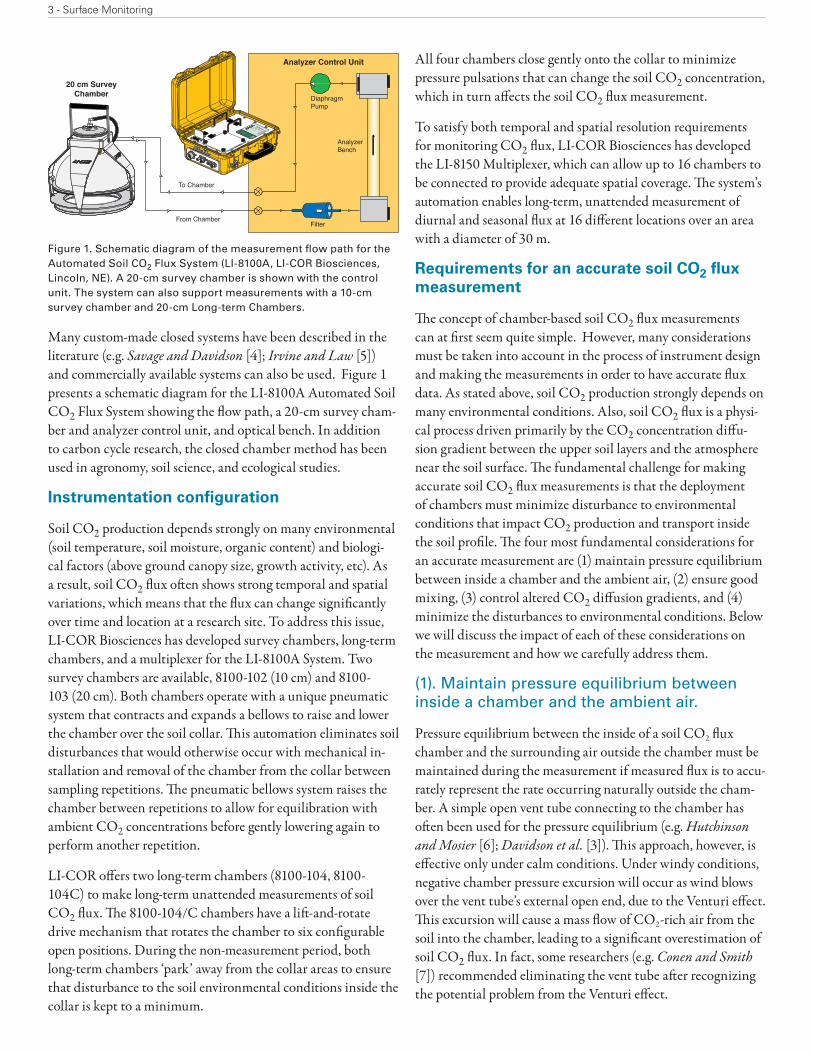
Figure 1. Schematic diagram of the measurement flow path for the Automated Soil CO2 Flux System (LI-8100A, LI-COR Biosciences, Lincoln, NE). A 20-cm survey chamber is shown with the control unit. The system can also support measurements with a 10-cm survey chamber and 20-cm Long-term Chambers.
Many custom-made closed systems have been described in the literature (e.g. Savage and Davidson [4]; Irvine and Law [5]) and commercially available systems can also be used. Figure 1 presents a schematic diagram for the LI-8100A Automated Soil CO2 Flux System showing the flow path, a 20-cm survey cham-ber and analyzer control unit, and optical bench. In addition to carbon cycle research, the closed chamber method has been used in agronomy, soil science, and ecological studies.
Instrumentation configuration
Soil CO2 production depends strongly on many environmental (soil temperature, soil moisture, organic content) and biologi-cal factors (above ground canopy size, growth activity, etc). As a result, soil CO2 flux often shows strong temporal and spatial variations, which means that the flux can change significantly over time and location at a research site. To address this issue, LI-COR Biosciences has developed survey chambers, long-term chambers, and a multiplexer for the LI-8100A System. Two survey chambers are available, 8100-102 (10 cm) and 8100-103 (20 cm). Both chambers operate with a unique pneumatic system that contracts and expands a bellows to raise and lower the chamber over the soil collar. This automation eliminates soil disturbances that would otherwise occur with mechanical in-stallation and removal of the chamber from the collar between sampling repetitions. The pneumatic bellows system raises the chamber between repetitions to allow for equilibration with ambient CO2 concentrations before gently lowering again to perform another repetition.
LI-COR offers two long-term chambers (8100-104, 8100-104C) to make long-term unattended measurements of soil CO2 flux. The 8100-104/C chambers have a lift-and-rotate drive mechanism that rotates the chamber to six configurable open positions. During the non-measurement period, both long-term chambers ‘park’ away from the collar areas to ensure that disturbance to the soil environmental conditions inside the collar is kept to a minimum.
All four chambers close gently onto the collar to minimize pressure pulsations that can change the soil CO2 concentration, which in turn affects the soil CO2 flux measurement.
To satisfy both temporal and spatial resolution requirements for monitoring CO2 flux, LI-COR Biosciences has developed the LI-8150 Multiplexer, which can allow up to 16 chambers to be connected to provide adequate spatial coverage. The system’s automation enables long-term, unattended measurement of diurnal and seasonal flux at 16 different locations over an area with a diameter of 30 m.
Requirements for an accurate soil CO2 flux measurement
The concept of chamber-based soil CO2 flux measurements can at first seem quite simple. However, many considerations must be taken into account in the process of instrument design and making the measurements in order to have accurate flux data. As stated above, soil CO2 production strongly depends on many environmental conditions. Also, soil CO2 flux is a physi-cal process driven primarily by the CO2 concentration diffu-sion gradient between the upper soil layers and the atmosphere near the soil surface. The fundamental challenge for making accurate soil CO2 flux measurements is that the deployment of chambers must minimize disturbance to environmental conditions that impact CO2 production and transport inside the soil profile. The four most fundamental considerations for an accurate measurement are (1) maintain pressure equilibrium between inside a chamber and the ambient air, (2) ensure good mixing, (3) control altered CO2 diffusion gradients, and (4) minimize the disturbances to environmental conditions. Below we will discuss the impact of each of these considerations on the measurement and how we carefully address them.
(1). Maintain pressure equilibrium between inside a chamber and the ambient air.
Pressure equilibrium between the inside of a soil CO2 flux chamber and the surrounding air outside the chamber must be maintained during the measurement if measured flux is to accu-rately represent the rate occurring naturally outside the cham-ber. A simple open vent tube connecting to the chamber has often been used for the pressure equilibrium (e.g. Hutchinson and Mosier [6]; Davidson et al. [3]). This approach, however, is effective only under calm conditions. Under windy conditions, negative chamber pressure excursion will occur as wind blows over the vent tube’s external open end, due to the Venturi effect. This excursion will cause a mass flow of CO2-rich air from the soil into the chamber, leading to a significant overestimation of soil CO2 flux. In fact, some researchers (e.g. Conen and Smith [7]) recommended eliminating the vent tube after recognizing the potential problem from the Venturi effect.
3 - Surface Monitoring
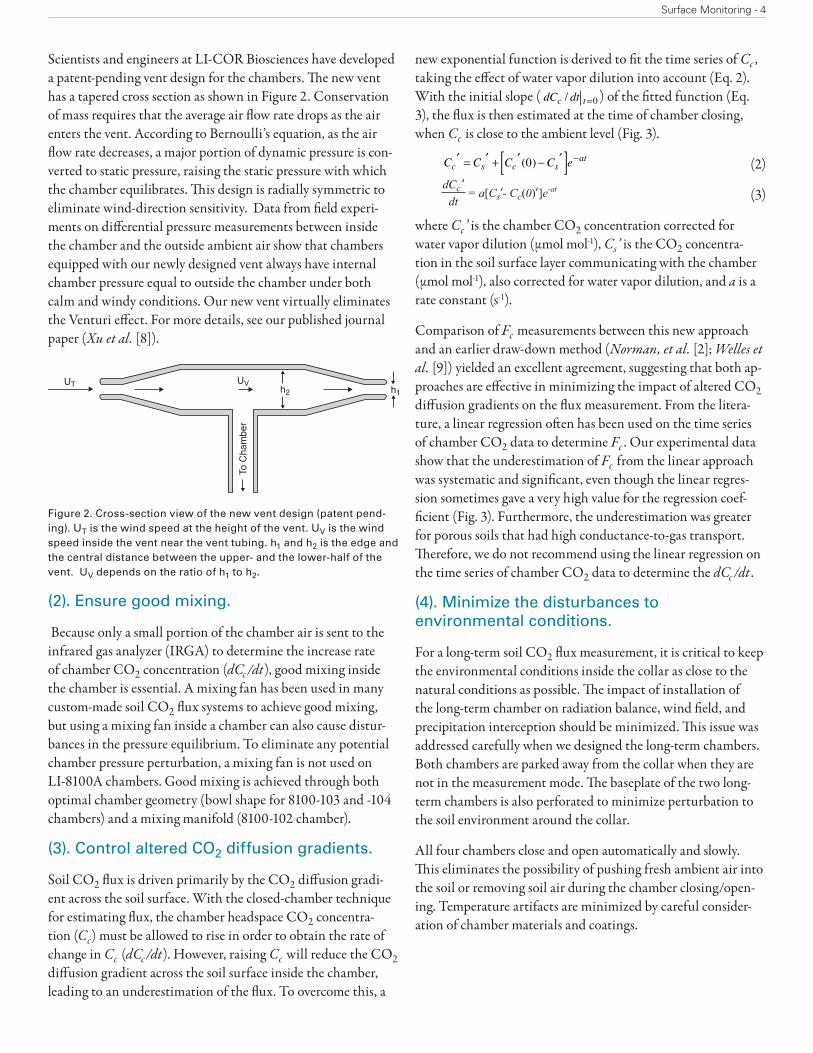
Scientists and engineers at LI-COR Biosciences have developed a patent-pending vent design for the chambers. The new vent has a tapered cross section as shown in Figure 2. Conservation of mass requires that the average air flow rate drops as the air enters the vent. According to Bernoulli’s equation, as the air flow rate decreases, a major portion of dynamic pressure is con-verted to static pressure, raising the static pressure with which the chamber equilibrates. This design is radially symmetric to eliminate wind-direction sensitivity. Data from field experi-ments on differential pressure measurements between inside the chamber and the outside ambient air show that chambers equipped with our newly designed vent always have internal chamber pressure equal to outside the chamber under both calm and windy conditions. Our new vent virtually eliminates the Venturi effect. For more details, see our published journal paper (Xu et al. [8]).
UT UV
To C
ham
ber
h2 h1
Figure 2. Cross-section view of the new vent design (patent pend-ing). UT is the wind speed at the height of the vent. UV is the wind speed inside the vent near the vent tubing. h1 and h2 is the edge and the central distance between the upper- and the lower-half of the vent. UV depends on the ratio of h1 to h2.
(2). Ensure good mixing.
Because only a small portion of the chamber air is sent to the infrared gas analyzer (IRGA) to determine the increase rate of chamber CO2 concentration (dCc /dt), good mixing inside the chamber is essential. A mixing fan has been used in many custom-made soil CO2 flux systems to achieve good mixing, but using a mixing fan inside a chamber can also cause distur-bances in the pressure equilibrium. To eliminate any potential chamber pressure perturbation, a mixing fan is not used on LI-8100A chambers. Good mixing is achieved through both optimal chamber geometry (bowl shape for 8100-103 and -104 chambers) and a mixing manifold (8100-102 chamber).
(3). Control altered CO2 diffusion gradients.
Soil CO2 flux is driven primarily by the CO2 diffusion gradi-ent across the soil surface. With the closed-chamber technique for estimating flux, the chamber headspace CO2 concentra-tion (Cc) must be allowed to rise in order to obtain the rate of change in Cc (dCc /dt). However, raising Cc will reduce the CO2 diffusion gradient across the soil surface inside the chamber, leading to an underestimation of the flux. To overcome this, a
new exponential function is derived to fit the time series of Cc , taking the effect of water vapor dilution into account (Eq. 2). With the initial slope ( ) of the fitted function (Eq. 3), the flux is then estimated at the time of chamber closing, when Cc is close to the ambient level (Fig. 3).
(2)
(3)
where Cc’ is the chamber CO2 concentration corrected for water vapor dilution (µmol mol-1), Cs’ is the CO2 concentra-tion in the soil surface layer communicating with the chamber (µmol mol-1), also corrected for water vapor dilution, and a is a rate constant (s-1).
Comparison of Fc measurements between this new approach and an earlier draw-down method (Norman, et al. [2]; Welles et al. [9]) yielded an excellent agreement, suggesting that both ap-proaches are effective in minimizing the impact of altered CO2 diffusion gradients on the flux measurement. From the litera-ture, a linear regression often has been used on the time series of chamber CO2 data to determine Fc . Our experimental data show that the underestimation of Fc from the linear approach was systematic and significant, even though the linear regres-sion sometimes gave a very high value for the regression coef-ficient (Fig. 3). Furthermore, the underestimation was greater for porous soils that had high conductance-to-gas transport. Therefore, we do not recommend using the linear regression on the time series of chamber CO2 data to determine the dCc /dt .
(4). Minimize the disturbances to environmental conditions.
For a long-term soil CO2 flux measurement, it is critical to keep the environmental conditions inside the collar as close to the natural conditions as possible. The impact of installation of the long-term chamber on radiation balance, wind field, and precipitation interception should be minimized. This issue was addressed carefully when we designed the long-term chambers. Both chambers are parked away from the collar when they are not in the measurement mode. The baseplate of the two long-term chambers is also perforated to minimize perturbation to the soil environment around the collar.
All four chambers close and open automatically and slowly. This eliminates the possibility of pushing fresh ambient air into the soil or removing soil air during the chamber closing/open-ing. Temperature artifacts are minimized by careful consider-ation of chamber materials and coatings.
C C C C ec s c sat′ = ′ + ′ − ′[ ] −( )0
dCdtc ‘
‘ ‘= a[Cs - Cc(0) ]e-at
dC dtc t/ =0
Surface Monitoring - 4
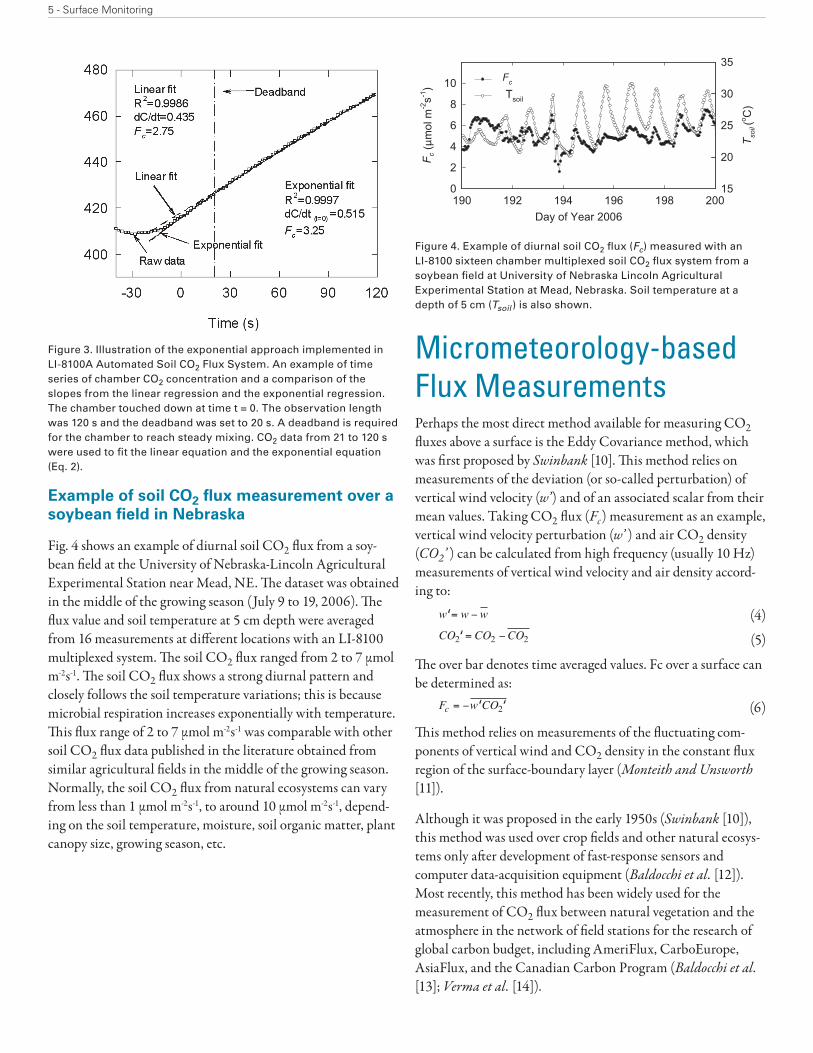
Figure 3. Illustration of the exponential approach implemented in LI-8100A Automated Soil CO2 Flux System. An example of time series of chamber CO2 concentration and a comparison of the slopes from the linear regression and the exponential regression. The chamber touched down at time t = 0. The observation length was 120 s and the deadband was set to 20 s. A deadband is required for the chamber to reach steady mixing. CO2 data from 21 to 120 s were used to fit the linear equation and the exponential equation (Eq. 2).
Example of soil CO2 flux measurement over a soybean field in Nebraska
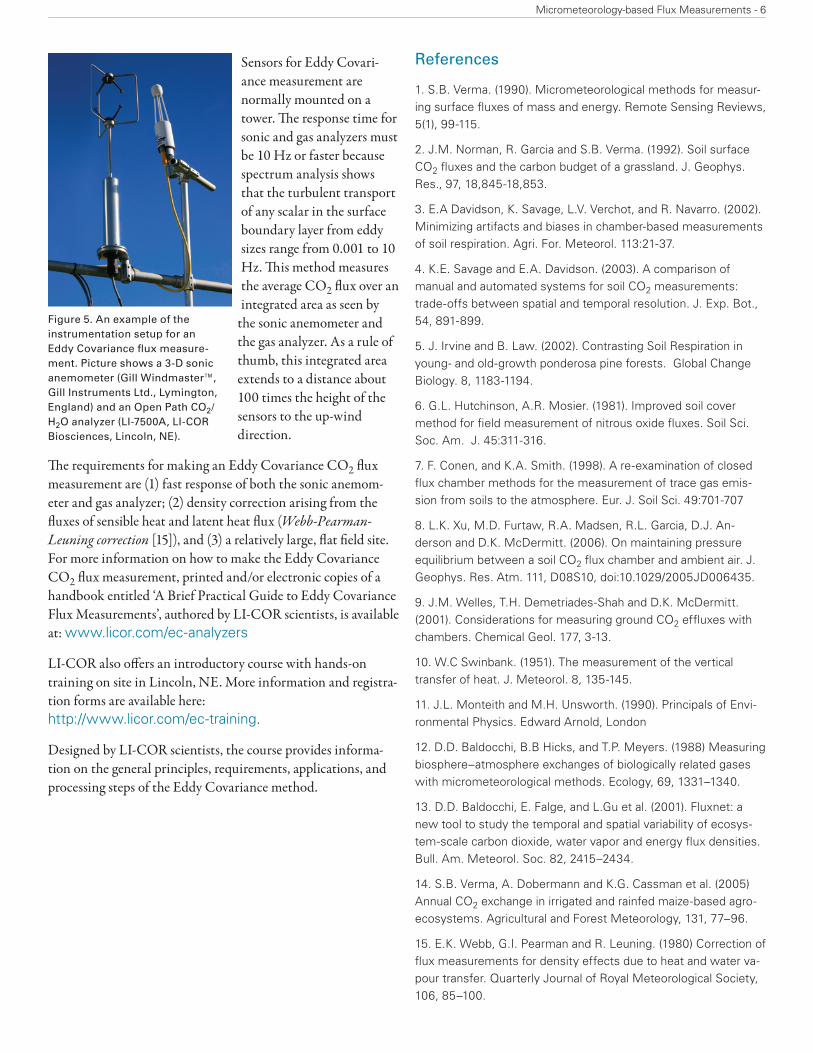
Fig. 4 shows an example of diurnal soil CO2 flux from a soy-bean field at the University of Nebraska-Lincoln Agricultural Experimental Station near Mead, NE. The dataset was obtained in the middle of the growing season (July 9 to 19, 2006). The flux value and soil temperature at 5 cm depth were averaged from 16 measurements at different locations with an LI-8100 multiplexed system. The soil CO2 flux ranged from 2 to 7 µmol m-2s-1. The soil CO2 flux shows a strong diurnal pattern and closely follows the soil temperature variations; this is because microbial respiration increases exponentially with temperature. This flux range of 2 to 7 µmol m-2s-1 was comparable with other soil CO2 flux data published in the literature obtained from similar agricultural fields in the middle of the growing season. Normally, the soil CO2 flux from natural ecosystems can vary from less than 1 µmol m-2s-1, to around 10 µmol m-2s-1, depend-ing on the soil temperature, moisture, soil organic matter, plant canopy size, growing season, etc.
Day of Year 2006
190 192 194 196 198 200
Fc
(µm
ol m
-2s-1
)
0
2
4
6
8
10
Tsoil(o C
)
15
20
25
30
35FcTsoil
Figure 4. Example of diurnal soil CO2 flux (Fc) measured with an LI-8100 sixteen chamber multiplexed soil CO2 flux system from a soybean field at University of Nebraska Lincoln Agricultural Experimental Station at Mead, Nebraska. Soil temperature at a depth of 5 cm (Tsoil ) is also shown.
Micrometeorology-based Flux MeasurementsPerhaps the most direct method available for measuring CO2 fluxes above a surface is the Eddy Covariance method, which was first proposed by Swinbank [10]. This method relies on measurements of the deviation (or so-called perturbation) of vertical wind velocity (w’) and of an associated scalar from their mean values. Taking CO2 flux (Fc) measurement as an example, vertical wind velocity perturbation (w’ ) and air CO2 density (CO2’ ) can be calculated from high frequency (usually 10 Hz) measurements of vertical wind velocity and air density accord-ing to:
w w w= −‘ (4)CO CO CO2 2 2= −‘ (5)
The over bar denotes time averaged values. Fc over a surface can be determined as:
F w COc = − 2‘ ‘ (6)
This method relies on measurements of the fluctuating com-ponents of vertical wind and CO2 density in the constant flux region of the surface-boundary layer (Monteith and Unsworth [11]).
Although it was proposed in the early 1950s (Swinbank [10]), this method was used over crop fields and other natural ecosys-tems only after development of fast-response sensors and computer data-acquisition equipment (Baldocchi et al. [12]). Most recently, this method has been widely used for the measurement of CO2 flux between natural vegetation and the atmosphere in the network of field stations for the research of global carbon budget, including AmeriFlux, CarboEurope, AsiaFlux, and the Canadian Carbon Program (Baldocchi et al. [13]; Verma et al. [14]).
5 - Surface Monitoring
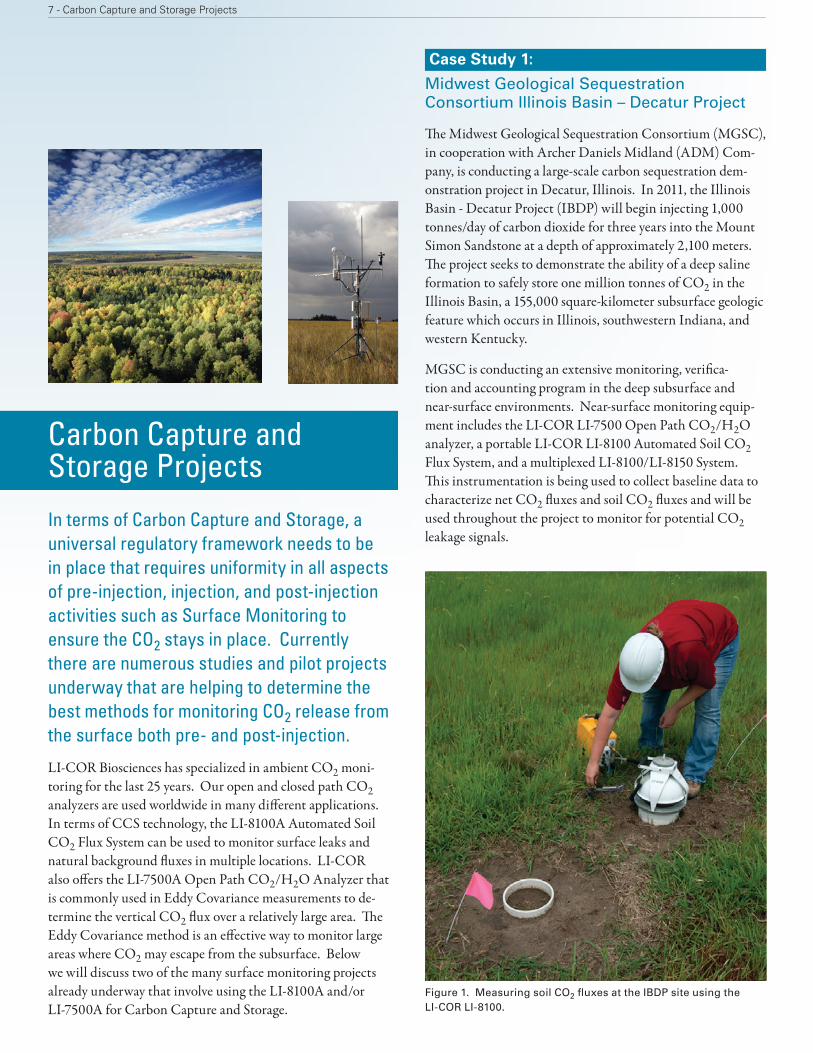
Sensors for Eddy Covari-ance measurement are normally mounted on a tower. The response time for sonic and gas analyzers must be 10 Hz or faster because spectrum analysis shows that the turbulent transport of any scalar in the surface boundary layer from eddy sizes range from 0.001 to 10 Hz. This method measures the average CO2 flux over an integrated area as seen by
the sonic anemometer and the gas analyzer. As a rule of thumb, this integrated area extends to a distance about 100 times the height of the sensors to the up-wind direction.
The requirements for making an Eddy Covariance CO2 flux measurement are (1) fast response of both the sonic anemom-eter and gas analyzer; (2) density correction arising from the fluxes of sensible heat and latent heat flux (Webb-Pearman-Leuning correction [15]), and (3) a relatively large, flat field site. For more information on how to make the Eddy Covariance CO2 flux measurement, printed and/or electronic copies of a handbook entitled ‘A Brief Practical Guide to Eddy Covariance Flux Measurements’, authored by LI-COR scientists, is available at: www.licor.com/ec-analyzers
LI-COR also offers an introductory course with hands-on training on site in Lincoln, NE. More information and registra-tion forms are available here: http://www.licor.com/ec-training.
Designed by LI-COR scientists, the course provides informa-tion on the general principles, requirements, applications, and processing steps of the Eddy Covariance method.
References
1. S.B. Verma. (1990). Micrometeorological methods for measur-ing surface fluxes of mass and energy. Remote Sensing Reviews, 5(1), 99-115.
2. J.M. Norman, R. Garcia and S.B. Verma. (1992). Soil surface CO2 fluxes and the carbon budget of a grassland. J. Geophys. Res., 97, 18,845-18,853.
3. E.A Davidson, K. Savage, L.V. Verchot, and R. Navarro. (2002). Minimizing artifacts and biases in chamber-based measurements of soil respiration. Agri. For. Meteorol. 113:21-37.
4. K.E. Savage and E.A. Davidson. (2003). A comparison of manual and automated systems for soil CO2 measurements: trade-offs between spatial and temporal resolution. J. Exp. Bot., 54, 891-899.
5. J. Irvine and B. Law. (2002). Contrasting Soil Respiration in young- and old-growth ponderosa pine forests. Global Change Biology. 8, 1183-1194.
6. G.L. Hutchinson, A.R. Mosier. (1981). Improved soil cover method for field measurement of nitrous oxide fluxes. Soil Sci. Soc. Am. J. 45:311-316.
7. F. Conen, and K.A. Smith. (1998). A re-examination of closed flux chamber methods for the measurement of trace gas emis-sion from soils to the atmosphere. Eur. J. Soil Sci. 49:701-707
8. L.K. Xu, M.D. Furtaw, R.A. Madsen, R.L. Garcia, D.J. An-derson and D.K. McDermitt. (2006). On maintaining pressure equilibrium between a soil CO2 flux chamber and ambient air. J. Geophys. Res. Atm. 111, D08S10, doi:10.1029/2005JD006435.
9. J.M. Welles, T.H. Demetriades-Shah and D.K. McDermitt. (2001). Considerations for measuring ground CO2 effluxes with chambers. Chemical Geol. 177, 3-13.
10. W.C Swinbank. (1951). The measurement of the vertical transfer of heat. J. Meteorol. 8, 135-145.
11. J.L. Monteith and M.H. Unsworth. (1990). Principals of Envi-ronmental Physics. Edward Arnold, London
12. D.D. Baldocchi, B.B Hicks, and T.P. Meyers. (1988) Measuring biosphere–atmosphere exchanges of biologically related gases with micrometeorological methods. Ecology, 69, 1331–1340.
13. D.D. Baldocchi, E. Falge, and L.Gu et al. (2001). Fluxnet: a new tool to study the temporal and spatial variability of ecosys-tem-scale carbon dioxide, water vapor and energy flux densities. Bull. Am. Meteorol. Soc. 82, 2415–2434.
14. S.B. Verma, A. Dobermann and K.G. Cassman et al. (2005) Annual CO2 exchange in irrigated and rainfed maize-based agro- ecosystems. Agricultural and Forest Meteorology, 131, 77–96.
15. E.K. Webb, G.I. Pearman and R. Leuning. (1980) Correction of flux measurements for density effects due to heat and water va-pour transfer. Quarterly Journal of Royal Meteorological Society, 106, 85–100.
Figure 5. An example of the instrumentation setup for an Eddy Covariance flux measure-ment. Picture shows a 3-D sonic anemometer (Gill Windmaster™, Gill Instruments Ltd., Lymington, England) and an Open Path CO2/H2O analyzer (LI-7500A, LI-COR Biosciences, Lincoln, NE).
Micrometeorology-based Flux Measurements - 6
In terms of Carbon Capture and Storage, a universal regulatory framework needs to be in place that requires uniformity in all aspects of pre-injection, injection, and post-injection activities such as Surface Monitoring to ensure the CO2 stays in place. Currently there are numerous studies and pilot projects underway that are helping to determine the best methods for monitoring CO2 release from the surface both pre- and post-injection.
LI-COR Biosciences has specialized in ambient CO2 moni-toring for the last 25 years. Our open and closed path CO2 analyzers are used worldwide in many different applications. In terms of CCS technology, the LI-8100A Automated Soil CO2 Flux System can be used to monitor surface leaks and natural background fluxes in multiple locations. LI-COR also offers the LI-7500A Open Path CO2/H2O Analyzer that is commonly used in Eddy Covariance measurements to de-termine the vertical CO2 flux over a relatively large area. The Eddy Covariance method is an effective way to monitor large areas where CO2 may escape from the subsurface. Below we will discuss two of the many surface monitoring projects already underway that involve using the LI-8100A and/or LI-7500A for Carbon Capture and Storage.
Case Study 1:
Midwest Geological Sequestration Consortium Illinois Basin – Decatur Project
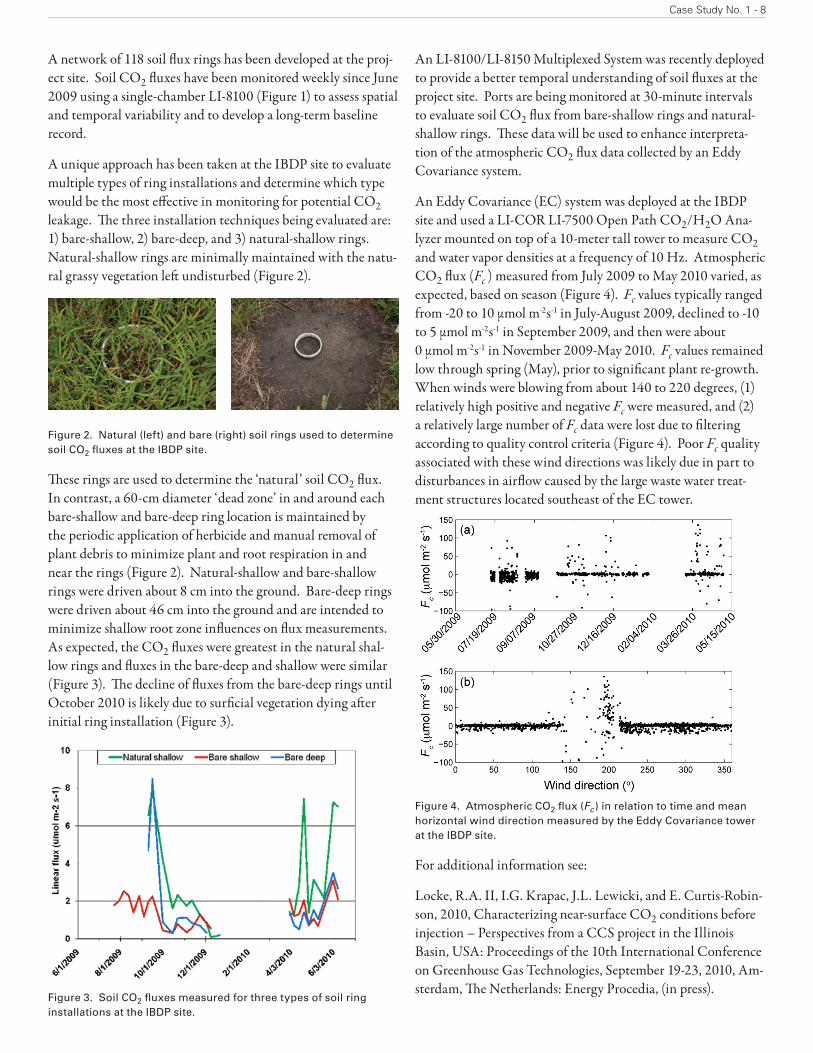
The Midwest Geological Sequestration Consortium (MGSC), in cooperation with Archer Daniels Midland (ADM) Com-pany, is conducting a large-scale carbon sequestration dem-onstration project in Decatur, Illinois. In 2011, the Illinois Basin - Decatur Project (IBDP) will begin injecting 1,000 tonnes/day of carbon dioxide for three years into the Mount Simon Sandstone at a depth of approximately 2,100 meters. The project seeks to demonstrate the ability of a deep saline formation to safely store one million tonnes of CO2 in the Illinois Basin, a 155,000 square-kilometer subsurface geologic feature which occurs in Illinois, southwestern Indiana, and western Kentucky.
MGSC is conducting an extensive monitoring, verifica-tion and accounting program in the deep subsurface and near-surface environments. Near-surface monitoring equip-ment includes the LI-COR LI-7500 Open Path CO2/H2O analyzer, a portable LI-COR LI-8100 Automated Soil CO2 Flux System, and a multiplexed LI-8100/LI-8150 System. This instrumentation is being used to collect baseline data to characterize net CO2 fluxes and soil CO2 fluxes and will be used throughout the project to monitor for potential CO2 leakage signals.
Figure 1. Measuring soil CO2 fluxes at the IBDP site using the LI-COR LI-8100.
7 - Carbon Capture and Storage Projects
Carbon Capture and Storage Projects
A network of 118 soil flux rings has been developed at the proj-ect site. Soil CO2 fluxes have been monitored weekly since June 2009 using a single-chamber LI-8100 (Figure 1) to assess spatial and temporal variability and to develop a long-term baseline record.
A unique approach has been taken at the IBDP site to evaluate multiple types of ring installations and determine which type would be the most effective in monitoring for potential CO2 leakage. The three installation techniques being evaluated are: 1) bare-shallow, 2) bare-deep, and 3) natural-shallow rings. Natural-shallow rings are minimally maintained with the natu-ral grassy vegetation left undisturbed (Figure 2).
Figure 2. Natural (left) and bare (right) soil rings used to determine soil CO2 fluxes at the IBDP site.
These rings are used to determine the ‘natural’ soil CO2 flux. In contrast, a 60-cm diameter ‘dead zone’ in and around each bare-shallow and bare-deep ring location is maintained by the periodic application of herbicide and manual removal of plant debris to minimize plant and root respiration in and near the rings (Figure 2). Natural-shallow and bare-shallow rings were driven about 8 cm into the ground. Bare-deep rings were driven about 46 cm into the ground and are intended to minimize shallow root zone influences on flux measurements. As expected, the CO2 fluxes were greatest in the natural shal-low rings and fluxes in the bare-deep and shallow were similar (Figure 3). The decline of fluxes from the bare-deep rings until October 2010 is likely due to surficial vegetation dying after initial ring installation (Figure 3).
Figure 3. Soil CO2 fluxes measured for three types of soil ring installations at the IBDP site.
An LI-8100/LI-8150 Multiplexed System was recently deployed to provide a better temporal understanding of soil fluxes at the project site. Ports are being monitored at 30-minute intervals to evaluate soil CO2 flux from bare-shallow rings and natural-shallow rings. These data will be used to enhance interpreta-tion of the atmospheric CO2 flux data collected by an Eddy Covariance system.
An Eddy Covariance (EC) system was deployed at the IBDP site and used a LI-COR LI-7500 Open Path CO2/H2O Ana-lyzer mounted on top of a 10-meter tall tower to measure CO2 and water vapor densities at a frequency of 10 Hz. Atmospheric CO2 flux (Fc ) measured from July 2009 to May 2010 varied, as expected, based on season (Figure 4). Fc values typically ranged from -20 to 10 μmol m-2s-1 in July-August 2009, declined to -10 to 5 μmol m-2s-1 in September 2009, and then were about 0 μmol m-2s-1 in November 2009-May 2010. Fc values remained low through spring (May), prior to significant plant re-growth. When winds were blowing from about 140 to 220 degrees, (1) relatively high positive and negative Fc were measured, and (2) a relatively large number of Fc data were lost due to filtering according to quality control criteria (Figure 4). Poor Fc quality associated with these wind directions was likely due in part to disturbances in airflow caused by the large waste water treat-ment structures located southeast of the EC tower.
Figure 4. Atmospheric CO2 flux (Fc ) in relation to time and mean horizontal wind direction measured by the Eddy Covariance tower at the IBDP site.
For additional information see:
Locke, R.A. II, I.G. Krapac, J.L. Lewicki, and E. Curtis-Robin-son, 2010, Characterizing near-surface CO2 conditions before injection – Perspectives from a CCS project in the Illinois Basin, USA: Proceedings of the 10th International Conference on Greenhouse Gas Technologies, September 19-23, 2010, Am-sterdam, The Netherlands: Energy Procedia, (in press).
Case Study No. 1 - 8
Case Study 2:
SECARB Black Warrior Injection Test, Tuscaloosa County, Alabama
The Black Warrior Basin has produced a large quantity of coal-bed methane and has the potential for considerable enhanced coalbed methane production. Additionally, as bituminous coal can adsorb approximately twice as much CO2 as methane at reservoir pressure, the basin has significant potential for CO2 sequestration. A field test is being conducted and has been designed to test reservoir conditions in the three primary target coal zones.* A number of monitoring activities are planned for the site, including reservoir pressure monitoring in deep observation wells, fluid and pH monitoring in each coal bed, shallow groundwater quality monitoring, soil gas composi-tion, conservative tracers, and soil CO2 flux monitoring. A set of soil gas samples was collected and soil flux monitoring was performed at a control site located in Deerlick Creek to provide additional background information on near surface conditions in the region. Preliminary results indicate that a significant volume of CO2 is found in the soil profile and carbon isotopic data suggests that the CO2 is of bacterial origin. Soil CO2 flux data was collected for nine months and indicated a high vari-ability among individual sites and through time. The data show significant seasonal variations, with high flux rates during the warm months associated with high soil activity and low flux rates during the winter months.
*Author’s Note: As of the time of printing, this study was recently completed.
Introduction
The Black Warrior Basin has produced more than 2 Tcf of coalbed methane and the basin is conservatively estimated to have the potential to store 5.9 Tcf of CO2 in mature reservoirs. Based on this estimate, sequestration of CO2 would enhance coalbed methane recovery, increasing reserves by more than 20 percent [1]. A field verification test program of carbon seques-tration in coal is being conducted in the Black Warrior Basin under the auspices of the U.S. Department of Energy’s South-eastern Regional Carbon Sequestration Partnership (SECARB [2]). The test is a small-scale, short-term test in an area where technical feasibility and commercial applicability are considered to be high. Part of this project is to begin to develop and dem-onstrate technology to ensure the safe and permanent storage of CO2 in coal seams.
Project Design
The project focuses on the injection of about 1,000 tons of CO2 into a mature coalbed methane well and a series of buildup and falloff tests that will be monitored in the injection well and
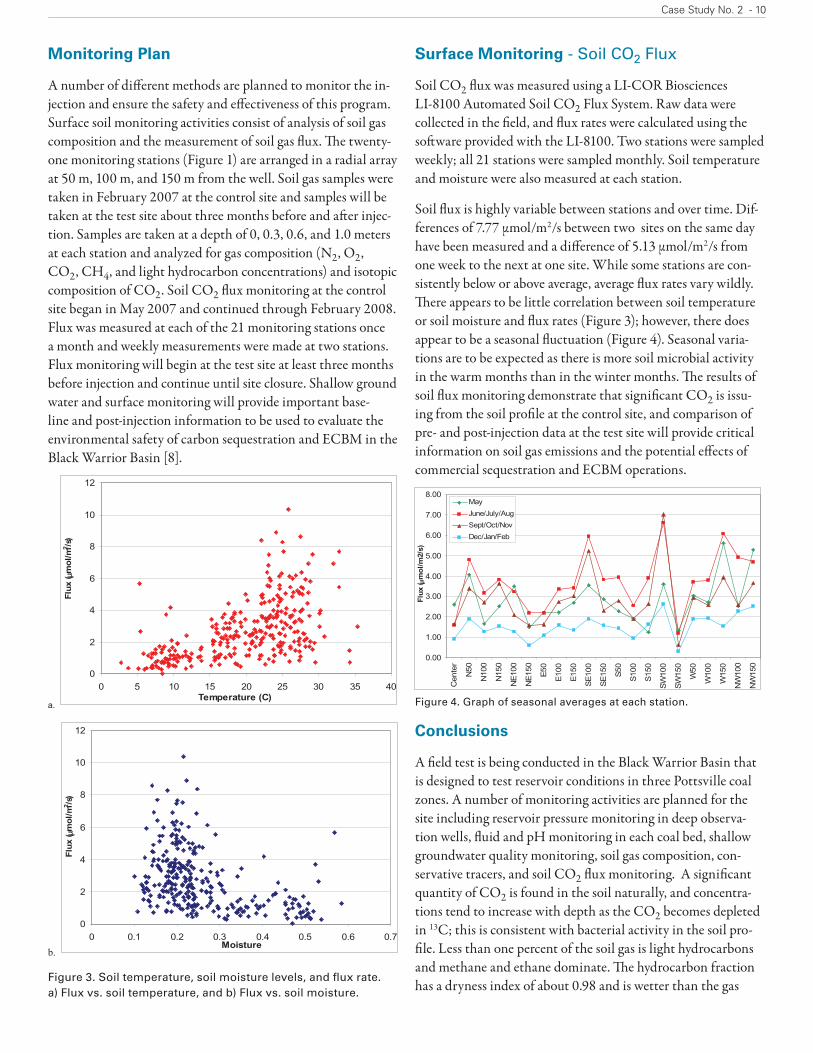
a series of remote observation wells. Before the injection test, one shallow water observation well and three deep observation wells will be drilled (Figures 1 and 2), and the injection well’s mechanical integrity will be tested to ensure that the test can be conducted safely. Coal samples from cores in the deep wells will be sent off to have adsorption isotherms for CH4 and CO2 run, for remaining gas in place analysis, and for proximate, ultimate, and petrographic analysis.
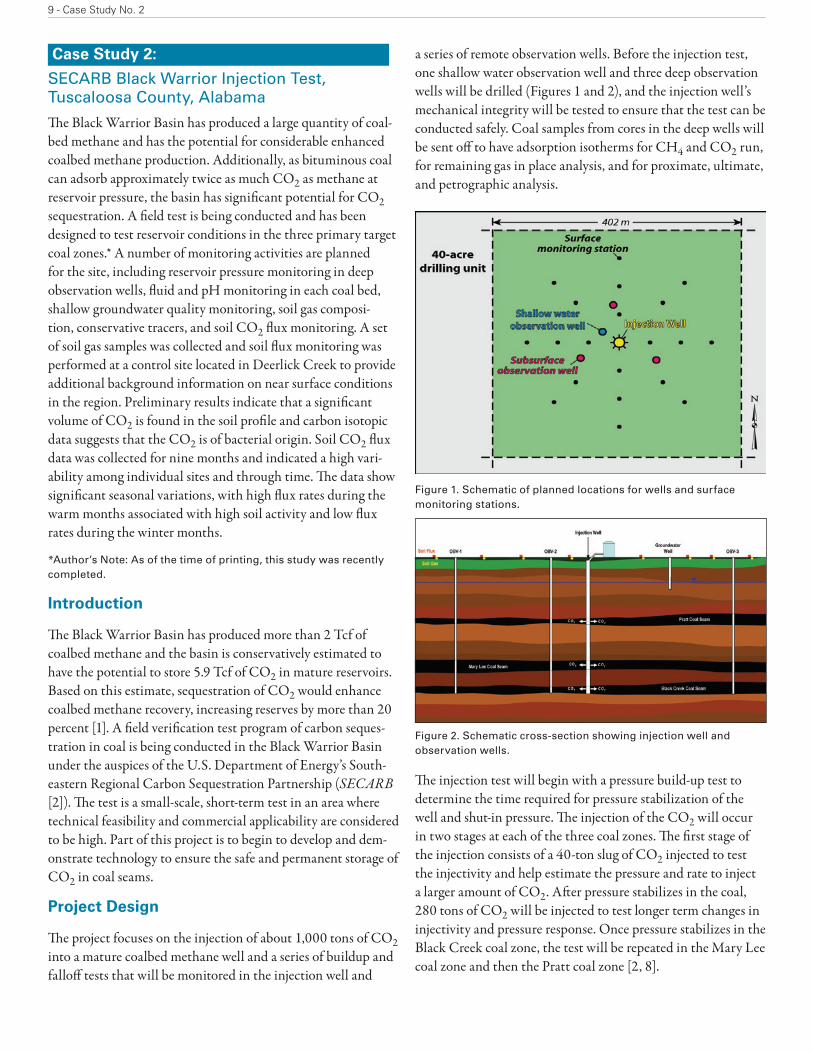
Figure 1. Schematic of planned locations for wells and surface monitoring stations.
Figure 2. Schematic cross-section showing injection well and observation wells.
The injection test will begin with a pressure build-up test to determine the time required for pressure stabilization of the well and shut-in pressure. The injection of the CO2 will occur in two stages at each of the three coal zones. The first stage of the injection consists of a 40-ton slug of CO2 injected to test the injectivity and help estimate the pressure and rate to inject a larger amount of CO2. After pressure stabilizes in the coal, 280 tons of CO2 will be injected to test longer term changes in injectivity and pressure response. Once pressure stabilizes in the Black Creek coal zone, the test will be repeated in the Mary Lee coal zone and then the Pratt coal zone [2, 8].
9 - Case Study No. 2
Case Study No. 2 - 10
Monitoring Plan
A number of different methods are planned to monitor the in-jection and ensure the safety and effectiveness of this program. Surface soil monitoring activities consist of analysis of soil gas composition and the measurement of soil gas flux. The twenty-one monitoring stations (Figure 1) are arranged in a radial array at 50 m, 100 m, and 150 m from the well. Soil gas samples were taken in February 2007 at the control site and samples will be taken at the test site about three months before and after injec-tion. Samples are taken at a depth of 0, 0.3, 0.6, and 1.0 meters at each station and analyzed for gas composition (N2, O2, CO2, CH4, and light hydrocarbon concentrations) and isotopic composition of CO2. Soil CO2 flux monitoring at the control site began in May 2007 and continued through February 2008. Flux was measured at each of the 21 monitoring stations once a month and weekly measurements were made at two stations. Flux monitoring will begin at the test site at least three months before injection and continue until site closure. Shallow ground water and surface monitoring will provide important base-line and post-injection information to be used to evaluate the environmental safety of carbon sequestration and ECBM in the Black Warrior Basin [8].
a.
0
2
4
6
8
10
12
0 5 10 15 20 25 30 35 40Temperature (C)
Flu
x ( μ
mo
l/m
2/s
)
b.
0
2
4
6
8
10
12
0 0.1 0.2 0.3 0.4 0.5 0.6 0.7Moisture
Flu
x ( μ
mo
l/m
2/s
)
Surface Monitoring - Soil CO2 Flux
Soil CO2 flux was measured using a LI-COR Biosciences LI-8100 Automated Soil CO2 Flux System. Raw data were collected in the field, and flux rates were calculated using the software provided with the LI-8100. Two stations were sampled weekly; all 21 stations were sampled monthly. Soil temperature and moisture were also measured at each station.
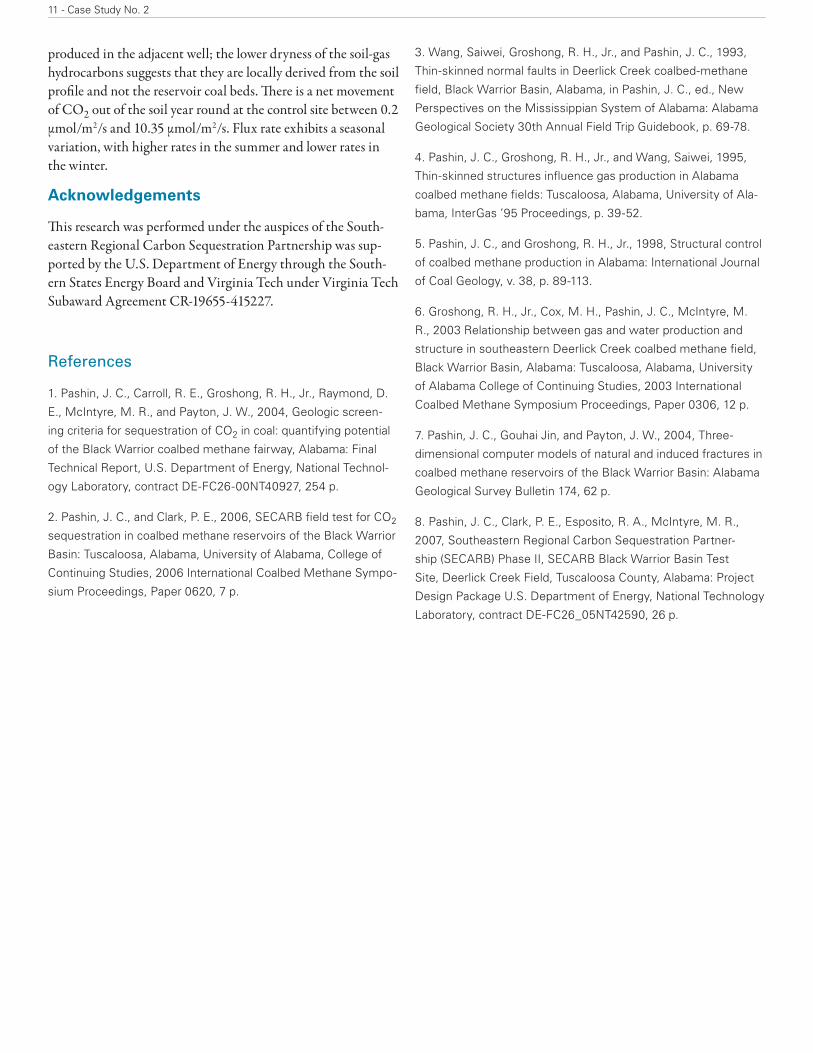
Soil flux is highly variable between stations and over time. Dif-ferences of 7.77 µmol/m2/s between two sites on the same day have been measured and a difference of 5.13 µmol/m2/s from one week to the next at one site. While some stations are con-sistently below or above average, average flux rates vary wildly. There appears to be little correlation between soil temperature or soil moisture and flux rates (Figure 3); however, there does appear to be a seasonal fluctuation (Figure 4). Seasonal varia-tions are to be expected as there is more soil microbial activity in the warm months than in the winter months. The results of soil flux monitoring demonstrate that significant CO2 is issu-ing from the soil profile at the control site, and comparison of pre- and post-injection data at the test site will provide critical information on soil gas emissions and the potential effects of commercial sequestration and ECBM operations.
0.00
1.00
2.00
3.00
4.00
5.00
6.00
7.00
8.00
Cente
r
N50
N100
N150
NE
100
NE
150
E50
E100
E150
SE
100
SE
150
S50
S100
S150
SW
100
SW
150
W50
W100
W150
NW
100
NW
150
May
June/July/Aug
Sept/Oct/Nov
Dec/Jan/Feb
Flu
x ( μ
mo
l/m
2/s
)
Figure 4. Graph of seasonal averages at each station.
Conclusions
A field test is being conducted in the Black Warrior Basin that is designed to test reservoir conditions in three Pottsville coal zones. A number of monitoring activities are planned for the site including reservoir pressure monitoring in deep observa-tion wells, fluid and pH monitoring in each coal bed, shallow groundwater quality monitoring, soil gas composition, con-servative tracers, and soil CO2 flux monitoring. A significant quantity of CO2 is found in the soil naturally, and concentra-tions tend to increase with depth as the CO2 becomes depleted in 13C; this is consistent with bacterial activity in the soil pro-file. Less than one percent of the soil gas is light hydrocarbons and methane and ethane dominate. The hydrocarbon fraction has a dryness index of about 0.98 and is wetter than the gas Figure 3. Soil temperature, soil moisture levels, and flux rate.
a) Flux vs. soil temperature, and b) Flux vs. soil moisture.
11 - Case Study No. 2
produced in the adjacent well; the lower dryness of the soil-gas hydrocarbons suggests that they are locally derived from the soil profile and not the reservoir coal beds. There is a net movement of CO2 out of the soil year round at the control site between 0.2 µmol/m2/s and 10.35 µmol/m2/s. Flux rate exhibits a seasonal variation, with higher rates in the summer and lower rates in the winter.
Acknowledgements
This research was performed under the auspices of the South-eastern Regional Carbon Sequestration Partnership was sup-ported by the U.S. Department of Energy through the South-ern States Energy Board and Virginia Tech under Virginia Tech Subaward Agreement CR-19655-415227.
References
1. Pashin, J. C., Carroll, R. E., Groshong, R. H., Jr., Raymond, D.
E., McIntyre, M. R., and Payton, J. W., 2004, Geologic screen-
ing criteria for sequestration of CO2 in coal: quantifying potential
of the Black Warrior coalbed methane fairway, Alabama: Final
Technical Report, U.S. Department of Energy, National Technol-
ogy Laboratory, contract DE-FC26-00NT40927, 254 p.
2. Pashin, J. C., and Clark, P. E., 2006, SECARB field test for CO2
sequestration in coalbed methane reservoirs of the Black Warrior
Basin: Tuscaloosa, Alabama, University of Alabama, College of
Continuing Studies, 2006 International Coalbed Methane Sympo-
sium Proceedings, Paper 0620, 7 p.
3. Wang, Saiwei, Groshong, R. H., Jr., and Pashin, J. C., 1993,
Thin-skinned normal faults in Deerlick Creek coalbed-methane
field, Black Warrior Basin, Alabama, in Pashin, J. C., ed., New
Perspectives on the Mississippian System of Alabama: Alabama
Geological Society 30th Annual Field Trip Guidebook, p. 69-78.
4. Pashin, J. C., Groshong, R. H., Jr., and Wang, Saiwei, 1995,
Thin-skinned structures influence gas production in Alabama
coalbed methane fields: Tuscaloosa, Alabama, University of Ala-
bama, InterGas ’95 Proceedings, p. 39-52.
5. Pashin, J. C., and Groshong, R. H., Jr., 1998, Structural control
of coalbed methane production in Alabama: International Journal
of Coal Geology, v. 38, p. 89-113.
6. Groshong, R. H., Jr., Cox, M. H., Pashin, J. C., McIntyre, M.
R., 2003 Relationship between gas and water production and
structure in southeastern Deerlick Creek coalbed methane field,
Black Warrior Basin, Alabama: Tuscaloosa, Alabama, University
of Alabama College of Continuing Studies, 2003 International
Coalbed Methane Symposium Proceedings, Paper 0306, 12 p.
7. Pashin, J. C., Gouhai Jin, and Payton, J. W., 2004, Three-
dimensional computer models of natural and induced fractures in
coalbed methane reservoirs of the Black Warrior Basin: Alabama
Geological Survey Bulletin 174, 62 p.
8. Pashin, J. C., Clark, P. E., Esposito, R. A., McIntyre, M. R.,
2007, Southeastern Regional Carbon Sequestration Partner-
ship (SECARB) Phase II, SECARB Black Warrior Basin Test
Site, Deerlick Creek Field, Tuscaloosa County, Alabama: Project
Design Package U.S. Department of Energy, National Technology
Laboratory, contract DE-FC26_05NT42590, 26 p.
Carbon Capture and Sequestration (CCS) technologies have significant potential to reduce atmospheric CO2 emissions by permanently storing CO2 in underground geologic formations. As recently as 2004, however, there were few educational programs that focused on implementing and managing CCS programs. This left people who were interested in climate change solutions with few opportunities to learn about CCS technologies.
Pamela Tomski recognized this deficit and responded by starting the Research Experience in Carbon Sequestration (RECS) program. RECS provides training and education for early-career professionals and students through a combination of classroom instruction and field activities, which typically include visits to a geologic CO2 storage site, power plant, and natural CO2 reservoir. Participants learn about CCS topics that encompass energy studies, geology, climate science, and related fields.
Tomski organized the first RECS program in 2004 with support from the U.S. Department of Energy and other private organizations. The RECS program has been popular since its inception – and has seen a steady increase in interest. In 2010 RECS selected 30 participants out of several hundred applicants. In the future Tomski hopes to expand the program and hold two training sessions each year.
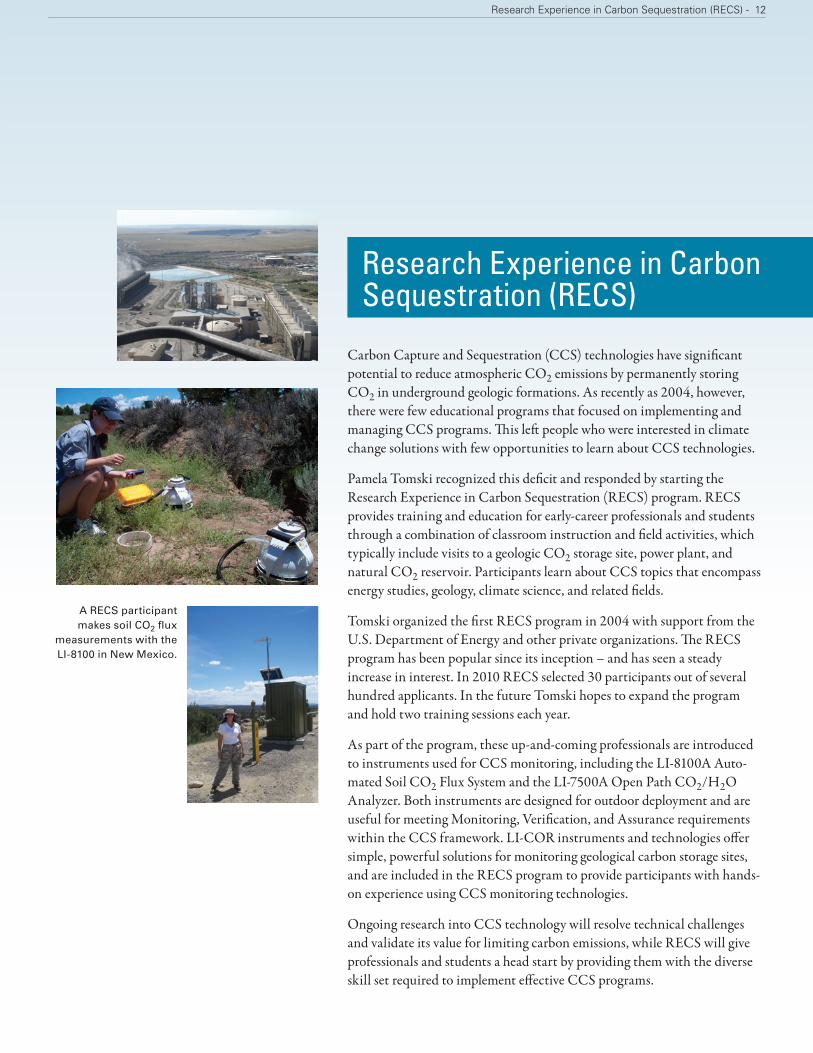
As part of the program, these up-and-coming professionals are introduced to instruments used for CCS monitoring, including the LI-8100A Auto-mated Soil CO2 Flux System and the LI-7500A Open Path CO2/H2O Analyzer. Both instruments are designed for outdoor deployment and are useful for meeting Monitoring, Verification, and Assurance requirements within the CCS framework. LI-COR instruments and technologies offer simple, powerful solutions for monitoring geological carbon storage sites, and are included in the RECS program to provide participants with hands-on experience using CCS monitoring technologies.
Ongoing research into CCS technology will resolve technical challenges and validate its value for limiting carbon emissions, while RECS will give professionals and students a head start by providing them with the diverse skill set required to implement effective CCS programs.
Research Experience in Carbon Sequestration (RECS) - 12
A RECS participant makes soil CO2 flux
measurements with the LI-8100 in New Mexico.
Research Experience in Carbon Sequestration (RECS)
13 - Zero Emission Research and Technology (ZERT) Center
The Zero Emission Research and Technology (ZERT) Center is a research group focused on understanding the basic science of underground (geologic) CO2 storage and for developing tools to ensure safety and reliability. ZERT is a collaboration involv-ing several private corporations, DOE laboratories (Los Alamos National Lab, Lawrence Berkeley National Lab, National En-ergy Technology Lab, Lawrence Livermore National Lab, and Pacific Northwest National Lab), as well as Montana State and West Virginia University.
In order to understand the possible fates of injected CO2, ZERT is performing laboratory experiments to understand CO2 physical and chemical interaction with geologic formation minerals and fluids. ZERT is also developing monitoring and verification techniques to determine the behavior of the under-ground CO2 and underground storage capacity for different geologic formations.
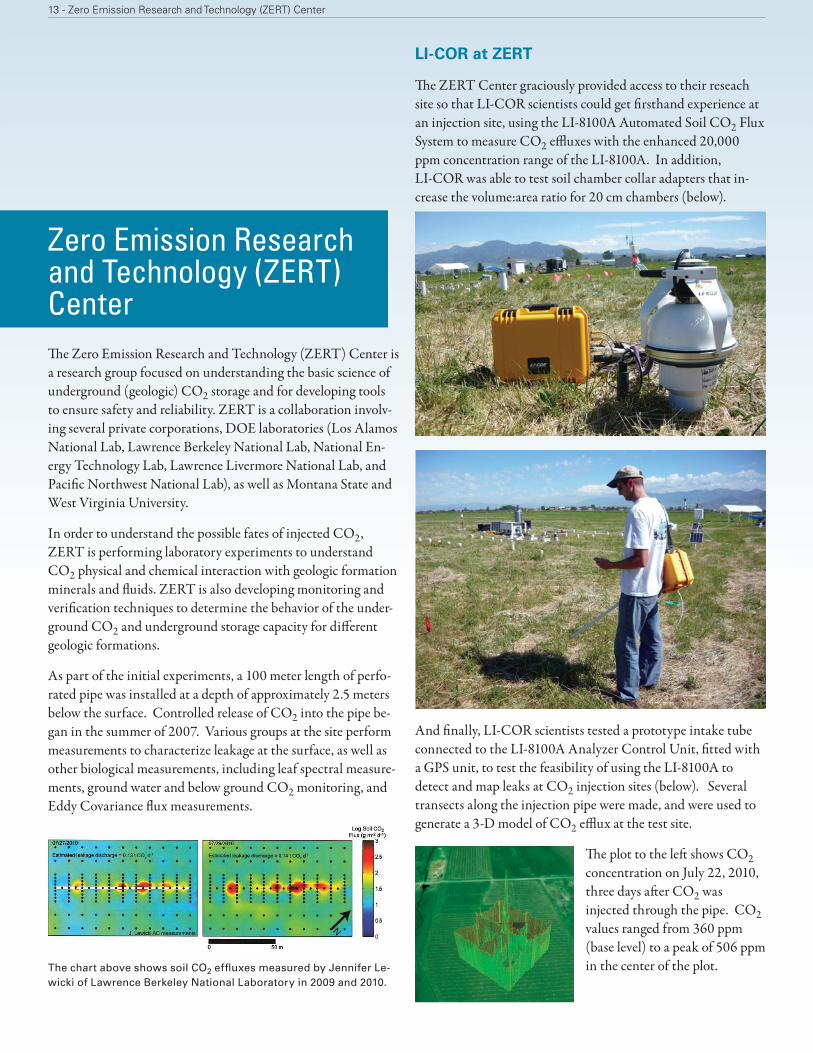
As part of the initial experiments, a 100 meter length of perfo-rated pipe was installed at a depth of approximately 2.5 meters below the surface. Controlled release of CO2 into the pipe be-gan in the summer of 2007. Various groups at the site perform measurements to characterize leakage at the surface, as well as other biological measurements, including leaf spectral measure-ments, ground water and below ground CO2 monitoring, and Eddy Covariance flux measurements.
The chart above shows soil CO2 effluxes measured by Jennifer Le-wicki of Lawrence Berkeley National Laboratory in 2009 and 2010.
LI-COR at ZERT
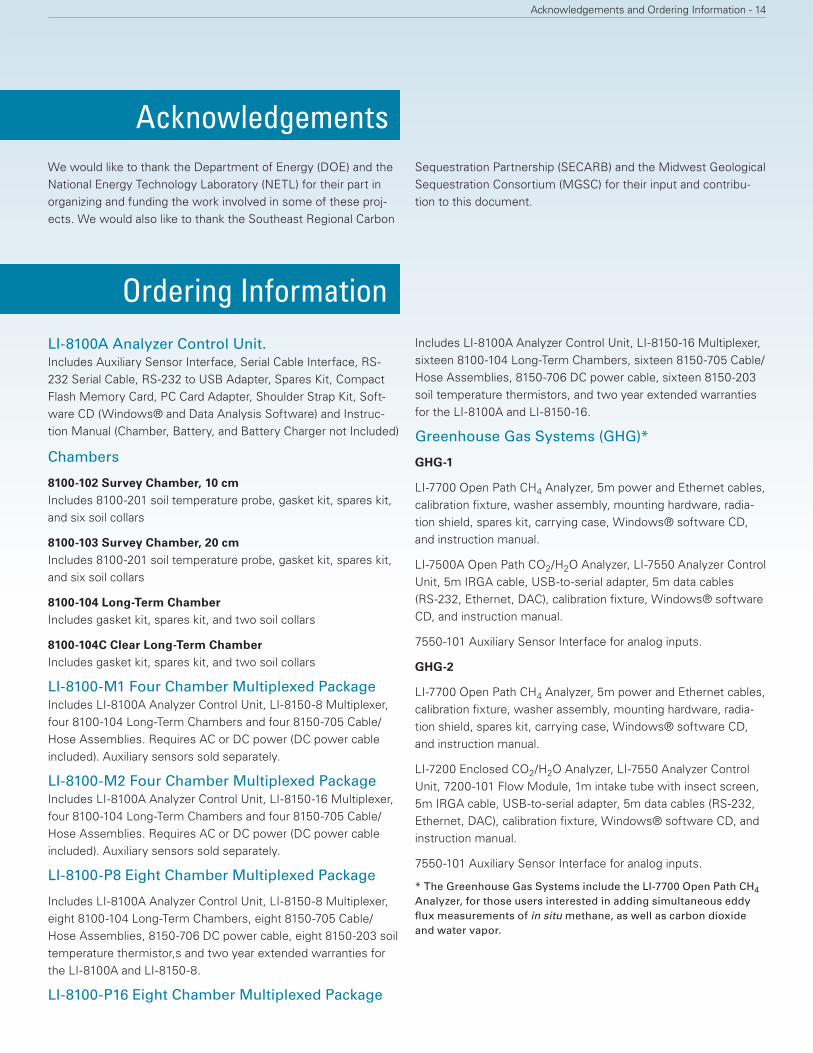
The ZERT Center graciously provided access to their reseach site so that LI-COR scientists could get firsthand experience at an injection site, using the LI-8100A Automated Soil CO2 Flux System to measure CO2 effluxes with the enhanced 20,000 ppm concentration range of the LI-8100A. In addition, LI-COR was able to test soil chamber collar adapters that in-crease the volume:area ratio for 20 cm chambers (below).
And finally, LI-COR scientists tested a prototype intake tube connected to the LI-8100A Analyzer Control Unit, fitted with a GPS unit, to test the feasibility of using the LI-8100A to detect and map leaks at CO2 injection sites (below). Several transects along the injection pipe were made, and were used to generate a 3-D model of CO2 efflux at the test site.
The plot to the left shows CO2 concentration on July 22, 2010, three days after CO2 was injected through the pipe. CO2 values ranged from 360 ppm (base level) to a peak of 506 ppm in the center of the plot.
Zero Emission Research and Technology (ZERT) Center
Acknowledgements and Ordering Information - 14
LI-8100A Analyzer Control Unit. Includes Auxiliary Sensor Interface, Serial Cable Interface, RS-232 Serial Cable, RS-232 to USB Adapter, Spares Kit, Compact Flash Memory Card, PC Card Adapter, Shoulder Strap Kit, Soft-ware CD (Windows® and Data Analysis Software) and Instruc-tion Manual (Chamber, Battery, and Battery Charger not Included)
Chambers
8100-102 Survey Chamber, 10 cm Includes 8100-201 soil temperature probe, gasket kit, spares kit, and six soil collars
8100-103 Survey Chamber, 20 cm Includes 8100-201 soil temperature probe, gasket kit, spares kit, and six soil collars
8100-104 Long-Term Chamber Includes gasket kit, spares kit, and two soil collars
8100-104C Clear Long-Term Chamber Includes gasket kit, spares kit, and two soil collars
LI-8100-M1 Four Chamber Multiplexed Package Includes LI-8100A Analyzer Control Unit, LI-8150-8 Multiplexer, four 8100-104 Long-Term Chambers and four 8150-705 Cable/Hose Assemblies. Requires AC or DC power (DC power cable included). Auxiliary sensors sold separately.
LI-8100-M2 Four Chamber Multiplexed Package Includes LI-8100A Analyzer Control Unit, LI-8150-16 Multiplexer, four 8100-104 Long-Term Chambers and four 8150-705 Cable/Hose Assemblies. Requires AC or DC power (DC power cable included). Auxiliary sensors sold separately.
LI-8100-P8 Eight Chamber Multiplexed Package
Includes LI-8100A Analyzer Control Unit, LI-8150-8 Multiplexer, eight 8100-104 Long-Term Chambers, eight 8150-705 Cable/Hose Assemblies, 8150-706 DC power cable, eight 8150-203 soil temperature thermistor,s and two year extended warranties for the LI-8100A and LI-8150-8.
LI-8100-P16 Eight Chamber Multiplexed Package
Includes LI-8100A Analyzer Control Unit, LI-8150-16 Multiplexer, sixteen 8100-104 Long-Term Chambers, sixteen 8150-705 Cable/Hose Assemblies, 8150-706 DC power cable, sixteen 8150-203 soil temperature thermistors, and two year extended warranties for the LI-8100A and LI-8150-16.
Greenhouse Gas Systems (GHG)*
GHG-1
LI-7700 Open Path CH4 Analyzer, 5m power and Ethernet cables, calibration fixture, washer assembly, mounting hardware, radia-tion shield, spares kit, carrying case, Windows® software CD, and instruction manual.
LI-7500A Open Path CO2/H2O Analyzer, LI-7550 Analyzer Control Unit, 5m IRGA cable, USB-to-serial adapter, 5m data cables (RS-232, Ethernet, DAC), calibration fixture, Windows® software CD, and instruction manual.
7550-101 Auxiliary Sensor Interface for analog inputs.
GHG-2
LI-7700 Open Path CH4 Analyzer, 5m power and Ethernet cables, calibration fixture, washer assembly, mounting hardware, radia-tion shield, spares kit, carrying case, Windows® software CD, and instruction manual.
LI-7200 Enclosed CO2/H2O Analyzer, LI-7550 Analyzer Control Unit, 7200-101 Flow Module, 1m intake tube with insect screen, 5m IRGA cable, USB-to-serial adapter, 5m data cables (RS-232, Ethernet, DAC), calibration fixture, Windows® software CD, and instruction manual.
7550-101 Auxiliary Sensor Interface for analog inputs.
* The Greenhouse Gas Systems include the LI-7700 Open Path CH4 Analyzer, for those users interested in adding simultaneous eddy flux measurements of in situ methane, as well as carbon dioxide and water vapor.
Ordering Information
We would like to thank the Department of Energy (DOE) and the National Energy Technology Laboratory (NETL) for their part in organizing and funding the work involved in some of these proj-ects. We would also like to thank the Southeast Regional Carbon
Sequestration Partnership (SECARB) and the Midwest Geological Sequestration Consortium (MGSC) for their input and contribu-tion to this document.
Acknowledgements

LI-COR® Biosciences
4647 Superior Street • Lincoln, Nebraska 68504 TEL: +1-402-467-3576 • FAX: +1-402-467-2819 [email protected] • [email protected] • www.licor.com/env Serving United States, Canada, and Mexico.
LI-COR GmbH, Germany • +49 (0) 6172 17 17 771 [email protected] • [email protected] Serving Andorra, Albania, Belarus, Cyprus, Estonia, Germany, Iceland, Latvia, Lithuania, Liechtenstein, Malta, Moldova, Monaco, San Marino, Ukraine and Vatican City.
LI-COR Ltd, United Kingdom • +44 (0) 1223 422102 [email protected] • [email protected] Serving UK, Ireland, and Scandinavia.
LI-COR Distributor Network: www.licor.com/env/distributors
Copyright 2013, LI-COR, Inc. Printed in the U.S.A.
5/2013 980-11916 Rev. 1
LI-COR® is a registered trademark of LI-COR, Inc. The LI-8100A product line is covered by U.S. and foreign patents pending, and U.S. patents including U.S. 7,509,836; 7,568,374; 7,748,253; and 7,856,899. The LI-7500A analyzer is covered by U.S. Patent #6,317,212 and foreign equivalents. The LI-7700 and LI-7200 analyzers are covered by U.S. Patents, patents pending and foreign equivalents. Windows® is a registered trademark of Microsoft. All brand and product names are trademarks or registered trademarks of their respective owners.
For patent information, visit www.licor.com/patents.
The LI-COR board of directors would like to take this opportunity to return thanks to God for His merciful providence in allowing LI-COR to develop and commercialize products, through the collective effort of dedicated employees, that enable the examination of the wonders of His works.
“Trust in the LORD with all your heart and do not lean on your own under-standing. In all your ways acknowledge Him, and He will make your paths straight.”
—Proverbs 3:5,6