surat municipal corporation - mohua.gov.inmohua.gov.in/upload/uploadfiles/files/surat.pdf · surat...
TRANSCRIPT

1
Surat Municipal Corporation
Category of Initiative : “Technical Innovation”
Title of the Initiative : “Leakage Mapping and its’ Positive Impact”
Presentation by : Jatin Shah, City Engineer, SMC

Location: Surat City
45
72
30
Palanpor
Jahangirabad
Pal
S D.T.P.S. NO-6
(Ve su)
D.T .P.S. NO-3(Run dh)
Rundh
D.T .P.S. NO-7(Vesu-Magdalla)
Magdalla
31
90
47
67
1006
H-21
TOWNSHIP
(SUDA)
O-58
P- 94
W.D.C.
(SUDA)
O-59
Garden
(SUDA)
O-63
Recreation
(S.U.D.A)
P-90
Water Distri.
Centre
(SUDA)
T-28
AerodromeComplex
(Civil Aviation Dept.)
Dumas
Vanta
Bhimpore
Sult anabad
Dumas
Abhava
TA
PI
RI
TA
PI
RI
VE
R
Magob
Kosad
3
Utran
Amroli
Chhapra
Bhatha
Ved
Jahangirpura
Pisad
T.P.S.NO.13
(Adajan)
T.P.S.NO.12
(Adajan)
T.P.S.NO.11(Adajan)
T.P.S.NO.1 4
(Rander Adajan)
Rander
D.T.P.S.NO.23
(Rander)
Singanpor
Dabholi Katargam
TunkiD.T .P.S. NO.24
T.P.S.NO.18(Katargam)
T.P.S.NO.3(Katargam)
T.P.S.NO .1
(Lal Darwa ja))
GAMTAL
G.I.D.C.
K a t a r g a m
T.P.S.NO.4Ashwanikumar Navagam
T.P.S.NO.8(Umarwada )
T.P.S.NO.3
( Karanj)
FulpadaD.T.P.S.NO.17
(Fulpada)
T.P.S.-15(Fulpada)
GAMTAL
G.I.D.CPandesara
172
Adajan
Althan
Bhimrad
Vesu
Bharthana
Vesu
DUMBHAL
Limbayat
Udhana
BhedvadPandesara
Bhatar
Bamroli
T.P.S.NO. 5Umra North
D.T.P.S. NO-2
Vesu-Bha rthana-Ve su
D.T .P.S. NO.-1(Vesu)
VESU
UMRA
S.W.P. CAMPUS
RE CREATION POND
AND GARDE N
S.V.P. ENGG. COLLEGEPIPLOD
BHART HANAVESU
SO UTH GUJARAT UNIVERCI TY
T.P.S.NO. 6PIPLOD
T.P.S. NO.10
( Adajan)
T.P.S. NO.4
Umr a Sou th
GUJARAT AGRICULTU RE
UNIVERCITY (PANAS FA RM )
T .P.S.NO. 5
Athwa Umra
T.P.S. NO.9
( Majura)
T.P.S.NO. 6
(Majura khatodra)
D.T.P.S. NO.21
(Bhestan)
UDHNA SAHKARISAN GH LIMITED
T.P.S. NO.7
( Anjana)
RAILW
AY
LAN
D
PRO
P.R
LY
SE WA GE DISPOSAL
PLANT
G.I.D.CESTATE
D.T.P.S.NO.22(Bhestan)
Vadod
Khajod
Sarsana
Gabheni
Un
SonariJiav
Budiya
Kosad
MotaVarachha
TA
PI
RI
VE
Sarthana
172
129
D.T.P.S. NO - 20
T.P.S. NO 16(Kapa dra )
D.T.P.S. NO - 20(Nana V arach ha-Kapadra)
Utran
Puna
Nanavarachha
Simada
Dindoli
Parvat
Godadra
76
G.H.B
G.H.B
G.H.B
G.I. D. CESTATE
G.I.D.CESTATE
Gaviar
Variav
Bhestan
G.E.B.
Power House
TO
OL
PAD
WEIR CUM CAUSE WAY
LOW LEVEL BRIDGE
EXTST.SA
RD
AR
BR
IDG
E
EXIST.NEHRU BRIDGE
SWAM
I VIVEKANAND BRIDGE
TO HAZIRA
TO D
AN
DI
TO BHESAN
TO HAZIRA
TO PA
LSAN
A
TO NAVSARI
TO
AH
ME
DA
BA
D
TO
KA
MR
EJ
TA
PI
RI
VE
TA
PI
RI
VE
TO BHUSAVAL
TO KADODRA
TO KATHOR
TO
KA
TH
OR
TO
MU
MB
AI
TO HAZIRA
NORTH ZONE69
29
53
3170
19
7
6257
12
18
60134041
17
10
344
37
33
3514
61
2123
32 3
25
3626
24
5255
4616
54
4222
47
20
65
11
6
64
1
5071
76
28
51
73
75
5
49
39
74 58 66
68
2
8
27
9
4448
3863
56
78
79
80
81
82
771543
59
67
Dumas
Gabheni
Vanta
EAST ZONE
ZONE
WEST ZONE
CENTRAL
SOUTH EAST ZONE
SOUTH ZONESOUTH WESTZONE
Surat City
GujaratI N D I A

Surat City
• 2nd largest city in Gujarat
• 9th largest in India
• Among the fastest growing cities in India.
• 42 % of the world’s total rough diamond
cutting and polishing,
• 70 % of the nation’s total rough diamond
cutting and polishing,
• 40 % of the nation’s total diamond
exports,
• 40 % of the nation’s total man made
fabric production,
• 28 % of the nation’s total man made
fibre production
• 18 % of the nation’s total man made
fibre export, and
• 12 % of the nation’s total fabric
production.
• Large number of textile process houses.
• Over 550 units granted Consent
GREATER SURAT IN REGIONAL CONTEXT
NAVSARI

Growth of City
• Historical Development Of Surat Dates Back To 300 BC.
• Municipality Established In 1852 AD.
• Municipal Corporation Formed In 1966.
Year Area in Sq. Km
Population(in Million)
1951 8.18 0.223
1961 8.18 0.288
1971 33.85 0.472
1981 55.56 0.776
1991 111.16 1.499
2001 112.27 2.434
2001* 326.51 2.877
2010 326.51 ~ 4.400
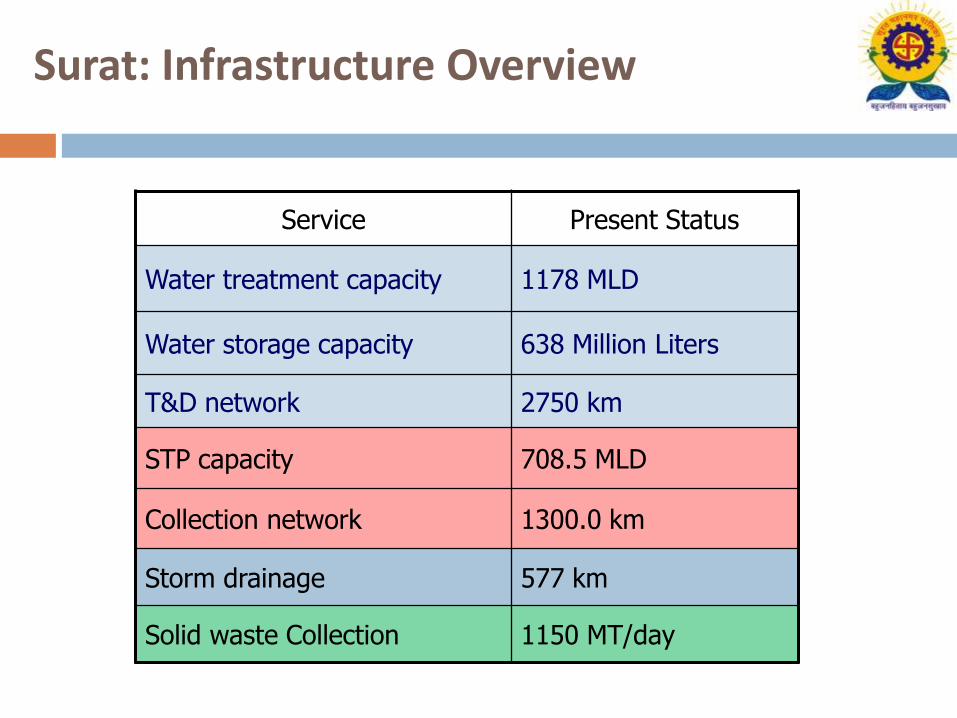
Surat: Infrastructure Overview
Service Present Status
Water treatment capacity 1178 MLD
Water storage capacity 638 Million Liters
T&D network 2750 km
STP capacity 708.5 MLD
Collection network 1300.0 km
Storm drainage 577 km
Solid waste Collection 1150 MT/day

6
Water Supply System of Surat City –
Present Status At a Glance
Population covered under piped network:- 86 % of projected pop. 44 Lacs
Area covered under piped network:-
(Area of city increased in year 2006 from 112.28 Sq.Km. to 326.51 Sq.km)
For area of city before extension : 98 %
For area of city after extension: 57 %
Source of Water: River Tapi
Total numbers of Water Works:- 4
Total numbers of Water Distribution Stations: 17
Total Installed capacity of all WTP:- 1178 MLD
Present gross daily average water supply: 780 MLD
Frequency of water supply: Average 3 hours daily
Total Storage capacity of all UGSR & ESR:- 638 ML
Total Approx. length of all water supply pipelines:- 2750 Km.

7
Leakage through pipelines – Reasons
Leakages may occur in water supply pipelines due to various reasons as shown in the diagram below.

8
Leakage through pipelines – A Nuisance
A small leak in the middle of a road can cause tremendous
trouble to the citizens.
It disrupts traffic on roads.
Less quantity of water to consumers than planned.
Loss of treated water amounts to a considerable financial
loss and therefore affecting sustainability of the system.
A leak of only one litre per minute corresponds to 525,600
litres per year.
Leaks increase operating costs
A potential source for contamination of treated safe water
9
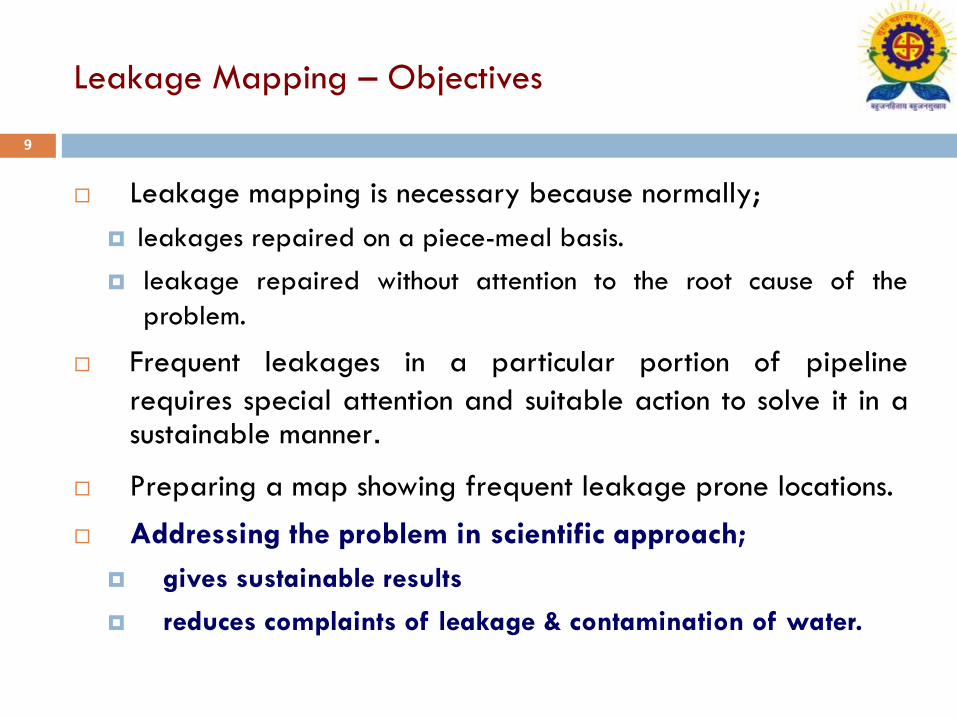
Leakage Mapping – Objectives
Leakage mapping is necessary because normally;
leakages repaired on a piece-meal basis.
leakage repaired without attention to the root cause of the
problem.
Frequent leakages in a particular portion of pipeline
requires special attention and suitable action to solve it in a sustainable manner.
Preparing a map showing frequent leakage prone locations.
Addressing the problem in scientific approach;
gives sustainable results
reduces complaints of leakage & contamination of water.

10
Leakage Mapping – Need of the hour
The Ministry of Urban Development, Government of India has
chosen the city of Surat among pilot cities for implementing
Service Level Benchmarking for four urban basic services and it
includes “Drinking water Supply”.
To achieve NRW within 20% standard limit is an important
parameter of Service Level Benchmarking (SLB), as suggested by
MoUD and adopted by SMC.
As a constant endeavour to achieve the targeted SLB, Non-
Revenue Water (NRW) cell of Surat Municipal Corporation has
started functioning.
Leakage Mapping is an important activity of NRW cell, Leakage Mapping is a “No cost, Low Cost initiative” to
bring down NRW.

Leakage Mapping – Mechanism Flow-chart
Leakage Complaint:
•Customer Complaint- Web/Helpline
•Departmental / Zonal leak detection team
Leakage Reporting:
•All Zones Report to HQ daily
•HE reports to Comm. weekly
Leakage Repairs
Water Pipeline
By Zones By Head Quarter By outsourcing (AMC)
Pipe < 550 mm dia.Pipe 550 -750 mm dia.
Pipe > 750 mm dia.
Frequent Leakage Mapping HQ-AutoCad – Monthly Review
Frequent Leakage Fault Finding & SolutionAfter Discussion with Leakage team/ Fitter
Remedial Measures Implementation

12
Customer Complaints - Leakage & Contamination
Customers’ leakage complaints are generally related to
ferrule level water connection.
Customer can make a complaint by;
Internet on SMC’s website www.suratminicipal.gov.in
helpline phone numbers
visiting nearest City Civic Center / ward office / zone office.
Customer complaints regarding leakage/contamination of
tap water attended within 24 hours.
Customers are informed by email/phone when their
complaints are resolved.
Customer’s feedback is also taken to know their level of
satisfaction

Complaint Management System (web)
14
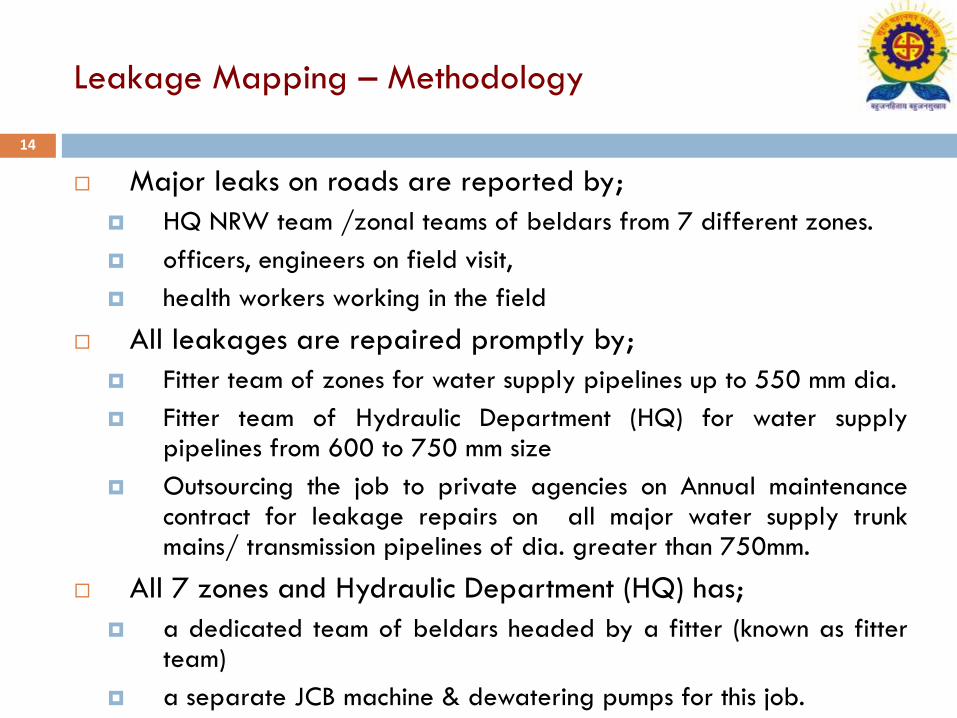
Leakage Mapping – Methodology
Major leaks on roads are reported by;
HQ NRW team /zonal teams of beldars from 7 different zones.
officers, engineers on field visit,
health workers working in the field
All leakages are repaired promptly by;
Fitter team of zones for water supply pipelines up to 550 mm dia.
Fitter team of Hydraulic Department (HQ) for water supply pipelines from 600 to 750 mm size
Outsourcing the job to private agencies on Annual maintenance contract for leakage repairs on all major water supply trunk mains/ transmission pipelines of dia. greater than 750mm.
All 7 zones and Hydraulic Department (HQ) has;
a dedicated team of beldars headed by a fitter (known as fitter team)
a separate JCB machine & dewatering pumps for this job.

15
Leakage Mapping – Methodology
All leakage complaints are registered by every zone in a separate register.
All zones prepare a summarized statement of all leakages including;
New leakages found,
Leakages repaired on the previous day
leakages under repairs
All zones report daily in a standard format to Hydraulic Department at Head Quarter.
Hydraulic Engineer prepares a summarized daily report of leakages for all zones.
Summarized report is reviewed by Municipal Commissioner in weekly meeting of Health & Engineering.

16
Leakage Mapping – Methodology
In weekly leakage report from all zones, frequent leakage spots
are sorted out and shown on water supply network map in
computer.
These spots are then observed carefully for the probable cause
during the leakage repairing and accordingly reported by the
concerned engineer of the department.
Remedial measures for these frequent leakage spots are then
taken as per the requirements.
Due to graphical presentation of leakage mapping, frequent
leakage spots do not escape unnoticed as a routine leakage
repairing exercise.
Regularly updated Leakage mapping acts like a History card for
water supply network at any point of time.

Case Study : Scientific Solution of A Leakage Spot

Case Study : Scientific Solution of A Leakage Spot

19
Water Supply Leakage Mapping –
Initiative started with Central Zone
Central zone of the city was found more leakage prone,
compared to others due to age old pipeline.
A study of leakage complaints received in past several
years gave an idea of preparing a map showing
frequent leakage prone locations.
In last 5 years, about 25000 meters of pipeline length
of 100 to 200 mm dia. was replaced in central zone.

20
LEAKAGE MAPPING – CENTRAL ZONE
21
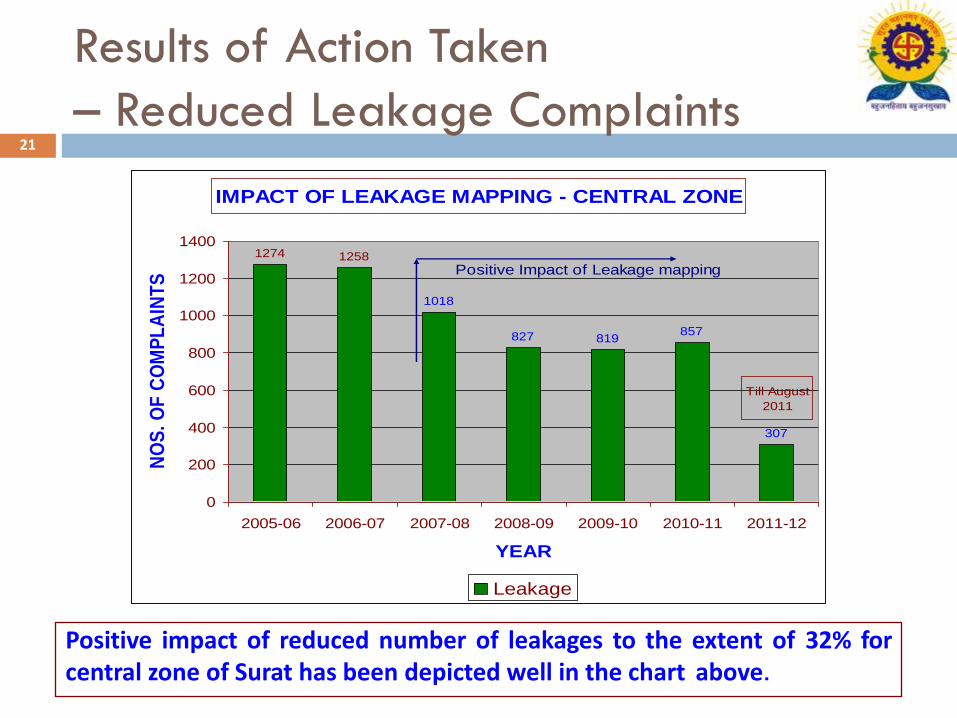
Results of Action Taken
– Reduced Leakage Complaints
Positive impact of reduced number of leakages to the extent of 32% forcentral zone of Surat has been depicted well in the chart above.
IMPACT OF LEAKAGE MAPPING - CENTRAL ZONE
1274 1258
1018
827 819857
307
0
200
400
600
800
1000
1200
1400
2005-06 2006-07 2007-08 2008-09 2009-10 2010-11 2011-12
YEAR
NO
S.
OF
CO
MP
LA
INT
S
Leakage
Positive Impact of Leakage mapping
Till August
2011

22
Leakage Mapping: Initiative in Rander Gamtal
Water supply pipelines in Rander Gamtal area are
very old - like in case of Central zone of the city.
During the span of 3 years before initiative, 274
complaints of leakages & 38 complaints for
contamination of water were attended in Rander
Gamtal area.
Leakage Mapping was carried out for Rander Gamtal
area and specific spots were identified.
As per Leakage Mapping, few pipelines in that area
are replaced stage-wise in year 2010-11.

23
Leakage Mapping - For Rander Gamtal area

24
Leakage Mapping – Rander Gamtal

25
Leakage Mapping - Details

26
Initiative : Entire Surat City
After successful implementation in central zone &Rander Gamtal (village area), the same initiativewas continued in other zones of the city too.
After mapping leakages in all zones of Surat, corrective action of changing the required pipelines, faulty valves etc. has been started.
Positive impact of reduced number of leakages to the extent of almost 30% per year for all zones of Surat.

27
Results of Action Taken
– Reduced Leakages – All Zones
IMPACT OF LEAKAGE MAPPING - ALL ZONES
9644 9903
710766336733
8392
2888
0
2000
4000
6000
8000
10000
12000
2005-06 2006-07 2007-08 2008-09 2009-10 2010-11 2011-12
YEAR
NO
S. O
F C
OM
PL
AIN
TS
Leakage
Positive Impact of Leakage mapping
Till August
2011

Reduced Nos. of Leakages per
Km of Pipe length
2.58
3.61
2.75 2.60
4.404.59
0.00
0.50
1.00
1.50
2.00
2.50
3.00
3.50
4.00
4.50
5.00
2005-06 2006-07 2007-08 2008-09 2009-10 2010-11
Year
Rati
o (
Leakag
es/P
ipe len
gth
)
Positive Impact of Leakage mapping

29
Frequent Leakage & Contamination spots attended
Sr. No. Area
Nos. of frequent
leakage spots
attended
Nos. of frequent
contamination
spots attended
1 Central Zone 22 13
2 Rander Gamtal 68 44
3 West Zone (except Rander gamtal) 7 0
4 North Zone 23 19
5 South Zone 33 11
6 East Zone 11 12
7 South-West Zone 17 4
8 South-East Zone 4 7
TOTAL 185 110

30
Quantifiable Benefits
All the benefits of leakage mapping can not be measured /
quantified due to being very dynamic in nature.
Hypothetical calculation of benefits due to leakage
mapping;
Problem of 185 frequent leakage spots & 110
contamination spots solved.
Prevented probable wastage of 708 ML potable water,
which saved almost Rs.21.24 Lacs
Road reinstatement after leakage repairs would have cost
almost Rs.191.16 Lacs
So, total Rs.212.40 Lacs saved through Leakage Mapping

31
Benefits
Saving of precious potable water & energy cost due
to less leakage problem.
Frequent digging of roads and concurrent chances of
damage to other services avoided – saving in cost.
Less chances of outbreak of water borne diseases.
Problem of water pressure can be solved partly.
Other socio-economical benefits can not be measured
in monetary terms.

32
Conclusion
“Leakage Mapping” History card for the water supply network.
A very simple yet effective method,
Very high potential for replication. “No cost, Low Cost initiative to bring down
NRW”.

33
“Let’s save water for our city, country and the world”