supporting remittances in southern africa · supporting remittances in southern africa ......
TRANSCRIPT
Supporting remittances in Southern Africa Estimating market potential and assessing regulatory obstacles Prepared for CGAP and FinMark Trust
i
16/05/2005 Author: Sarah Truen
Richard Ketley Hennie Bester Ben Davis Hugh-David Hutcheson Kofi Kwakwa Sydney Mogapi Genesis Analytics (Pty) Ltd 2nd Floor, No 3 Melrose Square, Melrose Arch, Johannesburg South Africa, 2196. Post to: Suite 3, Private Bag X1, Melrose Arch, Johannesburg, South Africa, 2076. Tel: +27 11 214 4080, Fax: +27 11 214 4099 www.genesis-analytics.com
ii
���������������
List of Figures vi
List of Tables vi
Executive Summary viii
1. INTRODUCTION 1
2. REGIONAL MIGRATION PATTERNS 4
2.1. Choice of countries 4
2.1.1. Data insufficiencies 6
Box 1: Reasons for excluding Zimbabwe 7
2.2. Quantifying migration 7
2.2.1. Inter-SADC migration 8
Box 2: Remittances and the undocumented migrant community 12
2.2.2. Domestic migration - South Africa 14
Box 3: Access to banking services for Mexican remitters in the US: the Matricula
card 16
3. SIZE OF THE REMITTANCE MARKET 17
3.1. Introduction 17
3.2. Current remittance flows 18
3.2.1. Estimating inter-SADC remittances 18 3.2.2. Estimating South African domestic remittances 20
4. REMITTANCE DEMAND CHARACTERISTICS 23
iii
4.1. Introduction 23
4.2. Focus group feedback 24
4.2.1. Principal findings 24
Box 4: Informal Funds Transfer Systems 30
Box 5: Taxi driver routes 33
Box 6: Latin American focus group findings 35
4.3. Remittance methods 36
4.3.1. Estimate of remittances per channel 39
Box 7: Channel usage characteristics 40
5. MONEY TRANSFER ALTERNATIVES – CURRENT AND EMERGING 42
5.1. Introduction 42
5.2. Current money transfer environment 43
5.3. New products and channels – domestic remittances 44
5.3.1. Domestic - banked 44
Box 8: The Mzansi account and remittances 46
Box 9: Mobile banking in practice 49
Box 10: Mobile banking challenges 50
5.3.2. Domestic unbanked 51
5.4. New products and channels – international remittances 55
5.4.1. International - banked 55
Box 11: Smart Padala – international mobile banking alternatives 56
iv
5.4.2. International - unbanked 57
Box 12: Teba Limited and Teba Bank 60
6. RANKING THE MODELS 61
6.1. Introduction 61
6.2. Volume estimates per emerging channel 62
6.3. Revenue estimates per emerging channel 66
7. REGULATORY ENVIRONMENT 67
7.1. Introduction 67
7.2. Exchange control 68
7.2.1. Background 68 7.2.2. Application to buy foreign exchange 69 7.2.3. Remitting money 69 7.2.4. Reporting system 72 7.2.5. The Post Office 72 7.2.6. Impact of exchange control on remittances 73 7.2.7. Impact of remittances on exchange control 76
7.3. Anti-money laundering 78
7.3.1. Customer due diligence (CDD) 78 7.3.2. Monitoring requirements 80 7.3.3. Intermediaries and correspondent banking 80 7.3.4. Impact of AML regulation 81
7.4. Immigration regulation 82
7.5. Proposed regulatory changes 84
7.5.1. Remove exchange control reporting requirements below a certain
threshold 84 7.5.2. A limited authorised dealer license for the remittance market 84 7.5.3. Extend exemption 17 to SADC / Africa 84
v
7.5.4. Facilitate remittances on presentation of a passport only 85
7.6. Quantifying regulatory barriers 85
8. CONCLUSIONS AND RECOMMENDATIONS 87
8.1. Remittance destinations and channels 87
8.2. Alternative business models 88
8.3. Regulatory barriers 89
8.4. Opportunity versus regulation 91
8.5. Policy recommendations 92
Bibliography 95
Appendix 1: FATF, Basel and FICA requirements 99
Appendix 2: Auhorised dealers in foreign exchange 112
Appendix 3: Migration estimate assumptions 114
Appendix 4: Country profiles 115
Appendix 5: Use of repatriations data 127
Appendix 6: Bias in repatriations 128
vi
���������� �����
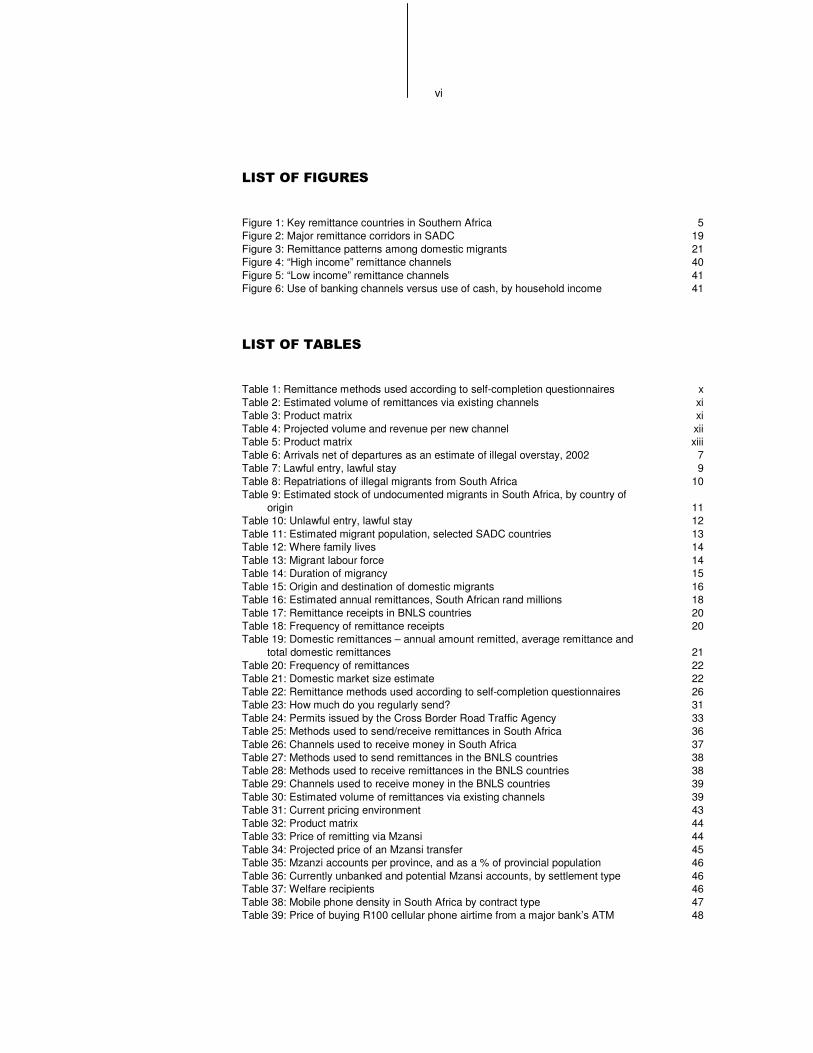
Figure 1: Key remittance countries in Southern Africa 5 Figure 2: Major remittance corridors in SADC 19 Figure 3: Remittance patterns among domestic migrants 21 Figure 4: “High income” remittance channels 40 Figure 5: “Low income” remittance channels 41 Figure 6: Use of banking channels versus use of cash, by household income 41
���������������
Table 1: Remittance methods used according to self-completion questionnaires x Table 2: Estimated volume of remittances via existing channels xi Table 3: Product matrix xi Table 4: Projected volume and revenue per new channel xii Table 5: Product matrix xiii Table 6: Arrivals net of departures as an estimate of illegal overstay, 2002 7 Table 7: Lawful entry, lawful stay 9 Table 8: Repatriations of illegal migrants from South Africa 10 Table 9: Estimated stock of undocumented migrants in South Africa, by country of
origin 11 Table 10: Unlawful entry, lawful stay 12 Table 11: Estimated migrant population, selected SADC countries 13 Table 12: Where family lives 14 Table 13: Migrant labour force 14 Table 14: Duration of migrancy 15 Table 15: Origin and destination of domestic migrants 16 Table 16: Estimated annual remittances, South African rand millions 18 Table 17: Remittance receipts in BNLS countries 20 Table 18: Frequency of remittance receipts 20 Table 19: Domestic remittances – annual amount remitted, average remittance and
total domestic remittances 21 Table 20: Frequency of remittances 22 Table 21: Domestic market size estimate 22 Table 22: Remittance methods used according to self-completion questionnaires 26 Table 23: How much do you regularly send? 31 Table 24: Permits issued by the Cross Border Road Traffic Agency 33 Table 25: Methods used to send/receive remittances in South Africa 36 Table 26: Channels used to receive money in South Africa 37 Table 27: Methods used to send remittances in the BNLS countries 38 Table 28: Methods used to receive remittances in the BNLS countries 38 Table 29: Channels used to receive money in the BNLS countries 39 Table 30: Estimated volume of remittances via existing channels 39 Table 31: Current pricing environment 43 Table 32: Product matrix 44 Table 33: Price of remitting via Mzansi 44 Table 34: Projected price of an Mzansi transfer 45 Table 35: Mzanzi accounts per province, and as a % of provincial population 46 Table 36: Currently unbanked and potential Mzansi accounts, by settlement type 46 Table 37: Welfare recipients 46 Table 38: Mobile phone density in South Africa by contract type 47 Table 39: Price of buying R100 cellular phone airtime from a major bank’s ATM 48

vii
Table 40: Mobile payments communication protocols 50 Table 41: Transaction price and minimum transfer value of airtime for the cellular
telephone operators in South Africa. 53 Table 42: SADC payment receiving infrastructure 57 Table 43: Money transfer agent fees 59 Table 44: South African retailer presence in remittance receiving countries 59 Table 45: TravelWallet fee schedule 60 Table 46: Emerging channels – consumer value proposition, weighted by
infrastructural accessibility 64 Table 47: Projected movement of remittance volumes from traditional to new
remittance channels 65 Table 48: Projected volume and revenue per new channel 66 Table 49: Importance of remittance flows as a form of income support in SADC 77 Table 50: South African immigration permits 83 Table 51: Quantifying regulatory barriers 86 Table 52: Quantifying regulatory barriers 91 Table 53: Botswana profile 115 Table 54: Botswana infrastructure 116 Table 55: Lesotho profile 117 Table 56: Lesotho infrastructure 119 Table 57: Malawi profile 119 Table 58: Malawi infrastructure 120 Table 59: Mozambique profile 121 Table 60: Mozambican infrastructure 122 Table 61: Swaziland profile 123 Table 62: Swaziland infrastructure 124 Table 63: South Africa profile 124 Table 64: South African infrastructure 126 Table 65: Top ten source countries for repatriations and legal immigration into South
Africa 127
�
viii
���� ��� ������
We received considerable support from our sponsors at CGAP and the Finmark Trust during the preparation of the report, with particular thanks due to Jennifer Isern, Jeremy Leach and Rani Deshpande. The excellent work of Pauline Gule at Uthini Research on the focus groups is also appreciated. Finally, significant value was gained from the input of the peer review group, with the following individuals, in no particular order, deserving mention: David Porteous (Recap International); Valsa Shah (Department for International Development); Maud Bokkerink (International Monetary Fund); Juan Buchenau (MFIC); Ole Andreassen (The World Bank); Raul Hernandez-Coss (Asia Pacific Economic Cooperation); Sally Peberdy (Southern African Migration Project); Latifah Merican Cheong (The World Bank); and Janet Love (South African Reserve Bank).
ix
�����������������
In many poor nations, remittances are an extremely important, counter-cyclical form of income support. In some countries, in fact, remittance flows are large enough to substantially support the balance of payments and dwarf aid flows. However, a large proportion of such flows still travel via informal channels, which is sub-optimal for both the welfare of remitters and economic growth. Informal channels provide low levels of security, uncertain delivery times and take money out of the formal financial system, where it would be available to banks to on-lend. The formalisation of the remittance market is thus an important development goal.
To date, research on remittances in Southern Africa has been thin on the ground, and there is little official data on such flows. However, given well-established patterns of temporary economic migration in the area, particularly to South Africa, there are certainly grounds for believing that remittance flows are substantial.
This report was commissioned by the FinMark Trust and CGAP (The Consultative Group to Assist the Poor), in order to highlight the potential demand for cross-border remittance services in southern Africa, evaluate the potential business and technological opportunities in the remittance market, identify regulatory barriers to doing business (in both financial and immigration legislation), and propose policy and regulatory changes to facilitate the development of the market.
REGIONAL MIGRATION PATTERNS
The South African economy dwarfs that of its neighbours, and has been the focus of regional economic activity for over a century. Short-term economic migration to South Africa dates back to the late 1800’s and has continued to the present day in one form or another. Within South Africa, apartheid legislation was originally designed specifically to encourage short term labour migration. Black South Africans were largely confined to rural “homelands”, from which they were encouraged to migrate on short-term employment contracts to seek unskilled work in mines, factories and farms. Similarly, short-term migration by work-seekers from other SADC countries has also characterised cross-border migration into South Africa since the late 1800s.
Unfortunately, the available data on migration patterns, particularly cross-border migration, is poor. We were therefore forced to use as wide a range of information sources as possible, as well as an understanding of the historical patterns of migration in the area, to inform our estimate of the total stock of migrants, both domestic and international, now in South Africa. We concluded that approximately 2.1m migrants from SADC are currently resident in South Africa.
The research focused on the migration to South Africa of citizens from Botswana, Lesotho, Malawi, Mozambique and Swaziland. Although a large number of Zimbabwean citizens are also likely to reside in South Africa, Zimbabwe was excluded from the survey. This was because this survey
x
seeks to identify business opportunities and it would be futile to try and formalise the market in Zimbabwe given the large disparity between formal and black market exchange rates in Zimbabwe.
SIZE OF THE REMITTANCE MARKET
The estimate of the size of the remittance market was based on a combination of an estimate of total migration and estimates of remitting behaviour by those migrants. On the assumptions that 60% of all international migrants remit, that mineworkers remit in accordance with home country requirements, and that other remitting migrants remit 30% of income annually, it was estimated that, at the present time, approximately R6.1bn in cross-border remittances is made from South Africa into SADC annually.
In the domestic remittance market, it was estimated that 6m South Africans make some sort of remittance payment annually, and that total annual domestic remittances of R12bn are made. This estimate was developed from the Finscope and Labour Force surveys. It should be noted that all estimates were dogged by poor data, and are therefore subject to review.
REMITTANCE DEMAND CHARACTERISTICS
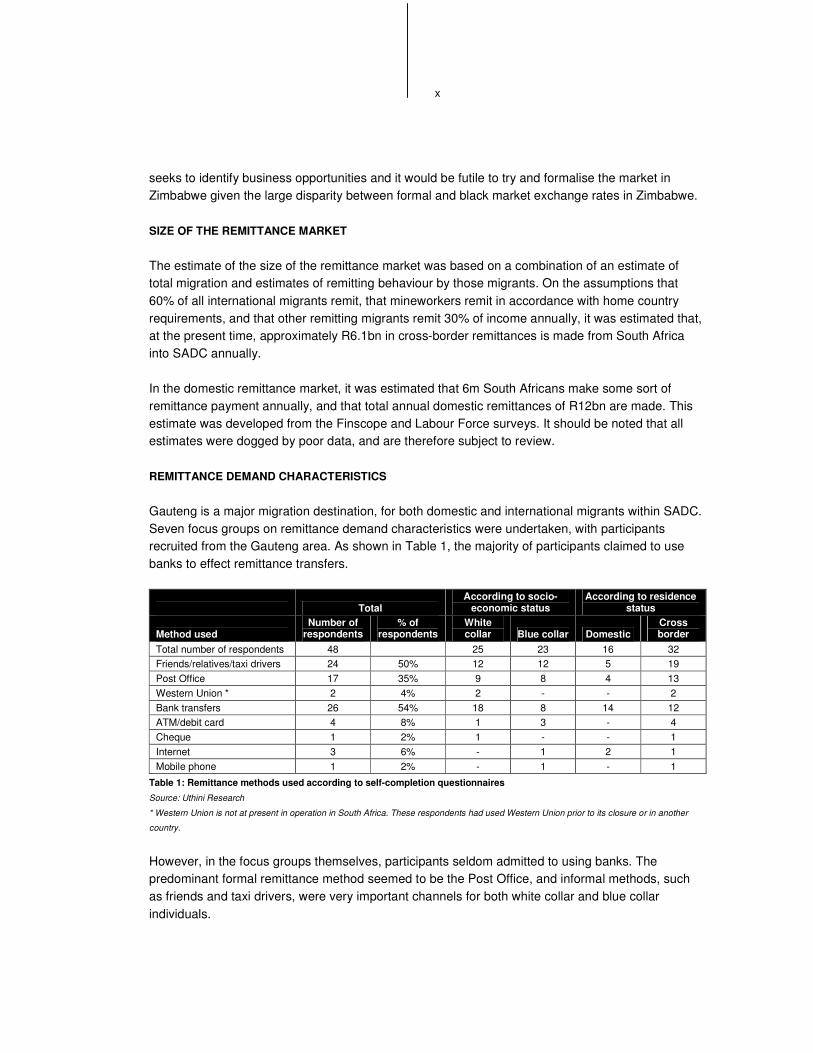
Gauteng is a major migration destination, for both domestic and international migrants within SADC. Seven focus groups on remittance demand characteristics were undertaken, with participants recruited from the Gauteng area. As shown in Table 1, the majority of participants claimed to use banks to effect remittance transfers.
Total According to socio-
economic status According to residence
status
Method used Number of
respondents % of
respondents White collar Blue collar Domestic
Cross border
Total number of respondents 48 25 23 16 32 Friends/relatives/taxi drivers 24 50% 12 12 5 19 Post Office 17 35% 9 8 4 13 Western Union * 2 4% 2 - - 2 Bank transfers 26 54% 18 8 14 12 ATM/debit card 4 8% 1 3 - 4 Cheque 1 2% 1 - - 1 Internet 3 6% - 1 2 1 Mobile phone 1 2% - 1 - 1
Table 1: Remittance methods used according to self-completion questionnaires
Source: Uthini Research
* Western Union is not at present in operation in South Africa. These respondents had used Western Union prior to its closure or in another
country.
However, in the focus groups themselves, participants seldom admitted to using banks. The predominant formal remittance method seemed to be the Post Office, and informal methods, such as friends and taxi drivers, were very important channels for both white collar and blue collar individuals.
xi
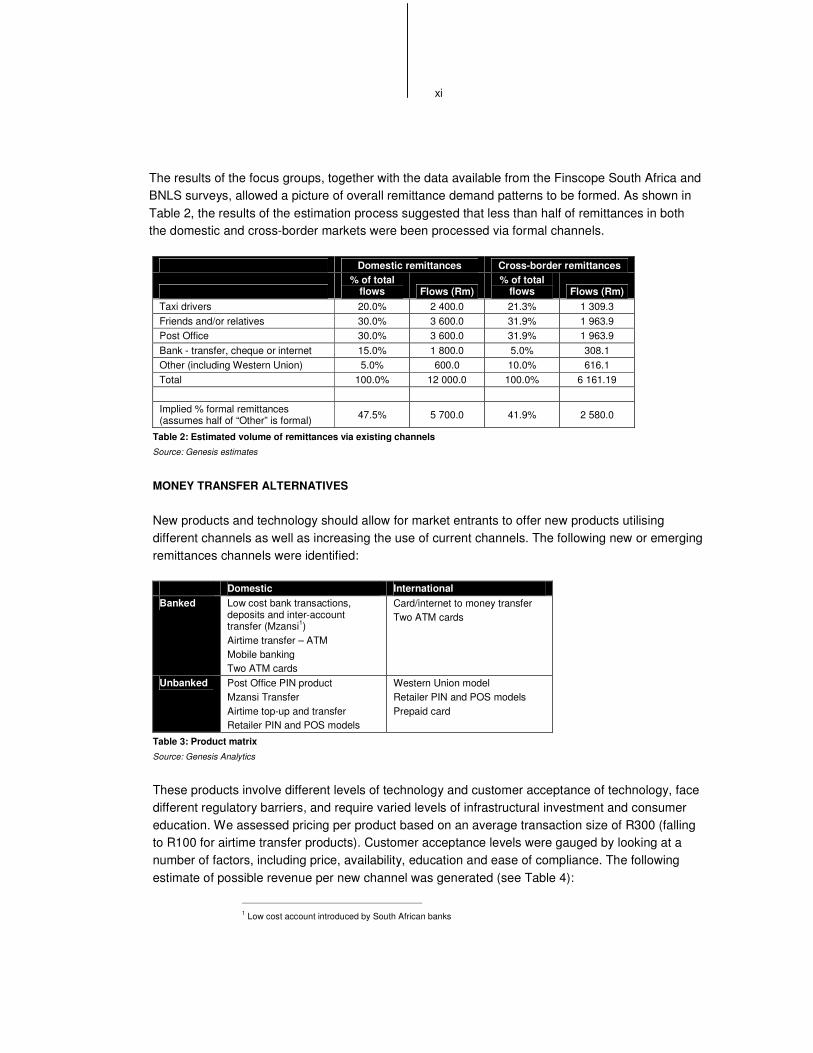
The results of the focus groups, together with the data available from the Finscope South Africa and BNLS surveys, allowed a picture of overall remittance demand patterns to be formed. As shown in Table 2, the results of the estimation process suggested that less than half of remittances in both the domestic and cross-border markets were been processed via formal channels.
Domestic remittances Cross-border remittances
% of total
flows Flows (Rm) % of total
flows Flows (Rm) Taxi drivers 20.0% 2 400.0 21.3% 1 309.3 Friends and/or relatives 30.0% 3 600.0 31.9% 1 963.9 Post Office 30.0% 3 600.0 31.9% 1 963.9 Bank - transfer, cheque or internet 15.0% 1 800.0 5.0% 308.1 Other (including Western Union) 5.0% 600.0 10.0% 616.1 Total 100.0% 12 000.0 100.0% 6 161.19 Implied % formal remittances (assumes half of “Other” is formal) 47.5% 5 700.0 41.9% 2 580.0
Table 2: Estimated volume of remittances via existing channels Source: Genesis estimates
MONEY TRANSFER ALTERNATIVES
New products and technology should allow for market entrants to offer new products utilising different channels as well as increasing the use of current channels. The following new or emerging remittances channels were identified:
Domestic International Banked Low cost bank transactions,
deposits and inter-account transfer (Mzansi1) Airtime transfer – ATM Mobile banking Two ATM cards
Card/internet to money transfer Two ATM cards
Unbanked Post Office PIN product Mzansi Transfer Airtime top-up and transfer Retailer PIN and POS models
Western Union model Retailer PIN and POS models Prepaid card
Table 3: Product matrix Source: Genesis Analytics
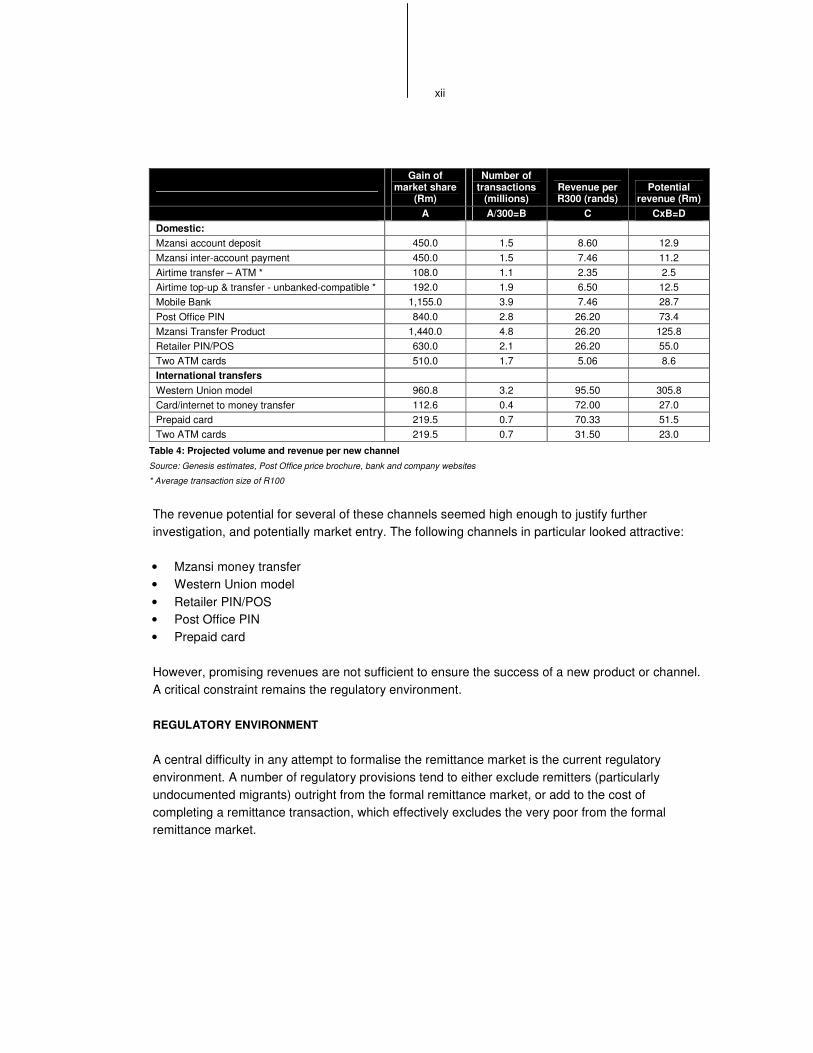
These products involve different levels of technology and customer acceptance of technology, face different regulatory barriers, and require varied levels of infrastructural investment and consumer education. We assessed pricing per product based on an average transaction size of R300 (falling to R100 for airtime transfer products). Customer acceptance levels were gauged by looking at a number of factors, including price, availability, education and ease of compliance. The following estimate of possible revenue per new channel was generated (see Table 4):
1 Low cost account introduced by South African banks
xii
Gain of market share
(Rm)
Number of transactions
(millions) Revenue per R300 (rands)
Potential revenue (Rm)
A A/300=B C CxB=D Domestic: Mzansi account deposit 450.0 1.5 8.60 12.9 Mzansi inter-account payment 450.0 1.5 7.46 11.2 Airtime transfer – ATM * 108.0 1.1 2.35 2.5 Airtime top-up & transfer - unbanked-compatible * 192.0 1.9 6.50 12.5 Mobile Bank 1,155.0 3.9 7.46 28.7 Post Office PIN 840.0 2.8 26.20 73.4 Mzansi Transfer Product 1,440.0 4.8 26.20 125.8 Retailer PIN/POS 630.0 2.1 26.20 55.0 Two ATM cards 510.0 1.7 5.06 8.6 International transfers Western Union model 960.8 3.2 95.50 305.8 Card/internet to money transfer 112.6 0.4 72.00 27.0 Prepaid card 219.5 0.7 70.33 51.5 Two ATM cards 219.5 0.7 31.50 23.0
Table 4: Projected volume and revenue per new channel
Source: Genesis estimates, Post Office price brochure, bank and company websites
* Average transaction size of R100
The revenue potential for several of these channels seemed high enough to justify further investigation, and potentially market entry. The following channels in particular looked attractive:
• Mzansi money transfer • Western Union model • Retailer PIN/POS • Post Office PIN • Prepaid card
However, promising revenues are not sufficient to ensure the success of a new product or channel. A critical constraint remains the regulatory environment.
REGULATORY ENVIRONMENT
A central difficulty in any attempt to formalise the remittance market is the current regulatory environment. A number of regulatory provisions tend to either exclude remitters (particularly undocumented migrants) outright from the formal remittance market, or add to the cost of completing a remittance transaction, which effectively excludes the very poor from the formal remittance market.
xiii
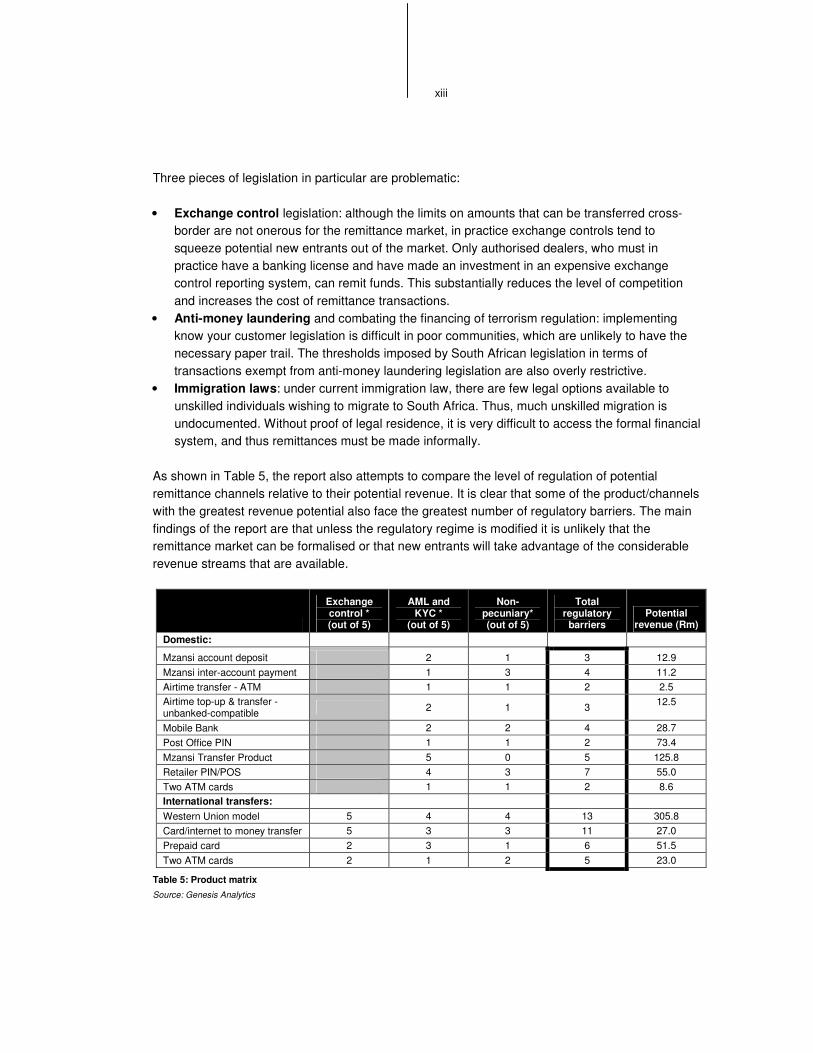
Three pieces of legislation in particular are problematic:
• Exchange control legislation: although the limits on amounts that can be transferred cross-border are not onerous for the remittance market, in practice exchange controls tend to squeeze potential new entrants out of the market. Only authorised dealers, who must in practice have a banking license and have made an investment in an expensive exchange control reporting system, can remit funds. This substantially reduces the level of competition and increases the cost of remittance transactions.
• Anti-money laundering and combating the financing of terrorism regulation: implementing know your customer legislation is difficult in poor communities, which are unlikely to have the necessary paper trail. The thresholds imposed by South African legislation in terms of transactions exempt from anti-money laundering legislation are also overly restrictive.
• Immigration laws: under current immigration law, there are few legal options available to unskilled individuals wishing to migrate to South Africa. Thus, much unskilled migration is undocumented. Without proof of legal residence, it is very difficult to access the formal financial system, and thus remittances must be made informally.
As shown in Table 5, the report also attempts to compare the level of regulation of potential remittance channels relative to their potential revenue. It is clear that some of the product/channels with the greatest revenue potential also face the greatest number of regulatory barriers. The main findings of the report are that unless the regulatory regime is modified it is unlikely that the remittance market can be formalised or that new entrants will take advantage of the considerable revenue streams that are available.
Exchange control * (out of 5)
AML and KYC *
(out of 5)
Non-pecuniary* (out of 5)
Total regulatory
barriers Potential
revenue (Rm) Domestic:
Mzansi account deposit 2 1 3 12.9 Mzansi inter-account payment 1 3 4 11.2 Airtime transfer - ATM 1 1 2 2.5 Airtime top-up & transfer - unbanked-compatible 2 1 3 12.5
Mobile Bank 2 2 4 28.7 Post Office PIN 1 1 2 73.4 Mzansi Transfer Product 5 0 5 125.8 Retailer PIN/POS 4 3 7 55.0 Two ATM cards 1 1 2 8.6 International transfers: Western Union model 5 4 4 13 305.8 Card/internet to money transfer 5 3 3 11 27.0 Prepaid card 2 3 1 6 51.5 Two ATM cards 2 1 2 5 23.0
Table 5: Product matrix Source: Genesis Analytics

xiv
The following regulatory reforms would greatly assist the development of the formal remittances market:
• Remove exchange control reporting requirements below a R5 000 threshold: at present all foreign exchange transactions must be reported to the SARB, which increases the cost of executing each transaction. We recommend that this requirement be dropped for transactions below a threshold of R5 000, which could be done without incurring substantial balance of payments risks.
• Introduce a limited authorised dealer license for the remittance market: at present, full authorised dealer licenses are only issued to banks, with limited licenses available to bureaux de change. In order to encourage competition in the remittance market, we recommend the introduction of a specialised limited authorised dealer license for the remittance market.
• Extend FICA exemption 17 to SADC/Africa: FICA exemption 17 was designed to facilitate the introduction of the Mzansi account, by reducing some AML requirements for low-value accounts and transactions. We recommend that this be extended to cross-border transfers within SADC or Africa.
• Facilitate remittances on presentation of a passport alone: this would be in line with the US approach to Mexican migrants, who are able to gain access to financial services on presentation of a Matricula card. A prerequisite for this will be the legal protection of the data supplied to the financial institution from being used by immigration authorities for prosecution.
1
�� ����������
Remittances have an important role to play in supporting development. The households that receive remittances are often among the poorest of the poor, so remittances are an extremely targeted form of income support. In addition, remittances are often counter-cyclical, with the number of economic migrants and the size of remittances tending to increase in response to economic stress at home.2 International experience suggests that a 10% increase in the share of international remittances in a country’s GDP is typically associated with a 1.6% decline in the share of people living in poverty.3
Further evidence of the importance of remittances for poverty reduction is provided by a 2004 study of Mexican municipalities,4 which found that an increase in the proportion of households receiving remittances improved municipal performance on a number of poverty measures:
• Infant mortality decreased: a 7.7% increase in the fraction of households receiving remittances was associated with a 5% decrease in infant mortality.
• Literacy and school attendance among 6-14 year-olds improved: a 7.7% increase in the fraction of households receiving remittances was associated with an almost 40% decrease in illiteracy and a 3.7% increase in school attendance.
• The level of poverty and social marginalisation declined.
Despite this importance, little work has been undertaken to date on African remittance patterns.5 This report aims to begin to correct this imbalance, and represents a continuation of the research process started in 2003, with the publication of “African Families, African Money”, a report on the remittance market commissioned by the FinMark Trust. The current report was commissioned by the FinMark Trust and CGAP (The Consultative Group to Assist the Poor), in order to highlight potential demand for cross-border remittances services in southern Africa, evaluate the potential business and technological opportunities in the remittance market, identify regulatory barriers to doing so (in both financial and immigration legislation) and propose policy and regulatory changes to facilitate the development of the market.
2 Cordova 2004, 2 3 Adams & Page 2003, 1 4 Cordova 2004 5 For an introduction into global remittance patterns, see papers such as “Crafting a Money Transfers Strategy” by Isern et al, available from http://www.cgap.org/docs/OccasionalPaper_10.pdf.
2
Labour migration into South Africa from the rest of Southern Africa is well-entrenched in the regional economy. The phenomenon has its roots in the establishment of the gold and diamond mining industries in the mid-19th century, and has essentially continued unabated since then. In addition to the working opportunities on the mines, South Africa’s comparative wealth and stability make it an attractive destination for both economic migrants and refugees from the rest of Africa. South Africa’s role as a migration destination makes it the key origin country for remittances to SADC.
Within South Africa, substantial wealth disparities still exist. These disparities have a regional bias, with areas such as the Eastern Cape experiencing large scale rural poverty, while Gauteng remains the centre of economic development. The patterns of settlement that were enforced under apartheid, with the rural poor concentrated in “homelands” and encouraged to migrate to urban areas for employment, still inform employment migration patterns today.
We have sought to gain clarity on the remittance market by attempting to generate an estimate of the size of major inter-SADC migration flows and subsequent remittance flows. The size of the domestic remitting population was also estimated, and used to generate an estimate of the size of the domestic remittance market. Focus groups were held to try and identify the characteristics of remittance demand. This data was then used to explore business opportunities in the international and domestic remittance markets.
The macro-economic benefits of formalising remittance flows would be felt by a number of stakeholders:
• Remitters and remittance recipients would benefit from improved speed and security as compared to informal products
• Financial service providers would benefit from increased revenue flows • An increase in funds sent through formal banking systems would increase the
stock of funds available for banks to on-lend • Impoverished countries would be able to utilise international remittance inflows
to fund imports on the balance of payments • Regulators would have more information on the size and direction of currency
flows (and the remaining informal financial market would contain fewer legitimate flows, thus making illicit flows more easy to detect)
However, the development of the formal remittance market faces a number of regulatory barriers. Anti-money laundering legislation imposes substantial compliance costs on financial firms, which is then typically transmitted to the
3
consumer in the form of increased prices. Where consumers are poor, this may result in financial exclusion. Immigration laws complicate the picture by excluding many migrants from legal migration avenues. Finally, exchange control legislation in South Africa has a pernicious impact on the remittance market, again by imposing compliance costs on each transaction.
In section 2 we begin by examining regional migration patterns within SADC, which confirms our initial hypothesis that the majority of migrants have South Africa as their destination point. Domestic migration patterns within South Africa are also examined. Section 3 builds on the migration estimates in order to reach an estimate of the current size of the inter-SADC remittance market. Demand characteristics of the remittance market, as revealed by focus group discussions, are analysed in section 4.
Two key measures of whether the poor have access to financial services are (1) the presence of feasible choices and (2) increasing usage by the poor of those services.6 In section 5 and 6 we evaluate the potential of various new business models, focussed on the remittance market, in an attempt to increase the range of feasible choices faced by the poor. The regulatory framework of the South African remittance market is discussed in section 7.7 Section 8 provides conclusions and policy recommendations.
All figures in the report are quoted in South African rands, which, for the year ended 30 April 2005, traded at an average of R6.24 to the US dollar and R7.89 to the euro.8
6 Porteous 2004, 8 7 The regulatory environment of the major SADC remittance receiving countries will be explored in a report commissioned by the World Bank and currently being undertaken by ePayCom and Genesis Analytics. 8 www.oanda.com
4
�� �� ������� ���������������
SUMMARY
The key determinant of remittance patterns are migration patterns. Within SADC, migration patterns are typically not well documented. However, a great deal is
known about the historical patterns and drivers of migration, and this understanding can be used to inform the estimation process. Using this historical background,
combined with existing data on immigration and repatriations, we identified Mozambique, Lesotho, Swaziland, Botswana and Malawi, in order of importance, as being the key sources of cross-border migrants into South Africa (Zimbabwe,
another large source of migration to South Africa, was excluded from the analysis, because the disparity between its formal and black market exchange rates was felt to be sufficient to inhibit the development of its formal remittance market). Together
with migrants from other SADC countries, we estimated a total stock of SADC migrants in South Africa of 2.1m individuals. As the wealthiest country in the region, South Africa is the largest destination country for economic migrants.
Rural-urban migration within South Africa was also found to be substantial. The most important destination area for internal migrants was Gauteng, which is also
the centre of economic activity in the country.
���� ����������������
Our approach was to synthesize available data sources and our existing regional knowledge in choosing which countries to focus our research efforts on. For example, repatriations data sheds some light on sources of undocumented migration. In 2001, the Department of Home Affairs deported a total of 156 123 illegal aliens.9 Of these, 153 429 or 98.3% were derived from the following countries: Botswana (0.04%); Lesotho (3.83%); Malawi (1.30%); Mozambique (60.47%); Namibia (0.001%); Swaziland (2.09%); and Zimbabwe (30.55%).
The shortlist of countries examined was drawn from this list, partly as a result of an understanding of the historical patterns of regional migration (see Appendix 4) and 9 Annual report of the Department of Home Affairs 2001/2002, 51.
5
partly because high levels of repatriation are likely to be an indication of high levels of poor and unskilled migrants – the group that experiences the greatest exclusion from the formal remittance market (see Appendix 5 for a discussion of the use of repatriations data). Namibia was excluded on the basis of both having fairly small legal migration and repatriations data. Zimbabwe was excluded on the basis that its exchange control regime is not compatible with the development of a workable formal remittance model (which is discussed further in Box 1).
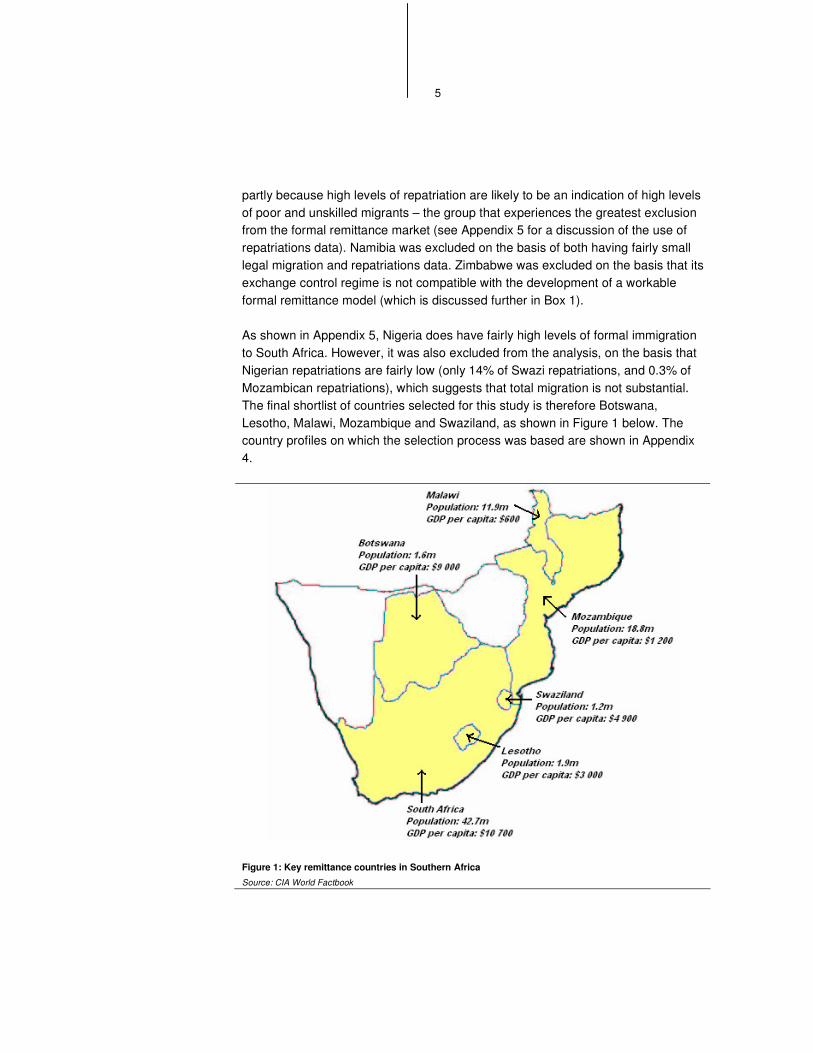
As shown in Appendix 5, Nigeria does have fairly high levels of formal immigration to South Africa. However, it was also excluded from the analysis, on the basis that Nigerian repatriations are fairly low (only 14% of Swazi repatriations, and 0.3% of Mozambican repatriations), which suggests that total migration is not substantial. The final shortlist of countries selected for this study is therefore Botswana, Lesotho, Malawi, Mozambique and Swaziland, as shown in Figure 1 below. The country profiles on which the selection process was based are shown in Appendix 4.
Figure 1: Key remittance countries in Southern Africa
Source: CIA World Factbook
6
������ �����������������
Estimating the size of the Southern African remittance market is a fairly complex task, due to the dearth of accurate data on the topic. Not only is data on official remittances flows scarce, but most commentators agree that informal remittances are a particularly high proportion of total flows in the region. There is almost no data on the size of these informal flows.
The absence of data complicates the process of choosing which countries in the region to focus research attention on. Both balance of payments data on remittance flows and migration data are profoundly flawed when trying to identify the major remittance routes. In many cases the data is simply absent: only one-third of sub-Saharan countries report remittances as a separate item in their balance of payments data.10 Numbers on legal migration to South Africa are also typically only available on a flow rather than a stock basis, and some assumption must typically be made to turn these flow numbers into stock numbers.11
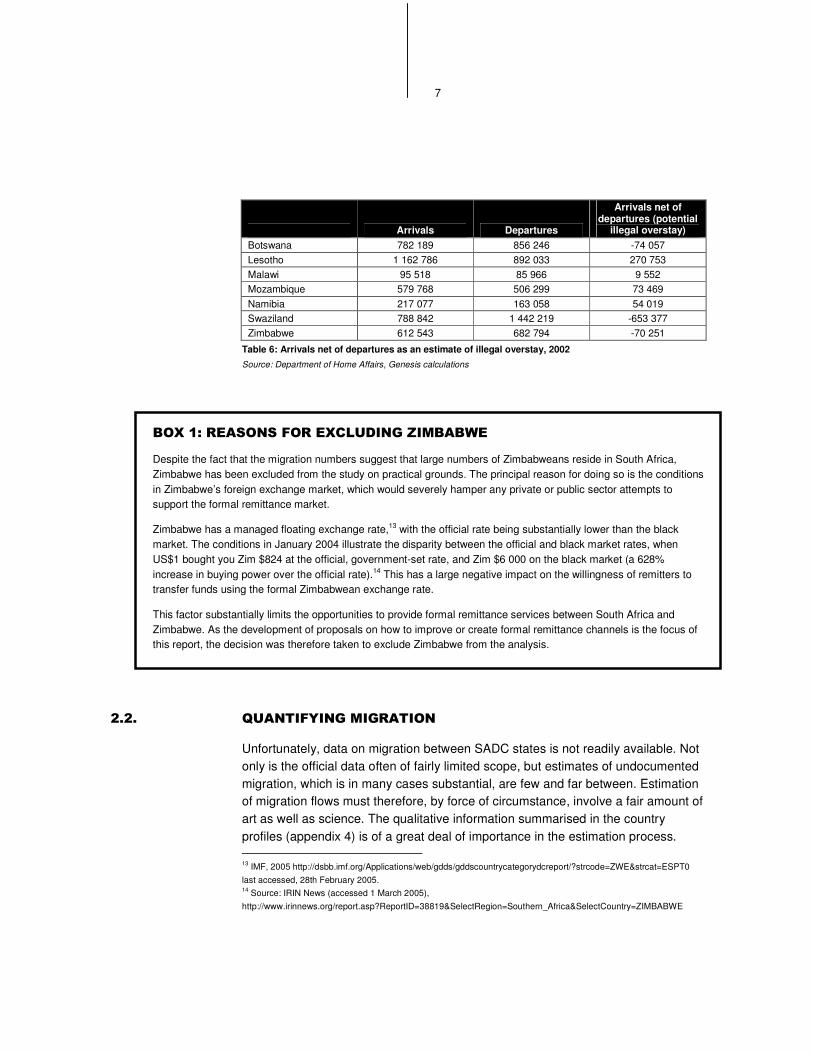
The extent of the problem with the migration data can be illustrated by the South African arrivals and departures data for 2002 in Table 6 (South Africa being one of the countries in the region with the highest quality data). It should be possible to assess how many people are arriving in the country legally, but then overstaying their visas illegally, by looking at arrivals net of departures. However, a quick scan of the numbers thus produced suggests major problems with the data.12 This is illustrated most clearly in the case of Swaziland, where the data suggests that the undocumented migrant community of Swazis in South Africa decreased by 653 377 individuals in 2002 alone. No other data found during the research process supports this conclusion.
10 Sander and Maimbo 2003, 1 11 For example, a rough estimate could be generated by working on the assumption that the stock of immigrants is equivalent to the sum of the flow of immigrants over past ten years. 12 A discussion with the Southern African Migration Project (“SAMP”) suggests that not all individuals crossing borders are required to complete departure forms.
7
Arrivals Departures
Arrivals net of departures (potential
illegal overstay) Botswana 782 189 856 246 -74 057 Lesotho 1 162 786 892 033 270 753 Malawi 95 518 85 966 9 552 Mozambique 579 768 506 299 73 469 Namibia 217 077 163 058 54 019 Swaziland 788 842 1 442 219 -653 377 Zimbabwe 612 543 682 794 -70 251
Table 6: Arrivals net of departures as an estimate of illegal overstay, 2002 Source: Department of Home Affairs, Genesis calculations
������������������������ �������� ���
Despite the fact that the migration numbers suggest that large numbers of Zimbabweans reside in South Africa, Zimbabwe has been excluded from the study on practical grounds. The principal reason for doing so is the conditions in Zimbabwe’s foreign exchange market, which would severely hamper any private or public sector attempts to support the formal remittance market.
Zimbabwe has a managed floating exchange rate,13 with the official rate being substantially lower than the black market. The conditions in January 2004 illustrate the disparity between the official and black market rates, when US$1 bought you Zim $824 at the official, government-set rate, and Zim $6 000 on the black market (a 628% increase in buying power over the official rate).14 This has a large negative impact on the willingness of remitters to transfer funds using the formal Zimbabwean exchange rate.
This factor substantially limits the opportunities to provide formal remittance services between South Africa and Zimbabwe. As the development of proposals on how to improve or create formal remittance channels is the focus of this report, the decision was therefore taken to exclude Zimbabwe from the analysis.
���� �������� ��� ������
Unfortunately, data on migration between SADC states is not readily available. Not only is the official data often of fairly limited scope, but estimates of undocumented migration, which is in many cases substantial, are few and far between. Estimation of migration flows must therefore, by force of circumstance, involve a fair amount of art as well as science. The qualitative information summarised in the country profiles (appendix 4) is of a great deal of importance in the estimation process. 13 IMF, 2005 http://dsbb.imf.org/Applications/web/gdds/gddscountrycategorydcreport/?strcode=ZWE&strcat=ESPT0 last accessed, 28th February 2005. 14 Source: IRIN News (accessed 1 March 2005), http://www.irinnews.org/report.asp?ReportID=38819&SelectRegion=Southern_Africa&SelectCountry=ZIMBABWE
8
It should also be born in mind that, if the GDP of the six countries examined is summed, South African GDP comprises approximately 91% of the total. Economic migration to South Africa of SADC citizens is thus the dominating theme of inter-SADC migration.
������ ����������� ������
A useful way to analyse migration data (and use such data to generate an estimate of the stock of migrants) is to subdivide it according to whether or not a migrant entered the country legally, and whether or not they have regularised their current legal status. This is the approach followed in Jonathan Crush in “Making Up the Numbers: Measuring “Illegal Immigration” to South Africa” (Southern African Migration Project Migration Policy Brief No. 3). Below we analyse migration from selected SADC countries into South Africa, using the four possible sub-categories of legal status.
2.2.1.1. LAWFUL ENTRY, LAWFUL STAY
The best available data on migration into South Africa is data on legal migrants. However, even in this migration category, estimation problems exist. Most importantly, the data is typically a flow rather than a stock amount. Thus the figures allow analysis of how the number of migrants per year has changed, but are much less clear on how the total number of foreign nationals in South Africa has changed from year to year.
This category has three components, as follows:
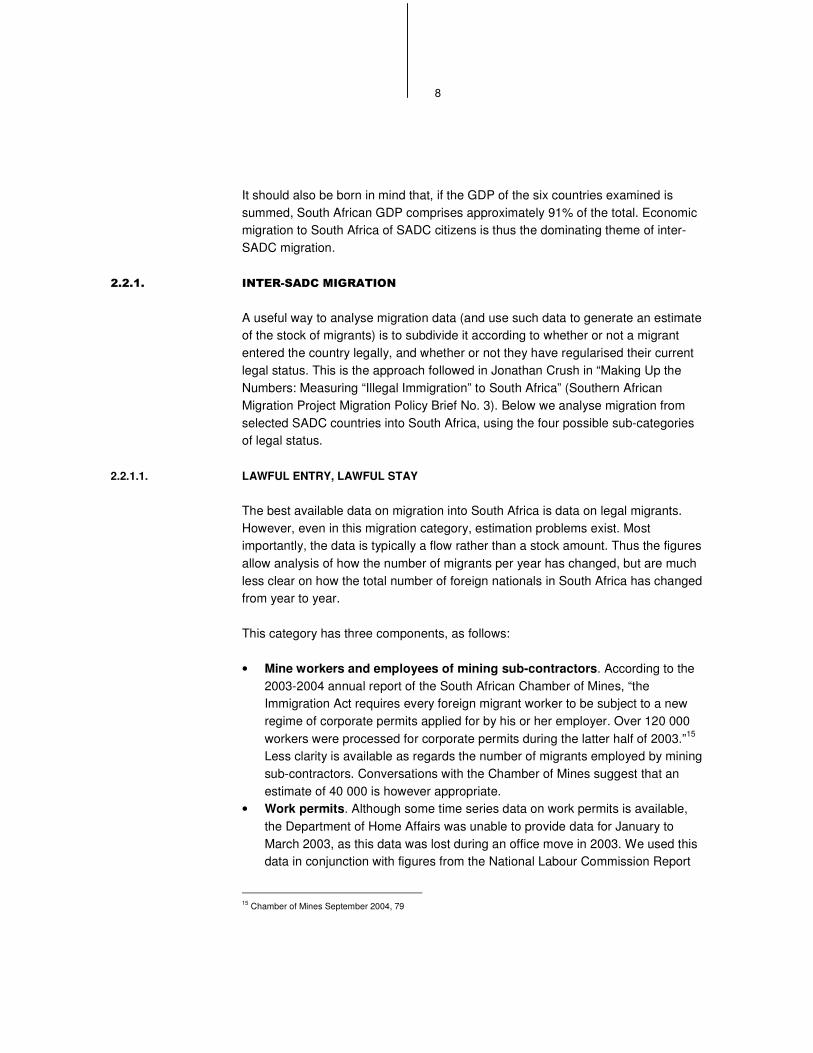
• Mine workers and employees of mining sub-contractors. According to the 2003-2004 annual report of the South African Chamber of Mines, “the Immigration Act requires every foreign migrant worker to be subject to a new regime of corporate permits applied for by his or her employer. Over 120 000 workers were processed for corporate permits during the latter half of 2003.”15 Less clarity is available as regards the number of migrants employed by mining sub-contractors. Conversations with the Chamber of Mines suggest that an estimate of 40 000 is however appropriate.
• Work permits. Although some time series data on work permits is available, the Department of Home Affairs was unable to provide data for January to March 2003, as this data was lost during an office move in 2003. We used this data in conjunction with figures from the National Labour Commission Report
15 Chamber of Mines September 2004, 79
9
of 1996 to extrapolate the probable stock figures for work permits indicated in Table 7.
• Seasonal agricultural workers. The estimate of agricultural workers was derived from the Southern African Migration Project (“SAMP”) Migration Policy Brief by Jonathan Crush mentioned above.
Low High Contract miners 120 000 120 000 Mining sub-contractors employed
40 000 40 000
Work permits 45 000 75 000 Seasonal farm workers16 18 000 20 000 Other valid permits 228 000 300 000
Table 7: Lawful entry, lawful stay
Sources: Chamber of Mines, Economics division: contract miners and migrants employed by mine contractors
Department of Home Affairs: Work permits and other valid permits
Crush 2001: Seasonal workers
2.2.1.2. BOTH UNLAWFUL AND LAWFUL ENTRY, UNLAWFUL STAY
This is the most difficult migration category to quantify, as the clandestine nature of undocumented migration ensures that data sources are thin on the ground. To date, attempts to estimate the size of this group have been largely unsuccessful. Most notably, the Human Sciences Research Council (HSRC) conducted a door-to-door survey in mid-1994, which asked respondents this question, “How many people who are not SA citizens live in the house around this property?” The resulting estimate of 4.5m undocumented migrants in South Africa was heavily criticized, and the estimate was eventually withdrawn.17
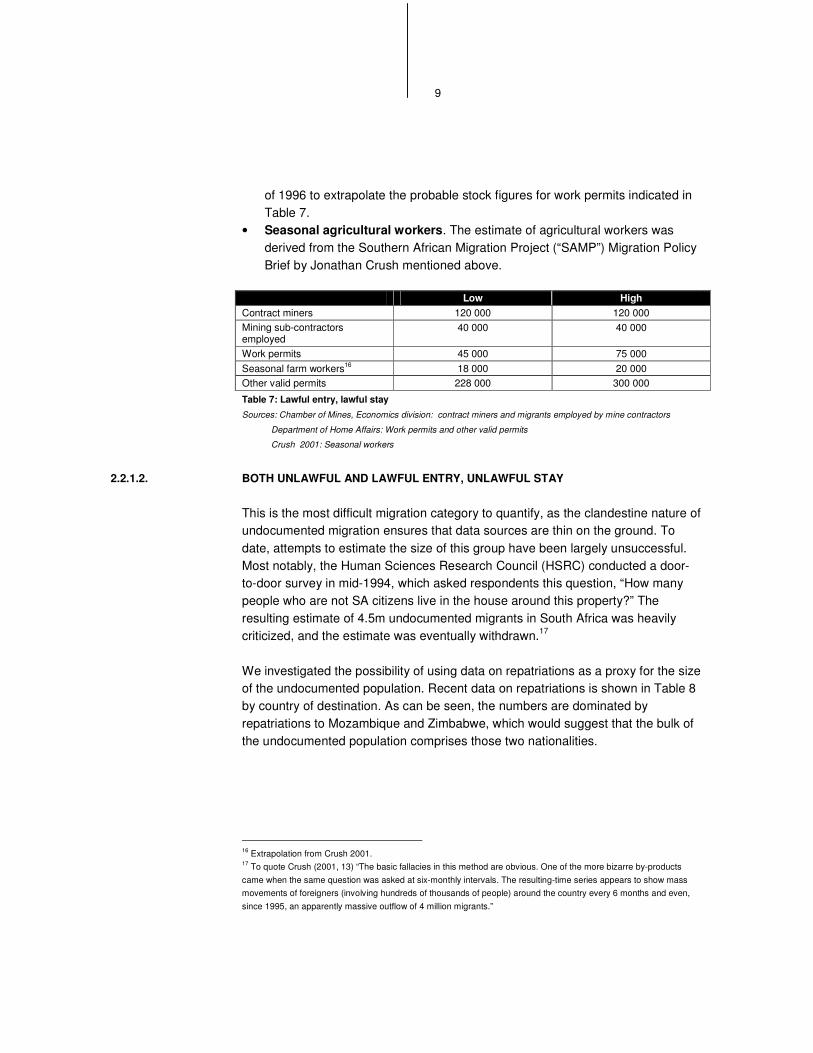
We investigated the possibility of using data on repatriations as a proxy for the size of the undocumented population. Recent data on repatriations is shown in Table 8 by country of destination. As can be seen, the numbers are dominated by repatriations to Mozambique and Zimbabwe, which would suggest that the bulk of the undocumented population comprises those two nationalities.
16 Extrapolation from Crush 2001. 17 To quote Crush (2001, 13) “The basic fallacies in this method are obvious. One of the more bizarre by-products came when the same question was asked at six-monthly intervals. The resulting-time series appears to show mass movements of foreigners (involving hundreds of thousands of people) around the country every 6 months and even, since 1995, an apparently massive outflow of 4 million migrants.”
10
1999 2000 2001 2002 2003 2004 Namibia 3 6 2 11 7 13 Botswana 112 43 67 33 43 34 Swaziland 5 610 3 571 3 258 1 848 1 075 1 434 Malawi 3 474 3 309 2 024 3 132 4 790 3 168 Lesotho 6 003 6 180 5 977 5 278 7 447 7 273 Zimbabwe 42 769 47 649 47 697 38 118 55 753 66 189 Mozambique 123 961 106 647 94 404 83 695 82 067 74 122 Total 181 932 167 405 153 429 132 115 151 182 152 233
Table 8: Repatriations of illegal migrants from South Africa
Source: Department of Home Affairs
However, in order to use the repatriations numbers in any estimation process, cognisance must be taken of the biases and flaws in the data. For example, the total numbers of repatriated individuals will be influenced by the resources used to track them down. Individuals who experience multiple repatriations may also be a significant enough group to affect the data. Finally, the ability of law enforcers to identify undocumented migrants is affected by social perceptions of what migrants look like, as discussed in Appendix 6.
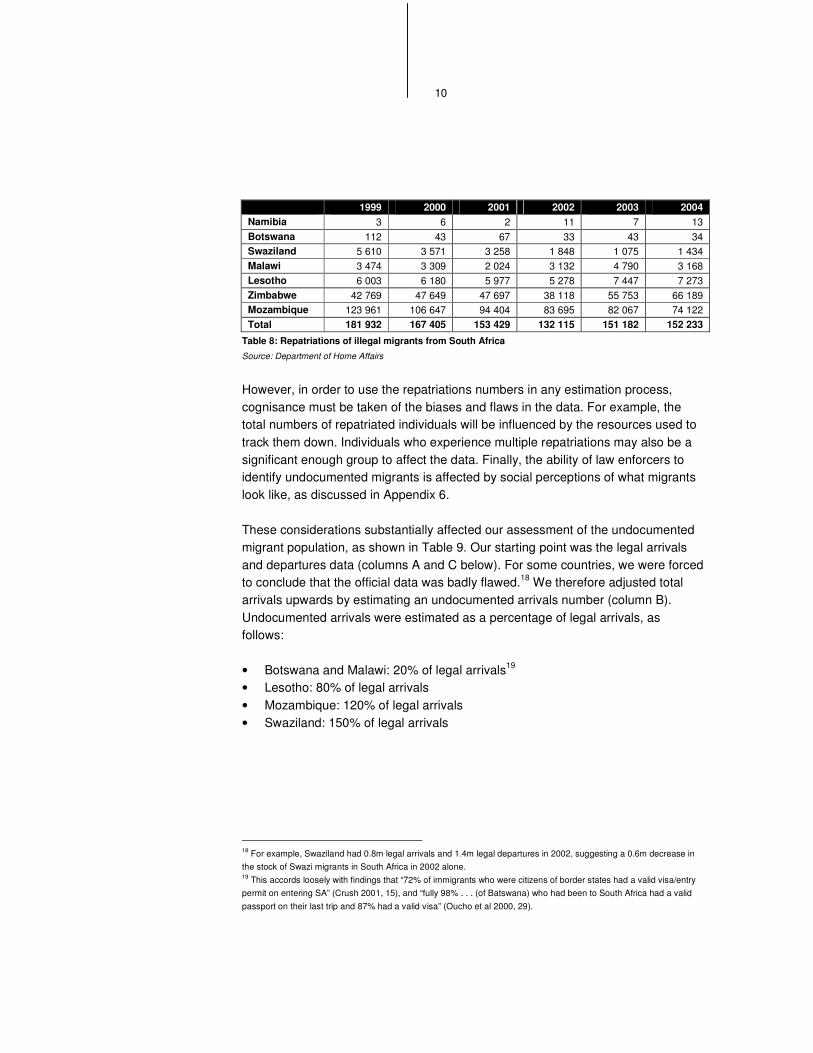
These considerations substantially affected our assessment of the undocumented migrant population, as shown in Table 9. Our starting point was the legal arrivals and departures data (columns A and C below). For some countries, we were forced to conclude that the official data was badly flawed.18 We therefore adjusted total arrivals upwards by estimating an undocumented arrivals number (column B). Undocumented arrivals were estimated as a percentage of legal arrivals, as follows:
• Botswana and Malawi: 20% of legal arrivals19 • Lesotho: 80% of legal arrivals • Mozambique: 120% of legal arrivals • Swaziland: 150% of legal arrivals
18 For example, Swaziland had 0.8m legal arrivals and 1.4m legal departures in 2002, suggesting a 0.6m decrease in the stock of Swazi migrants in South Africa in 2002 alone. 19 This accords loosely with findings that “72% of immigrants who were citizens of border states had a valid visa/entry permit on entering SA” (Crush 2001, 15), and “fully 98% . . . (of Batswana) who had been to South Africa had a valid passport on their last trip and 87% had a valid visa” (Oucho et al 2000, 29).
11
Arrivals in
2002
Un-documented
arrivals Departures
in 2002 Net arrivals
Stock of un-documented
migrants Repatriations
in 2004 % of stock repatriated
A B C A+B-C = D D/3 = E F F/E = G (actual) (estimated) (actual) (estimated) (estimated) (actual) (estimated) Botswana 782 189 156 438 856 246 82 381 27 460 34 0.1% Lesotho 1 162 786 930 229 892 033 1 200 982 400 327 7 273 1.8% Malawi 95 518 19 104 85 966 28 655 9 552 3 168 33.2% Mozambique 579 768 695 722 506 299 769 191 256 397 74 122 28.9% Swaziland 20 788 842 1 183 263 1 442 219 529 886 176 629 1 434 0.8% Other SADC 21 829 620 839 721 845 852 823 489 274 496 66 202 27.3% Total 4 238 723 3 824 476 4 628 615 3 434 584 1 144 861 152 233 13.3%
Table 9: Estimated stock of undocumented migrants in South Africa, by country of origin Source: Genesis calculations, Department of Home Affairs
The actual stock of undocumented migrants is estimated as roughly a third of net annual undocumented arrivals, in column E. The literature suggests that the great majority of undocumented arrivals are for fairly short term visits (of under a year).22 To check how reasonable this estimate was, we checked it against annual repatriation statistics (shown in column F). On our estimates, approximately one third of all undocumented Malawian and Mozambican migrants are repatriated each year, which suggests that our estimate of the total stock of undocumented migrants is conservative. Much higher repatriation numbers for Mozambicans and Malawians than for Batswana, Basotho and Swazis are however consistent with the factors influencing repatriation described in Appendix 6.
20 For countries such as Swaziland, the number of arrivals and departures may be higher than the total number of citizens. This reflects the fact that many visits are of short duration. For example, informal traders may enter South Africa daily to take advantage of cheap wholesale perishable goods, then return to Swaziland that day to retail them. 21 This category is dominated by Zimbabwean migrants, but will also include citizens of Angola, the Democratic Republic of Congo (DRC), Mauritius, Namibia, Seychelles, Tanzania and Zambia. 22 Oucho et al (2000, 27) found that only 2% of Batswana intended to stay for over a year on their last trip to South Africa. A SAMP survey found that “only 16% (of respondents) said it was likely or very likely (with a high of 25% in Lesotho, and a low of 12% in Zimbabwe) that they would go and live permanently in South Africa” (Crouch 2001, 13).

12
������������������������������������ �������������
The undocumented migrant community in South Africa is undoubtedly a large source of remittances to SADC. However, for a number of reasons a study focused exclusively on the remittance behaviour of this community is likely to prove unfruitful:
Illegality itself. Any study of the undocumented migrant community is likely to be substantially hampered by the reluctance of undocumented migrants to be in any way formally surveyed. With sufficient resources, this barrier could be dealt with by the persistent researcher. However, for the reasons detailed below, it is unlikely that such effort would ultimately be rewarded.
Foreign exchange regulations. The foreign exchange market in SA is highly regulated. Banks are virtually the only agents allowed to handle foreign exchange transactions, and act as the front line for a raft of other legislation. Before funds can be remitted the remitter would need to assure the bank that the funds were legally earned and that the remitter was working legally. Undocumented migrants are likely to have widely varying or inadequate documentation, which will in all likelihood make compliance with foreign exchange regulations prohibitively difficult.
Labour market. The largest obstacle to regularising the remittances of undocumented migrants is likely to be the condition of the South African labour market. The market is characterised by extremely high levels of unemployment, associated at least partially with high levels of unionisation and a wage rate above market clearing levels. In this market, any suggestion that undocumented migrants are “stealing” local jobs by undercutting wages is received with a great deal of indignation and political attention. As there is no way for an undocumented migrant to legally earn money in South Africa, all remittances by such migrants are by definition the result of such “stolen” jobs or illegal employment. Politically, therefore, it will be very difficult to implement changes in this segment of the remittances market. Unless such regulatory changes can be implemented, it will not be possible to regularise or incorporate into a legal business model the remittances of undocumented migrants.
In the US market, access to financial services by the undocumented Mexican migrant community has to some extent been regularised by use of the Matricula card. A brief description of this system, and its suitability for the South African undocumented community, is given in Box 3. In section 7.5, a number of regulatory proposals are made, some of which would help to regularise this market.
2.2.1.3. UNLAWFUL ENTRY, LAWFUL STAY
This category includes asylum seekers, refugees and undocumented migrants legalised for work purposes under section 41 of the Aliens Control Act (mainly farm workers). Data was only available for asylum seekers and refugees, and does not include the approximately 280 000 Mozambicans estimated to have remained in South Africa after fleeing the civil war in the 1980s.
Low High Refugees 27 000 27 000 Asylum seekers 115 000 115 000
Table 10: Unlawful entry, lawful stay Source: Telephonic discussion with UNHCR representative
13
Discussions with a representative of the United Nations High Commission for Refugees (“UNHCR”) suggest that no one nationality dominates this category. African refugees and asylum seekers come from areas as diverse as Angola, the Great Lakes and Eritrea, while non-Africans would include Indians and Pakistanis. Despite the political turmoil in Zimbabwe, relatively few Zimbabweans choose to seek asylum or refugee status.
2.2.1.4. TOTAL INTER-SADC MIGRATION ESTIMATE
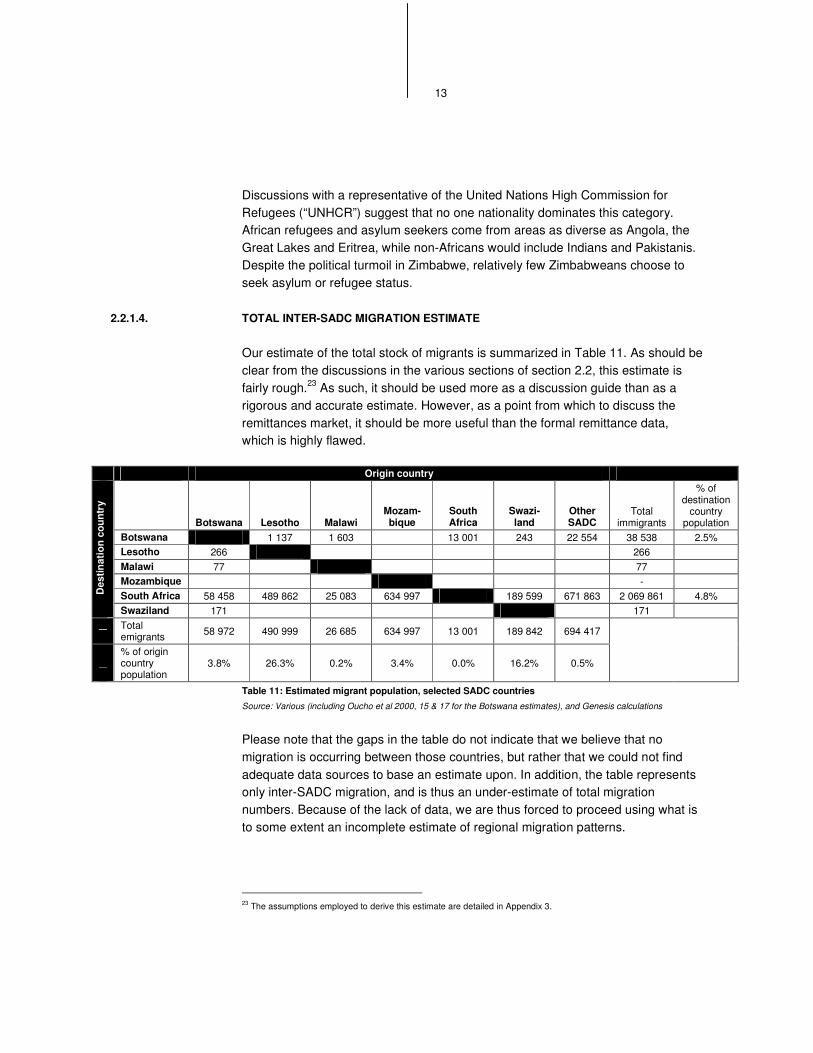
Our estimate of the total stock of migrants is summarized in Table 11. As should be clear from the discussions in the various sections of section 2.2, this estimate is fairly rough.23 As such, it should be used more as a discussion guide than as a rigorous and accurate estimate. However, as a point from which to discuss the remittances market, it should be more useful than the formal remittance data, which is highly flawed.
Origin country
Botswana Lesotho Malawi Mozam-bique
South Africa
Swazi-land
Other SADC
Total immigrants
% of destination
country population
Botswana 1 137 1 603 13 001 243 22 554 38 538 2.5% Lesotho 266 266 Malawi 77 77 Mozambique - South Africa 58 458 489 862 25 083 634 997 189 599 671 863 2 069 861 4.8% D
estin
atio
n co
untr
y
Swaziland 171 171
Total emigrants 58 972 490 999 26 685 634 997 13 001 189 842 694 417
% of origin country population
3.8% 26.3% 0.2% 3.4% 0.0% 16.2% 0.5%
Table 11: Estimated migrant population, selected SADC countries
Source: Various (including Oucho et al 2000, 15 & 17 for the Botswana estimates), and Genesis calculations
Please note that the gaps in the table do not indicate that we believe that no migration is occurring between those countries, but rather that we could not find adequate data sources to base an estimate upon. In addition, the table represents only inter-SADC migration, and is thus an under-estimate of total migration numbers. Because of the lack of data, we are thus forced to proceed using what is to some extent an incomplete estimate of regional migration patterns.
23 The assumptions employed to derive this estimate are detailed in Appendix 3.
14
������ ���������� ��������������������
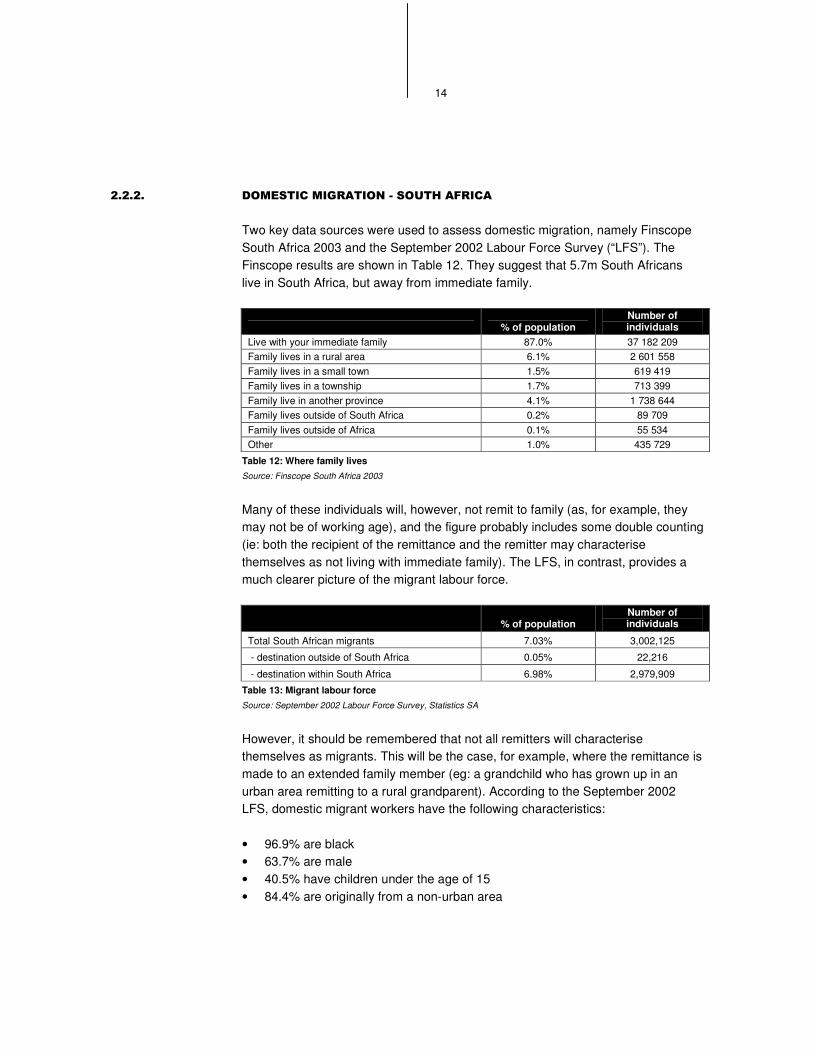
Two key data sources were used to assess domestic migration, namely Finscope South Africa 2003 and the September 2002 Labour Force Survey (“LFS”). The Finscope results are shown in Table 12. They suggest that 5.7m South Africans live in South Africa, but away from immediate family.
% of population Number of individuals
Live with your immediate family 87.0% 37 182 209 Family lives in a rural area 6.1% 2 601 558 Family lives in a small town 1.5% 619 419 Family lives in a township 1.7% 713 399 Family live in another province 4.1% 1 738 644 Family lives outside of South Africa 0.2% 89 709 Family lives outside of Africa 0.1% 55 534 Other 1.0% 435 729
Table 12: Where family lives Source: Finscope South Africa 2003
Many of these individuals will, however, not remit to family (as, for example, they may not be of working age), and the figure probably includes some double counting (ie: both the recipient of the remittance and the remitter may characterise themselves as not living with immediate family). The LFS, in contrast, provides a much clearer picture of the migrant labour force.
% of population Number of individuals
Total South African migrants 7.03% 3,002,125
- destination outside of South Africa 0.05% 22,216
- destination within South Africa 6.98% 2,979,909
Table 13: Migrant labour force Source: September 2002 Labour Force Survey, Statistics SA
However, it should be remembered that not all remitters will characterise themselves as migrants. This will be the case, for example, where the remittance is made to an extended family member (eg: a grandchild who has grown up in an urban area remitting to a rural grandparent). According to the September 2002 LFS, domestic migrant workers have the following characteristics:
• 96.9% are black • 63.7% are male • 40.5% have children under the age of 15 • 84.4% are originally from a non-urban area
15
• 72.6% have less than a matric (in other words, school leaver’s) certificate
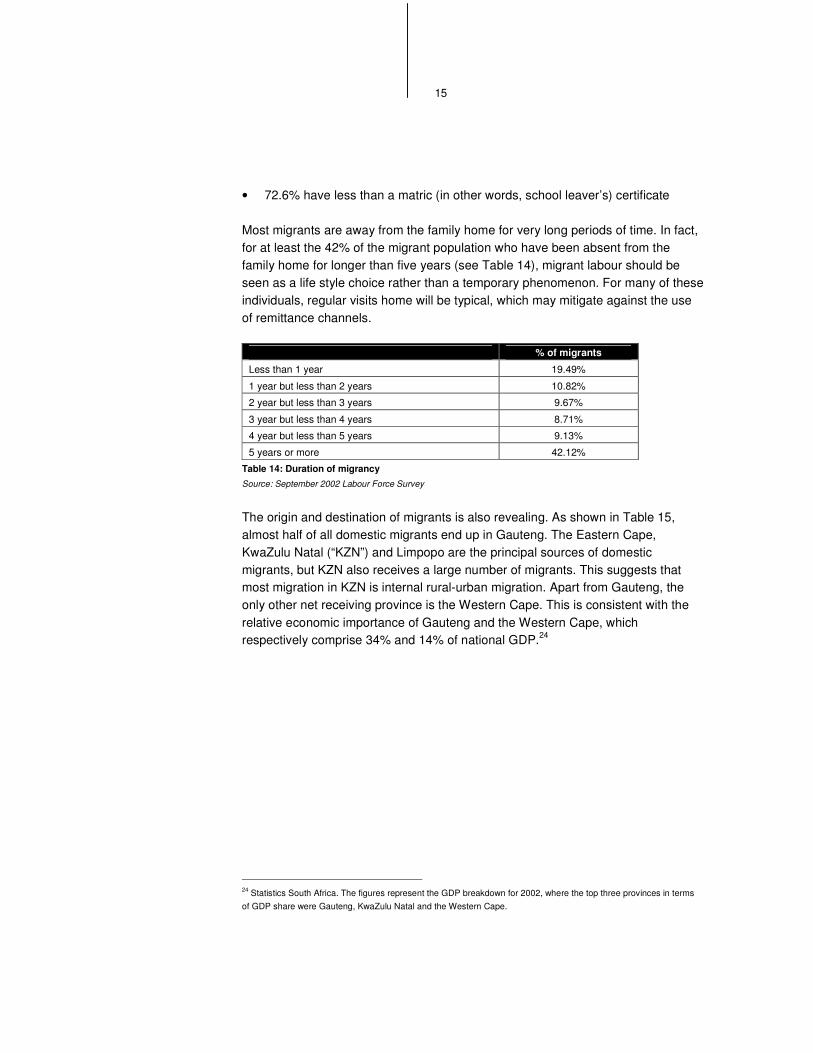
Most migrants are away from the family home for very long periods of time. In fact, for at least the 42% of the migrant population who have been absent from the family home for longer than five years (see Table 14), migrant labour should be seen as a life style choice rather than a temporary phenomenon. For many of these individuals, regular visits home will be typical, which may mitigate against the use of remittance channels.
% of migrants
Less than 1 year 19.49%
1 year but less than 2 years 10.82%
2 year but less than 3 years 9.67%
3 year but less than 4 years 8.71%
4 year but less than 5 years 9.13%
5 years or more 42.12%
Table 14: Duration of migrancy Source: September 2002 Labour Force Survey
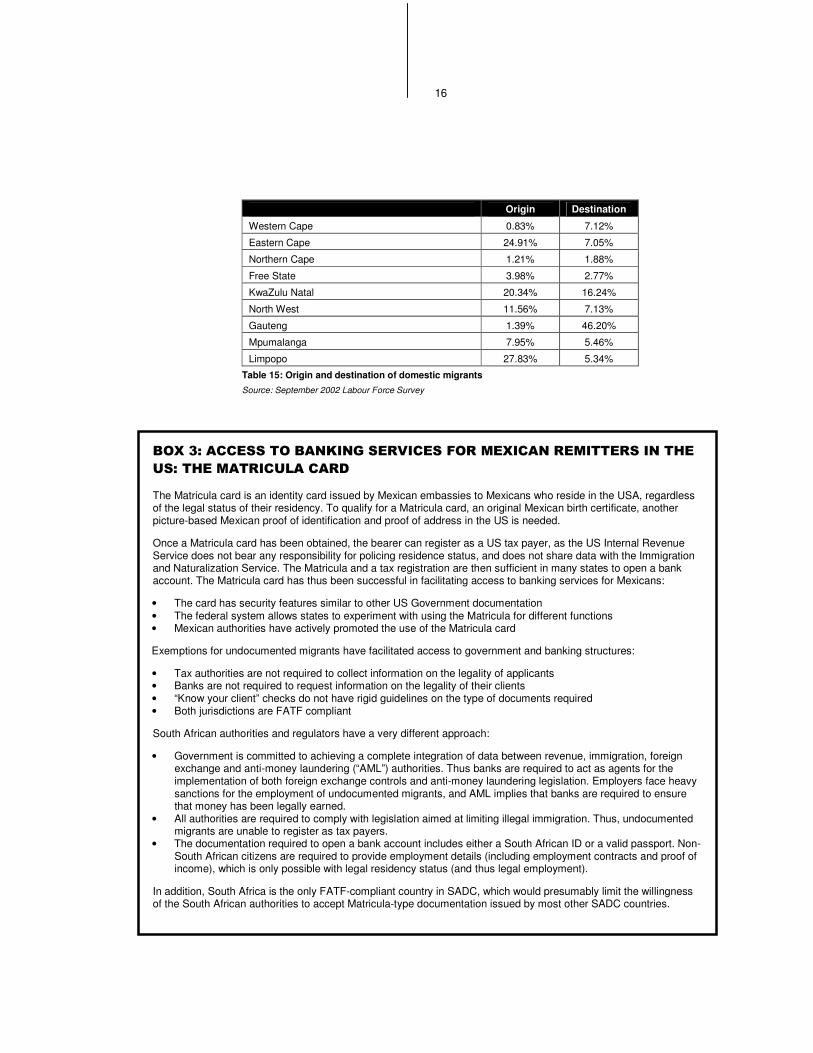
The origin and destination of migrants is also revealing. As shown in Table 15, almost half of all domestic migrants end up in Gauteng. The Eastern Cape, KwaZulu Natal (“KZN”) and Limpopo are the principal sources of domestic migrants, but KZN also receives a large number of migrants. This suggests that most migration in KZN is internal rural-urban migration. Apart from Gauteng, the only other net receiving province is the Western Cape. This is consistent with the relative economic importance of Gauteng and the Western Cape, which respectively comprise 34% and 14% of national GDP.24
24 Statistics South Africa. The figures represent the GDP breakdown for 2002, where the top three provinces in terms of GDP share were Gauteng, KwaZulu Natal and the Western Cape.
16
Origin Destination
Western Cape 0.83% 7.12%
Eastern Cape 24.91% 7.05%
Northern Cape 1.21% 1.88%
Free State 3.98% 2.77%
KwaZulu Natal 20.34% 16.24%
North West 11.56% 7.13%
Gauteng 1.39% 46.20%
Mpumalanga 7.95% 5.46%
Limpopo 27.83% 5.34%
Table 15: Origin and destination of domestic migrants Source: September 2002 Labour Force Survey
���� �������������� �����������������������������������
���������������������
The Matricula card is an identity card issued by Mexican embassies to Mexicans who reside in the USA, regardless of the legal status of their residency. To qualify for a Matricula card, an original Mexican birth certificate, another picture-based Mexican proof of identification and proof of address in the US is needed.
Once a Matricula card has been obtained, the bearer can register as a US tax payer, as the US Internal Revenue Service does not bear any responsibility for policing residence status, and does not share data with the Immigration and Naturalization Service. The Matricula and a tax registration are then sufficient in many states to open a bank account. The Matricula card has thus been successful in facilitating access to banking services for Mexicans:
• The card has security features similar to other US Government documentation • The federal system allows states to experiment with using the Matricula for different functions • Mexican authorities have actively promoted the use of the Matricula card
Exemptions for undocumented migrants have facilitated access to government and banking structures:
• Tax authorities are not required to collect information on the legality of applicants • Banks are not required to request information on the legality of their clients • “Know your client” checks do not have rigid guidelines on the type of documents required • Both jurisdictions are FATF compliant
South African authorities and regulators have a very different approach:
• Government is committed to achieving a complete integration of data between revenue, immigration, foreign exchange and anti-money laundering (“AML”) authorities. Thus banks are required to act as agents for the implementation of both foreign exchange controls and anti-money laundering legislation. Employers face heavy sanctions for the employment of undocumented migrants, and AML implies that banks are required to ensure that money has been legally earned.
• All authorities are required to comply with legislation aimed at limiting illegal immigration. Thus, undocumented migrants are unable to register as tax payers.
• The documentation required to open a bank account includes either a South African ID or a valid passport. Non-South African citizens are required to provide employment details (including employment contracts and proof of income), which is only possible with legal residency status (and thus legal employment).
In addition, South Africa is the only FATF-compliant country in SADC, which would presumably limit the willingness of the South African authorities to accept Matricula-type documentation issued by most other SADC countries.

17
� ����������������������������
SUMMARY
Unfortunately, macro-level data on remittance flows is not available in SADC. Remittance estimates were therefore based on migration estimates. Available data
on the earnings and remittance patterns of miners, for example, were combined with mining migration patterns to derive an estimate of total remitting by miners,
and so on. Cross-border remittances flowing from South Africa to the rest of SADC were estimated at R6.1bn annually (just under US$1bn), with Mozambique and
Lesotho being the largest destination countries.
Domestic remittances within South Africa were estimated at R12bn annually, which equates to an average of R2 000 remitted by each of the estimated 6m domestic
remitters. The average payment size was estimated as R500 or less.
��� ����������
A key indication of the size of potential demand for remittance services is the volume of current remittance flows, an assessment of which is therefore the first step of analysis. In order to assess whether or not current remittance demand is fully met, extensive use was made of focus group methodology. The focus group findings are detailed in section 4.
18
��� ������������������� ��
����� �������� ��������������������
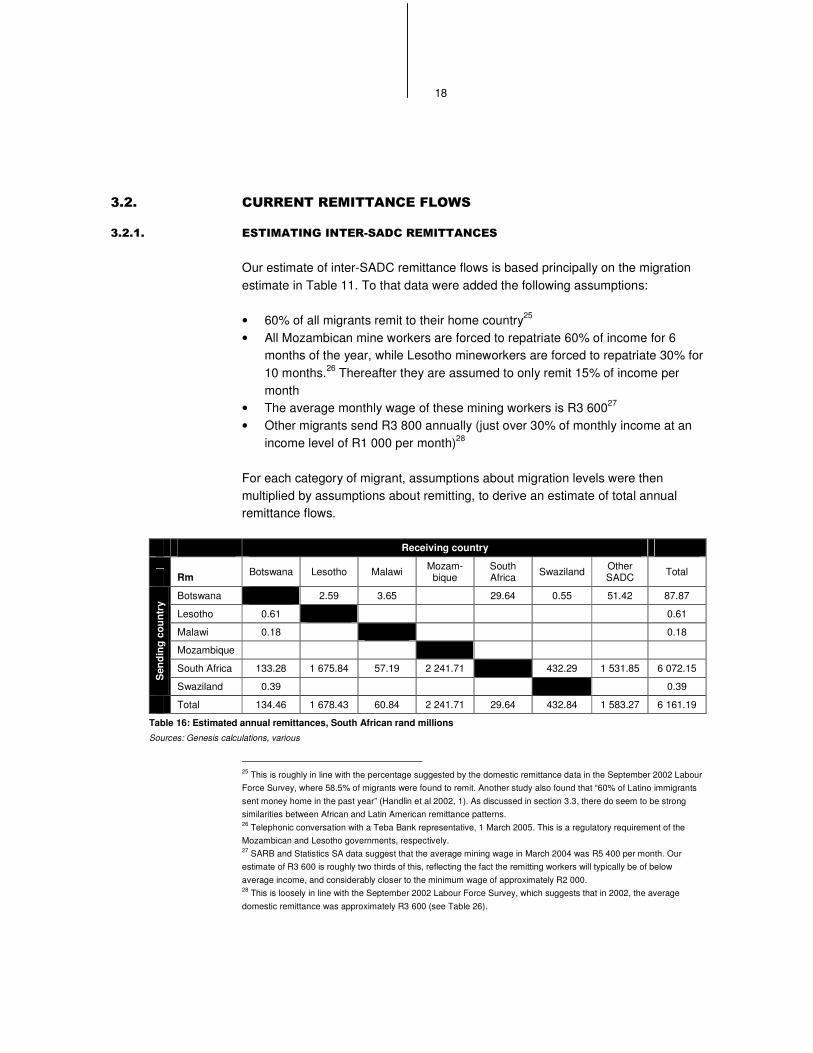
Our estimate of inter-SADC remittance flows is based principally on the migration estimate in Table 11. To that data were added the following assumptions:
• 60% of all migrants remit to their home country25 • All Mozambican mine workers are forced to repatriate 60% of income for 6
months of the year, while Lesotho mineworkers are forced to repatriate 30% for 10 months.26 Thereafter they are assumed to only remit 15% of income per month
• The average monthly wage of these mining workers is R3 60027 • Other migrants send R3 800 annually (just over 30% of monthly income at an
income level of R1 000 per month)28
For each category of migrant, assumptions about migration levels were then multiplied by assumptions about remitting, to derive an estimate of total annual remittance flows.
Receiving country
Rm Botswana Lesotho Malawi Mozam-bique
South Africa Swaziland Other
SADC Total
Botswana 2.59 3.65 29.64 0.55 51.42 87.87
Lesotho 0.61 0.61
Malawi 0.18 0.18
Mozambique
South Africa 133.28 1 675.84 57.19 2 241.71 432.29 1 531.85 6 072.15
Sen
ding
cou
ntry
Swaziland 0.39 0.39
Total 134.46 1 678.43 60.84 2 241.71 29.64 432.84 1 583.27 6 161.19
Table 16: Estimated annual remittances, South African rand millions Sources: Genesis calculations, various
25 This is roughly in line with the percentage suggested by the domestic remittance data in the September 2002 Labour Force Survey, where 58.5% of migrants were found to remit. Another study also found that “60% of Latino immigrants sent money home in the past year” (Handlin et al 2002, 1). As discussed in section 3.3, there do seem to be strong similarities between African and Latin American remittance patterns. 26 Telephonic conversation with a Teba Bank representative, 1 March 2005. This is a regulatory requirement of the Mozambican and Lesotho governments, respectively. 27 SARB and Statistics SA data suggest that the average mining wage in March 2004 was R5 400 per month. Our estimate of R3 600 is roughly two thirds of this, reflecting the fact the remitting workers will typically be of below average income, and considerably closer to the minimum wage of approximately R2 000. 28 This is loosely in line with the September 2002 Labour Force Survey, which suggests that in 2002, the average domestic remittance was approximately R3 600 (see Table 26).
19
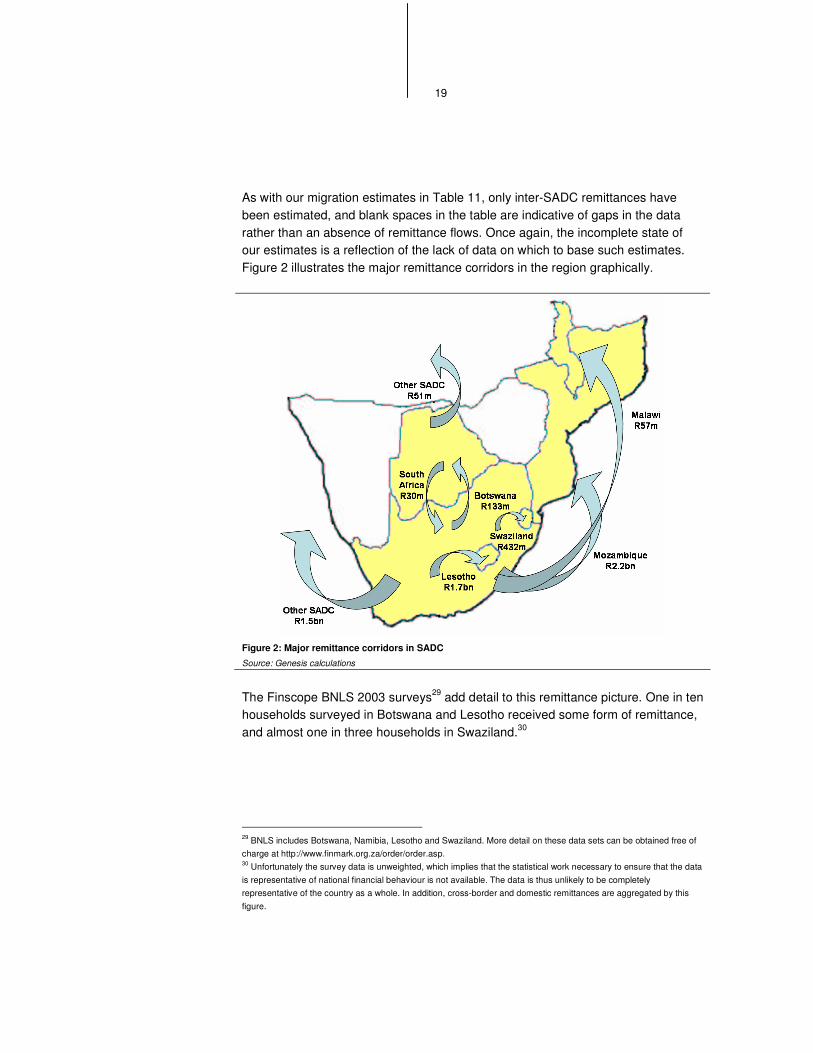
As with our migration estimates in Table 11, only inter-SADC remittances have been estimated, and blank spaces in the table are indicative of gaps in the data rather than an absence of remittance flows. Once again, the incomplete state of our estimates is a reflection of the lack of data on which to base such estimates. Figure 2 illustrates the major remittance corridors in the region graphically.
Figure 2: Major remittance corridors in SADC
Source: Genesis calculations
The Finscope BNLS 2003 surveys29 add detail to this remittance picture. One in ten households surveyed in Botswana and Lesotho received some form of remittance, and almost one in three households in Swaziland.30
29 BNLS includes Botswana, Namibia, Lesotho and Swaziland. More detail on these data sets can be obtained free of charge at http://www.finmark.org.za/order/order.asp. 30 Unfortunately the survey data is unweighted, which implies that the statistical work necessary to ensure that the data is representative of national financial behaviour is not available. The data is thus unlikely to be completely representative of the country as a whole. In addition, cross-border and domestic remittances are aggregated by this figure.
20
Botswana Namibia Lesotho Swaziland
No remittance receipts in household 90.6% 97.5% 89.7% 70.5% At least one person in the household receives remittances 9.4% 2.5% 10.3% 29.5%
Table 17: Remittance receipts in BNLS countries Source: Finscope BNLS 2003
In Botswana, Namibia and Lesotho, the most typical pattern of remitting is irregular, while in Swaziland, remittances are most often sent on a monthly basis. This may reflect the higher level of remitting in Swaziland shown in Table 17, with remittances possibly playing a more important role in terms of income support here than for the other BNLS countries.
Botswana Namibia Lesotho Swaziland
Daily remittance receipts 2.0% 0.0% 0.0% 0.6%
Weekly remittance receipts 0.0% 0.0% 1.8% 2.2%
Monthly remittance receipts 38.0% 22.2% 45.5% 63.1%
Other regular remittance receipts 10.0% 0.0% 0.0% 0.0%
Irregular remittance receipts 50.0% 77.8% 52.7% 34.1%
Table 18: Frequency of remittance receipts
Source: Finscope BNLS 2003
����� �������� �������������������������������
Substantially better data is available on domestic remittances than on international remittances. Our principal data source here remains the September 2002 LFS. The relevant section of the LFS starts with the question “are there any persons who are usually regarded as members of this household, but who are usually away for a month or more because they are migrant workers?” Migrants who have permanently left the family home, but still remit to family, are therefore excluded from the LFS estimates of remittances, as are remitters who have never been regarded as members of the household (for example, urban grandchildren who remit to rural grandparents).
The exclusion of these permanent migrants therefore entails that the LFS data, as summarised in Table 19, represents an underestimate of the size of the domestic remittance market, and probably a substantial underestimate. It is thus likely that the domestic remittances market is substantially larger than the flow of remittances out of South Africa into SADC (approximately R6bn, as shown in Table 16).
21
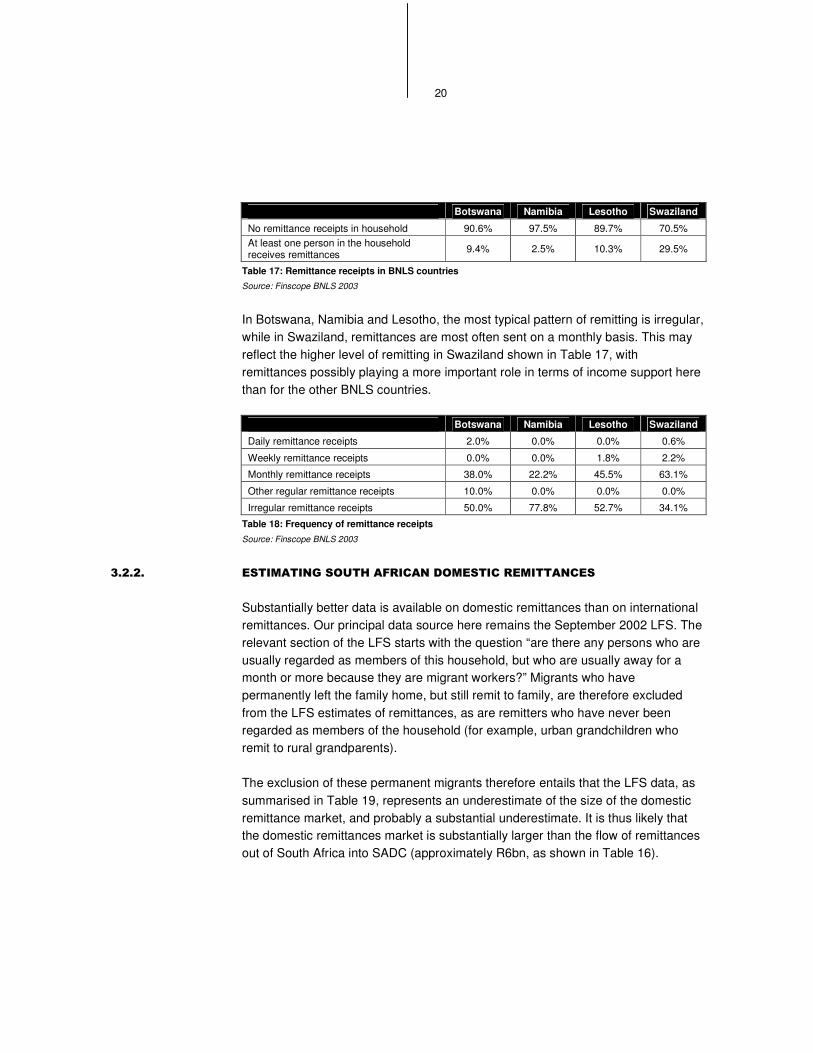
% of migrants remitting:
No money given 41.52%
R1 500 or under 23.20%
R5 000 or under, over R1 500 22.64%
R10 000 or under, over R5 000 9.01%
R20 000 or under, over R10 000 2.09%
Over R20 000 given 1.83%
Average annual remittance R 3,574.70
Total annual remittances R 6 179.3m
Table 19: Domestic remittances – annual amount remitted, average remittance and total domestic
remittances
Source: September 2002 Labour Force Survey
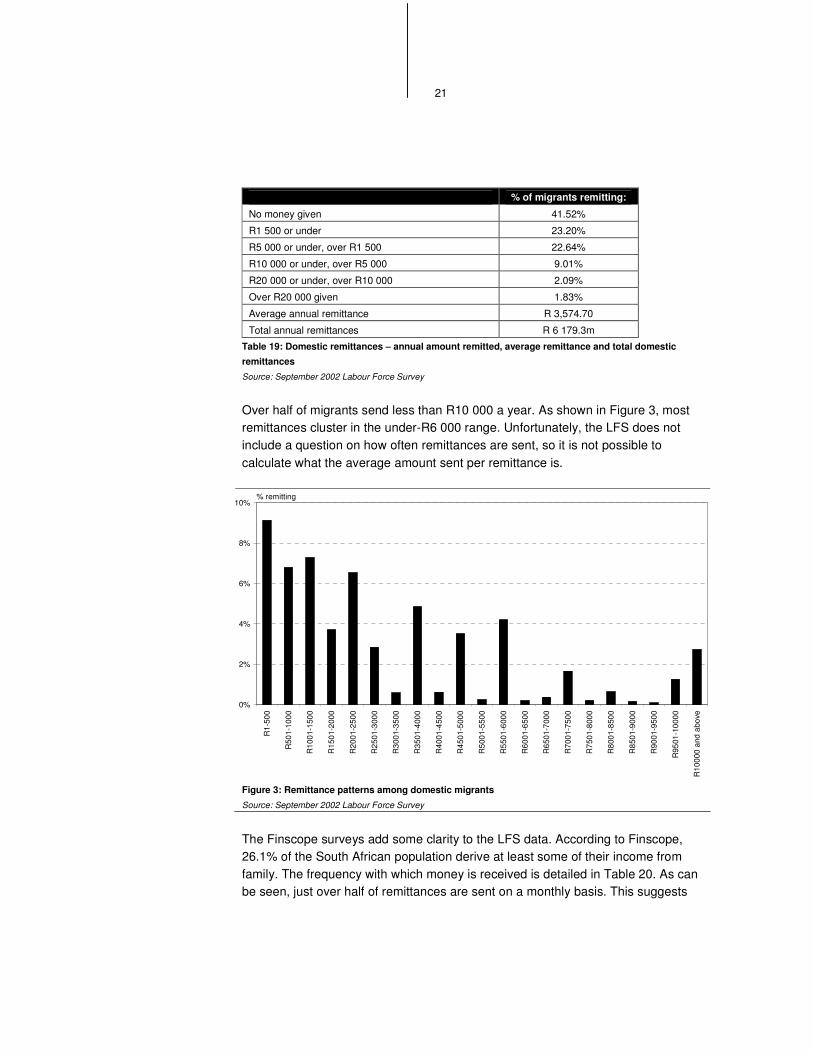
Over half of migrants send less than R10 000 a year. As shown in Figure 3, most remittances cluster in the under-R6 000 range. Unfortunately, the LFS does not include a question on how often remittances are sent, so it is not possible to calculate what the average amount sent per remittance is.
0%
2%
4%
6%
8%
10%
R1-
500
R50
1-10
00
R10
01-1
500
R15
01-2
000
R20
01-2
500
R25
01-3
000
R30
01-3
500
R35
01-4
000
R40
01-4
500
R45
01-5
000
R50
01-5
500
R55
01-6
000
R60
01-6
500
R65
01-7
000
R70
01-7
500
R75
01-8
000
R80
01-8
500
R85
01-9
000
R90
01-9
500
R95
01-1
0000
R10
000
and
abov
e
% remitting
Figure 3: Remittance patterns among domestic migrants
Source: September 2002 Labour Force Survey
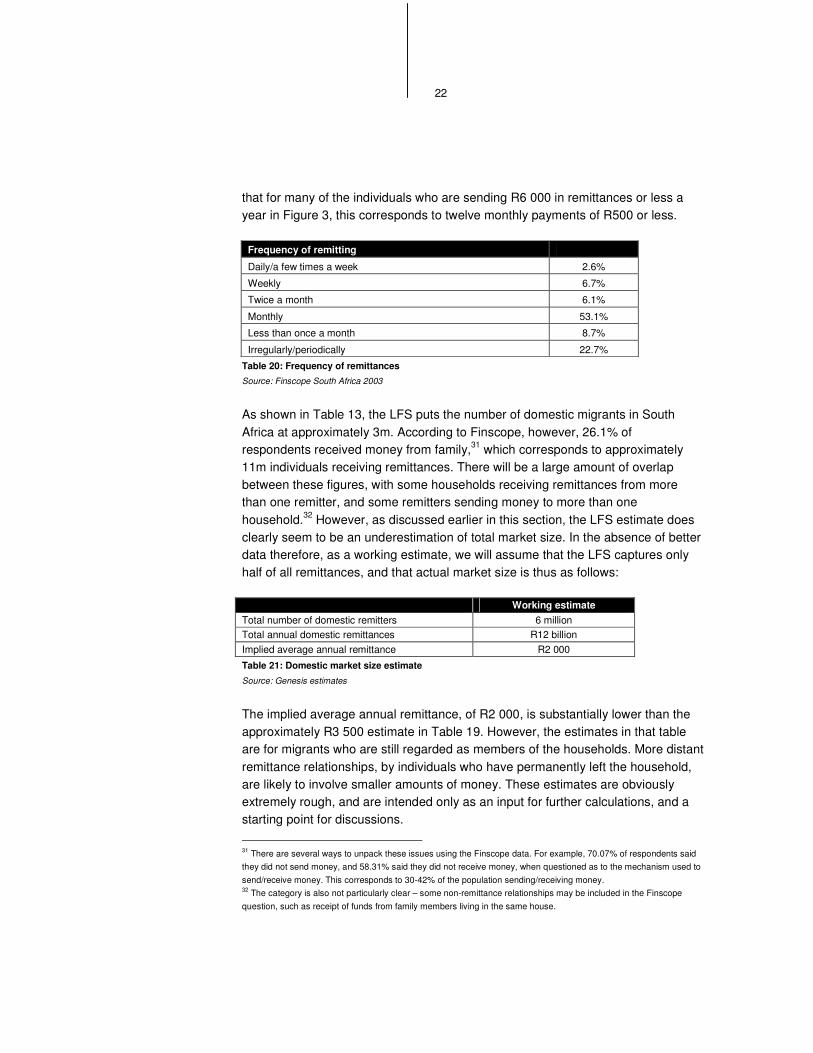
The Finscope surveys add some clarity to the LFS data. According to Finscope, 26.1% of the South African population derive at least some of their income from family. The frequency with which money is received is detailed in Table 20. As can be seen, just over half of remittances are sent on a monthly basis. This suggests
22
that for many of the individuals who are sending R6 000 in remittances or less a year in Figure 3, this corresponds to twelve monthly payments of R500 or less.
Frequency of remitting
Daily/a few times a week 2.6%
Weekly 6.7%
Twice a month 6.1%
Monthly 53.1%
Less than once a month 8.7%
Irregularly/periodically 22.7%
Table 20: Frequency of remittances Source: Finscope South Africa 2003
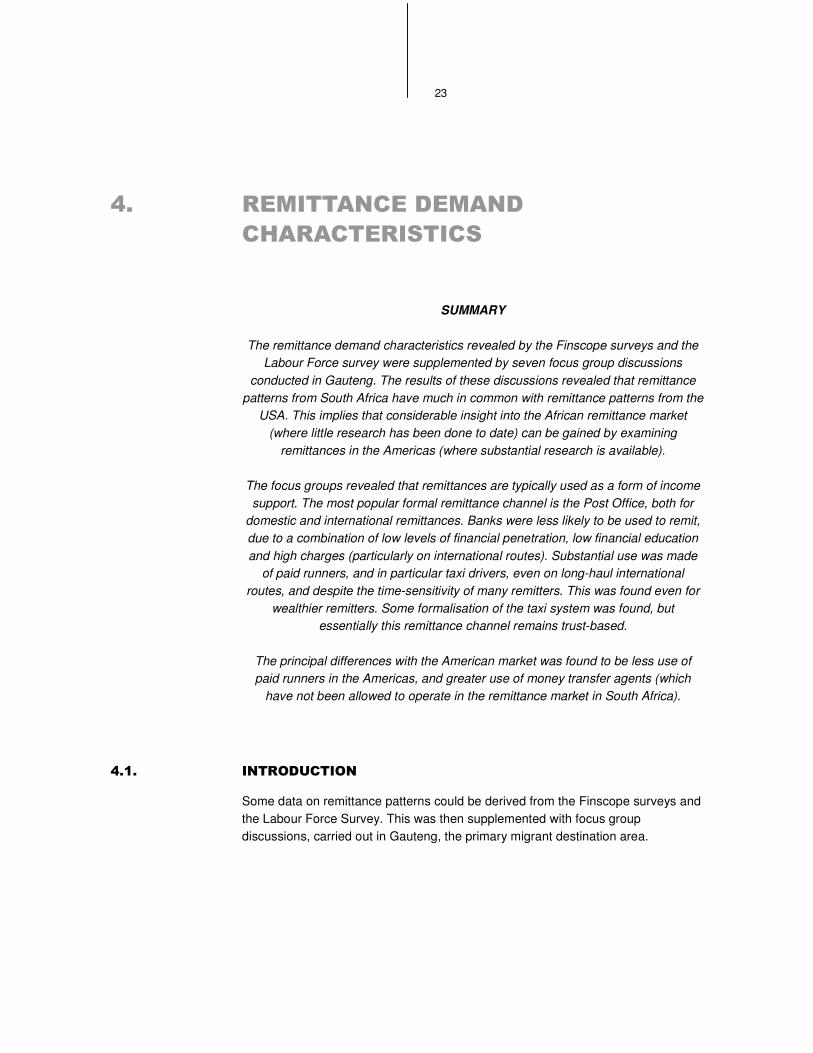
As shown in Table 13, the LFS puts the number of domestic migrants in South Africa at approximately 3m. According to Finscope, however, 26.1% of respondents received money from family,31 which corresponds to approximately 11m individuals receiving remittances. There will be a large amount of overlap between these figures, with some households receiving remittances from more than one remitter, and some remitters sending money to more than one household.32 However, as discussed earlier in this section, the LFS estimate does clearly seem to be an underestimation of total market size. In the absence of better data therefore, as a working estimate, we will assume that the LFS captures only half of all remittances, and that actual market size is thus as follows:
Working estimate Total number of domestic remitters 6 million Total annual domestic remittances R12 billion Implied average annual remittance R2 000
Table 21: Domestic market size estimate
Source: Genesis estimates
The implied average annual remittance, of R2 000, is substantially lower than the approximately R3 500 estimate in Table 19. However, the estimates in that table are for migrants who are still regarded as members of the households. More distant remittance relationships, by individuals who have permanently left the household, are likely to involve smaller amounts of money. These estimates are obviously extremely rough, and are intended only as an input for further calculations, and a starting point for discussions.
31 There are several ways to unpack these issues using the Finscope data. For example, 70.07% of respondents said they did not send money, and 58.31% said they did not receive money, when questioned as to the mechanism used to send/receive money. This corresponds to 30-42% of the population sending/receiving money. 32 The category is also not particularly clear – some non-remittance relationships may be included in the Finscope question, such as receipt of funds from family members living in the same house.
23
!� ���������������
�������������
SUMMARY
The remittance demand characteristics revealed by the Finscope surveys and the Labour Force survey were supplemented by seven focus group discussions
conducted in Gauteng. The results of these discussions revealed that remittance patterns from South Africa have much in common with remittance patterns from the
USA. This implies that considerable insight into the African remittance market (where little research has been done to date) can be gained by examining
remittances in the Americas (where substantial research is available).
The focus groups revealed that remittances are typically used as a form of income support. The most popular formal remittance channel is the Post Office, both for
domestic and international remittances. Banks were less likely to be used to remit, due to a combination of low levels of financial penetration, low financial education and high charges (particularly on international routes). Substantial use was made
of paid runners, and in particular taxi drivers, even on long-haul international routes, and despite the time-sensitivity of many remitters. This was found even for
wealthier remitters. Some formalisation of the taxi system was found, but essentially this remittance channel remains trust-based.
The principal differences with the American market was found to be less use of paid runners in the Americas, and greater use of money transfer agents (which
have not been allowed to operate in the remittance market in South Africa).
!��� ����������
Some data on remittance patterns could be derived from the Finscope surveys and the Labour Force Survey. This was then supplemented with focus group discussions, carried out in Gauteng, the primary migrant destination area.
24
!��� ����� �������������
Seven focus group discussions on the remittance market were conducted by Uthini Research in January and February 2005 in Johannesburg. Discussions were structured as follows:
• Domestic transfers: two focus groups were conducted on the domestic transfer market, one consisting of blue collar workers and the other of white collar workers.33
• Cross border, same currency: individuals resident in South Africa, but remitting to a South African Customs Union/Common Monetary Area (“SACU/CMA”) country were interviewed. White collar and blue collar workers were interviewed separately.
• Cross border, different currency: individuals resident in South Africa and remitting to a SADC but non-CMA country were interviewed, in a white collar and blue collar group.
• Taxi drivers: taxi drivers who carried remittances, both domestically and cross-border, were interviewed.
Although the fact that all respondents were based in Johannesburg may introduce some bias into the sample, Gauteng (in which Johannesburg is located) is such a strong focus point for domestic migration that such bias is minimised (as shown in Table 15, almost half of domestic migrants reside in Gauteng).
!����� ������������ ��
4.2.1.1. AWARENESS AND USE OF FINANCIAL PRODUCTS
As expected, substantial differences were found between the level of financial knowledge of blue collar and white collar workers.
• Blue collar workers: were either unbanked, or held a limited-function savings account with an ATM card.34 Accounts were used only to deposit or withdraw cash, with very limited awareness of transfer functionality. When accounts needed to be paid, typically money was withdrawn and physically taken to the
33 Blue collar workers were the lower income/education group, and consisted mainly of labourers, domestic workers and the unemployed. The white collar worker group included a wide range of professions, such as quantity surveying, production assistants, secretaries, administrators, assistant managers and human resources officers. No formal breakdown of income and educational levels by group was collated. 34 Several respondents had recently opened the new low cost Mzansi account that has been launched by the major banks under a government encouraged policy to improve access by creating a low cost account.
25
creditor. Some discomfort with using technology, including ATM machines, was expressed. The domestic transfer group seemed to be more financially sophisticated than the two cross-border groups.
• White collar workers: the white collar workers as a whole were substantially more financially aware than the blue collar workers, with a small but significant minority even familiar with internet and telephonic banking. However, the cross border, non-CMA group resembled the blue collar groups in its level of financial awareness. In addition, greater awareness of the various financial channels available did not seem to translate into a noticeable difference in usage patterns, as illustrated in Table 22.
Interestingly, the cross-border group did not regard opening a bank account as particularly difficult. As long as the individual was employed and could supply an ID, payslip, some personal details and proof of legal residence, the focus group participants did not seem to have had problems in opening an account, even as a foreign national.
4.2.1.2. PURPOSE OF REMITTANCES
Most focus group participants described their remittances as the principal source of income for the family at home.
“I send to my sister to pay for the residence, so she is in big trouble if I don’t send the money.”
“I send to my grandmother – without that money she is dead.”
“They are depending on me at home, because my kids are there and if I do not send what will my kids eat the whole month? My mother is not working and she is looking after them.”
In addition, money is needed on an ad hoc basis to meet family emergencies. Specific systems to meet family emergencies, where there is an urgent need for money, have often been set up.
“If there is an emergency, if they say granny needs money to go to the hospital now and we don’t have the money, what I do is to have somebody stand by. I give say R200 for a month to this person and if they don’t use that money, the next time they need money I phone them to say use this money to take granny to the hospital.”
26
“If there are emergencies I tell them to borrow the money somewhere and I pay that person back by transferring into that account.”
27 of the 48 respondents were sending money home to their parents, while the rest all mentioned members of their immediate and extended family. None sent remittances to non-family members. Remittances to parents or grandparents may in fact be intended for minor children in the care of those family members.
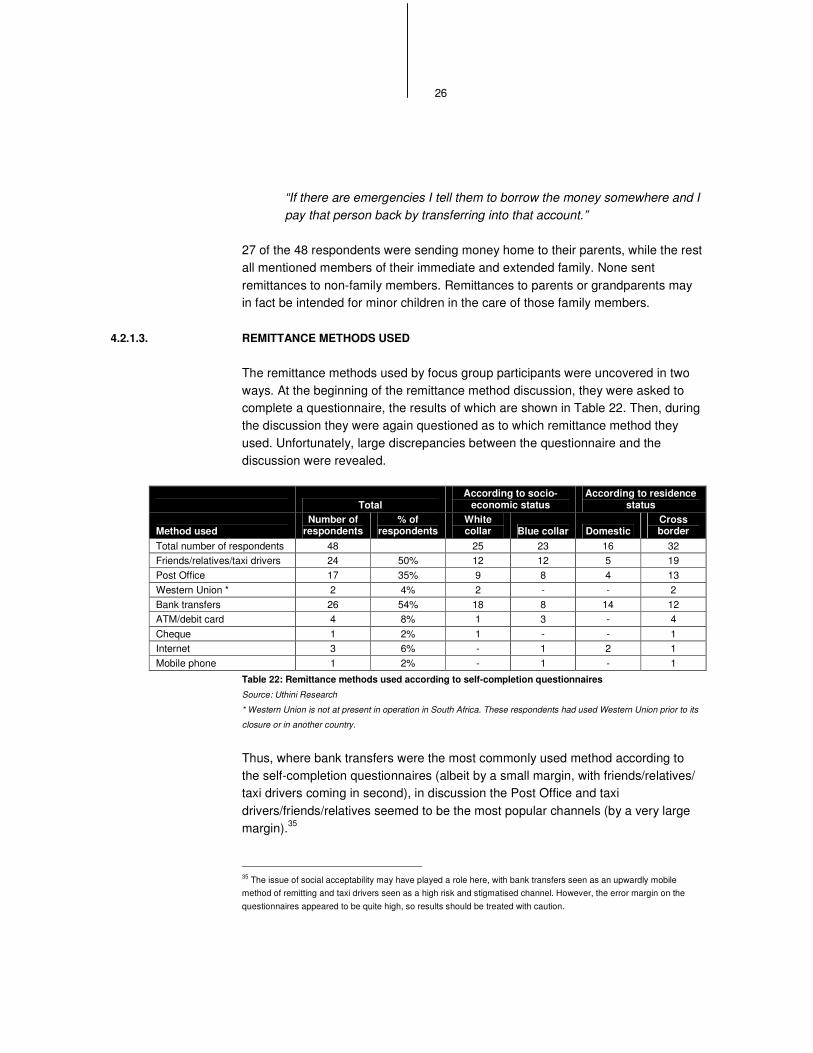
4.2.1.3. REMITTANCE METHODS USED
The remittance methods used by focus group participants were uncovered in two ways. At the beginning of the remittance method discussion, they were asked to complete a questionnaire, the results of which are shown in Table 22. Then, during the discussion they were again questioned as to which remittance method they used. Unfortunately, large discrepancies between the questionnaire and the discussion were revealed.
Total According to socio-
economic status According to residence
status
Method used Number of
respondents % of
respondents White collar Blue collar Domestic
Cross border
Total number of respondents 48 25 23 16 32 Friends/relatives/taxi drivers 24 50% 12 12 5 19 Post Office 17 35% 9 8 4 13 Western Union * 2 4% 2 - - 2 Bank transfers 26 54% 18 8 14 12 ATM/debit card 4 8% 1 3 - 4 Cheque 1 2% 1 - - 1 Internet 3 6% - 1 2 1 Mobile phone 1 2% - 1 - 1
Table 22: Remittance methods used according to self-completion questionnaires
Source: Uthini Research
* Western Union is not at present in operation in South Africa. These respondents had used Western Union prior to its
closure or in another country.
Thus, where bank transfers were the most commonly used method according to the self-completion questionnaires (albeit by a small margin, with friends/relatives/ taxi drivers coming in second), in discussion the Post Office and taxi drivers/friends/relatives seemed to be the most popular channels (by a very large margin).35
35 The issue of social acceptability may have played a role here, with bank transfers seen as an upwardly mobile method of remitting and taxi drivers seen as a high risk and stigmatised channel. However, the error margin on the questionnaires appeared to be quite high, so results should be treated with caution.
27
4.2.1.4. CHOOSING REMITTANCE METHODS
A number of factors affected the choice of remittance channel:
• Ease: methods with less paperwork and documentation requirements were preferred
• Familiarity: often the remittance method used is the method used by their parents and grandparents, or recommended by friends and family
• Cost: although participants had little precise knowledge of cost structures, their perception of which methods were cheapest tended to be accurate
• Speed: of particular importance when the remittance is intended to meet an emergency need
• Risk tolerance: for theft or other losses. Participants claimed to become more risk-averse as the size of the remittance increased
• Access: how easy it is for the recipient to reach the delivery point
Finally, remittance channels were chosen to suit individual circumstances, such as the access of the recipient to a particular remittance infrastructure, or, in the case of one fairly typical respondent:
“My uncle is a taxi driver so that is best for me.”
Participants indicated that they would not shift to a cheaper but unknown channel. Brand recognition and trust therefore are likely to represent an important entry barrier into this market, and a potential entrant which already has brand recognition would have a head start.36 Specific commentary on the various distribution channels is detailed below.
Bank transfers: bank transfers were seen as safe and quick, but relatively more expensive. They were used more often for domestic than for cross border transfers.
“They charge you a lot but your money will be safe.”
Post Office: the Post Office was felt to have a much better rural distribution network than the banks, and to be comparable to the bank in terms of safety and
36 For example, the groups were questioned about a hypothetical situation in which Pep Stores (a low income clothing retailer which has an extensive rural network) started a remittance service. Many participants indicated that this would be of use to them, although there was some concern that remittance money would then be misspent on luxuries from Pep.

28
speed. It was popular among both the domestic and cross-border groups, although concerns were raised about the trust-worthiness of the Malawian Post Office.
“The security part of it is that our grandmothers and great grandmothers they trust the post office more than anything – you will never hear that at the post office they stole your money.”
“I use the post office if there is an emergency at home – if they called me in the morning then later in the afternoon they get the money.”
The general perception was that the Post Office is less expensive than banks (although detailed awareness of cost structures was not present). The process of transferring money through the Post Office was not perceived to be intimidating (and of course the recipient and sender do not need to be banked, although this was not an issue that was discussed in depth in the groups).
“At the post office you just need the address of the person you are sending the money to and your address. They give you a form to fill in, you put your money in an envelope, you write the name of the receiver and sign, then they give you a slip, a sort of receipt.”
Taxi driver: although there is a greater risk that the money will be lost or stolen, sending via a taxi driver is cheap, there are no forms to fill in, and the unbanked can access it easily. The method is used extensively for both domestic and cross-border remittances, and with equal likelihood by both blue and white collar workers.
“If I don’t have a bank account and there is a taxi home boy that I can send it with, then I would ask him that brother can you please give this at home. But I’ll start by phoning and letting them know that I am sending this much money with this taxi man.”
“I send money with other people because at home the post office is far, a long walking distance and my mother is old so she cannot walk far. That is why I send the money via drivers.”
The use of taxi drivers seemed to be dependent on the trust in the taxi driver, the amount of money, and the urgency of the remittance. Although participants were aware of a risk that the money could be lost or stolen, and was not insured, this did not seem to affect their willingness to use taxi drivers. This suggests that the risk is not unacceptably high. Tellingly, no group participant reported that they personally had lost money sent via taxi. However, most group participants indicated that they
29
would be unwilling to send a large amount of money with a taxi driver (although one individual reported sending R10 000 via taxi on one occasion). Trust was an important element of the remittance channel.
“If you give the money to a taxi driver it won’t be just anyone, it must be someone that you know and trust – maybe you were studying with him at school and he never got a job and became a taxi driver.”37
“To give a taxi man a lot of money is unreasonable, because money is the devil. If it is a lot of money then you must use the post office or the bank.”
Friend or relative: sending via a friend or relative is essentially very similar to sending via a taxi driver. However, where taxi drivers may be reluctant to drive on dirt roads to deliver money in rural areas, use of a friend or family member can often result in the money being delivered door-to-door. If the relationship is sufficiently close, there are also unlikely to be any charges.
“If you give it to family or friends then you know that the amount that will arrive there is the same amount as you gave – no charges and no deductions.”
“In our country there are people from rural areas and if I send via the post office it will take time for it to reach the rural school where my children are, and after a week the post office sends the money back. The letter from the post office to the school can be delayed for weeks and then they send the money back to the sender.”
As with taxi drivers, trust remains an important part of the remittance relationship:
“There are people that I know and trust that go home 2-3 times a month. I make an appointment with these people, I put some groceries in a bag and I put the money in an envelope with a letter. We also count the money together. Then I ask him to bring back some proof that he did go and see my wife, he will then tell me which date he will be back and then I go and get that proof from him.”
Money transfer agencies: the groups were questioned on their awareness of money transfer agencies, and in particular Western Union. Awareness levels were 37 Although both taxi drivers and passengers emphasized that the remittance relationship was entirely based on trust, the nature of that trust varied from individual to individual. For some, the driver needed to be a trusted friend, while for others, the trust was in the institution of remitting itself, and the driver could be a stranger.
30
extremely low, given that Western Union does not operate in SA and Money Gram has a very limited presence. The highest awareness was in the cross-border, non-CMA group.
����!�������������������������������
A number of complex and well established informal remittance systems have arisen in communities with a long history of emigration. These include the fei ch’ien and chit systems in China, the Colombian black market peso system (used mainly to launder rather than remit money) and the Thai poey kuan system. Possibly the largest and best known informal remittance system, however, is hawala, which originated in India and Pakistan. The system carries approximately $10 billion to $20 billion a year in India and more than $5 billion a year in Pakistan.38
The mechanics of the system are as follows: a hawaladar (ie: broker) accepts funds from a remitter in country A who wishes to send money to country B. The details of the remittance (recipient, size, and a proposed collection code) are then sent by the hawaladar to their counterpart in country B, by phone, fax or email. Once the collection code is agreed on, the sending hawaladar gives it to the remitter, who must then privately relay it to the remittance recipient. The receiving hawalada then pays the recipient, on presentation of the collection code. The transaction is typically not receipted, and can therefore be characterised as trust-based.
Debts that arise between hawaladars can be cleared in a number of ways. Often there is a pre-existing business relationship, and debts can be cleared by under- or over-invoicing on transactions. Sometimes the receiving hawaladar is in debt to the sending hawaladar, and the hawala relationship is thus a means of clearing that debt.
For the consumer, motivations for using hawala rather than a formal remittance system include the following:39
• Cost effectiveness: hawalas are cheaper than formal remitters, charging commissions of only 0.25-1.25%40 • Speed and reliability: hawalas are often faster and more reliable than formal remittance channels • Lack of bureaucracy and identification requirements
Hawala systems have tended to follow the migration patterns of Indian migrants. However, the Indian community in South Africa is for the most part of extremely long standing (the bulk of the population immigrated between 1859 and 1910, but Indian convicts and slaves had arrived in the Cape Colony as early as 1654), and thus do not need to remit to family. Since 1994, immigration from India and other parts of Asia has increased somewhat, but the more recent migrant communities are still small, and no signs of domestic hawala operations were uncovered by this research (although immigrant Asian communities were not explicitly surveyed).
4.2.1.5. PRICE SENSITIVITY
Many focus group participants had limited awareness of bank charges in general, and this tendency was found in the remittance market as well. In fact, some participants expressed reluctance to know how much they were being charged:
“. . . I don’t want to know how much they charge me. If I search for the records then I’ll collapse so I don’t even want to know.”
38 Buencamino and Gorbunov 2002, 2 39 Jost and Sandhu 2000, http://www.interpol.int/Public/FinancialCrime/MoneyLaundering/Hawala/default.asp 40 Buencamino and Gorbunov 2002, 2
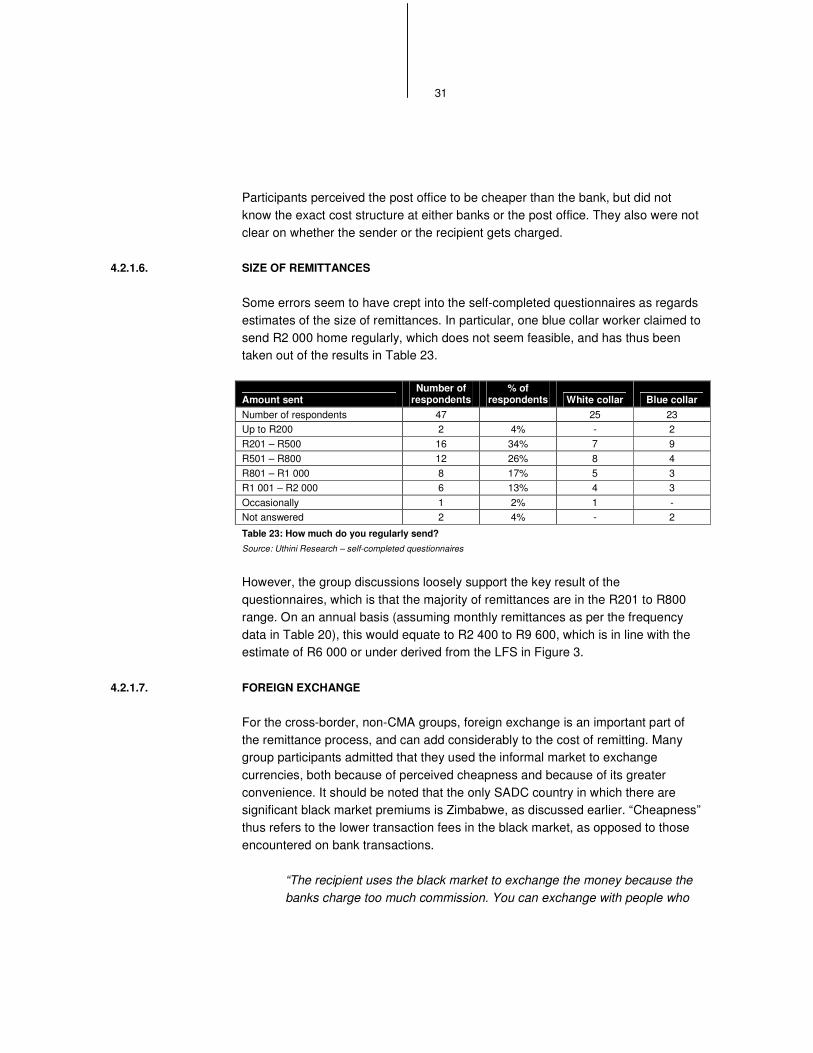
31
Participants perceived the post office to be cheaper than the bank, but did not know the exact cost structure at either banks or the post office. They also were not clear on whether the sender or the recipient gets charged.
4.2.1.6. SIZE OF REMITTANCES
Some errors seem to have crept into the self-completed questionnaires as regards estimates of the size of remittances. In particular, one blue collar worker claimed to send R2 000 home regularly, which does not seem feasible, and has thus been taken out of the results in Table 23.
Amount sent Number of
respondents % of
respondents White collar Blue collar Number of respondents 47 25 23 Up to R200 2 4% - 2 R201 – R500 16 34% 7 9 R501 – R800 12 26% 8 4 R801 – R1 000 8 17% 5 3 R1 001 – R2 000 6 13% 4 3 Occasionally 1 2% 1 - Not answered 2 4% - 2
Table 23: How much do you regularly send? Source: Uthini Research – self-completed questionnaires
However, the group discussions loosely support the key result of the questionnaires, which is that the majority of remittances are in the R201 to R800 range. On an annual basis (assuming monthly remittances as per the frequency data in Table 20), this would equate to R2 400 to R9 600, which is in line with the estimate of R6 000 or under derived from the LFS in Figure 3.
4.2.1.7. FOREIGN EXCHANGE
For the cross-border, non-CMA groups, foreign exchange is an important part of the remittance process, and can add considerably to the cost of remitting. Many group participants admitted that they used the informal market to exchange currencies, both because of perceived cheapness and because of its greater convenience. It should be noted that the only SADC country in which there are significant black market premiums is Zimbabwe, as discussed earlier. “Cheapness” thus refers to the lower transaction fees in the black market, as opposed to those encountered on bank transactions.
“The recipient uses the black market to exchange the money because the banks charge too much commission. You can exchange with people who
32
are coming this side and that way it’s easy, maybe you are from South Africa and that person is coming this side and you exchange with them.”
“When you arrive in SA you will find some people standing there who will exchange the money for you there. They are small boys and they have all the different currencies.”
4.2.1.8. TAXI DRIVERS
The focus group was comprised of eight taxi drivers, including six South Africans, a Malawian and a Mozambican. All were chosen because they drove long haul routes and had at some point carried remittances (of both cash and goods). Their routes were from Johannesburg to the following destinations:
• Malawi • the Eastern Cape • Lesotho • Limpopo • KwaZulu Natal • Swaziland
Goods remittances. All of the drivers said that at some point they had carried goods as well as cash remittances. Particularly on trips to rural areas, goods remittances were significant, often requiring a separate trailer to transport. Goods carried included boxes of groceries, furniture (beds, sofas, wardrobes), appliances (a fridge) and in one case, a dog. Some drivers refused to carry unaccompanied goods, on the basis that they might be used to smuggle illegal goods, or that collection might become a problem (in cases where unaccompanied goods are supposed to be collected at the taxi rank, the driver might end up having to personally deliver the goods if the collector does not appear).
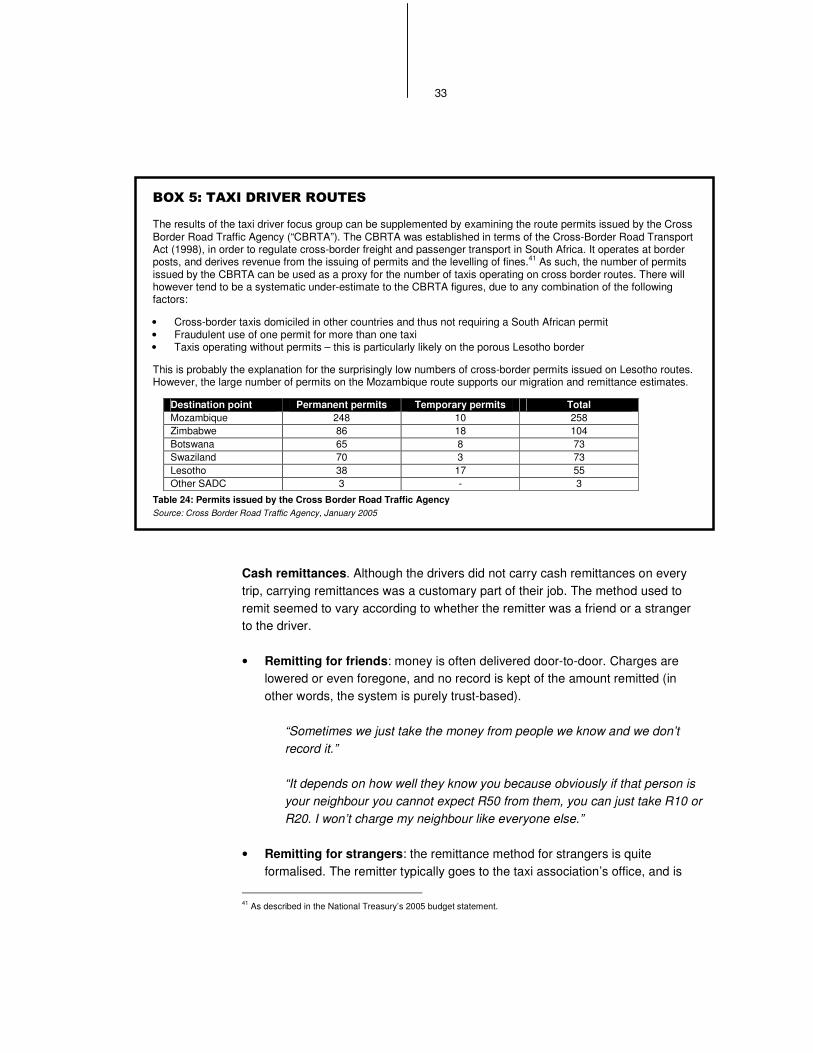
33
����"���������������������
The results of the taxi driver focus group can be supplemented by examining the route permits issued by the Cross Border Road Traffic Agency (“CBRTA”). The CBRTA was established in terms of the Cross-Border Road Transport Act (1998), in order to regulate cross-border freight and passenger transport in South Africa. It operates at border posts, and derives revenue from the issuing of permits and the levelling of fines.41 As such, the number of permits issued by the CBRTA can be used as a proxy for the number of taxis operating on cross border routes. There will however tend to be a systematic under-estimate to the CBRTA figures, due to any combination of the following factors:
• Cross-border taxis domiciled in other countries and thus not requiring a South African permit • Fraudulent use of one permit for more than one taxi • Taxis operating without permits – this is particularly likely on the porous Lesotho border
This is probably the explanation for the surprisingly low numbers of cross-border permits issued on Lesotho routes. However, the large number of permits on the Mozambique route supports our migration and remittance estimates.
Destination point Permanent permits Temporary permits Total Mozambique 248 10 258 Zimbabwe 86 18 104 Botswana 65 8 73 Swaziland 70 3 73 Lesotho 38 17 55 Other SADC 3 - 3
Table 24: Permits issued by the Cross Border Road Traffic Agency Source: Cross Border Road Traffic Agency, January 2005
Cash remittances. Although the drivers did not carry cash remittances on every trip, carrying remittances was a customary part of their job. The method used to remit seemed to vary according to whether the remitter was a friend or a stranger to the driver.
• Remitting for friends: money is often delivered door-to-door. Charges are lowered or even foregone, and no record is kept of the amount remitted (in other words, the system is purely trust-based).
“Sometimes we just take the money from people we know and we don’t record it.”
“It depends on how well they know you because obviously if that person is your neighbour you cannot expect R50 from them, you can just take R10 or R20. I won’t charge my neighbour like everyone else.”
• Remitting for strangers: the remittance method for strangers is quite formalised. The remitter typically goes to the taxi association’s office, and is
41 As described in the National Treasury’s 2005 budget statement.
34
directed to the driver who is leaving for the desired area soonest. The driver and the remitter count the money together in the office, and record the amount in a book kept in the office for this purpose. At the destination point, the money must be collected from the taxi association office in that town (and can be left there for collection if the recipient is not there when the taxi arrives). In order to collect the cash, the recipient must know the number plate of the taxi and the name of the driver that delivered it.
Although drivers are paid to carry remittances, there does not seem to be a formal or set payment system, and the taxi owner does not seem to take a cut (although the presence of the book in the taxi office indicates that the owners are typically fully aware that remittances are being sent).
“It is not a fixed amount, it differs – say they send R200, you will get R20 or R30, but if it is R1 000, it must be R50-R60, depending on how generous that person is.”
“Another thing, when they are sending money with us, they need to give a tip – it is a way of saying thank you, his appreciation.”
The drivers agreed that the typical remittance amount is in the region of R500, which is in line with the findings of the remittance focus groups and the LFS. Although most drivers had only ever carried a maximum of R800 – R5 000 in one envelope, one driver claimed to have once carried R18 000 on a trip, for a single remitter. The most envelopes ever carried at one time was five.
The drivers agreed that remitters were typically not insured against losses, through accidents or theft. However, in some circumstances taxi drivers are insured against such losses. In these cases, only remittances which have been entered into the book at the taxi association will be insured.
The drivers did not regard crossing national borders carrying money as problematic. The money is not declared, and border guards are typically not aware that the driver is carrying cash, and therefore do not look for it.
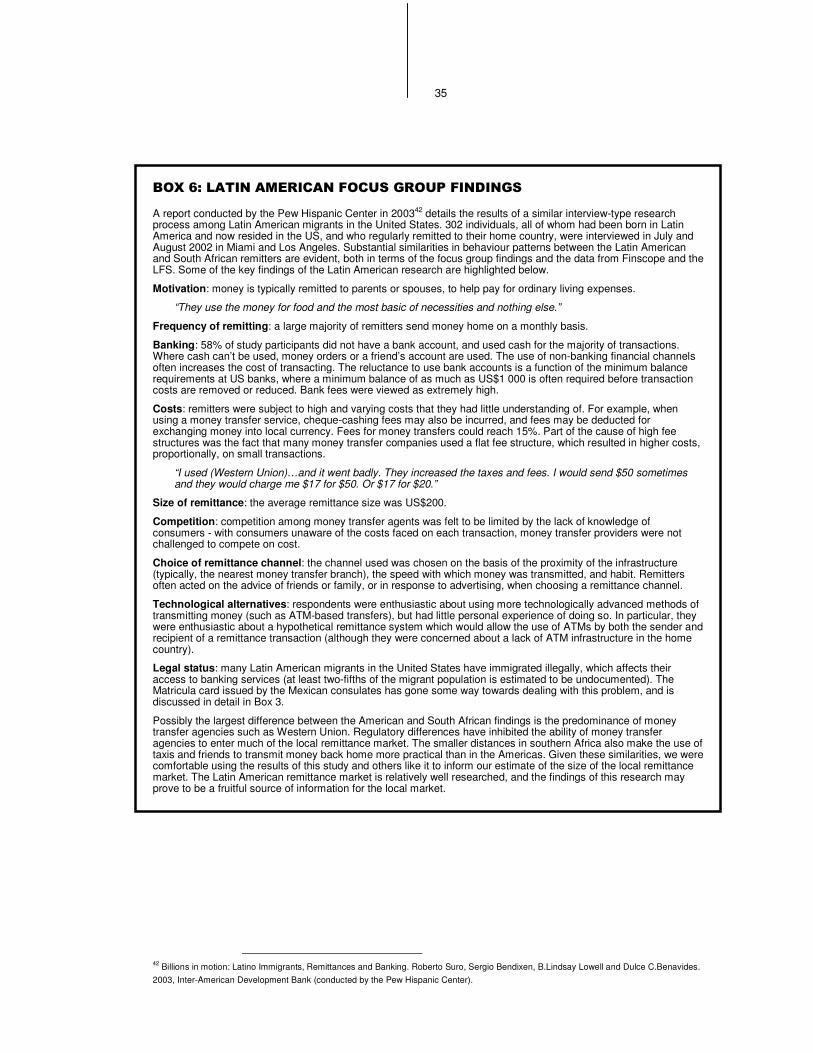
35
����#������������������� ��������� ��
A report conducted by the Pew Hispanic Center in 200342 details the results of a similar interview-type research process among Latin American migrants in the United States. 302 individuals, all of whom had been born in Latin America and now resided in the US, and who regularly remitted to their home country, were interviewed in July and August 2002 in Miami and Los Angeles. Substantial similarities in behaviour patterns between the Latin American and South African remitters are evident, both in terms of the focus group findings and the data from Finscope and the LFS. Some of the key findings of the Latin American research are highlighted below.
Motivation: money is typically remitted to parents or spouses, to help pay for ordinary living expenses.
“They use the money for food and the most basic of necessities and nothing else.”
Frequency of remitting: a large majority of remitters send money home on a monthly basis.
Banking: 58% of study participants did not have a bank account, and used cash for the majority of transactions. Where cash can’t be used, money orders or a friend’s account are used. The use of non-banking financial channels often increases the cost of transacting. The reluctance to use bank accounts is a function of the minimum balance requirements at US banks, where a minimum balance of as much as US$1 000 is often required before transaction costs are removed or reduced. Bank fees were viewed as extremely high.
Costs: remitters were subject to high and varying costs that they had little understanding of. For example, when using a money transfer service, cheque-cashing fees may also be incurred, and fees may be deducted for exchanging money into local currency. Fees for money transfers could reach 15%. Part of the cause of high fee structures was the fact that many money transfer companies used a flat fee structure, which resulted in higher costs, proportionally, on small transactions.
“I used (Western Union)…and it went badly. They increased the taxes and fees. I would send $50 sometimes and they would charge me $17 for $50. Or $17 for $20.”
Size of remittance: the average remittance size was US$200.
Competition: competition among money transfer agents was felt to be limited by the lack of knowledge of consumers - with consumers unaware of the costs faced on each transaction, money transfer providers were not challenged to compete on cost.
Choice of remittance channel: the channel used was chosen on the basis of the proximity of the infrastructure (typically, the nearest money transfer branch), the speed with which money was transmitted, and habit. Remitters often acted on the advice of friends or family, or in response to advertising, when choosing a remittance channel.
Technological alternatives: respondents were enthusiastic about using more technologically advanced methods of transmitting money (such as ATM-based transfers), but had little personal experience of doing so. In particular, they were enthusiastic about a hypothetical remittance system which would allow the use of ATMs by both the sender and recipient of a remittance transaction (although they were concerned about a lack of ATM infrastructure in the home country).
Legal status: many Latin American migrants in the United States have immigrated illegally, which affects their access to banking services (at least two-fifths of the migrant population is estimated to be undocumented). The Matricula card issued by the Mexican consulates has gone some way towards dealing with this problem, and is discussed in detail in Box 3.
Possibly the largest difference between the American and South African findings is the predominance of money transfer agencies such as Western Union. Regulatory differences have inhibited the ability of money transfer agencies to enter much of the local remittance market. The smaller distances in southern Africa also make the use of taxis and friends to transmit money back home more practical than in the Americas. Given these similarities, we were comfortable using the results of this study and others like it to inform our estimate of the size of the local remittance market. The Latin American remittance market is relatively well researched, and the findings of this research may prove to be a fruitful source of information for the local market.
42 Billions in motion: Latino Immigrants, Remittances and Banking. Roberto Suro, Sergio Bendixen, B.Lindsay Lowell and Dulce C.Benavides. 2003, Inter-American Development Bank (conducted by the Pew Hispanic Center).
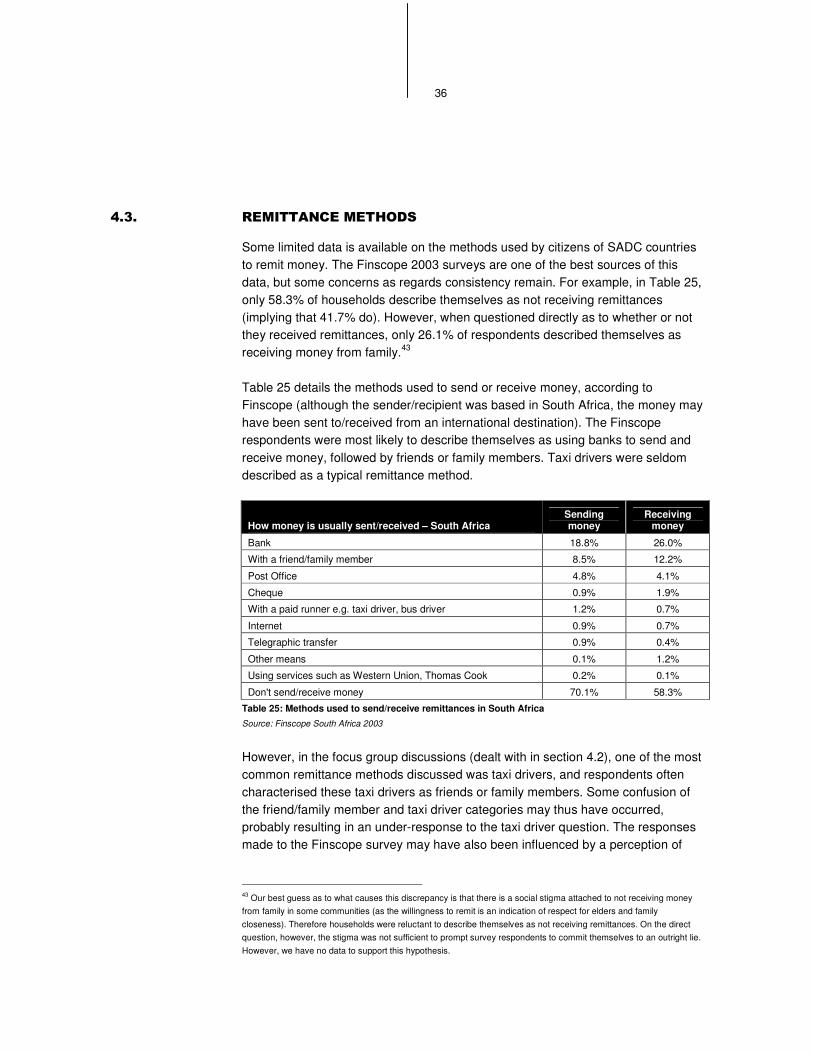
36
!� � �����������������
Some limited data is available on the methods used by citizens of SADC countries to remit money. The Finscope 2003 surveys are one of the best sources of this data, but some concerns as regards consistency remain. For example, in Table 25, only 58.3% of households describe themselves as not receiving remittances (implying that 41.7% do). However, when questioned directly as to whether or not they received remittances, only 26.1% of respondents described themselves as receiving money from family.43
Table 25 details the methods used to send or receive money, according to Finscope (although the sender/recipient was based in South Africa, the money may have been sent to/received from an international destination). The Finscope respondents were most likely to describe themselves as using banks to send and receive money, followed by friends or family members. Taxi drivers were seldom described as a typical remittance method.
How money is usually sent/received – South Africa Sending money
Receiving money
Bank 18.8% 26.0%
With a friend/family member 8.5% 12.2%
Post Office 4.8% 4.1%
Cheque 0.9% 1.9%
With a paid runner e.g. taxi driver, bus driver 1.2% 0.7%
Internet 0.9% 0.7%
Telegraphic transfer 0.9% 0.4%
Other means 0.1% 1.2%
Using services such as Western Union, Thomas Cook 0.2% 0.1%
Don't send/receive money 70.1% 58.3%
Table 25: Methods used to send/receive remittances in South Africa Source: Finscope South Africa 2003
However, in the focus group discussions (dealt with in section 4.2), one of the most common remittance methods discussed was taxi drivers, and respondents often characterised these taxi drivers as friends or family members. Some confusion of the friend/family member and taxi driver categories may thus have occurred, probably resulting in an under-response to the taxi driver question. The responses made to the Finscope survey may have also been influenced by a perception of
43 Our best guess as to what causes this discrepancy is that there is a social stigma attached to not receiving money from family in some communities (as the willingness to remit is an indication of respect for elders and family closeness). Therefore households were reluctant to describe themselves as not receiving remittances. On the direct question, however, the stigma was not sufficient to prompt survey respondents to commit themselves to an outright lie. However, we have no data to support this hypothesis.
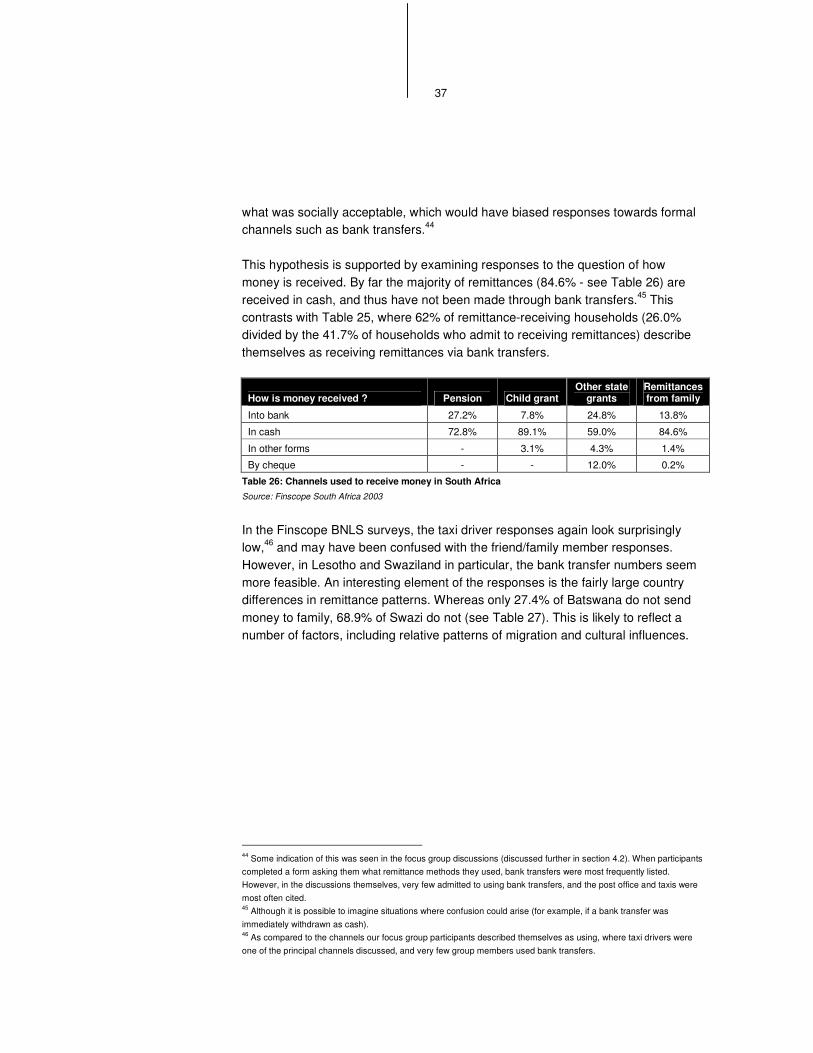
37
what was socially acceptable, which would have biased responses towards formal channels such as bank transfers.44
This hypothesis is supported by examining responses to the question of how money is received. By far the majority of remittances (84.6% - see Table 26) are received in cash, and thus have not been made through bank transfers.45 This contrasts with Table 25, where 62% of remittance-receiving households (26.0% divided by the 41.7% of households who admit to receiving remittances) describe themselves as receiving remittances via bank transfers.
How is money received ? Pension Child grant Other state
grants Remittances from family
Into bank 27.2% 7.8% 24.8% 13.8%
In cash 72.8% 89.1% 59.0% 84.6%
In other forms - 3.1% 4.3% 1.4%
By cheque - - 12.0% 0.2%
Table 26: Channels used to receive money in South Africa Source: Finscope South Africa 2003
In the Finscope BNLS surveys, the taxi driver responses again look surprisingly low,46 and may have been confused with the friend/family member responses. However, in Lesotho and Swaziland in particular, the bank transfer numbers seem more feasible. An interesting element of the responses is the fairly large country differences in remittance patterns. Whereas only 27.4% of Batswana do not send money to family, 68.9% of Swazi do not (see Table 27). This is likely to reflect a number of factors, including relative patterns of migration and cultural influences.
44 Some indication of this was seen in the focus group discussions (discussed further in section 4.2). When participants completed a form asking them what remittance methods they used, bank transfers were most frequently listed. However, in the discussions themselves, very few admitted to using bank transfers, and the post office and taxis were most often cited. 45 Although it is possible to imagine situations where confusion could arise (for example, if a bank transfer was immediately withdrawn as cash). 46 As compared to the channels our focus group participants described themselves as using, where taxi drivers were one of the principal channels discussed, and very few group members used bank transfers.
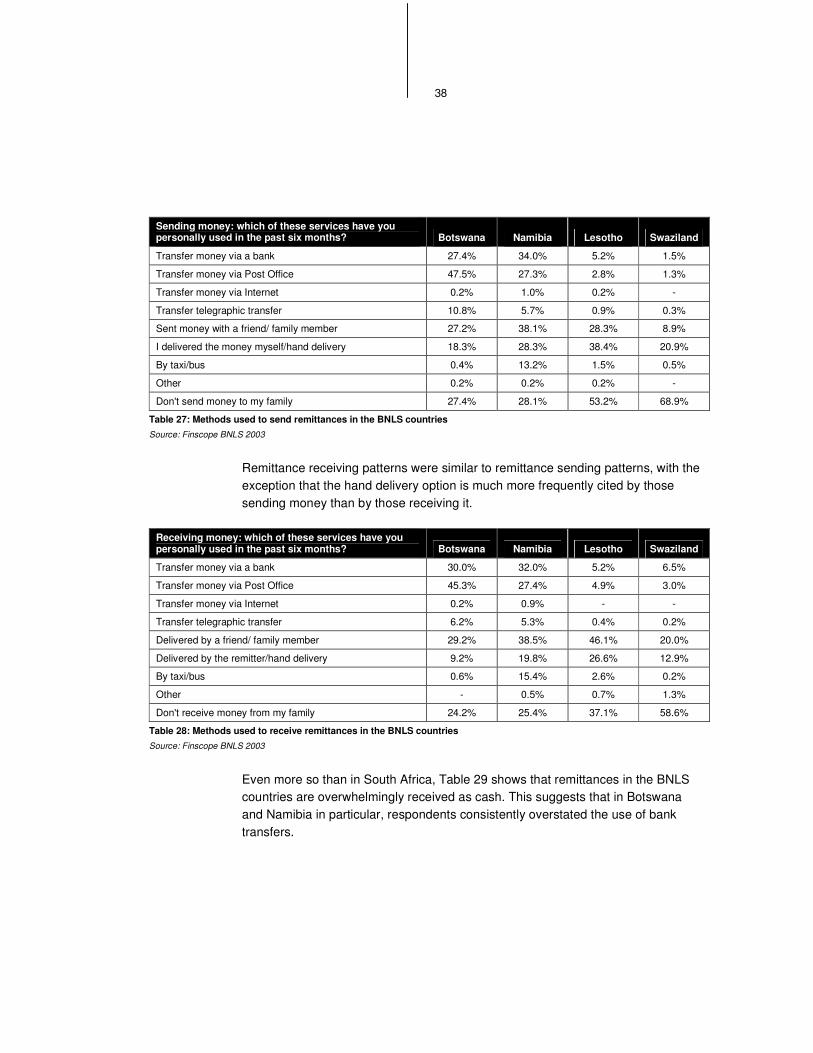
38
Sending money: which of these services have you personally used in the past six months? Botswana Namibia Lesotho Swaziland
Transfer money via a bank 27.4% 34.0% 5.2% 1.5%
Transfer money via Post Office 47.5% 27.3% 2.8% 1.3%
Transfer money via Internet 0.2% 1.0% 0.2% -
Transfer telegraphic transfer 10.8% 5.7% 0.9% 0.3%
Sent money with a friend/ family member 27.2% 38.1% 28.3% 8.9%
I delivered the money myself/hand delivery 18.3% 28.3% 38.4% 20.9%
By taxi/bus 0.4% 13.2% 1.5% 0.5%
Other 0.2% 0.2% 0.2% -
Don't send money to my family 27.4% 28.1% 53.2% 68.9%
Table 27: Methods used to send remittances in the BNLS countries Source: Finscope BNLS 2003
Remittance receiving patterns were similar to remittance sending patterns, with the exception that the hand delivery option is much more frequently cited by those sending money than by those receiving it.
Receiving money: which of these services have you personally used in the past six months? Botswana Namibia Lesotho Swaziland
Transfer money via a bank 30.0% 32.0% 5.2% 6.5%
Transfer money via Post Office 45.3% 27.4% 4.9% 3.0%
Transfer money via Internet 0.2% 0.9% - -
Transfer telegraphic transfer 6.2% 5.3% 0.4% 0.2%
Delivered by a friend/ family member 29.2% 38.5% 46.1% 20.0%
Delivered by the remitter/hand delivery 9.2% 19.8% 26.6% 12.9%
By taxi/bus 0.6% 15.4% 2.6% 0.2%
Other - 0.5% 0.7% 1.3%
Don't receive money from my family 24.2% 25.4% 37.1% 58.6%
Table 28: Methods used to receive remittances in the BNLS countries Source: Finscope BNLS 2003
Even more so than in South Africa, Table 29 shows that remittances in the BNLS countries are overwhelmingly received as cash. This suggests that in Botswana and Namibia in particular, respondents consistently overstated the use of bank transfers.
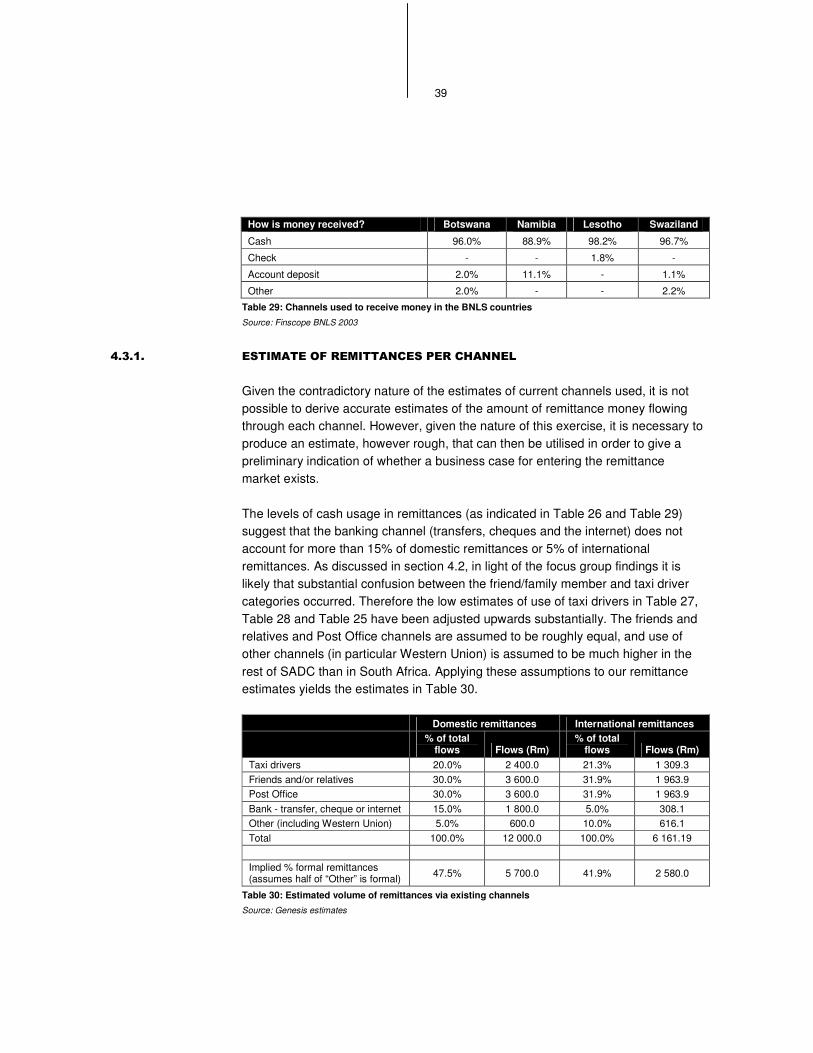
39
How is money received? Botswana Namibia Lesotho Swaziland
Cash 96.0% 88.9% 98.2% 96.7%
Check - - 1.8% -
Account deposit 2.0% 11.1% - 1.1%
Other 2.0% - - 2.2%
Table 29: Channels used to receive money in the BNLS countries
Source: Finscope BNLS 2003
!� ��� �������������������������������
Given the contradictory nature of the estimates of current channels used, it is not possible to derive accurate estimates of the amount of remittance money flowing through each channel. However, given the nature of this exercise, it is necessary to produce an estimate, however rough, that can then be utilised in order to give a preliminary indication of whether a business case for entering the remittance market exists.
The levels of cash usage in remittances (as indicated in Table 26 and Table 29) suggest that the banking channel (transfers, cheques and the internet) does not account for more than 15% of domestic remittances or 5% of international remittances. As discussed in section 4.2, in light of the focus group findings it is likely that substantial confusion between the friend/family member and taxi driver categories occurred. Therefore the low estimates of use of taxi drivers in Table 27, Table 28 and Table 25 have been adjusted upwards substantially. The friends and relatives and Post Office channels are assumed to be roughly equal, and use of other channels (in particular Western Union) is assumed to be much higher in the rest of SADC than in South Africa. Applying these assumptions to our remittance estimates yields the estimates in Table 30.
Domestic remittances International remittances
% of total
flows Flows (Rm) % of total
flows Flows (Rm) Taxi drivers 20.0% 2 400.0 21.3% 1 309.3 Friends and/or relatives 30.0% 3 600.0 31.9% 1 963.9 Post Office 30.0% 3 600.0 31.9% 1 963.9 Bank - transfer, cheque or internet 15.0% 1 800.0 5.0% 308.1 Other (including Western Union) 5.0% 600.0 10.0% 616.1 Total 100.0% 12 000.0 100.0% 6 161.19 Implied % formal remittances (assumes half of “Other” is formal) 47.5% 5 700.0 41.9% 2 580.0
Table 30: Estimated volume of remittances via existing channels Source: Genesis estimates
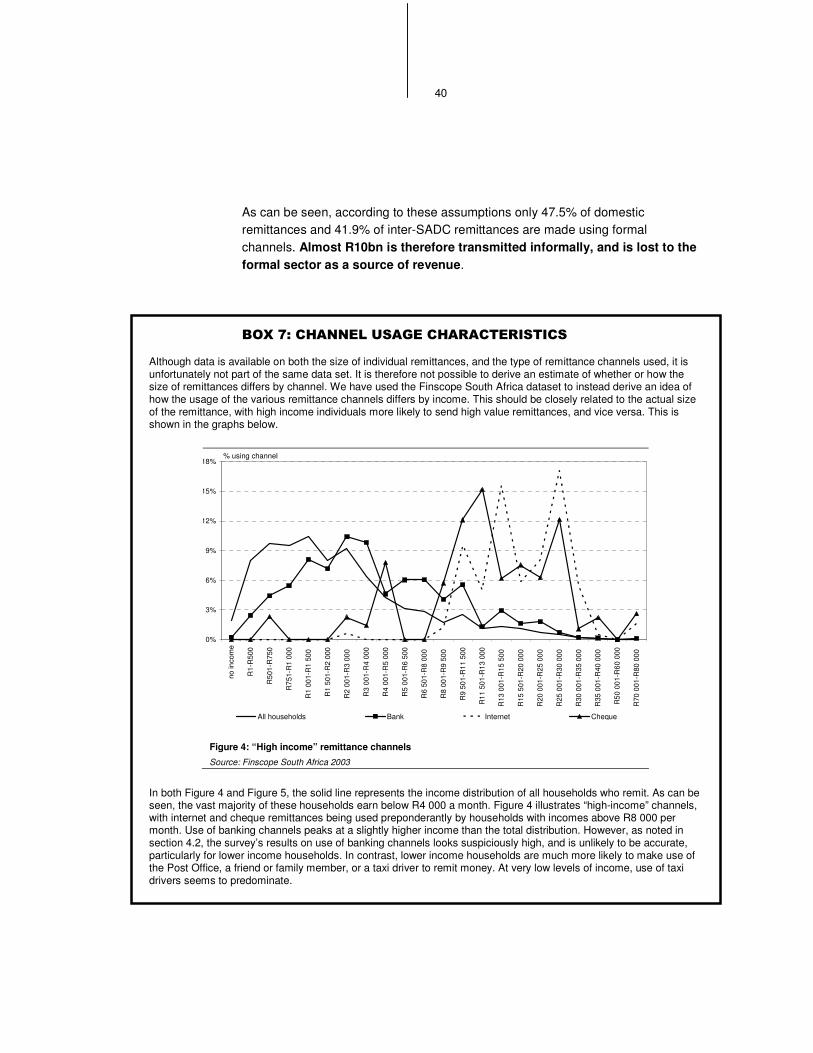
40
As can be seen, according to these assumptions only 47.5% of domestic remittances and 41.9% of inter-SADC remittances are made using formal channels. Almost R10bn is therefore transmitted informally, and is lost to the formal sector as a source of revenue.
����$���������� ���������������
Although data is available on both the size of individual remittances, and the type of remittance channels used, it is unfortunately not part of the same data set. It is therefore not possible to derive an estimate of whether or how the size of remittances differs by channel. We have used the Finscope South Africa dataset to instead derive an idea of how the usage of the various remittance channels differs by income. This should be closely related to the actual size of the remittance, with high income individuals more likely to send high value remittances, and vice versa. This is shown in the graphs below.
Figure 4: “High income” remittance channels
Source: Finscope South Africa 2003
In both Figure 4 and Figure 5, the solid line represents the income distribution of all households who remit. As can be seen, the vast majority of these households earn below R4 000 a month. Figure 4 illustrates “high-income” channels, with internet and cheque remittances being used preponderantly by households with incomes above R8 000 per month. Use of banking channels peaks at a slightly higher income than the total distribution. However, as noted in section 4.2, the survey’s results on use of banking channels looks suspiciously high, and is unlikely to be accurate, particularly for lower income households. In contrast, lower income households are much more likely to make use of the Post Office, a friend or family member, or a taxi driver to remit money. At very low levels of income, use of taxi drivers seems to predominate.
0%
3%
6%
9%
12%
15%
18%
no in
com
e
R1-
R50
0
R50
1-R
750
R75
1-R
1 00
0
R1
001-
R1
500
R1
501-
R2
000
R2
001-
R3
000
R3
001-
R4
000
R4
001-
R5
000
R5
001-
R6
500
R6
501-
R8
000
R8
001-
R9
500
R9
501-
R11
500
R11
501
-R13
000
R13
001
-R15
500
R15
501
-R20
000
R20
001
-R25
000
R25
001
-R30
000
R30
001
-R35
000
R35
001
-R40
000
R50
001
-R60
000
R70
001
-R80
000
All households Bank Internet Cheque
% using channel
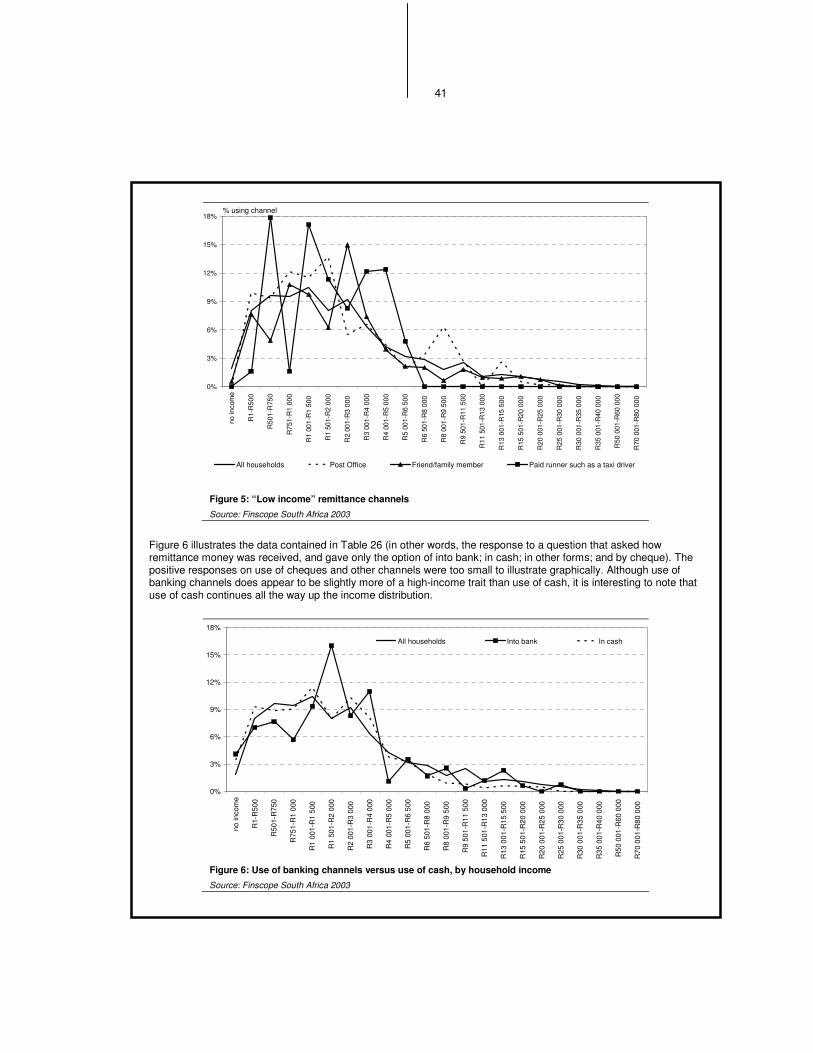
41
Figure 5: “Low income” remittance channels
Source: Finscope South Africa 2003
Figure 6 illustrates the data contained in Table 26 (in other words, the response to a question that asked how remittance money was received, and gave only the option of into bank; in cash; in other forms; and by cheque). The positive responses on use of cheques and other channels were too small to illustrate graphically. Although use of banking channels does appear to be slightly more of a high-income trait than use of cash, it is interesting to note that use of cash continues all the way up the income distribution.
0%
3%
6%
9%
12%
15%
18%
no in
com
e
R1-
R50
0
R50
1-R
750
R75
1-R
1 00
0
R1
001-
R1
500
R1
501-
R2
000
R2
001-
R3
000
R3
001-
R4
000
R4
001-
R5
000
R5
001-
R6
500
R6
501-
R8
000
R8
001-
R9
500
R9
501-
R11
500
R11
501
-R13
000
R13
001
-R15
500
R15
501
-R20
000
R20
001
-R25
000
R25
001
-R30
000
R30
001
-R35
000
R35
001
-R40
000
R50
001
-R60
000
R70
001
-R80
000
All households Into bank In cash
Figure 6: Use of banking channels versus use of cash, by household income
Source: Finscope South Africa 2003
0%
3%
6%
9%
12%
15%
18%
no in
com
e
R1-
R50
0
R50
1-R
750
R75
1-R
1 00
0
R1
001-
R1
500
R1
501-
R2
000
R2
001-
R3
000
R3
001-
R4
000
R4
001-
R5
000
R5
001-
R6
500
R6
501-
R8
000
R8
001-
R9
500
R9
501-
R11
500
R11
501
-R13
000
R13
001
-R15
500
R15
501
-R20
000
R20
001
-R25
000
R25
001
-R30
000
R30
001
-R35
000
R35
001
-R40
000
R50
001
-R60
000
R70
001
-R80
000
All households Post Office Friend/family member Paid runner such as a taxi driver
% using channel
42
"� �������������������������%�
������������� � �
SUMMARY
Given that more than half of all remittances seem to be travelling via informal channels, an opportunity exists to introduce new remittance products and channels
into this market. Increasing formalisation of remittances would be both profit-maximising for financial service providers and welfare-enhancing for remitters.
A number of potential remittance channels were identified, serving both banked and unbanked remitters, and the domestic and international remittance market. They included account deposits, inter-account transfers, various forms of mobile
airtime transfer, mobile banking, a two ATM card model, internet transfers to money transfer agents, the Post Office PIN product, the Mzansi Transfer product,
retailer PIN and POS models, the Western Union model and a prepaid card model. The wide range of models demonstrates the technological possibilities of the
current payments market. Where possible, pricing was based on models currently in use in South Africa. Where such pricing was not available, international pricing
was utilised.
"��� �����������
In section 3 we found that the remittance market in South Africa, for both domestic and cross-border flows, moves R18bn annually. However, only about R8bn of those funds travel via formal channels (see Table 30). This represents both a loss of revenue for financial services providers, and a welfare loss for remitters (who are forced to send money home via risky, slow and otherwise inefficient remittance channels). The formalisation of this market would be both pro-poor and welfare-enhancing for the economy as a whole.
Technological and market developments have made a number of potential money transfer models feasible in the South African market. Their characteristics, advantages and drawbacks are discussed below. For the purposes of the
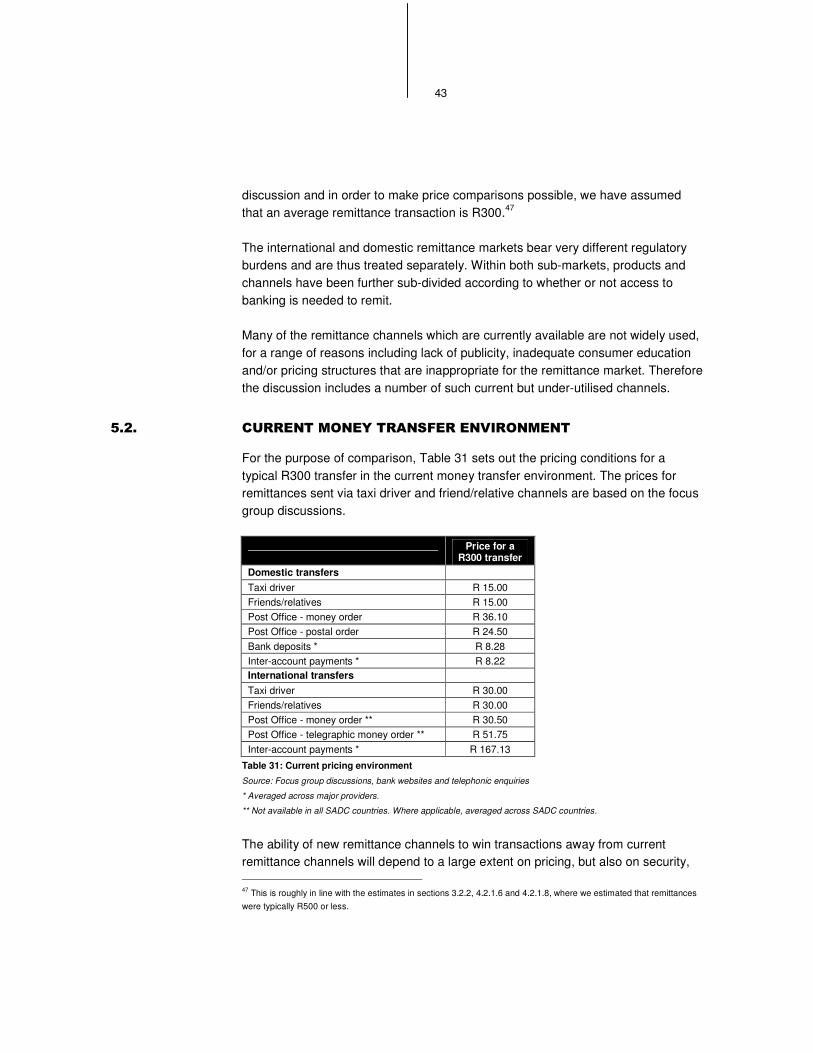
43
discussion and in order to make price comparisons possible, we have assumed that an average remittance transaction is R300.47
The international and domestic remittance markets bear very different regulatory burdens and are thus treated separately. Within both sub-markets, products and channels have been further sub-divided according to whether or not access to banking is needed to remit.
Many of the remittance channels which are currently available are not widely used, for a range of reasons including lack of publicity, inadequate consumer education and/or pricing structures that are inappropriate for the remittance market. Therefore the discussion includes a number of such current but under-utilised channels.
"��� ����������������������������
For the purpose of comparison, Table 31 sets out the pricing conditions for a typical R300 transfer in the current money transfer environment. The prices for remittances sent via taxi driver and friend/relative channels are based on the focus group discussions.
Price for a
R300 transfer Domestic transfers Taxi driver R 15.00 Friends/relatives R 15.00 Post Office - money order R 36.10 Post Office - postal order R 24.50 Bank deposits * R 8.28 Inter-account payments * R 8.22 International transfers Taxi driver R 30.00 Friends/relatives R 30.00 Post Office - money order ** R 30.50 Post Office - telegraphic money order ** R 51.75 Inter-account payments * R 167.13
Table 31: Current pricing environment
Source: Focus group discussions, bank websites and telephonic enquiries
* Averaged across major providers.
** Not available in all SADC countries. Where applicable, averaged across SADC countries.
The ability of new remittance channels to win transactions away from current remittance channels will depend to a large extent on pricing, but also on security, 47 This is roughly in line with the estimates in sections 3.2.2, 4.2.1.6 and 4.2.1.8, where we estimated that remittances were typically R500 or less.
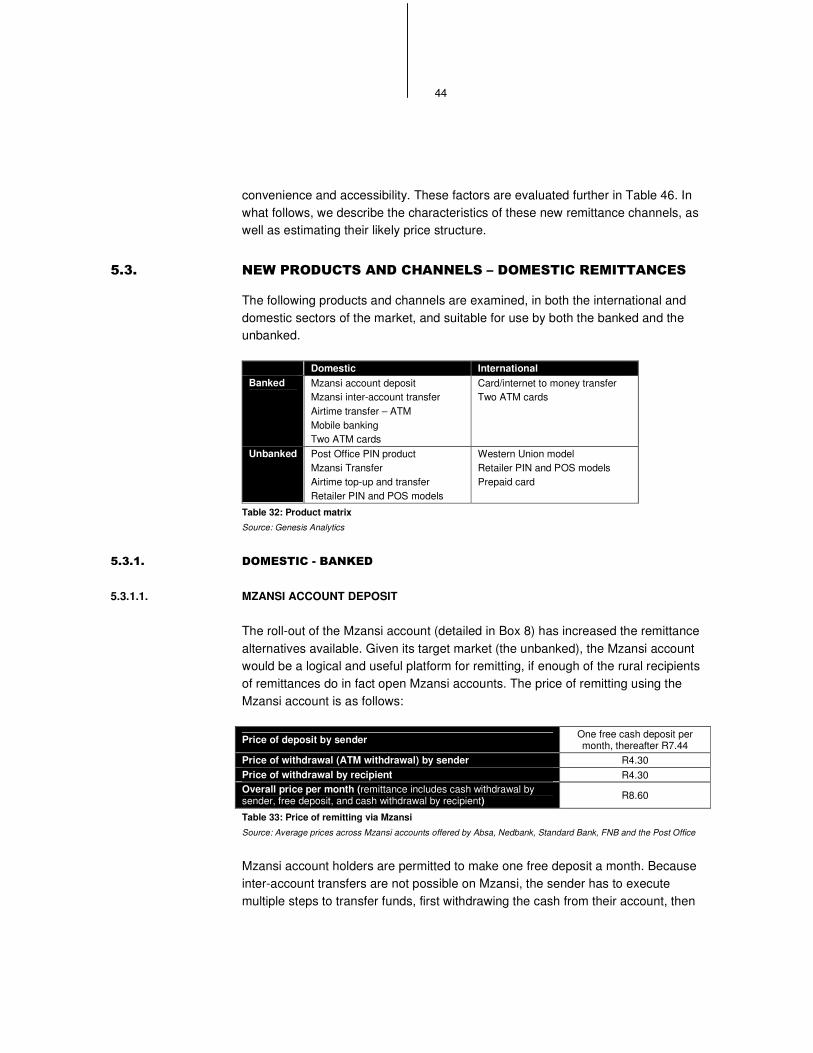
44
convenience and accessibility. These factors are evaluated further in Table 46. In what follows, we describe the characteristics of these new remittance channels, as well as estimating their likely price structure.
"� � �� ������������������%�������������������
The following products and channels are examined, in both the international and domestic sectors of the market, and suitable for use by both the banked and the unbanked.
Domestic International Banked Mzansi account deposit
Mzansi inter-account transfer Airtime transfer – ATM Mobile banking Two ATM cards
Card/internet to money transfer Two ATM cards
Unbanked Post Office PIN product Mzansi Transfer Airtime top-up and transfer Retailer PIN and POS models
Western Union model Retailer PIN and POS models Prepaid card
Table 32: Product matrix Source: Genesis Analytics
"� ��� ����������������
5.3.1.1. MZANSI ACCOUNT DEPOSIT
The roll-out of the Mzansi account (detailed in Box 8) has increased the remittance alternatives available. Given its target market (the unbanked), the Mzansi account would be a logical and useful platform for remitting, if enough of the rural recipients of remittances do in fact open Mzansi accounts. The price of remitting using the Mzansi account is as follows:
Price of deposit by sender One free cash deposit per month, thereafter R7.44
Price of withdrawal (ATM withdrawal) by sender R4.30 Price of withdrawal by recipient R4.30 Overall price per month (remittance includes cash withdrawal by sender, free deposit, and cash withdrawal by recipient) R8.60
Table 33: Price of remitting via Mzansi
Source: Average prices across Mzansi accounts offered by Absa, Nedbank, Standard Bank, FNB and the Post Office
Mzansi account holders are permitted to make one free deposit a month. Because inter-account transfers are not possible on Mzansi, the sender has to execute multiple steps to transfer funds, first withdrawing the cash from their account, then
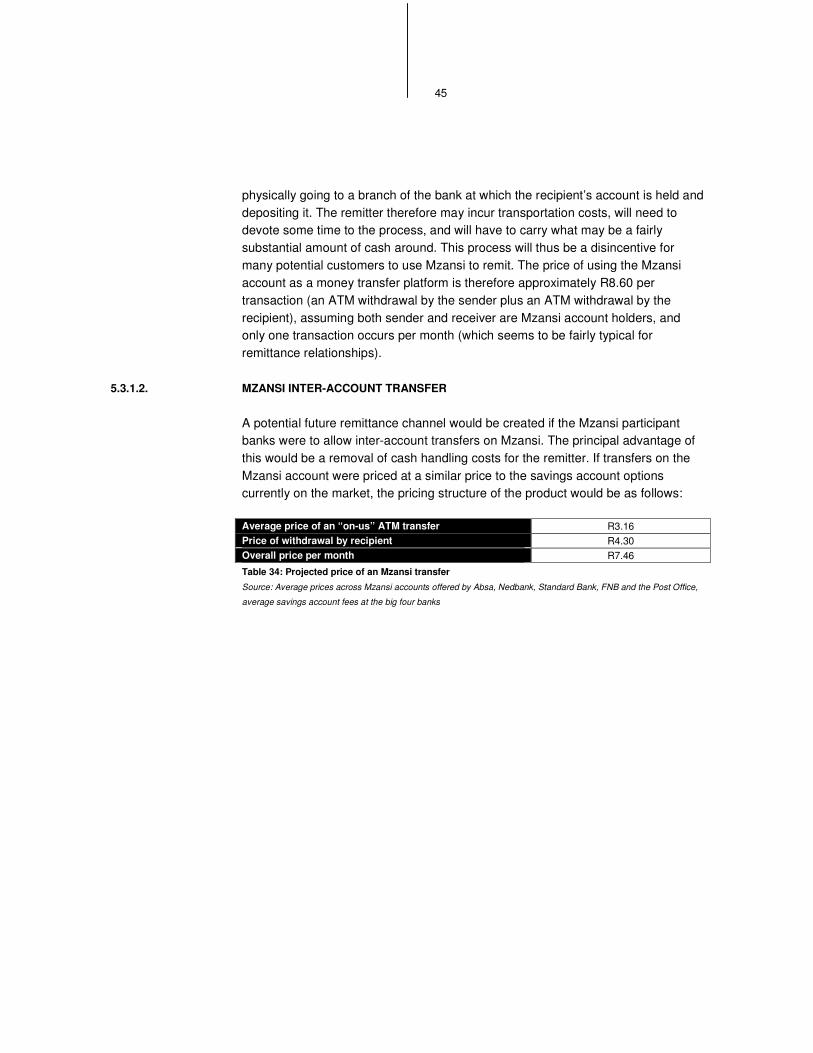
45
physically going to a branch of the bank at which the recipient’s account is held and depositing it. The remitter therefore may incur transportation costs, will need to devote some time to the process, and will have to carry what may be a fairly substantial amount of cash around. This process will thus be a disincentive for many potential customers to use Mzansi to remit. The price of using the Mzansi account as a money transfer platform is therefore approximately R8.60 per transaction (an ATM withdrawal by the sender plus an ATM withdrawal by the recipient), assuming both sender and receiver are Mzansi account holders, and only one transaction occurs per month (which seems to be fairly typical for remittance relationships).
5.3.1.2. MZANSI INTER-ACCOUNT TRANSFER
A potential future remittance channel would be created if the Mzansi participant banks were to allow inter-account transfers on Mzansi. The principal advantage of this would be a removal of cash handling costs for the remitter. If transfers on the Mzansi account were priced at a similar price to the savings account options currently on the market, the pricing structure of the product would be as follows:
Average price of an “on-us” ATM transfer R3.16 Price of withdrawal by recipient R4.30 Overall price per month R7.46
Table 34: Projected price of an Mzansi transfer
Source: Average prices across Mzansi accounts offered by Absa, Nedbank, Standard Bank, FNB and the Post Office,
average savings account fees at the big four banks

46
����&�������������������������������
The Mzansi account was launched in October 2004 by the four major South African banks48 and the Post Office, as part of an initiative to improve access to financial services for the poor in South Africa. The Mzansi account is priced significantly lower than current banking offerings and is intended to promote savings and make transacting easier. By mid-May 2005, more than a million Mzansi accounts had been opened. Aggregated data from participating banks show that in excess of 6 000 accounts were being opened daily. 91.3% of the Mzansi accounts opened are held by clients who had previously not banked with their chosen Mzansi banking institution, suggesting that a real improvement in access to banking services has occurred. It is expected that the steady state number of Mzansi accounts will be about 20% of the 13.2m unbanked, or 2.6m accounts.49
The provincial breakdown of Mzansi account holders is shown in Table 35. Domestic migrants originate mainly in Limpopo, the Eastern Cape and KwaZulu Natal, with the principal destination points being Gauteng and KwaZulu Natal (see Table 15). From the remittance point of view, it is more important that the recipient has an account, as the remittance can be completed by a cash deposit into that account. It is therefore disappointing to see that penetration levels of the Mzansi account in Limpopo and the Eastern Cape are among the lowest of all provinces.
Eastern Cape
Free State Gauteng KwaZulu
Natal Limpopo Mpuma-langa
North West
Northern Cape
WesternCape
Estimated number of Mzansi account holders
104 000 73 000 298 000 175 000 78 000 98 000 50 000 25 000 100 000
% of provincial population 1.6% 2.7% 3.4% 1.9% 1.5% 3.1% 1.4% 3.0% 2.2%
Table 35: Mzanzi accounts per province, and as a % of provincial population Source: Banking Council Media Release, 9 February 2005, Census 2001
According to Finscope 2003, 48% of unbanked South Africans live either in rural formal areas or on tribal land. As shown in Table 36, we estimate that approximately 38% or just under one million Mzansi accounts will be taken up by rural individuals.
Currently unbanked Potential Mzansi accounts % Individuals % Individuals Rural formal 10% 1,321,799 11% 290 796 Tribal land 38% 5,022,836 27% 703 197 Urban formal 43% 5,683,735 52% 1 364 096 Urban informal 9% 1,189,619 11% 285 509 Total 100% 13,217,989 100% 2 643 598
Table 36: Currently unbanked and potential Mzansi accounts, by settlement type Source: Finscope 2003, Genesis estimates
Importantly, however, if the reforms to the distribution of welfare payments currently proposed are successful, and as a result, the current cash payouts are replaced by transfers into an Mzansi-like basic account, these accounts could then also be used to receive deposits (including remittance transfers) from urban senders. The numbers involved are potentially substantial.
How money is obtained:
Government old age pension Other pension Child grant
Any other type of state grant
Total welfare recipients
Number of individuals 2 806 607 1 742 916 2 511 850 478 448 7 539 821 % of population 6.6% 4.1% 5.9% 1.1% 17.7%
Table 37: Welfare recipients Source: Finscope South Africa 2003
If these two developments contribute to a rapid increase in the number of households in rural areas with a bank account then the share of remittance payments made through a bank should increase rapidly.50
48 Namely Absa, FNB, Standard and Nedcor. 49 Banking Council estimates, available from http://www.banking.org.za/documents/2005/MAY/PresReleaseonemillionaccount.pdf 50 This does not assume that remittances will be made via inter-bank transfers. The focus groups showed that the level of knowledge and education required made such activities unlikely amongst low income remitters. Cash deposits are therefore the more likely remittance method.
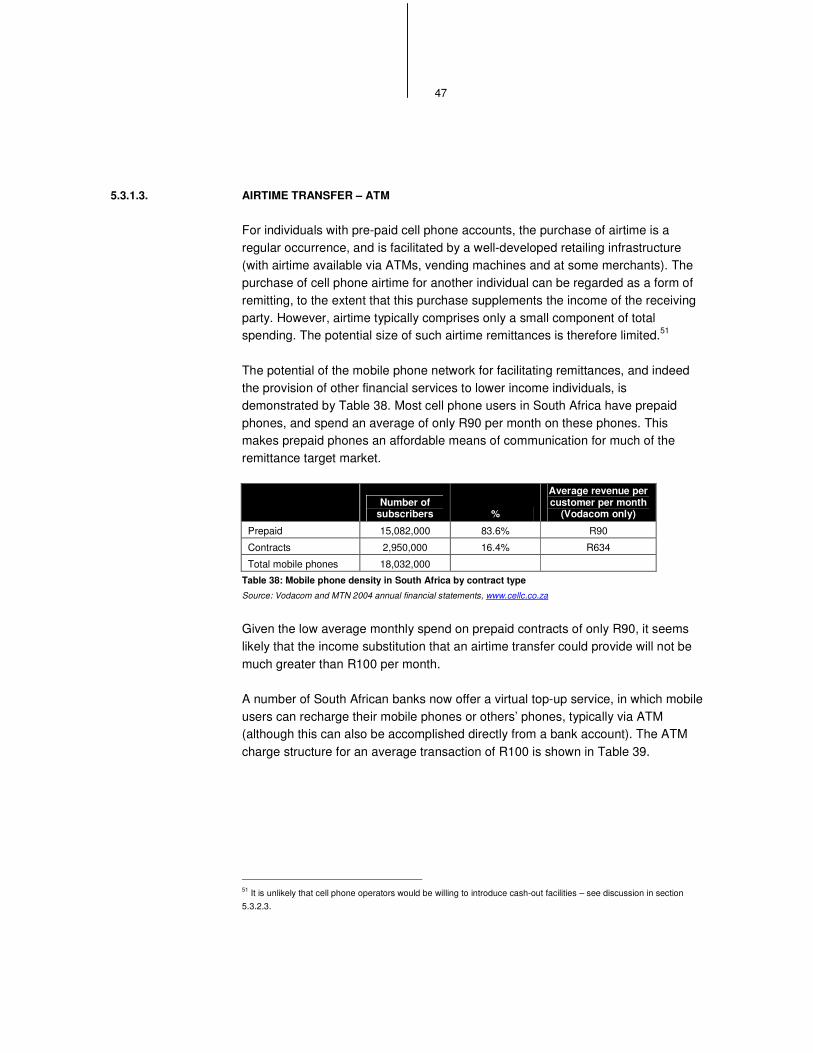
47
5.3.1.3. AIRTIME TRANSFER – ATM
For individuals with pre-paid cell phone accounts, the purchase of airtime is a regular occurrence, and is facilitated by a well-developed retailing infrastructure (with airtime available via ATMs, vending machines and at some merchants). The purchase of cell phone airtime for another individual can be regarded as a form of remitting, to the extent that this purchase supplements the income of the receiving party. However, airtime typically comprises only a small component of total spending. The potential size of such airtime remittances is therefore limited.51
The potential of the mobile phone network for facilitating remittances, and indeed the provision of other financial services to lower income individuals, is demonstrated by Table 38. Most cell phone users in South Africa have prepaid phones, and spend an average of only R90 per month on these phones. This makes prepaid phones an affordable means of communication for much of the remittance target market.
Number of
subscribers %
Average revenue per customer per month
(Vodacom only)
Prepaid 15,082,000 83.6% R90
Contracts 2,950,000 16.4% R634
Total mobile phones 18,032,000
Table 38: Mobile phone density in South Africa by contract type
Source: Vodacom and MTN 2004 annual financial statements, www.cellc.co.za
Given the low average monthly spend on prepaid contracts of only R90, it seems likely that the income substitution that an airtime transfer could provide will not be much greater than R100 per month.
A number of South African banks now offer a virtual top-up service, in which mobile users can recharge their mobile phones or others’ phones, typically via ATM (although this can also be accomplished directly from a bank account). The ATM charge structure for an average transaction of R100 is shown in Table 39.
51 It is unlikely that cell phone operators would be willing to introduce cash-out facilities – see discussion in section 5.3.2.3.
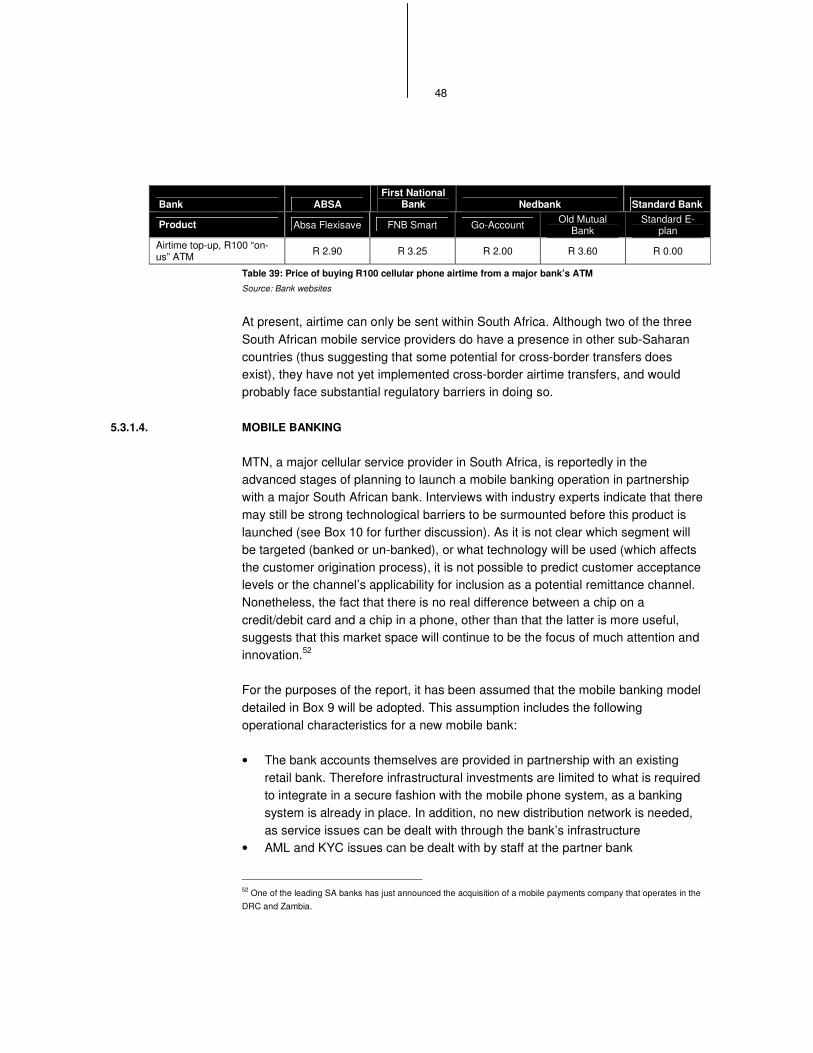
48
Bank ABSA First National
Bank Nedbank Standard Bank
Product Absa Flexisave FNB Smart Go-Account Old Mutual Bank
Standard E-plan
Airtime top-up, R100 “on-us” ATM R 2.90 R 3.25 R 2.00 R 3.60 R 0.00
Table 39: Price of buying R100 cellular phone airtime from a major bank’s ATM Source: Bank websites
At present, airtime can only be sent within South Africa. Although two of the three South African mobile service providers do have a presence in other sub-Saharan countries (thus suggesting that some potential for cross-border transfers does exist), they have not yet implemented cross-border airtime transfers, and would probably face substantial regulatory barriers in doing so.
5.3.1.4. MOBILE BANKING
MTN, a major cellular service provider in South Africa, is reportedly in the advanced stages of planning to launch a mobile banking operation in partnership with a major South African bank. Interviews with industry experts indicate that there may still be strong technological barriers to be surmounted before this product is launched (see Box 10 for further discussion). As it is not clear which segment will be targeted (banked or un-banked), or what technology will be used (which affects the customer origination process), it is not possible to predict customer acceptance levels or the channel’s applicability for inclusion as a potential remittance channel. Nonetheless, the fact that there is no real difference between a chip on a credit/debit card and a chip in a phone, other than that the latter is more useful, suggests that this market space will continue to be the focus of much attention and innovation.52
For the purposes of the report, it has been assumed that the mobile banking model detailed in Box 9 will be adopted. This assumption includes the following operational characteristics for a new mobile bank:
• The bank accounts themselves are provided in partnership with an existing retail bank. Therefore infrastructural investments are limited to what is required to integrate in a secure fashion with the mobile phone system, as a banking system is already in place. In addition, no new distribution network is needed, as service issues can be dealt with through the bank’s infrastructure
• AML and KYC issues can be dealt with by staff at the partner bank
52 One of the leading SA banks has just announced the acquisition of a mobile payments company that operates in the DRC and Zambia.
49
• Pricing structures will be very similar to existing bank transaction pricing
����'������������� ����������
A mobile banking operation was established in South Africa in early 2005, in partnership with a small South African bank and one of the major card operators.53 The operation combines a branded debit card with a SMS tool kit method of completing a range of transactions. Customers can use their cell phone to make inter-account transfers to other Maestro card holders, merchant payments, top up their own or other’s pay-as-you-go airtime accounts, and perform balance enquiries.
From a remittance point of view, a major drawback of the system is that transfers outside of the system take approximately 24 hours to clear (between in-house accounts, transactions are instantaneous, but given the small size of the present network, few transfers are likely to be affected by this). Statements are only available on request (and for a fee). The price of an on-us transfer is R2.99, while off-us transfers cost R4.99.
It is far from certain that this will be the mobile banking model ultimately adopted by operators such as MTN. Some of the issues which a mobile banking operator would need to deal with are detailed in Box 10.
For the purposes of the report, we will assume that a R300 domestic transfer via mobile banking is priced as would be an Mzansi inter-account payment, at R7.46 (in other words, a transfer by the sender at an average price of R3.16, plus a cash withdrawal by the recipient at R4.30).
53 The mobile banking operator in question has requested that they remain anonymous.
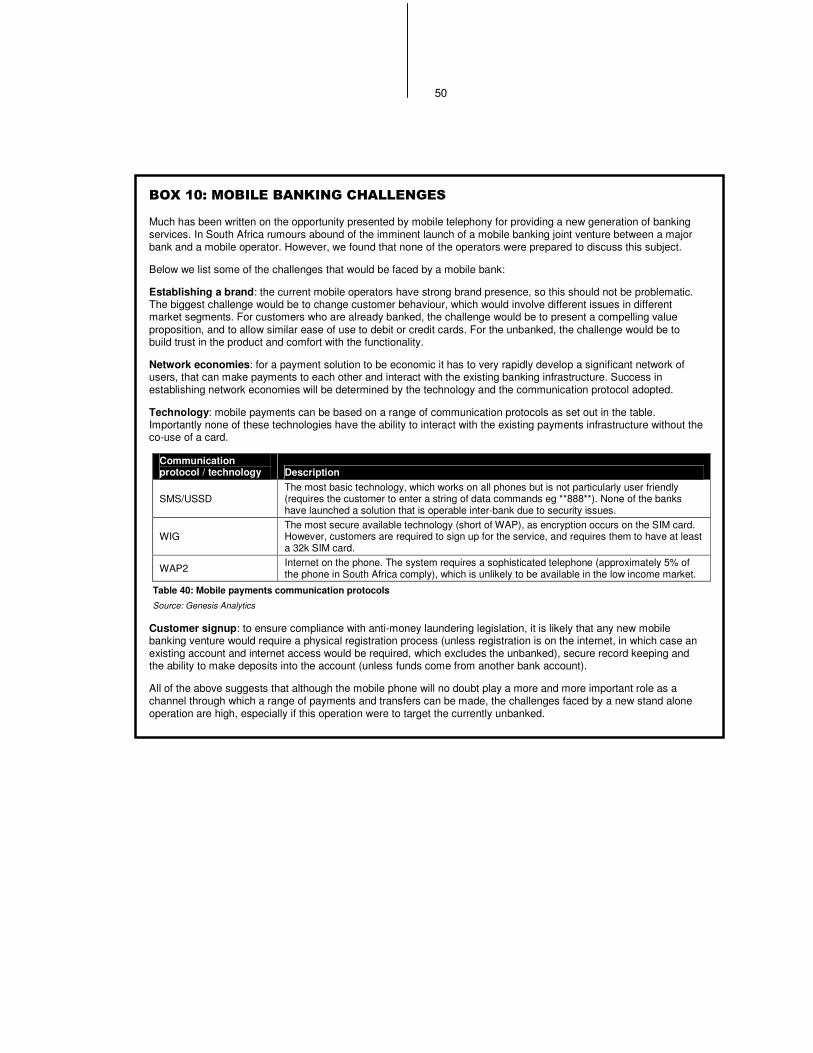
50
�����(������������� ������ ���
Much has been written on the opportunity presented by mobile telephony for providing a new generation of banking services. In South Africa rumours abound of the imminent launch of a mobile banking joint venture between a major bank and a mobile operator. However, we found that none of the operators were prepared to discuss this subject.
Below we list some of the challenges that would be faced by a mobile bank:
Establishing a brand: the current mobile operators have strong brand presence, so this should not be problematic. The biggest challenge would be to change customer behaviour, which would involve different issues in different market segments. For customers who are already banked, the challenge would be to present a compelling value proposition, and to allow similar ease of use to debit or credit cards. For the unbanked, the challenge would be to build trust in the product and comfort with the functionality.
Network economies: for a payment solution to be economic it has to very rapidly develop a significant network of users, that can make payments to each other and interact with the existing banking infrastructure. Success in establishing network economies will be determined by the technology and the communication protocol adopted.
Technology: mobile payments can be based on a range of communication protocols as set out in the table. Importantly none of these technologies have the ability to interact with the existing payments infrastructure without the co-use of a card.
Communication protocol / technology Description
SMS/USSD The most basic technology, which works on all phones but is not particularly user friendly (requires the customer to enter a string of data commands eg **888**). None of the banks have launched a solution that is operable inter-bank due to security issues.
WIG The most secure available technology (short of WAP), as encryption occurs on the SIM card. However, customers are required to sign up for the service, and requires them to have at least a 32k SIM card.
WAP2 Internet on the phone. The system requires a sophisticated telephone (approximately 5% of the phone in South Africa comply), which is unlikely to be available in the low income market.
Table 40: Mobile payments communication protocols
Source: Genesis Analytics
Customer signup: to ensure compliance with anti-money laundering legislation, it is likely that any new mobile banking venture would require a physical registration process (unless registration is on the internet, in which case an existing account and internet access would be required, which excludes the unbanked), secure record keeping and the ability to make deposits into the account (unless funds come from another bank account).
All of the above suggests that although the mobile phone will no doubt play a more and more important role as a channel through which a range of payments and transfers can be made, the challenges faced by a new stand alone operation are high, especially if this operation were to target the currently unbanked.
51
5.3.1.5. TWO ATM CARDS
A potential remittance channel would be to market specialised current and/or savings accounts, with ATM cards issued in two different names and with two types of access rights. This would allow remitters to run their remittance relationship off one rather than two bank accounts, permitting a reduction in account maintenance fees. In addition, in order to complete the remittance relationship, it would no longer be necessary to transfer/deposit the money, and then withdraw it. Remitting would only involve withdrawal fees from the account involved.
The following issues would need to be dealt with to launch the product:
• Access rights: the “sender” of funds would probably want to have preferential access rights to the account. For example, the “recipient” might have a monthly limit on their card, whereas the sender would have no limit on withdrawals. The sender might also have the right to cancel the recipient’s card, while the reverse should not be true. These kinds of limits might be necessary to ensure customer uptake, and may prove challenging from a systems perspective
• Bank uptake: this kind of product would cannibalise existing bank revenue streams. Instead of earning fees on two separate bank accounts, and on transfers between those accounts, they would earn revenues only on a single, albeit high-use, account. In order to make the business case from the bank’s point of view, therefore, it might be necessary to introduce a higher monthly basic fee on accounts offering this kind of functionality
The price to remit R300 via the two-ATM card model is estimated at R5.06, the average price of an “on-us” ATM withdrawal at a sample of five South African savings accounts.
"� ��� ���������������
5.3.2.1. POST OFFICE PIN PRODUCT
The South African Post PIN product was launched in late 2002/early 2003. It can be used at any Post Office branch, and funds can be transferred within South Africa as well as to participating Post Offices in other countries.54 All that is needed to redeem the transfer is the money order number and the PIN number.
54 At present this includes Lesotho, Namibia, Swaziland, Botswana, Kenya, St Helena and Zambia.
52
The sender fills in a form, pays the relevant amount, and then is given a PIN number which must be separately transmitted to the recipient (typically via telephone). The recipient can then access the funds at any online SAPO branch or agency.
The PIN product costs R17.20 plus 3% of the value of the money order. Therefore the price of a R300 PIN transfer is R26.20.
5.3.2.2. MZANSI TRANSFER PRODUCT
The Mzansi Money Transfer System, originally known as the National Money Transfer System, is being developed under the auspices of the Interbank Working Group. The system went into testing towards the end of February 2005, and it is anticipated that it will be available in approximately six months, assuming that the Mzansi-participant banks decide to adopt the system. The system is based on the Western Union money transfer model, but uses the banks’ IT infrastructure. Deposits can be made at one Mzansi-participant bank and collected at any other participant bank.
Transactions are executed in real time and the recipient can, in theory, have immediate access to the cash sent by the remitter. While this product holds promise for enabling unbanked individuals from the lower LSM populations to transfer money efficiently, the exact details of the product have not been finalised, and it is not clear what impact the final details will have on the uptake of this product.
Amongst the details to be finalised include a crucial product feature, namely pricing. Potential participating banks have clearly indicated that they intend to offer and manage this product on a strictly profit-making basis, which could inhibit roll-out to lower income individuals. For the purposes of the modelling exercise in section 6, our working assumption is that it will cost R26.20 to transfer R300 via the Mzansi Transfer system (in other words, that the system will be priced to compete with the Post Office PIN product).
Additional features of this product that might inhibit broader use include:
• The remitter must relay a 16 digit code number as well as a 5 digit password, and thus the transmission of a total of 21 digits is necessary to complete the transaction. Given the target market for this product, and the literacy challenges in this market, this barrier could become a significant one.
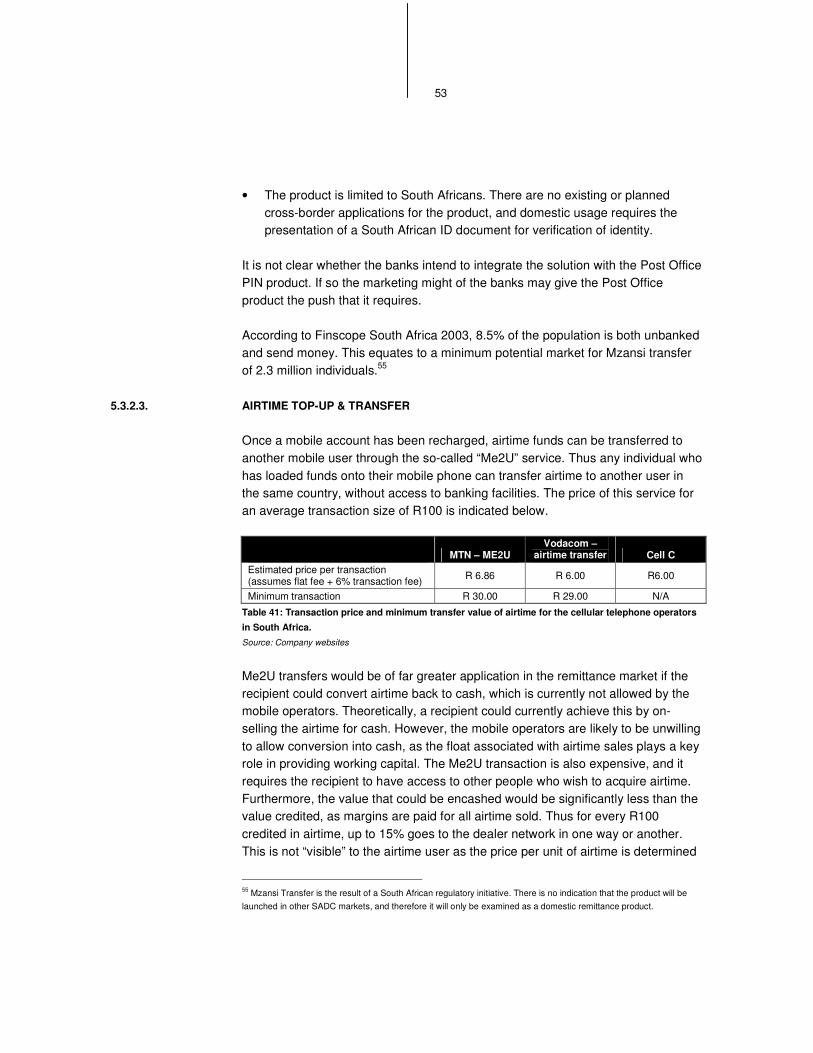
53
• The product is limited to South Africans. There are no existing or planned cross-border applications for the product, and domestic usage requires the presentation of a South African ID document for verification of identity.
It is not clear whether the banks intend to integrate the solution with the Post Office PIN product. If so the marketing might of the banks may give the Post Office product the push that it requires.
According to Finscope South Africa 2003, 8.5% of the population is both unbanked and send money. This equates to a minimum potential market for Mzansi transfer of 2.3 million individuals.55
5.3.2.3. AIRTIME TOP-UP & TRANSFER
Once a mobile account has been recharged, airtime funds can be transferred to another mobile user through the so-called “Me2U” service. Thus any individual who has loaded funds onto their mobile phone can transfer airtime to another user in the same country, without access to banking facilities. The price of this service for an average transaction size of R100 is indicated below.
MTN – ME2U Vodacom –
airtime transfer Cell C Estimated price per transaction (assumes flat fee + 6% transaction fee) R 6.86 R 6.00 R6.00
Minimum transaction R 30.00 R 29.00 N/A
Table 41: Transaction price and minimum transfer value of airtime for the cellular telephone operators
in South Africa. Source: Company websites
Me2U transfers would be of far greater application in the remittance market if the recipient could convert airtime back to cash, which is currently not allowed by the mobile operators. Theoretically, a recipient could currently achieve this by on-selling the airtime for cash. However, the mobile operators are likely to be unwilling to allow conversion into cash, as the float associated with airtime sales plays a key role in providing working capital. The Me2U transaction is also expensive, and it requires the recipient to have access to other people who wish to acquire airtime. Furthermore, the value that could be encashed would be significantly less than the value credited, as margins are paid for all airtime sold. Thus for every R100 credited in airtime, up to 15% goes to the dealer network in one way or another. This is not “visible” to the airtime user as the price per unit of airtime is determined
55 Mzansi Transfer is the result of a South African regulatory initiative. There is no indication that the product will be launched in other SADC markets, and therefore it will only be examined as a domestic remittance product.
54
by the operator. However, were the operator to facilitate an airtime to cash transfer, the value paid out (before any payout associated costs) would be less 15% (for example, a minimum R45 fee on a R300 transfer).
5.3.2.4. RETAILER PIN AND POS MODELS
It would be theoretically possible for any retailer with a large distribution network and a payments infrastructure to create Western Union-style remittance products. The challenge is less one of technology than of branding. Several focus group participants expressed some distrust of a retailer-based remittance system, and therefore the issue of building trust would probably require a substantial initial marketing and education investment (discussed in section 4.2). In particular, the focus group participants highlighted concerns that family members would be forced to spend the cash at the retailer, or that they would waste the money on non-essential items at the retailer.56
Our modelling assumption is that a retailer PIN/POS model would be priced to compete with the Post Office PIN product, at R26.20 for a R300 transaction. Should the model be associated with substantial reductions in cash handling costs for the retailer, it might be possible to offer the product at a lower price than the Post Office PIN product.
56 It should be noted however that the focus groups were on the whole open to the idea of using retailer networks to remit money. The negative opinions were only voiced by a (significant) minority of participants.
55
"�!� �� ������������������%������������
����������
"�!��� �������������������
5.4.1.1. CARD/INTERNET TO MONEY TRANSFER
The advent of the internet solves one of the key challenges in creating a money transfer product. Any person wishing to send money to another card or bank account holder, or to an unbanked individual through a money transfer company, can log onto the internet to post a payment using a debit or credit card. This can be accomplished as long as the receiving institution acts as a card acquiring merchant on the internet. This technological development has allowed the emergence of a range of competing money transfer companies internationally (including the card associations that can, via the internet, accept card to card transactions), and should increase competition and thus be associated with a reduction in the price of money transfers in the bank and non-bank market for all senders who:
• Have a card association debit or credit card • Have access to and are familiar with using the internet
Although many remittance relationships involve at least one party who is extremely poor, and has no internet familiarity or access, the model still has potential in this marketplace. This is because, once payment has been routed to a Western Union-type money transfer agency, a wide range of remittance recipients can be successfully catered to. In economic migration, the migrant is typically moving to an area with better infrastructure (and is moving in order to earn more). Remittance relationships where the remitter is at least somewhat more financially educated than the recipient are thus typical, suggesting that a significant proportion of remittance relationships could be served by an internet to money transfer agent relationship.
Unfortunately the educational endowment of migrants is very difficult to judge. In the focus groups cross border migrants were certainly better educated than the domestic migrants and anecdotal evidence suggests that the educational endowments of some migrant communities are relatively high (for example Zimbabweans and Nigerians). Thus whereas according to Finscope South Africa 2003, 3.1% of individuals both described themselves as having access to the internet and as sending money, the share of cross-border migrants comfortable with internet usage could be significantly higher.
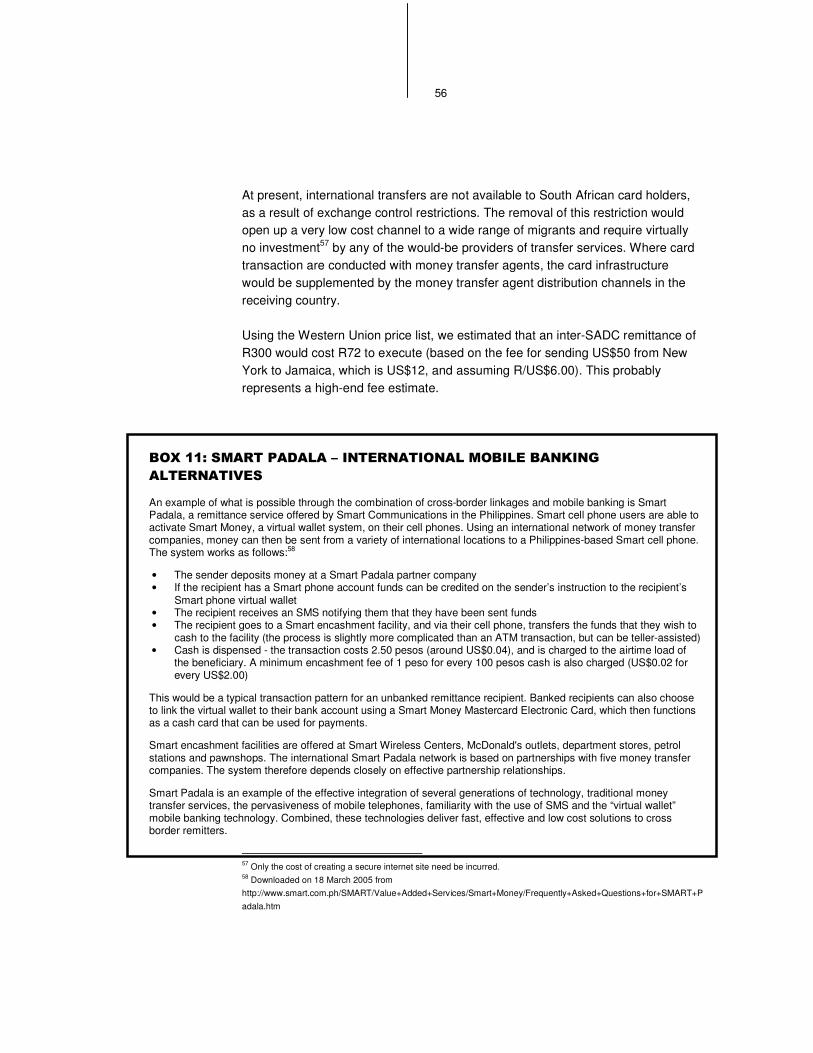
56
At present, international transfers are not available to South African card holders, as a result of exchange control restrictions. The removal of this restriction would open up a very low cost channel to a wide range of migrants and require virtually no investment57 by any of the would-be providers of transfer services. Where card transaction are conducted with money transfer agents, the card infrastructure would be supplemented by the money transfer agent distribution channels in the receiving country.
Using the Western Union price list, we estimated that an inter-SADC remittance of R300 would cost R72 to execute (based on the fee for sending US$50 from New York to Jamaica, which is US$12, and assuming R/US$6.00). This probably represents a high-end fee estimate.
���������������������%����������������������� �
������������
An example of what is possible through the combination of cross-border linkages and mobile banking is Smart Padala, a remittance service offered by Smart Communications in the Philippines. Smart cell phone users are able to activate Smart Money, a virtual wallet system, on their cell phones. Using an international network of money transfer companies, money can then be sent from a variety of international locations to a Philippines-based Smart cell phone. The system works as follows:58
• The sender deposits money at a Smart Padala partner company • If the recipient has a Smart phone account funds can be credited on the sender’s instruction to the recipient’s
Smart phone virtual wallet • The recipient receives an SMS notifying them that they have been sent funds • The recipient goes to a Smart encashment facility, and via their cell phone, transfers the funds that they wish to
cash to the facility (the process is slightly more complicated than an ATM transaction, but can be teller-assisted) • Cash is dispensed - the transaction costs 2.50 pesos (around US$0.04), and is charged to the airtime load of
the beneficiary. A minimum encashment fee of 1 peso for every 100 pesos cash is also charged (US$0.02 for every US$2.00)
This would be a typical transaction pattern for an unbanked remittance recipient. Banked recipients can also choose to link the virtual wallet to their bank account using a Smart Money Mastercard Electronic Card, which then functions as a cash card that can be used for payments.
Smart encashment facilities are offered at Smart Wireless Centers, McDonald's outlets, department stores, petrol stations and pawnshops. The international Smart Padala network is based on partnerships with five money transfer companies. The system therefore depends closely on effective partnership relationships.
Smart Padala is an example of the effective integration of several generations of technology, traditional money transfer services, the pervasiveness of mobile telephones, familiarity with the use of SMS and the “virtual wallet” mobile banking technology. Combined, these technologies deliver fast, effective and low cost solutions to cross border remitters.
57 Only the cost of creating a secure internet site need be incurred. 58 Downloaded on 18 March 2005 from http://www.smart.com.ph/SMART/Value+Added+Services/Smart+Money/Frequently+Asked+Questions+for+SMART+Padala.htm
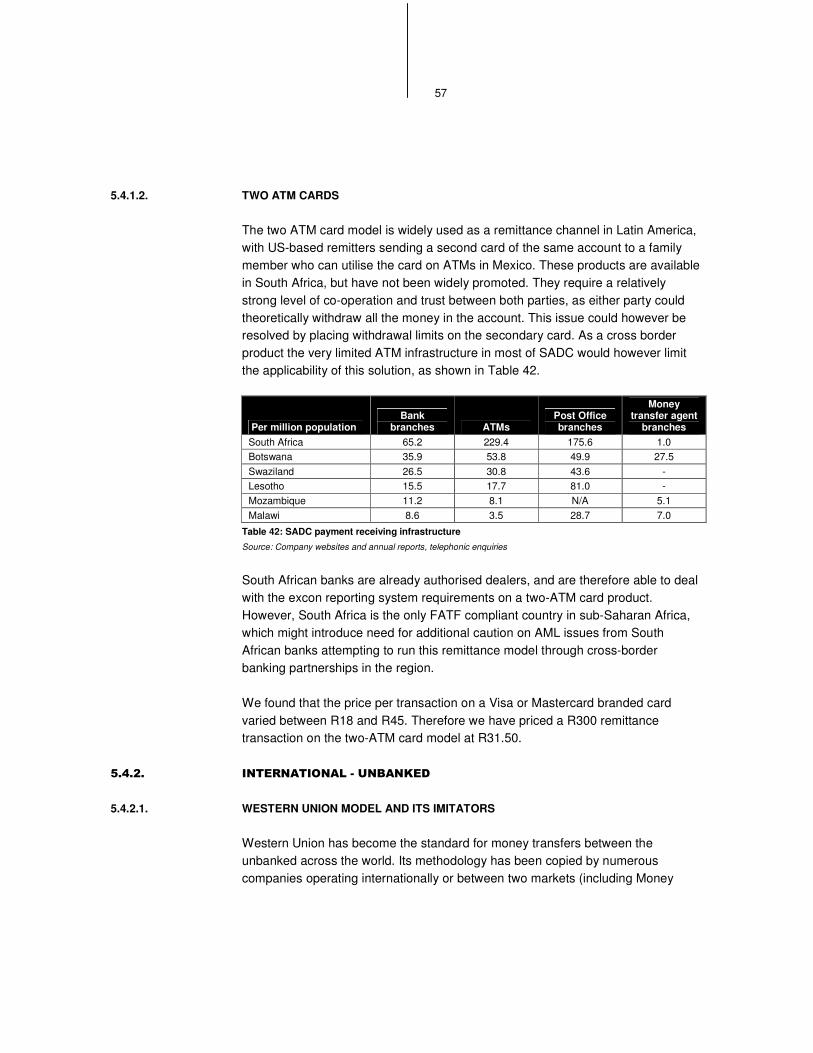
57
5.4.1.2. TWO ATM CARDS
The two ATM card model is widely used as a remittance channel in Latin America, with US-based remitters sending a second card of the same account to a family member who can utilise the card on ATMs in Mexico. These products are available in South Africa, but have not been widely promoted. They require a relatively strong level of co-operation and trust between both parties, as either party could theoretically withdraw all the money in the account. This issue could however be resolved by placing withdrawal limits on the secondary card. As a cross border product the very limited ATM infrastructure in most of SADC would however limit the applicability of this solution, as shown in Table 42.
Per million population Bank
branches ATMs Post Office branches
Money transfer agent
branches South Africa 65.2 229.4 175.6 1.0 Botswana 35.9 53.8 49.9 27.5 Swaziland 26.5 30.8 43.6 - Lesotho 15.5 17.7 81.0 - Mozambique 11.2 8.1 N/A 5.1 Malawi 8.6 3.5 28.7 7.0
Table 42: SADC payment receiving infrastructure
Source: Company websites and annual reports, telephonic enquiries
South African banks are already authorised dealers, and are therefore able to deal with the excon reporting system requirements on a two-ATM card product. However, South Africa is the only FATF compliant country in sub-Saharan Africa, which might introduce need for additional caution on AML issues from South African banks attempting to run this remittance model through cross-border banking partnerships in the region.
We found that the price per transaction on a Visa or Mastercard branded card varied between R18 and R45. Therefore we have priced a R300 remittance transaction on the two-ATM card model at R31.50.
"�!��� ��������������������
5.4.2.1. WESTERN UNION MODEL AND ITS IMITATORS
Western Union has become the standard for money transfers between the unbanked across the world. Its methodology has been copied by numerous companies operating internationally or between two markets (including Money
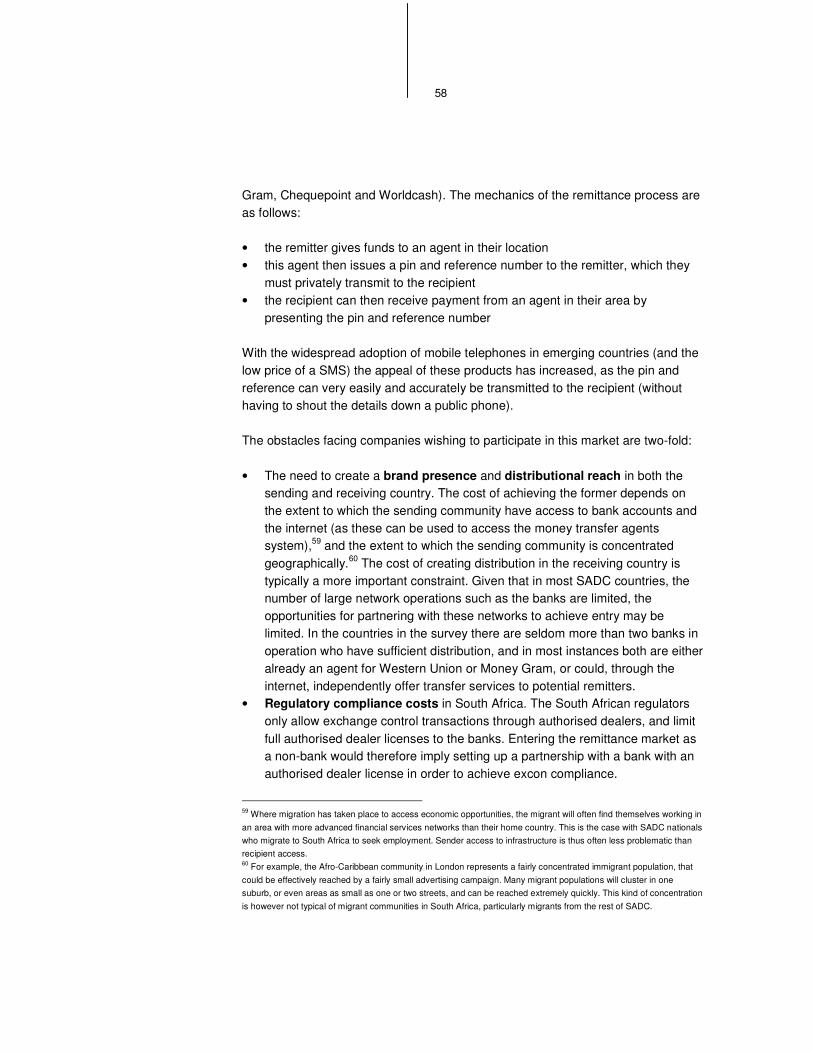
58
Gram, Chequepoint and Worldcash). The mechanics of the remittance process are as follows:
• the remitter gives funds to an agent in their location • this agent then issues a pin and reference number to the remitter, which they
must privately transmit to the recipient • the recipient can then receive payment from an agent in their area by
presenting the pin and reference number
With the widespread adoption of mobile telephones in emerging countries (and the low price of a SMS) the appeal of these products has increased, as the pin and reference can very easily and accurately be transmitted to the recipient (without having to shout the details down a public phone).
The obstacles facing companies wishing to participate in this market are two-fold:
• The need to create a brand presence and distributional reach in both the sending and receiving country. The cost of achieving the former depends on the extent to which the sending community have access to bank accounts and the internet (as these can be used to access the money transfer agents system),59 and the extent to which the sending community is concentrated geographically.60 The cost of creating distribution in the receiving country is typically a more important constraint. Given that in most SADC countries, the number of large network operations such as the banks are limited, the opportunities for partnering with these networks to achieve entry may be limited. In the countries in the survey there are seldom more than two banks in operation who have sufficient distribution, and in most instances both are either already an agent for Western Union or Money Gram, or could, through the internet, independently offer transfer services to potential remitters.
• Regulatory compliance costs in South Africa. The South African regulators only allow exchange control transactions through authorised dealers, and limit full authorised dealer licenses to the banks. Entering the remittance market as a non-bank would therefore imply setting up a partnership with a bank with an authorised dealer license in order to achieve excon compliance.
59 Where migration has taken place to access economic opportunities, the migrant will often find themselves working in an area with more advanced financial services networks than their home country. This is the case with SADC nationals who migrate to South Africa to seek employment. Sender access to infrastructure is thus often less problematic than recipient access. 60 For example, the Afro-Caribbean community in London represents a fairly concentrated immigrant population, that could be effectively reached by a fairly small advertising campaign. Many migrant populations will cluster in one suburb, or even areas as small as one or two streets, and can be reached extremely quickly. This kind of concentration is however not typical of migrant communities in South Africa, particularly migrants from the rest of SADC.
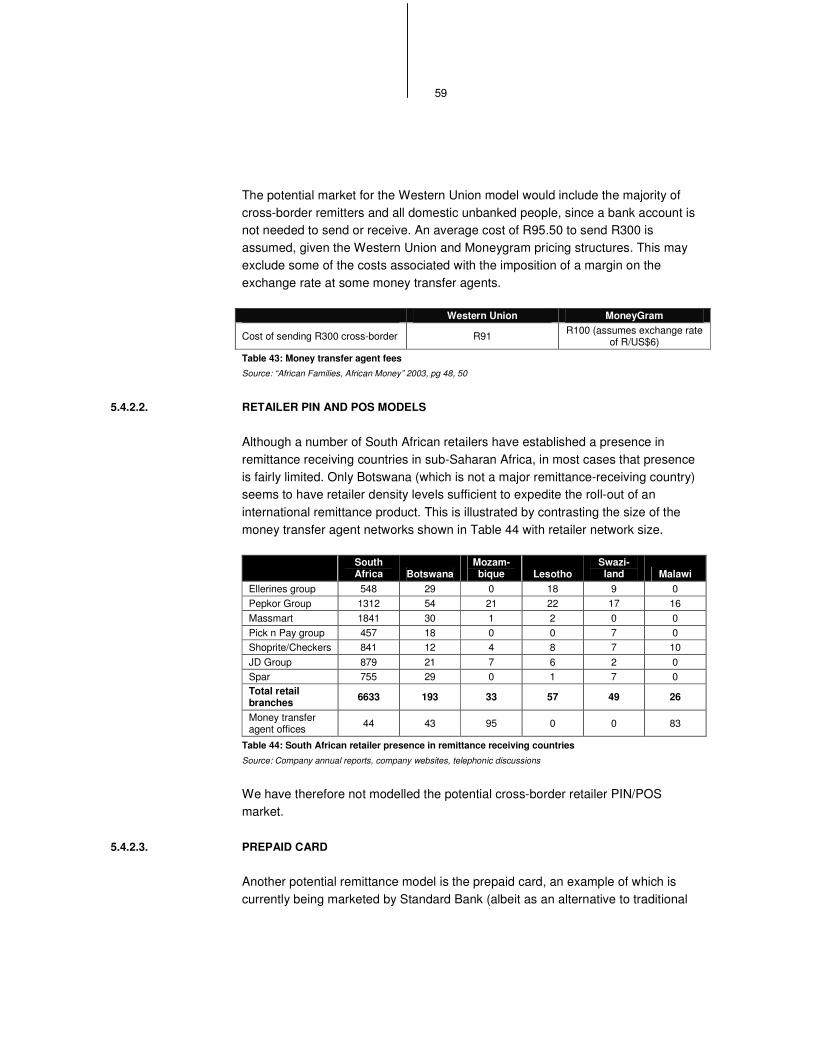
59
The potential market for the Western Union model would include the majority of cross-border remitters and all domestic unbanked people, since a bank account is not needed to send or receive. An average cost of R95.50 to send R300 is assumed, given the Western Union and Moneygram pricing structures. This may exclude some of the costs associated with the imposition of a margin on the exchange rate at some money transfer agents.
Western Union MoneyGram
Cost of sending R300 cross-border R91 R100 (assumes exchange rate of R/US$6)
Table 43: Money transfer agent fees Source: “African Families, African Money” 2003, pg 48, 50
5.4.2.2. RETAILER PIN AND POS MODELS
Although a number of South African retailers have established a presence in remittance receiving countries in sub-Saharan Africa, in most cases that presence is fairly limited. Only Botswana (which is not a major remittance-receiving country) seems to have retailer density levels sufficient to expedite the roll-out of an international remittance product. This is illustrated by contrasting the size of the money transfer agent networks shown in Table 44 with retailer network size.
South Africa Botswana
Mozam-bique Lesotho
Swazi-land Malawi
Ellerines group 548 29 0 18 9 0 Pepkor Group 1312 54 21 22 17 16 Massmart 1841 30 1 2 0 0 Pick n Pay group 457 18 0 0 7 0 Shoprite/Checkers 841 12 4 8 7 10 JD Group 879 21 7 6 2 0 Spar 755 29 0 1 7 0 Total retail branches 6633 193 33 57 49 26
Money transfer agent offices 44 43 95 0 0 83
Table 44: South African retailer presence in remittance receiving countries
Source: Company annual reports, company websites, telephonic discussions
We have therefore not modelled the potential cross-border retailer PIN/POS market.
5.4.2.3. PREPAID CARD
Another potential remittance model is the prepaid card, an example of which is currently being marketed by Standard Bank (albeit as an alternative to traditional
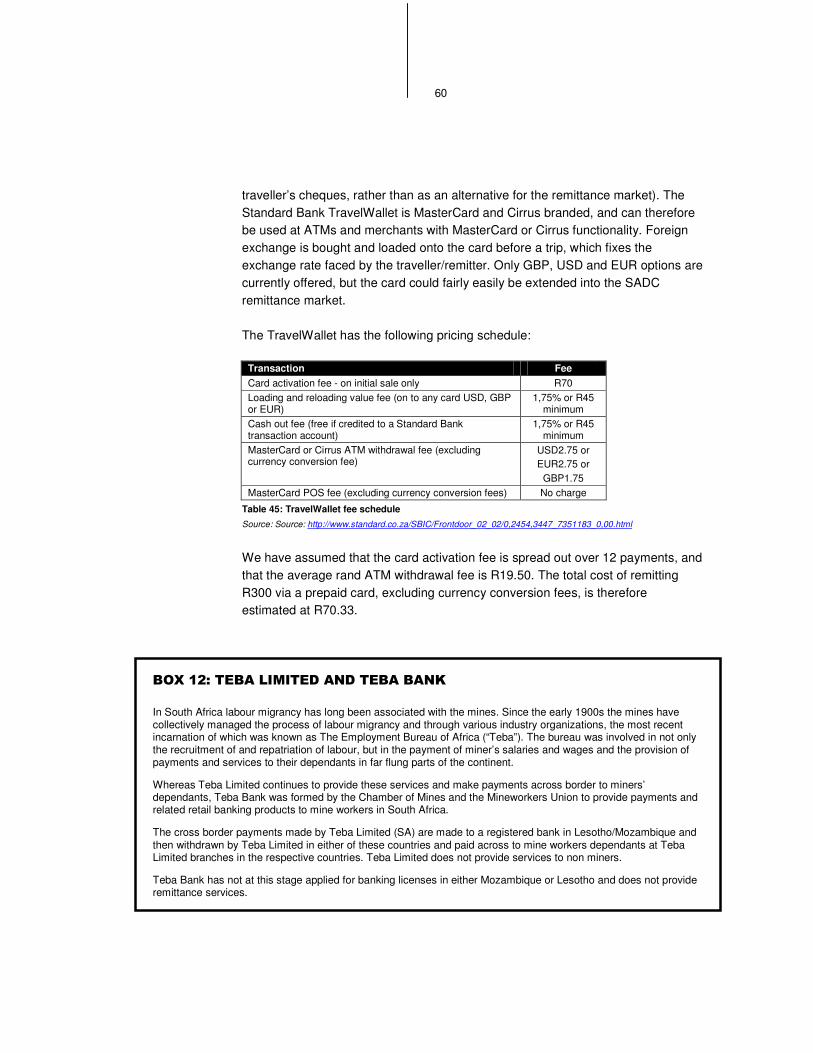
60
traveller’s cheques, rather than as an alternative for the remittance market). The Standard Bank TravelWallet is MasterCard and Cirrus branded, and can therefore be used at ATMs and merchants with MasterCard or Cirrus functionality. Foreign exchange is bought and loaded onto the card before a trip, which fixes the exchange rate faced by the traveller/remitter. Only GBP, USD and EUR options are currently offered, but the card could fairly easily be extended into the SADC remittance market.
The TravelWallet has the following pricing schedule:
Transaction Fee Card activation fee - on initial sale only R70 Loading and reloading value fee (on to any card USD, GBP or EUR)
1,75% or R45 minimum
Cash out fee (free if credited to a Standard Bank transaction account)
1,75% or R45 minimum
MasterCard or Cirrus ATM withdrawal fee (excluding currency conversion fee)
USD2.75 or EUR2.75 or
GBP1.75 MasterCard POS fee (excluding currency conversion fees) No charge
Table 45: TravelWallet fee schedule Source: Source: http://www.standard.co.za/SBIC/Frontdoor_02_02/0,2454,3447_7351183_0,00.html
We have assumed that the card activation fee is spread out over 12 payments, and that the average rand ATM withdrawal fee is R19.50. The total cost of remitting R300 via a prepaid card, excluding currency conversion fees, is therefore estimated at R70.33.
���������������������������������
In South Africa labour migrancy has long been associated with the mines. Since the early 1900s the mines have collectively managed the process of labour migrancy and through various industry organizations, the most recent incarnation of which was known as The Employment Bureau of Africa (“Teba”). The bureau was involved in not only the recruitment of and repatriation of labour, but in the payment of miner’s salaries and wages and the provision of payments and services to their dependants in far flung parts of the continent.
Whereas Teba Limited continues to provide these services and make payments across border to miners’ dependants, Teba Bank was formed by the Chamber of Mines and the Mineworkers Union to provide payments and related retail banking products to mine workers in South Africa.
The cross border payments made by Teba Limited (SA) are made to a registered bank in Lesotho/Mozambique and then withdrawn by Teba Limited in either of these countries and paid across to mine workers dependants at Teba Limited branches in the respective countries. Teba Limited does not provide services to non miners.
Teba Bank has not at this stage applied for banking licenses in either Mozambique or Lesotho and does not provide remittance services.
61
#� ���� ������������
SUMMARY
A variety of product characteristics will affect consumer acceptance and product take-up in the remittance market. These include factors such as price, access to infrastructure, compliance requirements (for example, AML regulations) and the
need for customer education. By making estimates about the relative importance of such factors, it was possible to generate estimates of the ability of the new
remittance channels to capture revenue flows.
A number of these emerging channels show high enough potential revenue to justify further research. Of these products, however, many face high regulatory
barriers to operation. In the international market, the products that had an attractive combination of high revenue and low regulatory barriers were the two ATM cards
model and prepaid cards. In the domestic market, the Post Office PIN product had these attractive characteristics.
#��� �����������
Section 5 highlighted a number of key developments and trends with regards to emerging money transfer models in Southern Africa. This includes:
• Rapid developments in technology that utilise existing networks (cards, ATMs and mobile phones for example) to effect payments. It is probably safe to assume that any new money transfer solution will require only a minimum level of investment in technology. The internet can serve as the enabling platform, the card association infrastructure already exists, and mobile telephones and cards are already in the hands of many millions of potential remitters and receivers.
• The issue of which channel will succeed is thus more dependent on consumer behaviour, and in particular on the channel’s ability to gain consumer trust, provide appropriate education, and the costs of creating a mass market brand and distribution infrastructure (in both sending and receiving markets).
• What products can feasibly and cost-effectively be offered is profoundly affected by regulation.
62
The focus group discussions shed some light on the current habits and preferences of remitters. In order to focus policy and business development efforts where they are likely to have the most impact, it is important to identify “models of high influence” – in other words, emerging money transfer models that have the highest possibility of making a significant and measurable impact on access to money transfer services by remitters, if the restrictions facing their implementation are removed or relaxed.
In order to determine which models should be regarded as “high influence”, with a high probability of achieving both customer acceptance and profitability, the following approach has been adopted:
• An estimation of ability to capture volume from existing products and channels • Combining volume estimates with price estimates to derive an idea of the likely
revenue stream for new products
Below we set out our step-by-step channel assessment process in more detail.
#��� ������������������������� � ������
The first step in assessing the type of volume that could potentially flow through each projected new remittance channel is to assess how attractive each product is to the consumer. An index of attractiveness was therefore generated in order to compare the products, including the following components:
• Physical accessibility: products which require access to the internet, a mobile phone, or a bank account held by either/both the receiver or/and the sender limit their potential market size. An access weight was generated to reflect this, and the score given to the receiving and sending distribution was weighted accordingly
• Security: remitting via taxi driver or a friend is not particularly secure, and most of the new remittance channels have substantial advantages in terms of security
• Price: a rank out of three was given to the products on price, depending on how they compared against each other
• Speed of transfer: money is often remitted to meet urgent financial needs, making the speed of the transfer an important consideration to the consumer
• Education: low income individuals often have a low level of financial education. The need for product education therefore imposes a barrier to product attractiveness
63
• Ease of customer compliance: compliance in terms of AML and KYC are often difficult for low income customers, who typically have less formal documentation at their disposal
A rank from three (very attractive) to zero (not attractive at all) was given to each product. The index rank is shown in Table 46 on the following page.
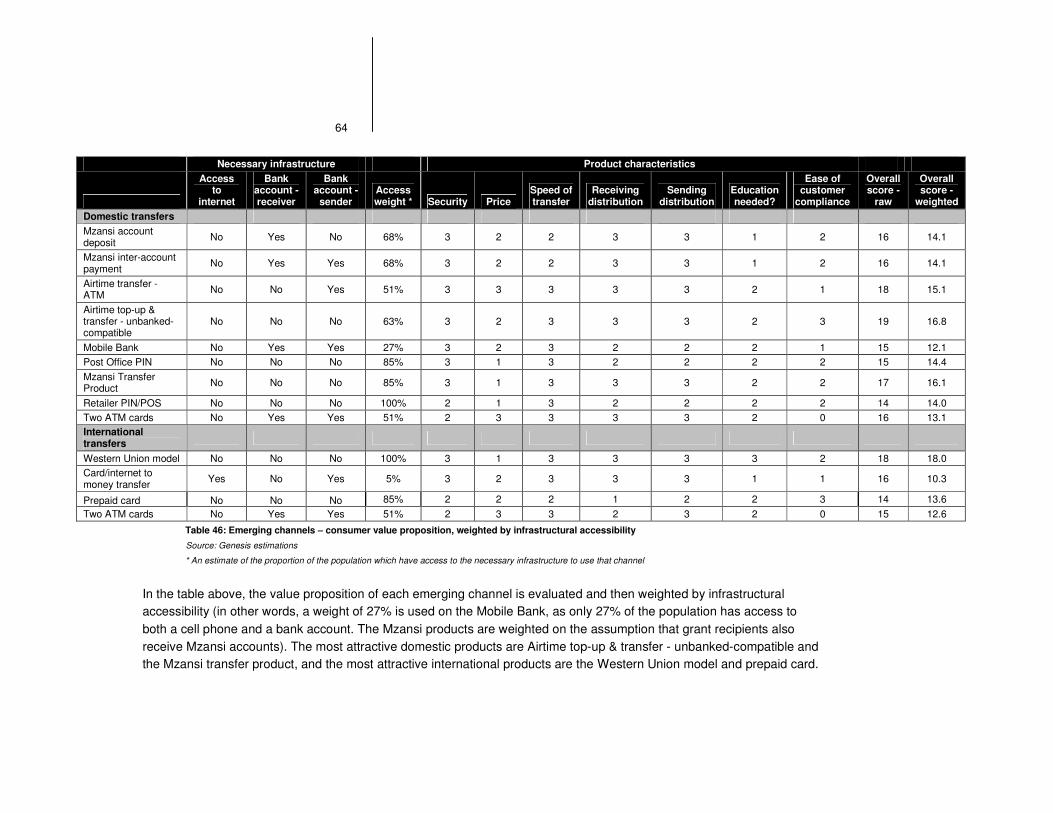
64
Necessary infrastructure Product characteristics
Access to
internet
Bank account - receiver
Bank account -
sender Access weight * Security Price
Speed of transfer
Receiving distribution
Sending distribution
Education needed?
Ease of customer
compliance
Overall score -
raw
Overall score -
weighted Domestic transfers Mzansi account deposit No Yes No 68% 3 2 2 3 3 1 2 16 14.1
Mzansi inter-account payment No Yes Yes 68% 3 2 2 3 3 1 2 16 14.1
Airtime transfer - ATM No No Yes 51% 3 3 3 3 3 2 1 18 15.1
Airtime top-up & transfer - unbanked-compatible
No No No 63% 3 2 3 3 3 2 3 19 16.8
Mobile Bank No Yes Yes 27% 3 2 3 2 2 2 1 15 12.1 Post Office PIN No No No 85% 3 1 3 2 2 2 2 15 14.4 Mzansi Transfer Product No No No 85% 3 1 3 3 3 2 2 17 16.1
Retailer PIN/POS No No No 100% 2 1 3 2 2 2 2 14 14.0 Two ATM cards No Yes Yes 51% 2 3 3 3 3 2 0 16 13.1 International transfers
Western Union model No No No 100% 3 1 3 3 3 3 2 18 18.0 Card/internet to money transfer Yes No Yes 5% 3 2 3 3 3 1 1 16 10.3
Prepaid card No No No 85% 2 2 2 1 2 2 3 14 13.6 Two ATM cards No Yes Yes 51% 2 3 3 2 3 2 0 15 12.6
Table 46: Emerging channels – consumer value proposition, weighted by infrastructural accessibility
Source: Genesis estimations
* An estimate of the proportion of the population which have access to the necessary infrastructure to use that channel
In the table above, the value proposition of each emerging channel is evaluated and then weighted by infrastructural accessibility (in other words, a weight of 27% is used on the Mobile Bank, as only 27% of the population has access to both a cell phone and a bank account. The Mzansi products are weighted on the assumption that grant recipients also receive Mzansi accounts). The most attractive domestic products are Airtime top-up & transfer - unbanked-compatible and the Mzansi transfer product, and the most attractive international products are the Western Union model and prepaid card.
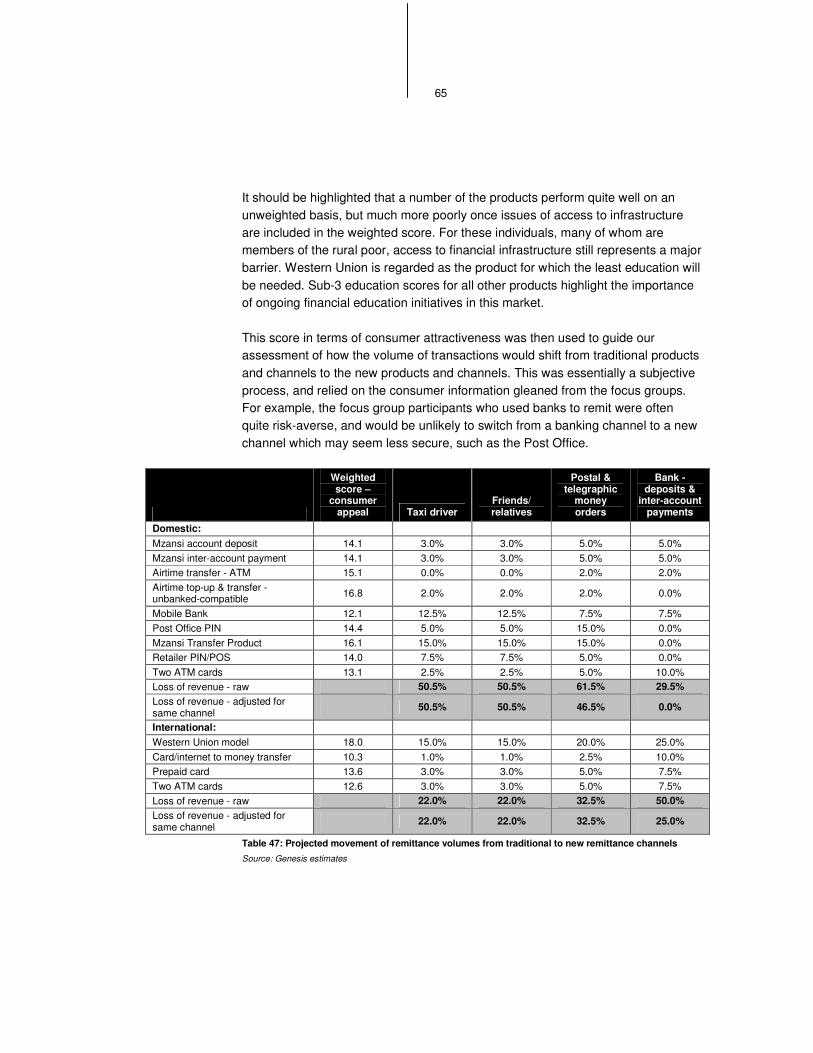
65
It should be highlighted that a number of the products perform quite well on an unweighted basis, but much more poorly once issues of access to infrastructure are included in the weighted score. For these individuals, many of whom are members of the rural poor, access to financial infrastructure still represents a major barrier. Western Union is regarded as the product for which the least education will be needed. Sub-3 education scores for all other products highlight the importance of ongoing financial education initiatives in this market.
This score in terms of consumer attractiveness was then used to guide our assessment of how the volume of transactions would shift from traditional products and channels to the new products and channels. This was essentially a subjective process, and relied on the consumer information gleaned from the focus groups. For example, the focus group participants who used banks to remit were often quite risk-averse, and would be unlikely to switch from a banking channel to a new channel which may seem less secure, such as the Post Office.
Weighted score –
consumer appeal Taxi driver
Friends/ relatives
Postal & telegraphic
money orders
Bank - deposits &
inter-account payments
Domestic: Mzansi account deposit 14.1 3.0% 3.0% 5.0% 5.0% Mzansi inter-account payment 14.1 3.0% 3.0% 5.0% 5.0% Airtime transfer - ATM 15.1 0.0% 0.0% 2.0% 2.0% Airtime top-up & transfer - unbanked-compatible 16.8 2.0% 2.0% 2.0% 0.0%
Mobile Bank 12.1 12.5% 12.5% 7.5% 7.5% Post Office PIN 14.4 5.0% 5.0% 15.0% 0.0% Mzansi Transfer Product 16.1 15.0% 15.0% 15.0% 0.0% Retailer PIN/POS 14.0 7.5% 7.5% 5.0% 0.0% Two ATM cards 13.1 2.5% 2.5% 5.0% 10.0% Loss of revenue - raw 50.5% 50.5% 61.5% 29.5% Loss of revenue - adjusted for same channel 50.5% 50.5% 46.5% 0.0%
International: Western Union model 18.0 15.0% 15.0% 20.0% 25.0% Card/internet to money transfer 10.3 1.0% 1.0% 2.5% 10.0% Prepaid card 13.6 3.0% 3.0% 5.0% 7.5% Two ATM cards 12.6 3.0% 3.0% 5.0% 7.5% Loss of revenue - raw 22.0% 22.0% 32.5% 50.0% Loss of revenue - adjusted for same channel 22.0% 22.0% 32.5% 25.0%
Table 47: Projected movement of remittance volumes from traditional to new remittance channels
Source: Genesis estimates
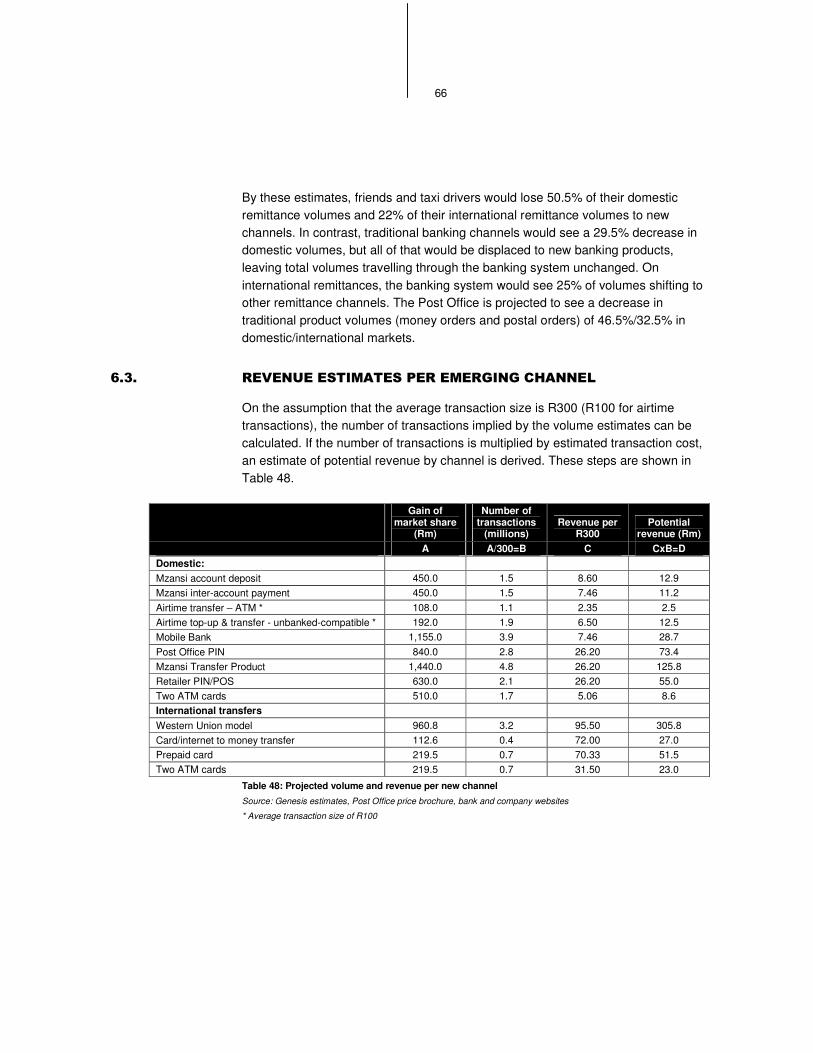
66
By these estimates, friends and taxi drivers would lose 50.5% of their domestic remittance volumes and 22% of their international remittance volumes to new channels. In contrast, traditional banking channels would see a 29.5% decrease in domestic volumes, but all of that would be displaced to new banking products, leaving total volumes travelling through the banking system unchanged. On international remittances, the banking system would see 25% of volumes shifting to other remittance channels. The Post Office is projected to see a decrease in traditional product volumes (money orders and postal orders) of 46.5%/32.5% in domestic/international markets.
#� � ������������������������� � ������
On the assumption that the average transaction size is R300 (R100 for airtime transactions), the number of transactions implied by the volume estimates can be calculated. If the number of transactions is multiplied by estimated transaction cost, an estimate of potential revenue by channel is derived. These steps are shown in Table 48.
Gain of market share
(Rm)
Number of transactions
(millions) Revenue per
R300 Potential
revenue (Rm) A A/300=B C CxB=D Domestic: Mzansi account deposit 450.0 1.5 8.60 12.9 Mzansi inter-account payment 450.0 1.5 7.46 11.2 Airtime transfer – ATM * 108.0 1.1 2.35 2.5 Airtime top-up & transfer - unbanked-compatible * 192.0 1.9 6.50 12.5 Mobile Bank 1,155.0 3.9 7.46 28.7 Post Office PIN 840.0 2.8 26.20 73.4 Mzansi Transfer Product 1,440.0 4.8 26.20 125.8 Retailer PIN/POS 630.0 2.1 26.20 55.0 Two ATM cards 510.0 1.7 5.06 8.6 International transfers Western Union model 960.8 3.2 95.50 305.8 Card/internet to money transfer 112.6 0.4 72.00 27.0 Prepaid card 219.5 0.7 70.33 51.5 Two ATM cards 219.5 0.7 31.50 23.0
Table 48: Projected volume and revenue per new channel
Source: Genesis estimates, Post Office price brochure, bank and company websites
* Average transaction size of R100
67
$� �� �����������������
SUMMARY
The fact that a significant proportion of remittance flows travel informally may be a rational response to the obstacles regulation places in the way of the formal
development of this market. Regulatory obstacles are associated with three main pieces of legislation:
• Exchange control legislation: although the limits on amounts that can be transferred cross-border are not onerous for the remittance market, in practice exchange controls tend to squeeze remitters out of the market. Only authorised dealers, who must have a banking license and have made an investment in an expensive exchange control reporting system, can remit funds. This increases
the cost of remittance transactions • Anti-money laundering and combating the financing of terrorism regulation:
implementing know your customer legislation is difficult in poor communities, which are unlikely to have the necessary paper trail. The thresholds imposed by South African legislation in terms of transactions exempt from anti-money
laundering legislation are also overly restrictive • Immigration laws: under current immigration law, there are few legal options
available to unskilled individuals wishing to migrate to South Africa. Thus much unskilled migration is undocumented. Without proof of legal residence, it is very
difficult to access the formal financial system, and thus remittances must be made informally
$��� �����������
The regulatory environment surrounding money transfers in South Africa is unnecessarily onerous. It presents substantial obstacles to the access of remitters to formal remittance services and also to the implementation of certain business models in the remittance market. Three primary areas of regulation are relevant to the remittances market: exchange control, anti-money laundering (AML) and combating the financing of terrorism (CFT) regulation, and immigration laws.
68
$��� ���� ��������
$����� ��� �����
South Africa still maintains a system of exchange control (originally instituted at the outbreak of the Second World War in 1939), which regulates the purchase and sale of foreign exchange by South African residents and non-residents. The system of exchange control is contained in the Exchange Control Regulations61 issued in terms of section 9 of the Currency and Exchanges Act, 9 of 1933. The administration of the Regulations, including the power to make Orders and Rules under the Exchange Control Regulations, has been delegated to the South African Reserve Bank (“SARB”), which has in turn established an Exchange Control Department (“Exchange Control”) to administer the regulations. Exchange Control has appointed certain banks as authorised dealers in foreign exchange to assist them in administering exchange control.
Different exchange control rulings apply to the transactions of residents of the CMA and non-residents. There are no trade and exchange restrictions between the member countries of the CMA and they form a single exchange control territory. Each CMA member has its own exchange control regulation and authorities, but in terms of the CMA Agreement, their application of exchange control must be at least as strict as that of South Africa. Thus transfer of funds from South Africa to other CMA countries does not require the approval of Exchange Control.
The main purpose of exchange control is “to prevent the loss of foreign currency resources through the transfer abroad of real or financial assets held in South Africa”62. The trend since 1995 has been a gradual relaxation of exchange controls. For example, since March 1998 South African corporates can remit R250m per new investment in SADC. This was increased to R750m per new investment anywhere in Africa from February 2001. Currently South African residents can invest up to R750 000 abroad.63 However, the pace of relaxation has to date been so slow that we can assume that exchange control will be in place for the foreseeable future.
61 Originally promulgated in 1961 in Government Notices R1111 and R1112 of 1 December 1961, and amended from time to time since then. 62 Exchange Control Manual, p.E1. Implicit in this goal is the desire to prevent the erosion of forex reserves, potentially associated with large-scale currency depreciation and thus macroeconomic instability. 63 Exchange Control Manual, C4.
69
$����� ���������������������� ����� ��
The scheme of the Exchange Control Regulations - as it is relevant to private remittances of the scale discussed in this report - is as follows:
• Only authorised dealers can trade in foreign exchange: no person other than an authorised dealer can buy or sell foreign currency to a person other than an authorised dealer.
• The SARB appoints authorised dealers: the Exchange Control department appoints authorised dealers to trade in foreign exchange. Currently only banks are permitted to acquire full licences to act as authorised dealers (see Appendix 2 for the current list of authorised dealers). The authority is delegated to designated bank branches.
• Application to authorised dealer: a person must apply to an authorised dealer for approval to purchase foreign currency. There is no value threshold below which no application is required. Thus an application needs to be made for even the smallest amount.
• Authorised dealers can sell foreign currency only for permissible purposes64: permissible purposes depend on whether the person is a resident or non-resident (see section 7.2.3.1). Applicants must thus state the purpose of the transaction to the authorised dealer when they apply to purchase foreign exchange.
• Authorised dealers must report every sale of foreign exchange: every sale of foreign exchange, irrespective of the amount involved, must be reported by the authorised dealer to the SARB in the form required by the Cross Border Foreign Exchange Transaction Reporting System. This system is designed in line with international standards for managing Balance of Payments data (see section 7.2.4)
$��� � ������� ������
To determine whether a remittance transaction is permissible under the Exchange Control Regulations and whether an authorised dealer can therefore sell foreign exchange to the remitter, two criteria are relevant: (1) the identity of the remitter, and (2) the nature of the transaction.
64 Exchange Control Regulation 2
70
7.2.3.1. IDENTITY OF THE REMITTER
The Exchange Control Regulations distinguish between residents and non-residents, as well as three additional categories, namely temporary residents, immigrants and emigrants (with the latter two not relevant for the purposes of this report).
Residents are persons, whether of a South African or any other nationality that have taken up residence, or are domiciled or registered in South Africa. This would therefore include South African citizens and permanent residents to whom South African national identity documents have been issued. A significant proportion of the cross-border remitters referred to in this report are residents. The Exchange Control Regulations place no restrictions on the access of residents to banking and other financial services in South Africa.
Non-residents are defined as persons whose normal place of residence, domicile or registration is outside the CMA. As such, they can therefore not earn income from working in South Africa, and legal economic migrants, working in South Africa and sending remittances to SADC countries, would therefore be categorised as residents rather than non-residents. Conversely, illegal migrants working in South Africa would meet the non-resident definition.
Temporary residents are defined as “foreign nationals of countries outside the CMA who have taken up temporary residence in the Republic excluding those who are purely on temporary visits”.65 They include contract workers. To purchase foreign exchange they must provide the authorised dealer with an original and valid work permit issued by the Department of Home Affairs (see section 7.2.4). As far as access to banking and permissible transactions are concerned, the norm applied by Exchange Control is that “contract workers should, while they are in the RSA, be treated more or less like residents in order to avoid unnecessary administrative procedures which would have resulted from treating them as non-residents. That implies, for example, that they can keep bank accounts or obtain funds from financial institutions for the purchase of a house in the same way as a resident.”66
There is significant anecdotal evidence that most foreigners, including those that have a legal right to work, find it difficult to open a bank account.67 With the
65 Page J1 of the Exchange Control Manual. 66 Page J1 of the Exchange Control Manual. 67 Please note however that the focus group participants did not confirm that this was the case. We are uncertain as to the cause of this discrepancy.
71
introduction of new anti-money laundering legislation, the onus on authorised dealers in this regard is likely to increase. Many foreign nationals will effectively find themselves excluded from appropriate financial products and services.
7.2.3.2. NATURE OF THE TRANSACTION
The Exchange Control Regulations characterise remittances as transfer payments or unrequited transfers (in other words, payment is not made in expectation of receiving goods or services). Various forms of transfer payments are permissible under the Regulations. For our purposes the most relevant category is “gifts”. South African residents are permitted to transfer monetary gifts within a limit of R30 000 per applicant per calendar year to persons normally resident outside the CMA, or South African residents temporarily outside the CMA for the sole purpose of study.68 Most remittances would fall into this category, and the monetary limit would be more than sufficient for the vast majority of remitters. Other relevant permissible transfer payments include:
• Alimony: alimony may be paid in accordance with a court order, and up to R9 000 per month over and above the amount awarded by the court;
• Maintenance: maintenance payments of up to R9 000 per month are permissible. However, the requirements for doing so are onerous, and include presenting “original documentary evidence from a magistrate or civic official, or, in the absence of such official, from a priest, minister of religion, medical doctor or principal of a school in the town or city where the beneficiary is resident”, proving that the recipient is either the father, mother, brother or sister of the remitter, and that the beneficiary is in need. Such home country documentation must be renewed annually.69
Aside from the above categories, temporary residents are allowed to “transfer abroad funds (without a monetary limit) accumulated during their stay in South Africa provided the individuals can substantiate the source of such funds and that the value of such funds is reasonable in relation to their income generating activities in the Republic during the period.”70
68 Page L1 of the Exchange Control Manual. 69 Page L2 of the Exchange Control Manual. 70 Page J2 of the Exchange Control Manual.

72
$���!� ������� ������� �
Every sale of foreign exchange, irrespective of the amount involved, must be reported by the authorised dealer to the SARB in the form required by the Cross Border Foreign Exchange Transaction Reporting System. Data required includes:
• For the domestic party: full names, residence permit number, address, and either an email address, phone number or fax number
• For the non-resident party: full name, country code and if available, address • The size of the transaction, both in domestic currency and in the foreign
currency concerned • The purpose of the transfer71
Where the remitter also holds an account at the authorised dealer, much of this information will already have been captured by the bank’s KYC processes. Additional data, such as the identity of the recipient and the purpose of the transfer, is captured through a form which the authorised dealer is required to complete before the transaction is undertaken. Industry participants suggest that monitoring is so strictly enforced that errors in inputting data into the system will be queried telephonically within the day.
$���"� ���������������
A curious anomaly within the exchange control framework is the position of the South African Post Office. The Post Office is empowered by law to remit money outside the country via money order, postal order “or other document authorized to be used for the purpose of so remitting money.”72 Within the CMA, the Post Office imposes no limits on the amount of money that can be remitted through its system, although the maximum size of a single transaction is R2 000. For remittances sent beyond the CMA,73 the maximum amount that can be sent in one month per individual is R2 000.
The Post Office has consistently argued that it has a long history of sending remittances, and thus that its legal authority to be involved in the remittance business supersedes exchange control legislation, and is therefore not subject to it.
71 Ascertained via a telephone conversation with an exchange control representative. 72 Section 46 of the Postal Act of 1958. 73 The countries which the Post Office can send remittances to are as follows: Lesotho, Namibia, Swaziland, United Kingdom, Jersey, Northern Ireland, Botswana, Kenya, St Helena, Zambia, Brazil, Canada, Italy, Malaysia, Mauritius, Singapore, Sri Lanka and Switzerland. This includes all the countries covered in this study except Malawi and Mozambique.
73
Although the SARB has challenged this position from time to time, Post Office remittances are not reported via the SARB’s reporting system.
$���#� ������������� ��������������������
The impact of exchange control regulations on the remittances market has three dimensions: (1) the impact on remitters; (2) the impact on remittance businesses or potential businesses; and (3) the impact on regulated remittance flows.
7.2.6.1. IMPACT ON REMITTERS
The Exchange Control Regulations provide ample scope for remittance transactions, be that as gifts or simply repatriation of earnings, and the value thresholds (R30 000 in the case of gifts and unlimited in the case of earning repatriations) are high enough to facilitate the bulk of the remittances that are our concern in this report. However, exchange control effectively squeezes remitters out of the formal system for two reasons.
Legality of residency and work: firstly, Exchange Control presents insuperable obstacles to remitters who do not have the necessary permission or documentation to live or work legally in South Africa. If you cannot present proof of citizenship, permanent residency or one of the temporary permits, you cannot purchase foreign exchange. Undocumented migrants, who may well form the bulk of potential remitters from South Africa, are therefore prevented from using any formal remittance channel, except perhaps the Post Office.74
Cost: the second reason is one of cost. Exchange control effectively reserves the formal remittance market for authorised dealers, i.e banks. This buttresses the banks’ exclusive control of the payments system, with the result that both the operational costs and the spread cost (ie: the difference between the exchange rate charged and the exchange rate in the market) for international remittance transactions via the banking system remain very high (see Table 31). These high bank charges place remitting via the formal sector beyond the reach of most SADC remitters in South Africa.
74 Contrast the position in, for example, Spain where illegal immigrants can remit money via the formal banking system upon production of a valid passport. However, such illegal immigrants cannot open bank accounts in Spain. This was reflected in a presentation by Erik Magdaleno, Manager of Financial Services of La Caixa, a bank in Spain, to the Third International Conference on Hawala in Abu Dhabi, United Arab Emirates, held on 2 – 3 April 2005.
74
7.2.6.2. IMPACT ON REMITTANCE BUSINESSES
There are three possible ways for a new business entrant into the remittance market to deal with exchange control reporting requirements. The first is to conduct all dealings through an authorised dealer. At small transaction volumes, this is likely to be more economical than investing in an in-house exchange control reporting system (that can provide the exchange control department with the data necessary to ensure excon compliance). The authorised dealer will then bear the responsibility for ensuring that data collection is adequate. The second option is to ask Exchange Control for a special dispensation to report transactions directly to them, rather than through an in-house reporting system. The foreign exchange trade is still handled by an authorised dealer (typically on a batched basis), but the data on each transaction comes directly from the company itself (and is then netted off against the batched transaction reported by the authorised dealer). The third option is to apply for an authorised dealer licence and to handle all aspects of the transaction and reporting requirements, an option which is however only open to institutions which hold a banking license.
The first option requires the smallest investment and the third the largest. The second option may be the most difficult to follow, however, as Exchange Control seems to prefer that authorised dealers be responsible for reporting requirements. Only two organisations have been given permission to operate in this manner. Most new remittance channels would therefore probably have to operate using the first option, and report transactions through an authorised dealer. This will contribute to operational costs, and thus the per-transaction cost of remitting.
Western Union’s withdrawal from the South African market seems to have been closely associated with its failure to provide a reporting system compliant with SARB requirements. Presumably it could not obtain exchange control permission to report via option 2, nor satisfy an authorised dealer that it could provide adequate transaction data via option 1. Option 3, of becoming an authorised dealer, would have been discouraged by the SARB, as Western Union did not hold a banking license.
The limitation of full authorised dealer licenses to banks, together with the substantial investment required for the exchange control reporting system, impose barriers to entry into the remittance market. The result has been a decrease in the number of providers of formal remittance services (with the exit of Western Union from the South African market illustrating this phenomenon). Theory suggests that the fewer service providers there are, the less competition there is in the market.
75
This will typically result in prices rising above their competitive level, leading to a decrease in consumer utility.
In addition, banks can only handle transactions that terminate in bank accounts, and therefore can only handle remittances to banked individuals. The restriction of authorised dealer licenses therefore has the consequences of excluding unbanked recipients from the formal cross-border remittance sector (with the exception of the Post Office).
7.2.6.3. IMPACT ON REGULATED REMITTANCE FLOWS
Sociologist Robert Merton postulated that “almost all human actions have at least one unintended consequence.”75 This law of unexpected consequences is of particular relevance to the regulatory environment, as the manner in which regulations are formulated may inadvertently subvert their intended purpose.
In the remittance market, the danger is that legislation designed to introduce additional clarity on the source and destination of funds may in fact drive these transactions underground, resulting in an effective decrease in clarity. Some evidence of this can be seen in market experience with foreign exchange controls in certain other countries:
• India: the liberalisation of the exchange rate in India in 1991 has since been associated with a substantial decrease in the use of illegal channels to remit money to the state of Kerala (a principal remittance destination)76
• The Philippines: the Philippines abolished exchange control in 1995, and found in the same year that private remittances through formal channels had quadrupled77
• Pakistan: political instability in Pakistan in 1998 (associated with nuclear testing) led to the imposition of currency controls. Foreign remittance flows through banks decreased from approximately US$150m per month to US$50m per month78
• Vietnam: in 1996, Vietnam introduced a 5% withholding tax on foreign remittances. Remittance flows through formal channels halved after the introduction of the tax, and recovered after its removal in 199779
75 http://en.wikipedia.org/wiki/Law_of_unintended_consequences 76 Kannan & Hari 2002, 6 77 Buencamino & Gorbunov 2002, 8 78 Buencamino & Gorbunov 2002, 8 79 Buencamino & Gorbunov 2002, 9
76
The impact of exchange control in South Africa has been similar. Only about 5% of remittances from South Africa to SADC are sent via channels that are subject to exchange control. The balance is not subject to exchange control scrutiny. Almost 60% - and probably more – of remittances flowing out of South Africa do so outside of the regulated financial system.
By driving remitters to use unregulated channels, the ability of regulators to monitor the transfer of funds and detect any suspicious activity actually decreases. The heavy use of informal remittance channels in South Africa suggests that this has already occurred.
$���$� ������������������������� ��������
7.2.7.1. BALANCE OF PAYMENTS
As already stated, one of the principal aims of exchange control is to protect South African foreign exchange reserves, in order to prevent currency devaluation and macroeconomic instability. In Table 16, we estimated that the total outflow of South African remittances to SADC (both formal and informal) was approximately R6bn. This equates to 1.5% of total current and financial account outflows. According to our estimates the flows from the CMA to Botswana, Malawi, Mozambique and other SADC destinations involves approximately R4bn worth of remittances, or about 1.0% of current and financial account outflows from South Africa. Remittance flows are therefore not a substantial enough component of the balance of payments to pose any real threat to foreign exchange reserves.
The flows referred to in the previous paragraph are estimates of formal and informal flows to SADC. Actual formal remittances are partially captured in the balance of payments as part of the “compensation of employees” line.80 In 2003, compensation of employees comprised a net outflow of R2.4bn (an inflow of R2.9bn and an outflow of R5.3bn, which is lower than our estimate of R6bn in total outflows of formal and informal remittances). This includes remittances to all countries outside South Africa, therefore also beyond the SADC region. Formal remittances therefore equate to 0.8% of current and financial account receipts and 1.4% of current and financial account payments. Even the most conservative
80 Ideally, it would be better to use the workers’ remittances category from the balance of payments data, which better captures actual flows of funds. However, South Africa doesn’t report this data line. Therefore we have used compensation of employees, which comprises wages, salaries, and other benefits earned by individuals-in economies other than those in which they are residents-for work performed for and paid for by residents of those economies. It is thus a much broader estimate (although, interestingly, still lower than our estimate of R6bn in cross-border flows, which includes informal channels).
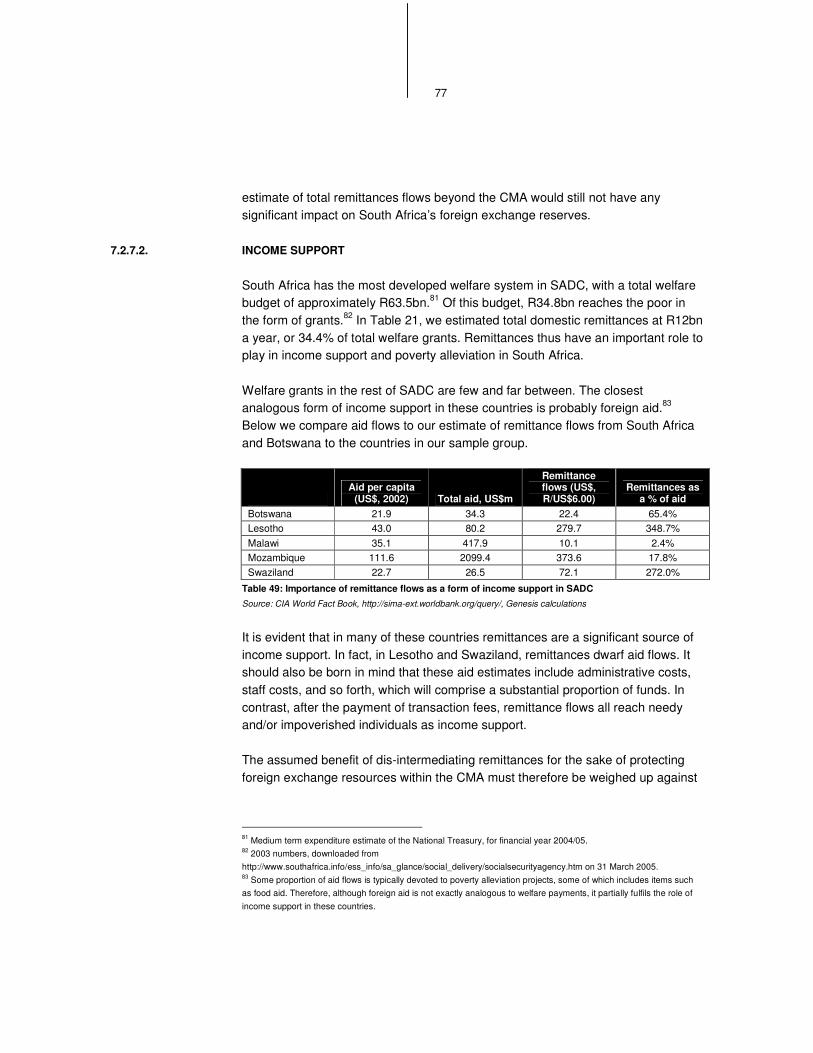
77
estimate of total remittances flows beyond the CMA would still not have any significant impact on South Africa’s foreign exchange reserves.
7.2.7.2. INCOME SUPPORT
South Africa has the most developed welfare system in SADC, with a total welfare budget of approximately R63.5bn.81 Of this budget, R34.8bn reaches the poor in the form of grants.82 In Table 21, we estimated total domestic remittances at R12bn a year, or 34.4% of total welfare grants. Remittances thus have an important role to play in income support and poverty alleviation in South Africa.
Welfare grants in the rest of SADC are few and far between. The closest analogous form of income support in these countries is probably foreign aid.83 Below we compare aid flows to our estimate of remittance flows from South Africa and Botswana to the countries in our sample group.
Aid per capita
(US$, 2002) Total aid, US$m
Remittance flows (US$, R/US$6.00)
Remittances as a % of aid
Botswana 21.9 34.3 22.4 65.4% Lesotho 43.0 80.2 279.7 348.7% Malawi 35.1 417.9 10.1 2.4% Mozambique 111.6 2099.4 373.6 17.8% Swaziland 22.7 26.5 72.1 272.0%
Table 49: Importance of remittance flows as a form of income support in SADC Source: CIA World Fact Book, http://sima-ext.worldbank.org/query/, Genesis calculations
It is evident that in many of these countries remittances are a significant source of income support. In fact, in Lesotho and Swaziland, remittances dwarf aid flows. It should also be born in mind that these aid estimates include administrative costs, staff costs, and so forth, which will comprise a substantial proportion of funds. In contrast, after the payment of transaction fees, remittance flows all reach needy and/or impoverished individuals as income support.
The assumed benefit of dis-intermediating remittances for the sake of protecting foreign exchange resources within the CMA must therefore be weighed up against
81 Medium term expenditure estimate of the National Treasury, for financial year 2004/05. 82 2003 numbers, downloaded from http://www.southafrica.info/ess_info/sa_glance/social_delivery/socialsecurityagency.htm on 31 March 2005. 83 Some proportion of aid flows is typically devoted to poverty alleviation projects, some of which includes items such as food aid. Therefore, although foreign aid is not exactly analogous to welfare payments, it partially fulfils the role of income support in these countries.
78
the massive and highly targeted welfare benefit of these remittances in SADC member states.
$� � ���������������� &!��
As the remittance market involves the transfer of funds, it is substantially affected by anti-money laundering (“AML”) and combating the financing of terrorism (“CFT”) regulation. A remittance, as an unrequited transfer of funds, could potentially allow money launderers an effective means of transmitting illegal funds (as one of the problems with transmitting illegal funds is that no legitimate transactional documents can be given to justify doing so, and no such documents must be given for sending unrequited funds). The recommendations of the Financial Action Task Force (“FATF”), the principal international standard setting body in the AML and CFT arena, will therefore impact the remittance market in Southern Africa to the extent that it is implemented via domestic legislation.
South Africa enacted the Financial Intelligence Centre Act (“FICA”) in 2002. FICA seeks to implement the FATF Forty Recommendations, and the recommendations of the Basel Committee on Banking Supervision. The FATF Nine Special Recommendations on terrorist financing are not dealt with by FICA and are yet to be implemented in South Africa. The relevant FATF Recommendations as well as the relevant provisions of FICA and the regulations issued in terms of FICA are detailed in Appendix 1.
FICA and its regulations as well as the FATF Recommendations impact the remittances market in three key respects: (1) the customer due diligence requirements (“CDD”) determine which migrants/remitters can get access to the formal financial system to send remittances; (2) the requirements regarding correspondent relationships place an onus on financial institutions to interrogate the standing and levels of AML compliance of their financial counterparts in the receiving/sending country; and (3) AML and CFT compliance increases the cost of accessing formal remittances services.
$� ��� ���������������� ���)��*�
Accountable institutions under FICA (which includes banks and all money remitters) must undertake CDD both on the customer, when initiating the relationship, and on the pattern of transactions on the account. This implies that the
84 This section draws heavily on a previous Genesis report, “Legislative and regulatory obstacles to mass banking.” Prepared for FinMark Trust, September 2003
79
duty of banks to monitor client relationships is ongoing, and also that, ideally, banking systems should be able to provide data on the pattern of transactions of a particular individual, across all accounts held.
Section 21 of FICA requires accountable institutions to establish and verify the identity of their clients. What this requires in practice is detailed in the regulations issued in terms of FICA. Before a financial institution can open an account or perform a single transaction (i.e. where a permanent relationship is not entered into with the client) for a South African citizen or resident, the bank must obtain the (1) full names, (2) date of birth, (3) identity number and (4) residential address of the person.85 The bank must verify this information against a valid identification document issued by the South African authorities and, in the case of the residential address, against documentation that can reasonably verify the information, normally a utility account. In the case of a foreign national, the bank must obtain the nationality and passport number, rather than the identity number. This must obviously be verified against the passport.
Verifying client identity in South Africa has proved extremely difficult, particularly in the low income market:
• In low income areas such as informal settlements, verifying legal permanent address can be prohibitively difficult. At least one-third of South African households do not have formal addresses: according to the most recent census (2001) 30% of the approximately 9.1 million households in South Africa live in either traditional dwellings or informal structures
• Low income consumers increasingly prepay for their utilities. This means that no water, electricity or phone bills are available to confirm residential address, as prepaid systems don’t create an audit trail
• Among the poor, telephone numbers, fax numbers, and e-mail addresses are typically not available
FICA Exemption 1786 was designed to enable the launch of the Mzansi87 account (see Box 8). It dispenses with the requirement to obtain and verify the residential address of clients, but maintains the requirement to present a South African identity document. The qualifying accounts and single transactions for this Exemption are those which enable the client to transfer or make payments not exceeding R5 000 per day or R25 000 in a monthly cycle (more than sufficient for the average size remittance in SADC). For accounts, the balance held may never exceed R25 000. 85 See regulation 3. The requirement to obtain the income tax number is not currently operative. 86 Government Notice R1353 issued on 19 November 2004 in GG No 27011. 87 Mzansi means “south”.
80
Transfers as a result of a point-of-sale payment or cash withdrawal in a CMA country are allowed, but transfers beyond the CMA are not.
Exemption 17 follows a conservative approach to value thresholds compared to FATF. Some of the FATF thresholds are substantially larger than the FICA thresholds. FATF suggests that the threshold for occasional and/or money transfer agent customers should be US$15 000, which equates to between R118 350 (R/�7.89) and R93 600 (R/US$6.24). FATF Special Recommendation 7 (wire transfers) suggests a threshold of US$3 000 (R18 720 at R/US$6.24), which admittedly is below the FICA R25 000 balance threshold. However, the FATF number refers to a transaction rather than a balance threshold, and is thus still not as onerous.
The current position is therefore that domestic and CMA remitters require only a South African identity document to access formal remittance channels. Remittances beyond SADC require the full CDD under FICA. In due course the full import of FATF Special Recommendation 6 (see Appendix 1 for details) will also be felt in the SADC market.
It should also be noted that most of the data which financial institutions are required to collect in terms of FICA is already collected by Exchange Control. This duplication of regulatory effort causes an increase in the transaction costs faced by remittance clients and businesses.
$� ��� ������� �������������
The AML requirements on the financial institution do not end with the CDD process. Accounts must be monitored for suspicious transaction patterns, and action must be taken should such patterns be detected. This implies that an investment in monitoring systems must be undertaken, and that specialist monitoring and enforcement personnel must be available to the institution. AML compliance therefore is associated with an increase in the cost of running accounts, as well as the costs of establishing relationships with customers.
$� � � �������������������������������� �
FATF recommendation 7 requires financial institutions involved in cross-border banking and similar relationships to gather sufficient information about the respondent institution’s business, reputation and quality of supervision. It must also assess its AML and CFT controls (see Appendix 1).
81
This is relevant to the remittance market, as one of the easiest ways to provide an adequate remittance distribution network is to form a partnership with a financial institution in the destination country. However, South Africa is the only FATF-compliant country in SADC and the only FATF member in Africa, which will probably create some reluctance to rely on the KYC abilities of partner institutions.88 This will not be the case where the partner institution is a division of the financial institutions in South Africa or another institution, such as a retailer, with whom the financial institution has a relationship in South Africa.
$� �!� ��������������� �������
AML regulation in South Africa has both cost and access implications. The Basel Committee on Banking Supervision specifically addresses the possibility that CDD will result in a reduction in access to finance, by stating that “[i]t is important that the customer acceptance policy is not so restrictive that it results in a denial of access by the general public to banking services, especially for people who are financially or socially disadvantaged.”89 However, it seems likely that the current South African regulatory environment does result in such exclusions. Two specific exclusions seem to occur:
• Legality: remitters without a South African identity document or valid residence/work permit cannot obtain access to formal financial services
• Service-based exclusions: in terms of FICA exemption 17, accounts with lower CDD requirements cannot be used to transfer funds outside of the CMA. Therefore even if an individual who wishes to remit funds outside of the CMA is able to gain access to an Mzansi account, they are denied access to a key remittance service
What is the money laundering risk posed by remittances? Clearly remittances, particularly into formal bank accounts in the recipient country, can be well used by money launderers. International norms though equate the risk of money laundering to the potential quantum that can be laundered. In this regard the FATF threshold for occasional transactions is US$/�15 000, or R93 600 at current US$ exchange rates. A monthly threshold of R25 000 for multiple transactions, as is enforced under Exemption 17, would therefore be well within the international risk threshold.
88 However, most SADC countries are members of ESAAMLG (the Eastern and Southern Africa Anti-Money Laundering Group), so some commitment to compliance with anti-money laundering proposals has been expressed. 89 “Customer due diligence for banks”, Basel Committee on Banking Supervision, October 2001.
82
$�!� ���� �������� �������
As should be clear by now, the legality of the presence of a migrant in South Africa is an absolute and insurmountable requirement for that person to gain access to formal remittance products, be that from an exchange control or from a AML perspective. Immigration to South Africa is regulated by the Immigration Act, 13 of 2002. Acquiring citizenship or permanent residency in South Africa requires the individual to follow a fairly time-consuming process, similar to that applicable in other countries. Trying to change that to facilitate remittances would be a counter-productive endeavour.
As shown in Table 50, the only temporary permit currently available for an unskilled worker wishing to enter South Africa to seek employment is a corporate permit, which is in many ways a remnant of the apartheid labour system which provided preferential treatment to the mines and farms as regards foreign labour. As regards the other work permits, it is unlikely that most relatively low skilled migrants will be able to comply lawfully with the requirement that the employer must certify that a qualified South African citizen is not available. Therefore any unskilled individual who wishes to enter South Africa to work, and does not do so in terms of a corporate permit, must by necessity do so illegally.90
90 The corporate permit system is principally used by large employers, mostly in the mining industry. Therefore migrants seeking employment as, for example, domestic helpers, restaurant staff, gardeners, and with other small employers, would not have access to the corporate permit system.
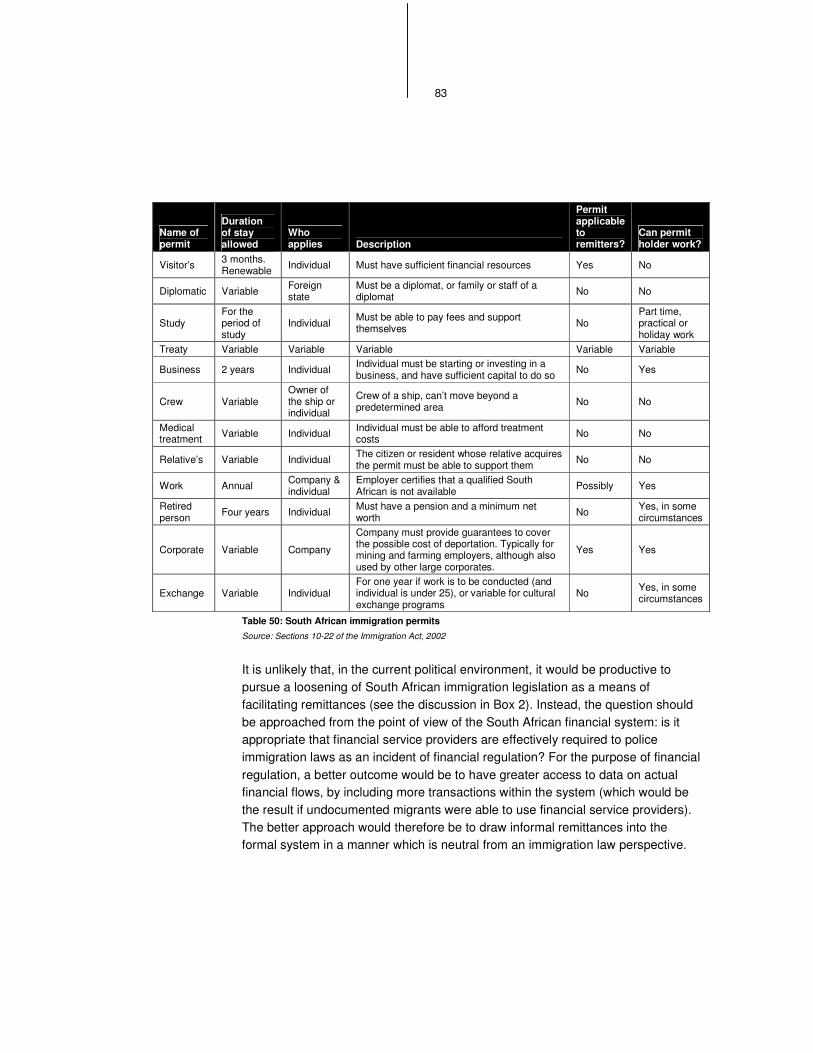
83
Name of permit
Duration of stay allowed
Who applies Description
Permit applicable to remitters?
Can permit holder work?
Visitor’s 3 months. Renewable Individual Must have sufficient financial resources Yes No
Diplomatic Variable Foreign state
Must be a diplomat, or family or staff of a diplomat No No
Study For the period of study
Individual Must be able to pay fees and support themselves No
Part time, practical or holiday work
Treaty Variable Variable Variable Variable Variable
Business 2 years Individual Individual must be starting or investing in a business, and have sufficient capital to do so No Yes
Crew Variable Owner of the ship or individual
Crew of a ship, can’t move beyond a predetermined area No No
Medical treatment Variable Individual Individual must be able to afford treatment
costs No No
Relative’s Variable Individual The citizen or resident whose relative acquires the permit must be able to support them No No
Work Annual Company & individual
Employer certifies that a qualified South African is not available Possibly Yes
Retired person Four years Individual Must have a pension and a minimum net
worth No Yes, in some circumstances
Corporate Variable Company
Company must provide guarantees to cover the possible cost of deportation. Typically for mining and farming employers, although also used by other large corporates.
Yes Yes
Exchange Variable Individual For one year if work is to be conducted (and individual is under 25), or variable for cultural exchange programs
No Yes, in some circumstances
Table 50: South African immigration permits Source: Sections 10-22 of the Immigration Act, 2002
It is unlikely that, in the current political environment, it would be productive to pursue a loosening of South African immigration legislation as a means of facilitating remittances (see the discussion in Box 2). Instead, the question should be approached from the point of view of the South African financial system: is it appropriate that financial service providers are effectively required to police immigration laws as an incident of financial regulation? For the purpose of financial regulation, a better outcome would be to have greater access to data on actual financial flows, by including more transactions within the system (which would be the result if undocumented migrants were able to use financial service providers). The better approach would therefore be to draw informal remittances into the formal system in a manner which is neutral from an immigration law perspective.
84
$�"� ����������� ���������� ���
Whereas reforms to SA immigration laws may have considerable merit this is not the focus of this report. Enticing as many remitters as possible to utilise regulated financial channels, will be to the broader benefit of the South African financial system, law enforcement agencies and the communities and countries from which migrants originate. In this respect South Africa can draw useful lessons from the United States where the financial sector is not required to assist in the policing of the immigration system, but simply be allowed to act as the financial intermediation agent and payment system operator, which are its primary functions. More broadly we recommend a set of inter-linking amendments to the current Exchange Control Regulations and AML regulations. None of these amendments require legislative (Parliamentary) amendments since all of these can be effected via subordinate legislation.
$�"��� ����������� ��������������� ������������������ ���
����������������
Currently only about 5% of the estimated R6 billion cross-border remittances to SADC are recorded via the SARB’s costly reporting system. The existence of the Post Office anomaly has not hurt the country’s Balance of Payments. We recommend that all authorised agents be exempted from reporting transactions, which can be limited to unrequited transfers, below a certain threshold, which we suggest should be R5 000 (in line with the requirements of the current Exemption 17).
$�"��� ���������������������������������������������������
�������
At present, full authorised dealer licenses are limited to banks, with limited licenses available to bureaux de change. In order to encourage competition in the remittance market, we recommend the institution of a specialised limited authorised dealer license for the remittance market.
$�"� � ����������������$��������+�������
Exemption 17 currently facilitates some forms of cross-border transfers within the CMA. We recommend that this be extended to cross-border transfers within SADC or Africa. The current exchange control dispensation allows higher levels of investment from South Africa to SADC and Africa, than to the rest of the world.
85
This indicates that the South African government is prepared to facilitate financial flows to the rest of the continent on a preferred basis.
$�"�!� ���������������������������������������������������
We recommend that both the Exchange Control and AML regulations be amended to facilitate access to remittance services (note, not necessarily full financial services) on presentation of a valid passport alone (ie: without documentation of legal migration status). Other countries already follow a similar approach, notably the United States with Mexican migrants. We note that a prerequisite for migrants to use this dispensation will be the legal protection of the data supplied to the financial institution from being used by immigration authorities for prosecution.
Finally, the fact that South Africa is the only FATF-compliant country in SADC substantially increases the regulatory burden on South African institutions involved in cross-border transactions into SADC. Increased emphasis on gaining FATF compliance in major remittance receiving countries would therefore be of considerable benefit to the banks, many of which already have cross border operations.
$�#� �������� ��� �����������������
Some quantification of the likely regulatory barriers faced by the various emerging channels introduced in section 5 is possible, based on a qualitative understanding of the models themselves and the regulatory environment. This is detailed in Table 51. Each model is given a score out of five in the three key areas of regulation, with a score of zero denoting that regulation imposes no barrier to the model in question, and a score of five denoting a substantial and/or insurmountable barrier. “Non-pecuniary” barriers include factors such as lack of political support or perceived opposition from sector regulators.
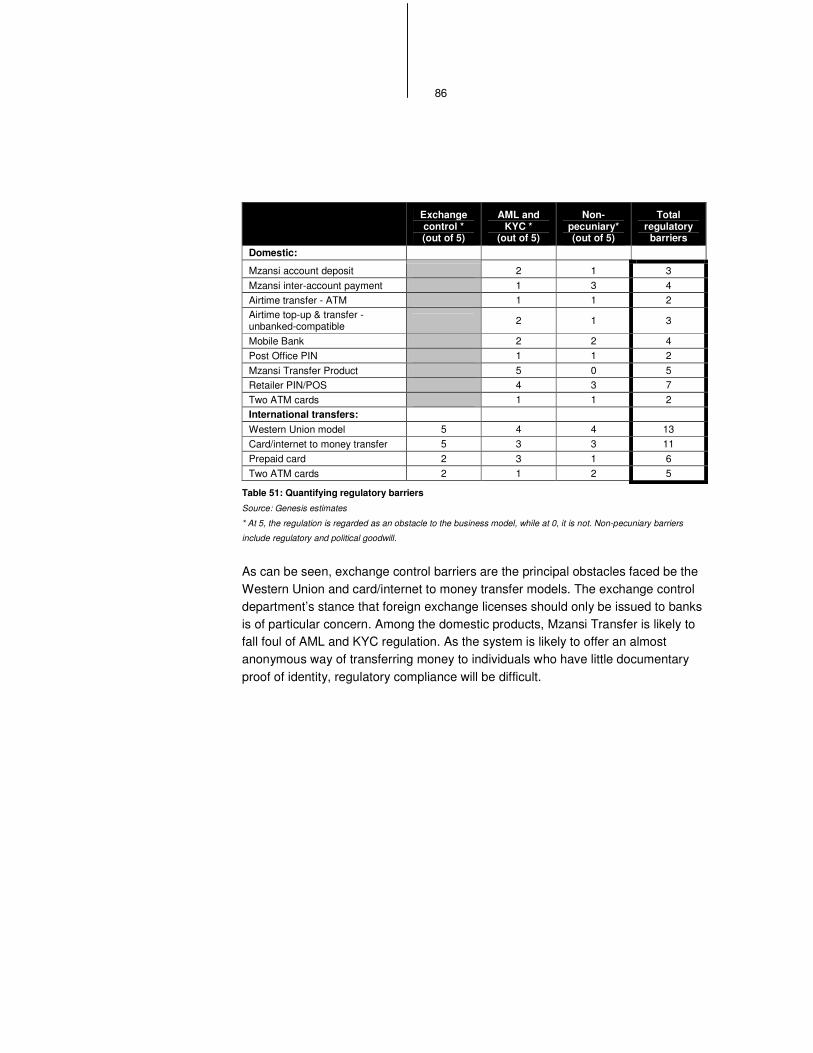
86
Exchange control * (out of 5)
AML and KYC *
(out of 5)
Non-pecuniary* (out of 5)
Total regulatory
barriers Domestic:
Mzansi account deposit 2 1 3 Mzansi inter-account payment 1 3 4 Airtime transfer - ATM 1 1 2 Airtime top-up & transfer - unbanked-compatible 2 1 3
Mobile Bank 2 2 4 Post Office PIN 1 1 2 Mzansi Transfer Product 5 0 5 Retailer PIN/POS 4 3 7 Two ATM cards 1 1 2 International transfers: Western Union model 5 4 4 13 Card/internet to money transfer 5 3 3 11 Prepaid card 2 3 1 6 Two ATM cards 2 1 2 5
Table 51: Quantifying regulatory barriers
Source: Genesis estimates
* At 5, the regulation is regarded as an obstacle to the business model, while at 0, it is not. Non-pecuniary barriers
include regulatory and political goodwill.
As can be seen, exchange control barriers are the principal obstacles faced be the Western Union and card/internet to money transfer models. The exchange control department’s stance that foreign exchange licenses should only be issued to banks is of particular concern. Among the domestic products, Mzansi Transfer is likely to fall foul of AML and KYC regulation. As the system is likely to offer an almost anonymous way of transferring money to individuals who have little documentary proof of identity, regulatory compliance will be difficult.
87
&� �����������
�������������
The SADC region is characterised by a long-standing pattern of economic migration, with one of the principal destinations of migrants over more than a century being South Africa. As a result of this sustained history of migration, the region also experiences large cross-border remittance flows.
&��� �����������������������������
We focused only on flows between members of SADC, and found strong grounds for believing that the bulk of flows are from South Africa, with the recipient countries benefiting, on an annual basis, as follows:
• Botswana: R133m • Lesotho: R1 676m • Malawi: R57m • Mozambique: R2 241m • Swaziland: R432m • Other SADC: R1 532m • Total flows from South Africa to the rest of SADC91: R6 072m annually
Due to insufficient data, remittance flows between other SADC countries (with the exception of Botswana) could not be estimated. In addition, we did not attempt to estimate the size of remittance flows into SADC from the rest of the world
As regards the domestic remittance market within South Africa, high levels of rural-urban migration, sustained over a number of generations, and coupled with the prevalence of migrant labour patterns, have created a substantial demand for remittance services. We estimated that R12bn annually is remitted domestically in South Africa.
The sheer volume of remittance flows should make this an attractive market for financial services providers. However, less than half of remittance money flows via formal channels:
• In the domestic market, only 47.5% is carried by formal financial service providers
91 Excludes Zimbabwe
88
• In the international market, only 41.9% is carried by formal financial service providers
• Only 5% of international flows are subject to South African exchange control scrutiny (excluding money sent via the Post Office)
There would be a number of benefits associated with increased use of formal remittance channels. Financial institutions would benefit from the increased transaction flow. From the point of view of regulators and criminal justice bodies, the use of formal channels would make monitoring fraud, money laundering and other financial crimes much easier. Formalisation would also make it easier to quantify the size of remittance flows, and thus highlight their importance.
&��� ���������������������������
The rapid pace of technological development has made a number of new remittance channels feasible. We examined the following channels (either newly introduced or merely under discussion) in more depth:
• Low cost account deposit: the increased prevalence of low income “Mzansi” accounts has made “remitting” via a deposit into an Mzansi account a possibility
• Mzansi transfer: a new money transfer system, operating from Mzansi partner banks but not requiring a bank account, is under discussion. As a result of the extent of the partner banks retail networks this could achieve wide distribution
• Inter-account payment: at present, it is not possibly to use Mzansi accounts to effect inter-account payments. However, we examined the potential of this channel for the remittance market, if customers become more familiar with banking products
• Retailer PIN/POS: we considered the possibility of a remittance system operating off the distribution network of ordinary retailers, and not requiring access to a bank account
• Mobile Bank: with a new mobile phone banking model under discussion between major South African banks and service providers, we considered the possibility of using this initiative for remittances
• Airtime transfer – ATM: cell phone airtime, transferred to another individual via an ATM interface, was considered as a form of remittance
• Two ATM cards: it is already possible to run two ATM cards off a single bank account in many cases. We considered the potential for an adaptation of this product for the remittance market
89
• Card/internet to money transfer: some money transfer agencies have websites which allow money to be sent by credit card holders via the money transfer agent’s physical infrastructure
• Prepaid card: money could be remitted by loading the desired value onto a prepaid card with ATM and POS functionality
• Airtime top-up & transfer - unbanked-compatible: once airtime has been loaded onto a cell phone, it can then be sent to another cell phone. This channel is available to unbanked individuals
• Western Union model: the Western Union money transfer agent model was considered
• Post Office PIN: the Post Office has recently updated its remittance product offering by introducing the PIN product
The report found that the most attractive products/channels were the Western Union and Mzansi Transfer product, followed by the Post Office and Retailer PIN model and prepaid card. The ability of market participants/new entrants to offer these products is however constrained by existing regulations.
&� � �� �����������������
The successful formalisation of the remittance market in Southern Africa depends on changes to a number of regulations, in particular, exchange control regulations, AML regulations, and the interplay between these two sets of regulations and the immigration regime.
Exchange Control: although the monetary limits for remittance-type transfers – R30 000 per annum – would seem sufficient for the average remitter, the system itself excludes many remitters. Only authorised dealers can trade in foreign exchange, and are required by the Exchange Control Department to report all transactions, irrespective of their size, via a costly reporting system. Only legal residents or temporary residents with a valid work permit can buy foreign exchange. The effect of exchange control is therefore to exclude all migrants without valid South African immigration permits from access to regulated remittance channels. Moreover, those remitters who do have legal status are forced to remit via a costly transaction through an authorised dealer. The effect of this has historically been to price international transfers beyond the reach of the poor. The result is that 95% of remittances flow beyond the reach of exchange controls (seeing that the Post Office is not subject to exchange control regulations). The absence of money transfer agencies in the market has resulted in a large-scale exclusion of the unbanked from the formal remittance market.
90
The principal purpose of exchange control is to protect the country’s foreign exchange reserves, in order to prevent macroeconomic instability. However, it seems far from certain that the remittance market threatens the balance of payments, and is thus not an appropriate target for the exchange control authorities. Our calculations suggest that remittances comprise approximately 1.5% of total current and financial account outflows, and are thus not substantial enough to pose a threat to foreign exchange reserves.
In contrast, remittance flows comprise a very large proportion of total aid flows for many countries in SADC. Remittances as a proportion of total aid flows are as follows:
• Botswana: 65.4% • Lesotho: 348.7% • Malawi: 2.4% • Mozambique: 17.8% • Swaziland: 272.0%
In South Africa, domestic remittances comprise 34.4% of total welfare payments. Remittances therefore play an important role in poverty alleviation in many countries in the region.
AML regulation: the manner in which the FATF AML recommendations have been implemented in South Africa also presents obstacles for remitters. The CDD requirements of the Financial Intelligence Centre Act and its regulations, particularly the requirement to verify the residential address of the client, make it very difficult for low income households who do not have access to the necessary documentation (at least one third of the adult population in South Africa) to use formal financial services. To facilitate access to banking, the government has issued Exemption 17 to the FICA regulations which dispenses with the requirement to record and verify residential address, but still requires the presentation of a South African national identity document (which is issued to citizens and permanent residents only). A passport is not sufficient identification under Exemption 17. Persons who are both poor, and only have a legal work permit or who are illegal immigrants, therefore remain excluded from access to regulated financial services. Moreover, Exemption 17 only facilitates domestic remittances and remittances within the CMA.
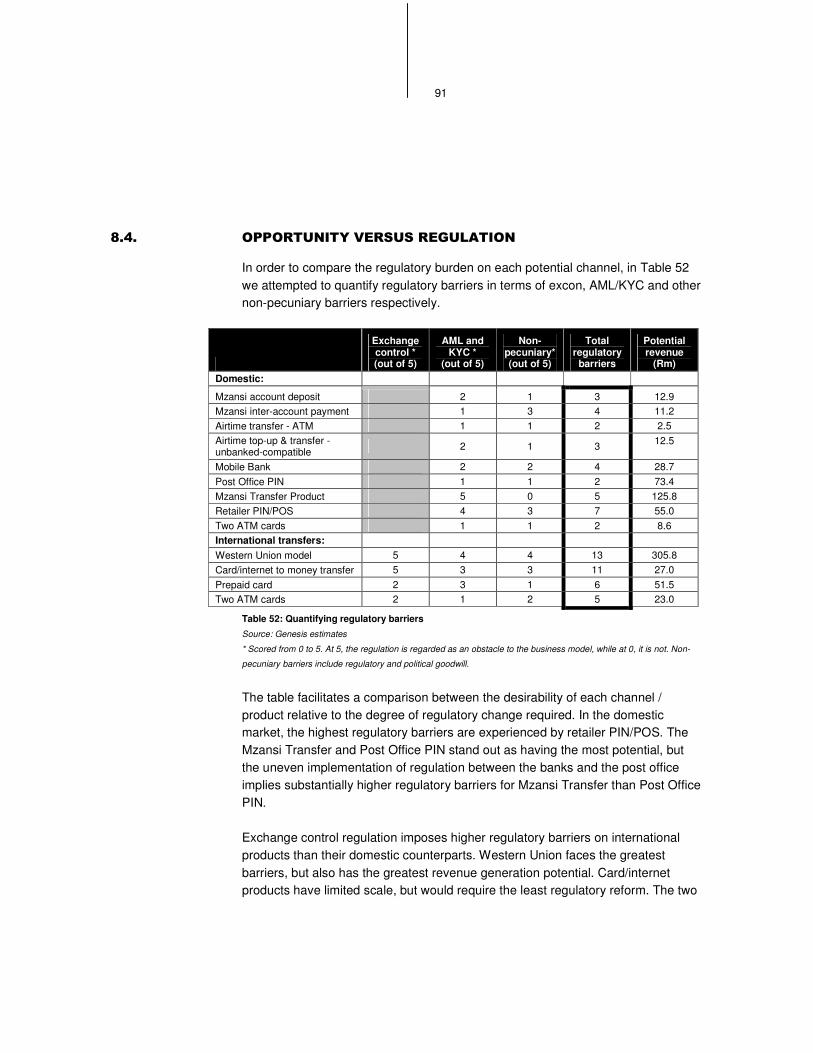
91
&�!� �������������������� �������
In order to compare the regulatory burden on each potential channel, in Table 52 we attempted to quantify regulatory barriers in terms of excon, AML/KYC and other non-pecuniary barriers respectively.
Exchange control * (out of 5)
AML and KYC *
(out of 5)
Non-pecuniary* (out of 5)
Total regulatory
barriers
Potential revenue
(Rm) Domestic:
Mzansi account deposit 2 1 3 12.9 Mzansi inter-account payment 1 3 4 11.2 Airtime transfer - ATM 1 1 2 2.5 Airtime top-up & transfer - unbanked-compatible 2 1 3 12.5
Mobile Bank 2 2 4 28.7 Post Office PIN 1 1 2 73.4 Mzansi Transfer Product 5 0 5 125.8 Retailer PIN/POS 4 3 7 55.0 Two ATM cards 1 1 2 8.6 International transfers: Western Union model 5 4 4 13 305.8 Card/internet to money transfer 5 3 3 11 27.0 Prepaid card 2 3 1 6 51.5 Two ATM cards 2 1 2 5 23.0
Table 52: Quantifying regulatory barriers
Source: Genesis estimates
* Scored from 0 to 5. At 5, the regulation is regarded as an obstacle to the business model, while at 0, it is not. Non-
pecuniary barriers include regulatory and political goodwill.
The table facilitates a comparison between the desirability of each channel / product relative to the degree of regulatory change required. In the domestic market, the highest regulatory barriers are experienced by retailer PIN/POS. The Mzansi Transfer and Post Office PIN stand out as having the most potential, but the uneven implementation of regulation between the banks and the post office implies substantially higher regulatory barriers for Mzansi Transfer than Post Office PIN.
Exchange control regulation imposes higher regulatory barriers on international products than their domestic counterparts. Western Union faces the greatest barriers, but also has the greatest revenue generation potential. Card/internet products have limited scale, but would require the least regulatory reform. The two
92
ATM card and prepaid card models both offer an attractive combination of low initial investment, low regulatory barriers and high revenues in the international market.
In both the domestic and international markets, the product with the highest potential revenue also faces the highest regulatory hurdles (in other words, Mzansi Transfer and Western Union respectively), suggesting that regulatory changes are necessary before the remittance market can operate efficiently.
&�"� �������������������
Any study of remittances in Southern Africa must contend with the paucity of data on this market. The high level of informal remittances in the region means that formal estimates are often not particularly good indications of actual levels of activity. This leads to our first recommendation:
Recommendation 1: the collection of better data on remittance flows in SADC must be prioritised by regional governments.
Better data would highlight the importance of these remittances flows, and their potential to greatly support, and in some cases dwarf, aid flows. The counter-cyclical nature of remittance flows, and their importance in supporting income among impoverished households, could also be explored in greater detail.
Unfortunately, the relative lack of data entails that any estimate of the size of the SADC remittance market will be approximate at best. We tried to err on the side of caution in our estimation procedure. Even so, the market size estimates, of R6bn annually in the cross-border market and R12bn annually in the domestic market, of which slightly more than half travels via informal channels, suggests that a substantial market opportunity exists to formalise these flows. This was born out by our modelling exercise, and leads us to the next recommendation.
Recommendation 2: the informal remittance market represents a market opportunity for financial services providers, and several new products and channels have potential.
However, some of the emerging remittance channels modelled in the report still face substantial regulatory obstacles (most notably, the Western Union model). It is extra-ordinary that business such as Western Union that are commonplace in most developed and developing markets are unable to operate in South Africa due to the level of regulation.
93
Where regulation does not provide an absolute obstacle to remitting, it often increases the cost of remitting, and thus effectively excludes poorer individuals from the market.
An example of this kind of constraint is provided by the SARB’s exchange control reporting system. In order to report data to SARB requirements, an investment must currently be made in a reporting system. This increases the cost of establishing a remittance business, and thus is likely to increase the cost of remitting. Importantly, all transactions, regardless of size, must be reported on the system. This requirement fails to meet the financial needs of the poor, who are more likely to be extremely price sensitive and are likely to remit immaterially small amounts of money (in the region of R300). Therefore we suggest:
Recommendation 3: remove exchange control reporting requirements on transactions below a R5 000 threshold.
Furthermore, in order to remit money cross-border, a financial services provider must hold an authorised dealer license. As only banks are allowed to hold such licenses, the effect is to stifle competition in the remittance market place. In the bureaux de change market, this issue has been dealt with by the introduction of a limited authorised dealer license for bureaux de change. We suggest that this approach be followed in the remittance market as well.
Recommendation 4: introduce a limited authorised dealer license for the remittance market
The Mzansi account represents substantial progress towards realising the goal of financial services participation for the poor in South Africa. However, the legislation governing the account (FICA exemption 17) neglects its potential role in the remittance market, by explicitly excluding cross-border transfers. We therefore recommend that:
Recommendation 5: extend FICA exemption 17 to SADC
One of the thorniest issues in the SADC remittance market is the question of whether to aid remittances by undocumented migrants, and if so, how. Politically, the question of immigration by unskilled workers to South Africa is highly charged, as the unskilled labour market exhibits extremely high levels of unemployment. However, the remittances sent by these migrants to impoverished communities across the border have an extremely important role to play in supporting development.
94
We therefore suggest that an incremental change to the situation should be experimented with. In essence, we propose that the financial services sector no longer be required to police the immigration laws, by requiring proof of legal residence from potential customers. Instead, as per the approach followed in the USA, client information gathered by banks should not be shared with the immigration authorities, and we suggest that:
Recommendation 6: financial service providers should be able to facilitate remittances on presentation of a passport alone
As shown in Table 46, most of the emerging channels discussed in this report would require at least some consumer education. The evidence suggests that education remains an issue on current products as well. For example, in the domestic remittance market, the use of inter-account transfers in preference to more expensive cash deposits as a remittance method was not as prevalent as could be desired. The importance of ongoing financial education initiatives, particularly as regards cost, should therefore not be neglected.
Recommendation 7: support financial education initiatives.
Ultimately, regulation, education and data-collection should encourage progress towards a win-win solution for the remittances market: better products for remitters, improved income support for impoverished remittance-receiving communities, more profits for financial services providers, more formalisation of financial flows (and thus a more transparent, regulated market), and more funds available to the financial system to provide liquidity to lenders. The continuing neglect of the SADC remittance market, by data collection agencies, regulators and financial services providers, excludes impoverished remitters and their families from realising the benefits of formalisation.
95
������ ������
Adams, Richard H. and Page, John, December 2003. International Migration, Remittances and Poverty in Developing Countries. World Bank Policy Research Working Paper 3179.
Amuedo-Dorantes, Catalina, and Pozo, Susan. On the Use of Differing Money Transmission Methods by Mexican Immigrants. centrA: Fundacion Centro de Estudios Andaluces. Serie Economia E2004/06
Bair, Sheila C. Improving Access to the U.S. Banking System among recent Latin American Immigrants. The Multilateral Investment Fund.
Buch, Claudia, Kuckulenz, Anja and Le Manchec, Marie-Helene, June 2002. Worker Remittances and Capital Flows. Kiel Working Paper No. 1130. M.
Buencamino, Leonides and Gorbunov, Sergei, November 2002.Informal Money Transfer Systems: Opportunities and Challenges for Development Finance. DESA Discussion Paper No. 26.
Cobbe, Jim, Florida State University, September 2004. Lesotho: Will the Enclave Empty? http://www.migrationinformation.com/Profiles/display.cfm?ID=248
Cordova, Ernesto Lopez, 11 March 2004. Globalisation, Migration and Development: The Role of Mexican Migrant Remittances. First draft.
Crush, Jonathan. 1996. Contract Migration to South Africa: Past, Present and Future. Southern African Migration Project. Policy and Law Online News. http://www.polity.org.za/html/govdocs/green_papers/migration/crush.html
Crush, Jonathan, Ulicki, Theresa, Tseane, Teke and Jansen van Vuuren, Elisabeth, 1999. Undermining Labour: Migrancy and Sub-Contracting in the South African Gold Mining Industry. South African Migration Project.
Crush, Jonathan (ed) with Mather, Charles, Mathebula, Freddie, Lincoln, David, Maririke, Claude and Ulicki, Theresa, 2000. Borderline Farming: Foreign Migrants in South African Commercial Agriculture. South African Migration Project.
Crush, Jonathan, 2001. Making Up the Numbers: Measuring “Illegal Immigration” to South Africa. Southern African Migration Project Migration Policy Brief No. 3.
96
Crush, Jonathan, Southern African Migration Project (SAMP), June 2003. South Africa: New Nation, New Migration Policy? http://www.migrationinformation.com/Profiles/display.cfm?ID=131
El-Qorchi, Mohammed, Samuel M. Maimbo, and John F. Wilson. 2002. Hawala: How Does This Informal Funds Transfer System Work, and Should It Be Regulated? Finance and Development 39(4), December 2002, International Monetary Fund, Washington, D.C. http://www.imf.org/external/pubs/ft/fandd/2002/12/elqorchi.htm
Falkena, Hans, Davel, Gabriel, Hawkins, Penelope, Llewellyn, David, Luus, Christo, Masilela, Elias, Parr, Geoff, Pienaar, Johnny and Shaw, Henry. April 2004. Competition in South African Banking. Task Group for the National Treasury and the South African Reserve Bank.
Genesis Analytics, April 2003. African Families, African Money: Bridging the Money Transfer Divide.
Handlin, Elizabeth, Krontoft, Margrethe, and Testa, William, March 2002. Remittances and the unbanked. Special Issue Chicago Fed Letter, The Federal Reserve Bank of Chicago number 175a.
Handmaker, Jeff and Schneider, James, August 2002. The Status ‘Regularisation’ Programme for Former Mozambican Refugees in South Africa. Working Paper for the Research Unit on Law and Administration (RULA) in the School of Law, University of the Witwatersrand, South Africa.
Harris, Bronwyn in Hook, D. & Eagle, G. (eds), 2002. Xenophobia: A new pathology for a new South Africa? Psychopathology and Social Prejudice, pp. 169-184, Cape Town: University of Cape Town Press.
Hawkins, Penelope and Bertoldi, Andreas. The Impact of the Dedicated Banks Bill on access to financial services. Draft report as at March 2005. Commissioned by the FinMark Trust.
Isern, Jennifer, Deshpande, Rani and van Doorn, Judith. Crafting a Money Transfers Strategy: Guidance for Pro-Poor Financial Service Providers. Occasional Paper No. 10, March 2005, The Consultative Group to Assist the Poor. Available from http://www.cgap.org/docs/OccasionalPaper_10.pdf.
97
Jost, Patrick M. and Sandhu, Harjit Singh, January 2000. The hawala alternative remittance system and its role in money laundering. Interpol General Secretariat, Lyon. http://www.interpol.int/Public/FinancialCrime/MoneyLaundering/Hawala/default.asp
Kannan, KP and Hari, KS, March 2002. Kerala’s Gulf Connection: Emigration, Remittances and their Macroeconomic Impact, 1972-2000.
Lefko-Everett, Kate, Southern African Migration Project, September 2004. Botswana's Changing Migration Patterns. http://www.migrationinformation.com/Profiles/display.cfm?ID=246
Maphosa, Frances, July 2004. The Impact of Remittances from Zimbabweans working in South Africa on Rural Livelihoods in the Southern Districts of Zimbabwe. A summary of a report submitted to The Council for the Development of Social Science Research in Africa (CODESRIA)..
O'Neil, Kevin, Migration Policy Institute, April 1, 2003.Consular ID Cards: Mexico and Beyond. http://www.chicagofed.org/cedric/cedric_files/ced/print1.cfm
Orozco, Manuel, October 10, 2002. Worker remittances: the human face of globalization. Inter-American Dialogue Working Paper commissioned by the Multilateral Investment Fund of the Inter-American Development Bank.
Orozco, Manuel, March 26, 2003. Costs, economic identity and banking the unbanked. Inter-American Dialogue, Washington, DC. Testimony presented before the Congressional Hispanic Caucus.
Orozco, Manuel, October 1st 2003. Worker Remittances: Issues and Best Practices. Testimony presented to the U.S. House Committee on Financial Services hearing entitled “Remittances: Reducing Costs, Increasing Competition, and Broadening Access to the Market”. Inter-American Dialogue.
Oucho, John, Campbell, Eugene and Mukamaambo, Elizabeth. Botswana: Migration Perspectives and Prospects. Southern African Migration Project, 2000.
Porteous, David, 31 October 2004. Making financial markets work for the poor. Commissioned by the FinMark Trust.
Rogerson, CM, 1999. Building Skills: Cross-border Migrants and the South African Construction Industry. South African Migration Project.
98
Sander, Cerstin, and Maimbo, Samuel Munzele, November 2003. Migrant Labor Remittances in Africa: Reducing Obstacles to Developmental Contributions. Africa Region Working Paper Series No. 64.
Simelane, Hamilton Sipho and Crush, Jonathan. Swaziland Moves: Perceptions and Patterns of Modern Migration. Southern African Migration Project, 2004.
South African Reserve Bank. Exchange Control Manual. Updated August 2002.
Suro, Roberto, Bendixen, Sergio, Lowell, B.Lindsay and Benavides, Dulce C., 2003. Billions in motion: Latino Immigrants, Remittances and Banking. Inter-American Development Bank (conducted by the Pew Hispanic Center).
99
���������������,��������������������������
The FATF Recommendations were initially developed in 1990, and revised for the first time in 1996 to take into account changes in money laundering trends and to anticipate potential future threats. In October 2001, eight special recommendations on terrorist financing were added, and then later supplemented by a ninth special recommendation. In 2003, the FATF has completed a review and update of the 40 Recommendations. Below we summarise and discuss the key facets of the recommendations from the point of view of the remittance market. We also discuss the recommendations of the Basel Committee on Banking Supervision, and the provisions of FICA.
������������"�� ���������������������� ���)-��.*�
“Financial institutions should not keep anonymous accounts or accounts in obviously fictitious names. Financial institutions should undertake customer due diligence measures, including identifying and verifying the identity of their customers, when:
• establishing business relations; • carrying out occasional transactions: (i) above the applicable
designated threshold; or (ii) that are wire transfers in the circumstances covered by the Interpretative Note to Special Recommendation VII;
• there is a suspicion of money laundering or terrorist financing; or • the financial institution has doubts about the veracity or adequacy of
previously obtained customer identification data.”
Recommendation 5 essentially addresses know your customer (“KYC”) requirements from a money laundering perspective. Customer identity must be verified “using reliable, independent source documents, data or information,” “before or during the course of establishing a business relationship or conducting transactions for occasional customers”. The recommended threshold for occasional customers (including wire transfers) is US$/�15 000, which equates to between R118 350 (R/�7.89) and R93 600 (R/US$6.24). This is substantially less than the typical southern African remitter would be able to transmit, and therefore suggests that, at least for occasional and/or wire transfer remitters, CDD requirements may not be necessary.
Financial institutions may apply some discretion in applying CDD “on a risk sensitive basis depending on the type of customer, business relationship or
100
transaction.” An example of a transaction which would be eligible for simplified or reduced CDD would be “life insurance policies where the annual premium is no more than USD/�1 000 or a single premium of no more than USD/�2 500.” This equates to an annual premium of approximately R6 240 to R7 890 or a single premium of R15 600 to R19 725. As shown in Figure 3, the bulk of remittances are below the R10 000 mark.
������������$����������������� �
“Financial institutions should, in relation to cross-border correspondent banking and other similar relationships, in addition to performing normal due diligence measures:
a) Gather sufficient information about a respondent institution to understand fully the nature of the respondent’s business and to determine from publicly available information the reputation of the institution and the quality of supervision, including whether it has been subject to a money laundering or terrorist financing investigation or regulatory action.
b) Assess the respondent institution’s anti-money laundering and terrorist financing controls.
e) With respect to “payable-through accounts”, be satisfied that the respondent bank has verified the identity of and performed on-going due diligence on the customers having direct access to accounts of the correspondent and that it is able to provide relevant customer identification data upon request to the correspondent bank.”
A potential international remittance channel would involve the use of correspondent banks in destination countries, to provide distribution infrastructure and brand recognition. However, this kind of correspondent relationship is complicated in SADC by the fact that South Africa is the region’s only FATF-compliant country. This increases the risk to a South African bank of entering into a cross-border correspondent relationship, given that FATF places considerable onus on the bank to ensure that its correspondent is not engaged in money laundering activities.
������������'��������������������������
“Countries may permit financial institutions to rely on intermediaries or other third parties to perform elements (a) – (c) of the CDD process or to introduce business, provided that the criteria set out below are met. Where such reliance is permitted, the ultimate responsibility for customer
101
identification and verification remains with the financial institution relying on the third party.”
In order to use third parties in this manner, companies must be able to obtain the data used to perform CDD (for example, copies of identification documents), on request without delay, and the third party must have measures in place to comply with CDD requirements.
Similarly to recommendation 7, recommendation 9 is likely to inhibit the willingness of financial institutions to solve remittance distribution problems by forming relationships with intermediaries. This recommendation does not apply to outsourcing or agency relationships.
�������������������������������/�����������
“Financial institutions should give special attention to business relationships and transactions with persons, including companies and financial institutions, from countries which do not or insufficiently apply the FATF Recommendations.”
South Africa is the only FATF-qualifying country in SADC. The ability of South African banks to form remitting relationships with other SADC-based banks will therefore be limited by Recommendation 21.
������������� ������������������ �
“Countries should ensure that financial institutions are subject to adequate regulation and supervision and are effectively implementing the FATF Recommendations. Competent authorities should take the necessary legal or regulatory measures to prevent criminals or their associates from holding or being the beneficial owner of a significant or controlling interest or holding a management function in a financial institution.
For financial institutions subject to the Core Principles, the regulatory and supervisory measures that apply for prudential purposes and which are also relevant to money laundering, should apply in a similar manner for anti-money laundering and terrorist financing purposes.
Other financial institutions should be licensed or registered and appropriately regulated, and subject to supervision or oversight for anti-money laundering purposes, having regard to the risk of money laundering or terrorist financing in that sector. At a minimum, businesses providing a
102
service of money or value transfer, or of money or currency changing should be licensed or registered, and subject to effective systems for monitoring and ensuring compliance with national requirements to combat money laundering and terrorist financing.”
This recommendation effectively removes the possibility of running an unregulated remittance sector. The minimum requirement for the sector is therefore some sort of licensing regime, combined with an effective monitoring and compliance system. The additional cost of such systems and licenses is then presumably passed on to consumers.
�������������������#����������������������
“Each country should take measures to ensure that persons or legal entities, including agents, that provide a service for the transmission of money or value, including transmission through an informal money or value transfer system or network, should be licensed or registered and subject to all the FATF Recommendations that apply to banks and non-bank financial institutions. Each country should ensure that persons or legal entities that carry out this service illegally are subject to administrative, civil or criminal sanctions.”
Implemented stringently, this recommendation would impose a substantial hindrance to innovation in the remittance market. In addition, the recommendation is strongly anti-poor, as it requires the imposition of licensing and regulation costs on informal providers, which is likely to increase the cost of what are typically the cheapest remittance channels available.
�������������������$��� �������������
“Countries should take measures to require financial institutions, including money remitters, to include accurate and meaningful originator information (name, address and account number) on funds transfers and related messages that are sent, and the information should remain with the transfer or related message through the payment chain.
Countries should take measures to ensure that financial institutions, including money remitters, conduct enhanced scrutiny of and monitor for suspicious activity funds transfers which do not contain complete originator information (name, address and account number).”
103
Special recommendation 7 is consistent with the body of anti-money laundering regulation in general, but is troubling to the extent that it does not consider the potential exclusion of the poor from wire transfers. Given that access to bank accounts is in itself problematic (and formal addresses are not always available), the recommendation potentially adds another layer of exclusion to individuals who are already substantially excluded from access to financial services.
�������������������'��������������
“Countries should have measures in place to detect the physical cross-border transportation of currency and bearer negotiable instruments, including a declaration system or other disclosure obligation.
Countries should ensure that their competent authorities have the legal authority to stop or restrain currency or bearer negotiable instruments that are suspected to be related to terrorist financing or money laundering, or that are falsely declared or disclosed.”
In the SADC context, special recommendation 9 would most obviously have an impact on remittances carried cross-border via friends and/or taxi drivers. However, the threshold suggested by FATF for monitoring transactions is for amounts larger than USD/�15 000. Effectively this exempts the vast majority of SADC remittances from the provisions of special recommendation 9.
��������������������� ������������
While the FATF recommendations address KYC from a money laundering perspective, the Basel Committee on Banking Supervision has dealt with the issue from a broader banking perspective (in particular, in a paper entitled “Customer due diligence for banks”, which was recognised as the agreed standard for CDD by the 2002 International Conference of Banking Supervisors in Cape Town).
We will only discuss those Basel recommendations which represent a departure from or addition to the FAFT 40 Recommendations, as follows:
• Banks should develop customer acceptance policies and procedures, with factors such as a customer’s background, country of origin and so forth taken into account when considering their risk profile. More extensive due diligence should be conducted for higher risk customers.
104
• Customer identification procedures should ideally be based on those documents which it is most difficult to obtain illegally or counterfeit. CDD on natural persons should include: • legal name and any other names used (such as maiden name) • correct permanent address (verified against a utility bill, tax assessment,
bank statement or a letter from a public authority) • telephone number, fax number, and e-mail address • date and place of birth (verified against an ID, birth certificate or passport,
which has been certified by an authorised person such as an embassy official)
• nationality • occupation, public position held and/or name of employer • an official personal identification number or other unique identifier
contained in an unexpired official document (e.g. passport, identification card, residence permit, social security records, driving licence), that ideally should include a photograph of the bearer
• type of account and nature of the banking relationship • signature
For once-off or occasional transactions that do not exceed a threshold amount, it may be enough to record only the name and address of the customer.
������ ��������
FICA was formulated as an attempt to put into practice the anti-money laundering provisions embodied in the 1990 version of the FATF 40 recommendations. It does not however include the 8 special recommendations on terrorist financing released by FICA in October 2001. Below we discuss the elements of FICA that are of bearing on the remittance market.
ESTABLISHMENT AND VERIFICATION OF IDENTITY
2 Introductory
(1) No accountable institution may knowingly establish or maintain a business relationship or conduct a single transaction with a client who is entering into that business relationship or single transaction under a false name.
(2) When an accountable institution in terms of the Act must establish and verify the identity of a natural or legal person or a trust, the institution must establish and verify identity in accordance with regulations 2 to 18.
105
The requirement to identify the parties to a transaction is one of the central goals of FICA. For the remittance market, the identification requirements for natural persons, which differ between South African citizens and foreign nationals, are of key importance.
3 Information concerning South African citizens and residents
(1) An accountable institution must obtain from, or in respect of, a natural person who is a citizen of, or resident in, the Republic, that person's-
(a) full names;
(b) date of birth;
(c) identity number;
(d) income tax registration number, if such a number has been issued to that person; and
(e) residential address.
4 Verification of information concerning South African citizens and residents
(1) An accountable institution must verify the full names, date of birth and identity number of a natural person referred to in regulation 3 (1) (a), (b) or (c), or 3 (2) (a), (b) or (c) by comparing these particulars with-
(a) (i) an identification document of that person; or
(ii) in the case where that person is, for a reason that is acceptable to the institution, unable to produce an identification document, another document issued to that person, which, taking into account any guidance notes concerning the verification of identities which may apply to that institution, is acceptable to the institution and bears-
(aa) a photograph of that person;
(bb) that person's full names or initials and surname;
(cc) that person's date of birth; and
(dd) that person's identity number; and
(b) any of these particulars with information which is obtained from any other independent source, if it is believed to be reasonably necessary taking into account any guidance notes concerning the verification of identities which may apply to that institution.
106
Although possession of suitable forms of identification is still not universal among South African citizens, the process of obtaining such documentation is fairly accessible. FICA identification requirements are therefore not a hindrance to South African citizens wishing to gain access to the domestic remittance market.
5 Information concerning foreign nationals
(1) An accountable institution must obtain from, or in respect of, a natural person who is a citizen of another country and is not resident in the Republic, that person's-
(a) full names;
(b) date of birth;
(c) nationality;
(d) passport number;
(e) South African income tax registration number, if such a number has been issued to that person; and
(f) residential address.
By requiring the passport number of all foreign nationals, FICA immediately excludes individuals whose residency status is not legal from the South African financial system.
CLIENT PROFILE
21 Information to identify proceeds of unlawful activities or money laundering activities
(1) An accountable institution must, in the circumstances referred to in subregulation (2), obtain the information referred to in subregulation (3) from or in respect of-
(a) a client who has established a business relationship or concludes a single transaction; or
(b) a prospective client seeking to establish a business relationship or conclude a single transaction.
(2) An accountable institution must obtain the information referred to in subregulation (3) whenever it is reasonably necessary, taking into account any guidance notes concerning the verification of identities or the reporting
107
of suspicious and unusual transactions which may apply to that institution, with a view to obtaining additional information-
(a) concerning a business relationship or single transaction which poses a particularly high risk of facilitating money laundering activities; or
(b) to enable the accountable institution to identify the proceeds of unlawful activity or money laundering activities.
(3) The information which an accountable institution must obtain in the circumstances referred to in subregulation (2) must be adequate to reasonably enable the institution to determine whether transactions involving a client referred in subregulation (1) are consistent with the institution's knowledge of that client and that client's business activities and must include particulars concerning-
(a) the source of that client's income; and
(b) the source of the funds which that client expects to use in concluding the single transaction or transactions in the course of the business relationship.
The requirement that a bank must identify the source and legality of an individual’s income further serves to exclude illegal migrants from the banking sector. As illegal immigrants can’t legally work in South Africa, their sources of legal income are few and far between.
REPORTING OF SUSPICIOUS AND UNUSUAL TRANSACTIONS
23 Information to be reported
(2) In respect of the transaction concerning which a report under section 29 is made, the report must contain as much of the following information as is readily available-
(a) the date and time of the transaction, or, in the case of a series of transactions the period over which the transactions were conducted;
(b) the type of funds or property involved;
(c) the amount or the value of the property involved;
(d) the currency in which the transaction was conducted;
(e) the method in which the transaction was conducted;
108
(f) the method in which the funds or property were disposed of;
(g) the amount of the disposition of the funds; and
(h) the currency in which the funds were disposed of;
(i) the purpose of the transaction;
(j) the name of any other institution or person involved in the transaction;
(h) the number of any account at another institution involved in the transaction;
(k) the name and identifying number of the branch or office where the transaction was conducted; and
(l) any remarks, comments or explanations which the person conducting the transaction may have made or given.
(3) In respect of any account which may have been involved in the transaction concerning which a report under section 29 is made, the report must contain as much of the particulars as are readily available, of-
(a) the account number;
(b) the name and identifying number of the branch or office where the account is held;
(c) the type of account;
(d) the name of each account holder;
(e) the date on which the account was opened;
(f) the date on which the account was closed;
(g) if the account was closed, the name of the person who gave the instruction to close it;
(h) the status of the account;
(i) any previous activity in the preceding 180 days which had been considered for reporting in connection with the account, whether the activity was reported or not; and
(j) the report number of any previous reports made in connection with the account.
The report must also contain the identification particulars of the individuals or entities involved in the transaction. As onerous as these reporting requirements
109
may be, it is worth bearing in mind that they still require less data, in some ways, than the South African exchange control reporting system. In particular, the reporting requirements of South African banks end at the South African border under FICA. In terms of the exchange control regulations, the banks must still be able to identify the foreign recipient of funds. This is confirmed by the general exemptions detailed below.
GENERAL EXEMPTIONS
4 Exemption from section 21 and 22 of the Act 38 of 2001
Every accountable institution is exempted from compliance with the provisions of section 21 and 22 (1) (a), 22 (1) (b), 22 (1) (c), 22 (1) (d), 22 (1) (e), 22 (1) (h) and 22 (1) (i) of the Act, in respect of a business relationship or single transaction which is established or concluded with that institution (the second accountable institution) by another accountable institution (the primary accountable institution) acting on behalf of a client of that primary accountable institution, subject to the condition that the primary accountable institution confirms in writing to the satisfaction of the second accountable institution that-
(a) it has established and verified the identity of the client in accordance with section 21 of the Act; or
(b) in terms of its internal rules and the procedures ordinarily applied in the course of establishing business relationships or concluding single transactions the primary accountable institution will have established and verified, in accordance with section 21 of the Act, the identity of every client on whose behalf it will be establishing business relationships or conducting concluding single transactions with the second accountable institution.
5 Exemption from verification obligations under section 21 of the Act
Every accountable institution is exempted from compliance with the provisions of section 21 of the Act which require the verification of the identity of a client of that institution if-
(a) that client is situated in a country where, to the satisfaction of the relevant supervisory body, anti-money laundering regulation and supervision of compliance with such anti-money laundering regulation, which is equivalent to that which applies to the accountable institution is in force;
110
(b) a person or institution in that country, which is subject to the anti-money laundering regulation referred to in paragraph (a) confirms in writing to the satisfaction of the accountable institution that the person or institution has verified the particulars concerning that client which the accountable institution had obtained in accordance with section 21 of the Act; and
(c) the person or institution referred to in paragraph (b) undertakes to forward all documents obtained in the course of verifying such particulars to the accountable institution.
The ability to transfer AML obligations to another institution involved in the transaction considerably lightens the regulatory burden of FICA. The exemption essentially allows banks to avoid duplicating effort. However, in the sub-Saharan African remittances market, it may be of limited use, as South Africa is the only FATF compliant country in the region.
EXEMPTIONS FOR BANKS
15 Exemption from Parts 1 and 2 of Chapter 3 of Act 38 of 2001
Every accountable institution which performs the functions of an accountable institution referred to in items 6, 7, 14 and 16 of Schedule 192 to the Act is exempted, in respect of those functions, from compliance with the provisions of Parts 1 and 2 of Chapter 3 of the Act in respect of every business relationship with a natural person in terms of which an unsecured loan of an amount not exceeding R15 000,00 is made to that person.
17 Exemption from regulations made under Act 38 of 2001
(3) The business relationships and single transactions referred to in paragraph (2), above, are every business relationship or single transaction which-
(a) enables the client to withdraw or transfer or make payments of an amount not exceeding R5 000,00 per day and not exceeding R25 000,00 in a monthly cycle; and
(b) does not enable the client to effect a transfer funds to any destination outside the Republic, except for a transfer as a result
92 In terms of Schedule 1 of the Act, this includes the following types of accountable institutions: “6. A person who carries on the “business of a bank” as defined in the Banks Act, 1990 (Act 94 of 1990). 7. A mutual bank as defined in the Mutual Banks Act, 1993 (Act 124 of 1993). 14. The Postbank referred. to in section 51 of the Postal Services Act, 1998 (Act 124 of 1998). 16. The Ithala Development Finance Corporation Limited.”
111
of a point-of-sale payment or a cash withdrawal in a country in the Rand Common Monetary Area.
(4) This exemption is subject to the conditions that, should a business relationship referred to in paragraph (2), above, entail the holding of an account,
(a) the balance maintained in that account does not exceed R25 000,00 at any time: or
(b) the same person does not simultaneously hold two or more accounts which meet the criteria referred to in paragraph (3) and are similar in nature with the same institution.
(5) No debit from an account, referred to in paragraph (4), may be effected before-
(a) the prescribed steps referred to in section 21 of the Act, read with the Regulations, concerning the establishing and verification of the identity of the client concerned are completed, and
(b) the records pertaining to the establishing and verification of the identity of a client referred to in paragraph (a), which an institution is required to keep in accordance with section 22 (1) (a), 22 (1) (b) , 22 (1) (c), 22 (1) (d), 22 (1) (e) , 22 (1) (h) and 22 (1) (i) of the Act, are obtained,
in the case where-
(i) the balance in an account referred to in paragraph (4)(a) exceeds R25 000,00, or
(ii) a person acquires more than one account referred to in subparagraph 4(b) with the same institution.
Size limits on transactions that are exempted from regulation have two key purposes. Firstly, they are intended to aid access to finance for the poor, and secondly, they are designed to reduce the financial burden of regulation by exempting transactions which are immaterial from the regulatory process. However, the FICA size limits are substantially lower than the type of size limits discussed in the FATF 40 recommendations. This is discussed in depth in section 7.3.
112
������������������������������������ ����� ��
Downloaded from the South African Reserve Bank website (www.reservebank.co.za) on 31 March 2005.
The offices in the Republic of the undermentioned banks are authorised to act, for the purposes of the Exchange Control Regulations, as Authorised Dealers in foreign exchange:
• ABN AMRO Bank N.V. • ABSA Bank Limited • Bank of Baroda • Bank of China Johannesburg Branch • Bank of Taiwan South Africa Branch • Barclays Bank PLC, South Africa Branch • China Construction Bank, Johannesburg Branch • Citibank, N.A., South Africa • Commerzbank Aktiengesellschaft • Credit Agricole Indosuez • Deutsche Bank AG, Johannesburg Branch • FirstRand Bank Limited • Gensec Bank Limited • Habib Overseas Bank Limited • HSBC Bank plc - Johannesburg Branch • HBZ Bank Limited • Investec Bank Limited • JPMorgan Chase Bank ( Johannesburg Branch) • MEEG Bank Limited • Mercantile Bank Limited • Nedbank Limited • Rennies Bank Limited • Société Générale • Standard Chartered Bank - Johannesburg Branch • State Bank of India • The South African Bank of Athens Limited • The Standard Bank of South Africa Limited
The offices in the Republic of the undermentioned institutions are authorised to act, for the purposes of the Exchange Control Regulations, as Authorised Dealers in foreign exchange with limited authority:
113
• Master Currency (Pty) Limited • Nedtravel (Pty) Limited
The offices in the Republic of the undermentioned institutions are authorised to act, for the purposes of the Exchange Control Regulations, as Authorised Dealers in foreign exchange with limited authority to operate Bureaux de Change in South Africa:
• FxAfrica Foreign Exchange (Pty) Ltd • Global Foreign Exchange (Pty) Limited • Imali Express (Pty) Limited • Inter Africa Bureau de Change (Pty) Limited • Tower Bureau de Change (Pty) Limited
114
�������� ���� ��������������������������
The following data and assumptions were employed to derive the estimate of total stock of migrants shown in Table 11.
• Table 7 illustrates the various types of work permits available, and the number of them issued. We assumed that all contract miners, mining sub-contractors and seasonal farm workers originate from SADC, and that two-thirds of all work and other valid permits holders are derived from SADC.
• As per Table 7, total migrants employed by the mining sector were estimated at 120 000, plus another 40 000 migrants working for mining sub-contractors. The mix of nationalities among the sub-contractors is assumed to be the same as among the miners, and is derived from Teba Bank data.
• Work and other valid permits were allocated by country according to the weight of that country’s population in the total population of SADC (excluding South Africa).
• 280 000 refugees from the Mozambican civil war were estimated to remain in South Africa
• The estimate of 30 998 Batswana resident legally in South Africa in Oucho et al, 2000 was used.
• The estimate of the stock of illegal migrants, by country, derived in Table 9 was used.
• The 19 000 farm worker permits were assumed to be issued only to Mozambicans and Basotho.
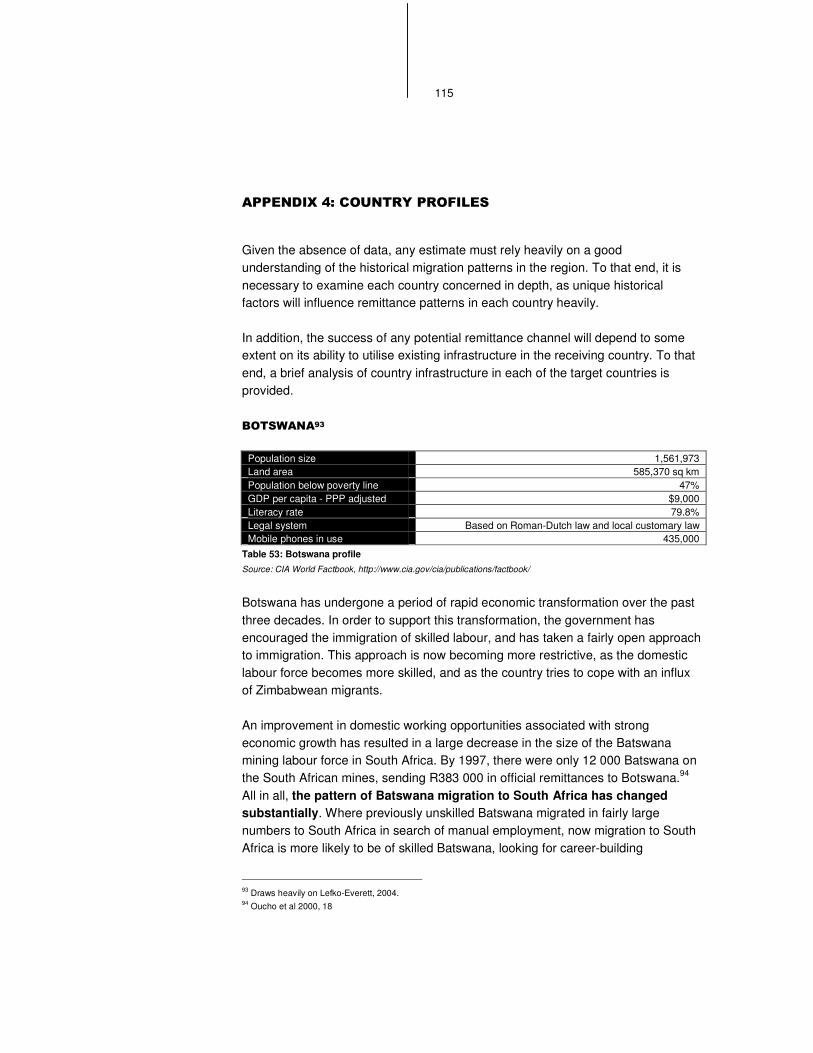
115
��������!�����������������
Given the absence of data, any estimate must rely heavily on a good understanding of the historical migration patterns in the region. To that end, it is necessary to examine each country concerned in depth, as unique historical factors will influence remittance patterns in each country heavily.
In addition, the success of any potential remittance channel will depend to some extent on its ability to utilise existing infrastructure in the receiving country. To that end, a brief analysis of country infrastructure in each of the target countries is provided.
����� ��' �
Population size 1,561,973 Land area 585,370 sq km Population below poverty line 47% GDP per capita - PPP adjusted $9,000 Literacy rate 79.8% Legal system Based on Roman-Dutch law and local customary law Mobile phones in use 435,000
Table 53: Botswana profile Source: CIA World Factbook, http://www.cia.gov/cia/publications/factbook/
Botswana has undergone a period of rapid economic transformation over the past three decades. In order to support this transformation, the government has encouraged the immigration of skilled labour, and has taken a fairly open approach to immigration. This approach is now becoming more restrictive, as the domestic labour force becomes more skilled, and as the country tries to cope with an influx of Zimbabwean migrants.
An improvement in domestic working opportunities associated with strong economic growth has resulted in a large decrease in the size of the Batswana mining labour force in South Africa. By 1997, there were only 12 000 Batswana on the South African mines, sending R383 000 in official remittances to Botswana.94 All in all, the pattern of Batswana migration to South Africa has changed substantially. Where previously unskilled Batswana migrated in fairly large numbers to South Africa in search of manual employment, now migration to South Africa is more likely to be of skilled Batswana, looking for career-building
93 Draws heavily on Lefko-Everett, 2004. 94 Oucho et al 2000, 18
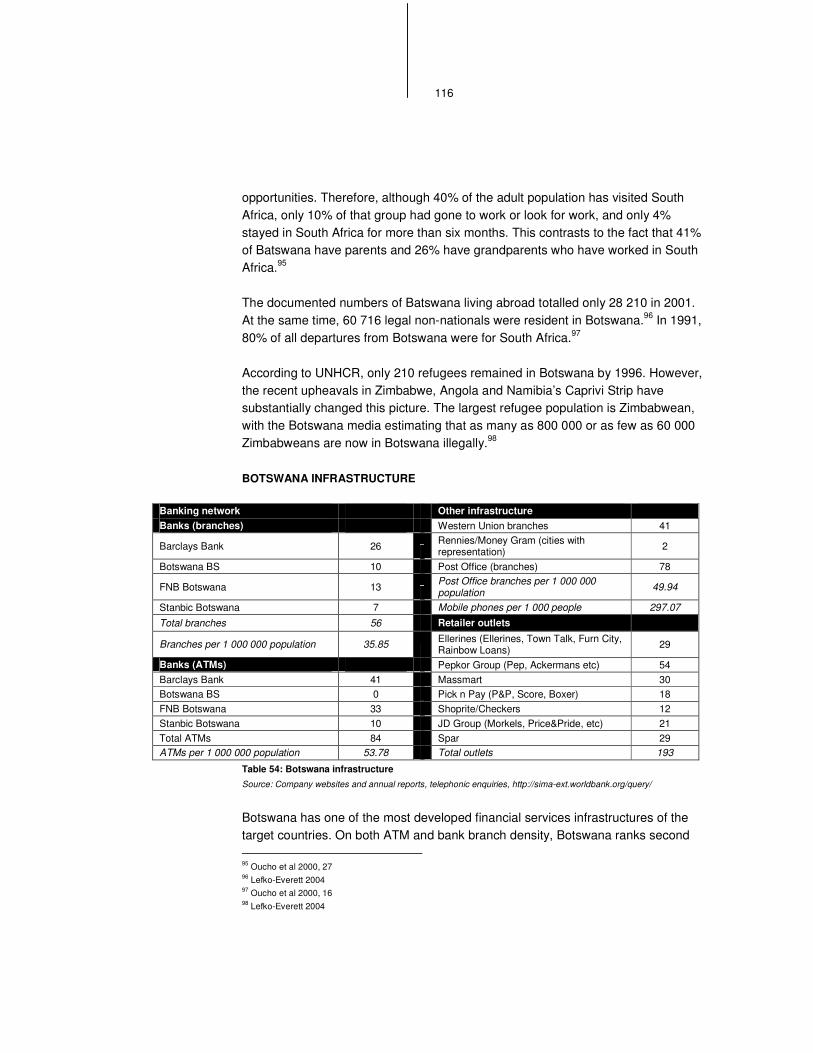
116
opportunities. Therefore, although 40% of the adult population has visited South Africa, only 10% of that group had gone to work or look for work, and only 4% stayed in South Africa for more than six months. This contrasts to the fact that 41% of Batswana have parents and 26% have grandparents who have worked in South Africa.95
The documented numbers of Batswana living abroad totalled only 28 210 in 2001. At the same time, 60 716 legal non-nationals were resident in Botswana.96 In 1991, 80% of all departures from Botswana were for South Africa.97
According to UNHCR, only 210 refugees remained in Botswana by 1996. However, the recent upheavals in Zimbabwe, Angola and Namibia’s Caprivi Strip have substantially changed this picture. The largest refugee population is Zimbabwean, with the Botswana media estimating that as many as 800 000 or as few as 60 000 Zimbabweans are now in Botswana illegally.98
BOTSWANA INFRASTRUCTURE
Banking network Other infrastructure Banks (branches) Western Union branches 41
Barclays Bank 26 Rennies/Money Gram (cities with representation) 2
Botswana BS 10 Post Office (branches) 78
FNB Botswana 13 Post Office branches per 1 000 000 population 49.94
Stanbic Botswana 7 Mobile phones per 1 000 people 297.07
Total branches 56 Retailer outlets
Branches per 1 000 000 population 35.85 Ellerines (Ellerines, Town Talk, Furn City, Rainbow Loans) 29
Banks (ATMs) Pepkor Group (Pep, Ackermans etc) 54 Barclays Bank 41 Massmart 30 Botswana BS 0 Pick n Pay (P&P, Score, Boxer) 18 FNB Botswana 33 Shoprite/Checkers 12 Stanbic Botswana 10 JD Group (Morkels, Price&Pride, etc) 21 Total ATMs 84 Spar 29 ATMs per 1 000 000 population 53.78 Total outlets 193
Table 54: Botswana infrastructure Source: Company websites and annual reports, telephonic enquiries, http://sima-ext.worldbank.org/query/
Botswana has one of the most developed financial services infrastructures of the target countries. On both ATM and bank branch density, Botswana ranks second 95 Oucho et al 2000, 27 96 Lefko-Everett 2004 97 Oucho et al 2000, 16 98 Lefko-Everett 2004
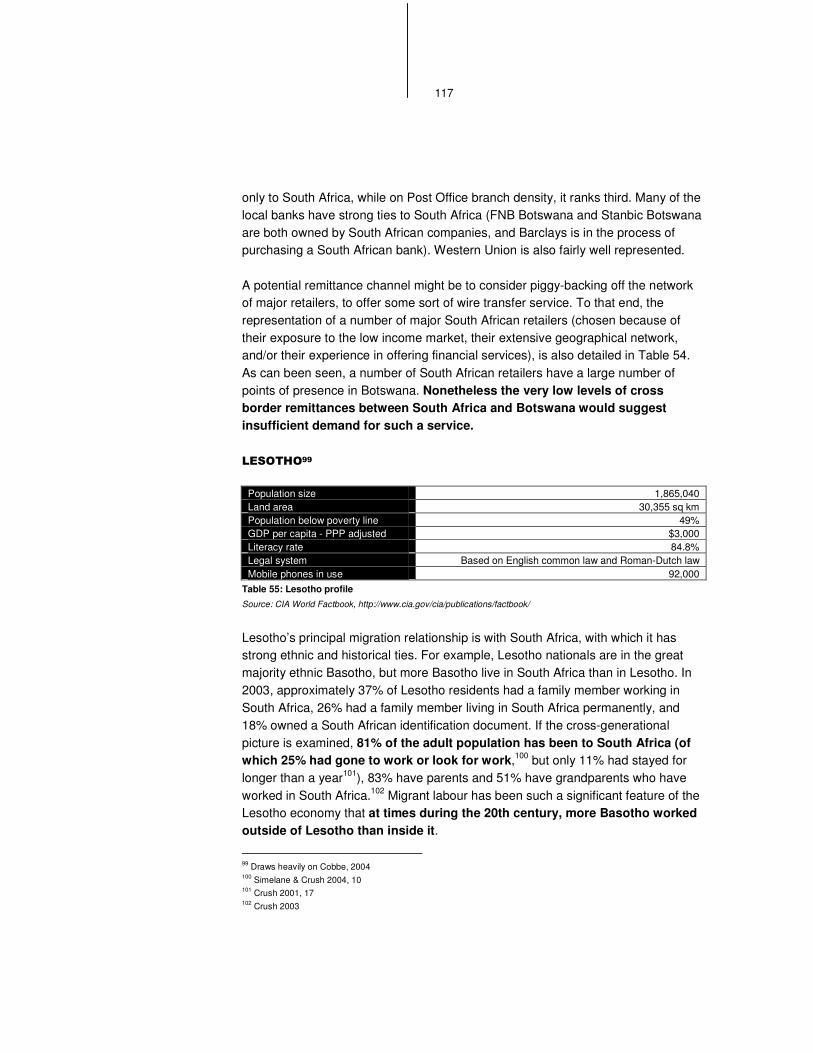
117
only to South Africa, while on Post Office branch density, it ranks third. Many of the local banks have strong ties to South Africa (FNB Botswana and Stanbic Botswana are both owned by South African companies, and Barclays is in the process of purchasing a South African bank). Western Union is also fairly well represented.
A potential remittance channel might be to consider piggy-backing off the network of major retailers, to offer some sort of wire transfer service. To that end, the representation of a number of major South African retailers (chosen because of their exposure to the low income market, their extensive geographical network, and/or their experience in offering financial services), is also detailed in Table 54. As can been seen, a number of South African retailers have a large number of points of presence in Botswana. Nonetheless the very low levels of cross border remittances between South Africa and Botswana would suggest insufficient demand for such a service.
�������''�
Population size 1,865,040 Land area 30,355 sq km Population below poverty line 49% GDP per capita - PPP adjusted $3,000 Literacy rate 84.8% Legal system Based on English common law and Roman-Dutch law Mobile phones in use 92,000
Table 55: Lesotho profile Source: CIA World Factbook, http://www.cia.gov/cia/publications/factbook/
Lesotho’s principal migration relationship is with South Africa, with which it has strong ethnic and historical ties. For example, Lesotho nationals are in the great majority ethnic Basotho, but more Basotho live in South Africa than in Lesotho. In 2003, approximately 37% of Lesotho residents had a family member working in South Africa, 26% had a family member living in South Africa permanently, and 18% owned a South African identification document. If the cross-generational picture is examined, 81% of the adult population has been to South Africa (of which 25% had gone to work or look for work,100 but only 11% had stayed for longer than a year101), 83% have parents and 51% have grandparents who have worked in South Africa.102 Migrant labour has been such a significant feature of the Lesotho economy that at times during the 20th century, more Basotho worked outside of Lesotho than inside it.
99 Draws heavily on Cobbe, 2004 100 Simelane & Crush 2004, 10 101 Crush 2001, 17 102 Crush 2003
118
The migration status of Lesotho nationals in South Africa is often subject to some real ambiguity. As mentioned, many Lesotho nationals have South African identification documents, and those who had five years’ residence in South Africa at the time of the 1994 elections were permitted to vote. Such ambiguity makes any assessment of the official immigration numbers extremely difficult.
Undocumented migration into South Africa is both widespread and easy to accomplish. The border itself is extremely mountainous and difficult to police, and has thus always been very porous. At official control points, it is often possible to cross without documents permitting residence or employment, ostensibly for a short term visit. Passports only need to be shown, not stamped, when crossing the border. Once in South Africa, Lesotho nationals find it easy to pass as South African Basotho.
The total number of Lesotho mine workers in South Africa probably peaked in 1990 at over 127 000, which was then more than half of the foreign mines labour force, and outnumbered the number of formal wage-earners in Lesotho. This had fallen to under 60 000 by 2003, associated to a large extent with a decrease in the mining labour force as a whole. A number of these individuals are likely to have found employment with mining subcontractors, or non-mining employers, rather than simply returning to Lesotho, as Lesotho is one of the principal sources of foreign labour for such sub-contractors.103
Basotho are also a large part of the labour force in the farming industry in the eastern Free State in particular, reaching approximately 7 000 legally employed migrants (with presumably a fair number of undocumented migrants in addition) out of around 73 000 part-time farmworkers in the regional industry in 2000.104
103 Crush, Ulicki et al 1999, 1. the report also found that “Nearly two-thirds of the sub-contract workers have been employed on a regular mine,” which again suggests that the sub-contracting industry has become a source of employment for retrenched mine workers. 104 Crush, Mather et al 2000, 63
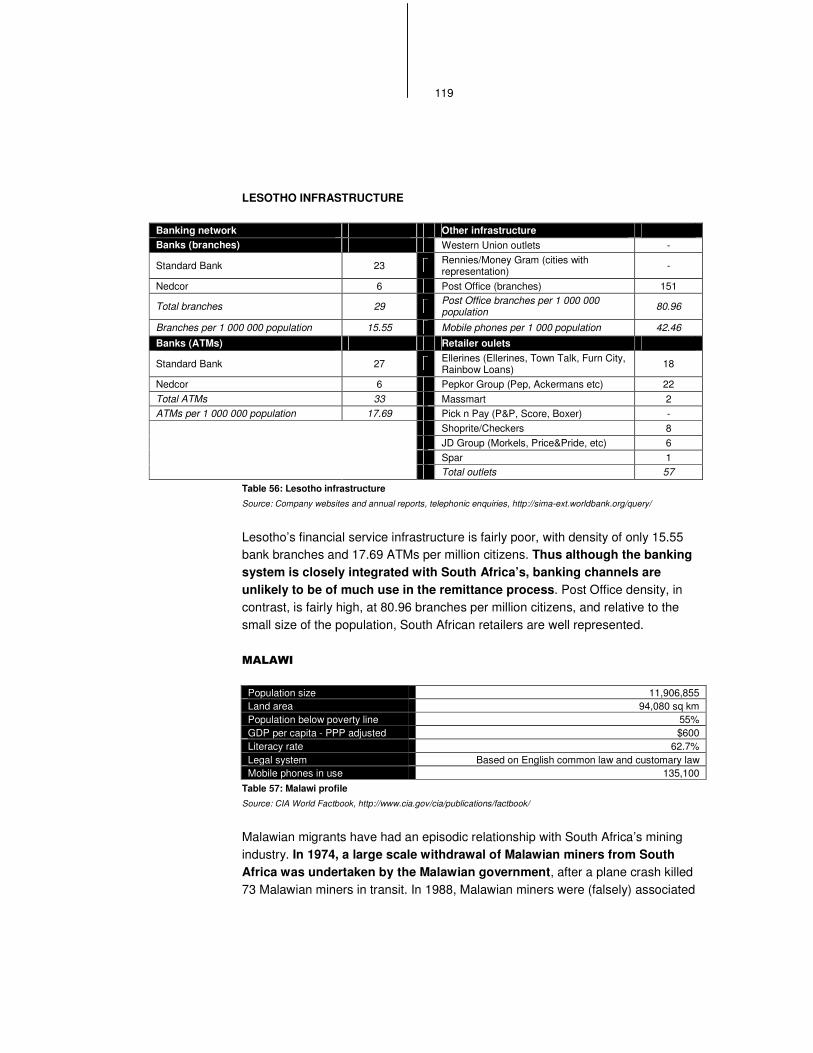
119
LESOTHO INFRASTRUCTURE
Banking network Other infrastructure Banks (branches) Western Union outlets -
Standard Bank 23 Rennies/Money Gram (cities with representation) -
Nedcor 6 Post Office (branches) 151
Total branches 29 Post Office branches per 1 000 000 population 80.96
Branches per 1 000 000 population 15.55 Mobile phones per 1 000 population 42.46
Banks (ATMs) Retailer oulets
Standard Bank 27 Ellerines (Ellerines, Town Talk, Furn City, Rainbow Loans) 18
Nedcor 6 Pepkor Group (Pep, Ackermans etc) 22 Total ATMs 33 Massmart 2 ATMs per 1 000 000 population 17.69 Pick n Pay (P&P, Score, Boxer) - Shoprite/Checkers 8 JD Group (Morkels, Price&Pride, etc) 6 Spar 1 Total outlets 57
Table 56: Lesotho infrastructure Source: Company websites and annual reports, telephonic enquiries, http://sima-ext.worldbank.org/query/
Lesotho’s financial service infrastructure is fairly poor, with density of only 15.55 bank branches and 17.69 ATMs per million citizens. Thus although the banking system is closely integrated with South Africa’s, banking channels are unlikely to be of much use in the remittance process. Post Office density, in contrast, is fairly high, at 80.96 branches per million citizens, and relative to the small size of the population, South African retailers are well represented.
����� ��
Population size 11,906,855 Land area 94,080 sq km Population below poverty line 55% GDP per capita - PPP adjusted $600 Literacy rate 62.7% Legal system Based on English common law and customary law Mobile phones in use 135,100
Table 57: Malawi profile Source: CIA World Factbook, http://www.cia.gov/cia/publications/factbook/
Malawian migrants have had an episodic relationship with South Africa’s mining industry. In 1974, a large scale withdrawal of Malawian miners from South Africa was undertaken by the Malawian government, after a plane crash killed 73 Malawian miners in transit. In 1988, Malawian miners were (falsely) associated
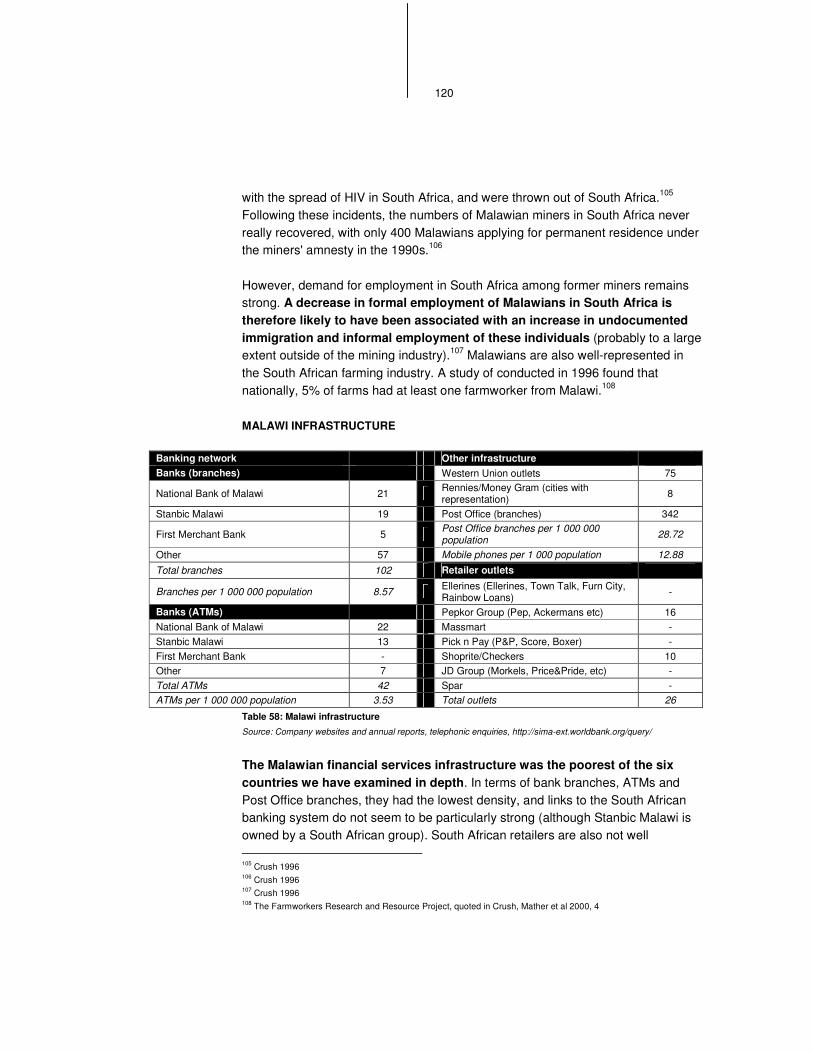
120
with the spread of HIV in South Africa, and were thrown out of South Africa.105 Following these incidents, the numbers of Malawian miners in South Africa never really recovered, with only 400 Malawians applying for permanent residence under the miners' amnesty in the 1990s.106
However, demand for employment in South Africa among former miners remains strong. A decrease in formal employment of Malawians in South Africa is therefore likely to have been associated with an increase in undocumented immigration and informal employment of these individuals (probably to a large extent outside of the mining industry).107 Malawians are also well-represented in the South African farming industry. A study of conducted in 1996 found that nationally, 5% of farms had at least one farmworker from Malawi.108
MALAWI INFRASTRUCTURE
Banking network Other infrastructure Banks (branches) Western Union outlets 75
National Bank of Malawi 21 Rennies/Money Gram (cities with representation) 8
Stanbic Malawi 19 Post Office (branches) 342
First Merchant Bank 5 Post Office branches per 1 000 000 population 28.72
Other 57 Mobile phones per 1 000 population 12.88
Total branches 102 Retailer outlets
Branches per 1 000 000 population 8.57 Ellerines (Ellerines, Town Talk, Furn City, Rainbow Loans) -
Banks (ATMs) Pepkor Group (Pep, Ackermans etc) 16 National Bank of Malawi 22 Massmart - Stanbic Malawi 13 Pick n Pay (P&P, Score, Boxer) - First Merchant Bank - Shoprite/Checkers 10 Other 7 JD Group (Morkels, Price&Pride, etc) - Total ATMs 42 Spar - ATMs per 1 000 000 population 3.53 Total outlets 26
Table 58: Malawi infrastructure Source: Company websites and annual reports, telephonic enquiries, http://sima-ext.worldbank.org/query/
The Malawian financial services infrastructure was the poorest of the six countries we have examined in depth. In terms of bank branches, ATMs and Post Office branches, they had the lowest density, and links to the South African banking system do not seem to be particularly strong (although Stanbic Malawi is owned by a South African group). South African retailers are also not well 105 Crush 1996 106 Crush 1996 107 Crush 1996 108 The Farmworkers Research and Resource Project, quoted in Crush, Mather et al 2000, 4
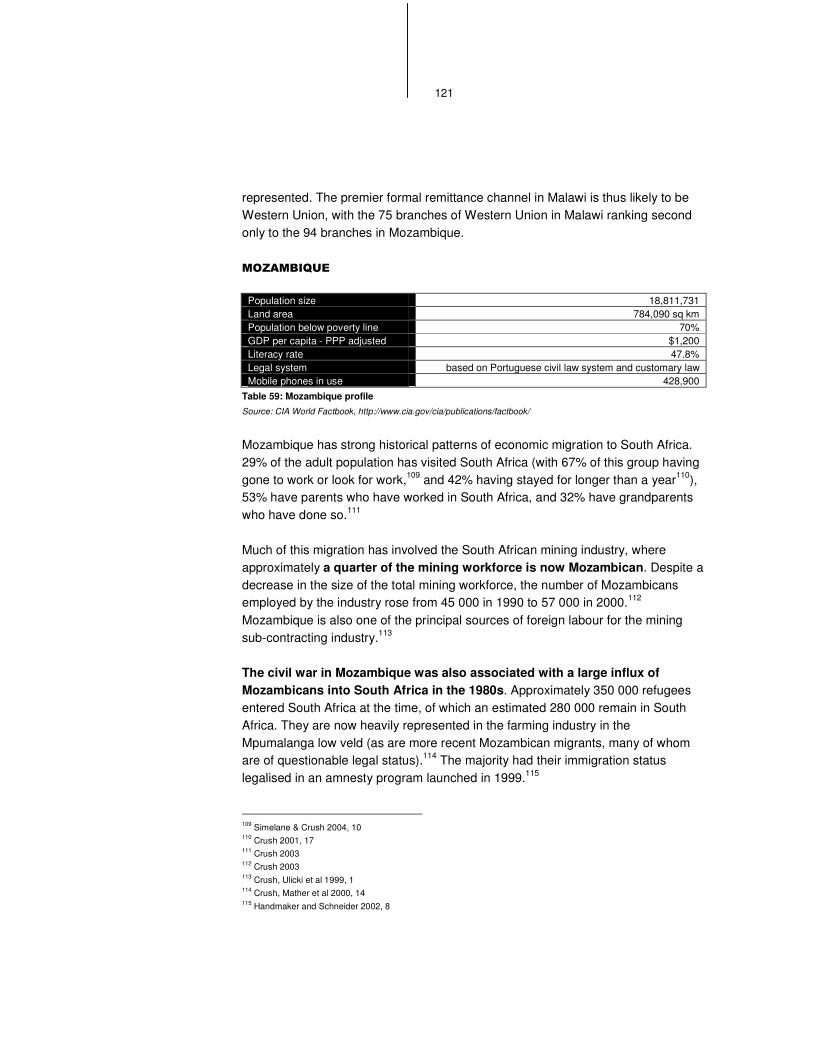
121
represented. The premier formal remittance channel in Malawi is thus likely to be Western Union, with the 75 branches of Western Union in Malawi ranking second only to the 94 branches in Mozambique.
�����������
Population size 18,811,731 Land area 784,090 sq km Population below poverty line 70% GDP per capita - PPP adjusted $1,200 Literacy rate 47.8% Legal system based on Portuguese civil law system and customary law Mobile phones in use 428,900
Table 59: Mozambique profile Source: CIA World Factbook, http://www.cia.gov/cia/publications/factbook/
Mozambique has strong historical patterns of economic migration to South Africa. 29% of the adult population has visited South Africa (with 67% of this group having gone to work or look for work,109 and 42% having stayed for longer than a year110), 53% have parents who have worked in South Africa, and 32% have grandparents who have done so.111
Much of this migration has involved the South African mining industry, where approximately a quarter of the mining workforce is now Mozambican. Despite a decrease in the size of the total mining workforce, the number of Mozambicans employed by the industry rose from 45 000 in 1990 to 57 000 in 2000.112 Mozambique is also one of the principal sources of foreign labour for the mining sub-contracting industry.113
The civil war in Mozambique was also associated with a large influx of Mozambicans into South Africa in the 1980s. Approximately 350 000 refugees entered South Africa at the time, of which an estimated 280 000 remain in South Africa. They are now heavily represented in the farming industry in the Mpumalanga low veld (as are more recent Mozambican migrants, many of whom are of questionable legal status).114 The majority had their immigration status legalised in an amnesty program launched in 1999.115
109 Simelane & Crush 2004, 10 110 Crush 2001, 17 111 Crush 2003 112 Crush 2003 113 Crush, Ulicki et al 1999, 1 114 Crush, Mather et al 2000, 14 115 Handmaker and Schneider 2002, 8
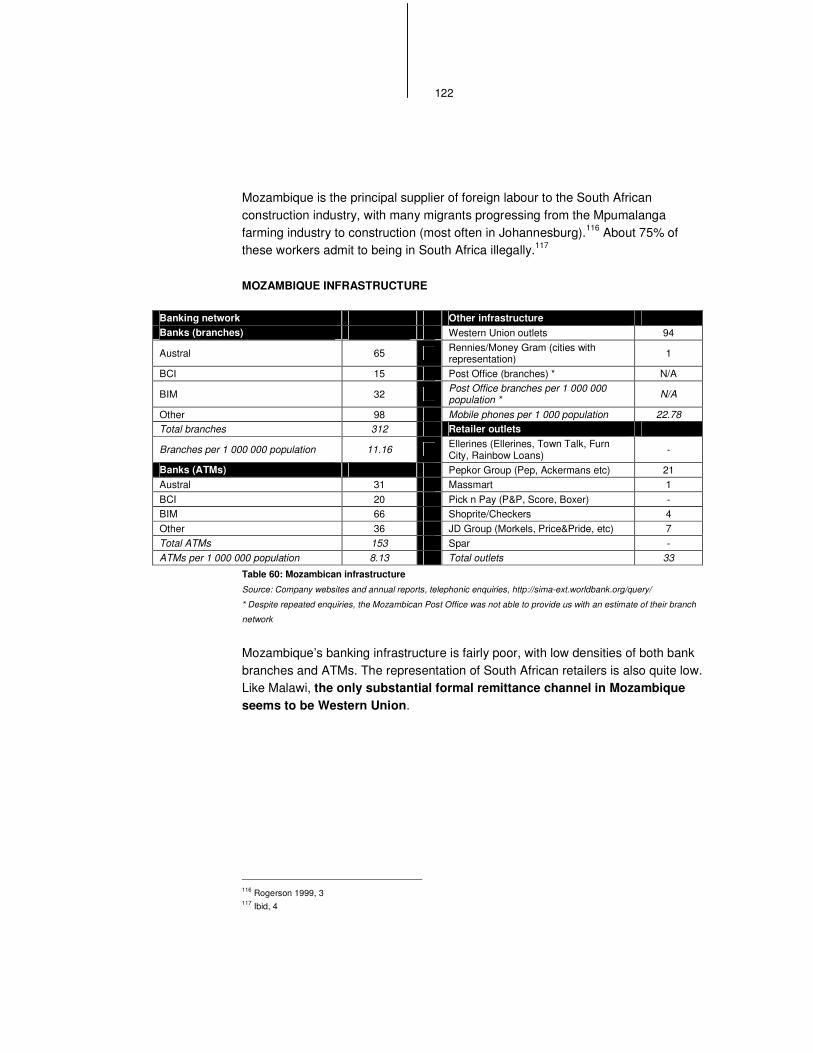
122
Mozambique is the principal supplier of foreign labour to the South African construction industry, with many migrants progressing from the Mpumalanga farming industry to construction (most often in Johannesburg).116 About 75% of these workers admit to being in South Africa illegally.117
MOZAMBIQUE INFRASTRUCTURE
Banking network Other infrastructure Banks (branches) Western Union outlets 94
Austral 65 Rennies/Money Gram (cities with representation) 1
BCI 15 Post Office (branches) * N/A
BIM 32 Post Office branches per 1 000 000 population * N/A
Other 98 Mobile phones per 1 000 population 22.78 Total branches 312 Retailer outlets
Branches per 1 000 000 population 11.16 Ellerines (Ellerines, Town Talk, Furn City, Rainbow Loans) -
Banks (ATMs) Pepkor Group (Pep, Ackermans etc) 21 Austral 31 Massmart 1 BCI 20 Pick n Pay (P&P, Score, Boxer) - BIM 66 Shoprite/Checkers 4 Other 36 JD Group (Morkels, Price&Pride, etc) 7 Total ATMs 153 Spar - ATMs per 1 000 000 population 8.13 Total outlets 33
Table 60: Mozambican infrastructure
Source: Company websites and annual reports, telephonic enquiries, http://sima-ext.worldbank.org/query/
* Despite repeated enquiries, the Mozambican Post Office was not able to provide us with an estimate of their branch
network
Mozambique’s banking infrastructure is fairly poor, with low densities of both bank branches and ATMs. The representation of South African retailers is also quite low. Like Malawi, the only substantial formal remittance channel in Mozambique seems to be Western Union.
116 Rogerson 1999, 3 117 Ibid, 4
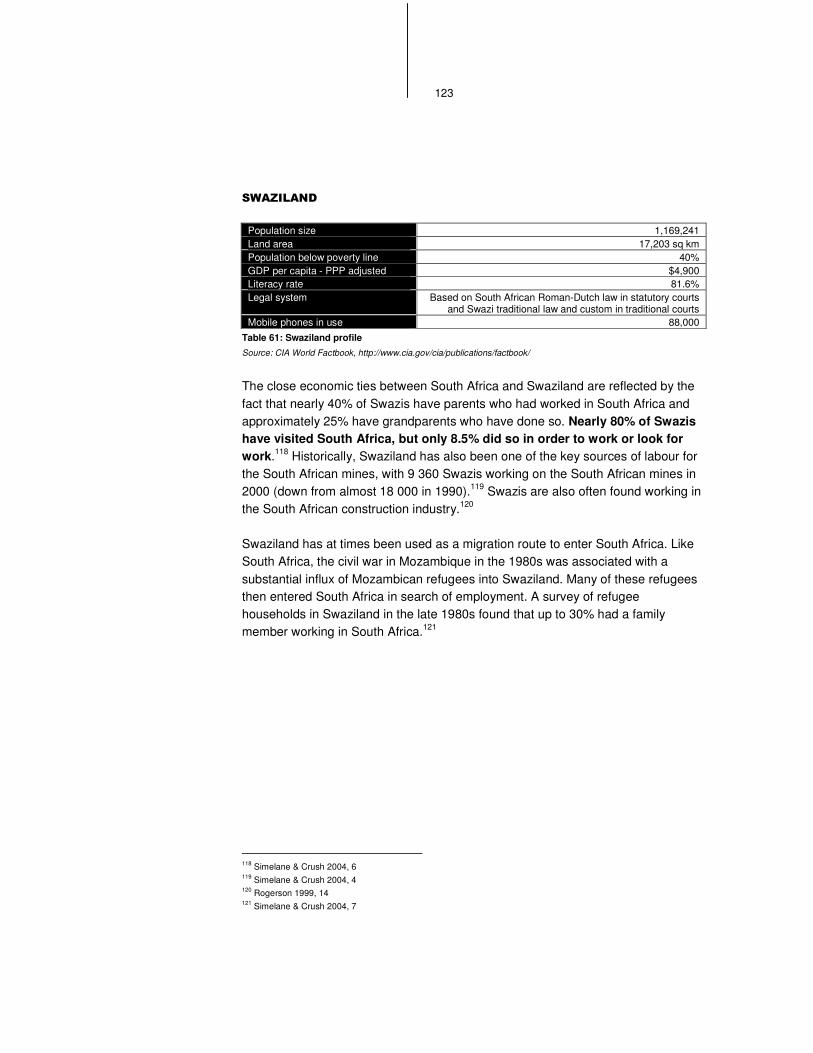
123
�� �������
Population size 1,169,241 Land area 17,203 sq km Population below poverty line 40% GDP per capita - PPP adjusted $4,900 Literacy rate 81.6% Legal system Based on South African Roman-Dutch law in statutory courts
and Swazi traditional law and custom in traditional courts Mobile phones in use 88,000
Table 61: Swaziland profile Source: CIA World Factbook, http://www.cia.gov/cia/publications/factbook/
The close economic ties between South Africa and Swaziland are reflected by the fact that nearly 40% of Swazis have parents who had worked in South Africa and approximately 25% have grandparents who have done so. Nearly 80% of Swazis have visited South Africa, but only 8.5% did so in order to work or look for work.118 Historically, Swaziland has also been one of the key sources of labour for the South African mines, with 9 360 Swazis working on the South African mines in 2000 (down from almost 18 000 in 1990).119 Swazis are also often found working in the South African construction industry.120
Swaziland has at times been used as a migration route to enter South Africa. Like South Africa, the civil war in Mozambique in the 1980s was associated with a substantial influx of Mozambican refugees into Swaziland. Many of these refugees then entered South Africa in search of employment. A survey of refugee households in Swaziland in the late 1980s found that up to 30% had a family member working in South Africa.121
118 Simelane & Crush 2004, 6 119 Simelane & Crush 2004, 4 120 Rogerson 1999, 14 121 Simelane & Crush 2004, 7
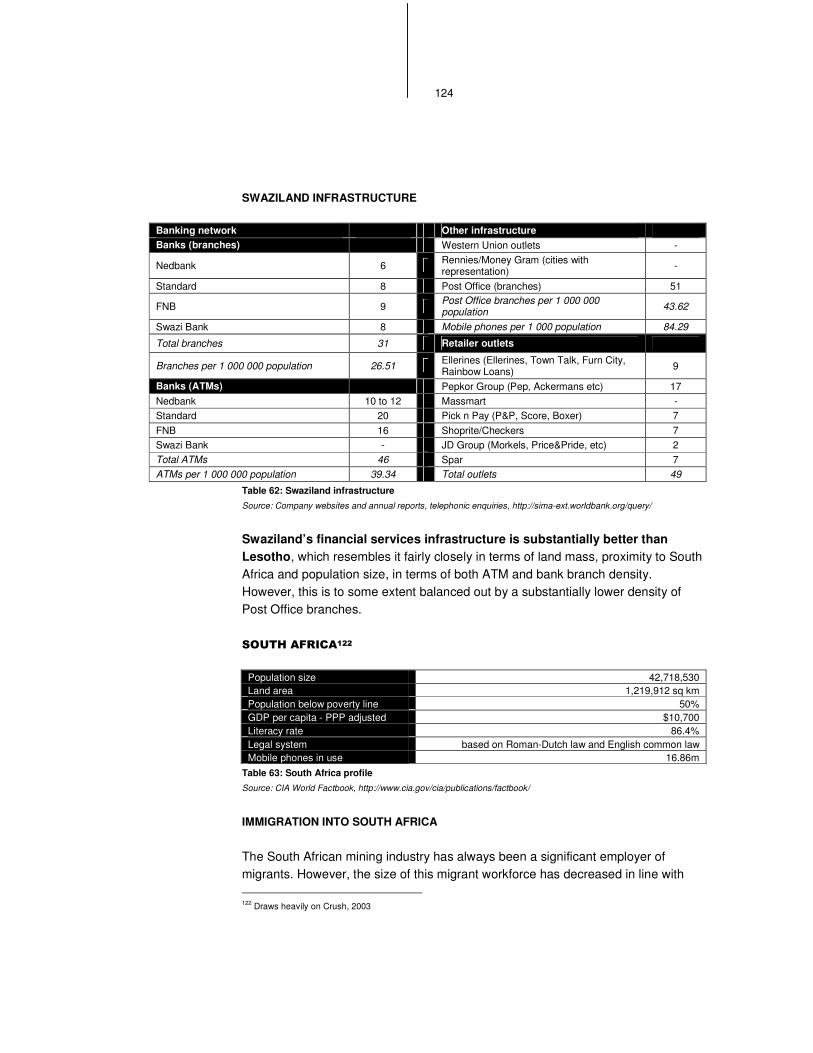
124
SWAZILAND INFRASTRUCTURE
Banking network Other infrastructure Banks (branches) Western Union outlets -
Nedbank 6 Rennies/Money Gram (cities with representation) -
Standard 8 Post Office (branches) 51
FNB 9 Post Office branches per 1 000 000 population 43.62
Swazi Bank 8 Mobile phones per 1 000 population 84.29
Total branches 31 Retailer outlets
Branches per 1 000 000 population 26.51 Ellerines (Ellerines, Town Talk, Furn City, Rainbow Loans) 9
Banks (ATMs) Pepkor Group (Pep, Ackermans etc) 17 Nedbank 10 to 12 Massmart - Standard 20 Pick n Pay (P&P, Score, Boxer) 7 FNB 16 Shoprite/Checkers 7 Swazi Bank - JD Group (Morkels, Price&Pride, etc) 2 Total ATMs 46 Spar 7 ATMs per 1 000 000 population 39.34 Total outlets 49
Table 62: Swaziland infrastructure Source: Company websites and annual reports, telephonic enquiries, http://sima-ext.worldbank.org/query/
Swaziland’s financial services infrastructure is substantially better than Lesotho, which resembles it fairly closely in terms of land mass, proximity to South Africa and population size, in terms of both ATM and bank branch density. However, this is to some extent balanced out by a substantially lower density of Post Office branches.
���������������
Population size 42,718,530 Land area 1,219,912 sq km Population below poverty line 50% GDP per capita - PPP adjusted $10,700 Literacy rate 86.4% Legal system based on Roman-Dutch law and English common law Mobile phones in use 16.86m
Table 63: South Africa profile Source: CIA World Factbook, http://www.cia.gov/cia/publications/factbook/
IMMIGRATION INTO SOUTH AFRICA
The South African mining industry has always been a significant employer of migrants. However, the size of this migrant workforce has decreased in line with 122 Draws heavily on Crush, 2003
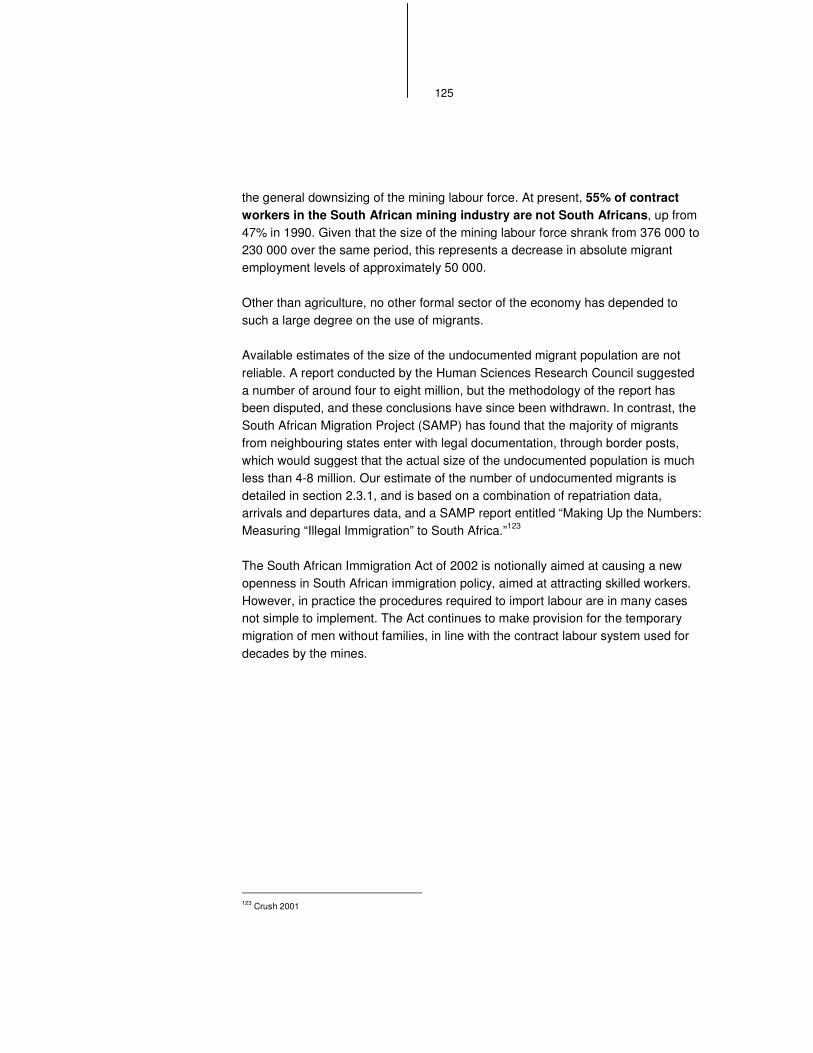
125
the general downsizing of the mining labour force. At present, 55% of contract workers in the South African mining industry are not South Africans, up from 47% in 1990. Given that the size of the mining labour force shrank from 376 000 to 230 000 over the same period, this represents a decrease in absolute migrant employment levels of approximately 50 000.
Other than agriculture, no other formal sector of the economy has depended to such a large degree on the use of migrants.
Available estimates of the size of the undocumented migrant population are not reliable. A report conducted by the Human Sciences Research Council suggested a number of around four to eight million, but the methodology of the report has been disputed, and these conclusions have since been withdrawn. In contrast, the South African Migration Project (SAMP) has found that the majority of migrants from neighbouring states enter with legal documentation, through border posts, which would suggest that the actual size of the undocumented population is much less than 4-8 million. Our estimate of the number of undocumented migrants is detailed in section 2.3.1, and is based on a combination of repatriation data, arrivals and departures data, and a SAMP report entitled “Making Up the Numbers: Measuring “Illegal Immigration” to South Africa.”123
The South African Immigration Act of 2002 is notionally aimed at causing a new openness in South African immigration policy, aimed at attracting skilled workers. However, in practice the procedures required to import labour are in many cases not simple to implement. The Act continues to make provision for the temporary migration of men without families, in line with the contract labour system used for decades by the mines.
123 Crush 2001
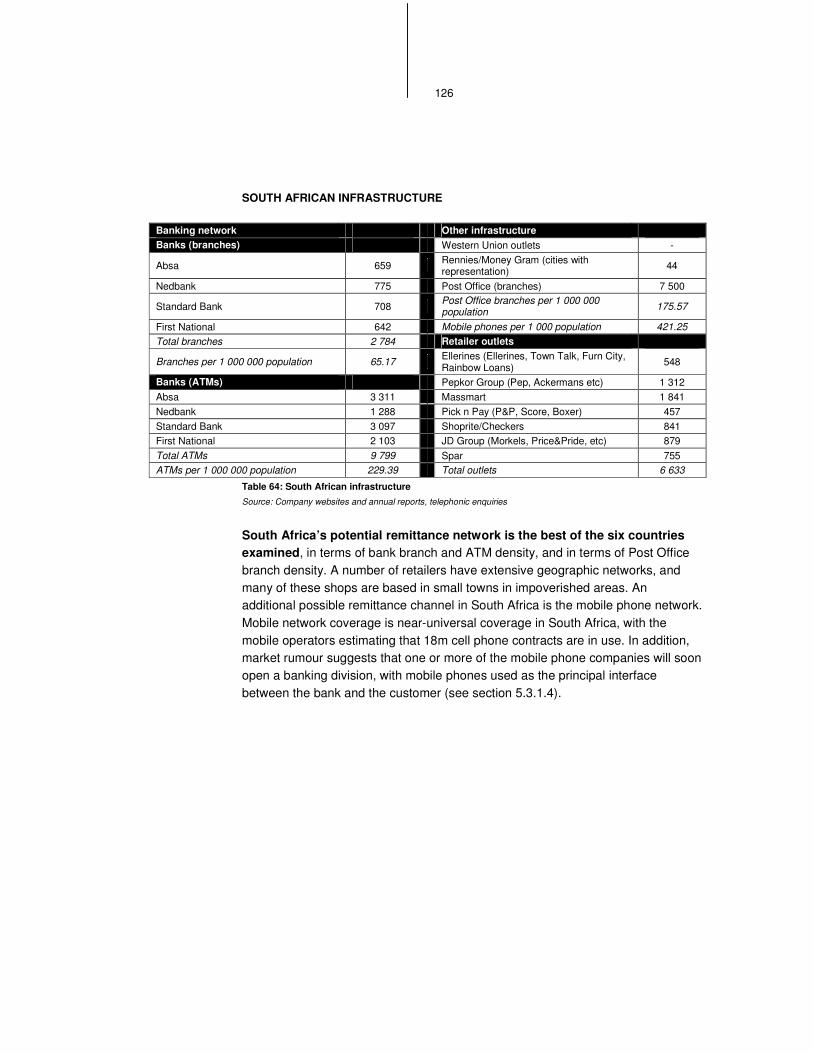
126
SOUTH AFRICAN INFRASTRUCTURE
Banking network Other infrastructure Banks (branches) Western Union outlets -
Absa 659 Rennies/Money Gram (cities with representation) 44
Nedbank 775 Post Office (branches) 7 500
Standard Bank 708 Post Office branches per 1 000 000 population 175.57
First National 642 Mobile phones per 1 000 population 421.25 Total branches 2 784 Retailer outlets
Branches per 1 000 000 population 65.17 Ellerines (Ellerines, Town Talk, Furn City, Rainbow Loans) 548
Banks (ATMs) Pepkor Group (Pep, Ackermans etc) 1 312 Absa 3 311 Massmart 1 841 Nedbank 1 288 Pick n Pay (P&P, Score, Boxer) 457 Standard Bank 3 097 Shoprite/Checkers 841 First National 2 103 JD Group (Morkels, Price&Pride, etc) 879 Total ATMs 9 799 Spar 755 ATMs per 1 000 000 population 229.39 Total outlets 6 633
Table 64: South African infrastructure Source: Company websites and annual reports, telephonic enquiries
South Africa’s potential remittance network is the best of the six countries examined, in terms of bank branch and ATM density, and in terms of Post Office branch density. A number of retailers have extensive geographic networks, and many of these shops are based in small towns in impoverished areas. An additional possible remittance channel in South Africa is the mobile phone network. Mobile network coverage is near-universal coverage in South Africa, with the mobile operators estimating that 18m cell phone contracts are in use. In addition, market rumour suggests that one or more of the mobile phone companies will soon open a banking division, with mobile phones used as the principal interface between the bank and the customer (see section 5.3.1.4).
127
��������"���������������������������
Repatriations data is a profoundly flawed measure of migration. However, in southern Africa it gives a much better picture of patterns of low income migration than can be gained from documented migration numbers. This is illustrated in Table 65. Four of the top five repatriations countries are not even represented in the top ten immigration countries. A reliance on formal migration would therefore result in a skewed picture of actual migration to South Africa.
Historical labour
migrancy? *
Average repatriations,
2001-2003
Historical labour
migrancy? *
Documented immigrants,
2002 Mozambique Yes 86 722 United Kingdom No 668 Zimbabwe Yes 47 189 Nigeria No 631 Lesotho Yes 6 234 India No 608 Malawi Yes 3 315 Zimbabwe Yes 464 Swaziland Yes 2 060 China No 361 Tanzania No 796 Pakistan No 345 Pakistan No 432 Germany No 286 Nigeria No 291 Ghana No 202 India No 266 USA No 150 China No 155 Bulgaria No 149
Table 65: Top ten source countries for repatriations and legal immigration into South Africa
Source: Department of Home Affairs, Statistics South Africa
* This column indicates whether a history of sustained, short term labour migration exists from this country to South
Africa. The UK is excluded as most migration to South Africa has been long term, while India is excluded as little
migration has occurred in the last century.
Thus our approach to estimating migration was to combine all possible sources of data, including historical data on patterns of migration (see Appendix 4), and the sources of repatriation bias discussed in Appendix 6 and section 2.2.1.2.
128
��������#����������������������
The methods used by the police to identify undocumented migrants for repatriation purposes have been described as follows:
“In trying to establish whether a suspect is an illegal or not, members of the internal tracing units focus on a number of aspects. One of these is language: accent, the pronouncement of certain words (such as Zulu for 'elbow', or 'buttonhole' or the name of a meerkat). Some are asked what nationality they are and if they reply 'Sud' African this is a dead give-away for a Mozambican, while Malawians tend to pronounce the letter 'r' as 'errow'.... Appearance is another factor in trying to establish whether a suspect is illegal -- hairstyle, type of clothing worn as well as actual physical appearance. In the case of Mozambicans a dead give-away is the vaccination mark on the lower left forearm... [while] those from Lesotho tend to wear gumboots, carry walking sticks or wear blankets (in the traditional manner), and also speak slightly different Sesotho.”124
This reliance on subjective characteristics such as physical appearance and behaviour occasionally is reported to lead to victimisation of South Africans of unusual physical appearance, as reported in The Star newspaper on July 10 2001:
“If you have a dark skin, wear your hair in braids and cannot pronounce the word "elbow" in three different South African languages, like Lydia Ackerman (22), you could be picked up by the police as a suspected illegal immigrant.
On Saturday, Ackerman was standing outside her home in Forest Hill in the south of Johannesburg, when police approached her and questioned her about her nationality.
Apparently, police asked her to pronounce the word 'elbow' in three different South African languages. When she failed to do so, they bundled her into the back of a police truck to a deportation centre. Ackerman said the police did not give her an opportunity to show them her identity documents.
124 Minaar, A. and Hough, M. (1996). Causes, Extent and Impact of Clandestine Migration in Selected Southern African Countries with Specific Reference to South Africa. Pretoria: Human Sciences Research Council. Quoted in Harris 2002.
129
But on the way, when Ackerman spoke to the police in Afrikaans, they immediately stopped and dropped her off somewhere in Krugersdorp.”125
How then do factors like this affect the repatriation statistics? Our working hypothesis is that factors such as shared language and/or physical appearance make certain nationalities easier to identify than others, and thus more prone to deportation.
• Lesotho: the language spoken in Lesotho, Sesotho, is both widely spoken in South Africa, and shares common roots with the South African languages of Tswana, Pedi and Phokeng. There are a significant number of indigenous South Africans who identify themselves as ethnic Basotho. Therefore we assume that it is relatively easy for a Lesotho national to evade detection in South Africa.
• Botswana: the language spoken in Botswana, Setswana, is both widely spoken in South Africa, and shares common roots with the South African languages of Pedi, Phokeng and Sotho. There are a significant number of indigenous South Africans who identify themselves as ethnic Tswana. Therefore we assume that it is relatively easy for a Botswana national to evade detection in South Africa.
• Swaziland: Swazis are Nguni and as such share common language and ethnic roots with the South African Zulu, Xhosa and Ndebele groups. Therefore we assume that it is relatively easy for a Swazi national to evade detection in South Africa.
• Mozambique: There are some language similarities between the Mozambican Shangaan and the South African Tsonga and Venda ethnic groups. However, Tsonga and Venda are quite small ethnic groups in SA. Mozambicans are also unlikely to speak English as a second language, as Mozambique was a Portuguese colony. We therefore assume that Mozambicans are more likely to conform to the police internal tracing units’ identification techniques, and are thus more likely to face deportation.
• Malawi: there are no close language similarities between indigenous Malawian languages and South African languages, and likewise no close ethnic ties. We therefore assume that Malawians are more likely to conform to the police internal tracing units’ identification techniques, and are thus more likely to face deportation.
Although an extensive analysis of the remittance experience of the Zimbabwean migrant population has not been included in the report, it is worth noting that
125 http://www.iol.co.za/index.php?set_id=1&click_id=13&art_id=ct20010710222503575X510239
130
Zimbabweans would probably not have much trouble passing as South Africans. The Zimbabwean language Ndebele closely resembles a number of South African languages, particularly Zulu (some similarities also exist between the Zimbabwean language of Shona and the South African Venda language). However, Zimbabweans are likely to find the assimilation process more difficult than would Sotho or Swazi migrants.
�