supporting information dye-sensitized solar cells (dsscs ... · c department of physics, polymers...
TRANSCRIPT
Supporting Information
A Comparative study of the Influence of N,N'-dialkyl vs N,N'-diaryl based Electron Donors Ancillary Ligands on the Photocurrent and Photovoltage in
Dye-Sensitized Solar Cells (DSSCs)
Saba Ashrafa,b, Erol Yildirimb, Javeed Akhtarc, Humaira M. Siddiqia, Ahmed
El-Shafeib*
a Department of Chemistry, Quaid-I-Azam University, Islamabad 45320, Pakistan
b Polymer and Color Chemistry Program, North Carolina State University, Raleigh, NC, 27695,
USA
c Department of Physics, Polymers & Materials Synthesis Lab (PMS), COMSATS, Institute of
Information Technology, Chak Shahzad Islamabad, Pakistan
(*)Corresponding author: Ahmed [email protected]
Electronic Supplementary Material (ESI) for Physical Chemistry Chemical Physics.This journal is © the Owner Societies 2017
1. Materials:
All the chemicals and solvents were purchased either from Sigma-Aldrich, Fisher Scientific or
TCI-America and were used as received. Sephadex LH-20 for purification of dyes was purchased
from Fischer Scientific. ESI-MS was recorded on a high resolution mass spectrometer – the
Thermo Fisher Scientific Exactive Plus MS, a benchtop full-scan Orbitrap™ mass spectrometer
– using Heated Electrospray Ionization (HESI). FT-IR (ATR) spectra were recorded on a Nicolet
Nexus 470 FTIR spectrometer (Thermo Scientific, USA) and UV-Visible spectra were measured
by using Cary 300 spectrophotometer. Fluorescence and emission decay were recorded at room
temperature on a Fluorolog-3 spectrofluorometer (HORIBA Jobin Yvon Inc.). 1H-NMR spectra
were recorded in a Bruker 500 MHz.
2. Synthesis
2.1. Synthesis of Ligands
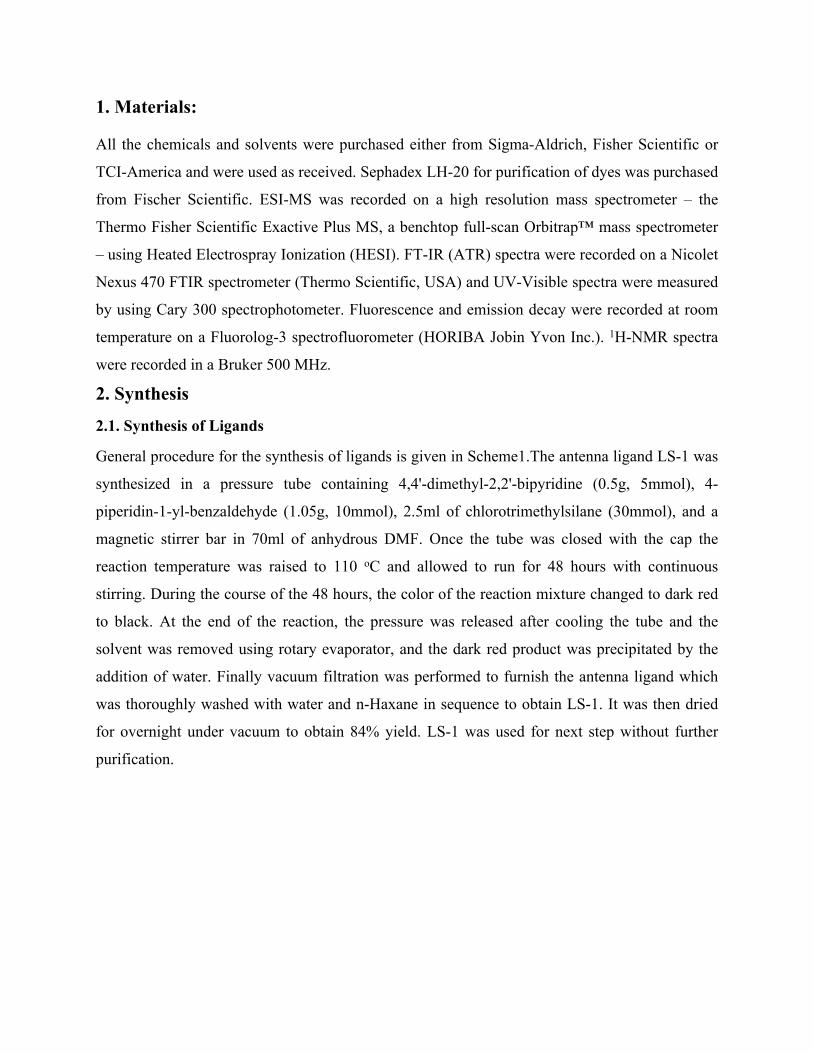
General procedure for the synthesis of ligands is given in Scheme1.The antenna ligand LS-1 was
synthesized in a pressure tube containing 4,4'-dimethyl-2,2'-bipyridine (0.5g, 5mmol), 4-
piperidin-1-yl-benzaldehyde (1.05g, 10mmol), 2.5ml of chlorotrimethylsilane (30mmol), and a
magnetic stirrer bar in 70ml of anhydrous DMF. Once the tube was closed with the cap the
reaction temperature was raised to 110 oC and allowed to run for 48 hours with continuous
stirring. During the course of the 48 hours, the color of the reaction mixture changed to dark red
to black. At the end of the reaction, the pressure was released after cooling the tube and the
solvent was removed using rotary evaporator, and the dark red product was precipitated by the
addition of water. Finally vacuum filtration was performed to furnish the antenna ligand which
was thoroughly washed with water and n-Haxane in sequence to obtain LS-1. It was then dried
for overnight under vacuum to obtain 84% yield. LS-1 was used for next step without further
purification.
N N
ArAr
N N
Under Pressure, chlorotrimethylsilane
110 oC, 48 hrs, 70mL (DMF)Ar
O
H
where Ar =
NSL-I = NK77-7's ligand =
Scheme 1- Synthetic route N,N'-dialkyl (LS-1) vs N,N'-diaryl (K77-7) electron-donating
ancillary ligands
2.2. Synthesis of Complexes
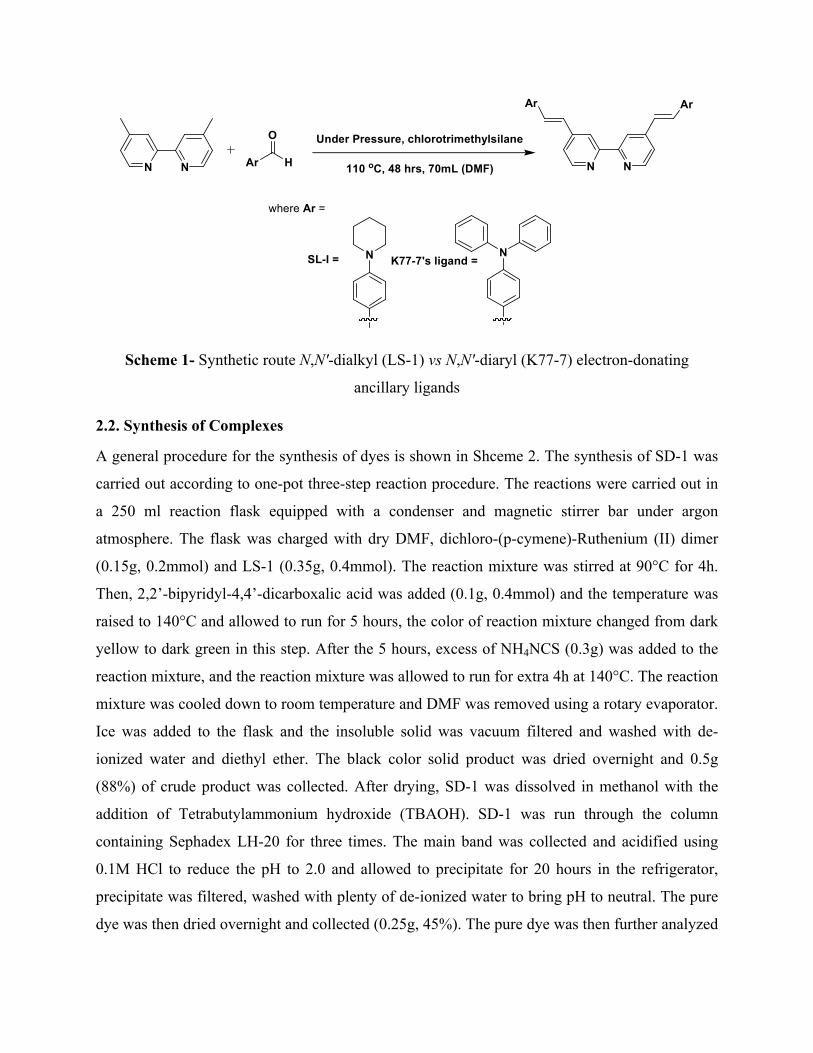
A general procedure for the synthesis of dyes is shown in Shceme 2. The synthesis of SD-1 was
carried out according to one-pot three-step reaction procedure. The reactions were carried out in
a 250 ml reaction flask equipped with a condenser and magnetic stirrer bar under argon
atmosphere. The flask was charged with dry DMF, dichloro-(p-cymene)-Ruthenium (II) dimer
(0.15g, 0.2mmol) and LS-1 (0.35g, 0.4mmol). The reaction mixture was stirred at 90°C for 4h.
Then, 2,2’-bipyridyl-4,4’-dicarboxalic acid was added (0.1g, 0.4mmol) and the temperature was
raised to 140°C and allowed to run for 5 hours, the color of reaction mixture changed from dark
yellow to dark green in this step. After the 5 hours, excess of NH4NCS (0.3g) was added to the
reaction mixture, and the reaction mixture was allowed to run for extra 4h at 140°C. The reaction
mixture was cooled down to room temperature and DMF was removed using a rotary evaporator.
Ice was added to the flask and the insoluble solid was vacuum filtered and washed with de-
ionized water and diethyl ether. The black color solid product was dried overnight and 0.5g
(88%) of crude product was collected. After drying, SD-1 was dissolved in methanol with the
addition of Tetrabutylammonium hydroxide (TBAOH). SD-1 was run through the column
containing Sephadex LH-20 for three times. The main band was collected and acidified using
0.1M HCl to reduce the pH to 2.0 and allowed to precipitate for 20 hours in the refrigerator,
precipitate was filtered, washed with plenty of de-ionized water to bring pH to neutral. The pure
dye was then dried overnight and collected (0.25g, 45%). The pure dye was then further analyzed
by ATR/FT-IR, 1H NMR and high resolution mass spectrometry. SD-1 was characterized by ESI
high resolution MS and 1HNMR, which is given in the coming sections.
N N
ArAr
DMF, 90 oC/4hrs Under Argon
Ru
RuCl
ClCl
N
N
Ar
RuCl
Cl
Ar
N N
HOOC COOH
1. DMF, 140 oC/5hrs 2. NH4NCS excess/4hrs
N
N
Ar
Ru
Ar
SCN
N
where Ar =
NSD-I =
N
N
Ar
RuCl
Cl
Ar
N
NCS
COOH
HOOC
NK77-7 =
Scheme 2- Synthetic route to sensitizers SD-1 and K77-7
2.3. Purification of Ru-complexes
SD-1 was purified on a column using Sephadex LH-20 as the stationary phase and pure methanol
as the mobile phase. The crude dye of SD-1 was dissolved in a mixture of methanol and TBAOH
and loaded on Sephadex LH-20, and the compound was eluted using clean methanol. The main
band was collected and acidified using 0.1M HCl until the pH dropped to 2.0, and the acidified
solution was kept in a refrigerator for 48 hours. Then, the precipitates were filtered, washed with
plenty of de-ionized water to remove remaining HCl. The same purification procedure was
repeated three times in order to obtain SD-1 in the pure form. Complexes K77-7 was also
purified using the same procedure.
3. Analytical Measurements:
3.1 UV-Vis Spectra
UV-Visible spectra were measured by using Cary 300 spectrophotometer. A clean DMF solution
of 2 × 10⁻⁵ M of each dye was prepared and spectra were recorded using 1 cm path length quartz
cell. Molar absorptivity was measured by using Beer-lambert law:
ε = A / c l
3.2. Fluorescence Spectra
Fluorescence and emission decay were recorded at room temperature on a Fluorolog-3
spectrofluorometer (HORIBA Jobin Yvon Inc.
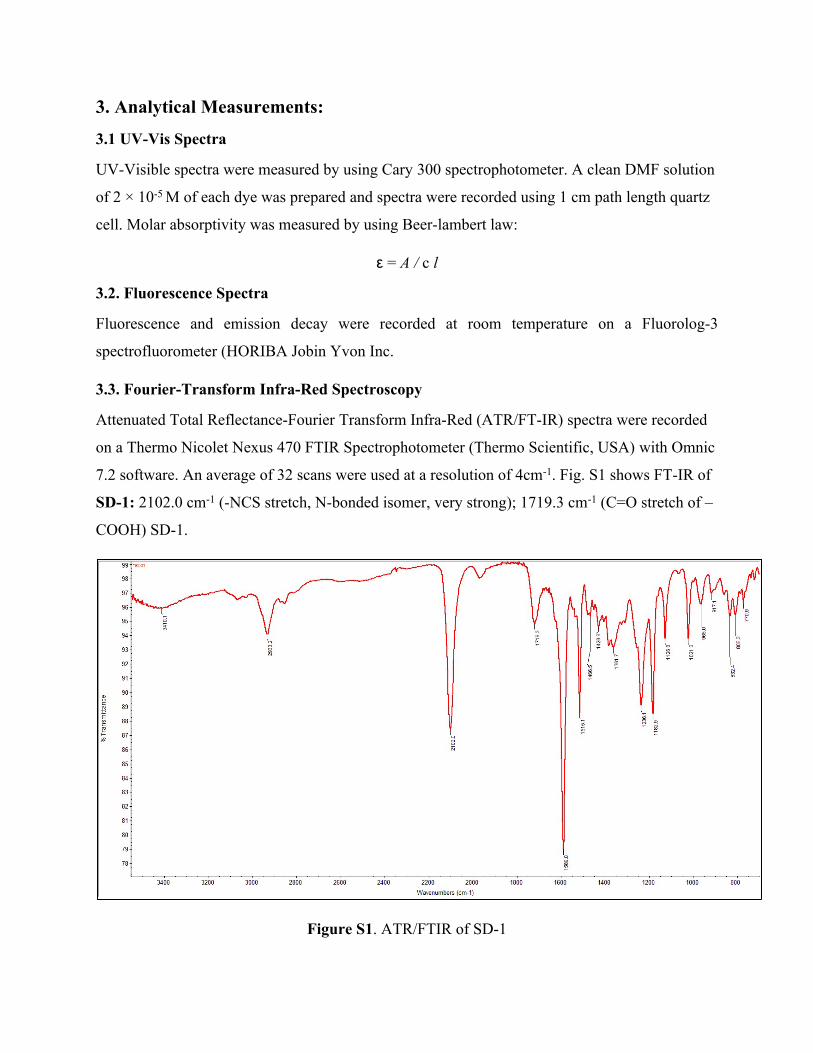
3.3. Fourier-Transform Infra-Red Spectroscopy
Attenuated Total Reflectance-Fourier Transform Infra-Red (ATR/FT-IR) spectra were recorded
on a Thermo Nicolet Nexus 470 FTIR Spectrophotometer (Thermo Scientific, USA) with Omnic
7.2 software. An average of 32 scans were used at a resolution of 4cm-1. Fig. S1 shows FT-IR of
SD-1: 2102.0 cm-1 (-NCS stretch, N-bonded isomer, very strong); 1719.3 cm-1 (C=O stretch of –
COOH) SD-1.
Figure S1. ATR/FTIR of SD-1
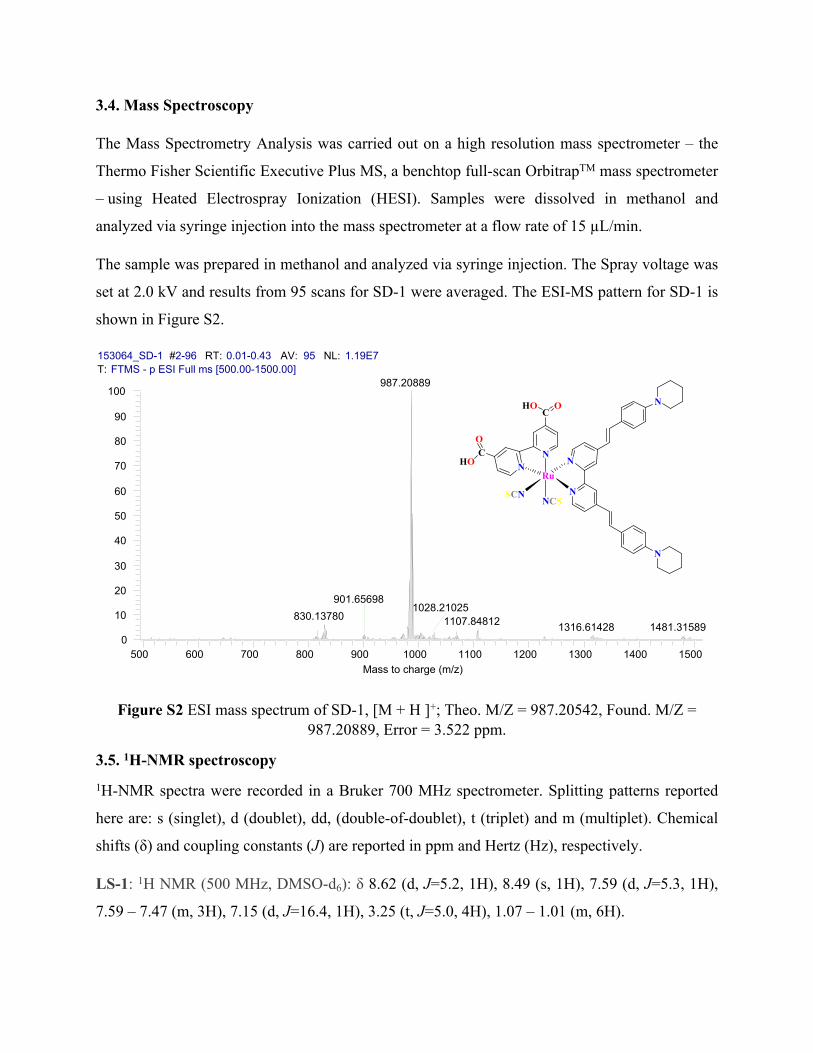
3.4. Mass Spectroscopy
The Mass Spectrometry Analysis was carried out on a high resolution mass spectrometer – the
Thermo Fisher Scientific Executive Plus MS, a benchtop full-scan OrbitrapTM mass spectrometer
– using Heated Electrospray Ionization (HESI). Samples were dissolved in methanol and
analyzed via syringe injection into the mass spectrometer at a flow rate of 15 µL/min.
The sample was prepared in methanol and analyzed via syringe injection. The Spray voltage was
set at 2.0 kV and results from 95 scans for SD-1 were averaged. The ESI-MS pattern for SD-1 is
shown in Figure S2.
153064_SD-1 #2-96 RT: 0.01-0.43 AV: 95 NL: 1.19E7T: FTMS - p ESI Full ms [500.00-1500.00]
500 600 700 800 900 1000 1100 1200 1300 1400 15000
10
20
30
40
50
60
70
80
90
100987.20889
830.13780 1107.848121028.21025
901.65698
1316.61428 1481.31589
N
NRu
SCN
NN
NCS
C
C
N
N
OHO
O
HO
Mass to charge (m/z)
Figure S2 ESI mass spectrum of SD-1, [M + H ]+; Theo. M/Z = 987.20542, Found. M/Z = 987.20889, Error = 3.522 ppm.
3.5. 1H-NMR spectroscopy1H-NMR spectra were recorded in a Bruker 700 MHz spectrometer. Splitting patterns reported
here are: s (singlet), d (doublet), dd, (double-of-doublet), t (triplet) and m (multiplet). Chemical
shifts (δ) and coupling constants (J) are reported in ppm and Hertz (Hz), respectively.
LS-1: 1H NMR (500 MHz, DMSO-d6): δ 8.62 (d, J=5.2, 1H), 8.49 (s, 1H), 7.59 (d, J=5.3, 1H),
7.59 – 7.47 (m, 3H), 7.15 (d, J=16.4, 1H), 3.25 (t, J=5.0, 4H), 1.07 – 1.01 (m, 6H).
SD-I 3rd_C01.mpr<I> vs. Ewe, cycle 1
Ew e /V vs. Ag/Ag+10.50-0.5-1
<I>
/m
A
0.03
0.02
0.01
0
SD-1: 1H NMR (500 MHz, DMSO-d6): δ 8.98 – 8.93 (m, 2H), 8.63 (s, 1H), 7.61 (d, J=10.5, 2H),
7.52 (d, J=15.3, 2H), 7.13 – 7.04 (m, 3H), 6.99 (s, 1H), 6.88 – 6.81 (m, 1H), 3.23 – 3.12 (m, 4H),
1.31 – 1.25 (m, 6H).
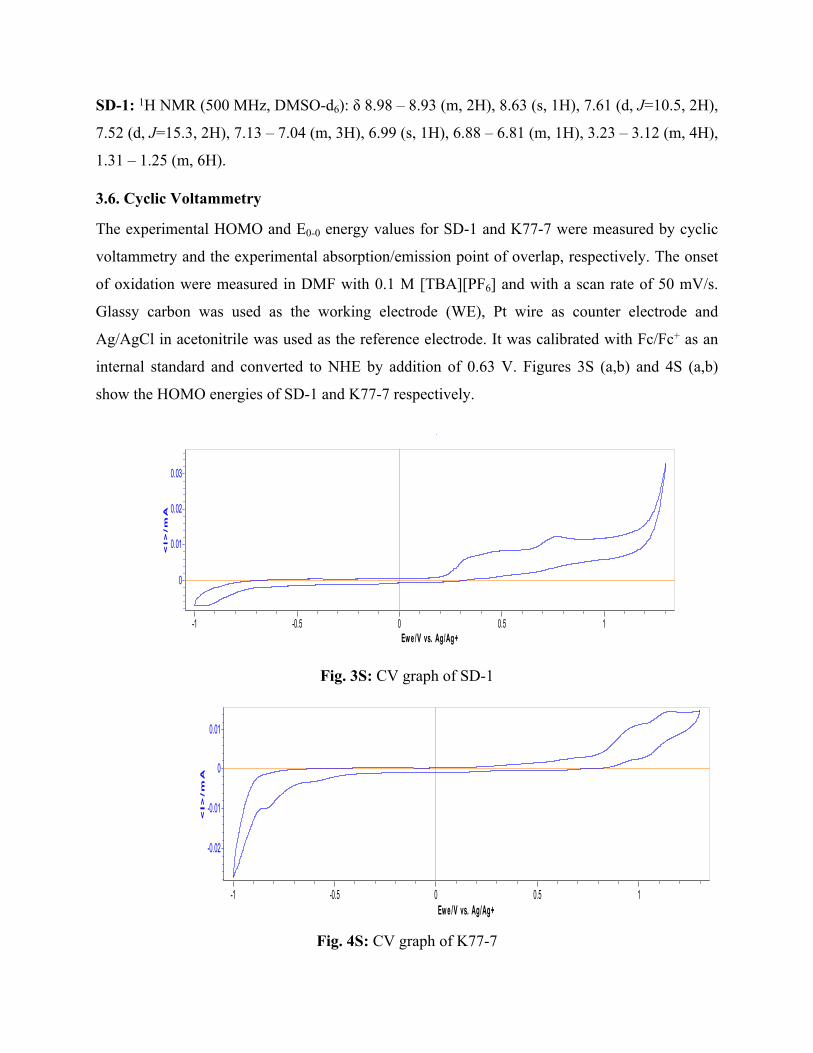
3.6. Cyclic Voltammetry
The experimental HOMO and E0-0 energy values for SD-1 and K77-7 were measured by cyclic
voltammetry and the experimental absorption/emission point of overlap, respectively. The onset
of oxidation were measured in DMF with 0.1 M [TBA][PF6] and with a scan rate of 50 mV/s.
Glassy carbon was used as the working electrode (WE), Pt wire as counter electrode and
Ag/AgCl in acetonitrile was used as the reference electrode. It was calibrated with Fc/Fc+ as an
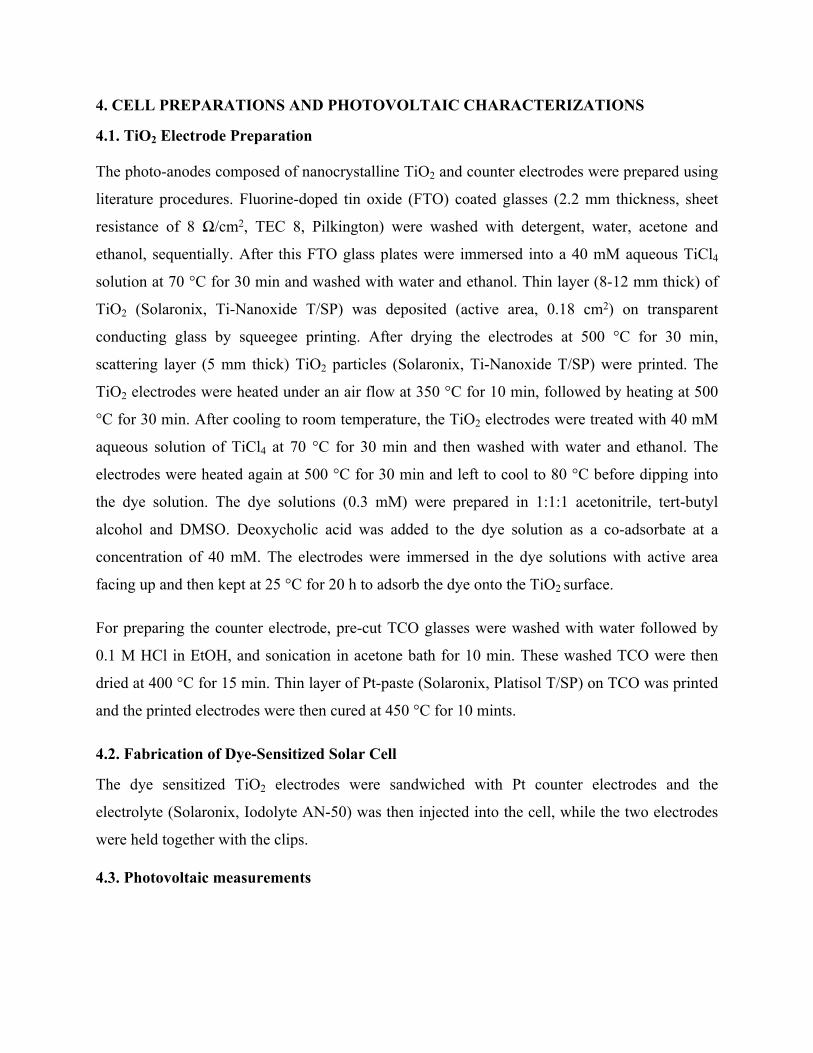
internal standard and converted to NHE by addition of 0.63 V. Figures 3S (a,b) and 4S (a,b)
show the HOMO energies of SD-1 and K77-7 respectively.
Fig. 3S: CV graph of SD-1K77-7 2ND_C01.mpr
<I> vs. Ewe, cycle 1
Ew e /V vs. Ag/Ag+10.50-0.5-1
<I>
/m
A
0.01
0
-0.01
-0.02
Fig. 4S: CV graph of K77-7
4. CELL PREPARATIONS AND PHOTOVOLTAIC CHARACTERIZATIONS
4.1. TiO2 Electrode Preparation
The photo-anodes composed of nanocrystalline TiO2 and counter electrodes were prepared using
literature procedures. Fluorine-doped tin oxide (FTO) coated glasses (2.2 mm thickness, sheet
resistance of 8 Ω/cm2, TEC 8, Pilkington) were washed with detergent, water, acetone and
ethanol, sequentially. After this FTO glass plates were immersed into a 40 mM aqueous TiCl4
solution at 70 °C for 30 min and washed with water and ethanol. Thin layer (8-12 mm thick) of
TiO2 (Solaronix, Ti-Nanoxide T/SP) was deposited (active area, 0.18 cm2) on transparent
conducting glass by squeegee printing. After drying the electrodes at 500 °C for 30 min,
scattering layer (5 mm thick) TiO2 particles (Solaronix, Ti-Nanoxide T/SP) were printed. The
TiO2 electrodes were heated under an air flow at 350 °C for 10 min, followed by heating at 500
°C for 30 min. After cooling to room temperature, the TiO2 electrodes were treated with 40 mM
aqueous solution of TiCl4 at 70 °C for 30 min and then washed with water and ethanol. The
electrodes were heated again at 500 °C for 30 min and left to cool to 80 °C before dipping into
the dye solution. The dye solutions (0.3 mM) were prepared in 1:1:1 acetonitrile, tert-butyl
alcohol and DMSO. Deoxycholic acid was added to the dye solution as a co-adsorbate at a
concentration of 40 mM. The electrodes were immersed in the dye solutions with active area
facing up and then kept at 25 °C for 20 h to adsorb the dye onto the TiO2 surface.
For preparing the counter electrode, pre-cut TCO glasses were washed with water followed by
0.1 M HCl in EtOH, and sonication in acetone bath for 10 min. These washed TCO were then
dried at 400 °C for 15 min. Thin layer of Pt-paste (Solaronix, Platisol T/SP) on TCO was printed
and the printed electrodes were then cured at 450 °C for 10 mints.
4.2. Fabrication of Dye-Sensitized Solar Cell
The dye sensitized TiO2 electrodes were sandwiched with Pt counter electrodes and the
electrolyte (Solaronix, Iodolyte AN-50) was then injected into the cell, while the two electrodes
were held together with the clips.
4.3. Photovoltaic measurements

Photovoltaic measurements of sealed cells were made by illuminating the cell through the
conducting glass from the anode side with a solar simulator (WXS-155S-10) at AM 1.5
illuminations (light intensities: 100 mW cm-2).
4.4. Incident Photon to Current Efficiency (IPCE) Conversion
IPCE measurements were made on a CEP-2000 system (Bunkoh-Keiki Co. Ltd.). IPCE at each
wavelength was calculated using Equation 1, where ISC is the short-circuit photocurrent density
(mAcm-2) under monochromatic irradiation, q is the elementary charge, λ is the wavelength of
incident radiation in nm and P0 is the incident radiative flux in Wm-2.
Equation (1)𝐼𝑃𝐶𝐸 (𝜆) = 1240 𝐼𝑆𝐶
𝑞𝜆𝑃𝑜
The incident photon-to-current conversion efficiency was plotted as a function of wavelength.
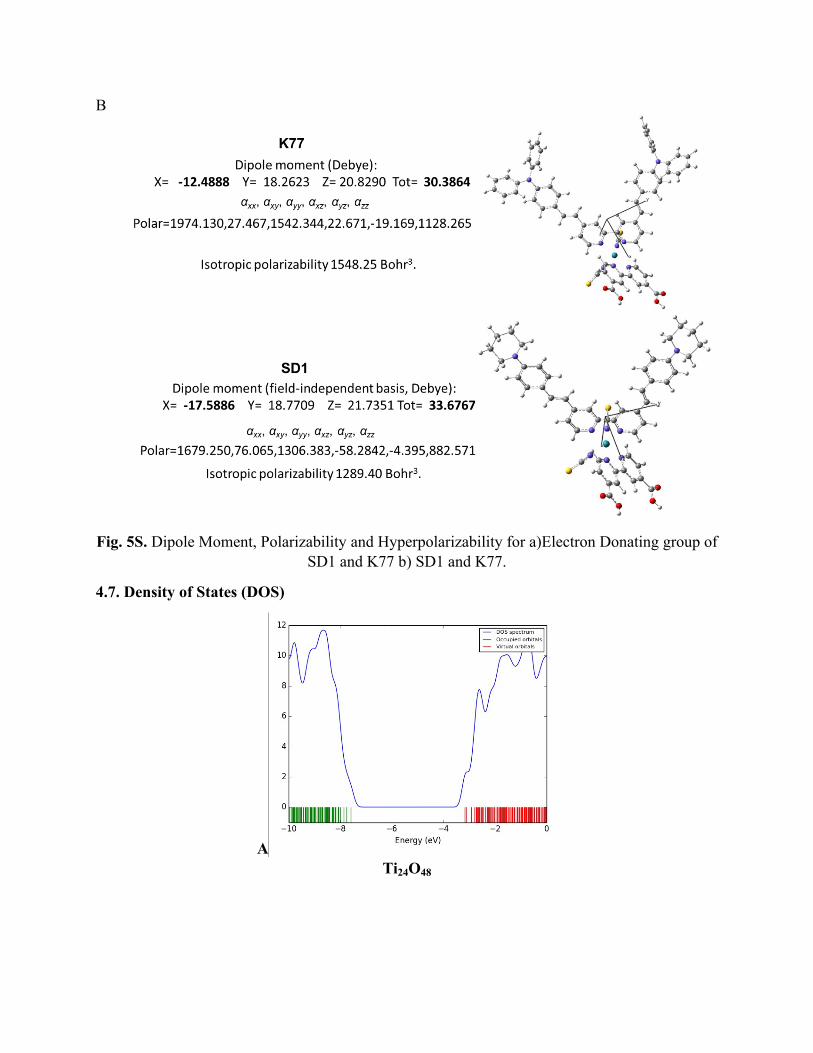
4.5. Dipole Moment and Polarizability
A
B
Fig. 5S. Dipole Moment, Polarizability and Hyperpolarizability for a)Electron Donating group of SD1 and K77 b) SD1 and K77.
4.7. Density of States (DOS)
A
Ti24O48
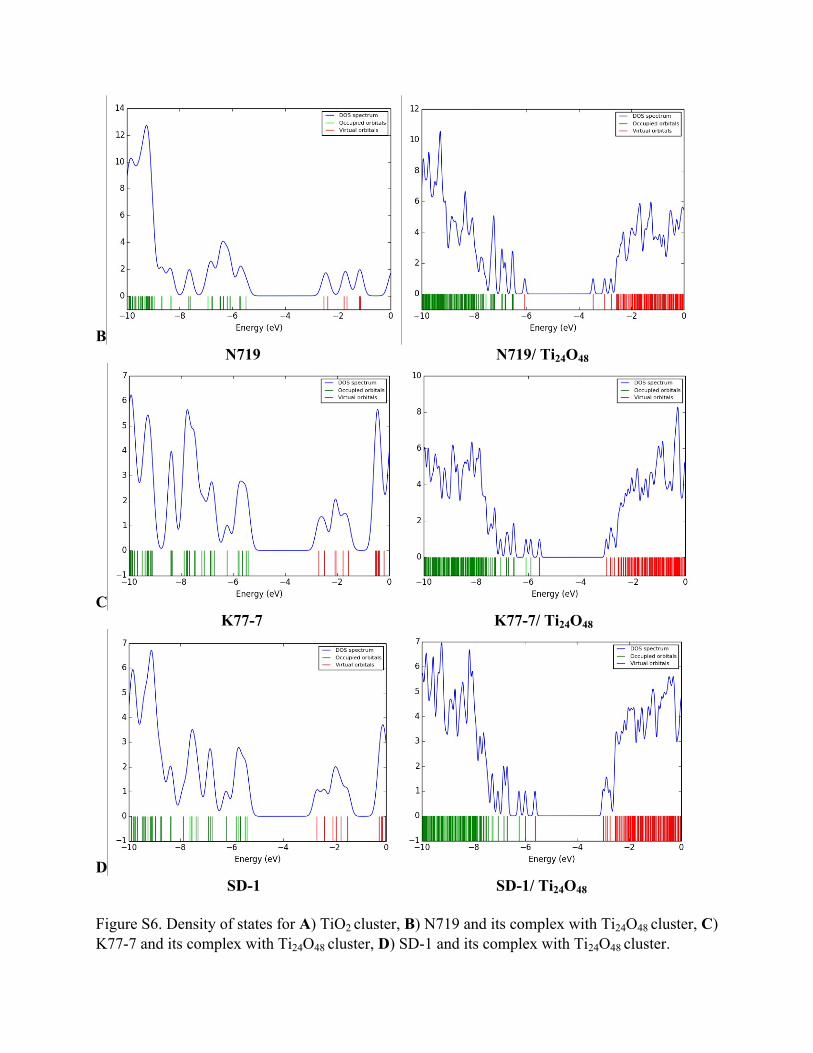
B
N719 N719/ Ti24O48
C K77-7 K77-7/ Ti24O48
D SD-1 SD-1/ Ti24O48
Figure S6. Density of states for A) TiO2 cluster, B) N719 and its complex with Ti24O48 cluster, C) K77-7 and its complex with Ti24O48 cluster, D) SD-1 and its complex with Ti24O48 cluster.