support for farmers' cooperatives -...
TRANSCRIPT
Support for Farmers' Cooperatives
Country Report Malta
Gaetano Buttiġieġ Emanuel Zahra
The 2011-2012 project „Support for Farmers‘ Cooperatives“ is commissioned and funded by the European Commission, DG Agriculture and Rural Development.
Contract Number: 30-CE-0395921/00-42.
The project is managed by Wageningen UR’s Agricultural Economics Research Institute LEI and Wageningen University. Project managers: Krijn J. Poppe and Jos Bijman.
Other members of the consortium are:
Pellervo Economic Research PTT, Finland: Perttu Pyykkönen University of Helsinki, Finland: Petri Ollila Agricultural Economics Research Institute, Greece: Constantine Iliopoulos Justus Liebig University Giessen, Germany: Rainer Kühl Humboldt University Berlin, Germany: Konrad Hagedorn, Markus Hanisch and
Renate Judis HIVA Katholieke Universiteit Leuven, Belgium: Caroline Gijselinckx Rotterdam School of Management, Erasmus University, The Netherlands: George
Hendrikse and Tony Hak
How to cite this report:
Buttiġieġ, G., Zahra, E. (2012). Support for Farmers’ Cooperatives; Country Report Malta. Wageningen: Wageningen UR.
Disclaimer:
This study, financed by the European Commission, was carried out by a consortium under the management of LEI Wageningen UR. The conclusions and recommendations presented in this report are the sole responsibility of the research consortium and do not necessarily reflect the opinion of the Commission or anticipate its future policies.
Support for Farmers' Cooperatives
Country Report Malta
Gaetano Buttiġieġ
Independent Consultant, Malta
Emanuel Zahra
Independent Consultant, Malta
November 2012
Corresponding authors: Emanuel Zahra Gaetano Buttiġieġ 41, Alexader Street c/o KPĦ, A38, Industrial Estate Cospicua BML 1212 Marsa MRS 9081 Malta Malta
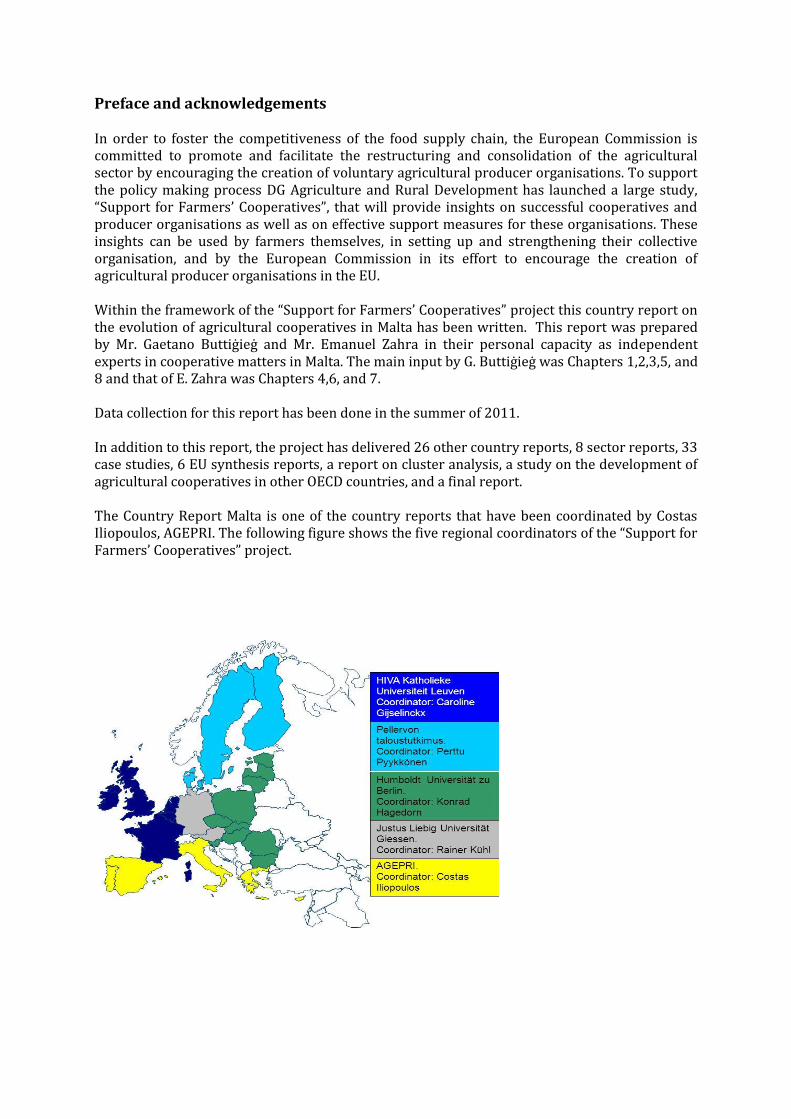
Preface and acknowledgements In order to foster the competitiveness of the food supply chain, the European Commission is committed to promote and facilitate the restructuring and consolidation of the agricultural sector by encouraging the creation of voluntary agricultural producer organisations. To support the policy making process DG Agriculture and Rural Development has launched a large study, “Support for Farmers’ Cooperatives”, that will provide insights on successful cooperatives and producer organisations as well as on effective support measures for these organisations. These insights can be used by farmers themselves, in setting up and strengthening their collective organisation, and by the European Commission in its effort to encourage the creation of agricultural producer organisations in the EU. Within the framework of the “Support for Farmers’ Cooperatives” project this country report on the evolution of agricultural cooperatives in Malta has been written. This report was prepared by Mr. Gaetano Buttiġieġ and Mr. Emanuel Zahra in their personal capacity as independent experts in cooperative matters in Malta. The main input by G. Buttiġieġ was Chapters 1,2,3,5, and 8 and that of E. Zahra was Chapters 4,6, and 7. Data collection for this report has been done in the summer of 2011. In addition to this report, the project has delivered 26 other country reports, 8 sector reports, 33 case studies, 6 EU synthesis reports, a report on cluster analysis, a study on the development of agricultural cooperatives in other OECD countries, and a final report. The Country Report Malta is one of the country reports that have been coordinated by Costas Iliopoulos, AGEPRI. The following figure shows the five regional coordinators of the “Support for Farmers’ Cooperatives” project.
Table of contents
1. Introduction ........................................................................................... 6 1.1 Objective of the study ....................................................................................................... 6
1.2 Analytical framework .......................................................................................................... 6
1.3 Definition of the cooperative ................................................................................................ 7
1.4 Method of data collection .................................................................................................... 8
1.5 Period under study ............................................................................................................. 8
2 Facts and figures on agriculture ................................................................. 9 2.1 Share of agriculture in the economy ..................................................................................... 9
2.2 Agricultural output per sector .............................................................................................. 9
2.3 Development in the number of farms .................................................................................. 11
2.4 Size of farms ................................................................................................................... 12
2.5 Age of farmers: distribution of farms to age classes ............................................................ 13
2.6 Specialisation of farm production ....................................................................................... 14
2.7 Economic indicators of farms ............................................................................................. 15
3 Evolution, position and performance of cooperatives .................................. 17 3.1 Types of cooperatives ....................................................................................................... 17
3.2 Market share of farmers' cooperatives in the food chain ......................................................... 24
3.3 List of top 50 largest farmers’ cooperatives ......................................................................... 27
3.4 List of top 5 largest farmers’ cooperatives per sector ............................................................. 29
3.5 Transnational cooperatives ................................................................................................ 29
3.6 Interesting Cooperative Experiences…………………………………………………………………………………………………29
4 Description of the evolution and position of individual cooperatives. ............. 32 4.1 Data gathering per cooperative .......................................................................................... 34
4.2 Position in the food chain .................................................................................................. 34
4.3 Institutional environment .................................................................................................. 36
4.4 Internal Governance ......................................................................................................... 38
4.5 Performance of the cooperatives ........................................................................................ 38
5 Sector analysis ...................................................................................... 40 5.1 Introduction .................................................................................................................... 40
5.2 Cereals........................................................................................................................... 43
5.3 Sugar ............................................................................................................................. 44
5.4 Fruit and vegetables ......................................................................................................... 44
5.5 Olive oil and table olives ................................................................................................... 46
5.6 Wine .............................................................................................................................. 48
5.7 Dairy ............................................................................................................................. 51
5.8 Sheep meat .................................................................................................................... 53
5.9 Pig meat ......................................................................................................................... 54
5.10 EU Policies and Agriculture in Malta – Future Challenges ...................................................... 56
6 Overview of policy measures ................................................................... 58 6.1 Regulatory framework ...................................................................................................... 58
6.2 Policy measures ............................................................................................................... 58
6.3 Other legal issues ............................................................................................................ 61
7 Assessment of developments and role of policy measures ........................... 63 7.1 Explaining the performance of cooperatives ......................................................................... 63
7.2 Effects of policy measures on the competitive position of cooperatives ..................................... 64
8 Future research ..................................................................................... 65
REFERENCES ........................................................................................... 67

5
6
1. Introduction
1.1 Objective of the study
The imbalances in bargaining power between the contracting parties in the food supply chain have drawn much attention, also from policy makers. The European Commission is committed to facilitate the restructuring of the sector by encouraging the creation of voluntary agricultural producer organisations. DG Agriculture and Rural Development has launched a large study, “Support for Farmers' Cooperatives”, that will provide the background knowledge that will help farmers organise themselves in cooperatives as a tool to consolidate their market orientation and so generate a solid market income. In the framework of this study, this report provides the relevant knowledge from Malta.
In this context, the specific objectives of the project, and this country report, are the following:
First, it will provide a comprehensive description of the current level of development of cooperatives and other forms of producer organisations in Malta. The description presented in this report will pay special attention to the following drivers and constraints for the development of cooperatives:
Economic and fiscal incentives or disincentives and other public support measures at regional and national;
Legal aspects, including those related to competition law and tax law;
Historical, cultural and sociologically relevant aspects;
The relationship between cooperatives/POs and the actors of the food chain;
Internal governance of the cooperatives/POs.
Second, identify laws and regulations that enable or constrain cooperative development and third, to identify specific support measures and initiatives which have proved to be effective and efficient for promoting cooperatives and other forms of producer organisations in the agricultural sector in Malta.
1.2 Analytical framework
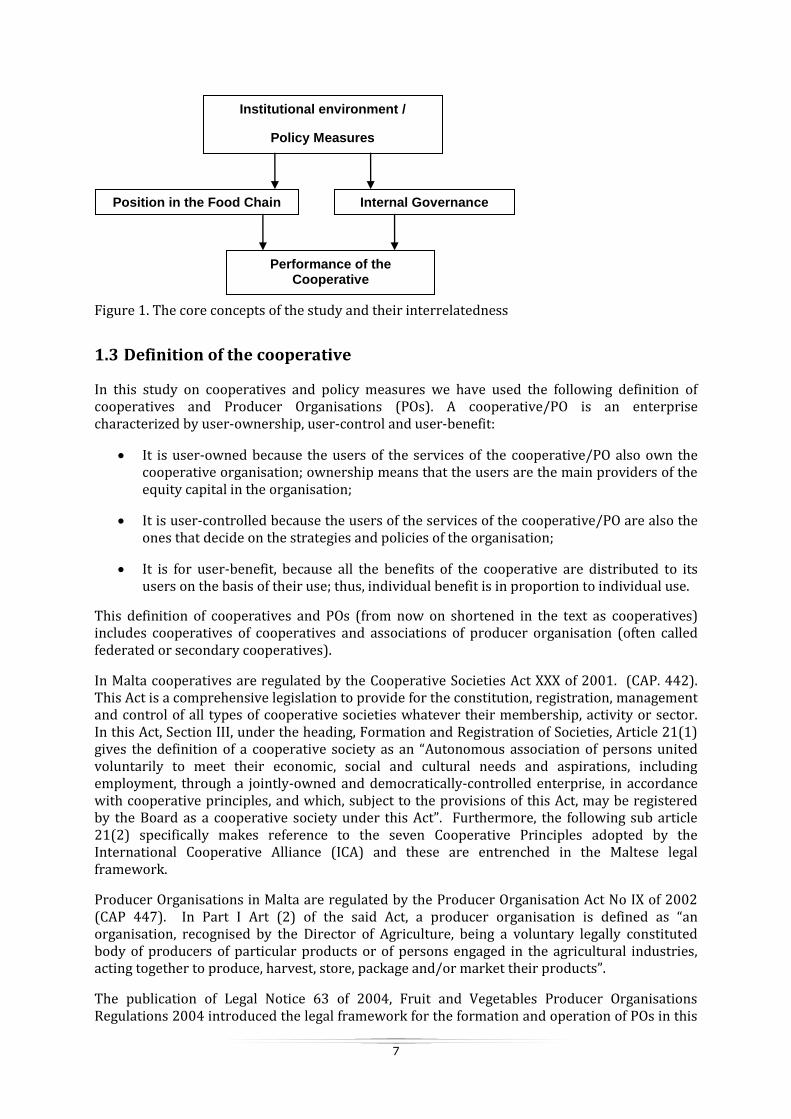
There are at least three main factors that determine the success of cooperatives in current food chains. These factors relate to (a) position in the food supply chain, (b) internal governance, and (c) the institutional environment. The position of the cooperative in the food supply chain refers to the competitiveness of the cooperative vis-à-vis its customers, such as processors, wholesalers and retailers. The internal governance refers to its decision-making processes, the role of the different governing bodies, and the allocation of control rights to the management (and the agency problems that goes with delegation of decision rights). The institutional environment refers to the social, cultural, political and legal context in which the cooperative is operating, and which may have a supporting or constraining effect on the performance of the cooperative. Those three factors constitute the three building blocks of the analytical framework applied in this study (Figure 1).
7
Figure 1. The core concepts of the study and their interrelatedness
1.3 Definition of the cooperative
In this study on cooperatives and policy measures we have used the following definition of cooperatives and Producer Organisations (POs). A cooperative/PO is an enterprise characterized by user-ownership, user-control and user-benefit:
It is user-owned because the users of the services of the cooperative/PO also own the cooperative organisation; ownership means that the users are the main providers of the equity capital in the organisation;
It is user-controlled because the users of the services of the cooperative/PO are also the ones that decide on the strategies and policies of the organisation;
It is for user-benefit, because all the benefits of the cooperative are distributed to its users on the basis of their use; thus, individual benefit is in proportion to individual use.
This definition of cooperatives and POs (from now on shortened in the text as cooperatives) includes cooperatives of cooperatives and associations of producer organisation (often called federated or secondary cooperatives).
In Malta cooperatives are regulated by the Cooperative Societies Act XXX of 2001. (CAP. 442). This Act is a comprehensive legislation to provide for the constitution, registration, management and control of all types of cooperative societies whatever their membership, activity or sector. In this Act, Section III, under the heading, Formation and Registration of Societies, Article 21(1) gives the definition of a cooperative society as an “Autonomous association of persons united voluntarily to meet their economic, social and cultural needs and aspirations, including employment, through a jointly-owned and democratically-controlled enterprise, in accordance with cooperative principles, and which, subject to the provisions of this Act, may be registered by the Board as a cooperative society under this Act”. Furthermore, the following sub article 21(2) specifically makes reference to the seven Cooperative Principles adopted by the International Cooperative Alliance (ICA) and these are entrenched in the Maltese legal framework.
Producer Organisations in Malta are regulated by the Producer Organisation Act No IX of 2002 (CAP 447). In Part I Art (2) of the said Act, a producer organisation is defined as “an organisation, recognised by the Director of Agriculture, being a voluntary legally constituted body of producers of particular products or of persons engaged in the agricultural industries, acting together to produce, harvest, store, package and/or market their products”.
The publication of Legal Notice 63 of 2004, Fruit and Vegetables Producer Organisations Regulations 2004 introduced the legal framework for the formation and operation of POs in this
Institutional environment /
Policy Measures
Position in the Food Chain Internal Governance
Performance of the Cooperative
8
sector including fruit, vegetables, products intended for processing, citrus fruit, nuts and mushrooms. Moreover, Legal Notice 237 of 2007 Producer Organisations (Certain Products) Regulations, 2007 introduced the regulations for the setting up of producer organisations in other agricultural sectors – potatoes, pig meat, milk, poultry, traditional cheeslets made from sheep and/or goats milk, honey, rabbit meat.
In general it is a condition on every Producer Organisation to meet the requirements of Council Regulation (EC) 1234/2007 and Commission Regulation (EC) 1580/2007.
In Malta both organisations – cooperatives and Producer Organisations are registered and regulated by Government authorities through the Cooperatives Board and the Agriculture Directorate respectively.
Both farmers’ organisations must have a minimum of five members and these must belong to only one organisation for the same product category. Under Maltese legislation, membership in both organisations is voluntary.
Both organisations must have their own specific conditions for the legal constitution and rules of the organisation - referred to as the Statute in the case of cooperatives and rules of Association in the case of producer organisations.
1.4 Method of data collection
Multiple sources of information have been used, such as databases, interviews, corporate documents, academic and trade journal articles. The databases used are FADN, Eurostat and a database from DG Agri on the producer organisations in the fruit and vegetable sector. Data, statistics and information have also been obtained from relevant Maltese government sources at the Ministry for Resources and Rural Affairs, Department of Agriculture, Managing Authority Rural Development, Paying Agency, Cooperatives Board (National Cooperatives Regulator), National Statistics Office in Malta. In addition, information on individual cooperatives has been collected by studying annual reports, other corporate publications and websites. Interviews have been conducted with representatives of Koperattivi Malta - the national association of cooperatives; managers and board members of individual cooperatives, and academic or professional experts on cooperatives.
1.5 Period under study
This report covers the period from 2000 to 2010 and presents the most up-to-date information. This refers to both the factual data that has been collected and the literature that has been reviewed.
9
2 Facts and figures on agriculture
2.1 Share of agriculture in the economy
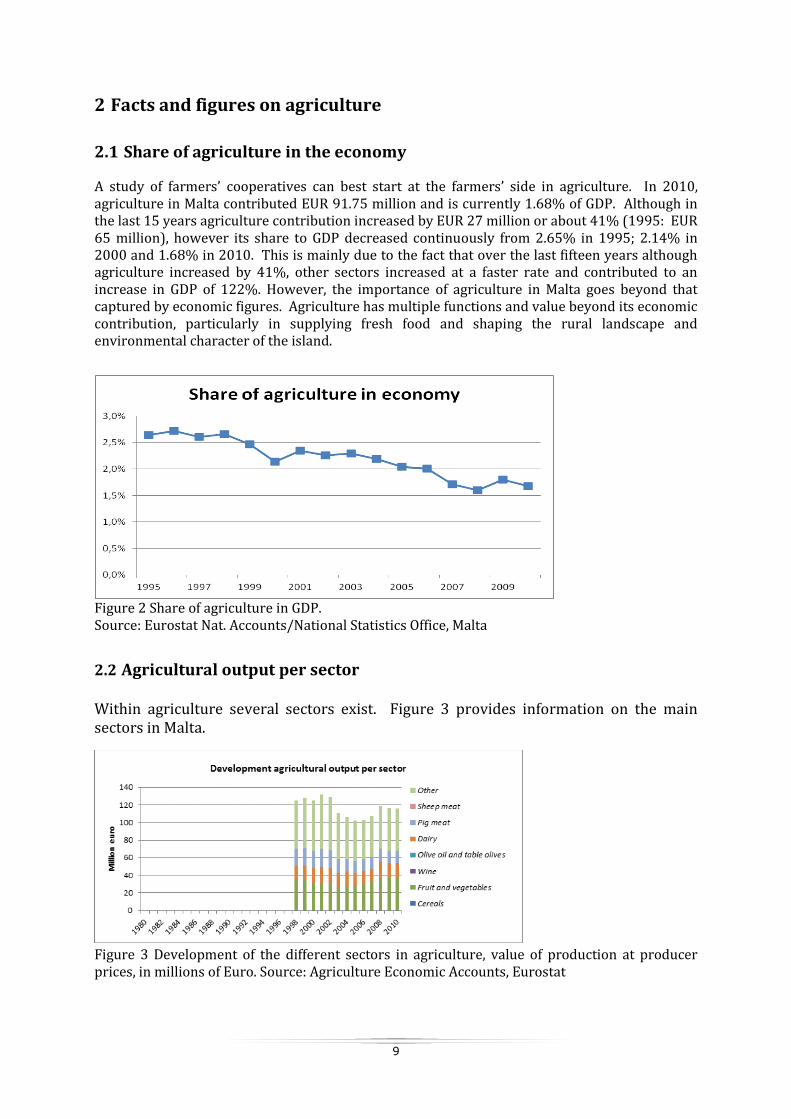
A study of farmers’ cooperatives can best start at the farmers’ side in agriculture. In 2010, agriculture in Malta contributed EUR 91.75 million and is currently 1.68% of GDP. Although in the last 15 years agriculture contribution increased by EUR 27 million or about 41% (1995: EUR 65 million), however its share to GDP decreased continuously from 2.65% in 1995; 2.14% in 2000 and 1.68% in 2010. This is mainly due to the fact that over the last fifteen years although agriculture increased by 41%, other sectors increased at a faster rate and contributed to an increase in GDP of 122%. However, the importance of agriculture in Malta goes beyond that captured by economic figures. Agriculture has multiple functions and value beyond its economic contribution, particularly in supplying fresh food and shaping the rural landscape and environmental character of the island.
Figure 2 Share of agriculture in GDP. Source: Eurostat Nat. Accounts/National Statistics Office, Malta
2.2 Agricultural output per sector
Within agriculture several sectors exist. Figure 3 provides information on the main sectors in Malta.
Figure 3 Development of the different sectors in agriculture, value of production at producer prices, in millions of Euro. Source: Agriculture Economic Accounts, Eurostat
10
In 2010, agricultural goods output in Malta totalled EUR 116 with EUR 70 million animal output and EUR 46 million crop output.
The animal output is subdivided into animals for slaughter (EUR 44 million) and animal products mainly milk and eggs (EUR 25million).
The crop output is mainly composed of fruit and vegetables including horticulture (EUR 40 million) and forage and potatoes (EUR 7 million).
Figure 3 clearly shows that Maltese agriculture is dominated by three main sectors – Fruit and Vegetables, Milk and Pig meat; each sector contributing 34%, 15% and 11% respectively of the total agricultural goods output.
Sheep/goat meat, wine and olives/olive oil sectors are very small sectors which do not even exceed 1% of the agricultural goods output. Cereals and sugar sectors do not exist in Malta.
Apart from the 8 sectors under consideration in this report, the “other” crop and animal products sectors together account for about 40% of the total agricultural output in Malta. The “other” crop output includes forage plants, potatoes, plants and flowers while the “other” animal output includes cattle, poultry, other animals and eggs.
Apart from the agricultural output value, it is also worth mentioning that the utilised agricultural area in Malta subdivided by crop type shows that about 45% is devoted to forage production; about 34% to potatoes, kitchen and market gardening and about 13% to vineyards and permanent cropping (NSO, Agriculture and Fisheries 2008).
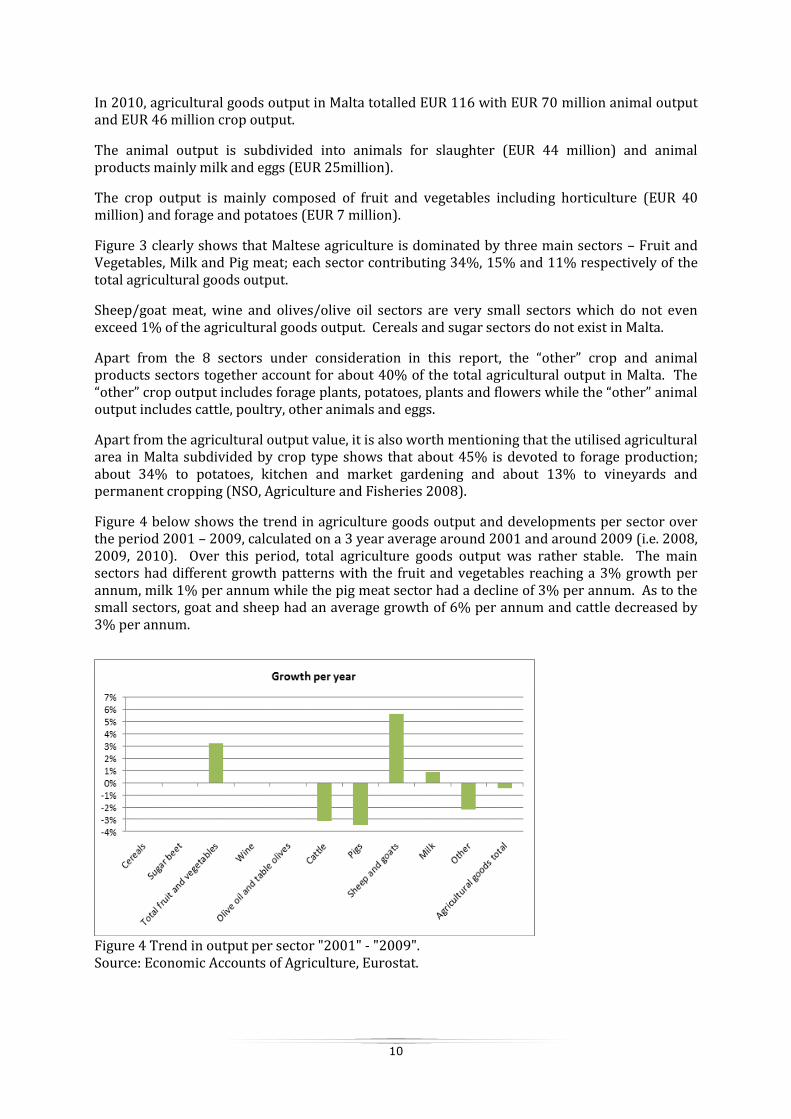
Figure 4 below shows the trend in agriculture goods output and developments per sector over the period 2001 – 2009, calculated on a 3 year average around 2001 and around 2009 (i.e. 2008, 2009, 2010). Over this period, total agriculture goods output was rather stable. The main sectors had different growth patterns with the fruit and vegetables reaching a 3% growth per annum, milk 1% per annum while the pig meat sector had a decline of 3% per annum. As to the small sectors, goat and sheep had an average growth of 6% per annum and cattle decreased by 3% per annum.
Figure 4 Trend in output per sector "2001" - "2009". Source: Economic Accounts of Agriculture, Eurostat.

11
2.3 Development in the number of farms
The number of farms in Malta is given in Table 1 and Figure 5 as per National Statistics Office, Malta. The information shows clearly that the main livestock sectors – Pig meat and Dairy have relatively fewer farms highlighting also the more intensive production in these sectors. There is a different scenario in the sheep and goat sector, as these farms are relatively very small units.
On the contrary, the other main sector – Fruit and Vegetables includes a relatively much larger number of holdings highlighting clearly fragmentation of agricultural land within this sector. Majority of holdings in this sector are relatively small, with half of these with less than 0.5 hectare per holding. Even the small sectors wine, and olive oil/table olives, when compared to their output are smaller units. This also highlights the land fragmentation problem in the crop sector. As shown in Figure 5, practically in all main sectors over the period 2003 – 2007 the number of farms per sector is decreasing.
Table 1 Number of farms 2000 2007 % change per year
Cereals #N/A 0 #N/A Sugar #N/A 0 #N/A Pig meat #N/A 250 #N/A Sheep meat #N/A 270 #N/A Total fruits and vegetables #N/A 1,390 #N/A Horticulture #N/A 1,170 fruit and citrus fruit #N/A 220 Olive oil and table olives #N/A 50 #N/A Wine #N/A 220 #N/A Dairy #N/A 100 #N/A Beef #N/A 0 #N/A
Source: Eurostat, Farm Structure Survey.
Figure 5 Number of farms 2000 - 2007 with data per specialist type of farming Source: Eurostat, Farm Structure Survey.
12
2.4 Size of farms
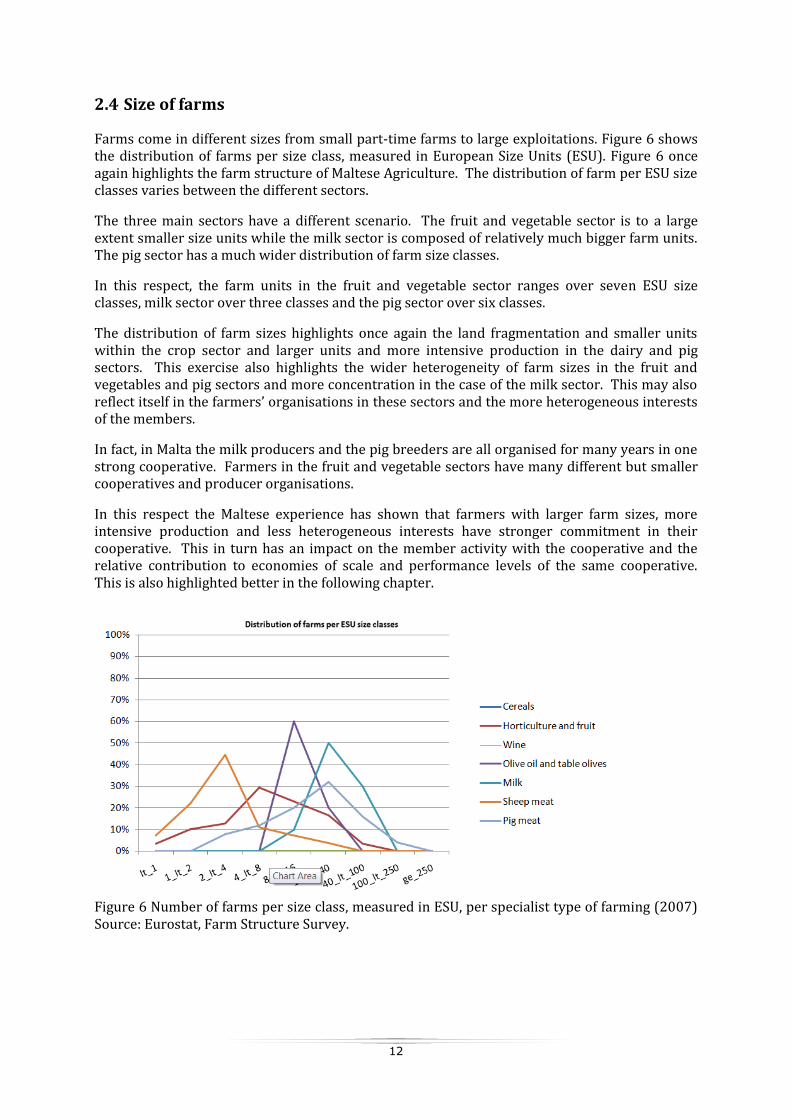
Farms come in different sizes from small part-time farms to large exploitations. Figure 6 shows the distribution of farms per size class, measured in European Size Units (ESU). Figure 6 once again highlights the farm structure of Maltese Agriculture. The distribution of farm per ESU size classes varies between the different sectors.
The three main sectors have a different scenario. The fruit and vegetable sector is to a large extent smaller size units while the milk sector is composed of relatively much bigger farm units. The pig sector has a much wider distribution of farm size classes.
In this respect, the farm units in the fruit and vegetable sector ranges over seven ESU size classes, milk sector over three classes and the pig sector over six classes.
The distribution of farm sizes highlights once again the land fragmentation and smaller units within the crop sector and larger units and more intensive production in the dairy and pig sectors. This exercise also highlights the wider heterogeneity of farm sizes in the fruit and vegetables and pig sectors and more concentration in the case of the milk sector. This may also reflect itself in the farmers’ organisations in these sectors and the more heterogeneous interests of the members.
In fact, in Malta the milk producers and the pig breeders are all organised for many years in one strong cooperative. Farmers in the fruit and vegetable sectors have many different but smaller cooperatives and producer organisations.
In this respect the Maltese experience has shown that farmers with larger farm sizes, more intensive production and less heterogeneous interests have stronger commitment in their cooperative. This in turn has an impact on the member activity with the cooperative and the relative contribution to economies of scale and performance levels of the same cooperative. This is also highlighted better in the following chapter.
Figure 6 Number of farms per size class, measured in ESU, per specialist type of farming (2007) Source: Eurostat, Farm Structure Survey.
13
2.5 Age of farmers: distribution of farms to age classes
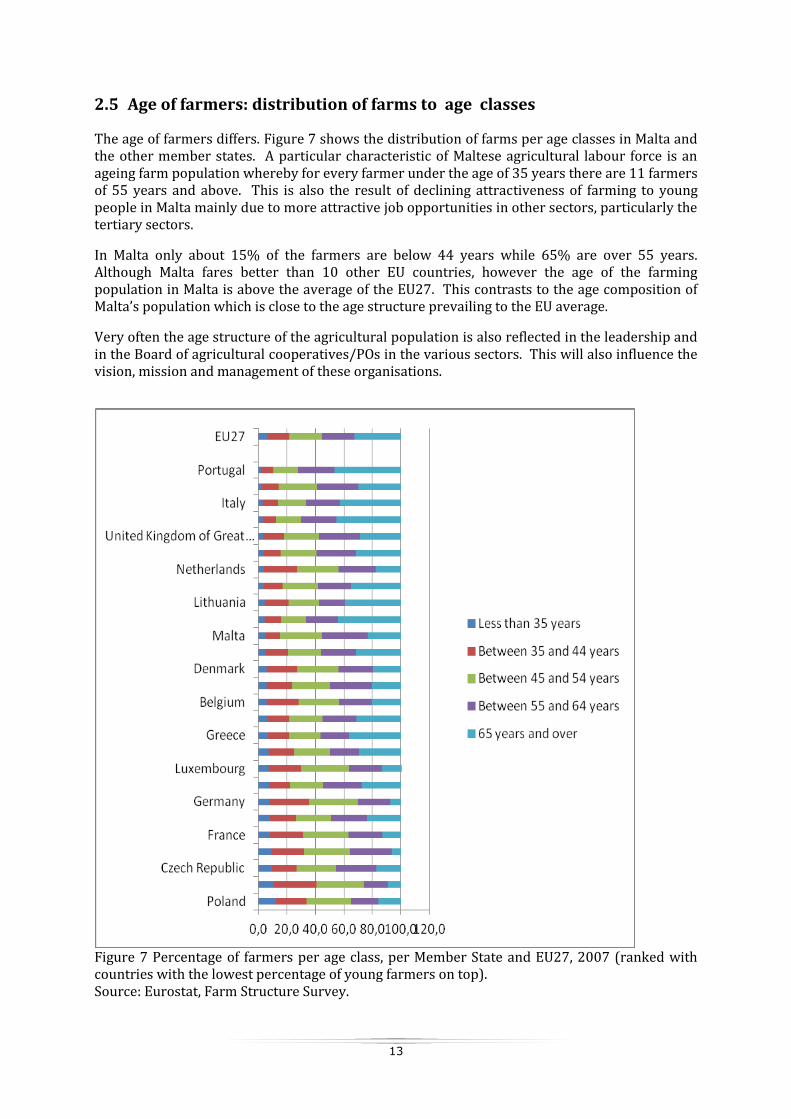
The age of farmers differs. Figure 7 shows the distribution of farms per age classes in Malta and the other member states. A particular characteristic of Maltese agricultural labour force is an ageing farm population whereby for every farmer under the age of 35 years there are 11 farmers of 55 years and above. This is also the result of declining attractiveness of farming to young people in Malta mainly due to more attractive job opportunities in other sectors, particularly the tertiary sectors.
In Malta only about 15% of the farmers are below 44 years while 65% are over 55 years. Although Malta fares better than 10 other EU countries, however the age of the farming population in Malta is above the average of the EU27. This contrasts to the age composition of Malta’s population which is close to the age structure prevailing to the EU average.
Very often the age structure of the agricultural population is also reflected in the leadership and in the Board of agricultural cooperatives/POs in the various sectors. This will also influence the vision, mission and management of these organisations.
Figure 7 Percentage of farmers per age class, per Member State and EU27, 2007 (ranked with countries with the lowest percentage of young farmers on top). Source: Eurostat, Farm Structure Survey.
14
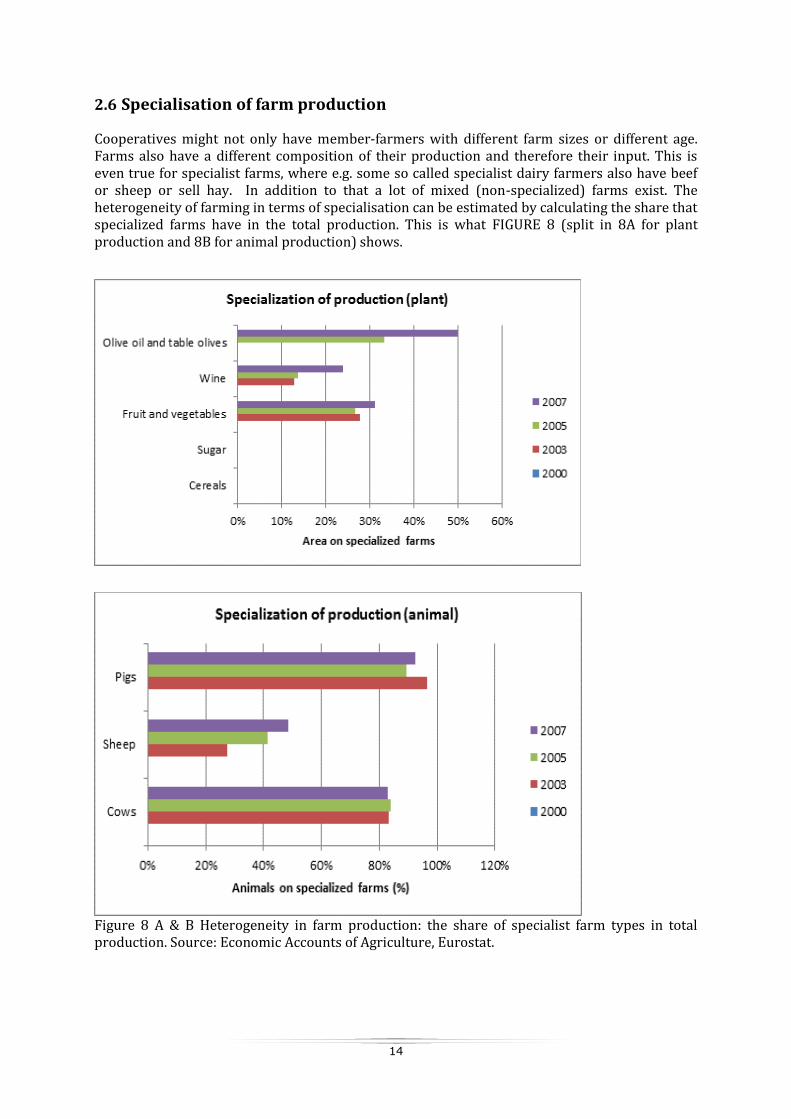
2.6 Specialisation of farm production
Cooperatives might not only have member-farmers with different farm sizes or different age. Farms also have a different composition of their production and therefore their input. This is even true for specialist farms, where e.g. some so called specialist dairy farmers also have beef or sheep or sell hay. In addition to that a lot of mixed (non-specialized) farms exist. The heterogeneity of farming in terms of specialisation can be estimated by calculating the share that specialized farms have in the total production. This is what FIGURE 8 (split in 8A for plant production and 8B for animal production) shows.
Figure 8 A & B Heterogeneity in farm production: the share of specialist farm types in total production. Source: Economic Accounts of Agriculture, Eurostat.
15
In the plant production, specialisation of production has increased in all sectors over the period 2003 – 2007. The share of specialised farms (area) in total sector production increased from 28% to 31% in the fruit and vegetable sectors; from 13% to 24% in the wine sector and from 0% to 50% in the olive oil and table olives sector. Without doubt farm specialisation in these sectors is on the increase. However, in 2007 most of the farms in these sectors were not limited only to this activity. This reflects the prominence of heterogeneity in farm production in these sectors.
This situation may also create heterogeneity of interest among the farming community in these sectors. This may be one reason why in Malta there are various cooperatives/POs in these sectors and farmers may be members in different organisations.
In the livestock sector, specialisation is high in the dairy and pig sectors at 83% and 92% respectively. Although to a lesser extent, this development is also happening in the smaller and more fragmented sector of goats and sheep – the animals on specialised farms increased from 27% in 2003 to 49% in 2007.
Hence, most of the farms in the dairy and pig sectors and half of the farms in the goat/sheep sector are limited to the activity in their sector. Specialisation in these sectors is also the result of more intensive production with much higher farm investment.
In Malta this situation may also be reflected in the fact that since many years pig breeders and milk producers have been organised in their respective cooperative with a multipurpose objective to cater better for the needs and specialisation of the members.
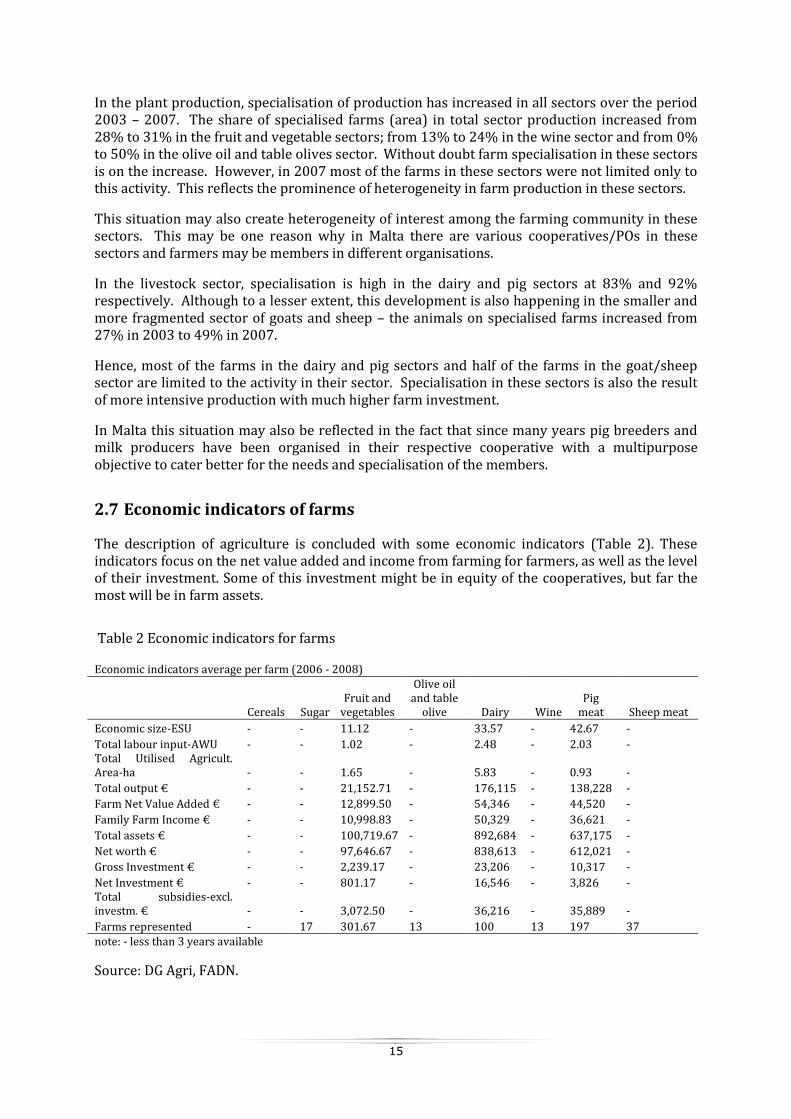
2.7 Economic indicators of farms
The description of agriculture is concluded with some economic indicators (Table 2). These indicators focus on the net value added and income from farming for farmers, as well as the level of their investment. Some of this investment might be in equity of the cooperatives, but far the most will be in farm assets.
Table 2 Economic indicators for farms
Economic indicators average per farm (2006 - 2008)
Cereals Sugar Fruit and
vegetables
Olive oil and table
olive Dairy Wine Pig
meat Sheep meat
Economic size-ESU - - 11.12 - 33.57 - 42.67 -
Total labour input-AWU - - 1.02 - 2.48 - 2.03 - Total Utilised Agricult. Area-ha - - 1.65 - 5.83 - 0.93 -
Total output € - - 21,152.71 - 176,115 - 138,228 -
Farm Net Value Added € - - 12,899.50 - 54,346 - 44,520 -
Family Farm Income € - - 10,998.83 - 50,329 - 36,621 -
Total assets € - - 100,719.67 - 892,684 - 637,175 -
Net worth € - - 97,646.67 - 838,613 - 612,021 -
Gross Investment € - - 2,239.17 - 23,206 - 10,317 -
Net Investment € - - 801.17 - 16,546 - 3,826 - Total subsidies-excl. investm. € - - 3,072.50 - 36,216 - 35,889 -
Farms represented - 17 301.67 13 100 13 197 37 note: - less than 3 years available
Source: DG Agri, FADN.
16
The economic indicators confirm once again the results of the statistical data analysed and discussed in the previous sections. Once again, these indicators highlight the predominance in Maltese Agriculture of the three main sectors – Dairy, Pig meat and Fruit and Vegetables. The economic indicators for farms in other sectors olives/olive oil, wine, sheep meat are not available due to the low numbers of farms (represented in the FADN). Cereals and sugar sectors do not exist in Malta.
The average net value added performance is almost four times higher in the dairy and pig meat sectors as compared to that of the fruit and vegetable sector. A similar picture emerges with respect to the family farm incomes in these three main sectors of Maltese Agriculture. In both comparisons, the dairy sector in Malta nets the highest score both in terms of net added value and family farm income.
The level of gross investment is by far the highest in the Dairy sector; more than double that in the pig sector and ten times that in the fruit and vegetable sectors.
The economic indicators reflect the relatively high level of specialisation and investment in the dairy and pig meat sectors and hence the resulting higher farm net value added and family farm income.
17
3 Evolution, position and performance of cooperatives
3.1 Types of cooperatives
The Maltese Cooperative Movement – a historical background1.
After the Second World War, Malta suffered from the lack of essential commodities and food and lack of employment opportunities. The poverty that ensued after the war led to mass emigration in search of a better and more prosperous future. The Colonial Government launched a plan to rehabilitate the country and its various sectors, particularly agriculture.
Following a study on the working of Cooperative Societies, on 12th June 1946 the Colonial Government passed in Parliament the first ordinance on cooperative societies (Ordinance No XXXIV of 1946) and this launched the legal framework to encourage the setting up of cooperatives in Malta. Farmers in the fruit and vegetable sector were the pioneers to start organising themselves and thus give birth to the cooperative movement in Malta. On 15th January 1947, the first cooperative – Zabbar Farmers Cooperative Society Ltd., was registered to organise the farmers of that locality and to sell their fruit and vegetables. During the same month, five other farmers’ cooperatives in different localities in Malta were set up with similar objectives. Eventually almost one year later, on 8th February 1948 these six primary cooperatives set up a secondary cooperative – Farmers Central Cooperative Society Ltd., in order to collect and sell collectively the produce of the members of the primary cooperatives. During the same year more farmers’ cooperatives were set up.
Another landmark in the historical development of cooperatives in Malta took place on 16th June 1958 when this time the milk producers organised themselves in one of the largest cooperatives in Malta - “Koperattiva Maltija tal-Halib Ltd”. Soon after, another multipurpose cooperative was set up for the first time in the sister island of Gozo - “Gozo Milk and Agricultural Producers Cooperative Society Ltd.”. Later cooperatives were also set up in the fisheries, wine and poultry sectors.
The first three decades were completely dominated by cooperatives in the various agricultural sectors and fisheries. It was during the eighties that there was another historical landmark in the history of the Maltese cooperatives movement. Apart from farmers, other workers started looking at the cooperatives model. New cooperatives emerged in completely new sectors such as transport, media, government employees and other services. This trend continued and since then most of the new cooperatives are workers cooperatives in a variety of services sectors.
The development of the cooperative movement in Malta was also characterised by changes in the Maltese Cooperatives legislation. The aim was always to keep abreast of developments and establish a suitable legal framework for the formation and operation of cooperatives. The three enactments2 are:
i. The Cooperative Societies Ordinance of 1946 This was introduced by Ordinance No. XXXIV of 1946 adopted on the 8 July 1946 and brought into force on the 12th December 1946. The objective was “to provide for the constitution and regulation of cooperative societies”
ii. The Cooperative Societies Act of 1978 This Act was listed as Chapter 278 of the Laws of Malta and was brought into effect on the 16 April, 1979. The purpose as stated was “to provide, in place of the Cooperative
1 Apex (2007) – Historical Profile of the Maltese Cooperative Movement [Apex Publication]
2 Fabri David (2006) – Reconsidering Cooperatives – Lessons for Maltese Coops – Paper 1 pg. 6 [APS Bank Publication]
18
Societies Ordinance, 1946, for the constitution, registration and control of cooperative societies and for matters connected therewith…”
iii. The Cooperative Societies Act of 2001
This more recent Act describes itself as “An Act to provide for the constitution, registration and control of cooperative societies and for matters connected therewith or ancillary thereto”. It is listed as Chapter 442 of the Law of Malta.
Within this context, it is interesting to mention that in the constitution of the Republic of Malta that came into force in December 1974, Article 20 lists the encouragement of cooperatives as one of the fundamental principles to which the State must adhere “The State recognises the social function of cooperatives and shall encourage their development”.
Another historical development was the setting up of a national organisation of Maltese Cooperatives – originally named APEX and later Koperattivi Malta. This voluntary organisation was formally registered on 17th March 1997.
Koperattivi Malta is a non-political organisation set up by the Cooperative Societies Act of 2001 for the sole purpose of representing and promoting the cooperative movement in the Maltese Islands. Koperattivi Malta mission is to provide vital services to its members in the fields of education, training, and management consultancy aimed at enhancing the cooperative movement and the benefits derived there from by its members. Koperattivi Malta is also committed towards the proactive representation of the movement locally and in international fora.
The agricultural cooperatives are members, together with other cooperatives in this organisation. In Malta there is no organisation/association exclusively for cooperatives in agriculture and agro-food sectors. Koperattivi Malta is also a member of the International Cooperative Alliance (ICA), Cooperatives Europe and also COPA-COGECA, the lobby organisation in Brussels for the national agricultural cooperatives and organisations of the EU27 countries.
Another important development in the local scenario is the Central Cooperative Fund (CCF).
The new Cooperative Societies Act that came into effect in April 1978 under article 86 established the Central Cooperative Fund. The main objective of the Fund is to promote and finance cooperative education, training, research, auditing and general development of the cooperative movement in Malta.
By virtue of this Act, every cooperative was obliged to contribute 5% of the surplus of each financial year to the Fund. This is administered by a joint committee composed of five cooperative representatives and two government representatives as prescribed by the Minister under regulations stipulated in the Act.
Since its inception, the CCF started slowly to introduce and finance activities in line with the stated objectives. However when in 1997 the organisation of Maltese Cooperatives was set up, the activities within the objectives of the CCF were delegated and taken over by this national organisation. Since 1997, the CCF funds were mainly used to finance the management, administration and activities of the national organisation of Maltese Cooperatives. Most of the activities are related to education, information and training, affiliation and participation in EU and international Cooperative Organisations, visits abroad, promotion and social functions.
At the end of 2010, there were 65 registered cooperatives operating in many varied sectors of the Maltese economy. There are 18 cooperatives in the agricultural sectors; 2 in the fisheries; 9 in the transport and related services, and 36 other cooperatives mainly workers cooperatives in the services sectors. These include media, professional and management consultancy, bulk

19
supplies, cleansing, waste recovery, government related services, port services, restoration, youths, cultural, social etc.
According to the Cooperatives Board, in 2009 the total turnover of all the registered and operating cooperatives in Malta amounted to about €69 million. At the end of December 2010, declared membership was about 4,800.
Comparing with the same period mentioned above, the agricultural cooperatives, 15 in the food sectors and 3 in the non-food, had a total turnover of about €42 million and declared membership of about 3,000. The total turnover of agricultural cooperatives in terms of product sectors is subdivided as follows: 35% in the milk sector; 33% in the pig sector, 30% in the fruit and vegetables sector and 2% in the non food sector.
It is interesting to note that agricultural cooperatives represent about 60% of total turnover and about 63% of total membership of all the cooperatives in Malta.
Over the period 2000 – 2009, agricultural cooperatives increased from 14 to 18 and turnover increased slightly by 1.5% from EUR 41.4 million to EUR 42 million. During this period 8 new agricultural cooperatives were set up but 4 went out of business and were liquidated (winded up).
It is also worth noting that at the end of 2010 out of the 18 agricultural cooperatives, 9 cooperatives were established since the 1940’s, 2 cooperatives since the 1950’s and 1 since the 1960’s. This shows that more than half of the agriculture cooperatives in Malta have been established and operating for many years.
The historical developments leading to the current scenario confirm the great relevance and contribution of the agricultural cooperatives, not only to the agricultural industry but also to the Maltese cooperative movement at large.
Producers Organisations – Historical Background
Farmers started organising themselves in Producer Organisations following Malta’s accession to the European Union on 1st May 2004. The Producer Organisation Act No IX of 2002 (CAP 447) followed by the publication of Legal Notice 63 of 2004, Fruit and Vegetables Producer Organisations 2004 and three years later Legal Notice 237 of 2007 Producer Organisation (Certain Products) Regulations 2007, introduced the legal framework for POs in the various agricultural sectors.
Producer Organisations/Groups set up under the Fruit and Vegetables Producer Organisations Regulations 2004 (Legal Notice 63 of 2004) and operate under Common Market Organisation (CMO) in the relevant sectors (including fruit, vegetables, products for processing, citrus fruits, nuts and mushrooms), could apply for financial assistance from the European Agriculture and Guarantee Fund (EAGF) as per Council Regulation (EC) No 1234/2007; 1182/2007 and Commission Regulation 1580/2007.
In the case of a Producer Group, the financial assistance for the respective Recognition Plan shall be subject to a ceiling of €100,000 per annual segment.
In the case of a Producer Organisation, the financial assistance for the implementation of the respective Operational Programme is based on either the amount that corresponds to 60% of the operational final expenditure or 4.1% of the verified value of the Marketable Production (VMP)—whichever is lower. This figure may be increased up to 4.6% where additional funding on crisis prevention and management measures has been approved.
20
The minimum requirements are that the PO must have a minimum of 5 members and must have a minimum VMP of €100,000.
Members of these POs/PGs are required to market the entirety of the products for which they are recognised through the organisation – unless authorised to sell up to 25% of their total production of eligible crops directly to consumers.
Legal Notice 237 of 2007 Producer Organisation (Certain Products) Regulation 2007 provides for setting up of POs that operate in other agricultural sectors – potatoes, pig meat, milk, poultry, traditional cheeslets made from sheep and/or goats milk, honey, rabbit meat. However, as these POs do not operate under the CAP Common Market Organisation, these cannot benefit from related financial assistance as explained before.
However, these POs can benefit from financial assistance for the costs of setting up of the PO under Measure 142 under the Rural Development Programme (RDP).
In September 2004, the first PO “Gozitano” was registered in the fruit and vegetables sector in Gozo, and by 2009, 10 POs were registered – 3 in the fruit and vegetables, 4 in the tomatoes for processing, one in the wine grapes production and two others – one in the mushrooms and one in the rabbit meat respectively.
In May 2010, another eight POs were registered but these are still in the first months of their formation and still gearing to start their operations.
It is worth mentioning that in Malta there are 4 cooperatives which have also set up a PO. These 4 cooperatives have each set up a PO as it is expected that the PO Operational Programme will complement the activity of the cooperative and at the same time it is also possible to apply and benefit from direct aid under CAP – CMO and/or RDP Funds. Apart from these examples there are no other synergies between other POs set up so far.
One has to remark that most of the agricultural cooperatives have been operating for many, many years, some for more than 60 years; hence a lot of experience has been gained. This contrasts with producer organisations which have been operating only for a short period and hence still striving to establish themselves within the various agricultural sectors. The PO experience in Malta is still at its infancy and needs more time to be analysed and assessed.
In the case of POs set up by cooperatives very often the members are linked and the PO shares the experience gained in the cooperative over the years. This is not the case with other newly set up POs.
Classification of Agricultural Cooperatives/POs
In Malta at the end of 2010 there were 18 cooperatives and 16 producer organisations and 3 producer groups3 registered with the Cooperatives Board and the Government Agricultural Directorate respectively. Eight of these POs have just been registered in mid-2010 and are still in the first months of their formation. Moreover no official public information about membership, turnover, operations etc is available on POs and PGs in general. Hence our analysis is limited when it comes to the PO domain.
For the purpose of this study, basic information about POs will include all POs registered with the Government Agriculture Directorate. However, for the purpose of further details and analysis only the 9 POs which have been established for some time and are effectively operational within their sectors will be considered. These include the 2 POs and 2 PGs in the
3 Producer groups (PGs) are also referred to as POs in this report.
21
Fruit and Vegetables, 4 POs in the tomatoes for processing and 1 PO in the wine/grapes sector. The other 2 POs though registered for some time may not be effectively operational, while the 8 POs that have just been established and hence still gearing to be operational will not be considered in the analysis within this study.
Initial experience with the setting up of POs in Malta, indicates that these are EU led with the financial assistance, as already explained in this section, being one of the perceived benefits. It is worth mentioning that the 8 POs that have just been registered in 2010 are still waiting for the application of the setting up funds under measure 142 in the Rural Development Programme.
Likewise, the two cooperatives – one in the wine sector and another in the broiler sector – that are still registered with the Board of Cooperatives but resulted are not effectively operational, will not be considered in the analysis within this study.
For simplicity, these 10 POs and 2 cooperatives are referred to as “OTHER” whenever we make reference to these for statistical or information purposes within this study.
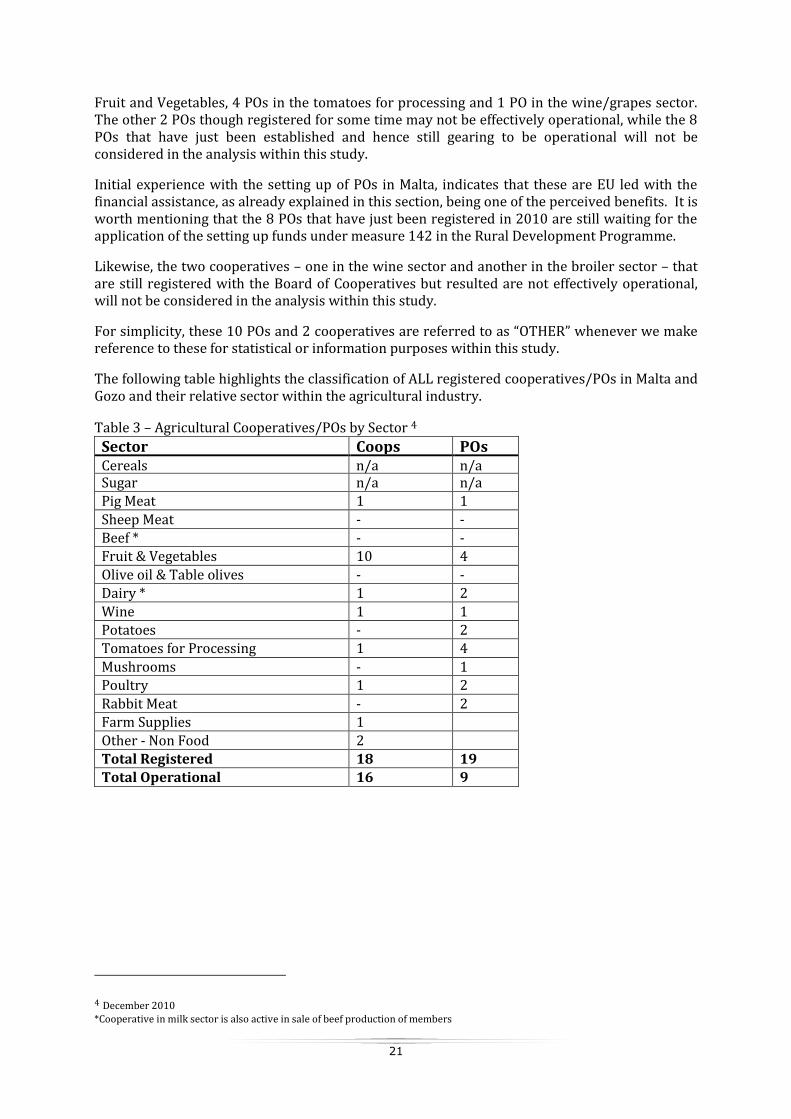
The following table highlights the classification of ALL registered cooperatives/POs in Malta and Gozo and their relative sector within the agricultural industry.
Table 3 – Agricultural Cooperatives/POs by Sector 4
Sector Coops POs Cereals n/a n/a Sugar n/a n/a
Pig Meat 1 1
Sheep Meat - - Beef * - -
Fruit & Vegetables 10 4
Olive oil & Table olives - -
Dairy * 1 2
Wine 1 1 Potatoes - 2
Tomatoes for Processing 1 4
Mushrooms - 1
Poultry 1 2
Rabbit Meat - 2 Farm Supplies 1
Other - Non Food 2
Total Registered 18 19 Total Operational 16 9
4 December 2010
*Cooperative in milk sector is also active in sale of beef production of members
22
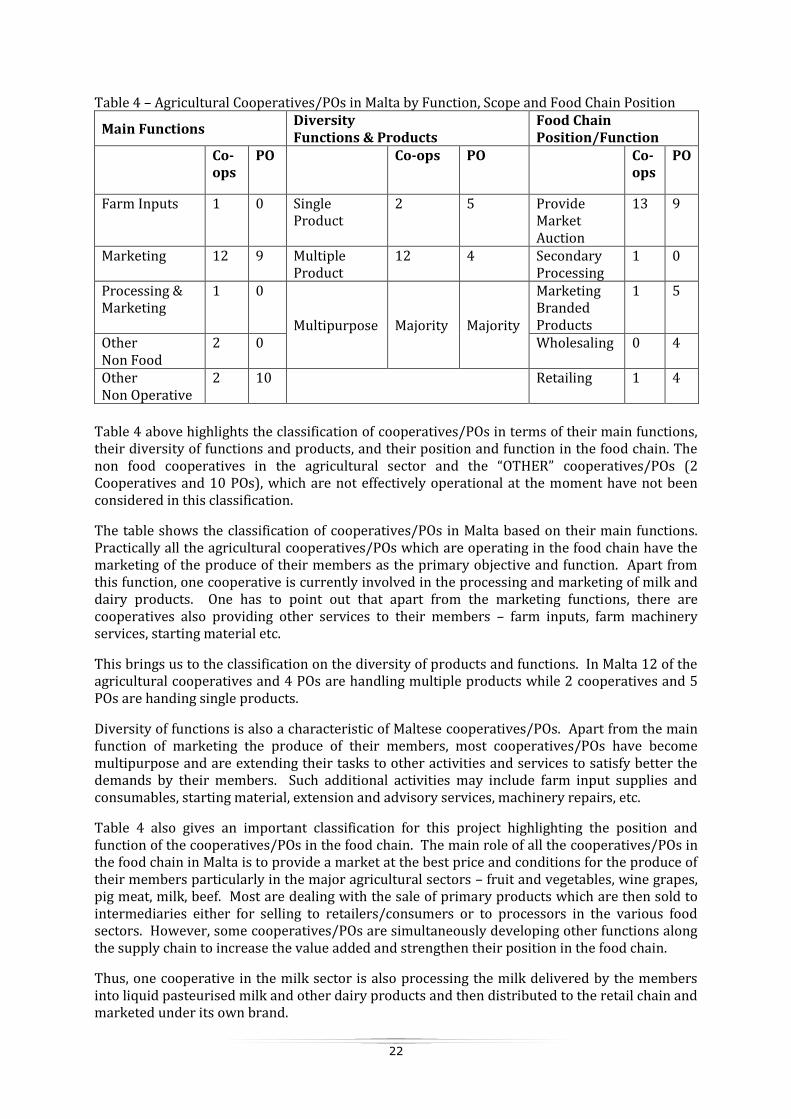
Table 4 – Agricultural Cooperatives/POs in Malta by Function, Scope and Food Chain Position
Main Functions Diversity Functions & Products
Food Chain Position/Function
Co-ops
PO Co-ops PO Co-ops
PO
Farm Inputs 1 0 Single Product
2 5 Provide Market Auction
13 9
Marketing 12 9 Multiple Product
12 4 Secondary Processing
1 0
Processing & Marketing
1 0
Multipurpose Majority Majority
Marketing Branded Products
1 5
Other Non Food
2 0 Wholesaling 0 4
Other Non Operative
2 10 Retailing 1 4
Table 4 above highlights the classification of cooperatives/POs in terms of their main functions, their diversity of functions and products, and their position and function in the food chain. The non food cooperatives in the agricultural sector and the “OTHER” cooperatives/POs (2 Cooperatives and 10 POs), which are not effectively operational at the moment have not been considered in this classification.
The table shows the classification of cooperatives/POs in Malta based on their main functions. Practically all the agricultural cooperatives/POs which are operating in the food chain have the marketing of the produce of their members as the primary objective and function. Apart from this function, one cooperative is currently involved in the processing and marketing of milk and dairy products. One has to point out that apart from the marketing functions, there are cooperatives also providing other services to their members – farm inputs, farm machinery services, starting material etc.
This brings us to the classification on the diversity of products and functions. In Malta 12 of the agricultural cooperatives and 4 POs are handling multiple products while 2 cooperatives and 5 POs are handing single products.
Diversity of functions is also a characteristic of Maltese cooperatives/POs. Apart from the main function of marketing the produce of their members, most cooperatives/POs have become multipurpose and are extending their tasks to other activities and services to satisfy better the demands by their members. Such additional activities may include farm input supplies and consumables, starting material, extension and advisory services, machinery repairs, etc.
Table 4 also gives an important classification for this project highlighting the position and function of the cooperatives/POs in the food chain. The main role of all the cooperatives/POs in the food chain in Malta is to provide a market at the best price and conditions for the produce of their members particularly in the major agricultural sectors – fruit and vegetables, wine grapes, pig meat, milk, beef. Most are dealing with the sale of primary products which are then sold to intermediaries either for selling to retailers/consumers or to processors in the various food sectors. However, some cooperatives/POs are simultaneously developing other functions along the supply chain to increase the value added and strengthen their position in the food chain.
Thus, one cooperative in the milk sector is also processing the milk delivered by the members into liquid pasteurised milk and other dairy products and then distributed to the retail chain and marketed under its own brand.
23
In the case of fruit and vegetables, POs are also doing other functions – (a) wholesaling by selling member products and other products in order to supply a full assortment to the retail; (b) retailing by directly selling to consumers; (c) marketing pre-packed, graded quality products under the PO brand.
In the wine sector, the PO is also trying to subcontract and process some of the grape production of its members into quality wine which is then marketed under its own brand. One farm supply cooperative in the non food is retailing its products for the crop/horticulture to its customers.
As mentioned in these examples, these functions are important to increase the value added to the produce of the members and hence to strengthen their position in the respective value chain, thus contributing to the final sustainability of the respective sector.
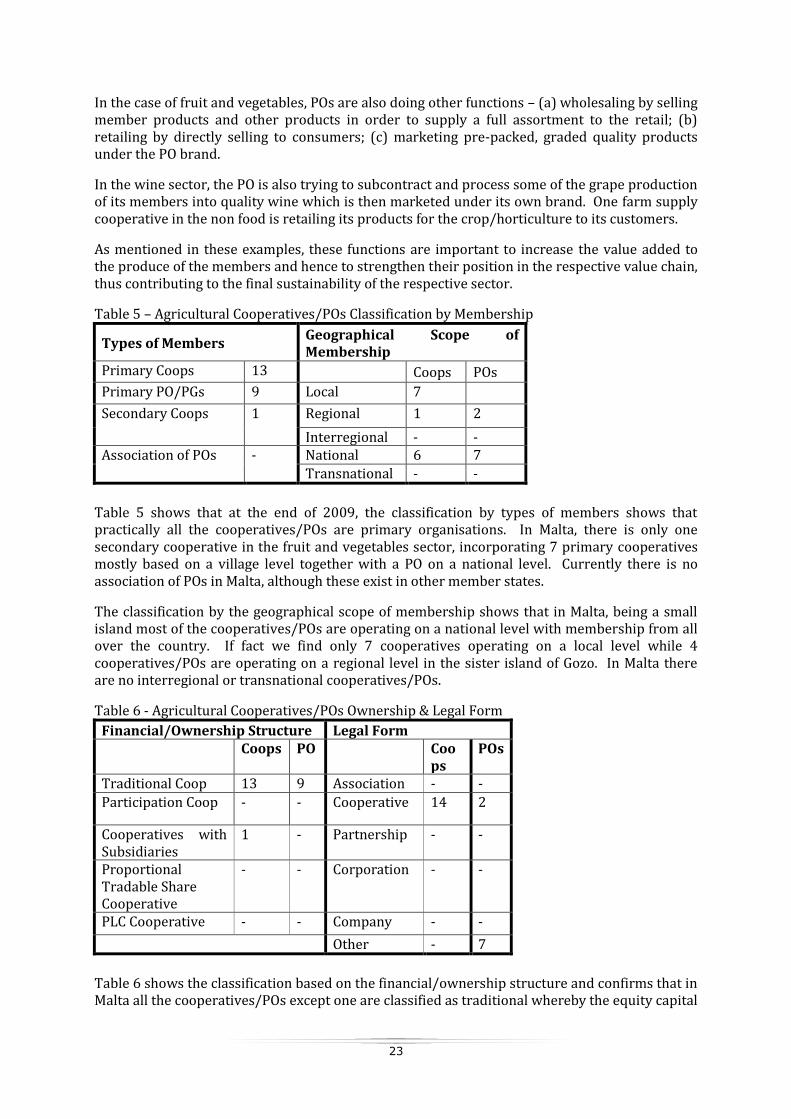
Table 5 – Agricultural Cooperatives/POs Classification by Membership
Types of Members Geographical Scope of Membership
Primary Coops 13 Coops POs
Primary PO/PGs 9 Local 7
Secondary Coops 1 Regional 1 2
Interregional - - Association of POs - National 6 7
Transnational - -
Table 5 shows that at the end of 2009, the classification by types of members shows that practically all the cooperatives/POs are primary organisations. In Malta, there is only one secondary cooperative in the fruit and vegetables sector, incorporating 7 primary cooperatives mostly based on a village level together with a PO on a national level. Currently there is no association of POs in Malta, although these exist in other member states.
The classification by the geographical scope of membership shows that in Malta, being a small island most of the cooperatives/POs are operating on a national level with membership from all over the country. If fact we find only 7 cooperatives operating on a local level while 4 cooperatives/POs are operating on a regional level in the sister island of Gozo. In Malta there are no interregional or transnational cooperatives/POs.
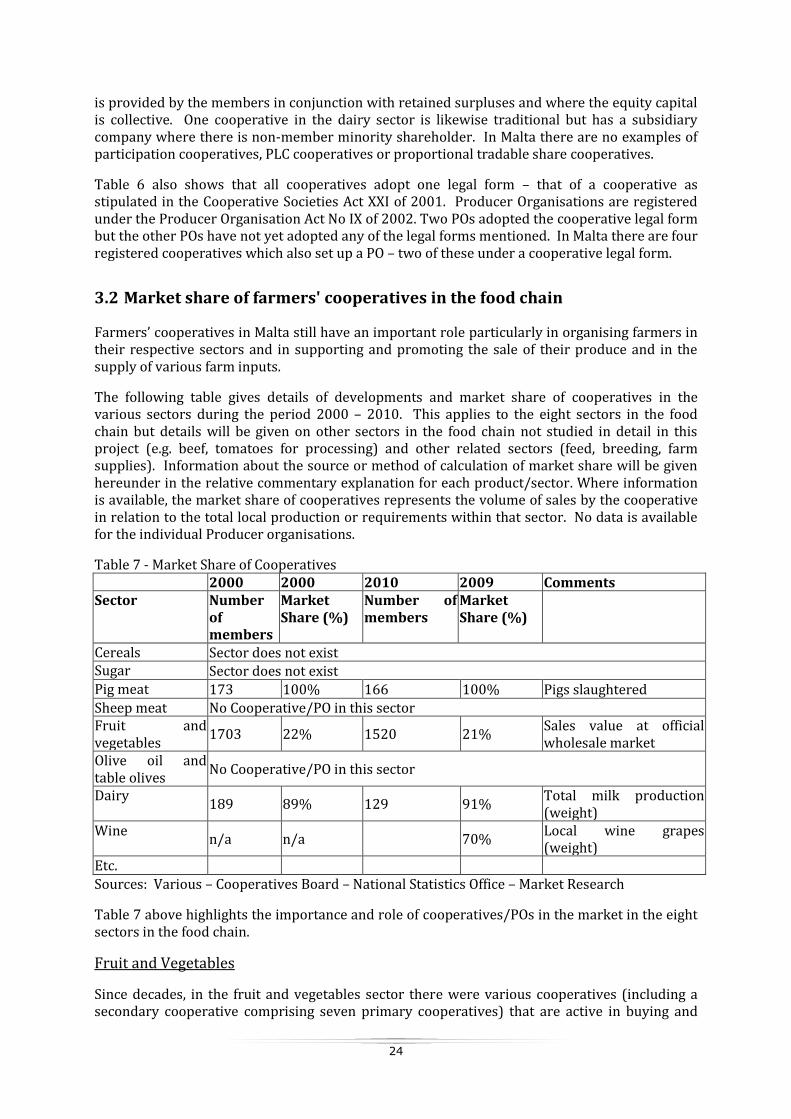
Table 6 - Agricultural Cooperatives/POs Ownership & Legal Form
Financial/Ownership Structure Legal Form Coops PO Coo
ps POs
Traditional Coop 13 9 Association - -
Participation Coop - - Cooperative 14 2
Cooperatives with Subsidiaries
1 - Partnership - -
Proportional Tradable Share Cooperative
- - Corporation - -
PLC Cooperative - - Company - -
Other - 7
Table 6 shows the classification based on the financial/ownership structure and confirms that in Malta all the cooperatives/POs except one are classified as traditional whereby the equity capital
24
is provided by the members in conjunction with retained surpluses and where the equity capital is collective. One cooperative in the dairy sector is likewise traditional but has a subsidiary company where there is non-member minority shareholder. In Malta there are no examples of participation cooperatives, PLC cooperatives or proportional tradable share cooperatives.
Table 6 also shows that all cooperatives adopt one legal form – that of a cooperative as stipulated in the Cooperative Societies Act XXI of 2001. Producer Organisations are registered under the Producer Organisation Act No IX of 2002. Two POs adopted the cooperative legal form but the other POs have not yet adopted any of the legal forms mentioned. In Malta there are four registered cooperatives which also set up a PO – two of these under a cooperative legal form.
3.2 Market share of farmers' cooperatives in the food chain
Farmers’ cooperatives in Malta still have an important role particularly in organising farmers in their respective sectors and in supporting and promoting the sale of their produce and in the supply of various farm inputs.
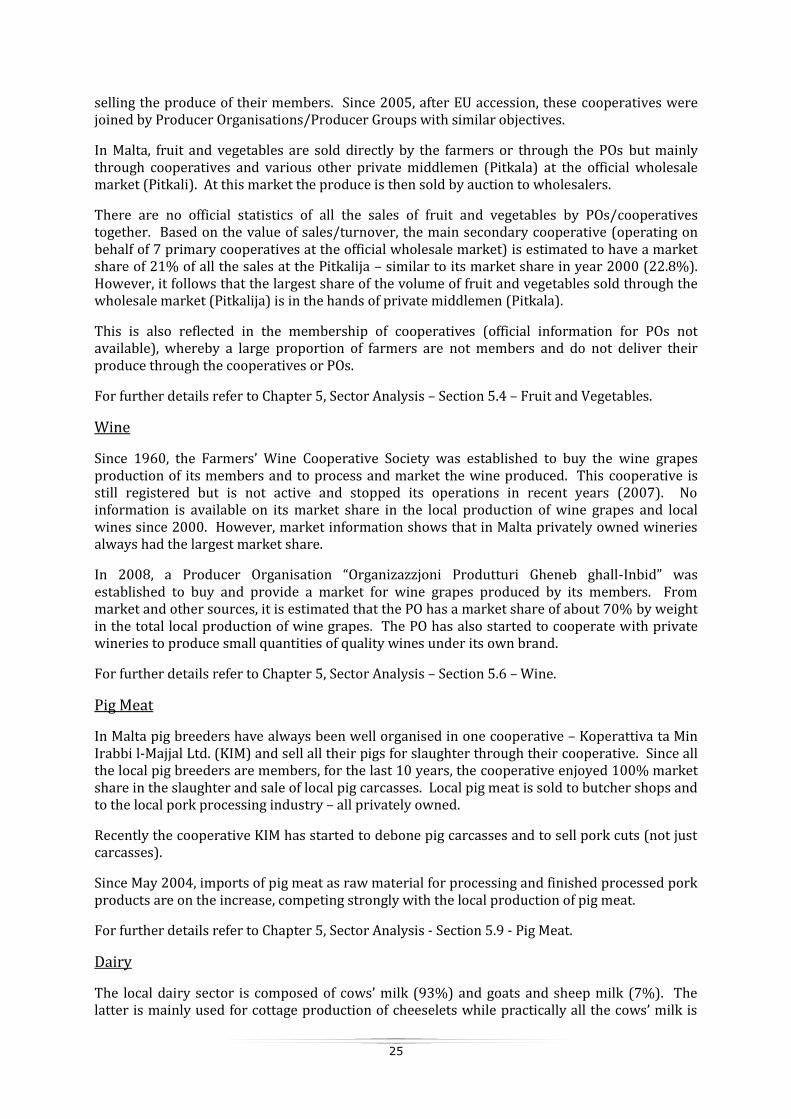
The following table gives details of developments and market share of cooperatives in the various sectors during the period 2000 – 2010. This applies to the eight sectors in the food chain but details will be given on other sectors in the food chain not studied in detail in this project (e.g. beef, tomatoes for processing) and other related sectors (feed, breeding, farm supplies). Information about the source or method of calculation of market share will be given hereunder in the relative commentary explanation for each product/sector. Where information is available, the market share of cooperatives represents the volume of sales by the cooperative in relation to the total local production or requirements within that sector. No data is available for the individual Producer organisations.
Table 7 - Market Share of Cooperatives 2000 2000 2010 2009 Comments Sector Number
of members
Market Share (%)
Number of members
Market Share (%)
Cereals Sector does not exist Sugar Sector does not exist Pig meat 173 100% 166 100% Pigs slaughtered Sheep meat No Cooperative/PO in this sector Fruit and vegetables
1703 22% 1520 21% Sales value at official wholesale market
Olive oil and table olives
No Cooperative/PO in this sector
Dairy 189 89% 129 91%
Total milk production (weight)
Wine n/a n/a 70%
Local wine grapes (weight)
Etc. Sources: Various – Cooperatives Board – National Statistics Office – Market Research
Table 7 above highlights the importance and role of cooperatives/POs in the market in the eight sectors in the food chain.
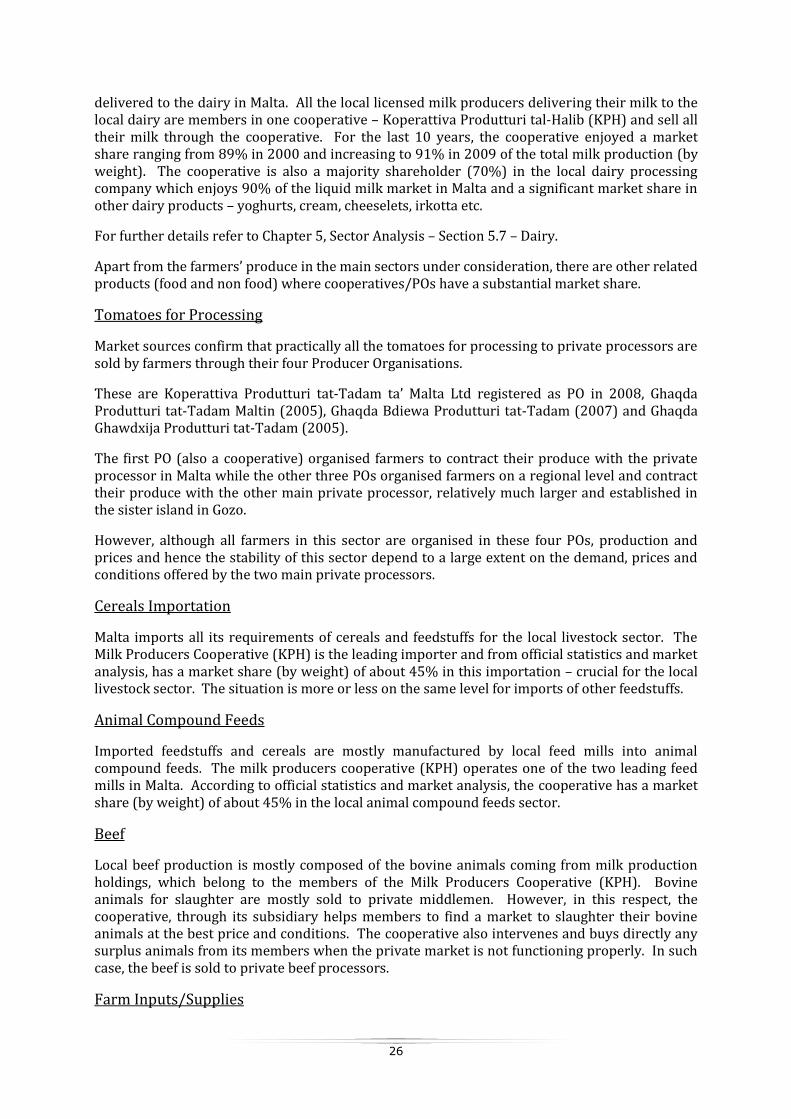
Fruit and Vegetables
Since decades, in the fruit and vegetables sector there were various cooperatives (including a secondary cooperative comprising seven primary cooperatives) that are active in buying and
25
selling the produce of their members. Since 2005, after EU accession, these cooperatives were joined by Producer Organisations/Producer Groups with similar objectives.
In Malta, fruit and vegetables are sold directly by the farmers or through the POs but mainly through cooperatives and various other private middlemen (Pitkala) at the official wholesale market (Pitkali). At this market the produce is then sold by auction to wholesalers.
There are no official statistics of all the sales of fruit and vegetables by POs/cooperatives together. Based on the value of sales/turnover, the main secondary cooperative (operating on behalf of 7 primary cooperatives at the official wholesale market) is estimated to have a market share of 21% of all the sales at the Pitkalija – similar to its market share in year 2000 (22.8%). However, it follows that the largest share of the volume of fruit and vegetables sold through the wholesale market (Pitkalija) is in the hands of private middlemen (Pitkala).
This is also reflected in the membership of cooperatives (official information for POs not available), whereby a large proportion of farmers are not members and do not deliver their produce through the cooperatives or POs.
For further details refer to Chapter 5, Sector Analysis – Section 5.4 – Fruit and Vegetables.
Wine
Since 1960, the Farmers’ Wine Cooperative Society was established to buy the wine grapes production of its members and to process and market the wine produced. This cooperative is still registered but is not active and stopped its operations in recent years (2007). No information is available on its market share in the local production of wine grapes and local wines since 2000. However, market information shows that in Malta privately owned wineries always had the largest market share.
In 2008, a Producer Organisation “Organizazzjoni Produtturi Gheneb ghall-Inbid” was established to buy and provide a market for wine grapes produced by its members. From market and other sources, it is estimated that the PO has a market share of about 70% by weight in the total local production of wine grapes. The PO has also started to cooperate with private wineries to produce small quantities of quality wines under its own brand.
For further details refer to Chapter 5, Sector Analysis – Section 5.6 – Wine.
Pig Meat
In Malta pig breeders have always been well organised in one cooperative – Koperattiva ta Min Irabbi l-Majjal Ltd. (KIM) and sell all their pigs for slaughter through their cooperative. Since all the local pig breeders are members, for the last 10 years, the cooperative enjoyed 100% market share in the slaughter and sale of local pig carcasses. Local pig meat is sold to butcher shops and to the local pork processing industry – all privately owned.
Recently the cooperative KIM has started to debone pig carcasses and to sell pork cuts (not just carcasses).
Since May 2004, imports of pig meat as raw material for processing and finished processed pork products are on the increase, competing strongly with the local production of pig meat.
For further details refer to Chapter 5, Sector Analysis - Section 5.9 - Pig Meat.
Dairy
The local dairy sector is composed of cows’ milk (93%) and goats and sheep milk (7%). The latter is mainly used for cottage production of cheeselets while practically all the cows’ milk is
26
delivered to the dairy in Malta. All the local licensed milk producers delivering their milk to the local dairy are members in one cooperative – Koperattiva Produtturi tal-Halib (KPH) and sell all their milk through the cooperative. For the last 10 years, the cooperative enjoyed a market share ranging from 89% in 2000 and increasing to 91% in 2009 of the total milk production (by weight). The cooperative is also a majority shareholder (70%) in the local dairy processing company which enjoys 90% of the liquid milk market in Malta and a significant market share in other dairy products – yoghurts, cream, cheeselets, irkotta etc.
For further details refer to Chapter 5, Sector Analysis – Section 5.7 – Dairy.
Apart from the farmers’ produce in the main sectors under consideration, there are other related products (food and non food) where cooperatives/POs have a substantial market share.
Tomatoes for Processing
Market sources confirm that practically all the tomatoes for processing to private processors are sold by farmers through their four Producer Organisations.
These are Koperattiva Produtturi tat-Tadam ta’ Malta Ltd registered as PO in 2008, Ghaqda Produtturi tat-Tadam Maltin (2005), Ghaqda Bdiewa Produtturi tat-Tadam (2007) and Ghaqda Ghawdxija Produtturi tat-Tadam (2005).
The first PO (also a cooperative) organised farmers to contract their produce with the private processor in Malta while the other three POs organised farmers on a regional level and contract their produce with the other main private processor, relatively much larger and established in the sister island in Gozo.
However, although all farmers in this sector are organised in these four POs, production and prices and hence the stability of this sector depend to a large extent on the demand, prices and conditions offered by the two main private processors.
Cereals Importation
Malta imports all its requirements of cereals and feedstuffs for the local livestock sector. The Milk Producers Cooperative (KPH) is the leading importer and from official statistics and market analysis, has a market share (by weight) of about 45% in this importation – crucial for the local livestock sector. The situation is more or less on the same level for imports of other feedstuffs.
Animal Compound Feeds
Imported feedstuffs and cereals are mostly manufactured by local feed mills into animal compound feeds. The milk producers cooperative (KPH) operates one of the two leading feed mills in Malta. According to official statistics and market analysis, the cooperative has a market share (by weight) of about 45% in the local animal compound feeds sector.
Beef
Local beef production is mostly composed of the bovine animals coming from milk production holdings, which belong to the members of the Milk Producers Cooperative (KPH). Bovine animals for slaughter are mostly sold to private middlemen. However, in this respect, the cooperative, through its subsidiary helps members to find a market to slaughter their bovine animals at the best price and conditions. The cooperative also intervenes and buys directly any surplus animals from its members when the private market is not functioning properly. In such case, the beef is sold to private beef processors.
Farm Inputs/Supplies
27
Most agricultural cooperatives in Malta apart from their main objective to find a market for their members’ produce are also engaged in providing members with their farm inputs requirements.
In this respect in the dairy and pig sectors, cooperatives are exclusively the providers of artificial insemination and breeding services. In the pig sector, the cooperative is the exclusive importer of breeding stock.
Likewise, these two cooperatives enjoy with their members a large market share in farm supplies, consumables and equipment required on the farms in the pig and dairy sectors respectively. Moreover, various cooperatives/POs are also very active in supplying fertilisers, seeds, supplies and equipment to farmers in the crop and horticulture sector. There are no official statistics to establish the correct market share.
The market share information shows that cooperatives/POs still play a significant role in the primary products in the food chain. Apart from milk, cooperatives/POs have not yet entered concretely into the processing sector and the downstream chain of the food sector. This shows that ultimately the downstream private investors have the final control on the market, even more when imports of similar products are easily available. The share of member participation and commitment in the various agricultural sectors highlight the marked difference in Malta between the structure and role of cooperatives in the livestock sectors (pig and dairy) and those in the fruit and vegetables sectors. Farmers’ cooperation and market share is also strong in the sale of local wine grapes and tomatoes for processing.
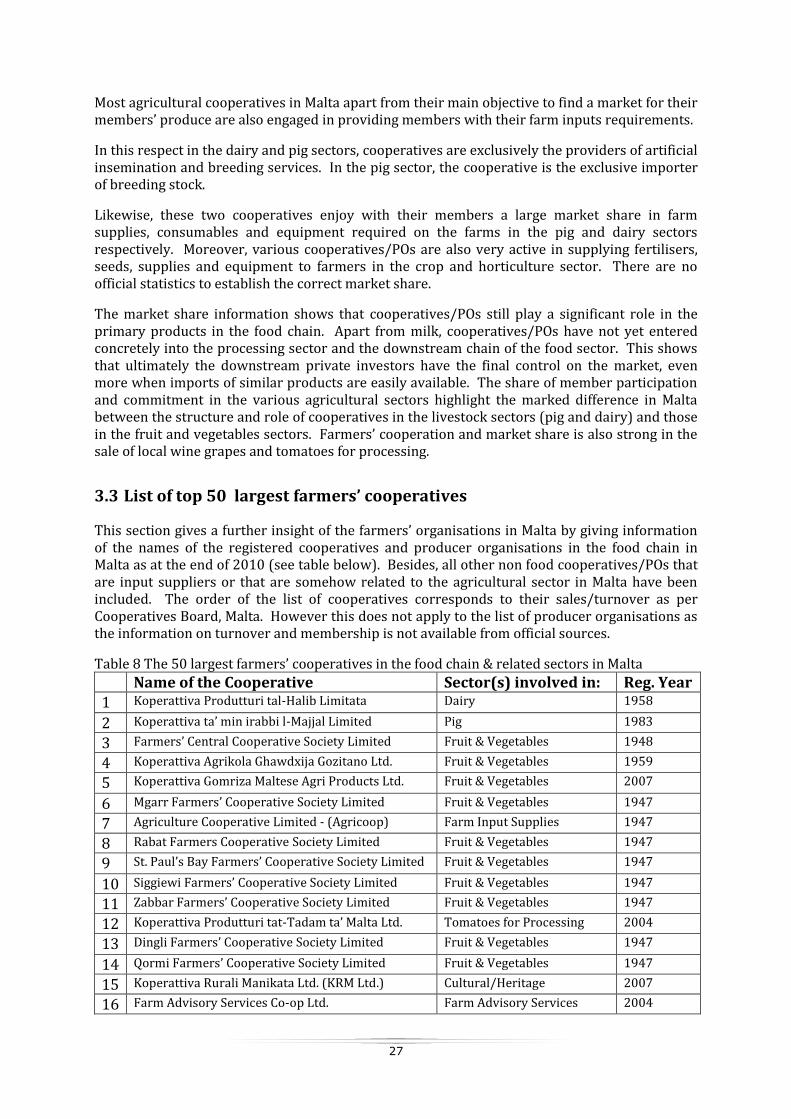
3.3 List of top 50 largest farmers’ cooperatives
This section gives a further insight of the farmers’ organisations in Malta by giving information of the names of the registered cooperatives and producer organisations in the food chain in Malta as at the end of 2010 (see table below). Besides, all other non food cooperatives/POs that are input suppliers or that are somehow related to the agricultural sector in Malta have been included. The order of the list of cooperatives corresponds to their sales/turnover as per Cooperatives Board, Malta. However this does not apply to the list of producer organisations as the information on turnover and membership is not available from official sources.
Table 8 The 50 largest farmers’ cooperatives in the food chain & related sectors in Malta
Name of the Cooperative Sector(s) involved in: Reg. Year 1 Koperattiva Produtturi tal-Halib Limitata Dairy 1958
2 Koperattiva ta’ min irabbi l-Majjal Limited Pig 1983
3 Farmers’ Central Cooperative Society Limited Fruit & Vegetables 1948
4 Koperattiva Agrikola Ghawdxija Gozitano Ltd. Fruit & Vegetables 1959
5 Koperattiva Gomriza Maltese Agri Products Ltd. Fruit & Vegetables 2007
6 Mgarr Farmers’ Cooperative Society Limited Fruit & Vegetables 1947
7 Agriculture Cooperative Limited - (Agricoop) Farm Input Supplies 1947
8 Rabat Farmers Cooperative Society Limited Fruit & Vegetables 1947
9 St. Paul’s Bay Farmers’ Cooperative Society Limited Fruit & Vegetables 1947
10 Siggiewi Farmers’ Cooperative Society Limited Fruit & Vegetables 1947
11 Zabbar Farmers’ Cooperative Society Limited Fruit & Vegetables 1947
12 Koperattiva Produtturi tat-Tadam ta’ Malta Ltd. Tomatoes for Processing 2004
13 Dingli Farmers’ Cooperative Society Limited Fruit & Vegetables 1947
14 Qormi Farmers’ Cooperative Society Limited Fruit & Vegetables 1947
15 Koperattiva Rurali Manikata Ltd. (KRM Ltd.) Cultural/Heritage 2007
16 Farm Advisory Services Co-op Ltd. Farm Advisory Services 2004
28
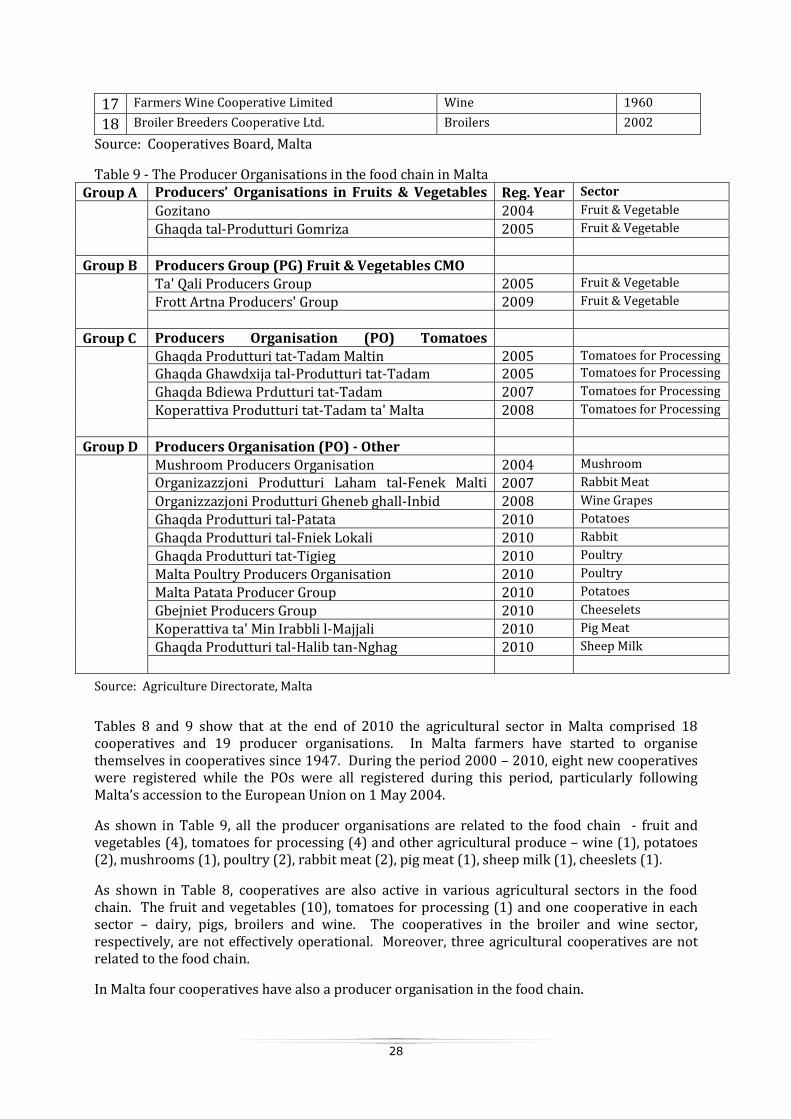
17 Farmers Wine Cooperative Limited Wine 1960
18 Broiler Breeders Cooperative Ltd. Broilers 2002
Source: Cooperatives Board, Malta
Table 9 - The Producer Organisations in the food chain in Malta Group A Producers’ Organisations in Fruits & Vegetables
CMO Reg. Year Sector
Gozitano 2004 Fruit & Vegetable
Ghaqda tal-Produtturi Gomriza 2005 Fruit & Vegetable
Group B Producers Group (PG) Fruit & Vegetables CMO
Ta' Qali Producers Group 2005 Fruit & Vegetable
Frott Artna Producers' Group 2009 Fruit & Vegetable
Group C Producers Organisation (PO) Tomatoes Processing
Ghaqda Produtturi tat-Tadam Maltin 2005 Tomatoes for Processing
Ghaqda Ghawdxija tal-Produtturi tat-Tadam 2005 Tomatoes for Processing
Ghaqda Bdiewa Prdutturi tat-Tadam 2007 Tomatoes for Processing
Koperattiva Produtturi tat-Tadam ta' Malta 2008 Tomatoes for Processing
Group D Producers Organisation (PO) - Other
Mushroom Producers Organisation 2004 Mushroom
Organizazzjoni Produtturi Laham tal-Fenek Malti (PG)
2007 Rabbit Meat
Organizzazjoni Produtturi Gheneb ghall-Inbid 2008 Wine Grapes
Ghaqda Produtturi tal-Patata 2010 Potatoes
Ghaqda Produtturi tal-Fniek Lokali 2010 Rabbit
Ghaqda Produtturi tat-Tigieg 2010 Poultry
Malta Poultry Producers Organisation 2010 Poultry
Malta Patata Producer Group 2010 Potatoes
Gbejniet Producers Group 2010 Cheeselets
Koperattiva ta' Min Irabbli l-Majjali 2010 Pig Meat
Ghaqda Produtturi tal-Halib tan-Nghag 2010 Sheep Milk
Source: Agriculture Directorate, Malta
Tables 8 and 9 show that at the end of 2010 the agricultural sector in Malta comprised 18 cooperatives and 19 producer organisations. In Malta farmers have started to organise themselves in cooperatives since 1947. During the period 2000 – 2010, eight new cooperatives were registered while the POs were all registered during this period, particularly following Malta’s accession to the European Union on 1 May 2004.
As shown in Table 9, all the producer organisations are related to the food chain - fruit and vegetables (4), tomatoes for processing (4) and other agricultural produce – wine (1), potatoes (2), mushrooms (1), poultry (2), rabbit meat (2), pig meat (1), sheep milk (1), cheeslets (1).
As shown in Table 8, cooperatives are also active in various agricultural sectors in the food chain. The fruit and vegetables (10), tomatoes for processing (1) and one cooperative in each sector – dairy, pigs, broilers and wine. The cooperatives in the broiler and wine sector, respectively, are not effectively operational. Moreover, three agricultural cooperatives are not related to the food chain.
In Malta four cooperatives have also a producer organisation in the food chain.
29
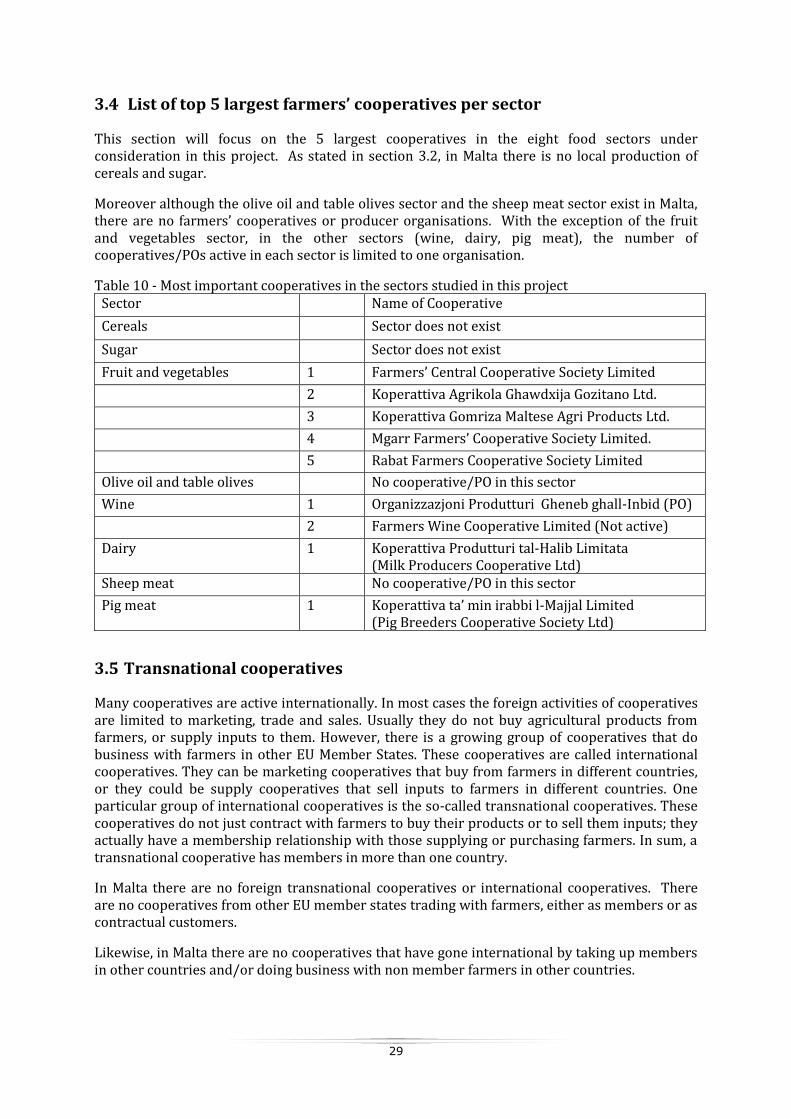
3.4 List of top 5 largest farmers’ cooperatives per sector
This section will focus on the 5 largest cooperatives in the eight food sectors under consideration in this project. As stated in section 3.2, in Malta there is no local production of cereals and sugar.
Moreover although the olive oil and table olives sector and the sheep meat sector exist in Malta, there are no farmers’ cooperatives or producer organisations. With the exception of the fruit and vegetables sector, in the other sectors (wine, dairy, pig meat), the number of cooperatives/POs active in each sector is limited to one organisation.
Table 10 - Most important cooperatives in the sectors studied in this project Sector Name of Cooperative
Cereals Sector does not exist
Sugar Sector does not exist
Fruit and vegetables 1 Farmers’ Central Cooperative Society Limited
2 Koperattiva Agrikola Ghawdxija Gozitano Ltd.
3 Koperattiva Gomriza Maltese Agri Products Ltd.
4 Mgarr Farmers’ Cooperative Society Limited.
5 Rabat Farmers Cooperative Society Limited
Olive oil and table olives No cooperative/PO in this sector
Wine 1 Organizzazjoni Produtturi Gheneb ghall-Inbid (PO)
2 Farmers Wine Cooperative Limited (Not active)
Dairy 1 Koperattiva Produtturi tal-Halib Limitata (Milk Producers Cooperative Ltd)
Sheep meat No cooperative/PO in this sector
Pig meat 1 Koperattiva ta’ min irabbi l-Majjal Limited (Pig Breeders Cooperative Society Ltd)
3.5 Transnational cooperatives
Many cooperatives are active internationally. In most cases the foreign activities of cooperatives are limited to marketing, trade and sales. Usually they do not buy agricultural products from farmers, or supply inputs to them. However, there is a growing group of cooperatives that do business with farmers in other EU Member States. These cooperatives are called international cooperatives. They can be marketing cooperatives that buy from farmers in different countries, or they could be supply cooperatives that sell inputs to farmers in different countries. One particular group of international cooperatives is the so-called transnational cooperatives. These cooperatives do not just contract with farmers to buy their products or to sell them inputs; they actually have a membership relationship with those supplying or purchasing farmers. In sum, a transnational cooperative has members in more than one country.
In Malta there are no foreign transnational cooperatives or international cooperatives. There are no cooperatives from other EU member states trading with farmers, either as members or as contractual customers.
Likewise, in Malta there are no cooperatives that have gone international by taking up members in other countries and/or doing business with non member farmers in other countries.
30
3.6 Interesting cooperative experiences
This chapter highlighted briefly the importance and the activities of the agricultural cooperatives/POs in Malta. However, Malta’s accession to the European Union on 1st May 2004 and the adoption of the agricultural acquis, particularly the removal of all protection barriers on the imports of agricultural and food products within the EU single market, has definitely brought strong competition from these imports on the local market.
It was obvious that this brought great pressure on all agricultural sectors in general and cooperatives /POs and their members to reorganise and restructure to face the new challenges and realities in the various sectors.
During the period 2000 – 2010, most of the cooperatives in the agricultural sector continued with their operations for the benefit of their members. Four cooperatives stopped their operations, went out of business and are on liquidation or liquidated. Two of these cooperatives were in the poultry sector.
It is interesting to note that almost all the cooperatives that went out of business and liquidated in a very short span of their life were ranging between 5 – 9 years from formation. Likewise, these were set up on the eve of Malta’s accession to the EU and hence the threat of increased competition but also the opportunity of getting access to funds for initial set up and investments.
There are many reasons which cumulatively brought failure and liquidation. In general, the reasons may be attributed to the lack of direction and clear vision, internal governance, members’ commitment and loyalty, lack of initial funds for investment, and obviously harsh competition by the private sector, especially importers.
In addition to the above, there are two other cooperatives facing difficulties, one in the broiler meat established in 2003 and one in the wine processing and marketing established in 1960. These cooperatives are still registered but for some time stopped their operations in their respective sector. Competition, internal governance and lack of member commitment are again possible reasons for these difficulties.
In all cases, the members had to start selling their produce directly; or most probably to private investor owned firms or middlemen. In the case of the sale of wine grapes, in 2008 farmers organised themselves once again in a Producer Organisation. From market research, this PO is currently responsible for the sale to local wineries of about 70% of local wine grapes production. The PO is also venturing through cooperation with private wineries to process and produce quality wines under its own brand.
Apart from failures, in the last years there were also interesting examples of innovation and better organisation within various agricultural cooperatives in the food chain.
Two cooperatives in the fruit and vegetables, one cooperative in the tomatoes for processing and one in the pig meat sector also set up a producer organisation to improve the operation of their business.
The 4 POs in the fruit and vegetable sector, in line with their objectives, have also started to become active in retail and direct selling to consumers, in selling quality, graded and pre-packed products under their brand; in preparing and selling special products with a local cottage and traditional aspect. This new development is also creating a niche market which links well with tourism and agro tourism in Malta.
A Farmers’ Vegetable and Fruit market, set up in 2010 with the full support of the Ministry for Resources and Rural Affairs and the participation of cooperatives/POs and their members, acted as an example for the establishment of an open market, open twice per week, where farmers sell
31
their local fresh produce directly to consumers. This market is proving to be an innovative and positive experience for both farmers and consumers.
One interesting case related to the way a cooperative is organised is definitely the Koperattiva Produtturi tal-Halib Ltd (KPH) established in 1958 and incorporating all the local licensed milk producers delivering their milk to the dairy. KPH is committed to reduce the farm input costs, to sustain a market and to get the best value for the members’ produce – milk and beef. To reach these objectives over the years KPH invested heavily and developed a vertical structure to run its core business. The main activities are as follows: -
KPH is the leading importer of cereals and other feedstuffs in Malta.
KPH owns and runs one of the main feed mills in Malta (which is EU approved) producing
and selling compound feeds for the various livestock sectors – dairy, beef, pigs, poultry and
rabbit.
KPH is also active in the supply of farm equipment and consumables, artificial insemination
and cattle breeding services, farm insurance, training, farm support and advisory services to
help members to upgrade their farm facilities and operations and to improve quality and
efficiency.
KPH has two subsidiary companies:
One subsidiary owns and runs the dairy processing plant in Malta (which is EU
approved) and which processes all the milk delivered from Malta and Gozo into various
fresh dairy products like fresh pasteurised milk, milk drinks, yoghurts, desserts,
mozzarella, cream, cheeselets, irkotta etc. which are sold on the local market. In spite of
competition from imports, the dairy enjoys about 90% of the local market for fresh
pasteurised milk.
One subsidiary assists local producers to find a market for the beef produced locally at
the best possible prices.
All this core business activity in 2010 makes this cooperative one of the leading farmers’ organisations in the agricultural industry and in the agro food sector in Malta.
Finally, another interesting and innovative case of a cooperative not in the food chain but more in culture and heritage, related though to the local agricultural sector, is Koperattiva Rurali Manikata Ltd (KRM) established in 2007.
This cooperative has been entrusted by government with the management of farmstead in Manikata – an extensive rural complex made up of caves and rooms of different sizes, most of them in ruins. These possibly date back to medieval times. But most of these buildings belong to the era of the Knights of St. John. Farmers used to dwell in this area but little by little, the area was abandoned to its own fate and eventually this marvellous place turned into shambles.
Koperattiva Rurali Manikata is intent on restoring and conserving this place over a number of years, eventually turning it into a services centre for its farmer members. It plans to open up a visitors’ centre for all those who visit the fields of the members through the cooperative’s educational agro-tourism programme. To complement this programme, KRM also wishes to have an outlet in the Razzett from where visitors would be able to purchase typical local food. The role of policies to support this is discussed in the next chapters.
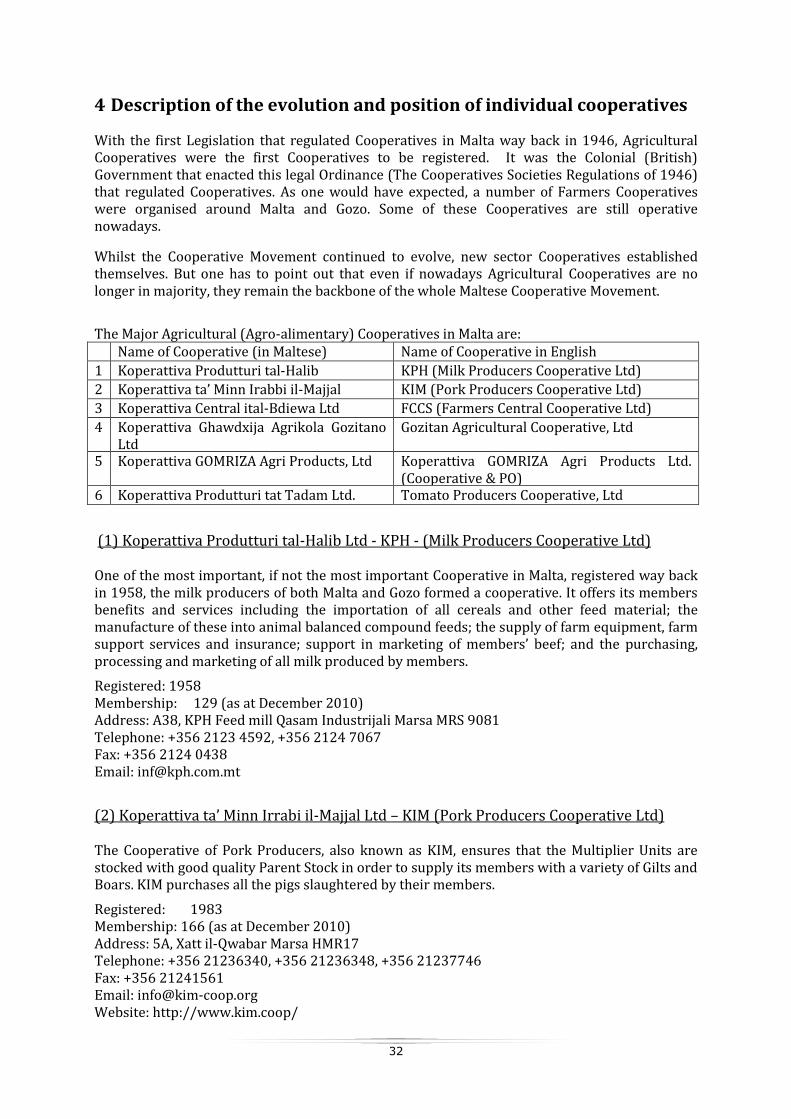
32
4 Description of the evolution and position of individual cooperatives
With the first Legislation that regulated Cooperatives in Malta way back in 1946, Agricultural Cooperatives were the first Cooperatives to be registered. It was the Colonial (British) Government that enacted this legal Ordinance (The Cooperatives Societies Regulations of 1946) that regulated Cooperatives. As one would have expected, a number of Farmers Cooperatives were organised around Malta and Gozo. Some of these Cooperatives are still operative nowadays.
Whilst the Cooperative Movement continued to evolve, new sector Cooperatives established themselves. But one has to point out that even if nowadays Agricultural Cooperatives are no longer in majority, they remain the backbone of the whole Maltese Cooperative Movement.
The Major Agricultural (Agro-alimentary) Cooperatives in Malta are: Name of Cooperative (in Maltese) Name of Cooperative in English
1 Koperattiva Produtturi tal-Halib KPH (Milk Producers Cooperative Ltd)
2 Koperattiva ta’ Minn Irabbi il-Majjal KIM (Pork Producers Cooperative Ltd)
3 Koperattiva Central ital-Bdiewa Ltd FCCS (Farmers Central Cooperative Ltd)
4 Koperattiva Ghawdxija Agrikola Gozitano Ltd
Gozitan Agricultural Cooperative, Ltd
5 Koperattiva GOMRIZA Agri Products, Ltd Koperattiva GOMRIZA Agri Products Ltd. (Cooperative & PO)
6 Koperattiva Produtturi tat Tadam Ltd. Tomato Producers Cooperative, Ltd
(1) Koperattiva Produtturi tal-Halib Ltd - KPH - (Milk Producers Cooperative Ltd)
One of the most important, if not the most important Cooperative in Malta, registered way back in 1958, the milk producers of both Malta and Gozo formed a cooperative. It offers its members benefits and services including the importation of all cereals and other feed material; the manufacture of these into animal balanced compound feeds; the supply of farm equipment, farm support services and insurance; support in marketing of members’ beef; and the purchasing, processing and marketing of all milk produced by members.
Registered: 1958 Membership: 129 (as at December 2010) Address: A38, KPH Feed mill Qasam Industrijali Marsa MRS 9081 Telephone: +356 2123 4592, +356 2124 7067 Fax: +356 2124 0438 Email: [email protected]
(2) Koperattiva ta’ Minn Irrabi il-Majjal Ltd – KIM (Pork Producers Cooperative Ltd)
The Cooperative of Pork Producers, also known as KIM, ensures that the Multiplier Units are stocked with good quality Parent Stock in order to supply its members with a variety of Gilts and Boars. KIM purchases all the pigs slaughtered by their members.
Registered: 1983 Membership: 166 (as at December 2010) Address: 5A, Xatt il-Qwabar Marsa HMR17 Telephone: +356 21236340, +356 21236348, +356 21237746 Fax: +356 21241561 Email: [email protected] Website: http://www.kim.coop/
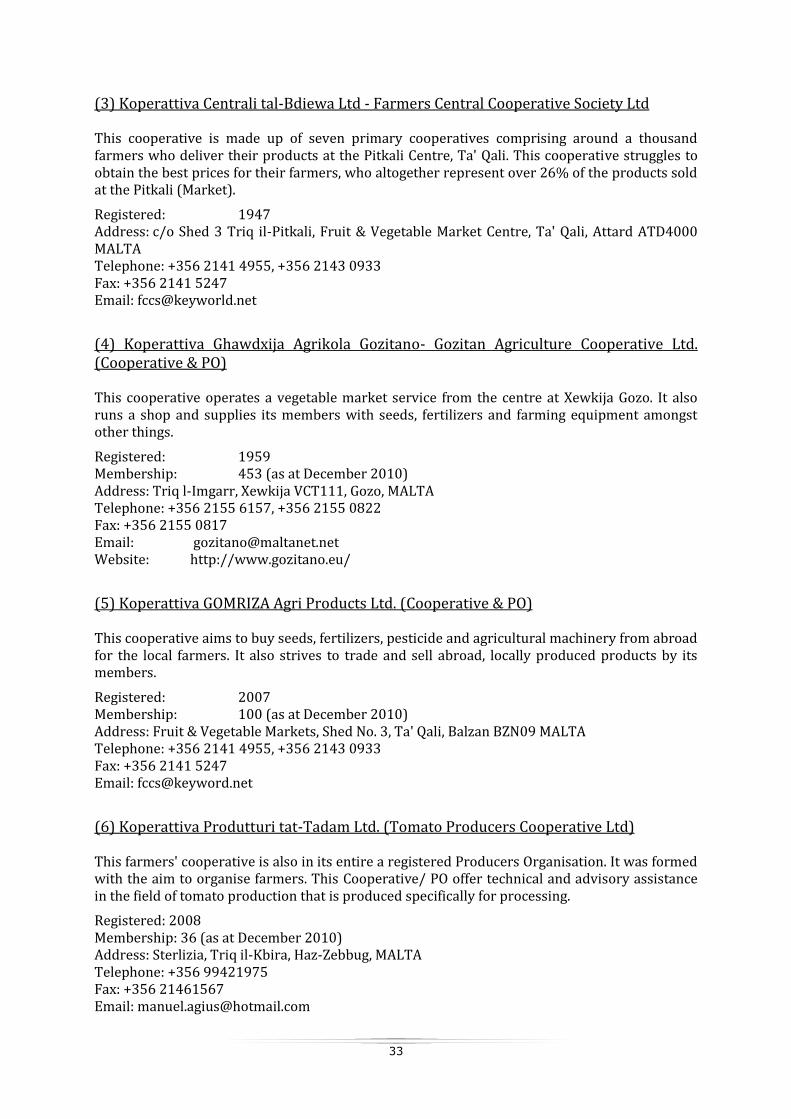
33
(3) Koperattiva Centrali tal-Bdiewa Ltd - Farmers Central Cooperative Society Ltd
This cooperative is made up of seven primary cooperatives comprising around a thousand farmers who deliver their products at the Pitkali Centre, Ta' Qali. This cooperative struggles to obtain the best prices for their farmers, who altogether represent over 26% of the products sold at the Pitkali (Market).
Registered: 1947 Address: c/o Shed 3 Triq il-Pitkali, Fruit & Vegetable Market Centre, Ta' Qali, Attard ATD4000 MALTA Telephone: +356 2141 4955, +356 2143 0933 Fax: +356 2141 5247 Email: [email protected]
(4) Koperattiva Ghawdxija Agrikola Gozitano- Gozitan Agriculture Cooperative Ltd. (Cooperative & PO)
This cooperative operates a vegetable market service from the centre at Xewkija Gozo. It also runs a shop and supplies its members with seeds, fertilizers and farming equipment amongst other things.
Registered: 1959 Membership: 453 (as at December 2010) Address: Triq l-Imgarr, Xewkija VCT111, Gozo, MALTA Telephone: +356 2155 6157, +356 2155 0822 Fax: +356 2155 0817 Email: [email protected] Website: http://www.gozitano.eu/
(5) Koperattiva GOMRIZA Agri Products Ltd. (Cooperative & PO)
This cooperative aims to buy seeds, fertilizers, pesticide and agricultural machinery from abroad for the local farmers. It also strives to trade and sell abroad, locally produced products by its members.
Registered: 2007 Membership: 100 (as at December 2010) Address: Fruit & Vegetable Markets, Shed No. 3, Ta' Qali, Balzan BZN09 MALTA Telephone: +356 2141 4955, +356 2143 0933 Fax: +356 2141 5247 Email: [email protected]
(6) Koperattiva Produtturi tat-Tadam Ltd. (Tomato Producers Cooperative Ltd)
This farmers' cooperative is also in its entire a registered Producers Organisation. It was formed with the aim to organise farmers. This Cooperative/ PO offer technical and advisory assistance in the field of tomato production that is produced specifically for processing.
Registered: 2008 Membership: 36 (as at December 2010) Address: Sterlizia, Triq il-Kbira, Haz-Zebbug, MALTA Telephone: +356 99421975 Fax: +356 21461567 Email: [email protected]
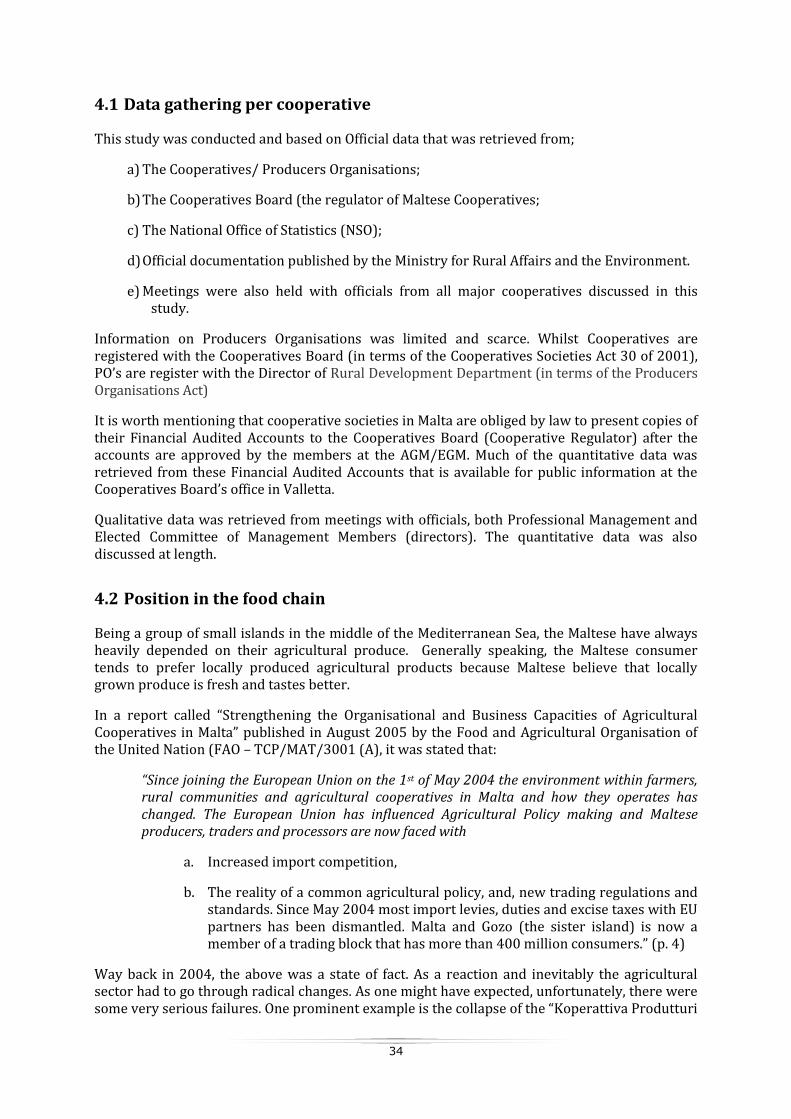
34
4.1 Data gathering per cooperative
This study was conducted and based on Official data that was retrieved from;
a) The Cooperatives/ Producers Organisations;
b) The Cooperatives Board (the regulator of Maltese Cooperatives;
c) The National Office of Statistics (NSO);
d) Official documentation published by the Ministry for Rural Affairs and the Environment.
e) Meetings were also held with officials from all major cooperatives discussed in this study.
Information on Producers Organisations was limited and scarce. Whilst Cooperatives are registered with the Cooperatives Board (in terms of the Cooperatives Societies Act 30 of 2001), PO’s are register with the Director of Rural Development Department (in terms of the Producers Organisations Act)
It is worth mentioning that cooperative societies in Malta are obliged by law to present copies of their Financial Audited Accounts to the Cooperatives Board (Cooperative Regulator) after the accounts are approved by the members at the AGM/EGM. Much of the quantitative data was retrieved from these Financial Audited Accounts that is available for public information at the Cooperatives Board’s office in Valletta.
Qualitative data was retrieved from meetings with officials, both Professional Management and Elected Committee of Management Members (directors). The quantitative data was also discussed at length.
4.2 Position in the food chain
Being a group of small islands in the middle of the Mediterranean Sea, the Maltese have always heavily depended on their agricultural produce. Generally speaking, the Maltese consumer tends to prefer locally produced agricultural products because Maltese believe that locally grown produce is fresh and tastes better.
In a report called “Strengthening the Organisational and Business Capacities of Agricultural Cooperatives in Malta” published in August 2005 by the Food and Agricultural Organisation of the United Nation (FAO – TCP/MAT/3001 (A), it was stated that:
“Since joining the European Union on the 1st of May 2004 the environment within farmers, rural communities and agricultural cooperatives in Malta and how they operates has changed. The European Union has influenced Agricultural Policy making and Maltese producers, traders and processors are now faced with
a. Increased import competition,
b. The reality of a common agricultural policy, and, new trading regulations and standards. Since May 2004 most import levies, duties and excise taxes with EU partners has been dismantled. Malta and Gozo (the sister island) is now a member of a trading block that has more than 400 million consumers.” (p. 4)
Way back in 2004, the above was a state of fact. As a reaction and inevitably the agricultural sector had to go through radical changes. As one might have expected, unfortunately, there were some very serious failures. One prominent example is the collapse of the “Koperattiva Produtturi
35
tat-Tjur Ltd. – Poultry Producers Cooperative Ltd, a cooperative that was set-up specifically as a means of achieving farmer-led vertical integration of the Maltese broiler industry and which financially collapsed in a matter of months because of bad decision making and bad governance, because of this, this local broiler breeders industry is still in disarray up to today.
Having said that, the Maltese Agriculture sector had a number of very positive results, a case in point is the Koperattiva Produtturi tal-Halib – KPH – Milk Producers Cooperative. This Cooperative reacted intelligently to the open market forces and established itself as a high quality, reliable local Milk Producer.
It has to be appreciated that because Malta’s Agricultural land is so minute, its yield is considerably high. This is because being right in the middle of the Mediterranean Sea, Malta’s weather, especially in winter time is considered to be very mild when compared to mainland Europe. On the negative side, Maltese fields are tiny and it is very difficult to employ heavy machinery to cultivate the fields with efficiency. Another major problem is irrigation, being an island, Malta has very limited water resources and more often than not, irrigation has to be carried out through borehole extracted water which has also become very limited and the authorities are in the process of placing more stringent control on the use of it.
It is therefore understandable that more often than not, Maltese produce is generally perceived as more expensive than the imported agricultural produce, although this is not always the case.
Many cooperatives and producer organisations have reacted to the importation of Agricultural produce from the European Union and beyond by improving (a) the quality of their Produce and (b) the presentation of the local produce being sold. It is worth mentioning that the volume of locally produced agricultural produce being sold to the local consumer in attractive sealed and labelled containers is on the increase as most Cooperatives and POs have developed branding and marketing strategies which they are now implementing, albeit to varying degrees. Perhaps the most obvious case can be found within the dairy sector. However, other sectors, such as, the pork and fruit and vegetable sectors are also adopting a more savvy approach to the consumer.
For example, KIM launched a point-of-sale ‘Majjal ta’ Malta frisk u genwin’ (‘Maltese pork: fresh and wholesome’) campaign. The Ta’ Qali Producers Group have developed branded packaging which they are using across their product range. Some Cooperatives have also opened up their Market shops improving drastically their marketing position.
The Milk Producers Cooperative (KPH) and its subsidiaries which have always led the way in achieving results through co-operation, reacted by making huge technical advancement both on Farm and Dairy Plant level. This Cooperative continued to improve its marketing strategy. The Milk Producers Cooperative also made available to its customers an increased variety number of marketed dairy products.
The Pig Breeders Cooperative (KIM) started to react to the external Market forces very late in the day. KIM was one of those Cooperatives that complained with the local authorities of unfair competition. KIM complained that “low quality”, “water saturated” pork was being imported. The Cooperative complained that KIM’s products could never compete, pricewise, with such products. As mentioned above, KIM’s reaction was to launch a marketing campaign aimed at “educating” the local consumer to appreciate locally-bred, fresh pork which yielded positive results. KIM also embarked on a restructuring exercise with the aim of further improving the quality of the pork. They also put in place the necessary facilities to offer the ‘deboned’ carcass, thus increasing the ‘added value’ to their customers. Although official statistics are not available to assess the result of this campaign the Cooperative’s management informed us that there was a positive reaction. They estimate that sales of local pork rose by around 23%, with its local market share stabilising at around 70%.
36
4.3 Institutional environment
Historical Development of Maltese Cooperatives
As has already been stated, the origins of the Maltese cooperative movement are largely in the agricultural sector. Next, the evolution of Maltese cooperatives is briefly sketched.
1837- a group of Medical Doctors formed an association called Societa’ Medica d’Incoraggiamento, in 1847, its name was changed to Camera Medica;
In 1862 - a group of farmers joined into an association known as Societa’ in Sollievo dei Gabelloti di Malta e Gozo
1884 – Engineer Angelo Caruana set-up the Societa’ Operaia at Senglea, due to fears linked to Protestantism, it’s name was changed to Societa’ Operaia San Giuseppe;
1887 – The Societa’ Coperattiva Maltese whose principal aim was to provide some form of relief to those who were unemployed was setup.
1891 – Socjeta’ Maltija tas-Sajd;
1904 – L-Ghaqda tal-Furnara;
1906 – Sidien Bejjiegha tal-Halib;
1911- Ghaqda Sajjieda Xlukkajri;
1919 - Xirka Maltija tas-Sajd;
Maltese Cooperative Legislation History
1. Cooperatives Societies Ordinance, 1946;
This was introduced by Ordinance No. XXIV of 1946 adopted on the 8th of July 1946 and brought into force on the 12th of December 1946. It stated purpose was “to provide for the Constitution and Regulation of Cooperative Societies”.
2. Cooperatives Societies Act 6 of 1975;
This Act abolished completely the role of the registrar and introduced the Cooperatives Board as the regulatory body of Cooperatives in Malta;
3. Cooperatives Societies Act, 1978 (Act No XXVI of 1978);
This Act was listed as Chapter 278 of the Laws of Malta and was brought into effect on the 16th April 1979. It stated purpose was “to provide, in place of the Cooperative Ordinance, 1946, for the constitution. Registration and control of Cooperatives Societies and for matters connected therewith…”
4. Cooperatives Societies Act XXX of 2001.
This more recent Act describes itself as “An act to provide for the (a) Constitution, (b) Registration (c) Control of Cooperatives Societies and (d) for matters connected therewith or ancillary thereto”. It is listed as Chapter 442 of the Laws of Malta.
It is worth mentioning that currently discussions with Koperattivi Malta (Cooperatives Malta – Federation of Maltese Cooperatives) are underway to amend the Maltese Cooperatives Legislation.
37
Legislation on Producers Organisations
Producers Organisation legislations in Malta is regulated by CHAPTER 447
PRODUCER ORGANISATIONS ACT, to provide for the creation of Producer Organisations in the Agricultural and Fisheries sectors enacted on the 6th January, 2003.
Producers Organisations in Malta are regulated by Rural Development Department, Agricultural Services and Rural Development Division within the Ministry for Resources and Rural Affairs.
Rationales for setting up a Producers Organisation
The rationales for setting up a Producer Organisation in Malta are summarised below:
• to protect and/or increase the market share of producers and ensure that their production is as market-oriented as possible;
• to increase the capacity of producers to access market information and to undertake new marketing activities so as to promote the placing on the market of the products produced by Producer Organisations’ members;
• to improve the producers’ ability to meet legislative and other constraints by promoting production techniques which are environmentally sound and along rational lines.
Mandatory Eligibility Criteria for establishing a PO in Malta
In order to apply for recognition, a Producer Organisation must comply with the following mandatory criteria:
• It must draw its membership from producers in the Maltese islands of potatoes, pig meat, poultry, milk, traditional cheeselets made from sheep and/or goat’s, honey and rabbit meat. Each individual can only be a member of one Producer Organisation of the same product.
• It shall be set up for the purpose of jointly adapting the production, and jointly marketing their agricultural product, including preparation for sale and supply to bulk buyers, and of establishing common rules of production information, with special reference to harvesting and stocks. Thus groups forming for other purposes are ineligible for support.
• It must have a minimum of 5 members. All the members must be farmers or livestock breeders registered with IACS or with the Food and Veterinary Regulation Division,
• It must have a minimum turnover of 10% of the sector's national production in the case of pig meat, milk and poultry and a minimum of 2.5% of the sector's national production for rabbit meat, honey, cheeselets and potatoes. This 2.5 % of annual turnover must however amount to at least €200,000
Overview of Producers’ Organisations
Whilst conducting this study it became evident that both the officials and farmers members of Cooperatives were unaware of the real scope of Producer Organisations. It was clear that the
38
majority felt that POs were necessary ‘a necessary evil’ whose main function was to allow access to EU funding. In their opinion, the POs represented, to some degree at least, a duplication of work as Cooperatives and POs have similar characteristics and objectives. This duplication may also be responsible for creating some fragmentation in the organisation of farmers. While this may not be a direct threat to the cooperatives, it may lead to some dissipation of resources and, possibly, lower overall volumes of produce.
4.4 Internal Governance
Maltese Agricultural Cooperatives have not been immune to bad governance experiences; unfortunately, we have witnessed the dissolution of some agriculture cooperatives due to (1) lack professional management and (2) lack of member loyalty. In spite of existing legislative and statutory supporting infrastructures, which some cooperatives successfully managed to harness to their advantage, a number implemented modus operandi that were not always ‘above board’. Unfortunately, their deviation from legislative guidelines resulted in often quite blatant examples of bad governance.
Unfortunately, one of the major issues that lead to internal bad governance in cooperatives is the lack of participation of the members in the democratic process. Generally speaking, internal good governance is best achieved whenever a harmonious (work) relation is achieved between the Committee of Management (Directors) and the professional management. It is not easy to find or educate professional management of cooperatives to understand the borderline responsibility between the “policy” and the “executive”. Cooperatives belong to their members and all aims and interest has to be focused at the member as a part of the collective.
On a positive note, one has to point out that the number of University Students that are reading for a Degree in Accounts/ Finance within the Faculty, Education, Management and Accountancy (FEMA) opting to submit a thesis related to cooperatives is increasing on a yearly basis. In fact, this year, four University Students from this Faculty will be focusing their theses on Cooperatives. Koperattivi Malta, through the Central Cooperative Fund, has carried out a number of rather basic training courses aimed at cooperative members. Unfortunately, the response from cooperative members was not very encouraging. My recommendation would be that, prior to conducting these educational courses, a TNA (Training Needs Analysis) is carried out so that the organisers (in this case Koperattivi Malta), can identify the needs and concerns of their course participants.
Another suggestion would be for the University to introduce a module on Cooperative Management. This would be a good start towards raising the profile of this area amongst students and prospective cooperative administrators.
4.5 Performance of the cooperatives
It is very difficult to generalise about the overall performance of Agricultural Cooperative in Malta, the reality is that Cooperatives have reacted in different ways, but one can safely conclude that whilst the pinch of the open EU open market reality had been felt, most Agricultural Cooperative have in one sense or another have reacted positively.
As stated earlier on, the “Koperattiva Produtturi tat-Tjur Ltd. – Poultry Producers Cooperative Ltd was the greatest sad failure, in which all attempts to organise local production of poultry failed completely. No doubt about it, the attempts to vertically integrate was a direct reaction to the market forces realities but the failure of success of this cooperative can only be blamed on its members who were not able to understand their long term interests.
39
Another example that is still developing is, the Koperattiva ta’ Minn Irabbi il-Majjal – KIM – Pig Producers Cooperative Ltd. Officials of this cooperative have stated that locally produced pork is in direct competition with low quality cheaper pork products. KIM has sought on various the assistance of local authorities to ascertain that all imported Pork products had a certain level of quality standard. KIM claims that it can only compete with pork imports if the consumer is not aware that their higher quality products are much better than imported lower quality. As a reaction to this, the KIM embarked on a marketing exercise aimed at making the Maltese Consumer more aware of their products.
In Malta, cooperatives have a significant market position in the supply of inputs and marketing of Dairy, fruit and vegetables and pork but few in other agriculture sector.
In recent years sale turnover has continued to decline and margins tightened for most cooperatives and the reality is if they do not capitalise on the positive aspect of change they will face serious difficulties. Local Agricultural Cooperatives will need to be more dynamic, optimistic and develop structures, standards and procedures over time that are in response to changes in the commercial, political and social environment.
40
5 Sector analysis
5.1 Introduction
In this chapter we discuss developments in the eight sectors that are central to this study. We report on trends in the markets, important changes in (agricultural) policy and we try to link this to the strategies and performance of the investor-owned firms and cooperatives in the sector. The period of observation is 2000 – 2010. Agriculture in Malta5
Malta is a small, densely populated Mediterranean island state, in which the agricultural sector contributes only 1.7% of the GDP but is the largest land user, occupying 11,800 hectares or 47.8% of the total area of the islands. Farmers do not only cater for the local fresh food demand but are also the major stakeholders in countryside management in the Maltese Islands. In fact, Maltese agriculture is considered as having multiple functions and a value beyond its economic contribution. It has been particularly important in shaping the rural landscape and the environmental character of the Maltese archipelago. Farming is also an integral component of the cultural heritage and a crucial backdrop for the tourism industry.
In Malta, there are 973 registered full-time farmers and 14,575 registered part-time farmers, out of which around 3000 are thought to be active. The Maltese farming population is ageing and young people are less attracted to a career in agriculture as other sectors, particularly the tertiary sector, provide more appealing employment possibilities.
Maltese Agriculture – Major Limitations
Maltese agriculture faces major natural and structural constraints. Two main limitations are lack of farmland and land fragmentation. The total number of agricultural holdings amount to 11,072, with 71.3% of these being less than 1 hectare of utilised agriculture area (UAA). A typical feature of Maltese agriculture is the small size of fields that are normally delineated by rubble walls. This can be a big stumbling block for farmers as the use of machinery and agricultural equipment is impeded. The issue of small farmland is coupled with land fragmentation that results from customary inheritance practices where the occupant divides farmland between progeny. The low organic content of soils also presents added limitations. Apart from land constraints, another major limitation is limited rainfall and limited access to water.
The livestock sector also suffers from various constraints, apart from those already mentioned related to land and water. This sector is also constrained by the complete reliance on imported cereals and other feed materials; lack of feed material options; higher costs for sea transport and logistics due to relatively small parcels; lack of pastures for livestock and lack of good quality forage
Finally another major limitation faced by Maltese agriculture is the local small market which in turn gives rise to low economies of scale and relatively higher costs throughout the production and food supply chain Farming produce in Malta
A range of vegetables are cultivated in Malta either as field crops or protected in greenhouses. In greenhouses, Maltese farmers cultivate tomatoes, cucumber, aubergines, zucchini, bell pepper, runner beans, lettuce, strawberries, melons, watermelons as well as herbs. These vegetables are
5 Information – Department of Agriculture – National Statistics Office Malta
41
also grown as field crops requiring irrigation. Other field crops include potatoes, onions, garlic, kohlrabi, cauliflower, cabbages and broad beans. Spring potatoes in Malta are grown exclusively for export, to reach the early market in the Netherlands, Germany, Switzerland and UK. The potato winter crop, which is less popular among farmers, is grown only for the local market. Most tomatoes grown in the open fields are grown to supply three main processors of a traditional tomato paste known as Kunserva. Besides this, other table tomato crops are grown for the fresh local consumption. The total annual volume of vegetables sold through official markets averages around 40,000 tonnes.
Common fruit trees in Malta include peaches, figs, plums, grapes, oranges, nectarines, lemons and the Bambinella, a small pear that has recently started being exported to a leading food chain in the UK. Summer is the main fruit season in Malta, starting from June till September. However, citrus trees produce like oranges and lemons are sold in the winter months. The total annual volume of fruit sold through official markets exceeds 3,000 tonnes.
The two indigenous vine varieties, Ġellewza and Girgentina, produce large grape bunches in large quantities that are used both as fruit and for wine making. Around 60 % of the area under vines in Malta is dedicated to these two indigenous varieties. There are other 60 vine varieties in Malta that are exclusively used for wine making by 12 local wineries. The Ministry for Resources and Rural Affairs controls labelling on wine bottles produced in Malta, which must clearly show the denomination of the wine, the vintage year and also the origin. The total wine production has increased to 37,000 hectolitre per year and with an average grape production of 3,500,000 kg per year.
Animal husbandry in Malta is carried out in closed farm environments since permanent grass areas or grazing pastures are practically non-existent in Malta. There are 130 cow farms, 150 pig farms, 80 chicken farms, 40 hen farms and around 270 sheep farms having more than 10 sheep. There are also around 300 small sheep farms and a number of rabbit farms. Animal breeders in Malta are vulnerable to cereal prices since feed is imported. Nevertheless there was a large investment in farms since EU accession, mainly linked with hygiene and quality standards, animal welfare, environment and farm modernisation. Malta – EU Accession – Major Policy Changes/Support Schemes
During the period 2000 – 2010 and perhaps throughout the historical development of agriculture in Malta, one of the major changes that had a great impact on agriculture in general and all the sectors under consideration was Malta’s accession to the European Union on 1st May 2004.
Prior to EU accession, local agricultural products were protected through a system of import tariffs/levies or quotas on similar primary or processed food products from abroad. Thus, local farming produce was secured by a closed market system with a focus on a narrow variation of crops and food products. As to pricing and farmers’ income, farmers enjoyed better bargaining power in the supply chain. However, the inward oriented market system, together with lack of investment aid policies, did not motivate the farming community to invest in higher quality, better efficiency, modernisation of farms and equipment; diversification and value added quality products and better marketing.
Since Malta joined the European Union on 1st May 2004, the environment within which farmers, rural communities and agricultural cooperatives operate has changed drastically. The European Union has influenced agricultural policy making. Maltese farmers, agro-processors, traders and consumers had to adapt to a completely different scenario.
On the production level, all sectors need to adapt to the EU framework, in particular:
42
- The EU Common Agricultural Policy including the CMO and EU regulations and standards
- The approval and compliance to all EU standards of all food production holdings, agro-processing plants and establishments
- Cross compliance regulations ensuring compliance to the required standards in waste management and environment, food hygiene, food safety, animal welfare
All this necessitated a vast investment programme by the farmers and operators in the various sectors to restructure and upgrade significantly the holdings, products and management/operations.
But the major policy change since EU accession on 1st May 2004 was the immediate dismantling of all import tariffs/levies, duties and import quotas with all EU partners and hence the complete liberalisation of the import market for agricultural and relative food products. This brought harsh competition to the local agricultural produce and agro food products in all sectors from imports of similar products. This also changed in no small way the position of the local agricultural sectors within the food chain with the countervailing power in most cases shifting from upstream to downstream in the chain.
Since EU accession on 1st May 2004, to assist the farming community and local production to adapt to this new scenario and to mitigate the replacement of import levies and assist local production to meet competition, various measures were implemented namely: -
- EU Direct Payments Direct payments/direct income support under the CMO of various sectors and the EU Common Agricultural Policy. Since 2007 Malta adopted the Single Payment Scheme (SPS) under the first pillar of the CAP whereby direct aid (entitlements), decoupled from production are paid to land farmers and dairy producers.
- National Aid Programme (SMPPMA) Financial assistance/support on income and investments under a government temporary state aid programme ‘Special Market Policy Programme for Maltese Agriculture’ (SMPPMA) for the period post accession (2004 – 2013). The crop sectors that benefitted from this state aid were tomatoes for processing, wine, fresh fruit and fresh vegetables. The livestock sectors that benefitted from this state aid were the dairy, pig meat, eggs and poultry sectors. This programme ended in 2010 for the livestock sectors and will end in 2013 for the crop sectors.
- Rural Development Programme
Various other measures and assistance schemes under the two Rural Development Programmes for Malta (2004 – 2006 and 2007 – 2013), namely:
1. Improving the competitiveness of the agricultural sector (Axis 1)
Measure 121 – Modernisation of Agricultural Holdings
There was a very strong participation by farmers in all the agricultural sectors for financial assistance on their investments related to modernisation and restructuring.
Measure 123 – Adding Value to Agricultural Products
43
Measure 124 – Cooperation for development of new products, processes and technologies in the agriculture and food sectors
Regarding these two measures, there was relatively low participation by farmers’ cooperatives as very few are operating in the processing and value chain. Most of these funds were used for projects to modernise and upgrade processing plants (privately investor owned) in all the agri food sectors. Unlike cooperatives, these private entities are not committed to buy the local primary produce for processing.
Measure 111 – Vocational Training and Information Actions
Cooperatives and farmers’ associations took a leading role in the implementation of this measure.
Measure 115 – Setting up of Farm Advisory Services
Measure 114 – Use of Farm Advisory Services
A joint consortium including two leading cooperatives and a farmers’ association was set up to run this service and implement these measures.
Measure 142 – Setting up of Producer Groups
Only one PO (Viticulture) benefitted under this measure. Other registered POs are waiting for the re-issue of this measure.
Note: there are two POs and three PGs benefitting under the CMO
2. Improving the Environment in the Countryside (Axis 2)
As Malta was designated as less favoured area, all land farmers received payments under Measure 212 – Natural Handicap Areas Payments. Moreover, various farmers benefitted from Measure 214 – Agri Environmental Payments
3. Meeting Standards (2004 – 2006)
Most livestock breeders benefitted from this financial aid on investment on their farms related to waste management to meet the nitrates directive/environmental conditions
The radical change brought by EU accession had a different impact on the various sectors within the local agricultural industry. This will be reviewed sector by sector in the next sections.
5.2 Cereals
In Malta there is no usable local production of cereals. Although about 40% of the arable land is used to sow different types of wheat, however this is completely used to produce forage for the dairy sector in Malta.
Malta imports all its requirements of cereals for domestic use, mainly barley and maize for animal feed for the local livestock sectors and common and durum wheat for the production of flour for local human consumption. According to official statistics (National Statistics Office (2009)), during the crop year 2008/2009, Malta imported 162,400 metric tons of cereals comprising of 35,500 metric tons of common wheat, 34,600 metric tons of durum wheat, 61,600 metric tons of maize, and 28,200 metric tons of barley.
For the purpose of this study, in Malta there is no cereals sector.
44
5.3 Sugar
Malta has no planting of sugar beet and hence no usable local production of sugar. Malta imports all its requirements of sugar, both for domestic human consumption and re-exports. According to official statistics (National Statistics Office (2009)), during the crop year 2008/2009 Malta imported 35,900 metric tons of sugar, with 18,100 metric tons going for local human consumption.
For the purpose of this study, in Malta there is no sugar sector that can be considered.
5.4 Fruit and vegetables Fruit and vegetables sector is one of the three main sectors in Maltese agriculture.
Vegetable sector - Production
The vegetable sector market in Malta consists of a wide range of vegetables. These are mainly divided in two, the Protected Crop produce and the Fields Crop Produce. As Protected Crop cultivation, farmers produce mostly greenhouse tomatoes, cucumber, aubergines, zucchini/squash, bell pepper, runner beans, lettuce, strawberries, melons and watermelons. Herbs are also becoming increasingly cultivated in the greenhouses. These vegetables are also grown as field crops requiring irrigation.
In the outdoor fields the mostly grown vegetables are the potatoes, brassicas (kohlrabi, cauliflower, cabbages etc), lettuce, tomatoes, bell peppers, aubergines, onions, garlic, zucchini/squash, broad beans, strawberries, melons and water melons.
The potato crop in Malta is planted in either the spring or winter season. Most of the potatoes in the spring crop are grown exclusively for export, to reach the early market in Europe while the rest is grown for local consumption. The winter crop, which is less popular among farmers, is a crop grown solely for the local market.
Most tomatoes grown in the open fields are grown for processing, where all the produce is processed by three main processors. Besides this, other tomato crops are grown by farmers for the fresh local market.
Brassicas, lettuce and zucchini in Malta are cultivated nearly all year round.
The total annual volume of vegetables sold through official markets in the last 5 years (2005 – 2009) averages around 40,000 tonnes.
Fruit Sector - Production
The fruit sector market in Malta also consists of a variety of fruit. Common fruit trees in Malta include peaches, figs, plums, grapes, oranges, nectarines and the Bambinella. Summer is the main fruit season in Malta, starting from June till September. However citrus trees produce like oranges and lemons are sold in the winter months.
The total annual volume of fruit sold through official markets in the last 5 years averages around 3,000 tonnes.
Policies
As explained in section 5.1, EU accession on 1st May 2004 also had an impact on the fruit and vegetables sectors. Farmers had to adapt to the CMO and all EU regulations and standards applicable to this sector. At the same time, all existing import tariffs were removed and the local
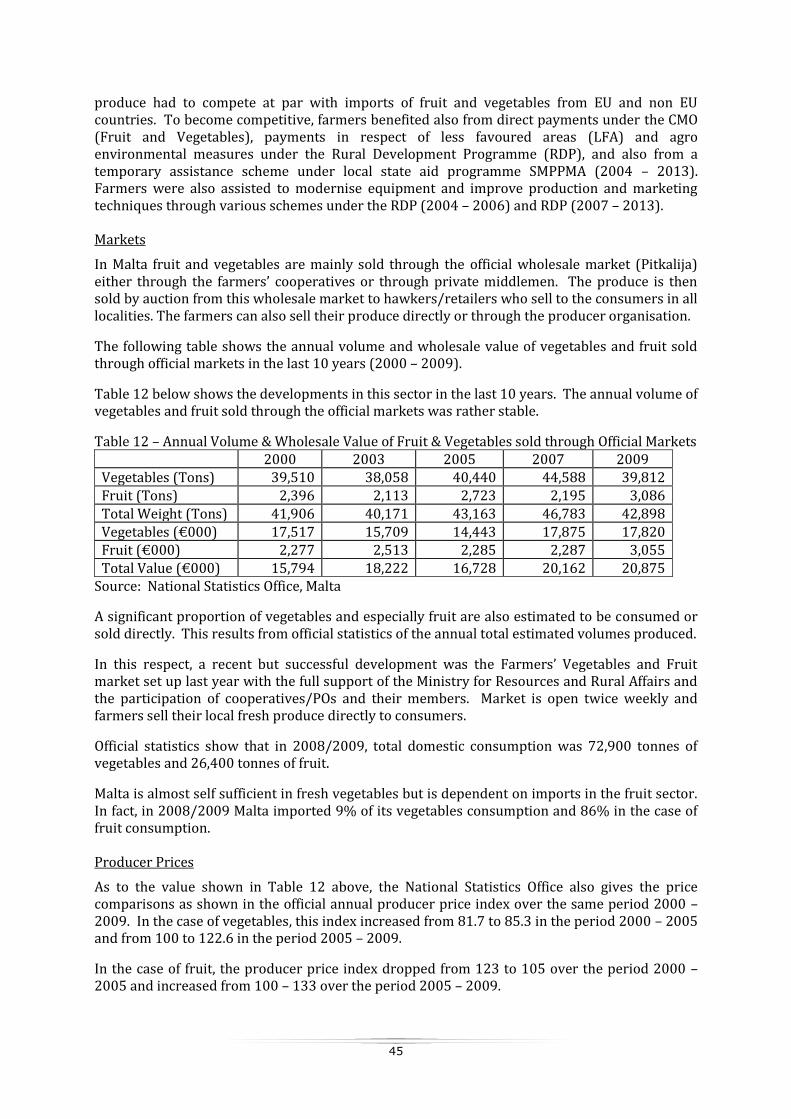
45
produce had to compete at par with imports of fruit and vegetables from EU and non EU countries. To become competitive, farmers benefited also from direct payments under the CMO (Fruit and Vegetables), payments in respect of less favoured areas (LFA) and agro environmental measures under the Rural Development Programme (RDP), and also from a temporary assistance scheme under local state aid programme SMPPMA (2004 – 2013). Farmers were also assisted to modernise equipment and improve production and marketing techniques through various schemes under the RDP (2004 – 2006) and RDP (2007 – 2013).
Markets
In Malta fruit and vegetables are mainly sold through the official wholesale market (Pitkalija) either through the farmers’ cooperatives or through private middlemen. The produce is then sold by auction from this wholesale market to hawkers/retailers who sell to the consumers in all localities. The farmers can also sell their produce directly or through the producer organisation.
The following table shows the annual volume and wholesale value of vegetables and fruit sold through official markets in the last 10 years (2000 – 2009).
Table 12 below shows the developments in this sector in the last 10 years. The annual volume of vegetables and fruit sold through the official markets was rather stable.
Table 12 – Annual Volume & Wholesale Value of Fruit & Vegetables sold through Official Markets 2000 2003 2005 2007 2009 Vegetables (Tons) 39,510 38,058 40,440 44,588 39,812 Fruit (Tons) 2,396 2,113 2,723 2,195 3,086 Total Weight (Tons) 41,906 40,171 43,163 46,783 42,898 Vegetables (€000) 17,517 15,709 14,443 17,875 17,820 Fruit (€000) 2,277 2,513 2,285 2,287 3,055 Total Value (€000) 15,794 18,222 16,728 20,162 20,875
Source: National Statistics Office, Malta
A significant proportion of vegetables and especially fruit are also estimated to be consumed or sold directly. This results from official statistics of the annual total estimated volumes produced.
In this respect, a recent but successful development was the Farmers’ Vegetables and Fruit market set up last year with the full support of the Ministry for Resources and Rural Affairs and the participation of cooperatives/POs and their members. Market is open twice weekly and farmers sell their local fresh produce directly to consumers.
Official statistics show that in 2008/2009, total domestic consumption was 72,900 tonnes of vegetables and 26,400 tonnes of fruit.
Malta is almost self sufficient in fresh vegetables but is dependent on imports in the fruit sector. In fact, in 2008/2009 Malta imported 9% of its vegetables consumption and 86% in the case of fruit consumption.
Producer Prices
As to the value shown in Table 12 above, the National Statistics Office also gives the price comparisons as shown in the official annual producer price index over the same period 2000 – 2009. In the case of vegetables, this index increased from 81.7 to 85.3 in the period 2000 – 2005 and from 100 to 122.6 in the period 2005 – 2009.
In the case of fruit, the producer price index dropped from 123 to 105 over the period 2000 – 2005 and increased from 100 – 133 over the period 2005 – 2009.
46
Cooperatives/POs
In this sector Malta has by far the largest number of cooperatives (9) including one secondary cooperative, and two producer organisations and two producer groups. However, only a fraction of the farming population is members and sells their produce through these organisations. As discussed in section 3.2, only about one fourth of the fruit and vegetables are sold through POs/Cooperatives at the wholesale market. The system at the wholesale market is still dominated by the middlemen (pitkala). This is the result of long standing and cultural arrangements. Farmers’ organisations are not yet perceived as giving better prices and conditions than the private middlemen. Moreover, members’ loyalty and the free rider concept in cooperatives have to be addressed. Cooperatives are still acting like middlemen – sale by auction and have not yet embarked on a programme of adding value to produce. POs are starting to move in this direction. In fact 2 POs and 3 PGs are benefitting under the CMO – but official public information is not available on membership/turnover and financial assistance.
The lack of coordination and vertical integration by the farmers’ organisations that would add value to the produce along the supply chain and stiff competition from imports has put a lot of pressure on prices and competitiveness of the local produce and the bargaining power upstream. However, these new challenges did not bring any mergers in the upstream or downstream chain.
Future Challenges
Cooperatives and POs in this sector have the challenge to meet competition from imports and make the sector more competitive and sustainable in the coming years. In this respect it will be interesting how cooperatives/POs will be able:
To address the challenges of water management, climate change and sustainability
To address the issues of membership, member loyalty and market share of the cooperatives/POs in this sector
To strengthen internal governance and professional management of these organisations and create the right framework for more cooperation between the farmers’ organisations to work on common strategies with the objective of strengthening their competitiveness and their position in the food chain
To extend their activity from simple auction with wholesalers to more value added activities, including storage, grading, packing, promotion and marketing
As one of the main sectors, EU policies and CAP are crucial for the survival and competitiveness of this sector, particularly the level of financial support as direct payments (Pillar 1) and RDP measures (Pillar 2) in consideration of the specificities and limitations of the local fruit and vegetables sector. Further details are given in section 5.1 and 5.10 in this chapter.
5.5 Olive oil and table olives
In Malta as an island in the Mediterranean, olive trees were common in the very past. Over the years, urban development has reduced drastically the arable land and the olive tree population decreased considerably. In Malta olive oil and table olives are relatively a very small sector in the Maltese agro food system.
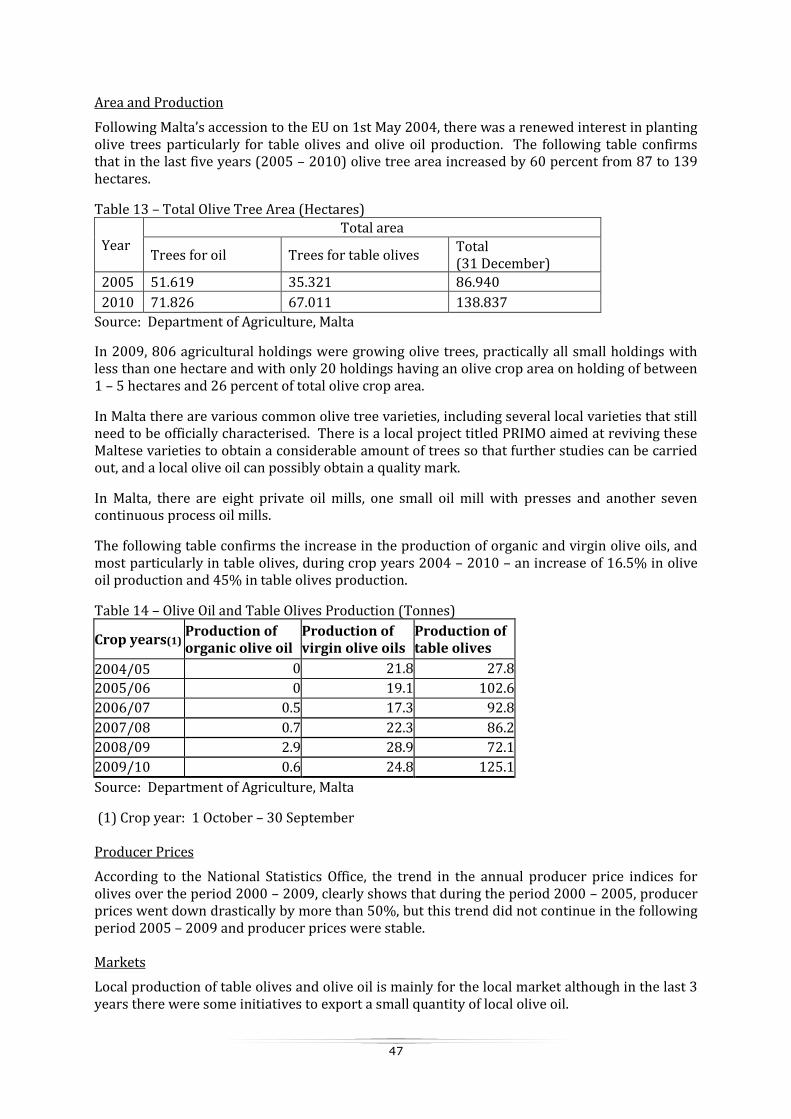
47
Area and Production
Following Malta’s accession to the EU on 1st May 2004, there was a renewed interest in planting olive trees particularly for table olives and olive oil production. The following table confirms that in the last five years (2005 – 2010) olive tree area increased by 60 percent from 87 to 139 hectares.
Table 13 – Total Olive Tree Area (Hectares)
Year Total area
Trees for oil Trees for table olives Total (31 December)
2005 51.619 35.321 86.940
2010 71.826 67.011 138.837
Source: Department of Agriculture, Malta
In 2009, 806 agricultural holdings were growing olive trees, practically all small holdings with less than one hectare and with only 20 holdings having an olive crop area on holding of between 1 – 5 hectares and 26 percent of total olive crop area.
In Malta there are various common olive tree varieties, including several local varieties that still need to be officially characterised. There is a local project titled PRIMO aimed at reviving these Maltese varieties to obtain a considerable amount of trees so that further studies can be carried out, and a local olive oil can possibly obtain a quality mark.
In Malta, there are eight private oil mills, one small oil mill with presses and another seven continuous process oil mills.
The following table confirms the increase in the production of organic and virgin olive oils, and most particularly in table olives, during crop years 2004 – 2010 – an increase of 16.5% in olive oil production and 45% in table olives production.
Table 14 – Olive Oil and Table Olives Production (Tonnes)
Crop years(1) Production of organic olive oil
Production of virgin olive oils
Production of table olives
2004/05 0 21.8 27.8
2005/06 0 19.1 102.6
2006/07 0.5 17.3 92.8
2007/08 0.7 22.3 86.2
2008/09 2.9 28.9 72.1
2009/10 0.6 24.8 125.1
Source: Department of Agriculture, Malta
(1) Crop year: 1 October – 30 September
Producer Prices
According to the National Statistics Office, the trend in the annual producer price indices for olives over the period 2000 – 2009, clearly shows that during the period 2000 – 2005, producer prices went down drastically by more than 50%, but this trend did not continue in the following period 2005 – 2009 and producer prices were stable.
Markets
Local production of table olives and olive oil is mainly for the local market although in the last 3 years there were some initiatives to export a small quantity of local olive oil.
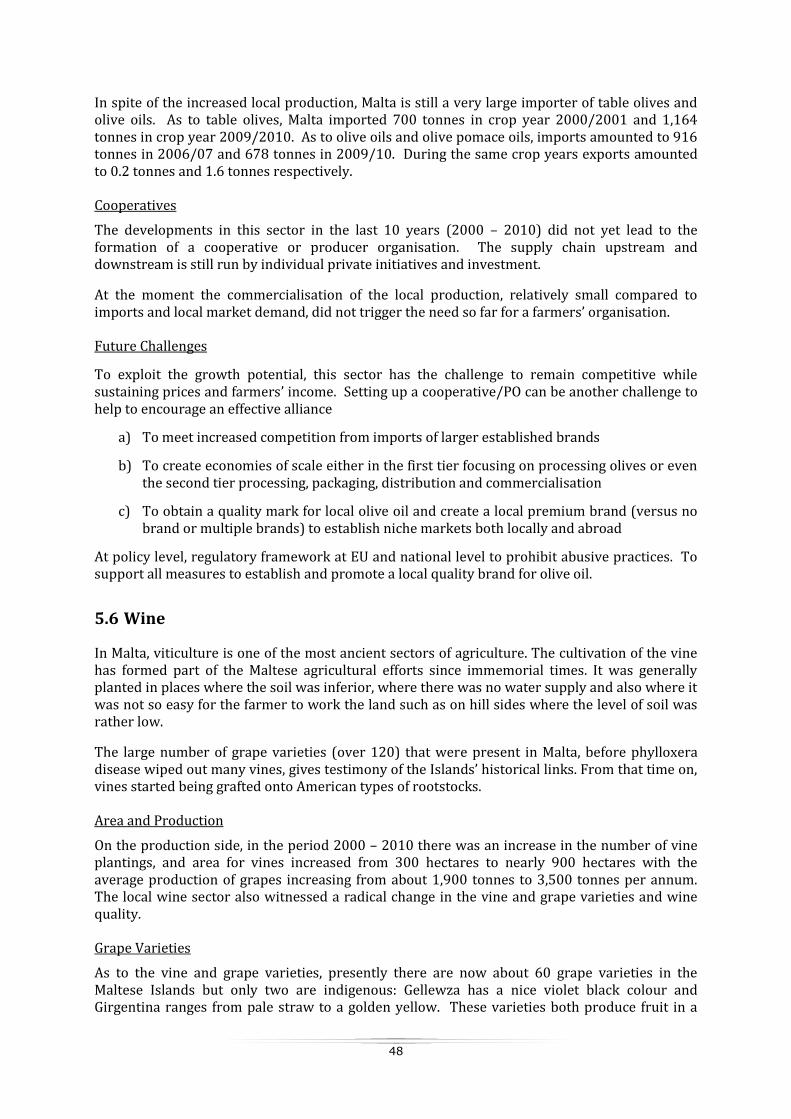
48
In spite of the increased local production, Malta is still a very large importer of table olives and olive oils. As to table olives, Malta imported 700 tonnes in crop year 2000/2001 and 1,164 tonnes in crop year 2009/2010. As to olive oils and olive pomace oils, imports amounted to 916 tonnes in 2006/07 and 678 tonnes in 2009/10. During the same crop years exports amounted to 0.2 tonnes and 1.6 tonnes respectively.
Cooperatives
The developments in this sector in the last 10 years (2000 – 2010) did not yet lead to the formation of a cooperative or producer organisation. The supply chain upstream and downstream is still run by individual private initiatives and investment.
At the moment the commercialisation of the local production, relatively small compared to imports and local market demand, did not trigger the need so far for a farmers’ organisation.
Future Challenges
To exploit the growth potential, this sector has the challenge to remain competitive while sustaining prices and farmers’ income. Setting up a cooperative/PO can be another challenge to help to encourage an effective alliance
a) To meet increased competition from imports of larger established brands
b) To create economies of scale either in the first tier focusing on processing olives or even the second tier processing, packaging, distribution and commercialisation
c) To obtain a quality mark for local olive oil and create a local premium brand (versus no brand or multiple brands) to establish niche markets both locally and abroad
At policy level, regulatory framework at EU and national level to prohibit abusive practices. To support all measures to establish and promote a local quality brand for olive oil.
5.6 Wine
In Malta, viticulture is one of the most ancient sectors of agriculture. The cultivation of the vine has formed part of the Maltese agricultural efforts since immemorial times. It was generally planted in places where the soil was inferior, where there was no water supply and also where it was not so easy for the farmer to work the land such as on hill sides where the level of soil was rather low.
The large number of grape varieties (over 120) that were present in Malta, before phylloxera disease wiped out many vines, gives testimony of the Islands’ historical links. From that time on, vines started being grafted onto American types of rootstocks.
Area and Production
On the production side, in the period 2000 – 2010 there was an increase in the number of vine plantings, and area for vines increased from 300 hectares to nearly 900 hectares with the average production of grapes increasing from about 1,900 tonnes to 3,500 tonnes per annum. The local wine sector also witnessed a radical change in the vine and grape varieties and wine quality.
Grape Varieties
As to the vine and grape varieties, presently there are now about 60 grape varieties in the Maltese Islands but only two are indigenous: Gellewza has a nice violet black colour and Girgentina ranges from pale straw to a golden yellow. These varieties both produce fruit in a
49
large quantity. The size of the cluster is also relatively large. The area under vines dedicated to the two indigenous variety groups is about 60% of the total area under vines in Malta. The rest of these varieties are all international varieties with the most popular being the Merlot, Syrah, Grenache, Cabernet Sauvignon and Cabernet Franc for red varieties and Chardonnay, Vermentino, Viognier and Trebbiano as white varieties. With EU accession, the Maltese consumer trend was to choose wines made from international grape varieties. Nevertheless, the Gellewza variety is currently being given more importance and a number of DOK Gellewza wines are also being produced.
Producer Prices
According to the National Statistics Office (NSO), the annual producer price indices for grapes for the years 2000 – 2009 show that prices dropped drastically in 2004 and 2005 but were then stable over the period 2005 – 2009. In 2010, grape prices were not very high and these are normally divided into 3 categories mainly: DOK at €0.95, IGT at €0.75 and table wine at €0.45 per kilogram.
Wine Production
All the local wine grapes production is sold to local wineries. With EU accession, these wineries which are privately owned also had to undertake a vast programme of restructuring and upgrading of their facilities and processes to enable them to produce a greater variety and higher quality wines. This was necessary to meet the stiff competition from wine imports from EU and non EU countries. Presently in Malta there are 12 wineries, 5 of which are large and buy a considerable amount of grapes from farmers while the others are smaller and press a small amount of grapes which they grow themselves. Three of these wineries are situated on the island of Gozo.
The total wine production has increased to 37,058.59 hectolitre per year and with an average grape production of 3,511,030 Kg per year.
Wine Quality
As to the wine quality, the success of such a wealthy tradition stands to reason, given that our island has all the ingredients for the production of good quality wine. The Maltese climate improves the grape quality with a high sugar level and low acidity. Farmers and viticulturalists are making use of innovative planting techniques, pruning as well as machinery that is used in the vineyard. This led to a large increase in the production of quality wines being classified as DOK and IGT. With the introduction of Legal Notice 416 of 2007 (D.O.K. Wines Production Protocols Regulations) wineries are sending samples of each wine to the Enoteca of Siena for DOK and IGT classification based on chemical and organoleptic analysis. This wine must conform to both Maltese and EU legislation. Labelling must clearly show the denomination of the wine, the vintage year and also the origin.
Policies
EU accession on 1st May 2004, as discussed in Section 5.1, brought a radical change also in the wine sector. On the one hand on accession the wine market was liberalised for imports from other EU countries and protective import tariffs were completely dismantled. At the same time, various support measures and assistance schemes linked with the local state aid programme (SMPPMA) and the Rural Development Programme (RDP) motivated farmers to plant more vines for a variety of high quality wine grapes and to use more modern and innovative production systems and techniques. Likewise, incentives were given to restructure and upgrade the wineries and the processing and marketing systems. The introduction of DOK and IGT brought Maltese wine within the range of EU quality wines.
50
In its national support programme in the wine sector, approved in 2008, Malta chose to transfer the entire budget to the single payment scheme for the period 2009 – 2013. In this sector Malta opted for the single payment decoupled from production. However, following EU accession in 2004, assistance for new vine plantings carried a condition that vines have to be cultivated for at least ten years. Therefore, so far one cannot assess the impact of decoupled aid under the single payment scheme on the local production of grapes.
These radical changes in policies brought about significant changes along the whole supply chain and most important in the local wine market.
Markets
Obviously the pressure on producer prices and the local wine sector is the result of very stiff competition from imports of varieties of wine from EU and non EU countries. According to National Statistics Office, in crop year 2000/2001 as compared to year 2008/2009 the local usable production of wine decreased from 60,600 to 32,100 hectolitres while imports increased from 8,700 to 44,900 hectolitres respectively. Over the same period, domestic human consumption of wine has increased from 66,800 to 83,100 hectolitres. In Malta, although the wine sector has undergone a major restructuring process, there were no mergers in the upstream or downstream chain.
Cooperative/PO
A farmers’ cooperative established in 1960 for many years was buying the grapes produced by the members and was processing its own wines. But this cooperative though still registered is no longer active.
Meanwhile in September 2008, the PO “Organizazzjoni Produtturi Gheneb ghall-Inbid” was established and is currently the only producer organisation dealing with viticulture. This PO aims at finding new markets for the grapes produced by its members and is also producing under contract with other wineries its own wines. Market sources report that PO has a market share of about 70% by weight of the total local production of wine grapes. The PO is a key player in negotiating prices and conditions for this production with the wineries. In recent years, imports of foreign wine have put great pressure on the price and sale of wine grapes. For this reason, the PO started cooperation with private wineries to produce small quantity of quality wines under its own brand.
Apart from the other initiatives mentioned before, the PO has embarked on a project of vine grafting to increase grapes production for white wine in line with the current trend and market demand in Malta. The PO has also embarked on a Research and Development Programme, with assistance under measure 124 (RDP) to set up a small winery (Enoteca) to improve quality and innovation leading to high quality wines. The PO is also committed to create better awareness in favour of the local produce and to improve the promotion and marketing of these products.
It is worth noting that this PO (Viticulture) has benefitted under Measure 142 “Setting up of Producer Groups” under the Rural Development Programme. Moreover, this PO is also benefitting from financial assistance under Measure 124 “Cooperation for development of new products, processes and technologies in the agricultural and food sectors” under the Rural Development Programme to support a research and development programme, to improve quality and innovation leading to high quality wines. The PO has not yet applied for funds under measures for the promotion of wines in third country markets.
Future Challenges
The challenges ahead for the PO in this sector will be to sustain the market and farmers’ income in a highly competitive scenario. The PO and the sector have to focus on the improvements in
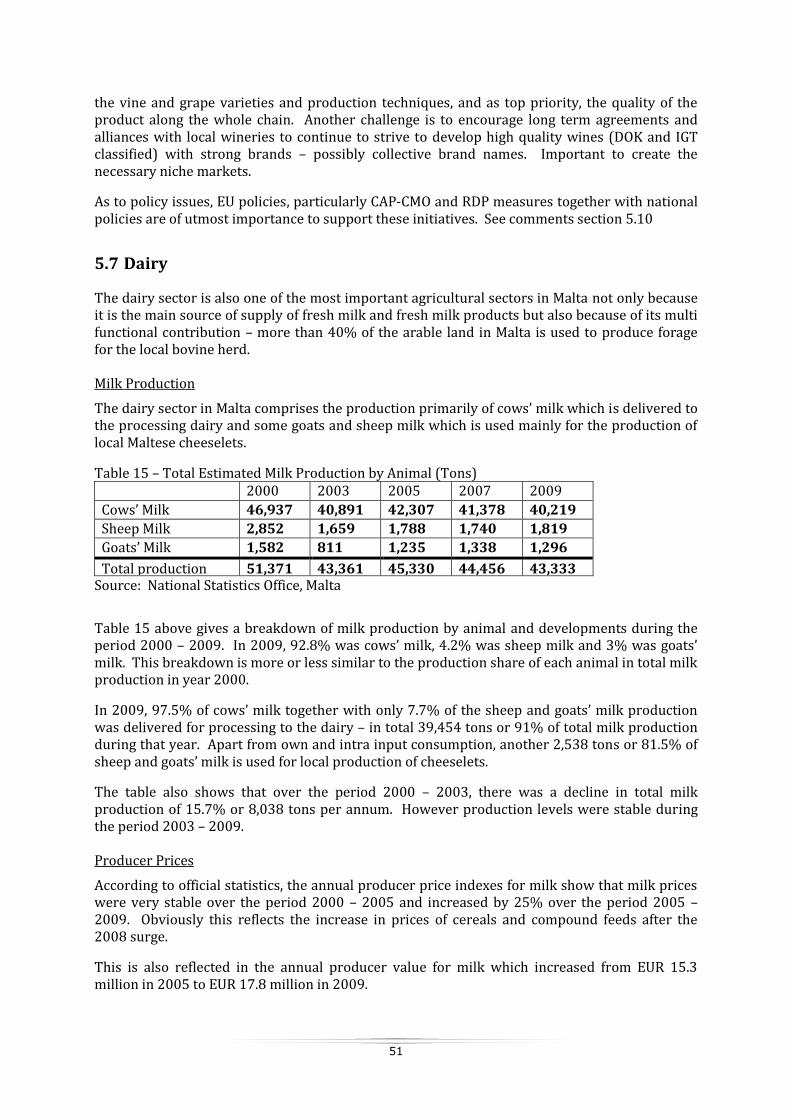
51
the vine and grape varieties and production techniques, and as top priority, the quality of the product along the whole chain. Another challenge is to encourage long term agreements and alliances with local wineries to continue to strive to develop high quality wines (DOK and IGT classified) with strong brands – possibly collective brand names. Important to create the necessary niche markets.
As to policy issues, EU policies, particularly CAP-CMO and RDP measures together with national policies are of utmost importance to support these initiatives. See comments section 5.10
5.7 Dairy
The dairy sector is also one of the most important agricultural sectors in Malta not only because it is the main source of supply of fresh milk and fresh milk products but also because of its multi functional contribution – more than 40% of the arable land in Malta is used to produce forage for the local bovine herd.
Milk Production
The dairy sector in Malta comprises the production primarily of cows’ milk which is delivered to the processing dairy and some goats and sheep milk which is used mainly for the production of local Maltese cheeselets.
Table 15 – Total Estimated Milk Production by Animal (Tons)
2000 2003 2005 2007 2009
Cows’ Milk 46,937 40,891 42,307 41,378 40,219
Sheep Milk 2,852 1,659 1,788 1,740 1,819
Goats’ Milk 1,582 811 1,235 1,338 1,296
Total production 51,371 43,361 45,330 44,456 43,333 Source: National Statistics Office, Malta
Table 15 above gives a breakdown of milk production by animal and developments during the period 2000 – 2009. In 2009, 92.8% was cows’ milk, 4.2% was sheep milk and 3% was goats’ milk. This breakdown is more or less similar to the production share of each animal in total milk production in year 2000.
In 2009, 97.5% of cows’ milk together with only 7.7% of the sheep and goats’ milk production was delivered for processing to the dairy – in total 39,454 tons or 91% of total milk production during that year. Apart from own and intra input consumption, another 2,538 tons or 81.5% of sheep and goats’ milk is used for local production of cheeselets.
The table also shows that over the period 2000 – 2003, there was a decline in total milk production of 15.7% or 8,038 tons per annum. However production levels were stable during the period 2003 – 2009.
Producer Prices
According to official statistics, the annual producer price indexes for milk show that milk prices were very stable over the period 2000 – 2005 and increased by 25% over the period 2005 – 2009. Obviously this reflects the increase in prices of cereals and compound feeds after the 2008 surge.
This is also reflected in the annual producer value for milk which increased from EUR 15.3 million in 2005 to EUR 17.8 million in 2009.

52
Policies
As already explained in 5.1, accession to the EU on 1st May 2004 was a major policy change which had a great impact on the local milk sector. Milk producers, processors and operators along the supply chain had to adapt and conform to the relevant EU regulations and standards in the milk sector, particularly the CMO for milk. At the same time a major policy change was the immediate removal of all protective import tariffs on milk and dairy products from EU partners and hence the complete liberalisation of the local market. Needless to say this brought stiff competition.
These major changes were followed by a huge investment programme to upgrade and restructure the farms, the processing dairy and other related activities along the supply chain. To mitigate these changes and meet the new challenges, particularly competition, farmers benefited from direct payments under the CMO (Milk) and also from a temporary assistance scheme under local state aid programme SMPPMA (2004 – 2010). Milk producers were also assisted to improve competitiveness, efficiency and quality and meet EU standards through various schemes under the RDP (2004 – 2006) and RDP (2007 – 2013).
Cooperatives
As to farmers’ organisations, in the sheep and goat milk sector over the last 10 years there were various attempts to organise the farmers in a cooperative or producer organisation but for various reasons always failed. Last year two small POs were set up in this sector but not yet operating.
As to the milk producers delivering their milk to the dairy, these have long been organised since 1958. Koperattiva Produtturi tal-Halib Ltd. (KPH) today incorporates practically all these milk producers who deliver their milk daily to the dairy. KPH is today the largest farmers’ organisation in terms of turnover within the cooperative movement but also within the agricultural sectors. KPH has created and invested in a vertically integrated structure to give the best value added to the milk and beef produced and delivered by the members. For more information see sections 3.2 and 3.6.
In fact, KPH has a 70% shareholding in the local dairy processing company which is responsible to buy all the milk produced and delivered – 89% of total milk production in 2000 and 91% in 2009. Milk is sold as pasteurised milk or processed into other dairy products, such as yoghurts, desserts, cream, mozzarella, ricotta and cheeselets. The dairy has its own brand and enjoys 90% of the liquid milk market and a significant market share in the other dairy products.
Markets
In spite of stiff competition, due to the vertically integrated structure of the cooperative (KPH), milk producers and the local milk sector managed to maintain their position in the market. Official statistics (NSO) show that total domestic consumption of liquid milk was 31,500 tonnes with 89% being local milk and 11% imported. Over the period under review, the market and the local production share were very stable.
As to other dairy products – yoghurts, desserts, cream, cheeselets, irkotta – although official statistics are not available, but on the basis of reliable market research, local production of these products enjoys a significant market share in Malta – although there is stiff competition from similar imported products.
Over the period under review, the local market and local production share proved rather stable. At the moment, there is no local dairy produce registered under the EU quality schemes (PDO, PGI, and TSG). However, there is a drive to explore this possibility with the local traditional cheeselet “gbejna” and to develop certification systems for higher quality produce in this sector.
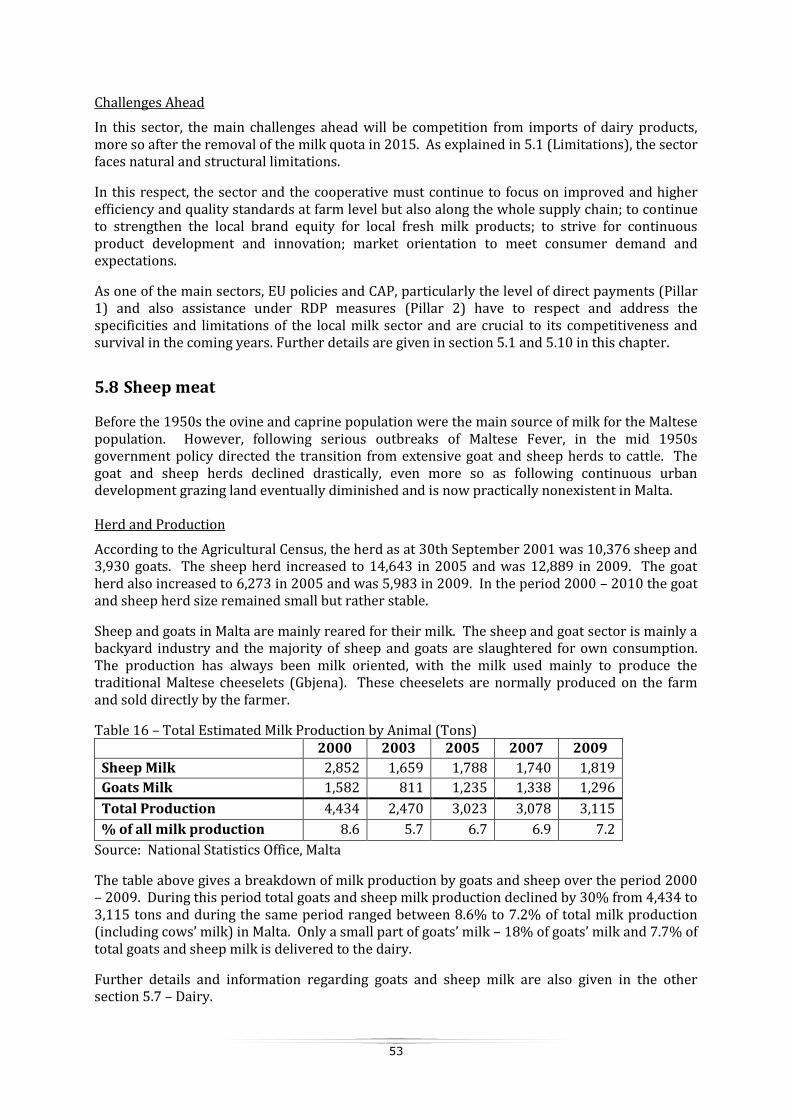
53
Challenges Ahead
In this sector, the main challenges ahead will be competition from imports of dairy products, more so after the removal of the milk quota in 2015. As explained in 5.1 (Limitations), the sector faces natural and structural limitations.
In this respect, the sector and the cooperative must continue to focus on improved and higher efficiency and quality standards at farm level but also along the whole supply chain; to continue to strengthen the local brand equity for local fresh milk products; to strive for continuous product development and innovation; market orientation to meet consumer demand and expectations.
As one of the main sectors, EU policies and CAP, particularly the level of direct payments (Pillar 1) and also assistance under RDP measures (Pillar 2) have to respect and address the specificities and limitations of the local milk sector and are crucial to its competitiveness and survival in the coming years. Further details are given in section 5.1 and 5.10 in this chapter.
5.8 Sheep meat
Before the 1950s the ovine and caprine population were the main source of milk for the Maltese population. However, following serious outbreaks of Maltese Fever, in the mid 1950s government policy directed the transition from extensive goat and sheep herds to cattle. The goat and sheep herds declined drastically, even more so as following continuous urban development grazing land eventually diminished and is now practically nonexistent in Malta.
Herd and Production
According to the Agricultural Census, the herd as at 30th September 2001 was 10,376 sheep and 3,930 goats. The sheep herd increased to 14,643 in 2005 and was 12,889 in 2009. The goat herd also increased to 6,273 in 2005 and was 5,983 in 2009. In the period 2000 – 2010 the goat and sheep herd size remained small but rather stable.
Sheep and goats in Malta are mainly reared for their milk. The sheep and goat sector is mainly a backyard industry and the majority of sheep and goats are slaughtered for own consumption. The production has always been milk oriented, with the milk used mainly to produce the traditional Maltese cheeselets (Gbjena). These cheeselets are normally produced on the farm and sold directly by the farmer.
Table 16 – Total Estimated Milk Production by Animal (Tons) 2000 2003 2005 2007 2009
Sheep Milk 2,852 1,659 1,788 1,740 1,819
Goats Milk 1,582 811 1,235 1,338 1,296
Total Production 4,434 2,470 3,023 3,078 3,115
% of all milk production 8.6 5.7 6.7 6.9 7.2
Source: National Statistics Office, Malta
The table above gives a breakdown of milk production by goats and sheep over the period 2000 – 2009. During this period total goats and sheep milk production declined by 30% from 4,434 to 3,115 tons and during the same period ranged between 8.6% to 7.2% of total milk production (including cows’ milk) in Malta. Only a small part of goats’ milk – 18% of goats’ milk and 7.7% of total goats and sheep milk is delivered to the dairy.
Further details and information regarding goats and sheep milk are also given in the other section 5.7 – Dairy.

54
Meat Production/Markets
Local sheep and goat meat production is limited. In 2000, sheep and lamb meat was nearly 8 tons carcass weight and declined to about 5 tons in 2005. In the case of goats and kids meat, this was just less than 1 ton carcass weight in 2000 and never exceeded that level in the following years.
As to the value of meat production at producer prices for goat and sheep, this amounted to EUR 333,000 in 2005 and EUR 425,000 in 2009.
However, it is worth noting that Malta imports around 800 tons of mutton or lamb, mainly from New Zealand. The import regime is totally liberalised and there are no import tariffs.
Cooperatives/POs
As to farmers’ organisations, in the sheep and goats sector over the last 10 years there were various attempts to organise farmers in a cooperative or producer organisation but for various reasons always failed. Individualism, small units and the direct sale and localisation (local village) inhibit effective alliances in this sector. Last year two POs were registered but mainly for the milk and gbejniet in this sector.
Future Challenge
In Malta there is no potential for sheep/goat meat. However, there is a challenge to sustain and develop a market for the traditional Maltese cheeselets – so popular with the local consumers and tourists. This necessitates an intensive programme of investment, continued improvement in efficiency and quality in milk production and processing systems and better marketing.
5.9 Pig meat
The pig sector is one of the most important sectors within the agricultural activity in Malta. Pig meat accounts for about 55% of the carcass weight of all livestock slaughtered in Malta.
Herd and Production
During the period under review 2000 – 2009, the number of pig farms decreased from 174 to 139 farms; the pig breeding stock decreased from 8,183 to 7,269 heads while the total stock, including young and fattening pigs decreased from 80,074 to 65,914 heads.
During the same period (2000 – 2009), the number of pigs slaughtered dropped by about 26% or 31,000 pigs. As a result carcass weight of pigs slaughtered went down by about 23% or 2,150 tonnes as shown in the table below.
Table 17 – Annual Pig Slaughtering (2000 – 2009) 2000 2005 2009
Pigs (No.) 121,227 108,210 90,140
Carcass Weight (Tons) 9,519 8,889 7,369
Source: National Statistics Office, Malta
Producer Prices
The annual value of total pigs slaughtered also reflects the downward trend from EUR 19 million in year 2001, EUR 13.9 million in year 2005 and EUR 13.1 million in 2009 – a drop of 31% over the period 2001 – 2009. During the same period, the annual average price on a carcass weight declined from €1.91/Kg in 2001 to €1.57/Kg in 2005 but increased to €1.78/Kg due to a spiral in cost of feeds.
55
Policies
Accession to the EU in 1st May 2004 also had a radical impact on the pig meat sector. Pig breeders and processors had to adapt to all EU regulations and standards applicable to this sector. For this purpose and to become more competitive, pig breeders benefited from a temporary support scheme under the state aid programme (SMPPMA 2004 – 2010) and other measures for farm upgrade and modernisation and training under the Rural Development Programme (RDP). Likewise, support and assistance was given to private pork meat processors to restructure and modernise their plants and to improve quality and diversification of pork processed products and their marketing.
But the major change for the sector was the removal of all protective import levies and the liberalisation of the local market for imports of pig meat and processed pork products. With this change, local pork processors strengthened their purchasing power vis-à-vis the local pig producers and their cooperative as these processors had access to the EU market for their raw material requirements. At the same time, local processors had to face stiff competition with imported processed pork products.
This radical change in policies brought significant changes in the local production of pig meat and along the whole supply chain, but particularly in the stiff competition in the local market. However, these changes did not bring any mergers in the upstream or downstream chain but the bargaining power of pig breeders and their cooperative was weakened.
Markets
Official statistics (NSO) show that in 2009 total domestic consumption was about 13,000 tonnes and 43% was imported while 57% was local production. In the last five years imports have increased by 10%.
Cooperative/PO
In Malta, since 1983 pig breeders have always been well organised in one cooperative – Koperattiva ta Min Irabbi l-Majjal Ltd. (KIM) and sell their pigs for slaughter through their cooperative. Since all the local pig breeders are members, the cooperative enjoys 100% market share in the slaughter and sale of local pig carcasses. Local pig meat is then sold to butcher shops and to the local pork processors – all privately owned.
KIM is also very active in improving efficiency and quality on the farms; in providing other services to the members particularly supply of farm inputs and equipment, veterinary products, breeding stocks, AI education, training and advisory services.
In May 2010, KIM also registered a Producer Organisation to complement its activity. In view of the drop in demand for local pig meat, KIM started to debone and sell pork cuts (instead of whole pig carcasses). KIM also launched a promotion campaign in favour of local fresh pork.
Future Challenges
The challenges ahead for the pig breeders and the cooperative will remain the stiff competition from imports of pig meat and processed pork products. The cooperative will have to continue to focus on the improvement in efficiency and quality of local pork, develop and promote the Maltese pork brand, to establish alliances and long term agreements with local processors and distributors, and continue to develop its activity in the value/supply chain.
As to EU policy, RDP measures to support these initiatives while other measures needed to address the chronic limitations in Malta, particularly the relatively higher feed costs (see also comments in section 5.10).
56
5.10 EU Policies and Agriculture in Malta – Future Challenges
CAP Policies
EU CAP policy had a tremendous impact on the shape of agriculture in Malta. Likewise on the farmers’ income and livelihood and the cooperatives/POs in the various sectors. Without any doubt, these policies will continue to have a decisive impact in the coming years.
Throughout this study, it was emphasized that although Malta is a small island state, agriculture though small will continue to have an even more important and strategic role, to provide a range of fresh quality food, to ensure a degree of food security and to safeguard the management of our limited land and rural environment.
However, this study clearly highlights the natural and structural limitations of agriculture in Malta – land limitation and fragmentation; limited water supply; reliance on imported cereals and other feed materials, higher costs due to sea transport and logistics issues; and the competitive difficulties of a sector with a small local market and lack of economies of scale along the food supply chain.
In this scenario, the legitimate aspirations of farmers and their cooperatives are to preserve adequate income levels and to be able to compete but on a level playing field with imported products.
Hence, with respect to Malta, the CAP must continue to take in consideration the special characteristics and specificities of Maltese agriculture and address the specific natural and structural limitations.
The “one size fits all approach” cannot be used with respect to this island and Malta’s specificities have to be recognised and addressed.
The EU level of financial support under Pillar 1 (Direct Payments) and Pillar 2 (Rural Development) are crucial to enable the various agricultural sectors to compete on a level playing field and to continue to move towards resource, environmental and climate sustainability in the coming years.
Support for Cooperatives
Apart from the financial assistance, EU and national policies need to be stronger to reinforce the role of cooperatives in the agri food chain and thus address the imbalances in the bargaining power in the supply chain; improve economies of scale and hence sector competitiveness and consolidate market orientation to guarantee a solid market income. This is even more important in the Maltese context, where countervailing power in most cases has been shifted downstream in the food chain. Various policy measures can be studied at national and EU levels.
Cooperatives’ role can be integrated in the first and second pillars of the CAP
Specific financial assistance and support to cooperatives
a) To strengthen their position in the food chain including promotion and marketing strategies
b) To strengthen their professional management and organisation
c) To create cooperation/synergies with other cooperatives (joint marketing/ grouped production etc). Cooperation between cooperatives is one of the cooperative principles.
d) Members and staff training, technical knowhow and assistance, consultancy services
57
Producer organisations should not create duplication with the role of existing cooperatives. This could be counterproductive in the overall objective. The formation of POs should not be led just by EU funds. The setting up support should not encourage the emergence of new POs which do not have a market share.
Competition Policies
In a small country with a small market, it is very common for cooperatives or producer organisations to grow in size and scale in terms of membership and market share – and this to be more effective and competitive in the market. Fragmentation may inhibit the survival of the members, the cooperative and the sector. Even more so when the main sectors already suffer from natural and structural limitations, relatively higher costs and lack of economies of scale, apart from the countervailing power of importers and operators downstream in the supply chain. In such cases, competition policies and rules (EU and national) have to recognise and address such situations.
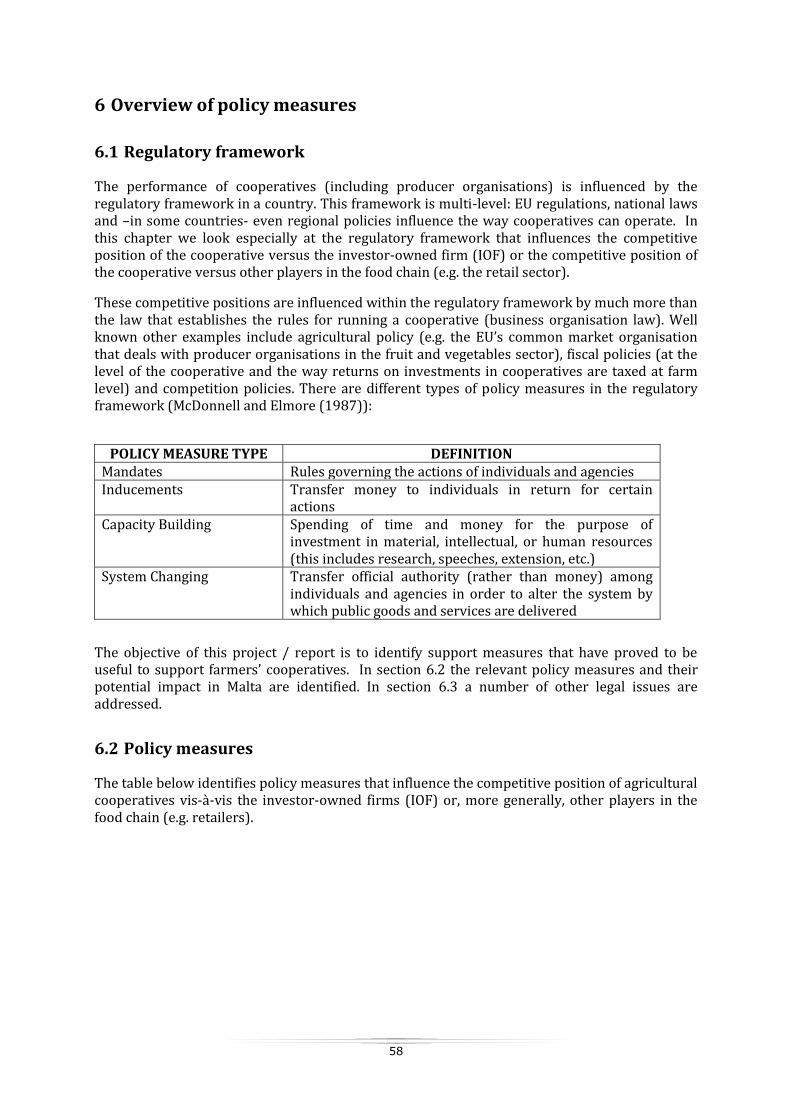
58
6 Overview of policy measures
6.1 Regulatory framework
The performance of cooperatives (including producer organisations) is influenced by the regulatory framework in a country. This framework is multi-level: EU regulations, national laws and –in some countries- even regional policies influence the way cooperatives can operate. In this chapter we look especially at the regulatory framework that influences the competitive position of the cooperative versus the investor-owned firm (IOF) or the competitive position of the cooperative versus other players in the food chain (e.g. the retail sector).
These competitive positions are influenced within the regulatory framework by much more than the law that establishes the rules for running a cooperative (business organisation law). Well known other examples include agricultural policy (e.g. the EU’s common market organisation that deals with producer organisations in the fruit and vegetables sector), fiscal policies (at the level of the cooperative and the way returns on investments in cooperatives are taxed at farm level) and competition policies. There are different types of policy measures in the regulatory framework (McDonnell and Elmore (1987)):
POLICY MEASURE TYPE DEFINITION
Mandates Rules governing the actions of individuals and agencies Inducements Transfer money to individuals in return for certain
actions Capacity Building Spending of time and money for the purpose of
investment in material, intellectual, or human resources (this includes research, speeches, extension, etc.)
System Changing Transfer official authority (rather than money) among individuals and agencies in order to alter the system by which public goods and services are delivered
The objective of this project / report is to identify support measures that have proved to be useful to support farmers’ cooperatives. In section 6.2 the relevant policy measures and their potential impact in Malta are identified. In section 6.3 a number of other legal issues are addressed.
6.2 Policy measures
The table below identifies policy measures that influence the competitive position of agricultural cooperatives vis-à-vis the investor-owned firms (IOF) or, more generally, other players in the food chain (e.g. retailers).
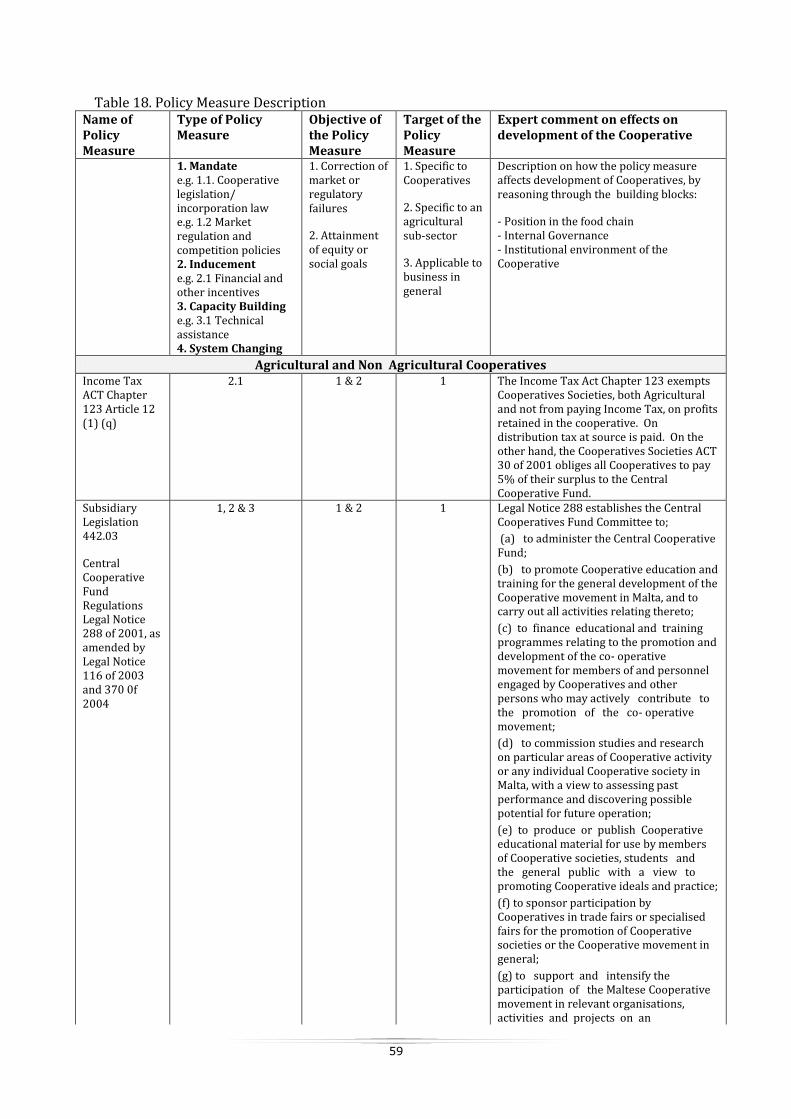
59
Table 18. Policy Measure Description Name of Policy Measure
Type of Policy Measure
Objective of the Policy Measure
Target of the Policy Measure
Expert comment on effects on development of the Cooperative
1. Mandate e.g. 1.1. Cooperative legislation/ incorporation law e.g. 1.2 Market regulation and competition policies 2. Inducement e.g. 2.1 Financial and other incentives 3. Capacity Building e.g. 3.1 Technical assistance 4. System Changing
1. Correction of market or regulatory failures
2. Attainment of equity or social goals
1. Specific to Cooperatives
2. Specific to an agricultural sub-sector
3. Applicable to business in general
Description on how the policy measure affects development of Cooperatives, by reasoning through the building blocks:
- Position in the food chain - Internal Governance - Institutional environment of the Cooperative
Agricultural and Non Agricultural Cooperatives Income Tax ACT Chapter 123 Article 12 (1) (q)
2.1 1 & 2 1 The Income Tax Act Chapter 123 exempts Cooperatives Societies, both Agricultural and not from paying Income Tax, on profits retained in the cooperative. On distribution tax at source is paid. On the other hand, the Cooperatives Societies ACT 30 of 2001 obliges all Cooperatives to pay 5% of their surplus to the Central Cooperative Fund.
Subsidiary Legislation 442.03
Central Cooperative Fund Regulations Legal Notice 288 of 2001, as amended by Legal Notice 116 of 2003 and 370 0f 2004
1, 2 & 3 1 & 2 1 Legal Notice 288 establishes the Central Cooperatives Fund Committee to;
(a) to administer the Central Cooperative Fund;
(b) to promote Cooperative education and training for the general development of the Cooperative movement in Malta, and to carry out all activities relating thereto;
(c) to finance educational and training programmes relating to the promotion and development of the co- operative movement for members of and personnel engaged by Cooperatives and other persons who may actively contribute to the promotion of the co- operative movement;
(d) to commission studies and research on particular areas of Cooperative activity or any individual Cooperative society in Malta, with a view to assessing past performance and discovering possible potential for future operation;
(e) to produce or publish Cooperative educational material for use by members of Cooperative societies, students and the general public with a view to promoting Cooperative ideals and practice;
(f) to sponsor participation by Cooperatives in trade fairs or specialised fairs for the promotion of Cooperative societies or the Cooperative movement in general;
(g) to support and intensify the participation of the Maltese Cooperative movement in relevant organisations, activities and projects on an
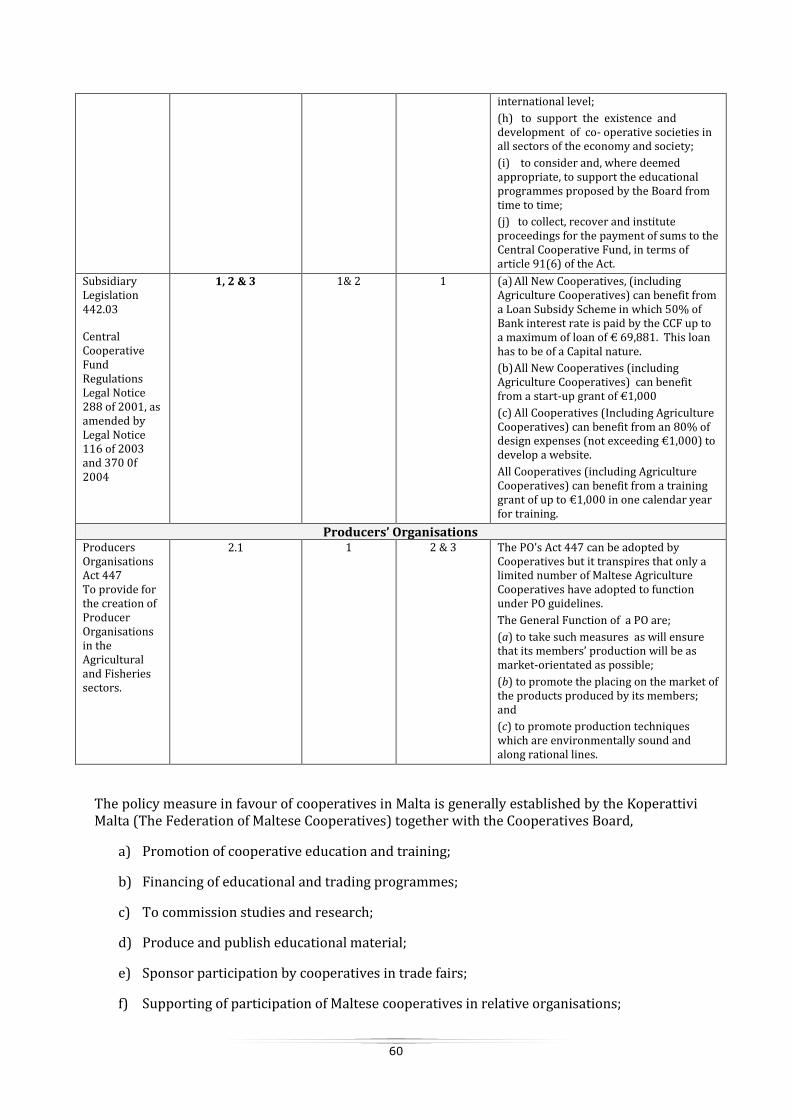
60
international level;
(h) to support the existence and development of co- operative societies in all sectors of the economy and society;
(i) to consider and, where deemed appropriate, to support the educational programmes proposed by the Board from time to time;
(j) to collect, recover and institute proceedings for the payment of sums to the Central Cooperative Fund, in terms of article 91(6) of the Act.
Subsidiary Legislation 442.03
Central Cooperative Fund Regulations Legal Notice 288 of 2001, as amended by Legal Notice 116 of 2003 and 370 0f 2004
1, 2 & 3 1& 2 1 (a) All New Cooperatives, (including Agriculture Cooperatives) can benefit from a Loan Subsidy Scheme in which 50% of Bank interest rate is paid by the CCF up to a maximum of loan of € 69,881. This loan has to be of a Capital nature.
(b) All New Cooperatives (including Agriculture Cooperatives) can benefit from a start-up grant of €1,000
(c) All Cooperatives (Including Agriculture Cooperatives) can benefit from an 80% of design expenses (not exceeding €1,000) to develop a website.
All Cooperatives (including Agriculture Cooperatives) can benefit from a training grant of up to €1,000 in one calendar year for training.
Producers’ Organisations Producers Organisations Act 447 To provide for the creation of Producer Organisations in the Agricultural and Fisheries sectors.
2.1 1 2 & 3 The PO’s Act 447 can be adopted by Cooperatives but it transpires that only a limited number of Maltese Agriculture Cooperatives have adopted to function under PO guidelines.
The General Function of a PO are;
(a) to take such measures as will ensure that its members’ production will be as market-orientated as possible;
(b) to promote the placing on the market of the products produced by its members; and
(c) to promote production techniques which are environmentally sound and along rational lines.
The policy measure in favour of cooperatives in Malta is generally established by the Koperattivi Malta (The Federation of Maltese Cooperatives) together with the Cooperatives Board,
a) Promotion of cooperative education and training;
b) Financing of educational and trading programmes;
c) To commission studies and research;
d) Produce and publish educational material;
e) Sponsor participation by cooperatives in trade fairs;
f) Supporting of participation of Maltese cooperatives in relative organisations;
61
g) Supporting the development of cooperatives in all sectors of the economy.
h) Support educational programmes proposed by the board from time to time.
Agencies and Organisations that Support Agricultural Cooperatives in Malta Government of Malta
The Ministry for Finance the Economy & Investment (MFEI)
The Ministry of Finance, the Economy and Investment is working on effective policy measures in favour of Agriculture Cooperatives; this is being done in conjunction with the Ministry for Resources and Rural Affairs.
The Ministry for Resources and Rural Affairs (MRRA)
Can Direct income support for Malta's food producers by developing food export marketing opportunities and by recognizing and supporting producers' organisation
Koperattivi Malta (Federation of Maltese Cooperatives)
Agriculture Subcommittee
This important subcommittee within the Federation of Maltese Cooperatives can exert more pressure so that Agriculture Cooperatives are supported better.
Central Cooperatives Fund (CCF)
Agriculture Members on the CCF
This Solidarity Fund which is financed by all Cooperatives can establish direct policy aid towards Agriculture Cooperatives
6.3 Other legal issues
Whilst it has to be acknowledged that the cooperative legal structure in Malta does exist, more often than not. However, farmer-members seem to be either unaware of or are very much ill-informed.
Maybe, the time has come for a “tailor made” Maltese cooperative legislation aimed specifically at Agriculture Cooperatives. It is evident that most Maltese agriculture cooperatives cannot or maybe are not in a position to organise themselves. This lack of organisation is severally hindering these agriculture cooperatives from achieving a visionary strategy so that they can position themselves better in today’s highly competitive market.
A specific agricultural cooperative legislation or a single cooperative legislation with articles applying solely to agriculture cooperatives would therefore set the foundation for better organised agriculture cooperatives. This is especially relevant when it comes to good governance; e.g., the need to hire an external, professional supervisory board, and employ a visionary professional management team with a sound knowledge cooperative management.
During the compilation of the questionnaire on legal issues, it emerged quite clearly that there seemed to be some lack of clarity, or rather, a lack of understanding of PO regulations. This may be stemming from the fact that during the drafting of the legislation itself, some factors, which have since proven to be quite central, could not be anticipated. The end result today is that the legislative structure needs fine-tuning to make it more relevant and effective.
The Cooperatives Societies ACT 30 of 2001
The Cooperatives Societies ACT 30 of 2001 is a legislation that encapsulates all registered cooperatives in Malta, both agricultural and urban. Generally speaking, agricultural cooperatives never voiced out any concern about any limitations in this legislation when it comes to applying it to the agricultural sector.
The Producers Organisation Act, Chapter 447
62
The Producers Organisation Act, Chapter 447, is a very generic legislation that gives to much leeway and no proper structure guidelines; this has led, more often than not, to structures that do not fulfil the legislator’s intention, that is;
Article 4, The Functions and aims of a producers’ organisation shall be;
a) To take such measures as will ensure that its members’ production will be as market-oriented as possible;
b) To promote the placing on the market of products produced by its members; and
c) To promote production techniques which are environmentally sound and along rational lines.
From our experience and from what emerged from this study, farmers have not fully understood the difference between a cooperative and producers’ organisation. Unfortunately very often than not, the lack of distinction between a PO and a cooperative has led to a situation of confusion in which officials and members of cooperatives get confused between the scope of cooperatives and that of a producers’ organisation.
It is worth noting here that from 2004 onwards most EU funding has been channelled through POs. This established the PO as an entity. However, we believe that many cooperatives have not yet seen the benefits of integrating some of the more efficient management and quality control procedures from the PO model. While some Cooperatives operate at a high level of efficiency, some would definitely benefit from adopting more up-to-date procedures. Some resistance is definitely due to the widespread perception that POs are primarily vehicles for accessing EU funding.
In the medium term, this link between POs and EU funds could lead to further fracturing between the cooperatives and the PO model, rather than a gradual integration of the strengths of the two models as described above.
63
7 Assessment of developments and role of policy measures
Whilst the overall number of cooperatives in Malta has continued to increase steadily, the increase in the number of Agriculture Cooperatives has halted. Prior to Malta’s accession to the EU, the Maltese Government used to offer various incentive schemes that helped farmers to organise themselves in cooperatives. A case in point was a scheme offered to both farmers and fishermen in which members of a cooperative would be able to pay half of the National Insurance contribution. This “incentive” was retreated prior to EU accession but may be re-instituted in the very near future. There is further evidence of the Government’s commitment to organising farmers in various sectors. One example of a ‘proactive’ incentive is a favourable tax regime on retained profits which is aimed at encouraging further capital investment. Another is that a member in a PO or a cooperative gets more points in the assessment of their application for funds under measure 121 in the Rural Development Programme.
7.1 Explaining the performance of cooperatives
It is evident that most Agricultural Cooperatives in Malta and Gozo have seen their overall financial and competitive performance declining over the past five years. Only a few cooperatives have seen their performance improving. Most agricultural cooperatives have experienced a decline in both sales and profits resulting from their core activity. Whilst one cannot really generalise, it is evident that most Maltese agricultural cooperatives are struggling to achieve results and maybe, consolidate their position.
It has to be pointed out that the major challenges facing Maltese agricultural cooperatives are not caused solely by external pressures but also problems within cooperatives. It has been noticed, for example, that some farmers are now more than ever before opting to do business outside their cooperative. This free riding behaviour obviously goes against cooperative bylaws but also the very principles of co-operation.
The eternal problem of good governance and the need to hire professional management are also pertinent to the issue of cooperatives performance. There is concrete evidence that those cooperatives that employ professional management with a sound knowledge of the concept of cooperative management have moved forward both organisationally and financially. On the other hand, cooperatives that have opted for “part-time,” “non-professional” management have rendered themselves uncompetitive.
It appears that some agricultural cooperatives are not as advanced as some of their counterparts on strategy and vision. To some extent the reason for this has been their greater reliance on the quality of their produce and a resistance to investing in certain standard management functions (e.g. marketing and sales) Branding is only limited to a few cooperatives, namely the Koperattiva Produtturi tal-Halib Ltd (Milk Producers Cooperative, Ltd) and Koperattiva Produtturi tal-Majjal Ltd (Pig Producers Cooperative, Ltd). The wine sector may be the exception that proves the rule as the Wine Producers Organisation has proactively acquired the DOC label.
Whilst the honey sector does not fall within the remit of this study, it is worth mentioning that this sector is not organised into a cooperative or a PO.
On a positive note, one has to appreciate that most cooperatives, POs and PGs are now recognising that branding is an important part of marketing strategy. Today local produce is not only competing with imported but also local products.
64
7.2 Effects of policy measures on the competitive position of cooperatives
It is obvious that most of the policy measures that have been put in place have had effects on all agricultural cooperatives. One has to appreciate that there were other organisations apart from cooperatives that benefited from such policy measures; e.g., Producers Organisations and Producers Groups (PG). The latter are organisations formed during a transitional period in order to allow PGs to meet the requirements for being recognised as a PO.
Whilst up to five years ago, PO’s and PG’s were virtually nonexistent, they have now become very common. Unfortunately, the already minute Maltese agricultural market has been fragmented even more by the setting up of PO’s and PG’s. This has led to a situation in which some farmers are now giving more preference to their PO than their cooperative.
Whilst one has to be very careful in drawing conclusions, it is my impression that, generally speaking, PO’s and PG’s have generally reacted better than most cooperatives in the Fruit and Vegetable Sector. A case in point is the Ta’ Qali Producers Group who has taken the lead in branding fruits and other agricultural produce whilst the Farmers Central Cooperative seems to be focusing more on its core activity that is the Pitkali6. It is true that the Farmers Central Cooperative has set-up its own PO under the Cooperative name of Gomriza, but it is our opinion that Gomriza has not, at least yet, achieved the results of establishing itself as one of the marketing leaders in such a competitive market.
6 A farmers’ market.
65
8 Future research The research gave a description of the current level of development of cooperatives and producer organisations in various agricultural sectors in Malta. In addition, this study examined and analysed these farmers’ organisations in terms of their position in the food supply chain, especially their competitiveness; internal governance and the institutional environment. This also highlights the understanding of the drivers and constraints for the development of cooperatives in Malta.
The research as presented in this report carries some weaknesses: -
a) Malta being a small island has limited agricultural sectors and hence few farmers’ organisations. Maltese agriculture is predominantly related to three main sectors – dairy, pig meat, fruit and vegetables and the few agricultural cooperatives/POs are mainly in these sectors. Obviously this scenario has also limited the analysis of our study.
b) Information and statistics on Producer Organisations in Malta are very limited. Unlike cooperatives, POs have only started after Malta’s accession to the EU on 1st May 2004. Hence the operations and experience with POs in Malta is only limited to the last 5 years.
c) In view of the limitations mentioned in a) above, in Malta there are limited studies, research, literature and publications on the subject.
However one must point out that the local situation presents a unique opportunity for research where it comes to the direct contact with all those involved in the agriculture cooperatives and the respective agricultural sectors. This is definitely the strength behind this research.
Obviously, this study will analyse and propose answers too many questions, particularly on a level of country by country but more important at the European level. However, like every research project, it will definitely give rise to further questions and research.
As to the Maltese scenario, in section 3.6 we have already mentioned some interesting case studies which might be useful for further research.
On a wider context and complementary to the objectives of this study, the following suggestions for further research and the relative experience in all the EU countries may be worth considering.
1. Research to analyse and highlight the share of the consumer price that goes to the producer for his produce in each agricultural sector in all EU countries. This can be further analysed to compare the results where farmers are organised in cooperatives and Pos and the extent of their position along the food supply chain. Such research may also examine the results in relation to the internal governance and professional management structures, institutional environment, government policies, competition policies and transparency along the food supply chain. The objective of such research must lead to recommendations of how to improve farmers’ income and the balance amongst operators in the food chain within the EU.
2. Research to analyse and to study recommendations how to create the right platform and incentives to promote cooperation between cooperatives, both on a local level but even more important between all EU countries. This cooperation is not only one of the basic cooperative principles, but also a tool to consolidate the position of the farmers in the market and hence to generate a solid market income. The wealth of current experiences can serve to strengthen further cooperation between farmers and their organizations all over the EU countries. In this respect, one also has to analyse carefully the setting up of POs where cooperatives are already established and organized. Integration of resources and efforts rather than fragmentation is necessary to be sustainable and competitive.
66
In conclusion, the Malta experience should complement similar research in other countries and should also contribute towards the final objective of this project to promote more dynamically support for farmers’ cooperatives in the coming years.
67
REFERENCES APEX Publication (2007); Historical Profile of the Maltese Cooperative Movement Barberini, I. (1996). “Cooperative Governance: The Supervision, Auditing and Control of Co-ops in Italy”.
Review of International Co-operation, Vol. 89, No. 4/1996, pp.13-15. Central Cooperative Fund Regulations, Legal Notice 288 of 2001 as amended by Legal Notice 116 of 2003
and 370 of 2004. Cooperative Societies Act, (1978) Act No. XXVI of 1978. Cooperatives Societies Act, (2001), Act XXX of 2001. Cooperative Union Ltd (1998) Corporate Governance: Codes of Best Practice. UK, Cooperative Union Ltd. Committee on Corporate Governance in Greece (1999). “Principles on Corporate Governance in Greece:
Recommendations for its competitive transformation” Committee on Corporate Governance in Greece under the co-ordination of the Capital Market Commission, Athens.
Committee on the Financial Aspects of Corporate Governance and Gee and Co. Ltd. (1992). “The Financial Aspects of Corporate Governance”.
Cooperatives Board Publication (2002). “Koperattivi, Twaqqif u Tmexxija. (Cooperatives, the Setting up and Administration)”.
Davidman, M., (1996). “Cooperatives and Co-operation: Causes of Failure, Guidelines for Success”. http://www.solbaram.org/articles/coops.htm
Davis, P and Donaldson, J. (1998). “Cooperative Management: A Philosophy for Business”. Cheltenham: New Harmony Press.
Davis, P. (1996) “Facilitating ‘Cooperative’ Management Development”. Co-op Dialogue, Vol. 4, No. 4, May-Dec, pp. 1-16.
Davis, P. (1997). “Cooperative Identity and Cooperative Management”. Report of the Special Workshop on ICA Cooperative Identity Statement – from theory to practice, 17 – 21 Aug 1997, Jaipur, India, pp32-41.
Davis, P. (1998). “Value-based professional management in Co-ops”. Co-op Dialogue, Vol. 8, No.1, January-June 1998, pp.9-16.
Delia, E.P. (2002). “The Economic Relevance of Agriculture for Malta’s Economy”, Occasional Paper 5. An APS Bank Publication (Malta).
Delia, E.P. (2004). “The Future of Cooperatives in Agriculture & Fisheries Sectors”. APS Bank Publication. (Malta).
Delia, E. P (2006). “Reconsidering Cooperatives, Lessons for Maltese Coops”, APS Bank Publication. (Malta).
Food and Agriculture Organisation of the United Nations (FAO), (2005). “Strengthening the Organisational and Business Capacities of Agriculture Cooperatives in Malta”. (TPC/MAT/3001 (A).
Groves, F. (1985). “What is co-operation?” UCC Occasional Paper No. 6, Wisconsin: University of Wisconsin.
Hellriegel, S. and Woodman (1998). “Organisational Behaviour”, 8th Edition. ICA (1986) “Part II – Consideration of Cooperative Principles”, Section 1. Report of the 23rd ICA congress
at Vienna, 5-8 September 1966, pp. 160-180. Institute of Chartered Accounts in England & Wales (1999). “Internal Control: Guidance for Directors on
the Combined Code”, London. International Labour Organisation (2000) “Promotion of Cooperatives” Vol. VI. Geneve, ILO. Itkonen, R. (1996). “My Views on Cooperative Corporate Governance” Review of International Co-
operation, Vol. 89, No. 4/1996, pp.20-24. Lees, M. and Volkers, R. (1996). “General Trends, Findings and Recommendations”. Review of
International Co-operation, Vol. 89, No. 4/1996, pp.37-49. Lees, M. (1996). “Corporate Governance in Cooperatives: The European Experience”.
http://fox.nstn.ca/~svcocord/coopgov1.htm. Minutes of the Regional Assembly for Europe (1996) Review of International Co-operation, 89(4):5-10. Münkner, H.H. (1995). “A New Era for Co-ops and the Implications for Co-op Legislation” Review of
International Cooperative Alliance. Nadeau, E.G. and Thompson, D.J. (1996). “Cooperation Works! And others [Review of Co-operation
Works!]” Review of International Co-operation, 89(4):59-65. Nicolaisen, A. (1996). “The Auditor’s Responsibilities related to reports to Members”. Review of
International Co-operation, 89(4):25-26. Pflimlin, E. (1996) Technical/Democratic Supervision in European Cooperative Banks (1996). Review of
International Co-operation, 89(4):27-33.
68
Prakash, D. “Governance in the Management of Cooperatives” available at http://www.coop.org/ica/issues/governance.html.
Producers Organisation Act (2003). “To provide for the creation of Producer Organisation in the Agricultural and Fisheries sectors”. Chapter 447, 6th January 2003, Malta.
Producer Organisation – Fruit and Vegetables Regulations, Legal Notice 63 of 2004. Producer Organisation (Certain Products) Regulations 2007 – Legal Notice 237 of 2007. Qureshi, Z. (1996). “Harnessing the Collective Genius to Create the Results they Desire”. Review of
International Co-operation, 89(4):53-58. Rodriguez, R. (1998). “The Third World War – War for Markets – And how quality management can win
this war for Co-ops”. Co-op Dialogue, 8(1):17-19. Rizzo, S. “A Study on the implementation of the Directive 2003/72/EC (Employee Involvement in the
European cooperative society in ten Member States with special reference to Malta)”. Rural Development Program for Malta 2004/2006 http://www.mepa.org.mt/rdp_04-06 Rural Development Program for Malta 2007/2013
http://enrd.ec.europa.eu/app_templates/filedownload.cfm?id=D4B49B3F-F1AC-E159-A08E-9770D9861FEA
Siversten, S. (1996). “Governance Issues seen from a management perspective”. Review of International
Co-operation, 89(4):34-36. ICA (1937). “The Principles of Co-operation: The Present Application of the Rochdale Principles of Co-
operation”, Studies and Reports, London, 1964, 3-5. Torgerson, R.E., Reynolds, B.J. and Gray, T.W. (1997). “Evolution of Cooperative Thought, Theory and
Purpose. Presentation: Conference on Cooperatives”. Their importance in the future of the food and agricultural system. Las Vegas: Food and Agricultural Marketing Consortium.
Volkers, R. (1995). “Corporate Governance and Management Control Systems in European Cooperatives.
Websites
Cooperatives Board (Maltese Regulator); http://www.coopsboard.org.mt Cooperatives Europe; http://www.coopseurope.coop/ COPA COGECA; http://www.copa-cogeca.be European Commission Agriculture & Rural Development http://ec.europa.eu/agriculture Gozitano Agriculture Coop; http://www.gozitano.eu/ International Cooperative Alliance (ICA); http://www.ica.coop/al-ica/ International Labour Organisation (ILO); http://www.ilo.org KIM (Pig Producers Cooperative Ltd; http://www.kim.coop/ Koperattivi Malta (Cooperatives Malta); http://www.cooperatives-malta.coop Ministry for Justice and Home Affairs; http://www.justiceservices.gov.mt Ministry for Resources and Rural Affairs; http://www.mrra.gov.mt National Statistics Office (Malta); http://www.nso.gov.mt