supplying the unconventional revolution: sizing the
TRANSCRIPT
Supplying the Unconventional Revolution: Sizing the unconventional oil and gas supply chain
Main report
6803-0914TB
IHS ECONOMICS September 2014

© 2014 IHS ii September 2014
IHS Economics | Supplying the Unconventional Revolution: Sizing the unconventional oil and gas supply chain
About IHS (www.ihs.com)IHS (NYSE: IHS) is the leading source of information, insight and analytics in critical areas that shape today’s business landscape. Businesses and governments in more than 165 countries around the globe rely on the com-prehensive content, expert independent analysis and flexible delivery methods of IHS to make high-impact decisions and develop strategies with speed and confidence. IHS has been in business since 1959 and became a publicly traded company on the New York Stock Exchange in 2005. Headquartered in Englewood, Colorado, USA, IHS is committed to sustainable, profitable growth and employs approximately 8,000 people in 31 coun-tries around the world.
For more information, contact:
Brendan O’Neil Managing Director, Consulting, Economics and Country Risk, IHS
[email protected] (202) 481-9239
For press information, contact:
Jim Dorsey Senior Manager Media Relations, IHS
Jeff Marn Senior Manager Public Relations, IHS
IHS EconomicsCopyright notice and legal disclaimer© 2014 IHS. No portion of this report may be reproduced, reused, or otherwise distributed in any form without prior written consent, with the exception of any internal client distribution as may be permitted in the license agreement between client and IHS. Content reproduced or redistributed with IHS permission must display IHS legal notices and attributions of authorship. The information contained herein is from sources considered reliable but its accuracy and completeness are not warranted, nor are the opinions and analyses which are based upon it, and to the extent permitted by law, IHS shall not be liable for any errors or omissions or any loss, damage or expense incurred by reliance on information or any statement contained herein. IHS and the IHS logo are trademarks of IHS. For more information, please contact IHS at www.ihs.com/CustomerCare.
© 2014 IHS iii September 2014
IHS Economics | Supplying the Unconventional Revolution: Sizing the unconventional oil and gas supply chain
Contents
Executive summary 1National level key findings 6Supply chain core group key findings 7State level key findings 7Introduction 9Report structure 10Unconventional oil and gas supply chain: National assessment 11Structure 12Defining the unconventional oil and natural gas supply chain 13Economic contribution assessment 15
– Methodology 15 – Economic contribution assessment results 15
Economic contribution assessment by core group 21 – Capital goods 21 – Construction and well services 27 – Logistics 31 – Materials 34 – Professional and other services 36
Unconventional oil and natural gas supply chain: State assessment 39Structure 40Methodology 40Producing vs. nonproducing states 41
– Employment contributions 41 – Labor income 47 – Government revenue 48
Regional industry analysis 49 – Economic contribution assessment by state and core group 52
State snapshots 68 – Producing states 70 – Nonproducing states 84
Unconventional oil and natural gas supply chain: Supplemental construction assessment 87Supplemental construction by type 89
– Employment contributions 92Total construction contributions 93Conclusion 95
© 2014 IHS iv September 2014
IHS Economics | Supplying the Unconventional Revolution: Sizing the unconventional oil and gas supply chain
Project directors•Mohsen Bonakdarpour, Managing Director, Consulting, Economics and Country Risk
•Brendan O’Neil, Managing Director, Consulting, Economics and Country Risk
Project team•Tabitha Bailey, Director, Consulting, Economics and Country Risk
•Julie Gressley, Consultant, Consulting, Economics and Country Risk
•Scott Hazelton, Managing Director, Consulting, Economics and Country Risk
•Phil Hopkins, Director, Consulting, Economics and Country Risk
•Leslie Levesque, Consultant, Consulting, Economics and Country Risk
•Mihaela Solcan, Consultant, Consulting, Economics and Country Risk
Acknowledgements
We would like to thank the subject matter experts, technical experts, industry experts, and analysts who contributed either directly to this study or indirectly through the study on which the underly-ing oil and gas estimates were based. Specifically, we would like to thank Kevin Birn, Chuck Clowdis, Andrej Divis, Bob Flanagan, Vardan Genanyan, and Antti Lindstrom. We would also like to thank Tom Biracree, Mike Kelly, and Keri Semesnyei for their editorial, graphic design, and layout support.
This report offers an independent assessment of the importance of the unconventional oil and gas supply chain to the US economy. This research was prepared for the Energy Equipment and Infrastructure Alliance (EEIA).
EEIA represents the unconventional oil and gas supply chain: equipment manufacturers and distributors, construction contractors, service providers, material suppliers, and logistics companies. EEIA members provide equipment, materials, construction, services, logistics and workers to unconventional oil and gas exploration and production, transportation and processing.
IHS is exclusively responsible for this report and all of the analysis and content contained herein. The analysis and metrics developed during the course of this research represent the independent views of IHS and are intended to contribute to the dialogue on the role of the unconventional oil and gas supply chain in promoting employment and economic growth.
All of the gross output and labor income contributions throughout this report are expressed in terms of constant 2012 dollars.
© 2014 IHS 1 September 2014
IHS Economics | Supplying the Unconventional Revolution: Sizing the unconventional oil and gas supply chain
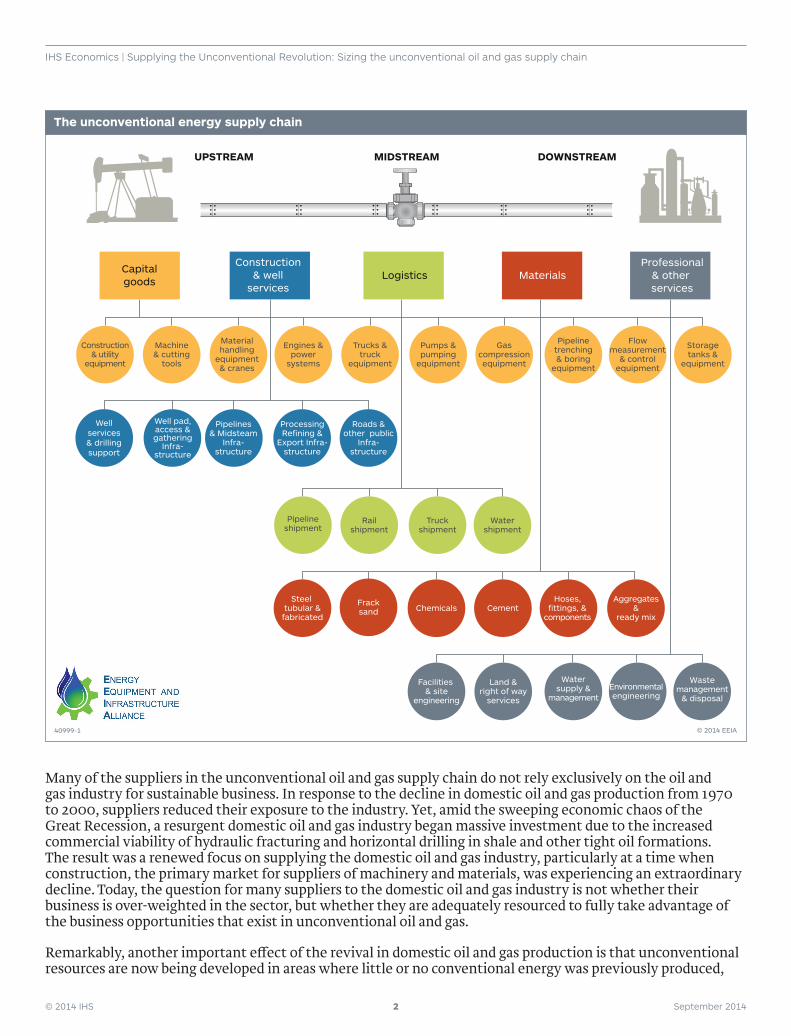
Executive summaryUnconventional oil and gas development in the United States is a wide-reaching economic juggernaut that impacts dozens of industries beyond the oil and gas sector.1 Furthermore, the impacts are distributed across suppliers from every state irrespective of whether oil and gas resources are native to the state. Major capital and operating expenditures flow to a lengthy supply chain that enables upstream, midstream, and downstream development activity. The unconventional oil and gas supply chain is composed of providers of materials, capital goods, construction and well services, professional and other services, and logistics and represents more than 40% of total unconventional oil and gas related employment over the 2012–25 period analyzed for this report.
In addition to the capital and operating spending stimulus that generates supply chain activity, unconventional oil gas development is also kindling new construction activity in the regions where drilling activity is occurring. While this supplemental construction activity is not a function of upstream operator spending, the ripple effect of the large capital investment is added housing, commercial buildings, and infrastructure vital to upstream operations and employees. Upstream, midstream, and downstream investment has indirectly generated construction activity at a time when the construction sector and its own supply chain is recovering from the worst construction recession since the Great Depression. This IHS analysis quantifies the economic contributions at a level of detail that comprehensively defines the unconventional supply chain effect across many industries and the lower 48 states.
Oil and gas operators in the upstream, midstream, and downstream sectors share a symbiotic relationship with their immense network of suppliers. Suppliers benefit from the enormous investment required for the exploration, production, processing, and transport of oil and gas resources. And it is the suppliers of materials, capital equipment and services that complete the virtuous circle by enabling operators to commercialize otherwise inaccessible hydrocarbons.
This IHS study is the first comprehensive assessment of the unconventional energy supply chain, focusing on the economic contributions associated with the oil and gas industry’s broad network of suppliers and their important roles in advancing unconventional resources development, ultimately enhancing the energy and economic security of the United States. The contributions to the US economy identified in this study demonstrate the critical linkage between energy value chain investment and several sectors likely to experience above-trend economic growth over the next two decades. For example, employment growth in the unconventional oil and gas supply chain will outpace IHS’s estimate for total US employment growth over 2012–25 by 2.9% vs. 1.1%.2 Furthermore, the $79,000 average wage earned by the unconventional supply chain worker exceeds the average annual US wage of $68,000.
The following is a diagram of the unconventional energy supply chain sectors and components that demonstrates the expansive scope of its industries and their pervasive presence throughout the economy.
1 The word “unconventional” applies to oil and gas extracted using the major new technological advances in extraction, such as horizontal drilling and hydraulic fracturing.
2 Source: IHS Economics, August 2014 US macroeconomic forecasts.
© 2014 IHS 2 September 2014
IHS Economics | Supplying the Unconventional Revolution: Sizing the unconventional oil and gas supply chain
Many of the suppliers in the unconventional oil and gas supply chain do not rely exclusively on the oil and gas industry for sustainable business. In response to the decline in domestic oil and gas production from 1970 to 2000, suppliers reduced their exposure to the industry. Yet, amid the sweeping economic chaos of the Great Recession, a resurgent domestic oil and gas industry began massive investment due to the increased commercial viability of hydraulic fracturing and horizontal drilling in shale and other tight oil formations. The result was a renewed focus on supplying the domestic oil and gas industry, particularly at a time when construction, the primary market for suppliers of machinery and materials, was experiencing an extraordinary decline. Today, the question for many suppliers to the domestic oil and gas industry is not whether their business is over-weighted in the sector, but whether they are adequately resourced to fully take advantage of the business opportunities that exist in unconventional oil and gas.
Remarkably, another important effect of the revival in domestic oil and gas production is that unconventional resources are now being developed in areas where little or no conventional energy was previously produced,
Fracksand
Steel tubular &fabricated
Chemicals CementHoses,
fittings, &components
Aggregates&
ready mix
Facilities & site
engineering
Land &right of way
services
Watersupply &
managementEnvironmentalengineering
Wastemanagement
& disposal
Watershipment
Truckshipment
Railshipment
Pipelineshipment
Construction& utility
equipment
Machine& cutting
tools
Materialhandling
equipment& cranes
Engines &power
systems
Trucks &truck
equipment
Gascompressionequipment
Pumps &pumping
equipment
Pipelinetrenching& boring
equipment
Flowmeasurement
& controlequipment
Storagetanks &
equipment
ProcessingRefining &
Export Infra-structure
Wellservices& drillingsupport
Pipelines& Midsteam
Infra-structure
Well pad,access &gathering
Infra-structure
Roads &other public
Infra-structure
MaterialsLogisticsProfessional
& other services
Construction& well
services
Capitalgoods
MIDSTREAM DOWNSTREAMUPSTREAM
40999-1 © 2014 EEIA
The unconventional energy supply chain
© 2014 IHS 3 September 2014
IHS Economics | Supplying the Unconventional Revolution: Sizing the unconventional oil and gas supply chain
and companies with no previous energy-driven business are thriving by supplying this new activity. New businesses have been formed to take advantage of the unique needs of unconventional resource development, such as water management, proppant supply, and engineering services. Investment in unconventional oil and gas development has not only stimulated the Great Revival in domestic production, it has also shaped economic renewal following the Great Recession.
This study investigates three key areas where the unconventional oil and gas supply chain supports economic growth in the lower 48 states. First, the study evaluates the economic contributions of the unconventional oil and gas activity on its supply chain industries in terms of employment, labor income, government revenue, and gross output of goods and services. The rapid expansion in both domestic production capacity of unconventional oil and gas and the associated midstream and downstream energy infrastructure stimulates supply chain activity throughout the energy value chain. Second, the study breaks down the national results into state-by-state findings.
Third, the study examines the incremental levels of construction activity associated with unconventional oil and gas development. In addition to construction activity on drilling sites and pipelines fueled by operator capital and operating expenditures, considerable supplemental construction investment not borne by the operators is necessary to support upstream, midstream, and downstream activity. Examples of related construction activity include road widening and resurfacing to accommodate increased truck traffic and construction of new housing and lodging units in rural areas where the existing housing stock is insufficient to meet growing demand.
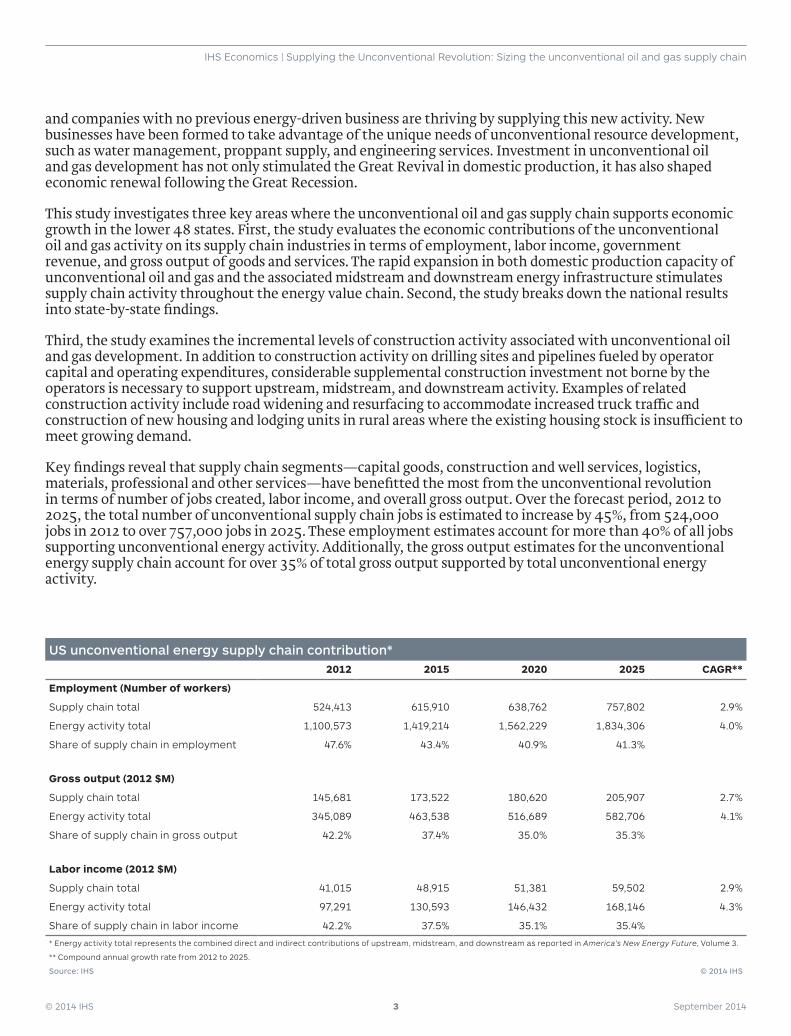
Key findings reveal that supply chain segments—capital goods, construction and well services, logistics, materials, professional and other services—have benefitted the most from the unconventional revolution in terms of number of jobs created, labor income, and overall gross output. Over the forecast period, 2012 to 2025, the total number of unconventional supply chain jobs is estimated to increase by 45%, from 524,000 jobs in 2012 to over 757,000 jobs in 2025. These employment estimates account for more than 40% of all jobs supporting unconventional energy activity. Additionally, the gross output estimates for the unconventional energy supply chain account for over 35% of total gross output supported by total unconventional energy activity.
US unconventional energy supply chain contribution*2012 2015 2020 2025 CAGR**
Employment (Number of workers)
Supply chain total 524,413 615,910 638,762 757,802 2.9%
Energy activity total 1,100,573 1,419,214 1,562,229 1,834,306 4.0%
Share of supply chain in employment 47.6% 43.4% 40.9% 41.3%
Gross output (2012 $M)
Supply chain total 145,681 173,522 180,620 205,907 2.7%
Energy activity total 345,089 463,538 516,689 582,706 4.1%
Share of supply chain in gross output 42.2% 37.4% 35.0% 35.3%
Labor income (2012 $M)
Supply chain total 41,015 48,915 51,381 59,502 2.9%
Energy activity total 97,291 130,593 146,432 168,146 4.3%
Share of supply chain in labor income 42.2% 37.5% 35.1% 35.4%
* Energy activity total represents the combined direct and indirect contributions of upstream, midstream, and downstream as reported in America’s New Energy Future, Volume 3.
** Compound annual growth rate from 2012 to 2025.
Source: IHS © 2014 IHS
© 2014 IHS 4 September 2014
IHS Economics | Supplying the Unconventional Revolution: Sizing the unconventional oil and gas supply chain
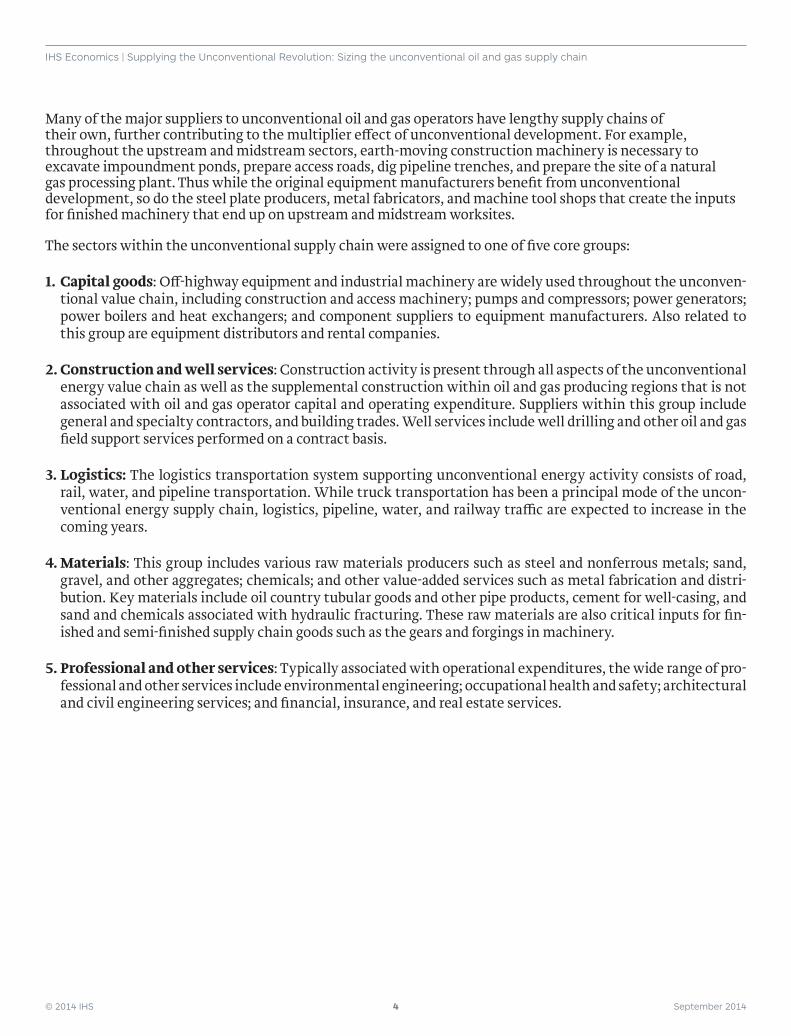
Many of the major suppliers to unconventional oil and gas operators have lengthy supply chains of their own, further contributing to the multiplier effect of unconventional development. For example, throughout the upstream and midstream sectors, earth-moving construction machinery is necessary to excavate impoundment ponds, prepare access roads, dig pipeline trenches, and prepare the site of a natural gas processing plant. Thus while the original equipment manufacturers benefit from unconventional development, so do the steel plate producers, metal fabricators, and machine tool shops that create the inputs for finished machinery that end up on upstream and midstream worksites.
The sectors within the unconventional supply chain were assigned to one of five core groups:
1. Capital goods: Off-highway equipment and industrial machinery are widely used throughout the unconven-tional value chain, including construction and access machinery; pumps and compressors; power generators; power boilers and heat exchangers; and component suppliers to equipment manufacturers. Also related to this group are equipment distributors and rental companies.
2. Construction and well services: Construction activity is present through all aspects of the unconventional energy value chain as well as the supplemental construction within oil and gas producing regions that is not associated with oil and gas operator capital and operating expenditure. Suppliers within this group include general and specialty contractors, and building trades. Well services include well drilling and other oil and gas field support services performed on a contract basis.
3. Logistics: The logistics transportation system supporting unconventional energy activity consists of road, rail, water, and pipeline transportation. While truck transportation has been a principal mode of the uncon-ventional energy supply chain, logistics, pipeline, water, and railway traffic are expected to increase in the coming years.
4. Materials: This group includes various raw materials producers such as steel and nonferrous metals; sand, gravel, and other aggregates; chemicals; and other value-added services such as metal fabrication and distri-bution. Key materials include oil country tubular goods and other pipe products, cement for well-casing, and sand and chemicals associated with hydraulic fracturing. These raw materials are also critical inputs for fin-ished and semi-finished supply chain goods such as the gears and forgings in machinery.
5. Professional and other services: Typically associated with operational expenditures, the wide range of pro-fessional and other services include environmental engineering; occupational health and safety; architectural and civil engineering services; and financial, insurance, and real estate services.
© 2014 IHS 5 September 2014
IHS Economics | Supplying the Unconventional Revolution: Sizing the unconventional oil and gas supply chain
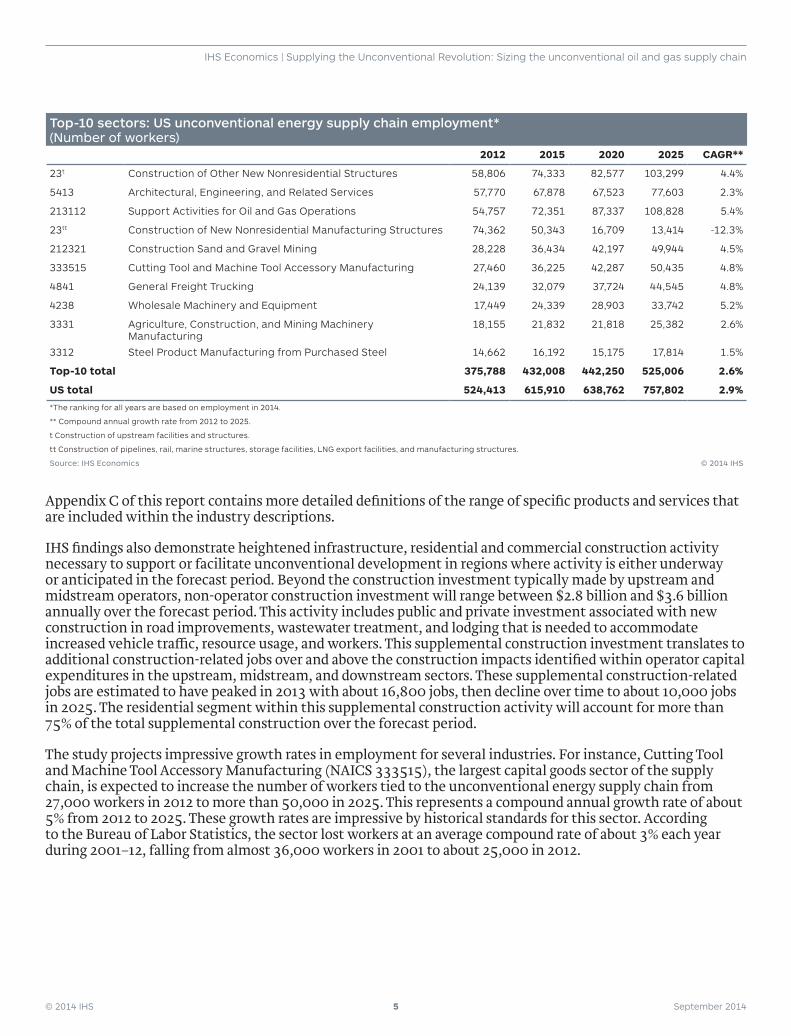
Top-10 sectors: US unconventional energy supply chain employment* (Number of workers)
2012 2015 2020 2025 CAGR**
23t Construction of Other New Nonresidential Structures 58,806 74,333 82,577 103,299 4.4%
5413 Architectural, Engineering, and Related Services 57,770 67,878 67,523 77,603 2.3%
213112 Support Activities for Oil and Gas Operations 54,757 72,351 87,337 108,828 5.4%
23tt Construction of New Nonresidential Manufacturing Structures 74,362 50,343 16,709 13,414 -12.3%
212321 Construction Sand and Gravel Mining 28,228 36,434 42,197 49,944 4.5%
333515 Cutting Tool and Machine Tool Accessory Manufacturing 27,460 36,225 42,287 50,435 4.8%
4841 General Freight Trucking 24,139 32,079 37,724 44,545 4.8%
4238 Wholesale Machinery and Equipment 17,449 24,339 28,903 33,742 5.2%
3331 Agriculture, Construction, and Mining Machinery Manufacturing
18,155 21,832 21,818 25,382 2.6%
3312 Steel Product Manufacturing from Purchased Steel 14,662 16,192 15,175 17,814 1.5%
Top-10 total 375,788 432,008 442,250 525,006 2.6%
US total 524,413 615,910 638,762 757,802 2.9%
*The ranking for all years are based on employment in 2014.
** Compound annual growth rate from 2012 to 2025.
t Construction of upstream facilities and structures.
tt Construction of pipelines, rail, marine structures, storage facilities, LNG export facilities, and manufacturing structures.
Source: IHS Economics © 2014 IHS
Appendix C of this report contains more detailed definitions of the range of specific products and services that are included within the industry descriptions.
IHS findings also demonstrate heightened infrastructure, residential and commercial construction activity necessary to support or facilitate unconventional development in regions where activity is either underway or anticipated in the forecast period. Beyond the construction investment typically made by upstream and midstream operators, non-operator construction investment will range between $2.8 billion and $3.6 billion annually over the forecast period. This activity includes public and private investment associated with new construction in road improvements, wastewater treatment, and lodging that is needed to accommodate increased vehicle traffic, resource usage, and workers. This supplemental construction investment translates to additional construction-related jobs over and above the construction impacts identified within operator capital expenditures in the upstream, midstream, and downstream sectors. These supplemental construction-related jobs are estimated to have peaked in 2013 with about 16,800 jobs, then decline over time to about 10,000 jobs in 2025. The residential segment within this supplemental construction activity will account for more than 75% of the total supplemental construction over the forecast period.
The study projects impressive growth rates in employment for several industries. For instance, Cutting Tool and Machine Tool Accessory Manufacturing (NAICS 333515), the largest capital goods sector of the supply chain, is expected to increase the number of workers tied to the unconventional energy supply chain from 27,000 workers in 2012 to more than 50,000 in 2025. This represents a compound annual growth rate of about 5% from 2012 to 2025. These growth rates are impressive by historical standards for this sector. According to the Bureau of Labor Statistics, the sector lost workers at an average compound rate of about 3% each year during 2001–12, falling from almost 36,000 workers in 2001 to about 25,000 in 2012.
© 2014 IHS 6 September 2014
IHS Economics | Supplying the Unconventional Revolution: Sizing the unconventional oil and gas supply chain
National level key findingsIHS expects capital and operating expenditures to grow substantially between 2012 and 2025 supporting unconventional oil and natural gas production and expanding the upstream, midstream, and downstream value chain. The impact on employment, gross output, and labor income is expected to be significant throughout the supply chain:
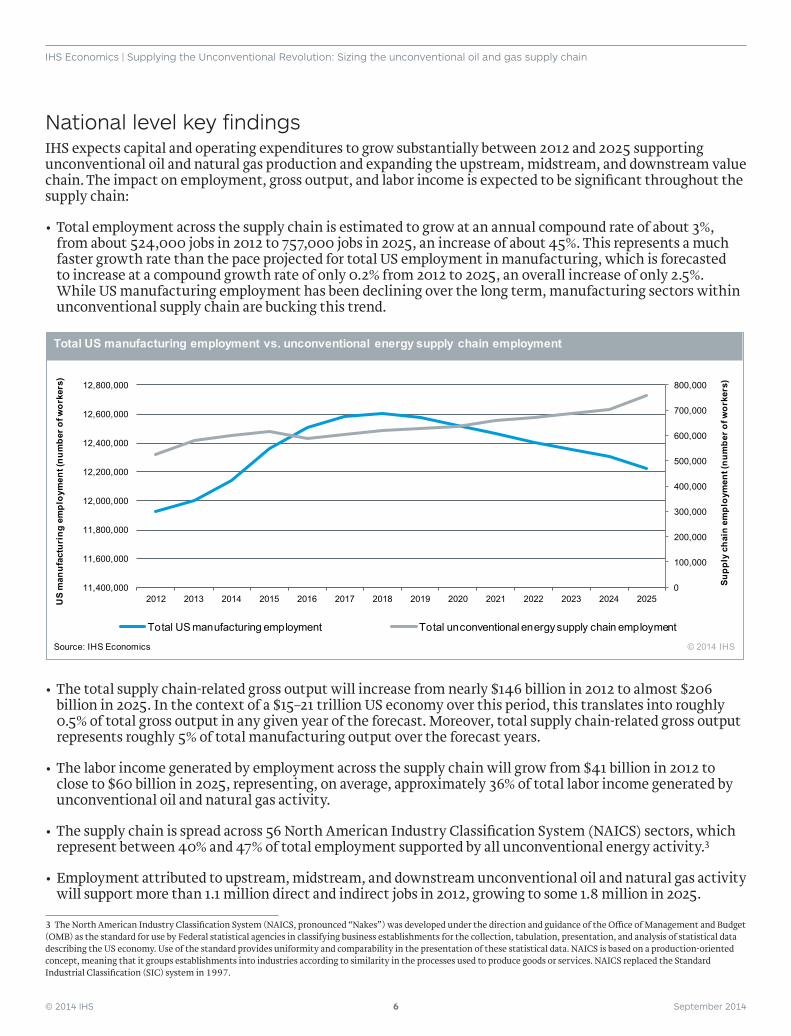
•Total employment across the supply chain is estimated to grow at an annual compound rate of about 3%, from about 524,000 jobs in 2012 to 757,000 jobs in 2025, an increase of about 45%. This represents a much faster growth rate than the pace projected for total US employment in manufacturing, which is forecasted to increase at a compound growth rate of only 0.2% from 2012 to 2025, an overall increase of only 2.5%. While US manufacturing employment has been declining over the long term, manufacturing sectors within unconventional supply chain are bucking this trend.
•The total supply chain-related gross output will increase from nearly $146 billion in 2012 to almost $206 billion in 2025. In the context of a $15–21 trillion US economy over this period, this translates into roughly 0.5% of total gross output in any given year of the forecast. Moreover, total supply chain-related gross output represents roughly 5% of total manufacturing output over the forecast years.
•The labor income generated by employment across the supply chain will grow from $41 billion in 2012 to close to $60 billion in 2025, representing, on average, approximately 36% of total labor income generated by unconventional oil and natural gas activity.
•The supply chain is spread across 56 North American Industry Classification System (NAICS) sectors, which represent between 40% and 47% of total employment supported by all unconventional energy activity.3
•Employment attributed to upstream, midstream, and downstream unconventional oil and natural gas activity will support more than 1.1 million direct and indirect jobs in 2012, growing to some 1.8 million in 2025.
3 The North American Industry Classification System (NAICS, pronounced “Nakes”) was developed under the direction and guidance of the Office of Management and Budget (OMB) as the standard for use by Federal statistical agencies in classifying business establishments for the collection, tabulation, presentation, and analysis of statistical data describing the US economy. Use of the standard provides uniformity and comparability in the presentation of these statistical data. NAICS is based on a production-oriented concept, meaning that it groups establishments into industries according to similarity in the processes used to produce goods or services. NAICS replaced the Standard Industrial Classification (SIC) system in 1997.
0
100,000
200,000
300,000
400,000
500,000
600,000
700,000
800,000
11,400,000
11,600,000
11,800,000
12,000,000
12,200,000
12,400,000
12,600,000
12,800,000
2012 2013 2014 2015 2016 2017 2018 2019 2020 2021 2022 2023 2024 2025
Supp
ly c
hain
em
ploy
men
t (nu
mbe
r of w
orke
rs)
Total US manufacturing employment Total unconventional energy supply chain employment
Total US manufacturing employment vs. unconventional energy supply chain employment
Source: IHS Economics © 2014 IHS
US
man
ufac
turi
ng e
mpl
oym
ent (
num
ber o
f wor
kers
)
© 2014 IHS 7 September 2014
IHS Economics | Supplying the Unconventional Revolution: Sizing the unconventional oil and gas supply chain
•Total government revenues generated by the unconventional energy supply chain will increase from more than $13 billion in 2012 to more than $16 billion in 2015 and to about $23 billion in 2025.
•Average income per employee in the supply chain industries is estimated at about $79,000 between 2012 and 2025.
Supply chain core group key findings•Two of the core groups, construction and well services and capital goods, account for more than 55% of total
economic benefits supported by unconventional energy supply chain activity.
• In terms of employment, the top sector within the capital goods group is Cutting Tool and Machine Tool Accessory Manufacturing (NAICS 333515), followed closely by Wholesale of Machinery and Equipment (NAICS 4238). Employment supported by unconventional energy activity in these two sectors is estimated to increase by 87%, from about 45,000 workers in 2012 to more than 84,000 workers in 2025.
•Construction and well services activities associated with the unconventional energy supply chain is represented by four sectors: Construction of New Nonresidential Manufacturing Structures (part of NAICS 23—construction of pipelines, rail, marine structures, storage facilities, LNG export facilities, and manufacturing structures); Construction of Other New Nonresidential Structures (part of NAICS 23—construction of upstream facilities and structures); Drilling of Oil and Gas Wells (NAICS 213111); and Support Activities for Oil and Gas Operations (NAICS 213112). Through 2025, these four sectors are estimated to support on average 216,000 jobs per year related to unconventional energy activity.
•Within the materials group, Construction Sand and Gravel Mining (NAICS 212321) is the largest sector of the unconventional energy supply chain in terms of employment, gross output, and labor income contributions. The employment contribution in this sector is expected to almost double from 28,000 workers in 2012 to nearly 50,000 workers in 2025. Similarly, labor income in this sector will increase from $2.5 billion in 2012 to $4.3 billion in 2025. Gross output will increase from about $6 billion to more than $10 billion over the forecast horizon.
•Within the professional and other services group, the Architectural, Engineering, and Related Services (NAICS 5413) sector is projected to increase its number of workers associated with the unconventional energy supply chain activity from more than 57,000 in 2012 to about 77,000 in 2025, representing a compound annual growth rate of 2.3%
•Among the supply chain sectors in the logistics group, General Freight Trucking (NAICS 4841) experiences the largest employment contributions stemming from unconventional energy activity. The number of workers in this sector is estimated to increase from 24,000 in 2012 to more than 44,000 in 2025.
• In Heavy Duty Truck Manufacturing, both gross output and employment are expected to double between 2012 and 2025 from $1.1 billion to $2.3 billion and 3,000 workers to 6,000 workers, respectively.
State level key findings•Unconventional energy supply chain jobs account for 2% of total state employment in Texas, Louisiana,
and Oklahoma throughout the forecast period. Supply chain employment accounts for 1% of total state employment in Arkansas, Colorado, and Pennsylvania.
• In 2012, the supply chain industries across the producing states contributed about $126 billion to total US gross output; by 2015 this will grow to over $146 billion, stabilizing at nearly $170 billion by 2025. The supply chain industries in the nonproducing states are estimated to generate $19 billion in gross output in 2012, nearly $27 billion in 2015, and $36 billion by 2025.

© 2014 IHS 8 September 2014
IHS Economics | Supplying the Unconventional Revolution: Sizing the unconventional oil and gas supply chain
•The top-10 producing states account for more than 70% of the energy supply chain contributions in terms of employment, labor income, and gross output. The top-10 producing states over the forecast period are: Texas, Louisiana, Pennsylvania, Colorado, North Dakota, Ohio, Oklahoma, California, Arkansas, and Utah.
•The top supply chain industries in terms of employment contributions across the oil and gas producing states are concentrated in Construction (part of NAICS 23), Support Activities for Oil and Gas Operations (NAICS 213112), General Freight Trucking (NAICS 4841), and Architectural, Engineering, and Related Services (NAICS 5413).
•The top supply chain industries that support the largest number of jobs across the nonproducing states are concentrated in the capital goods core group.
© 2014 IHS 9 September 2014
IHS Economics | Supplying the Unconventional Revolution: Sizing the unconventional oil and gas supply chain
IntroductionThe unconventional oil and natural gas revolution was made possible by a series of technological innovations including hydraulic fracturing and horizontal drilling.4 The converging forces of technology, risk capital, and global demand have catapulted the United States into position as the world’s largest natural gas producer. In its World Energy Outlook for 2013, the International Energy Agency estimated that the United States will reclaim the title as the world’s largest crude oil producer within this decade. US natural gas production reached almost 65 billion cubic feet (Bcf) per day in 2013, up from 52 Bcf per day five years ago. Oil production increased from 5 million barrels per day (MMb/d) in 2008 to 7.4 MMb/d in 2013.5 Moreover, since 2008, the rapid rise in affordable and abundant oil and natural gas resources has not only enhanced US energy self-sufficiency, but has also helped revive the manufacturing sector, particularly the domestic producers of petrochemicals that have lower feedstock costs than global competitors.
The unlocking of unconventional oil and gas resources has been accompanied by tremendous capital investment and operating expenditures across the energy value chain. This IHS analysis demonstrates how these expenditures in the upstream, midstream, and downstream segments of the energy value chain significantly contribute to the US economy in areas such as steel and nonferrous metals, capital equipment, construction services, professional services, and transportation. The economic contributions from unconventional oil and gas development are assessed in this report by the number of jobs supported and their associated incomes, the value of goods and services produced and the resulting tax revenues paid to federal, state, and local governments. The core focus of the report is on the economic contributions throughout the extensive supply chain that enables development of unconventional oil and gas resources.
This iteration of IHS Economics’ contribution analysis for unconventional oil and gas sizes in detail the supply chain impacts from upstream, midstream, and downstream unconventional oil and gas related activity. The national contribution of the unconventional supply chain is determined from the integration of the bottom-up production and capital spending profiles from IHS Energy research. These findings will present detailed characteristics of the upstream activities that include well construction, drilling, completion, facilities and gathering, and the myriad suppliers that support this development. The analysis is consistent with the approach used in IHS’s America’s New Energy Future study (ANEF), which examined the effects of unconventional oil and natural gas on the US economy and the manufacturing sector. The results at the state level are provided in the second part of the study, while the third part analyzes in detail the construction activity associated with the unconventional energy activity.
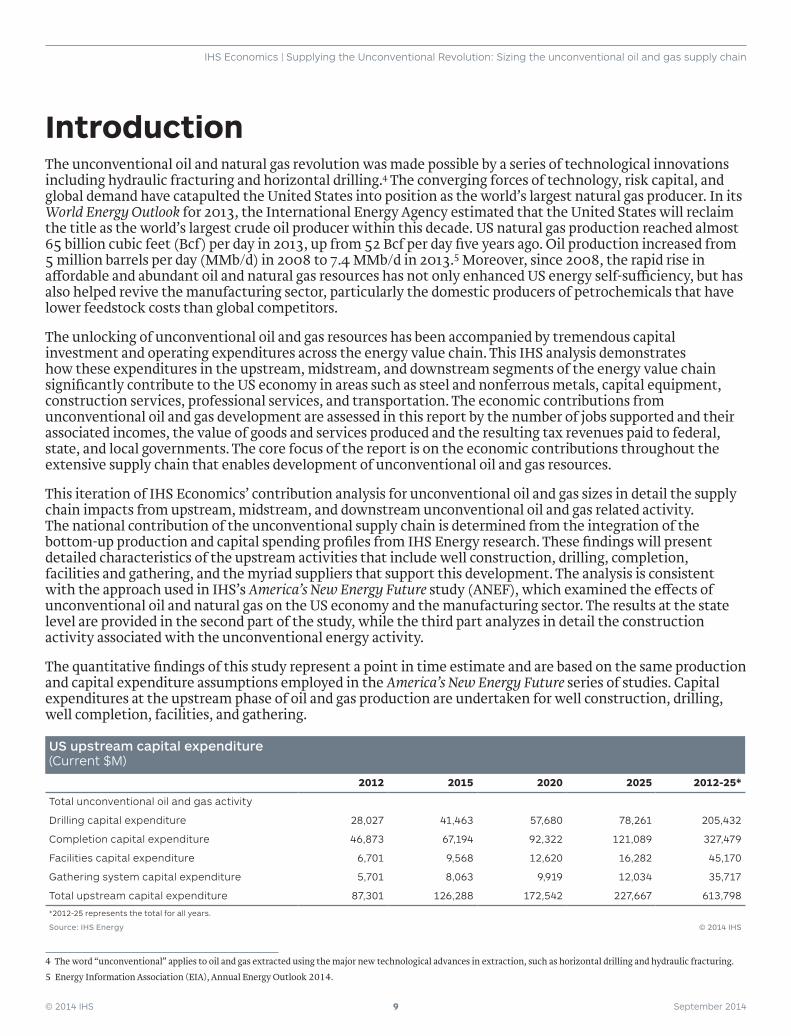
The quantitative findings of this study represent a point in time estimate and are based on the same production and capital expenditure assumptions employed in the America’s New Energy Future series of studies. Capital expenditures at the upstream phase of oil and gas production are undertaken for well construction, drilling, well completion, facilities, and gathering.
US upstream capital expenditure (Current $M)
2012 2015 2020 2025 2012-25*
Total unconventional oil and gas activity
Drilling capital expenditure 28,027 41,463 57,680 78,261 205,432
Completion capital expenditure 46,873 67,194 92,322 121,089 327,479
Facilities capital expenditure 6,701 9,568 12,620 16,282 45,170
Gathering system capital expenditure 5,701 8,063 9,919 12,034 35,717
Total upstream capital expenditure 87,301 126,288 172,542 227,667 613,798
*2012-25 represents the total for all years.
Source: IHS Energy © 2014 IHS
4 The word “unconventional” applies to oil and gas extracted using the major new technological advances in extraction, such as horizontal drilling and hydraulic fracturing.
5 Energy Information Association (EIA), Annual Energy Outlook 2014.
© 2014 IHS 10 September 2014
IHS Economics | Supplying the Unconventional Revolution: Sizing the unconventional oil and gas supply chain
As development of unconventional oil and gas resources evolves, numerous dynamics could shape the outlook for production and energy value chain development including, but not limited to:
•Federal, state, and local policy and regulations
•Changes to the current ban on crude oil exports
•Approvals for constructing new liquefied natural gas terminal capacity
•Technological innovations
•Workforce and supply chain capacity constraints
•Geopolitical events
Any change in the forces that drive the oil and gas sector investment would have an impact on the level of capital and operating expenditures that flow through the unconventional oil and gas supply chain.
Report structureThis report contains four sections:
•Unconventional oil and gas supply chain: National assessment presents the economic contributions that the unconventional energy supply chain are making to the US economy in terms of employment, gross output, labor income, and government revenues.
•Unconventional oil and gas supply chain: State assessment presents the economic contributions broken down at the state level. This section discusses in detail the key oil and gas producing and nonproducing states as well as the top sectors within each core group of the unconventional energy supply chain.
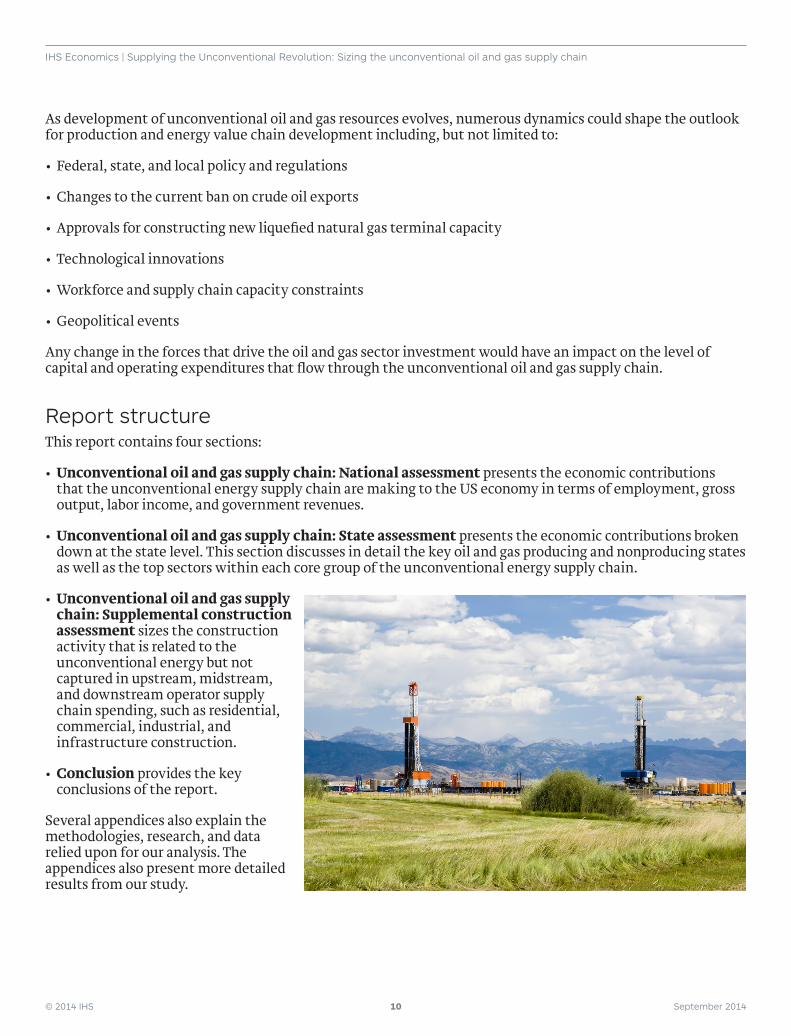
•Unconventional oil and gas supply chain: Supplemental construction assessment sizes the construction activity that is related to the unconventional energy but not captured in upstream, midstream, and downstream operator supply chain spending, such as residential, commercial, industrial, and infrastructure construction.
•Conclusion provides the key conclusions of the report.
Several appendices also explain the methodologies, research, and data relied upon for our analysis. The appendices also present more detailed results from our study.
© 2014 IHS 11 September 2014
IHS Economics | Supplying the Unconventional Revolution: Sizing the unconventional oil and gas supply chain
Unconventional oil and gas supply chain: National assessment
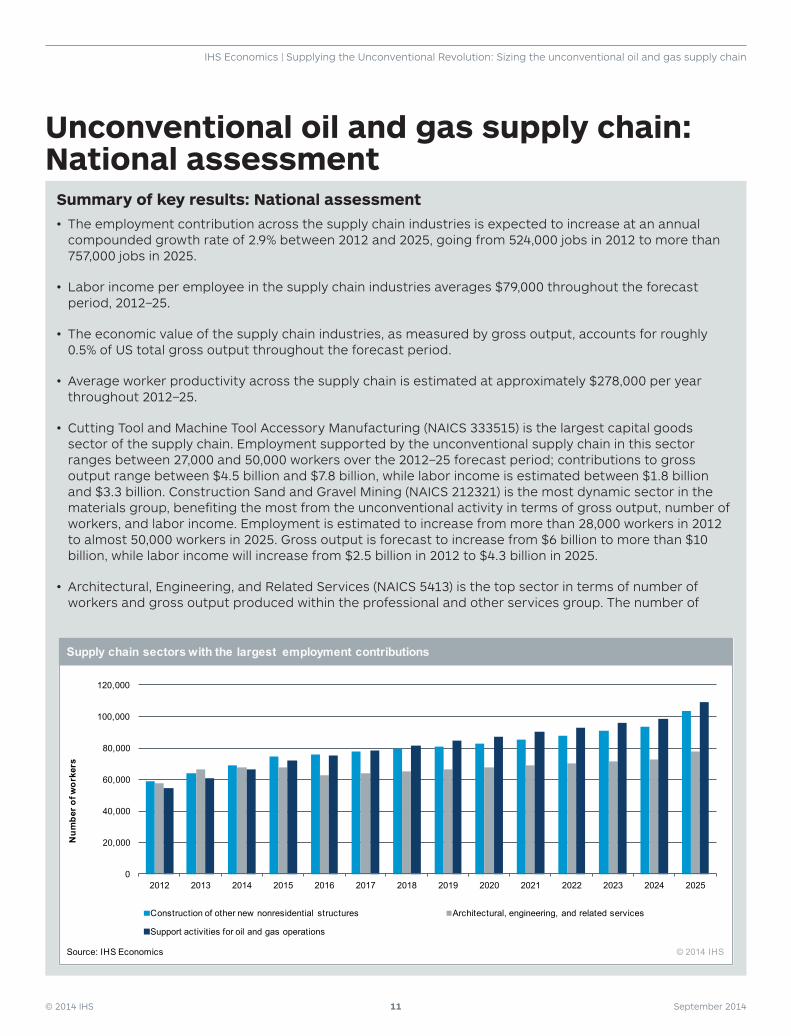
Summary of key results: National assessment• The employment contribution across the supply chain industries is expected to increase at an annual
compounded growth rate of 2.9% between 2012 and 2025, going from 524,000 jobs in 2012 to more than 757,000 jobs in 2025.
• Labor income per employee in the supply chain industries averages $79,000 throughout the forecast period, 2012–25.
• The economic value of the supply chain industries, as measured by gross output, accounts for roughly 0.5% of US total gross output throughout the forecast period.
• Average worker productivity across the supply chain is estimated at approximately $278,000 per year throughout 2012–25.
• Cutting Tool and Machine Tool Accessory Manufacturing (NAICS 333515) is the largest capital goods sector of the supply chain. Employment supported by the unconventional supply chain in this sector ranges between 27,000 and 50,000 workers over the 2012–25 forecast period; contributions to gross output range between $4.5 billion and $7.8 billion, while labor income is estimated between $1.8 billion and $3.3 billion. Construction Sand and Gravel Mining (NAICS 212321) is the most dynamic sector in the materials group, benefiting the most from the unconventional activity in terms of gross output, number of workers, and labor income. Employment is estimated to increase from more than 28,000 workers in 2012 to almost 50,000 workers in 2025. Gross output is forecast to increase from $6 billion to more than $10 billion, while labor income will increase from $2.5 billion in 2012 to $4.3 billion in 2025.
• Architectural, Engineering, and Related Services (NAICS 5413) is the top sector in terms of number of workers and gross output produced within the professional and other services group. The number of
0
20,000
40,000
60,000
80,000
100,000
120,000
2012 2013 2014 2015 2016 2017 2018 2019 2020 2021 2022 2023 2024 2025
Construction of other new nonresidential structures Architectural, engineering, and related services
Support activities for oil and gas operations
Supply chain sectors with the largest employment contributions
Source: IHS Economics © 2014 IHS
Num
ber o
f wor
kers
© 2014 IHS 12 September 2014
IHS Economics | Supplying the Unconventional Revolution: Sizing the unconventional oil and gas supply chain
As new energy resources transform America’s energy landscape, unconventional oil and gas activity is already bringing important benefits to the US economy. US crude oil production is up 50% since 2008 and natural gas production has increased by nearly a third since 2005, with shale gas increasing from 2% of output in 2002 to 37% today. Unconventional natural gas accounts for almost 65% of US natural gas production; this includes shale gas as well as natural gas from tight sands formations and coal bed methane. The rapid rise in production created a surplus of natural gas, driving down prices, which in turn contributed to a revival of the US manufacturing sector, especially the energy-intensive chemicals complex.6
By the end of the decade, IHS Energy expects 75% of US natural gas production to originate from unconventional sources. Natural gas demand in the coming decades is expected to be driven primarily by the power generation sector and by natural-gas intensive industries such as petrochemicals.
Technological advancements involving hydraulic fracturing used in the production of natural gas have been successfully transferred to unconventional oil formations. Unconventional or “tight” oil is crude oil and condensate produced from low permeability reservoirs, such as shale formations. According to IHS Energy, US production of unconventional oil is expected to increase from 2.07 MMb/d in 2012 to 5.43 MMb/d in 2025.7
As production of unconventional oil and natural gas expands over the next decades, economic investment by the oil and gas industry will also expand. The data and assumptions required to estimate the various economic contributions of unconventional oil and natural gas activity include upstream production profiles and the expected capital expenditures of upstream, midstream, and downstream energy companies. Capacity requirements for midstream and downstream activities such as oil pipelines and storage and natural gas processing plants are determined by upstream production. The capacity expansion necessary to support the unconventional oil and natural gas revolution estimated by IHS are detailed in the appendices.
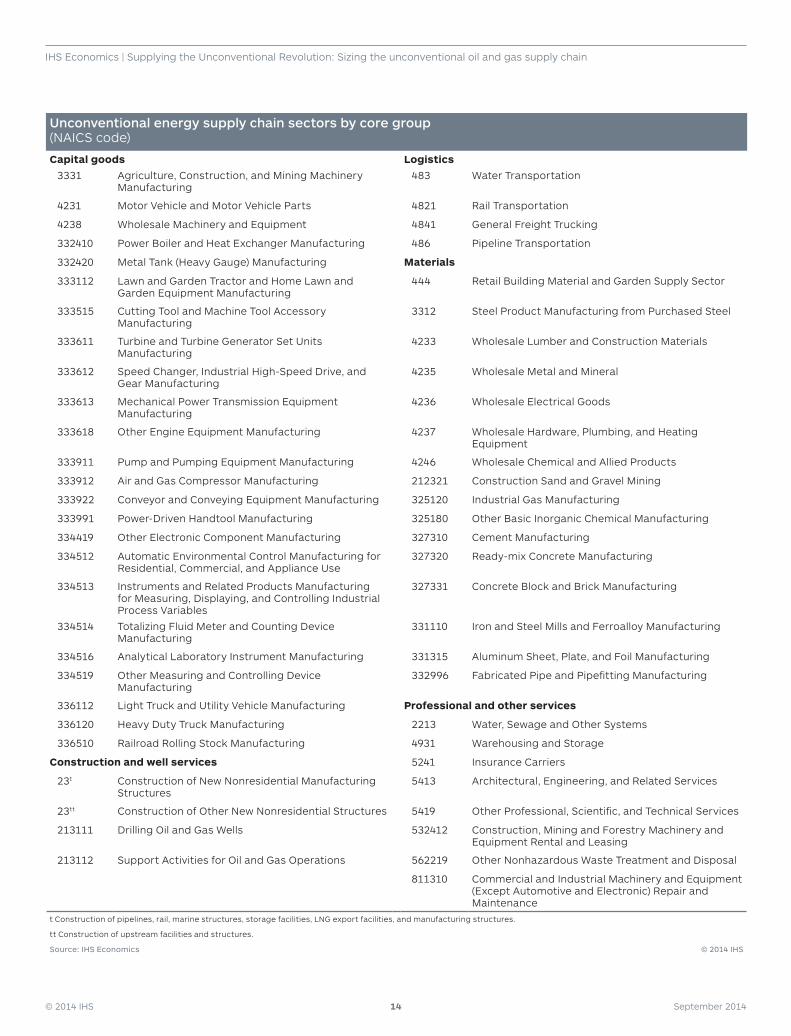
StructureThe first section of the national assessment identifies the unconventional energy supply chain sectors. The main supplier industries were found among 56 North American Industry Classification System (NAICS) sectors, which were segmented into the following five broad groups: capital goods, construction and well services, logistics, materials, and professional and other services.
The second part of this section presents the economic contributions of the unconventional energy supply chain. The analysis presents aggregate and detailed results, at up to the 6-digit NAICS level, of the impact of the unconventional oil and gas activity on key supply chain industries.
6 EIA Annual Energy Outlook 2014.
7 Unconventional oil as used in this IHS report represents oil and condensate recovered from tight oil, shale gas and tight gas plays.
workers supported by the unconventional energy supply chain is estimated to increase from almost 58,000 in 2012 to more than 77,000 in 2025. Over the same period, gross output will increase from $8.3 billion to almost $10 billion while labor income will increase from $4.7 billion to $6.2 billion.
• Within the construction and well services group, employment and output in Construction of New Nonresidential Manufacturing Structures (part of NAICS 23—Construction of pipelines, rail, marine structures, storage facilities, LNG export facilities, and manufacturing structures) are expected to decline in the second half of the forecast period as necessary structures and infrastructure are completed. Support Activities for Oil and Gas Operations (NAICS 213112), however, will strongly grow employment and output, tracking upstream unconventional investment, which is expected to increase over the forecast period.
© 2014 IHS 13 September 2014
IHS Economics | Supplying the Unconventional Revolution: Sizing the unconventional oil and gas supply chain
Defining the unconventional oil and natural gas supply chainThe unconventional oil and natural gas supply chain is far-reaching. Previous IHS analysis focused on a more aggregate definition of the unconventional supply chain whereas this analysis captures supply chain participants in more discrete component parts, namely 4-, 5-, and 6-digit NAICS codes (versus 2- and 3-digit NAICS codes measured in previous studies). The first step in preparing both the economic impact assessment, and subsequently the workforce analysis, was to identify 56 economic sectors up to the 6-digit NAICS code level that comprise the unconventional energy supply chain. IHS identified the supply chain sectors using information from multiple sources, including: 1) our extensive research of unconventional energy analysis in which we have assessed the purchasing relationships between the unconventional energy sector and the sectors that either supply goods and services to it, or purchase its energy products for use as inputs; 2) our experience in conducting other studies analyzing the economic impacts of energy development; 3) proprietary IHS databases and analysis across the energy value chain and supply chain sectors; 4) a literature review; and 5) discussions with representatives and members of the Energy Equipment & Infrastructure Alliance.
The sectors within the unconventional supply chain were assigned to one of five core groups:
1. Capital goods: Off-highway equipment and industrial machinery are widely used throughout the unconven-tional value chain, including construction and access machinery; pumps and compressors; power generators; and power boilers and heat exchangers. This group includes component suppliers to equipment manufactur-ers as well as equipment distributors and rental companies.
2. Construction and well services: Construction activity is present through all aspects of the unconventional energy value chain as well as the supplemental construction within oil and gas producing regions that is not associated with oil and gas operator capital expenditure and operating expenditure. Suppliers within this group include general and specialty contractors and building trades. Well services include well drilling and other oil and gas field services performed on a contract basis.
3. Logistics: The logistics transportation system supporting unconventional energy activity consists of road, rail, water, and pipeline transportation. While truck transportation is, and will continue to be, the main part of the unconventional energy supply chain logistics system, pipeline, water, and railway traffic are expected to increase in the coming years.
4. Materials: Within this group fall various raw materials producers such as steel and nonferrous metals; sand, gravel, and other aggregates; chemicals; and other value-added services such as metal fabrication and distribu-tion. Key materials include oil country tubular good and other pipeline products, cement for well casing, and sand and chemicals associated with hydraulic fracturing. These raw materials are also critical inputs for fin-ished and semi-finished supply chain goods such as the gears and forgings in machinery.
5. Professional and other services: Typically associated with operational expenditures, the wide range of pro-fessional and other services include environmental engineering; occupational health and safety; architectural and civil engineering services; and financial, insurance, and real estate services.
© 2014 IHS 14 September 2014
IHS Economics | Supplying the Unconventional Revolution: Sizing the unconventional oil and gas supply chain
Unconventional energy supply chain sectors by core group (NAICS code)
Capital goods Logistics
3331 Agriculture, Construction, and Mining Machinery Manufacturing
483 Water Transportation
4231 Motor Vehicle and Motor Vehicle Parts 4821 Rail Transportation
4238 Wholesale Machinery and Equipment 4841 General Freight Trucking
332410 Power Boiler and Heat Exchanger Manufacturing 486 Pipeline Transportation
332420 Metal Tank (Heavy Gauge) Manufacturing Materials
333112 Lawn and Garden Tractor and Home Lawn and Garden Equipment Manufacturing
444 Retail Building Material and Garden Supply Sector
333515 Cutting Tool and Machine Tool Accessory Manufacturing
3312 Steel Product Manufacturing from Purchased Steel
333611 Turbine and Turbine Generator Set Units Manufacturing
4233 Wholesale Lumber and Construction Materials
333612 Speed Changer, Industrial High-Speed Drive, and Gear Manufacturing
4235 Wholesale Metal and Mineral
333613 Mechanical Power Transmission Equipment Manufacturing
4236 Wholesale Electrical Goods
333618 Other Engine Equipment Manufacturing 4237 Wholesale Hardware, Plumbing, and Heating Equipment
333911 Pump and Pumping Equipment Manufacturing 4246 Wholesale Chemical and Allied Products
333912 Air and Gas Compressor Manufacturing 212321 Construction Sand and Gravel Mining
333922 Conveyor and Conveying Equipment Manufacturing 325120 Industrial Gas Manufacturing
333991 Power-Driven Handtool Manufacturing 325180 Other Basic Inorganic Chemical Manufacturing
334419 Other Electronic Component Manufacturing 327310 Cement Manufacturing
334512 Automatic Environmental Control Manufacturing for Residential, Commercial, and Appliance Use
327320 Ready-mix Concrete Manufacturing
334513 Instruments and Related Products Manufacturing for Measuring, Displaying, and Controlling Industrial Process Variables
327331 Concrete Block and Brick Manufacturing
334514 Totalizing Fluid Meter and Counting Device Manufacturing
331110 Iron and Steel Mills and Ferroalloy Manufacturing
334516 Analytical Laboratory Instrument Manufacturing 331315 Aluminum Sheet, Plate, and Foil Manufacturing
334519 Other Measuring and Controlling Device Manufacturing
332996 Fabricated Pipe and Pipefitting Manufacturing
336112 Light Truck and Utility Vehicle Manufacturing Professional and other services
336120 Heavy Duty Truck Manufacturing 2213 Water, Sewage and Other Systems
336510 Railroad Rolling Stock Manufacturing 4931 Warehousing and Storage
Construction and well services 5241 Insurance Carriers
23t Construction of New Nonresidential Manufacturing Structures
5413 Architectural, Engineering, and Related Services
23tt Construction of Other New Nonresidential Structures 5419 Other Professional, Scientific, and Technical Services
213111 Drilling Oil and Gas Wells 532412 Construction, Mining and Forestry Machinery and Equipment Rental and Leasing
213112 Support Activities for Oil and Gas Operations 562219 Other Nonhazardous Waste Treatment and Disposal
811310 Commercial and Industrial Machinery and Equipment (Except Automotive and Electronic) Repair and Maintenance
t Construction of pipelines, rail, marine structures, storage facilities, LNG export facilities, and manufacturing structures.
tt Construction of upstream facilities and structures.
Source: IHS Economics © 2014 IHS
© 2014 IHS 15 September 2014
IHS Economics | Supplying the Unconventional Revolution: Sizing the unconventional oil and gas supply chain
Results are presented by these core supply chain groupings at the national level later in this section. Results by core groups will be presented at the state level in a later section.
Economic contribution assessmentThis section of the report will present the economic contribution assessment of the supply chain industries due to the unconventional energy activity value chain including upstream, midstream, and downstream sectors. The results will be presented in aggregate for employment and labor income, and each of them will be analyzed in the context of the national economy across the supply chain of the unconventional activity. The results will be presented for the sum of the direct and indirect contributions, which are defined as follows:
Direct Impacts: The direct contribution is the effect of the core industry’s output, employment, and income. For example, unconventional oil and gas direct contributions in upstream, midstream processes, and downstream elements are generated by increased capital expenditures and production or operating expenditure. These activities directly contributed not only through production activity (operating activity), but also through broader expenditures on capital goods and facilities. These sectors are directly involved in unconventional oil and natural gas activities, such as upstream exploration and production companies, midstream processing and pipeline transportation companies, downstream local distribution companies, and their onsite construction service providers. The total number of jobs directly attributable to unconventional oil and gas are in exploring, producing, transporting, storing and delivering oil and gas to consumers or in providing critical supplies or onsite services to the industry.
Indirect Impacts: Purchasing patterns of unconventional oil and gas indirectly contribute to all of its supplier industries. Changes in demand from the direct industries lead to corresponding changes in output, employment, and labor income throughout their supply chains via inter-industry linkages. The affected supplier activities span the majority of US industries.
MethodologyUsing data and analysis from proprietary databases and the IMPLAN model, IHS evaluated the changes in upstream and midstream activities within the context of a customized industrial structure of the US economy. The data categories in the model were tailored based on the unique mix of equipment, materials, and services that characterize the unconventional oil and gas value chain, for which IHS developed modified production functions that are customized for unconventional activity. The economic impact is measured in terms of jobs created or sustained and employee wages and compensation. IHS linked the static IMPLAN model to its dynamic US macroeconomic model in order to augment the static determination of employment impacts and income effects with a comprehensive dynamic modeling methodology. Both models were run using the initial set of input assumptions to produce direct and indirect contributions. A baseline macroeconomic forecast of the US economy was used to assess the contribution of the unconventional oil and natural gas value chain.
Economic contribution assessment results
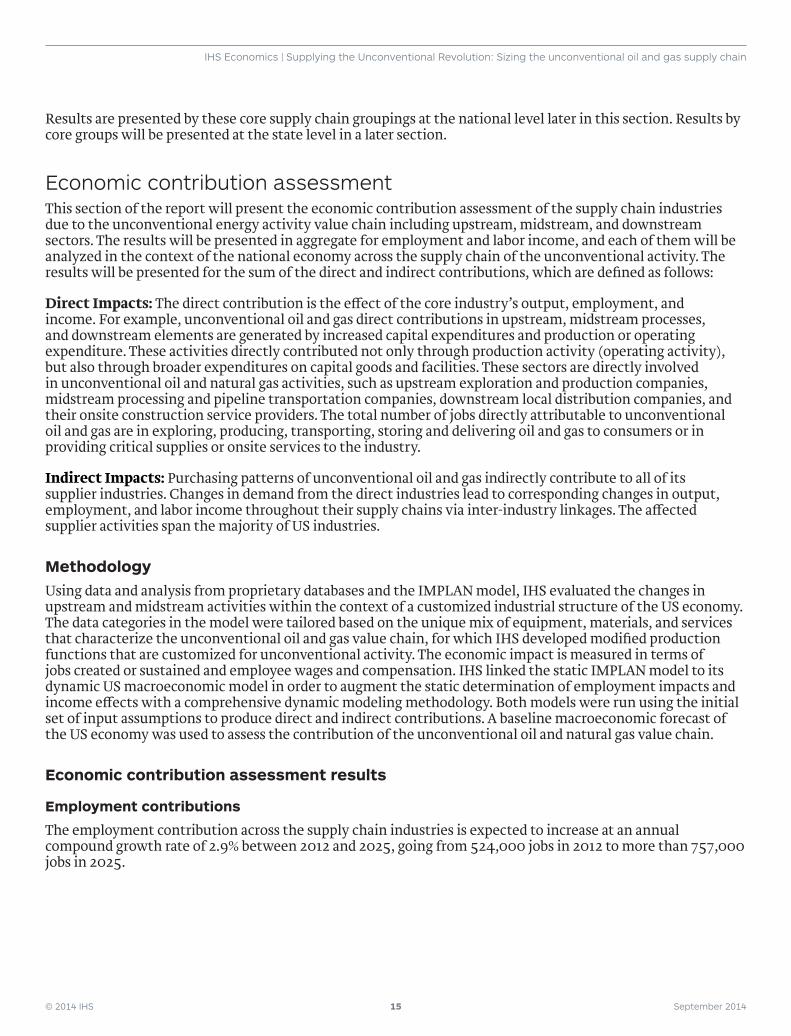
Employment contributions
The employment contribution across the supply chain industries is expected to increase at an annual compound growth rate of 2.9% between 2012 and 2025, going from 524,000 jobs in 2012 to more than 757,000 jobs in 2025.
© 2014 IHS 16 September 2014
IHS Economics | Supplying the Unconventional Revolution: Sizing the unconventional oil and gas supply chain
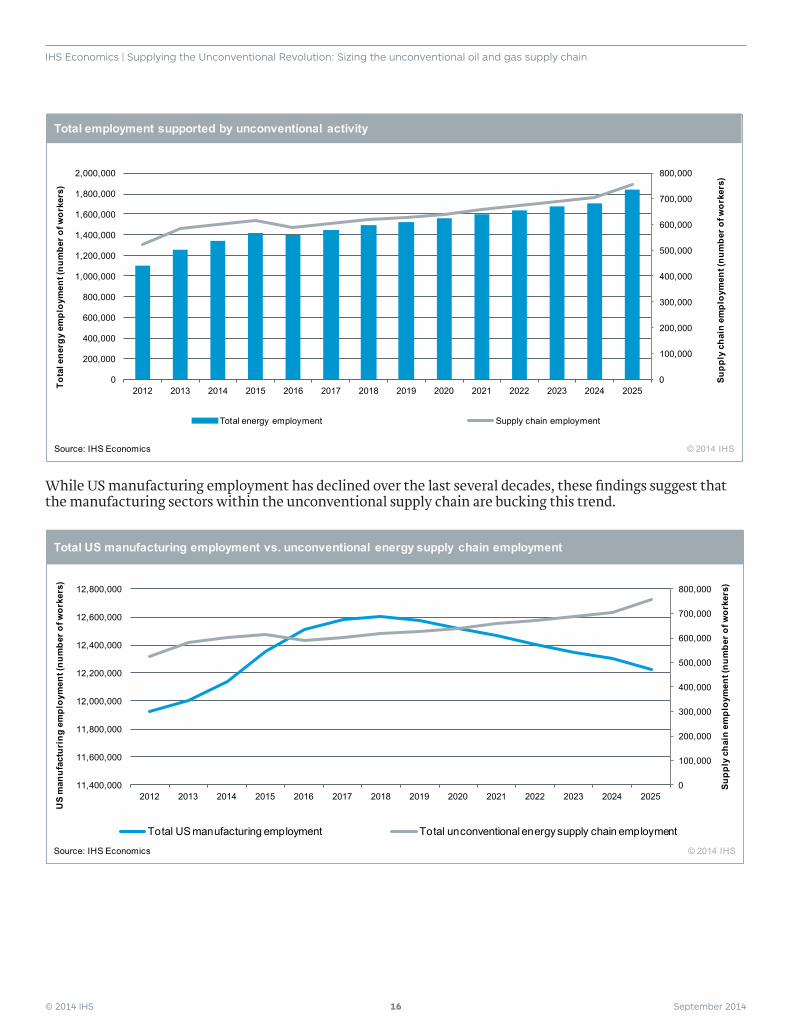
While US manufacturing employment has declined over the last several decades, these findings suggest that the manufacturing sectors within the unconventional supply chain are bucking this trend.
0
100,000
200,000
300,000
400,000
500,000
600,000
700,000
800,000
0
200,000
400,000
600,000
800,000
1,000,000
1,200,000
1,400,000
1,600,000
1,800,000
2,000,000
2012 2013 2014 2015 2016 2017 2018 2019 2020 2021 2022 2023 2024 2025
Supp
ly c
hain
em
ploy
men
t (nu
mbe
r of w
orke
rs)
Total energy employment Supply chain employment
Total employment supported by unconventional activity
Source: IHS Economics © 2014 IHS
Tota
l ene
rgy
empl
oym
ent (
num
ber o
f wor
kers
)
0
100,000
200,000
300,000
400,000
500,000
600,000
700,000
800,000
11,400,000
11,600,000
11,800,000
12,000,000
12,200,000
12,400,000
12,600,000
12,800,000
2012 2013 2014 2015 2016 2017 2018 2019 2020 2021 2022 2023 2024 2025
Supp
ly c
hain
em
ploy
men
t (nu
mbe
r of w
orke
rs)
Total US manufacturing employment Total unconventional energy supply chain employment
Total US manufacturing employment vs. unconventional energy supply chain employment
Source: IHS Economics © 2014 IHS
US
man
ufac
turi
ng e
mpl
oym
ent (
num
ber o
f wor
kers
)
© 2014 IHS 17 September 2014
IHS Economics | Supplying the Unconventional Revolution: Sizing the unconventional oil and gas supply chain
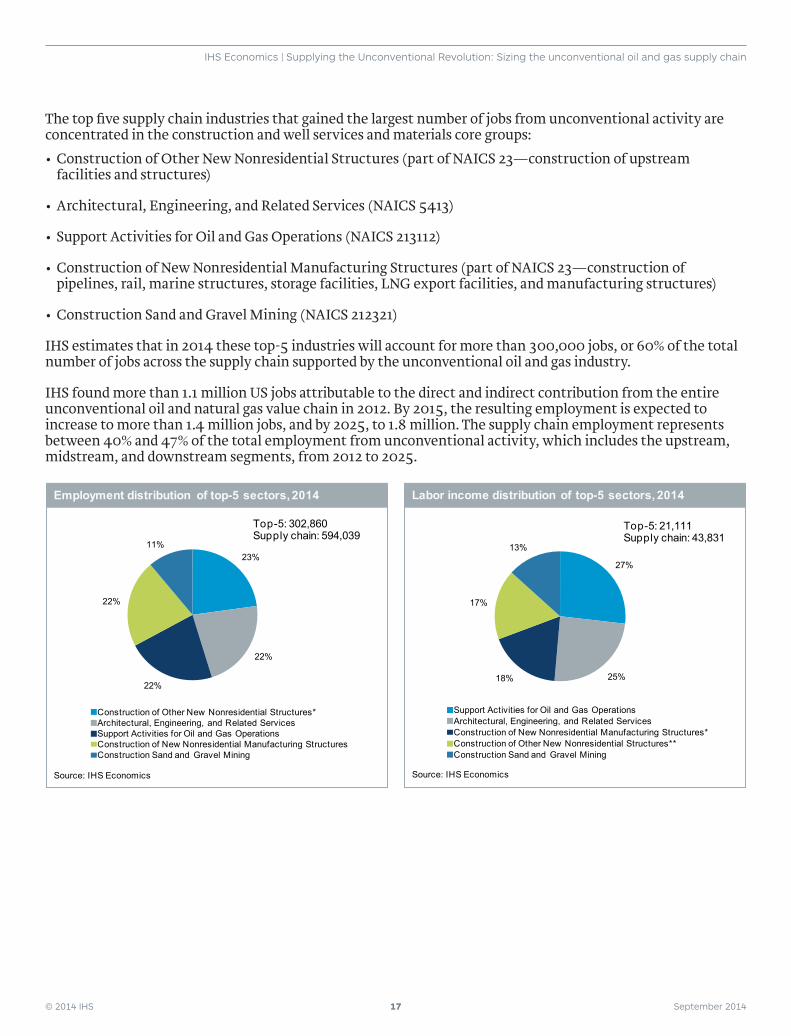
The top five supply chain industries that gained the largest number of jobs from unconventional activity are concentrated in the construction and well services and materials core groups: •Construction of Other New Nonresidential Structures (part of NAICS 23—construction of upstream
facilities and structures)
•Architectural, Engineering, and Related Services (NAICS 5413)
•Support Activities for Oil and Gas Operations (NAICS 213112)
•Construction of New Nonresidential Manufacturing Structures (part of NAICS 23—construction of pipelines, rail, marine structures, storage facilities, LNG export facilities, and manufacturing structures)
•Construction Sand and Gravel Mining (NAICS 212321)
IHS estimates that in 2014 these top-5 industries will account for more than 300,000 jobs, or 60% of the total number of jobs across the supply chain supported by the unconventional oil and gas industry.
IHS found more than 1.1 million US jobs attributable to the direct and indirect contribution from the entire unconventional oil and natural gas value chain in 2012. By 2015, the resulting employment is expected to increase to more than 1.4 million jobs, and by 2025, to 1.8 million. The supply chain employment represents between 40% and 47% of the total employment from unconventional activity, which includes the upstream, midstream, and downstream segments, from 2012 to 2025.
23%
22%
22%
22%
11%
Construction of Other New Nonresidential Structures*Architectural, Engineering, and Related ServicesSupport Activities for Oil and Gas Operations Construction of New Nonresidential Manufacturing StructuresConstruction Sand and Gravel Mining
Employment distribution of top-5 sectors, 2014
Source: IHS Economics
Top-5: 302,860Supply chain: 594,039
27%
25%18%
17%
13%
Support Activities for Oil and Gas Operations Architectural, Engineering, and Related ServicesConstruction of New Nonresidential Manufacturing Structures*Construction of Other New Nonresidential Structures**Construction Sand and Gravel Mining
Labor income distribution of top-5 sectors, 2014
Source: IHS Economics
Top-5: 21,111Supply chain: 43,831
© 2014 IHS 18 September 2014
IHS Economics | Supplying the Unconventional Revolution: Sizing the unconventional oil and gas supply chain
Top-15 sectors: US unconventional energy supply chain employment* (Number of workers)
2012 2015 2020 2025 CAGR**
23t Construction of Other New Nonresidential Structures 58,806 74,333 82,577 103,299 4.4%
5413 Architectural, Engineering, and Related Services 57,770 67,878 67,523 77,603 2.3%
213112 Support Activities for Oil and Gas Operations 54,757 72,351 87,337 108,828 5.4%
23tt Construction of New Nonresidential Manufacturing Structures 74,362 50,343 16,709 13,414 -12.3%
212321 Construction Sand and Gravel Mining 28,228 36,434 42,197 49,944 4.5%
333515 Cutting Tool and Machine Tool Accessory Manufacturing 27,460 36,225 42,287 50,435 4.8%
4841 General Freight Trucking 24,139 32,079 37,724 44,545 4.8%
4238 Wholesale Machinery and Equipment 17,449 24,339 28,903 33,742 5.2%
3331 Agriculture, Construction, and Mining Machinery Manufacturing 18,155 21,832 21,818 25,382 2.6%
3312 Steel Product Manufacturing from Purchased Steel 14,662 16,192 15,175 17,814 1.5%
213111 Drilling Oil and Gas Wells 12,917 17,526 21,176 26,558 5.7%
2213 Water, Sewage and Other Systems 12,769 16,243 18,046 21,474 4.1%
332410 Power Boiler and Heat Exchanger Manufacturing 13,860 10,712 4,159 3,876 -9.3%
333912 Air and Gas Compressor Manufacturing 10,079 13,318 15,566 18,566 4.8%
332996 Fabricated Pipe and Pipefitting Manufacturing 9,219 11,497 12,673 14,872 3.7%
Top-15 total 434,632 501,304 513,870 610,352 2.6%
US total 524,413 615,910 638,762 757,802 2.9%
*The ranking for all years are based on employment in 2014.
** Compound annual growth rate from 2012 to 2025.
t Construction of upstream facilities and structures.
tt Construction of pipelines, rail, marine structures, storage facilities, LNG export facilities, and manufacturing structures.
Source: IHS Economics © 2014 IHS
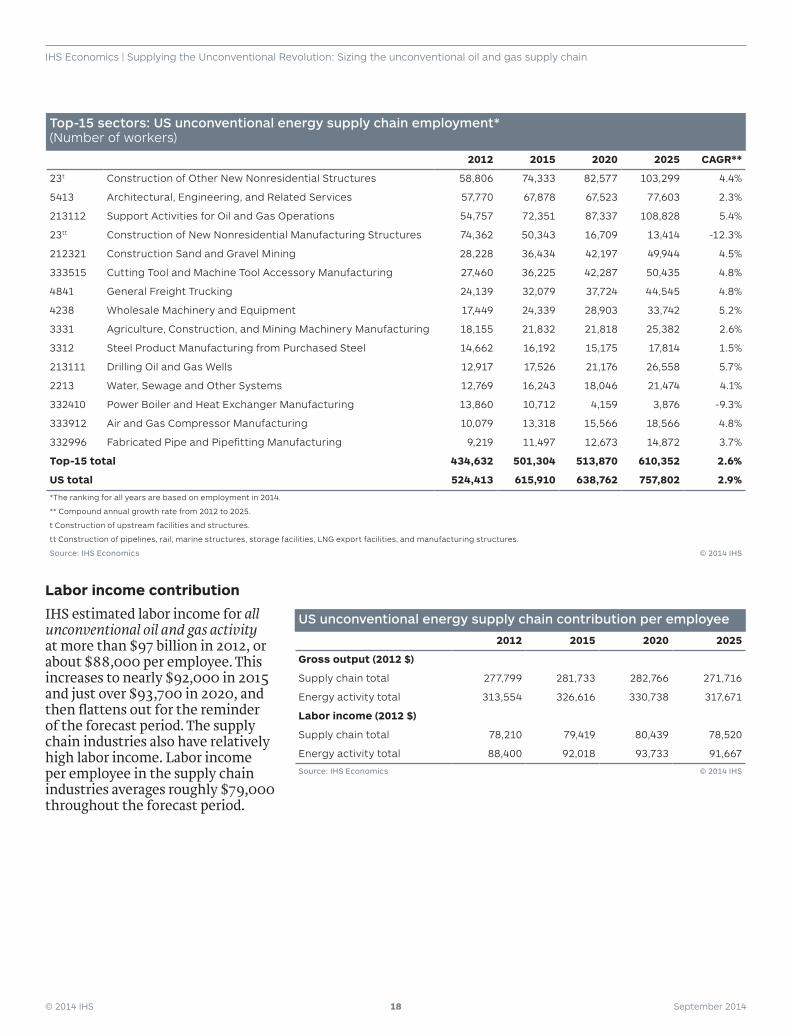
Labor income contribution
IHS estimated labor income for all unconventional oil and gas activity at more than $97 billion in 2012, or about $88,000 per employee. This increases to nearly $92,000 in 2015 and just over $93,700 in 2020, and then flattens out for the reminder of the forecast period. The supply chain industries also have relatively high labor income. Labor income per employee in the supply chain industries averages roughly $79,000 throughout the forecast period.
US unconventional energy supply chain contribution per employee
2012 2015 2020 2025
Gross output (2012 $)
Supply chain total 277,799 281,733 282,766 271,716
Energy activity total 313,554 326,616 330,738 317,671
Labor income (2012 $)
Supply chain total 78,210 79,419 80,439 78,520
Energy activity total 88,400 92,018 93,733 91,667
Source: IHS Economics © 2014 IHS
© 2014 IHS 19 September 2014
IHS Economics | Supplying the Unconventional Revolution: Sizing the unconventional oil and gas supply chain
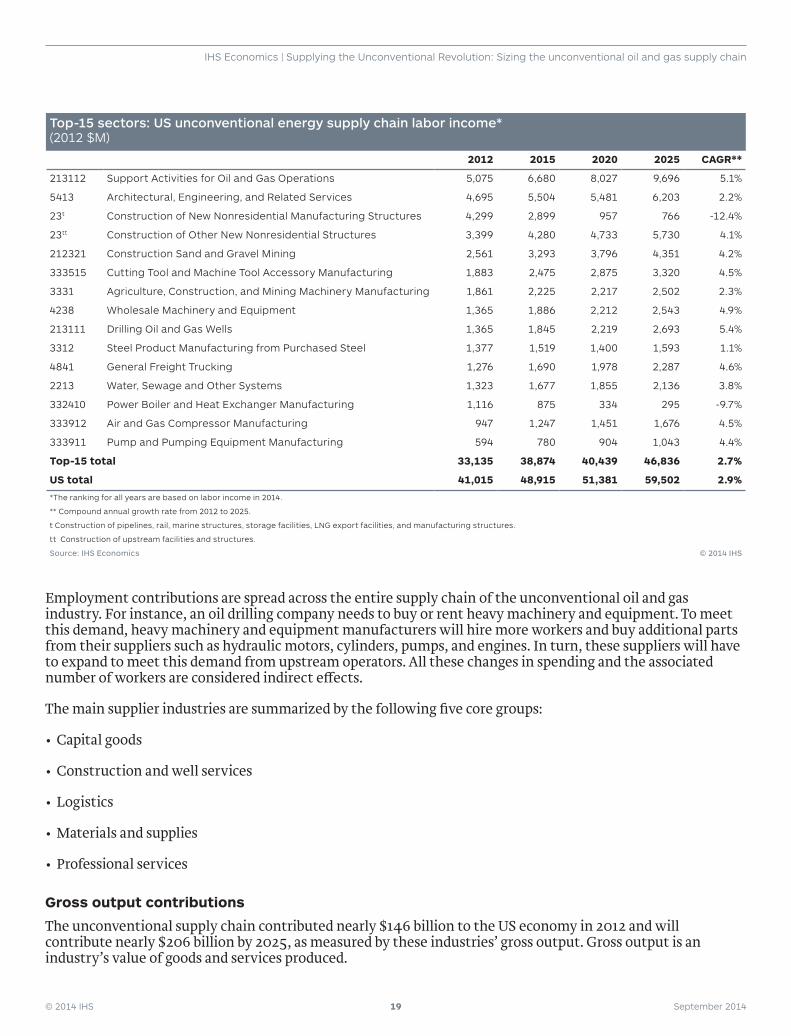
Top-15 sectors: US unconventional energy supply chain labor income* (2012 $M)
2012 2015 2020 2025 CAGR**
213112 Support Activities for Oil and Gas Operations 5,075 6,680 8,027 9,696 5.1%
5413 Architectural, Engineering, and Related Services 4,695 5,504 5,481 6,203 2.2%
23t Construction of New Nonresidential Manufacturing Structures 4,299 2,899 957 766 -12.4%
23tt Construction of Other New Nonresidential Structures 3,399 4,280 4,733 5,730 4.1%
212321 Construction Sand and Gravel Mining 2,561 3,293 3,796 4,351 4.2%
333515 Cutting Tool and Machine Tool Accessory Manufacturing 1,883 2,475 2,875 3,320 4.5%
3331 Agriculture, Construction, and Mining Machinery Manufacturing 1,861 2,225 2,217 2,502 2.3%
4238 Wholesale Machinery and Equipment 1,365 1,886 2,212 2,543 4.9%
213111 Drilling Oil and Gas Wells 1,365 1,845 2,219 2,693 5.4%
3312 Steel Product Manufacturing from Purchased Steel 1,377 1,519 1,400 1,593 1.1%
4841 General Freight Trucking 1,276 1,690 1,978 2,287 4.6%
2213 Water, Sewage and Other Systems 1,323 1,677 1,855 2,136 3.8%
332410 Power Boiler and Heat Exchanger Manufacturing 1,116 875 334 295 -9.7%
333912 Air and Gas Compressor Manufacturing 947 1,247 1,451 1,676 4.5%
333911 Pump and Pumping Equipment Manufacturing 594 780 904 1,043 4.4%
Top-15 total 33,135 38,874 40,439 46,836 2.7%
US total 41,015 48,915 51,381 59,502 2.9%
*The ranking for all years are based on labor income in 2014.
** Compound annual growth rate from 2012 to 2025.
t Construction of pipelines, rail, marine structures, storage facilities, LNG export facilities, and manufacturing structures.
tt Construction of upstream facilities and structures.
Source: IHS Economics © 2014 IHS
Employment contributions are spread across the entire supply chain of the unconventional oil and gas industry. For instance, an oil drilling company needs to buy or rent heavy machinery and equipment. To meet this demand, heavy machinery and equipment manufacturers will hire more workers and buy additional parts from their suppliers such as hydraulic motors, cylinders, pumps, and engines. In turn, these suppliers will have to expand to meet this demand from upstream operators. All these changes in spending and the associated number of workers are considered indirect effects.
The main supplier industries are summarized by the following five core groups:
•Capital goods
•Construction and well services
•Logistics
•Materials and supplies
•Professional services
Gross output contributions
The unconventional supply chain contributed nearly $146 billion to the US economy in 2012 and will contribute nearly $206 billion by 2025, as measured by these industries’ gross output. Gross output is an industry’s value of goods and services produced.
© 2014 IHS 20 September 2014
IHS Economics | Supplying the Unconventional Revolution: Sizing the unconventional oil and gas supply chain
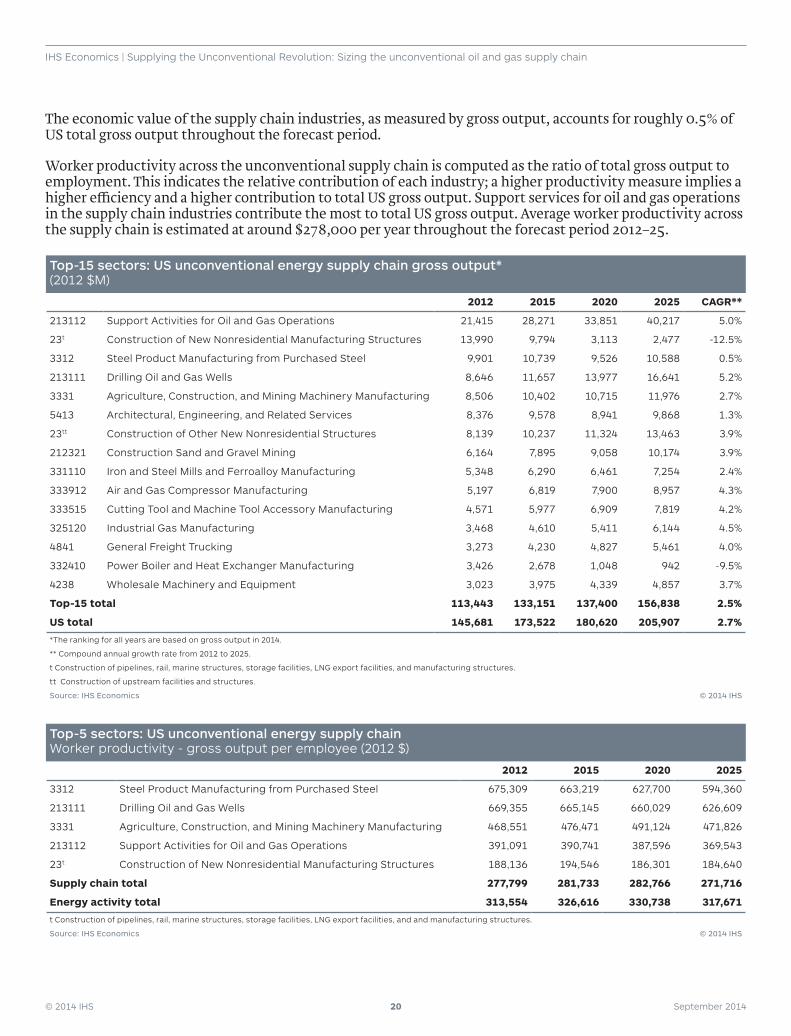
The economic value of the supply chain industries, as measured by gross output, accounts for roughly 0.5% of US total gross output throughout the forecast period.
Worker productivity across the unconventional supply chain is computed as the ratio of total gross output to employment. This indicates the relative contribution of each industry; a higher productivity measure implies a higher efficiency and a higher contribution to total US gross output. Support services for oil and gas operations in the supply chain industries contribute the most to total US gross output. Average worker productivity across the supply chain is estimated at around $278,000 per year throughout the forecast period 2012–25.
Top-15 sectors: US unconventional energy supply chain gross output* (2012 $M)
2012 2015 2020 2025 CAGR**
213112 Support Activities for Oil and Gas Operations 21,415 28,271 33,851 40,217 5.0%
23t Construction of New Nonresidential Manufacturing Structures 13,990 9,794 3,113 2,477 -12.5%
3312 Steel Product Manufacturing from Purchased Steel 9,901 10,739 9,526 10,588 0.5%
213111 Drilling Oil and Gas Wells 8,646 11,657 13,977 16,641 5.2%
3331 Agriculture, Construction, and Mining Machinery Manufacturing 8,506 10,402 10,715 11,976 2.7%
5413 Architectural, Engineering, and Related Services 8,376 9,578 8,941 9,868 1.3%
23tt Construction of Other New Nonresidential Structures 8,139 10,237 11,324 13,463 3.9%
212321 Construction Sand and Gravel Mining 6,164 7,895 9,058 10,174 3.9%
331110 Iron and Steel Mills and Ferroalloy Manufacturing 5,348 6,290 6,461 7,254 2.4%
333912 Air and Gas Compressor Manufacturing 5,197 6,819 7,900 8,957 4.3%
333515 Cutting Tool and Machine Tool Accessory Manufacturing 4,571 5,977 6,909 7,819 4.2%
325120 Industrial Gas Manufacturing 3,468 4,610 5,411 6,144 4.5%
4841 General Freight Trucking 3,273 4,230 4,827 5,461 4.0%
332410 Power Boiler and Heat Exchanger Manufacturing 3,426 2,678 1,048 942 -9.5%
4238 Wholesale Machinery and Equipment 3,023 3,975 4,339 4,857 3.7%
Top-15 total 113,443 133,151 137,400 156,838 2.5%
US total 145,681 173,522 180,620 205,907 2.7%
*The ranking for all years are based on gross output in 2014.
** Compound annual growth rate from 2012 to 2025.
t Construction of pipelines, rail, marine structures, storage facilities, LNG export facilities, and manufacturing structures.
tt Construction of upstream facilities and structures.
Source: IHS Economics © 2014 IHS
Top-5 sectors: US unconventional energy supply chain Worker productivity - gross output per employee (2012 $)
2012 2015 2020 2025
3312 Steel Product Manufacturing from Purchased Steel 675,309 663,219 627,700 594,360
213111 Drilling Oil and Gas Wells 669,355 665,145 660,029 626,609
3331 Agriculture, Construction, and Mining Machinery Manufacturing 468,551 476,471 491,124 471,826
213112 Support Activities for Oil and Gas Operations 391,091 390,741 387,596 369,543
23t Construction of New Nonresidential Manufacturing Structures 188,136 194,546 186,301 184,640
Supply chain total 277,799 281,733 282,766 271,716
Energy activity total 313,554 326,616 330,738 317,671
t Construction of pipelines, rail, marine structures, storage facilities, LNG export facilities, and and manufacturing structures.
Source: IHS Economics © 2014 IHS
© 2014 IHS 21 September 2014
IHS Economics | Supplying the Unconventional Revolution: Sizing the unconventional oil and gas supply chain
Government revenue
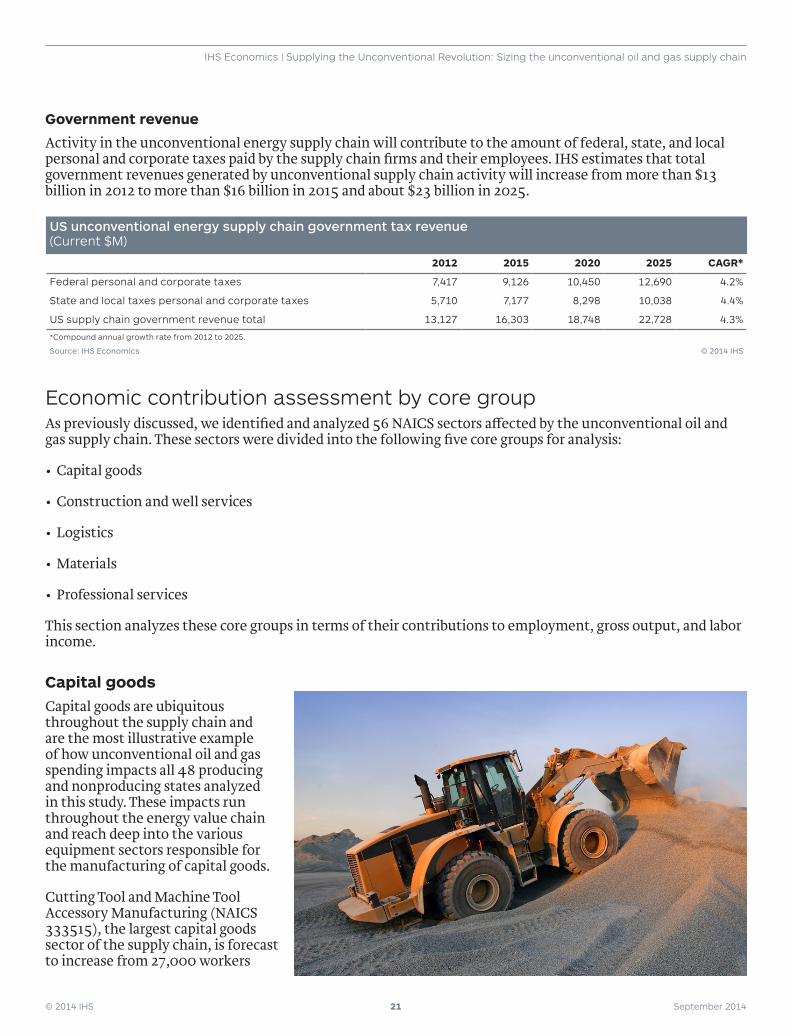
Activity in the unconventional energy supply chain will contribute to the amount of federal, state, and local personal and corporate taxes paid by the supply chain firms and their employees. IHS estimates that total government revenues generated by unconventional supply chain activity will increase from more than $13 billion in 2012 to more than $16 billion in 2015 and about $23 billion in 2025.
US unconventional energy supply chain government tax revenue (Current $M)
2012 2015 2020 2025 CAGR*
Federal personal and corporate taxes 7,417 9,126 10,450 12,690 4.2%
State and local taxes personal and corporate taxes 5,710 7,177 8,298 10,038 4.4%
US supply chain government revenue total 13,127 16,303 18,748 22,728 4.3%
*Compound annual growth rate from 2012 to 2025.
Source: IHS Economics © 2014 IHS
Economic contribution assessment by core group As previously discussed, we identified and analyzed 56 NAICS sectors affected by the unconventional oil and gas supply chain. These sectors were divided into the following five core groups for analysis:
•Capital goods
•Construction and well services
•Logistics
•Materials
•Professional services
This section analyzes these core groups in terms of their contributions to employment, gross output, and labor income.
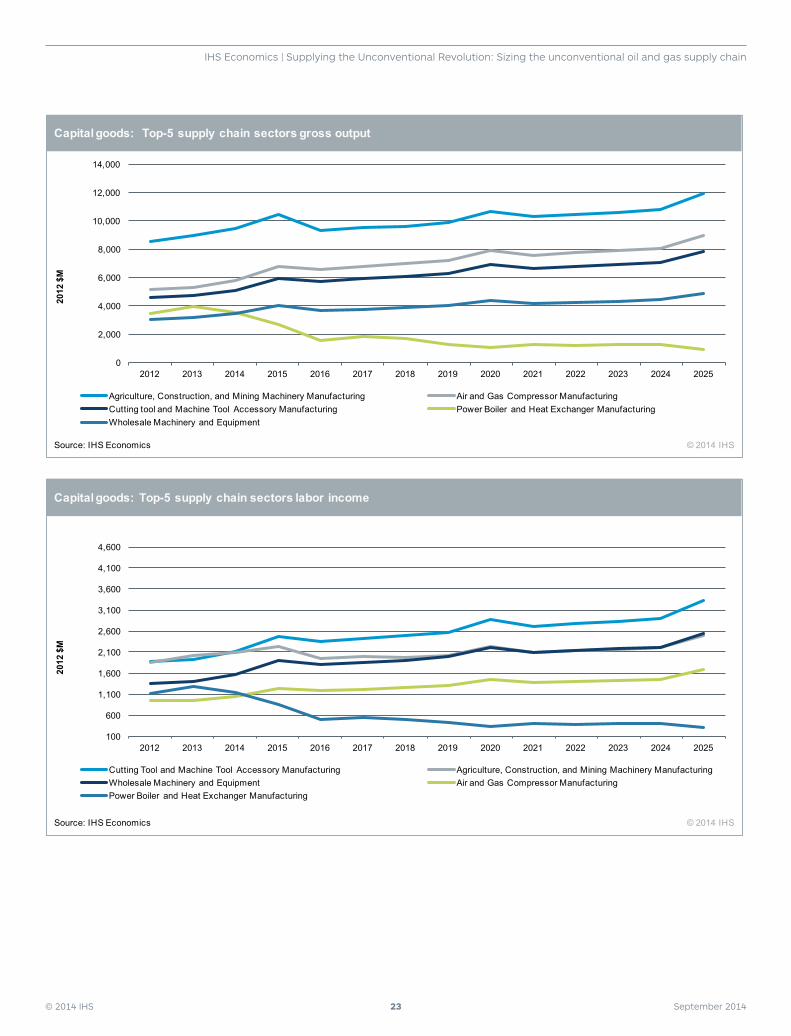
Capital goodsCapital goods are ubiquitous throughout the supply chain and are the most illustrative example of how unconventional oil and gas spending impacts all 48 producing and nonproducing states analyzed in this study. These impacts run throughout the energy value chain and reach deep into the various equipment sectors responsible for the manufacturing of capital goods.
Cutting Tool and Machine Tool Accessory Manufacturing (NAICS 333515), the largest capital goods sector of the supply chain, is forecast to increase from 27,000 workers
© 2014 IHS 22 September 2014
IHS Economics | Supplying the Unconventional Revolution: Sizing the unconventional oil and gas supply chain
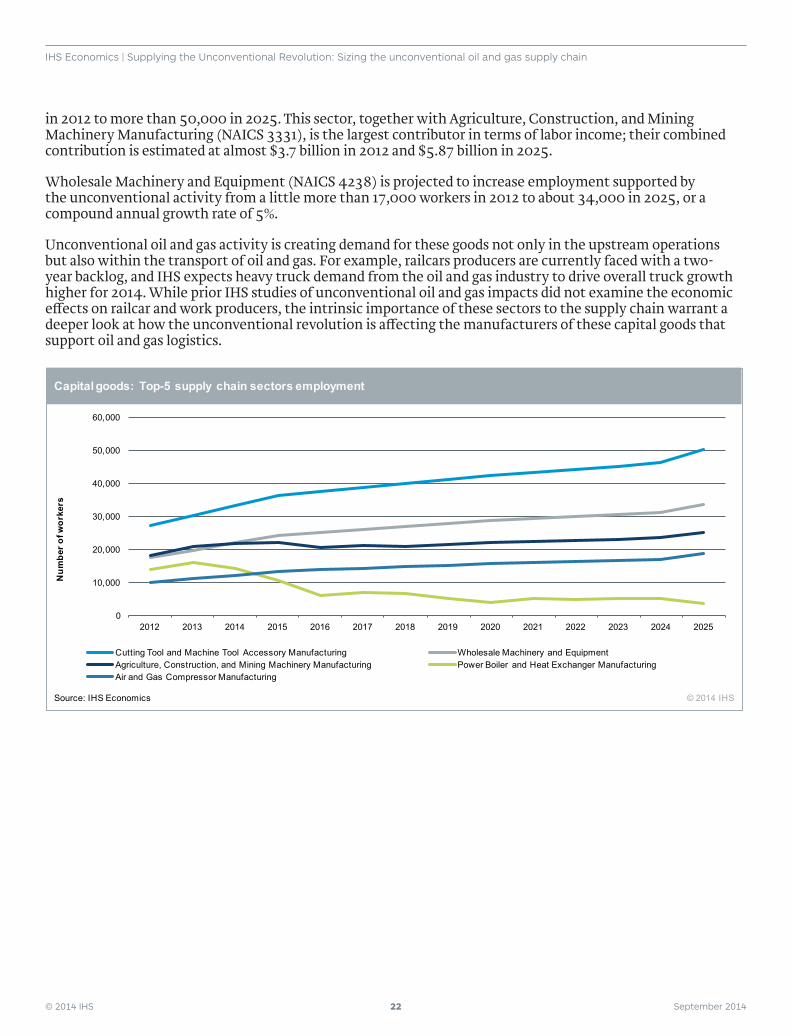
in 2012 to more than 50,000 in 2025. This sector, together with Agriculture, Construction, and Mining Machinery Manufacturing (NAICS 3331), is the largest contributor in terms of labor income; their combined contribution is estimated at almost $3.7 billion in 2012 and $5.87 billion in 2025.
Wholesale Machinery and Equipment (NAICS 4238) is projected to increase employment supported by the unconventional activity from a little more than 17,000 workers in 2012 to about 34,000 in 2025, or a compound annual growth rate of 5%.
Unconventional oil and gas activity is creating demand for these goods not only in the upstream operations but also within the transport of oil and gas. For example, railcars producers are currently faced with a two-year backlog, and IHS expects heavy truck demand from the oil and gas industry to drive overall truck growth higher for 2014. While prior IHS studies of unconventional oil and gas impacts did not examine the economic effects on railcar and work producers, the intrinsic importance of these sectors to the supply chain warrant a deeper look at how the unconventional revolution is affecting the manufacturers of these capital goods that support oil and gas logistics.
0
10,000
20,000
30,000
40,000
50,000
60,000
2012 2013 2014 2015 2016 2017 2018 2019 2020 2021 2022 2023 2024 2025
Cutting Tool and Machine Tool Accessory Manufacturing Wholesale Machinery and EquipmentAgriculture, Construction, and Mining Machinery Manufacturing Power Boiler and Heat Exchanger ManufacturingAir and Gas Compressor Manufacturing
Capital goods: Top-5 supply chain sectors employment
Source: IHS Economics © 2014 IHS
Num
ber o
f wor
kers
© 2014 IHS 23 September 2014
IHS Economics | Supplying the Unconventional Revolution: Sizing the unconventional oil and gas supply chain
0
2,000
4,000
6,000
8,000
10,000
12,000
14,000
2012 2013 2014 2015 2016 2017 2018 2019 2020 2021 2022 2023 2024 2025
Agriculture, Construction, and Mining Machinery Manufacturing Air and Gas Compressor Manufacturing Cutting tool and Machine Tool Accessory Manufacturing Power Boiler and Heat Exchanger ManufacturingWholesale Machinery and Equipment
Capital goods: Top-5 supply chain sectors gross output
Source: IHS Economics © 2014 IHS
2012
$M
100
600
1,100
1,600
2,100
2,600
3,100
3,600
4,100
4,600
2012 2013 2014 2015 2016 2017 2018 2019 2020 2021 2022 2023 2024 2025
Cutting Tool and Machine Tool Accessory Manufacturing Agriculture, Construction, and Mining Machinery ManufacturingWholesale Machinery and Equipment Air and Gas Compressor Manufacturing Power Boiler and Heat Exchanger Manufacturing
Capital goods: Top-5 supply chain sectors labor income
Source: IHS Economics © 2014 IHS
2012
$M
© 2014 IHS 24 September 2014
IHS Economics | Supplying the Unconventional Revolution: Sizing the unconventional oil and gas supply chain
Railcar manufacturing
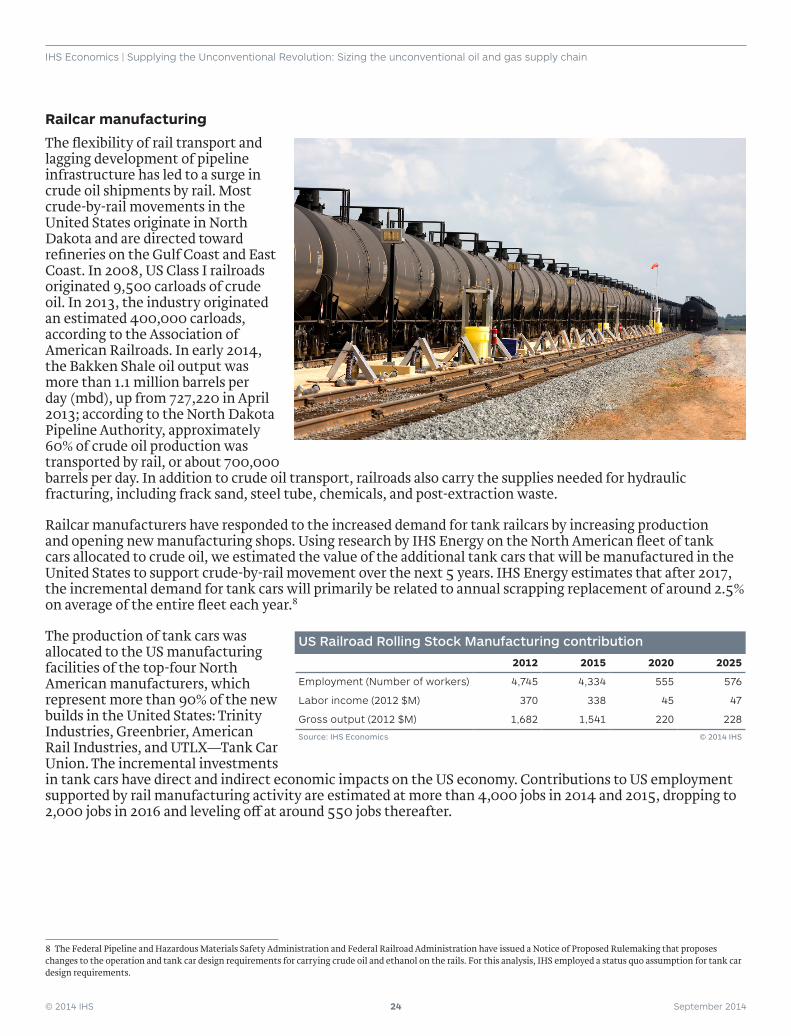
The flexibility of rail transport and lagging development of pipeline infrastructure has led to a surge in crude oil shipments by rail. Most crude-by-rail movements in the United States originate in North Dakota and are directed toward refineries on the Gulf Coast and East Coast. In 2008, US Class I railroads originated 9,500 carloads of crude oil. In 2013, the industry originated an estimated 400,000 carloads, according to the Association of American Railroads. In early 2014, the Bakken Shale oil output was more than 1.1 million barrels per day (mbd), up from 727,220 in April 2013; according to the North Dakota Pipeline Authority, approximately 60% of crude oil production was transported by rail, or about 700,000 barrels per day. In addition to crude oil transport, railroads also carry the supplies needed for hydraulic fracturing, including frack sand, steel tube, chemicals, and post-extraction waste.
Railcar manufacturers have responded to the increased demand for tank railcars by increasing production and opening new manufacturing shops. Using research by IHS Energy on the North American fleet of tank cars allocated to crude oil, we estimated the value of the additional tank cars that will be manufactured in the United States to support crude-by-rail movement over the next 5 years. IHS Energy estimates that after 2017, the incremental demand for tank cars will primarily be related to annual scrapping replacement of around 2.5% on average of the entire fleet each year.8
The production of tank cars was allocated to the US manufacturing facilities of the top-four North American manufacturers, which represent more than 90% of the new builds in the United States: Trinity Industries, Greenbrier, American Rail Industries, and UTLX—Tank Car Union. The incremental investments in tank cars have direct and indirect economic impacts on the US economy. Contributions to US employment supported by rail manufacturing activity are estimated at more than 4,000 jobs in 2014 and 2015, dropping to 2,000 jobs in 2016 and leveling off at around 550 jobs thereafter.
8 The Federal Pipeline and Hazardous Materials Safety Administration and Federal Railroad Administration have issued a Notice of Proposed Rulemaking that proposes changes to the operation and tank car design requirements for carrying crude oil and ethanol on the rails. For this analysis, IHS employed a status quo assumption for tank car design requirements.
US Railroad Rolling Stock Manufacturing contribution
2012 2015 2020 2025
Employment (Number of workers) 4,745 4,334 555 576
Labor income (2012 $M) 370 338 45 47
Gross output (2012 $M) 1,682 1,541 220 228
Source: IHS Economics © 2014 IHS
© 2014 IHS 25 September 2014
IHS Economics | Supplying the Unconventional Revolution: Sizing the unconventional oil and gas supply chain
“Unconventional oil and gas development is having a tremendous positive impact on the growth of both rail car manufacturing and demand for rail transport capacity. Crude by rail has seen unprecedented growth, and the projections are for continued major increases. Rail shipments of oil and gas production supplies such as frack sand and pipe are adding even more to demand. This is a brand new business that didn’t exist in 2009, and now it is one of the industry’s biggest drivers. In fact it is picking up a good bit of the slack created by lower coal shipments. We also see energy-related rail transport between the U.S. and both Canada and Mexico as a strong growth area.” Tony Hatch, ABH Consulting
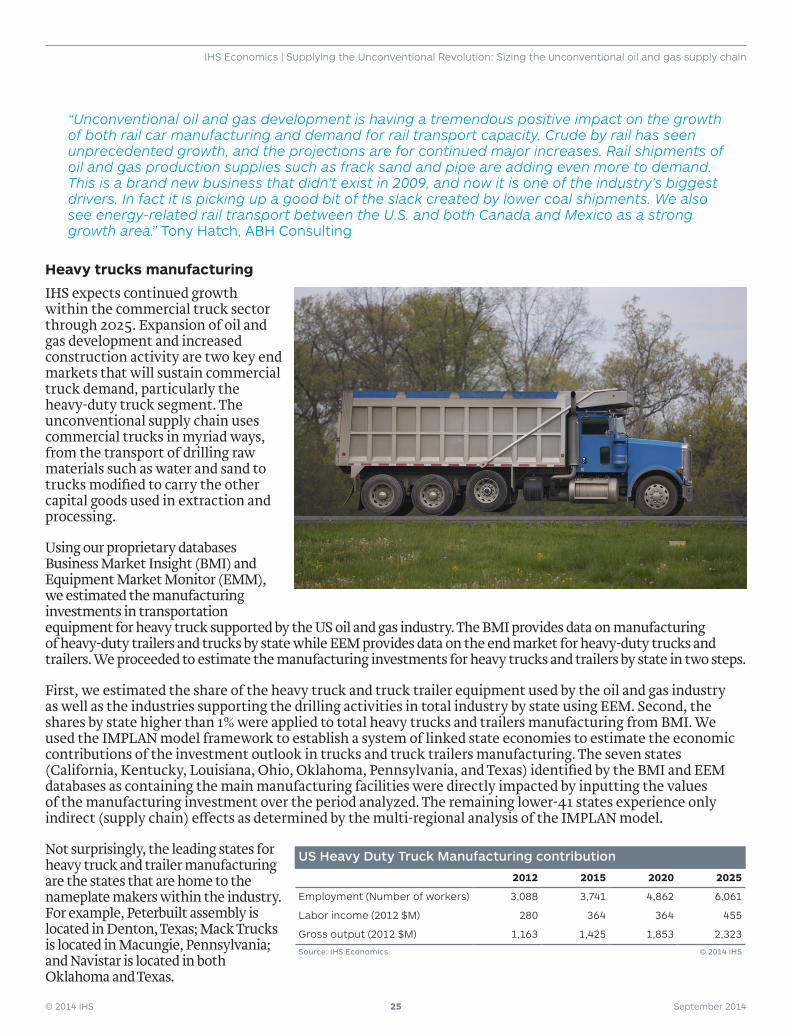
Heavy trucks manufacturing
IHS expects continued growth within the commercial truck sector through 2025. Expansion of oil and gas development and increased construction activity are two key end markets that will sustain commercial truck demand, particularly the heavy-duty truck segment. The unconventional supply chain uses commercial trucks in myriad ways, from the transport of drilling raw materials such as water and sand to trucks modified to carry the other capital goods used in extraction and processing.
Using our proprietary databases Business Market Insight (BMI) and Equipment Market Monitor (EMM), we estimated the manufacturing investments in transportation equipment for heavy truck supported by the US oil and gas industry. The BMI provides data on manufacturing of heavy-duty trailers and trucks by state while EEM provides data on the end market for heavy-duty trucks and trailers. We proceeded to estimate the manufacturing investments for heavy trucks and trailers by state in two steps.
First, we estimated the share of the heavy truck and truck trailer equipment used by the oil and gas industry as well as the industries supporting the drilling activities in total industry by state using EEM. Second, the shares by state higher than 1% were applied to total heavy trucks and trailers manufacturing from BMI. We used the IMPLAN model framework to establish a system of linked state economies to estimate the economic contributions of the investment outlook in trucks and truck trailers manufacturing. The seven states (California, Kentucky, Louisiana, Ohio, Oklahoma, Pennsylvania, and Texas) identified by the BMI and EEM databases as containing the main manufacturing facilities were directly impacted by inputting the values of the manufacturing investment over the period analyzed. The remaining lower-41 states experience only indirect (supply chain) effects as determined by the multi-regional analysis of the IMPLAN model.
Not surprisingly, the leading states for heavy truck and trailer manufacturing are the states that are home to the nameplate makers within the industry. For example, Peterbuilt assembly is located in Denton, Texas; Mack Trucks is located in Macungie, Pennsylvania; and Navistar is located in both Oklahoma and Texas.
US Heavy Duty Truck Manufacturing contribution
2012 2015 2020 2025
Employment (Number of workers) 3,088 3,741 4,862 6,061
Labor income (2012 $M) 280 364 364 455
Gross output (2012 $M) 1,163 1,425 1,853 2,323
Source: IHS Economics © 2014 IHS
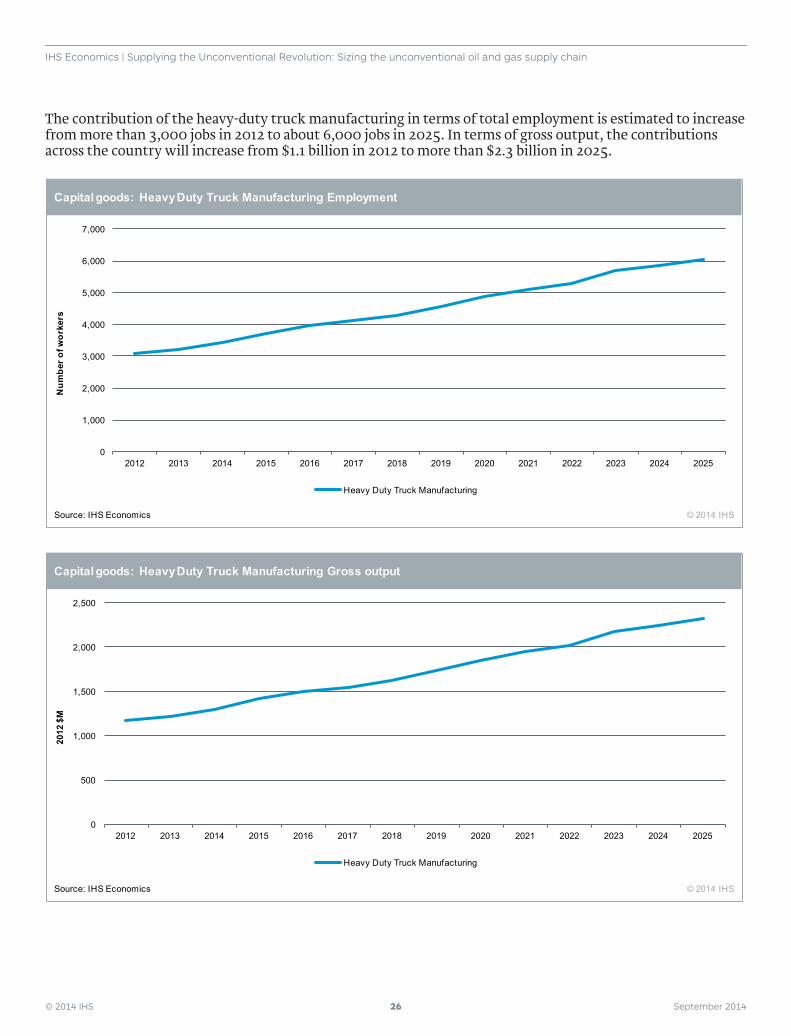
© 2014 IHS 26 September 2014
IHS Economics | Supplying the Unconventional Revolution: Sizing the unconventional oil and gas supply chain
The contribution of the heavy-duty truck manufacturing in terms of total employment is estimated to increase from more than 3,000 jobs in 2012 to about 6,000 jobs in 2025. In terms of gross output, the contributions across the country will increase from $1.1 billion in 2012 to more than $2.3 billion in 2025.
0
1,000
2,000
3,000
4,000
5,000
6,000
7,000
2012 2013 2014 2015 2016 2017 2018 2019 2020 2021 2022 2023 2024 2025
Heavy Duty Truck Manufacturing
Capital goods: Heavy Duty Truck Manufacturing Employment
Source: IHS Economics © 2014 IHS
Num
ber o
f wor
kers
0
500
1,000
1,500
2,000
2,500
2012 2013 2014 2015 2016 2017 2018 2019 2020 2021 2022 2023 2024 2025
Heavy Duty Truck Manufacturing
Capital goods: Heavy Duty Truck Manufacturing Gross output
Source: IHS Economics © 2014 IHS
2012
$M
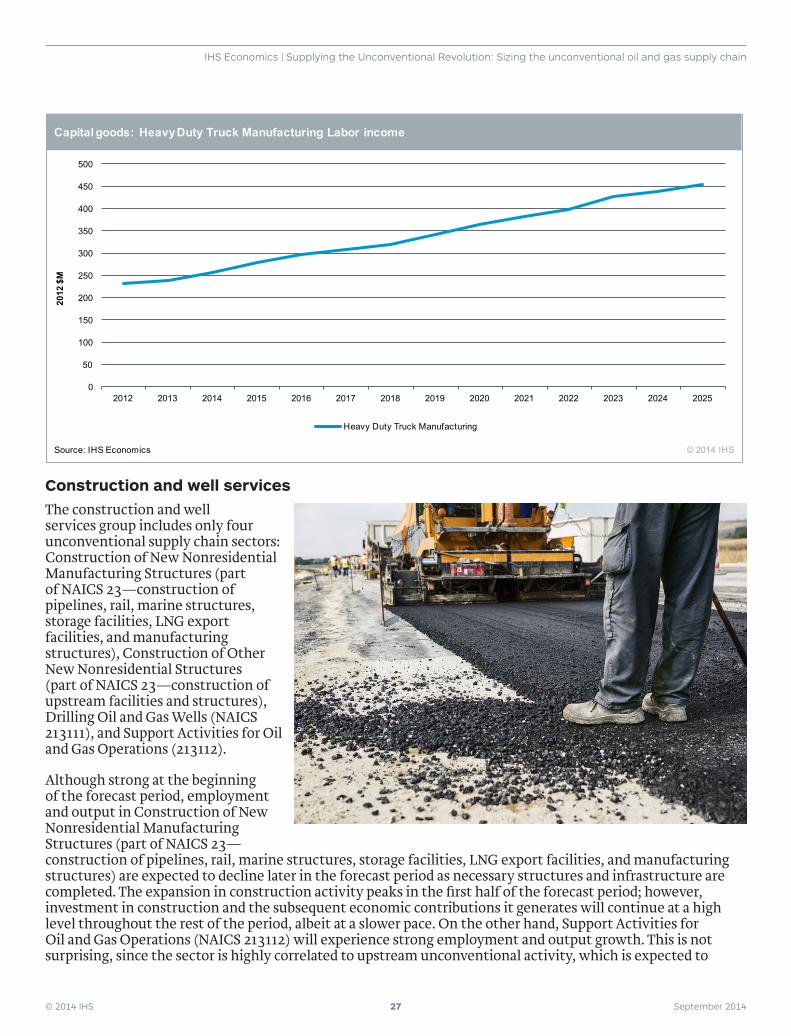
© 2014 IHS 27 September 2014
IHS Economics | Supplying the Unconventional Revolution: Sizing the unconventional oil and gas supply chain
Construction and well servicesThe construction and well services group includes only four unconventional supply chain sectors: Construction of New Nonresidential Manufacturing Structures (part of NAICS 23—construction of pipelines, rail, marine structures, storage facilities, LNG export facilities, and manufacturing structures), Construction of Other New Nonresidential Structures (part of NAICS 23—construction of upstream facilities and structures), Drilling Oil and Gas Wells (NAICS 213111), and Support Activities for Oil and Gas Operations (213112).
Although strong at the beginning of the forecast period, employment and output in Construction of New Nonresidential Manufacturing Structures (part of NAICS 23—construction of pipelines, rail, marine structures, storage facilities, LNG export facilities, and manufacturing structures) are expected to decline later in the forecast period as necessary structures and infrastructure are completed. The expansion in construction activity peaks in the first half of the forecast period; however, investment in construction and the subsequent economic contributions it generates will continue at a high level throughout the rest of the period, albeit at a slower pace. On the other hand, Support Activities for Oil and Gas Operations (NAICS 213112) will experience strong employment and output growth. This is not surprising, since the sector is highly correlated to upstream unconventional activity, which is expected to
0
50
100
150
200
250
300
350
400
450
500
2012 2013 2014 2015 2016 2017 2018 2019 2020 2021 2022 2023 2024 2025
Heavy Duty Truck Manufacturing
Capital goods: Heavy Duty Truck Manufacturing Labor income
Source: IHS Economics © 2014 IHS
2012
$M
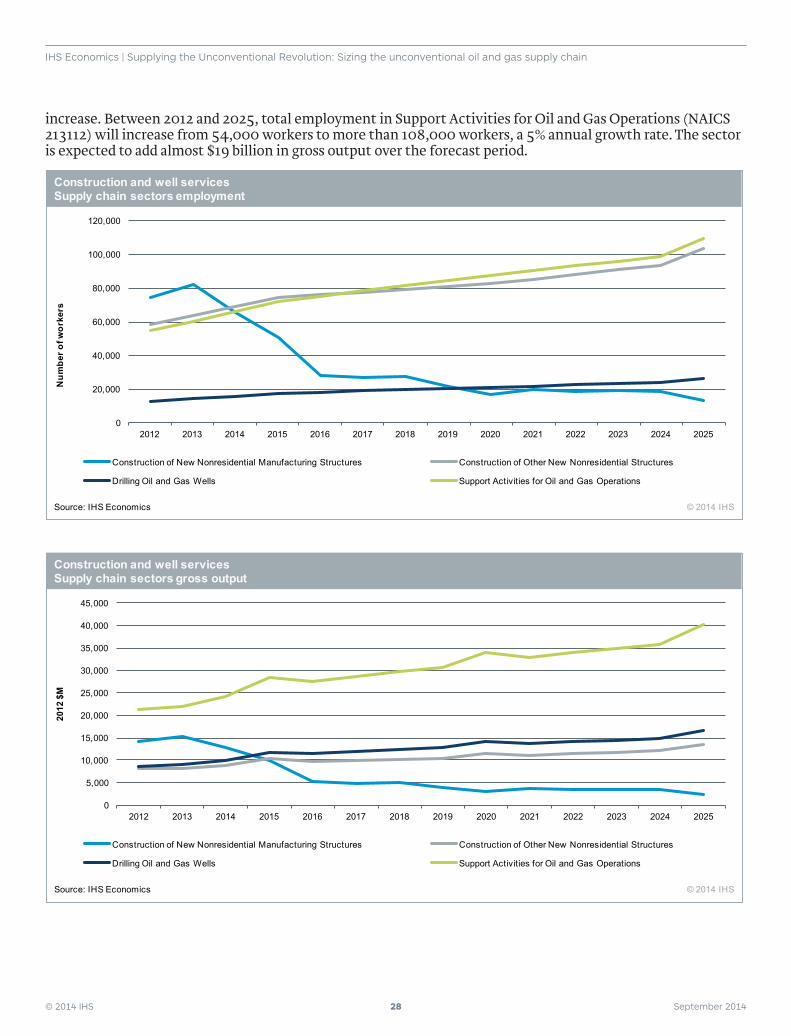
© 2014 IHS 28 September 2014
IHS Economics | Supplying the Unconventional Revolution: Sizing the unconventional oil and gas supply chain
increase. Between 2012 and 2025, total employment in Support Activities for Oil and Gas Operations (NAICS 213112) will increase from 54,000 workers to more than 108,000 workers, a 5% annual growth rate. The sector is expected to add almost $19 billion in gross output over the forecast period.
0
20,000
40,000
60,000
80,000
100,000
120,000
2012 2013 2014 2015 2016 2017 2018 2019 2020 2021 2022 2023 2024 2025
Construction of New Nonresidential Manufacturing Structures Construction of Other New Nonresidential Structures
Drilling Oil and Gas Wells Support Activities for Oil and Gas Operations
Construction and well services Supply chain sectors employment
Source: IHS Economics © 2014 IHS
Num
ber o
f wor
kers
0
5,000
10,000
15,000
20,000
25,000
30,000
35,000
40,000
45,000
2012 2013 2014 2015 2016 2017 2018 2019 2020 2021 2022 2023 2024 2025
Construction of New Nonresidential Manufacturing Structures Construction of Other New Nonresidential Structures
Drilling Oil and Gas Wells Support Activities for Oil and Gas Operations
Construction and well services Supply chain sectors gross output
Source: IHS Economics © 2014 IHS
2012
$M
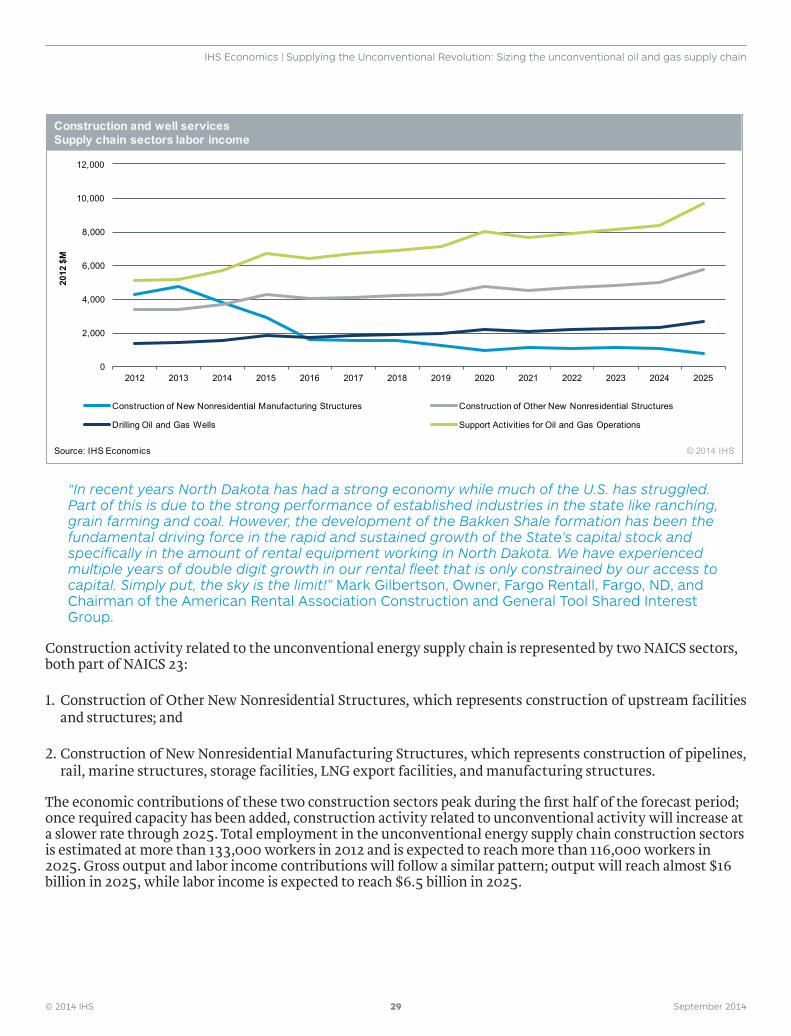
© 2014 IHS 29 September 2014
IHS Economics | Supplying the Unconventional Revolution: Sizing the unconventional oil and gas supply chain
“In recent years North Dakota has had a strong economy while much of the U.S. has struggled. Part of this is due to the strong performance of established industries in the state like ranching, grain farming and coal. However, the development of the Bakken Shale formation has been the fundamental driving force in the rapid and sustained growth of the State’s capital stock and specifically in the amount of rental equipment working in North Dakota. We have experienced multiple years of double digit growth in our rental fleet that is only constrained by our access to capital. Simply put, the sky is the limit!” Mark Gilbertson, Owner, Fargo Rentall, Fargo, ND, and Chairman of the American Rental Association Construction and General Tool Shared Interest Group.
Construction activity related to the unconventional energy supply chain is represented by two NAICS sectors, both part of NAICS 23:
1. Construction of Other New Nonresidential Structures, which represents construction of upstream facilities and structures; and
2. Construction of New Nonresidential Manufacturing Structures, which represents construction of pipelines, rail, marine structures, storage facilities, LNG export facilities, and manufacturing structures.
The economic contributions of these two construction sectors peak during the first half of the forecast period; once required capacity has been added, construction activity related to unconventional activity will increase at a slower rate through 2025. Total employment in the unconventional energy supply chain construction sectors is estimated at more than 133,000 workers in 2012 and is expected to reach more than 116,000 workers in 2025. Gross output and labor income contributions will follow a similar pattern; output will reach almost $16 billion in 2025, while labor income is expected to reach $6.5 billion in 2025.
0
2,000
4,000
6,000
8,000
10,000
12,000
2012 2013 2014 2015 2016 2017 2018 2019 2020 2021 2022 2023 2024 2025
Construction of New Nonresidential Manufacturing Structures Construction of Other New Nonresidential Structures
Drilling Oil and Gas Wells Support Activities for Oil and Gas Operations
Construction and well services Supply chain sectors labor income
Source: IHS Economics © 2014 IHS
2012
$M
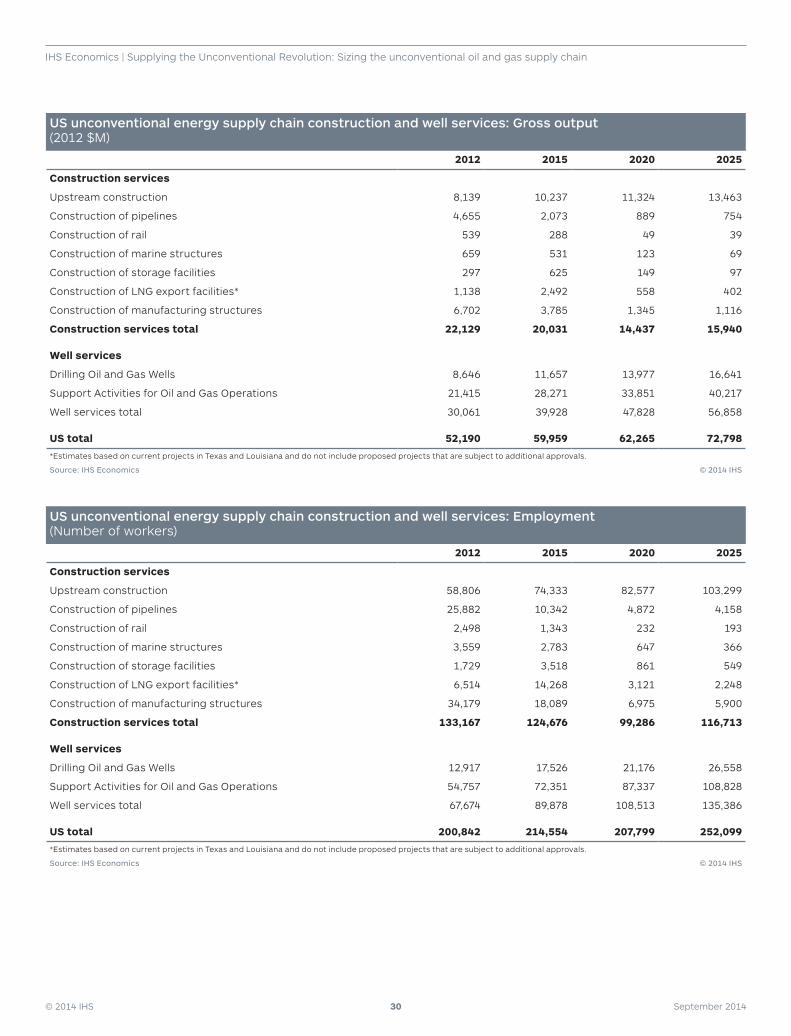
© 2014 IHS 30 September 2014
IHS Economics | Supplying the Unconventional Revolution: Sizing the unconventional oil and gas supply chain
US unconventional energy supply chain construction and well services: Gross output (2012 $M)
2012 2015 2020 2025
Construction services
Upstream construction 8,139 10,237 11,324 13,463
Construction of pipelines 4,655 2,073 889 754
Construction of rail 539 288 49 39
Construction of marine structures 659 531 123 69
Construction of storage facilities 297 625 149 97
Construction of LNG export facilities* 1,138 2,492 558 402
Construction of manufacturing structures 6,702 3,785 1,345 1,116
Construction services total 22,129 20,031 14,437 15,940
Well services
Drilling Oil and Gas Wells 8,646 11,657 13,977 16,641
Support Activities for Oil and Gas Operations 21,415 28,271 33,851 40,217
Well services total 30,061 39,928 47,828 56,858
US total 52,190 59,959 62,265 72,798
*Estimates based on current projects in Texas and Louisiana and do not include proposed projects that are subject to additional approvals.
Source: IHS Economics © 2014 IHS
US unconventional energy supply chain construction and well services: Employment (Number of workers)
2012 2015 2020 2025
Construction services
Upstream construction 58,806 74,333 82,577 103,299
Construction of pipelines 25,882 10,342 4,872 4,158
Construction of rail 2,498 1,343 232 193
Construction of marine structures 3,559 2,783 647 366
Construction of storage facilities 1,729 3,518 861 549
Construction of LNG export facilities* 6,514 14,268 3,121 2,248
Construction of manufacturing structures 34,179 18,089 6,975 5,900
Construction services total 133,167 124,676 99,286 116,713
Well services
Drilling Oil and Gas Wells 12,917 17,526 21,176 26,558
Support Activities for Oil and Gas Operations 54,757 72,351 87,337 108,828
Well services total 67,674 89,878 108,513 135,386
US total 200,842 214,554 207,799 252,099
*Estimates based on current projects in Texas and Louisiana and do not include proposed projects that are subject to additional approvals.
Source: IHS Economics © 2014 IHS
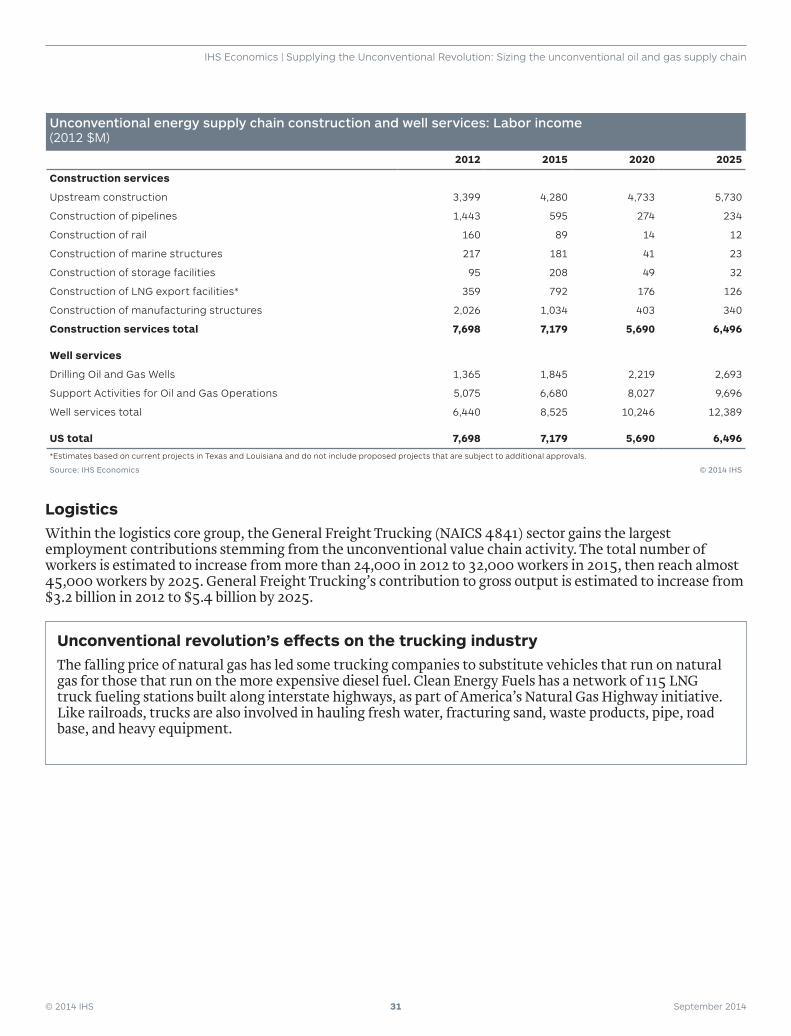
© 2014 IHS 31 September 2014
IHS Economics | Supplying the Unconventional Revolution: Sizing the unconventional oil and gas supply chain
Unconventional energy supply chain construction and well services: Labor income (2012 $M)
2012 2015 2020 2025
Construction services
Upstream construction 3,399 4,280 4,733 5,730
Construction of pipelines 1,443 595 274 234
Construction of rail 160 89 14 12
Construction of marine structures 217 181 41 23
Construction of storage facilities 95 208 49 32
Construction of LNG export facilities* 359 792 176 126
Construction of manufacturing structures 2,026 1,034 403 340
Construction services total 7,698 7,179 5,690 6,496
Well services
Drilling Oil and Gas Wells 1,365 1,845 2,219 2,693
Support Activities for Oil and Gas Operations 5,075 6,680 8,027 9,696
Well services total 6,440 8,525 10,246 12,389
US total 7,698 7,179 5,690 6,496
*Estimates based on current projects in Texas and Louisiana and do not include proposed projects that are subject to additional approvals.
Source: IHS Economics © 2014 IHS
LogisticsWithin the logistics core group, the General Freight Trucking (NAICS 4841) sector gains the largest employment contributions stemming from the unconventional value chain activity. The total number of workers is estimated to increase from more than 24,000 in 2012 to 32,000 workers in 2015, then reach almost 45,000 workers by 2025. General Freight Trucking’s contribution to gross output is estimated to increase from $3.2 billion in 2012 to $5.4 billion by 2025.
Unconventional revolution’s effects on the trucking industryThe falling price of natural gas has led some trucking companies to substitute vehicles that run on natural gas for those that run on the more expensive diesel fuel. Clean Energy Fuels has a network of 115 LNG truck fueling stations built along interstate highways, as part of America’s Natural Gas Highway initiative. Like railroads, trucks are also involved in hauling fresh water, fracturing sand, waste products, pipe, road base, and heavy equipment.
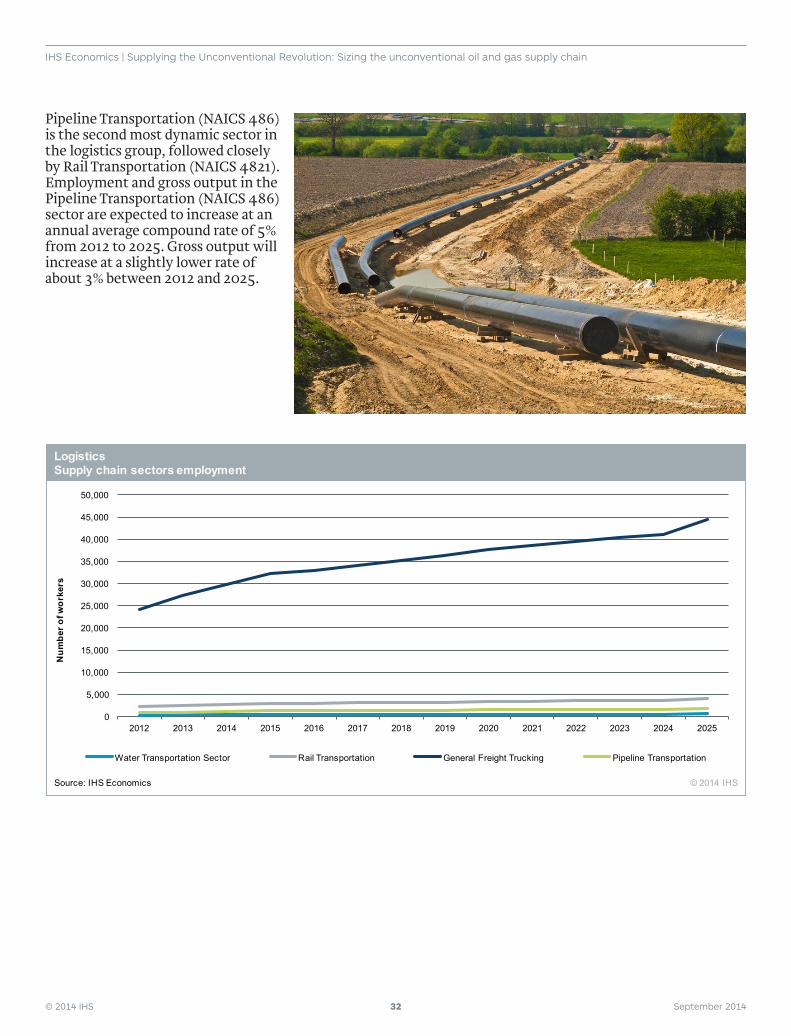
© 2014 IHS 32 September 2014
IHS Economics | Supplying the Unconventional Revolution: Sizing the unconventional oil and gas supply chain
Pipeline Transportation (NAICS 486) is the second most dynamic sector in the logistics group, followed closely by Rail Transportation (NAICS 4821). Employment and gross output in the Pipeline Transportation (NAICS 486) sector are expected to increase at an annual average compound rate of 5% from 2012 to 2025. Gross output will increase at a slightly lower rate of about 3% between 2012 and 2025.
0
5,000
10,000
15,000
20,000
25,000
30,000
35,000
40,000
45,000
50,000
2012 2013 2014 2015 2016 2017 2018 2019 2020 2021 2022 2023 2024 2025
Water Transportation Sector Rail Transportation General Freight Trucking Pipeline Transportation
Logistics Supply chain sectors employment
Source: IHS Economics © 2014 IHS
Num
ber o
f wor
kers
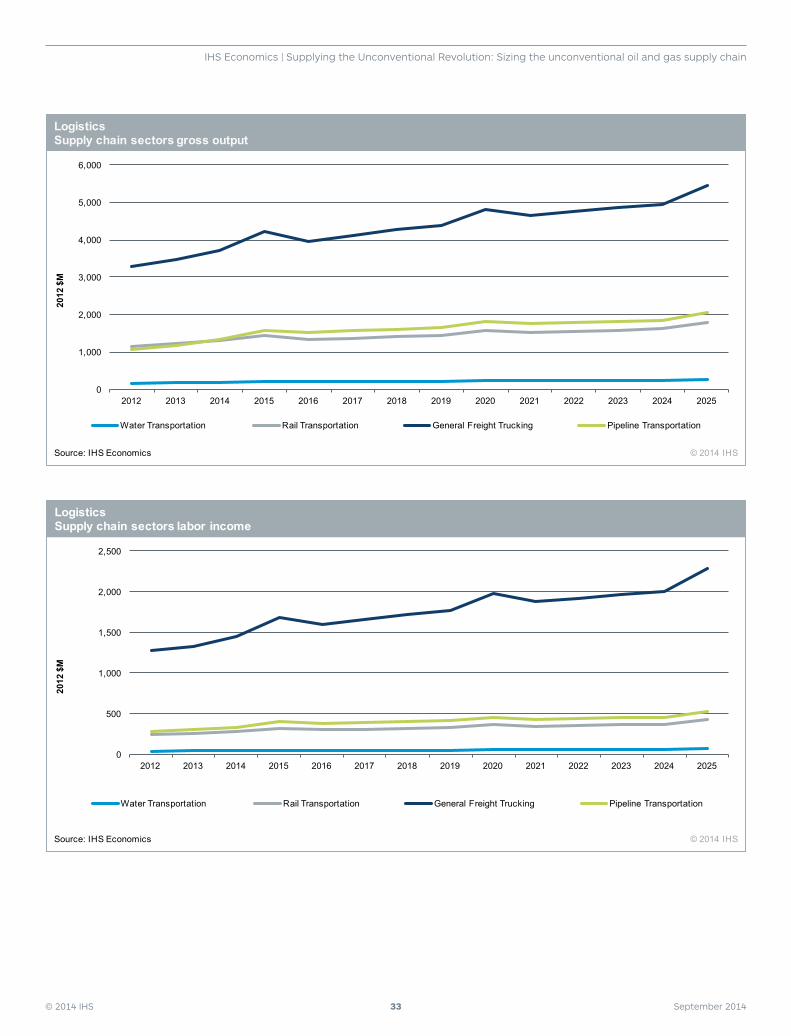
© 2014 IHS 33 September 2014
IHS Economics | Supplying the Unconventional Revolution: Sizing the unconventional oil and gas supply chain
0
1,000
2,000
3,000
4,000
5,000
6,000
2012 2013 2014 2015 2016 2017 2018 2019 2020 2021 2022 2023 2024 2025
Water Transportation Rail Transportation General Freight Trucking Pipeline Transportation
Logistics Supply chain sectors gross output
Source: IHS Economics © 2014 IHS
2012
$M
0
500
1,000
1,500
2,000
2,500
2012 2013 2014 2015 2016 2017 2018 2019 2020 2021 2022 2023 2024 2025
Water Transportation Rail Transportation General Freight Trucking Pipeline Transportation
Source: IHS Economics © 2014 IHS
2012
$M
Logistics Supply chain sectors labor income
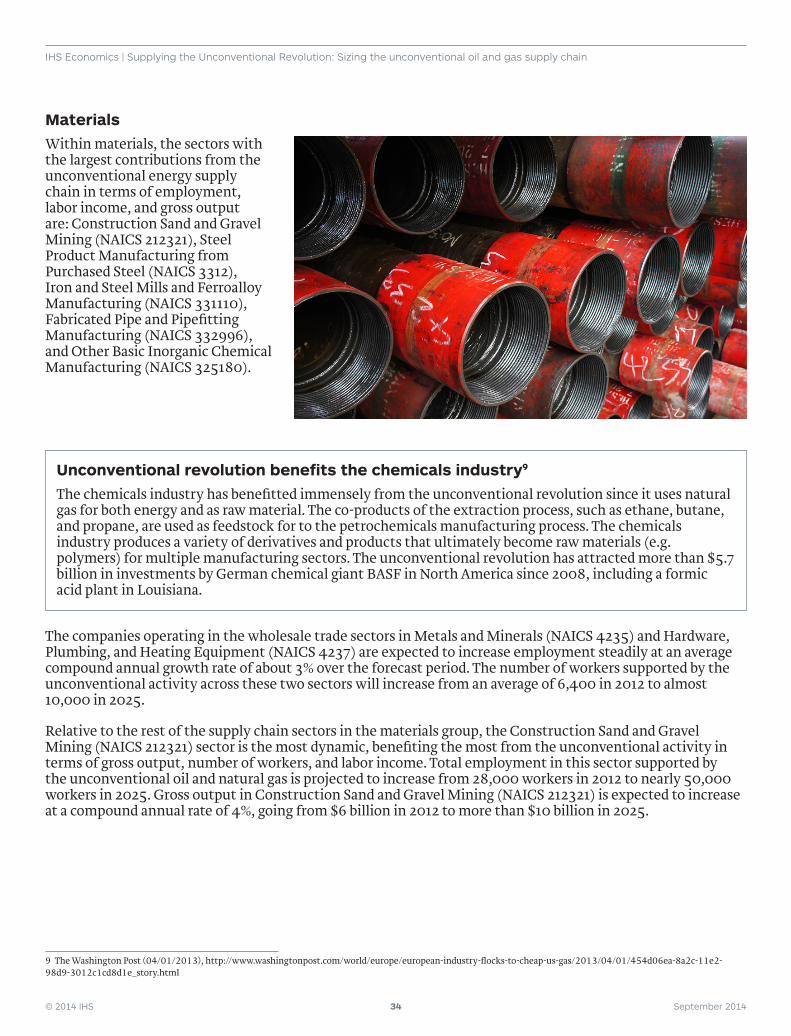
© 2014 IHS 34 September 2014
IHS Economics | Supplying the Unconventional Revolution: Sizing the unconventional oil and gas supply chain
MaterialsWithin materials, the sectors with the largest contributions from the unconventional energy supply chain in terms of employment, labor income, and gross output are: Construction Sand and Gravel Mining (NAICS 212321), Steel Product Manufacturing from Purchased Steel (NAICS 3312), Iron and Steel Mills and Ferroalloy Manufacturing (NAICS 331110), Fabricated Pipe and Pipefitting Manufacturing (NAICS 332996), and Other Basic Inorganic Chemical Manufacturing (NAICS 325180).
Unconventional revolution benefits the chemicals industry9
The chemicals industry has benefitted immensely from the unconventional revolution since it uses natural gas for both energy and as raw material. The co-products of the extraction process, such as ethane, butane, and propane, are used as feedstock for to the petrochemicals manufacturing process. The chemicals industry produces a variety of derivatives and products that ultimately become raw materials (e.g. polymers) for multiple manufacturing sectors. The unconventional revolution has attracted more than $5.7 billion in investments by German chemical giant BASF in North America since 2008, including a formic acid plant in Louisiana.
The companies operating in the wholesale trade sectors in Metals and Minerals (NAICS 4235) and Hardware, Plumbing, and Heating Equipment (NAICS 4237) are expected to increase employment steadily at an average compound annual growth rate of about 3% over the forecast period. The number of workers supported by the unconventional activity across these two sectors will increase from an average of 6,400 in 2012 to almost 10,000 in 2025.
Relative to the rest of the supply chain sectors in the materials group, the Construction Sand and Gravel Mining (NAICS 212321) sector is the most dynamic, benefiting the most from the unconventional activity in terms of gross output, number of workers, and labor income. Total employment in this sector supported by the unconventional oil and natural gas is projected to increase from 28,000 workers in 2012 to nearly 50,000 workers in 2025. Gross output in Construction Sand and Gravel Mining (NAICS 212321) is expected to increase at a compound annual rate of 4%, going from $6 billion in 2012 to more than $10 billion in 2025.
9 The Washington Post (04/01/2013), http://www.washingtonpost.com/world/europe/european-industry-flocks-to-cheap-us-gas/2013/04/01/454d06ea-8a2c-11e2-98d9-3012c1cd8d1e_story.html
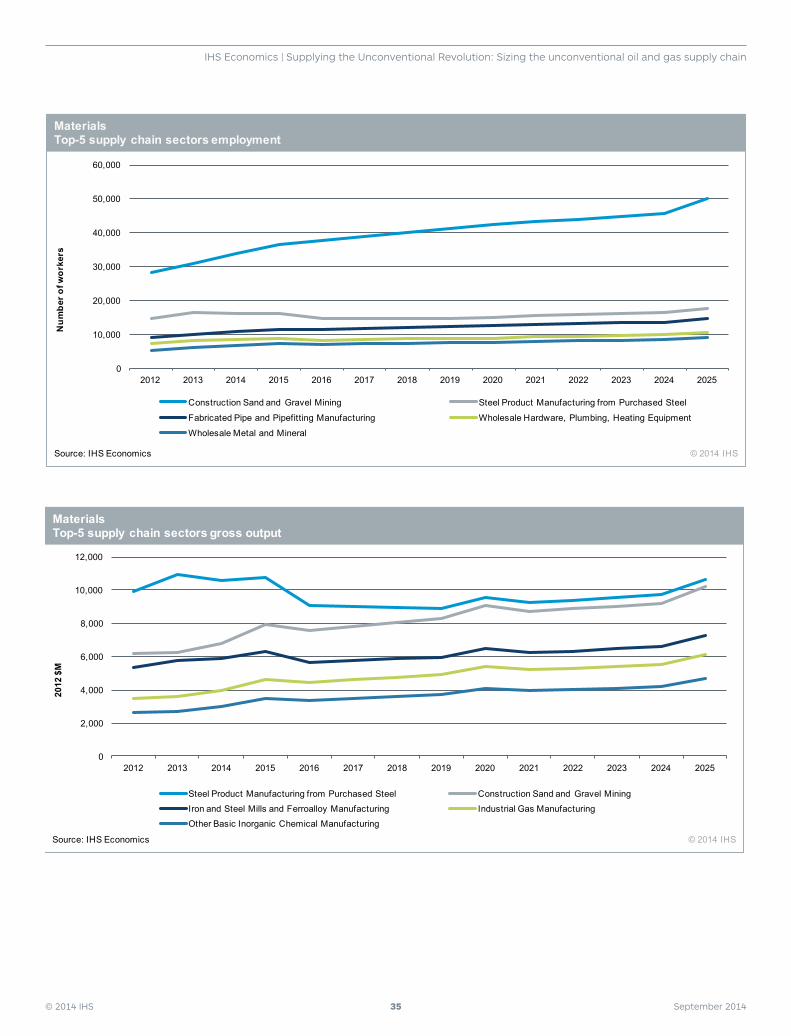
© 2014 IHS 35 September 2014
IHS Economics | Supplying the Unconventional Revolution: Sizing the unconventional oil and gas supply chain
0
10,000
20,000
30,000
40,000
50,000
60,000
2012 2013 2014 2015 2016 2017 2018 2019 2020 2021 2022 2023 2024 2025
Construction Sand and Gravel Mining Steel Product Manufacturing from Purchased Steel
Fabricated Pipe and Pipefitting Manufacturing Wholesale Hardware, Plumbing, Heating Equipment
Wholesale Metal and Mineral
Materials Top-5 supply chain sectors employment
Source: IHS Economics © 2014 IHS
Num
ber o
f wor
kers
0
2,000
4,000
6,000
8,000
10,000
12,000
2012 2013 2014 2015 2016 2017 2018 2019 2020 2021 2022 2023 2024 2025
Steel Product Manufacturing from Purchased Steel Construction Sand and Gravel Mining
Iron and Steel Mills and Ferroalloy Manufacturing Industrial Gas Manufacturing
Other Basic Inorganic Chemical Manufacturing
Source: IHS Economics © 2014 IHS
2012
$M
Materials Top-5 supply chain sectors gross output
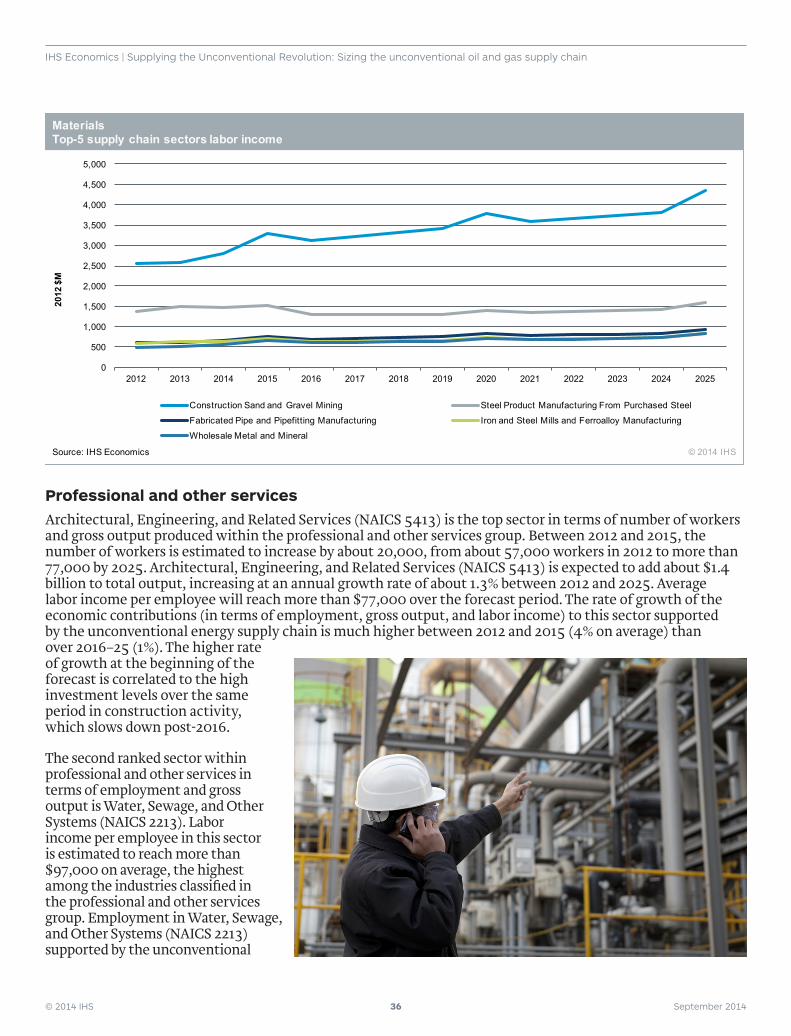
© 2014 IHS 36 September 2014
IHS Economics | Supplying the Unconventional Revolution: Sizing the unconventional oil and gas supply chain
Professional and other servicesArchitectural, Engineering, and Related Services (NAICS 5413) is the top sector in terms of number of workers and gross output produced within the professional and other services group. Between 2012 and 2015, the number of workers is estimated to increase by about 20,000, from about 57,000 workers in 2012 to more than 77,000 by 2025. Architectural, Engineering, and Related Services (NAICS 5413) is expected to add about $1.4 billion to total output, increasing at an annual growth rate of about 1.3% between 2012 and 2025. Average labor income per employee will reach more than $77,000 over the forecast period. The rate of growth of the economic contributions (in terms of employment, gross output, and labor income) to this sector supported by the unconventional energy supply chain is much higher between 2012 and 2015 (4% on average) than over 2016–25 (1%). The higher rate of growth at the beginning of the forecast is correlated to the high investment levels over the same period in construction activity, which slows down post-2016.
The second ranked sector within professional and other services in terms of employment and gross output is Water, Sewage, and Other Systems (NAICS 2213). Labor income per employee in this sector is estimated to reach more than $97,000 on average, the highest among the industries classified in the professional and other services group. Employment in Water, Sewage, and Other Systems (NAICS 2213) supported by the unconventional
0
500
1,000
1,500
2,000
2,500
3,000
3,500
4,000
4,500
5,000
2012 2013 2014 2015 2016 2017 2018 2019 2020 2021 2022 2023 2024 2025
Construction Sand and Gravel Mining Steel Product Manufacturing From Purchased Steel
Fabricated Pipe and Pipefitting Manufacturing Iron and Steel Mills and Ferroalloy Manufacturing
Wholesale Metal and Mineral
Materials Top-5 supply chain sectors labor income
Source: IHS Economics © 2014 IHS
2012
$M
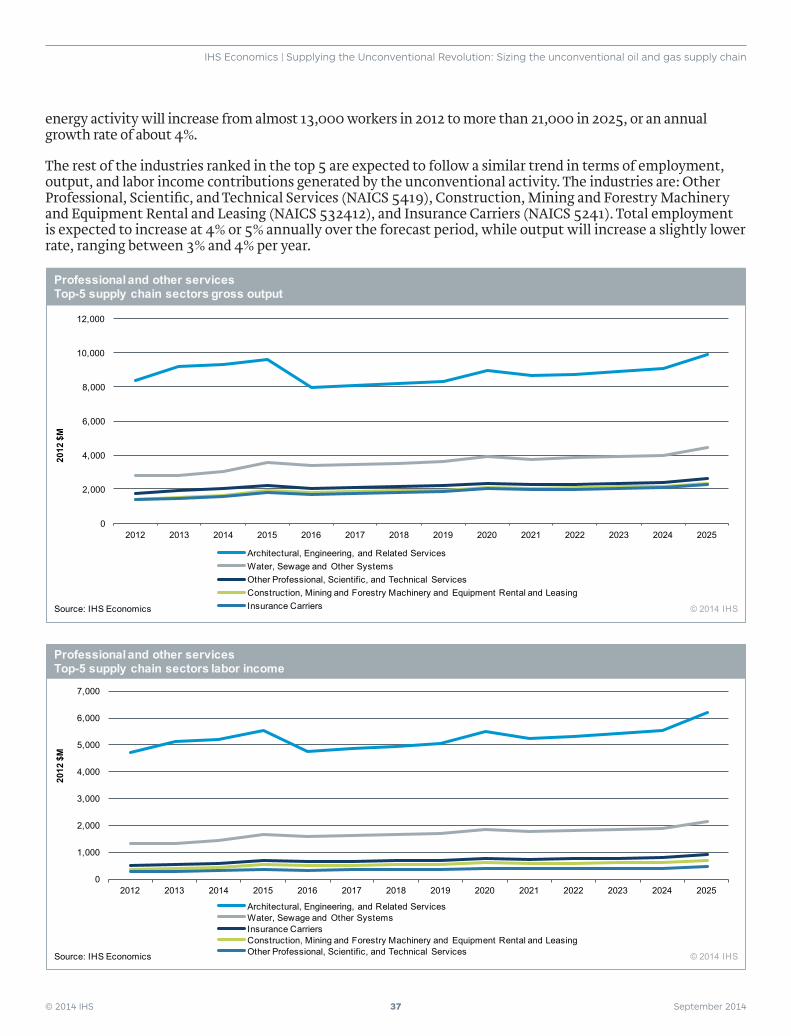
© 2014 IHS 37 September 2014
IHS Economics | Supplying the Unconventional Revolution: Sizing the unconventional oil and gas supply chain
energy activity will increase from almost 13,000 workers in 2012 to more than 21,000 in 2025, or an annual growth rate of about 4%.
The rest of the industries ranked in the top 5 are expected to follow a similar trend in terms of employment, output, and labor income contributions generated by the unconventional activity. The industries are: Other Professional, Scientific, and Technical Services (NAICS 5419), Construction, Mining and Forestry Machinery and Equipment Rental and Leasing (NAICS 532412), and Insurance Carriers (NAICS 5241). Total employment is expected to increase at 4% or 5% annually over the forecast period, while output will increase a slightly lower rate, ranging between 3% and 4% per year.
0
2,000
4,000
6,000
8,000
10,000
12,000
2012 2013 2014 2015 2016 2017 2018 2019 2020 2021 2022 2023 2024 2025
Architectural, Engineering, and Related ServicesWater, Sewage and Other Systems Other Professional, Scientific, and Technical ServicesConstruction, Mining and Forestry Machinery and Equipment Rental and LeasingInsurance Carriers
Professional and other services Top-5 supply chain sectors gross output
Source: IHS Economics © 2014 IHS
2012
$M
0
1,000
2,000
3,000
4,000
5,000
6,000
7,000
2012 2013 2014 2015 2016 2017 2018 2019 2020 2021 2022 2023 2024 2025
Architectural, Engineering, and Related ServicesWater, Sewage and Other Systems Insurance CarriersConstruction, Mining and Forestry Machinery and Equipment Rental and LeasingOther Professional, Scientific, and Technical Services
Professional and other services Top-5 supply chain sectors labor income
Source: IHS Economics © 2014 IHS
2012
$M
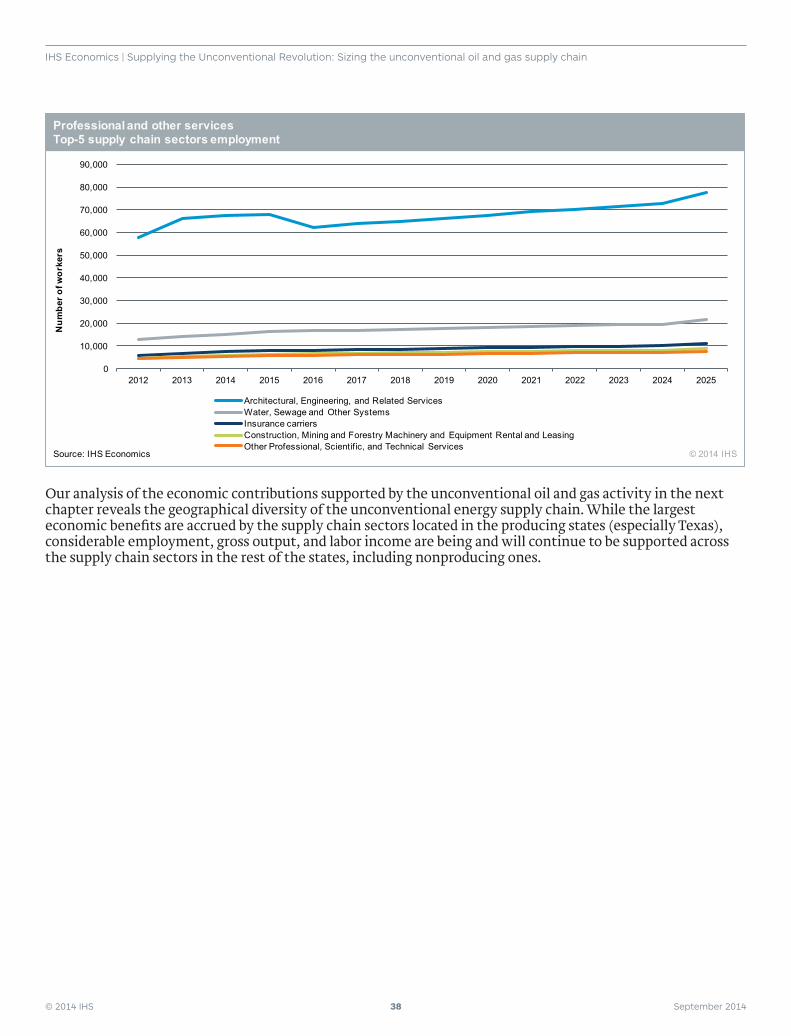
© 2014 IHS 38 September 2014
IHS Economics | Supplying the Unconventional Revolution: Sizing the unconventional oil and gas supply chain
Our analysis of the economic contributions supported by the unconventional oil and gas activity in the next chapter reveals the geographical diversity of the unconventional energy supply chain. While the largest economic benefits are accrued by the supply chain sectors located in the producing states (especially Texas), considerable employment, gross output, and labor income are being and will continue to be supported across the supply chain sectors in the rest of the states, including nonproducing ones.
0
10,000
20,000
30,000
40,000
50,000
60,000
70,000
80,000
90,000
2012 2013 2014 2015 2016 2017 2018 2019 2020 2021 2022 2023 2024 2025
Architectural, Engineering, and Related ServicesWater, Sewage and Other Systems Insurance carriersConstruction, Mining and Forestry Machinery and Equipment Rental and LeasingOther Professional, Scientific, and Technical Services
Professional and other services Top-5 supply chain sectors employment
Source: IHS Economics © 2014 IHS
Num
ber o
f wor
kers
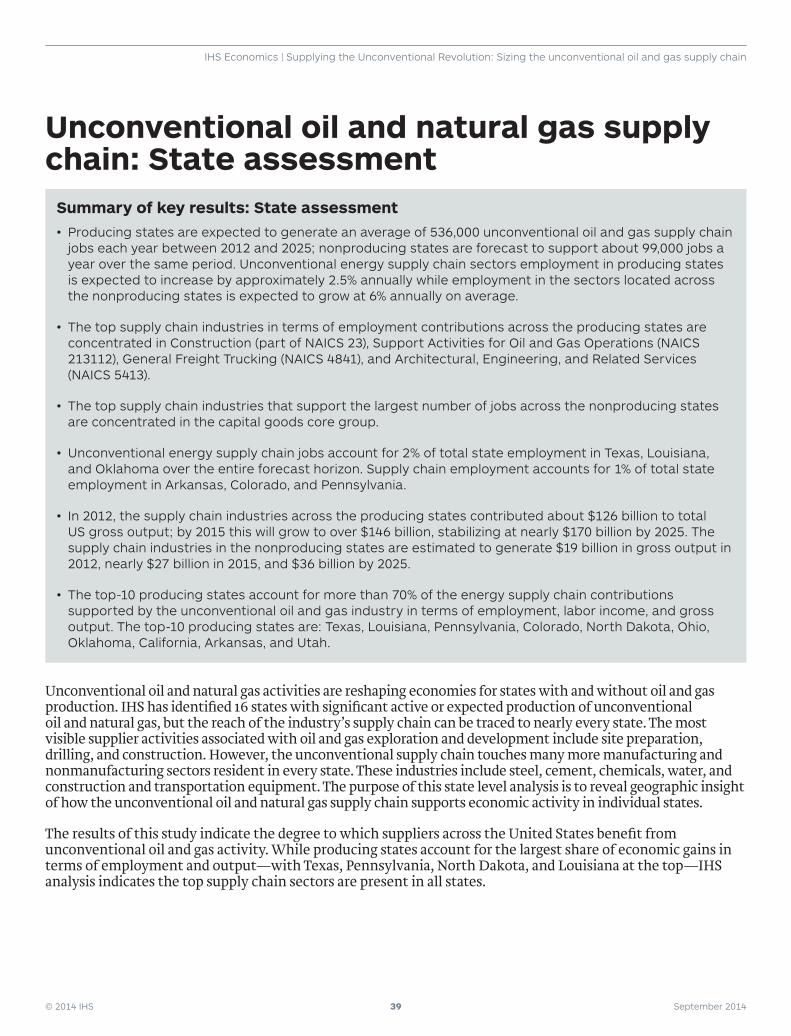
© 2014 IHS 39 September 2014
IHS Economics | Supplying the Unconventional Revolution: Sizing the unconventional oil and gas supply chain
Unconventional oil and natural gas supply chain: State assessment
Unconventional oil and natural gas activities are reshaping economies for states with and without oil and gas production. IHS has identified 16 states with significant active or expected production of unconventional oil and natural gas, but the reach of the industry’s supply chain can be traced to nearly every state. The most visible supplier activities associated with oil and gas exploration and development include site preparation, drilling, and construction. However, the unconventional supply chain touches many more manufacturing and nonmanufacturing sectors resident in every state. These industries include steel, cement, chemicals, water, and construction and transportation equipment. The purpose of this state level analysis is to reveal geographic insight of how the unconventional oil and natural gas supply chain supports economic activity in individual states.
The results of this study indicate the degree to which suppliers across the United States benefit from unconventional oil and gas activity. While producing states account for the largest share of economic gains in terms of employment and output—with Texas, Pennsylvania, North Dakota, and Louisiana at the top—IHS analysis indicates the top supply chain sectors are present in all states.
Summary of key results: State assessment• Producing states are expected to generate an average of 536,000 unconventional oil and gas supply chain
jobs each year between 2012 and 2025; nonproducing states are forecast to support about 99,000 jobs a year over the same period. Unconventional energy supply chain sectors employment in producing states is expected to increase by approximately 2.5% annually while employment in the sectors located across the nonproducing states is expected to grow at 6% annually on average.
• The top supply chain industries in terms of employment contributions across the producing states are concentrated in Construction (part of NAICS 23), Support Activities for Oil and Gas Operations (NAICS 213112), General Freight Trucking (NAICS 4841), and Architectural, Engineering, and Related Services (NAICS 5413).
• The top supply chain industries that support the largest number of jobs across the nonproducing states are concentrated in the capital goods core group.
• Unconventional energy supply chain jobs account for 2% of total state employment in Texas, Louisiana, and Oklahoma over the entire forecast horizon. Supply chain employment accounts for 1% of total state employment in Arkansas, Colorado, and Pennsylvania.
• In 2012, the supply chain industries across the producing states contributed about $126 billion to total US gross output; by 2015 this will grow to over $146 billion, stabilizing at nearly $170 billion by 2025. The supply chain industries in the nonproducing states are estimated to generate $19 billion in gross output in 2012, nearly $27 billion in 2015, and $36 billion by 2025.
• The top-10 producing states account for more than 70% of the energy supply chain contributions supported by the unconventional oil and gas industry in terms of employment, labor income, and gross output. The top-10 producing states are: Texas, Louisiana, Pennsylvania, Colorado, North Dakota, Ohio, Oklahoma, California, Arkansas, and Utah.
© 2014 IHS 40 September 2014
IHS Economics | Supplying the Unconventional Revolution: Sizing the unconventional oil and gas supply chain
StructureThe first part of this section compares the overall economies of the producing states against nonproducing states. Historical employment and output trends in the US economy were analyzed to understand the rapid growth of unconventional activity and to demonstrate the effect of its emerging potency since the Great Recession. IHS forecasts sustained growth of the industries identified as components of the supply chain a decade into the future.
The second part of this section traces the supply chain components to producing and nonproducing states and identifies historical and future trends in growth. Our analysis shows that while the supply chain economic contributions tend to be concentrated across the producing states, the nonproducing states also benefit. For instance, across nonproducing states, the largest contributions to the supply chain are service sectors, such as engineering and wholesale trade, which exist primarily across the southern and northeastern states. Furthermore, most of the supply chain contributions across the Midwestern nonproducing states are concentrated in the construction, transportation equipment, and equipment manufacturing sectors. The largest contributions to the supply chain sectors across the producing states are concentrated in the construction sector and support activities for oil and gas operations, followed by professional services and rail and truck transportation services.
The third part of this section breaks out state-level snapshots of employment and output for six key states integral to the unconventional supply chain. This section compares employment contributed by unconventional activities against total state employment, putting the reach of unconventional activities in perspective for each state.
Methodology A two-step approach was employed to analyze the state-level contributions of unconventional oil and gas activity to the supply chain industries. First, IHS Energy estimated future investment and production in unconventional oil and gas plays across US states. In IHS’s America’s New Energy Future series, the direct contributions of the upstream and midstream unconventional oil and gas related activities were captured in terms of operating expenditures and capital expenditures at the state level. The next step required IHS Economics to use a system of inter-industry linkages, based on the IMPLAN modeling framework, to evaluate the impacts generated by the production and capital spending at the state level. This detailed information was used as an input to our customized proprietary modeling framework, tracing a complete account of how the unconventional activity extends to supporting industries located across US states. The following upstream and midstream sector activities were determined to be the major contributors to unconventional supply chain economic activity:
•Oil and natural gas extraction
•Oil and natural gas drilling
•Support activities for oil and natural gas
•Construction of facilities, related technology for hydraulic fracturing and completions, and construction of pipeline
The economic impacts on the unconventional supply chain industries are measured in terms of jobs created or sustained, gross output contribution, and employee wages and other compensation.
© 2014 IHS 41 September 2014
IHS Economics | Supplying the Unconventional Revolution: Sizing the unconventional oil and gas supply chain
Producing vs. nonproducing statesThis analysis was undertaken on a state-by-state basis. First, we present top-line results by producing and nonproducing states. Then, we present the results for each of the top-10 producing and top-10 nonproducing states. More detailed results are presented in the appendices.
Each state was placed into one of the two following categories:
1. Producing states have current, emerging, or forecasted production of unconventional oil and natural gas
2. Nonproducing states do not have substantial current or prospective production of unconventional oil and gas.
Producing states are defined as those that are part of the 20 largest unconventional oil and natural gas producing plays in the US Lower 48, such as the Bakken and Marcellus shale plays. Producing states also include those that are part of an emerging oil or natural gas play that is expected to have sizeable unconventional oil and/or natural gas production in the forecast horizon. The 16 producing states are Arkansas, California, Colorado, Kansas, Louisiana, Mississippi, Montana, New Mexico, North Dakota, Ohio, Oklahoma, Pennsylvania, Texas, Utah, West Virginia, and Wyoming.
Nonproducing states are not part of the 20 largest unconventional oil and natural gas producing plays in the US Lower 48 and are not part of an emerging oil or natural gas play in the 2012 to 2025 forecast horizon. These states may be part of plays that are currently producing oil and/or natural gas, but nevertheless are classified as a nonproducing state because current production is relatively small and the prospect for future unconventional production is unknown. The 32 nonproducing states are Alabama, Arizona, Connecticut, Delaware, Florida, Georgia, Idaho, Illinois, Indiana, Iowa, Kentucky, Maine, Maryland, Massachusetts, Michigan, Minnesota, Missouri, Nebraska, Nevada, New Hampshire, New Jersey, New York, North Carolina, Oregon, Rhode Island, South Carolina, South Dakota, Tennessee, Vermont, Virginia, Washington, and Wisconsin. Some of these, such as Illinois, Indiana, Michigan and New York may over time move into the producing states category.
Both sets of states will benefit from the unconventional oil and gas supply chain either directly through new well drilling and completion, unconventional oil and gas production, and spending on capital equipment and commodities or indirectly through the strong support sectors that contribute to the expansive unconventional oil and gas supply chain.
The economic benefits—in terms of employment, labor income, and government revenue—as a result of the unconventional oil and gas supply chain are presented by producing and nonproducing states below.
Employment contributionsUnconventional activity will benefit supply chain sectors across the United States. Our analysis shows that while the supply chain economic contributions tend to be concentrated across the producing states, the rest of the states also benefit. For instance, across the nonproducing states, the largest contributions to the supply chain service sectors, such as engineering and wholesale trade, are estimated to occur primarily across the southern and northeastern states. Furthermore, most of the supply chain contributions across the Midwestern nonproducing states are concentrated in the construction, transportation, and equipment manufacturing sectors. The largest contributions to the supply chain sectors across the producing states are concentrated in the construction sector and support activities for oil and gas operations, followed by professional and rail and truck transportation services.
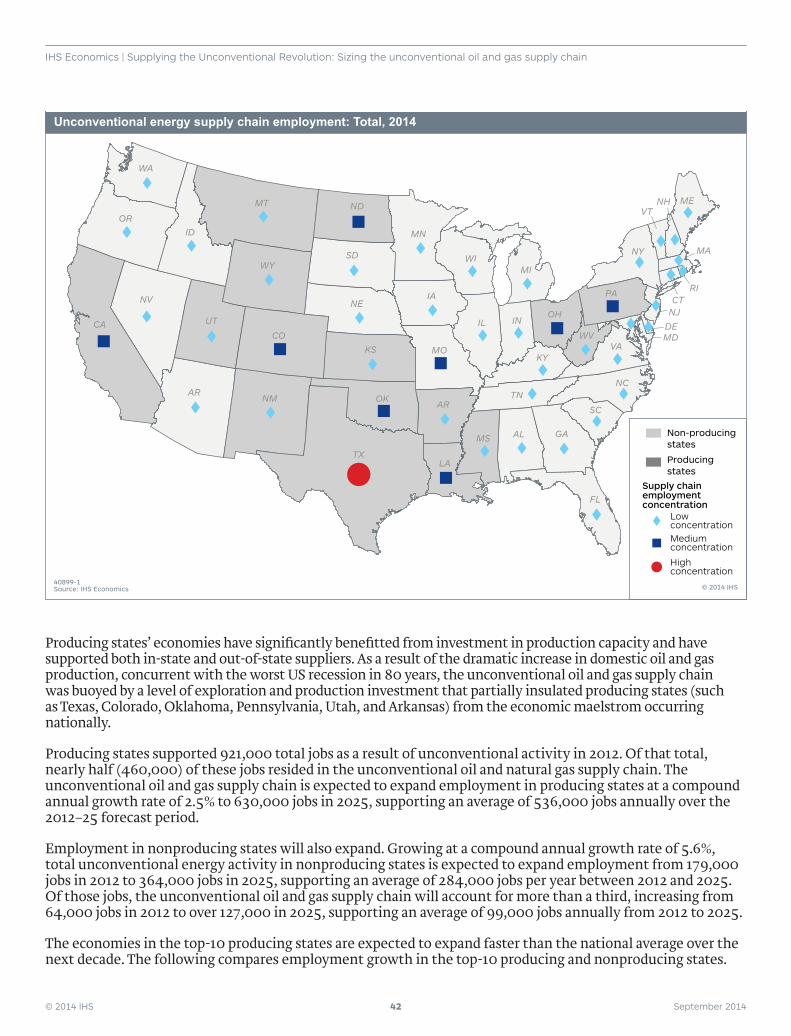
© 2014 IHS 42 September 2014
IHS Economics | Supplying the Unconventional Revolution: Sizing the unconventional oil and gas supply chain
Producing states’ economies have significantly benefitted from investment in production capacity and have supported both in-state and out-of-state suppliers. As a result of the dramatic increase in domestic oil and gas production, concurrent with the worst US recession in 80 years, the unconventional oil and gas supply chain was buoyed by a level of exploration and production investment that partially insulated producing states (such as Texas, Colorado, Oklahoma, Pennsylvania, Utah, and Arkansas) from the economic maelstrom occurring nationally.
Producing states supported 921,000 total jobs as a result of unconventional activity in 2012. Of that total, nearly half (460,000) of these jobs resided in the unconventional oil and natural gas supply chain. The unconventional oil and gas supply chain is expected to expand employment in producing states at a compound annual growth rate of 2.5% to 630,000 jobs in 2025, supporting an average of 536,000 jobs annually over the 2012–25 forecast period.
Employment in nonproducing states will also expand. Growing at a compound annual growth rate of 5.6%, total unconventional energy activity in nonproducing states is expected to expand employment from 179,000 jobs in 2012 to 364,000 jobs in 2025, supporting an average of 284,000 jobs per year between 2012 and 2025. Of those jobs, the unconventional oil and gas supply chain will account for more than a third, increasing from 64,000 jobs in 2012 to over 127,000 in 2025, supporting an average of 99,000 jobs annually from 2012 to 2025.
The economies in the top-10 producing states are expected to expand faster than the national average over the next decade. The following compares employment growth in the top-10 producing and nonproducing states.
CA
NV
OR
WA
MT
ID
ND
NE
KS
OK
SDWY
CO
UT
ARNM
TX
MN
MI
IA
MO
AR
WI
LA
MS AL GA
SC
NC
VAWV
TN
KY
OH
PA
NY MA
RICTNJDEMD
MENHVT
INIL
FL
Highconcentration
Mediumconcentration
Supply chainemploymentconcentration
Lowconcentration
Producingstates
Non-producingstates
© 2014 IHS40899-1Source: IHS Economics
Unconventional energy supply chain employment: Total, 2014

© 2014 IHS 43 September 2014
IHS Economics | Supplying the Unconventional Revolution: Sizing the unconventional oil and gas supply chain
•Unconventional supply chain employment in the top-10 producing states is expected to increase at a compound annual growth rate of 2.7% from 2012 through 2025, faster than the overall IHS state employment forecast of 1.3 % for those states.
•Unconventional supply chain employment contributions in Ohio and Oklahoma are expanding at a compound annual growth rate of 9% and 7%, respectively, well above their average state employment growth rate.
•The unconventional supply chain is expected to contribute about 2.5% employment growth, on average, across the top-10 producing states. The compound annual growth rate for unconventional supply chain employment in producing states is expected to grow faster than the overall IHS US employment growth forecast of 1.1% for the 2012–25.
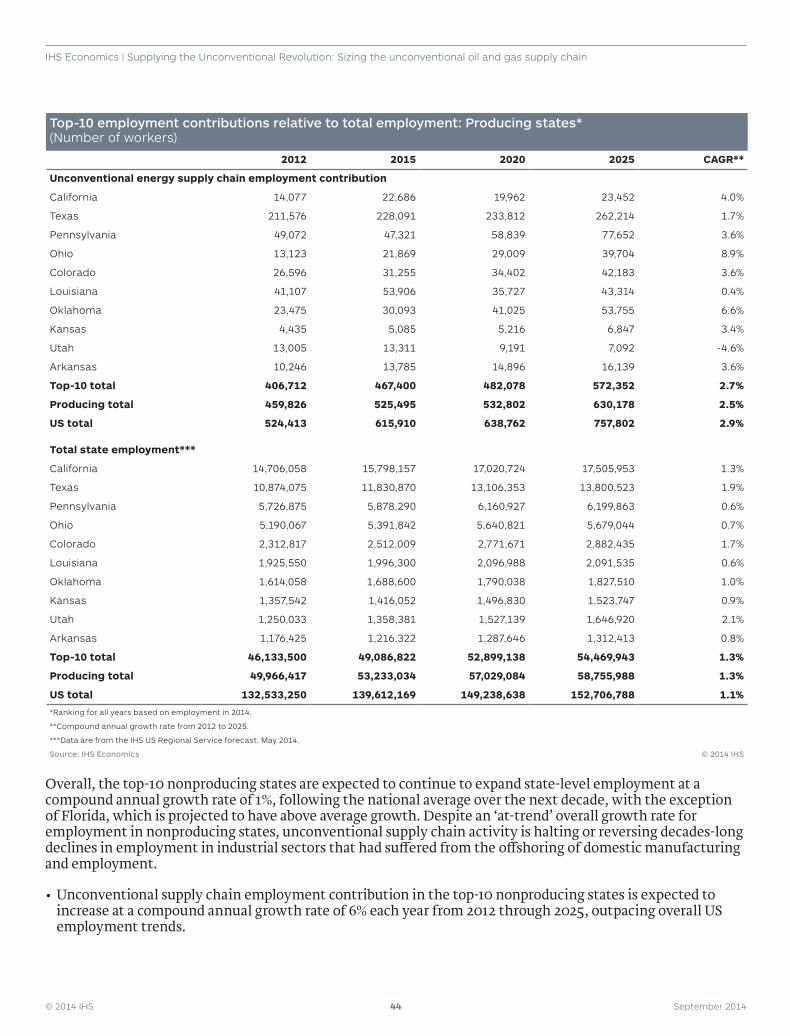
© 2014 IHS 44 September 2014
IHS Economics | Supplying the Unconventional Revolution: Sizing the unconventional oil and gas supply chain
Top-10 employment contributions relative to total employment: Producing states* (Number of workers)
2012 2015 2020 2025 CAGR**
Unconventional energy supply chain employment contribution
California 14,077 22,686 19,962 23,452 4.0%
Texas 211,576 228,091 233,812 262,214 1.7%
Pennsylvania 49,072 47,321 58,839 77,652 3.6%
Ohio 13,123 21,869 29,009 39,704 8.9%
Colorado 26,596 31,255 34,402 42,183 3.6%
Louisiana 41,107 53,906 35,727 43,314 0.4%
Oklahoma 23,475 30,093 41,025 53,755 6.6%
Kansas 4,435 5,085 5,216 6,847 3.4%
Utah 13,005 13,311 9,191 7,092 -4.6%
Arkansas 10,246 13,785 14,896 16,139 3.6%
Top-10 total 406,712 467,400 482,078 572,352 2.7%
Producing total 459,826 525,495 532,802 630,178 2.5%
US total 524,413 615,910 638,762 757,802 2.9%
Total state employment***
California 14,706,058 15,798,157 17,020,724 17,505,953 1.3%
Texas 10,874,075 11,830,870 13,106,353 13,800,523 1.9%
Pennsylvania 5,726,875 5,878,290 6,160,927 6,199,863 0.6%
Ohio 5,190,067 5,391,842 5,640,821 5,679,044 0.7%
Colorado 2,312,817 2,512,009 2,771,671 2,882,435 1.7%
Louisiana 1,925,550 1,996,300 2,096,988 2,091,535 0.6%
Oklahoma 1,614,058 1,688,600 1,790,038 1,827,510 1.0%
Kansas 1,357,542 1,416,052 1,496,830 1,523,747 0.9%
Utah 1,250,033 1,358,381 1,527,139 1,646,920 2.1%
Arkansas 1,176,425 1,216,322 1,287,646 1,312,413 0.8%
Top-10 total 46,133,500 49,086,822 52,899,138 54,469,943 1.3%
Producing total 49,966,417 53,233,034 57,029,084 58,755,988 1.3%
US total 132,533,250 139,612,169 149,238,638 152,706,788 1.1%
*Ranking for all years based on employment in 2014.
**Compound annual growth rate from 2012 to 2025.
***Data are from the IHS US Regional Service forecast, May 2014.
Source: IHS Economics © 2014 IHS
Overall, the top-10 nonproducing states are expected to continue to expand state-level employment at a compound annual growth rate of 1%, following the national average over the next decade, with the exception of Florida, which is projected to have above average growth. Despite an ‘at-trend’ overall growth rate for employment in nonproducing states, unconventional supply chain activity is halting or reversing decades-long declines in employment in industrial sectors that had suffered from the offshoring of domestic manufacturing and employment.
•Unconventional supply chain employment contribution in the top-10 nonproducing states is expected to increase at a compound annual growth rate of 6% each year from 2012 through 2025, outpacing overall US employment trends.
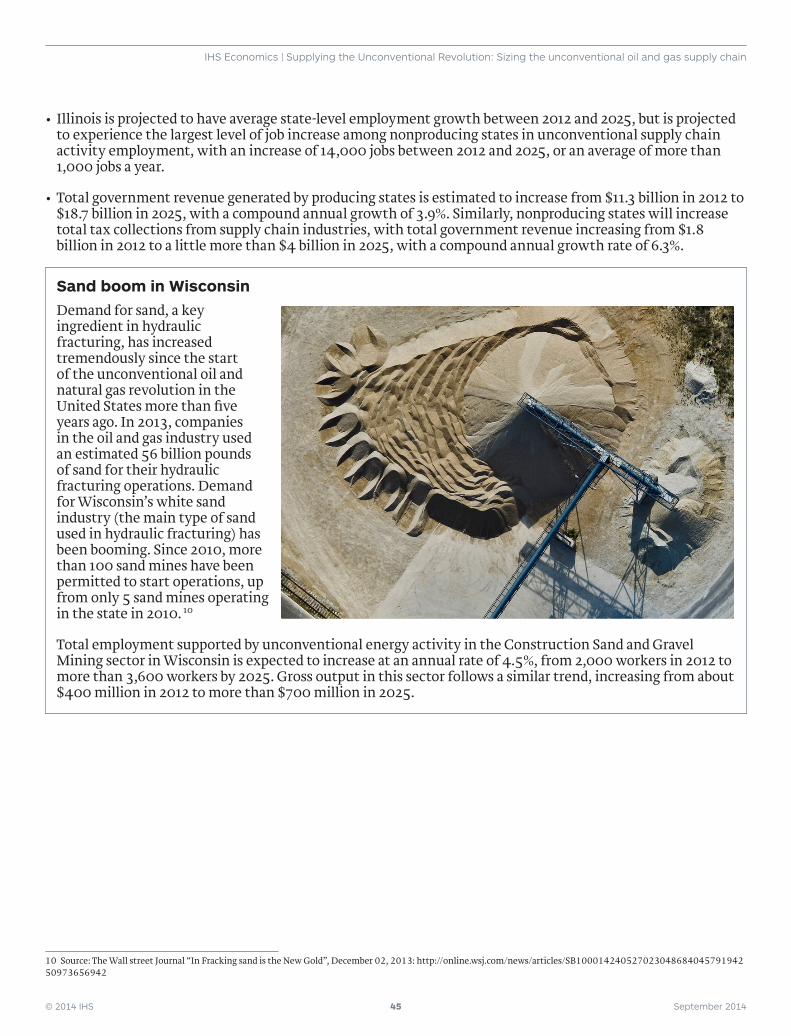
© 2014 IHS 45 September 2014
IHS Economics | Supplying the Unconventional Revolution: Sizing the unconventional oil and gas supply chain
• Illinois is projected to have average state-level employment growth between 2012 and 2025, but is projected to experience the largest level of job increase among nonproducing states in unconventional supply chain activity employment, with an increase of 14,000 jobs between 2012 and 2025, or an average of more than 1,000 jobs a year.
•Total government revenue generated by producing states is estimated to increase from $11.3 billion in 2012 to $18.7 billion in 2025, with a compound annual growth of 3.9%. Similarly, nonproducing states will increase total tax collections from supply chain industries, with total government revenue increasing from $1.8 billion in 2012 to a little more than $4 billion in 2025, with a compound annual growth rate of 6.3%.
Sand boom in WisconsinDemand for sand, a key ingredient in hydraulic fracturing, has increased tremendously since the start of the unconventional oil and natural gas revolution in the United States more than five years ago. In 2013, companies in the oil and gas industry used an estimated 56 billion pounds of sand for their hydraulic fracturing operations. Demand for Wisconsin’s white sand industry (the main type of sand used in hydraulic fracturing) has been booming. Since 2010, more than 100 sand mines have been permitted to start operations, up from only 5 sand mines operating in the state in 2010. 10
Total employment supported by unconventional energy activity in the Construction Sand and Gravel Mining sector in Wisconsin is expected to increase at an annual rate of 4.5%, from 2,000 workers in 2012 to more than 3,600 workers by 2025. Gross output in this sector follows a similar trend, increasing from about $400 million in 2012 to more than $700 million in 2025.
10 Source: The Wall street Journal “In Fracking sand is the New Gold”, December 02, 2013: http://online.wsj.com/news/articles/SB10001424052702304868404579194250973656942
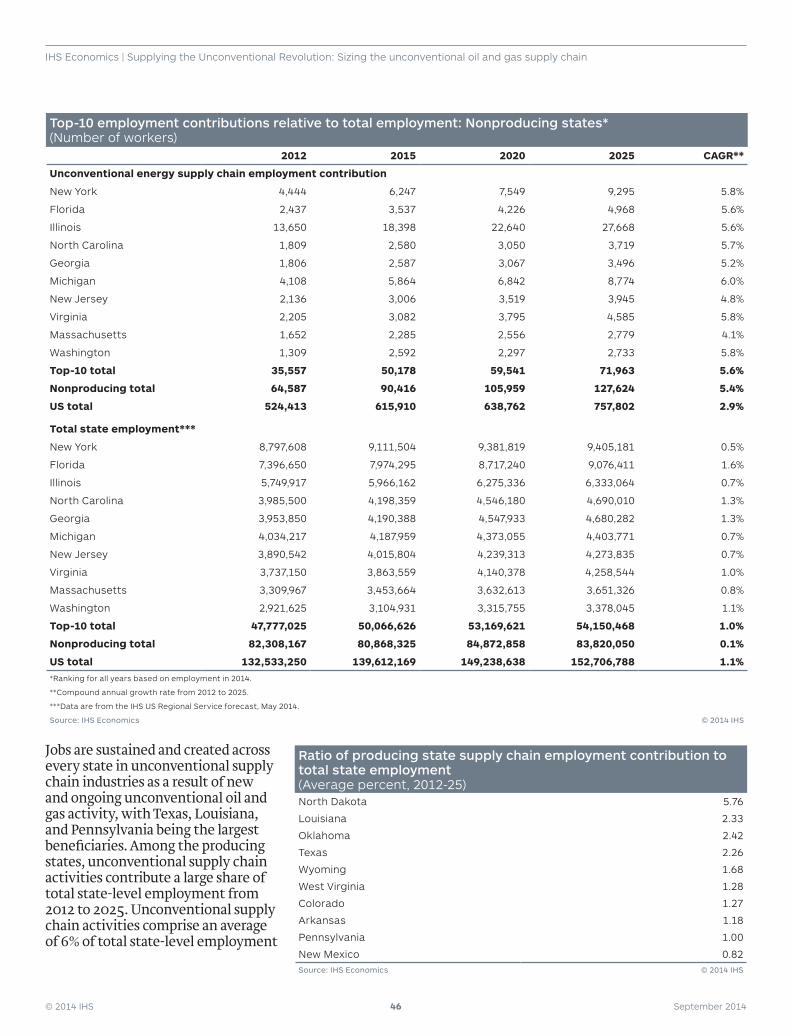
© 2014 IHS 46 September 2014
IHS Economics | Supplying the Unconventional Revolution: Sizing the unconventional oil and gas supply chain
Top-10 employment contributions relative to total employment: Nonproducing states* (Number of workers)
2012 2015 2020 2025 CAGR**
Unconventional energy supply chain employment contribution
New York 4,444 6,247 7,549 9,295 5.8%
Florida 2,437 3,537 4,226 4,968 5.6%
Illinois 13,650 18,398 22,640 27,668 5.6%
North Carolina 1,809 2,580 3,050 3,719 5.7%
Georgia 1,806 2,587 3,067 3,496 5.2%
Michigan 4,108 5,864 6,842 8,774 6.0%
New Jersey 2,136 3,006 3,519 3,945 4.8%
Virginia 2,205 3,082 3,795 4,585 5.8%
Massachusetts 1,652 2,285 2,556 2,779 4.1%
Washington 1,309 2,592 2,297 2,733 5.8%
Top-10 total 35,557 50,178 59,541 71,963 5.6%
Nonproducing total 64,587 90,416 105,959 127,624 5.4%
US total 524,413 615,910 638,762 757,802 2.9%
Total state employment***
New York 8,797,608 9,111,504 9,381,819 9,405,181 0.5%
Florida 7,396,650 7,974,295 8,717,240 9,076,411 1.6%
Illinois 5,749,917 5,966,162 6,275,336 6,333,064 0.7%
North Carolina 3,985,500 4,198,359 4,546,180 4,690,010 1.3%
Georgia 3,953,850 4,190,388 4,547,933 4,680,282 1.3%
Michigan 4,034,217 4,187,959 4,373,055 4,403,771 0.7%
New Jersey 3,890,542 4,015,804 4,239,313 4,273,835 0.7%
Virginia 3,737,150 3,863,559 4,140,378 4,258,544 1.0%
Massachusetts 3,309,967 3,453,664 3,632,613 3,651,326 0.8%
Washington 2,921,625 3,104,931 3,315,755 3,378,045 1.1%
Top-10 total 47,777,025 50,066,626 53,169,621 54,150,468 1.0%
Nonproducing total 82,308,167 80,868,325 84,872,858 83,820,050 0.1%
US total 132,533,250 139,612,169 149,238,638 152,706,788 1.1%*Ranking for all years based on employment in 2014.
**Compound annual growth rate from 2012 to 2025.
***Data are from the IHS US Regional Service forecast, May 2014.
Source: IHS Economics © 2014 IHS
Jobs are sustained and created across every state in unconventional supply chain industries as a result of new and ongoing unconventional oil and gas activity, with Texas, Louisiana, and Pennsylvania being the largest beneficiaries. Among the producing states, unconventional supply chain activities contribute a large share of total state-level employment from 2012 to 2025. Unconventional supply chain activities comprise an average of 6% of total state-level employment
Ratio of producing state supply chain employment contribution to total state employment (Average percent, 2012-25)North Dakota 5.76
Louisiana 2.33
Oklahoma 2.42
Texas 2.26
Wyoming 1.68
West Virginia 1.28
Colorado 1.27
Arkansas 1.18
Pennsylvania 1.00
New Mexico 0.82Source: IHS Economics © 2014 IHS
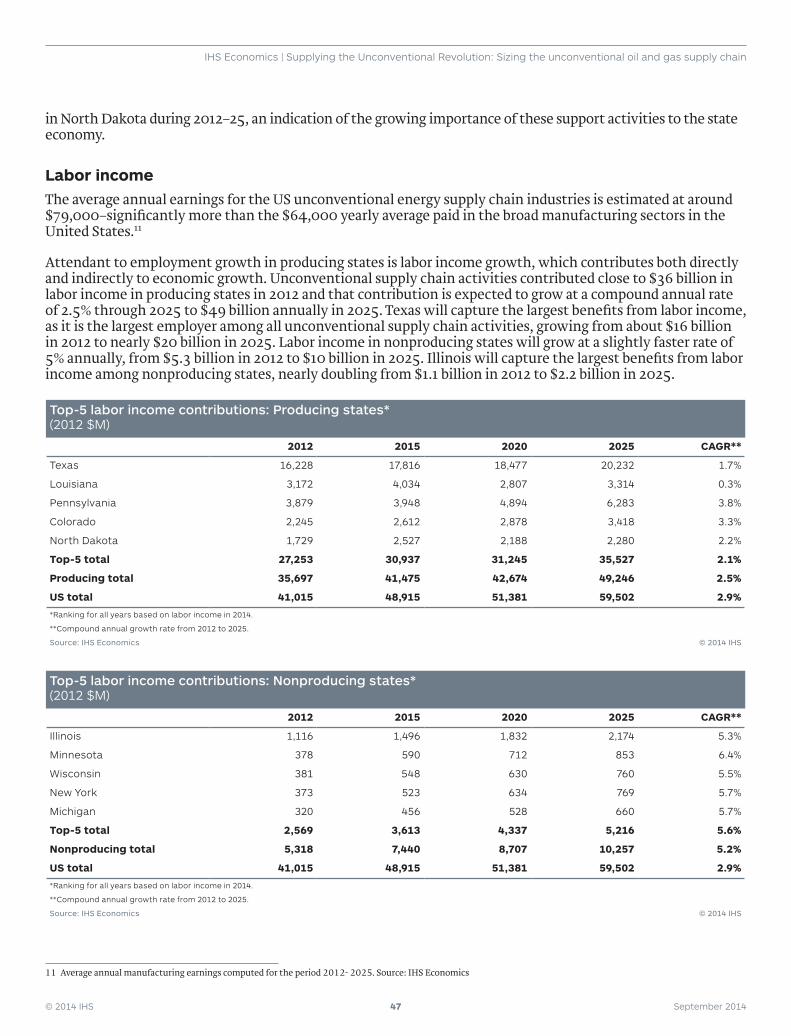
© 2014 IHS 47 September 2014
IHS Economics | Supplying the Unconventional Revolution: Sizing the unconventional oil and gas supply chain
in North Dakota during 2012–25, an indication of the growing importance of these support activities to the state economy.
Labor incomeThe average annual earnings for the US unconventional energy supply chain industries is estimated at around $79,000–significantly more than the $64,000 yearly average paid in the broad manufacturing sectors in the United States.11
Attendant to employment growth in producing states is labor income growth, which contributes both directly and indirectly to economic growth. Unconventional supply chain activities contributed close to $36 billion in labor income in producing states in 2012 and that contribution is expected to grow at a compound annual rate of 2.5% through 2025 to $49 billion annually in 2025. Texas will capture the largest benefits from labor income, as it is the largest employer among all unconventional supply chain activities, growing from about $16 billion in 2012 to nearly $20 billion in 2025. Labor income in nonproducing states will grow at a slightly faster rate of 5% annually, from $5.3 billion in 2012 to $10 billion in 2025. Illinois will capture the largest benefits from labor income among nonproducing states, nearly doubling from $1.1 billion in 2012 to $2.2 billion in 2025.
Top-5 labor income contributions: Producing states* (2012 $M)
2012 2015 2020 2025 CAGR**
Texas 16,228 17,816 18,477 20,232 1.7%
Louisiana 3,172 4,034 2,807 3,314 0.3%
Pennsylvania 3,879 3,948 4,894 6,283 3.8%
Colorado 2,245 2,612 2,878 3,418 3.3%
North Dakota 1,729 2,527 2,188 2,280 2.2%
Top-5 total 27,253 30,937 31,245 35,527 2.1%
Producing total 35,697 41,475 42,674 49,246 2.5%
US total 41,015 48,915 51,381 59,502 2.9%
*Ranking for all years based on labor income in 2014.
**Compound annual growth rate from 2012 to 2025.
Source: IHS Economics © 2014 IHS
Top-5 labor income contributions: Nonproducing states* (2012 $M)
2012 2015 2020 2025 CAGR**
Illinois 1,116 1,496 1,832 2,174 5.3%
Minnesota 378 590 712 853 6.4%
Wisconsin 381 548 630 760 5.5%
New York 373 523 634 769 5.7%
Michigan 320 456 528 660 5.7%
Top-5 total 2,569 3,613 4,337 5,216 5.6%
Nonproducing total 5,318 7,440 8,707 10,257 5.2%
US total 41,015 48,915 51,381 59,502 2.9%
*Ranking for all years based on labor income in 2014.
**Compound annual growth rate from 2012 to 2025.
Source: IHS Economics © 2014 IHS
11 Average annual manufacturing earnings computed for the period 2012- 2025. Source: IHS Economics
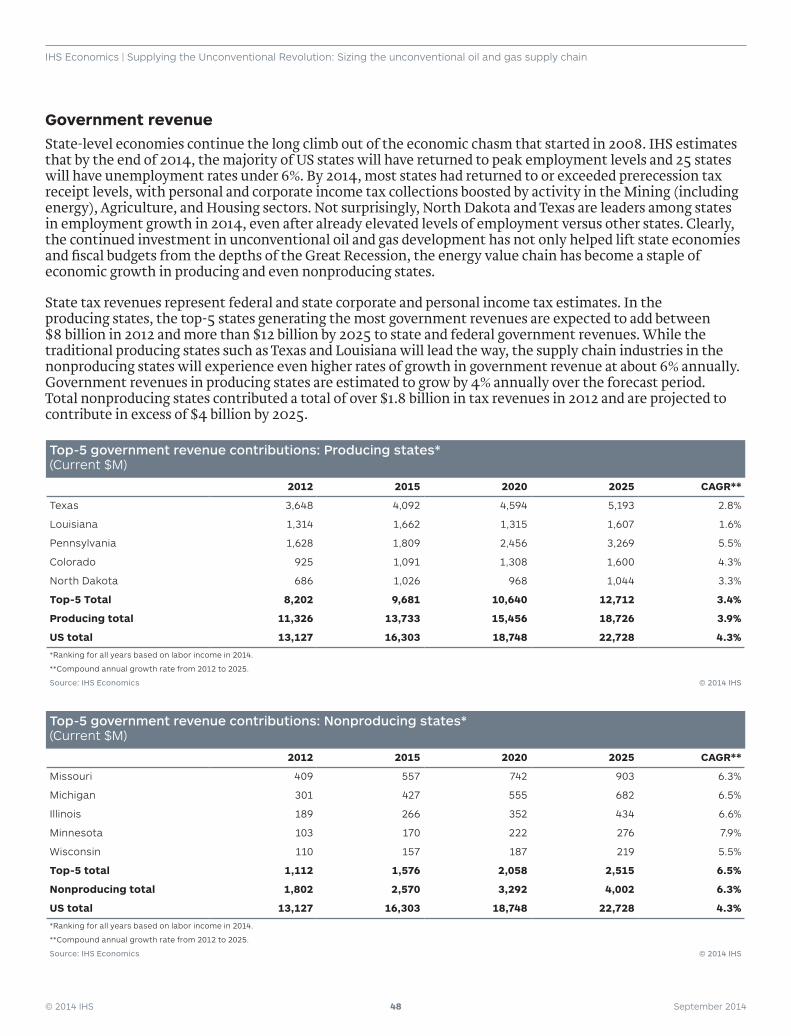
© 2014 IHS 48 September 2014
IHS Economics | Supplying the Unconventional Revolution: Sizing the unconventional oil and gas supply chain
Government revenueState-level economies continue the long climb out of the economic chasm that started in 2008. IHS estimates that by the end of 2014, the majority of US states will have returned to peak employment levels and 25 states will have unemployment rates under 6%. By 2014, most states had returned to or exceeded prerecession tax receipt levels, with personal and corporate income tax collections boosted by activity in the Mining (including energy), Agriculture, and Housing sectors. Not surprisingly, North Dakota and Texas are leaders among states in employment growth in 2014, even after already elevated levels of employment versus other states. Clearly, the continued investment in unconventional oil and gas development has not only helped lift state economies and fiscal budgets from the depths of the Great Recession, the energy value chain has become a staple of economic growth in producing and even nonproducing states.
State tax revenues represent federal and state corporate and personal income tax estimates. In the producing states, the top-5 states generating the most government revenues are expected to add between $8 billion in 2012 and more than $12 billion by 2025 to state and federal government revenues. While the traditional producing states such as Texas and Louisiana will lead the way, the supply chain industries in the nonproducing states will experience even higher rates of growth in government revenue at about 6% annually. Government revenues in producing states are estimated to grow by 4% annually over the forecast period. Total nonproducing states contributed a total of over $1.8 billion in tax revenues in 2012 and are projected to contribute in excess of $4 billion by 2025.
Top-5 government revenue contributions: Producing states* (Current $M)
2012 2015 2020 2025 CAGR**
Texas 3,648 4,092 4,594 5,193 2.8%
Louisiana 1,314 1,662 1,315 1,607 1.6%
Pennsylvania 1,628 1,809 2,456 3,269 5.5%
Colorado 925 1,091 1,308 1,600 4.3%
North Dakota 686 1,026 968 1,044 3.3%
Top-5 Total 8,202 9,681 10,640 12,712 3.4%
Producing total 11,326 13,733 15,456 18,726 3.9%
US total 13,127 16,303 18,748 22,728 4.3%
*Ranking for all years based on labor income in 2014.
**Compound annual growth rate from 2012 to 2025.
Source: IHS Economics © 2014 IHS
Top-5 government revenue contributions: Nonproducing states* (Current $M)
2012 2015 2020 2025 CAGR**
Missouri 409 557 742 903 6.3%
Michigan 301 427 555 682 6.5%
Illinois 189 266 352 434 6.6%
Minnesota 103 170 222 276 7.9%
Wisconsin 110 157 187 219 5.5%
Top-5 total 1,112 1,576 2,058 2,515 6.5%
Nonproducing total 1,802 2,570 3,292 4,002 6.3%
US total 13,127 16,303 18,748 22,728 4.3%
*Ranking for all years based on labor income in 2014.
**Compound annual growth rate from 2012 to 2025.
Source: IHS Economics © 2014 IHS
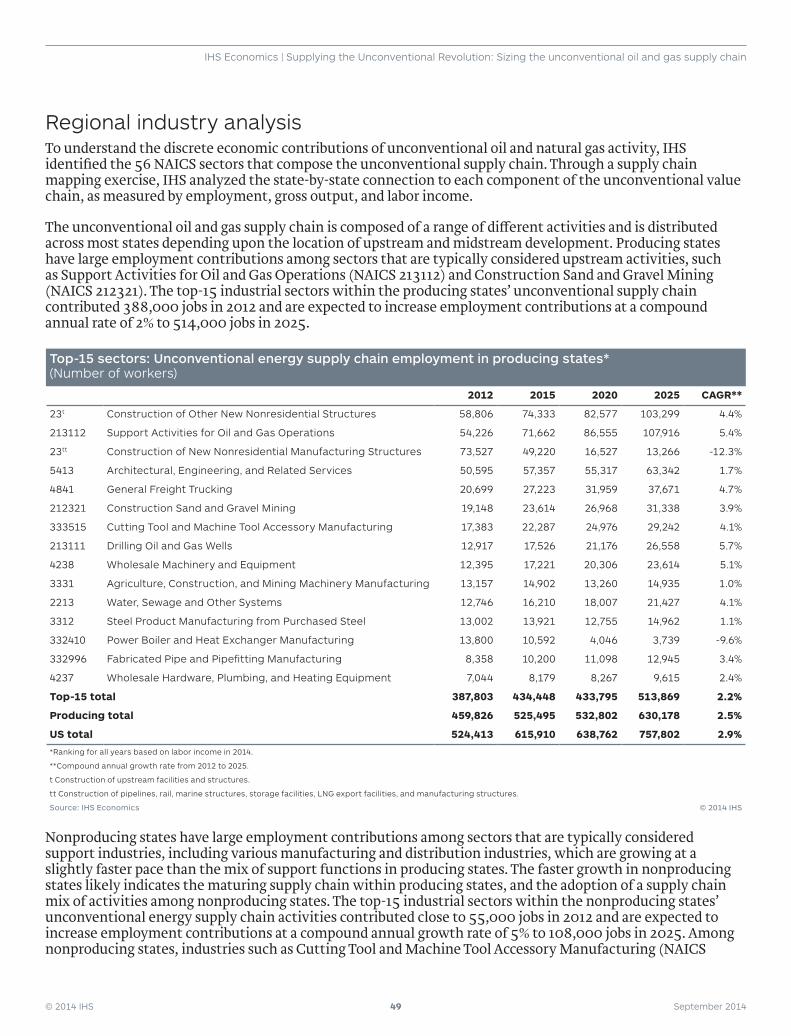
© 2014 IHS 49 September 2014
IHS Economics | Supplying the Unconventional Revolution: Sizing the unconventional oil and gas supply chain
Regional industry analysisTo understand the discrete economic contributions of unconventional oil and natural gas activity, IHS identified the 56 NAICS sectors that compose the unconventional supply chain. Through a supply chain mapping exercise, IHS analyzed the state-by-state connection to each component of the unconventional value chain, as measured by employment, gross output, and labor income.
The unconventional oil and gas supply chain is composed of a range of different activities and is distributed across most states depending upon the location of upstream and midstream development. Producing states have large employment contributions among sectors that are typically considered upstream activities, such as Support Activities for Oil and Gas Operations (NAICS 213112) and Construction Sand and Gravel Mining (NAICS 212321). The top-15 industrial sectors within the producing states’ unconventional supply chain contributed 388,000 jobs in 2012 and are expected to increase employment contributions at a compound annual rate of 2% to 514,000 jobs in 2025.
Top-15 sectors: Unconventional energy supply chain employment in producing states* (Number of workers)
2012 2015 2020 2025 CAGR**
23t Construction of Other New Nonresidential Structures 58,806 74,333 82,577 103,299 4.4%
213112 Support Activities for Oil and Gas Operations 54,226 71,662 86,555 107,916 5.4%
23tt Construction of New Nonresidential Manufacturing Structures 73,527 49,220 16,527 13,266 -12.3%
5413 Architectural, Engineering, and Related Services 50,595 57,357 55,317 63,342 1.7%
4841 General Freight Trucking 20,699 27,223 31,959 37,671 4.7%
212321 Construction Sand and Gravel Mining 19,148 23,614 26,968 31,338 3.9%
333515 Cutting Tool and Machine Tool Accessory Manufacturing 17,383 22,287 24,976 29,242 4.1%
213111 Drilling Oil and Gas Wells 12,917 17,526 21,176 26,558 5.7%
4238 Wholesale Machinery and Equipment 12,395 17,221 20,306 23,614 5.1%
3331 Agriculture, Construction, and Mining Machinery Manufacturing 13,157 14,902 13,260 14,935 1.0%
2213 Water, Sewage and Other Systems 12,746 16,210 18,007 21,427 4.1%
3312 Steel Product Manufacturing from Purchased Steel 13,002 13,921 12,755 14,962 1.1%
332410 Power Boiler and Heat Exchanger Manufacturing 13,800 10,592 4,046 3,739 -9.6%
332996 Fabricated Pipe and Pipefitting Manufacturing 8,358 10,200 11,098 12,945 3.4%
4237 Wholesale Hardware, Plumbing, and Heating Equipment 7,044 8,179 8,267 9,615 2.4%
Top-15 total 387,803 434,448 433,795 513,869 2.2%
Producing total 459,826 525,495 532,802 630,178 2.5%
US total 524,413 615,910 638,762 757,802 2.9%
*Ranking for all years based on labor income in 2014.
**Compound annual growth rate from 2012 to 2025.
t Construction of upstream facilities and structures.
tt Construction of pipelines, rail, marine structures, storage facilities, LNG export facilities, and manufacturing structures.
Source: IHS Economics © 2014 IHS
Nonproducing states have large employment contributions among sectors that are typically considered support industries, including various manufacturing and distribution industries, which are growing at a slightly faster pace than the mix of support functions in producing states. The faster growth in nonproducing states likely indicates the maturing supply chain within producing states, and the adoption of a supply chain mix of activities among nonproducing states. The top-15 industrial sectors within the nonproducing states’ unconventional energy supply chain activities contributed close to 55,000 jobs in 2012 and are expected to increase employment contributions at a compound annual growth rate of 5% to 108,000 jobs in 2025. Among nonproducing states, industries such as Cutting Tool and Machine Tool Accessory Manufacturing (NAICS
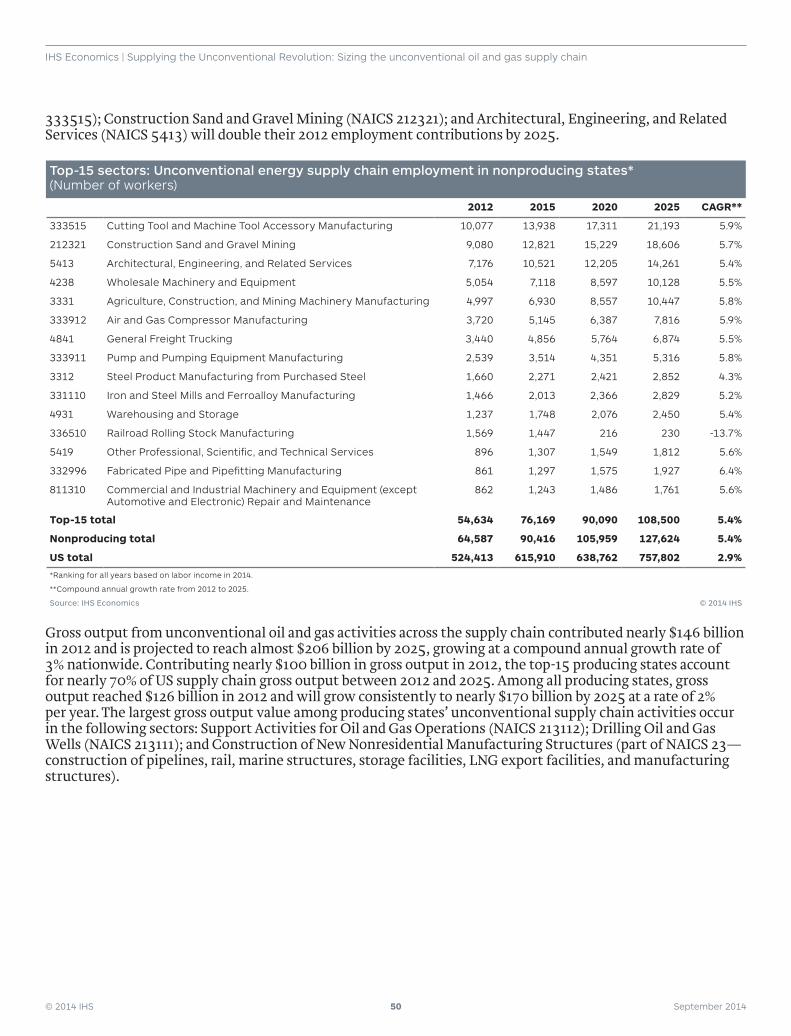
© 2014 IHS 50 September 2014
IHS Economics | Supplying the Unconventional Revolution: Sizing the unconventional oil and gas supply chain
333515); Construction Sand and Gravel Mining (NAICS 212321); and Architectural, Engineering, and Related Services (NAICS 5413) will double their 2012 employment contributions by 2025.
Top-15 sectors: Unconventional energy supply chain employment in nonproducing states* (Number of workers)
2012 2015 2020 2025 CAGR**
333515 Cutting Tool and Machine Tool Accessory Manufacturing 10,077 13,938 17,311 21,193 5.9%
212321 Construction Sand and Gravel Mining 9,080 12,821 15,229 18,606 5.7%
5413 Architectural, Engineering, and Related Services 7,176 10,521 12,205 14,261 5.4%
4238 Wholesale Machinery and Equipment 5,054 7,118 8,597 10,128 5.5%
3331 Agriculture, Construction, and Mining Machinery Manufacturing 4,997 6,930 8,557 10,447 5.8%
333912 Air and Gas Compressor Manufacturing 3,720 5,145 6,387 7,816 5.9%
4841 General Freight Trucking 3,440 4,856 5,764 6,874 5.5%
333911 Pump and Pumping Equipment Manufacturing 2,539 3,514 4,351 5,316 5.8%
3312 Steel Product Manufacturing from Purchased Steel 1,660 2,271 2,421 2,852 4.3%
331110 Iron and Steel Mills and Ferroalloy Manufacturing 1,466 2,013 2,366 2,829 5.2%
4931 Warehousing and Storage 1,237 1,748 2,076 2,450 5.4%
336510 Railroad Rolling Stock Manufacturing 1,569 1,447 216 230 -13.7%
5419 Other Professional, Scientific, and Technical Services 896 1,307 1,549 1,812 5.6%
332996 Fabricated Pipe and Pipefitting Manufacturing 861 1,297 1,575 1,927 6.4%
811310 Commercial and Industrial Machinery and Equipment (except Automotive and Electronic) Repair and Maintenance
862 1,243 1,486 1,761 5.6%
Top-15 total 54,634 76,169 90,090 108,500 5.4%
Nonproducing total 64,587 90,416 105,959 127,624 5.4%
US total 524,413 615,910 638,762 757,802 2.9%
*Ranking for all years based on labor income in 2014.
**Compound annual growth rate from 2012 to 2025.
Source: IHS Economics © 2014 IHS
Gross output from unconventional oil and gas activities across the supply chain contributed nearly $146 billion in 2012 and is projected to reach almost $206 billion by 2025, growing at a compound annual growth rate of 3% nationwide. Contributing nearly $100 billion in gross output in 2012, the top-15 producing states account for nearly 70% of US supply chain gross output between 2012 and 2025. Among all producing states, gross output reached $126 billion in 2012 and will grow consistently to nearly $170 billion by 2025 at a rate of 2% per year. The largest gross output value among producing states’ unconventional supply chain activities occur in the following sectors: Support Activities for Oil and Gas Operations (NAICS 213112); Drilling Oil and Gas Wells (NAICS 213111); and Construction of New Nonresidential Manufacturing Structures (part of NAICS 23—construction of pipelines, rail, marine structures, storage facilities, LNG export facilities, and manufacturing structures).
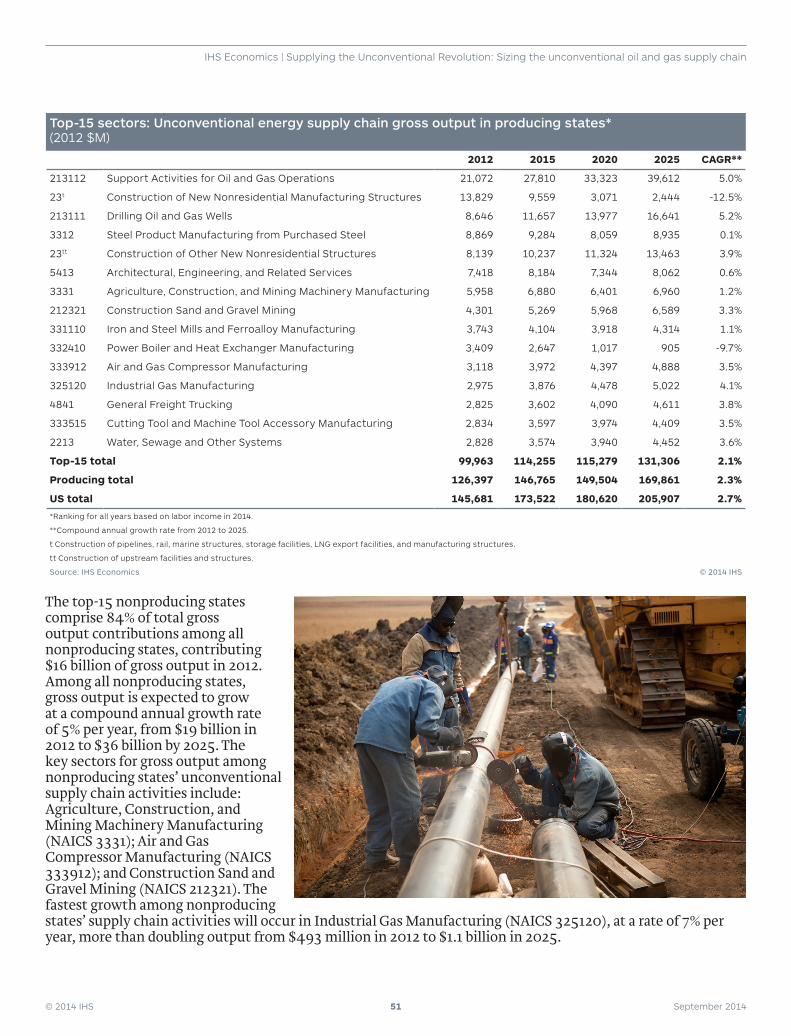
© 2014 IHS 51 September 2014
IHS Economics | Supplying the Unconventional Revolution: Sizing the unconventional oil and gas supply chain
Top-15 sectors: Unconventional energy supply chain gross output in producing states* (2012 $M)
2012 2015 2020 2025 CAGR**
213112 Support Activities for Oil and Gas Operations 21,072 27,810 33,323 39,612 5.0%
23t Construction of New Nonresidential Manufacturing Structures 13,829 9,559 3,071 2,444 -12.5%
213111 Drilling Oil and Gas Wells 8,646 11,657 13,977 16,641 5.2%
3312 Steel Product Manufacturing from Purchased Steel 8,869 9,284 8,059 8,935 0.1%
23tt Construction of Other New Nonresidential Structures 8,139 10,237 11,324 13,463 3.9%
5413 Architectural, Engineering, and Related Services 7,418 8,184 7,344 8,062 0.6%
3331 Agriculture, Construction, and Mining Machinery Manufacturing 5,958 6,880 6,401 6,960 1.2%
212321 Construction Sand and Gravel Mining 4,301 5,269 5,968 6,589 3.3%
331110 Iron and Steel Mills and Ferroalloy Manufacturing 3,743 4,104 3,918 4,314 1.1%
332410 Power Boiler and Heat Exchanger Manufacturing 3,409 2,647 1,017 905 -9.7%
333912 Air and Gas Compressor Manufacturing 3,118 3,972 4,397 4,888 3.5%
325120 Industrial Gas Manufacturing 2,975 3,876 4,478 5,022 4.1%
4841 General Freight Trucking 2,825 3,602 4,090 4,611 3.8%
333515 Cutting Tool and Machine Tool Accessory Manufacturing 2,834 3,597 3,974 4,409 3.5%
2213 Water, Sewage and Other Systems 2,828 3,574 3,940 4,452 3.6%
Top-15 total 99,963 114,255 115,279 131,306 2.1%
Producing total 126,397 146,765 149,504 169,861 2.3%
US total 145,681 173,522 180,620 205,907 2.7%
*Ranking for all years based on labor income in 2014.
**Compound annual growth rate from 2012 to 2025.
t Construction of pipelines, rail, marine structures, storage facilities, LNG export facilities, and manufacturing structures.
tt Construction of upstream facilities and structures.
Source: IHS Economics © 2014 IHS
The top-15 nonproducing states comprise 84% of total gross output contributions among all nonproducing states, contributing $16 billion of gross output in 2012. Among all nonproducing states, gross output is expected to grow at a compound annual growth rate of 5% per year, from $19 billion in 2012 to $36 billion by 2025. The key sectors for gross output among nonproducing states’ unconventional supply chain activities include: Agriculture, Construction, and Mining Machinery Manufacturing (NAICS 3331); Air and Gas Compressor Manufacturing (NAICS 333912); and Construction Sand and Gravel Mining (NAICS 212321). The fastest growth among nonproducing states’ supply chain activities will occur in Industrial Gas Manufacturing (NAICS 325120), at a rate of 7% per year, more than doubling output from $493 million in 2012 to $1.1 billion in 2025.
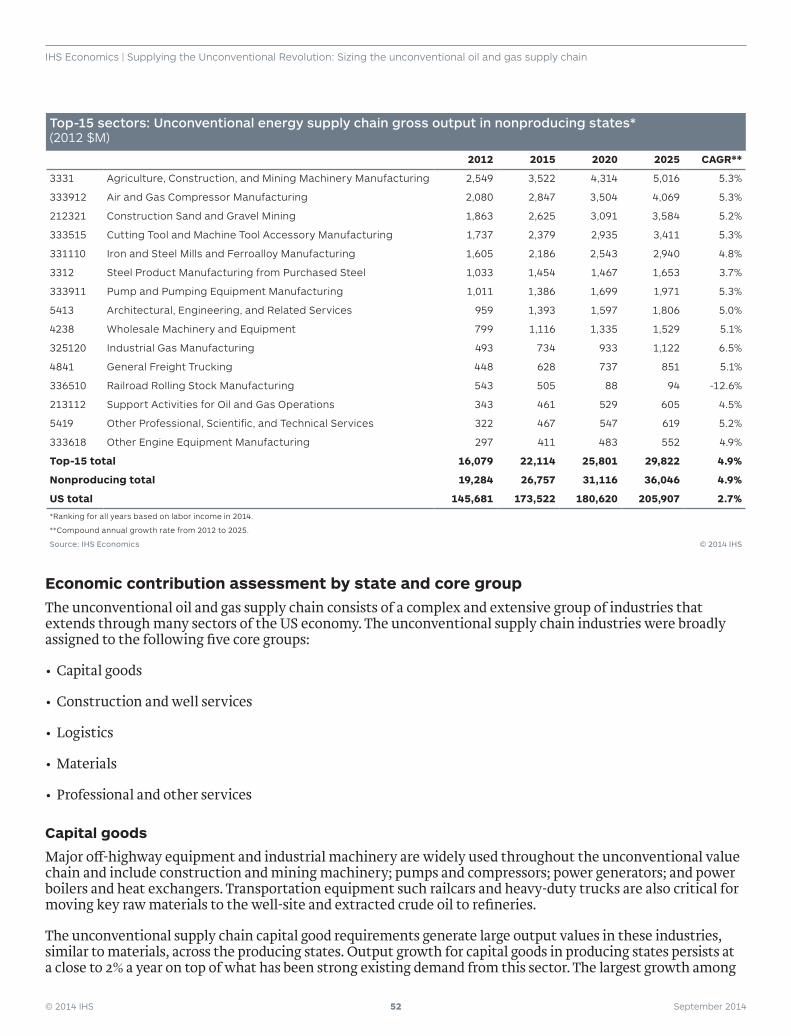
© 2014 IHS 52 September 2014
IHS Economics | Supplying the Unconventional Revolution: Sizing the unconventional oil and gas supply chain
Top-15 sectors: Unconventional energy supply chain gross output in nonproducing states* (2012 $M)
2012 2015 2020 2025 CAGR**
3331 Agriculture, Construction, and Mining Machinery Manufacturing 2,549 3,522 4,314 5,016 5.3%
333912 Air and Gas Compressor Manufacturing 2,080 2,847 3,504 4,069 5.3%
212321 Construction Sand and Gravel Mining 1,863 2,625 3,091 3,584 5.2%
333515 Cutting Tool and Machine Tool Accessory Manufacturing 1,737 2,379 2,935 3,411 5.3%
331110 Iron and Steel Mills and Ferroalloy Manufacturing 1,605 2,186 2,543 2,940 4.8%
3312 Steel Product Manufacturing from Purchased Steel 1,033 1,454 1,467 1,653 3.7%
333911 Pump and Pumping Equipment Manufacturing 1,011 1,386 1,699 1,971 5.3%
5413 Architectural, Engineering, and Related Services 959 1,393 1,597 1,806 5.0%
4238 Wholesale Machinery and Equipment 799 1,116 1,335 1,529 5.1%
325120 Industrial Gas Manufacturing 493 734 933 1,122 6.5%
4841 General Freight Trucking 448 628 737 851 5.1%
336510 Railroad Rolling Stock Manufacturing 543 505 88 94 -12.6%
213112 Support Activities for Oil and Gas Operations 343 461 529 605 4.5%
5419 Other Professional, Scientific, and Technical Services 322 467 547 619 5.2%
333618 Other Engine Equipment Manufacturing 297 411 483 552 4.9%
Top-15 total 16,079 22,114 25,801 29,822 4.9%
Nonproducing total 19,284 26,757 31,116 36,046 4.9%
US total 145,681 173,522 180,620 205,907 2.7%
*Ranking for all years based on labor income in 2014.
**Compound annual growth rate from 2012 to 2025.
Source: IHS Economics © 2014 IHS
Economic contribution assessment by state and core groupThe unconventional oil and gas supply chain consists of a complex and extensive group of industries that extends through many sectors of the US economy. The unconventional supply chain industries were broadly assigned to the following five core groups:
•Capital goods
•Construction and well services
•Logistics
•Materials
•Professional and other services
Capital goods
Major off-highway equipment and industrial machinery are widely used throughout the unconventional value chain and include construction and mining machinery; pumps and compressors; power generators; and power boilers and heat exchangers. Transportation equipment such railcars and heavy-duty trucks are also critical for moving key raw materials to the well-site and extracted crude oil to refineries.
The unconventional supply chain capital good requirements generate large output values in these industries, similar to materials, across the producing states. Output growth for capital goods in producing states persists at a close to 2% a year on top of what has been strong existing demand from this sector. The largest growth among
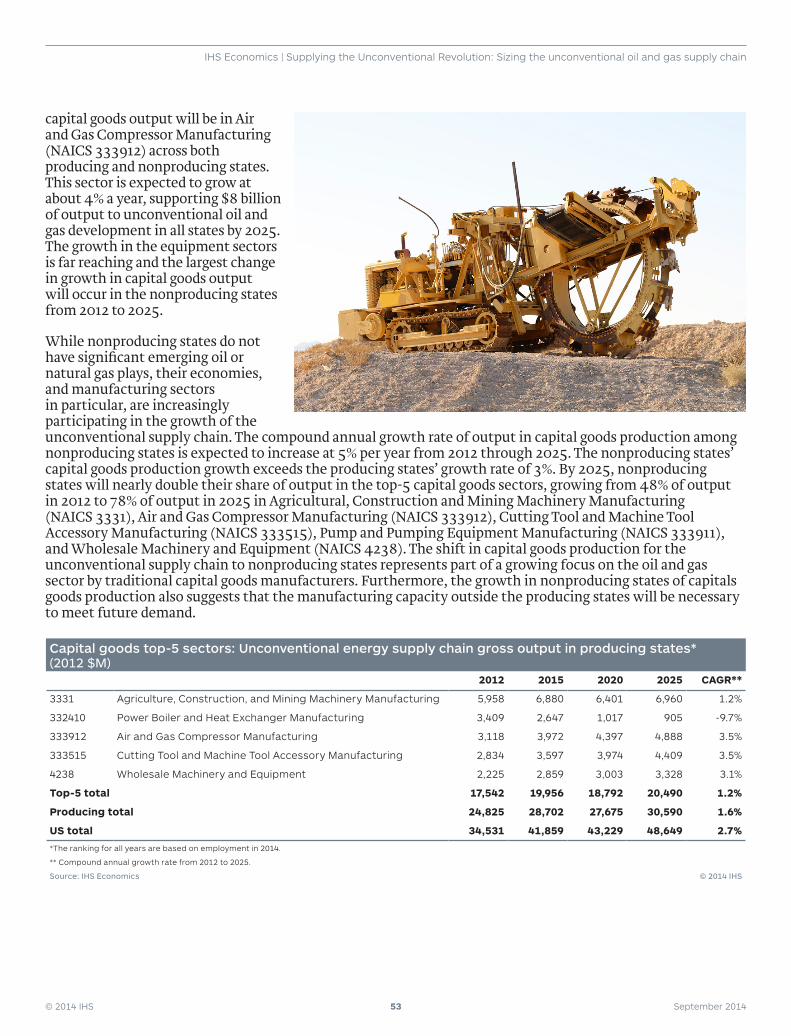
© 2014 IHS 53 September 2014
IHS Economics | Supplying the Unconventional Revolution: Sizing the unconventional oil and gas supply chain
capital goods output will be in Air and Gas Compressor Manufacturing (NAICS 333912) across both producing and nonproducing states. This sector is expected to grow at about 4% a year, supporting $8 billion of output to unconventional oil and gas development in all states by 2025. The growth in the equipment sectors is far reaching and the largest change in growth in capital goods output will occur in the nonproducing states from 2012 to 2025.
While nonproducing states do not have significant emerging oil or natural gas plays, their economies, and manufacturing sectors in particular, are increasingly participating in the growth of the unconventional supply chain. The compound annual growth rate of output in capital goods production among nonproducing states is expected to increase at 5% per year from 2012 through 2025. The nonproducing states’ capital goods production growth exceeds the producing states’ growth rate of 3%. By 2025, nonproducing states will nearly double their share of output in the top-5 capital goods sectors, growing from 48% of output in 2012 to 78% of output in 2025 in Agricultural, Construction and Mining Machinery Manufacturing (NAICS 3331), Air and Gas Compressor Manufacturing (NAICS 333912), Cutting Tool and Machine Tool Accessory Manufacturing (NAICS 333515), Pump and Pumping Equipment Manufacturing (NAICS 333911), and Wholesale Machinery and Equipment (NAICS 4238). The shift in capital goods production for the unconventional supply chain to nonproducing states represents part of a growing focus on the oil and gas sector by traditional capital goods manufacturers. Furthermore, the growth in nonproducing states of capitals goods production also suggests that the manufacturing capacity outside the producing states will be necessary to meet future demand.
Capital goods top-5 sectors: Unconventional energy supply chain gross output in producing states* (2012 $M)
2012 2015 2020 2025 CAGR**
3331 Agriculture, Construction, and Mining Machinery Manufacturing 5,958 6,880 6,401 6,960 1.2%
332410 Power Boiler and Heat Exchanger Manufacturing 3,409 2,647 1,017 905 -9.7%
333912 Air and Gas Compressor Manufacturing 3,118 3,972 4,397 4,888 3.5%
333515 Cutting Tool and Machine Tool Accessory Manufacturing 2,834 3,597 3,974 4,409 3.5%
4238 Wholesale Machinery and Equipment 2,225 2,859 3,003 3,328 3.1%
Top-5 total 17,542 19,956 18,792 20,490 1.2%
Producing total 24,825 28,702 27,675 30,590 1.6%
US total 34,531 41,859 43,229 48,649 2.7%
*The ranking for all years are based on employment in 2014.
** Compound annual growth rate from 2012 to 2025.
Source: IHS Economics © 2014 IHS
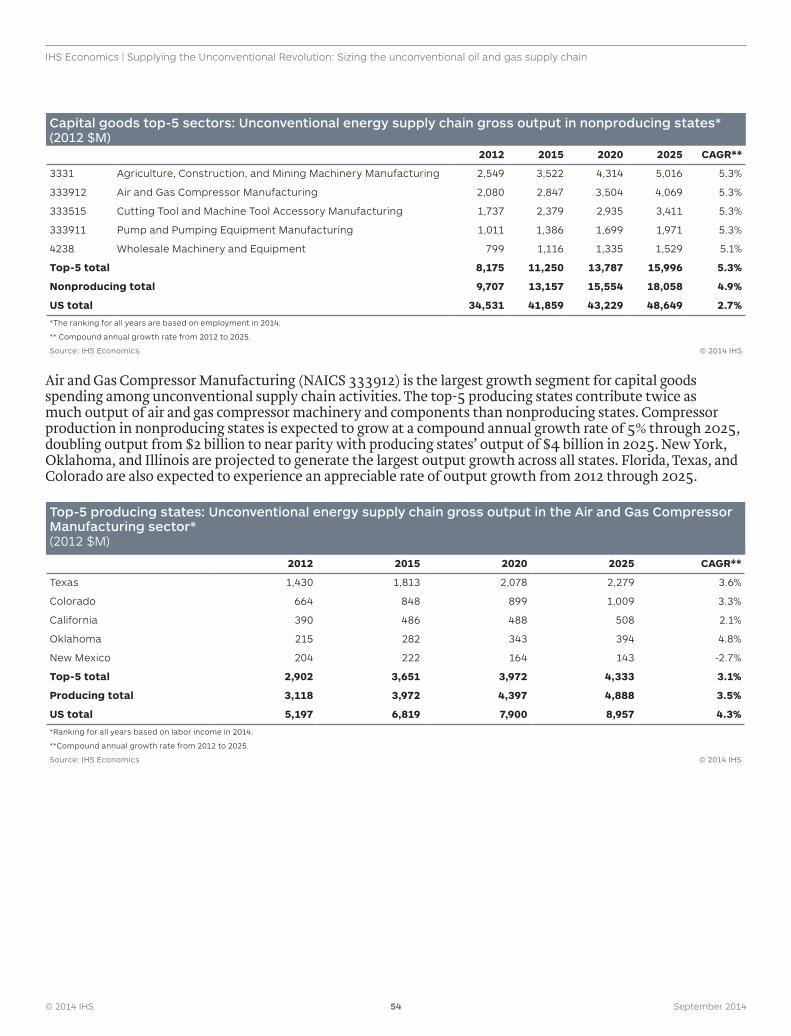
© 2014 IHS 54 September 2014
IHS Economics | Supplying the Unconventional Revolution: Sizing the unconventional oil and gas supply chain
Capital goods top-5 sectors: Unconventional energy supply chain gross output in nonproducing states* (2012 $M)
2012 2015 2020 2025 CAGR**
3331 Agriculture, Construction, and Mining Machinery Manufacturing 2,549 3,522 4,314 5,016 5.3%
333912 Air and Gas Compressor Manufacturing 2,080 2,847 3,504 4,069 5.3%
333515 Cutting Tool and Machine Tool Accessory Manufacturing 1,737 2,379 2,935 3,411 5.3%
333911 Pump and Pumping Equipment Manufacturing 1,011 1,386 1,699 1,971 5.3%
4238 Wholesale Machinery and Equipment 799 1,116 1,335 1,529 5.1%
Top-5 total 8,175 11,250 13,787 15,996 5.3%
Nonproducing total 9,707 13,157 15,554 18,058 4.9%
US total 34,531 41,859 43,229 48,649 2.7%
*The ranking for all years are based on employment in 2014.
** Compound annual growth rate from 2012 to 2025.
Source: IHS Economics © 2014 IHS
Air and Gas Compressor Manufacturing (NAICS 333912) is the largest growth segment for capital goods spending among unconventional supply chain activities. The top-5 producing states contribute twice as much output of air and gas compressor machinery and components than nonproducing states. Compressor production in nonproducing states is expected to grow at a compound annual growth rate of 5% through 2025, doubling output from $2 billion to near parity with producing states’ output of $4 billion in 2025. New York, Oklahoma, and Illinois are projected to generate the largest output growth across all states. Florida, Texas, and Colorado are also expected to experience an appreciable rate of output growth from 2012 through 2025.
Top-5 producing states: Unconventional energy supply chain gross output in the Air and Gas Compressor Manufacturing sector* (2012 $M)
2012 2015 2020 2025 CAGR**
Texas 1,430 1,813 2,078 2,279 3.6%
Colorado 664 848 899 1,009 3.3%
California 390 486 488 508 2.1%
Oklahoma 215 282 343 394 4.8%
New Mexico 204 222 164 143 -2.7%
Top-5 total 2,902 3,651 3,972 4,333 3.1%
Producing total 3,118 3,972 4,397 4,888 3.5%
US total 5,197 6,819 7,900 8,957 4.3%
*Ranking for all years based on labor income in 2014.
**Compound annual growth rate from 2012 to 2025.
Source: IHS Economics © 2014 IHS
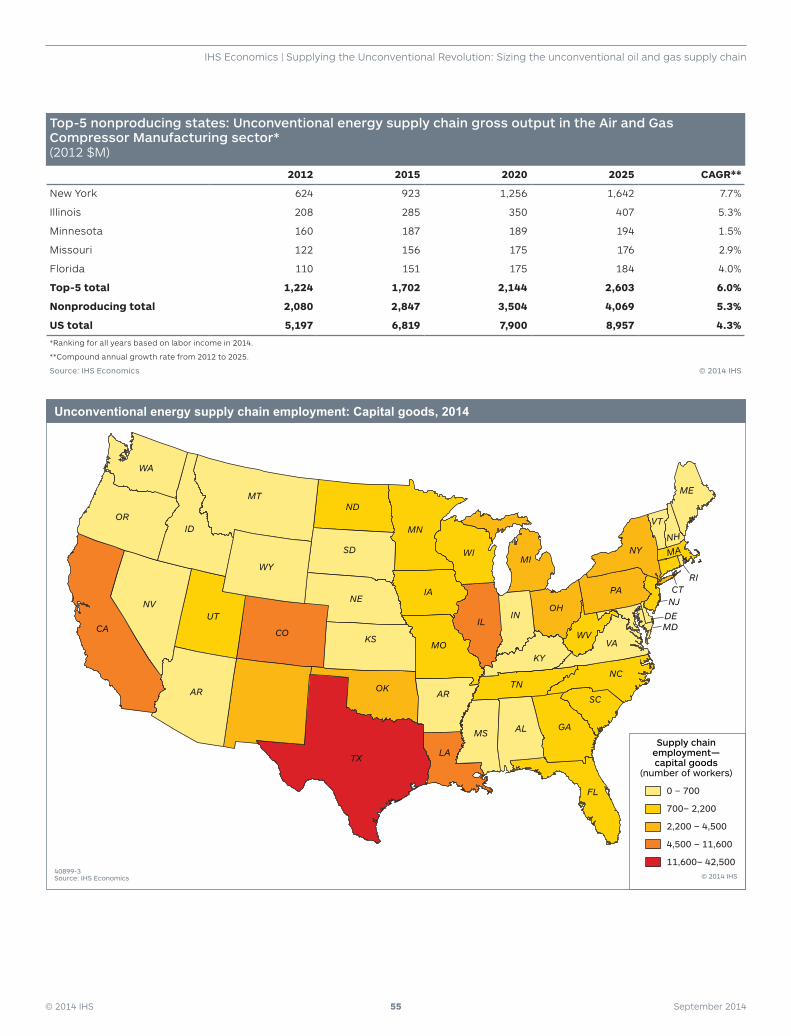
© 2014 IHS 55 September 2014
IHS Economics | Supplying the Unconventional Revolution: Sizing the unconventional oil and gas supply chain
Top-5 nonproducing states: Unconventional energy supply chain gross output in the Air and Gas Compressor Manufacturing sector* (2012 $M)
2012 2015 2020 2025 CAGR**
New York 624 923 1,256 1,642 7.7%
Illinois 208 285 350 407 5.3%
Minnesota 160 187 189 194 1.5%
Missouri 122 156 175 176 2.9%
Florida 110 151 175 184 4.0%
Top-5 total 1,224 1,702 2,144 2,603 6.0%
Nonproducing total 2,080 2,847 3,504 4,069 5.3%
US total 5,197 6,819 7,900 8,957 4.3%
*Ranking for all years based on labor income in 2014.
**Compound annual growth rate from 2012 to 2025.
Source: IHS Economics © 2014 IHS
CA
NV
OR
WA
MT
ID
ND
NE
KS
OK
SD
WY
CO
UT
AR
TX
MN
MI
IA
MO
AR
WI
LA
MS AL GA
SC
NC
VAWV
TN
KY
OH
PA
NY MA
RICTNJDEMD
ME
NH
VT
INIL
FL
Supply chainemployment—capital goods
(number of workers)
0 – 700
700– 2,200
2,200 – 4,500
4,500 – 11,600
11,600– 42,500© 2014 IHS
40899-3Source: IHS Economics
Unconventional energy supply chain employment: Capital goods, 2014
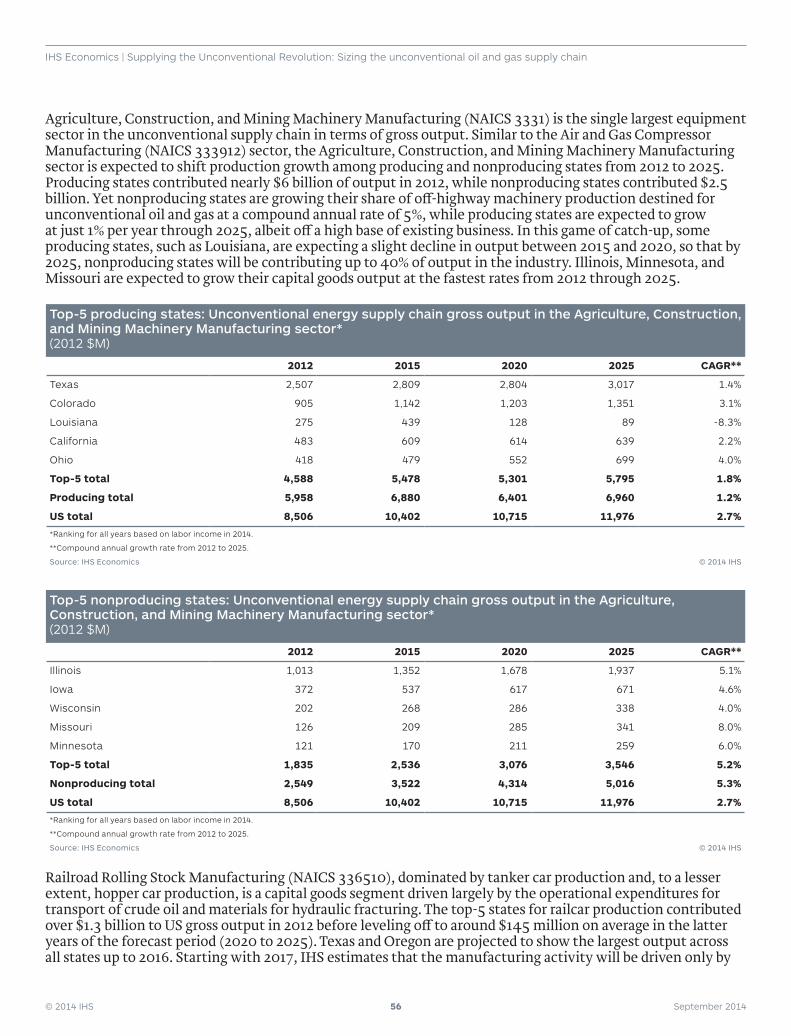
© 2014 IHS 56 September 2014
IHS Economics | Supplying the Unconventional Revolution: Sizing the unconventional oil and gas supply chain
Agriculture, Construction, and Mining Machinery Manufacturing (NAICS 3331) is the single largest equipment sector in the unconventional supply chain in terms of gross output. Similar to the Air and Gas Compressor Manufacturing (NAICS 333912) sector, the Agriculture, Construction, and Mining Machinery Manufacturing sector is expected to shift production growth among producing and nonproducing states from 2012 to 2025. Producing states contributed nearly $6 billion of output in 2012, while nonproducing states contributed $2.5 billion. Yet nonproducing states are growing their share of off-highway machinery production destined for unconventional oil and gas at a compound annual rate of 5%, while producing states are expected to grow at just 1% per year through 2025, albeit off a high base of existing business. In this game of catch-up, some producing states, such as Louisiana, are expecting a slight decline in output between 2015 and 2020, so that by 2025, nonproducing states will be contributing up to 40% of output in the industry. Illinois, Minnesota, and Missouri are expected to grow their capital goods output at the fastest rates from 2012 through 2025.
Top-5 producing states: Unconventional energy supply chain gross output in the Agriculture, Construction, and Mining Machinery Manufacturing sector* (2012 $M)
2012 2015 2020 2025 CAGR**
Texas 2,507 2,809 2,804 3,017 1.4%
Colorado 905 1,142 1,203 1,351 3.1%
Louisiana 275 439 128 89 -8.3%
California 483 609 614 639 2.2%
Ohio 418 479 552 699 4.0%
Top-5 total 4,588 5,478 5,301 5,795 1.8%
Producing total 5,958 6,880 6,401 6,960 1.2%
US total 8,506 10,402 10,715 11,976 2.7%
*Ranking for all years based on labor income in 2014.
**Compound annual growth rate from 2012 to 2025.
Source: IHS Economics © 2014 IHS
Top-5 nonproducing states: Unconventional energy supply chain gross output in the Agriculture, Construction, and Mining Machinery Manufacturing sector* (2012 $M)
2012 2015 2020 2025 CAGR**
Illinois 1,013 1,352 1,678 1,937 5.1%
Iowa 372 537 617 671 4.6%
Wisconsin 202 268 286 338 4.0%
Missouri 126 209 285 341 8.0%
Minnesota 121 170 211 259 6.0%
Top-5 total 1,835 2,536 3,076 3,546 5.2%
Nonproducing total 2,549 3,522 4,314 5,016 5.3%
US total 8,506 10,402 10,715 11,976 2.7%
*Ranking for all years based on labor income in 2014.
**Compound annual growth rate from 2012 to 2025.
Source: IHS Economics © 2014 IHS
Railroad Rolling Stock Manufacturing (NAICS 336510), dominated by tanker car production and, to a lesser extent, hopper car production, is a capital goods segment driven largely by the operational expenditures for transport of crude oil and materials for hydraulic fracturing. The top-5 states for railcar production contributed over $1.3 billion to US gross output in 2012 before leveling off to around $145 million on average in the latter years of the forecast period (2020 to 2025). Texas and Oregon are projected to show the largest output across all states up to 2016. Starting with 2017, IHS estimates that the manufacturing activity will be driven only by
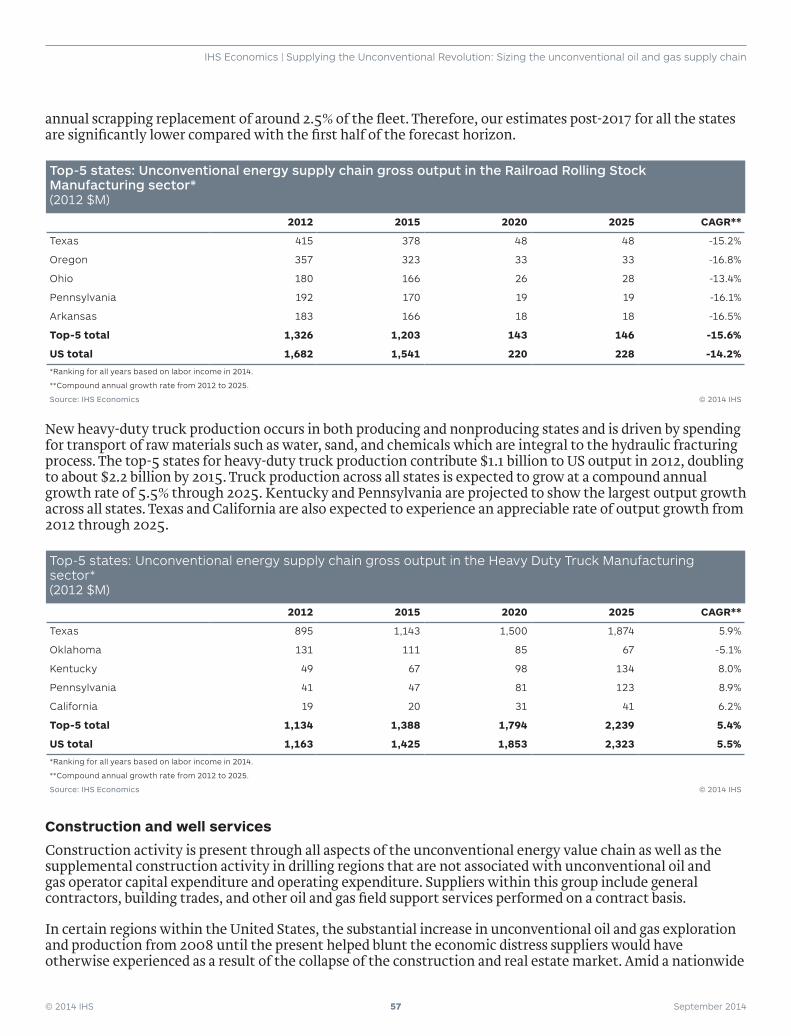
© 2014 IHS 57 September 2014
IHS Economics | Supplying the Unconventional Revolution: Sizing the unconventional oil and gas supply chain
annual scrapping replacement of around 2.5% of the fleet. Therefore, our estimates post-2017 for all the states are significantly lower compared with the first half of the forecast horizon.
Top-5 states: Unconventional energy supply chain gross output in the Railroad Rolling Stock Manufacturing sector* (2012 $M)
2012 2015 2020 2025 CAGR**
Texas 415 378 48 48 -15.2%
Oregon 357 323 33 33 -16.8%
Ohio 180 166 26 28 -13.4%
Pennsylvania 192 170 19 19 -16.1%
Arkansas 183 166 18 18 -16.5%
Top-5 total 1,326 1,203 143 146 -15.6%
US total 1,682 1,541 220 228 -14.2%
*Ranking for all years based on labor income in 2014.
**Compound annual growth rate from 2012 to 2025.
Source: IHS Economics © 2014 IHS
New heavy-duty truck production occurs in both producing and nonproducing states and is driven by spending for transport of raw materials such as water, sand, and chemicals which are integral to the hydraulic fracturing process. The top-5 states for heavy-duty truck production contribute $1.1 billion to US output in 2012, doubling to about $2.2 billion by 2015. Truck production across all states is expected to grow at a compound annual growth rate of 5.5% through 2025. Kentucky and Pennsylvania are projected to show the largest output growth across all states. Texas and California are also expected to experience an appreciable rate of output growth from 2012 through 2025.
Top-5 states: Unconventional energy supply chain gross output in the Heavy Duty Truck Manufacturing sector* (2012 $M)
2012 2015 2020 2025 CAGR**
Texas 895 1,143 1,500 1,874 5.9%
Oklahoma 131 111 85 67 -5.1%
Kentucky 49 67 98 134 8.0%
Pennsylvania 41 47 81 123 8.9%
California 19 20 31 41 6.2%
Top-5 total 1,134 1,388 1,794 2,239 5.4%
US total 1,163 1,425 1,853 2,323 5.5%
*Ranking for all years based on labor income in 2014.
**Compound annual growth rate from 2012 to 2025.
Source: IHS Economics © 2014 IHS
Construction and well services
Construction activity is present through all aspects of the unconventional energy value chain as well as the supplemental construction activity in drilling regions that are not associated with unconventional oil and gas operator capital expenditure and operating expenditure. Suppliers within this group include general contractors, building trades, and other oil and gas field support services performed on a contract basis.
In certain regions within the United States, the substantial increase in unconventional oil and gas exploration and production from 2008 until the present helped blunt the economic distress suppliers would have otherwise experienced as a result of the collapse of the construction and real estate market. Amid a nationwide
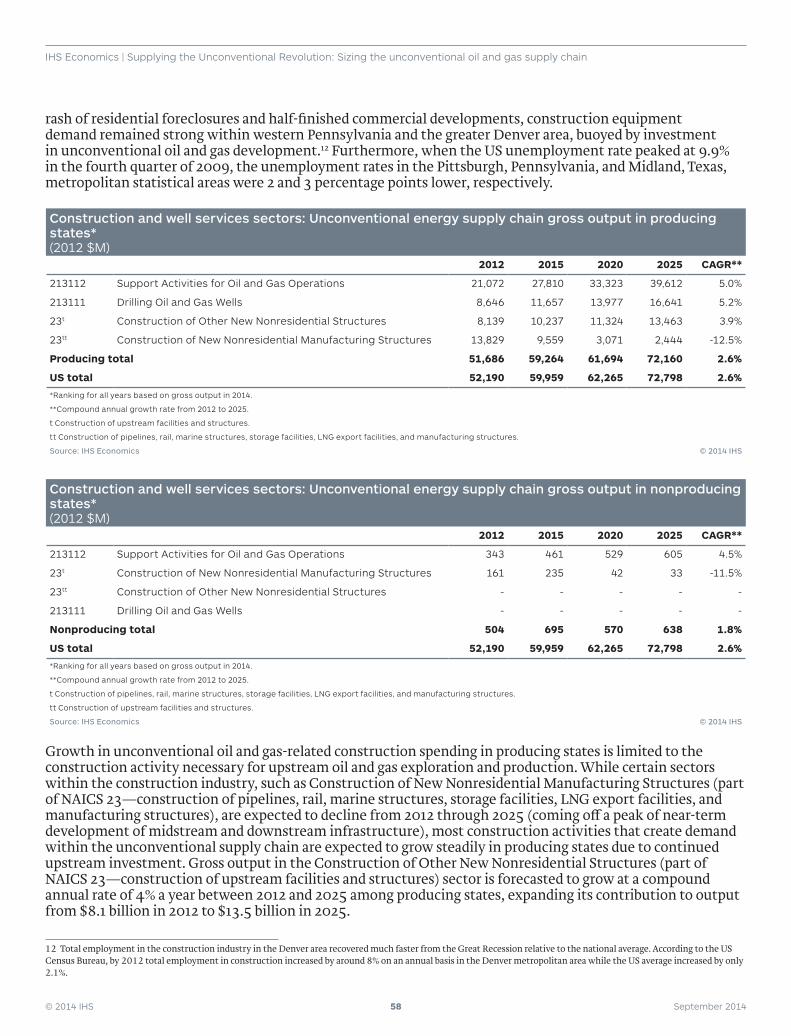
© 2014 IHS 58 September 2014
IHS Economics | Supplying the Unconventional Revolution: Sizing the unconventional oil and gas supply chain
rash of residential foreclosures and half-finished commercial developments, construction equipment demand remained strong within western Pennsylvania and the greater Denver area, buoyed by investment in unconventional oil and gas development.12 Furthermore, when the US unemployment rate peaked at 9.9% in the fourth quarter of 2009, the unemployment rates in the Pittsburgh, Pennsylvania, and Midland, Texas, metropolitan statistical areas were 2 and 3 percentage points lower, respectively.
Construction and well services sectors: Unconventional energy supply chain gross output in producing states* (2012 $M)
2012 2015 2020 2025 CAGR**
213112 Support Activities for Oil and Gas Operations 21,072 27,810 33,323 39,612 5.0%
213111 Drilling Oil and Gas Wells 8,646 11,657 13,977 16,641 5.2%
23t Construction of Other New Nonresidential Structures 8,139 10,237 11,324 13,463 3.9%
23tt Construction of New Nonresidential Manufacturing Structures 13,829 9,559 3,071 2,444 -12.5%
Producing total 51,686 59,264 61,694 72,160 2.6%
US total 52,190 59,959 62,265 72,798 2.6%
*Ranking for all years based on gross output in 2014.
**Compound annual growth rate from 2012 to 2025.
t Construction of upstream facilities and structures.
tt Construction of pipelines, rail, marine structures, storage facilities, LNG export facilities, and manufacturing structures.
Source: IHS Economics © 2014 IHS
Construction and well services sectors: Unconventional energy supply chain gross output in nonproducing states* (2012 $M)
2012 2015 2020 2025 CAGR**
213112 Support Activities for Oil and Gas Operations 343 461 529 605 4.5%
23t Construction of New Nonresidential Manufacturing Structures 161 235 42 33 -11.5%
23tt Construction of Other New Nonresidential Structures - - - - -
213111 Drilling Oil and Gas Wells - - - - -
Nonproducing total 504 695 570 638 1.8%
US total 52,190 59,959 62,265 72,798 2.6%
*Ranking for all years based on gross output in 2014.
**Compound annual growth rate from 2012 to 2025.
t Construction of pipelines, rail, marine structures, storage facilities, LNG export facilities, and manufacturing structures.
tt Construction of upstream facilities and structures.
Source: IHS Economics © 2014 IHS
Growth in unconventional oil and gas-related construction spending in producing states is limited to the construction activity necessary for upstream oil and gas exploration and production. While certain sectors within the construction industry, such as Construction of New Nonresidential Manufacturing Structures (part of NAICS 23—construction of pipelines, rail, marine structures, storage facilities, LNG export facilities, and manufacturing structures), are expected to decline from 2012 through 2025 (coming off a peak of near-term development of midstream and downstream infrastructure), most construction activities that create demand within the unconventional supply chain are expected to grow steadily in producing states due to continued upstream investment. Gross output in the Construction of Other New Nonresidential Structures (part of NAICS 23—construction of upstream facilities and structures) sector is forecasted to grow at a compound annual rate of 4% a year between 2012 and 2025 among producing states, expanding its contribution to output from $8.1 billion in 2012 to $13.5 billion in 2025.
12 Total employment in the construction industry in the Denver area recovered much faster from the Great Recession relative to the national average. According to the US Census Bureau, by 2012 total employment in construction increased by around 8% on an annual basis in the Denver metropolitan area while the US average increased by only 2.1%.
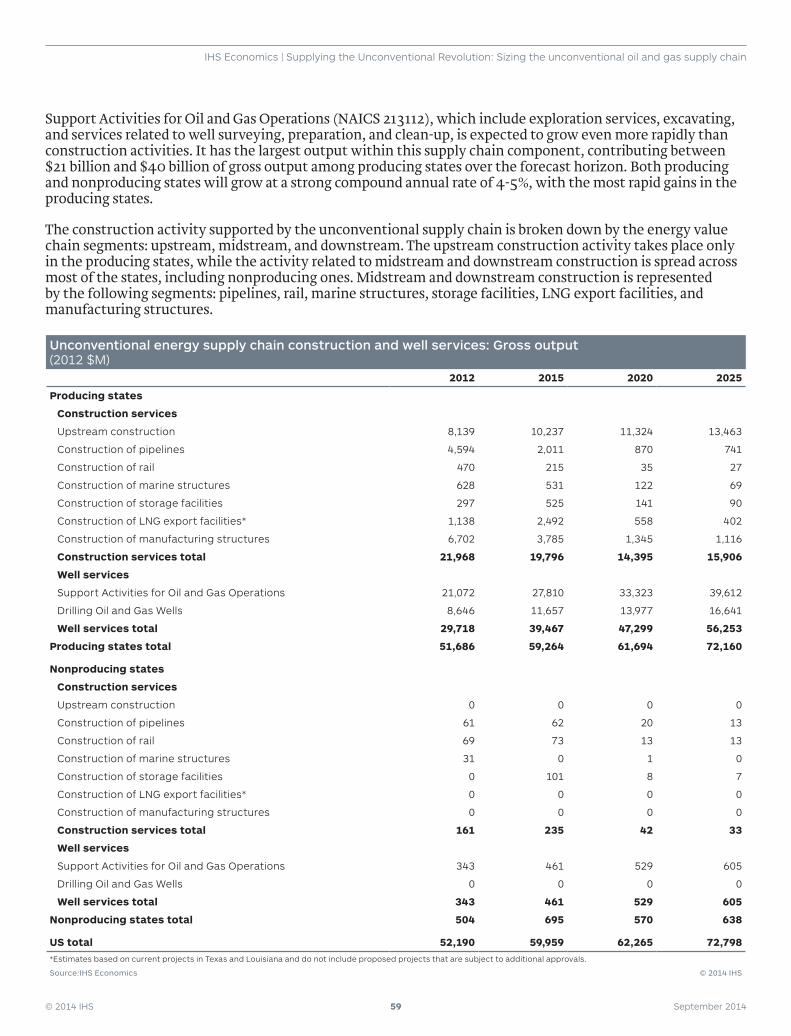
© 2014 IHS 59 September 2014
IHS Economics | Supplying the Unconventional Revolution: Sizing the unconventional oil and gas supply chain
Support Activities for Oil and Gas Operations (NAICS 213112), which include exploration services, excavating, and services related to well surveying, preparation, and clean-up, is expected to grow even more rapidly than construction activities. It has the largest output within this supply chain component, contributing between $21 billion and $40 billion of gross output among producing states over the forecast horizon. Both producing and nonproducing states will grow at a strong compound annual rate of 4-5%, with the most rapid gains in the producing states.
The construction activity supported by the unconventional supply chain is broken down by the energy value chain segments: upstream, midstream, and downstream. The upstream construction activity takes place only in the producing states, while the activity related to midstream and downstream construction is spread across most of the states, including nonproducing ones. Midstream and downstream construction is represented by the following segments: pipelines, rail, marine structures, storage facilities, LNG export facilities, and manufacturing structures.
Unconventional energy supply chain construction and well services: Gross output(2012 $M)
2012 2015 2020 2025
Producing states
Construction services
Upstream construction 8,139 10,237 11,324 13,463
Construction of pipelines 4,594 2,011 870 741
Construction of rail 470 215 35 27
Construction of marine structures 628 531 122 69
Construction of storage facilities 297 525 141 90
Construction of LNG export facilities* 1,138 2,492 558 402
Construction of manufacturing structures 6,702 3,785 1,345 1,116
Construction services total 21,968 19,796 14,395 15,906
Well services
Support Activities for Oil and Gas Operations 21,072 27,810 33,323 39,612
Drilling Oil and Gas Wells 8,646 11,657 13,977 16,641
Well services total 29,718 39,467 47,299 56,253
Producing states total 51,686 59,264 61,694 72,160
Nonproducing states
Construction services
Upstream construction 0 0 0 0
Construction of pipelines 61 62 20 13
Construction of rail 69 73 13 13
Construction of marine structures 31 0 1 0
Construction of storage facilities 0 101 8 7
Construction of LNG export facilities* 0 0 0 0
Construction of manufacturing structures 0 0 0 0
Construction services total 161 235 42 33
Well services
Support Activities for Oil and Gas Operations 343 461 529 605
Drilling Oil and Gas Wells 0 0 0 0
Well services total 343 461 529 605
Nonproducing states total 504 695 570 638
US total 52,190 59,959 62,265 72,798*Estimates based on current projects in Texas and Louisiana and do not include proposed projects that are subject to additional approvals.
Source:IHS Economics © 2014 IHS

© 2014 IHS 60 September 2014
IHS Economics | Supplying the Unconventional Revolution: Sizing the unconventional oil and gas supply chain
The states with the largest economic contributions in the construction sectors within the construction and well services core group supported by the unconventional energy supply chain are also the largest producing states. Texas and Pennsylvania account for more than 50% of gross output of the total unconventional energy supply chain construction activity over the forecast period.
Top-5 states: Unconventional energy supply chain gross output in construction and well services* (2012 $M)
2012 2015 2020 2025
Construction services
Texas 9,768 7,963 6,281 6,464
Louisiana 1,923 2,948 1,324 1,580
North Dakota 1,734 2,586 1,266 1,233
Pennsylvania 3,180 1,221 1,336 1,623
Oklahoma 1,182 1,275 1,684 2,128
Top-5 total 17,787 15,994 11,891 13,028
Construction services total 22,129 20,031 14,437 15,940
Well services
Texas 8,986 10,798 12,526 13,394
Pennsylvania 6,112 9,687 12,600 16,238
Louisiana 4,855 4,452 4,712 5,842
Colorado 3,273 3,676 4,409 5,081
North Dakota 1,828 2,868 2,989 3,111
Top-5 total 25,053 31,482 37,237 43,666
Well services total 30,061 39,928 47,828 56,858
US total 52,190 59,959 62,265 72,798
*Ranking for all years based on results in 2014.
Source:IHS Economics
The Utica Shale play has transformed the construction industry in eastern Ohio13
The diversity of recoverable resources in the Utica Shale (natural gas and oil, as well as natural gas liquids) drives the demand for a diverse supply chain. In order to maintain and grow the production of Utica resources, producers rely on a multitude of industries, which have transformed the construction and manufacturing sectors in Ohio.
For example, the oil and gas exploration of the Utica play has fueled the recent expansion of Bolt Construction. Bolt, an equipment manufacturing supplier to the oil and gas industry based in Youngstown Ohio, specializes in the construction of hydrant systems, compressor stations, and piping components. Over the past three years, the company has been experiencing record sales, driven mainly by unconventional activity in the Utica Shale in the eastern part of Ohio. Over the past several years, the company has doubled the size of its offices and more than tripled the number of its employees, from 30 a few years ago to more than 100 today. In order to accommodate the increased demand from oil and gas companies operating in the area, Bolt is in the process of building a state-of-the-art fabrication shop and is planning to expand its workforce even further.
13 The Business Journal, Youngstown, Ohio, September 24, 2012.
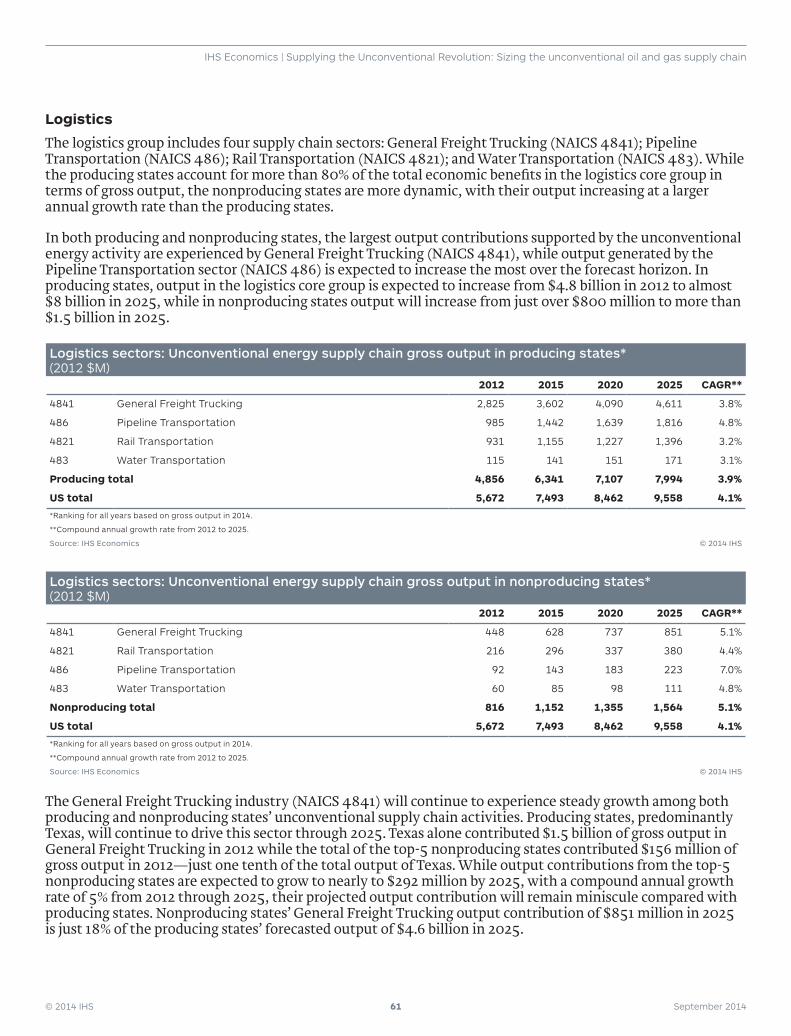
© 2014 IHS 61 September 2014
IHS Economics | Supplying the Unconventional Revolution: Sizing the unconventional oil and gas supply chain
Logistics
The logistics group includes four supply chain sectors: General Freight Trucking (NAICS 4841); Pipeline Transportation (NAICS 486); Rail Transportation (NAICS 4821); and Water Transportation (NAICS 483). While the producing states account for more than 80% of the total economic benefits in the logistics core group in terms of gross output, the nonproducing states are more dynamic, with their output increasing at a larger annual growth rate than the producing states.
In both producing and nonproducing states, the largest output contributions supported by the unconventional energy activity are experienced by General Freight Trucking (NAICS 4841), while output generated by the Pipeline Transportation sector (NAICS 486) is expected to increase the most over the forecast horizon. In producing states, output in the logistics core group is expected to increase from $4.8 billion in 2012 to almost $8 billion in 2025, while in nonproducing states output will increase from just over $800 million to more than $1.5 billion in 2025.
Logistics sectors: Unconventional energy supply chain gross output in producing states* (2012 $M)
2012 2015 2020 2025 CAGR**
4841 General Freight Trucking 2,825 3,602 4,090 4,611 3.8%
486 Pipeline Transportation 985 1,442 1,639 1,816 4.8%
4821 Rail Transportation 931 1,155 1,227 1,396 3.2%
483 Water Transportation 115 141 151 171 3.1%
Producing total 4,856 6,341 7,107 7,994 3.9%
US total 5,672 7,493 8,462 9,558 4.1%
*Ranking for all years based on gross output in 2014.
**Compound annual growth rate from 2012 to 2025.
Source: IHS Economics © 2014 IHS
Logistics sectors: Unconventional energy supply chain gross output in nonproducing states* (2012 $M)
2012 2015 2020 2025 CAGR**
4841 General Freight Trucking 448 628 737 851 5.1%
4821 Rail Transportation 216 296 337 380 4.4%
486 Pipeline Transportation 92 143 183 223 7.0%
483 Water Transportation 60 85 98 111 4.8%
Nonproducing total 816 1,152 1,355 1,564 5.1%
US total 5,672 7,493 8,462 9,558 4.1%
*Ranking for all years based on gross output in 2014.
**Compound annual growth rate from 2012 to 2025.
Source: IHS Economics © 2014 IHS
The General Freight Trucking industry (NAICS 4841) will continue to experience steady growth among both producing and nonproducing states’ unconventional supply chain activities. Producing states, predominantly Texas, will continue to drive this sector through 2025. Texas alone contributed $1.5 billion of gross output in General Freight Trucking in 2012 while the total of the top-5 nonproducing states contributed $156 million of gross output in 2012—just one tenth of the total output of Texas. While output contributions from the top-5 nonproducing states are expected to grow to nearly to $292 million by 2025, with a compound annual growth rate of 5% from 2012 through 2025, their projected output contribution will remain miniscule compared with producing states. Nonproducing states’ General Freight Trucking output contribution of $851 million in 2025 is just 18% of the producing states’ forecasted output of $4.6 billion in 2025.
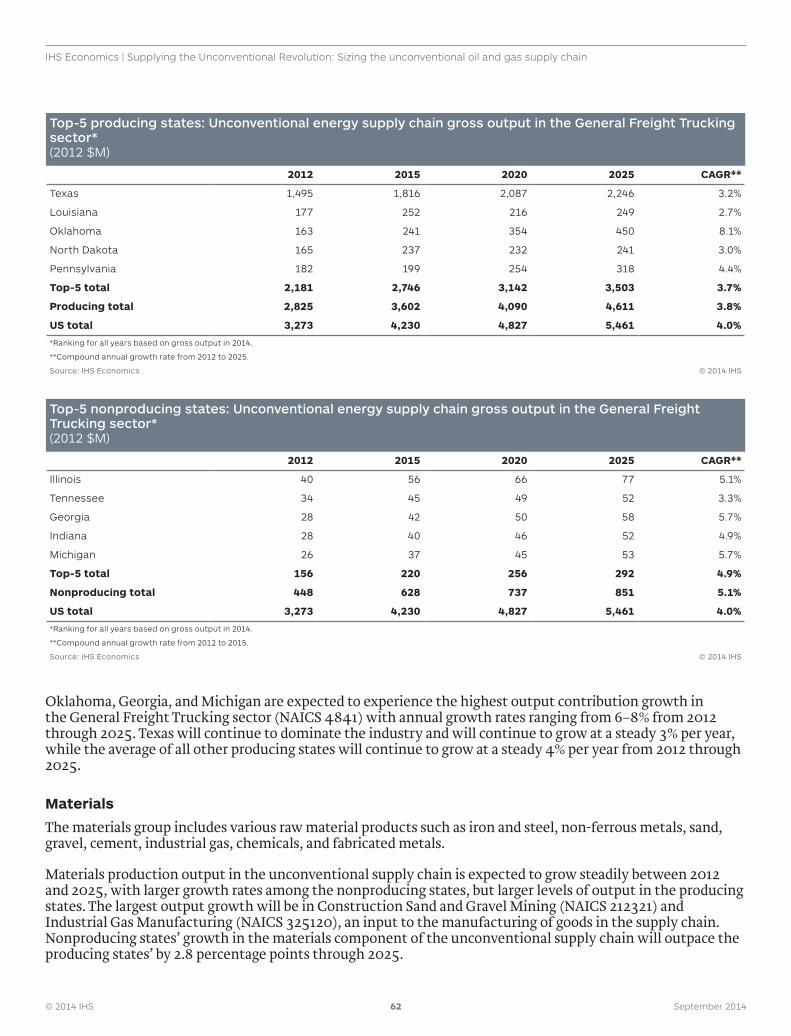
© 2014 IHS 62 September 2014
IHS Economics | Supplying the Unconventional Revolution: Sizing the unconventional oil and gas supply chain
Top-5 producing states: Unconventional energy supply chain gross output in the General Freight Trucking sector* (2012 $M)
2012 2015 2020 2025 CAGR**
Texas 1,495 1,816 2,087 2,246 3.2%
Louisiana 177 252 216 249 2.7%
Oklahoma 163 241 354 450 8.1%
North Dakota 165 237 232 241 3.0%
Pennsylvania 182 199 254 318 4.4%
Top-5 total 2,181 2,746 3,142 3,503 3.7%
Producing total 2,825 3,602 4,090 4,611 3.8%
US total 3,273 4,230 4,827 5,461 4.0%
*Ranking for all years based on gross output in 2014.
**Compound annual growth rate from 2012 to 2025.
Source: IHS Economics © 2014 IHS
Top-5 nonproducing states: Unconventional energy supply chain gross output in the General Freight Trucking sector* (2012 $M)
2012 2015 2020 2025 CAGR**
Illinois 40 56 66 77 5.1%
Tennessee 34 45 49 52 3.3%
Georgia 28 42 50 58 5.7%
Indiana 28 40 46 52 4.9%
Michigan 26 37 45 53 5.7%
Top-5 total 156 220 256 292 4.9%
Nonproducing total 448 628 737 851 5.1%
US total 3,273 4,230 4,827 5,461 4.0%
*Ranking for all years based on gross output in 2014.
**Compound annual growth rate from 2012 to 2015.
Source: IHS Economics © 2014 IHS
Oklahoma, Georgia, and Michigan are expected to experience the highest output contribution growth in the General Freight Trucking sector (NAICS 4841) with annual growth rates ranging from 6–8% from 2012 through 2025. Texas will continue to dominate the industry and will continue to grow at a steady 3% per year, while the average of all other producing states will continue to grow at a steady 4% per year from 2012 through 2025.
Materials
The materials group includes various raw material products such as iron and steel, non-ferrous metals, sand, gravel, cement, industrial gas, chemicals, and fabricated metals.
Materials production output in the unconventional supply chain is expected to grow steadily between 2012 and 2025, with larger growth rates among the nonproducing states, but larger levels of output in the producing states. The largest output growth will be in Construction Sand and Gravel Mining (NAICS 212321) and Industrial Gas Manufacturing (NAICS 325120), an input to the manufacturing of goods in the supply chain. Nonproducing states’ growth in the materials component of the unconventional supply chain will outpace the producing states’ by 2.8 percentage points through 2025.
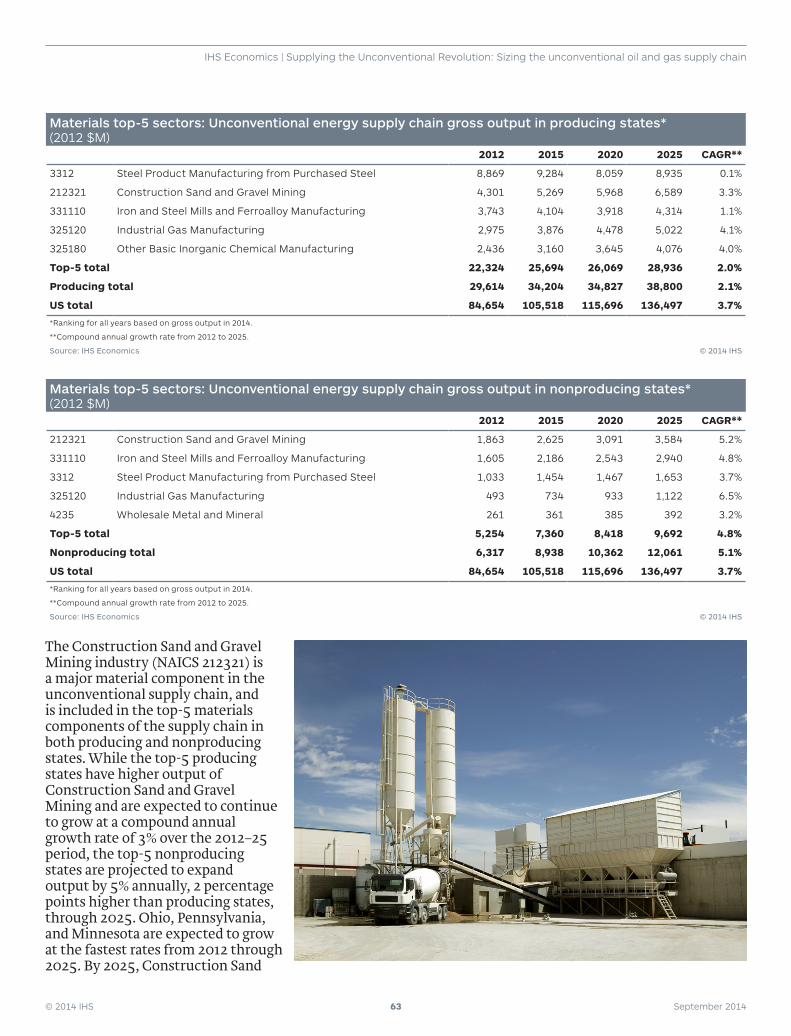
© 2014 IHS 63 September 2014
IHS Economics | Supplying the Unconventional Revolution: Sizing the unconventional oil and gas supply chain
Materials top-5 sectors: Unconventional energy supply chain gross output in producing states* (2012 $M)
2012 2015 2020 2025 CAGR**
3312 Steel Product Manufacturing from Purchased Steel 8,869 9,284 8,059 8,935 0.1%
212321 Construction Sand and Gravel Mining 4,301 5,269 5,968 6,589 3.3%
331110 Iron and Steel Mills and Ferroalloy Manufacturing 3,743 4,104 3,918 4,314 1.1%
325120 Industrial Gas Manufacturing 2,975 3,876 4,478 5,022 4.1%
325180 Other Basic Inorganic Chemical Manufacturing 2,436 3,160 3,645 4,076 4.0%
Top-5 total 22,324 25,694 26,069 28,936 2.0%
Producing total 29,614 34,204 34,827 38,800 2.1%
US total 84,654 105,518 115,696 136,497 3.7%
*Ranking for all years based on gross output in 2014.
**Compound annual growth rate from 2012 to 2025.
Source: IHS Economics © 2014 IHS
Materials top-5 sectors: Unconventional energy supply chain gross output in nonproducing states* (2012 $M)
2012 2015 2020 2025 CAGR**
212321 Construction Sand and Gravel Mining 1,863 2,625 3,091 3,584 5.2%
331110 Iron and Steel Mills and Ferroalloy Manufacturing 1,605 2,186 2,543 2,940 4.8%
3312 Steel Product Manufacturing from Purchased Steel 1,033 1,454 1,467 1,653 3.7%
325120 Industrial Gas Manufacturing 493 734 933 1,122 6.5%
4235 Wholesale Metal and Mineral 261 361 385 392 3.2%
Top-5 total 5,254 7,360 8,418 9,692 4.8%
Nonproducing total 6,317 8,938 10,362 12,061 5.1%
US total 84,654 105,518 115,696 136,497 3.7%
*Ranking for all years based on gross output in 2014.
**Compound annual growth rate from 2012 to 2025.
Source: IHS Economics © 2014 IHS
The Construction Sand and Gravel Mining industry (NAICS 212321) is a major material component in the unconventional supply chain, and is included in the top-5 materials components of the supply chain in both producing and nonproducing states. While the top-5 producing states have higher output of Construction Sand and Gravel Mining and are expected to continue to grow at a compound annual growth rate of 3% over the 2012–25 period, the top-5 nonproducing states are projected to expand output by 5% annually, 2 percentage points higher than producing states, through 2025. Ohio, Pennsylvania, and Minnesota are expected to grow at the fastest rates from 2012 through 2025. By 2025, Construction Sand
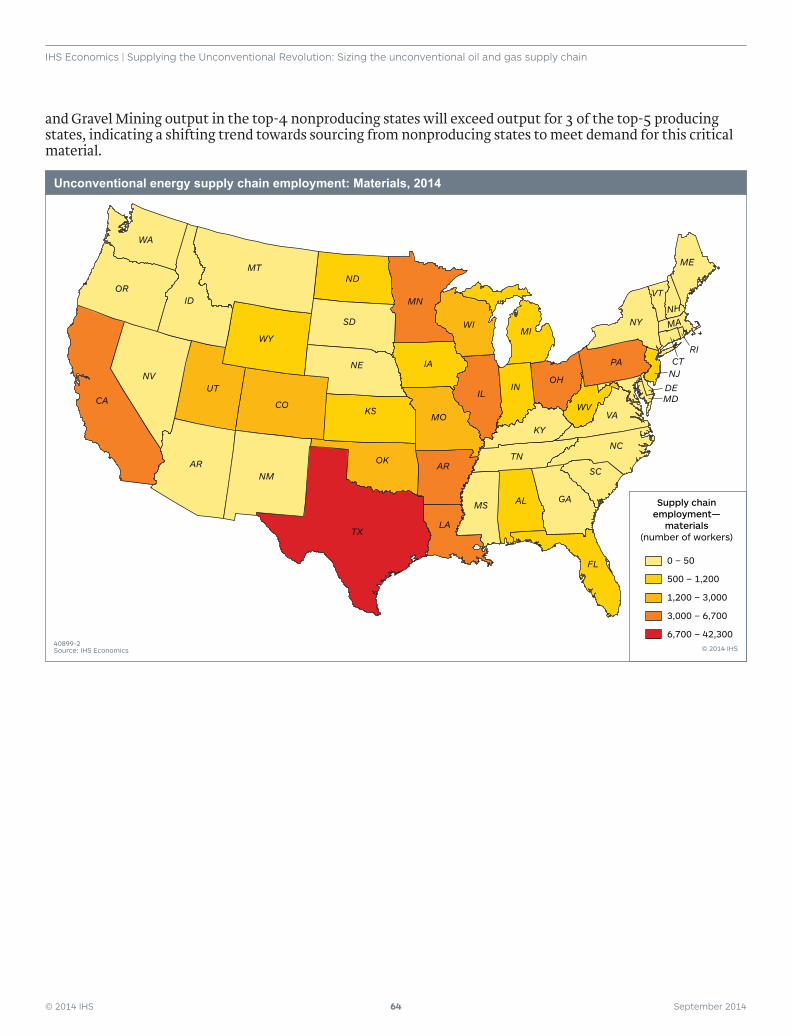
© 2014 IHS 64 September 2014
IHS Economics | Supplying the Unconventional Revolution: Sizing the unconventional oil and gas supply chain
and Gravel Mining output in the top-4 nonproducing states will exceed output for 3 of the top-5 producing states, indicating a shifting trend towards sourcing from nonproducing states to meet demand for this critical material.
CA
NV
OR
WA
MT
ID
ND
NE
KS
OK
SD
WY
CO
UT
ARNM
TX
MN
MI
IA
MO
AR
WI
LA
MS AL GA
SC
NC
VAWV
TN
KY
OH
PA
NY MA
RICTNJDEMD
ME
NH
VT
INIL
FL
Supply chainemployment—
materials(number of workers)
0 – 50
500 – 1,200
1,200 – 3,000
3,000 – 6,700
6,700 – 42,300© 2014 IHS
40899-2Source: IHS Economics
Unconventional energy supply chain employment: Materials, 2014
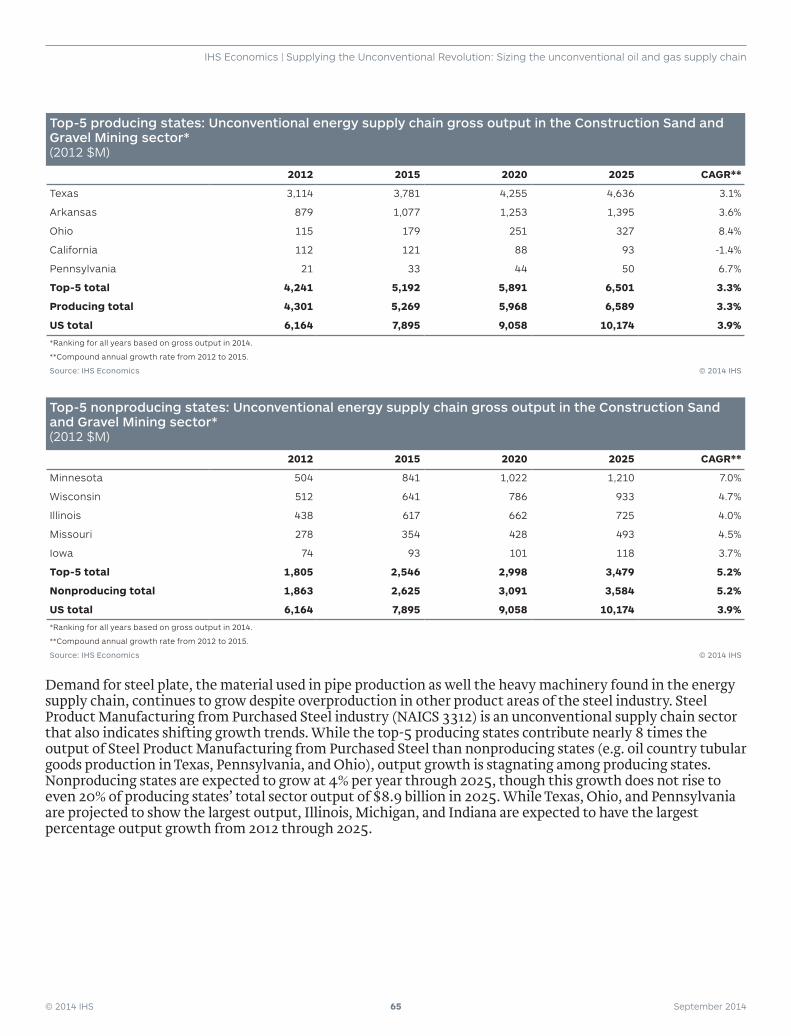
© 2014 IHS 65 September 2014
IHS Economics | Supplying the Unconventional Revolution: Sizing the unconventional oil and gas supply chain
Top-5 producing states: Unconventional energy supply chain gross output in the Construction Sand and Gravel Mining sector* (2012 $M)
2012 2015 2020 2025 CAGR**
Texas 3,114 3,781 4,255 4,636 3.1%
Arkansas 879 1,077 1,253 1,395 3.6%
Ohio 115 179 251 327 8.4%
California 112 121 88 93 -1.4%
Pennsylvania 21 33 44 50 6.7%
Top-5 total 4,241 5,192 5,891 6,501 3.3%
Producing total 4,301 5,269 5,968 6,589 3.3%
US total 6,164 7,895 9,058 10,174 3.9%
*Ranking for all years based on gross output in 2014.
**Compound annual growth rate from 2012 to 2015.
Source: IHS Economics © 2014 IHS
Top-5 nonproducing states: Unconventional energy supply chain gross output in the Construction Sand and Gravel Mining sector* (2012 $M)
2012 2015 2020 2025 CAGR**
Minnesota 504 841 1,022 1,210 7.0%
Wisconsin 512 641 786 933 4.7%
Illinois 438 617 662 725 4.0%
Missouri 278 354 428 493 4.5%
Iowa 74 93 101 118 3.7%
Top-5 total 1,805 2,546 2,998 3,479 5.2%
Nonproducing total 1,863 2,625 3,091 3,584 5.2%
US total 6,164 7,895 9,058 10,174 3.9%
*Ranking for all years based on gross output in 2014.
**Compound annual growth rate from 2012 to 2015.
Source: IHS Economics © 2014 IHS
Demand for steel plate, the material used in pipe production as well the heavy machinery found in the energy supply chain, continues to grow despite overproduction in other product areas of the steel industry. Steel Product Manufacturing from Purchased Steel industry (NAICS 3312) is an unconventional supply chain sector that also indicates shifting growth trends. While the top-5 producing states contribute nearly 8 times the output of Steel Product Manufacturing from Purchased Steel than nonproducing states (e.g. oil country tubular goods production in Texas, Pennsylvania, and Ohio), output growth is stagnating among producing states. Nonproducing states are expected to grow at 4% per year through 2025, though this growth does not rise to even 20% of producing states’ total sector output of $8.9 billion in 2025. While Texas, Ohio, and Pennsylvania are projected to show the largest output, Illinois, Michigan, and Indiana are expected to have the largest percentage output growth from 2012 through 2025.
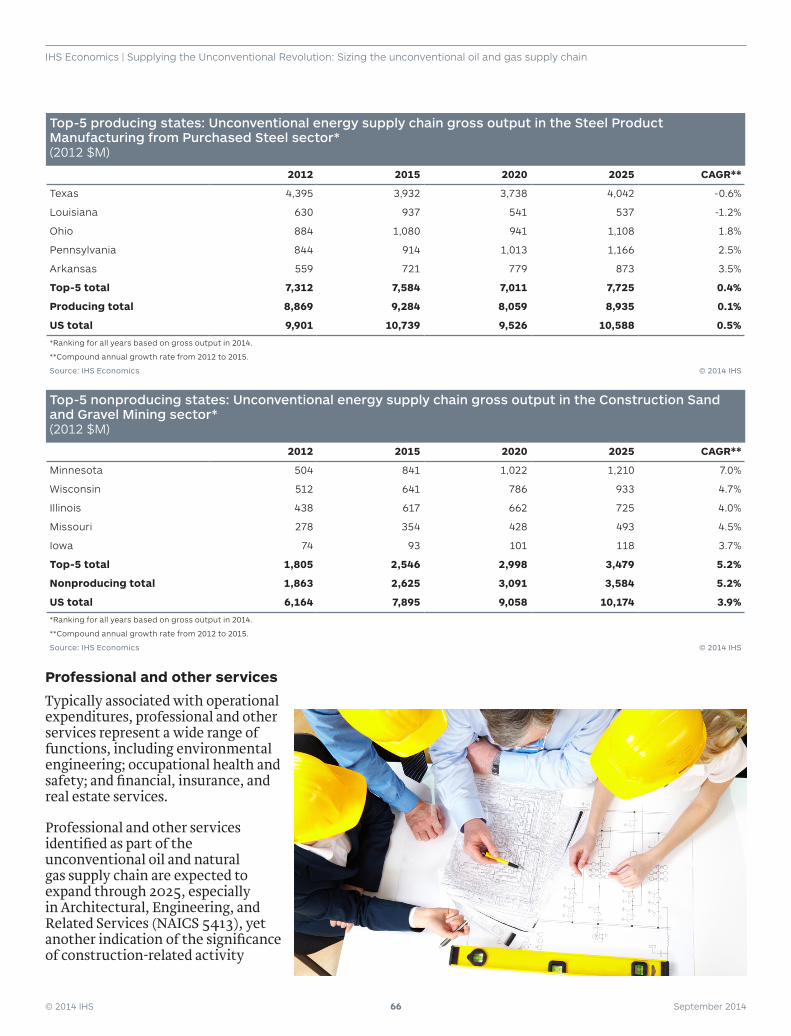
© 2014 IHS 66 September 2014
IHS Economics | Supplying the Unconventional Revolution: Sizing the unconventional oil and gas supply chain
Top-5 producing states: Unconventional energy supply chain gross output in the Steel Product Manufacturing from Purchased Steel sector* (2012 $M)
2012 2015 2020 2025 CAGR**
Texas 4,395 3,932 3,738 4,042 -0.6%
Louisiana 630 937 541 537 -1.2%
Ohio 884 1,080 941 1,108 1.8%
Pennsylvania 844 914 1,013 1,166 2.5%
Arkansas 559 721 779 873 3.5%
Top-5 total 7,312 7,584 7,011 7,725 0.4%
Producing total 8,869 9,284 8,059 8,935 0.1%
US total 9,901 10,739 9,526 10,588 0.5%
*Ranking for all years based on gross output in 2014.
**Compound annual growth rate from 2012 to 2015.
Source: IHS Economics © 2014 IHS
Top-5 nonproducing states: Unconventional energy supply chain gross output in the Construction Sand and Gravel Mining sector* (2012 $M)
2012 2015 2020 2025 CAGR**
Minnesota 504 841 1,022 1,210 7.0%
Wisconsin 512 641 786 933 4.7%
Illinois 438 617 662 725 4.0%
Missouri 278 354 428 493 4.5%
Iowa 74 93 101 118 3.7%
Top-5 total 1,805 2,546 2,998 3,479 5.2%
Nonproducing total 1,863 2,625 3,091 3,584 5.2%
US total 6,164 7,895 9,058 10,174 3.9%
*Ranking for all years based on gross output in 2014.
**Compound annual growth rate from 2012 to 2015.
Source: IHS Economics © 2014 IHS
Professional and other services
Typically associated with operational expenditures, professional and other services represent a wide range of functions, including environmental engineering; occupational health and safety; and financial, insurance, and real estate services.
Professional and other services identified as part of the unconventional oil and natural gas supply chain are expected to expand through 2025, especially in Architectural, Engineering, and Related Services (NAICS 5413), yet another indication of the significance of construction-related activity
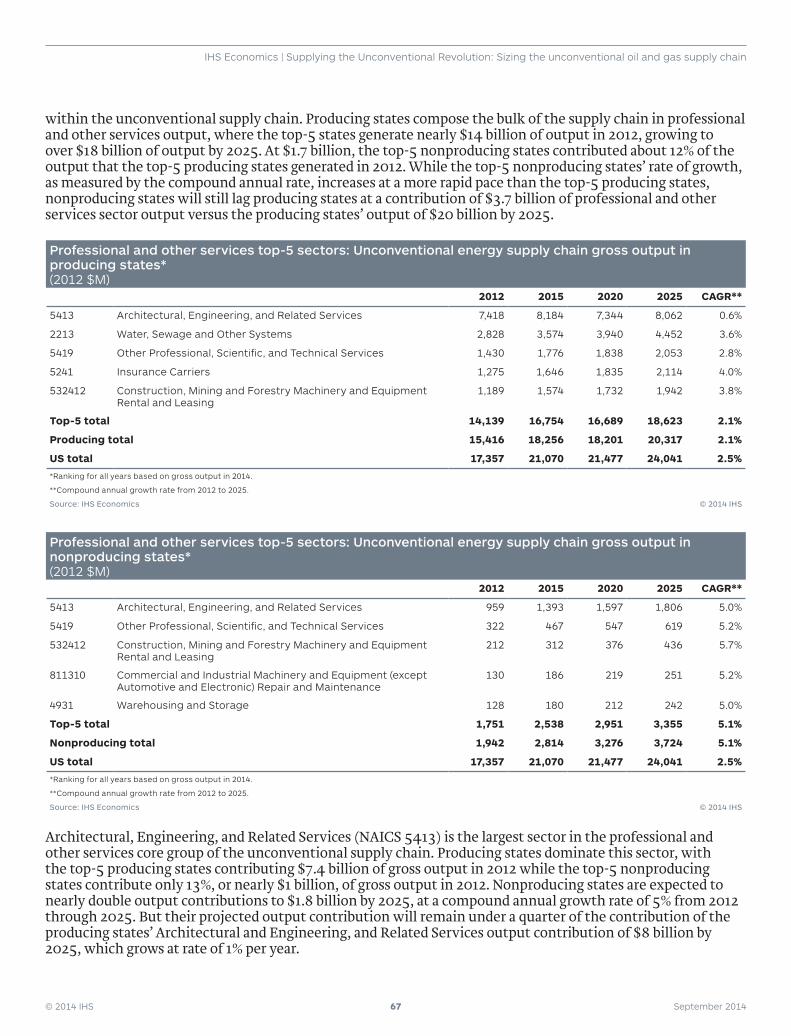
© 2014 IHS 67 September 2014
IHS Economics | Supplying the Unconventional Revolution: Sizing the unconventional oil and gas supply chain
within the unconventional supply chain. Producing states compose the bulk of the supply chain in professional and other services output, where the top-5 states generate nearly $14 billion of output in 2012, growing to over $18 billion of output by 2025. At $1.7 billion, the top-5 nonproducing states contributed about 12% of the output that the top-5 producing states generated in 2012. While the top-5 nonproducing states’ rate of growth, as measured by the compound annual rate, increases at a more rapid pace than the top-5 producing states, nonproducing states will still lag producing states at a contribution of $3.7 billion of professional and other services sector output versus the producing states’ output of $20 billion by 2025.
Professional and other services top-5 sectors: Unconventional energy supply chain gross output in producing states* (2012 $M)
2012 2015 2020 2025 CAGR**
5413 Architectural, Engineering, and Related Services 7,418 8,184 7,344 8,062 0.6%
2213 Water, Sewage and Other Systems 2,828 3,574 3,940 4,452 3.6%
5419 Other Professional, Scientific, and Technical Services 1,430 1,776 1,838 2,053 2.8%
5241 Insurance Carriers 1,275 1,646 1,835 2,114 4.0%
532412 Construction, Mining and Forestry Machinery and Equipment Rental and Leasing
1,189 1,574 1,732 1,942 3.8%
Top-5 total 14,139 16,754 16,689 18,623 2.1%
Producing total 15,416 18,256 18,201 20,317 2.1%
US total 17,357 21,070 21,477 24,041 2.5%
*Ranking for all years based on gross output in 2014.
**Compound annual growth rate from 2012 to 2025.
Source: IHS Economics © 2014 IHS
Professional and other services top-5 sectors: Unconventional energy supply chain gross output in nonproducing states* (2012 $M)
2012 2015 2020 2025 CAGR**
5413 Architectural, Engineering, and Related Services 959 1,393 1,597 1,806 5.0%
5419 Other Professional, Scientific, and Technical Services 322 467 547 619 5.2%
532412 Construction, Mining and Forestry Machinery and Equipment Rental and Leasing
212 312 376 436 5.7%
811310 Commercial and Industrial Machinery and Equipment (except Automotive and Electronic) Repair and Maintenance
130 186 219 251 5.2%
4931 Warehousing and Storage 128 180 212 242 5.0%
Top-5 total 1,751 2,538 2,951 3,355 5.1%
Nonproducing total 1,942 2,814 3,276 3,724 5.1%
US total 17,357 21,070 21,477 24,041 2.5%
*Ranking for all years based on gross output in 2014.
**Compound annual growth rate from 2012 to 2025.
Source: IHS Economics © 2014 IHS
Architectural, Engineering, and Related Services (NAICS 5413) is the largest sector in the professional and other services core group of the unconventional supply chain. Producing states dominate this sector, with the top-5 producing states contributing $7.4 billion of gross output in 2012 while the top-5 nonproducing states contribute only 13%, or nearly $1 billion, of gross output in 2012. Nonproducing states are expected to nearly double output contributions to $1.8 billion by 2025, at a compound annual growth rate of 5% from 2012 through 2025. But their projected output contribution will remain under a quarter of the contribution of the producing states’ Architectural and Engineering, and Related Services output contribution of $8 billion by 2025, which grows at rate of 1% per year.
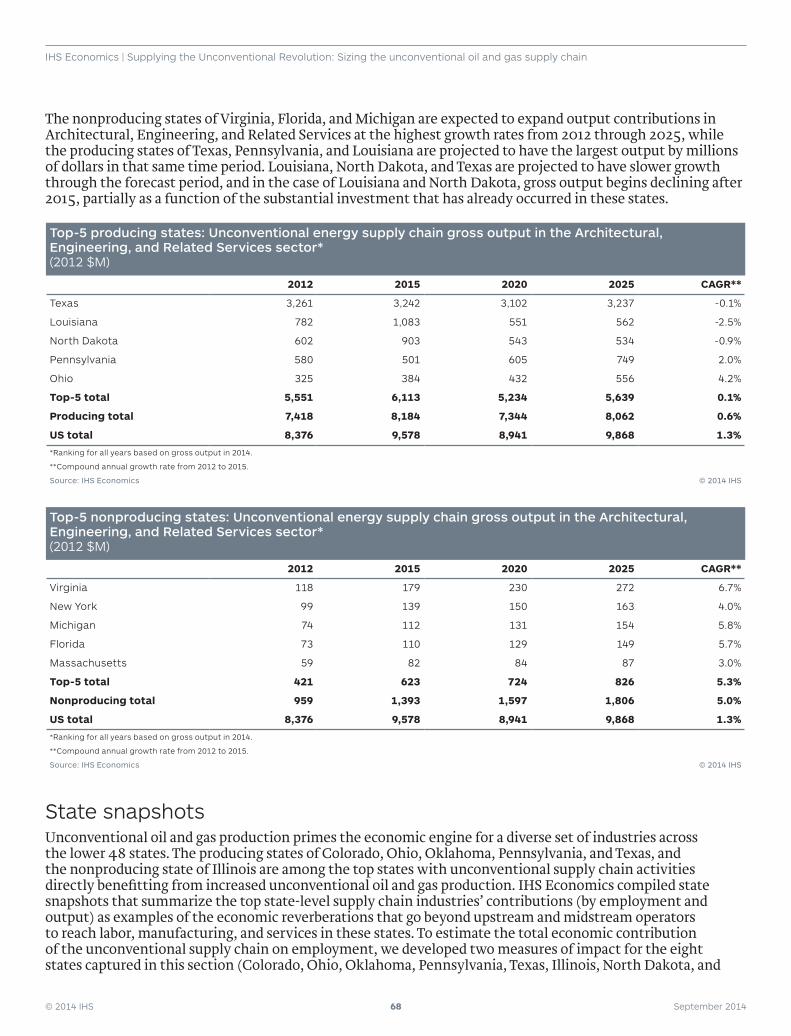
© 2014 IHS 68 September 2014
IHS Economics | Supplying the Unconventional Revolution: Sizing the unconventional oil and gas supply chain
The nonproducing states of Virginia, Florida, and Michigan are expected to expand output contributions in Architectural, Engineering, and Related Services at the highest growth rates from 2012 through 2025, while the producing states of Texas, Pennsylvania, and Louisiana are projected to have the largest output by millions of dollars in that same time period. Louisiana, North Dakota, and Texas are projected to have slower growth through the forecast period, and in the case of Louisiana and North Dakota, gross output begins declining after 2015, partially as a function of the substantial investment that has already occurred in these states.
Top-5 producing states: Unconventional energy supply chain gross output in the Architectural, Engineering, and Related Services sector* (2012 $M)
2012 2015 2020 2025 CAGR**
Texas 3,261 3,242 3,102 3,237 -0.1%
Louisiana 782 1,083 551 562 -2.5%
North Dakota 602 903 543 534 -0.9%
Pennsylvania 580 501 605 749 2.0%
Ohio 325 384 432 556 4.2%
Top-5 total 5,551 6,113 5,234 5,639 0.1%
Producing total 7,418 8,184 7,344 8,062 0.6%
US total 8,376 9,578 8,941 9,868 1.3%
*Ranking for all years based on gross output in 2014.
**Compound annual growth rate from 2012 to 2015.
Source: IHS Economics © 2014 IHS
Top-5 nonproducing states: Unconventional energy supply chain gross output in the Architectural, Engineering, and Related Services sector* (2012 $M)
2012 2015 2020 2025 CAGR**
Virginia 118 179 230 272 6.7%
New York 99 139 150 163 4.0%
Michigan 74 112 131 154 5.8%
Florida 73 110 129 149 5.7%
Massachusetts 59 82 84 87 3.0%
Top-5 total 421 623 724 826 5.3%
Nonproducing total 959 1,393 1,597 1,806 5.0%
US total 8,376 9,578 8,941 9,868 1.3%
*Ranking for all years based on gross output in 2014.
**Compound annual growth rate from 2012 to 2015.
Source: IHS Economics © 2014 IHS
State snapshotsUnconventional oil and gas production primes the economic engine for a diverse set of industries across the lower 48 states. The producing states of Colorado, Ohio, Oklahoma, Pennsylvania, and Texas, and the nonproducing state of Illinois are among the top states with unconventional supply chain activities directly benefitting from increased unconventional oil and gas production. IHS Economics compiled state snapshots that summarize the top state-level supply chain industries’ contributions (by employment and output) as examples of the economic reverberations that go beyond upstream and midstream operators to reach labor, manufacturing, and services in these states. To estimate the total economic contribution of the unconventional supply chain on employment, we developed two measures of impact for the eight states captured in this section (Colorado, Ohio, Oklahoma, Pennsylvania, Texas, Illinois, North Dakota, and
© 2014 IHS 69 September 2014
IHS Economics | Supplying the Unconventional Revolution: Sizing the unconventional oil and gas supply chain
Louisiana): Unconventional supply chain employment as a share of total unconventional energy activity employment as a share of total state employment.
The shares of the unconventional energy supply chain employment in total state employment among the eight states analyzed range from 0.1% in Illinois in 2012 to 7% in 2015 in North Dakota. Each state analyzed is expected to grow its share of supply chain employment relative to overall state employment through 2025, with the exception of Texas. The largest proportional supply chain employment growth will be in Oklahoma, which will grow from 1.4% in 2012 to 2.9% in 2025.
Several of the eight states had active plays in proximity to metropolitan statistical areas (MSA). MSA total employment is contrasted with MSA employment in the natural resources, construction and mining sectors to give a sense of the importance of these industries to the MSA area. State-level supply chain employment in natural resources, construction, and total mining are compared with MSA level employment in those industries, which provides insight into the depth of supply chain impacts on the state and MSA. For example, Texas’s combined Midland and Lubbock MSAs have employment in natural resources, construction, and mining that is less significant when compared with the employment in the state’s overall unconventional oil and gas supply chain activities. Ohio’s state-level employment in natural resources, construction, and mining will grow rapidly, even surpassing employment levels in the same industries in the Youngstown-Warren-Boardman MSA by 2025.
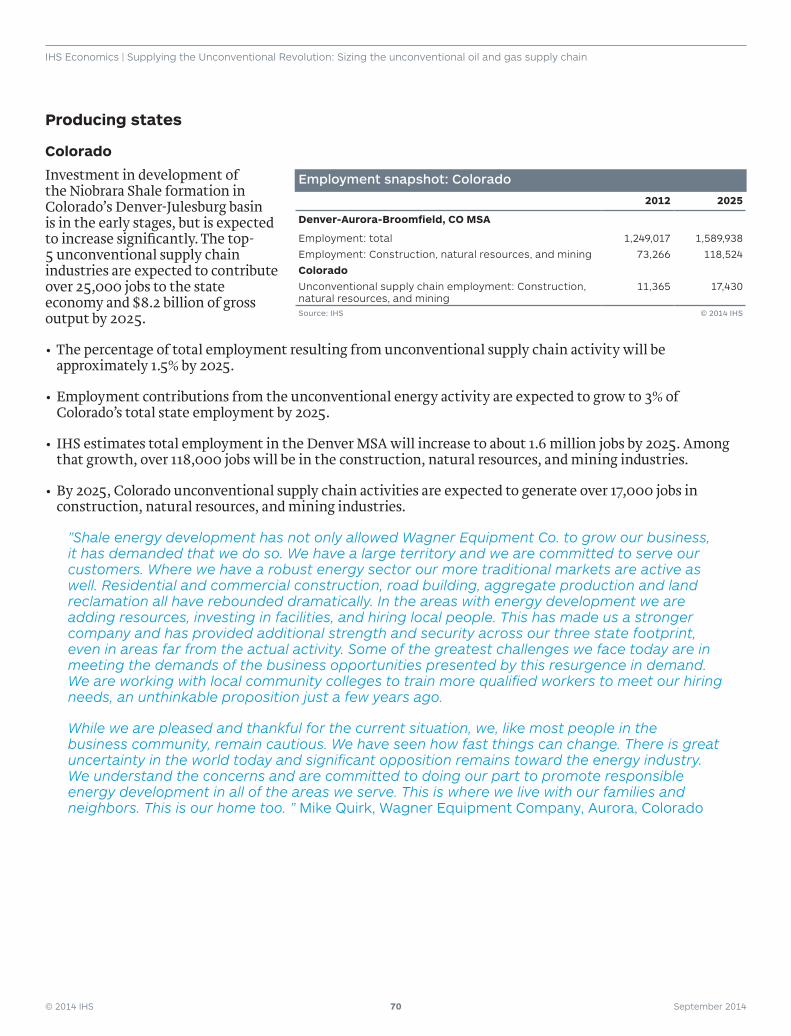
© 2014 IHS 70 September 2014
IHS Economics | Supplying the Unconventional Revolution: Sizing the unconventional oil and gas supply chain
Producing states
Colorado
Investment in development of the Niobrara Shale formation in Colorado’s Denver-Julesburg basin is in the early stages, but is expected to increase significantly. The top-5 unconventional supply chain industries are expected to contribute over 25,000 jobs to the state economy and $8.2 billion of gross output by 2025.
•The percentage of total employment resulting from unconventional supply chain activity will be approximately 1.5% by 2025.
•Employment contributions from the unconventional energy activity are expected to grow to 3% of Colorado’s total state employment by 2025.
• IHS estimates total employment in the Denver MSA will increase to about 1.6 million jobs by 2025. Among that growth, over 118,000 jobs will be in the construction, natural resources, and mining industries.
•By 2025, Colorado unconventional supply chain activities are expected to generate over 17,000 jobs in construction, natural resources, and mining industries.
”Shale energy development has not only allowed Wagner Equipment Co. to grow our business, it has demanded that we do so. We have a large territory and we are committed to serve our customers. Where we have a robust energy sector our more traditional markets are active as well. Residential and commercial construction, road building, aggregate production and land reclamation all have rebounded dramatically. In the areas with energy development we are adding resources, investing in facilities, and hiring local people. This has made us a stronger company and has provided additional strength and security across our three state footprint, even in areas far from the actual activity. Some of the greatest challenges we face today are in meeting the demands of the business opportunities presented by this resurgence in demand. We are working with local community colleges to train more qualified workers to meet our hiring needs, an unthinkable proposition just a few years ago.
While we are pleased and thankful for the current situation, we, like most people in the business community, remain cautious. We have seen how fast things can change. There is great uncertainty in the world today and significant opposition remains toward the energy industry. We understand the concerns and are committed to doing our part to promote responsible energy development in all of the areas we serve. This is where we live with our families and neighbors. This is our home too. ” Mike Quirk, Wagner Equipment Company, Aurora, Colorado
Employment snapshot: Colorado
2012 2025
Denver-Aurora-Broomfield, CO MSA
Employment: total 1,249,017 1,589,938
Employment: Construction, natural resources, and mining 73,266 118,524
Colorado
Unconventional supply chain employment: Construction, natural resources, and mining
11,365 17,430
Source: IHS © 2014 IHS
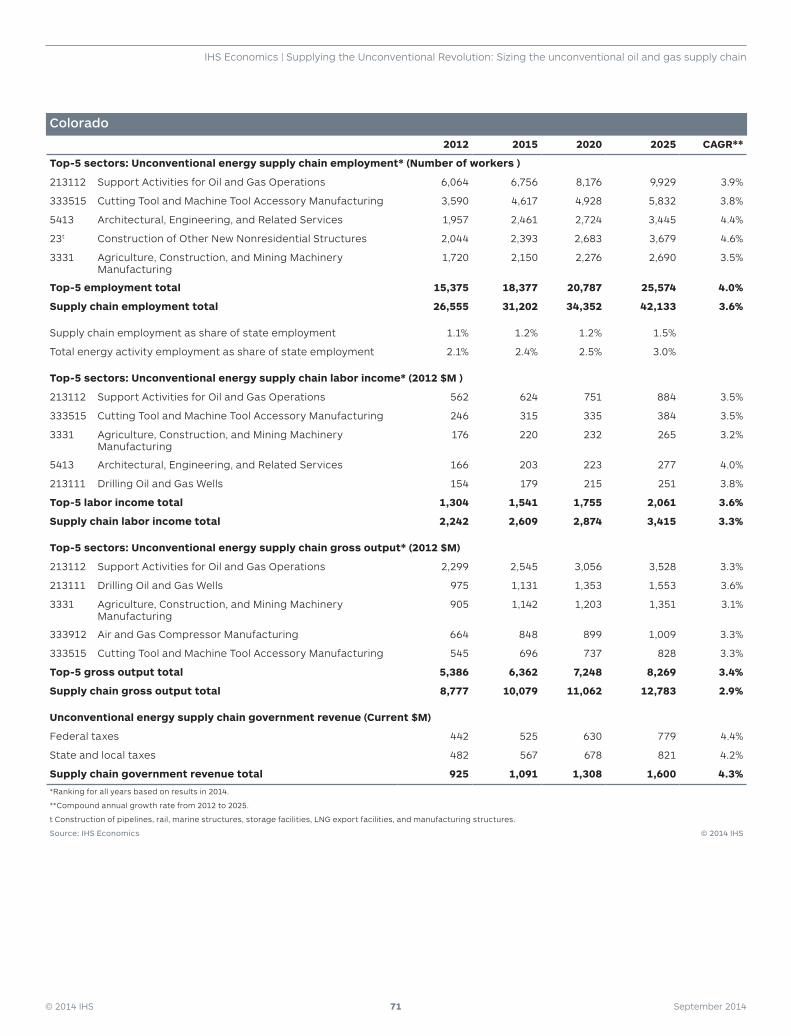
© 2014 IHS 71 September 2014
IHS Economics | Supplying the Unconventional Revolution: Sizing the unconventional oil and gas supply chain
Colorado
2012 2015 2020 2025 CAGR**
Top-5 sectors: Unconventional energy supply chain employment* (Number of workers )
213112 Support Activities for Oil and Gas Operations 6,064 6,756 8,176 9,929 3.9%
333515 Cutting Tool and Machine Tool Accessory Manufacturing 3,590 4,617 4,928 5,832 3.8%
5413 Architectural, Engineering, and Related Services 1,957 2,461 2,724 3,445 4.4%
23t Construction of Other New Nonresidential Structures 2,044 2,393 2,683 3,679 4.6%
3331 Agriculture, Construction, and Mining Machinery Manufacturing
1,720 2,150 2,276 2,690 3.5%
Top-5 employment total 15,375 18,377 20,787 25,574 4.0%
Supply chain employment total 26,555 31,202 34,352 42,133 3.6%
Supply chain employment as share of state employment 1.1% 1.2% 1.2% 1.5%
Total energy activity employment as share of state employment 2.1% 2.4% 2.5% 3.0%
Top-5 sectors: Unconventional energy supply chain labor income* (2012 $M )
213112 Support Activities for Oil and Gas Operations 562 624 751 884 3.5%
333515 Cutting Tool and Machine Tool Accessory Manufacturing 246 315 335 384 3.5%
3331 Agriculture, Construction, and Mining Machinery Manufacturing
176 220 232 265 3.2%
5413 Architectural, Engineering, and Related Services 166 203 223 277 4.0%
213111 Drilling Oil and Gas Wells 154 179 215 251 3.8%
Top-5 labor income total 1,304 1,541 1,755 2,061 3.6%
Supply chain labor income total 2,242 2,609 2,874 3,415 3.3%
Top-5 sectors: Unconventional energy supply chain gross output* (2012 $M)
213112 Support Activities for Oil and Gas Operations 2,299 2,545 3,056 3,528 3.3%
213111 Drilling Oil and Gas Wells 975 1,131 1,353 1,553 3.6%
3331 Agriculture, Construction, and Mining Machinery Manufacturing
905 1,142 1,203 1,351 3.1%
333912 Air and Gas Compressor Manufacturing 664 848 899 1,009 3.3%
333515 Cutting Tool and Machine Tool Accessory Manufacturing 545 696 737 828 3.3%
Top-5 gross output total 5,386 6,362 7,248 8,269 3.4%
Supply chain gross output total 8,777 10,079 11,062 12,783 2.9%
Unconventional energy supply chain government revenue (Current $M)
Federal taxes 442 525 630 779 4.4%
State and local taxes 482 567 678 821 4.2%
Supply chain government revenue total 925 1,091 1,308 1,600 4.3%
*Ranking for all years based on results in 2014.
**Compound annual growth rate from 2012 to 2025.
t Construction of pipelines, rail, marine structures, storage facilities, LNG export facilities, and manufacturing structures.
Source: IHS Economics © 2014 IHS
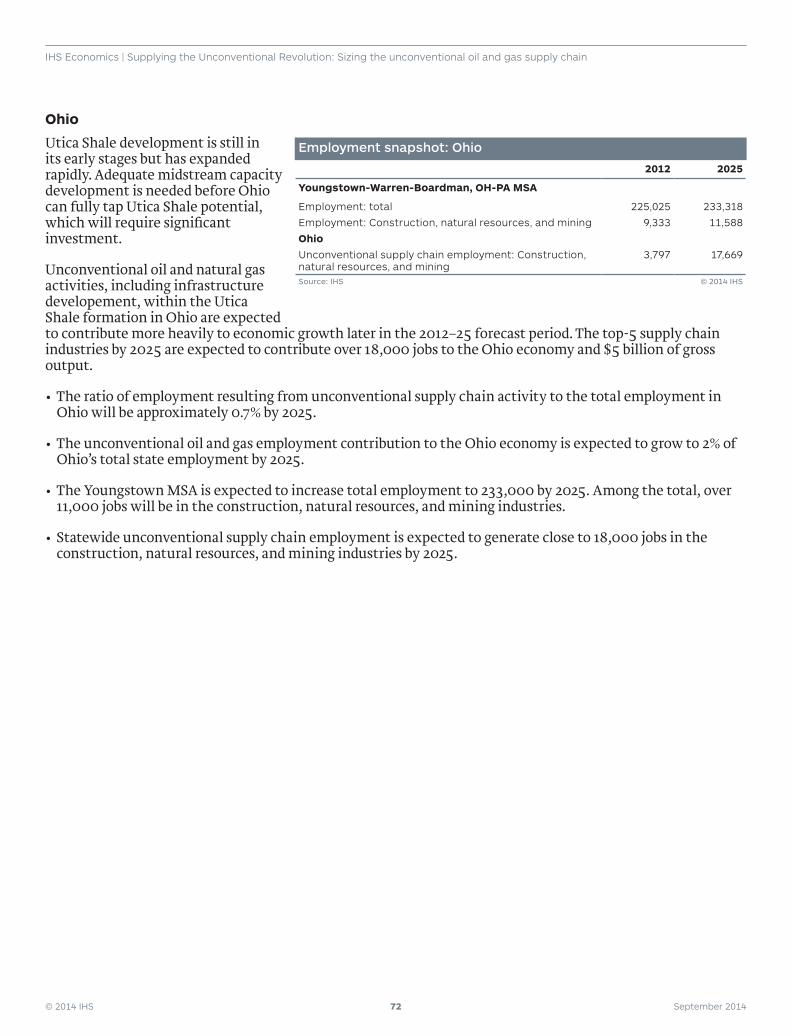
© 2014 IHS 72 September 2014
IHS Economics | Supplying the Unconventional Revolution: Sizing the unconventional oil and gas supply chain
Ohio
Utica Shale development is still in its early stages but has expanded rapidly. Adequate midstream capacity development is needed before Ohio can fully tap Utica Shale potential, which will require significant investment.
Unconventional oil and natural gas activities, including infrastructure developement, within the Utica Shale formation in Ohio are expected to contribute more heavily to economic growth later in the 2012–25 forecast period. The top-5 supply chain industries by 2025 are expected to contribute over 18,000 jobs to the Ohio economy and $5 billion of gross output.
•The ratio of employment resulting from unconventional supply chain activity to the total employment in Ohio will be approximately 0.7% by 2025.
•The unconventional oil and gas employment contribution to the Ohio economy is expected to grow to 2% of Ohio’s total state employment by 2025.
•The Youngstown MSA is expected to increase total employment to 233,000 by 2025. Among the total, over 11,000 jobs will be in the construction, natural resources, and mining industries.
•Statewide unconventional supply chain employment is expected to generate close to 18,000 jobs in the construction, natural resources, and mining industries by 2025.
Employment snapshot: Ohio
2012 2025
Youngstown-Warren-Boardman, OH-PA MSA
Employment: total 225,025 233,318
Employment: Construction, natural resources, and mining 9,333 11,588
Ohio
Unconventional supply chain employment: Construction, natural resources, and mining
3,797 17,669
Source: IHS © 2014 IHS

© 2014 IHS 73 September 2014
IHS Economics | Supplying the Unconventional Revolution: Sizing the unconventional oil and gas supply chain
Ohio
2012 2015 2020 2025 CAGR**
Top-5 sectors: Unconventional energy supply chain employment* (Number of workers )
23t Construction of New Nonresidential Manufacturing Structures
2,691 1,828 632 432 -13.1%
5413 Architectural, Engineering, and Related Services 1,623 2,179 3,021 4,131 7.4%
213112 Support Activities for Oil and Gas Operations 227 2,653 4,663 6,592 29.6%
3312 Steel Product Manufacturing from Purchased Steel 1,261 1,605 1,521 1,900 3.2%
23tt Construction of Other New Nonresidential Structures 208 2,230 3,836 5,686 29.0%
Top-5 employment total 6,011 10,496 13,673 18,741 9.1%
Supply chain employment total 13,123 21,869 29,009 39,704 8.9%
Supply chain employment as share of state employment 0.2% 0.4% 0.5% 0.7%
Total energy activity employment as share of state employment 0.5% 1.0% 1.5% 2.0%
Top-5 sectors: Unconventional energy supply chain labor income* (2012 $M )
23t Construction of New Nonresidential Manufacturing Structures
150 96 35 24 -13.1%
5413 Architectural, Engineering, and Related Services 129 177 245 330 7.5%
213112 Support Activities for Oil and Gas Operations 21 245 429 587 29.2%
3312 Steel Product Manufacturing from Purchased Steel 120 151 140 170 2.7%
23tt Construction of Other New Nonresidential Structures 12 128 220 315 28.6%
Top-5 labor income total 432 796 1,069 1,427 9.6%
Supply chain labor income total 1,041 1,757 2,343 3,120 8.8%
Top-5 sectors: Unconventional energy supply chain gross output* (2012 $M)
3312 Steel Product Manufacturing from Purchased Steel 884 1,080 941 1,108 1.8%
23t Construction of New Nonresidential Manufacturing Structures
686 488 160 108 -13.2%
213112 Support Activities for Oil and Gas Operations 90 1,047 1,826 2,453 28.9%
331110 Iron and Steel Mills and Ferroalloy Manufacturing 476 580 523 609 1.9%
3331 Agriculture, Construction, and Mining Machinery Manufacturing
418 479 552 699 4.0%
Top-5 gross output total 2,554 3,673 4,002 4,977 5.3%
Supply chain gross output total 4,750 7,407 8,892 11,419 7.0%
Unconventional energy supply chain government revenue (Current $M)
Federal taxes 174 330 489 681 11.1%
State and local taxes 197 361 532 724 10.5%
Supply chain government revenue total 371 691 1,021 1,405 10.8%
*Ranking for all years based on results in 2014.
**Compound annual growth rate from 2012 to 2025.
t Construction of pipelines, rail, marine structures, storage facilities, LNG export facilities, and manufacturing structures.
tt Construction of upstream facilities and structures.
Source: IHS Economics © 2014 IHS
© 2014 IHS 74 September 2014
IHS Economics | Supplying the Unconventional Revolution: Sizing the unconventional oil and gas supply chain
Oklahoma
According to the Energy Information Administration (EIA), Oklahoma produced 366,000 barrels of crude oil per day in May 2014 and is currently the fifth-largest shale gas producing. Several emerging unconventional oil plays are attracting significant energy company investment.
In 2015, the top-5 supply chain industries are expected to contribute over 18,000 jobs to the Oklahoma economy and $4.5 billion of gross output.
•The ratio of employment resulting from unconventional supply chain activity to the total state economy’s employment will be approximately 2.9% by 2025.
•The employment contribution from unconventional energy activity to the Oklahoma economy is expected to grow to 6.7% of Oklahoma’s total state employment.
•Construction employment and gross output are expected to more than double from 2012 through 2025.
•Unconventional supply chain employment stemming from support activities for oil and gas operations is expected to triple and gross output is expected to more than double from 2012 through 2025.
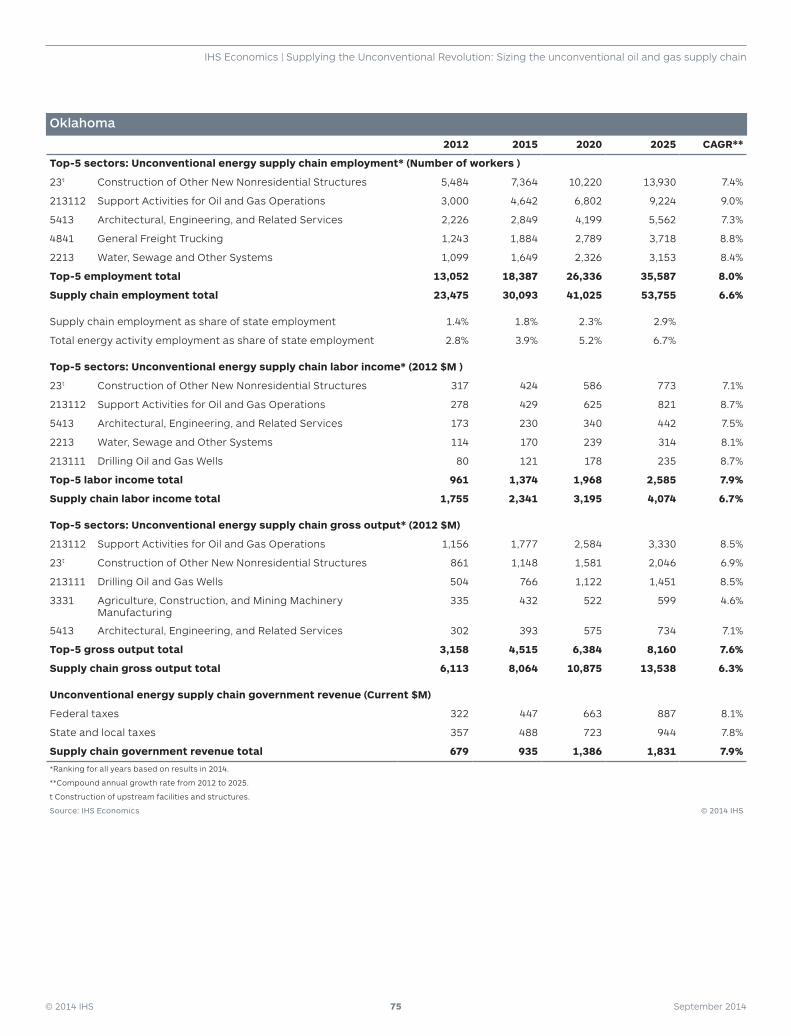
© 2014 IHS 75 September 2014
IHS Economics | Supplying the Unconventional Revolution: Sizing the unconventional oil and gas supply chain
Oklahoma
2012 2015 2020 2025 CAGR**
Top-5 sectors: Unconventional energy supply chain employment* (Number of workers )
23t Construction of Other New Nonresidential Structures 5,484 7,364 10,220 13,930 7.4%
213112 Support Activities for Oil and Gas Operations 3,000 4,642 6,802 9,224 9.0%
5413 Architectural, Engineering, and Related Services 2,226 2,849 4,199 5,562 7.3%
4841 General Freight Trucking 1,243 1,884 2,789 3,718 8.8%
2213 Water, Sewage and Other Systems 1,099 1,649 2,326 3,153 8.4%
Top-5 employment total 13,052 18,387 26,336 35,587 8.0%
Supply chain employment total 23,475 30,093 41,025 53,755 6.6%
Supply chain employment as share of state employment 1.4% 1.8% 2.3% 2.9%
Total energy activity employment as share of state employment 2.8% 3.9% 5.2% 6.7%
Top-5 sectors: Unconventional energy supply chain labor income* (2012 $M )
23t Construction of Other New Nonresidential Structures 317 424 586 773 7.1%
213112 Support Activities for Oil and Gas Operations 278 429 625 821 8.7%
5413 Architectural, Engineering, and Related Services 173 230 340 442 7.5%
2213 Water, Sewage and Other Systems 114 170 239 314 8.1%
213111 Drilling Oil and Gas Wells 80 121 178 235 8.7%
Top-5 labor income total 961 1,374 1,968 2,585 7.9%
Supply chain labor income total 1,755 2,341 3,195 4,074 6.7%
Top-5 sectors: Unconventional energy supply chain gross output* (2012 $M)
213112 Support Activities for Oil and Gas Operations 1,156 1,777 2,584 3,330 8.5%
23t Construction of Other New Nonresidential Structures 861 1,148 1,581 2,046 6.9%
213111 Drilling Oil and Gas Wells 504 766 1,122 1,451 8.5%
3331 Agriculture, Construction, and Mining Machinery Manufacturing
335 432 522 599 4.6%
5413 Architectural, Engineering, and Related Services 302 393 575 734 7.1%
Top-5 gross output total 3,158 4,515 6,384 8,160 7.6%
Supply chain gross output total 6,113 8,064 10,875 13,538 6.3%
Unconventional energy supply chain government revenue (Current $M)
Federal taxes 322 447 663 887 8.1%
State and local taxes 357 488 723 944 7.8%
Supply chain government revenue total 679 935 1,386 1,831 7.9%
*Ranking for all years based on results in 2014.
**Compound annual growth rate from 2012 to 2025.
t Construction of upstream facilities and structures.
Source: IHS Economics © 2014 IHS
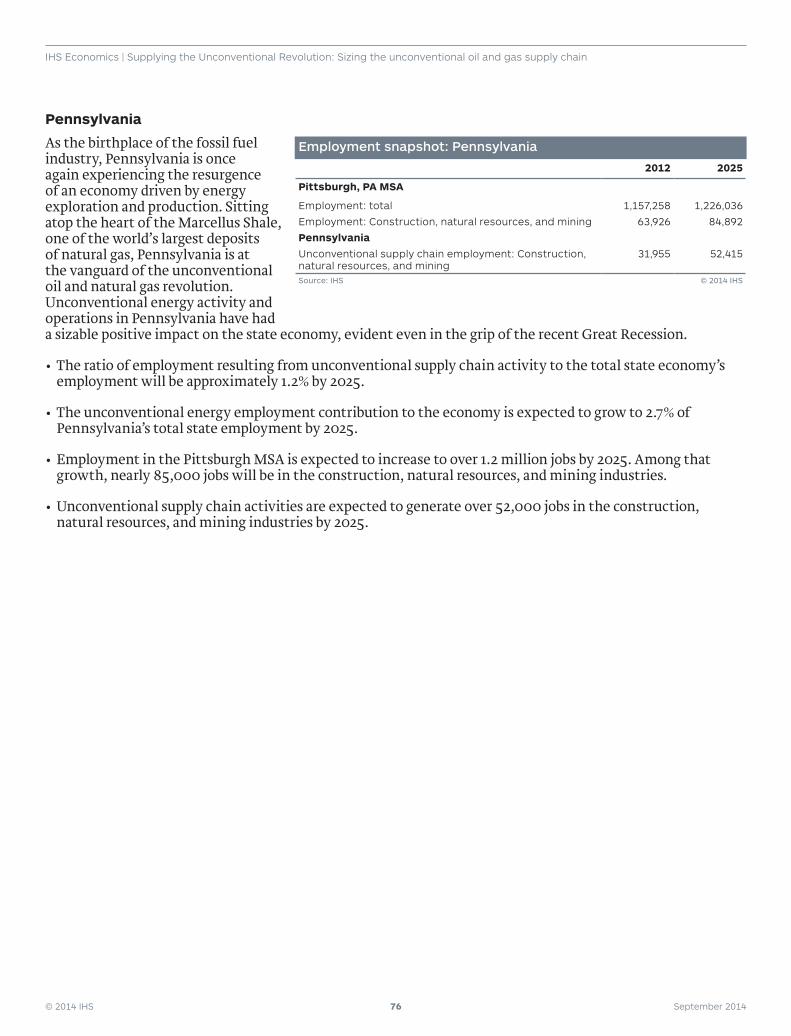
© 2014 IHS 76 September 2014
IHS Economics | Supplying the Unconventional Revolution: Sizing the unconventional oil and gas supply chain
Pennsylvania
As the birthplace of the fossil fuel industry, Pennsylvania is once again experiencing the resurgence of an economy driven by energy exploration and production. Sitting atop the heart of the Marcellus Shale, one of the world’s largest deposits of natural gas, Pennsylvania is at the vanguard of the unconventional oil and natural gas revolution. Unconventional energy activity and operations in Pennsylvania have had a sizable positive impact on the state economy, evident even in the grip of the recent Great Recession.
•The ratio of employment resulting from unconventional supply chain activity to the total state economy’s employment will be approximately 1.2% by 2025.
•The unconventional energy employment contribution to the economy is expected to grow to 2.7% of Pennsylvania’s total state employment by 2025.
•Employment in the Pittsburgh MSA is expected to increase to over 1.2 million jobs by 2025. Among that growth, nearly 85,000 jobs will be in the construction, natural resources, and mining industries.
•Unconventional supply chain activities are expected to generate over 52,000 jobs in the construction, natural resources, and mining industries by 2025.
Employment snapshot: Pennsylvania
2012 2025
Pittsburgh, PA MSA
Employment: total 1,157,258 1,226,036
Employment: Construction, natural resources, and mining 63,926 84,892
Pennsylvania
Unconventional supply chain employment: Construction, natural resources, and mining
31,955 52,415
Source: IHS © 2014 IHS
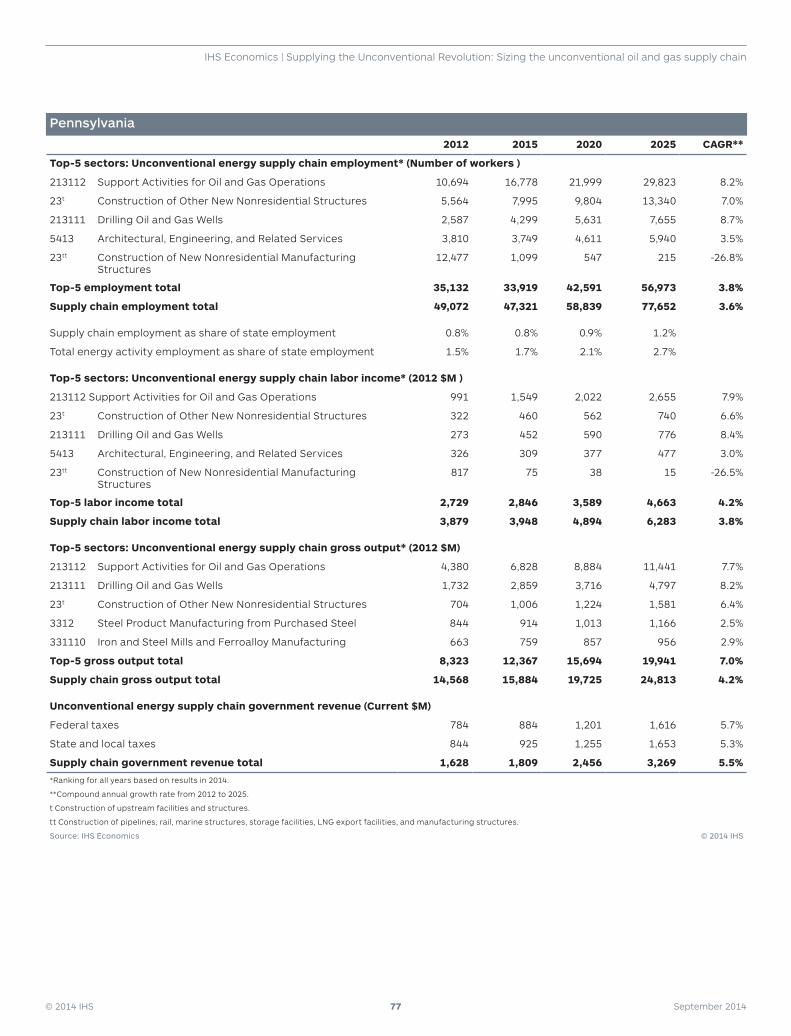
© 2014 IHS 77 September 2014
IHS Economics | Supplying the Unconventional Revolution: Sizing the unconventional oil and gas supply chain
Pennsylvania
2012 2015 2020 2025 CAGR**
Top-5 sectors: Unconventional energy supply chain employment* (Number of workers )
213112 Support Activities for Oil and Gas Operations 10,694 16,778 21,999 29,823 8.2%
23t Construction of Other New Nonresidential Structures 5,564 7,995 9,804 13,340 7.0%
213111 Drilling Oil and Gas Wells 2,587 4,299 5,631 7,655 8.7%
5413 Architectural, Engineering, and Related Services 3,810 3,749 4,611 5,940 3.5%
23tt Construction of New Nonresidential Manufacturing Structures
12,477 1,099 547 215 -26.8%
Top-5 employment total 35,132 33,919 42,591 56,973 3.8%
Supply chain employment total 49,072 47,321 58,839 77,652 3.6%
Supply chain employment as share of state employment 0.8% 0.8% 0.9% 1.2%
Total energy activity employment as share of state employment 1.5% 1.7% 2.1% 2.7%
Top-5 sectors: Unconventional energy supply chain labor income* (2012 $M )
213112 Support Activities for Oil and Gas Operations 991 1,549 2,022 2,655 7.9%
23t Construction of Other New Nonresidential Structures 322 460 562 740 6.6%
213111 Drilling Oil and Gas Wells 273 452 590 776 8.4%
5413 Architectural, Engineering, and Related Services 326 309 377 477 3.0%
23tt Construction of New Nonresidential Manufacturing Structures
817 75 38 15 -26.5%
Top-5 labor income total 2,729 2,846 3,589 4,663 4.2%
Supply chain labor income total 3,879 3,948 4,894 6,283 3.8%
Top-5 sectors: Unconventional energy supply chain gross output* (2012 $M)
213112 Support Activities for Oil and Gas Operations 4,380 6,828 8,884 11,441 7.7%
213111 Drilling Oil and Gas Wells 1,732 2,859 3,716 4,797 8.2%
23t Construction of Other New Nonresidential Structures 704 1,006 1,224 1,581 6.4%
3312 Steel Product Manufacturing from Purchased Steel 844 914 1,013 1,166 2.5%
331110 Iron and Steel Mills and Ferroalloy Manufacturing 663 759 857 956 2.9%
Top-5 gross output total 8,323 12,367 15,694 19,941 7.0%
Supply chain gross output total 14,568 15,884 19,725 24,813 4.2%
Unconventional energy supply chain government revenue (Current $M)
Federal taxes 784 884 1,201 1,616 5.7%
State and local taxes 844 925 1,255 1,653 5.3%
Supply chain government revenue total 1,628 1,809 2,456 3,269 5.5%
*Ranking for all years based on results in 2014.
**Compound annual growth rate from 2012 to 2025.
t Construction of upstream facilities and structures.
tt Construction of pipelines, rail, marine structures, storage facilities, LNG export facilities, and manufacturing structures.
Source: IHS Economics © 2014 IHS
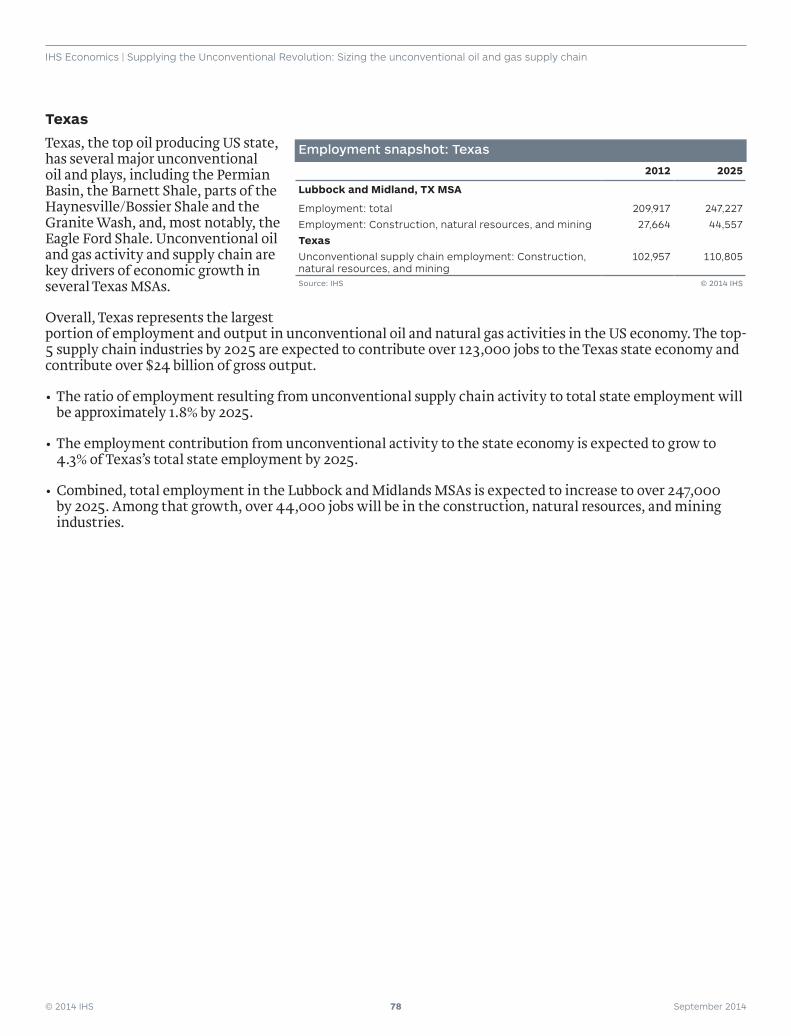
© 2014 IHS 78 September 2014
IHS Economics | Supplying the Unconventional Revolution: Sizing the unconventional oil and gas supply chain
Texas
Texas, the top oil producing US state, has several major unconventional oil and plays, including the Permian Basin, the Barnett Shale, parts of the Haynesville/Bossier Shale and the Granite Wash, and, most notably, the Eagle Ford Shale. Unconventional oil and gas activity and supply chain are key drivers of economic growth in several Texas MSAs.
Overall, Texas represents the largest portion of employment and output in unconventional oil and natural gas activities in the US economy. The top-5 supply chain industries by 2025 are expected to contribute over 123,000 jobs to the Texas state economy and contribute over $24 billion of gross output.
•The ratio of employment resulting from unconventional supply chain activity to total state employment will be approximately 1.8% by 2025.
•The employment contribution from unconventional activity to the state economy is expected to grow to 4.3% of Texas’s total state employment by 2025.
•Combined, total employment in the Lubbock and Midlands MSAs is expected to increase to over 247,000 by 2025. Among that growth, over 44,000 jobs will be in the construction, natural resources, and mining industries.
Employment snapshot: Texas
2012 2025
Lubbock and Midland, TX MSA
Employment: total 209,917 247,227
Employment: Construction, natural resources, and mining 27,664 44,557
Texas
Unconventional supply chain employment: Construction, natural resources, and mining
102,957 110,805
Source: IHS © 2014 IHS
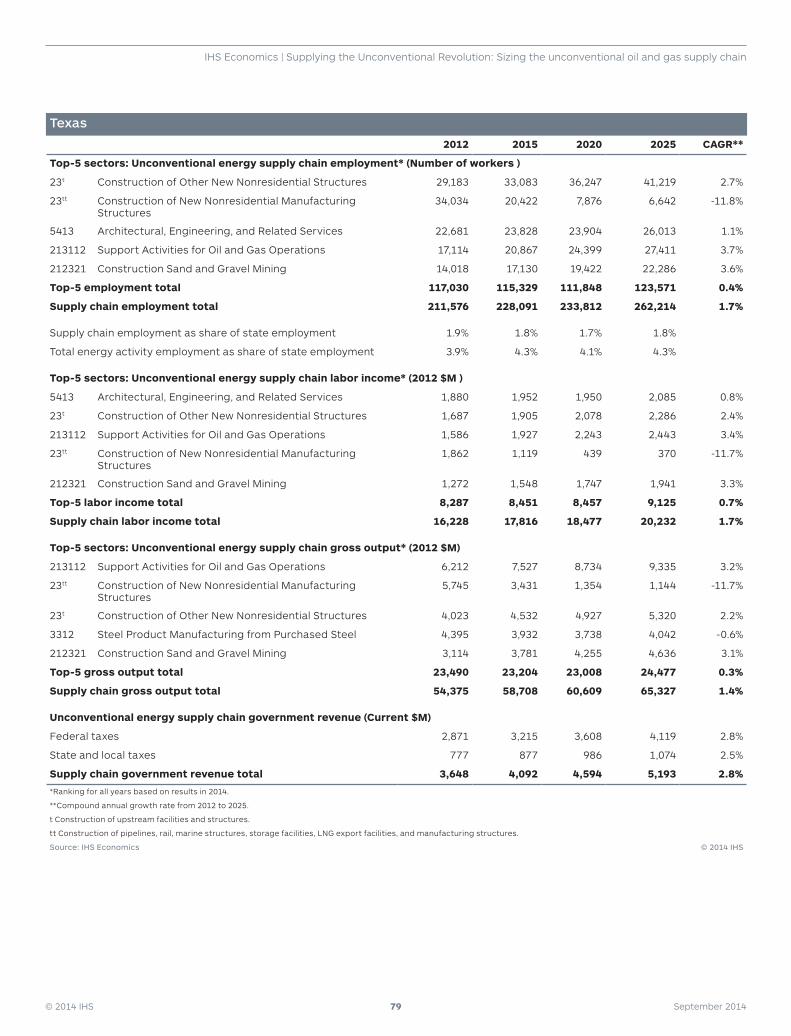
© 2014 IHS 79 September 2014
IHS Economics | Supplying the Unconventional Revolution: Sizing the unconventional oil and gas supply chain
Texas
2012 2015 2020 2025 CAGR**
Top-5 sectors: Unconventional energy supply chain employment* (Number of workers )
23t Construction of Other New Nonresidential Structures 29,183 33,083 36,247 41,219 2.7%
23tt Construction of New Nonresidential Manufacturing Structures
34,034 20,422 7,876 6,642 -11.8%
5413 Architectural, Engineering, and Related Services 22,681 23,828 23,904 26,013 1.1%
213112 Support Activities for Oil and Gas Operations 17,114 20,867 24,399 27,411 3.7%
212321 Construction Sand and Gravel Mining 14,018 17,130 19,422 22,286 3.6%
Top-5 employment total 117,030 115,329 111,848 123,571 0.4%
Supply chain employment total 211,576 228,091 233,812 262,214 1.7%
Supply chain employment as share of state employment 1.9% 1.8% 1.7% 1.8%
Total energy activity employment as share of state employment 3.9% 4.3% 4.1% 4.3%
Top-5 sectors: Unconventional energy supply chain labor income* (2012 $M )
5413 Architectural, Engineering, and Related Services 1,880 1,952 1,950 2,085 0.8%
23t Construction of Other New Nonresidential Structures 1,687 1,905 2,078 2,286 2.4%
213112 Support Activities for Oil and Gas Operations 1,586 1,927 2,243 2,443 3.4%
23tt Construction of New Nonresidential Manufacturing Structures
1,862 1,119 439 370 -11.7%
212321 Construction Sand and Gravel Mining 1,272 1,548 1,747 1,941 3.3%
Top-5 labor income total 8,287 8,451 8,457 9,125 0.7%
Supply chain labor income total 16,228 17,816 18,477 20,232 1.7%
Top-5 sectors: Unconventional energy supply chain gross output* (2012 $M)
213112 Support Activities for Oil and Gas Operations 6,212 7,527 8,734 9,335 3.2%
23tt Construction of New Nonresidential Manufacturing Structures
5,745 3,431 1,354 1,144 -11.7%
23t Construction of Other New Nonresidential Structures 4,023 4,532 4,927 5,320 2.2%
3312 Steel Product Manufacturing from Purchased Steel 4,395 3,932 3,738 4,042 -0.6%
212321 Construction Sand and Gravel Mining 3,114 3,781 4,255 4,636 3.1%
Top-5 gross output total 23,490 23,204 23,008 24,477 0.3%
Supply chain gross output total 54,375 58,708 60,609 65,327 1.4%
Unconventional energy supply chain government revenue (Current $M)
Federal taxes 2,871 3,215 3,608 4,119 2.8%
State and local taxes 777 877 986 1,074 2.5%
Supply chain government revenue total 3,648 4,092 4,594 5,193 2.8%
*Ranking for all years based on results in 2014.
**Compound annual growth rate from 2012 to 2025.
t Construction of upstream facilities and structures.
tt Construction of pipelines, rail, marine structures, storage facilities, LNG export facilities, and manufacturing structures.
Source: IHS Economics © 2014 IHS
© 2014 IHS 80 September 2014
IHS Economics | Supplying the Unconventional Revolution: Sizing the unconventional oil and gas supply chain
North Dakota
The explosive growth in unconventional oil and associated gas drilling activity in North Dakota’s Williston Basin has had a massive impact on the state’s economy. Development of the Bakken Shale has lowered the state unemployment rate to 2.8% (July 2014) and stimulated explosive growth in construction of housing and infrastructure.
Unconventional oil and gas activities are expected to continue to contribute significantly to growth in the state economy over the next decade. The top-5 unconventional supply chain industries are expected to contribute over 21,000 jobs to the state economy and more than $4.8 billion of gross output by 2025.
•The percentage of employment resulting from unconventional supply chain activity will be approximately 5.9% of total employment by 2025—the highest share across all states.
•More impressively, employment from the unconventional energy value chain is expected to continue to grow to 14.6% of North Dakota’s total state employment by 2025, from about 12% in 2012.
•The supply chain industries with the largest economic contributions are concentrated in the upstream segment of the energy value chain. Support Activities for Oil and Gas Operations (NAICS 213112) is the top supply chain industry, followed by Construction of New Nonresidential Manufacturing Structures (part of NAICS 23—construction of pipelines, rail, marine structures, storage facilities, LNG export facilities, and manufacturing structures) and Construction of Other New Nonresidential Structures (part of NAICS 23—construction of upstream facilities and structures), and the Architectual, Engineering, and Related Services sector (NAICS 5413).
“Shale energy extraction has resulted in exponential business growth at General Equipment & Supplies since 2009. In fact, over the past few years, my company has doubled its revenue, mostly because of energy development. These increased sales and continued strong business climate have come at time when our market share has remained constant. During the same period, we went from 125 employees to over 250 today. In fact, we would hire dozens more workers if we could find enough skilled labor.” Don Shilling, President, General Equipment & Supplies Co., Fargo, North Dakota and 2014 Vice Chairman, Associated Equipment Distributors (AED)
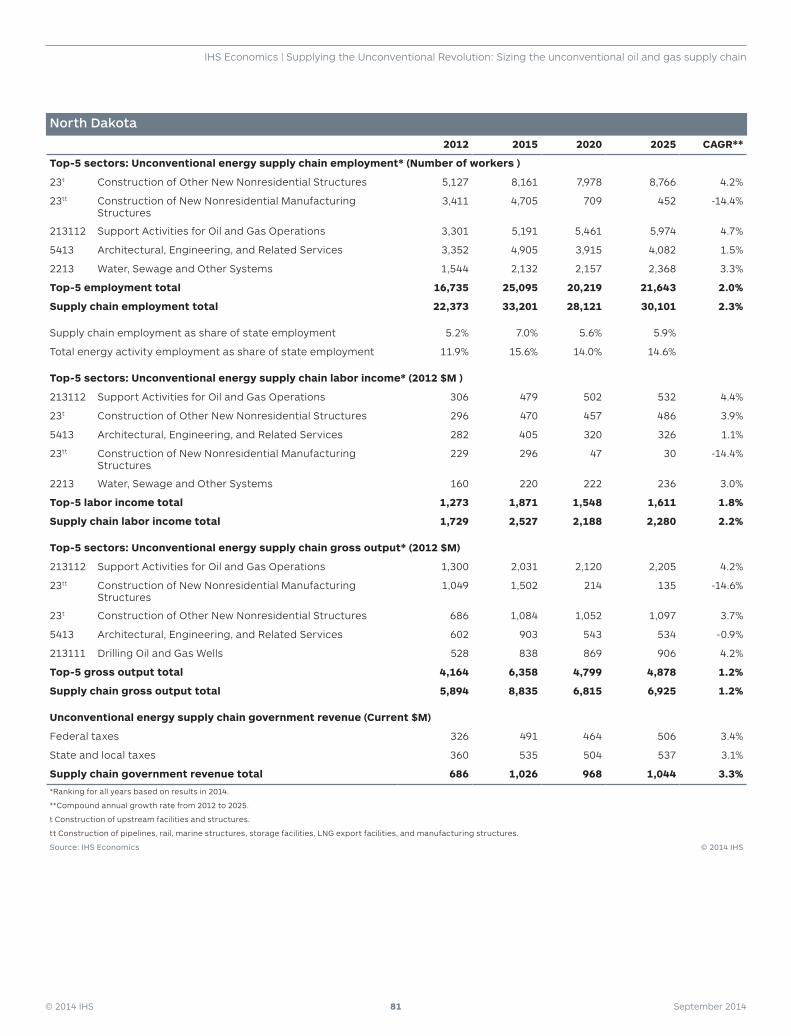
© 2014 IHS 81 September 2014
IHS Economics | Supplying the Unconventional Revolution: Sizing the unconventional oil and gas supply chain
North Dakota
2012 2015 2020 2025 CAGR**
Top-5 sectors: Unconventional energy supply chain employment* (Number of workers )
23t Construction of Other New Nonresidential Structures 5,127 8,161 7,978 8,766 4.2%
23tt Construction of New Nonresidential Manufacturing Structures
3,411 4,705 709 452 -14.4%
213112 Support Activities for Oil and Gas Operations 3,301 5,191 5,461 5,974 4.7%
5413 Architectural, Engineering, and Related Services 3,352 4,905 3,915 4,082 1.5%
2213 Water, Sewage and Other Systems 1,544 2,132 2,157 2,368 3.3%
Top-5 employment total 16,735 25,095 20,219 21,643 2.0%
Supply chain employment total 22,373 33,201 28,121 30,101 2.3%
Supply chain employment as share of state employment 5.2% 7.0% 5.6% 5.9%
Total energy activity employment as share of state employment 11.9% 15.6% 14.0% 14.6%
Top-5 sectors: Unconventional energy supply chain labor income* (2012 $M )
213112 Support Activities for Oil and Gas Operations 306 479 502 532 4.4%
23t Construction of Other New Nonresidential Structures 296 470 457 486 3.9%
5413 Architectural, Engineering, and Related Services 282 405 320 326 1.1%
23tt Construction of New Nonresidential Manufacturing Structures
229 296 47 30 -14.4%
2213 Water, Sewage and Other Systems 160 220 222 236 3.0%
Top-5 labor income total 1,273 1,871 1,548 1,611 1.8%
Supply chain labor income total 1,729 2,527 2,188 2,280 2.2%
Top-5 sectors: Unconventional energy supply chain gross output* (2012 $M)
213112 Support Activities for Oil and Gas Operations 1,300 2,031 2,120 2,205 4.2%
23tt Construction of New Nonresidential Manufacturing Structures
1,049 1,502 214 135 -14.6%
23t Construction of Other New Nonresidential Structures 686 1,084 1,052 1,097 3.7%
5413 Architectural, Engineering, and Related Services 602 903 543 534 -0.9%
213111 Drilling Oil and Gas Wells 528 838 869 906 4.2%
Top-5 gross output total 4,164 6,358 4,799 4,878 1.2%
Supply chain gross output total 5,894 8,835 6,815 6,925 1.2%
Unconventional energy supply chain government revenue (Current $M)
Federal taxes 326 491 464 506 3.4%
State and local taxes 360 535 504 537 3.1%
Supply chain government revenue total 686 1,026 968 1,044 3.3%
*Ranking for all years based on results in 2014.
**Compound annual growth rate from 2012 to 2025.
t Construction of upstream facilities and structures.
tt Construction of pipelines, rail, marine structures, storage facilities, LNG export facilities, and manufacturing structures.
Source: IHS Economics © 2014 IHS
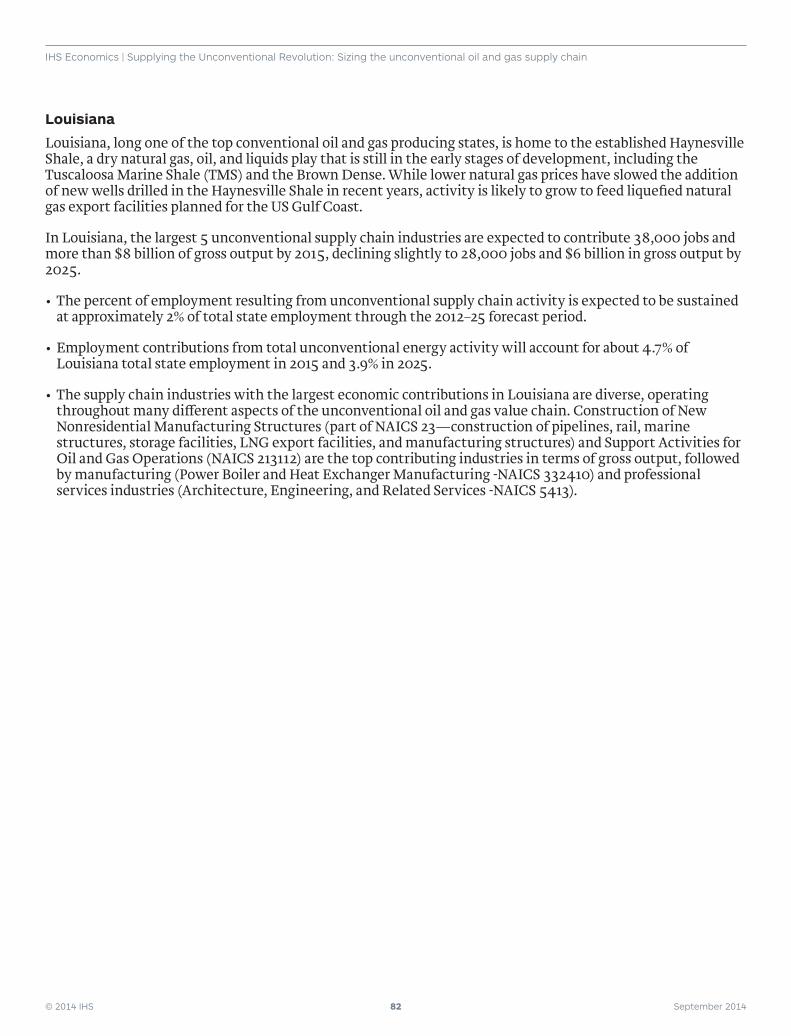
© 2014 IHS 82 September 2014
IHS Economics | Supplying the Unconventional Revolution: Sizing the unconventional oil and gas supply chain
Louisiana
Louisiana, long one of the top conventional oil and gas producing states, is home to the established Haynesville Shale, a dry natural gas, oil, and liquids play that is still in the early stages of development, including the Tuscaloosa Marine Shale (TMS) and the Brown Dense. While lower natural gas prices have slowed the addition of new wells drilled in the Haynesville Shale in recent years, activity is likely to grow to feed liquefied natural gas export facilities planned for the US Gulf Coast.
In Louisiana, the largest 5 unconventional supply chain industries are expected to contribute 38,000 jobs and more than $8 billion of gross output by 2015, declining slightly to 28,000 jobs and $6 billion in gross output by 2025.
•The percent of employment resulting from unconventional supply chain activity is expected to be sustained at approximately 2% of total state employment through the 2012–25 forecast period.
•Employment contributions from total unconventional energy activity will account for about 4.7% of Louisiana total state employment in 2015 and 3.9% in 2025.
•The supply chain industries with the largest economic contributions in Louisiana are diverse, operating throughout many different aspects of the unconventional oil and gas value chain. Construction of New Nonresidential Manufacturing Structures (part of NAICS 23—construction of pipelines, rail, marine structures, storage facilities, LNG export facilities, and manufacturing structures) and Support Activities for Oil and Gas Operations (NAICS 213112) are the top contributing industries in terms of gross output, followed by manufacturing (Power Boiler and Heat Exchanger Manufacturing -NAICS 332410) and professional services industries (Architecture, Engineering, and Related Services -NAICS 5413).
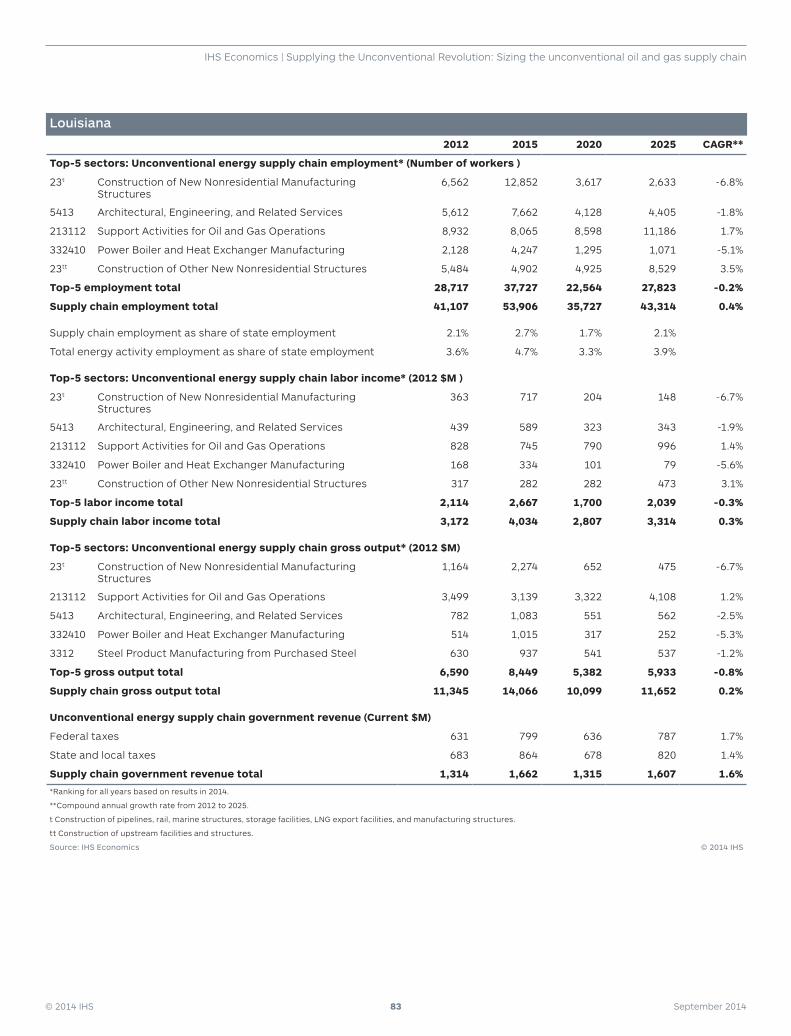
© 2014 IHS 83 September 2014
IHS Economics | Supplying the Unconventional Revolution: Sizing the unconventional oil and gas supply chain
Louisiana
2012 2015 2020 2025 CAGR**
Top-5 sectors: Unconventional energy supply chain employment* (Number of workers )
23t Construction of New Nonresidential Manufacturing Structures
6,562 12,852 3,617 2,633 -6.8%
5413 Architectural, Engineering, and Related Services 5,612 7,662 4,128 4,405 -1.8%
213112 Support Activities for Oil and Gas Operations 8,932 8,065 8,598 11,186 1.7%
332410 Power Boiler and Heat Exchanger Manufacturing 2,128 4,247 1,295 1,071 -5.1%
23tt Construction of Other New Nonresidential Structures 5,484 4,902 4,925 8,529 3.5%
Top-5 employment total 28,717 37,727 22,564 27,823 -0.2%
Supply chain employment total 41,107 53,906 35,727 43,314 0.4%
Supply chain employment as share of state employment 2.1% 2.7% 1.7% 2.1%
Total energy activity employment as share of state employment 3.6% 4.7% 3.3% 3.9%
Top-5 sectors: Unconventional energy supply chain labor income* (2012 $M )
23t Construction of New Nonresidential Manufacturing Structures
363 717 204 148 -6.7%
5413 Architectural, Engineering, and Related Services 439 589 323 343 -1.9%
213112 Support Activities for Oil and Gas Operations 828 745 790 996 1.4%
332410 Power Boiler and Heat Exchanger Manufacturing 168 334 101 79 -5.6%
23tt Construction of Other New Nonresidential Structures 317 282 282 473 3.1%
Top-5 labor income total 2,114 2,667 1,700 2,039 -0.3%
Supply chain labor income total 3,172 4,034 2,807 3,314 0.3%
Top-5 sectors: Unconventional energy supply chain gross output* (2012 $M)
23t Construction of New Nonresidential Manufacturing Structures
1,164 2,274 652 475 -6.7%
213112 Support Activities for Oil and Gas Operations 3,499 3,139 3,322 4,108 1.2%
5413 Architectural, Engineering, and Related Services 782 1,083 551 562 -2.5%
332410 Power Boiler and Heat Exchanger Manufacturing 514 1,015 317 252 -5.3%
3312 Steel Product Manufacturing from Purchased Steel 630 937 541 537 -1.2%
Top-5 gross output total 6,590 8,449 5,382 5,933 -0.8%
Supply chain gross output total 11,345 14,066 10,099 11,652 0.2%
Unconventional energy supply chain government revenue (Current $M)
Federal taxes 631 799 636 787 1.7%
State and local taxes 683 864 678 820 1.4%
Supply chain government revenue total 1,314 1,662 1,315 1,607 1.6%
*Ranking for all years based on results in 2014.
**Compound annual growth rate from 2012 to 2025.
t Construction of pipelines, rail, marine structures, storage facilities, LNG export facilities, and manufacturing structures.
tt Construction of upstream facilities and structures.
Source: IHS Economics © 2014 IHS
© 2014 IHS 84 September 2014
IHS Economics | Supplying the Unconventional Revolution: Sizing the unconventional oil and gas supply chain
Nonproducing states
Illinois
Although classified as a nonproducing state in this analysis, Illinois is experiencing growth from unconventional oil and natural gas activities related to the state’s large manufacturing sector. The Illinois economy also has above national average allocations of several industries that use natural gas as feedstock or as an input in manufacturing such as chemicals, plastics and rubber.The top-5 supply chain industries are expected to contribute over 22,000 jobs to the state economy by 2025 and over $5 billion of gross output, reaping economic benefits similar to Ohio.
•The ratio of employment resulting from unconventional supply chain activity to the total state employment will be approximately 0.3% by 2025.
•Employment contributions from unconventional oil and gas activity are expected to grow to 0.5% of Illinois’s total state employment by 2025, independent of any potential development of Illinois’ own unconventional oil and gas resources.
•Cutting tools and machine tool accessory manufacturing is expected to double employment and nearly double gross output contributions to the unconventional supply chain from 2012 through 2025.
• Iron and steel mills and ferroalloy manufacturing gross output in 2025 is expected to be 2.5 times greater than 2012 gross output, a clear linkage to the demand for construction materials, capital goods, and drilling and line pipe.
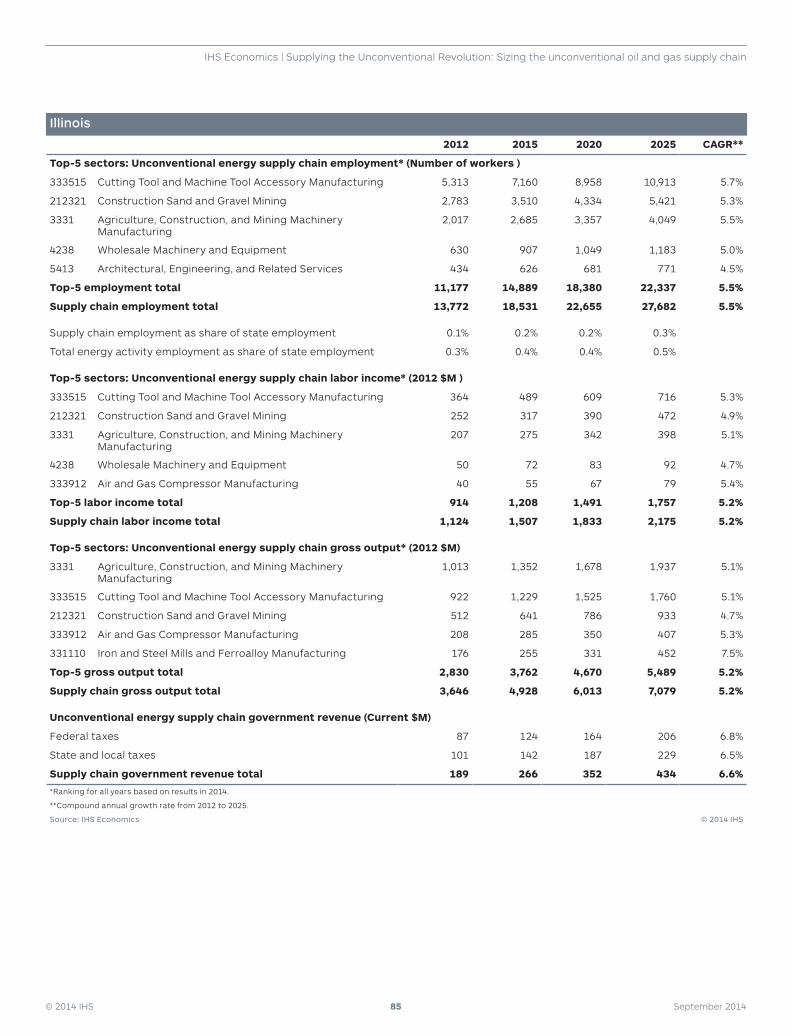
© 2014 IHS 85 September 2014
IHS Economics | Supplying the Unconventional Revolution: Sizing the unconventional oil and gas supply chain
Illinois
2012 2015 2020 2025 CAGR**
Top-5 sectors: Unconventional energy supply chain employment* (Number of workers )
333515 Cutting Tool and Machine Tool Accessory Manufacturing 5,313 7,160 8,958 10,913 5.7%
212321 Construction Sand and Gravel Mining 2,783 3,510 4,334 5,421 5.3%
3331 Agriculture, Construction, and Mining Machinery Manufacturing
2,017 2,685 3,357 4,049 5.5%
4238 Wholesale Machinery and Equipment 630 907 1,049 1,183 5.0%
5413 Architectural, Engineering, and Related Services 434 626 681 771 4.5%
Top-5 employment total 11,177 14,889 18,380 22,337 5.5%
Supply chain employment total 13,772 18,531 22,655 27,682 5.5%
Supply chain employment as share of state employment 0.1% 0.2% 0.2% 0.3%
Total energy activity employment as share of state employment 0.3% 0.4% 0.4% 0.5%
Top-5 sectors: Unconventional energy supply chain labor income* (2012 $M )
333515 Cutting Tool and Machine Tool Accessory Manufacturing 364 489 609 716 5.3%
212321 Construction Sand and Gravel Mining 252 317 390 472 4.9%
3331 Agriculture, Construction, and Mining Machinery Manufacturing
207 275 342 398 5.1%
4238 Wholesale Machinery and Equipment 50 72 83 92 4.7%
333912 Air and Gas Compressor Manufacturing 40 55 67 79 5.4%
Top-5 labor income total 914 1,208 1,491 1,757 5.2%
Supply chain labor income total 1,124 1,507 1,833 2,175 5.2%
Top-5 sectors: Unconventional energy supply chain gross output* (2012 $M)
3331 Agriculture, Construction, and Mining Machinery Manufacturing
1,013 1,352 1,678 1,937 5.1%
333515 Cutting Tool and Machine Tool Accessory Manufacturing 922 1,229 1,525 1,760 5.1%
212321 Construction Sand and Gravel Mining 512 641 786 933 4.7%
333912 Air and Gas Compressor Manufacturing 208 285 350 407 5.3%
331110 Iron and Steel Mills and Ferroalloy Manufacturing 176 255 331 452 7.5%
Top-5 gross output total 2,830 3,762 4,670 5,489 5.2%
Supply chain gross output total 3,646 4,928 6,013 7,079 5.2%
Unconventional energy supply chain government revenue (Current $M)
Federal taxes 87 124 164 206 6.8%
State and local taxes 101 142 187 229 6.5%
Supply chain government revenue total 189 266 352 434 6.6%
*Ranking for all years based on results in 2014.
**Compound annual growth rate from 2012 to 2025.
Source: IHS Economics © 2014 IHS

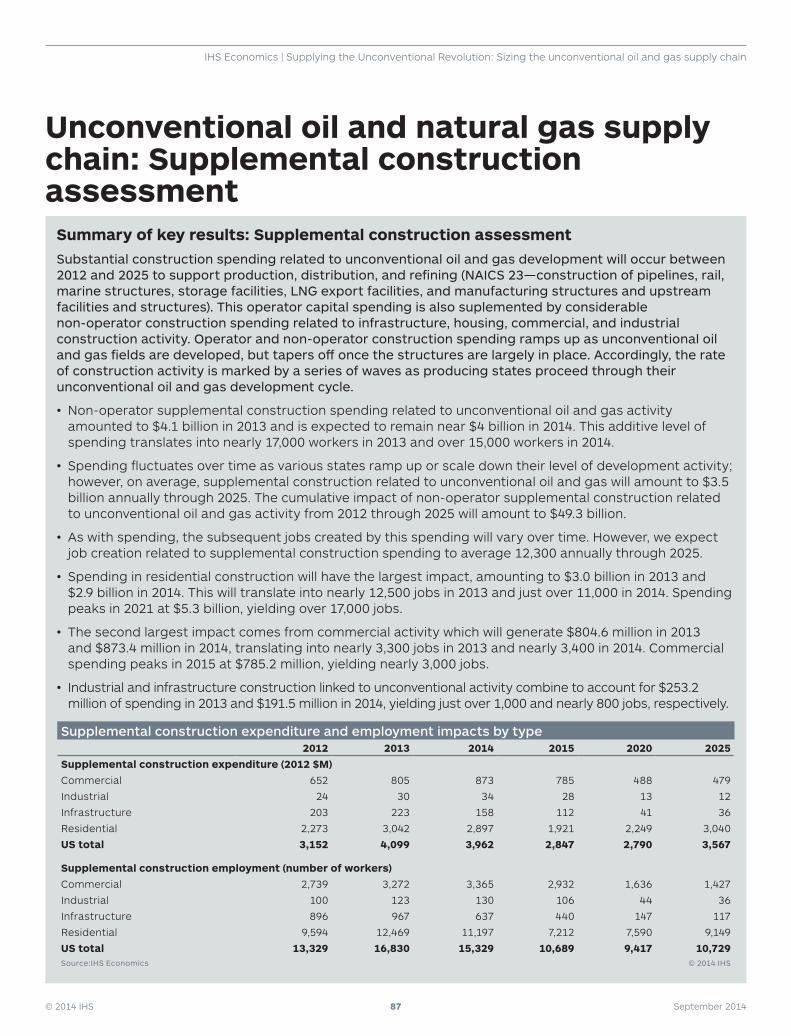
© 2014 IHS 87 September 2014
IHS Economics | Supplying the Unconventional Revolution: Sizing the unconventional oil and gas supply chain
Unconventional oil and natural gas supply chain: Supplemental construction assessment
Summary of key results: Supplemental construction assessmentSubstantial construction spending related to unconventional oil and gas development will occur between 2012 and 2025 to support production, distribution, and refining (NAICS 23—construction of pipelines, rail, marine structures, storage facilities, LNG export facilities, and manufacturing structures and upstream facilities and structures). This operator capital spending is also suplemented by considerable non-operator construction spending related to infrastructure, housing, commercial, and industrial construction activity. Operator and non-operator construction spending ramps up as unconventional oil and gas fields are developed, but tapers off once the structures are largely in place. Accordingly, the rate of construction activity is marked by a series of waves as producing states proceed through their unconventional oil and gas development cycle.
• Non-operator supplemental construction spending related to unconventional oil and gas activity amounted to $4.1 billion in 2013 and is expected to remain near $4 billion in 2014. This additive level of spending translates into nearly 17,000 workers in 2013 and over 15,000 workers in 2014.
• Spending fluctuates over time as various states ramp up or scale down their level of development activity; however, on average, supplemental construction related to unconventional oil and gas will amount to $3.5 billion annually through 2025. The cumulative impact of non-operator supplemental construction related to unconventional oil and gas activity from 2012 through 2025 will amount to $49.3 billion.
• As with spending, the subsequent jobs created by this spending will vary over time. However, we expect job creation related to supplemental construction spending to average 12,300 annually through 2025.
• Spending in residential construction will have the largest impact, amounting to $3.0 billion in 2013 and $2.9 billion in 2014. This will translate into nearly 12,500 jobs in 2013 and just over 11,000 in 2014. Spending peaks in 2021 at $5.3 billion, yielding over 17,000 jobs.
• The second largest impact comes from commercial activity which will generate $804.6 million in 2013 and $873.4 million in 2014, translating into nearly 3,300 jobs in 2013 and nearly 3,400 in 2014. Commercial spending peaks in 2015 at $785.2 million, yielding nearly 3,000 jobs.
• Industrial and infrastructure construction linked to unconventional activity combine to account for $253.2 million of spending in 2013 and $191.5 million in 2014, yielding just over 1,000 and nearly 800 jobs, respectively.
Supplemental construction expenditure and employment impacts by type2012 2013 2014 2015 2020 2025
Supplemental construction expenditure (2012 $M)
Commercial 652 805 873 785 488 479
Industrial 24 30 34 28 13 12
Infrastructure 203 223 158 112 41 36
Residential 2,273 3,042 2,897 1,921 2,249 3,040
US total 3,152 4,099 3,962 2,847 2,790 3,567
Supplemental construction employment (number of workers)
Commercial 2,739 3,272 3,365 2,932 1,636 1,427
Industrial 100 123 130 106 44 36
Infrastructure 896 967 637 440 147 117
Residential 9,594 12,469 11,197 7,212 7,590 9,149
US total 13,329 16,830 15,329 10,689 9,417 10,729Source:IHS Economics © 2014 IHS
© 2014 IHS 88 September 2014
IHS Economics | Supplying the Unconventional Revolution: Sizing the unconventional oil and gas supply chain
The US oil and gas industry—including upstream, midstream and downstream—is a major consumer of construction services. However, the nature of unconventional oil and gas exploration and production is that it creates additional construction demand beyond the direct investment required for extraction, processing, and transportation. In particular, workers in the oil and gas fields need housing, both temporary and permanent. They also stimulate additional business for local restaurants and retailers, leading to demand for new or expanded commercial establishments. The presence of the oil and gas industry also leads to demand for other businesses in the supply chain, which translates into new and expanded industrial structures. Finally, the nature of unconventional oil and gas exploration, production and transportation results in intensive use of rail and roads, requiring repair and upgrades to the installed base, and ultimately new construction investment to improve multi-modal transportation capacity.
To fully capture the economic contributions associated with construction activity that occurs independent of upstream, midstream, and downstream operator expenditures, IHS has estimated the residential, commercial, infrastructure, and industrial construction stimulated by unconventional oil and gas activity. While this added construction is primarily located within oil and gas producing states, it is nonetheless creating demand for construction materials, services and labor in producing and nonproducing states alike.
The expansion of unconventional oil and gas activity could not have come at a better time for the construction industry. The residential construction downturn was one of its proximate causes of the Great Recession, and the contagion of weak demand, poor business confidence, and tight credit ultimately decimated all sub-segments of the construction market. Even infrastructure spending, often a source of countercyclical stimulus, was underfunded in this case, as state and local tax receipts plummeted to a far greater extent than federal intervention could offset. The demand for oil and gas related construction services mitigated the severity of the downturn in many states. In some cases, notably North Dakota and Texas, oil and gas related construction actually expanded construction spending in a hostile environment.
Unconventional oil and gas exploration is both labor and capital intensive. Workers are needed not just to operate equipment on the fields themselves, but throughout the supply chain—transporting materials such as sand and water, repairing equipment that is under almost constant use, and supplying management and logistics. These workers require food and housing. Demand is a function of the size and utilization of the installed base as well as the locally available work force. In the case of North Dakota, the workforce was insufficient to accommodate operator requirements, resulting in a major influx of new workers. Additionally, the existing housing stock was sized to accommodate a stable agricultural environment, not a thriving energy sector. The confluence of new workers and inadequate facilities created a commercial construction boom. In Williston, North Dakota, the heart of the Bakken, commercial construction permits ballooned from $18.5 million in 2009 to $209.3 million in 2012 as first work camps and then hotels and motels were constructed. Demand for lodging space was augmented by the need for restaurants, retail space, and services such as laundry.
However, a key finding of the construction analysis is that the majority of the supplemental economic impact is on residential construction. While the short term needs of new workers can be met with temporary lodging, a proven oil and gas field takes time to develop—and multi-family housing (apartments and condos) is a cheaper long term solution than lodging. Again, Williston data illustrates the point. By mid-2013, commercial construction had actually slowed a bit, but multi-family permits had nearly doubled. Once drilling is completed and the fields are in a stable production, estimates suggest that up to 20% or more of the field development workforce will need to remain to manage and maintain the production, processing, and distribution network. This translates into the need for long term housing that is typically met via single family homes.
From a supplemental construction perspective, infrastructure spending is largely road-related. While there is significant rail investment, it is captured in the foregoing supply chain analysis based on upstream operator spending. Access road construction that takes equipment and materials to the drill sites from existing roads would also typically be captured in the supply chain impact. However, the need to repair, widen, or build public roads would typically not be included in any supply chain approach.
© 2014 IHS 89 September 2014
IHS Economics | Supplying the Unconventional Revolution: Sizing the unconventional oil and gas supply chain
Unconventional oil and gas drilling and production frequently occurs in relatively remote areas. While roads generally exist, they were built to accommodate agricultural or lighter traffic, with a relatively low intensity of use. The traffic associated with unconventional energy production is of significantly greater tonnage and travels at a much higher frequency during the preparation, drilling, and completion stages of well development. Indeed, quiet town centers have become the scenes of traffic jams as large numbers of trucks navigate tight quarters with little or no traffic control devices, moving material and equipment to and from the energy fields. While some new roads have been constructed, the majority of spending has been to maintain and upgrade existing roads to ameliorate the impact of heavy traffic. Local governments, occasionally in partnership with upstream operators, find ways to keep roads functioning since a lack of access can inhibit billions of dollars in unconventional oil and gas investment.
Road construction estimates are more challenging than commercial and residential construction impacts because they depend upon state and local governments prioritizing roads in the face of competing needs. Some states have imposed taxes on energy companies to improve roads, but, in many cases, the money has not yet found its way into physical improvements. An additional issue is that states may allocate money to municipalities for road work, but attach preconditions to the funds that the municipality is unwilling to accept. Even so, the approach used for this analysis is reflective of indicated state priorities. For example, Texas has indicated its intention to invest $1 billion in road construction to support unconventional oil and gas development. The results of our analysis suggest that Texas will spend $1.2 billion over the next ten years on related infrastructure improvements.
Rural or remote communities also tend to lack public water and sewer systems. Construction of such systems takes years of planning and the analysis does not foresee extensive systems installed for most areas in the time frame under investigation. However, the technology does exist for ‘package plants’ to treat sewerage and purify water on a local scale. It is expected that such construction would occur on or near production sites as well as being required by concentrations of commercial and residential structures.
Supplemental construction by typeIn 2015, the forecast shows that nearly 70% of all commercial construction expenditures will occur in Texas and Louisiana. North Dakota will have nearly a $100 million in commercial expenditures, less than half of either of those states. Mississippi is poised to grow the most as commercial spending will grow from just over $9,000 in 2015 to $15.7 million in 2025.
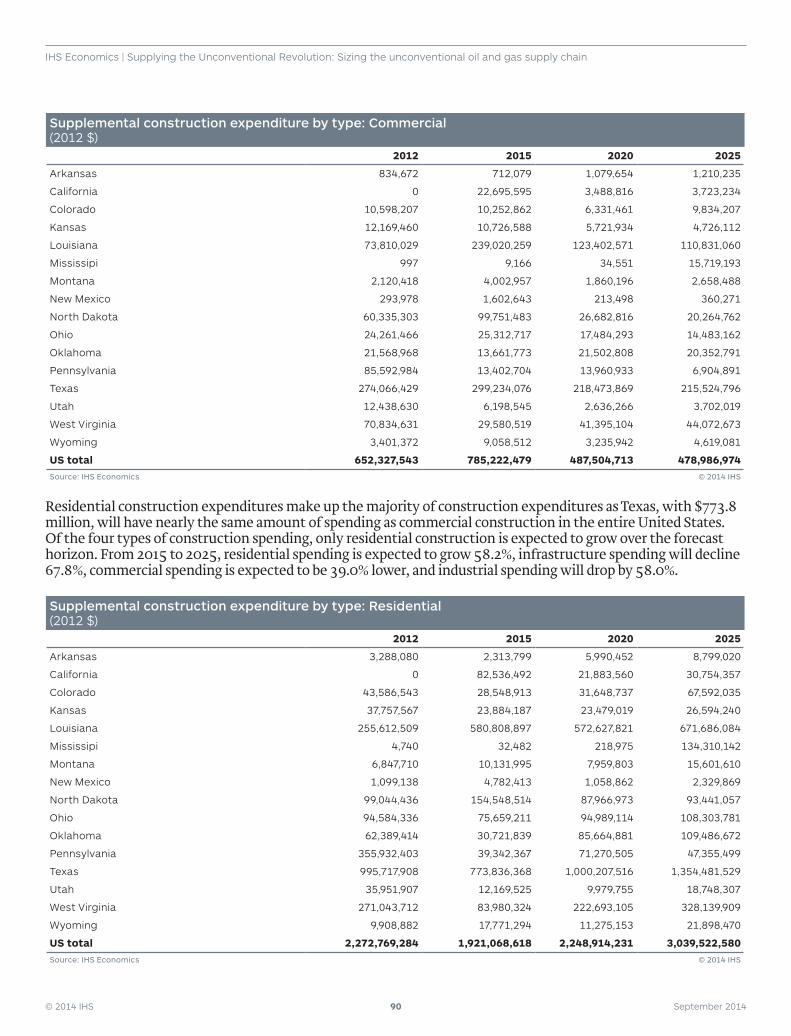
© 2014 IHS 90 September 2014
IHS Economics | Supplying the Unconventional Revolution: Sizing the unconventional oil and gas supply chain
Supplemental construction expenditure by type: Commercial (2012 $)
2012 2015 2020 2025
Arkansas 834,672 712,079 1,079,654 1,210,235
California 0 22,695,595 3,488,816 3,723,234
Colorado 10,598,207 10,252,862 6,331,461 9,834,207
Kansas 12,169,460 10,726,588 5,721,934 4,726,112
Louisiana 73,810,029 239,020,259 123,402,571 110,831,060
Mississipi 997 9,166 34,551 15,719,193
Montana 2,120,418 4,002,957 1,860,196 2,658,488
New Mexico 293,978 1,602,643 213,498 360,271
North Dakota 60,335,303 99,751,483 26,682,816 20,264,762
Ohio 24,261,466 25,312,717 17,484,293 14,483,162
Oklahoma 21,568,968 13,661,773 21,502,808 20,352,791
Pennsylvania 85,592,984 13,402,704 13,960,933 6,904,891
Texas 274,066,429 299,234,076 218,473,869 215,524,796
Utah 12,438,630 6,198,545 2,636,266 3,702,019
West Virginia 70,834,631 29,580,519 41,395,104 44,072,673
Wyoming 3,401,372 9,058,512 3,235,942 4,619,081
US total 652,327,543 785,222,479 487,504,713 478,986,974Source: IHS Economics © 2014 IHS
Residential construction expenditures make up the majority of construction expenditures as Texas, with $773.8 million, will have nearly the same amount of spending as commercial construction in the entire United States. Of the four types of construction spending, only residential construction is expected to grow over the forecast horizon. From 2015 to 2025, residential spending is expected to grow 58.2%, infrastructure spending will decline 67.8%, commercial spending is expected to be 39.0% lower, and industrial spending will drop by 58.0%.
Supplemental construction expenditure by type: Residential (2012 $)
2012 2015 2020 2025
Arkansas 3,288,080 2,313,799 5,990,452 8,799,020
California 0 82,536,492 21,883,560 30,754,357
Colorado 43,586,543 28,548,913 31,648,737 67,592,035
Kansas 37,757,567 23,884,187 23,479,019 26,594,240
Louisiana 255,612,509 580,808,897 572,627,821 671,686,084
Mississipi 4,740 32,482 218,975 134,310,142
Montana 6,847,710 10,131,995 7,959,803 15,601,610
New Mexico 1,099,138 4,782,413 1,058,862 2,329,869
North Dakota 99,044,436 154,548,514 87,966,973 93,441,057
Ohio 94,584,336 75,659,211 94,989,114 108,303,781
Oklahoma 62,389,414 30,721,839 85,664,881 109,486,672
Pennsylvania 355,932,403 39,342,367 71,270,505 47,355,499
Texas 995,717,908 773,836,368 1,000,207,516 1,354,481,529
Utah 35,951,907 12,169,525 9,979,755 18,748,307
West Virginia 271,043,712 83,980,324 222,693,105 328,139,909
Wyoming 9,908,882 17,771,294 11,275,153 21,898,470
US total 2,272,769,284 1,921,068,618 2,248,914,231 3,039,522,580Source: IHS Economics © 2014 IHS
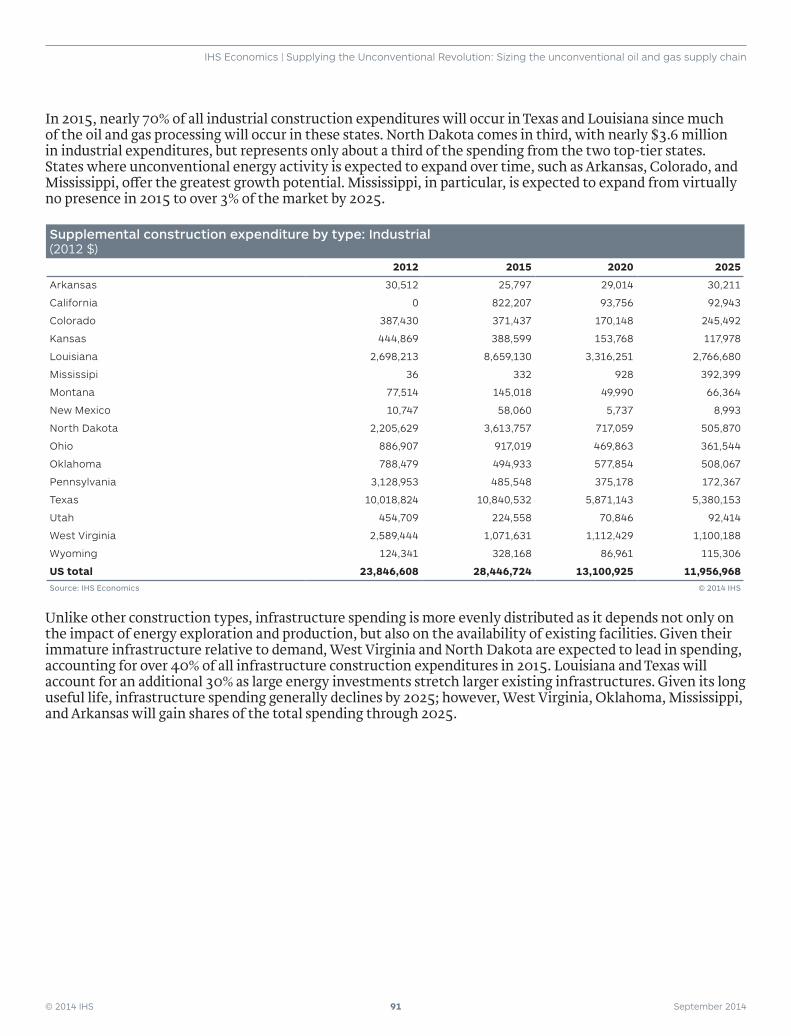
© 2014 IHS 91 September 2014
IHS Economics | Supplying the Unconventional Revolution: Sizing the unconventional oil and gas supply chain
In 2015, nearly 70% of all industrial construction expenditures will occur in Texas and Louisiana since much of the oil and gas processing will occur in these states. North Dakota comes in third, with nearly $3.6 million in industrial expenditures, but represents only about a third of the spending from the two top-tier states. States where unconventional energy activity is expected to expand over time, such as Arkansas, Colorado, and Mississippi, offer the greatest growth potential. Mississippi, in particular, is expected to expand from virtually no presence in 2015 to over 3% of the market by 2025.
Supplemental construction expenditure by type: Industrial (2012 $)
2012 2015 2020 2025
Arkansas 30,512 25,797 29,014 30,211
California 0 822,207 93,756 92,943
Colorado 387,430 371,437 170,148 245,492
Kansas 444,869 388,599 153,768 117,978
Louisiana 2,698,213 8,659,130 3,316,251 2,766,680
Mississipi 36 332 928 392,399
Montana 77,514 145,018 49,990 66,364
New Mexico 10,747 58,060 5,737 8,993
North Dakota 2,205,629 3,613,757 717,059 505,870
Ohio 886,907 917,019 469,863 361,544
Oklahoma 788,479 494,933 577,854 508,067
Pennsylvania 3,128,953 485,548 375,178 172,367
Texas 10,018,824 10,840,532 5,871,143 5,380,153
Utah 454,709 224,558 70,846 92,414
West Virginia 2,589,444 1,071,631 1,112,429 1,100,188
Wyoming 124,341 328,168 86,961 115,306
US total 23,846,608 28,446,724 13,100,925 11,956,968Source: IHS Economics © 2014 IHS
Unlike other construction types, infrastructure spending is more evenly distributed as it depends not only on the impact of energy exploration and production, but also on the availability of existing facilities. Given their immature infrastructure relative to demand, West Virginia and North Dakota are expected to lead in spending, accounting for over 40% of all infrastructure construction expenditures in 2015. Louisiana and Texas will account for an additional 30% as large energy investments stretch larger existing infrastructures. Given its long useful life, infrastructure spending generally declines by 2025; however, West Virginia, Oklahoma, Mississippi, and Arkansas will gain shares of the total spending through 2025.
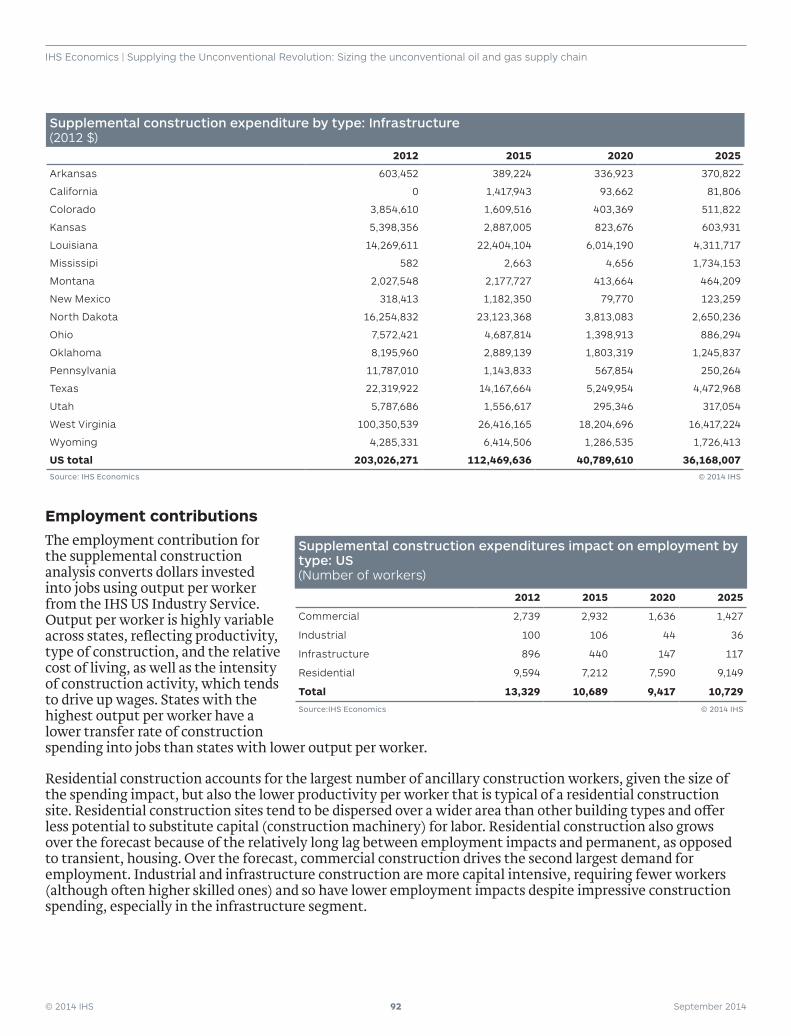
© 2014 IHS 92 September 2014
IHS Economics | Supplying the Unconventional Revolution: Sizing the unconventional oil and gas supply chain
Supplemental construction expenditure by type: Infrastructure (2012 $)
2012 2015 2020 2025
Arkansas 603,452 389,224 336,923 370,822
California 0 1,417,943 93,662 81,806
Colorado 3,854,610 1,609,516 403,369 511,822
Kansas 5,398,356 2,887,005 823,676 603,931
Louisiana 14,269,611 22,404,104 6,014,190 4,311,717
Mississipi 582 2,663 4,656 1,734,153
Montana 2,027,548 2,177,727 413,664 464,209
New Mexico 318,413 1,182,350 79,770 123,259
North Dakota 16,254,832 23,123,368 3,813,083 2,650,236
Ohio 7,572,421 4,687,814 1,398,913 886,294
Oklahoma 8,195,960 2,889,139 1,803,319 1,245,837
Pennsylvania 11,787,010 1,143,833 567,854 250,264
Texas 22,319,922 14,167,664 5,249,954 4,472,968
Utah 5,787,686 1,556,617 295,346 317,054
West Virginia 100,350,539 26,416,165 18,204,696 16,417,224
Wyoming 4,285,331 6,414,506 1,286,535 1,726,413
US total 203,026,271 112,469,636 40,789,610 36,168,007Source: IHS Economics © 2014 IHS
Employment contributionsThe employment contribution for the supplemental construction analysis converts dollars invested into jobs using output per worker from the IHS US Industry Service. Output per worker is highly variable across states, reflecting productivity, type of construction, and the relative cost of living, as well as the intensity of construction activity, which tends to drive up wages. States with the highest output per worker have a lower transfer rate of construction spending into jobs than states with lower output per worker.
Residential construction accounts for the largest number of ancillary construction workers, given the size of the spending impact, but also the lower productivity per worker that is typical of a residential construction site. Residential construction sites tend to be dispersed over a wider area than other building types and offer less potential to substitute capital (construction machinery) for labor. Residential construction also grows over the forecast because of the relatively long lag between employment impacts and permanent, as opposed to transient, housing. Over the forecast, commercial construction drives the second largest demand for employment. Industrial and infrastructure construction are more capital intensive, requiring fewer workers (although often higher skilled ones) and so have lower employment impacts despite impressive construction spending, especially in the infrastructure segment.
Supplemental construction expenditures impact on employment by type: US (Number of workers)
2012 2015 2020 2025
Commercial 2,739 2,932 1,636 1,427
Industrial 100 106 44 36
Infrastructure 896 440 147 117
Residential 9,594 7,212 7,590 9,149
Total 13,329 10,689 9,417 10,729
Source:IHS Economics © 2014 IHS
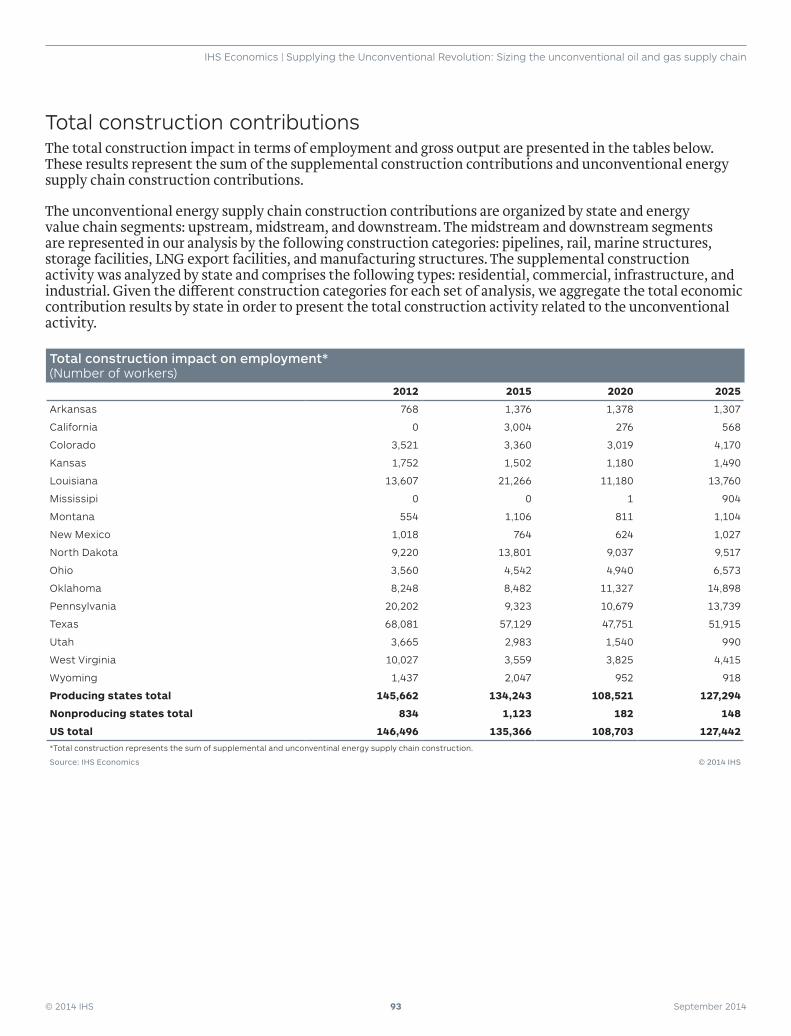
© 2014 IHS 93 September 2014
IHS Economics | Supplying the Unconventional Revolution: Sizing the unconventional oil and gas supply chain
Total construction contributionsThe total construction impact in terms of employment and gross output are presented in the tables below. These results represent the sum of the supplemental construction contributions and unconventional energy supply chain construction contributions.
The unconventional energy supply chain construction contributions are organized by state and energy value chain segments: upstream, midstream, and downstream. The midstream and downstream segments are represented in our analysis by the following construction categories: pipelines, rail, marine structures, storage facilities, LNG export facilities, and manufacturing structures. The supplemental construction activity was analyzed by state and comprises the following types: residential, commercial, infrastructure, and industrial. Given the different construction categories for each set of analysis, we aggregate the total economic contribution results by state in order to present the total construction activity related to the unconventional activity.
Total construction impact on employment* (Number of workers)
2012 2015 2020 2025
Arkansas 768 1,376 1,378 1,307
California 0 3,004 276 568
Colorado 3,521 3,360 3,019 4,170
Kansas 1,752 1,502 1,180 1,490
Louisiana 13,607 21,266 11,180 13,760
Mississipi 0 0 1 904
Montana 554 1,106 811 1,104
New Mexico 1,018 764 624 1,027
North Dakota 9,220 13,801 9,037 9,517
Ohio 3,560 4,542 4,940 6,573
Oklahoma 8,248 8,482 11,327 14,898
Pennsylvania 20,202 9,323 10,679 13,739
Texas 68,081 57,129 47,751 51,915
Utah 3,665 2,983 1,540 990
West Virginia 10,027 3,559 3,825 4,415
Wyoming 1,437 2,047 952 918
Producing states total 145,662 134,243 108,521 127,294
Nonproducing states total 834 1,123 182 148
US total 146,496 135,366 108,703 127,442*Total construction represents the sum of supplemental and unconventinal energy supply chain construction.
Source: IHS Economics © 2014 IHS
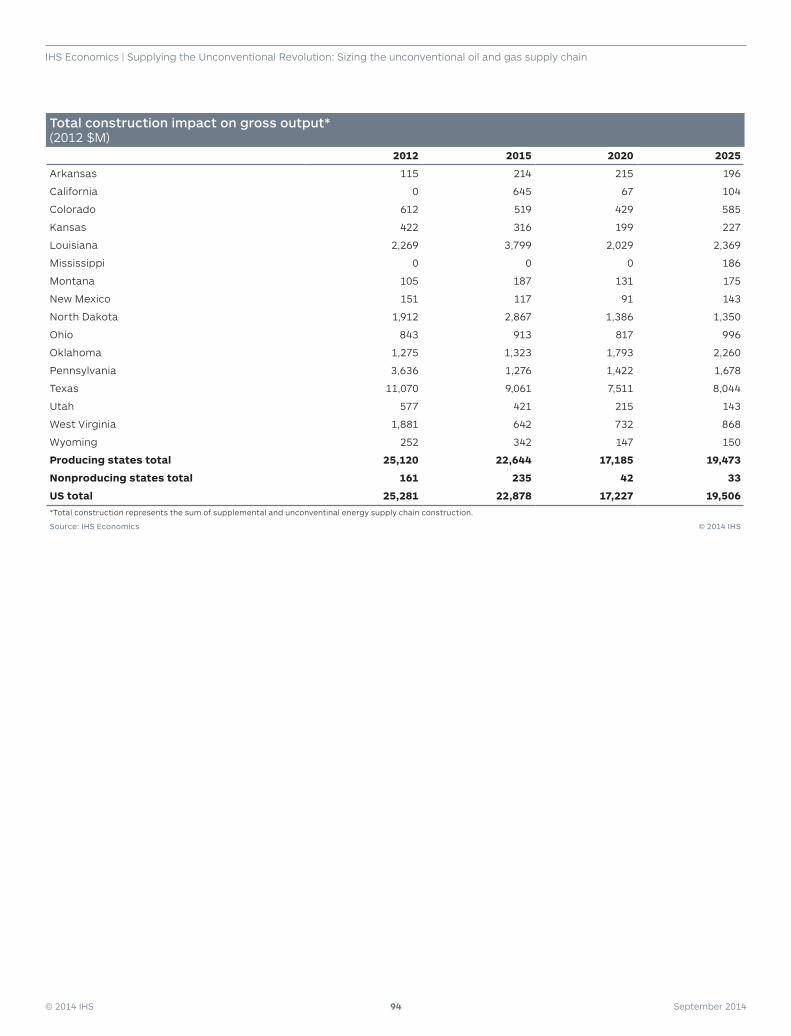
© 2014 IHS 94 September 2014
IHS Economics | Supplying the Unconventional Revolution: Sizing the unconventional oil and gas supply chain
Total construction impact on gross output* (2012 $M)
2012 2015 2020 2025
Arkansas 115 214 215 196
California 0 645 67 104
Colorado 612 519 429 585
Kansas 422 316 199 227
Louisiana 2,269 3,799 2,029 2,369
Mississippi 0 0 0 186
Montana 105 187 131 175
New Mexico 151 117 91 143
North Dakota 1,912 2,867 1,386 1,350
Ohio 843 913 817 996
Oklahoma 1,275 1,323 1,793 2,260
Pennsylvania 3,636 1,276 1,422 1,678
Texas 11,070 9,061 7,511 8,044
Utah 577 421 215 143
West Virginia 1,881 642 732 868
Wyoming 252 342 147 150
Producing states total 25,120 22,644 17,185 19,473
Nonproducing states total 161 235 42 33
US total 25,281 22,878 17,227 19,506*Total construction represents the sum of supplemental and unconventinal energy supply chain construction.
Source: IHS Economics © 2014 IHS
© 2014 IHS 95 September 2014
IHS Economics | Supplying the Unconventional Revolution: Sizing the unconventional oil and gas supply chain
ConclusionAs the ‘Great Revival’ in domestic energy production transforms America’s economy, the remarkable impact of unconventional oil and natural gas on the US economy is reverberating throughout the vast nationwide supply chain that supports today’s oil and gas production, processing, and transportation activities. Upstream, midstream, and downstream operators are responsible for the significant capital investment required for exploration, production, transport, and refinement of unconventional oil and natural gas. In recognition of this investment, the oil and gas industry is often depicted as the face of the ‘unconventional revolution’. However, it is the extensive oil and gas supply chain—labor, equipment, materials, services, and logistics—which represents the backbone that makes it possible to transform geological prospects into resource abundance throughout the energy value chain and the US economy.
The report’s key findings indicate that within the unconventional supply chain, across the 56 NAICS sectors analyzed,
•Total employment will grow from 524,000 jobs in 2012 to 757,000 jobs in 2025.
•The average annual wage of these jobs in the 2012–25 period is $79,000 in real 2012 dollars.
•The total supply chain-related gross output contributions will increase from nearly $146 billion in 2012 to almost $206 billion in 2025, representing roughly 0.5% of total US gross output in any given year of the forecast period.
•Total government revenues generated by the unconventional supply chain will increase from more than $13 billion in 2012 to more than $16 billion in 2015 and to about $23 billion in 2025.
•Lastly, study results show that supplemental construction, coupled with unconventional energy supply chain related construction activity, will add on average 127,000 jobs each year over the forecast period, corresponding to about $20 billion of annual gross output on average.