supplementary material word - supplementarymaterial95091-ins-rg-rv-3.docx created date...
TRANSCRIPT
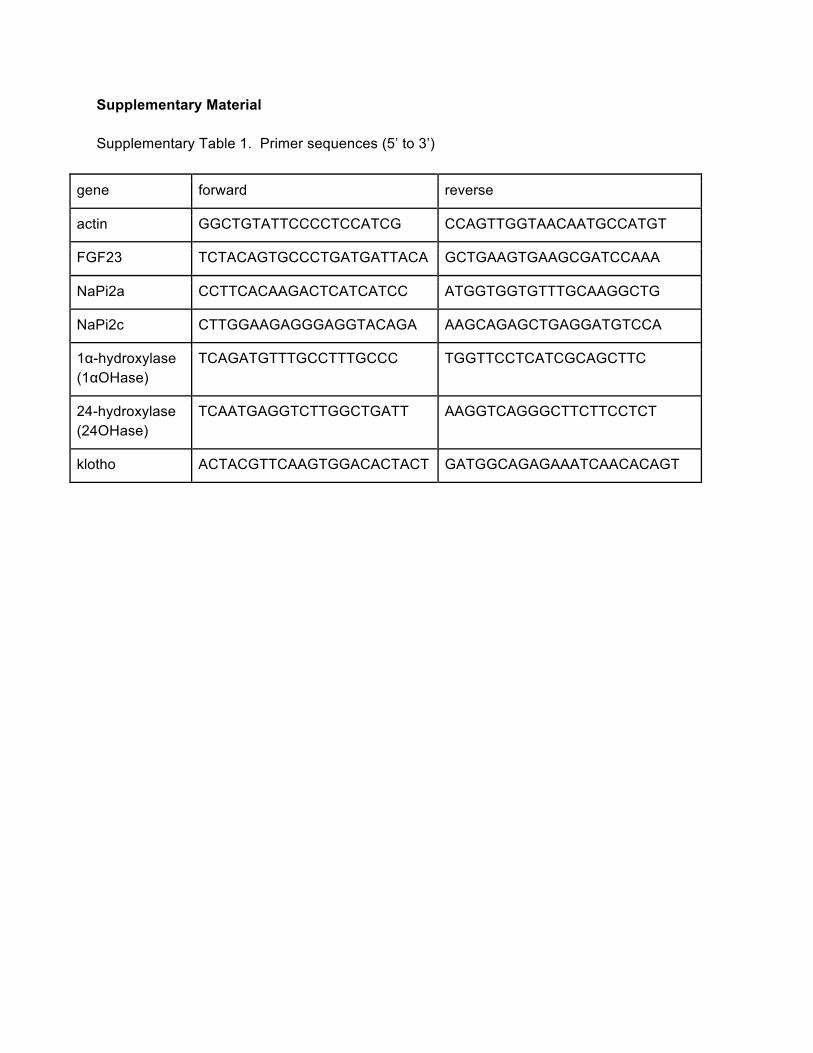
Supplementary Material Supplementary Table 1. Primer sequences (5’ to 3’)
gene forward reverse
actin GGCTGTATTCCCCTCCATCG CCAGTTGGTAACAATGCCATGT
FGF23 TCTACAGTGCCCTGATGATTACA GCTGAAGTGAAGCGATCCAAA
NaPi2a CCTTCACAAGACTCATCATCC ATGGTGGTGTTTGCAAGGCTG
NaPi2c CTTGGAAGAGGGAGGTACAGA AAGCAGAGCTGAGGATGTCCA
1α-hydroxylase (1αOHase)
TCAGATGTTTGCCTTTGCCC TGGTTCCTCATCGCAGCTTC
24-hydroxylase (24OHase)
TCAATGAGGTCTTGGCTGATT AAGGTCAGGGCTTCTTCCTCT
klotho ACTACGTTCAAGTGGACACTACT GATGGCAGAGAAATCAACACAGT
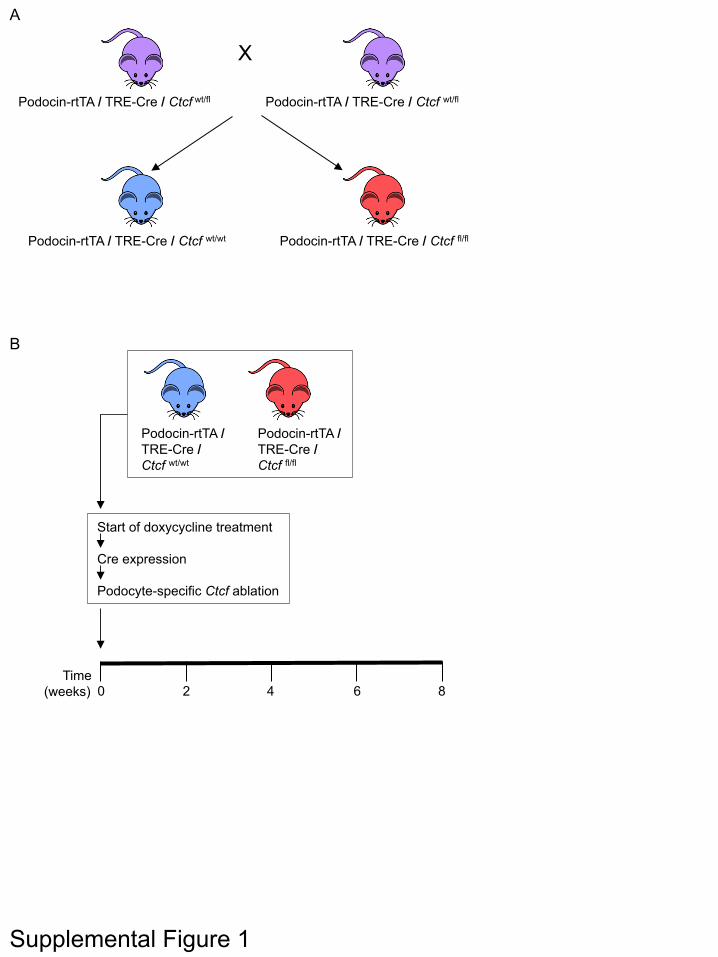
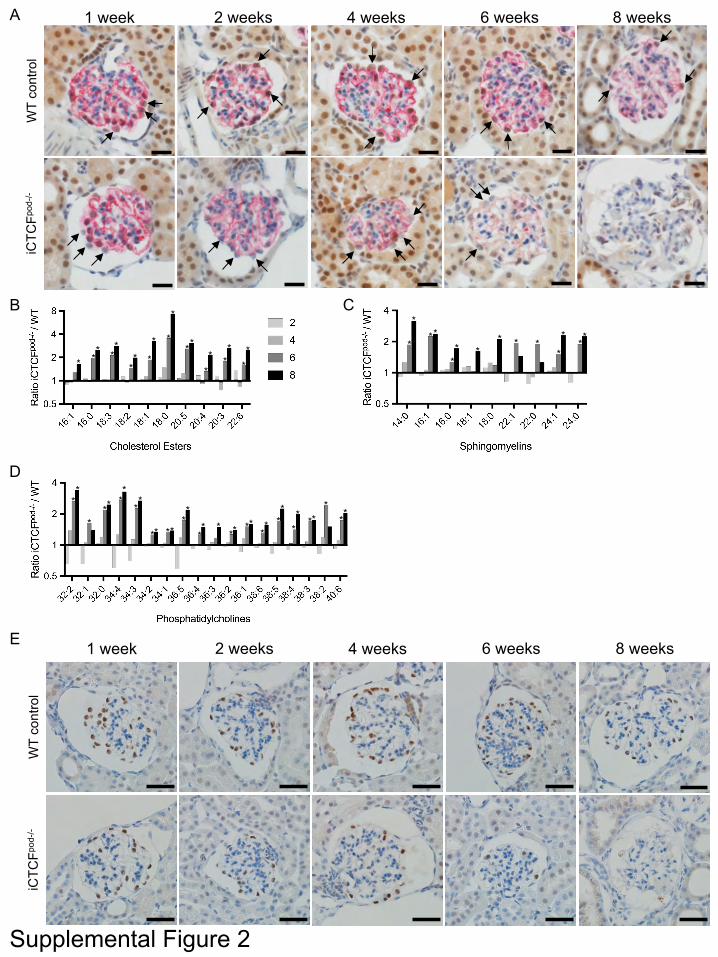
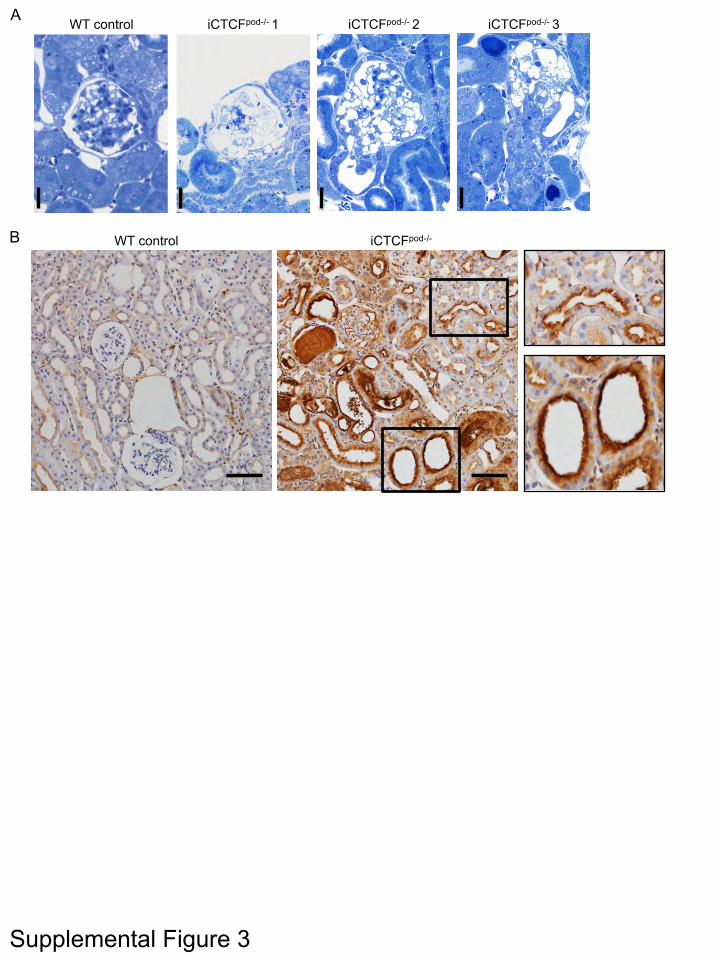
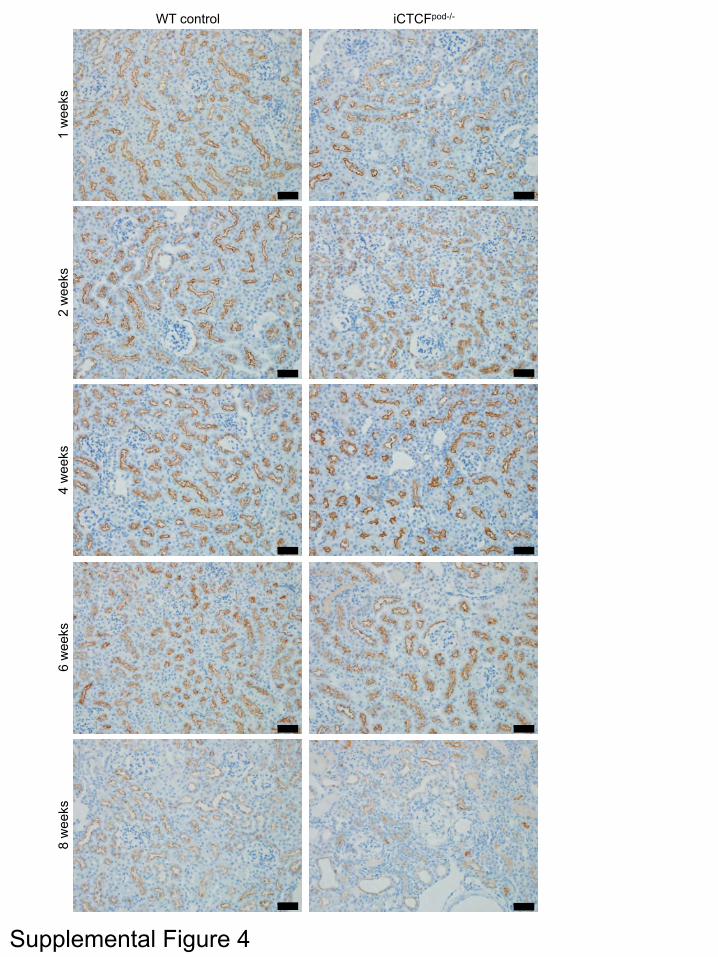
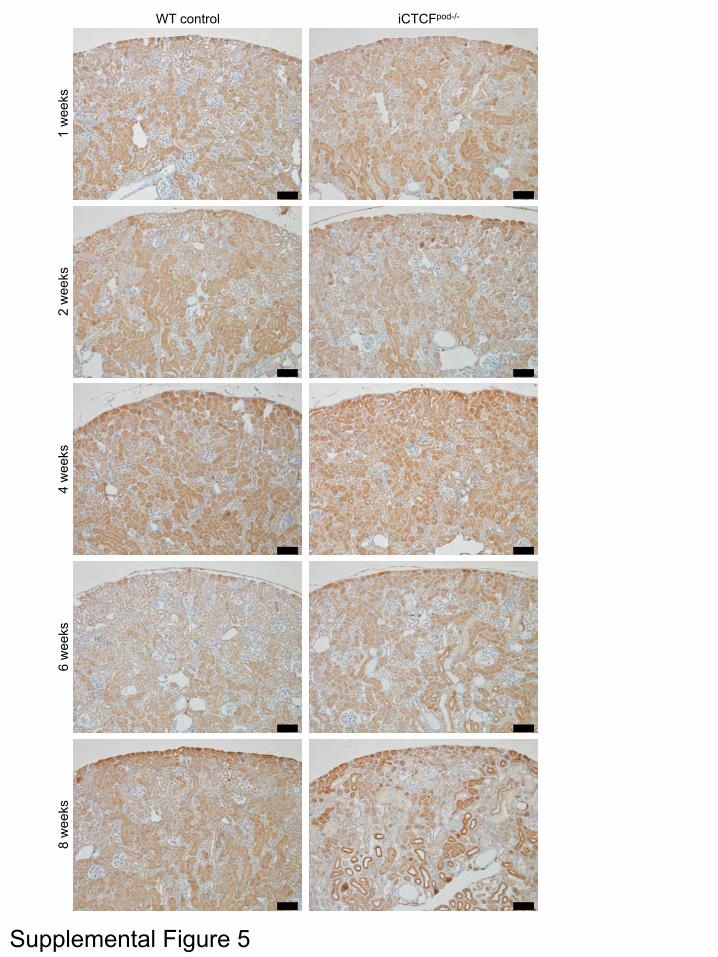
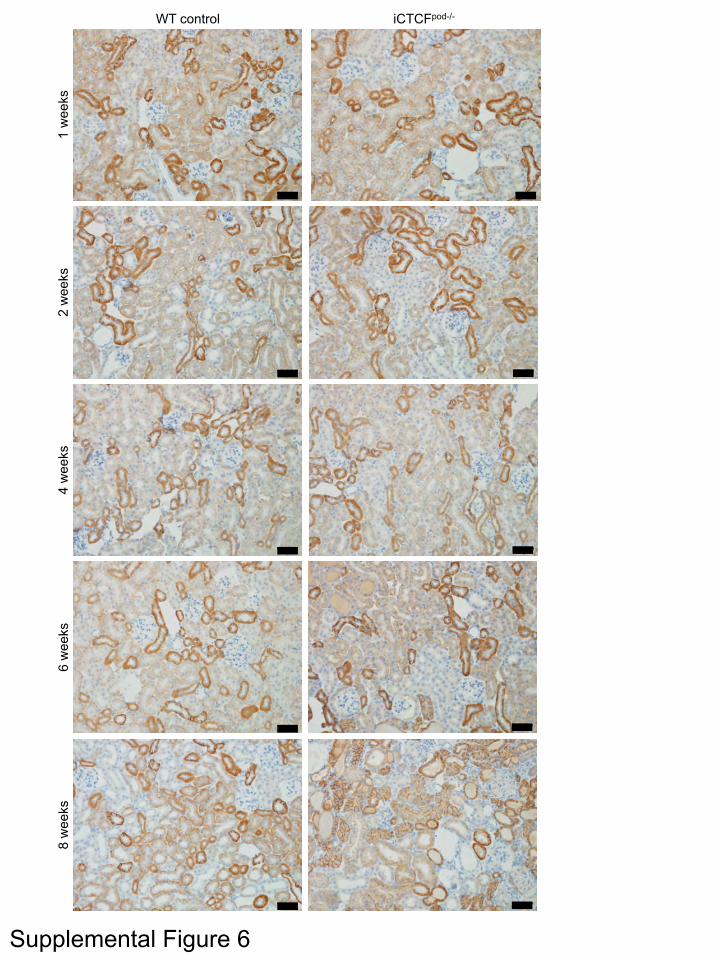
Supplementary Figures S1. Breeding and treatment strategy. A) Heterozygous, floxed CTCF mice (Ctcffl/wt) (52) were mated with doxycycline-inducible, podocyte-specific CRE transgenic mice (iCrepod) (53) to generate iCrepod-Ctcfwt/fl mice (not shown), which were then inbred to generate iCrepod-Ctcffl/fl and iCrepod-Ctcfwt/wt mice. B) CTCF deletion in podocytes of adult iCrepod-Ctcffl/fl mice was induced by doxycycline-mediated activation of Cre recombinase starting at 6 weeks of age to generate iCTCFpod-/- mice; doxycycline-treated iCrepod-Ctcfwt/wt mice (wildtype; WT) littermate mice served as controls. S2. Structural and functional characterization of disease progression in iCTCFpod-/- mice. A) CTCF and synaptopodin staining in weeks 1-8 post induction. Arrows mark podocytes. Synaptopodin red, CTCF brown. Tubular epithelial cell nuclei serve as a positive control for CTCF staining in iCTCFpod-/- mice, which show efficient deletion of CTCF from podocytes as early as 1 week after Cre induction. Size bar, 20µm. B-D) Lipidomic analysis of mouse sera shows consistent and progressive elevations in B) cholesterol esters, C) sphingomyelins, and D) phosphatidylcholines starting at 6 weeks post-Cre induction. n = 6, 17, 10, 8 WT mice and n = 8, 16, 13, 8 iCTCFpod-/- mice for data collected at 2, 4, 6 and 8 weeks. Adjusted p-values, controlling for multiple comparisons were calculated with a two-way ANOVA and are reported as: *p<0.05 comparing WT control versus iCTCFpod-/- mice at each time point for a given lipid. E) TLE4 staining of podocytes reveales progressive podocyte loss in kidneys of iCTCFpod-/- mice, starting at 2 weeks after Cre induction. At 8 weeks post-Cre induction, only rare intact podocyte nuclei or remnants of nuclear debris can be seen on the tuft of iCTCFpod-/- mice, indicating global podocyte loss in the majority of glomeruli. Size bar, 20µm. S3. Detection of podocyte vacuolization in iCTCFpod-/- mice 4 weeks post-Cre induction. A) Toluidine blue stained semithin kidney sections demonstrate profound cell body attenuation and vacuolization of podocytes in iCTCFpod-/- mice. B) No specific staining for albumin is seen in a WT control 8 weeks post-Cre induction. In contrast, large proteinaceous casts and frequent tubular reabsorption droplets in iCTCFpod-/- mice show strong reactivity for albumin. Despite the albumin load, tubular cells in iCTCFpod-/- mice remain largely intact, with preserved brush border, indicating lack of significant tubular epithelial cell injury. Size bar, 50µm. S4. Megalin staining reveals intact proximal brush borders in proximal tubular epithelial cells in iCTCFpod-/- mice. Staining for megalin, a marker of the brush border in proximal tubular cells shows no significant differences between iCTCFpod-/- and WT control mice despite the development of progressive podocyte loss, severe nephrosis and kidney failure. Size bar, 50µm. S5. Aquaporin1 staining is preserved in proximal tubular cells in iCTCFpod-/- mice. Aquaporin 1 staining is comparable in proximal tubular cells in WT and iCTCFpod-/- mice. Size bar, 100µm. S6. E-cadherin staining indicates intact tubular epithelial cells in iCTCFpod-/- mice. No
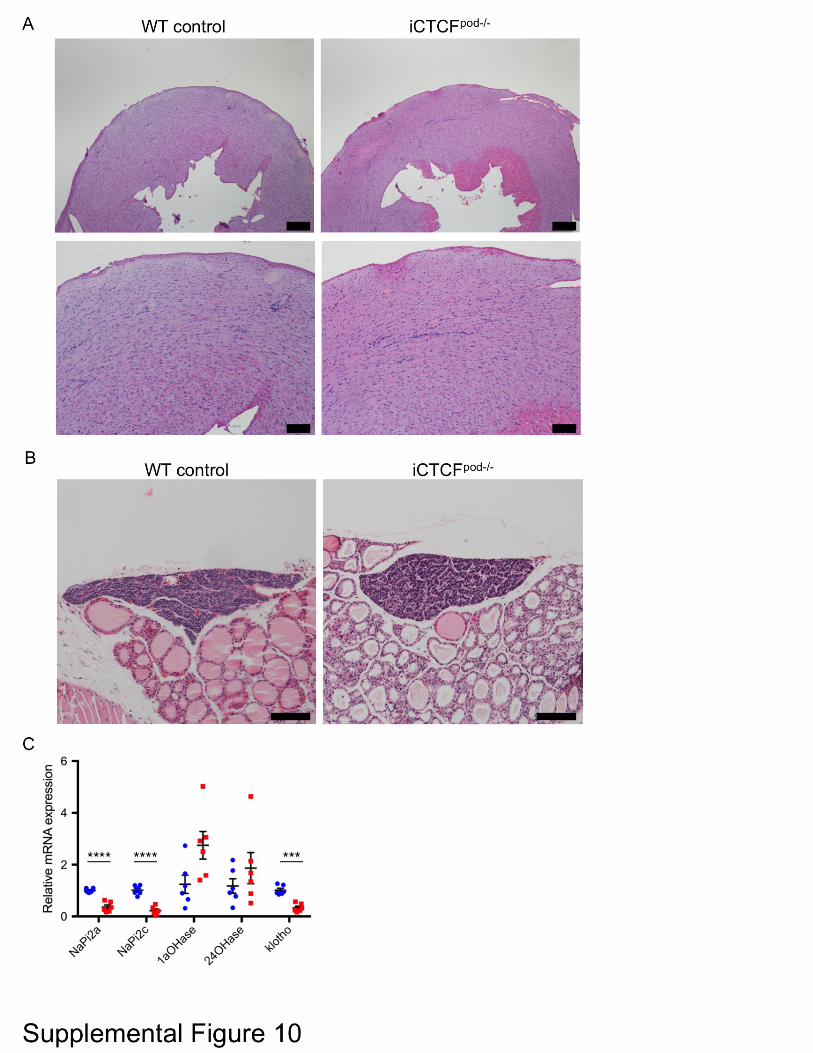
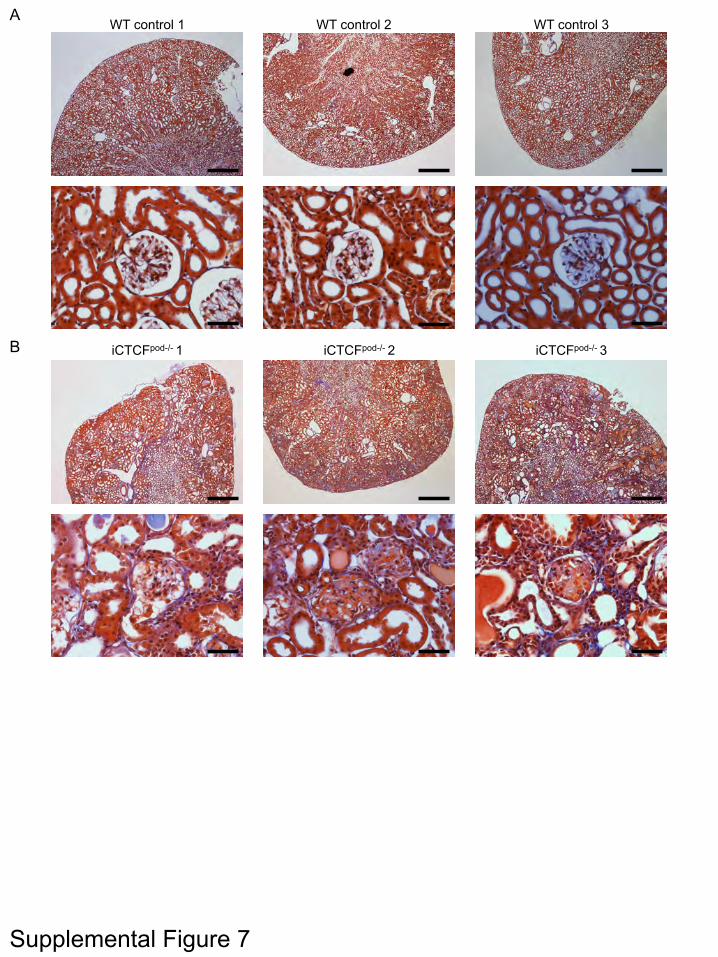
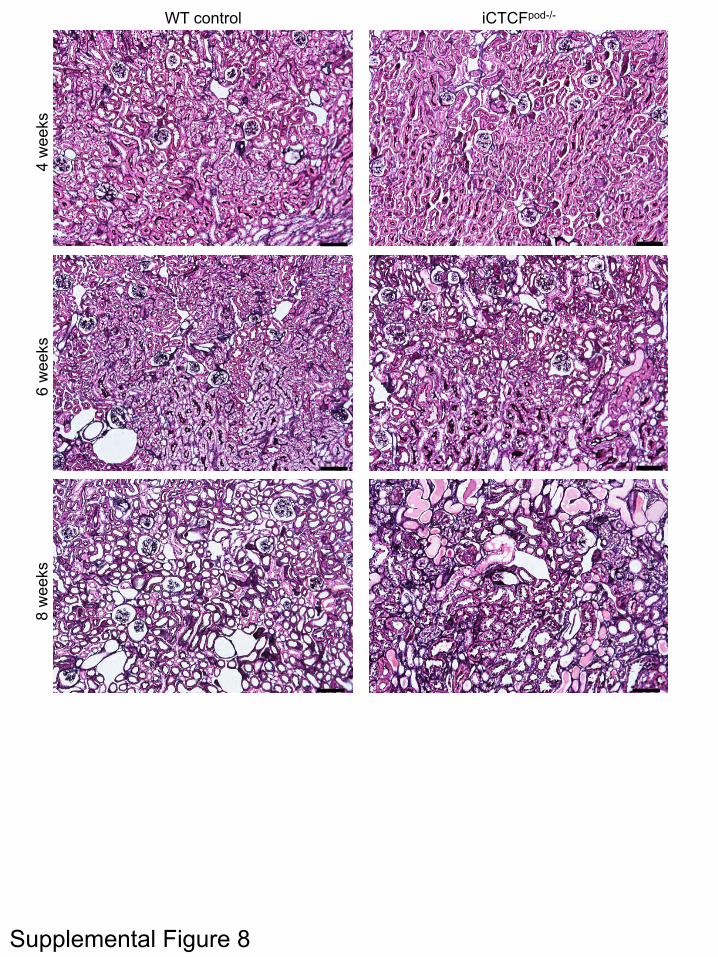
difference in E-cadherin staining of tubular cells, including distal tubular and collecting duct epithelial cells in WT and iCTCFpod-/- mice. Size bar, 50µm. S7. Trichrome staining reveals absence of interstitial fibrosis in additional representative images. Kidney sections from A) three WT controls and B) three iCTCFpod-/- mice at 8 weeks post-Cre induction show little to no detectable interstitial fibrosis. Size bar, top panel, 200 µm; lower panel, 20 µm. S8. Jones Methenamine Silver (JMS) staining confirms absence of fibrosis in kidneys of iCTCFpod-/-. JMS staining, highlighting collagen and elastic fibers in interstitium and basement membranes, corroborates the absence of interstitial fibrosis in WT control mice at all timepoints, and in iCTCFpod-/- mice at 4 and 6 weeks post-Cre induction. At 8 weeks post-Cre induction, focal mild JMS-positive collagen deposition can be seen in and around thickened tubular basement membranes. Size bar, 20µm. S9. a-SMA staining in iCTCFpod-/- mice is indistinguishable from WT controls. Staining for a-SMA, a marker of activated interstitial pro-fibrotic cells (myofibroblasts) is not observed in iCTCFpod-/- mice. Staining of vascular smooth muscle cells serves as positive control in both WT and iCTCFpod-/- mice. Size bar, 100µm. S10. Analysis of cardiac morphology, and calcium and phosphate metabolism in iCTCFpod-/- mice. A) Hearts of iCTCFpod-/- mice show no histological abnormalities and no evidence of hyperplasia. Size bar, top panel, 200µm; lower panel, 100µm. B) Parathyroid glands of iCTCFpod-/- mice show no histologic abnormalities and no evidence of hyperplasia. Size bar, 100µm. C) Whole kidney mRNA expression levels at 6 weeks post-Cre induction are normalized to actin, n = 6 mice for all groups. Adjusted p-values, controlling for multiple comparisons were calculated with multiple unpaired t-tests and are reported as: *p<0.05, ***p<0.001, ****p<0.0001 comparing WT control versus iCTCFpod-/- mice at each time point. NaPi2a, sodium phosphate co-transporter 2a; NaPi2c, sodium phosphate co-transporter 2c; 1αOHase, 1 alpha hydroxylase; 24OHase, 24 hydroxylase.
Podocin-rtTA / TRE-Cre / Ctcf wt/fl Podocin-rtTA / TRE-Cre / Ctcf wt/fl
X
Podocin-rtTA / TRE-Cre / Ctcf wt/wt Podocin-rtTA / TRE-Cre / Ctcf fl/fl
Podocin-rtTA / TRE-Cre / Ctcf wt/wt
Podocin-rtTA / TRE-Cre / Ctcf fl/fl
Start of doxycycline treatment Cre expression Podocyte-specific Ctcf ablation
Time (weeks) 0 8 2 4 6
Supplemental Figure 1
A
B
Supplemental Figure 2
1 week 2 weeks 4 weeks 6 weeks 8 weeks E
WT
cont
rol
iCTC
Fpod
-/-
A
* ** *
*
** *
* *
*
**
** *
*** *
* * *
* * *
* * * *
* * *
**
***
**
**
** ****
** *
**** * *
*
* **
** **
*
B
1 week 2 weeks 4 weeks 6 weeks 8 weeks W
T co
ntro
l iC
TCFp
od-/-
C
D
Supplemental Figure 3
WT control iCTCFpod-/- 1 iCTCFpod-/- 2 iCTCFpod-/- 3 A
WT control iCTCFpod-/- B
Supplemental Figure 4
WT control iCTCFpod-/-
4 w
eeks
6
wee
ks
8 w
eeks
2
wee
ks
1 w
eeks
Megalin
Supplemental Figure 5
Aqp1 WT control iCTCFpod-/-
4 w
eeks
6
wee
ks
8 w
eeks
2
wee
ks
1 w
eeks
Supplemental Figure 6
4 w
eeks
6
wee
ks
8 w
eeks
2
wee
ks
1 w
eeks
WT control iCTCFpod-/-
E-cadherin
WT control 1
iCTCFpod-/- 1
WT control 2 WT control 3
iCTCFpod-/- 3 iCTCFpod-/- 2
A
B
Supplemental Figure 7
4 w
eeks
6
wee
ks
8 w
eeks
Supplemental Figure 8
WT control iCTCFpod-/-
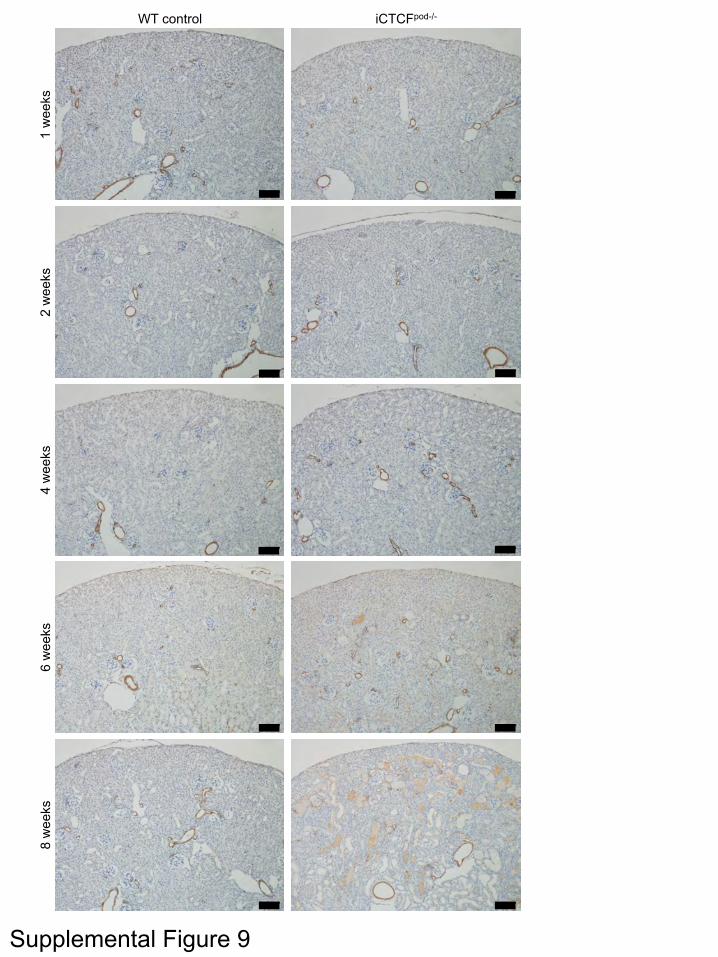
Supplemental Figure 9
4 w
eeks
6
wee
ks
8 w
eeks
2
wee
ks
1 w
eeks
WT control iCTCFpod-/-