supplementary figures - nature · supplementary figures supplementary fig. 1. ... the figure was...
TRANSCRIPT
1
Supplementary Figures
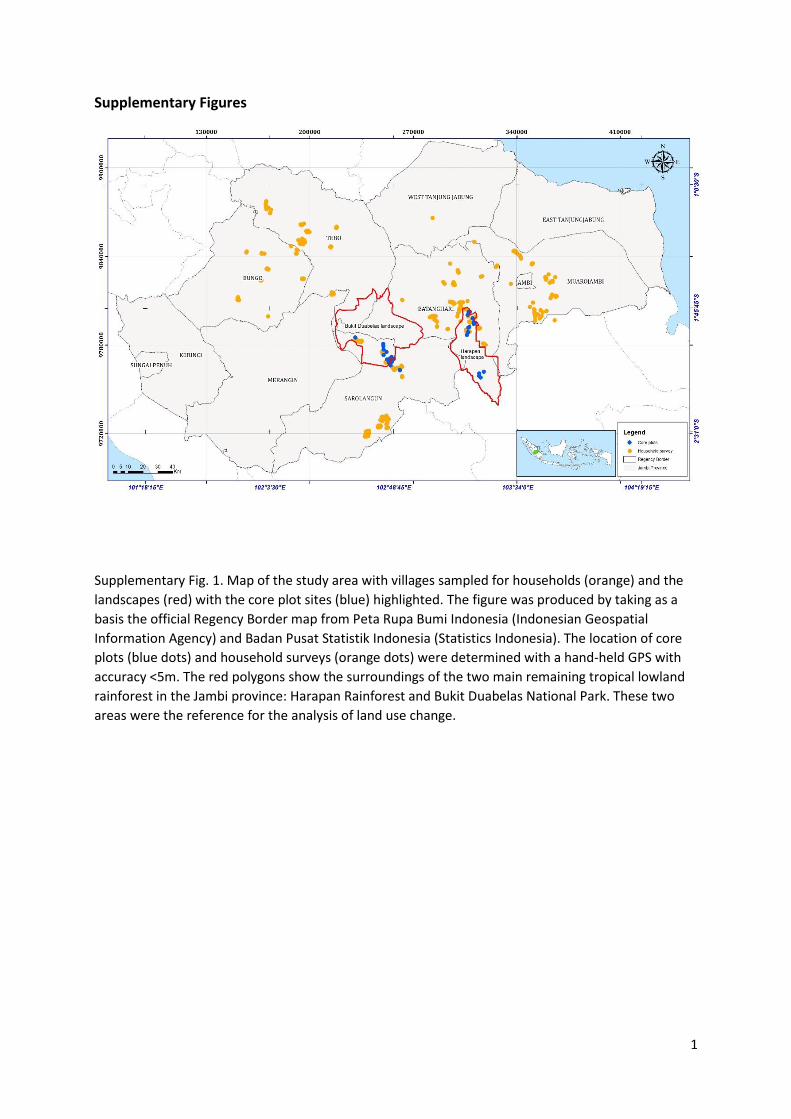
Supplementary Fig. 1. Map of the study area with villages sampled for households (orange) and the
landscapes (red) with the core plot sites (blue) highlighted. The figure was produced by taking as a
basis the official Regency Border map from Peta Rupa Bumi Indonesia (Indonesian Geospatial
Information Agency) and Badan Pusat Statistik Indonesia (Statistics Indonesia). The location of core
plots (blue dots) and household surveys (orange dots) were determined with a hand-held GPS with
accuracy <5m. The red polygons show the surroundings of the two main remaining tropical lowland
rainforest in the Jambi province: Harapan Rainforest and Bukit Duabelas National Park. These two
areas were the reference for the analysis of land use change.
2
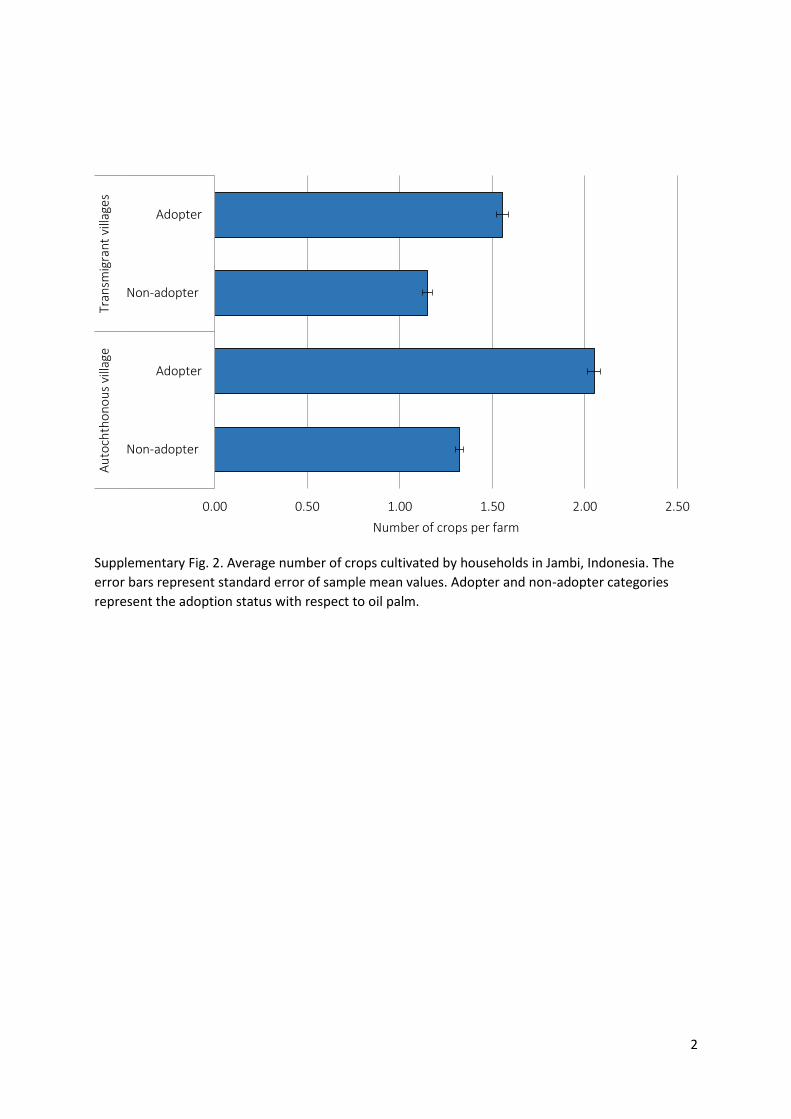
Supplementary Fig. 2. Average number of crops cultivated by households in Jambi, Indonesia. The
error bars represent standard error of sample mean values. Adopter and non-adopter categories
represent the adoption status with respect to oil palm.
0.00 0.50 1.00 1.50 2.00 2.50
Non-adopter
Adopter
Non-adopter
Adopter
Au
toch
tho
no
us
villa
geTr
ansm
igra
nt
villa
ges
Number of crops per farm
3
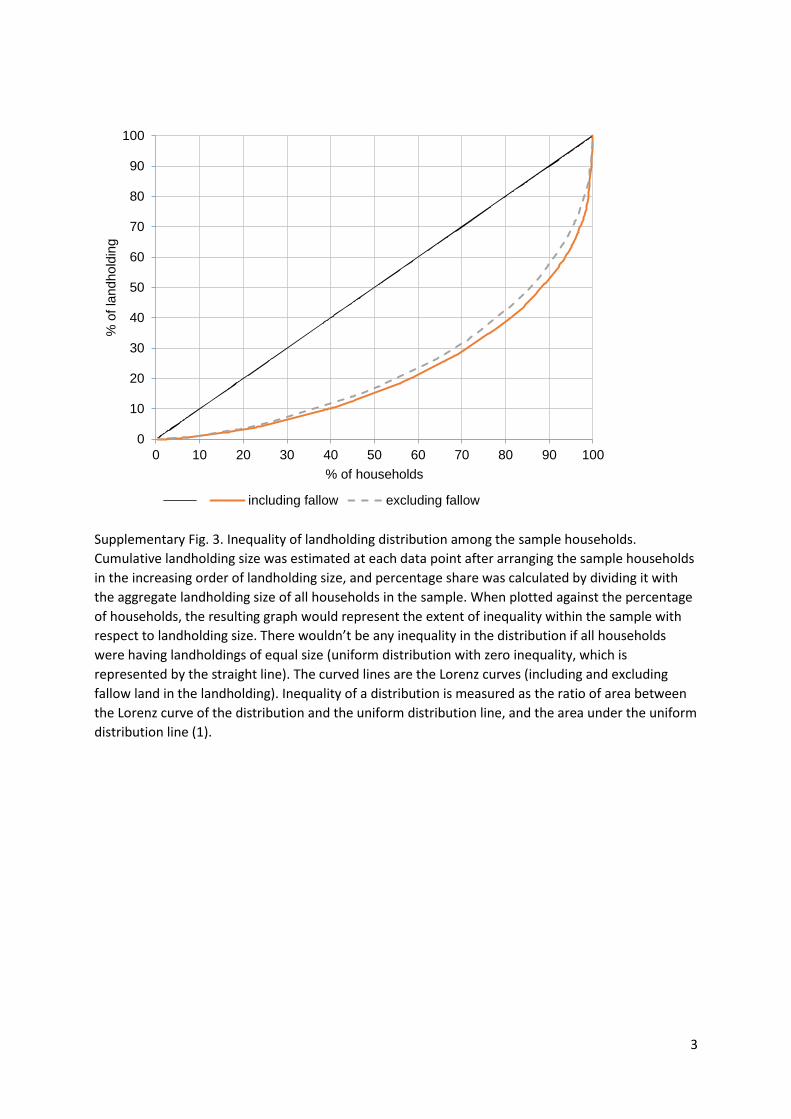
Supplementary Fig. 3. Inequality of landholding distribution among the sample households.
Cumulative landholding size was estimated at each data point after arranging the sample households
in the increasing order of landholding size, and percentage share was calculated by dividing it with
the aggregate landholding size of all households in the sample. When plotted against the percentage
of households, the resulting graph would represent the extent of inequality within the sample with
respect to landholding size. There wouldn’t be any inequality in the distribution if all households
were having landholdings of equal size (uniform distribution with zero inequality, which is
represented by the straight line). The curved lines are the Lorenz curves (including and excluding
fallow land in the landholding). Inequality of a distribution is measured as the ratio of area between
the Lorenz curve of the distribution and the uniform distribution line, and the area under the uniform
distribution line (1).
0
10
20
30
40
50
60
70
80
90
100
0 10 20 30 40 50 60 70 80 90 100
% o
f la
ndhold
ing
% of households
including fallow excluding fallow
4
A
B
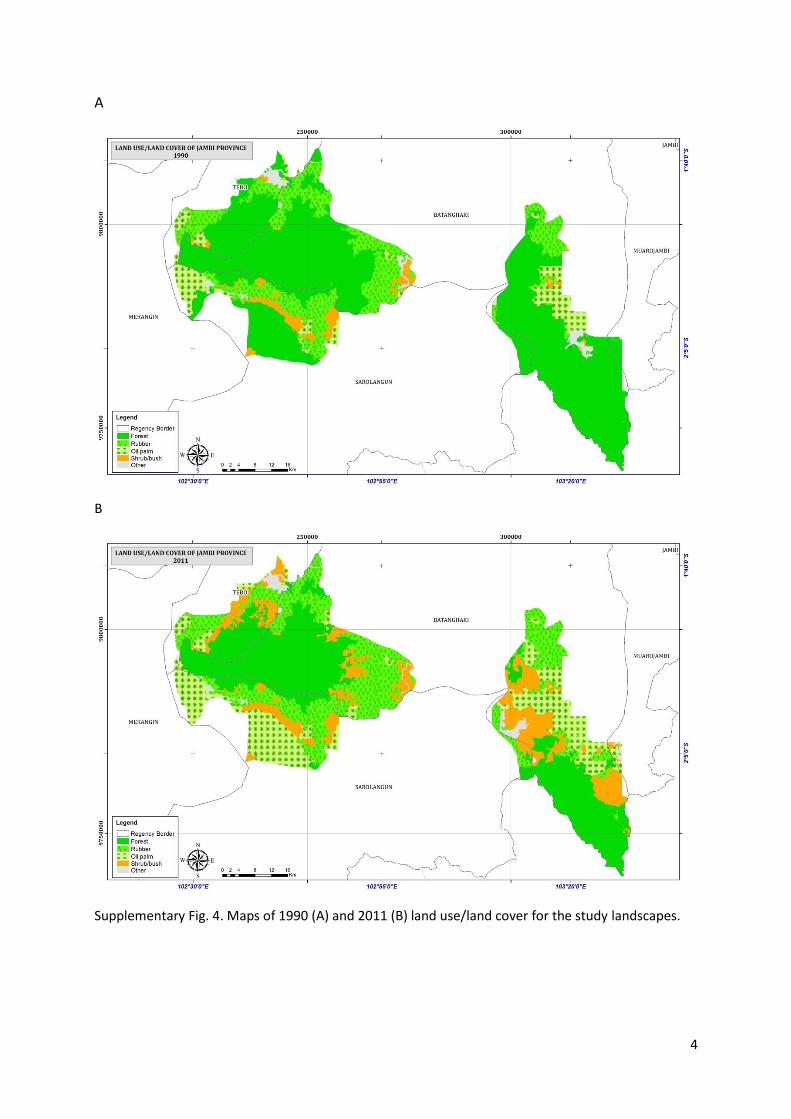
Supplementary Fig. 4. Maps of 1990 (A) and 2011 (B) land use/land cover for the study landscapes.
5
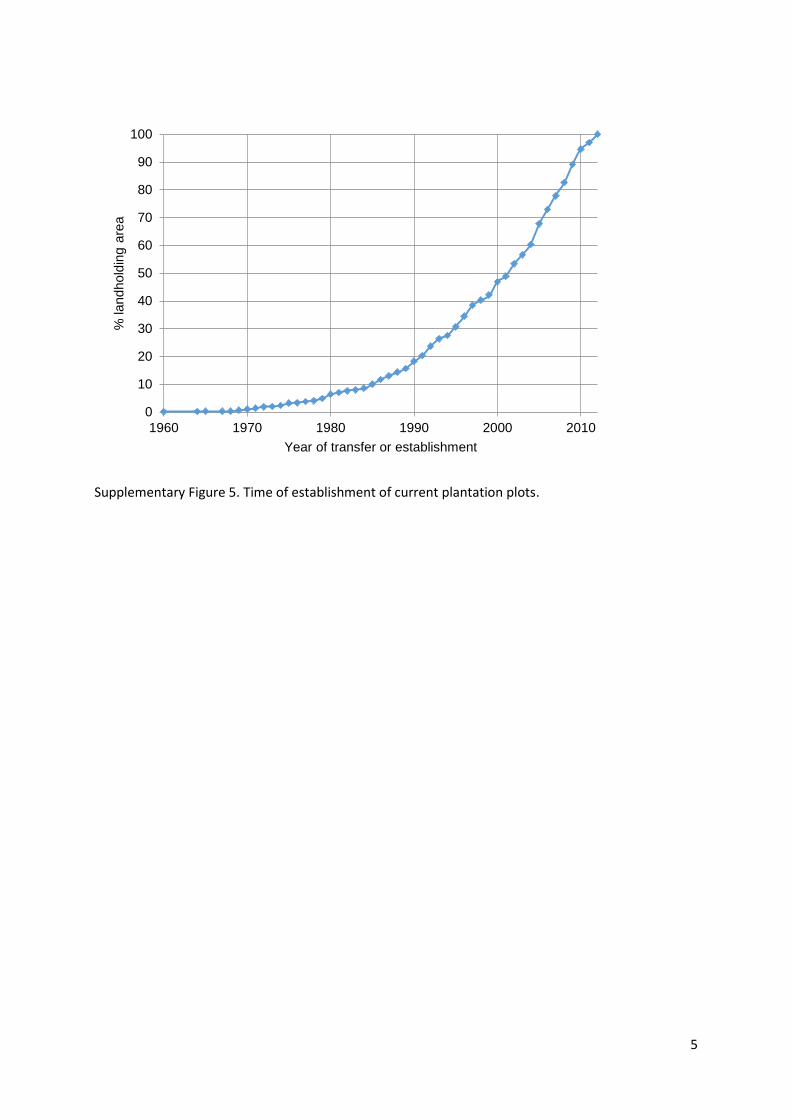
Supplementary Figure 5. Time of establishment of current plantation plots.
0
10
20
30
40
50
60
70
80
90
100
1960 1970 1980 1990 2000 2010
% landhold
ing a
rea
Year of transfer or establishment
6
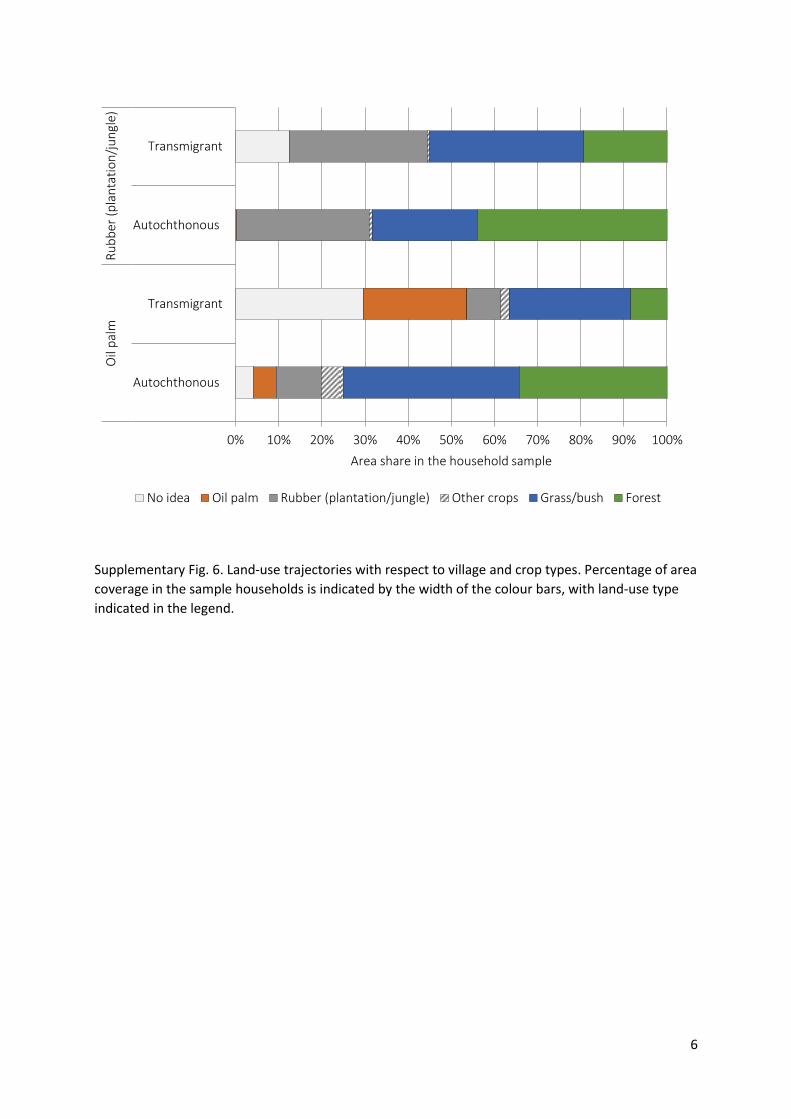
Supplementary Fig. 6. Land-use trajectories with respect to village and crop types. Percentage of area
coverage in the sample households is indicated by the width of the colour bars, with land-use type
indicated in the legend.
0% 10% 20% 30% 40% 50% 60% 70% 80% 90% 100%
Autochthonous
Transmigrant
Autochthonous
Transmigrant
Oil
pal
mR
ub
ber
(p
lan
tati
on
/ju
ngl
e)
Area share in the household sample
No idea Oil palm Rubber (plantation/jungle) Other crops Grass/bush Forest
7
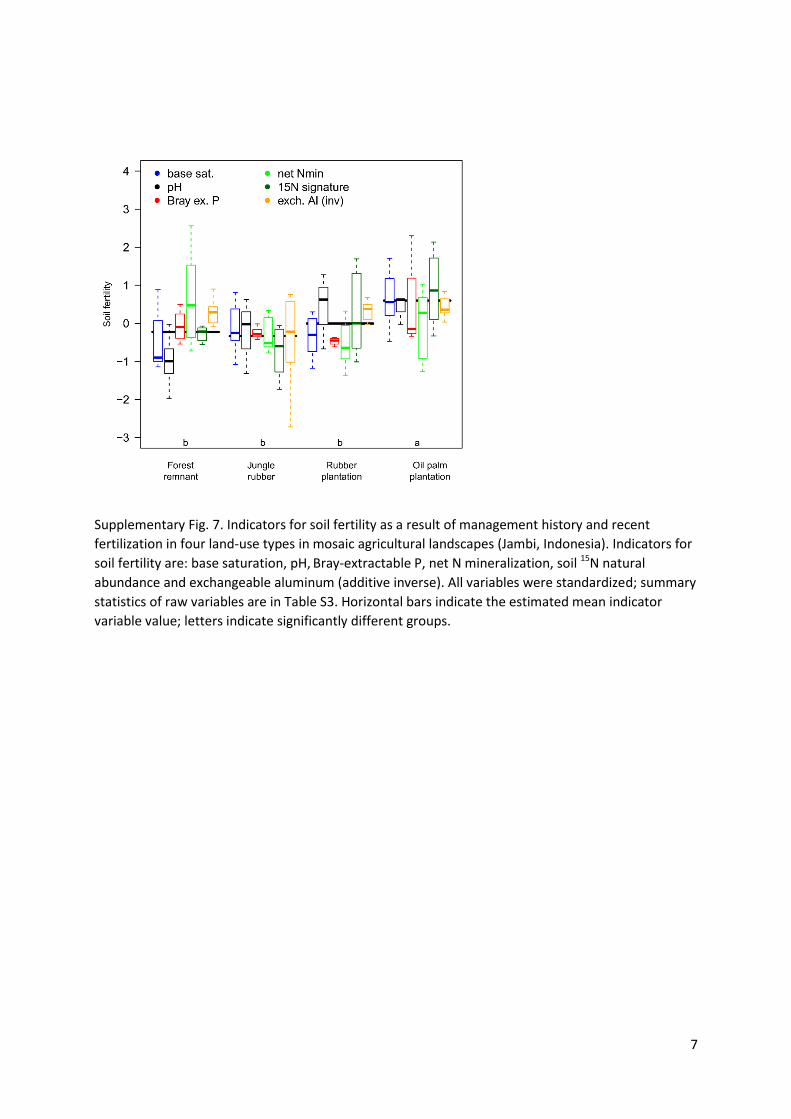
Supplementary Fig. 7. Indicators for soil fertility as a result of management history and recent
fertilization in four land-use types in mosaic agricultural landscapes (Jambi, Indonesia). Indicators for
soil fertility are: base saturation, pH, Bray-extractable P, net N mineralization, soil 15N natural
abundance and exchangeable aluminum (additive inverse). All variables were standardized; summary
statistics of raw variables are in Table S3. Horizontal bars indicate the estimated mean indicator
variable value; letters indicate significantly different groups.
8
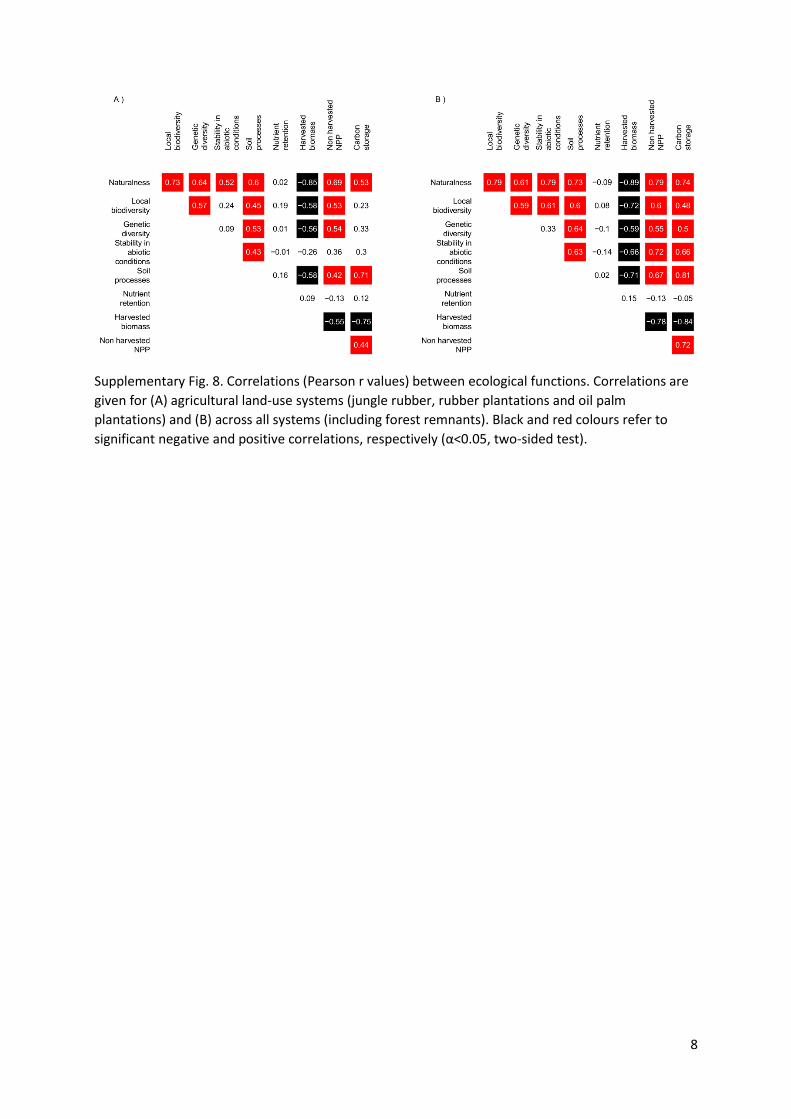
Supplementary Fig. 8. Correlations (Pearson r values) between ecological functions. Correlations are
given for (A) agricultural land-use systems (jungle rubber, rubber plantations and oil palm
plantations) and (B) across all systems (including forest remnants). Black and red colours refer to
significant negative and positive correlations, respectively (α<0.05, two-sided test).
9
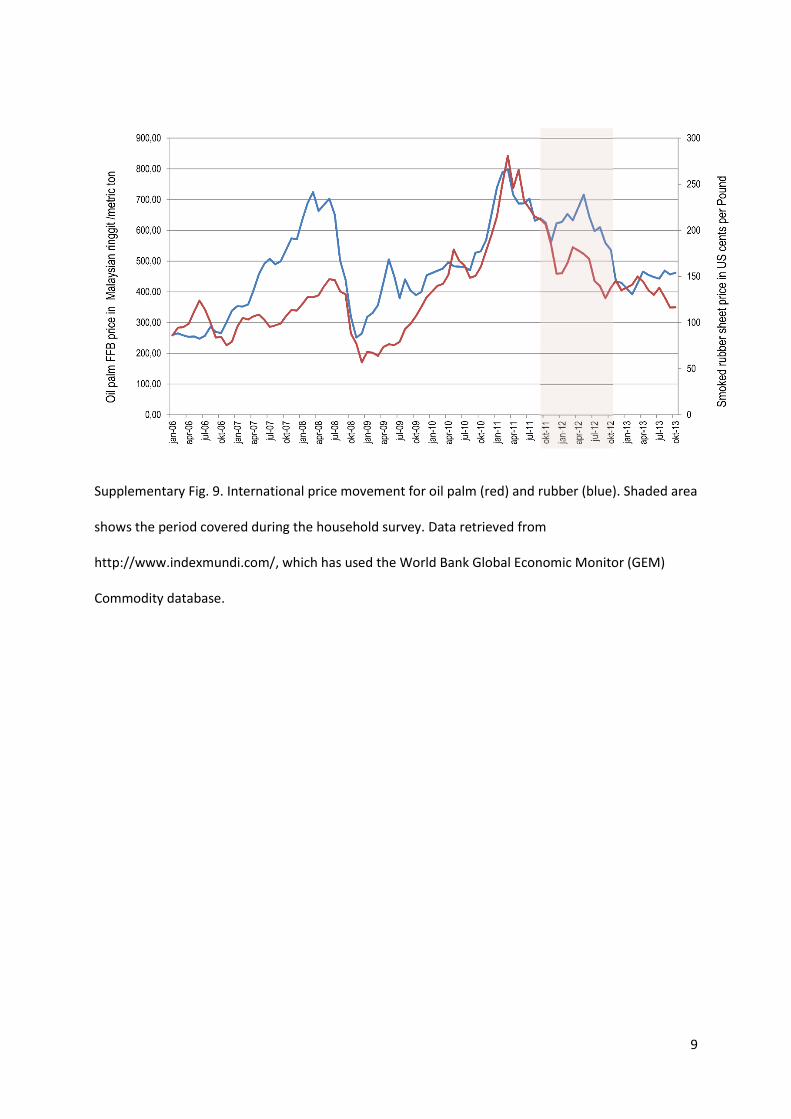
Supplementary Fig. 9. International price movement for oil palm (red) and rubber (blue). Shaded area
shows the period covered during the household survey. Data retrieved from
http://www.indexmundi.com/, which has used the World Bank Global Economic Monitor (GEM)
Commodity database.
10
Supplementary tables
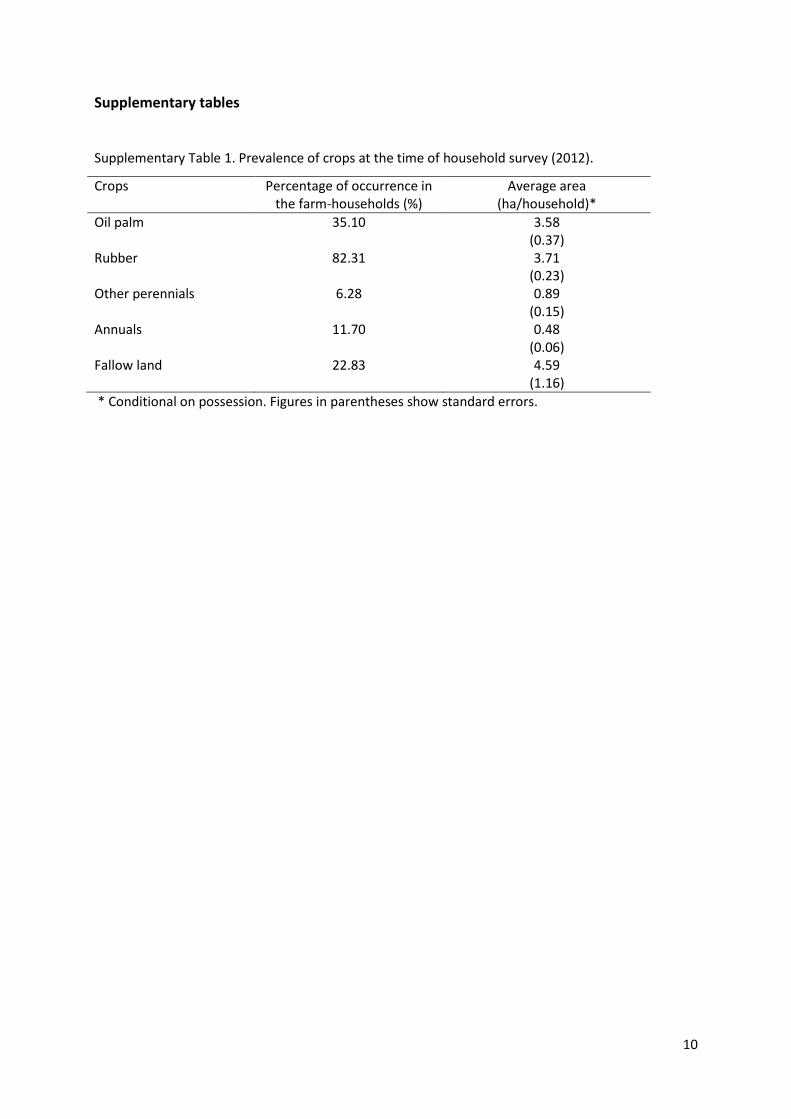
Supplementary Table 1. Prevalence of crops at the time of household survey (2012).
Crops Percentage of occurrence in the farm-households (%)
Average area (ha/household)*
Oil palm 35.10 3.58 (0.37)
Rubber 82.31 3.71 (0.23)
Other perennials 6.28 0.89 (0.15)
Annuals 11.70 0.48 (0.06)
Fallow land 22.83 4.59 (1.16)
* Conditional on possession. Figures in parentheses show standard errors.
11
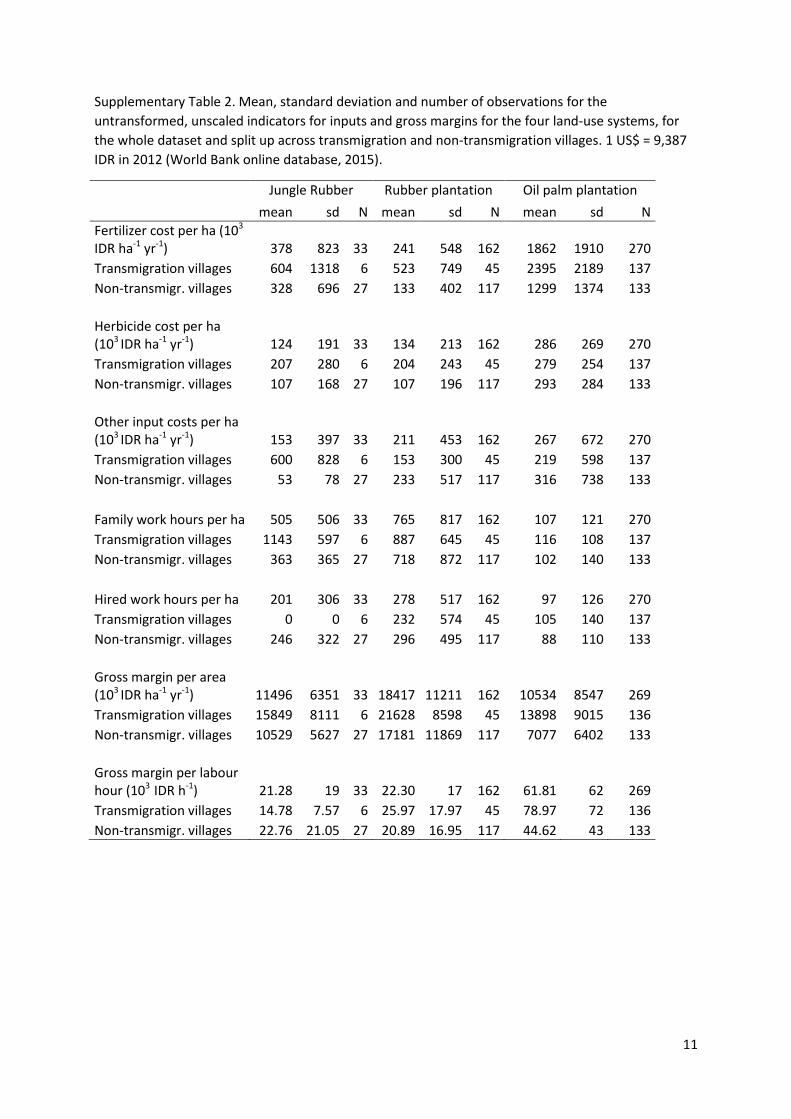
Supplementary Table 2. Mean, standard deviation and number of observations for the
untransformed, unscaled indicators for inputs and gross margins for the four land-use systems, for
the whole dataset and split up across transmigration and non-transmigration villages. 1 US$ = 9,387
IDR in 2012 (World Bank online database, 2015).
Jungle Rubber Rubber plantation Oil palm plantation
mean sd N mean sd N mean sd N
Fertilizer cost per ha (103
IDR ha-1 yr-1) 378 823 33 241 548 162 1862 1910 270
Transmigration villages 604 1318 6 523 749 45 2395 2189 137
Non-transmigr. villages 328 696 27 133 402 117 1299 1374 133
Herbicide cost per ha (103 IDR ha-1 yr-1) 124 191 33 134 213 162 286 269 270
Transmigration villages 207 280 6 204 243 45 279 254 137
Non-transmigr. villages 107 168 27 107 196 117 293 284 133
Other input costs per ha (103 IDR ha-1 yr-1) 153 397 33 211 453 162 267 672 270
Transmigration villages 600 828 6 153 300 45 219 598 137
Non-transmigr. villages 53 78 27 233 517 117 316 738 133
Family work hours per ha 505 506 33 765 817 162 107 121 270
Transmigration villages 1143 597 6 887 645 45 116 108 137
Non-transmigr. villages 363 365 27 718 872 117 102 140 133
Hired work hours per ha 201 306 33 278 517 162 97 126 270
Transmigration villages 0 0 6 232 574 45 105 140 137
Non-transmigr. villages 246 322 27 296 495 117 88 110 133
Gross margin per area (103 IDR ha-1 yr-1) 11496 6351 33 18417 11211 162 10534 8547 269
Transmigration villages 15849 8111 6 21628 8598 45 13898 9015 136
Non-transmigr. villages 10529 5627 27 17181 11869 117 7077 6402 133
Gross margin per labour hour (103 IDR h-1) 21.28 19 33 22.30 17 162 61.81 62 269
Transmigration villages 14.78 7.57 6 25.97 17.97 45 78.97 72 136
Non-transmigr. villages 22.76 21.05 27 20.89 16.95 117 44.62 43 133
12
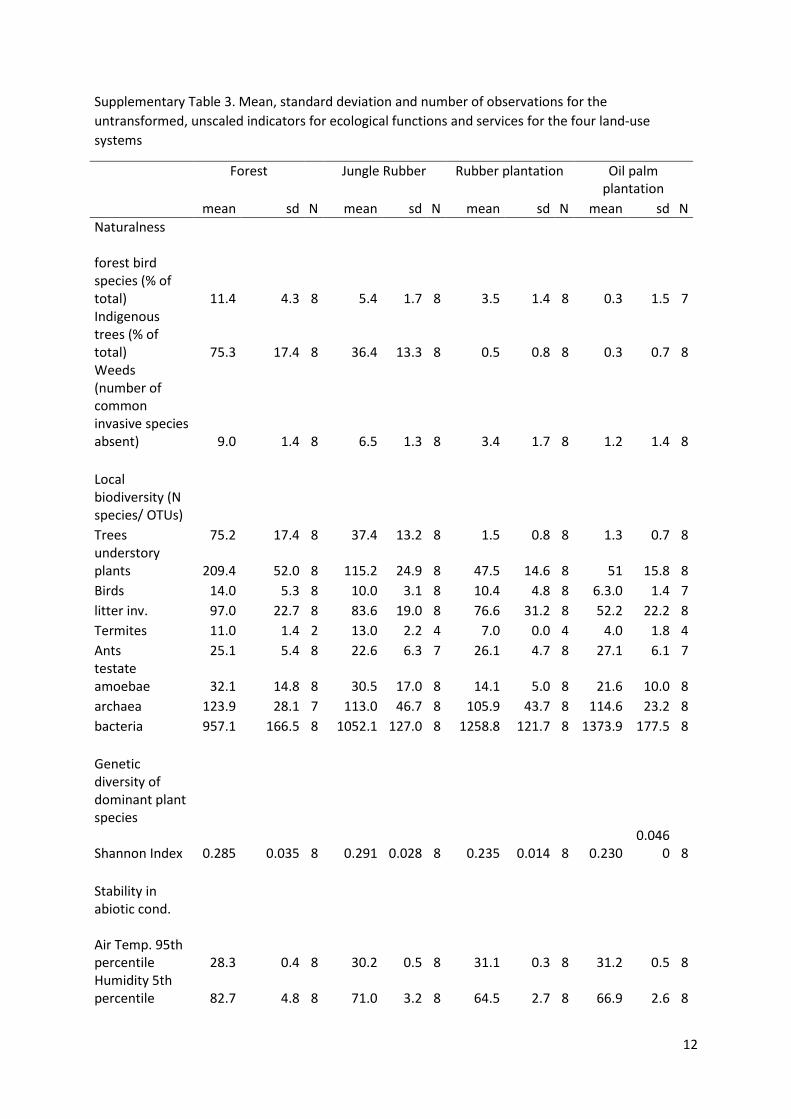
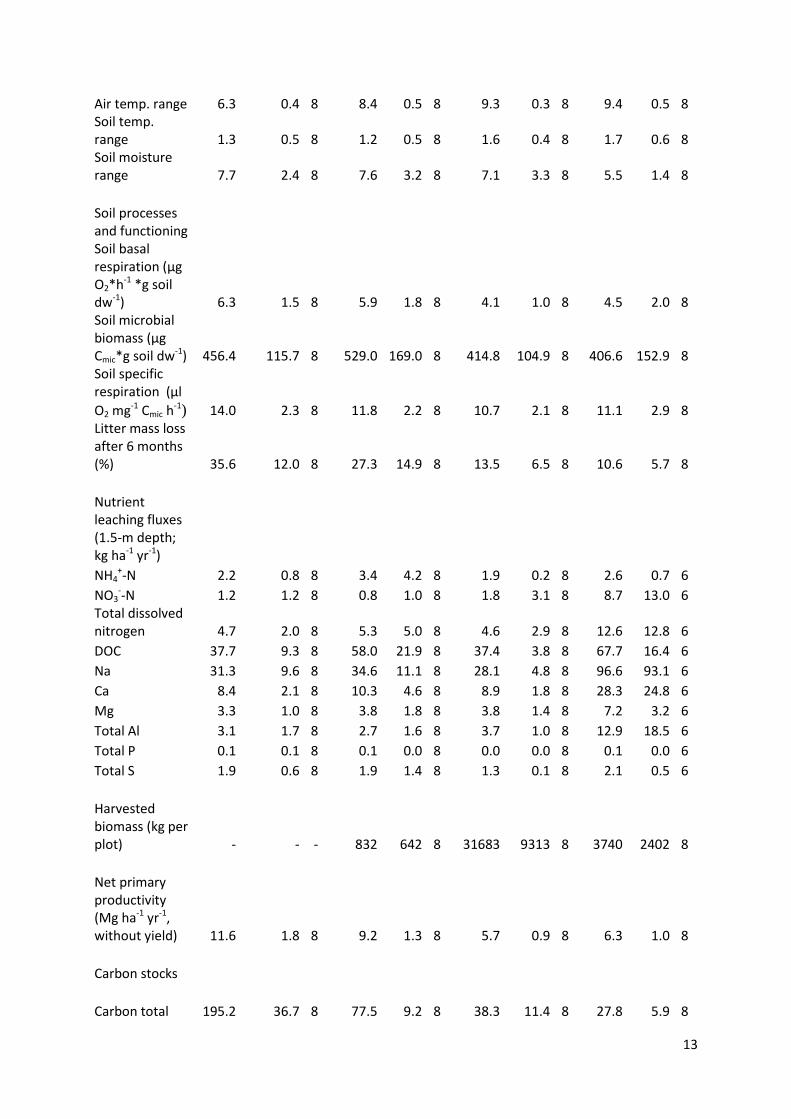
Supplementary Table 3. Mean, standard deviation and number of observations for the
untransformed, unscaled indicators for ecological functions and services for the four land-use
systems
Forest Jungle Rubber Rubber plantation Oil palm
plantation
mean sd N mean sd N mean sd N mean sd N
Naturalness forest bird species (% of total) 11.4 4.3 8 5.4 1.7 8 3.5 1.4 8 0.3 1.5 7 Indigenous trees (% of total) 75.3 17.4 8 36.4 13.3 8 0.5 0.8 8 0.3 0.7 8 Weeds (number of common invasive species absent) 9.0 1.4 8 6.5 1.3 8 3.4 1.7 8 1.2 1.4 8
Local biodiversity (N species/ OTUs)
Trees 75.2 17.4 8 37.4 13.2 8 1.5 0.8 8 1.3 0.7 8 understory plants 209.4 52.0 8 115.2 24.9 8 47.5 14.6 8 51 15.8 8
Birds 14.0 5.3 8 10.0 3.1 8 10.4 4.8 8 6.3.0 1.4 7
litter inv. 97.0 22.7 8 83.6 19.0 8 76.6 31.2 8 52.2 22.2 8
Termites 11.0 1.4 2 13.0 2.2 4 7.0 0.0 4 4.0 1.8 4
Ants 25.1 5.4 8 22.6 6.3 7 26.1 4.7 8 27.1 6.1 7 testate amoebae 32.1 14.8 8 30.5 17.0 8 14.1 5.0 8 21.6 10.0 8
archaea 123.9 28.1 7 113.0 46.7 8 105.9 43.7 8 114.6 23.2 8
bacteria 957.1 166.5 8 1052.1 127.0 8 1258.8 121.7 8 1373.9 177.5 8
Genetic diversity of dominant plant species
Shannon Index 0.285 0.035 8 0.291 0.028 8 0.235 0.014 8 0.230 0.046
0 8
Stability in abiotic cond. Air Temp. 95th percentile 28.3 0.4 8 30.2 0.5 8 31.1 0.3 8 31.2 0.5 8 Humidity 5th percentile 82.7 4.8 8 71.0 3.2 8 64.5 2.7 8 66.9 2.6 8
13
Air temp. range 6.3 0.4 8 8.4 0.5 8 9.3 0.3 8 9.4 0.5 8 Soil temp. range 1.3 0.5 8 1.2 0.5 8 1.6 0.4 8 1.7 0.6 8 Soil moisture range 7.7 2.4 8 7.6 3.2 8 7.1 3.3 8 5.5 1.4 8
Soil processes and functioning Soil basal respiration (µg O2*h-1 *g soil dw-1) 6.3 1.5 8 5.9 1.8 8 4.1 1.0 8 4.5 2.0 8 Soil microbial biomass (µg Cmic*g soil dw-1) 456.4 115.7 8 529.0 169.0 8 414.8 104.9 8 406.6 152.9 8 Soil specific respiration (µl
O2 mg-1 Cmic h-1) 14.0 2.3 8 11.8 2.2 8 10.7 2.1 8 11.1 2.9 8
Litter mass loss after 6 months (%) 35.6 12.0 8 27.3 14.9 8 13.5 6.5 8 10.6 5.7 8
Nutrient leaching fluxes (1.5-m depth; kg ha-1 yr-1)
NH4+-N 2.2 0.8 8 3.4 4.2 8 1.9 0.2 8 2.6 0.7 6
NO3--N 1.2 1.2 8 0.8 1.0 8 1.8 3.1 8 8.7 13.0 6
Total dissolved nitrogen 4.7 2.0 8 5.3 5.0 8 4.6 2.9 8 12.6 12.8 6
DOC 37.7 9.3 8 58.0 21.9 8 37.4 3.8 8 67.7 16.4 6
Na 31.3 9.6 8 34.6 11.1 8 28.1 4.8 8 96.6 93.1 6
Ca 8.4 2.1 8 10.3 4.6 8 8.9 1.8 8 28.3 24.8 6
Mg 3.3 1.0 8 3.8 1.8 8 3.8 1.4 8 7.2 3.2 6
Total Al 3.1 1.7 8 2.7 1.6 8 3.7 1.0 8 12.9 18.5 6
Total P 0.1 0.1 8 0.1 0.0 8 0.0 0.0 8 0.1 0.0 6
Total S 1.9 0.6 8 1.9 1.4 8 1.3 0.1 8 2.1 0.5 6
Harvested biomass (kg per plot) - - - 832 642 8 31683 9313 8 3740 2402 8
Net primary productivity (Mg ha-1 yr-1, without yield) 11.6 1.8 8 9.2 1.3 8 5.7 0.9 8 6.3 1.0 8
Carbon stocks
Carbon total 195.2 36.7 8 77.5 9.2 8 38.3 11.4 8 27.8 5.9 8
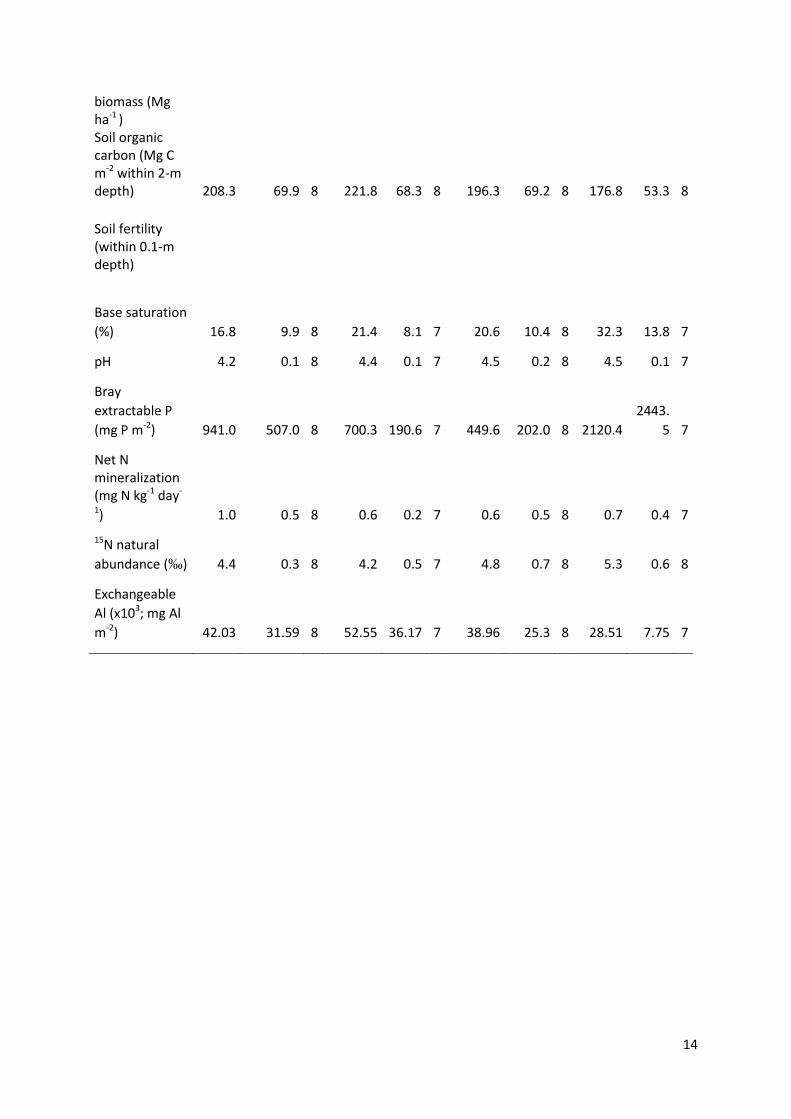
14
biomass (Mg ha-1 ) Soil organic carbon (Mg C m-2 within 2-m depth) 208.3 69.9 8 221.8 68.3 8 196.3 69.2 8 176.8 53.3 8
Soil fertility (within 0.1-m depth)
Base saturation
(%) 16.8 9.9 8 21.4 8.1 7 20.6 10.4 8 32.3 13.8 7
pH 4.2 0.1 8 4.4 0.1 7 4.5 0.2 8 4.5 0.1 7
Bray
extractable P
(mg P m-2) 941.0 507.0 8 700.3 190.6 7 449.6 202.0 8 2120.4
2443.
5 7
Net N mineralization (mg N kg-1 day-
1) 1.0 0.5 8 0.6 0.2 7 0.6 0.5 8 0.7 0.4 7
15N natural
abundance (‰) 4.4 0.3 8 4.2 0.5 7 4.8 0.7 8 5.3 0.6 8
Exchangeable
Al (x103; mg Al
m-2) 42.03 31.59 8 52.55 36.17 7 38.96 25.3 8 28.51 7.75 7
15
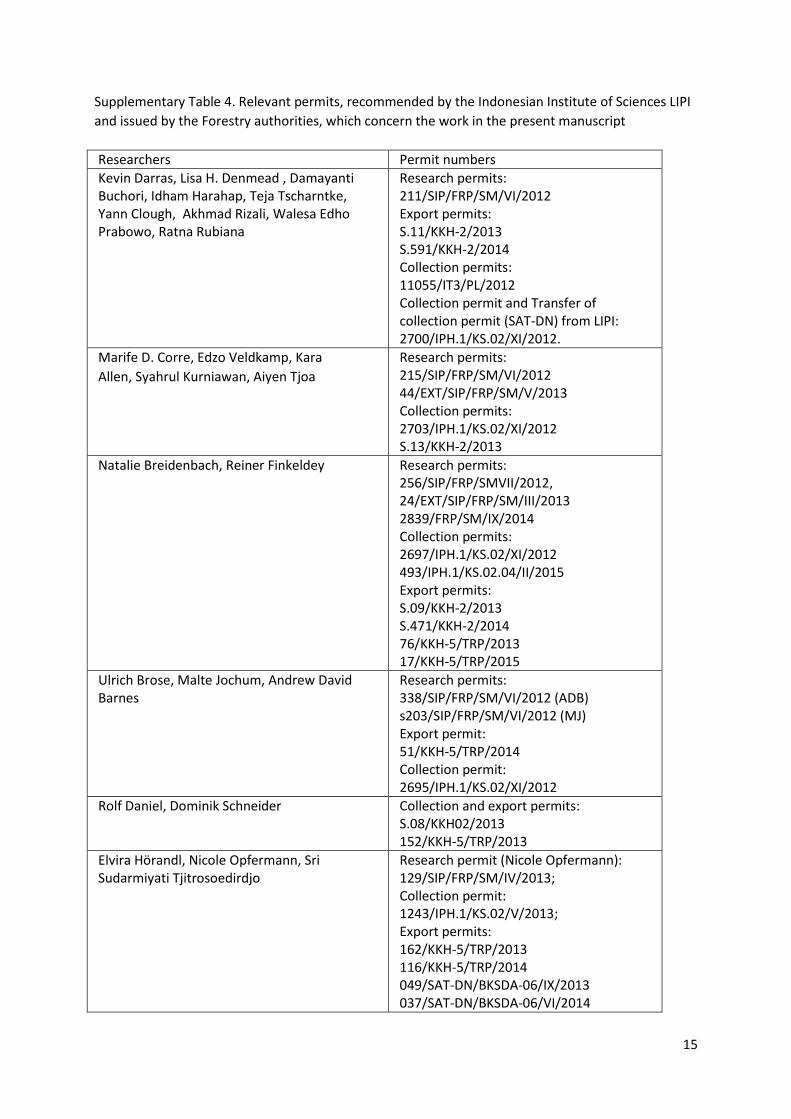
Supplementary Table 4. Relevant permits, recommended by the Indonesian Institute of Sciences LIPI
and issued by the Forestry authorities, which concern the work in the present manuscript
Researchers Permit numbers
Kevin Darras, Lisa H. Denmead , Damayanti Buchori, Idham Harahap, Teja Tscharntke, Yann Clough, Akhmad Rizali, Walesa Edho Prabowo, Ratna Rubiana
Research permits: 211/SIP/FRP/SM/VI/2012 Export permits: S.11/KKH-2/2013 S.591/KKH-2/2014 Collection permits: 11055/IT3/PL/2012 Collection permit and Transfer of collection permit (SAT-DN) from LIPI: 2700/IPH.1/KS.02/XI/2012.
Marife D. Corre, Edzo Veldkamp, Kara
Allen, Syahrul Kurniawan, Aiyen Tjoa
Research permits: 215/SIP/FRP/SM/VI/2012 44/EXT/SIP/FRP/SM/V/2013 Collection permits: 2703/IPH.1/KS.02/XI/2012 S.13/KKH-2/2013
Natalie Breidenbach, Reiner Finkeldey
Research permits: 256/SIP/FRP/SMVII/2012, 24/EXT/SIP/FRP/SM/III/2013 2839/FRP/SM/IX/2014 Collection permits: 2697/IPH.1/KS.02/XI/2012 493/IPH.1/KS.02.04/II/2015 Export permits: S.09/KKH-2/2013 S.471/KKH-2/2014 76/KKH-5/TRP/2013 17/KKH-5/TRP/2015
Ulrich Brose, Malte Jochum, Andrew David Barnes
Research permits: 338/SIP/FRP/SM/VI/2012 (ADB) s203/SIP/FRP/SM/VI/2012 (MJ) Export permit: 51/KKH-5/TRP/2014 Collection permit: 2695/IPH.1/KS.02/XI/2012
Rolf Daniel, Dominik Schneider
Collection and export permits: S.08/KKH02/2013 152/KKH-5/TRP/2013
Elvira Hörandl, Nicole Opfermann, Sri Sudarmiyati Tjitrosoedirdjo
Research permit (Nicole Opfermann): 129/SIP/FRP/SM/IV/2013; Collection permit: 1243/IPH.1/KS.02/V/2013; Export permits: 162/KKH-5/TRP/2013 116/KKH-5/TRP/2014 049/SAT-DN/BKSDA-06/IX/2013 037/SAT-DN/BKSDA-06/VI/2014
16
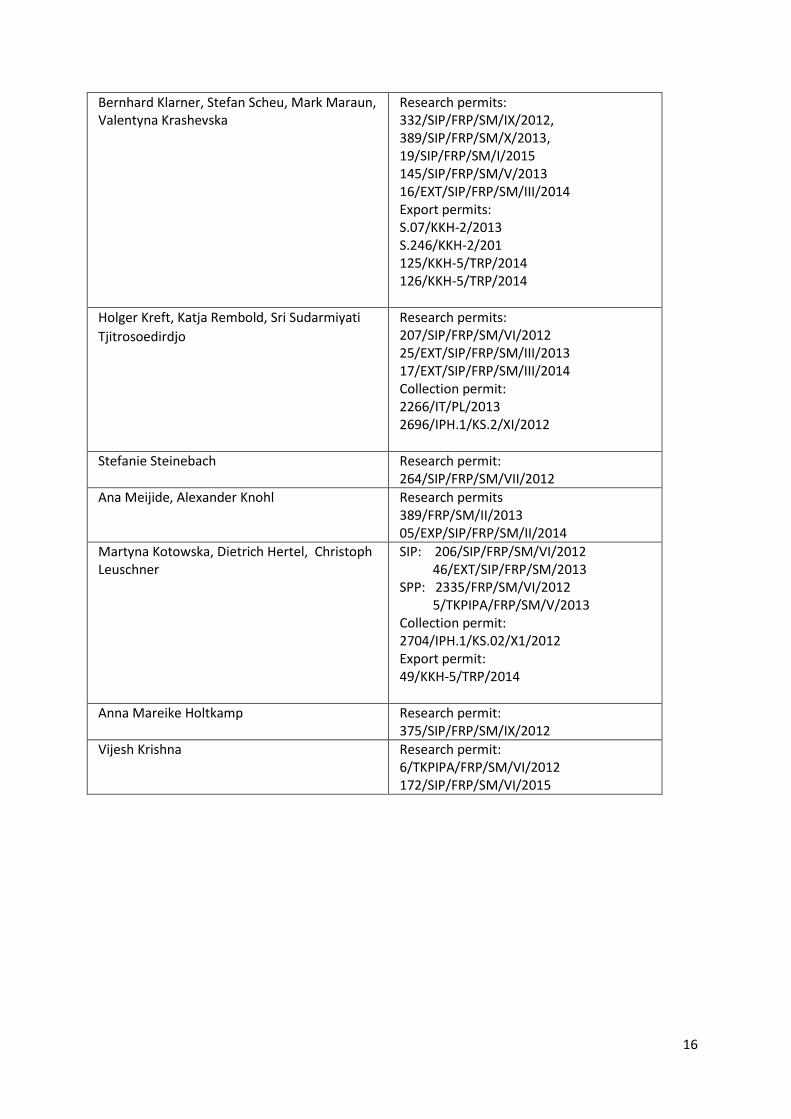
Bernhard Klarner, Stefan Scheu, Mark Maraun, Valentyna Krashevska
Research permits: 332/SIP/FRP/SM/IX/2012, 389/SIP/FRP/SM/X/2013, 19/SIP/FRP/SM/I/2015 145/SIP/FRP/SM/V/2013 16/EXT/SIP/FRP/SM/III/2014 Export permits: S.07/KKH-2/2013 S.246/KKH-2/201 125/KKH-5/TRP/2014 126/KKH-5/TRP/2014
Holger Kreft, Katja Rembold, Sri Sudarmiyati
Tjitrosoedirdjo
Research permits: 207/SIP/FRP/SM/VI/2012 25/EXT/SIP/FRP/SM/III/2013 17/EXT/SIP/FRP/SM/III/2014 Collection permit: 2266/IT/PL/2013 2696/IPH.1/KS.2/XI/2012
Stefanie Steinebach Research permit: 264/SIP/FRP/SM/VII/2012
Ana Meijide, Alexander Knohl Research permits 389/FRP/SM/II/2013 05/EXP/SIP/FRP/SM/II/2014
Martyna Kotowska, Dietrich Hertel, Christoph Leuschner
SIP: 206/SIP/FRP/SM/VI/2012 46/EXT/SIP/FRP/SM/2013 SPP: 2335/FRP/SM/VI/2012 5/TKPIPA/FRP/SM/V/2013 Collection permit: 2704/IPH.1/KS.02/X1/2012 Export permit: 49/KKH-5/TRP/2014
Anna Mareike Holtkamp Research permit: 375/SIP/FRP/SM/IX/2012
Vijesh Krishna Research permit: 6/TKPIPA/FRP/SM/VI/2012 172/SIP/FRP/SM/VI/2015
17
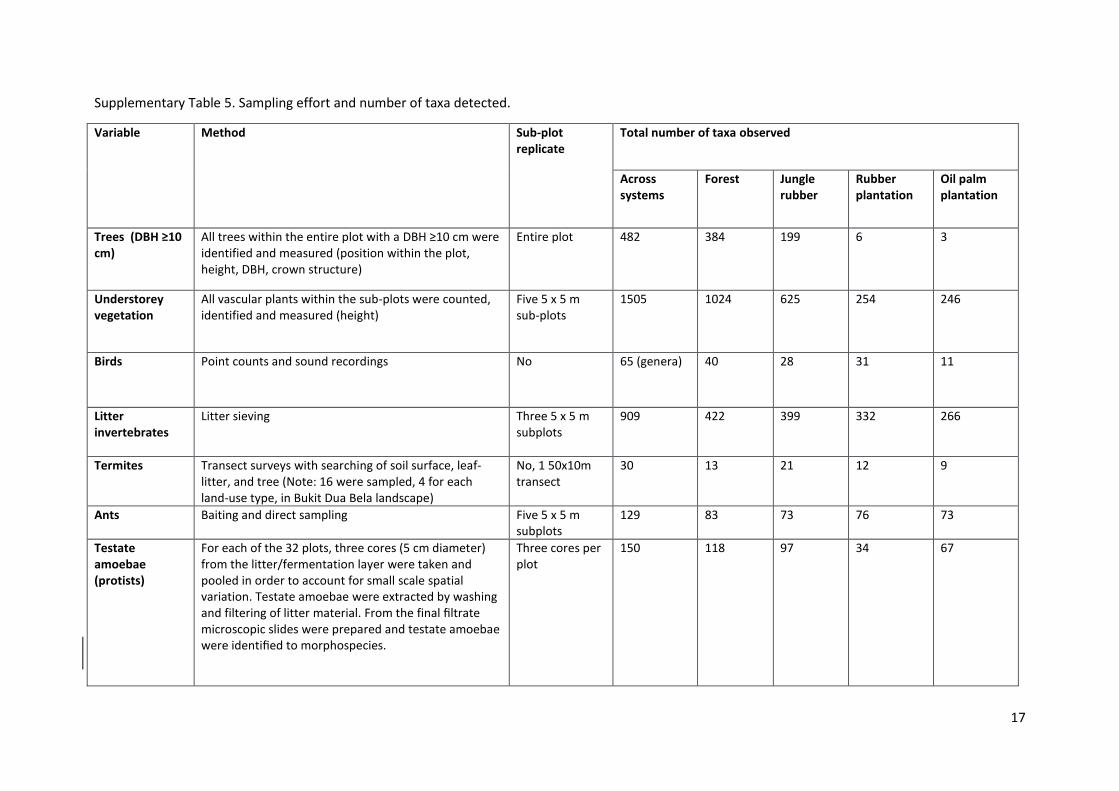
Supplementary Table 5. Sampling effort and number of taxa detected.
Variable Method Sub-plot replicate
Total number of taxa observed
Across systems
Forest Jungle rubber
Rubber plantation
Oil palm plantation
Trees (DBH ≥10 cm)
All trees within the entire plot with a DBH ≥10 cm were identified and measured (position within the plot, height, DBH, crown structure)
Entire plot 482 384 199 6 3
Understorey vegetation
All vascular plants within the sub-plots were counted, identified and measured (height)
Five 5 x 5 m sub-plots
1505 1024 625 254 246
Birds
Point counts and sound recordings
No 65 (genera) 40 28 31 11
Litter invertebrates
Litter sieving Three 5 x 5 m subplots
909 422 399 332 266
Termites Transect surveys with searching of soil surface, leaf-litter, and tree (Note: 16 were sampled, 4 for each land-use type, in Bukit Dua Bela landscape)
No, 1 50x10m transect
30 13 21 12 9
Ants Baiting and direct sampling Five 5 x 5 m subplots
129 83 73 76 73
Testate amoebae (protists)
For each of the 32 plots, three cores (5 cm diameter) from the litter/fermentation layer were taken and pooled in order to account for small scale spatial variation. Testate amoebae were extracted by washing and filtering of litter material. From the final filtrate microscopic slides were prepared and testate amoebae were identified to morphospecies.
Three cores per plot
150 118 97 34 67
18
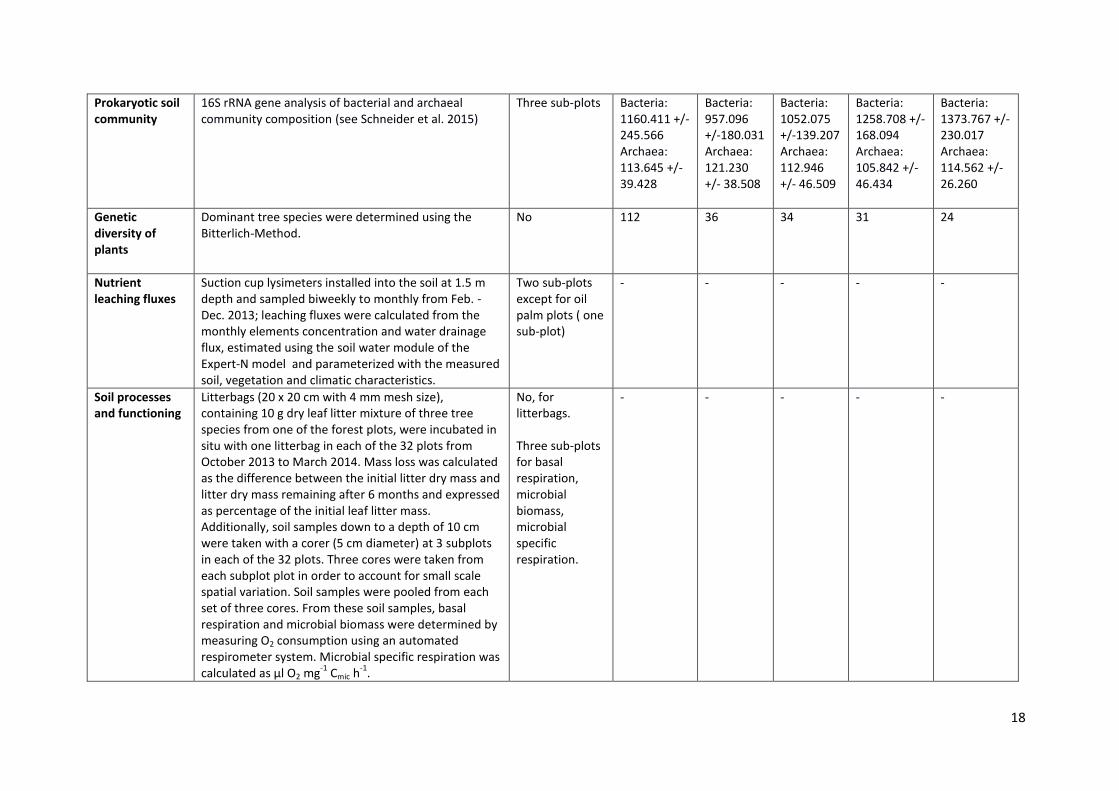
Prokaryotic soil community
16S rRNA gene analysis of bacterial and archaeal community composition (see Schneider et al. 2015)
Three sub-plots
Bacteria: 1160.411 +/- 245.566 Archaea: 113.645 +/-39.428
Bacteria: 957.096 +/-180.031 Archaea: 121.230 +/- 38.508
Bacteria: 1052.075 +/-139.207 Archaea: 112.946 +/- 46.509
Bacteria: 1258.708 +/-168.094 Archaea: 105.842 +/- 46.434
Bacteria: 1373.767 +/-230.017 Archaea: 114.562 +/- 26.260
Genetic diversity of plants
Dominant tree species were determined using the Bitterlich-Method.
No 112 36 34 31 24
Nutrient leaching fluxes
Suction cup lysimeters installed into the soil at 1.5 m depth and sampled biweekly to monthly from Feb. - Dec. 2013; leaching fluxes were calculated from the monthly elements concentration and water drainage flux, estimated using the soil water module of the Expert-N model and parameterized with the measured soil, vegetation and climatic characteristics.
Two sub-plots except for oil palm plots ( one sub-plot)
- - - - -
Soil processes and functioning
Litterbags (20 x 20 cm with 4 mm mesh size), containing 10 g dry leaf litter mixture of three tree species from one of the forest plots, were incubated in situ with one litterbag in each of the 32 plots from October 2013 to March 2014. Mass loss was calculated as the difference between the initial litter dry mass and litter dry mass remaining after 6 months and expressed as percentage of the initial leaf litter mass. Additionally, soil samples down to a depth of 10 cm were taken with a corer (5 cm diameter) at 3 subplots in each of the 32 plots. Three cores were taken from each subplot plot in order to account for small scale spatial variation. Soil samples were pooled from each set of three cores. From these soil samples, basal respiration and microbial biomass were determined by measuring O2 consumption using an automated respirometer system. Microbial specific respiration was calculated as µl O2 mg
-1 Cmic h
-1.
No, for litterbags. Three sub-plots for basal respiration, microbial biomass, microbial specific respiration.
- - - - -
19
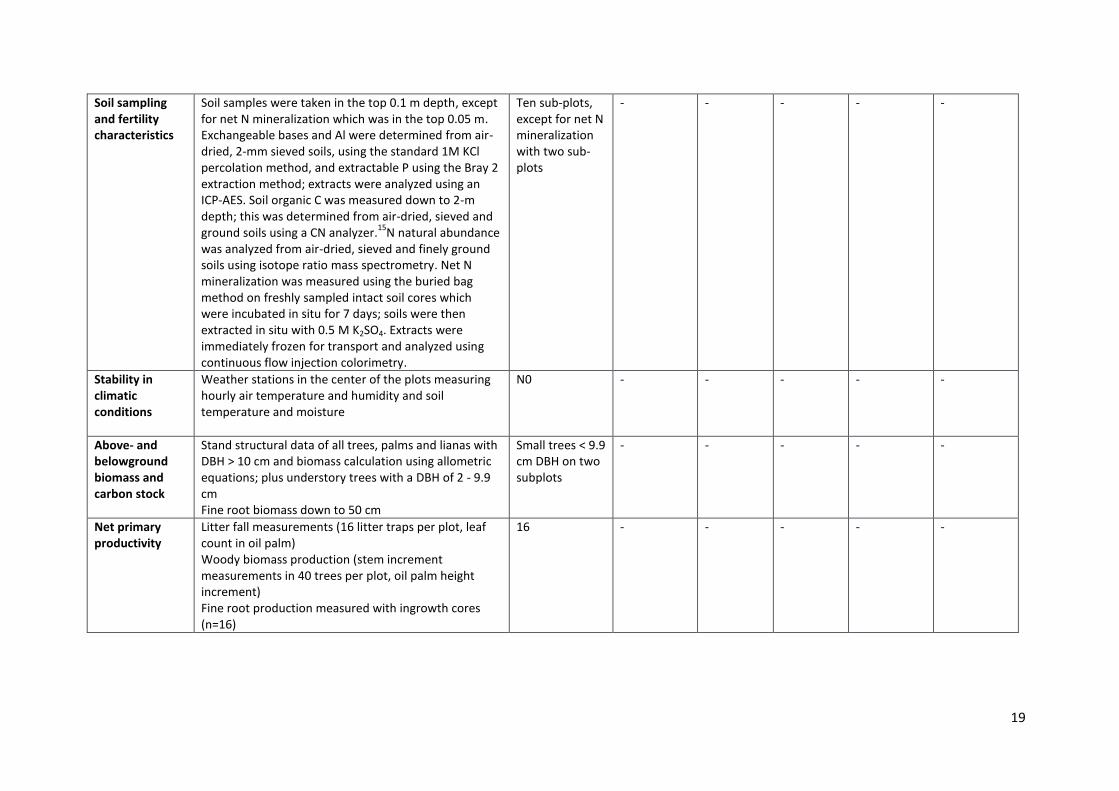
Soil sampling and fertility characteristics
Soil samples were taken in the top 0.1 m depth, except for net N mineralization which was in the top 0.05 m. Exchangeable bases and Al were determined from air-dried, 2-mm sieved soils, using the standard 1M KCl percolation method, and extractable P using the Bray 2 extraction method; extracts were analyzed using an ICP-AES. Soil organic C was measured down to 2-m depth; this was determined from air-dried, sieved and ground soils using a CN analyzer.
15N natural abundance
was analyzed from air-dried, sieved and finely ground soils using isotope ratio mass spectrometry. Net N mineralization was measured using the buried bag method on freshly sampled intact soil cores which were incubated in situ for 7 days; soils were then extracted in situ with 0.5 M K2SO4. Extracts were immediately frozen for transport and analyzed using continuous flow injection colorimetry.
Ten sub-plots, except for net N mineralization with two sub-plots
- - - - -
Stability in climatic conditions
Weather stations in the center of the plots measuring hourly air temperature and humidity and soil temperature and moisture
N0 - - - - -
Above- and belowground biomass and carbon stock
Stand structural data of all trees, palms and lianas with DBH > 10 cm and biomass calculation using allometric equations; plus understory trees with a DBH of 2 - 9.9 cm Fine root biomass down to 50 cm
Small trees < 9.9 cm DBH on two subplots
- - - - -
Net primary productivity
Litter fall measurements (16 litter traps per plot, leaf count in oil palm) Woody biomass production (stem increment measurements in 40 trees per plot, oil palm height increment) Fine root production measured with ingrowth cores (n=16)
16 - - - - -
20
Supplementary Notes
Supplementary Note 1: Historical and institutional background
Today’s land-use patterns in Jambi province result from a complex interplay of concurrent and often
ambivalent, constantly renegotiated, institutional frameworks, which have to be analyzed against
their historical background. The first set of rules, which changed the local system of property rights
and access to land, evolved with the Dutch colonial administration. Initially interested in controlling
the region’s spice trade, the Dutch soon implemented a cultivation system under which certain cash
crops like coffee, sugar, tea, cinnamon, tobacco, as well as silk were produced for the world market
(2). In 1865, the Dutch colonial forestry law was applied in the East Indies. Together with the Dutch
Agrarian Law adopted five years later, this set the legal framework for large-scale resource
exploitation, agricultural intensification and plantation economy.
When the Dutch took over colonial rule in Jambi in 1904, land use was dominated by small scale
agroforest systems, where different kinds of root crops and upland rice were grown in swidden
cultivation. This extensive shifting cultivation system produced mosaic landscapes, where forest
remnants and agricultural lands were integrated with each other. These local land use and land
tenure systems were defined as “beschikkingsrecht” in Dutch – or ‘right of use’ as the closest
translation. Areas not under cultivation (including fallows with secondary forests and shrublands)
were declared as “woeste grond” (Dutch for ‘uncultivated land’) and as such were a property of the
state (3). As the “beschikkingsrecht” did not have the character of ownership, it easily came under
control of the state or the Dutch government. These policies abolished the former concepts of local
land use and the complex concepts of different kinds of forests in relation to their usage by the
population. Instead, it created “no mans” land that conceptually divide the society from their natural
environment.
With the support of foreign capital, uncultivated land could either be assigned as leasehold for 75
years or as concession to private corporations for 99 years (4). With the expansion of the Dutch
21
colonial power on the Indonesian archipelago, plantation agriculture was widely introduced in
Sumatra. Even more important than the rising production of local crops was the introduction of
rubber in Jambi in 1904 (5). Rubber cultivation boomed from 1910 onwards with its heyday in the
1920s, due to an increased international demand and high rubber prices (6, 7). At that time, almost
the entire land area of Jambi province was planted with rubber trees. The planting of rubber trees
boomed and even with a local population density, according to Nasruddin (5) in 1935 around 44,000
people owned as much as 67 million rubber trees. Rubber was adopted widely in smallholdings by
the local population in the studied landscapes (sedentary Batin Sembilan and Jambi Melayu). Rattan
as traditional forest product was cultivated as well and was put aside when rubber business went
well, but used as income when rubber prices declined during the economic depression in 1935/1936.
Rattan was planted along the rivers as it was easy to harvest later using a boat. It could be harvested
at the age of 6 years, as for rubber. The introduction of rubber determined Jambi’s economy and
environmental policies until today. The Dutch also successfully drilled for oil at the Harapan
landscape.
Oil palm plantations were developed mainly in north Sumatra from 1911 onwards (8) and usually
operated by private Dutch companies, which held the needed financial and workforce inputs (8).
European laws and large-scale crop production by foreign corporations did not only induce major
changes in land use but also restricted local populations access to the land, and thus conceptually
turned the landscapes from socio-cultural systems into mere agricultural production systems.
After the Indonesian independence, the Basic Agrarian Law (BAL) from 1960 and the Forestry Law
from 1967 set the legal framework for further deforestation and agricultural intensification. Together
with the promotion of logging and the completion of the trans-Sumatra highway, land-use schemes
in Jambi province changed massively, and in the 1970s almost the entire forested area of Jambi
province was allocated as concession areas at the cost of local extensively-managed agroforest
systems (9, 10).
22
The years following the collapse of the Soeharto regime in 1998 were characterized by a far reaching
and rapid decentralization process. With the regional autonomy law (1999), administrative and
regulatory authority was transferred from the national government to provincial, district and
municipal governments, followed by a series of forestry sector reforms allowing district governments
and local communities a greater role in forest management (11). “Within this context, district
officials suddenly found that it was politically feasible to assert far-reaching administrative authority
over forest resources located within their jurisdictions, and many moved aggressively to do so” (11).
New district development strategies, based mainly on the exploitation of forest resources, were
formulated, overlapping often with national parks or conservation areas and with concession
boundaries issued by the national government. “As a result, many local regulations conflict with
higher-level policies and laws, while increased decision-making powers and the quest for locally
generated revenues have led to indiscriminate licensing for inappropriate forest conversion” (12).
The rights of indigenous people and local communities were limited or extinguished as the
Indonesian government interprets the Indonesian Constitution as granting the right to manage all
natural resources to the benefit of the nation (8, 13). Overall, these state policies heavily impacted
local people’s livelihood systems and pushed smallholders’ land-use systems from agroforestry-
based subsistence to monoculture cash-crop production.
Supplementary References
1. Brown C (2011) A short history of Indonesia. The unlikely nation? Talisman Publishing Pte Ltd, Singapore.
2. Haughton J, Khandker SR (2009) Handbook on poverty and inequality. The International Bank for Reconstruction and Development/The World Bank, Washington DC. p. 104-105
3. von Benda-Beckmann F, von Benda-Beckmann K (2010) Unity and Diversity. Multiple citizenship in Indonesia. Cultural Diversity and the Law. State Responses from Around the World, eds. Foblets MC, Gaudreault-Desbiens JF, DundesRenteln A (Brussels), p. 889-917.
4. Löffler U (1996) Land Tenure Developments in Indonesia. Study for the guiding principles. The importance of Land Tenure in Development Cooperation. GTZ.
5. Nasruddin AM (1989) Jambi dalam sejarah nusantara 692 – 1949 M. (Perpustakaan Musium Nasional Jambi).
6. Feintrenie L, Levang P (2009) Sumatra’s rubber agroforests: Advent, rise and fall of a sustainable cropping system. Small-scale Forestry 8(3):323–335.
7. Locher-Scholten E (2003) Sumatran sultanate and colonial state. Jambi and the rise of Dutch imperialism, 1830–1907. (Ithaca, NY: Southeast Asia Program Publications, Cornell University).
23
8. Jiwan N (2013) The political ecology of the Indonesian palm oil industry. The palm oil controversy in Southeast Asia. A transnational perspective, eds. Pye O, Bhattacharya J. (Singapore: Institute of Southeast Asian Studies). pp. 48–75.
9. Martini E, et al. (2010). Rubber agroforests and governance at the interface between conservation
and livelihoods in Bungo district, Jambi province, Indonesia. World Agroforestry Centre, Working
paper 124, Bogor, Indonesia.
10. Colchester M, Anderson P, Firdaus AY, Hasibuan F, Chao S (2011) Human rights abuses and land
conflicts in the PT Asiatic Persada concession in Jambi. Report of an independent investigation into
land disputes and forced evictions in a palm oil estate. Bogor, Indonesia: Forest Peoples
Programme, SawitWatch, HuMa.
11. Barr C, et al. (2006) Decentralization of forest administration in Indonesia: Implications for forest
Sustainability, economic development and community livelihoods. Bogor, Indonesia: Center for
International Forestry Research.
12. Indrarto GB, et al. (2012) The context of REDD+ in Indonesia: drivers, agents, and institutions.
Center for International Forestry Research, Bogor, Indonesia.
13. Anderson, P (2013) Free, prior and informed consent? Indigenous peoples and the palm oil boom in Indonesia. The palm oil controversy in Southeast Asia. A transnational perspective, eds. Pye O, Bhattacharya J. (Singapore: Institute of Southeast Asian Studies) pp. 244–258.