supplemental information inhibition of autophagy … · 1 supplemental information inhibition of...
TRANSCRIPT
1
SUPPLEMENTAL INFORMATION
Inhibition of autophagy as a new means of improving chemotherapy efficiency
in high-LC3B triple-negative breast cancers
Sylvain Lefort1,2*, Carine Joffre2,3*, Yann Kieffer1,2, Anne-Marie Givel1,2, Brigitte Bourachot1,2,
Giulia Zago2,3, Ivan Bieche4, Thierry Dubois5, Didier Meseure6, Anne Vincent-Salomon7,
Jacques Camonis2,3* and Fatima Mechta-Grigoriou1,2*.
* These authors contributed equally to this work.
Running Title: Role of autophagy in tumorigenesis and chemosensitivity of triple-negative
breast cancer patients
1Laboratory of “Stress and Cancer”, Institut Curie, 26 rue d’Ulm, 75248 Paris Cedex 05, France 2Inserm, U830, Paris, F-75248, France 3Laboratory of “Analysis of Transduction Pathways”, Institut Curie, 26 rue d’Ulm, 75248 Paris Cedex
05, France 4Department of Oncogenetics, Hôpital René Huguenin, 92210 Saint-Cloud, France 5Department of translational research, Institut Curie, 26 rue d’Ulm, 75248 Paris Cedex 05, France 6Department of Pathology, Hôpital René Huguenin, 92210 Saint-Cloud, France. 7Department of tumor biology, Institut Curie, 26 rue d’Ulm, 75248 Paris Cedex 05, France
2
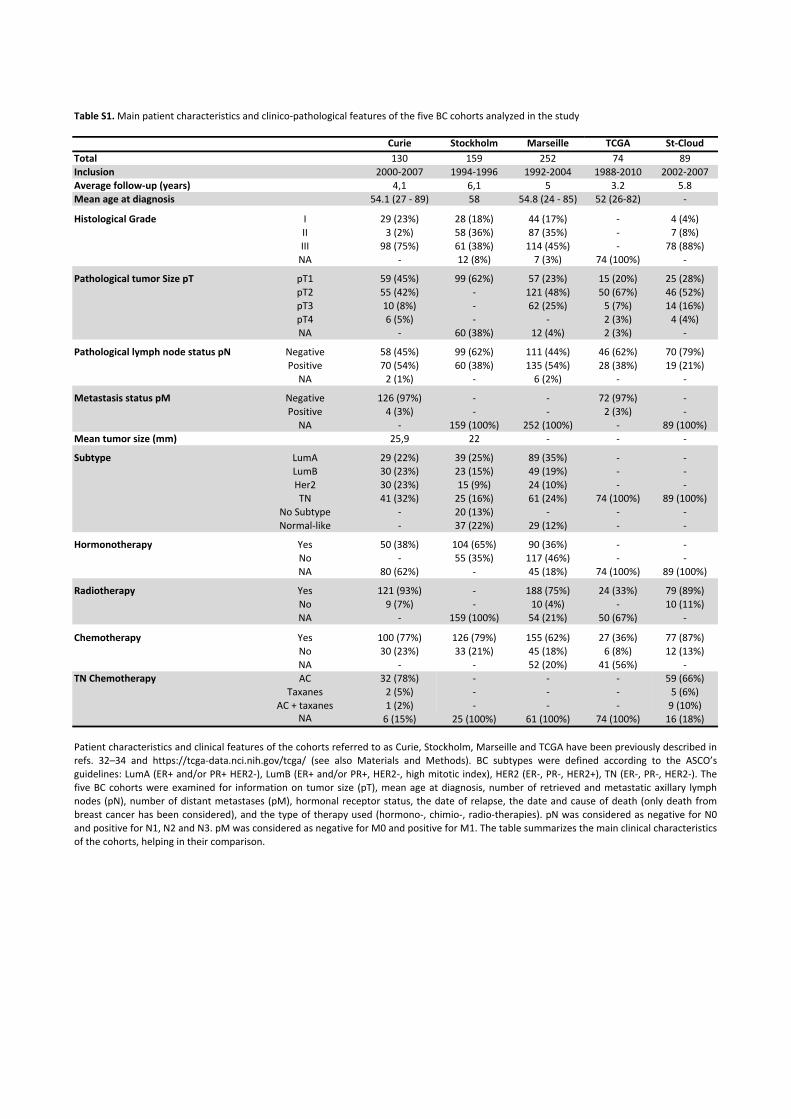
Table S1. Main patient characteristics and clinico-pathological features of the five BC cohorts
analyzed in the study. Patient characteristics and clinical features of the cohorts referred to
as Curie, Stockholm, Marseille and TCGA have been previously described in refs. 32–34 and
https://tcga-data.nci.nih.gov/tcga/ (see also Materials and Methods). BC subtypes were
defined according to the ASCO’s guidelines: LumA (ER+ and/or PR+ HER2-), LumB (ER+
and/or PR+, HER2-, high mitotic index), HER2 (ER-, PR-, HER2+), TN (ER-, PR-, HER2-). The
five BC cohorts were examined for information on tumor size (pT), mean age at diagnosis,
number of retrieved and metastatic axillary lymph nodes (pN), number of distant metastases
(pM), hormonal receptor status, the date of relapse, the date and cause of death (only death
from breast cancer has been considered), and the type of therapy used (hormono-, chimio-,
radio-therapies). pN was considered as negative for N0 and positive for N1, N2 and N3. pM
was considered as negative for M0 and positive for M1. The table summarizes the main
clinical characteristics of the cohorts, helping in their comparison.
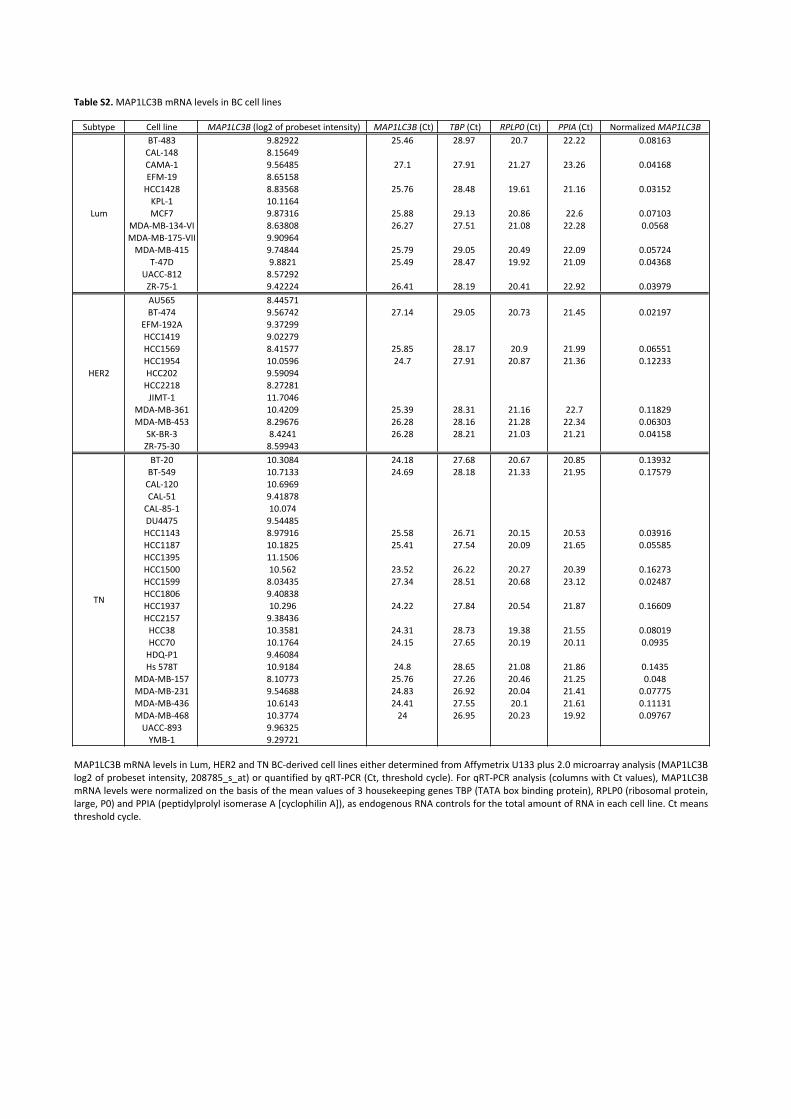
Table S2. MAP1LC3B mRNA levels in BC cell lines. MAP1LC3B mRNA levels in Lum, HER2
and TN BC-derived cell lines either determined from Affymetrix U133 plus 2.0 microarray
analysis (MAP1LC3B log2 of probeset intensity, 208785_s_at) or quantified by qRT-PCR (Ct,
threshold cycle). For qRT-PCR analysis (columns with Ct values), MAP1LC3B mRNA levels
were normalized on the basis of the mean values of 3 housekeeping genes TBP (TATA box
binding protein), RPLP0 (ribosomal protein, large, P0) and PPIA [peptidylprolyl isomerase A
[cyclophilin A)]), as endogenous RNA controls for the total amount of RNA in each cell line.
Ct means threshold cycle.
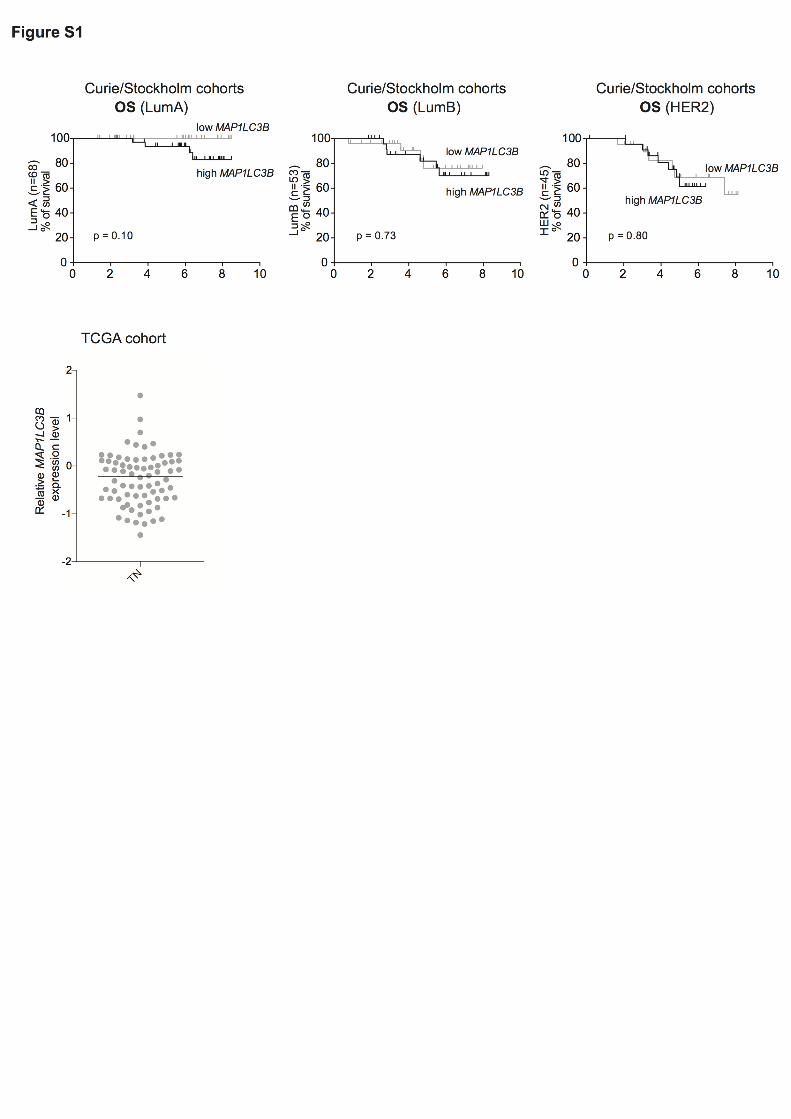
Figure S1. MAP1LC3B is not a prognostic marker in LumA, LumB and HER2 BC. Top,
Kaplan-Meier curves of OS for Curie/Stockholm cohorts with respect to MAP1LC3B mRNA
levels, in LumA BC (n = 34 for low expression and n = 34 for high expression; cut-off value =
-0.38, scatter plot shown in Fig. 1C), LumB BC (n = 26 for low expression and n = 27 for high
expression; cut-off value = 0.27, scatter plot shown in Fig. 1C) and HER2 BC (n = 21 for low
3
expression and n = 24 for high expression; cut-off value = 0.36, scatter plot shown in Fig.
1C), as indicated. p-values are based on Log-rank test. Bottom, Scatter plots of MAP1LC3B
mRNA levels in TN BC subtype from the TCGA cohort. MAP1LC3B mRNA level was
evaluated from Agilent G4502A_07 array and processed by the TCGA as follows:
Normalization using RMA algorithm and expression values were gene centered. Data are
from https://tcga-data.nci.nih.gov/tcga/.
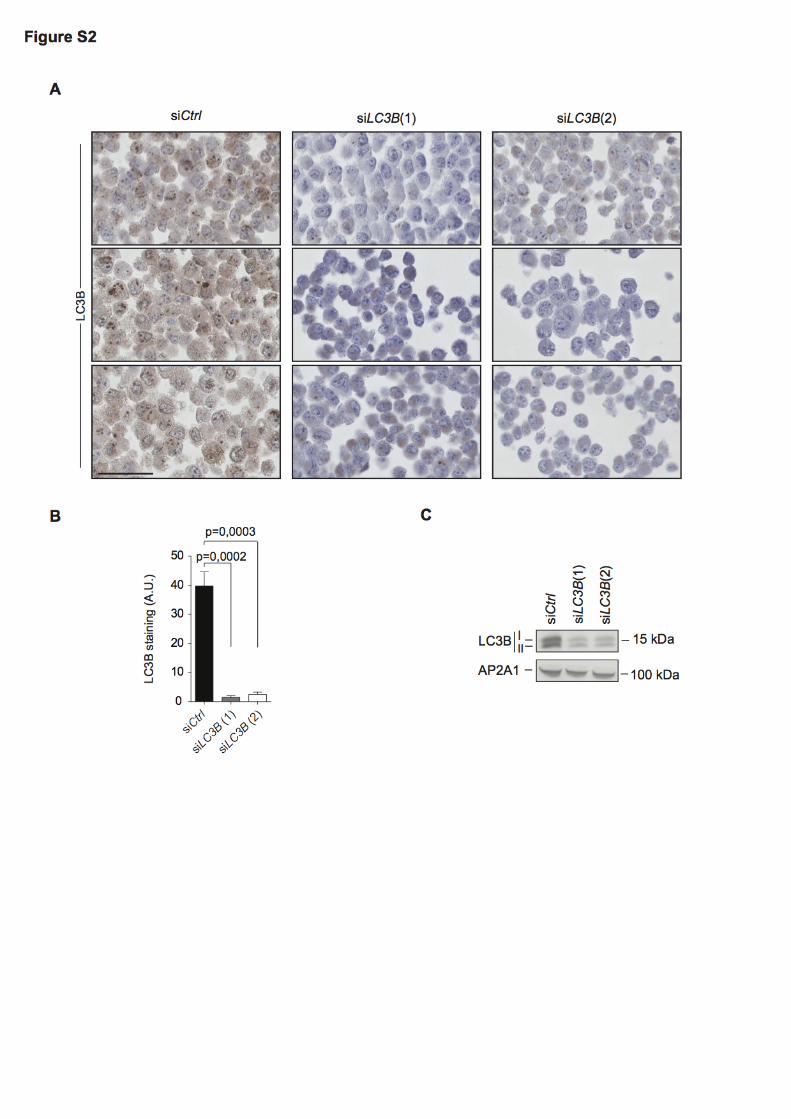
Figure S2. Verification of the specificity of the LC3B-directed antibody, used in this study. (A)
MDA231 TN BC cells transfected with control- (siCtrl) or LC3B-targeted (siLC3B) siRNA
were fixed, embedded into paraffin, sectioned, and incubated with LC3B-specific antibody
following the same protocol as the one used for IHC from BC patient samples. The specific
LC3B staining is severely reduced in LC3B-depleted cells, confirming the specificity of the
antibody in IHC experiments. (B) Bar graph showing reduced IHC staining in LC3B-depleted
cells (siLC3B), compared to control (siCTL). (C) Western blots showing LC3B protein levels
in MDA231 cells after transfection with control- (siCtrl) or LC3B-targeted (siLC3B) siRNA.
AP2A1/adaptin is used as an internal control for protein loading.
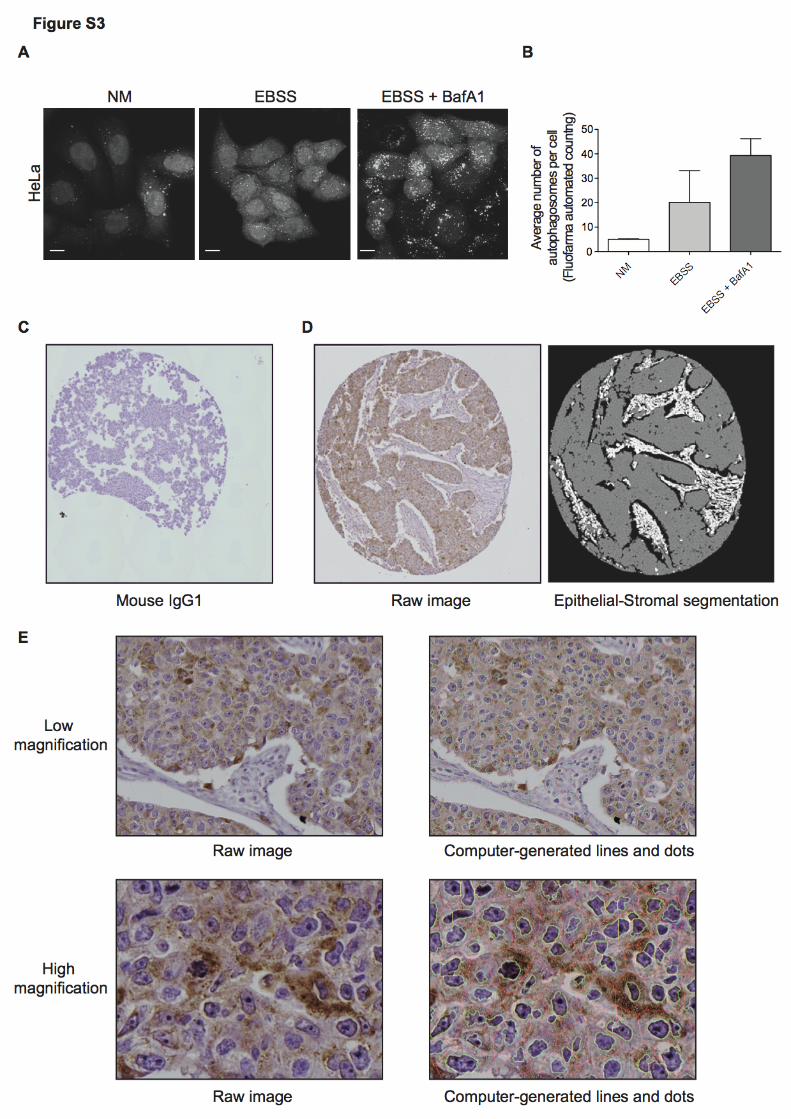
Figure S3. Automated quantification of autophagic vacuoles. (A) Representative confocal
pictures from HeLa-GFP-LC3 cells cultured in growing normal medium (NM) or incubated
with EBSS for 2 h with or without bafilomycin A1 (BafA1; 100 nM). Scale bar = 10 μM. (B)
Bar graph represents the average number of autophagosomes per cell based on the
Fluofarma automated quantification algorithm. (C-E) Representative views of the same tumor
sample following incubation with a mouse IGg1 antibody, used as a matched isotype control
for LC3B staining (C), with LC3B antibody (D, left), or with LC3B antibody following
deconvolution by Fluofarma algorithm, defining epithelial and stromal compartments (D,
right). (E) Representative views of the same tumor sample before (E, raw images, left) and
after (E, computer-generated images, right) segmentations achieved using Fluofarma
algorithm are shown with low (upper panels) and high (lower panels) magnification images,
4
after computer-generated delimitations of nuclear and plasma membranes (green and red
lines, respectively).
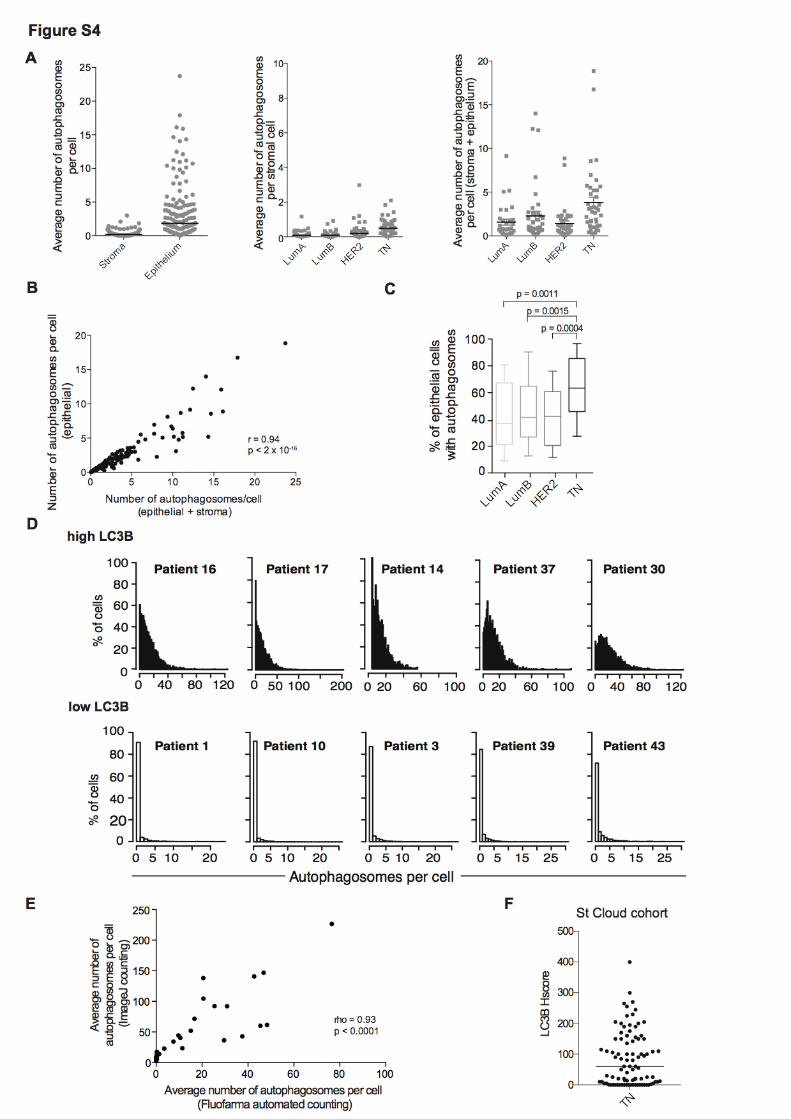
Figure S4. Quantification of autophagosomes in epithelial and stromal cells in human BC
samples. (A) Scatter plot of the average number of autophagosomes per cell based on the
automatized quantification algorithm (tumor samples from Curie cohort) in stromal versus
epithelial cells (A, left), in stromal cells according to BC subtypes (A, middle) and in both
epithelial and stromal cells according to BC subtypes (A, right). Horizontal bars represent
the median values. 27 LumA, 37 LumB, 33 HER2 and 40 TN tumors were analyzed. (B)
Correlation between the average number of autophagosomes per epithelial cells and the
number of autophagosomes per epithelial and stromal cells. Correlation coefficient was
computed using Pearson’s test. (C) Box-and-whisker plot showing that the percentage (%) of
autophagosome-positive epithelial cells (defined by the automated method) is significantly
higher in TN BC than in LumA, LumB and HER2 BC, confirming classic histological LC3B
scoring (Curie cohort) (Fig. 2B). (D) Each histogram represents, for a single TN tumor, the
percentage distribution of epithelial cells according to the number of autophagosomes per
cell. 5 TN tumors with a high number of autophagosomes per epithelial cell (upper) and 5 TN
tumors with a low number of autophagosomes per epithelial cell (lower) are shown. (E)
Positive correlation between automated quantification of LC3B immunofluorescence staining
of TN and HER2 cell lines by ImageJ software or Fluofarma algorithm. (F) LC3B histological
scoring (Hscore, see Methods) in the TN BC subtype from the St-Cloud cohort.
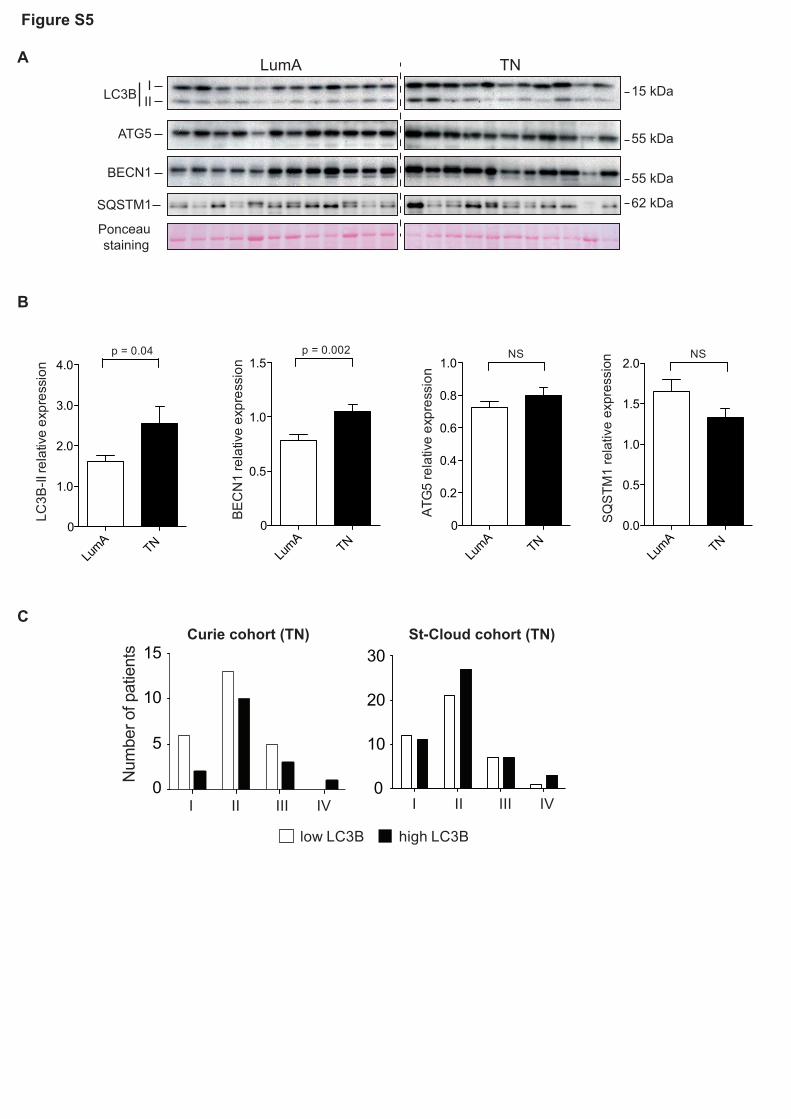
Figure S5. Levels of proteins involved in autophagy in human BC samples. (A) Western
blots showing LC3B, ATG5, BECN1 and SQSTM1 expression levels in LumA and TN BC.
Each line corresponds to individual BC patients. Ponceau staining was used as control for
evaluation of protein loading. (B) Bar graphs represent the corresponding quantification of
LC3B-II, BECN1, ATG5 and SQSTM1 protein levels. Data are expressed as means +/- sem
5
(n = at least 10 tumors per subtype). (C) Classification of the TN population of the Curie (C,
left) and St-Cloud (C, right) cohorts by LC3B status, according to stage.
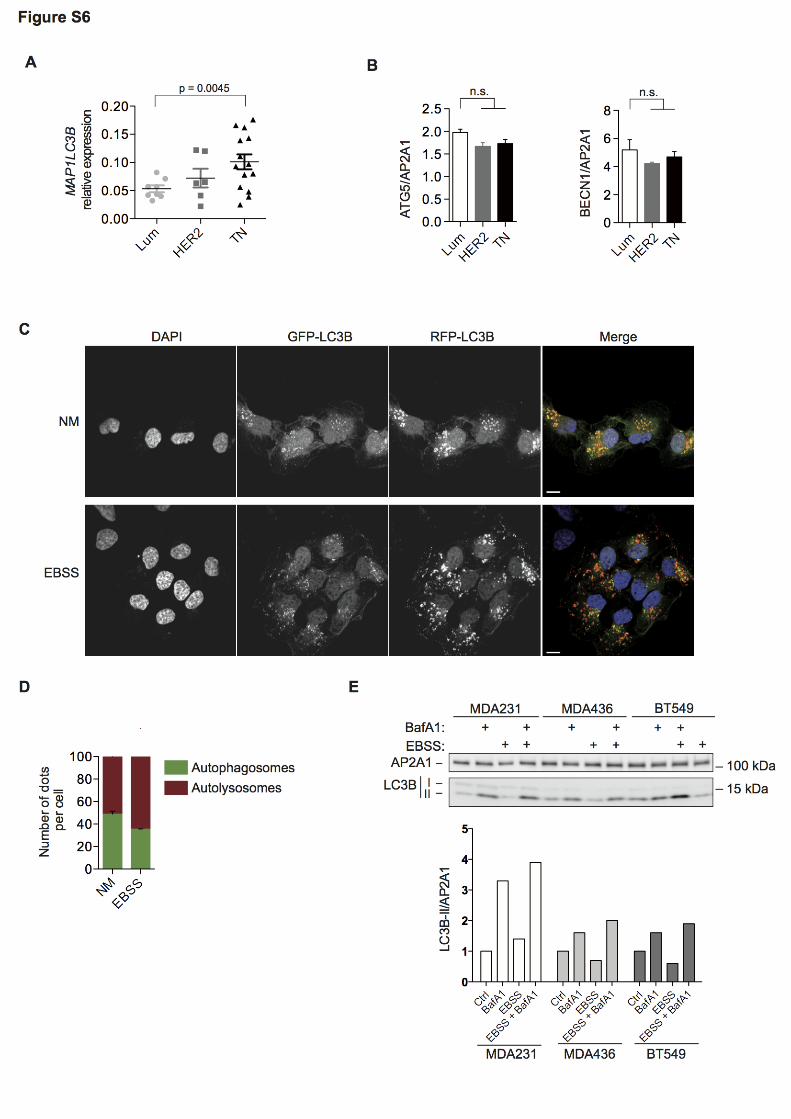
Figure S6. MAP1LC3B mRNA and protein levels in human BC cell lines. (A) MAP1LC3B
mRNA levels in LumA, HER2 and TN BC cell lines measured by qRT-PCR experiments (see
also Table S2 for detailed quantitative values). Horizontal bars represent the median values
(n ≥ 6 cell lines for each subtype). p-values are based onStudent’s t-test. (B) Bar graphs
show the ratio of ATG5/AP2A1 (left panel) or BECN1/AP2A1 (right panel) protein levels, as
assessed by densitometric analysis of the western blots shown in Fig. 3B. AP2A1 is used as
an internal control for protein loading. Data are shown as means +/- sem (N = 3 independent
experiments). p-values are based on Student’s t-test. (C) Representative confocal pictures of
MDA231 cells stably expressing the tandem probe RFP-GFP-LC3B cultivated in normal
medium (NM) or treated with EBSS for 1 h, fixed and stained for DAPI (blue). This dual probe
analysis enables a direct assessment of the level of autophagosome-lysosome fusion events
and makes it possible to distinguish between autophagosomes (yellow) and autolysosomes
(red). Scale bar = 10 μm. (D) The bar graph represents the number of autophagosomes
(yellow dots in C, green bar) and autolysosomes (red dots in C, red bar) per cell,
expressed as the percentage of total number of dots. (E) The indicated TN cell lines were
treated or not with EBSS for 2 h with or without bafilomycin A1 (BafA1; 100 nM). Western
blots for AP2A1 and LC3B are shown. The graph represents the LC3B-II/AP2A1 ratios,
quantified by densitometric analysis of the western blots shown above. AP2A1 is used as an
internal control for protein loading. N=3 independent experiments.
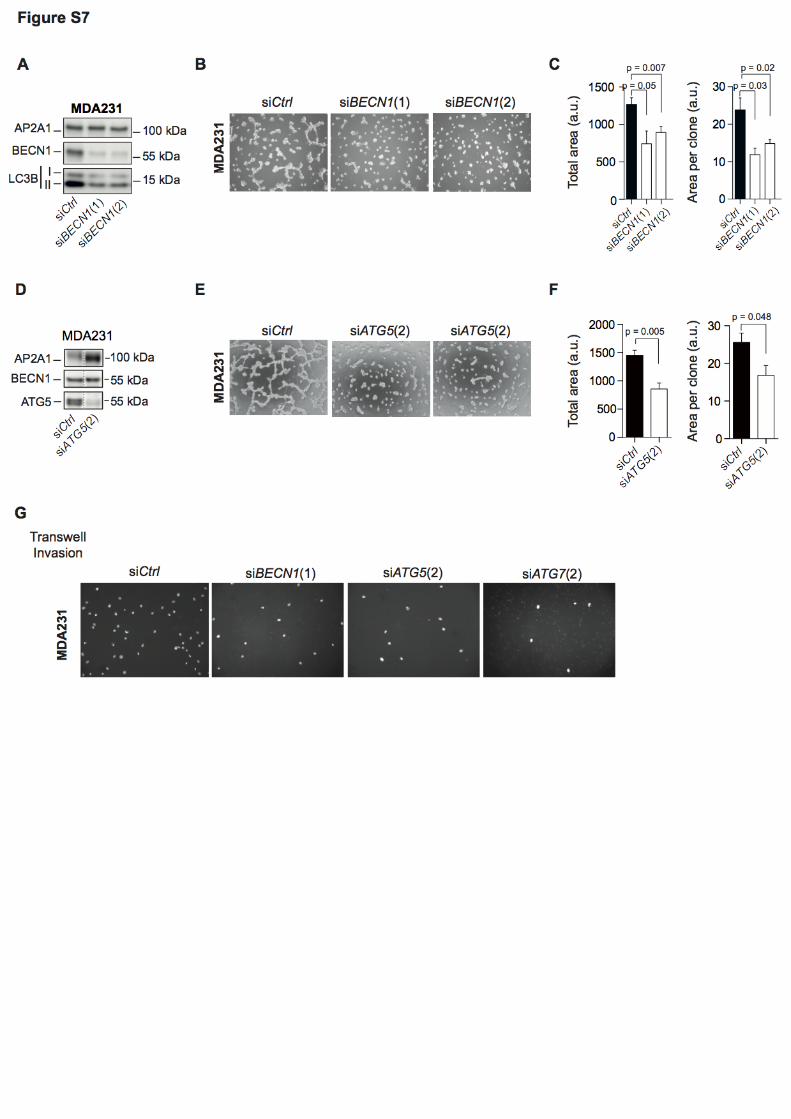
Figure S7. Role of autophagy in invasion of high-LC3B TN BC cells. (A-F) MDA231 TN cells
were transiently transfected with control- (Ctrl) or with two different siRNAs directed against
BECN1 (siBECN1(1), siBECN1(2)), or ATG5 [siATG5(1), siATG5(2) as indicated] and
maintained in 3D conditions for 3 days. (A,D) Western blots showing BECN1 (A) or ATG5
6
(D) protein levels in MDA231 cells following transfection with siRNAs, as indicated. AP2A1 is
used as an internal control for protein loading. (B,E) Representative bright field images from
MDA231 TN cells +/- siRNAs, as indicated. Scale bars = 100 μm. (C,F) Bar graphs represent
the total area covered by the stellate structures per field (left panel; a total area of 0.85mm2
has been evaluated; arbitrary unit, a.u) and the area per clone (right panel), as determined
using Metamorph software. Data are from MDA231 TN cells +/- siRNAs, as indicated. Data
shown are means +/- sem (N=3 independent experiments). (G) Representative photos from
MDA231 TN cells transiently transfected with control- (Ctrl), BECN1-, ATG5-, ATG7-targeted
siRNA and tested for invasion using a Transwell assay.
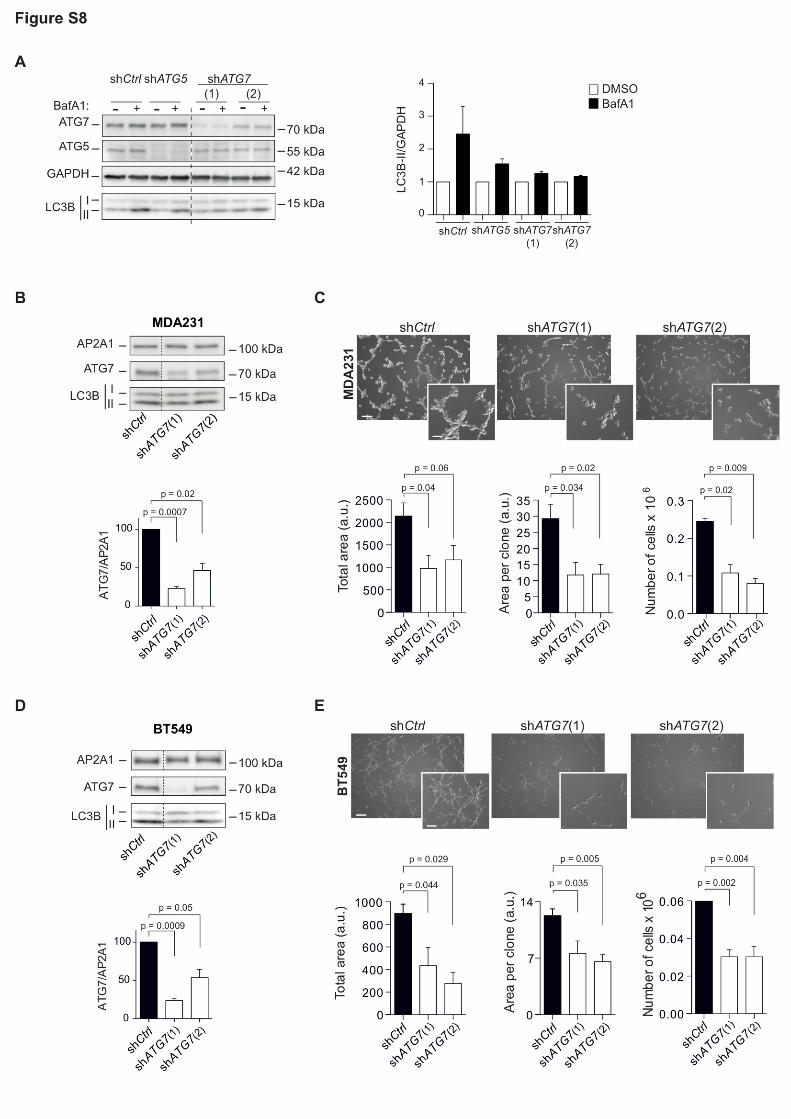
Figure S8. Role of autophagy in invasion of high-LC3B TN BC cells. (A) Western blots
showing ATG7, ATG5, GAPDH and LC3B expression levels in MDA231 cells stably
expressing the indicating shRNAs (left panel) TN BC without (-) or with (+) bafilmomycin A1
(BafA1) treatment. Bar graphs represent the corresponding quantification of LC3B-II/GAPDH
ratios (right panel). Data are expressed as means +/- sem (N = 2). (B-E) Results are from
MDA231 (B,C) or BT549 (D,E) cell lines stably expressing 2 different shRNA directed against
ATG7, referred to as shCtrl, shATG7(1) or shATG7(2), and cultured in 3D conditions. (B)
Western blots show ATG7 and LC3B protein levels in MDA231 stable cell lines, following 3D
culture. AP2A1 is used as an internal control for protein loading. (C) Representative bright
field images from MDA231 TN cells stably expressing shRNAs, as indicated, following 3D
culture. Scale bars = 100 μm (low magnification) and 50 μm (high magnification). Bar graphs
represent the total area of the stellate structures per field (left panel) or the area per clone
(middle panel) and the total number of cells extracted after 3 days of 3D culture (right panel).
Data are shown as means +/- sem (N = 3 independent experiments). p-values are based on
Student’s t-test. (D) Western blots show ATG7 and LC3B protein levels in BT549 stable cell
lines, following 3D culture. AP2A1 is used as an internal control for protein loading. (E)
Representative bright field images from BT549 TN cell lines stably expressing shRNAs, as
7
indicated, following 3D culture. Bar graphs represent the total area of the stellate structures
per field (left panel) or the area per clone (middle panel) and the total number of cells
extracted after 3 days of 3D culture (right panel). Data are shown as means +/- sem (N=3
independent experiments). p-values are based on Student’s t-test.
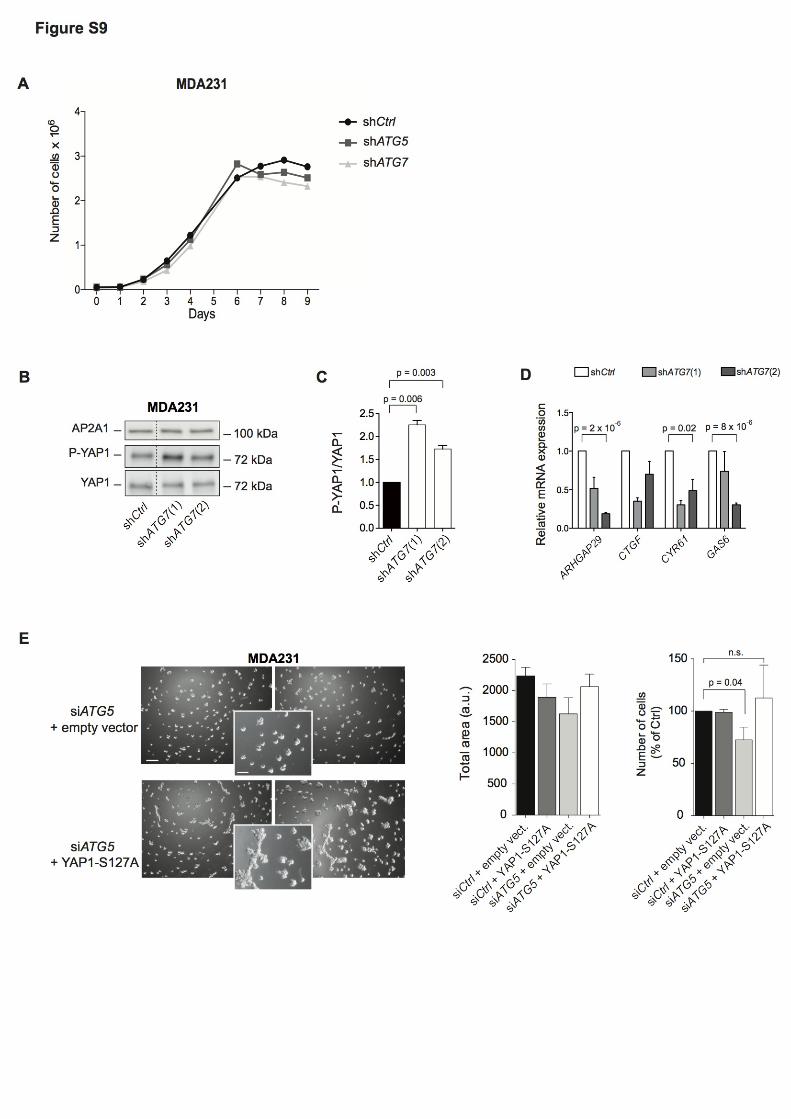
Figure S9. Inhibition of autophagy reduces YAP1 activity in high-LC3B TN BC cells (A)
Proliferation curves of MDA231 TN BC stable cell lines expressing different shRNA (referred
to as shCtrl, shATG5 or shATG7) in 2D culture, over 9 days. (B-D) Results are from MDA231
stable cell lines expressing different shRNA (referred to as shCtrl, shATG7(1) or shATG7(2)
and cultured in 3D conditions. Data are shown as means +/- sem (N=3 independent
experiments). (B) Western blots showing the phosphorylated form of YAP1 on Ser127
residue (P-YAP1), YAP1 and AP2A1 proteins in stable cell lines following 3D culture. AP2A1
is used as internal control for protein loading. (C) The bar graph shows the corresponding
quantification of P-YAP1/YAP1 protein level ratios. (D) mRNA levels of YAP1-target genes
were monitored by RT-qPCR following 3D culture. GAPDH is used as an internal control for
total mRNA levels. Data are shown as means +/- sem (N = 3 independent experiments). p-
values are based on Student’s t-test. (E) Results are from autophagy-proficient (siCtrl) or
autophagy-deficient (siATG5) MDA231 cells, transfected with an empty vector (Ctl) or a
vector expressing YAP-S127A, a non-phosphorylable mutant form of YAP, after 3 days of 3D
culture. (E, left) Representative bright field images from ATG5-depleted cells expressing or
not YAP-S127A, as indicated. Scale bars = 100 μm. Bar graph (E, middle) represents the
total area covered by the stellate structures per field. (E, right) Bar graph shows the total
number of cells extracted from the corresponding 3D culture after 3 days, as a percentage of
siCtrl cells transfected with an empty vector. Data are shown as means +/- sem (N = 2
independent experiments). p-values are based on Student’s t-test.
0
5
10
15
low LC3B high LC3B
Curie cohort (TN)
Num
ber o
f pat
ient
s
I II III IV0
10
20
30St-Cloud cohort (TN)
C
I II III IV
Figure S5
ATG5
BECN1
LumA TN
LC3B 15 kDa
55 kDa
55 kDa
A
LumA
TN 0
1.0
2.0
3.0
4.0p = 0.04
LC3B
-II re
lativ
e ex
pres
sion
LumA
TN 0
0.2
0.4
0.6
0.8
1.0
ATG
5 re
lativ
e ex
pres
sion
LumA
TN 0
0.5
1.0
1.5p = 0.002
BEC
N1
rela
tive
expr
essi
onPonceau staining
SQSTM1 62 kDa
LumA
TN 0.0
0.5
1.0
1.5
2.0
B
NSNS
SQ
STM
1 re
lativ
e ex
pres
sion
III
Table&S1.&Main%patient%characteristics%and%clinico0pathological%features%of%the%five%BC%cohorts%analyzed%in%the%study
Curie Stockholm Marseille TCGA St8CloudTotal 130 159 252 74 89Inclusion 200002007 199401996 199202004 198802010 200202007Average&follow8up&(years) 4,1 6,1 5 3.2 5.8Mean&age&at&diagnosis 54.1%(27%0%89) 58 54.8%(24%0%85) 52%(26082) 0
Histological&Grade I 29%(23%) 28%(18%) 44%(17%) 0 4%(4%)II 3%(2%) 58%(36%) 87%(35%) 0 7%(8%)III 98%(75%) 61%(38%) 114%(45%) 0 78%(88%)NA 0 12%(8%) 7%(3%) 74%(100%) 0
Pathological&tumor&Size&pT pT1 59%(45%) 99%(62%) 57%(23%) 15%(20%) 25%(28%)pT2 55%(42%) 0 121%(48%) 50%(67%) 46%(52%)pT3 10%(8%) 0 62%(25%) 5%(7%) 14%(16%)pT4 6%(5%) 0 0 2%(3%) 4%(4%)NA 0 60%(38%) 12%(4%) 2%(3%) 0
Pathological&lymph&node&status&pN Negative 58%(45%) 99%(62%) 111%(44%) 46%(62%) 70%(79%)Positive 70%(54%) 60%(38%) 135%(54%) 28%(38%) 19%(21%)NA 2%(1%) 0 6%(2%) 0 0
Metastasis&status&pM Negative 126%(97%) 0 0 72%(97%) 0Positive 4%(3%) 0 0 2%(3%) 0NA 0 159%(100%) 252%(100%) 0 89%(100%)
Mean&tumor&size&(mm) 25,9 22 0 0 0
Subtype LumA 29%(22%) 39%(25%) 89%(35%) 0 0LumB 30%(23%) 23%(15%) 49%(19%) 0 0Her2 30%(23%) 15%(9%) 24%(10%) 0 0TN 41%(32%) 25%(16%) 61%(24%) 74%(100%) 89%(100%)
No%Subtype 0 20%(13%) 0 0 0Normal0like 0 37%(22%) 29%(12%) 0 0
Hormonotherapy Yes 50%(38%) 104%(65%) 90%(36%) 0 0No 0 55%(35%) 117%(46%) 0 0NA 80%(62%) 0 45%(18%) 74%(100%) 89%(100%)
Radiotherapy Yes 121%(93%) 0 188%(75%) 24%(33%) 79%(89%)No 9%(7%) 0 10%(4%) 0 10%(11%)NA 0 159%(100%) 54%(21%) 50%(67%) 0
Chemotherapy Yes 100%(77%) 126%(79%) 155%(62%) 27%(36%) 77%(87%)No 30%(23%) 33%(21%) 45%(18%) 6%(8%) 12%(13%)NA 0 0 52%(20%) 41%(56%) 0
TN&Chemotherapy AC 32%(78%) 0 0 0 59%(66%)Taxanes 2%(5%) 0 0 0 5%(6%)
AC%+%taxanes 1%(2%) 0 0 0 9%(10%)NA 6%(15%) 25%(100%) 61%(100%) 74%(100%) 16%(18%)
Patient characteristics and clinical features of the cohorts referred to as Curie, Stockholm, Marseille and TCGA have been previously described inrefs. 32–34 and https://tcga0data.nci.nih.gov/tcga/ (see also Materials and Methods). BC subtypes were defined according to the ASCO’sguidelines: LumA (ER+ and/or PR+ HER20), LumB (ER+ and/or PR+, HER20, high mitotic index), HER2 (ER0, PR0, HER2+), TN (ER0, PR0, HER20). Thefive BC cohorts were examined for information on tumor size (pT), mean age at diagnosis, number of retrieved and metastatic axillary lymphnodes (pN), number of distant metastases (pM), hormonal receptor status, the date of relapse, the date and cause of death (only death frombreast cancer has been considered), and the type of therapy used (hormono0, chimio0, radio0therapies). pN was considered as negative for N0and positive for N1, N2 and N3. pM was considered as negative for M0 and positive for M1. The table summarizes the main clinical characteristicsof%the%cohorts,%helping%in%their%comparison.
Table&S2.!MAP1LC3B!mRNA!levels!in!BC!cell!lines
Subtype Cell!line MAP1LC3B!(log2!of!probeset!intensity) MAP1LC3B!(Ct) TBP!(Ct) RPLP0!(Ct) PPIA!(Ct) Normalized!MAP1LC3BBTE483 9.82922 25.46 28.97 20.7 22.22 0.08163CALE148 8.15649CAMAE1 9.56485 27.1 27.91 21.27 23.26 0.04168EFME19 8.65158HCC1428 8.83568 25.76 28.48 19.61 21.16 0.03152KPLE1 10.1164MCF7 9.87316 25.88 29.13 20.86 22.6 0.07103
MDAEMBE134EVI 8.63808 26.27 27.51 21.08 22.28 0.0568MDAEMBE175EVII 9.90964MDAEMBE415 9.74844 25.79 29.05 20.49 22.09 0.05724
TE47D 9.8821 25.49 28.47 19.92 21.09 0.04368UACCE812 8.57292ZRE75E1 9.42224 26.41 28.19 20.41 22.92 0.03979AU565 8.44571BTE474 9.56742 27.14 29.05 20.73 21.45 0.02197
EFME192A 9.37299HCC1419 9.02279HCC1569 8.41577 25.85 28.17 20.9 21.99 0.06551HCC1954 10.0596 24.7 27.91 20.87 21.36 0.12233HCC202 9.59094HCC2218 8.27281JIMTE1 11.7046
MDAEMBE361 10.4209 25.39 28.31 21.16 22.7 0.11829MDAEMBE453 8.29676 26.28 28.16 21.28 22.34 0.06303
SKEBRE3 8.4241 26.28 28.21 21.03 21.21 0.04158ZRE75E30 8.59943BTE20 10.3084 24.18 27.68 20.67 20.85 0.13932BTE549 10.7133 24.69 28.18 21.33 21.95 0.17579CALE120 10.6969CALE51 9.41878CALE85E1 10.074DU4475 9.54485HCC1143 8.97916 25.58 26.71 20.15 20.53 0.03916HCC1187 10.1825 25.41 27.54 20.09 21.65 0.05585HCC1395 11.1506HCC1500 10.562 23.52 26.22 20.27 20.39 0.16273HCC1599 8.03435 27.34 28.51 20.68 23.12 0.02487HCC1806 9.40838HCC1937 10.296 24.22 27.84 20.54 21.87 0.16609HCC2157 9.38436HCC38 10.3581 24.31 28.73 19.38 21.55 0.08019HCC70 10.1764 24.15 27.65 20.19 20.11 0.0935HDQEP1 9.46084Hs!578T 10.9184 24.8 28.65 21.08 21.86 0.1435
MDAEMBE157 8.10773 25.76 27.26 20.46 21.25 0.048MDAEMBE231 9.54688 24.83 26.92 20.04 21.41 0.07775MDAEMBE436 10.6143 24.41 27.55 20.1 21.61 0.11131MDAEMBE468 10.3774 24 26.95 20.23 19.92 0.09767UACCE893 9.96325YMBE1 9.29721
Lum
HER2
TN
MAP1LC3B mRNA levels in Lum, HER2 and TN BCEderived cell lines either determined from Affymetrix U133 plus 2.0 microarray analysis (MAP1LC3Blog2 of probeset intensity, 208785_s_at) or quantified by qRTEPCR (Ct, threshold cycle). For qRTEPCR analysis (columns with Ct values), MAP1LC3BmRNA levels were normalized on the basis of the mean values of 3 housekeeping genes TBP (TATA box binding protein), RPLP0 (ribosomal protein,large, P0) and PPIA (peptidylprolyl isomerase A [cyclophilin A]), as endogenous RNA controls for the total amount of RNA in each cell line. Ct meansthreshold!cycle.