supermassive black holes in galactic …astrolff/ferrarese_ford.pdf · supermassive black holes in...
TRANSCRIPT
SUPERMASSIVE BLACK HOLES IN GALACTICNUCLEI: PAST, PRESENT AND FUTURERESEARCH
Laura FerrareseDepartment of Physics and Astronomy, Rutgers UniversityPiscataway, NJ 08854 USA
Holland FordDepartment of Physics and Astronomy, Johns Hopkins UniversityBaltimore, Maryland 21218 USA
May 11, 2004
Abstract.
This review discusses the current status of supermassive black hole research, asseen from a purely observational standpoint. Since the early ’90s, rapid technologicaladvances, most notably the launch of the Hubble Space Telescope, the commission-ing of the VLBA and improvements in near-infrared speckle imaging techniques,have not only given us incontrovertible proof of the existence of supermassive blackholes, but have unveiled fundamental connections between the mass of the centralsingularity and the global properties of the host galaxy. It is thanks to these obser-vations that we are now, for the first time, in a position to understand the origin,evolution and cosmic relevance of these fascinating objects.
1. INTRODUCTION
The menagerie of Active Galactic Nuclei (AGNs) is as eclectic as couldbe imagined. Quasars, radio galaxies, Seyfert nuclei, Blazars, LINERS,BL-Lac objects, to name a few, are set apart from each other both bythe detailed character of the activity which takes place in the nuclei, andby the traits of the galaxies which host them. Underneath this appar-ent diversity, however, lie three revealing common properties. First,AGNs are extremely compact. Flux variability – a staple of all AGNs– confines AGNs to within the distance light can travel in a typicalvariability timescale. In many cases, X-ray variability is observed ontime scales of less than a day, and flares on time scales of minutes(e.g. NGC 6814, Tennant & Mushotzky 1983; MCG 6-30-15, McHardy1988). Second, the spectral energy distribution is decisively non-stellar:roughly speaking, AGNs’ power per unit logarithmic frequency intervalis constant over seven decades in frequency, while stars emit nearly allof their power in a frequency range a mere factor three wide. Third,AGNs must be very massive, a conclusion supported by two indepen-dent arguments. AGNs’ bolometric luminosities are astoundingly large:at least comparable, and often several orders of magnitude larger than
2 Laura Ferrarese and Holland Ford
the luminosity of the entire surrounding galaxy. Masses in excess of∼ 106M are needed for an AGN not to become unbound by its ownoutpouring of energy. Furthermore, according to our best estimates,AGNs remain active for upward of 107 years: during this period, anenormous amount of material, well over a million solar masses, mustbe consumed to sustain their luminosity, even assuming a very highefficiency of energy production.
Taken together, these considerations lead to the inescapable conclu-sion that the source of the nuclear activity is accretion onto a central,supermassive black hole (SBH; Rees 1984). Indeed, evidence of a rel-ativistic regime is betrayed, at least in some AGNs, by superluminalmotions of the radio jets, and by the broadening of low excitation X-ray emission lines (see § 8.2). In our standard picture, the accretedmatter is thought to be confined in an accretion disk, or more gener-ally optically thick plasma, glowing brightly at ultraviolet (UV) andperhaps soft X-ray wavelengths. Medium and hard X-ray emission isproduced by inverse Compton scattering in a corona of optically thinplasma which might surround or “sandwich” the disk. Clouds of line-emitting gas move at high velocity around this complex core and are inturn surrounded by an obscuring torus or warped disk of gas and dust,with a sea of electrons permeating the volume within and above thetorus. What is commonly referred to as the ‘AGN paradigm’ states thatthe detailed character of the nuclear activity can always be reproducedby finely tweaking, rather than completely revising, this basic picture.Changes in the angle at which the AGN is observed, in the spin and/ormass of the black hole, in the accretion rate, and in the modalities withwhich the surrounding interstellar medium interacts with the emergingAGN flux, account for the varied types found in the AGN zoo.
Although the black hole paradigm originated and evolved exclu-sively within the AGN context, modern SBH searches have targetedalmost exclusively quiescent or weakly active nearby galaxies - and it’son these galaxies that this review will mainly focus. There are two goodreasons for this. First, “dormant” SBHs are expected to be found in thenuclei of quiescent galaxies. The cumulative SBH mass density neededto explain the energetics of high redshift powerful quasars falls short,by at least two orders of magnitudes, to the one required to powerlocal AGNs (Padovani, Burg & Edelson 1990; Ferrarese 2002a). Theunaccounted SBHs must therefore reside in local, quiescent galaxies.Second, the telltale Keplerian dynamical signature imprinted by a cen-tral compact object on the motion of the surrounding gas and stars canonly be resolved in the most nearby galactic centers and, unfortunately,most nearby galaxies are not powerful AGNs. In passing, it must bementioned that although it is now accepted that SBH are present in
ferrarese_ford.tex; 11/05/2004; 22:31; no v.; p.2

SUPERMASSIVE BLACK HOLES IN GALACTIC NUCLEI 3
the nuclei of quiescent galaxies, we still do not completely understandhow the two coexist; in view of the abundant supply of gas and dustin galactic centers, preventing a SBH from accreting and immediatelyproducing an AGN is not a simple task (Fabian & Canizares 1988).Indeed, a definitive answer to this dilemma has yet to be found (Reeset al. 1982; Narayan & Yi 1994; Blandford & Begelman 1999; di Matteoet al. 1999).
The most recent review on SBHs was published in 1995 (Kormendy& Richstone 1995). Since then, progress in this field has been so rapidthat any attempt to summarize it was destined to be outdated by pub-lication time. The number of local SBH detections has gone from a fewin 1995 to almost three dozens in 2004. Strong connections betweenSBHs and their host galaxies have emerged. Formation and evolution-ary scenarios have become more tightly constrained. After such feverishactivity, we are now at a turning point, when progress is once againslowing down as observational facilities are been exploited to their limit.
This review will be concerned exclusively with supermassive blackholes. There is controversial evidence that “intermediate” mass blackholes (IBHs), bridging the gap between the stellar mass (a few to a fewtens of solar masses) and supermassive (over a million solar masses)varieties, might exist in the off-nuclear regions of some star-forminggalaxies and perhaps at the centers of globular clusters. An excellentreview of intermediate mass black holes is given by Miller & Colbert(2004), and we will not discuss the issue any further. Some useful for-malism will be introduced in § 2. We will then present a brief historicaloverview of the subject (§ 3). Although most reviews dispense withit, the history of SBHs is a fascinating example of the long trail oftentative steps, missed clues, and heterogeneous research areas whichultimately need to congeal for seemingly unforeseen and revolutionaryideas to emerge. Readers who are familiar with this history are invitedto skip to § 4; readers desiring a comprehensive history of the theoreti-cal developments should refer to Thorne’s book Black Holes and Time
Warps, Einstein’s Outrageous Legacy (1994). We will then move on todiscuss the several methods which can be used to measure SBH masses(§ 4- 8), with particular emphasis on resolved stellar and gas dynamicalstudies carried out with the Hubble Space Telescope. Scaling relation,linking SBH masses to the overall properties of the host galaxies, arediscussed in § 10. SBH demographics, from high redshift quasars tolocal galaxies, is discussed in § 10. Finally, in § 11 we will discuss themost pressing open questions and the issues on which future progressis most likely to be made.
ferrarese_ford.tex; 11/05/2004; 22:31; no v.; p.3
4 Laura Ferrarese and Holland Ford
2. SOME USEFUL FORMALISM
For convenience, we present in this section some terminology and equa-tions which will recurr in the remainder of this review.
An important measure of the accretion rate onto a BH of massM• is provided by the Eddington luminosity, i.e. the luminosity atwhich radiation pressure on free electrons balances the force of gravity.Because the force due to radiation ,ure has exactly the same inversesquare dependence on distance as gravity, but does not depend on mass,LE is independent of distance but depends on M•:
LE =4πGMmpc
σT∼ 1.3 × 1046
(
M•
108M
)
erg s−1 (1)
where mp is the proton rest mass and σT is the Thomson cross sec-tion. Above the Eddington luminosity, the source is unable to maintainsteady spherical accretion (although the presence of magnetic fields canconsiderably complicate the picture, Begelman 2001).
Related to the Eddington luminosity is the Salpeter time
tS =σT c
4πGmp∼ 4 × 10⁸ ε yr (2)
defined as the time it would take a black hole radiating at the Edding-ton luminosity to dissipate its entire rest mass. ε is the efficiency ofconversion of mass into energy, and depends on the spin of the blackhole, varying between 6% if the black hole is not spinning, and 42% ifthe black hole is maximally spinning.
The “boundary” of a (non-rotating) black hole of mass M• is aspherical surface called the event horizon, the radius of which is givenby the Schwarzschild (or gravitational) radius:
rSch =2GM•
c2∼ 3 × 10¹³
(
M•
108M
)
cm ∼ 2
(
M•
108M
)
A.U. (3)
At the Schwarzschild radius the gravitational time dilation goes toinfinity and lengths are contracted to zero.
The radius rst of the last stable orbit, inside which material plungesinto the black hole, depends on the black hole angular momentum,being smaller for spinning Kerr black holes. For a non rotating Schwarzschildblack hole:
rst =6GM•
c2= 3rSch (4)
ferrarese_ford.tex; 11/05/2004; 22:31; no v.; p.4

SUPERMASSIVE BLACK HOLES IN GALACTIC NUCLEI 5
The photon sphere, of radius 1.5rSch, is defined as the surface atwhich gravity bends the path of photons to such an extent that lightorbits the hole circularly.
For a Kerr (rotating) black hole there are two relevant surfaces,the event horizon, and the static surface, which completely enclosesit. At the static surface, space-time is flowing at the speed of light,meaning that a particle would need to move at the speed of light in adirection opposite to the rotation of the hole in order to be stationary.In the region of space within the static surface and the event horizon,called the ergosphere, the rotating black hole drags space around withit (frame dragging) in such a way that all objects must corrotate withthe black hole. For a maximally rotating black hole, the radius of thelast stable orbit is
rst =1.2GM•
c2(5)
Because of the dependence of rst on the black hole spin, the lattercan be inferred provided a measure of the former, and an estimate of theblack hole mass, are available, for instance from rapid flux variability(see also § 8.3).
In the case of supermassive black holes inhabiting galactic nuclei,the “sphere of influence” is defined as the region of space within whichthe gravitational potential of the SBH dominates over that of the sur-rounding stars. Its radius is given by:
rh ∼ G M•/σ2 ∼ 11.2 (M•/10
8M)/(σ/200 km s−1)2 pc. (6)
where σ is the velocity dispersion of the surrounding stellar popula-tion. Beyond a few thousand Schwarzchild radii from the central SBH,but within the sphere of influence, the motion of stars and gas is pre-dominantly Keplerian (relativistic effects are minimal), with a com-ponent due to the combined gravitational potential of stars, dust, gas,dark matter, and anything else contributing mass to within that region.Beyond the sphere of influence, the gravitational dominance of the SBHquickly vanishes.
3. A BRIEF HISTORICAL OVERVIEW
There is perhaps no better way to describe the long chain of eventsthat culminated, in the mid 1960s, in postulating the existence of blackholes than the famous quote from Albert Szent-Gyorgyi: “Research is
ferrarese_ford.tex; 11/05/2004; 22:31; no v.; p.5

6 Laura Ferrarese and Holland Ford
to see what everybody else has seen, and to think what nobody elsehas thought.”
Although Newton theorized that gravity acts on light, it was theBritish natural philosopher Reverend John Mitchell who pursued theimplications of this idea. In a paper delivered to the Royal Society inLondon in 1783, Mitchell envisioned the existence of “dark stars”. Herealized that the escape velocity would become larger if the star radiuswere to be increased while maintaining its density constant. Eventually,the escape velocity would exceed the velocity of light: such star wouldbecome invisible to a distant observer, since the “corpuscles” of light,after librating some distance above the star’s surface in their attemptto escape, would inevitably be pulled back. Thirteen years later, andwith no mention of Mitchell’s work, Pierre Laplace published a verysimilar argument in Exposition du Systeme du Monde, only to drop itin the 3rd edition of the book. The reason for the omission is not clear,but it might have been prompted by the gaining popularity of ChristianHuygen’s ondulatory theory of light – in view of Young and Fresnel’sexperiments – and the lack of a physical understanding of how gravityand waves intermingle.
Such understanding had to wait until the day, in 1915, when AlbertEinstein delivered a lecture on his theory of general relativity to theGerman Academy of Science in Berlin. Within a month of the pub-lication of Einstein’s work, Karl Schwarzschild, while serving in theGerman Army on the Russian front, solved Einstein’s field equationsfor a non-rotating spherical star. His solution (1916a,b) for the space-time geometry, now known as the Schwarzschild metric, enabled himto calculate, for a star of a given mass, the critical radius at which lightemitted from the surface would have an infinite gravitational redshift,and thereby infinite time dilation. Such star, Schwarzschild concluded,would be undetectable by an external observer at any distance fromthe star – a proposition received with considerable skepticism by mosttheorist of the time, including Einstein himself.
Whether a real star could ever reach this critical radius was addressedquite serendipitously in the 1930s. During the voyage from Madras,India, to England to begin graduate study at Cambridge University,nineteen year old Subrahmanyan Chandrasekhar set himself the taskof deriving the structure of white dwarfs, whose existence had beenknown since the very early days of the Hertzprung-Russell diagram.By using the theory of stellar polytropes (Eddington, 1930) in combi-nation with Fowler’s (1926) recently published equation of state for anon-relativistic degenerate electron gas, Chandrasekhar demonstratedthat the density (or radius) of a white dwarf is a very simple functionof its mass. After calculating the central density for Sirius B, how-
ferrarese_ford.tex; 11/05/2004; 22:31; no v.; p.6
SUPERMASSIVE BLACK HOLES IN GALACTIC NUCLEI 7
ever, Chandrasekhar realized that white dwarfs of mass 1 M reachhigh enough densities in their cores for the electron gas to becomes ful-ly relativistic, invalidating Fowler’s equation of state (cf Thorne 1994for a thorough discussion). By allowing for the relativistic increase inthe electrons’ momentum, Chandrasekhar was able to deduce, thoughnot prove, that the dependence of pressure on electron density softens
from Fowler’s N5/3e to N
4/3e . This change has drastic consequences – so
bizarre, in fact, to be publicly ridiculed by the most influential physi-cist of the time, sir Arthur Eddington. A fully relativistic polytropicgas can only be in equilibrium for a mass of precisely .91 M
1– nomatter what its radius or density.
In his 1931 paper, Chandrasekhar interpreted this value – now knownas the “Chandrasekhar limit” – as the maximum mass attainable by awhite dwarf as it approaches fully relativistic degenerate conditions. In1932, the russian physicist Lev Davidovich Landau – who had reacheda conclusion analogous to Chandrasekhar’s in the context of degener-ate neutron stars – went a step further. He clearly stated that additionof matter over the critical limit would lead to unavoidable collapse:the star would shrink in free fall to a point. This remarkable resulthas a simple physical explanation. For a star of small enough mass –whether it is composed of a degenerate gas of electrons or neutrons –the quantum pressure due to Pauli’s exclusion principle can always bebrought into balance with gravity by increasing the density via contrac-tion (according to Fowler’s equation). As the star becomes more mas-sive, however, further contractions will eventually lead to high enoughcore densities to bring the kinetic energy at the top of the Fermi seato levels comparable to the rest energy of the particles; the gas thenbecomes relativistic. Because of the softening in the equation of statethat follows the transition into the relativistic regime, the increase inquantum pressure which derives from further contraction always fallshort of balancing gravity: the contraction cannot be halted.
Following these pioneering works, a detailed study of the equilibriumconfiguration was published by Chandrasekhar (1935) for white dwarfs,and Oppenheimer & Volkoff (1938) for neutron stars. In 1939, Oppen-heimer & Snyder wrote what was destined to become the foundation forthe new field of physics concerned with gravitational singularities. In“On Continued Gravitational Contraction”, they provided a fully ana-lytical solution for the collapse of a cloud of gas, and drew attention tohow collapsed objects are a unique testbed for a fully relativistic the-ory of gravitation. By applying the general relativistic field equations
1 Subsequent improved calculations have shown this mass to be 1.4 M, e.g.Harwit (1998).
ferrarese_ford.tex; 11/05/2004; 22:31; no v.; p.7
8 Laura Ferrarese and Holland Ford
to a sphere of cold neutrons, Oppenheimer & Snyder concluded that“when all thermonuclear sources of energy are exhausted a sufficientlyheavy star will collapse. Unless fission due to rotation, the radiation ofmass, or the blowing off of mass by radiation, reduce the star’s mass tothe order of that of the Sun, this contraction will continue indefinitely[...] The total time of collapse for an object comoving with the stel-lar matter is finite [..] The star thus tends to close itself off from anycommunication with a distant observer; only its gravitational field per-sists”. Black holes – a term coined by Princeton theorist John Wheeleronly in 1960 – were effectively born.
Meanwhile, observational work on black holes was lagging behindthe theory by at least a decade. Although unrealized at the time, thevery first data supporting the existence of black holes – not a few, butmillions of solar masses – had been accumulating since the early ’40s. Ina 1943 paper titled “Nuclear Emission in Spiral Nebulae”, Carl Seyfertidentified 12 galaxies with highly unusual nuclei. Unlike the centers ofnormal galaxies which contain only old stars, these nuclei had “highexcitation nuclear emission lines superposed on a normal G-type spec-trum” (Figure 1). Seyfert remarked that “profiles of the emission linesshow that the lines are broadened, presumably by Doppler motion, byamounts up to 8500 km s−1 for the total widths of the hydrogen line inNGC 3516 and NGC 7469 [...] The lines of the other ions show no evi-dence of wide wings.” In our galaxy, only supernovae explosions wereknown to generate mass motions of this magnitude. Finally, Seyfertnoted that these unusual galaxies have “bright nuclei, scarcely distin-guishable from stars.” For instance, the nucleus of NGC 4151 in thenear ultraviolet is as bright as ∼70% of the entire ultraviolet luminosityof M 31. Later observations of variability timescales showed that manySeyfert nuclei were smaller than a few light minutes in size.
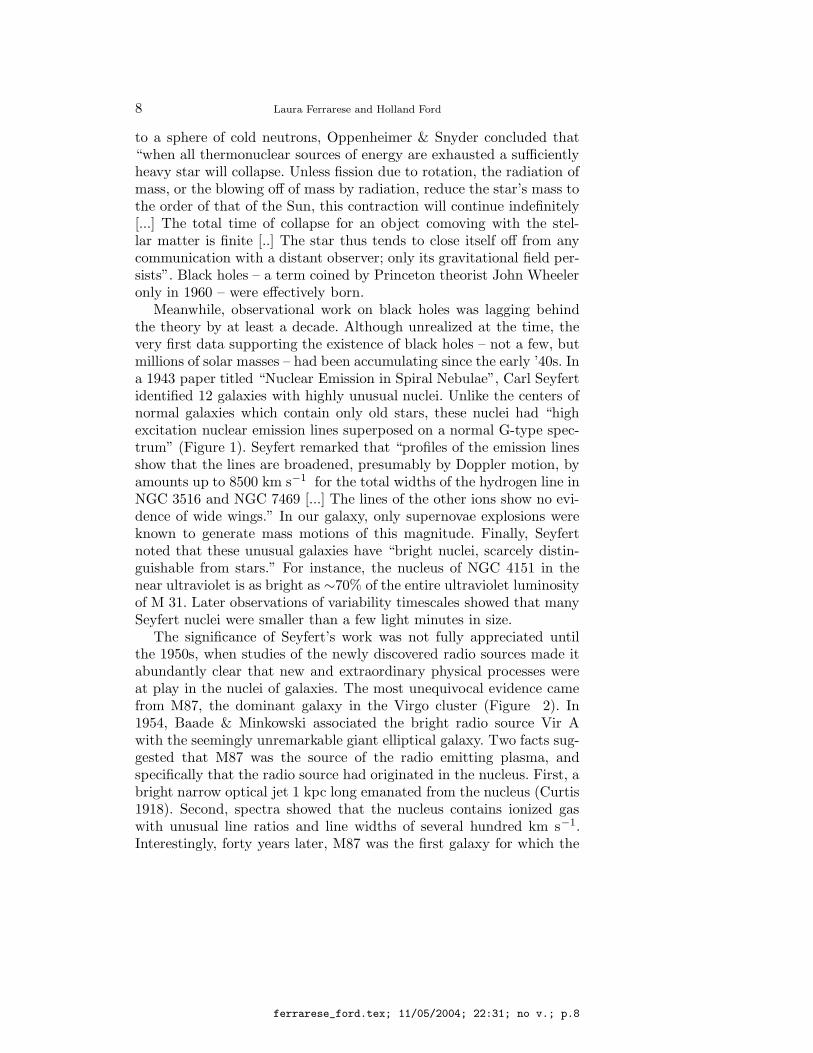
The significance of Seyfert’s work was not fully appreciated untilthe 1950s, when studies of the newly discovered radio sources made itabundantly clear that new and extraordinary physical processes wereat play in the nuclei of galaxies. The most unequivocal evidence camefrom M87, the dominant galaxy in the Virgo cluster (Figure 2). In1954, Baade & Minkowski associated the bright radio source Vir Awith the seemingly unremarkable giant elliptical galaxy. Two facts sug-gested that M87 was the source of the radio emitting plasma, andspecifically that the radio source had originated in the nucleus. First, abright narrow optical jet 1 kpc long emanated from the nucleus (Curtis1918). Second, spectra showed that the nucleus contains ionized gaswith unusual line ratios and line widths of several hundred km s−1.Interestingly, forty years later, M87 was the first galaxy for which the
ferrarese_ford.tex; 11/05/2004; 22:31; no v.; p.8

SUPERMASSIVE BLACK HOLES IN GALACTIC NUCLEI 9
Figure 1. A spectrum of the nucleus of NGC 4151 (top panel), compared to thespectrum of the planetary nebula M2-24 (middle and lower panel), illustrating thesimilarities and differences (broad lines and strong continuum in N4151). NGC 4151spectrum courtesy of W. C. Keel; M2-24 spectrum courtesy of Y. Zhang & X.-W.Liu.
presence of a supermassive black hole was firmly established using theHubble Space Telescope (see § 7; Ford et al. 1994; Harms et al. 1994).
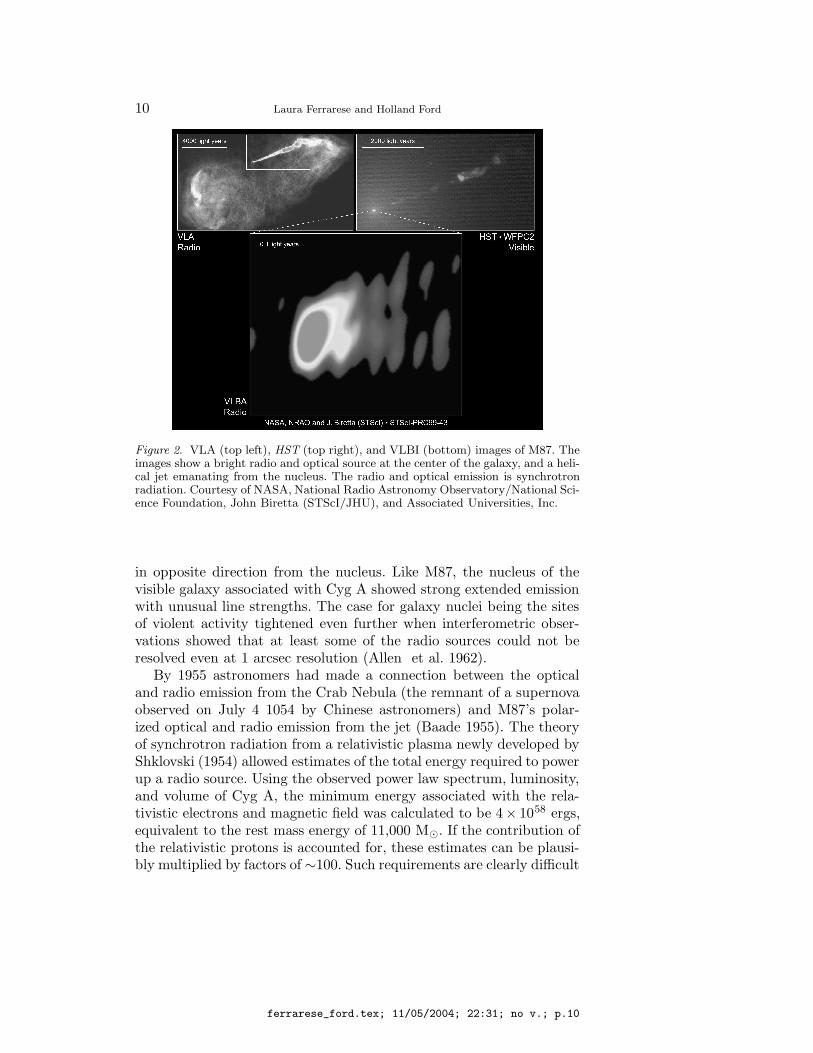
It soon became clear that M87 was far from being an isolated case.In 1953, Jennison & Das Gupta showed that the radio source CygnusA was double (Figure 3). The following year Baade and Minkowski(1954) identified the radio source with a galaxy at the center of a richcluster at z=0.057 (D ∼ 250 Mpc for H0 = 70 km s−1Mpc−1), imply-ing that Cyg A was one of the brightest radio sources in the sky. Theradio emission originated from two lobes on either side of the visibleobject, suggesting that it might be due to relativistic particles ejected
ferrarese_ford.tex; 11/05/2004; 22:31; no v.; p.9
10 Laura Ferrarese and Holland Ford
Figure 2. VLA (top left), HST (top right), and VLBI (bottom) images of M87. Theimages show a bright radio and optical source at the center of the galaxy, and a heli-cal jet emanating from the nucleus. The radio and optical emission is synchrotronradiation. Courtesy of NASA, National Radio Astronomy Observatory/National Sci-ence Foundation, John Biretta (STScI/JHU), and Associated Universities, Inc.
in opposite direction from the nucleus. Like M87, the nucleus of thevisible galaxy associated with Cyg A showed strong extended emissionwith unusual line strengths. The case for galaxy nuclei being the sitesof violent activity tightened even further when interferometric obser-vations showed that at least some of the radio sources could not beresolved even at 1 arcsec resolution (Allen et al. 1962).
By 1955 astronomers had made a connection between the opticaland radio emission from the Crab Nebula (the remnant of a supernovaobserved on July 4 1054 by Chinese astronomers) and M87’s polar-ized optical and radio emission from the jet (Baade 1955). The theoryof synchrotron radiation from a relativistic plasma newly developed byShklovski (1954) allowed estimates of the total energy required to powerup a radio source. Using the observed power law spectrum, luminosity,and volume of Cyg A, the minimum energy associated with the rela-tivistic electrons and magnetic field was calculated to be 4× 1058 ergs,equivalent to the rest mass energy of 11,000 M. If the contribution ofthe relativistic protons is accounted for, these estimates can be plausi-bly multiplied by factors of ∼100. Such requirements are clearly difficult
ferrarese_ford.tex; 11/05/2004; 22:31; no v.; p.10
SUPERMASSIVE BLACK HOLES IN GALACTIC NUCLEI 11
Figure 3. VLA 1.4 6cm image of the bright radio source Cygnus A. The jets transportenergy from the nucleus to the radio lobes at distance of ∼220 Kpc, before beingstopped by the intergalactic medium surrounding the galaxy. Image courtesy ofNRAO/AUI
to reconcile with any classical power source, once the small physical sizeof the nuclei is folded in.
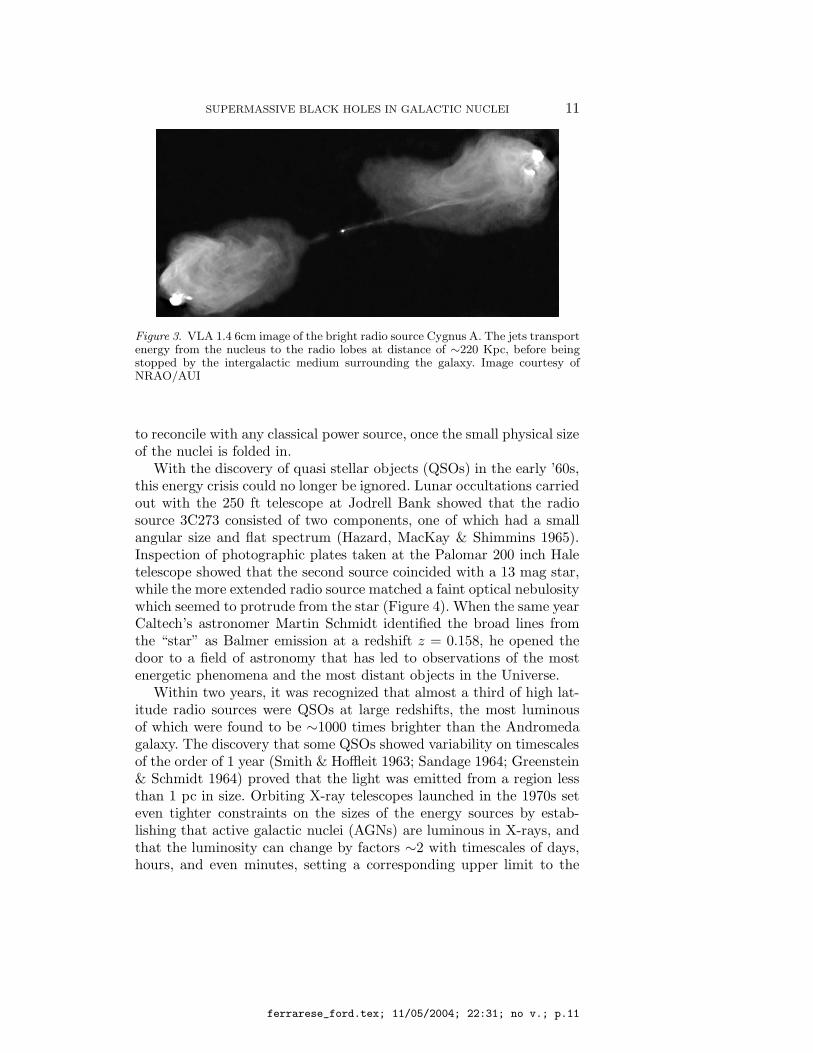
With the discovery of quasi stellar objects (QSOs) in the early ’60s,this energy crisis could no longer be ignored. Lunar occultations carriedout with the 250 ft telescope at Jodrell Bank showed that the radiosource 3C273 consisted of two components, one of which had a smallangular size and flat spectrum (Hazard, MacKay & Shimmins 1965).Inspection of photographic plates taken at the Palomar 200 inch Haletelescope showed that the second source coincided with a 13 mag star,while the more extended radio source matched a faint optical nebulositywhich seemed to protrude from the star (Figure 4). When the same yearCaltech’s astronomer Martin Schmidt identified the broad lines fromthe “star” as Balmer emission at a redshift z = 0.158, he opened thedoor to a field of astronomy that has led to observations of the mostenergetic phenomena and the most distant objects in the Universe.
Within two years, it was recognized that almost a third of high lat-itude radio sources were QSOs at large redshifts, the most luminousof which were found to be ∼1000 times brighter than the Andromedagalaxy. The discovery that some QSOs showed variability on timescalesof the order of 1 year (Smith & Hoffleit 1963; Sandage 1964; Greenstein& Schmidt 1964) proved that the light was emitted from a region lessthan 1 pc in size. Orbiting X-ray telescopes launched in the 1970s seteven tighter constraints on the sizes of the energy sources by estab-lishing that active galactic nuclei (AGNs) are luminous in X-rays, andthat the luminosity can change by factors ∼2 with timescales of days,hours, and even minutes, setting a corresponding upper limit to the
ferrarese_ford.tex; 11/05/2004; 22:31; no v.; p.11
12 Laura Ferrarese and Holland Ford
Figure 4. A pair of Hubble Space Telescope images of the quasar 3C 273, taken withthe Wide Field and Planetary Camera 2 (left), and the Advanced Camera for Surveys(right). In the latter image, the bright nucleus was placed behind an occulting finger,to reveal the light from the host galaxy. The WFPC2 image clearly shows the opticalsynchrotron jet extending 50 Kpc from the nucleus. For comparison, the jet in M87is only 2 kpc long.
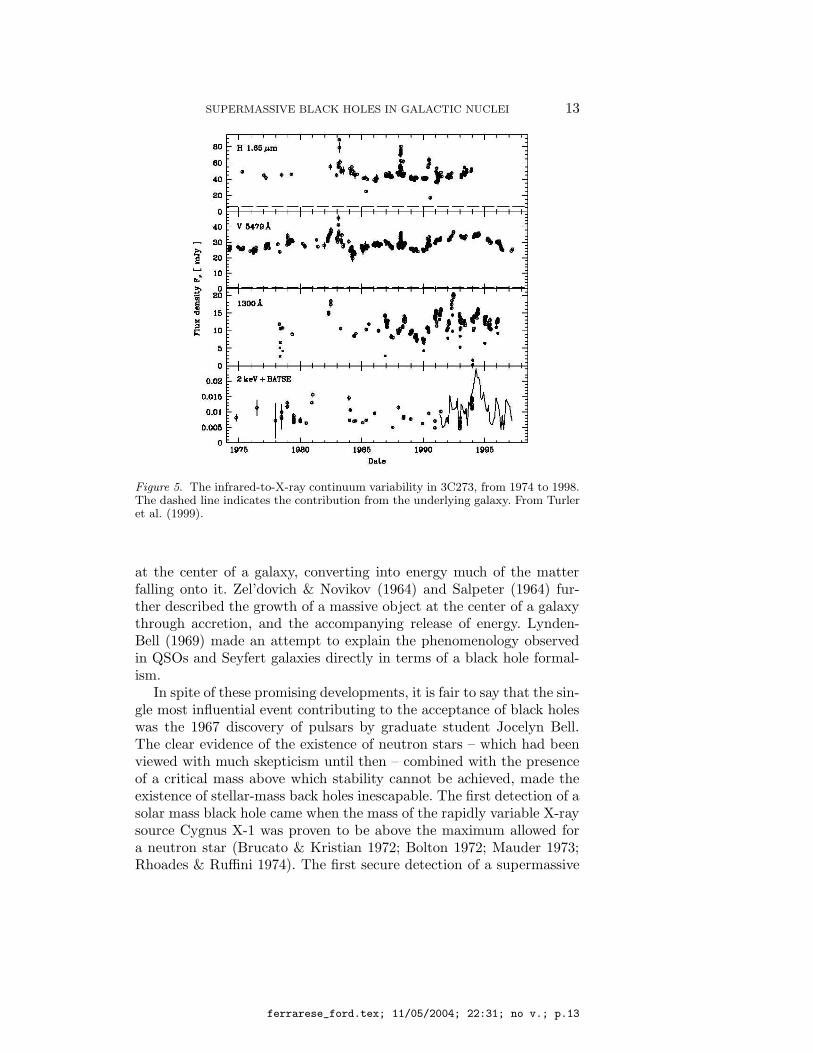
size of the central engine (Figure 5). If the engines are massive blackholes, the relationship between the Schwarzchild radius and the blackhole mass opens the possibility of setting an upper limit to the latterfrom the variation timescale.
Since the early 1960s there was much speculation about how theobserved luminosities could be produced within such a small region.Thermonuclear reactions, which have efficiencies of 0.7% at best (inthe case of fusion of H into He), were quickly eliminated. Speculationsconcentrated on runaway explosions triggered by supernovae outburstsin a cluster of tightly packed stars (Burbridge 1962), the collapse anddisintegration of a 105 − 108 M star (Hoyle and Fowler 1963; theauthors note that “The concept of stellar-type objects with masses upto 108M is of course strange, but the very nature of the case demandsan unusual physical situation”), rapid star formation in a newly borngalaxy (Field 1964), and energy generated in galaxy collisions (Har-rower 1960). By the 1963 Texas symposium (Robinson et al. 1965),much pondering was given to the idea that the energy source was grav-itational. For example, Wheeler envisioned a gravitational singularity
ferrarese_ford.tex; 11/05/2004; 22:31; no v.; p.12
SUPERMASSIVE BLACK HOLES IN GALACTIC NUCLEI 13
Figure 5. The infrared-to-X-ray continuum variability in 3C273, from 1974 to 1998.The dashed line indicates the contribution from the underlying galaxy. From Turleret al. (1999).
at the center of a galaxy, converting into energy much of the matterfalling onto it. Zel’dovich & Novikov (1964) and Salpeter (1964) fur-ther described the growth of a massive object at the center of a galaxythrough accretion, and the accompanying release of energy. Lynden-Bell (1969) made an attempt to explain the phenomenology observedin QSOs and Seyfert galaxies directly in terms of a black hole formal-ism.
In spite of these promising developments, it is fair to say that the sin-gle most influential event contributing to the acceptance of black holeswas the 1967 discovery of pulsars by graduate student Jocelyn Bell.The clear evidence of the existence of neutron stars – which had beenviewed with much skepticism until then – combined with the presenceof a critical mass above which stability cannot be achieved, made theexistence of stellar-mass back holes inescapable. The first detection of asolar mass black hole came when the mass of the rapidly variable X-raysource Cygnus X-1 was proven to be above the maximum allowed fora neutron star (Brucato & Kristian 1972; Bolton 1972; Mauder 1973;Rhoades & Ruffini 1974). The first secure detection of a supermassive
ferrarese_ford.tex; 11/05/2004; 22:31; no v.; p.13
14 Laura Ferrarese and Holland Ford
black hole in a galactic nucleus trailed twenty years behind. How itcame about, and what SBHs tell us about galaxy formation and evo-lution, will be the subject of the remainder of this review.
4. CURRENT STATUS OF SUPERMASSIVE BLACKHOLE SEARCHES: AN OVERVIEW
A SBH which forms or grows in a galactic nucleus will produce a cuspin the stellar density (Peebles 1972; Young 1980; Quinlan, Hernquist, &Sigurdsson 1995; van der Marel 1999). Unfortunately, as demonstratedvery effectively by Kormendy & Richstone (1995), the growth, or eventhe presence of a SBH is not a necessary condition for a “light cusps” toform. Moreover, even when originally present, central density cusps canbe destroyed during galaxy mergers, as a consequence of the hardeningof the SBH binary which forms at the center of the merger product(Milosavljevic & Merritt 2001).
The dynamical signature imprinted by a SBH on the motion of sur-rounding matter is, however, unique. Within the sphere of influence,a Keplerian rotation or velocity dispersion of stars or gas is unam-biguous proof of the existence of a central mass concentration. Theultimate test as to its nature (a singularity or a dense star cluster?)can only reside in the detection of relativistic velocities within a fewSchwarzschild radii. Only observations of the Fe Kα emission line inType 1 AGNs might give us a change of peering within the relativisticregime of a SBH (Table I and § 8.2), although this is still consideredto be a controversial issue.
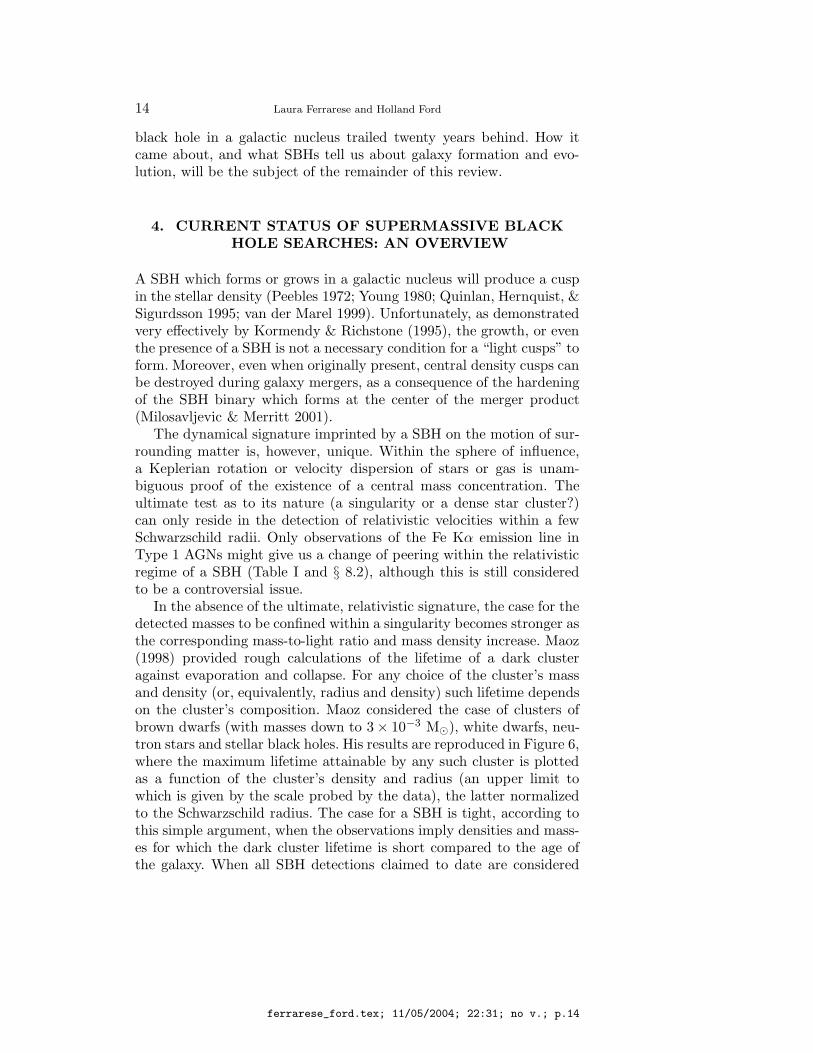
In the absence of the ultimate, relativistic signature, the case for thedetected masses to be confined within a singularity becomes stronger asthe corresponding mass-to-light ratio and mass density increase. Maoz(1998) provided rough calculations of the lifetime of a dark clusteragainst evaporation and collapse. For any choice of the cluster’s massand density (or, equivalently, radius and density) such lifetime dependson the cluster’s composition. Maoz considered the case of clusters ofbrown dwarfs (with masses down to 3 × 10⁻³ M), white dwarfs, neu-tron stars and stellar black holes. His results are reproduced in Figure 6,where the maximum lifetime attainable by any such cluster is plottedas a function of the cluster’s density and radius (an upper limit towhich is given by the scale probed by the data), the latter normalizedto the Schwarzschild radius. The case for a SBH is tight, according tothis simple argument, when the observations imply densities and mass-es for which the dark cluster lifetime is short compared to the age ofthe galaxy. When all SBH detections claimed to date are considered
ferrarese_ford.tex; 11/05/2004; 22:31; no v.; p.14
SUPERMASSIVE BLACK HOLES IN GALACTIC NUCLEI 15
Figure 6. The innermost radius (normalized to the Schwarzschild radius) probedby current experiments which have led to the detection of SBHs in nearby galacticnuclei, plotted against the inferred mass density within that region. The detection inthe Milky Way (§ 5.1) is shown as the solid triangle, water maser detections (§ 6) areshown as solid circles, detections based on stellar (§ 5.2) and gas (§ 7) dynamics areshown as open circles and triangles respectively. The solid curves show the maximumlifetime of a dark cluster against collision and evaporation, using the prescription inMaoz (1998), from 104 to 1013 years. The thick solid line represents a lifetime of 15billion years.
(Table II), this condition is verified only in the case of the Milky Way,NGC 4258 and Circinus. For all other galaxies, although we will tacitlyassume for the rest of this paper that the detected masses are indeedSBHs, dark clusters can provide viable explanations.
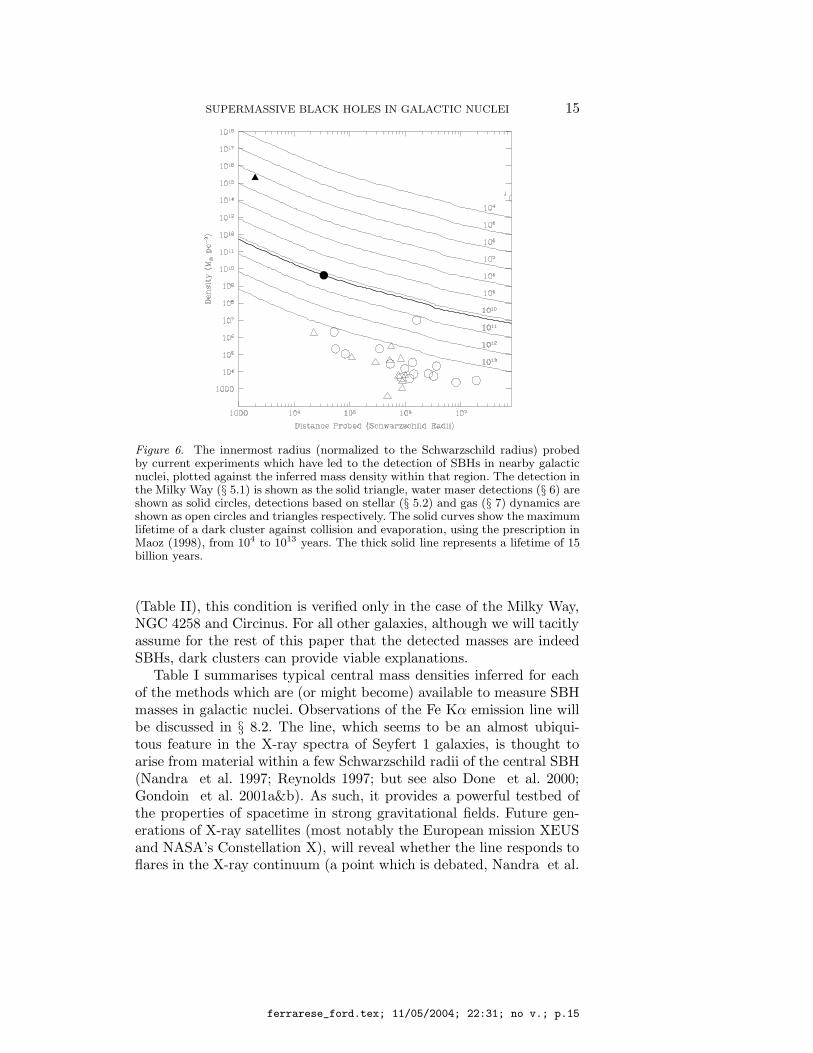
Table I summarises typical central mass densities inferred for eachof the methods which are (or might become) available to measure SBHmasses in galactic nuclei. Observations of the Fe Kα emission line willbe discussed in § 8.2. The line, which seems to be an almost ubiqui-tous feature in the X-ray spectra of Seyfert 1 galaxies, is thought toarise from material within a few Schwarzschild radii of the central SBH(Nandra et al. 1997; Reynolds 1997; but see also Done et al. 2000;Gondoin et al. 2001a&b). As such, it provides a powerful testbed ofthe properties of spacetime in strong gravitational fields. Future gen-erations of X-ray satellites (most notably the European mission XEUSand NASA’s Constellation X), will reveal whether the line responds toflares in the X-ray continuum (a point which is debated, Nandra et al.
ferrarese_ford.tex; 11/05/2004; 22:31; no v.; p.15
16 Laura Ferrarese and Holland Ford
Table I. Probing the Centers of Galaxies
Method & Scale No. of SBH M• Range Typical Densities
Telescope (RS) Detections (M) (M pc−3)
Fe Kα line 3-10 0 N/A N/A
(XEUS, ConX)
Reverberation Mapping 600 36 106 − 4 × 10⁸ >∼ 1010
(Ground based optical)
Stellar Proper Motion 1000 1 4 × 10⁶ 4 × 10¹⁶
(Keck, NTT, VLT)
H2O Megamasers 104 1 4 × 10⁷ 4 × 10⁹
(VLBI)
Gas Dynamics (optical) 106 11 7 × 10⁷ − 4 × 10⁹ ∼ 105
(Mostly HST)
Stellar Dynamics 106 17 107 − 3 × 10⁹ ∼ 105
(Mostly HST)
The columns give all methods which can (or, in the case of the Fe Kα line emission, might)be used to estimate SBH masses, and the telescopes needed for the observations; the typicaldistance from the singularity of the material probed by each method; the number of SBHdetections claimed based on that method; the range in the detected SBH masses; and thecorresponding implied central mass density.
1997; Nandra et al. 1999; Wang et al. 2001; Takahashi et al. 2002).If it does, the mass of the central SBH can conceivably be estimatedusing reverberation mapping techniques (§ 8.3).
In its current application, reverberation mapping (§ 8.3) targets theBroad Line Region (BLR) of Type 1 AGNs (Blandford & McKee 1982;Peterson 1993; Peterson 2002). It is currently the least secure, butpotentially most powerful of the methods which we will discuss, prob-ing material within only a few hundred Schwarzschild radii from thesingularity, a factor 103 closer than can be reached by stellar and gasdynamical studies using HST. As discussed in detail in § 8.3, reverber-ation mapping has so far been unable to test the Keplerian hypothesis.Rather, Keplerian motion is assumed, and a SBH mass derived fromthe observed “average” size and velocity of the BLR. If the methoddoes indeed measure masses (and the evidence that this is indeed thecase is growing stronger by the day), the inferred central densities leaveno doubt that such masses are indeed confined in a singularity.
To date, the only secure detections of SBHs (as opposed to denseclusters of stars or exotic particles) come from stellar proper motion inthe Galactic center and the H2O megamaser study of the nearby Seyfert
ferrarese_ford.tex; 11/05/2004; 22:31; no v.; p.16
SUPERMASSIVE BLACK HOLES IN GALACTIC NUCLEI 17
2 galaxy NGC 4258 (§ 5.1 and § 6 respectively). The applicability ofeither method is however limited (to one galaxy, the Milky Way, in thecase of proper motion studies). The most prolific methods are based onoptical stellar and gas dynamical studies, generally carried out usingthe Hubble Space Telescope (HST, § 5.2 and § 7). On the downside,these methods can rarely reach closer than several million Schwarzschildradii from the singularity; the implied central densities are always farlower than needed to conclude that the mass is indeed collapsed into aSBH.
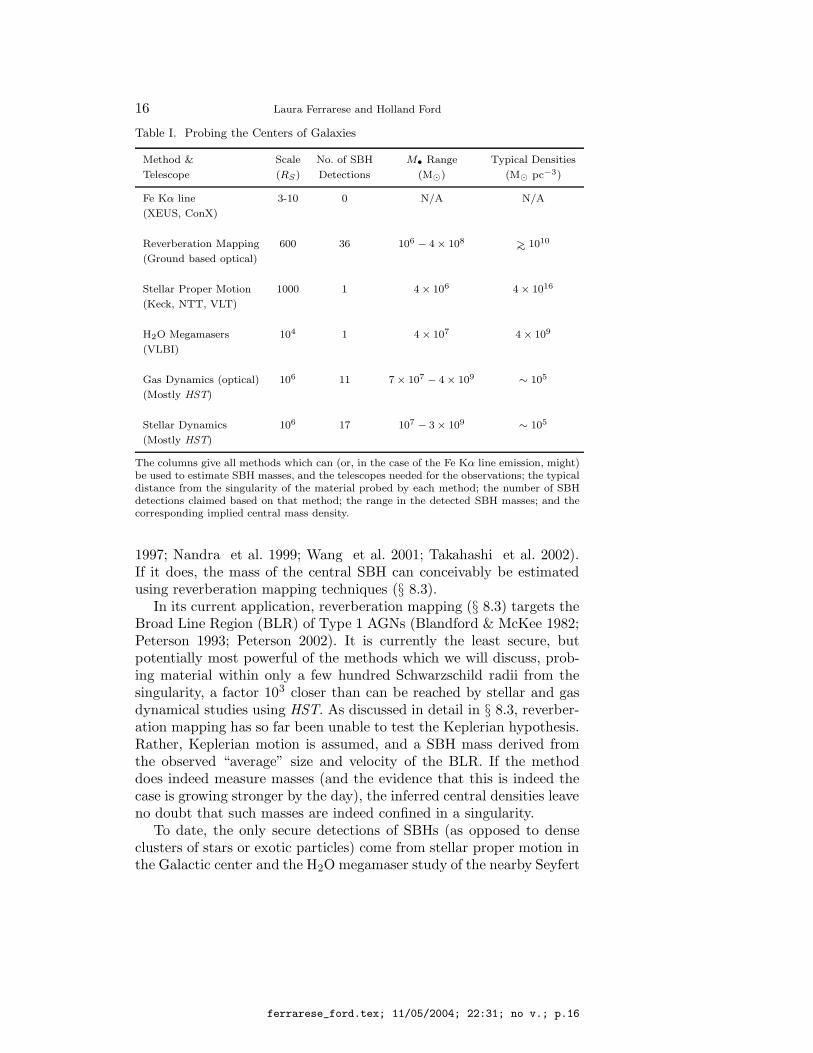
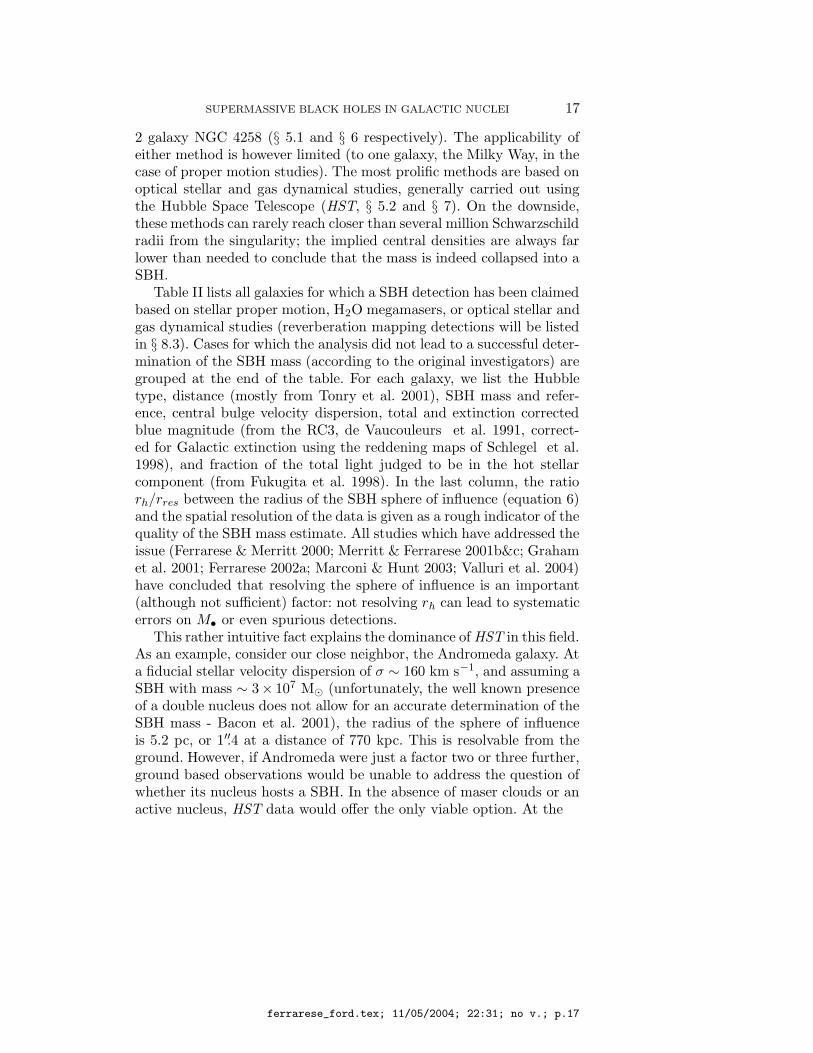
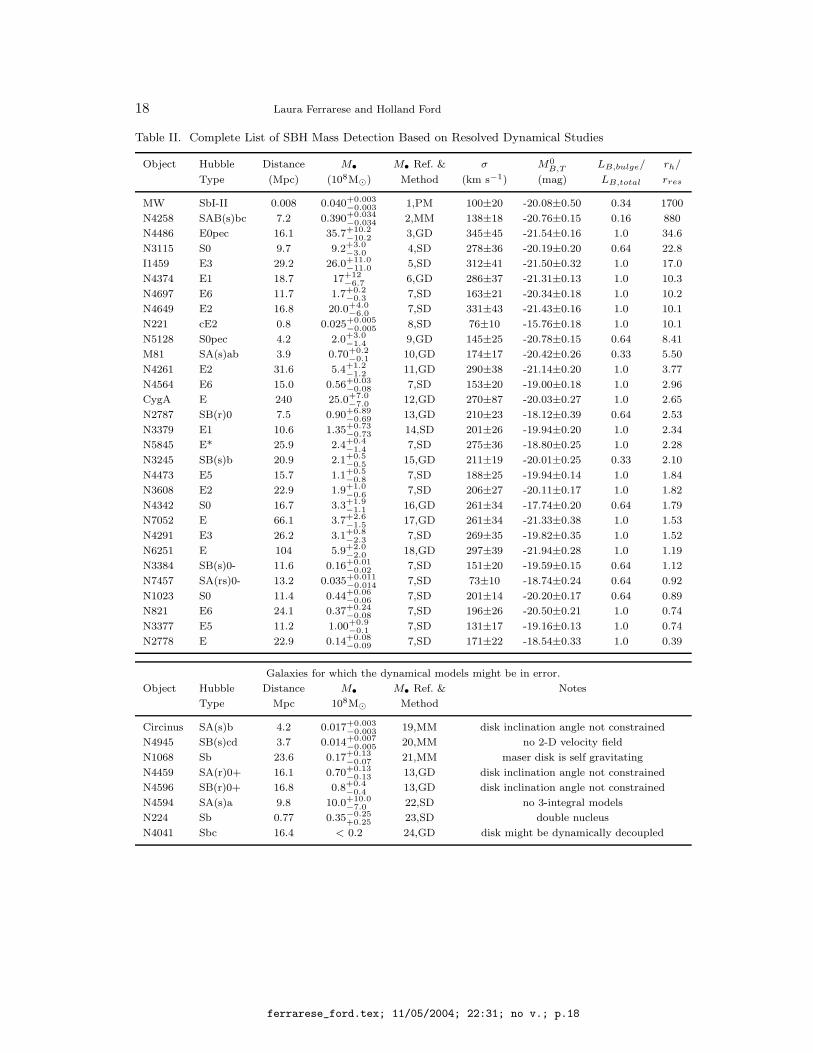
Table II lists all galaxies for which a SBH detection has been claimedbased on stellar proper motion, H2O megamasers, or optical stellar andgas dynamical studies (reverberation mapping detections will be listedin § 8.3). Cases for which the analysis did not lead to a successful deter-mination of the SBH mass (according to the original investigators) aregrouped at the end of the table. For each galaxy, we list the Hubbletype, distance (mostly from Tonry et al. 2001), SBH mass and refer-ence, central bulge velocity dispersion, total and extinction correctedblue magnitude (from the RC3, de Vaucouleurs et al. 1991, correct-ed for Galactic extinction using the reddening maps of Schlegel et al.1998), and fraction of the total light judged to be in the hot stellarcomponent (from Fukugita et al. 1998). In the last column, the ratiorh/rres between the radius of the SBH sphere of influence (equation 6)and the spatial resolution of the data is given as a rough indicator of thequality of the SBH mass estimate. All studies which have addressed theissue (Ferrarese & Merritt 2000; Merritt & Ferrarese 2001b&c; Grahamet al. 2001; Ferrarese 2002a; Marconi & Hunt 2003; Valluri et al. 2004)have concluded that resolving the sphere of influence is an important(although not sufficient) factor: not resolving rh can lead to systematicerrors on M• or even spurious detections.
This rather intuitive fact explains the dominance of HST in this field.As an example, consider our close neighbor, the Andromeda galaxy. Ata fiducial stellar velocity dispersion of σ ∼ 160 km s−1, and assuming aSBH with mass ∼ 3× 10⁷ M (unfortunately, the well known presenceof a double nucleus does not allow for an accurate determination of theSBH mass - Bacon et al. 2001), the radius of the sphere of influenceis 5.2 pc, or 1′′.4 at a distance of 770 kpc. This is resolvable from theground. However, if Andromeda were just a factor two or three further,ground based observations would be unable to address the question ofwhether its nucleus hosts a SBH. In the absence of maser clouds or anactive nucleus, HST data would offer the only viable option. At the
ferrarese_ford.tex; 11/05/2004; 22:31; no v.; p.17
18 Laura Ferrarese and Holland Ford
Table II. Complete List of SBH Mass Detection Based on Resolved Dynamical Studies
Object Hubble Distance M• M• Ref. & σ M0B,T
LB,bulge/ rh/
Type (Mpc) (108M) Method (km s−1) (mag) LB,total rres
MW SbI-II 0.008 0.040+0.003−0.003 1,PM 100±20 -20.08±0.50 0.34 1700
N4258 SAB(s)bc 7.2 0.390+0.034−0.034 2,MM 138±18 -20.76±0.15 0.16 880
N4486 E0pec 16.1 35.7+10.2−10.2
3,GD 345±45 -21.54±0.16 1.0 34.6
N3115 S0 9.7 9.2+3.0−3.0 4,SD 278±36 -20.19±0.20 0.64 22.8
I1459 E3 29.2 26.0+11.0−11.0
5,SD 312±41 -21.50±0.32 1.0 17.0
N4374 E1 18.7 17+12
−6.76,GD 286±37 -21.31±0.13 1.0 10.3
N4697 E6 11.7 1.7+0.2−0.3 7,SD 163±21 -20.34±0.18 1.0 10.2
N4649 E2 16.8 20.0+4.0−6.0
7,SD 331±43 -21.43±0.16 1.0 10.1
N221 cE2 0.8 0.025+0.005−0.005
8,SD 76±10 -15.76±0.18 1.0 10.1
N5128 S0pec 4.2 2.0+3.0−1.4 9,GD 145±25 -20.78±0.15 0.64 8.41
M81 SA(s)ab 3.9 0.70+0.2−0.1
10,GD 174±17 -20.42±0.26 0.33 5.50
N4261 E2 31.6 5.4+1.2−1.2
11,GD 290±38 -21.14±0.20 1.0 3.77
N4564 E6 15.0 0.56+0.03−0.08 7,SD 153±20 -19.00±0.18 1.0 2.96
CygA E 240 25.0+7.0−7.0
12,GD 270±87 -20.03±0.27 1.0 2.65
N2787 SB(r)0 7.5 0.90+6.89−0.69 13,GD 210±23 -18.12±0.39 0.64 2.53
N3379 E1 10.6 1.35+0.73−0.73 14,SD 201±26 -19.94±0.20 1.0 2.34
N5845 E* 25.9 2.4+0.4−1.4
7,SD 275±36 -18.80±0.25 1.0 2.28
N3245 SB(s)b 20.9 2.1+0.5−0.5 15,GD 211±19 -20.01±0.25 0.33 2.10
N4473 E5 15.7 1.1+0.5−0.8 7,SD 188±25 -19.94±0.14 1.0 1.84
N3608 E2 22.9 1.9+1.0−0.6
7,SD 206±27 -20.11±0.17 1.0 1.82
N4342 S0 16.7 3.3+1.9−1.1 16,GD 261±34 -17.74±0.20 0.64 1.79
N7052 E 66.1 3.7+2.6−1.5
17,GD 261±34 -21.33±0.38 1.0 1.53
N4291 E3 26.2 3.1+0.8−2.3
7,SD 269±35 -19.82±0.35 1.0 1.52
N6251 E 104 5.9+2.0−2.0 18,GD 297±39 -21.94±0.28 1.0 1.19
N3384 SB(s)0- 11.6 0.16+0.01−0.02
7,SD 151±20 -19.59±0.15 0.64 1.12
N7457 SA(rs)0- 13.2 0.035+0.011−0.014
7,SD 73±10 -18.74±0.24 0.64 0.92
N1023 S0 11.4 0.44+0.06−0.06 7,SD 201±14 -20.20±0.17 0.64 0.89
N821 E6 24.1 0.37+0.24−0.08
7,SD 196±26 -20.50±0.21 1.0 0.74
N3377 E5 11.2 1.00+0.9−0.1 7,SD 131±17 -19.16±0.13 1.0 0.74
N2778 E 22.9 0.14+0.08−0.09 7,SD 171±22 -18.54±0.33 1.0 0.39
Galaxies for which the dynamical models might be in error.
Object Hubble Distance M• M• Ref. & Notes
Type Mpc 108M Method
Circinus SA(s)b 4.2 0.017+0.003−0.003 19,MM disk inclination angle not constrained
N4945 SB(s)cd 3.7 0.014+0.007−0.005
20,MM no 2-D velocity field
N1068 Sb 23.6 0.17+0.13−0.07 21,MM maser disk is self gravitating
N4459 SA(r)0+ 16.1 0.70+0.13−0.13 13,GD disk inclination angle not constrained
N4596 SB(r)0+ 16.8 0.8+0.4−0.4
13,GD disk inclination angle not constrained
N4594 SA(s)a 9.8 10.0+10.0−7.0 22,SD no 3-integral models
N224 Sb 0.77 0.35−0.25+0.25
23,SD double nucleus
N4041 Sbc 16.4 < 0.2 24,GD disk might be dynamically decoupled
ferrarese_ford.tex; 11/05/2004; 22:31; no v.; p.18
SUPERMASSIVE BLACK HOLES IN GALACTIC NUCLEI 19
Notes to Table II: The columns give the galaxy’s Hubble type; distance (from Tonry et
al. 2001 whenever available; derived from the heliocentric systemic velocity and H0 = 75
km s−1 Mpc−1 in all other cases); black hole mass, reference (coded below) and method
of detection (PM = stellar proper motion, GD= gas dynamics, SD = stellar dynamics,
MM = H2O megamasers); central bulge velocity dispersion; total, extinction corrected blue
magnitude (from the RC3, de Vaucouleurs et al. 1991, corrected for Galactic extinction
using the reddening maps of Schlegel et al. 1998); fraction of the total light judged to be
in the hot stellar component (from Fukugita et al. 1998); the ratio of the diameter of the
SBH sphere of influence to the spatial resolution of the data. References: 1. Ghez et al.
2003 – 2. Miyoshi et al. 1995 – 3. Macchetto et al. 1997 – 4. Emsellem et al. 1999 – 5.
Cappellari et al. 2002 – 6. Bower et al. 1998 – 7. Gebhardt et al. 2003 – 8. Verolme et al.
2002 – 9. Marconi et al. 2001 – 10. Devereux et al. 2003 – 11. Ferrarese et al. 1996 –
12. Tadhunter et al. 2003 – 13. Sarzi et al. 2001 – 14. Gebhardt et al. 2000a – 15. Barth
et al. 2001 – 16. Cretton & van den Bosch 1999– 17. van der Marel & van den Bosch 1998 –
18. Ferrarese & Ford 1999 – 19. Greenhill et al. 2003 – 20. Greenhill, Moran & Herrnstein
1997 – 21. Greenhill et al. 1996 – 22. Kormendy et al. 1988 – 23. Bacon et al. 2001 – 24.
Marconi et al. 2003.
distance of the Virgo cluster, 15 Mpc, the sphere of influence of a∼ 3 × 10⁷ M SBH would shrink to a projected radius of 0′′.07, notonly well beyond the reach of any ground based telescope, beyond evenHST capabilities. Overall, as will be discussed in § 11, the number ofgalaxies for which the SBH sphere of influence can be resolved withground-based optical observations can be counted on the fingers of onehand. HST has enabled that number to be increased by well over anorder of magnitude.
5. STELLAR DYNAMICAL STUDIES
5.1. A Special Case: The Galactic Center
The case for a massive object at the Galactic Center has been buildingsince the 1970’s detection of strong radio emission originating from theinnermost 1-pc (Balick & Brown 1974; Ekers et al. 1975). Not only isthe source, dubbed Sgr A∗, extremely compact (VLBI observations at86 GHz set a tight upper limit of 1 A.U. to its size, Doeleman et al.2001), but the absence of any appreciable proper motion implies thatit must also be very massive. In the most recent study on the subject,Reid et al. (2003) argue that Sgr A∗ must be in excess of 4 × 10⁵
M, thus excluding that it might consist of a compact cluster of stellarobjects. Because of its proximity (8.0±0.4 kpc, Eisenhauer et al. 2003),the Galactic Center can be studied at a level of detail unimaginable in
ferrarese_ford.tex; 11/05/2004; 22:31; no v.; p.19
20 Laura Ferrarese and Holland Ford
any other galaxy. Proper motions of the star cluster surrounding SgrA∗ can be detected using near infrared speckle imaging techniques. On-going monitoring studies, conducted for the past ten years at the ESONTT and Keck Telescope first, and at the ESO VLT more recently,have reached a staggering 0′′.003 (0.1 mpc) astrometric accuracy in thestellar positions (Eckart et al. 1993; Ghez et al. 1998; Ghez et al.2000; Schodel et al. 2003; Ghez et al. 2003): proper motion has beenmeasured for over 40 stars within 1′′.2 of Sgr A∗; deviations from linearmotion has been detected for eight stars and four stars in particularhave passed the pericenter of their orbits since monitoring began (Ghezet al. 2003; Schodel et al. 2003). In the three cases for which accurateorbits can be traced, the stars orbit Sgr A∗ with periods between 15and 71 years, reaching as close as 87 A.U. from the central source.Using a simultaneous multi-orbital solution, Ghez et al. (2003) derivea best fit central mass of (4.0 ± 0.3) × 106 M. The implied centralmass density of 4×10¹⁶ M Mpc−3, provides virtually incontrovertibleevidence that the mass is indeed in the form of a singularity.
An excellent review of the nature and observations of Sgr A∗ canbe found in Melia & Falcke (2001), to which we refer the reader for adetailed discussion.
5.2. Integrated Stellar Dynamics
Modeling the kinematics of stars in galactic nuclei has historically beenthe method of choice to constrain the central potential, and for goodreasons: stars are always present, and their motion is always gravita-tional. But, as for every method, downsides also exists. Stellar absorp-tion lines are faint and the central surface brightness, especially inbright ellipticals, is low (Crane et al. 1993; Ferrarese et al. 1994;Lauer et al. 1995; Rest et al. 2001). Acquiring stellar kinematicaldata therefore often entails walking a fine line between the need forhigh spatial resolution and the need for high spectral signal-to-noise:the latter benefits from the large collective area of ground based tele-scopes, while the former demands the use of HST in all but a handful ofcases. Theoretical challenges arise from the fact that the stellar orbitalstructure is unknown and difficult to recover from the observables.Although dynamical models have reached a high degree of sophistica-tion (Verolme et al. 2002; Gebhardt et al. 2003; van de Ven et al. 2003),the biases and systematics which might affect them have not been fullyinvestigated and could be severe (Valluri, Merritt & Emsellem 2004).For the rest of this section, we will explore in detail some of the issuesrelated to stellar dynamical modeling.
ferrarese_ford.tex; 11/05/2004; 22:31; no v.; p.20
SUPERMASSIVE BLACK HOLES IN GALACTIC NUCLEI 21
Unlike globular clusters (e.g. Binney & Tremaine 1987), and withthe possible exception of unusually dense galactic nuclei – M32 andNGC205 could be such cases – stars in a galaxy have not had enoughtime to become aware of each other’s individual existence. Putting itmore rigorously, both the characteristic crossing time tc, and the galaxyage, are much shorter (typically by a factor 108 and 106 respectively)than the relaxation time, trel, defined as the characteristic timescaleover which, due to the cumulative effects of stellar encounters, a typ-ical star acquires a transverse velocity equal to its initial velocity. Tovery good approximation, therefore, galaxies can be treated as colli-sionless stellar systems: each star can be thought of as moving in thecombined gravitational potential Φ(~x, t) of all other stars. This makesit possible to describe the system analytically, while the dynamics ofglobular clusters, for instance, must be studied with the aid of numeri-cal simulations. The distribution function f(~x,~v, t) (DF), defined as thenumber of stars which occupy a given infinitesimal volume in phase-space, obeys a continuity equation, i.e. the rate of change of the numberof stars within a given phase space volume is equal to the amount ofinflow minus the amount of outflow:
δf
δt+ ~v · ~∇f − ~∇Φ(~x, t) ·
δf
δ~v= 0 (7)
Equation 12 is known as the Collisionless Boltzmann Equation (CBE).Φ(~x, t) is linked to the total mass density ρ by the Poisson equation:
∇2Φ(~x, t) = 4πGρ(~x, t) (8)
In the above equation, ρ comprises all mass present within the sys-tem, including not only stars, but also SBHs and dark matter, if present.
Modulo a multiplicative factor (the stellar mass-to-light ratio), thestellar mass density and the six components of the streaming velocityand velocity dispersion involve integrals of the DF in velocity space.This implies that the DF can be reconstructed given the stellar massdensity and velocity tensor. Once the DF is known, the total gravi-tational potential follows from the CBE, and the total mass density(and hence the SBH mass, if the stellar mass density is known) fromPoisson’s equation.
Unfortunately, not all seven variables can be extracted from obser-vational data: galaxies’ images and spectra contain information on theprojected surface brightness profile and the integrated, line of sightvelocity and velocity dispersion only. It is only at the cost of makingfurther simplification that the CBE and Poisson’s equations can besolved analytically. For instance, if there are grounds to believe that
ferrarese_ford.tex; 11/05/2004; 22:31; no v.; p.21
22 Laura Ferrarese and Holland Ford
the system is in a steady state (i.e. all time derivatives are null), spher-ically symmetric, and isotropic, the first velocity moment of the CBEbecomes:
GM(r) = −rσ2r
[
dlnν
dlnr+
dlnσ2r
dlnr
]
(9)
where σ2r is the velocity dispersion, and ν is the stellar mass density.
Both are related to the surface brightness profile and the line of sightvelocity dispersion through Abel integrals which can be easily inverted;therefore equation 9 can be solved analytically to derive M(r).
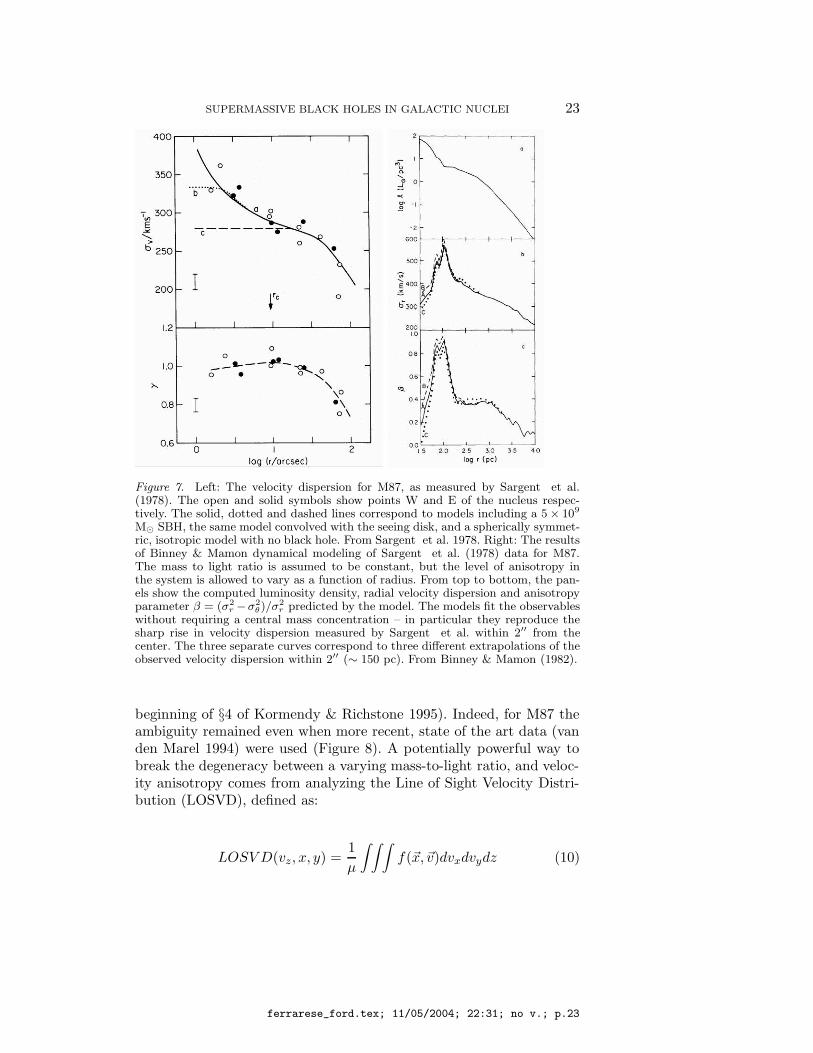
The first attempts to use morphological and dynamical data to con-strain the presence of a central mass were indeed based on Equation9: assuming an isotropic, spherically symmetric system, Sargent et al.(1978) “detected” a central ∼ 5 × 10⁹ M dark mass within the inner110 pc of M87 (Figure 7). But how much does this result depend on theassumptions of sphericity and isotropy? Like all giant ellipticals, M87does not appreciably rotate, and is well described (at least in the innerparts) by a spherical system. However, the assumption of isotropy isunfounded. The ratio between velocity dispersion and circular velocityin massive ellipticals is far higher than predicted for an isotropic model(Illingworth 1977), implying that these systems are supported by ananisotropic velocity tensor. Relaxing the assumption of isotropy drasti-cally alters the dynamical models. The Sargent et al. data were rean-alyzed by Binney & Mamon (1982), and later Richstone & Tremaine(1985). Both groups lifted the assumption of isotropy. To still be ableto solve the CBE analytically, if isotropy is not assumed, some otherrestrictions must be imposed on the system. In the specific case of M87,the mass to light ratio was constrained to be constant throughout thegalaxy. The model which is able to fit the data has a mass to lightratio of 7.6 (in the V −band), plausible for a stellar system, and a high-ly anisotropic velocity dispersion in the inner 300 pc (Figure 7). Thisis easy to understand: a highly radial velocity dispersion will mimic anincrease in the observed line of sight velocity dispersion in the centralregions (as the presence of a central dark object would) since, comparedto the isotropic case, the space-volume sampled by the data includesmore radially directed stars moving closely along the line of sight.
Although the Binney & Mamon model has not been tested fordynamical stability – indeed, no anisotropic dynamical models of galac-tic nuclei have – the example serves to illustrate the difficulty in mod-eling stellar kinematical data. It is important to realize that, especial-ly for non rotating, giant ellipticals, such difficulty cannot be rootedout given the observables (see also the illuminating discussion at the
ferrarese_ford.tex; 11/05/2004; 22:31; no v.; p.22
SUPERMASSIVE BLACK HOLES IN GALACTIC NUCLEI 23
Figure 7. Left: The velocity dispersion for M87, as measured by Sargent et al.(1978). The open and solid symbols show points W and E of the nucleus respec-tively. The solid, dotted and dashed lines correspond to models including a 5 × 10⁹
M SBH, the same model convolved with the seeing disk, and a spherically symmet-ric, isotropic model with no black hole. From Sargent et al. 1978. Right: The resultsof Binney & Mamon dynamical modeling of Sargent et al. (1978) data for M87.The mass to light ratio is assumed to be constant, but the level of anisotropy inthe system is allowed to vary as a function of radius. From top to bottom, the pan-els show the computed luminosity density, radial velocity dispersion and anisotropyparameter β = (σ2
r −σ2θ)/σ2
r predicted by the model. The models fit the observableswithout requiring a central mass concentration – in particular they reproduce thesharp rise in velocity dispersion measured by Sargent et al. within 2′′ from thecenter. The three separate curves correspond to three different extrapolations of theobserved velocity dispersion within 2′′ (∼ 150 pc). From Binney & Mamon (1982).
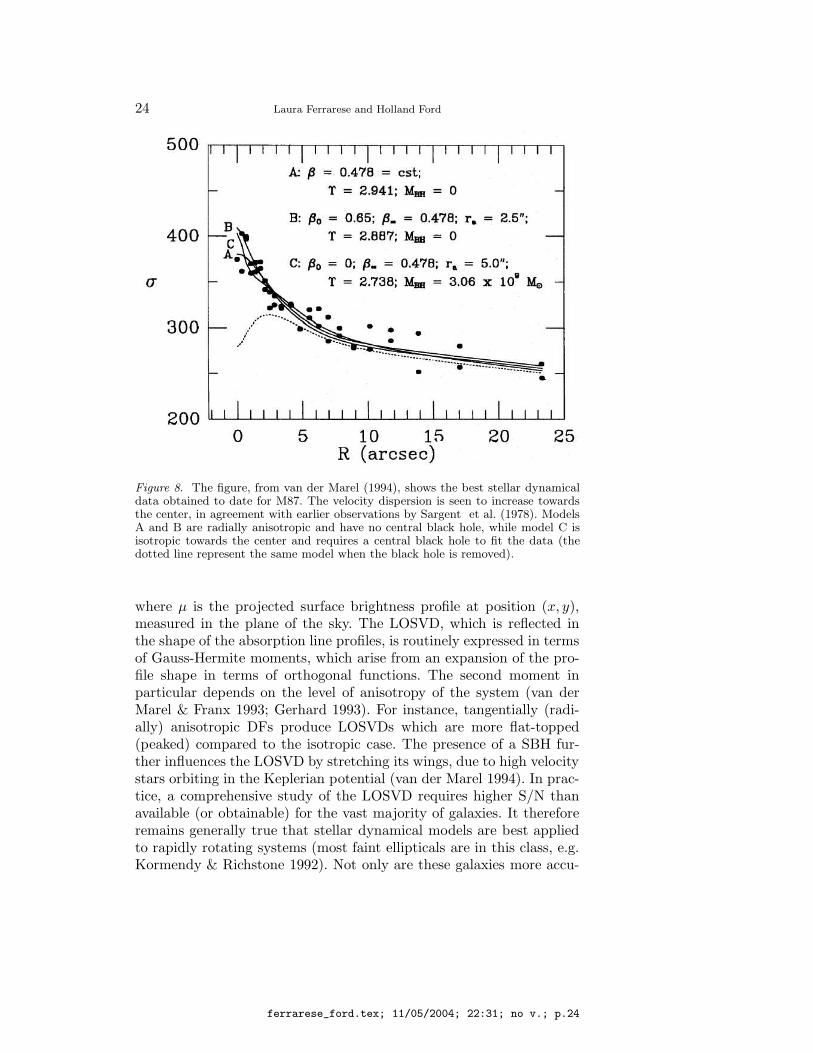
beginning of §4 of Kormendy & Richstone 1995). Indeed, for M87 theambiguity remained even when more recent, state of the art data (vanden Marel 1994) were used (Figure 8). A potentially powerful way tobreak the degeneracy between a varying mass-to-light ratio, and veloc-ity anisotropy comes from analyzing the Line of Sight Velocity Distri-bution (LOSVD), defined as:
LOSV D(vz, x, y) =1
µ
∫ ∫ ∫
f(~x,~v)dvxdvydz (10)
ferrarese_ford.tex; 11/05/2004; 22:31; no v.; p.23
24 Laura Ferrarese and Holland Ford
Figure 8. The figure, from van der Marel (1994), shows the best stellar dynamicaldata obtained to date for M87. The velocity dispersion is seen to increase towardsthe center, in agreement with earlier observations by Sargent et al. (1978). ModelsA and B are radially anisotropic and have no central black hole, while model C isisotropic towards the center and requires a central black hole to fit the data (thedotted line represent the same model when the black hole is removed).
where µ is the projected surface brightness profile at position (x, y),measured in the plane of the sky. The LOSVD, which is reflected inthe shape of the absorption line profiles, is routinely expressed in termsof Gauss-Hermite moments, which arise from an expansion of the pro-file shape in terms of orthogonal functions. The second moment inparticular depends on the level of anisotropy of the system (van derMarel & Franx 1993; Gerhard 1993). For instance, tangentially (radi-ally) anisotropic DFs produce LOSVDs which are more flat-topped(peaked) compared to the isotropic case. The presence of a SBH fur-ther influences the LOSVD by stretching its wings, due to high velocitystars orbiting in the Keplerian potential (van der Marel 1994). In prac-tice, a comprehensive study of the LOSVD requires higher S/N thanavailable (or obtainable) for the vast majority of galaxies. It thereforeremains generally true that stellar dynamical models are best appliedto rapidly rotating systems (most faint ellipticals are in this class, e.g.Kormendy & Richstone 1992). Not only are these galaxies more accu-
ferrarese_ford.tex; 11/05/2004; 22:31; no v.; p.24
SUPERMASSIVE BLACK HOLES IN GALACTIC NUCLEI 25
rately described as isotropic systems (Illingworth 1977) but also, asthe streaming velocity becomes the dominant kinematical component,terms involving the velocity dispersion play only a second order effectin the CBE. The most extreme cases of such systems are galaxies host-ing small nuclear stellar disks, a not uncommon occurrence especiallyin late type ellipticals (Kormendy & Richstone 1992; Scorza & Bender1995; van den Bosch & de Zeeuw 1996; van den Bosch, Jaffe & vander Marel 1998; Cretton & van den Bosch 1999). Van den Bosch &de Zeeuw (1996) find that if such a galaxy hosts a sufficiently massiveSBH, the wing of the bulge-dominated LOSVD will show a clear signa-ture of the fast rotation of the disk. Unfortunately, for this to happen,the mass of the SBH needs to be a few percent of the mass of the hotstellar component, at least a factor 10 larger than has been measured(§ 10).
Since the 1978 work of Sargent et al. , the level of sophistication ofthe dynamical models applied to stellar kinematics has been improvingsteadily. The complexity of the models is reflected in the complexityof the distribution function needed to describe the data. For instance,the DF of a spherical, isotropic system depends only on one integralof motion, the total energy of the system. The assumption of isotropymakes it possible to have a one-to-one correspondence between massdensity ρ(r) and distribution function: given ρ(r) (which can be deter-mined from the data once a stellar-mass-to-light ratio γstar and, for ourapplication, a central dark mass M• are assumed), it is always possibleto find analytically a DF which self-consistently generates ρ(r) (andvice-versa). Once the DF is known, the velocity dispersion can be pre-dicted uniquely. It follows that it is always possible to determine thevalues of γstar and M• which best fit the observables. As mentionedearlier, whether these values actually describe the real galaxy hingescritically on whether the assumptions do, which should not be takenfor granted.
If the velocity dispersion is anisotropic, the DF must depend on atleast two integrals of motion; in the simplest case f = f(E,Lz), whereLz is the vertical component of the angular momentum. Such a DF canbe fully constrained provided that the mass density and the tangentialcomponent of the streaming motion vθ are known. As in the sphericalisotropic case, therefore, the mean square velocity (velocity dispersionand streaming motion) can be uniquely predicted in any given gravi-tational potential. Two-integral (2I) models are handled through theJeans equations, which relate the second order of the velocity momentsto the potential and density of the stellar system. The procedure followsthe steps below:
ferrarese_ford.tex; 11/05/2004; 22:31; no v.; p.25
26 Laura Ferrarese and Holland Ford
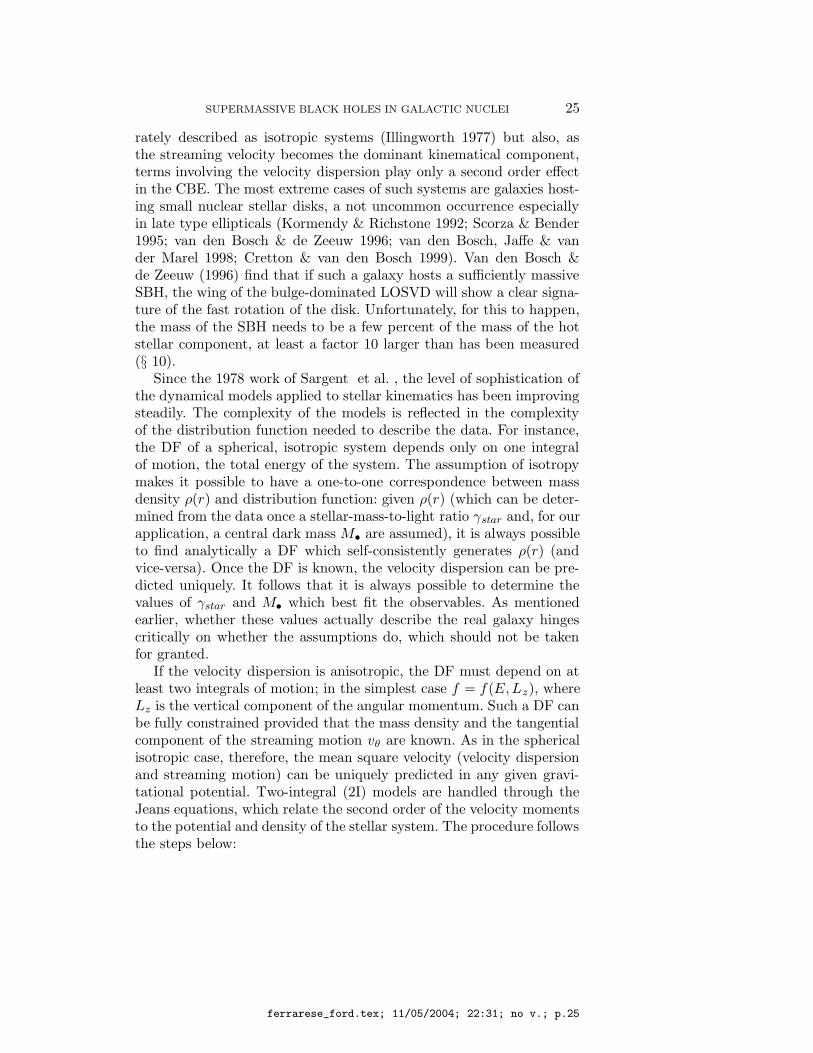
1. Deproject the observed 2-D surface brightness profile to derive theunderlying luminosity density. The deprojection is not unique, andan inclination angle i must be assumed.
2. Translate the luminosity density to a mass density by assuming a(generally constant with radius) γstar and a central point mass M•.Compute the gravitational potential Φ corresponding to the massdensity thus derived.
3. Solve the Jeans equation for the mean square velocities.
4. Project the mean velocities onto the plane of the sky to get theline of sight velocity and velocity dispersion.
5. Compare the predicted and observed velocities.
6. Return to point 1, and iterate until the values i, γstar and M•
which produce the best fit to the data are found. In practice, thedata are never of high enough quality for all three parameters to beconstrained, and an inclination angle i is always assumed a priori.
As in the case of spherical isotropic models, 2I models can pro-duce good fits to the data, but the solution might be severely in errorif the galaxy under study is not well approximated by the assump-tion that f = f(E,Lz). Unfortunately, there is ample evidence thatthis condition is in fact not generally obeyed. Not only do 2I modelspredict major-axis velocity dispersions which are larger than observed,they also require identical velocity dispersions in the radial and verticaldirection, a condition not verified, for instance, in the solar neighbor-hood. Furthermore, numerical simulations show that most orbits arenot completely described by two integrals of motion: a third integralmust be admitted, although an analytical description of such an inte-gral is not known. Dynamical models in which the distribution functiondepends on three integrals of motion are referred to as 3I models. Stateof the art 3I models are now routinely applied to stellar kinematics(Verolme et al. 2002; Gebhardt et al. 2003). Schwarzchild (1979) iscredited with devising a way to construct galaxy models without anexplicit knowledge of the integrals of motions:
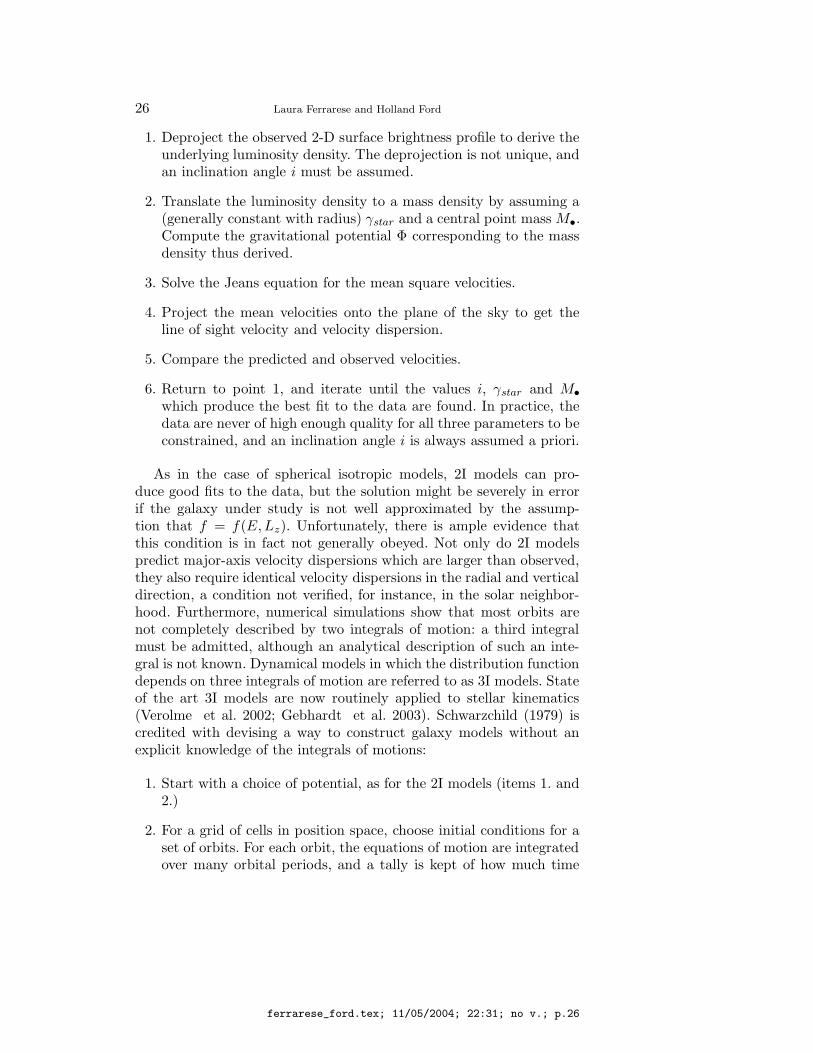
1. Start with a choice of potential, as for the 2I models (items 1. and2.)
2. For a grid of cells in position space, choose initial conditions for aset of orbits. For each orbit, the equations of motion are integratedover many orbital periods, and a tally is kept of how much time
ferrarese_ford.tex; 11/05/2004; 22:31; no v.; p.26
SUPERMASSIVE BLACK HOLES IN GALACTIC NUCLEI 27
each orbit spends in each cell. This provides a measure of how muchmass is contributed to each cell by each orbit.
3. Determine non-negative weights for each orbit such that the summedmass and velocity structure in each cell, when integrated along theline of sight, reproduce the observed surface brightness and kine-matical constraints.
With the introduction of 3I models, any kind of stellar system canin principle be modeled in the most general and unconstrained way.In practice, however, some assumptions must still be made. With oneexception (Verolme et al. 2002), the inclination angle of the galaxy isalways assumed a priori (e.g. Gebhardt et al. 2003); not doing so wouldintroduce an extra degree of freedom which cannot be constrained giventhe observables. Furthermore, although steps toward a formalism fortriaxial systems have recently been taken (van de Ven et al. 2003), allcurrent models assume axisymmetry.
These problems notwithstanding, systematic uncertainties could behidden in the method itself (if a lesson is to be learned from the M87example discussed above, it is that stellar dynamical studies can befallible!). It is therefore rather surprising that to date there has beenonly one study specifically aimed at investigating the incidence of sys-tematics in 3I models (Valluri, Merritt & Emsellem 2004). This studyreaches the rather bleak conclusion that even in the case of the bestobservational datasets, 3I models admit too many degrees of freedomto constrain M•. Valluri et al. identify a fundamental reason for this:since in the 3I case there is an infinite number of distribution functionscorresponding to a given ρ(r) and vθ (e.g. Binney & Tremaine 1987),a change in the gravitational potential (for instance due to the intro-duction of a central point mass) can always be compensated with achange in the DF, so to leave the goodness of the fit of the model tothe data unchanged. Valluri et al. further argue that this intrinsic inde-terminacy becomes apparent only when the number of orbits used inthe simulations (step 2 above) is large (at least a factor 10) comparedto the number of observational constraints. When only a few orbitsare used (relative to the number of constraints), the system is artifi-cially restricted to such an extent that an apparently well constrained(but very likely biased) solution is found. Although it seems unlikelythat 3I models are severely flawed (after all, SBH masses determinedusing these models agree, in a statistical sense, with those measuredusing completely independent methods, such as dynamical studies ofgas kinematics, and reverberation mapping, § 9) quantifying possiblesystematics is a must. Consequently, it is imperative that more studiesaddress this issue in the future.
ferrarese_ford.tex; 11/05/2004; 22:31; no v.; p.27

28 Laura Ferrarese and Holland Ford
The 17 claimed SBH detections that are based on 3I models arelisted in Table II, ranked from highest to lowest resolution of the SBHsphere of influence. With no exceptions, they all required the use ofHST data. Even then, the sphere of influence was not resolved in fivecases, and barely resolved in several others.
6. GAS DYNAMICS FROM WATER MASER CLOUDS
The 1995 announcement of the discovery of a massive black hole inNGC 4258 (Miyoshi et al. 1995) marked the beginning of an unex-pected and powerful new way to measure central masses in AGNs. Ata distance of 7.2 Mpc (Herrnstein et al. 1999), and given the low bulgevelocity dispersion of the galaxy (Heraudean & Simien 1998) the Hub-ble Space Telescope would be able to resolve the sphere of influenceonly of a SBH more massive than a few 108 M (equation 6). Scal-ing relations (§ 9) predict a SBH mass an order of magnitude smaller.NGC 4258, however, is blessed by the presence of water masers clouds,confined to a thin, regular disk extending only a fraction of a parsecfrom the central source. Emitting at 22 GHz, the masers can be studiedwith the VLBA at spatial resolutions a factor ∼ 200 higher than canbe achieved using the Hubble Space Telescope, instantly pushing theability to detect a SBH to correspondingly smaller masses.
The history of extragalactic water masers is a recent one, althoughGalactic water masers, which are likely the result of collisional exci-tation of warm interstellar gas (Neufeld & Melnick 1991) were firstdetected in 1968 (Cheung et al. 1969) and subsequently identified ina number of star forming regions and late-type stellar envelopes. Thefirst extraordinarily luminous, extragalactic example was found in theSeyfert 2 galaxy NGC 4945 (dos Santos and Lepine 1979). In the follow-ing five years very luminous (L > 100L) H2O masers were detected infour additional active galaxies: Circinus (Gardner & Whiteoak 1982),NGC 4258, NGC 1068 (Claussen, Heiligman, & Lo 1984), and NGC3079 (Henkel et al. 1984). The 22 GHz water maser emission lineluminosity in NGC 1068 is L22GHz = 350 L, exceeding the luminos-ity of a typical Galactic water maser by a factor of ∼ 3.5 × 10⁵, andexceeding the brightest Galactic source, W49 (Walker, Matsakis, andGarcia-Barreto 1982) by a factor of 350.
VLA observations by Clausen & Lo (1986) were unable to resolvethe maser sources in NGC 1068 and NGC 4258, which must thereforebe confined within 3.5 and 1.3 pc of the nucleus. Based on marked vari-ability of the two sources and preliminary VLBI observations, Clausen& Lo concluded that the true sizes of the sources were 10-100 times
ferrarese_ford.tex; 11/05/2004; 22:31; no v.; p.28

SUPERMASSIVE BLACK HOLES IN GALACTIC NUCLEI 29
smaller than the VLA upper limits. This made it unlikely that themasers could be a superposition of Galactic-type water masers, whichare known to be powered by massive young stars. To further strengthenthe lack of association between the nuclear and Galactic masers, theynoted that two nearby starburst galaxies, M82 and NGC 253, are notluminous water maser sources, and that the infrared luminosity thatwould be required to excite the H2O maser in NGC 4258 exceeded theobserved IR luminosity of the galaxy by a factor of nearly 300. Thelogical conclusion was that the excitation energy was produced in theactive nucleus. In an inspired insight, Clausen & Lo suggested that themasing in NGC 1068 might arise in the postulated – but never directlyobserved – pc-size obscuring torus which is at the heart of the Seyfert1/2 unification scheme (Antonucci and Miller 1985).
Neufeld, Maloney, & Conger (1994) show that luminous water maserscan be produced when X-rays, presumably generated by the innermostaccretion disk around the central SBH, illuminate and heat a torusof dense circumnuclear gas and dust. Their model leads to “a sand-wich structure in which the high-pressure gas closest to the midplaneis molecular but the lower-pressure gas above and below the plane isatomic.” When the X-ray heating is large enough to raise the temper-ature in gas and dust above 400 K, but small enough to permit theexistence of H2, a reaction network O + H2 → OH + H and OH +H2 → H2O + H is very efficient at producing water with an abundanceratio of water to hydrogen of several 10−4. Over a range of X-ray flux-es a stable two phase structure is possible with an atomic phase atT ∼ 6000 to 8000 K and a molecular phase at T ∼ 600 to 2500 K.Warping in the maser disk is argued to be critical: if the disk were flat,the path through the disk would be optically thick to X-rays and theX-ray opacity would become too high for the heating required to excitethe masers. This prediction is supported by observations of NGC 4258,which indeed show the maser disk to be mildly warped (§ 6.1)
Unfortunately, H2O masers are not common. The first large surveywas conducted by Braatz, Wilson, & Henkel (1994, 1996). Targeting354 galaxies mostly within 10 Mpc, including Seyfert galaxies, LINERS,and radio galaxies, they found a 7% detection rate (13 sources) amongSeyfert 2 and LINERS, but no detections in Seyfert 1 nuclei. This isnot surprising, since to detect water masers the observer must see along path length through the torus. Therefore, when the geometry isfavorable to observe masing, the Seyfert 1 nucleus is hidden by theoptically thick torus. The Greenhill et al. (1997) survey of 26 AGNswith the 70m antenna of the NASA Deep Space Network producedonly one detection, NGC 3735. One additional detection stemmed froma survey of 131 AGNs with the Parkes Observatory (Greenhill et al.
ferrarese_ford.tex; 11/05/2004; 22:31; no v.; p.29
30 Laura Ferrarese and Holland Ford
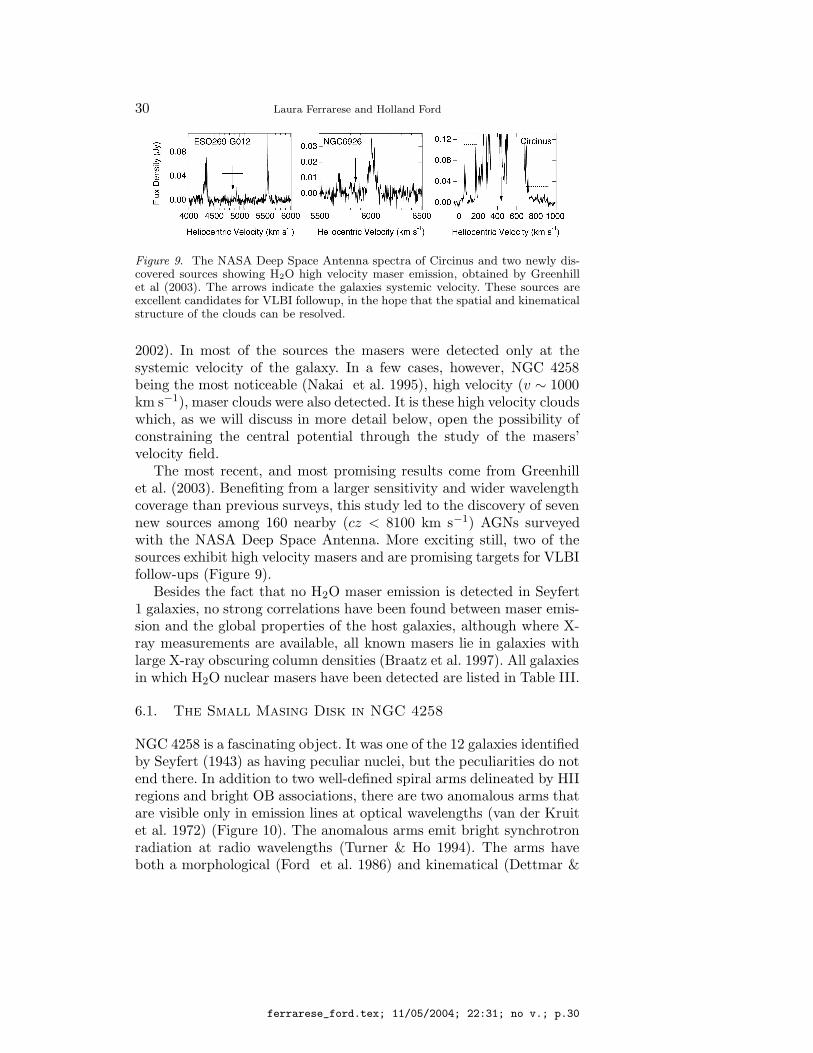
Figure 9. The NASA Deep Space Antenna spectra of Circinus and two newly dis-covered sources showing H2O high velocity maser emission, obtained by Greenhillet al (2003). The arrows indicate the galaxies systemic velocity. These sources areexcellent candidates for VLBI followup, in the hope that the spatial and kinematicalstructure of the clouds can be resolved.
2002). In most of the sources the masers were detected only at thesystemic velocity of the galaxy. In a few cases, however, NGC 4258being the most noticeable (Nakai et al. 1995), high velocity (v ∼ 1000km s−1), maser clouds were also detected. It is these high velocity cloudswhich, as we will discuss in more detail below, open the possibility ofconstraining the central potential through the study of the masers’velocity field.
The most recent, and most promising results come from Greenhillet al. (2003). Benefiting from a larger sensitivity and wider wavelengthcoverage than previous surveys, this study led to the discovery of sevennew sources among 160 nearby (cz < 8100 km s−1) AGNs surveyedwith the NASA Deep Space Antenna. More exciting still, two of thesources exhibit high velocity masers and are promising targets for VLBIfollow-ups (Figure 9).
Besides the fact that no H2O maser emission is detected in Seyfert1 galaxies, no strong correlations have been found between maser emis-sion and the global properties of the host galaxies, although where X-ray measurements are available, all known masers lie in galaxies withlarge X-ray obscuring column densities (Braatz et al. 1997). All galaxiesin which H2O nuclear masers have been detected are listed in Table III.
6.1. The Small Masing Disk in NGC 4258
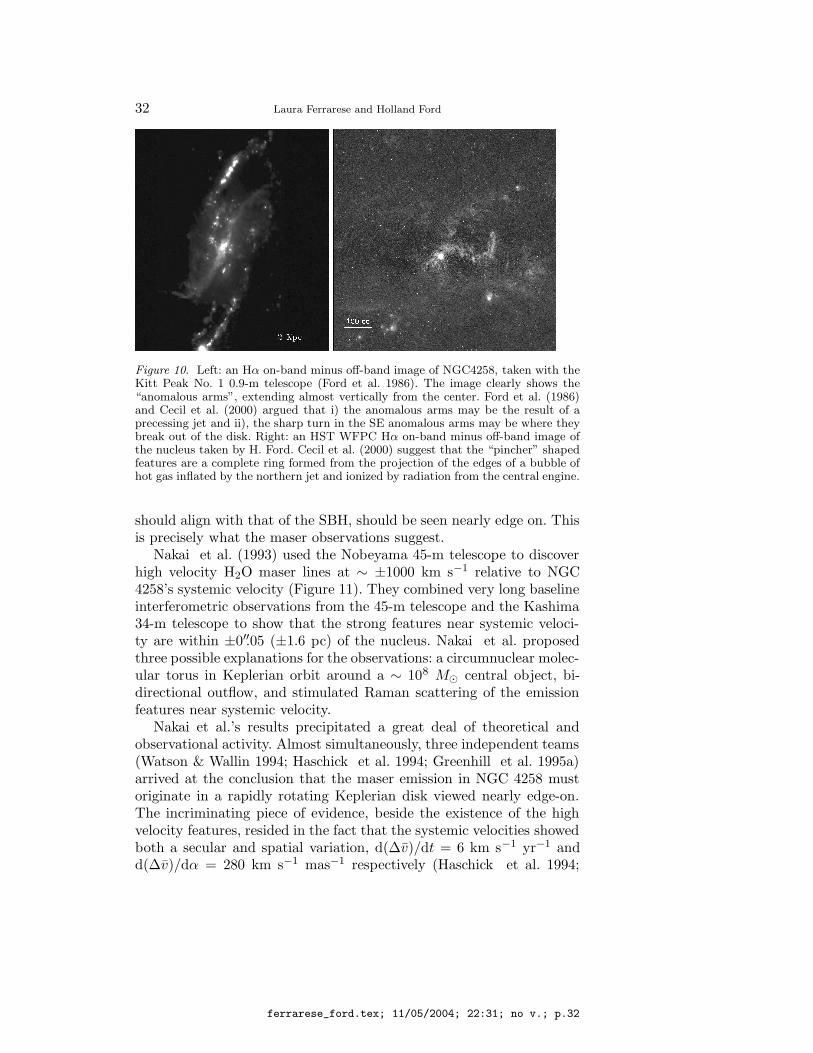
NGC 4258 is a fascinating object. It was one of the 12 galaxies identifiedby Seyfert (1943) as having peculiar nuclei, but the peculiarities do notend there. In addition to two well-defined spiral arms delineated by HIIregions and bright OB associations, there are two anomalous arms thatare visible only in emission lines at optical wavelengths (van der Kruitet al. 1972) (Figure 10). The anomalous arms emit bright synchrotronradiation at radio wavelengths (Turner & Ho 1994). The arms haveboth a morphological (Ford et al. 1986) and kinematical (Dettmar &
ferrarese_ford.tex; 11/05/2004; 22:31; no v.; p.30
SUPERMASSIVE BLACK HOLES IN GALACTIC NUCLEI 31
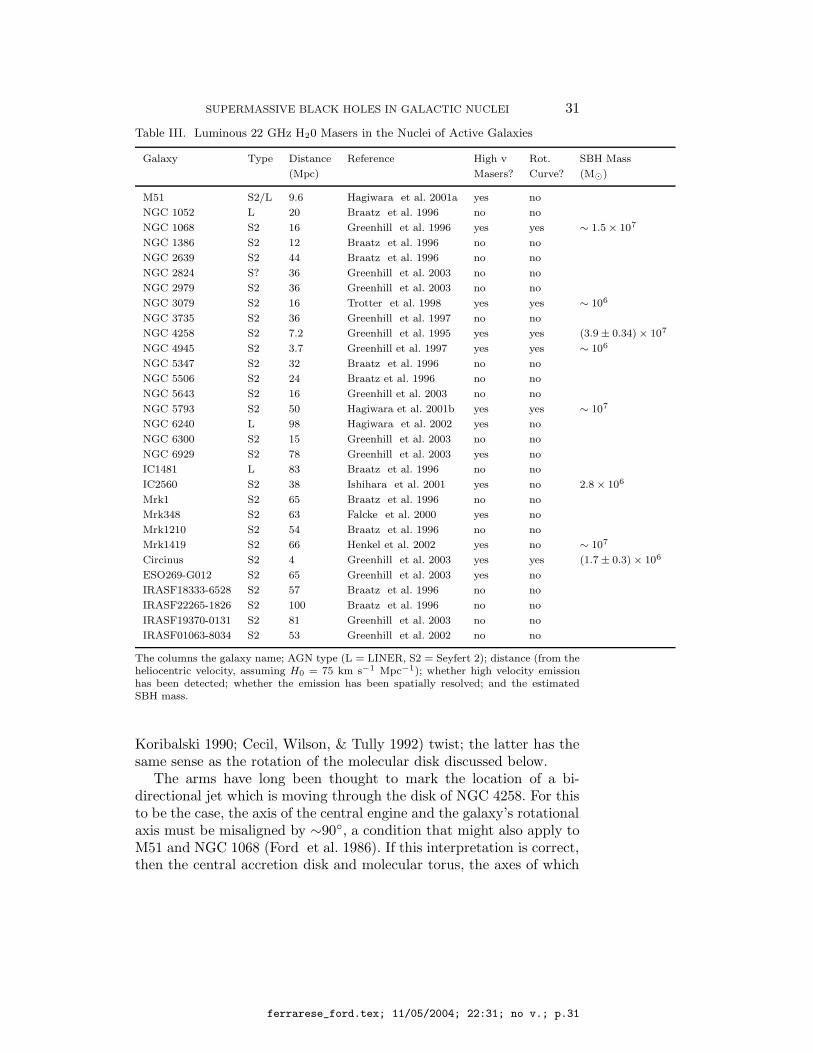
Table III. Luminous 22 GHz H20 Masers in the Nuclei of Active Galaxies
Galaxy Type Distance Reference High v Rot. SBH Mass
(Mpc) Masers? Curve? (M)
M51 S2/L 9.6 Hagiwara et al. 2001a yes no
NGC 1052 L 20 Braatz et al. 1996 no no
NGC 1068 S2 16 Greenhill et al. 1996 yes yes ∼ 1.5 × 10⁷
NGC 1386 S2 12 Braatz et al. 1996 no no
NGC 2639 S2 44 Braatz et al. 1996 no no
NGC 2824 S? 36 Greenhill et al. 2003 no no
NGC 2979 S2 36 Greenhill et al. 2003 no no
NGC 3079 S2 16 Trotter et al. 1998 yes yes ∼ 106
NGC 3735 S2 36 Greenhill et al. 1997 no no
NGC 4258 S2 7.2 Greenhill et al. 1995 yes yes (3.9 ± 0.34) × 107
NGC 4945 S2 3.7 Greenhill et al. 1997 yes yes ∼ 106
NGC 5347 S2 32 Braatz et al. 1996 no no
NGC 5506 S2 24 Braatz et al. 1996 no no
NGC 5643 S2 16 Greenhill et al. 2003 no no
NGC 5793 S2 50 Hagiwara et al. 2001b yes yes ∼ 107
NGC 6240 L 98 Hagiwara et al. 2002 yes no
NGC 6300 S2 15 Greenhill et al. 2003 no no
NGC 6929 S2 78 Greenhill et al. 2003 yes no
IC1481 L 83 Braatz et al. 1996 no no
IC2560 S2 38 Ishihara et al. 2001 yes no 2.8 × 10⁶
Mrk1 S2 65 Braatz et al. 1996 no no
Mrk348 S2 63 Falcke et al. 2000 yes no
Mrk1210 S2 54 Braatz et al. 1996 no no
Mrk1419 S2 66 Henkel et al. 2002 yes no ∼ 107
Circinus S2 4 Greenhill et al. 2003 yes yes (1.7 ± 0.3) × 106
ESO269-G012 S2 65 Greenhill et al. 2003 yes no
IRASF18333-6528 S2 57 Braatz et al. 1996 no no
IRASF22265-1826 S2 100 Braatz et al. 1996 no no
IRASF19370-0131 S2 81 Greenhill et al. 2003 no no
IRASF01063-8034 S2 53 Greenhill et al. 2002 no no
The columns the galaxy name; AGN type (L = LINER, S2 = Seyfert 2); distance (from theheliocentric velocity, assuming H0 = 75 km s−1 Mpc−1); whether high velocity emissionhas been detected; whether the emission has been spatially resolved; and the estimatedSBH mass.
Koribalski 1990; Cecil, Wilson, & Tully 1992) twist; the latter has thesame sense as the rotation of the molecular disk discussed below.
The arms have long been thought to mark the location of a bi-directional jet which is moving through the disk of NGC 4258. For thisto be the case, the axis of the central engine and the galaxy’s rotationalaxis must be misaligned by ∼90, a condition that might also apply toM51 and NGC 1068 (Ford et al. 1986). If this interpretation is correct,then the central accretion disk and molecular torus, the axes of which
ferrarese_ford.tex; 11/05/2004; 22:31; no v.; p.31
32 Laura Ferrarese and Holland Ford
Figure 10. Left: an Hα on-band minus off-band image of NGC4258, taken with theKitt Peak No. 1 0.9-m telescope (Ford et al. 1986). The image clearly shows the“anomalous arms”, extending almost vertically from the center. Ford et al. (1986)and Cecil et al. (2000) argued that i) the anomalous arms may be the result of aprecessing jet and ii), the sharp turn in the SE anomalous arms may be where theybreak out of the disk. Right: an HST WFPC Hα on-band minus off-band image ofthe nucleus taken by H. Ford. Cecil et al. (2000) suggest that the “pincher” shapedfeatures are a complete ring formed from the projection of the edges of a bubble ofhot gas inflated by the northern jet and ionized by radiation from the central engine.
should align with that of the SBH, should be seen nearly edge on. Thisis precisely what the maser observations suggest.
Nakai et al. (1993) used the Nobeyama 45-m telescope to discoverhigh velocity H2O maser lines at ∼ ±1000 km s−1 relative to NGC4258’s systemic velocity (Figure 11). They combined very long baselineinterferometric observations from the 45-m telescope and the Kashima34-m telescope to show that the strong features near systemic veloci-ty are within ±0′′.05 (±1.6 pc) of the nucleus. Nakai et al. proposedthree possible explanations for the observations: a circumnuclear molec-ular torus in Keplerian orbit around a ∼ 108 M central object, bi-directional outflow, and stimulated Raman scattering of the emissionfeatures near systemic velocity.
Nakai et al.’s results precipitated a great deal of theoretical andobservational activity. Almost simultaneously, three independent teams(Watson & Wallin 1994; Haschick et al. 1994; Greenhill et al. 1995a)arrived at the conclusion that the maser emission in NGC 4258 mustoriginate in a rapidly rotating Keplerian disk viewed nearly edge-on.The incriminating piece of evidence, beside the existence of the highvelocity features, resided in the fact that the systemic velocities showedboth a secular and spatial variation, d(∆v)/dt = 6 km s−1 yr−1 andd(∆v)/dα = 280 km s−1 mas−1 respectively (Haschick et al. 1994;
ferrarese_ford.tex; 11/05/2004; 22:31; no v.; p.32

SUPERMASSIVE BLACK HOLES IN GALACTIC NUCLEI 33
Figure 11. The Nobeyama spectrum of NGC 4258 that first revealed the presenceof high velocity H2O maser emission (From Nakai et al. 1993)
Greenhill et al. 1995a&b), exactly as expected if the masers originatein an edge on disk. In this case, the high velocity lines arise from masingalong the long lines of sight through the two opposing tangent pointsin the disk, while the clouds which project along the line of sight to thenucleus should have velocities close to the systemic velocity. The veloci-ty of individual masing clouds which project against the nucleus shouldtherefore change with time (secular change) as the clouds move alongtheir trajectory, while clouds projecting at slightly different locationsshould have slightly different velocity (spatial change), as observed2:
d(∆v)
dt'
v20
r0, (11)
d(∆v)
d(Dα)=
v0
r0. (12)
Here, v0 is the circular velocity at the outer radius (r0) of the disk,D is the distance to the galaxy, and α is the angular displacement alongthe arc.
Watson & Wallin modeled the hypothetical edge-on disk as a thinunsaturated annulus surrounding a transparent gap in the disk anda small central opaque region, which was included to account for thesplitting of the emission near systemic velocity into two sets of lines.Assuming a distance D = 6.6 Mpc3 Watson & Wallin used equa-tions 11) and 12) and advance publication results from Greenhill et al.(1995b) to find v0 ∼ 700 km s−1 and r0 = 0.1 pc. The agreement oftheir derived v0 with the observed values of the high velocity satellitelines (740 to 980 km s−1 and -760 to -920 km s−1) lent strong support
2 According to this model, there should be no frequency drift in the high velocityfeatures, again in agreement with the observations.
ferrarese_ford.tex; 11/05/2004; 22:31; no v.; p.33
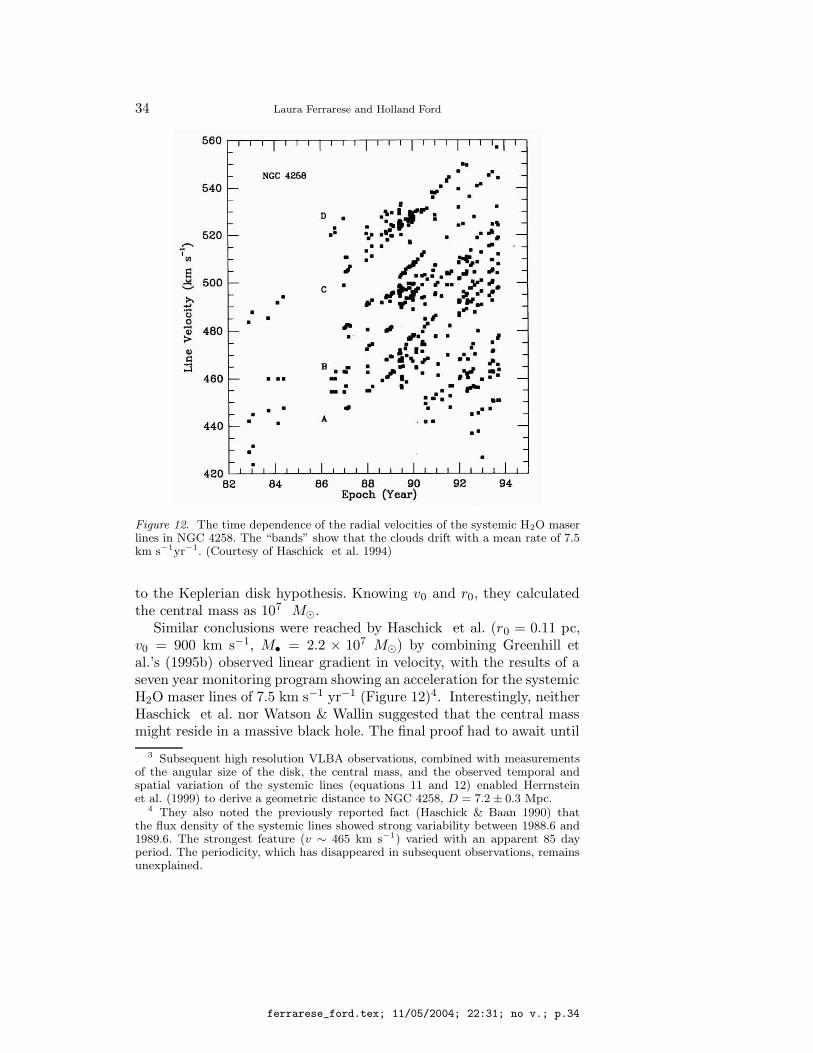
34 Laura Ferrarese and Holland Ford
Figure 12. The time dependence of the radial velocities of the systemic H2O maserlines in NGC 4258. The “bands” show that the clouds drift with a mean rate of 7.5km s−1yr−1. (Courtesy of Haschick et al. 1994)
to the Keplerian disk hypothesis. Knowing v0 and r0, they calculatedthe central mass as 107 M.
Similar conclusions were reached by Haschick et al. (r0 = 0.11 pc,v0 = 900 km s−1, M• = 2.2 × 10⁷ M) by combining Greenhill etal.’s (1995b) observed linear gradient in velocity, with the results of aseven year monitoring program showing an acceleration for the systemicH2O maser lines of 7.5 km s−1 yr−1 (Figure 12)4. Interestingly, neitherHaschick et al. nor Watson & Wallin suggested that the central massmight reside in a massive black hole. The final proof had to await until
3 Subsequent high resolution VLBA observations, combined with measurementsof the angular size of the disk, the central mass, and the observed temporal andspatial variation of the systemic lines (equations 11 and 12) enabled Herrnsteinet al. (1999) to derive a geometric distance to NGC 4258, D = 7.2 ± 0.3 Mpc.
4 They also noted the previously reported fact (Haschick & Baan 1990) thatthe flux density of the systemic lines showed strong variability between 1988.6 and1989.6. The strongest feature (v ∼ 465 km s−1) varied with an apparent 85 dayperiod. The periodicity, which has disappeared in subsequent observations, remainsunexplained.
ferrarese_ford.tex; 11/05/2004; 22:31; no v.; p.34
SUPERMASSIVE BLACK HOLES IN GALACTIC NUCLEI 35
the day when Miyoshi’s et al. (1995) high resolution (0.6×0.3 mas at aposition angle of ∼ 7) VLBI observations could spatially resolved thedisk’s structure. The masing clouds, which are confined in an annuluswith inner and outer radii of 0.14 and 0.28 pc respectively, displaythe unmistakable v2 = GM/r signature of Keplerian motion around3.9 × 107 solar masses5. Miyoshi’s et al. paper, combined with theHSTmeasurement of the mass of the SBH in M87, marked a turningpoint in the debate about the existence of massive black holes. Figure 13shows the VLBA velocities plotted versus distance along the disk majoraxis. The high velocity lines on opposing sides of the disk (which isvery thin, Figure 13) and the central lines are an almost perfect fit toa Keplerian disk inclined to the plane of the sky by 86. Moran et al.(1999) summarizes the properties of the disk and central mass.
The absence of measurable perturbations in the r−0.5 Kepleriandependence of the high velocity lines requires Mdisk < 4 × 10⁶ M.Taking the 4.1 mas inner radius as an upper limit to the size of thecentral object, Miyoshi et al. (1995) found that the mass density isρ > 4 × 10⁹ M pc−3, larger than the density in the densest knownstar clusters, globular clusters, where ρ < 105 M pc−3, and severalorders of magnitude larger than measured in any other galactic nucle-us for which a SBH has been claimed, with the exception of the MilkyWay (Figure 6). Stronger constraints still can be obtained by assum-ing that the central source has a size less than the angular extent ofthe systemic lines on the sky (∼ 0.6 mas = 0.02 pc). This requiresρ > 1.4 × 10¹² M pc−3, leaving virtually no doubt that the detect-ed mass belongs to a central black hole, with the masers orbiting asclose as ∼40,000 Schwarzschild radii. At this distance, relativistic cor-rections are small but not negligible; the transverse Doppler shift is∼ 2 km s−1, the gravitational redshift is ∼ 4 km s−1, while the gravi-tational deflection of the maser positions is only 0.1 µas (Moran et al.1995).
The VLBI observations of NGC 4258 are so exquisite to allow a mostdetailed study of the physical properties of the molecular disk (Moranet al. 1999; Neufeld & Maloney 1995; Neufeld, Maloney & Conger 1994).Herrnstein et al. (1996) convincingly argue that the disk is warped; thedegree of warping can be constrained given the relative positions of theclouds on the sky, the line of sight velocities and the accelerations foreach of the maser clouds. The warping can be represented by concentricrings with varying inclination and a progression in the line of nodes;Herrnstein et al. conclude that a model in which the line of nodesprogresses by several (5 to 10) degrees from the inner to the outer
5 Values have been corrected to a distance of 7.2 ± 0.3 Mpc (Herrnstein et al.1999).
ferrarese_ford.tex; 11/05/2004; 22:31; no v.; p.35
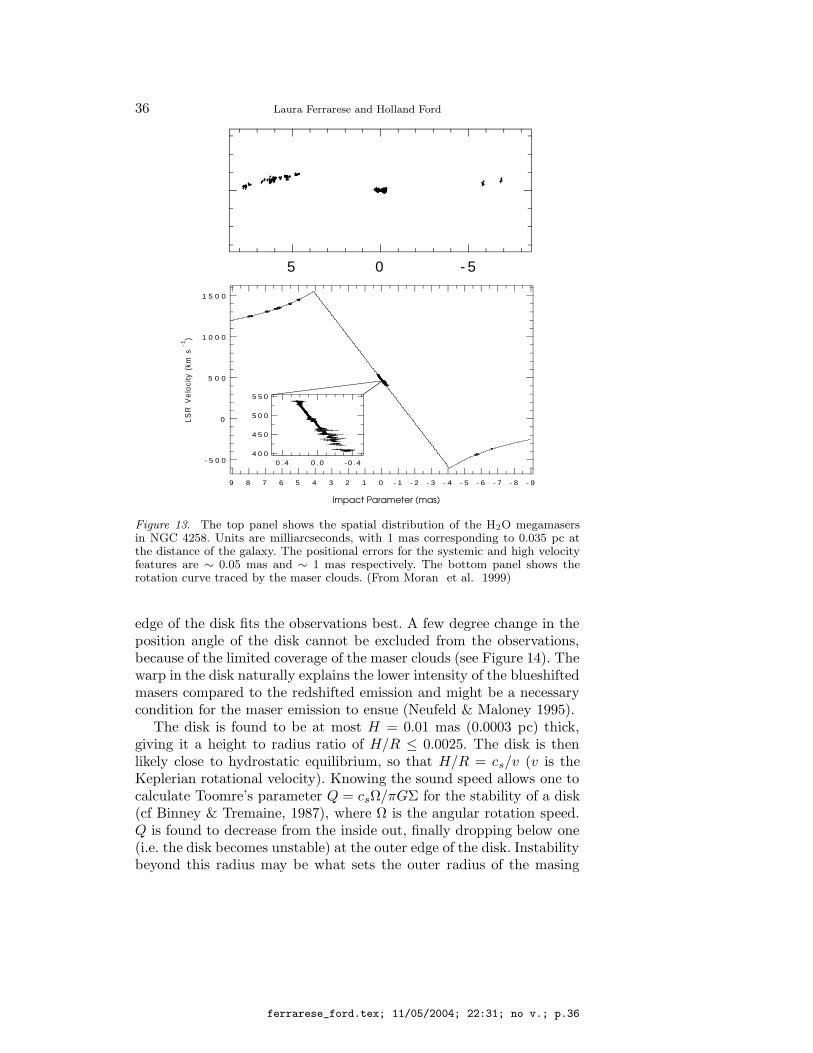
36 Laura Ferrarese and Holland Ford
1 5 0 0
1 0 0 0
5 0 0
0
- 5 0 0
LS
R V
elo
city
(km
s -1
)
9 8 7 6 5 4 3 2 1 0 - 1 - 2 - 3 - 4 - 5 - 6 - 7 - 8 - 9
5 5 0
5 0 0
4 5 0
4 0 00 .4 0 . 0 -0 .4
5 0 - 5
Impact Parameter (mas)
Figure 13. The top panel shows the spatial distribution of the H2O megamasersin NGC 4258. Units are milliarcseconds, with 1 mas corresponding to 0.035 pc atthe distance of the galaxy. The positional errors for the systemic and high velocityfeatures are ∼ 0.05 mas and ∼ 1 mas respectively. The bottom panel shows therotation curve traced by the maser clouds. (From Moran et al. 1999)
edge of the disk fits the observations best. A few degree change in theposition angle of the disk cannot be excluded from the observations,because of the limited coverage of the maser clouds (see Figure 14). Thewarp in the disk naturally explains the lower intensity of the blueshiftedmasers compared to the redshifted emission and might be a necessarycondition for the maser emission to ensue (Neufeld & Maloney 1995).
The disk is found to be at most H = 0.01 mas (0.0003 pc) thick,giving it a height to radius ratio of H/R ≤ 0.0025. The disk is thenlikely close to hydrostatic equilibrium, so that H/R = cs/v (v is theKeplerian rotational velocity). Knowing the sound speed allows one tocalculate Toomre’s parameter Q = csΩ/πGΣ for the stability of a disk(cf Binney & Tremaine, 1987), where Ω is the angular rotation speed.Q is found to decrease from the inside out, finally dropping below one(i.e. the disk becomes unstable) at the outer edge of the disk. Instabilitybeyond this radius may be what sets the outer radius of the masing
ferrarese_ford.tex; 11/05/2004; 22:31; no v.; p.36
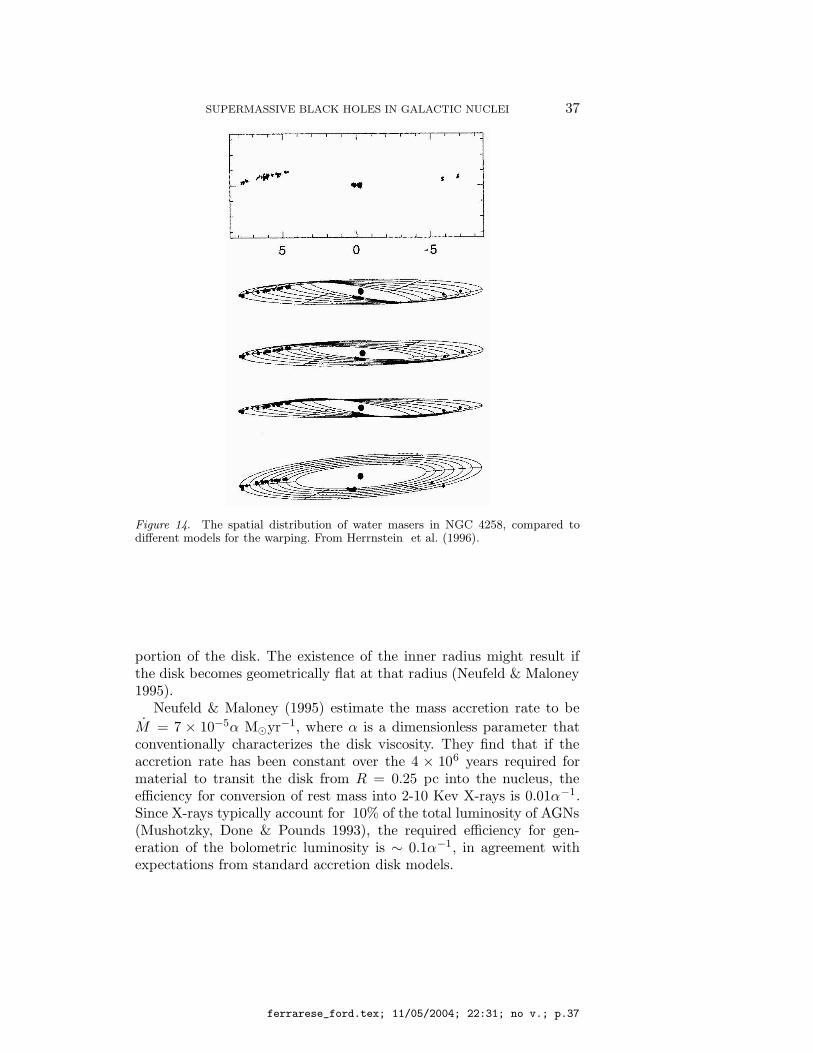
SUPERMASSIVE BLACK HOLES IN GALACTIC NUCLEI 37
Figure 14. The spatial distribution of water masers in NGC 4258, compared todifferent models for the warping. From Herrnstein et al. (1996).
portion of the disk. The existence of the inner radius might result ifthe disk becomes geometrically flat at that radius (Neufeld & Maloney1995).
Neufeld & Maloney (1995) estimate the mass accretion rate to be
M.
= 7 × 10⁻⁵α Myr−1, where α is a dimensionless parameter thatconventionally characterizes the disk viscosity. They find that if theaccretion rate has been constant over the 4 × 10⁶ years required formaterial to transit the disk from R = 0.25 pc into the nucleus, theefficiency for conversion of rest mass into 2-10 Kev X-rays is 0.01α−1.Since X-rays typically account for 10% of the total luminosity of AGNs(Mushotzky, Done & Pounds 1993), the required efficiency for gen-eration of the bolometric luminosity is ∼ 0.1α−1, in agreement withexpectations from standard accretion disk models.
ferrarese_ford.tex; 11/05/2004; 22:31; no v.; p.37
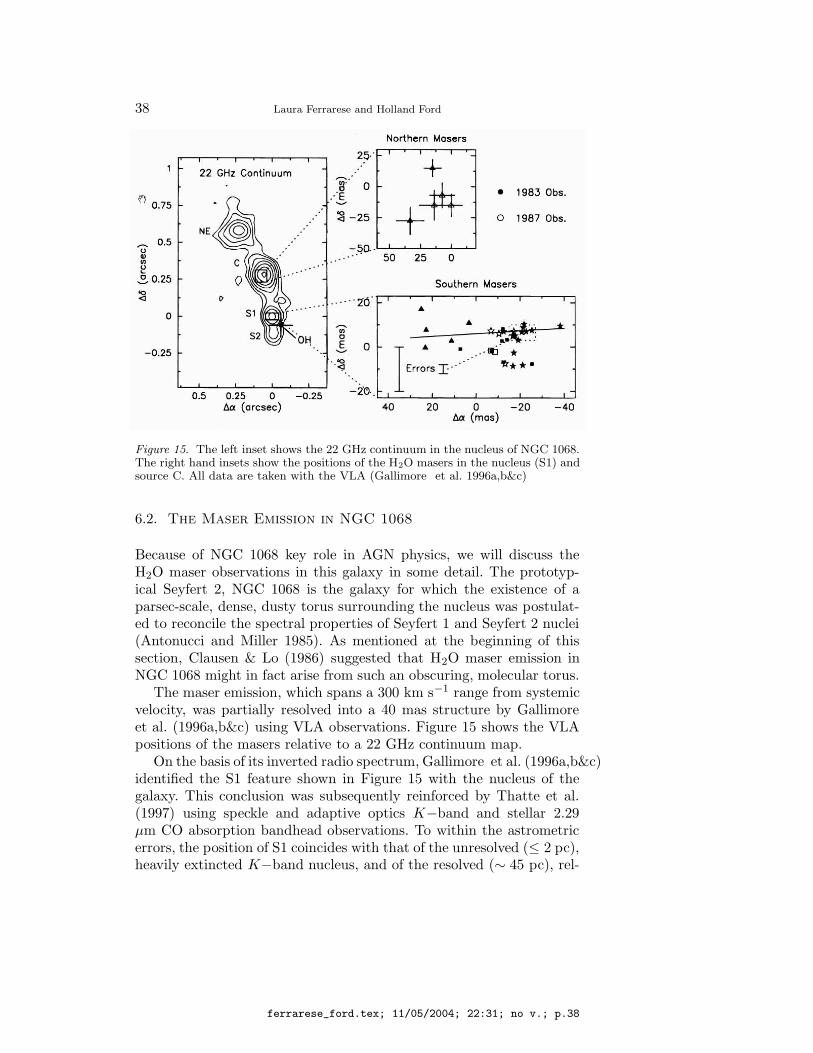
38 Laura Ferrarese and Holland Ford
Figure 15. The left inset shows the 22 GHz continuum in the nucleus of NGC 1068.The right hand insets show the positions of the H2O masers in the nucleus (S1) andsource C. All data are taken with the VLA (Gallimore et al. 1996a,b&c)
6.2. The Maser Emission in NGC 1068
Because of NGC 1068 key role in AGN physics, we will discuss theH2O maser observations in this galaxy in some detail. The prototyp-ical Seyfert 2, NGC 1068 is the galaxy for which the existence of aparsec-scale, dense, dusty torus surrounding the nucleus was postulat-ed to reconcile the spectral properties of Seyfert 1 and Seyfert 2 nuclei(Antonucci and Miller 1985). As mentioned at the beginning of thissection, Clausen & Lo (1986) suggested that H2O maser emission inNGC 1068 might in fact arise from such an obscuring, molecular torus.
The maser emission, which spans a 300 km s−1 range from systemicvelocity, was partially resolved into a 40 mas structure by Gallimoreet al. (1996a,b&c) using VLA observations. Figure 15 shows the VLApositions of the masers relative to a 22 GHz continuum map.
On the basis of its inverted radio spectrum, Gallimore et al. (1996a,b&c)identified the S1 feature shown in Figure 15 with the nucleus of thegalaxy. This conclusion was subsequently reinforced by Thatte et al.(1997) using speckle and adaptive optics K−band and stellar 2.29µm CO absorption bandhead observations. To within the astrometricerrors, the position of S1 coincides with that of the unresolved (≤ 2 pc),heavily extincted K−band nucleus, and of the resolved (∼ 45 pc), rel-
ferrarese_ford.tex; 11/05/2004; 22:31; no v.; p.38
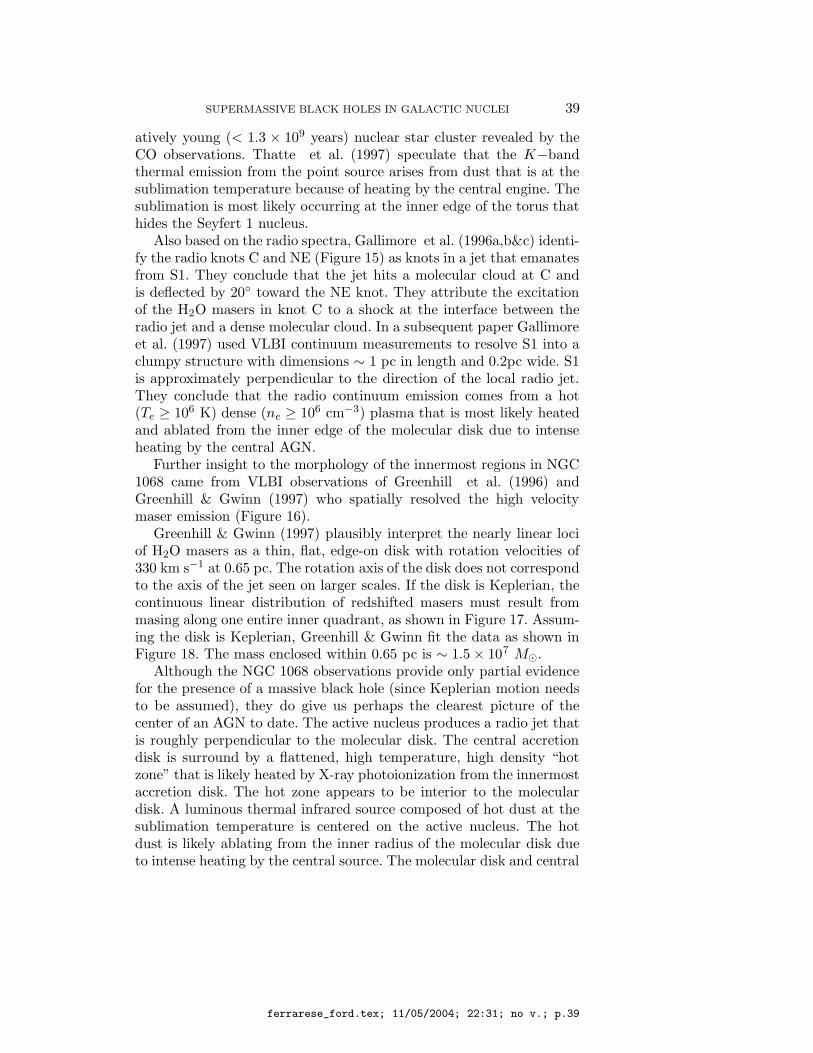
SUPERMASSIVE BLACK HOLES IN GALACTIC NUCLEI 39
atively young (< 1.3 × 10⁹ years) nuclear star cluster revealed by theCO observations. Thatte et al. (1997) speculate that the K−bandthermal emission from the point source arises from dust that is at thesublimation temperature because of heating by the central engine. Thesublimation is most likely occurring at the inner edge of the torus thathides the Seyfert 1 nucleus.
Also based on the radio spectra, Gallimore et al. (1996a,b&c) identi-fy the radio knots C and NE (Figure 15) as knots in a jet that emanatesfrom S1. They conclude that the jet hits a molecular cloud at C andis deflected by 20 toward the NE knot. They attribute the excitationof the H2O masers in knot C to a shock at the interface between theradio jet and a dense molecular cloud. In a subsequent paper Gallimoreet al. (1997) used VLBI continuum measurements to resolve S1 into aclumpy structure with dimensions ∼ 1 pc in length and 0.2pc wide. S1is approximately perpendicular to the direction of the local radio jet.They conclude that the radio continuum emission comes from a hot(Te ≥ 106 K) dense (ne ≥ 106 cm−3) plasma that is most likely heatedand ablated from the inner edge of the molecular disk due to intenseheating by the central AGN.
Further insight to the morphology of the innermost regions in NGC1068 came from VLBI observations of Greenhill et al. (1996) andGreenhill & Gwinn (1997) who spatially resolved the high velocitymaser emission (Figure 16).
Greenhill & Gwinn (1997) plausibly interpret the nearly linear lociof H2O masers as a thin, flat, edge-on disk with rotation velocities of330 km s−1 at 0.65 pc. The rotation axis of the disk does not correspondto the axis of the jet seen on larger scales. If the disk is Keplerian, thecontinuous linear distribution of redshifted masers must result frommasing along one entire inner quadrant, as shown in Figure 17. Assum-ing the disk is Keplerian, Greenhill & Gwinn fit the data as shown inFigure 18. The mass enclosed within 0.65 pc is ∼ 1.5 × 10⁷ M.
Although the NGC 1068 observations provide only partial evidencefor the presence of a massive black hole (since Keplerian motion needsto be assumed), they do give us perhaps the clearest picture of thecenter of an AGN to date. The active nucleus produces a radio jet thatis roughly perpendicular to the molecular disk. The central accretiondisk is surround by a flattened, high temperature, high density “hotzone” that is likely heated by X-ray photoionization from the innermostaccretion disk. The hot zone appears to be interior to the moleculardisk. A luminous thermal infrared source composed of hot dust at thesublimation temperature is centered on the active nucleus. The hotdust is likely ablating from the inner radius of the molecular disk dueto intense heating by the central source. The molecular disk and central
ferrarese_ford.tex; 11/05/2004; 22:31; no v.; p.39
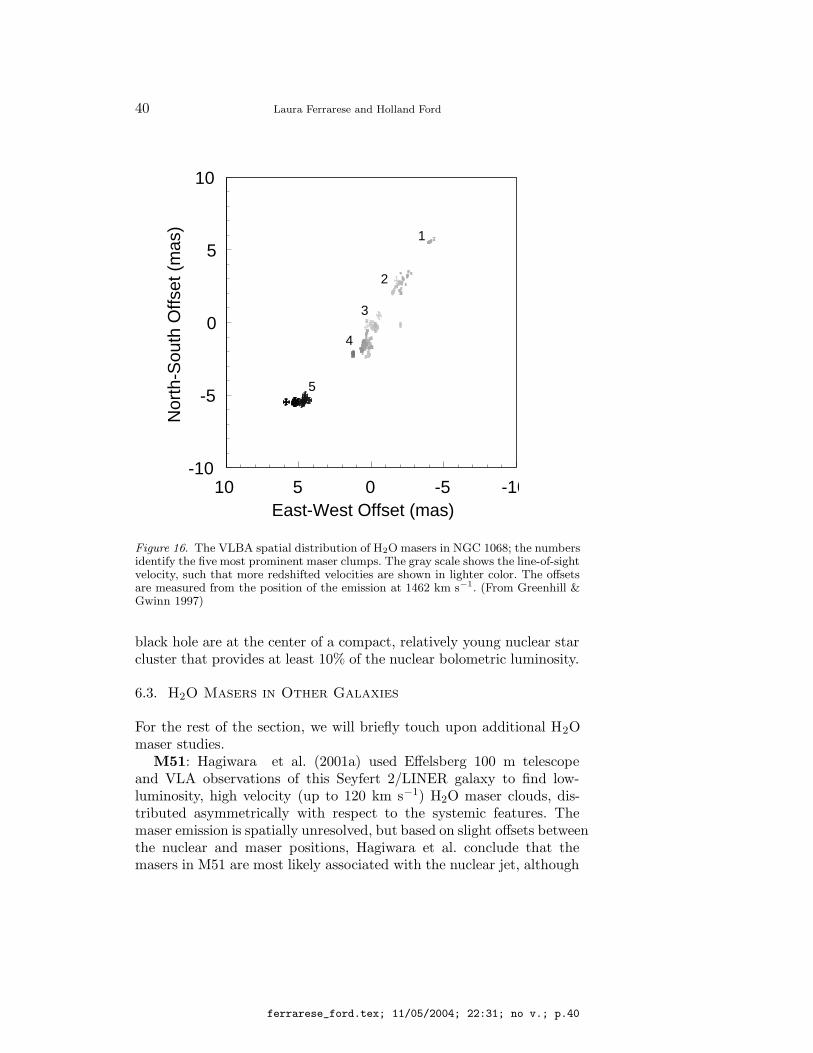
40 Laura Ferrarese and Holland Ford
10 5 0 -5 -10-10
-5
0
5
10
East-West Offset (mas)
Nor
th-S
outh
Offs
et (
mas
)
1
2
3
4
5
Figure 16. The VLBA spatial distribution of H2O masers in NGC 1068; the numbersidentify the five most prominent maser clumps. The gray scale shows the line-of-sightvelocity, such that more redshifted velocities are shown in lighter color. The offsetsare measured from the position of the emission at 1462 km s−1. (From Greenhill &Gwinn 1997)
black hole are at the center of a compact, relatively young nuclear starcluster that provides at least 10% of the nuclear bolometric luminosity.
6.3. H2O Masers in Other Galaxies
For the rest of the section, we will briefly touch upon additional H2Omaser studies.
M51: Hagiwara et al. (2001a) used Effelsberg 100 m telescopeand VLA observations of this Seyfert 2/LINER galaxy to find low-luminosity, high velocity (up to 120 km s−1) H2O maser clouds, dis-tributed asymmetrically with respect to the systemic features. Themaser emission is spatially unresolved, but based on slight offsets betweenthe nuclear and maser positions, Hagiwara et al. conclude that themasers in M51 are most likely associated with the nuclear jet, although
ferrarese_ford.tex; 11/05/2004; 22:31; no v.; p.40
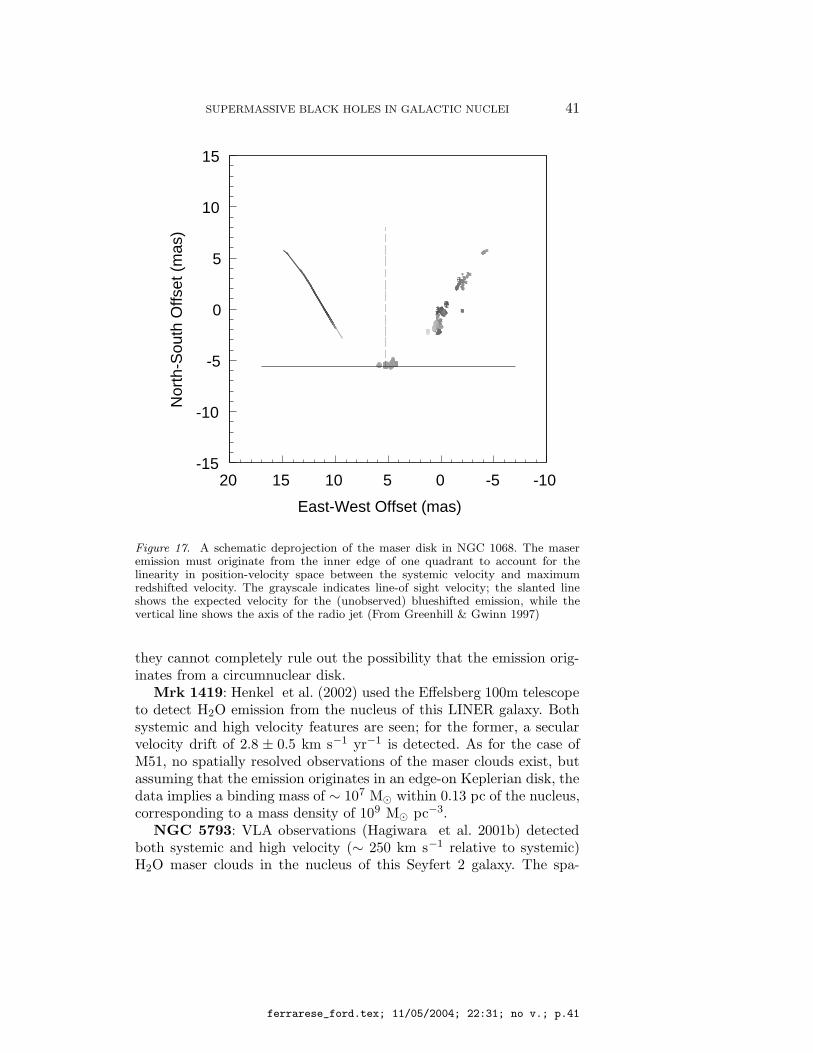
SUPERMASSIVE BLACK HOLES IN GALACTIC NUCLEI 41
20 15 10 5 0 -5 -10-15
-10
-5
0
5
10
15
East-West Offset (mas)
Nor
th-S
outh
Offs
et (
mas
)
Figure 17. A schematic deprojection of the maser disk in NGC 1068. The maseremission must originate from the inner edge of one quadrant to account for thelinearity in position-velocity space between the systemic velocity and maximumredshifted velocity. The grayscale indicates line-of sight velocity; the slanted lineshows the expected velocity for the (unobserved) blueshifted emission, while thevertical line shows the axis of the radio jet (From Greenhill & Gwinn 1997)
they cannot completely rule out the possibility that the emission orig-inates from a circumnuclear disk.
Mrk 1419: Henkel et al. (2002) used the Effelsberg 100m telescopeto detect H2O emission from the nucleus of this LINER galaxy. Bothsystemic and high velocity features are seen; for the former, a secularvelocity drift of 2.8 ± 0.5 km s−1 yr−1 is detected. As for the case ofM51, no spatially resolved observations of the maser clouds exist, butassuming that the emission originates in an edge-on Keplerian disk, thedata implies a binding mass of ∼ 107 M within 0.13 pc of the nucleus,corresponding to a mass density of 109 M pc−3.
NGC 5793: VLA observations (Hagiwara et al. 2001b) detectedboth systemic and high velocity (∼ 250 km s−1 relative to systemic)H2O maser clouds in the nucleus of this Seyfert 2 galaxy. The spa-
ferrarese_ford.tex; 11/05/2004; 22:31; no v.; p.41
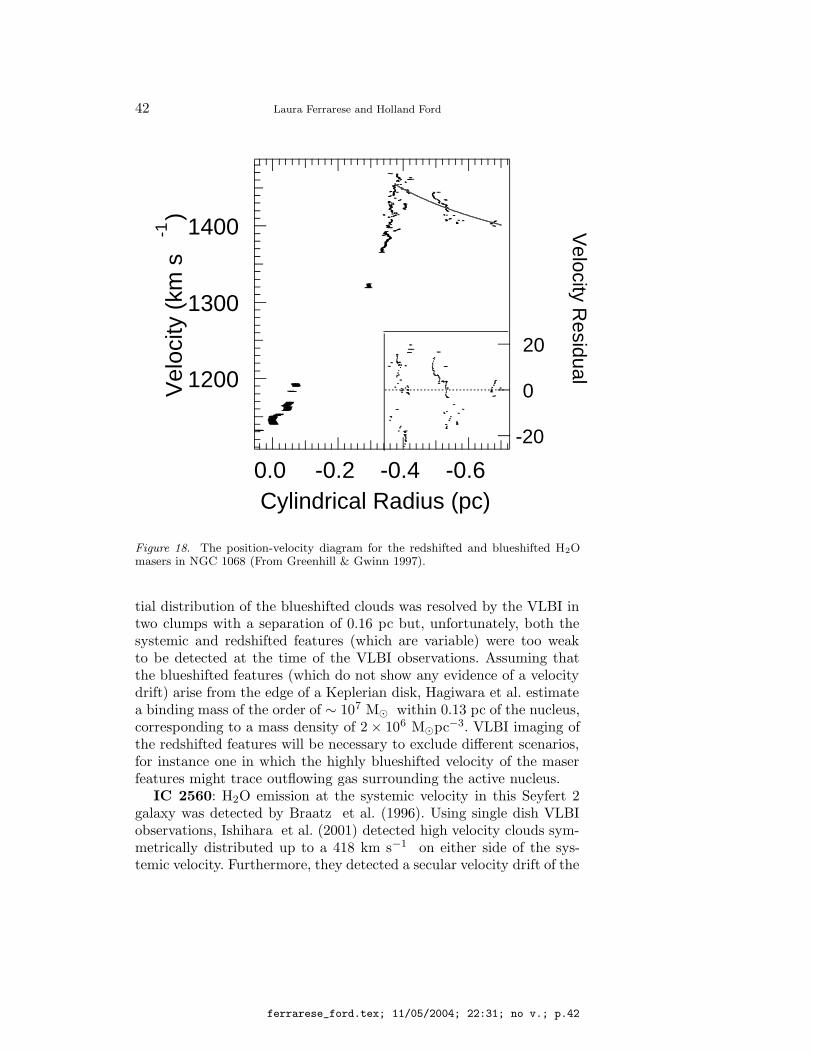
42 Laura Ferrarese and Holland Ford
1400
1300
1200Vel
ocity
(km
s-1
)
-0.6-0.4-0.20.0Cylindrical Radius (pc)
20
0
-20
Velocity R
esidual
Figure 18. The position-velocity diagram for the redshifted and blueshifted H2Omasers in NGC 1068 (From Greenhill & Gwinn 1997).
tial distribution of the blueshifted clouds was resolved by the VLBI intwo clumps with a separation of 0.16 pc but, unfortunately, both thesystemic and redshifted features (which are variable) were too weakto be detected at the time of the VLBI observations. Assuming thatthe blueshifted features (which do not show any evidence of a velocitydrift) arise from the edge of a Keplerian disk, Hagiwara et al. estimatea binding mass of the order of ∼ 107 M within 0.13 pc of the nucleus,corresponding to a mass density of 2 × 10⁶ Mpc−3. VLBI imaging ofthe redshifted features will be necessary to exclude different scenarios,for instance one in which the highly blueshifted velocity of the maserfeatures might trace outflowing gas surrounding the active nucleus.
IC 2560: H2O emission at the systemic velocity in this Seyfert 2galaxy was detected by Braatz et al. (1996). Using single dish VLBIobservations, Ishihara et al. (2001) detected high velocity clouds sym-metrically distributed up to a 418 km s−1 on either side of the sys-temic velocity. Furthermore, they detected a secular velocity drift of the
ferrarese_ford.tex; 11/05/2004; 22:31; no v.; p.42

SUPERMASSIVE BLACK HOLES IN GALACTIC NUCLEI 43
systemic features. The high velocity clouds are not spatially resolved;however, by assuming that the maser clouds lie in a Keplerian diskinclined 90 to the line of sight, Ishihara et al. measure a SBH massof 2.8× 10⁶ M within 0.068 pc, giving a density in excess of 2.1 ×10⁹
Mpc−3.NGC 4945: Greenhill, Moran & Herrnstein (1997) reported on
VLBA observations of this starburst/Seyfert 2 galaxy. H2O emissionat ∼ 150 km s−1 is found symmetrically distributed on both sides ofthe systemic features. The rotation curve, however, is not as cleanlyKeplerian as in the case of NGC 4258. Greenhill, Moran & Herrnsteinnote that while on the blue side the the velocities roughly decline withangular distance from the systemic emission, “the position errors aresignificant, the redshifted emission does not appear to mirror this struc-ture, the decline in velocity for the blueshifted emission is faster thanwhat is characteristic for a Keplerian rotation curve, and the non-point-source emission that seems to exist at some systemic and blueshiftedvelocities could not be mapped.” If the maser clouds are distributed ina Keplerian disk, the implied binding mass would be ∼ 106 M withina volume of radius ∼ 0.3 pc.
NGC 3079: The high velocity (∼ 500 km s−1 relative to systemic)water maser features in NGC 3079 were studied with the VLBA byTrotter et al. (1998). The galaxy, which has a LINER nucleus, featuresa large scale (∼ 700 pc), rotating molecular ring (Young, Claussen, &Scoville 1988; Sofue & Irwin 1992). The H2O maser clouds are confinedwithin 0.5 pc of the center, but their distribution and velocity struc-ture is consistent with them belonging to an “inward” extension ofthe molecular disk. In a simple Keplerian approximation, the impliedbinding mass is ∼ 106 M, although Trotter et al. note that “thevelocity dispersion of clumps within the distribution and the sugges-tion of internal velocity gradients within the clumps indicate that nonrotational, possibly turbulent motions are significant. The masers mayarise in shocks driven by a wide opening-angle nuclear wind.”
Circinus: Greenhill et al. (2003) used VLBA observations to resolvethe maser clouds into two distinct morphological and kinematical com-ponents. Some of the clouds trace a warped accretion disk extendingfrom 0.1 pc to 0.4 pc from the center of this galaxy, with a peak rota-tional speed of 260 km s−1. A second population of clouds defines awide-angle bipolar outflow up to 1 pc from the center. The cloudsbelonging to the disk follow a Keplerian rotation curve rather closely(Figure 19), implying a central mass of (1.7 ± 0.3) × 106 M, cor-responding to a mass density of (3.2 ± 0.9) × 108 Mpc−3. Greenhillet al. note that the inclination of the disk could not be measured direct-ly, and therefore “formally, the mass and density estimates depend on
ferrarese_ford.tex; 11/05/2004; 22:31; no v.; p.43
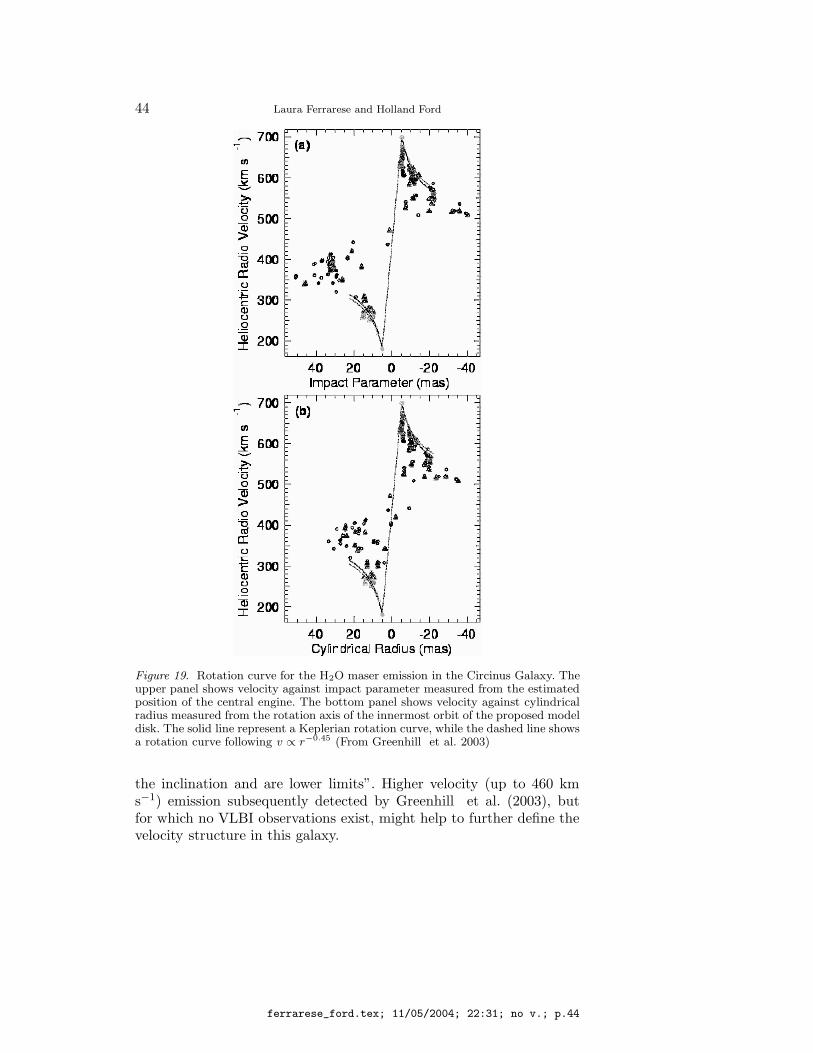
44 Laura Ferrarese and Holland Ford
Figure 19. Rotation curve for the H2O maser emission in the Circinus Galaxy. Theupper panel shows velocity against impact parameter measured from the estimatedposition of the central engine. The bottom panel shows velocity against cylindricalradius measured from the rotation axis of the innermost orbit of the proposed modeldisk. The solid line represent a Keplerian rotation curve, while the dashed line showsa rotation curve following v ∝ r−0.45 (From Greenhill et al. 2003)
the inclination and are lower limits”. Higher velocity (up to 460 kms−1) emission subsequently detected by Greenhill et al. (2003), butfor which no VLBI observations exist, might help to further define thevelocity structure in this galaxy.
ferrarese_ford.tex; 11/05/2004; 22:31; no v.; p.44
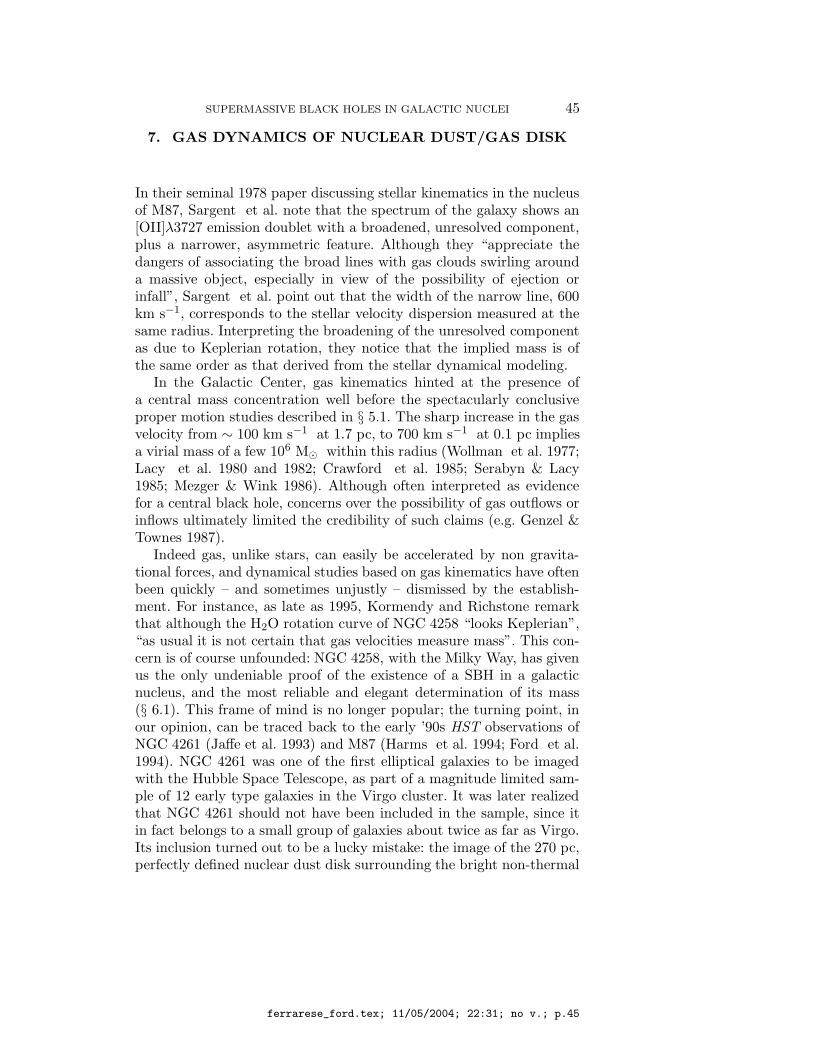
SUPERMASSIVE BLACK HOLES IN GALACTIC NUCLEI 45
7. GAS DYNAMICS OF NUCLEAR DUST/GAS DISK
In their seminal 1978 paper discussing stellar kinematics in the nucleusof M87, Sargent et al. note that the spectrum of the galaxy shows an[OII]λ3727 emission doublet with a broadened, unresolved component,plus a narrower, asymmetric feature. Although they “appreciate thedangers of associating the broad lines with gas clouds swirling arounda massive object, especially in view of the possibility of ejection orinfall”, Sargent et al. point out that the width of the narrow line, 600km s−1, corresponds to the stellar velocity dispersion measured at thesame radius. Interpreting the broadening of the unresolved componentas due to Keplerian rotation, they notice that the implied mass is ofthe same order as that derived from the stellar dynamical modeling.
In the Galactic Center, gas kinematics hinted at the presence ofa central mass concentration well before the spectacularly conclusiveproper motion studies described in § 5.1. The sharp increase in the gasvelocity from ∼ 100 km s−1 at 1.7 pc, to 700 km s−1 at 0.1 pc impliesa virial mass of a few 106 M within this radius (Wollman et al. 1977;Lacy et al. 1980 and 1982; Crawford et al. 1985; Serabyn & Lacy1985; Mezger & Wink 1986). Although often interpreted as evidencefor a central black hole, concerns over the possibility of gas outflows orinflows ultimately limited the credibility of such claims (e.g. Genzel &Townes 1987).
Indeed gas, unlike stars, can easily be accelerated by non gravita-tional forces, and dynamical studies based on gas kinematics have oftenbeen quickly – and sometimes unjustly – dismissed by the establish-ment. For instance, as late as 1995, Kormendy and Richstone remarkthat although the H2O rotation curve of NGC 4258 “looks Keplerian”,“as usual it is not certain that gas velocities measure mass”. This con-cern is of course unfounded: NGC 4258, with the Milky Way, has givenus the only undeniable proof of the existence of a SBH in a galacticnucleus, and the most reliable and elegant determination of its mass(§ 6.1). This frame of mind is no longer popular; the turning point, inour opinion, can be traced back to the early ’90s HST observations ofNGC 4261 (Jaffe et al. 1993) and M87 (Harms et al. 1994; Ford et al.1994). NGC 4261 was one of the first elliptical galaxies to be imagedwith the Hubble Space Telescope, as part of a magnitude limited sam-ple of 12 early type galaxies in the Virgo cluster. It was later realizedthat NGC 4261 should not have been included in the sample, since itin fact belongs to a small group of galaxies about twice as far as Virgo.Its inclusion turned out to be a lucky mistake: the image of the 270 pc,perfectly defined nuclear dust disk surrounding the bright non-thermal
ferrarese_ford.tex; 11/05/2004; 22:31; no v.; p.45
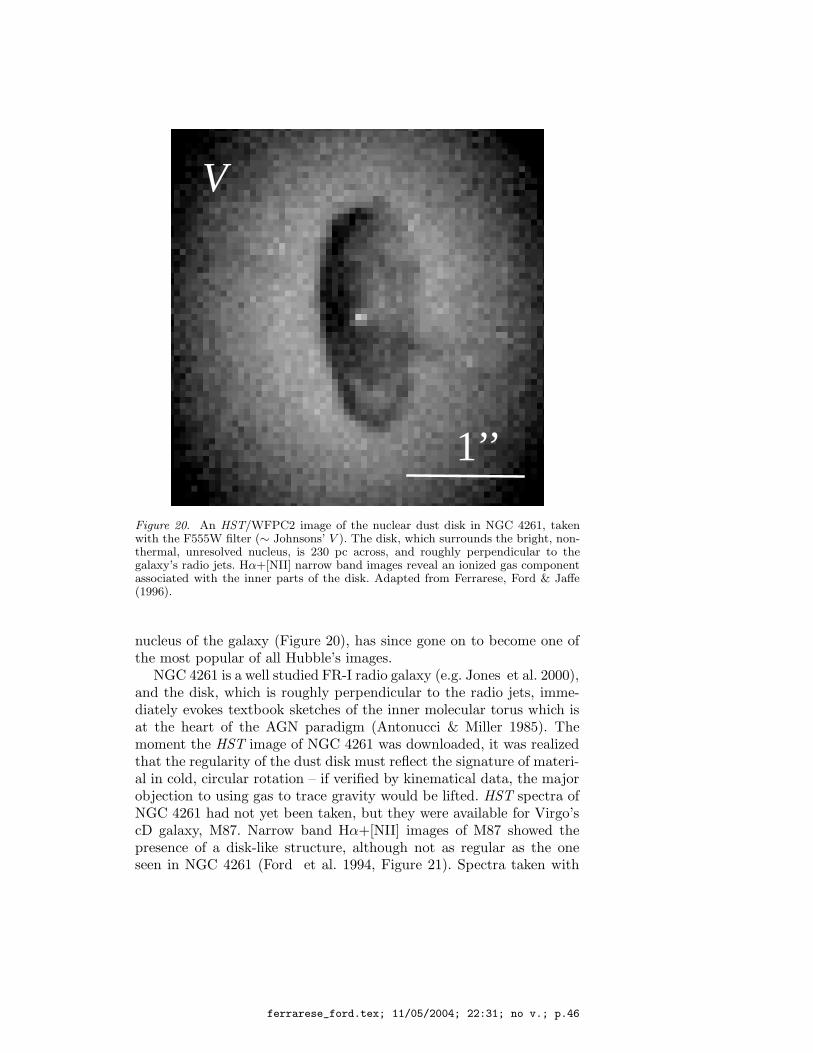
46 Laura Ferrarese and Holland Ford
V
1’’
Figure 20. An HST/WFPC2 image of the nuclear dust disk in NGC 4261, takenwith the F555W filter (∼ Johnsons’ V ). The disk, which surrounds the bright, non-thermal, unresolved nucleus, is 230 pc across, and roughly perpendicular to thegalaxy’s radio jets. Hα+[NII] narrow band images reveal an ionized gas componentassociated with the inner parts of the disk. Adapted from Ferrarese, Ford & Jaffe(1996).
nucleus of the galaxy (Figure 20), has since gone on to become one ofthe most popular of all Hubble’s images.
NGC 4261 is a well studied FR-I radio galaxy (e.g. Jones et al. 2000),and the disk, which is roughly perpendicular to the radio jets, imme-diately evokes textbook sketches of the inner molecular torus which isat the heart of the AGN paradigm (Antonucci & Miller 1985). Themoment the HST image of NGC 4261 was downloaded, it was realizedthat the regularity of the dust disk must reflect the signature of materi-al in cold, circular rotation – if verified by kinematical data, the majorobjection to using gas to trace gravity would be lifted. HST spectra ofNGC 4261 had not yet been taken, but they were available for Virgo’scD galaxy, M87. Narrow band Hα+[NII] images of M87 showed thepresence of a disk-like structure, although not as regular as the oneseen in NGC 4261 (Ford et al. 1994, Figure 21). Spectra taken with
ferrarese_ford.tex; 11/05/2004; 22:31; no v.; p.46
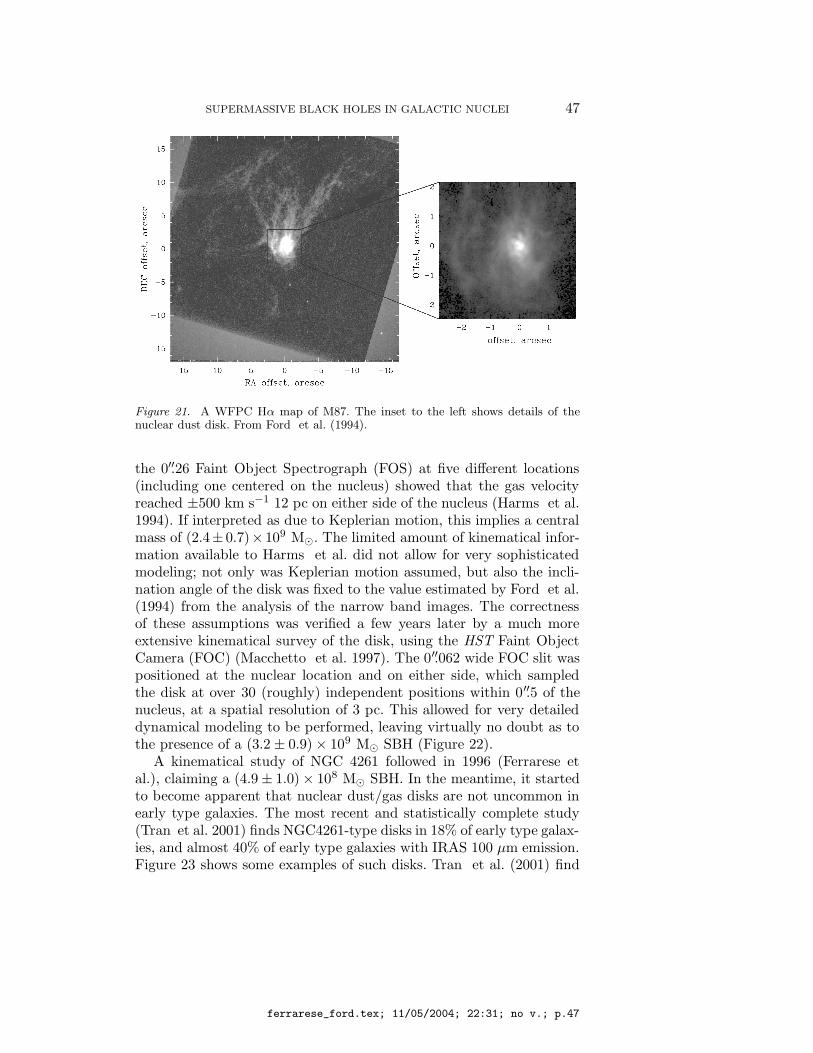
SUPERMASSIVE BLACK HOLES IN GALACTIC NUCLEI 47
Figure 21. A WFPC Hα map of M87. The inset to the left shows details of thenuclear dust disk. From Ford et al. (1994).
the 0′′.26 Faint Object Spectrograph (FOS) at five different locations(including one centered on the nucleus) showed that the gas velocityreached ±500 km s−1 12 pc on either side of the nucleus (Harms et al.1994). If interpreted as due to Keplerian motion, this implies a centralmass of (2.4± 0.7)× 109 M. The limited amount of kinematical infor-mation available to Harms et al. did not allow for very sophisticatedmodeling; not only was Keplerian motion assumed, but also the incli-nation angle of the disk was fixed to the value estimated by Ford et al.(1994) from the analysis of the narrow band images. The correctnessof these assumptions was verified a few years later by a much moreextensive kinematical survey of the disk, using the HST Faint ObjectCamera (FOC) (Macchetto et al. 1997). The 0′′.062 wide FOC slit waspositioned at the nuclear location and on either side, which sampledthe disk at over 30 (roughly) independent positions within 0′′.5 of thenucleus, at a spatial resolution of 3 pc. This allowed for very detaileddynamical modeling to be performed, leaving virtually no doubt as tothe presence of a (3.2 ± 0.9) × 109 M SBH (Figure 22).
A kinematical study of NGC 4261 followed in 1996 (Ferrarese etal.), claiming a (4.9 ± 1.0) × 108 M SBH. In the meantime, it startedto become apparent that nuclear dust/gas disks are not uncommon inearly type galaxies. The most recent and statistically complete study(Tran et al. 2001) finds NGC4261-type disks in 18% of early type galax-ies, and almost 40% of early type galaxies with IRAS 100 µm emission.Figure 23 shows some examples of such disks. Tran et al. (2001) find
ferrarese_ford.tex; 11/05/2004; 22:31; no v.; p.47
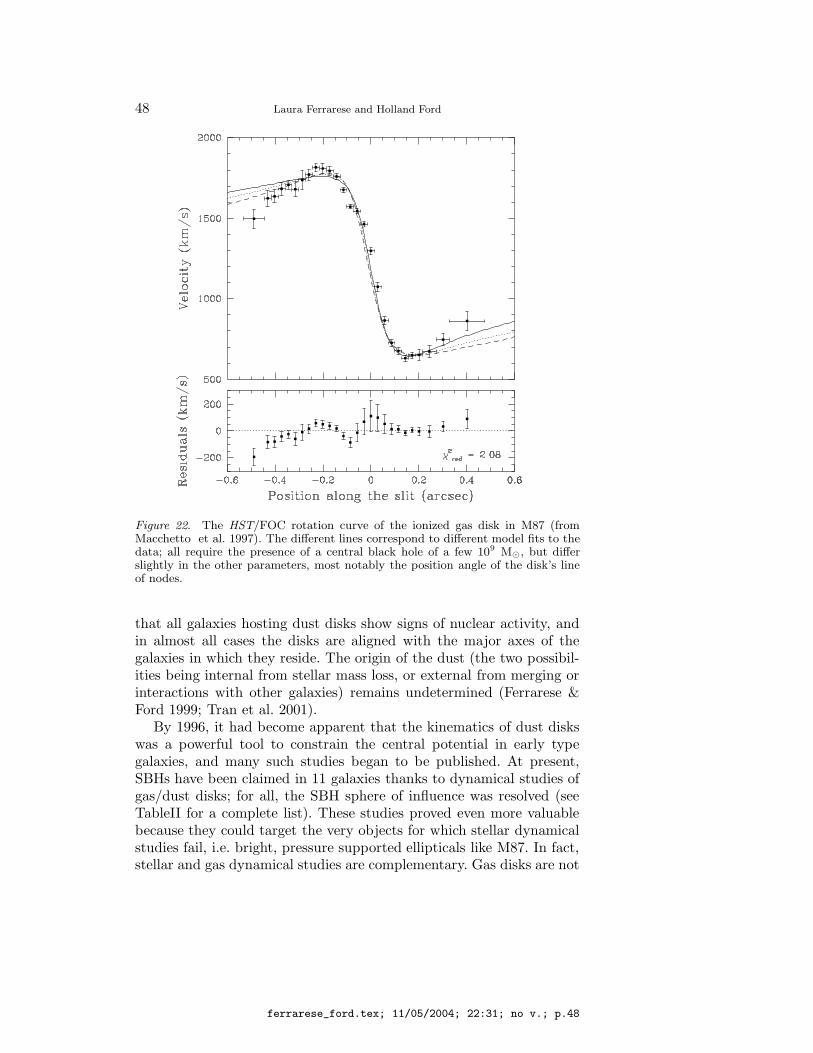
48 Laura Ferrarese and Holland Ford
Figure 22. The HST/FOC rotation curve of the ionized gas disk in M87 (fromMacchetto et al. 1997). The different lines correspond to different model fits to thedata; all require the presence of a central black hole of a few 109 M, but differslightly in the other parameters, most notably the position angle of the disk’s lineof nodes.
that all galaxies hosting dust disks show signs of nuclear activity, andin almost all cases the disks are aligned with the major axes of thegalaxies in which they reside. The origin of the dust (the two possibil-ities being internal from stellar mass loss, or external from merging orinteractions with other galaxies) remains undetermined (Ferrarese &Ford 1999; Tran et al. 2001).
By 1996, it had become apparent that the kinematics of dust diskswas a powerful tool to constrain the central potential in early typegalaxies, and many such studies began to be published. At present,SBHs have been claimed in 11 galaxies thanks to dynamical studies ofgas/dust disks; for all, the SBH sphere of influence was resolved (seeTableII for a complete list). These studies proved even more valuablebecause they could target the very objects for which stellar dynamicalstudies fail, i.e. bright, pressure supported ellipticals like M87. In fact,stellar and gas dynamical studies are complementary. Gas disks are not
ferrarese_ford.tex; 11/05/2004; 22:31; no v.; p.48
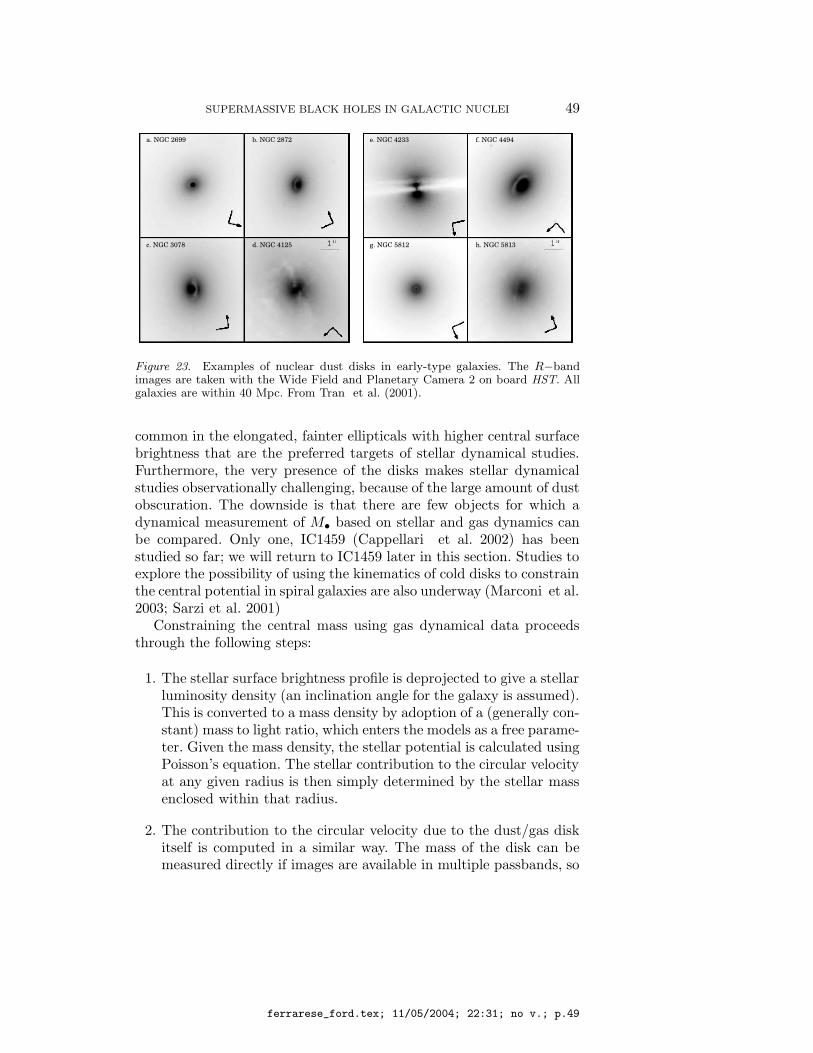
SUPERMASSIVE BLACK HOLES IN GALACTIC NUCLEI 49
a. NGC 2699 b. NGC 2872
c. NGC 3078 d. NGC 4125
e. NGC 4233 f. NGC 4494
g. NGC 5812 h. NGC 5813
Figure 23. Examples of nuclear dust disks in early-type galaxies. The R−bandimages are taken with the Wide Field and Planetary Camera 2 on board HST. Allgalaxies are within 40 Mpc. From Tran et al. (2001).
common in the elongated, fainter ellipticals with higher central surfacebrightness that are the preferred targets of stellar dynamical studies.Furthermore, the very presence of the disks makes stellar dynamicalstudies observationally challenging, because of the large amount of dustobscuration. The downside is that there are few objects for which adynamical measurement of M• based on stellar and gas dynamics canbe compared. Only one, IC1459 (Cappellari et al. 2002) has beenstudied so far; we will return to IC1459 later in this section. Studies toexplore the possibility of using the kinematics of cold disks to constrainthe central potential in spiral galaxies are also underway (Marconi et al.2003; Sarzi et al. 2001)
Constraining the central mass using gas dynamical data proceedsthrough the following steps:
1. The stellar surface brightness profile is deprojected to give a stellarluminosity density (an inclination angle for the galaxy is assumed).This is converted to a mass density by adoption of a (generally con-stant) mass to light ratio, which enters the models as a free parame-ter. Given the mass density, the stellar potential is calculated usingPoisson’s equation. The stellar contribution to the circular velocityat any given radius is then simply determined by the stellar massenclosed within that radius.
2. The contribution to the circular velocity due to the dust/gas diskitself is computed in a similar way. The mass of the disk can bemeasured directly if images are available in multiple passbands, so
ferrarese_ford.tex; 11/05/2004; 22:31; no v.; p.49
50 Laura Ferrarese and Holland Ford
that the amount of extinction can be determined. This requiresa knowledge of the visual mass absorption coefficient, reddeninglaw, and gas-to-dust mass ratio, all of which are reasonably wellconstrained (see Ferrarese & Ford 1999). The mass of the disk itselfgenerally turns out to be too small (of the order 105 - 106 M) tobe of any dynamical relevance (e.g. Ferrarese & Ford 1999; Barthet al. 2001)
3. An additional contribution to the rotational velocity comes from acentral point mass M•, which is obviously kept as a free parameterin the models.
4. The rotational velocity (which is calculated in the plane of thedisk) is projected along the line of sight. This requires knowledgeof the inclination angle of the disk. Although this should be afree parameter, it can not always be constrained from the data(e.g. Harms et al. 1994; Sarzi et al. 2001). In these cases, theinclination angle is fixed to the value measured from the images,under the assumption that the disk is flat all the way into thecenter.
5. The comparison between the line of sight velocities predicted bythe model and the observed velocities, depends on four additionalparameters: the x and y projected positions of the center of the slitrelative to the kinematical center of the disk, the angle between theline of node of the disk and the slit’s major axis, and the systemicvelocity of the disk. All are treated (if possible) as free parameters.
6. Finally, the model must be artificially “degraded” to simulate theobserving conditions: in particular, the blurring introduced by thefinite pixel size, as well as slit width must be taken into account.This step, which is very nicely described in Barth et al. (2001),depends on the emission line surface brightness within the disk, aswell as on the intrinsic and instrumental velocity dispersion of theline. The reason for this is that the contribution to the velocityobserved at any given position is given by the integrated contribu-tion at each neighboring positions, entering with a weight whichdepends on the broadening and strength of the line at each point.
7. The free parameters in the model, namely the inclination angleof the disk, the position of the center of the slit relative to thekinematical center of the disk, the angle between the line of nodeof the disk and the slit’s major axis, the systemic velocity of thedisk, the mass-to-light ratio of the stellar population, and the mass
ferrarese_ford.tex; 11/05/2004; 22:31; no v.; p.50
SUPERMASSIVE BLACK HOLES IN GALACTIC NUCLEI 51
of the central SBH, are varied until the best fit to the data areobtained.
For gas dynamical studies to be robust, a two dimensional velocityfield is essential (to be fair, the same is true of stellar dynamical studies,for which such data are never available – de Zeeuw 2003; Verolme et al.2002). In the case of gas kinematics, the 2-D velocity field is necessary toverify the critical underlying assumption that the gas motion is indeedgravitational and the gas is in equilibrium. It must be pointed out thatas long as the motion is gravitational, the gas does not necessarily haveto be in circular rotation in a geometrically thin disk for the data tobe useful. In fact, since the very first studies, it has been noted thatthe emission lines are broadened beyond what is expected from simplethermal broadening and instrumental effects (e.g. Ferrarese et al. 1996;Ferrarese & Ford 1999; van der Marel & van den Bosch 1998; VerdoesKleijn et al. 2000; Barth et al. 2001). The origin of the broadeningis not well understood and has been interpreted either as microturbo-lence within the disk (Ferrarese & Ford 1999; van der Marel & van denBosch 1998; Marconi et al. 2003) or as evidence of non-circular motion,as could be expected if the gas is fragmented into collisionless cloudsthat move ballistically, providing hydrostatic support against gravity(Verdoes Kleijn et al. 2000; Barth et al. 2001; Cappellari et al. 2002).In their analysis of NGC 3245, Barth et al. conclude that the massof the central SBH should be increased by 12% to account for non-circular motions. In either case, turbulence and asymmetric drifts canand have been successfully incorporated in the modeling (e.g. VerdoesKleijn et al. 2000; Barth et al. 2001), although doing so requires highS/N data with a wide spatial coverage.
Cases in which the gas is affected by non-gravitational motions or isnot in equilibrium can also be recognized from high resolution kinemat-ic maps of the ionized gas. In NGC 4041, a quiescent Sbc spiral, Marconiet al. (2003) remark that the systematic blueshift of the disk relativeto systemic velocity might be evidence that the disk is kinematicallydecoupled. They conclude that only an upper limit, of 2× 10⁷ M, canbe put on the central mass. Cappellari et al. (2002) conclude that non-gravitational motions might indeed be present in the case of IC 1459, forwhich the ionized gas shows no indication of rotation in the inner 1′′. IC1459 is the only galaxy for which a SBH mass estimate exists based bothon gas and stellar kinematics (Cappellari et al. 2002). Three-integralmodels applied to the stellar kinematics produce M• = (2.6±1.1)×109
M, while the gas kinematics produces estimates between a few ×108
and 109 M, depending on the assumptions made regarding the natureof the gas velocity dispersion. Unfortunately, the authors express strong
ferrarese_ford.tex; 11/05/2004; 22:31; no v.; p.51
52 Laura Ferrarese and Holland Ford
reservations as to the reliability of either mass estimate. As mentionedabove, there is evidence that the gas motion might not be completelygravitational, which would invalidate the method entirely. On the otherhand, they also note that the HST stellar spectra “do not show anyobvious evidence for the presence of a BH”, and conclude that the “BHmass determination [in IC 1459] via the stellar kinematics should betreated with caution”.
Other systematics in gas dynamical study are of a more techni-cal nature. Maciejewski & Binney (2001) point out that neglecting toaccount for the finite size of a wide slit can introduce systematic errorsin the measured masses. The reason for this is that if the slit is widerthan the instrumental resolution, the position and velocity informationbecome entangled. As a consequence, intrinsically gaussian emissionlines profiles could become asymmetric or even display multiple peaks.The degree to which this takes place is very sensitive not only to theslit width (relative to the instrumental PSF), but also to the gradientin the velocity field: spectra for galaxies with large velocity gradients,and observed with wide slits, are affected the most. From a practi-cal point of view, if the features artificially introduced by the slit inthe line profiles are mistaken for distinct kinematical components, themeasurement of the rotational velocity, and therefore the estimate ofM•, could be affected. Maciejewski & Binney indeed argue that thiscould be the case for Bower et al’s 1998 HST/STIS observations ofM84, observed with a 0′′.2 slit, and estimate that Bower et al. masscould have been overestimated by as much as a factor 4 because of thiseffect. The earlier observations which used FOS aperture spectroscopymatched to the FOS resolution (Harms et al. 1994; Ferrarese et al.1996; Ferrarese et al. 1999) as well as the FOC observations of M87(Macchetto et al. 1997), which used a very narrow slit, are not affectedby this bias. The most recent investigations (Cappellari et al. 2002;Verdoes Kleijn et al. 2000; Barth et al. 2001) take the finite slit widthinto account.
In view of the above discussion, gas kinematics is a transparentand therefore potentially powerful tracer of the central potential – inour view more so than stellar kinematics. The criticism that gas canbe subject to non gravitational motions is a strength rather than aweakness. Non gravitational motions can be recognized from the data,and detecting them leaves no doubt that the data are unsuitable fordynamical studies. The modeling is more transparent than in the caseof stellar dynamics. Either the Keplerian motion is detected or it isn’t– in the first case a SBH mass can be measured, in the second it can’t.Proof of this is that there have been no SBH detections based on gaskinematical data which did not resolve the sphere of influence. This is
ferrarese_ford.tex; 11/05/2004; 22:31; no v.; p.52
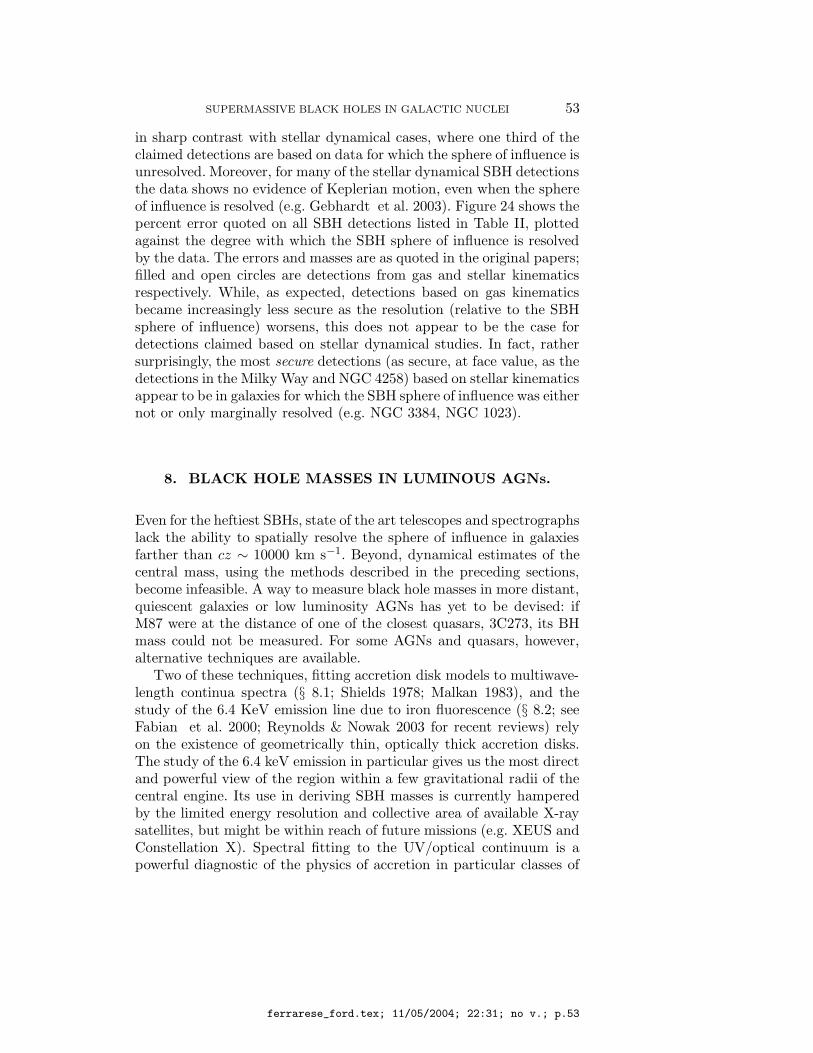
SUPERMASSIVE BLACK HOLES IN GALACTIC NUCLEI 53
in sharp contrast with stellar dynamical cases, where one third of theclaimed detections are based on data for which the sphere of influence isunresolved. Moreover, for many of the stellar dynamical SBH detectionsthe data shows no evidence of Keplerian motion, even when the sphereof influence is resolved (e.g. Gebhardt et al. 2003). Figure 24 shows thepercent error quoted on all SBH detections listed in Table II, plottedagainst the degree with which the SBH sphere of influence is resolvedby the data. The errors and masses are as quoted in the original papers;filled and open circles are detections from gas and stellar kinematicsrespectively. While, as expected, detections based on gas kinematicsbecame increasingly less secure as the resolution (relative to the SBHsphere of influence) worsens, this does not appear to be the case fordetections claimed based on stellar dynamical studies. In fact, rathersurprisingly, the most secure detections (as secure, at face value, as thedetections in the Milky Way and NGC 4258) based on stellar kinematicsappear to be in galaxies for which the SBH sphere of influence was eithernot or only marginally resolved (e.g. NGC 3384, NGC 1023).
8. BLACK HOLE MASSES IN LUMINOUS AGNs.
Even for the heftiest SBHs, state of the art telescopes and spectrographslack the ability to spatially resolve the sphere of influence in galaxiesfarther than cz ∼ 10000 km s−1. Beyond, dynamical estimates of thecentral mass, using the methods described in the preceding sections,become infeasible. A way to measure black hole masses in more distant,quiescent galaxies or low luminosity AGNs has yet to be devised: ifM87 were at the distance of one of the closest quasars, 3C273, its BHmass could not be measured. For some AGNs and quasars, however,alternative techniques are available.
Two of these techniques, fitting accretion disk models to multiwave-length continua spectra (§ 8.1; Shields 1978; Malkan 1983), and thestudy of the 6.4 KeV emission line due to iron fluorescence (§ 8.2; seeFabian et al. 2000; Reynolds & Nowak 2003 for recent reviews) relyon the existence of geometrically thin, optically thick accretion disks.The study of the 6.4 keV emission in particular gives us the most directand powerful view of the region within a few gravitational radii of thecentral engine. Its use in deriving SBH masses is currently hamperedby the limited energy resolution and collective area of available X-raysatellites, but might be within reach of future missions (e.g. XEUS andConstellation X). Spectral fitting to the UV/optical continuum is apowerful diagnostic of the physics of accretion in particular classes of
ferrarese_ford.tex; 11/05/2004; 22:31; no v.; p.53

54 Laura Ferrarese and Holland Ford
Figure 24. The percent error quoted on all SBH detections made using resolvedstellar (open circles) or gas (filled circles) dynamical studies (Table II), plottedagainst the degree by which the SBH sphere of influence is resolved by the data.
AGNs. However, because of their complexity, the models cannot yetreliably measure SBH masses in individual objects.
The other two techniques we will discuss rely on spectral observa-tions of the broad optical emission lines which characterize the spectraof Seyfert 1 galaxies and quasars. One of these, reverberation mapping,has great potential. The method, which can be applied to Seyfert 1galaxies and quasars with a variable continuum source, is extremelydemanding from an observational standpoint, but the theoretical for-malism is well described, and a better understanding of the systematicsis well underway. Photoionization models applied to the BLR, on theother hand, require only simple observations, but rely on a heavy setof assumptions. Their usefulness is mainly statistical.
Finally, we will discuss some “secondary mass estimators”. These arebased on empirical relations between SBH masses (or quantities relat-ed to the masses) and other, easily measurable, AGN properties. Suchrelations can be calibrated using galaxies for which the SBH mass is
ferrarese_ford.tex; 11/05/2004; 22:31; no v.; p.54
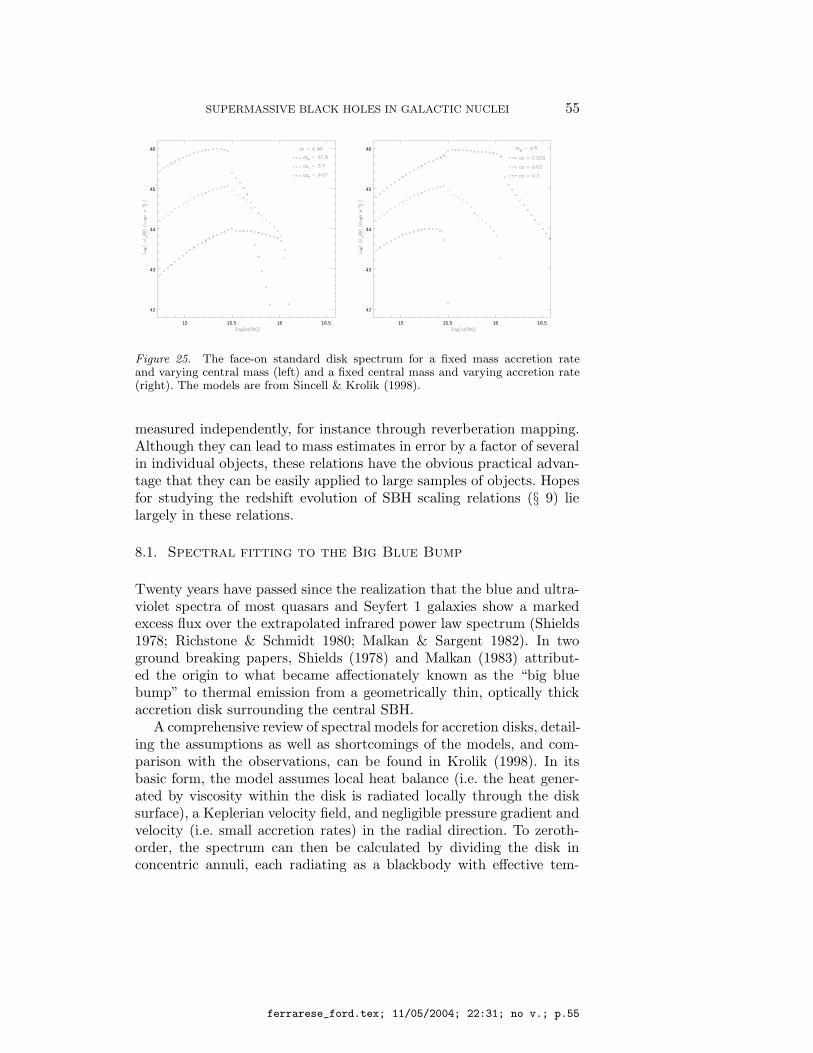
SUPERMASSIVE BLACK HOLES IN GALACTIC NUCLEI 55
15 15.5 16 16.5
42
43
44
45
46
15 15.5 16 16.5
42
43
44
45
46
Figure 25. The face-on standard disk spectrum for a fixed mass accretion rateand varying central mass (left) and a fixed central mass and varying accretion rate(right). The models are from Sincell & Krolik (1998).
measured independently, for instance through reverberation mapping.Although they can lead to mass estimates in error by a factor of severalin individual objects, these relations have the obvious practical advan-tage that they can be easily applied to large samples of objects. Hopesfor studying the redshift evolution of SBH scaling relations (§ 9) lielargely in these relations.
8.1. Spectral fitting to the Big Blue Bump
Twenty years have passed since the realization that the blue and ultra-violet spectra of most quasars and Seyfert 1 galaxies show a markedexcess flux over the extrapolated infrared power law spectrum (Shields1978; Richstone & Schmidt 1980; Malkan & Sargent 1982). In twoground breaking papers, Shields (1978) and Malkan (1983) attribut-ed the origin to what became affectionately known as the “big bluebump” to thermal emission from a geometrically thin, optically thickaccretion disk surrounding the central SBH.
A comprehensive review of spectral models for accretion disks, detail-ing the assumptions as well as shortcomings of the models, and com-parison with the observations, can be found in Krolik (1998). In itsbasic form, the model assumes local heat balance (i.e. the heat gener-ated by viscosity within the disk is radiated locally through the disksurface), a Keplerian velocity field, and negligible pressure gradient andvelocity (i.e. small accretion rates) in the radial direction. To zeroth-order, the spectrum can then be calculated by dividing the disk inconcentric annuli, each radiating as a blackbody with effective tem-
ferrarese_ford.tex; 11/05/2004; 22:31; no v.; p.55

56 Laura Ferrarese and Holland Ford
perature steadily decreasing outwards. While several problems can beidentified, most notably the fact that the accretion rates derived oftenexceed the limit above which the disk ceases to be geometrically thin(Szuszkiewicz, Malkan & Abramowicz 1996), this simple model canreproduce the blue/UV part of the spectrum reasonably well, givenonly three parameters: the mass of the central SBH, the mass accre-tion rate, and the inclination angle of the disk. More complex andrealistic models have been explored since then, and include relativis-tic effects in inclined disks surrounding both Kerr and SchwarzschildSBHs (Sun & Malkan 1989), modification to the black body spectrumdue to electron scattering, comptonization and irradiation of the sur-face of the disk by an external X-ray source (Ross, Fabian & Mineshige1992; Siemiginowska et al. 1995), and the presence of an inner shockfront inside which the flow becomes supersonic, and the disk gives wayto a hot, ionized, pressure supported torus. Geometrically thick disksable to support accretion rates comparable to the Eddington rate havealso been studied (Szuszkiewicz, Malkan & Abramowicz 1996; Sincell& Krolik 1998; Wang et al. 1999).
Spectral fitting to the optical/UV/soft X-ray continuum providesa powerful tool to study the physical mechanisms that regulate AGNactivity. Its value in measuring SBH masses is however limited. Thepotential systematic errors in the derived masses are large, due to thecomplex, and largely unknown, physical processes at play. Furthermore,the models rarely do a good job at fitting the available data, and oftenthe SBH mass and other parameters enter the models in a degenerateway. For instance, Figure 25 (from Sincell & Krolik 1998) shows thatthe shape of the spectrum is determined mainly by the ratio of theSBH mass to the accretion rate, rather than by the two quantitiesindependently. A similar conclusion is also reached by Szuszkiewicz,Malkan & Abramowicz (1996).
8.2. The Iron Kα Emission Line
X-ray production in Galactic black hole candidates as well as Seyfertnuclei is generally credited to inverse Compton scattering of soft opti-cal/UV photons off a population of hot electrons (Thorne & Price 1975;Sunyaev & Truemper 1979; Zdziarski et al. 1994). While the details ofthe model are not entirely agreed upon (see for instance the excellentreview in Reynolds & Nowak 2003) the general picture is that of a geo-metrically thin, optically thick accretion disk generating UV photons,and surrounded by a Comptonizing population of thermal electrons inthe form of a hot corona, produced by evaporation at the surface of thedisk. The hard X-rays produced in the hot corona irradiate and are in
ferrarese_ford.tex; 11/05/2004; 22:31; no v.; p.56
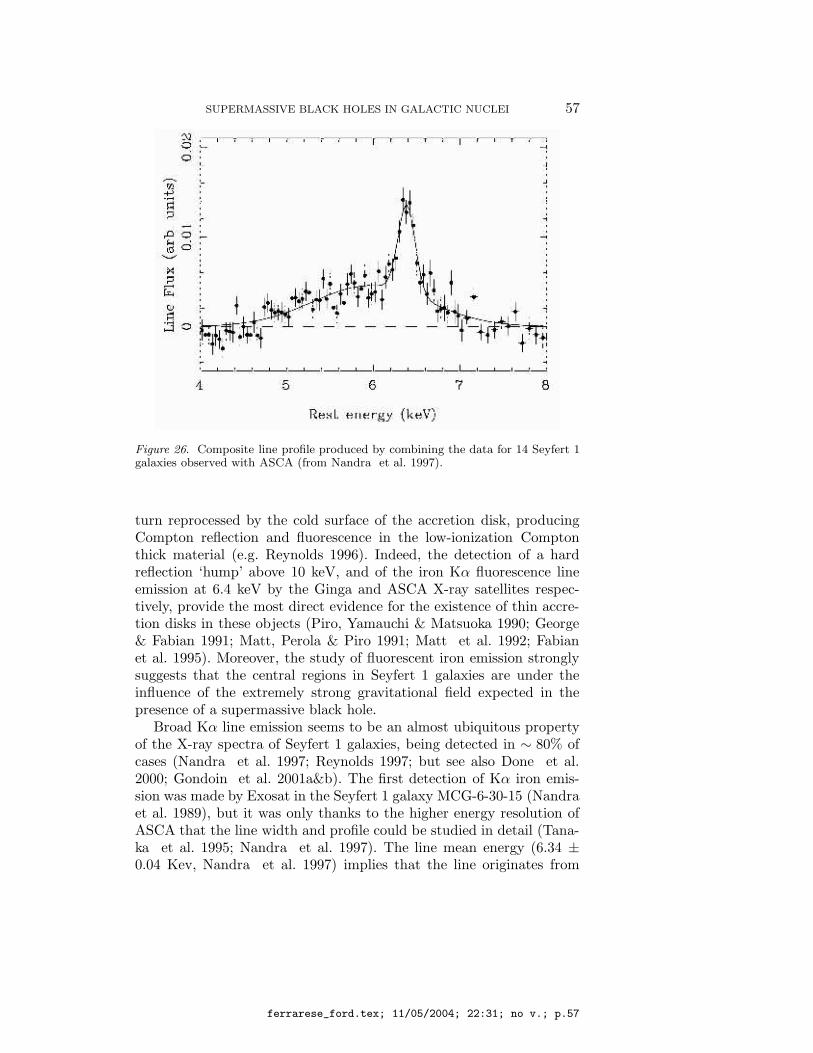
SUPERMASSIVE BLACK HOLES IN GALACTIC NUCLEI 57
Figure 26. Composite line profile produced by combining the data for 14 Seyfert 1galaxies observed with ASCA (from Nandra et al. 1997).
turn reprocessed by the cold surface of the accretion disk, producingCompton reflection and fluorescence in the low-ionization Comptonthick material (e.g. Reynolds 1996). Indeed, the detection of a hardreflection ‘hump’ above 10 keV, and of the iron Kα fluorescence lineemission at 6.4 keV by the Ginga and ASCA X-ray satellites respec-tively, provide the most direct evidence for the existence of thin accre-tion disks in these objects (Piro, Yamauchi & Matsuoka 1990; George& Fabian 1991; Matt, Perola & Piro 1991; Matt et al. 1992; Fabianet al. 1995). Moreover, the study of fluorescent iron emission stronglysuggests that the central regions in Seyfert 1 galaxies are under theinfluence of the extremely strong gravitational field expected in thepresence of a supermassive black hole.
Broad Kα line emission seems to be an almost ubiquitous propertyof the X-ray spectra of Seyfert 1 galaxies, being detected in ∼ 80% ofcases (Nandra et al. 1997; Reynolds 1997; but see also Done et al.2000; Gondoin et al. 2001a&b). The first detection of Kα iron emis-sion was made by Exosat in the Seyfert 1 galaxy MCG-6-30-15 (Nandraet al. 1989), but it was only thanks to the higher energy resolution ofASCA that the line width and profile could be studied in detail (Tana-ka et al. 1995; Nandra et al. 1997). The line mean energy (6.34 ±0.04 Kev, Nandra et al. 1997) implies that the line originates from
ferrarese_ford.tex; 11/05/2004; 22:31; no v.; p.57
58 Laura Ferrarese and Holland Ford
fluorescence in the cold, low ionization (<FeXVI), thin (0.1% to 1%of the total disk’s thickness) outer layer of the accretion disk (Fabianet al. 2000). The line is expected to be intrinsically narrow, but ASCArevealed it to be extremely broad and significantly skewed. Figure 26 isa composite line profile produced by combining the data for 14 Seyfert1 galaxies observed with ASCA (from Nandra et al. 1997). The fullwidth at zero intensity exceeds ∼ 2 keV, or 0.3c. The narrow (∼ 0.1eV) blue peak of the line is centered around the rest wavelength of6.4 keV, but the line itself extends dramatically to the red. The lineprofile can be reproduced remarkably well if it is assumed to originatefrom a rapidly spinning accretion disk within a few gravitational radiiof the central SBH. The disk rotation splits the line in two (in analogywith HI line emission in the outer disks of spiral galaxies). Relativisticbeaming enhances the blue over the red component, and gravitationalredshift strongly smears the emission from the innermost regions of thedisk into an extended red wing. While the blue peak moves progres-sively to higher frequencies the higher the inclination (more edge on) ofthe disk, the redward extent of the line is more strongly influenced byrelativistic effects, and is a sensitive function of the innermost radiusof the line emitting region. Alternative explanations to describe theline profile were suggested by Fabian et al. (1995) but quickly reject-ed; these include Comptonization producing a net redshift of the line,jet and outflow geometries producing a marked asymmetric profile, orphotoelectric absorption cutting into the blue side of the line.
In the surviving disk interpretation, the iron Kα line becomes apowerful testbed for the immediate environment around the centralSBH, as well as a unique tool for testing our knowledge of the propertiesof space and time in very strong gravitational fields. The line profilecan not only be used to determine the inclination of the accretion diskbut also the spin of the central black hole (albeit with some ambiguity:see discussion in Reynolds & Nowak 2003); if the line emitting gasextends all the way to the innermost stable orbit rst, a much broaderand more extended red wing is expected for a maximally rotating SBHthan for a static one, as a consequence of the shrinkage of rst in aKerr metric (§ 2; Fabian et al. 1989; Laor 1991; Martocchia & Matt1996; Reynolds & Nowak 2003). Indeed, ASCA and XMM observationsof MCG-6-30-15 are best explained under the assumption of an almostmaximally spinning SBH (Iwasawa 1996; Dabrowski et al. 1997; Wilmset al. 2001). We mention in passing that in the cases studied in detail,the line profile points to an average inclination angle for the disk of 30
(Nandra et al. 1997), consistent with the postulates of the unificationmodels of AGNs (Antonucci 1993). Most of the emission is produced
ferrarese_ford.tex; 11/05/2004; 22:31; no v.; p.58
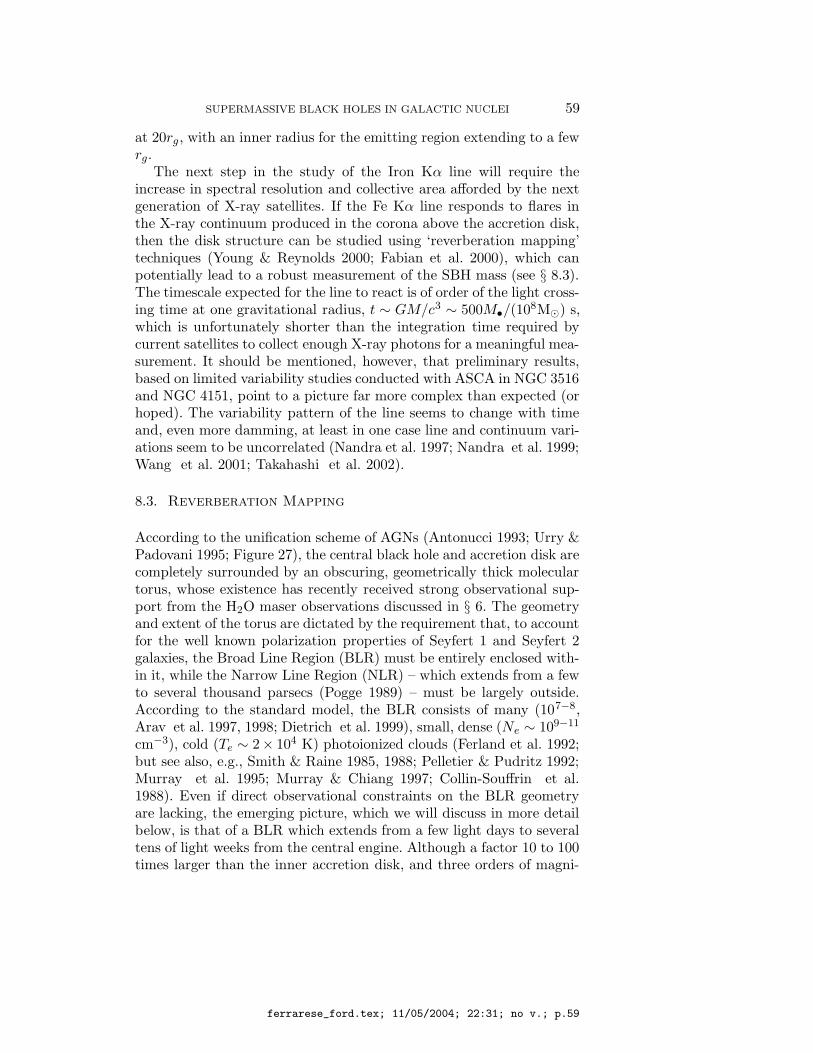
SUPERMASSIVE BLACK HOLES IN GALACTIC NUCLEI 59
at 20rg, with an inner radius for the emitting region extending to a fewrg.
The next step in the study of the Iron Kα line will require theincrease in spectral resolution and collective area afforded by the nextgeneration of X-ray satellites. If the Fe Kα line responds to flares inthe X-ray continuum produced in the corona above the accretion disk,then the disk structure can be studied using ‘reverberation mapping’techniques (Young & Reynolds 2000; Fabian et al. 2000), which canpotentially lead to a robust measurement of the SBH mass (see § 8.3).The timescale expected for the line to react is of order of the light cross-ing time at one gravitational radius, t ∼ GM/c3 ∼ 500M•/(10
8M) s,which is unfortunately shorter than the integration time required bycurrent satellites to collect enough X-ray photons for a meaningful mea-surement. It should be mentioned, however, that preliminary results,based on limited variability studies conducted with ASCA in NGC 3516and NGC 4151, point to a picture far more complex than expected (orhoped). The variability pattern of the line seems to change with timeand, even more damming, at least in one case line and continuum vari-ations seem to be uncorrelated (Nandra et al. 1997; Nandra et al. 1999;Wang et al. 2001; Takahashi et al. 2002).
8.3. Reverberation Mapping
According to the unification scheme of AGNs (Antonucci 1993; Urry &Padovani 1995; Figure 27), the central black hole and accretion disk arecompletely surrounded by an obscuring, geometrically thick moleculartorus, whose existence has recently received strong observational sup-port from the H2O maser observations discussed in § 6. The geometryand extent of the torus are dictated by the requirement that, to accountfor the well known polarization properties of Seyfert 1 and Seyfert 2galaxies, the Broad Line Region (BLR) must be entirely enclosed with-in it, while the Narrow Line Region (NLR) – which extends from a fewto several thousand parsecs (Pogge 1989) – must be largely outside.According to the standard model, the BLR consists of many (107−8,Arav et al. 1997, 1998; Dietrich et al. 1999), small, dense (Ne ∼ 109−11
cm−3), cold (Te ∼ 2× 10⁴ K) photoionized clouds (Ferland et al. 1992;but see also, e.g., Smith & Raine 1985, 1988; Pelletier & Pudritz 1992;Murray et al. 1995; Murray & Chiang 1997; Collin-Souffrin et al.1988). Even if direct observational constraints on the BLR geometryare lacking, the emerging picture, which we will discuss in more detailbelow, is that of a BLR which extends from a few light days to severaltens of light weeks from the central engine. Although a factor 10 to 100times larger than the inner accretion disk, and three orders of magni-
ferrarese_ford.tex; 11/05/2004; 22:31; no v.; p.59
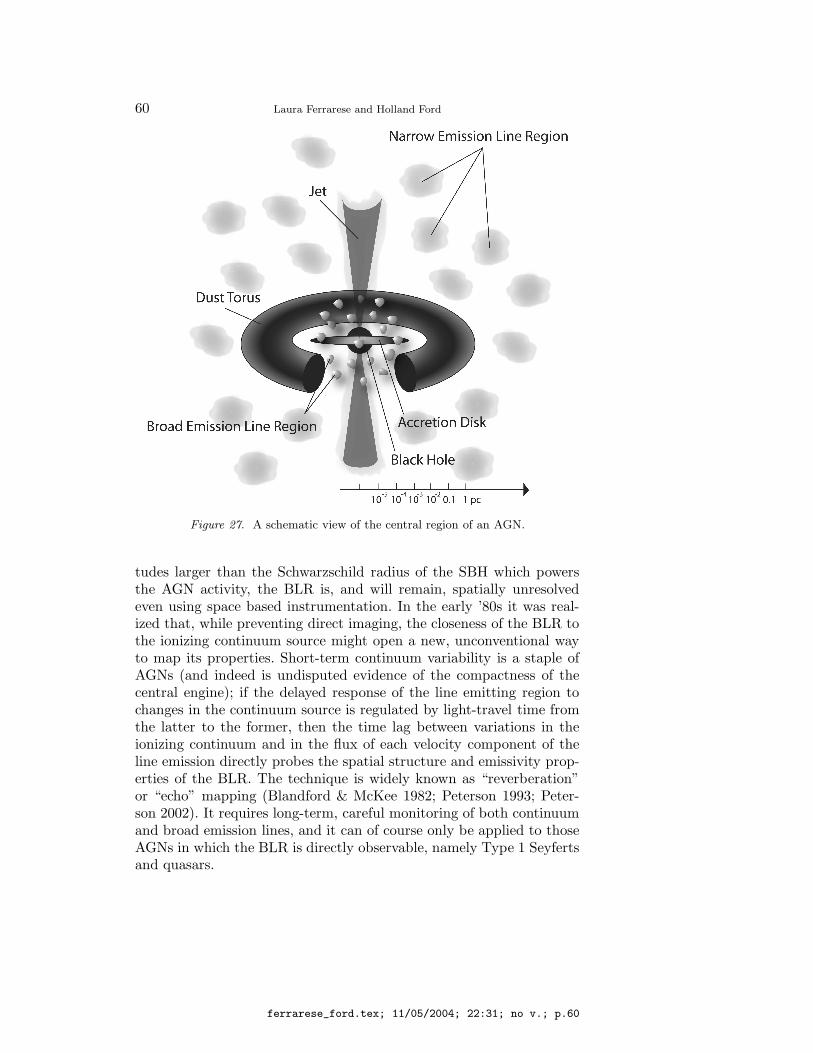
60 Laura Ferrarese and Holland Ford
Figure 27. A schematic view of the central region of an AGN.
tudes larger than the Schwarzschild radius of the SBH which powersthe AGN activity, the BLR is, and will remain, spatially unresolvedeven using space based instrumentation. In the early ’80s it was real-ized that, while preventing direct imaging, the closeness of the BLR tothe ionizing continuum source might open a new, unconventional wayto map its properties. Short-term continuum variability is a staple ofAGNs (and indeed is undisputed evidence of the compactness of thecentral engine); if the delayed response of the line emitting region tochanges in the continuum source is regulated by light-travel time fromthe latter to the former, then the time lag between variations in theionizing continuum and in the flux of each velocity component of theline emission directly probes the spatial structure and emissivity prop-erties of the BLR. The technique is widely known as “reverberation”or “echo” mapping (Blandford & McKee 1982; Peterson 1993; Peter-son 2002). It requires long-term, careful monitoring of both continuumand broad emission lines, and it can of course only be applied to thoseAGNs in which the BLR is directly observable, namely Type 1 Seyfertsand quasars.
ferrarese_ford.tex; 11/05/2004; 22:31; no v.; p.60
SUPERMASSIVE BLACK HOLES IN GALACTIC NUCLEI 61
In practice, reverberation mapping has so far failed to deliver a pic-ture of the central regions of AGNs, not because of fundamental flawsin the theoretical reasoning, but rather because of inadequate obser-vational data, a fact that could, and hopefully will, be rectified byfuture, dedicated spacecraft missions (Peterson 2003). Past and cur-rent experiments have however led to accurate measurements of thetime delay between velocity-integrated line emission variations, andcontinuum flux, which can (but see Krolik 2001) be taken as a mea-sure of the average BLR size. If assumptions are made regarding thegeometry of the BLR, and it is further argued that the motion of theclouds is gravitational, then the binding mass can be rather triviallyderived from the virial theorem: M = frσ2/G. Here, the BLR radiusr is known from the reverberation measurements, the mean velocity σis given by the emission line width, and the factor f depends on thegeometry and kinematics of the BLR.
As a mass estimator, reverberation mapping has several importantadvantages. First, the region probed is only a factor 1000 beyond theSchwarzschild radius of the central SBH. This might seem large, but itis still at least a thousand times closer to the central engine than theinnermost radius reached by ‘traditional’ methods based on resolvedkinematics. The implied mass densities (Table I) are in excess of 1010
M pc−3, leaving little doubt that if the measurements can indeedestablish a mass reliabily, this must belong to a supermassive blackhole, since no cluster configuration could be stable under these condi-tions (e.g. Rees 1984). Second, bright Type 1 AGNs, the ideal targets ofreverberation mapping, cannot be easily probed using standard tech-niques, precisily because the bright AGN continuum overwhelms thedynamical signature of the gas and dust needed for resolved dynamicalstudies. Although it can be argued that Type 1 AGNs comprise only1% of the total galaxy population, exploring the SBH mass function inas many and as diverse as possible galactic environments is essentialto understand the evolutionary histories of SBHs. Third, unlike SBHmasses derived from resolved kinematics, those inferred from reverber-ation mapping do not depend on the cosmology adopted. Because theBLR size is measured directly in physical units from the time delay,the distance to the host galaxy does not enter the analysis. This meansthat the redshift to which reverberation mapping measurements can bepushed is limited only by the requirement that the AGN must be brightenough to be easily detected. Forth, reverberation mapping is intrin-sically unbiased with respect to the mass of the SBH, since spatiallyresolving the sphere of influence (whose size depends on the mass) isirrelevant. Very small SBHs can be probed as long as the monitoring
ferrarese_ford.tex; 11/05/2004; 22:31; no v.; p.61
62 Laura Ferrarese and Holland Ford
can be carried out on short enough timescales, and viceversa for verymassive SBHs.
Time lags, in some cases in multiple emission lines, have now beenmeasured for 37 AGNs (§ 8.3.1); the inferred virial masses, listed withthe appropriate references in Table IV, have formal random uncertain-ties which rival those of resolved gas and stellar dynamical studies.However, systematic uncertainties can be a factor of several or more(Krolik 2001). To date, the most compelling evidence supporting thereliability of reverberation mapping is observational; AGN reverber-ation masses obey the same scaling relations observed in quiescentgalaxies, for which SBH masses are measured using “proven” tradi-tional techniques (§ 8.3.2).
8.3.1. Results of AGN Monitoring Programs
Reverberation mapping was not originally devised with the intent ofmeasuring SBH masses – but rather as a way to probe the kinemati-cal and morphological structure of the BLR. However, for the reasonsoutlined in the previous section, it holds high promise of becoming themethod of choice for mass determinations, replacing resolved kinemat-ical studies at least in galaxies beyond a few hundred megaparsecs. Itis therefore instructive to review the observational requirements of themethod, the monitoring programs that have led to the masses listed inTable IV, and what we have learned from them about the structure ofthe BLR.
Although variability in quasars has been known since the early ’60s,and in Seyfert galaxies since the late ’60s, methodical UV/optical mon-itoring did not start until the early ’80s. The most extensive effortshave been carried out by the International AGN Watch, led by BradleyM. Peterson (Peterson 1999). The project started in the late 1980s asan IUE and ground-based optical program to monitor NGC 5548, to-date the most extensively monitored AGN, and was soon expandedto include ground based and eventually HST monitoring. Since then,the project has monitored eight additional Seyfert 1 galaxies, includingfive in more than one emission line (see Wandel, Peterson & Malkan1999 for a compilation). Additional programs were lead by Bradly M.Peterson at Ohio State University (nine previously unobserved Seyfert1s); Shai Kaspi at Wise/Steward Observatory (17 quasars, Kaspi et al.2000), and the LAG (Lovers of AGNs) consortium, to which goes ourprize for the most clever acronym. LAG, led by the late M.V. Penston,monitored eight Seyfert galaxies and quasars, three of which had notbeen previously observed (Stirpe et al. 1994 and references therein).With the exception of the International AGN Watch, which includedUV, optical and X-ray monitoring (although not for all objects), all
ferrarese_ford.tex; 11/05/2004; 22:31; no v.; p.62

SUPERMASSIVE BLACK HOLES IN GALACTIC NUCLEI 63
studies focused on optical monitoring of the continuum and Hβ emis-sion, although Hα emission was also monitored for some objects.
The fact that more progress has not been made on the observationalfront might at first seem surprising. In fact, monitoring programs areexceedingly demanding, to the point that the efforts mentioned aboveshould be considered nothing short of heroic. On the upside, Type 1AGNs are normally very bright, so large telescopes are generally notnecessary for variations in the continuum to be easily detected – indeed,all ground based monitoring has been conducted with one to two-meterclass telescopes. Photometric conditions are desirable but not strictlynecessary, since the continuum and line flux can be calibrated againsta non-variable spectral component (e.g. a narrow emission line) or bysimultaneously observing a nearby (non-variable!) star (Peterson 2002).On the downside, observing conditions must be controlled and stable, orspurious variations can easily be introduced. For instance, the amountof light from the non-variable galactic component (NLR or underly-ing galaxy) entering the spectrograph depends on seeing conditions,pointing accuracy and guiding stability. If these conditions are not con-trolled, a change in any of them could easily be mistaken for a bona-fide
variation in the AGN continuum flux. The time sampling of the datashould ideally be 10 to 30 times shorter, and the total duration of theexperiment 10 to 30 times longer, than the expected time lag (Krolik2001). This implies that spectra should be obtained a few hours to sev-eral weeks apart, depending on the size of the BLR under study, andthat monitoring should extend over a several year period for the mostmassive systems. This mandates the use of a dedicated telescope.
The results of these AGN monitoring programs are beautifully describedin Peterson (2002). They conclusively demonstrated that although vari-ations in the AGNs’ continua are aperiodic (periodicities have beensearched for but never found), they correlate tightly with and precedevariations in the broad emission lines flux (Figure 28; Peterson 2002;Onken & Peterson 2002; Onken et al. 2003)6. This is, of course, a nec-essary condition for reverberation mapping studies to be viable. It isstrong evidence that, from the perspective of the BLR, the continuumsource must be point-like; if the BLR and the continuum emission werespatially coexisting, the time delays would be chaotic, since it shouldbe quite possible to have emission line variations from one part of theBLR precede variations in the continuum from a different part (indeeda similar situation might affect the 6.4 keV Fe Kα line emission, asdiscussed in § 8.2).
6 Curiously, the physical drive for the continuum variability itself is still unclear.Some clues are given by the fact that in all of the objects studied so far, there isno apparent time delay between variations in the UV and in the optical, arguing
ferrarese_ford.tex; 11/05/2004; 22:31; no v.; p.63

64 Laura Ferrarese and Holland Ford
The time delay between continuum and optical emission line varia-tions, measured by cross-correlating the continuum and emission lightcurves, can be of days to weeks. This time delay is a direct measureof the “responsivity weighted” size of the BLR7, which is approximat-ed by the radius where physical conditions (e.g. the particle density)produce the strongest line response for a given continuum change. Theresponsivity weighted size of the BLR depends on the ionization poten-tial of the line and on the continuum flux, and therefore can changewith time. In NGC 5548, the only AGN for which there is sufficientinformation on the long term behavior of a single line (Hβ) to mea-sure both the line widths and lags as a function of time, the lag isobserved to become longer as the continuum brightens (Peterson et al.2002). This is exactly what is expected. As the continuum brightens,the radius of the Stromgren sphere, i.e. the depth to which the BLR isionized, increases, and therefore the responsivity weighted size of theemitting region becomes larger. Furthermore, when more than one lineis monitored, the highest ionization lines respond most rapidly, and arehence produced closer, on average, to the central continuum source.Although the data are quite sparse, radial (out or inflow) motions donot seem to be dominant. A radial flow would be reflected in a differ-ence between the time lag measured for the blue and red wings of theline; such difference is generally not detected (e.g. Koratkar & Gaskell1991; Wanders & Horne 1994; Wanders & Peterson 1996; O’Brien et al.1998; Sergeev et al. 2002), although a mild radial flow has been claimedby Kollatschny (2003) in the Seyfert 1 Mrk 110.
When using reverberation mapping to calculate SBH masses, theBLR velocity which enters the virial equation, M = frσ2/G, mustbe measured. This is done (relatively) easily from the FWHM of theemission lines. To avoid contamination from the non-varying compo-nents of the AGN, the line width is measured from the “rms” spectrum,where the rms is calculated relative to the mean of all spectra obtained
against mechanical instabilities in the accretion disk or random fluctuations in theaccretion rate as responsible for the fluctuations (these mechanism would propagatefrom the inner and hotter to the outer and cooler part of the disk, stimulatingvariations in the UV continuum first and in the optical later). The leading theory isthat continuum variations might be caused as the disk reprocesses the hard X-raysproduced in the surrounding corona. Further clues as to the fundamental physicsthat regulates the continuum variability (including perhaps the mass of the centralSBH, Edelson & Nandra 1999) are held in the power density spectrum of the X-rayfluctuations (e.g. Belloni & Hasinger 1990; Haardt & Maraschi 1991, 1993; Zdziarskiet al. 1994; Stern et al. 1995; Bao & Abramowicz 1996).
7 This is true only if the BLR structure does not change over the duration ofthe monitoring program. This condition is satisfied for programs shorter than thedynamical cloud crossing time, typically a few to several years. A longer monitoringprogram has been conducted only for NGC 5548.
ferrarese_ford.tex; 11/05/2004; 22:31; no v.; p.64
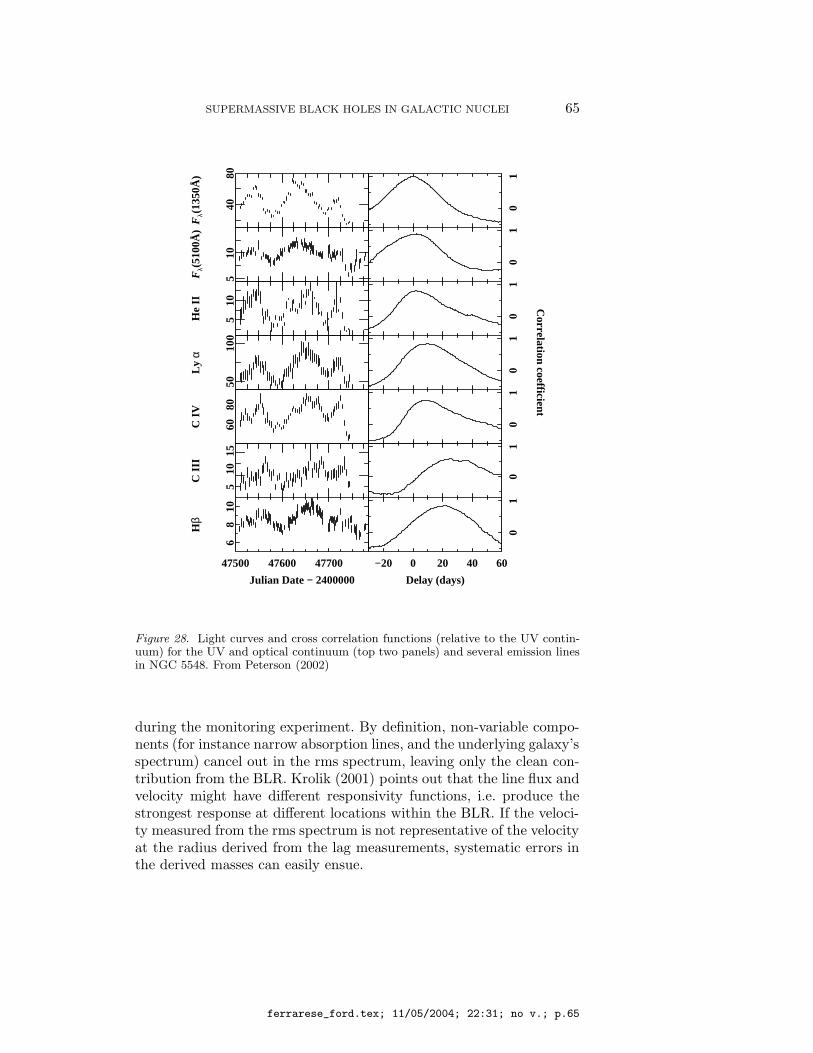
SUPERMASSIVE BLACK HOLES IN GALACTIC NUCLEI 65
47500 47600 47700
68
10
JulianDate−2400000
Hβ
4080
Fλ(
1350
Å)
510
Fλ(
5100
Å)
510
He
II
5010
0
Ly
α
6080
CI
V
510
15
CI
II
Delay(days)
−20 0 20 40 60
01
01
01
01
01
01
01
Correlationcoefficient
Figure 28. Light curves and cross correlation functions (relative to the UV contin-uum) for the UV and optical continuum (top two panels) and several emission linesin NGC 5548. From Peterson (2002)
during the monitoring experiment. By definition, non-variable compo-nents (for instance narrow absorption lines, and the underlying galaxy’sspectrum) cancel out in the rms spectrum, leaving only the clean con-tribution from the BLR. Krolik (2001) points out that the line flux andvelocity might have different responsivity functions, i.e. produce thestrongest response at different locations within the BLR. If the veloci-ty measured from the rms spectrum is not representative of the velocityat the radius derived from the lag measurements, systematic errors inthe derived masses can easily ensue.
ferrarese_ford.tex; 11/05/2004; 22:31; no v.; p.65
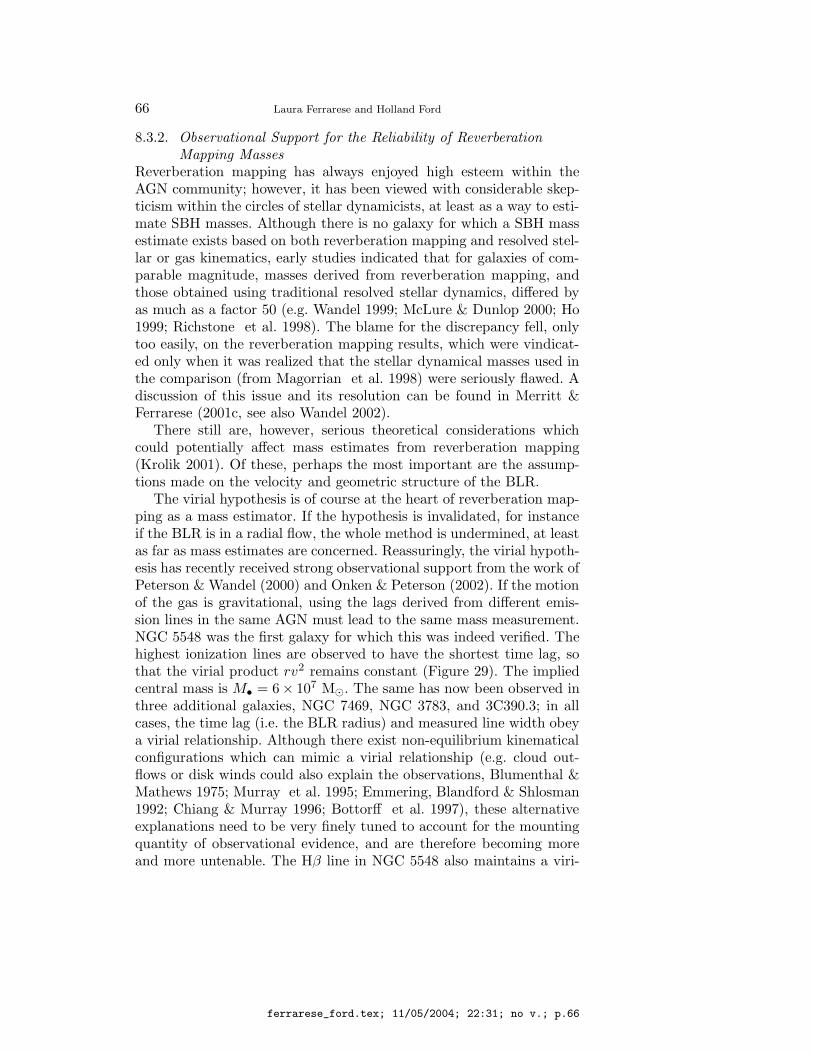
66 Laura Ferrarese and Holland Ford
8.3.2. Observational Support for the Reliability of Reverberation
Mapping Masses
Reverberation mapping has always enjoyed high esteem within theAGN community; however, it has been viewed with considerable skep-ticism within the circles of stellar dynamicists, at least as a way to esti-mate SBH masses. Although there is no galaxy for which a SBH massestimate exists based on both reverberation mapping and resolved stel-lar or gas kinematics, early studies indicated that for galaxies of com-parable magnitude, masses derived from reverberation mapping, andthose obtained using traditional resolved stellar dynamics, differed byas much as a factor 50 (e.g. Wandel 1999; McLure & Dunlop 2000; Ho1999; Richstone et al. 1998). The blame for the discrepancy fell, onlytoo easily, on the reverberation mapping results, which were vindicat-ed only when it was realized that the stellar dynamical masses used inthe comparison (from Magorrian et al. 1998) were seriously flawed. Adiscussion of this issue and its resolution can be found in Merritt &Ferrarese (2001c, see also Wandel 2002).
There still are, however, serious theoretical considerations whichcould potentially affect mass estimates from reverberation mapping(Krolik 2001). Of these, perhaps the most important are the assump-tions made on the velocity and geometric structure of the BLR.
The virial hypothesis is of course at the heart of reverberation map-ping as a mass estimator. If the hypothesis is invalidated, for instanceif the BLR is in a radial flow, the whole method is undermined, at leastas far as mass estimates are concerned. Reassuringly, the virial hypoth-esis has recently received strong observational support from the work ofPeterson & Wandel (2000) and Onken & Peterson (2002). If the motionof the gas is gravitational, using the lags derived from different emis-sion lines in the same AGN must lead to the same mass measurement.NGC 5548 was the first galaxy for which this was indeed verified. Thehighest ionization lines are observed to have the shortest time lag, sothat the virial product rv2 remains constant (Figure 29). The impliedcentral mass is M• = 6× 10⁷ M. The same has now been observed inthree additional galaxies, NGC 7469, NGC 3783, and 3C390.3; in allcases, the time lag (i.e. the BLR radius) and measured line width obeya virial relationship. Although there exist non-equilibrium kinematicalconfigurations which can mimic a virial relationship (e.g. cloud out-flows or disk winds could also explain the observations, Blumenthal &Mathews 1975; Murray et al. 1995; Emmering, Blandford & Shlosman1992; Chiang & Murray 1996; Bottorff et al. 1997), these alternativeexplanations need to be very finely tuned to account for the mountingquantity of observational evidence, and are therefore becoming moreand more untenable. The Hβ line in NGC 5548 also maintains a viri-
ferrarese_ford.tex; 11/05/2004; 22:31; no v.; p.66
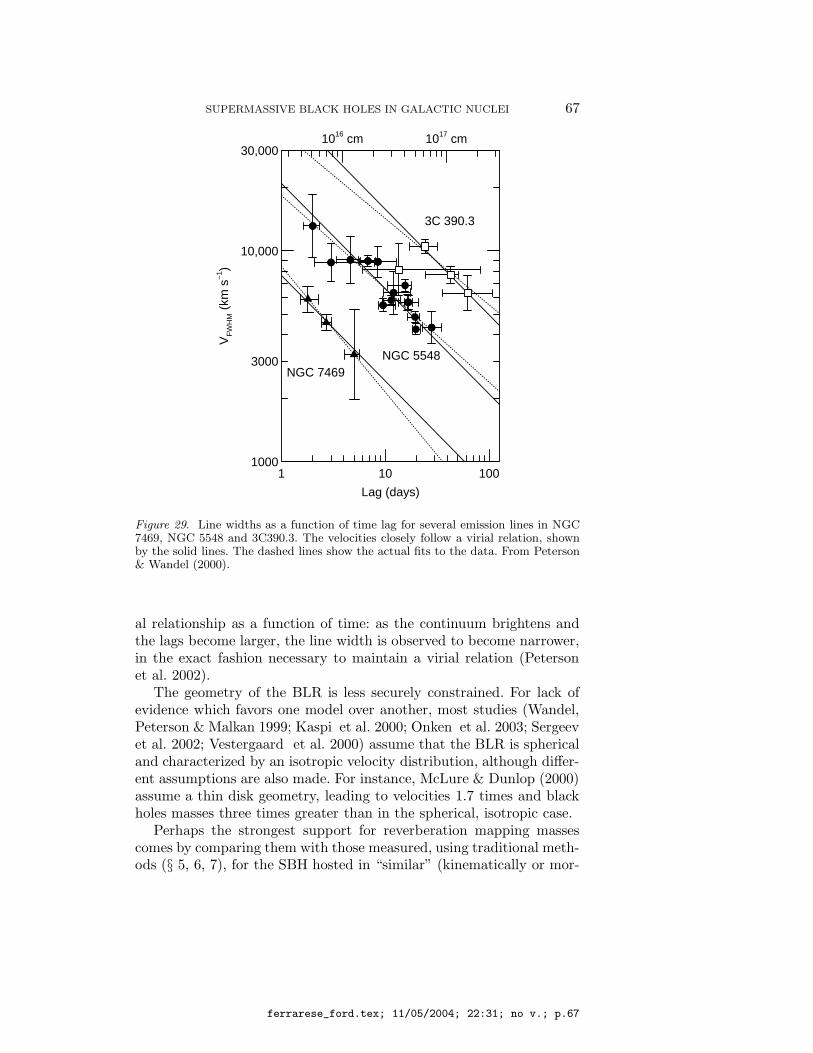
SUPERMASSIVE BLACK HOLES IN GALACTIC NUCLEI 67
1 10 100
Lag(days)
1000
3000
10,000
30,000
NGC5548
3C390.3
NGC7469
1016cm 1017cm
VF
WH
M(
kms
−1 )
Figure 29. Line widths as a function of time lag for several emission lines in NGC7469, NGC 5548 and 3C390.3. The velocities closely follow a virial relation, shownby the solid lines. The dashed lines show the actual fits to the data. From Peterson& Wandel (2000).
al relationship as a function of time: as the continuum brightens andthe lags become larger, the line width is observed to become narrower,in the exact fashion necessary to maintain a virial relation (Petersonet al. 2002).
The geometry of the BLR is less securely constrained. For lack ofevidence which favors one model over another, most studies (Wandel,Peterson & Malkan 1999; Kaspi et al. 2000; Onken et al. 2003; Sergeevet al. 2002; Vestergaard et al. 2000) assume that the BLR is sphericaland characterized by an isotropic velocity distribution, although differ-ent assumptions are also made. For instance, McLure & Dunlop (2000)assume a thin disk geometry, leading to velocities 1.7 times and blackholes masses three times greater than in the spherical, isotropic case.
Perhaps the strongest support for reverberation mapping massescomes by comparing them with those measured, using traditional meth-ods (§ 5, 6, 7), for the SBH hosted in “similar” (kinematically or mor-
ferrarese_ford.tex; 11/05/2004; 22:31; no v.; p.67
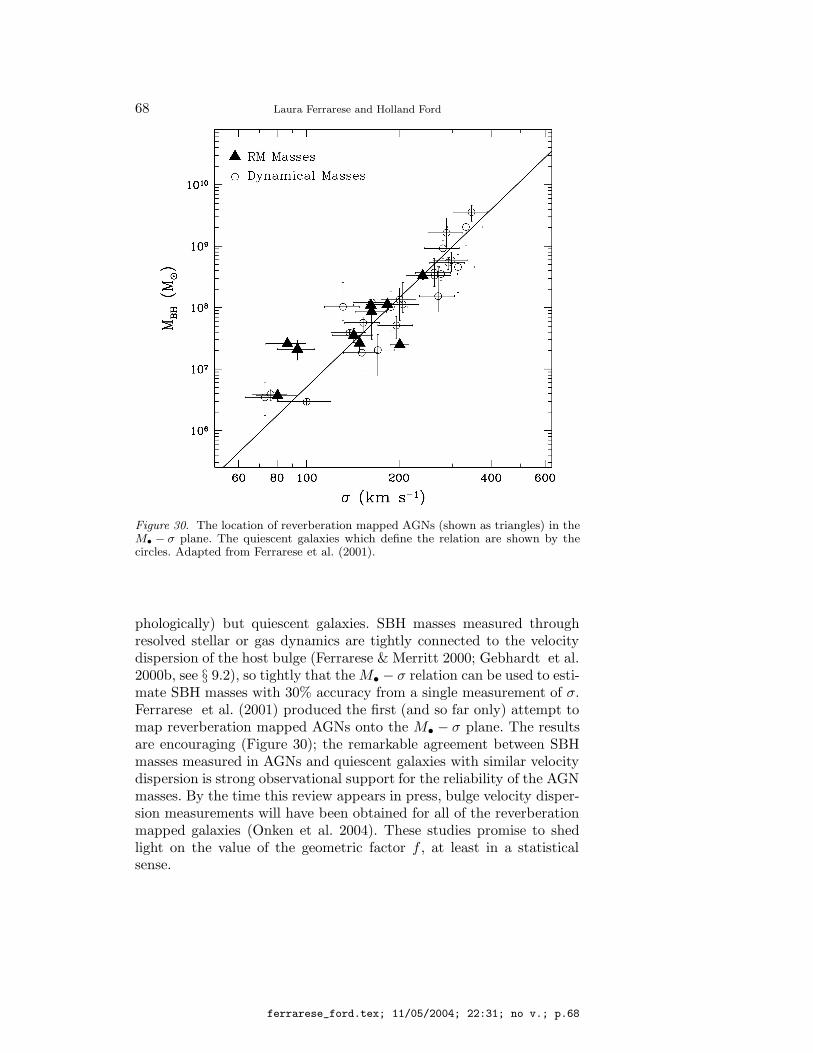
68 Laura Ferrarese and Holland Ford
Figure 30. The location of reverberation mapped AGNs (shown as triangles) in theM• − σ plane. The quiescent galaxies which define the relation are shown by thecircles. Adapted from Ferrarese et al. (2001).
phologically) but quiescent galaxies. SBH masses measured throughresolved stellar or gas dynamics are tightly connected to the velocitydispersion of the host bulge (Ferrarese & Merritt 2000; Gebhardt et al.2000b, see § 9.2), so tightly that the M• − σ relation can be used to esti-mate SBH masses with 30% accuracy from a single measurement of σ.Ferrarese et al. (2001) produced the first (and so far only) attempt tomap reverberation mapped AGNs onto the M• − σ plane. The resultsare encouraging (Figure 30); the remarkable agreement between SBHmasses measured in AGNs and quiescent galaxies with similar velocitydispersion is strong observational support for the reliability of the AGNmasses. By the time this review appears in press, bulge velocity disper-sion measurements will have been obtained for all of the reverberationmapped galaxies (Onken et al. 2004). These studies promise to shedlight on the value of the geometric factor f , at least in a statisticalsense.
ferrarese_ford.tex; 11/05/2004; 22:31; no v.; p.68

SUPERMASSIVE BLACK HOLES IN GALACTIC NUCLEI 69
8.3.3. The Future of Reverberation Mapping
Observationally, the main limitation of current reverberation mappingstudies lies in the less than optimal temporal sampling and duration ofthe experiments (Krolik 2001; Peterson 2002). This is the main obstaclewhich has so far prevented a direct determination of the geometry andkinematics of the BLR – the original aim of the method. Informationabout both is contained in the “transfer function”, i.e. the time-smearedemission line response to a δ-function outburst in the continuum:
L(vz, t) =
∫
∞
0Ψ(vz, τ)C(t − τ)dτ (13)
Here, L(vz, t) is the emission line flux observed at line of sight veloc-ity vz, Ψ(vz, t) is the transfer function, and C(t − τ) is the continuumlight curve. The integral of the transfer function over time gives the lineprofile (flux as a function of line of sight velocity), while the integralof the transfer function over velocity gives the delay map (normalizedflux as a function of time delay). Solving for the transfer function is aclassical inversion problem; in practice, it requires extremely high S/Ndata. In the best cases so far, it has been possible to solve only for the1D, or velocity independent transfer function, where both Ψ(τ) andL(t) represent integrals over the emission line width.
L(t) =
∫ ∞
0Ψ(τ)C(t − τ)dτ (14)
Examples of transfer functions are given in Peterson (2002). Theycan be calculated for different geometries (e.g. planar or spherical, aswell as more complicated cases), anisotropy in the line emission (whichcould arise, for instance, if the BLR is optically thick to both contin-uum and emission line radiation, so that most of the emission wouldemerge from the side of the the BLR facing the continuum source),anisotropy in the continuum emission (originating, for instance, if thecontinuum is emitted in a biconical beam with given opening angle),distance-dependent responsivity functions (due, for instance, to geo-metrical dilution or a varying covering factor for the BLR). While verydifferent scenarios can correspond to very similar 1D transfer dunctions,they are easily distinguishable using the 2D transfer function, i.e. whenboth time delay maps and line profiles are available (Figure 31).
Attempts at recovering transfer functions have been made in the caseof the CIV and HeII lines in NGC 4151 (Ulrich & Horne 1996), the CIVand Hβ lines in NGC 5548 (S. Collier, as cited by Peterson 2002), andthe Hα, Hβ, Hγ, HeIλ5876 and HeIIλ4686 lines in Mrk 110 (Kollatschny2003). In the latter case, the transfer function seems to resemble theone expected for a disk in Keplerian rotation, inclined approximatively
ferrarese_ford.tex; 11/05/2004; 22:31; no v.; p.69
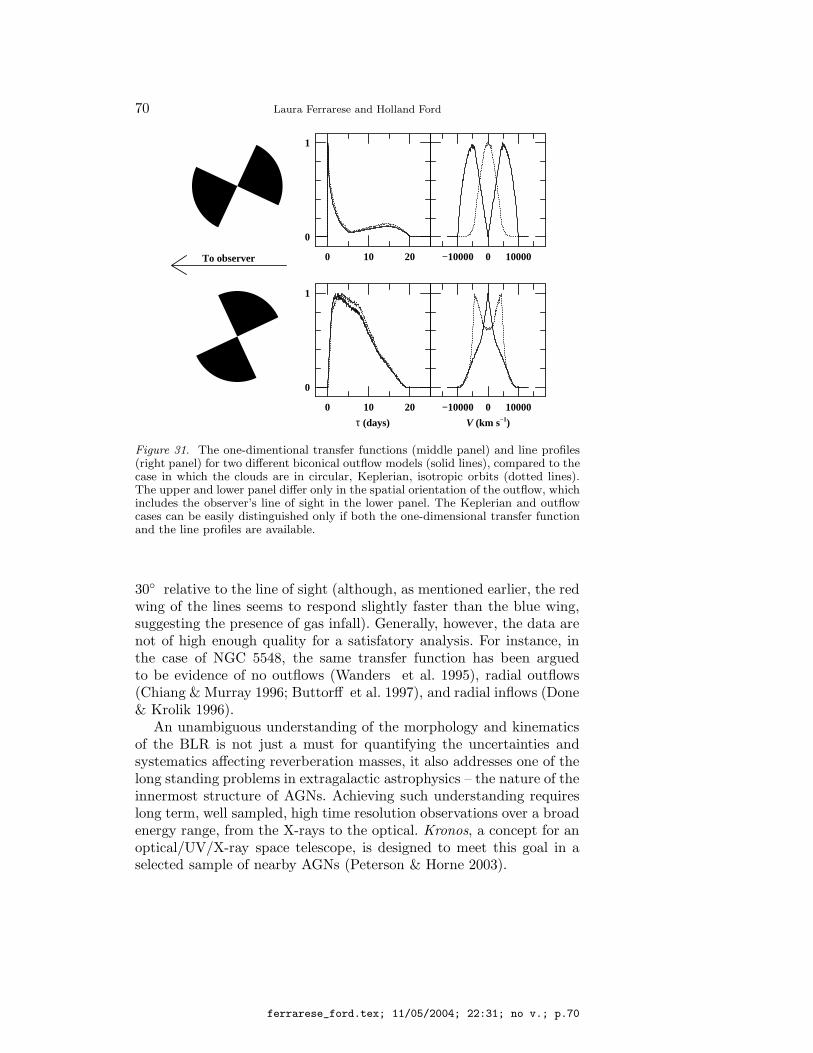
70 Laura Ferrarese and Holland Ford
−10000 0 100000 10 20
0
1
0 10 20
0
1
τ(days)
−10000 0 10000
V(kms−1)
Toobserver
Figure 31. The one-dimentional transfer functions (middle panel) and line profiles(right panel) for two different biconical outflow models (solid lines), compared to thecase in which the clouds are in circular, Keplerian, isotropic orbits (dotted lines).The upper and lower panel differ only in the spatial orientation of the outflow, whichincludes the observer’s line of sight in the lower panel. The Keplerian and outflowcases can be easily distinguished only if both the one-dimensional transfer functionand the line profiles are available.
30 relative to the line of sight (although, as mentioned earlier, the redwing of the lines seems to respond slightly faster than the blue wing,suggesting the presence of gas infall). Generally, however, the data arenot of high enough quality for a satisfatory analysis. For instance, inthe case of NGC 5548, the same transfer function has been arguedto be evidence of no outflows (Wanders et al. 1995), radial outflows(Chiang & Murray 1996; Buttorff et al. 1997), and radial inflows (Done& Krolik 1996).
An unambiguous understanding of the morphology and kinematicsof the BLR is not just a must for quantifying the uncertainties andsystematics affecting reverberation masses, it also addresses one of thelong standing problems in extragalactic astrophysics – the nature of theinnermost structure of AGNs. Achieving such understanding requireslong term, well sampled, high time resolution observations over a broadenergy range, from the X-rays to the optical. Kronos, a concept for anoptical/UV/X-ray space telescope, is designed to meet this goal in aselected sample of nearby AGNs (Peterson & Horne 2003).
ferrarese_ford.tex; 11/05/2004; 22:31; no v.; p.70
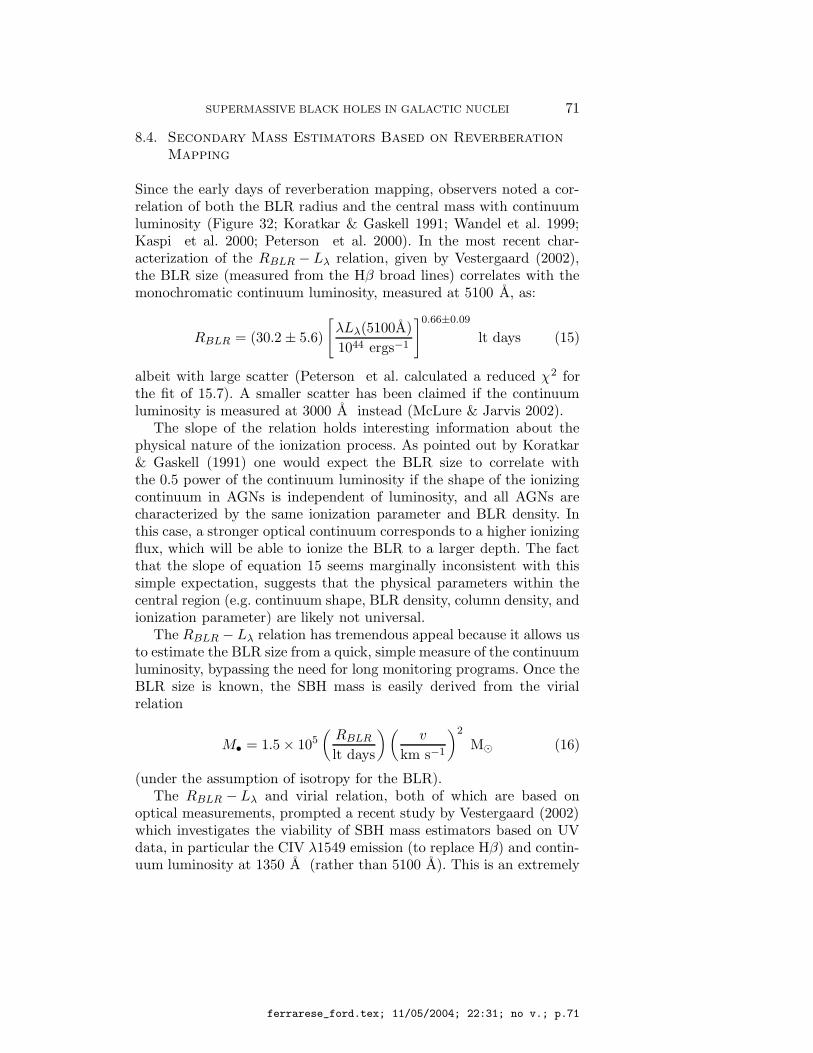
SUPERMASSIVE BLACK HOLES IN GALACTIC NUCLEI 71
8.4. Secondary Mass Estimators Based on Reverberation
Mapping
Since the early days of reverberation mapping, observers noted a cor-relation of both the BLR radius and the central mass with continuumluminosity (Figure 32; Koratkar & Gaskell 1991; Wandel et al. 1999;Kaspi et al. 2000; Peterson et al. 2000). In the most recent char-acterization of the RBLR − Lλ relation, given by Vestergaard (2002),the BLR size (measured from the Hβ broad lines) correlates with themonochromatic continuum luminosity, measured at 5100 A, as:
RBLR = (30.2 ± 5.6)
[
λLλ(5100A)
1044 ergs−1
]0.66±0.09
lt days (15)
albeit with large scatter (Peterson et al. calculated a reduced χ2 forthe fit of 15.7). A smaller scatter has been claimed if the continuumluminosity is measured at 3000 A instead (McLure & Jarvis 2002).
The slope of the relation holds interesting information about thephysical nature of the ionization process. As pointed out by Koratkar& Gaskell (1991) one would expect the BLR size to correlate withthe 0.5 power of the continuum luminosity if the shape of the ionizingcontinuum in AGNs is independent of luminosity, and all AGNs arecharacterized by the same ionization parameter and BLR density. Inthis case, a stronger optical continuum corresponds to a higher ionizingflux, which will be able to ionize the BLR to a larger depth. The factthat the slope of equation 15 seems marginally inconsistent with thissimple expectation, suggests that the physical parameters within thecentral region (e.g. continuum shape, BLR density, column density, andionization parameter) are likely not universal.
The RBLR − Lλ relation has tremendous appeal because it allows usto estimate the BLR size from a quick, simple measure of the continuumluminosity, bypassing the need for long monitoring programs. Once theBLR size is known, the SBH mass is easily derived from the virialrelation
M• = 1.5 × 10⁵(
RBLR
lt days
) (
v
km s−1
)2
M (16)
(under the assumption of isotropy for the BLR).The RBLR − Lλ and virial relation, both of which are based on
optical measurements, prompted a recent study by Vestergaard (2002)which investigates the viability of SBH mass estimators based on UVdata, in particular the CIV λ1549 emission (to replace Hβ) and contin-uum luminosity at 1350 A (rather than 5100 A). This is an extremely
ferrarese_ford.tex; 11/05/2004; 22:31; no v.; p.71
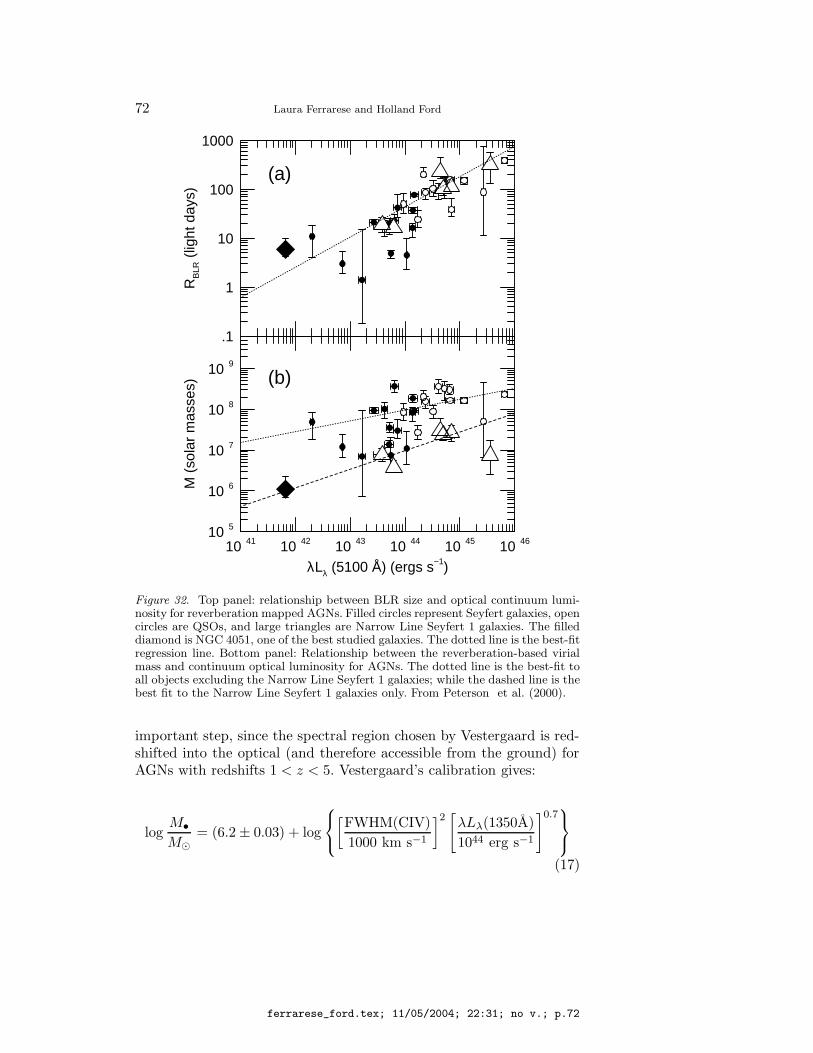
72 Laura Ferrarese and Holland Ford
.1
1
10
100
1000
RB
LR (
light
day
s)(a)
10 41 10 42 10 43 10 44 10 45 10 4610 5
10 6
10 7
10 8
10 9
λLλ (5100 Å) (ergs s−1)
M (
sola
r m
asse
s) (b)
Figure 32. Top panel: relationship between BLR size and optical continuum lumi-nosity for reverberation mapped AGNs. Filled circles represent Seyfert galaxies, opencircles are QSOs, and large triangles are Narrow Line Seyfert 1 galaxies. The filleddiamond is NGC 4051, one of the best studied galaxies. The dotted line is the best-fitregression line. Bottom panel: Relationship between the reverberation-based virialmass and continuum optical luminosity for AGNs. The dotted line is the best-fit toall objects excluding the Narrow Line Seyfert 1 galaxies; while the dashed line is thebest fit to the Narrow Line Seyfert 1 galaxies only. From Peterson et al. (2000).
important step, since the spectral region chosen by Vestergaard is red-shifted into the optical (and therefore accessible from the ground) forAGNs with redshifts 1 < z < 5. Vestergaard’s calibration gives:
logM•
M
= (6.2 ± 0.03) + log
[
FWHM(CIV)
1000 km s−1
]2[
λLλ(1350A)
1044 erg s−1
]0.7
(17)
ferrarese_ford.tex; 11/05/2004; 22:31; no v.; p.72
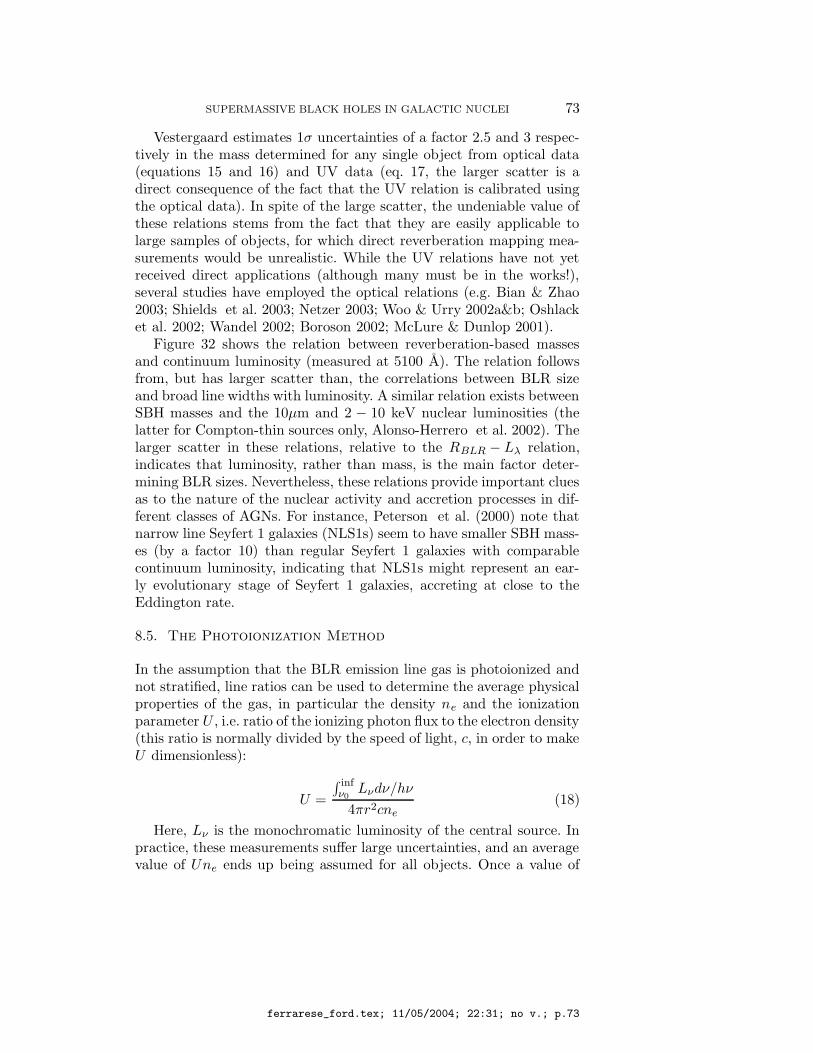
SUPERMASSIVE BLACK HOLES IN GALACTIC NUCLEI 73
Vestergaard estimates 1σ uncertainties of a factor 2.5 and 3 respec-tively in the mass determined for any single object from optical data(equations 15 and 16) and UV data (eq. 17, the larger scatter is adirect consequence of the fact that the UV relation is calibrated usingthe optical data). In spite of the large scatter, the undeniable value ofthese relations stems from the fact that they are easily applicable tolarge samples of objects, for which direct reverberation mapping mea-surements would be unrealistic. While the UV relations have not yetreceived direct applications (although many must be in the works!),several studies have employed the optical relations (e.g. Bian & Zhao2003; Shields et al. 2003; Netzer 2003; Woo & Urry 2002a&b; Oshlacket al. 2002; Wandel 2002; Boroson 2002; McLure & Dunlop 2001).
Figure 32 shows the relation between reverberation-based massesand continuum luminosity (measured at 5100 A). The relation followsfrom, but has larger scatter than, the correlations between BLR sizeand broad line widths with luminosity. A similar relation exists betweenSBH masses and the 10µm and 2 − 10 keV nuclear luminosities (thelatter for Compton-thin sources only, Alonso-Herrero et al. 2002). Thelarger scatter in these relations, relative to the RBLR − Lλ relation,indicates that luminosity, rather than mass, is the main factor deter-mining BLR sizes. Nevertheless, these relations provide important cluesas to the nature of the nuclear activity and accretion processes in dif-ferent classes of AGNs. For instance, Peterson et al. (2000) note thatnarrow line Seyfert 1 galaxies (NLS1s) seem to have smaller SBH mass-es (by a factor 10) than regular Seyfert 1 galaxies with comparablecontinuum luminosity, indicating that NLS1s might represent an ear-ly evolutionary stage of Seyfert 1 galaxies, accreting at close to theEddington rate.
8.5. The Photoionization Method
In the assumption that the BLR emission line gas is photoionized andnot stratified, line ratios can be used to determine the average physicalproperties of the gas, in particular the density ne and the ionizationparameter U , i.e. ratio of the ionizing photon flux to the electron density(this ratio is normally divided by the speed of light, c, in order to makeU dimensionless):
U =
∫ infν0
Lνdν/hν
4πr2cne(18)
Here, Lν is the monochromatic luminosity of the central source. Inpractice, these measurements suffer large uncertainties, and an averagevalue of Une ends up being assumed for all objects. Once a value of
ferrarese_ford.tex; 11/05/2004; 22:31; no v.; p.73
74 Laura Ferrarese and Holland Ford
Une is agreed upon, the radius r of the BLR is simply inversely propor-tional (via the ionizing flux, knowing which requires UV spectra) to thesquare root of Une, and the central mass can then be derived under thevirial assumption, just as in the case of reverberation mapping. BLRsizes derived using the photoionization method are in good agreementwith reverberation mapping estimates (Wandel, Peterson & Malkan1999). Indeed, using this method, Padovani, Burg & Edelson (1990)conducted the first study of SBH demographics in Seyfert 1 galaxies,and concluded that local AGNs cannot be the only repository of theSBHs residing in high redshift quasars, further justifying the search forSBHs in quiescent galaxies.
In contrast to reverberation mapping techniques, the photoioniza-tion method is completely independent of the assumed geometry of theBLR (for example it is insensitive to whether the gas is confined inmany separate clouds or has a continuous distribution). The downsideis, of course, that Une is not accurately known, although reasonableestimates can be obtained given high quality data. More important-ly, the photoionization method relies on a single-zone approximationfor the gas, which is certainly an oversimplification. Nevertheless, themethod has appeal since it can have statistical validity when appliedto large samples of objects.
ferrarese_ford.tex; 11/05/2004; 22:31; no v.; p.74
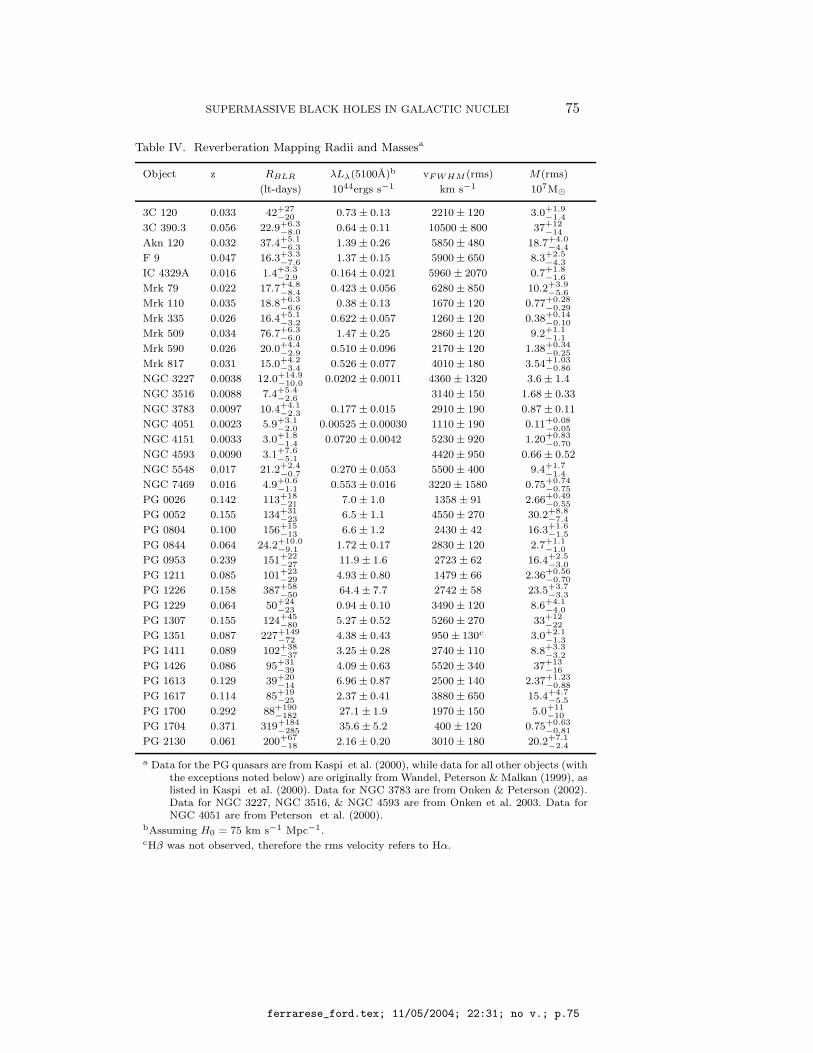
SUPERMASSIVE BLACK HOLES IN GALACTIC NUCLEI 75
Table IV. Reverberation Mapping Radii and Massesa
Object z RBLR λLλ(5100A)b vFWHM (rms) M(rms)
(lt-days) 1044ergs s−1 km s−1 107M
3C 120 0.033 42+27
−200.73 ± 0.13 2210 ± 120 3.0+1.9
−1.4
3C 390.3 0.056 22.9+6.3−8.0 0.64 ± 0.11 10500 ± 800 37+12
−14
Akn 120 0.032 37.4+5.1−6.3 1.39 ± 0.26 5850 ± 480 18.7+4.0
−4.4
F 9 0.047 16.3+3.3−7.6
1.37 ± 0.15 5900 ± 650 8.3+2.5−4.3
IC 4329A 0.016 1.4+3.3−2.9 0.164 ± 0.021 5960 ± 2070 0.7+1.8
−1.6
Mrk 79 0.022 17.7+4.8−8.4 0.423 ± 0.056 6280 ± 850 10.2+3.9
−5.6
Mrk 110 0.035 18.8+6.3−6.6
0.38 ± 0.13 1670 ± 120 0.77+0.28−0.29
Mrk 335 0.026 16.4+5.1−3.2 0.622 ± 0.057 1260 ± 120 0.38+0.14
−0.10
Mrk 509 0.034 76.7+6.3−6.0
1.47 ± 0.25 2860 ± 120 9.2+1.1−1.1
Mrk 590 0.026 20.0+4.4−2.9
0.510 ± 0.096 2170 ± 120 1.38+0.34−0.25
Mrk 817 0.031 15.0+4.2−3.4 0.526 ± 0.077 4010 ± 180 3.54+1.03
−0.86
NGC 3227 0.0038 12.0+14.9−10.0
0.0202 ± 0.0011 4360 ± 1320 3.6 ± 1.4
NGC 3516 0.0088 7.4+5.4−2.6
3140 ± 150 1.68 ± 0.33
NGC 3783 0.0097 10.4+4.1−2.3 0.177 ± 0.015 2910 ± 190 0.87 ± 0.11
NGC 4051 0.0023 5.9+3.1−2.0
0.00525 ± 0.00030 1110 ± 190 0.11+0.08−0.05
NGC 4151 0.0033 3.0+1.8−1.4
0.0720 ± 0.0042 5230 ± 920 1.20+0.83−0.70
NGC 4593 0.0090 3.1+7.6−5.1 4420 ± 950 0.66 ± 0.52
NGC 5548 0.017 21.2+2.4−0.7
0.270 ± 0.053 5500 ± 400 9.4+1.7−1.4
NGC 7469 0.016 4.9+0.6−1.1 0.553 ± 0.016 3220 ± 1580 0.75+0.74
−0.75
PG 0026 0.142 113+18
−217.0 ± 1.0 1358 ± 91 2.66+0.49
−0.55
PG 0052 0.155 134+31
−236.5 ± 1.1 4550 ± 270 30.2+8.8
−7.4
PG 0804 0.100 156+15
−136.6 ± 1.2 2430 ± 42 16.3+1.6
−1.5
PG 0844 0.064 24.2+10.0−9.1 1.72 ± 0.17 2830 ± 120 2.7+1.1
−1.0
PG 0953 0.239 151+22
−2711.9 ± 1.6 2723 ± 62 16.4+2.5
−3.0
PG 1211 0.085 101+23
−294.93 ± 0.80 1479 ± 66 2.36+0.56
−0.70
PG 1226 0.158 387+58
−5064.4 ± 7.7 2742 ± 58 23.5+3.7
−3.3
PG 1229 0.064 50+24
−230.94 ± 0.10 3490 ± 120 8.6+4.1
−4.0
PG 1307 0.155 124+45
−805.27 ± 0.52 5260 ± 270 33+12
−22
PG 1351 0.087 227+149
−724.38 ± 0.43 950 ± 130c 3.0+2.1
−1.3
PG 1411 0.089 102+38
−373.25 ± 0.28 2740 ± 110 8.8+3.3
−3.2
PG 1426 0.086 95+31
−394.09 ± 0.63 5520 ± 340 37+13
−16
PG 1613 0.129 39+20
−146.96 ± 0.87 2500 ± 140 2.37+1.23
−0.88
PG 1617 0.114 85+19
−252.37 ± 0.41 3880 ± 650 15.4+4.7
−5.5
PG 1700 0.292 88+190
−18227.1 ± 1.9 1970 ± 150 5.0+11
−10
PG 1704 0.371 319+184
−28535.6 ± 5.2 400 ± 120 0.75+0.63
−0.81
PG 2130 0.061 200+67
−182.16 ± 0.20 3010 ± 180 20.2+7.1
−2.4
a Data for the PG quasars are from Kaspi et al. (2000), while data for all other objects (withthe exceptions noted below) are originally from Wandel, Peterson & Malkan (1999), aslisted in Kaspi et al. (2000). Data for NGC 3783 are from Onken & Peterson (2002).Data for NGC 3227, NGC 3516, & NGC 4593 are from Onken et al. 2003. Data forNGC 4051 are from Peterson et al. (2000).
bAssuming H0 = 75 km s−1 Mpc−1.cHβ was not observed, therefore the rms velocity refers to Hα.
ferrarese_ford.tex; 11/05/2004; 22:31; no v.; p.75
76 Laura Ferrarese and Holland Ford
9. SCALING RELATIONS FOR SUPERMASSIVEBLACK HOLES.
If man were restricted to collecting facts, the sciences would only be a
sterile nomenclature and he would never have known the great laws of
nature. It is in comparing the phenomena with each other, in seeking
to grasp their relationships, that he is led to discover these laws.
Pierre-Simon Laplace, in “Exposition du systeme du monde”
9.1. The M• − L Relation
Using the eight SBH detections available at the time, Kormendy &Richstone (1995) noticed that supermassive black hole masses corre-late with the blue luminosity of the surrounding hot stellar compo-nent, this being the bulge of spiral galaxies, or the entire galaxy inthe case of ellipticals. Whether the observed correlation was simply theupper envelope of a distribution which extends to smaller masses wasunclear: while there should be no observational bias against detectinglarge SBHs in small bulges, a failed detection of a small SBH in a largesystem could have gone unreported at the time (but none has beenreported since). Kormendy & Richstone point out that the existenceof the correlation indicates that SBH and bulge formation are tight-ly connected or even, based on the claimed absence of a SBH in thebulge-less spiral M33, that the presence of a bulge might be essentialfor SBH formation.
Further SBH detections have confirmed the existence of a correla-tion. The most up-to-date M• − LB relation, using all SBH detectionsfor which the sphere of influence is resolved by the observations, isshown in Figure 33. A best fit, accounting for errors in both coordi-nates as well as intrinsic scatter gives:
log(M•) = (8.37 ± 0.11) − (0.419 ± 0.085)(B0T + 20.0) (19)
The scatter in the M• − LB relation is the subject of some debate.Using the 12 reliable SBH masses known at the time, Ferrarese & Mer-ritt (2000) reported a reduced χ2
r = 23 when the magnitudes are mea-sured in the B−band, and a scatter of 0.6 dex in M• at any givenluminosity. This result has not changed significantly in the past threeyears. The expanded sample shown in Figure 33 has a scatter aroundthe best fit line of 0.79 dex in M•. McLure & Dunlop (2001) were thefirst to point out that if the sample is restricted to elliptical galaxies,the scatter is reduced significantly, down to 0.33 dex. This is compa-rable to the scatter in the M• − σ relation to be discussed in the nextsection. Elliptical galaxies are distinguished from lenticulars and spirals
ferrarese_ford.tex; 11/05/2004; 22:31; no v.; p.76
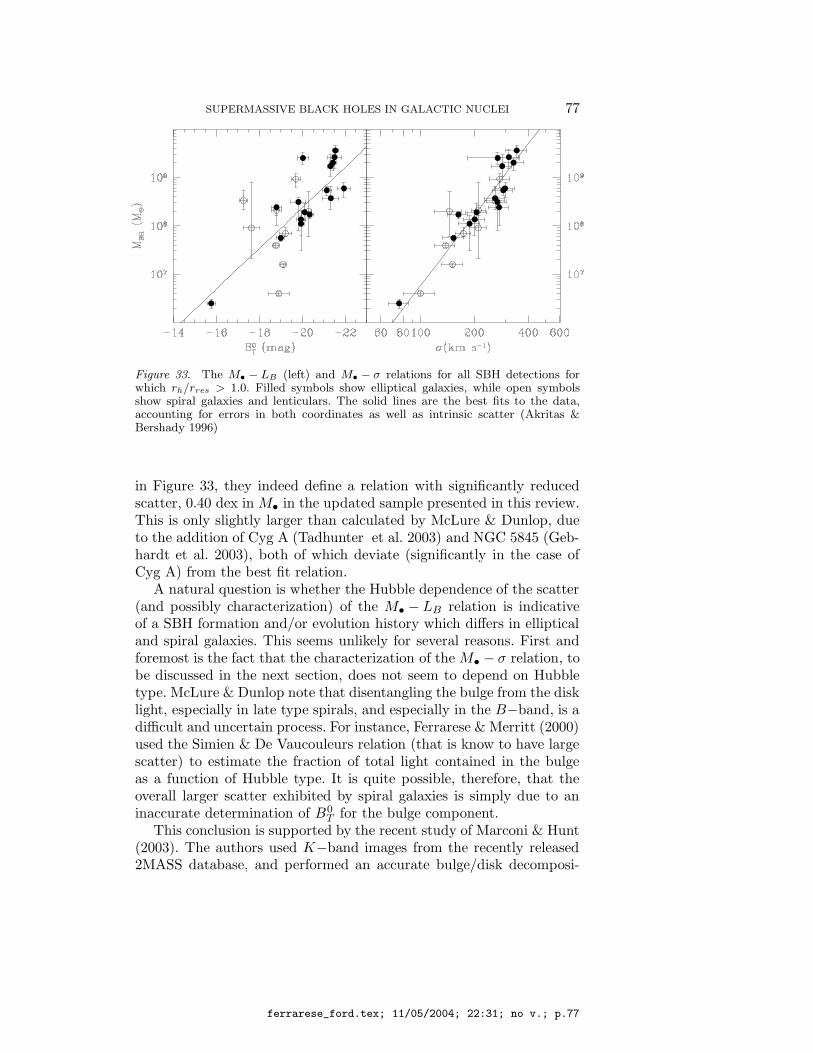
SUPERMASSIVE BLACK HOLES IN GALACTIC NUCLEI 77
Figure 33. The M• − LB (left) and M• − σ relations for all SBH detections forwhich rh/rres > 1.0. Filled symbols show elliptical galaxies, while open symbolsshow spiral galaxies and lenticulars. The solid lines are the best fits to the data,accounting for errors in both coordinates as well as intrinsic scatter (Akritas &Bershady 1996)
in Figure 33, they indeed define a relation with significantly reducedscatter, 0.40 dex in M• in the updated sample presented in this review.This is only slightly larger than calculated by McLure & Dunlop, dueto the addition of Cyg A (Tadhunter et al. 2003) and NGC 5845 (Geb-hardt et al. 2003), both of which deviate (significantly in the case ofCyg A) from the best fit relation.
A natural question is whether the Hubble dependence of the scatter(and possibly characterization) of the M• − LB relation is indicativeof a SBH formation and/or evolution history which differs in ellipticaland spiral galaxies. This seems unlikely for several reasons. First andforemost is the fact that the characterization of the M• − σ relation, tobe discussed in the next section, does not seem to depend on Hubbletype. McLure & Dunlop note that disentangling the bulge from the disklight, especially in late type spirals, and especially in the B−band, is adifficult and uncertain process. For instance, Ferrarese & Merritt (2000)used the Simien & De Vaucouleurs relation (that is know to have largescatter) to estimate the fraction of total light contained in the bulgeas a function of Hubble type. It is quite possible, therefore, that theoverall larger scatter exhibited by spiral galaxies is simply due to aninaccurate determination of B0
T for the bulge component.This conclusion is supported by the recent study of Marconi & Hunt
(2003). The authors used K−band images from the recently released2MASS database, and performed an accurate bulge/disk decomposi-
ferrarese_ford.tex; 11/05/2004; 22:31; no v.; p.77

78 Laura Ferrarese and Holland Ford
tion for the nearby quiescent spiral galaxies with dynamically mea-sured masses. When only SBH masses based on data which resolvedthe sphere of influence are used, Marconi & Hunt find that the scatterin the K−band M• − L relation is very small (0.31 dex), comparable tothe scatter in the M• − σ relation, no matter whether spiral galaxies areincluded or not. This is not altogether surprising. Both the M• − σ andM• − L relations betray the existence of a correlation between the massof supermassive black holes, and the mass of the host bulge. Near IRmagnitudes are a better tracer of mass than B−band magnitudes (andare also less sensitive to the disk component in spiral galaxies). If massis the underlying fundamental parameter as Marconi & Hunt suggest,the scatter in the M• − L relation should depend on the photometricband in which the magnitudes are measured8. Marconi & Hunt reacha second noteable conclusion, namely that the scatter in the M• − LK
relation depends on the sample of galaxies used, increasing significantly(from 0.31 dex to 0.51 dex) when including galaxies for which the datado not resolve the SBH sphere of influence. This is a strong endorse-ment of the argument, first proposed by Ferrarese & Merritt (2000),that resolving the sphere of influence is a necessary condition for areliable mass determination to be made.
9.2. The M• − σ Relation
Bulge magnitudes and velocity dispersions are correlated through theFaber-Jackson relation. The M• − L relation, therefore, immediatelyentails a correlation between M• and σ. In spite of the ample attentiondevoted to the M• − L relation since 1995, five years went by beforethe first M• − σ relation was published (Ferrarese & Merritt 2000; Geb-hardt et al. 2000b). The reason for the long delay is easily understood.Figure 34 (bottom panels) shows the M• − L and M• − σ correlationsusing all SBH masses, regardless of their accuracy, available in 2000.Both relations have large intrinsic scatter, and there doesn’t appear tobe any obvious advantage in preferring one to the other. The break-through came with the realization that the scatter in the M• − σ rela-tion is significantly dependent on sample selection. The upper panelsof Figure 34 only show SBH masses (as were available in 2000) derivedfrom data which resolved the sphere of influence. While no significantchanges (besides the obvious decrease in sample size) are noticeable inthe M• − L relation, the scatter in the M• − σ relation decreases sig-nificantly when the restricted sample is used. Based on these findings,Ferrarese & Merritt (2000) concluded that the reliability of the SBH
8 It must however be pointed out that Marconi & Hunt measure a smaller scatterfor the B−band M• − L relation than previously reported.
ferrarese_ford.tex; 11/05/2004; 22:31; no v.; p.78
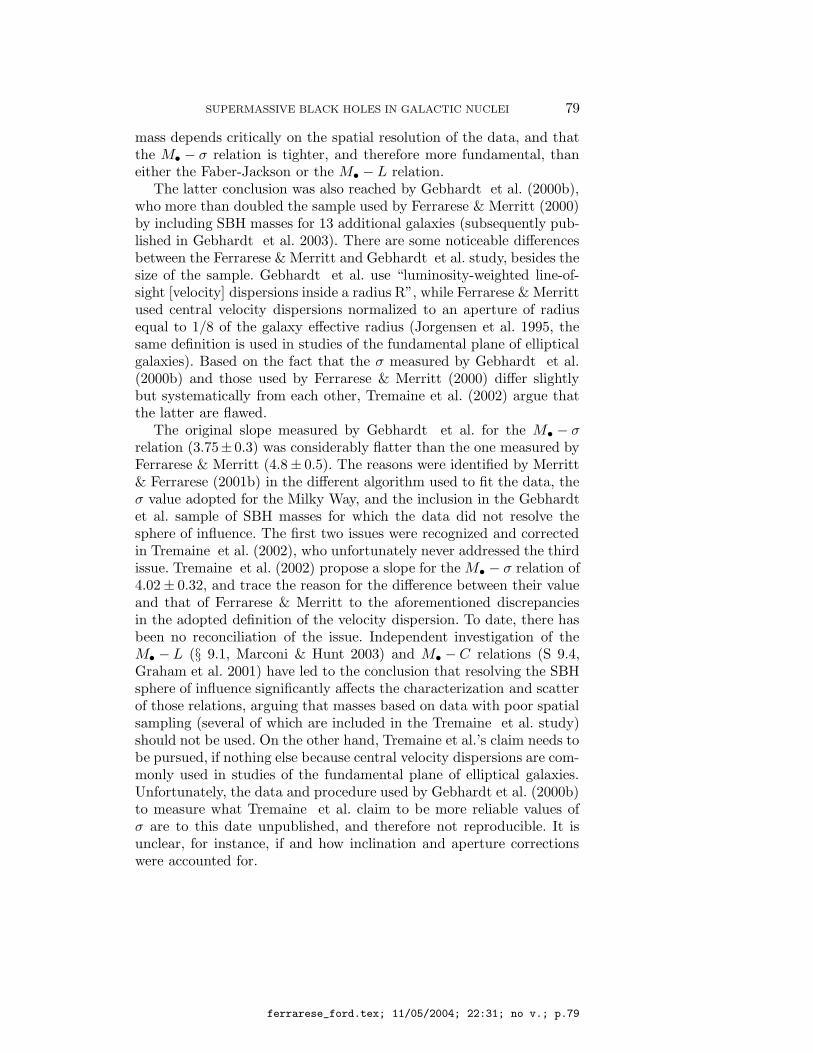
SUPERMASSIVE BLACK HOLES IN GALACTIC NUCLEI 79
mass depends critically on the spatial resolution of the data, and thatthe M• − σ relation is tighter, and therefore more fundamental, thaneither the Faber-Jackson or the M• − L relation.
The latter conclusion was also reached by Gebhardt et al. (2000b),who more than doubled the sample used by Ferrarese & Merritt (2000)by including SBH masses for 13 additional galaxies (subsequently pub-lished in Gebhardt et al. 2003). There are some noticeable differencesbetween the Ferrarese & Merritt and Gebhardt et al. study, besides thesize of the sample. Gebhardt et al. use “luminosity-weighted line-of-sight [velocity] dispersions inside a radius R”, while Ferrarese & Merrittused central velocity dispersions normalized to an aperture of radiusequal to 1/8 of the galaxy effective radius (Jorgensen et al. 1995, thesame definition is used in studies of the fundamental plane of ellipticalgalaxies). Based on the fact that the σ measured by Gebhardt et al.(2000b) and those used by Ferrarese & Merritt (2000) differ slightlybut systematically from each other, Tremaine et al. (2002) argue thatthe latter are flawed.
The original slope measured by Gebhardt et al. for the M• − σrelation (3.75± 0.3) was considerably flatter than the one measured byFerrarese & Merritt (4.8± 0.5). The reasons were identified by Merritt& Ferrarese (2001b) in the different algorithm used to fit the data, theσ value adopted for the Milky Way, and the inclusion in the Gebhardtet al. sample of SBH masses for which the data did not resolve thesphere of influence. The first two issues were recognized and correctedin Tremaine et al. (2002), who unfortunately never addressed the thirdissue. Tremaine et al. (2002) propose a slope for the M• − σ relation of4.02 ± 0.32, and trace the reason for the difference between their valueand that of Ferrarese & Merritt to the aforementioned discrepanciesin the adopted definition of the velocity dispersion. To date, there hasbeen no reconciliation of the issue. Independent investigation of theM• − L (§ 9.1, Marconi & Hunt 2003) and M• − C relations (S 9.4,Graham et al. 2001) have led to the conclusion that resolving the SBHsphere of influence significantly affects the characterization and scatterof those relations, arguing that masses based on data with poor spatialsampling (several of which are included in the Tremaine et al. study)should not be used. On the other hand, Tremaine et al.’s claim needs tobe pursued, if nothing else because central velocity dispersions are com-monly used in studies of the fundamental plane of elliptical galaxies.Unfortunately, the data and procedure used by Gebhardt et al. (2000b)to measure what Tremaine et al. claim to be more reliable values ofσ are to this date unpublished, and therefore not reproducible. It isunclear, for instance, if and how inclination and aperture correctionswere accounted for.
ferrarese_ford.tex; 11/05/2004; 22:31; no v.; p.79

80 Laura Ferrarese and Holland Ford
Figure 34. The M• − L (left panels) and M• − σ (right panels) relations for all SBHmasses (as available in 2000) for which the sphere of influence was (top panels) orwas not (bottom panel) resolved by the data. The solid and dotted lines are thebest-fit regression lines to the galaxies for which the SBH sphere of influence wasand was not resolved respectively. From Ferrarese & Merritt (2000).
Figure 33 shows the most current version of the M• − σ relation,including only SBH for which the data resolved the sphere of influence(from Table II, which now includes more galaxies than used in anypreviously published study of the M• − σ relation), using publishedcentral values of the velocity dispersions, and the fitting routine fromAkritas & Bershady (1996):
M•
108M
= (1.66 ± 0.24)
(
σ
200 km s−1
)4.86±0.43
(20)
(using the fitting algorithm used in Tremaine et al. (2002) actuallyproduces a slightly steeper slope, 5.1 ± 0.4). The reduced χ2 is 0.880,indicating that the intrinsic scatter of the relation is negligible. Thescatter around the mean is only 0.34 dex in M•. Neither the scatter,slope or zero point of the relation depend on the Hubble type of thegalaxies considered, as can be judged qualitatively from Figure 33.
ferrarese_ford.tex; 11/05/2004; 22:31; no v.; p.80
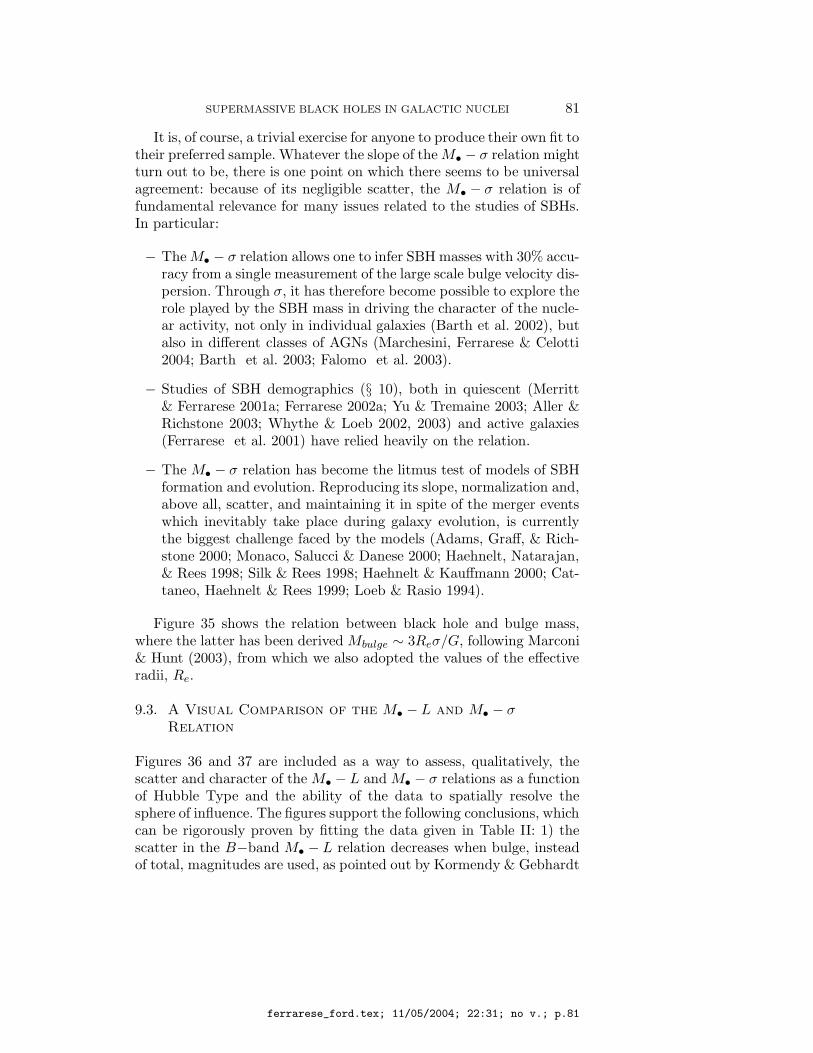
SUPERMASSIVE BLACK HOLES IN GALACTIC NUCLEI 81
It is, of course, a trivial exercise for anyone to produce their own fit totheir preferred sample. Whatever the slope of the M• − σ relation mightturn out to be, there is one point on which there seems to be universalagreement: because of its negligible scatter, the M• − σ relation is offundamental relevance for many issues related to the studies of SBHs.In particular:
− The M• − σ relation allows one to infer SBH masses with 30% accu-racy from a single measurement of the large scale bulge velocity dis-persion. Through σ, it has therefore become possible to explore therole played by the SBH mass in driving the character of the nucle-ar activity, not only in individual galaxies (Barth et al. 2002), butalso in different classes of AGNs (Marchesini, Ferrarese & Celotti2004; Barth et al. 2003; Falomo et al. 2003).
− Studies of SBH demographics (§ 10), both in quiescent (Merritt& Ferrarese 2001a; Ferrarese 2002a; Yu & Tremaine 2003; Aller &Richstone 2003; Whythe & Loeb 2002, 2003) and active galaxies(Ferrarese et al. 2001) have relied heavily on the relation.
− The M• − σ relation has become the litmus test of models of SBHformation and evolution. Reproducing its slope, normalization and,above all, scatter, and maintaining it in spite of the merger eventswhich inevitably take place during galaxy evolution, is currentlythe biggest challenge faced by the models (Adams, Graff, & Rich-stone 2000; Monaco, Salucci & Danese 2000; Haehnelt, Natarajan,& Rees 1998; Silk & Rees 1998; Haehnelt & Kauffmann 2000; Cat-taneo, Haehnelt & Rees 1999; Loeb & Rasio 1994).
Figure 35 shows the relation between black hole and bulge mass,where the latter has been derived Mbulge ∼ 3Reσ/G, following Marconi& Hunt (2003), from which we also adopted the values of the effectiveradii, Re.
9.3. A Visual Comparison of the M• − L and M• − σRelation
Figures 36 and 37 are included as a way to assess, qualitatively, thescatter and character of the M• − L and M• − σ relations as a functionof Hubble Type and the ability of the data to spatially resolve thesphere of influence. The figures support the following conclusions, whichcan be rigorously proven by fitting the data given in Table II: 1) thescatter in the B−band M• − L relation decreases when bulge, insteadof total, magnitudes are used, as pointed out by Kormendy & Gebhardt
ferrarese_ford.tex; 11/05/2004; 22:31; no v.; p.81
82 Laura Ferrarese and Holland Ford
Figure 35. The relation between SBH and virial bulge masses (following Marconi& Hunt 2003).
(2001). 2) The scatter in the M• − L relation decreases when the sampleis restricted to elliptical galaxies only, as first pointed out by McLure& Dunlop (2000). 3) The scatter further decreases if the sample isrestricted to galaxies for which the sphere of influence is well resolved,independently on the Hubble Type of the galaxy considered. 4) For allsamples, the scatter in the B−band M• − L relation is larger than inthe M• − σ relation (c.f. Marconi & Hunt 2003).
9.4. Black Hole Masses and Light Concentration
Graham et al. (2001) found a remarkably tight correlation betweenSBH masses and the concentration of bulge light, defined as the ratioof flux inside one-third of the half-light radius to the one within theentire half-light radius (Figure 38). The existence of the correlation isnot entirely surprising. At least in ellipticals (which comprise most ofthe sample) the shape of the brightness profile correlates with galaxyluminosity (Ferrarese et al. 1994; Lauer et al. 1995; Rest et al. 2001).Larger and more luminous galaxies have shallower brightness profiles(larger radii enclosing 1/3 of the light and thus less light concentra-
ferrarese_ford.tex; 11/05/2004; 22:31; no v.; p.82

SUPERMASSIVE BLACK HOLES IN GALACTIC NUCLEI 83
Figure 36. Top panels: The M• − L relation obtained when total B−band magni-tude is used, regardless of the Hubble Type of the host galaxy. Middle panels: as forthe upper panel, except bulge, rather than total magnitudes are used. Bottom pan-els: The M• − L relation for elliptical galaxies only. From left to right, the sample isincreasingly restricted in terms of how well the data resolves the sphere of influenceof the measured SBH, as indicated by the labels at the top.
tion) and host more massive black holes. As is the case for the M• − σrelation, however, what is surprising is the scatter, which appears tobe negligible. As noticed by Ferrarese & Merritt (2000) for the M• − σrelation and, later, by Marconi & Hunt for the M• − L relation, Grahamet al. find that the scatter in the M• − C relation decreases significant-ly when only SBH masses derived from data which resolves the sphereof influence are used.
The M• − C and M• − L relations have the practical advantage ofneeding only imaging data, generally more readily available than thespectroscopic data necessary to measure σ. The M• − C relation is,
ferrarese_ford.tex; 11/05/2004; 22:31; no v.; p.83
84 Laura Ferrarese and Holland Ford
Figure 37. The M• − σ relation obtained regardless of the Hubble Type of the hostgalaxy (top panels) and for elliptical galaxies only (bottom panel). From left toright, the sample is increasingly restricted in terms of how well the data resolves thesphere of influence of the measured SBH, as indicated by the labels at the top. Thetwo lines represent the fit from Tremaine et al. (2002, dashed line) and this paper(equation 20, solid line)
however, dependent on a parametric characterization of the light profile(Graham et al. use a modified Sersic law) which might not prove tobe a good fit for some galaxies. Graham et al. point out that cD andmerging/interacting galaxies might be particularly problematic, andexclude NGC 6251 and (judging from their Figure 2) M87 and NGC4374 from their analysis. It is interesting to notice that while outliersin the M• − C relation, these galaxies fit the M• − σ relation.
Regrettably, there have not yet been theoretical studies targetingthe M• − C relation specifically, although a number of authors havestudied the effect of a SBH (or a SBH binary) on the density profile ofthe surrounding stellar population (Young 1980; Quinlan, Hernquist &Sigurdsson 1995; Lee & Goodman 1989; Cipollina & Bertin 1994; Sig-urdsson, Hernquist & Quinlan 1995; Quinlan & Hernquist 1997; Nakano& Makino 1999, van der Marel 1999; Milosavljevic & Merritt 2001).
ferrarese_ford.tex; 11/05/2004; 22:31; no v.; p.84
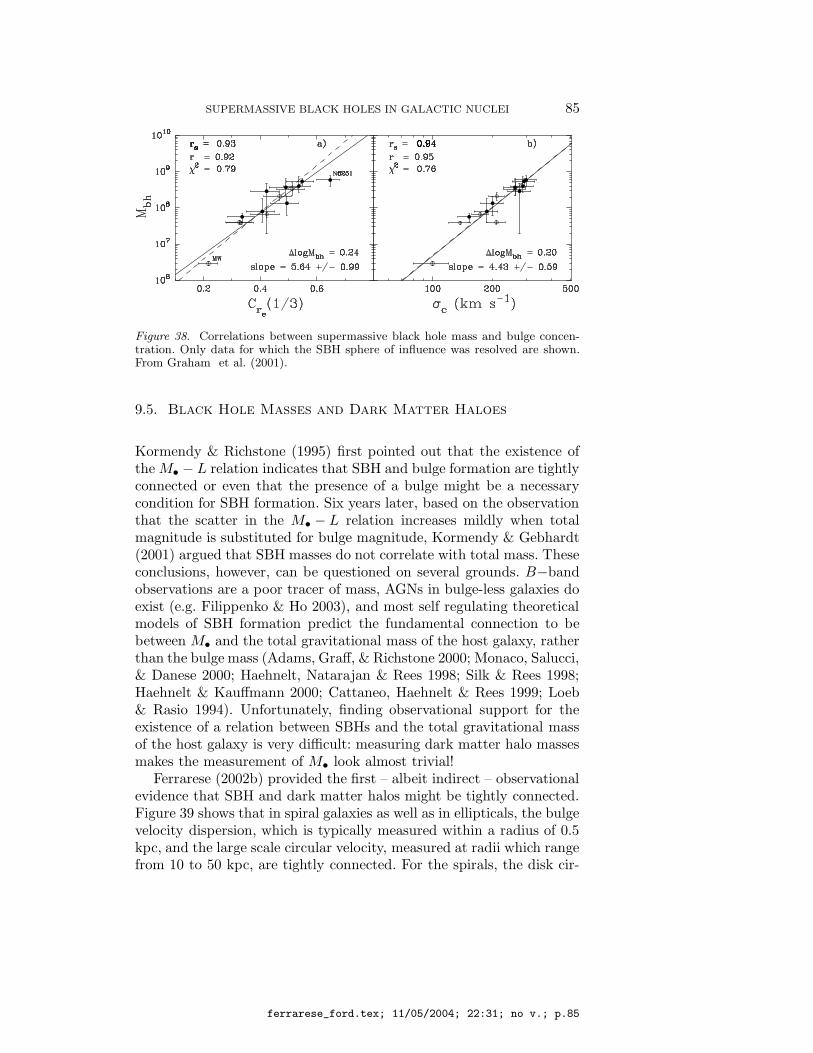
SUPERMASSIVE BLACK HOLES IN GALACTIC NUCLEI 85
Figure 38. Correlations between supermassive black hole mass and bulge concen-tration. Only data for which the SBH sphere of influence was resolved are shown.From Graham et al. (2001).
9.5. Black Hole Masses and Dark Matter Haloes
Kormendy & Richstone (1995) first pointed out that the existence ofthe M• − L relation indicates that SBH and bulge formation are tightlyconnected or even that the presence of a bulge might be a necessarycondition for SBH formation. Six years later, based on the observationthat the scatter in the M• − L relation increases mildly when totalmagnitude is substituted for bulge magnitude, Kormendy & Gebhardt(2001) argued that SBH masses do not correlate with total mass. Theseconclusions, however, can be questioned on several grounds. B−bandobservations are a poor tracer of mass, AGNs in bulge-less galaxies doexist (e.g. Filippenko & Ho 2003), and most self regulating theoreticalmodels of SBH formation predict the fundamental connection to bebetween M• and the total gravitational mass of the host galaxy, ratherthan the bulge mass (Adams, Graff, & Richstone 2000; Monaco, Salucci,& Danese 2000; Haehnelt, Natarajan & Rees 1998; Silk & Rees 1998;Haehnelt & Kauffmann 2000; Cattaneo, Haehnelt & Rees 1999; Loeb& Rasio 1994). Unfortunately, finding observational support for theexistence of a relation between SBHs and the total gravitational massof the host galaxy is very difficult: measuring dark matter halo massesmakes the measurement of M• look almost trivial!
Ferrarese (2002b) provided the first – albeit indirect – observationalevidence that SBH and dark matter halos might be tightly connected.Figure 39 shows that in spiral galaxies as well as in ellipticals, the bulgevelocity dispersion, which is typically measured within a radius of 0.5kpc, and the large scale circular velocity, measured at radii which rangefrom 10 to 50 kpc, are tightly connected. For the spirals, the disk cir-
ferrarese_ford.tex; 11/05/2004; 22:31; no v.; p.85

86 Laura Ferrarese and Holland Ford
cular velocity is measured directly from HI observations which extendbeyond the optical radius of the galaxy, well within the region wherethe rotation velocity stabilizes into a flat rotation curve. For the ellip-tical galaxies, the circular velocity is derived from dynamical modelsapplied to the stellar kinematics (Gerhard et al. 2001; Kronawitter etal. 2000). The best fit vc − σc relation gives:
log vc = (0.84 ± 0.09) log σc + (0.55 ± 0.29) (21)
The existence of the vc − σc relation, with virtually unchanged char-acterization, has since been confirmed using a larger sample of galaxiesby Baes et al. (2003).
The interest of the vc − σc relation reaches beyond the realm ofSBHs. For instance, characterizing the slope and normalization of therelation might help in constraining theoretical models and numeri-cal simulations following the formation and evolution of galaxies (e.g.Steinmetz & Muller 1995). For the purpose of this review, however,the vc − σc relation clearly betrays a correlation between the massesof SBHs and those of the surrounding dark matter halos (Figure 39),although the exact characterization of such a relation remains to beexplored. The velocity dispersion is easily transformed to M• using theM• − σ relation but, unfortunately, the relation between circular veloc-ity and dark matter halo mass is more uncertain. In a CDM-dominateduniverse, the dark matter halo mass is uniquely determined by the halovelocity measured at the virial radius. The latter is defined as the radiusat which the mean density exceeds the mean universal density by aconstant factor, generally referred to as the “virial overdensity”. Basedon this definition, and by virtue of the virial theorem, it immediatelyfollows that the halo mass must be proportional to the third powerof the virial velocity, but unfortunately the constant of proportionalitydepends on the adopted cosmology and may vary with time (e.g., Bryan& Norman 1998; Navarro & Steinmetz 2000). To convert the vc relationto a M• − MDM relation, the virial velocity must also be related to themeasured circular velocity, a step which entails further assumptions onthe value and mass dependence of the halo concentration parameter.Using the M• − σ relation, and the ΛCDM cosmological simulations ofBullock et al. (2002), Ferrarese (2002b) derives
M•
108 M
∼ 0.10
(
MDM
1012 M
)1.65
. (22)
The dependence of M• on MDM is not linear, a result that seemsquite robust no matter what the details of the adopted cosmologicalmodel are. The ratio between SBH and halo mass decreases from ∼
ferrarese_ford.tex; 11/05/2004; 22:31; no v.; p.86
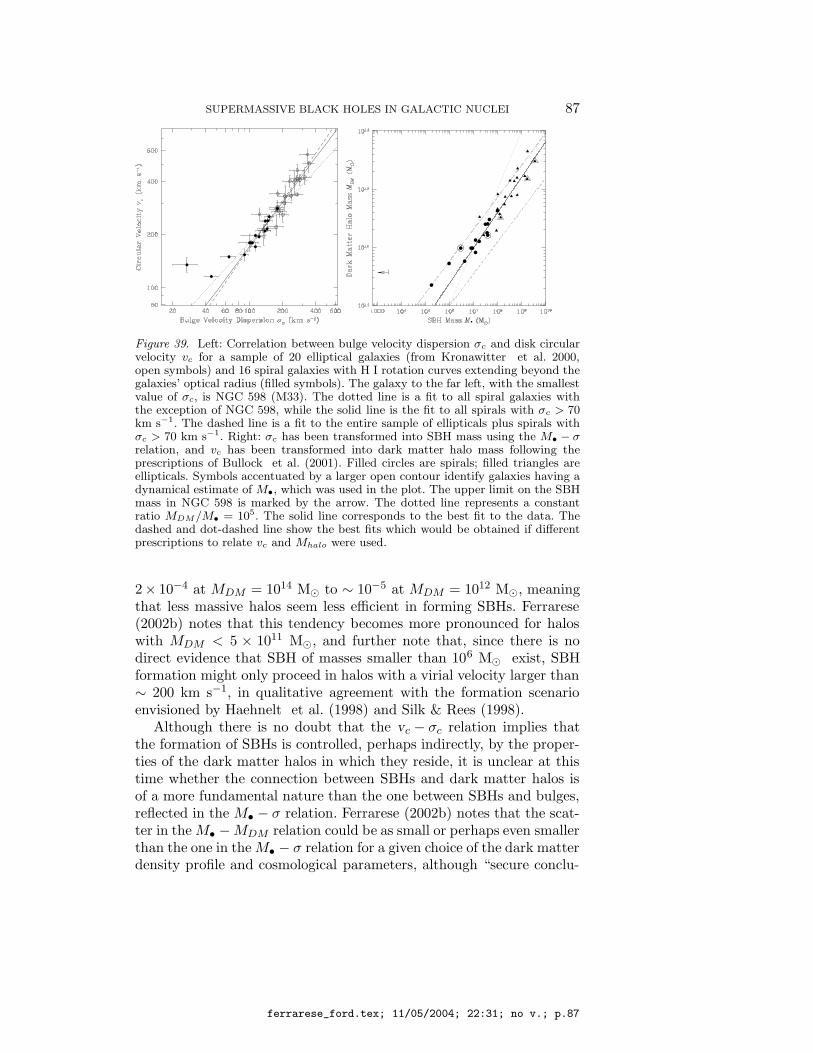
SUPERMASSIVE BLACK HOLES IN GALACTIC NUCLEI 87
Figure 39. Left: Correlation between bulge velocity dispersion σc and disk circularvelocity vc for a sample of 20 elliptical galaxies (from Kronawitter et al. 2000,open symbols) and 16 spiral galaxies with H I rotation curves extending beyond thegalaxies’ optical radius (filled symbols). The galaxy to the far left, with the smallestvalue of σc, is NGC 598 (M33). The dotted line is a fit to all spiral galaxies withthe exception of NGC 598, while the solid line is the fit to all spirals with σc > 70km s−1. The dashed line is a fit to the entire sample of ellipticals plus spirals withσc > 70 km s−1. Right: σc has been transformed into SBH mass using the M• − σrelation, and vc has been transformed into dark matter halo mass following theprescriptions of Bullock et al. (2001). Filled circles are spirals; filled triangles areellipticals. Symbols accentuated by a larger open contour identify galaxies having adynamical estimate of M•, which was used in the plot. The upper limit on the SBHmass in NGC 598 is marked by the arrow. The dotted line represents a constantratio MDM/M• = 105. The solid line corresponds to the best fit to the data. Thedashed and dot-dashed line show the best fits which would be obtained if differentprescriptions to relate vc and Mhalo were used.
2× 10⁻⁴ at MDM = 1014 M to ∼ 10−5 at MDM = 1012 M, meaningthat less massive halos seem less efficient in forming SBHs. Ferrarese(2002b) notes that this tendency becomes more pronounced for haloswith MDM < 5 × 10¹¹ M, and further note that, since there is nodirect evidence that SBH of masses smaller than 106 M exist, SBHformation might only proceed in halos with a virial velocity larger than∼ 200 km s−1, in qualitative agreement with the formation scenarioenvisioned by Haehnelt et al. (1998) and Silk & Rees (1998).
Although there is no doubt that the vc − σc relation implies thatthe formation of SBHs is controlled, perhaps indirectly, by the proper-ties of the dark matter halos in which they reside, it is unclear at thistime whether the connection between SBHs and dark matter halos isof a more fundamental nature than the one between SBHs and bulges,reflected in the M• − σ relation. Ferrarese (2002b) notes that the scat-ter in the M• − MDM relation could be as small or perhaps even smallerthan the one in the M• − σ relation for a given choice of the dark matterdensity profile and cosmological parameters, although “secure conclu-
ferrarese_ford.tex; 11/05/2004; 22:31; no v.; p.87

88 Laura Ferrarese and Holland Ford
Figure 40. The radio luminosity at 1.4 GHz vs. SBH mass for radio selected AGNs(filled squares), and optically selected radio quiet galaxies (open circles) and radioloud AGNs (filled circles). M• was derived from the bulge central velocity dispersion.The radio quiet sample seem to follow the relation (shown by the solid line) firstproposed by Franceschini et al. (1998) for a sample of galaxies with dynamicallymeasured SBH mass. From Snellen et al. (2003).
sions will have to await an empirical characterization of the M• − MDM
relation, with both M• and MDM determined directly from observa-tions”.
9.6. Black Hole Masses and Core Radio Power
One final correlation is worth mentioning. An early study by Frances-chini, Vercellone & Fabian (1998) found a correlation between M• andboth the core and total radio power (measured at 6cm) for the dozennearby weakly active galaxies with measured M• available at the time.Subsequent studies have extended the correlation to high luminosityradio quasars, for which SBH masses are estimated from the Hβ linewidth and the rBLR −L5100 correlation discussed in § 8.4. These stud-ies find either a looser correlation (Laor 2000; Lacy et al. 2001; Wu& Han 2001) or no correlation at all (Ho 2002; Oshlack et al. 2002;Woo & Urry 2002). This possibly indicates that other parameters (forinstance the accretion rate) play a more fundamental role than M• indetermining the radio properties. The most recent (and perhaps clean-est) investigation is that of Snellen et al. (2003), who estimated M• for
ferrarese_ford.tex; 11/05/2004; 22:31; no v.; p.88
SUPERMASSIVE BLACK HOLES IN GALACTIC NUCLEI 89
a sample of powerful radio galaxies using the M• − σ relation. Becausethe M• − σ relation is tighter than the rBLR−L5100 relation used in allother studies, the results are more easily interpretable. Snellen et al.find that a correlation between M• and core radio power exists foroptically selected inactive galaxies only, but breaks down in powerfulAGNs (Figure 40). The correlation between M• and radio power isclearly worth investigating further, not only because of its predictivepower, at least in radio quiet galaxies, but also because it holds impor-tant clues as to the role played by the SBH mass and accretion rate inshaping the character of the nuclear activity.
10. BLACK HOLE DEMOGRAPHICS
Tracing the mass function of SBHs from the quasar era to the presentday can yield important clues about the formation and growth of SBHs.It is, however, a road that can prove treacherous, unless we are fullyaware of the uncertainties associated with this process. For instance,in 1998, a widely cited study by Magorrian et al. led to a cumulativemass density recovered in local SBHs in excess, by a factor five, rela-tive to the one required to power quasars during the optically brightphase (z ∼ 2 − 3). Based on these findings, Richstone et al. (1998)suggested that “a large fraction of black hole growth may occur atradiative efficiencies significantly less than 0.1”. This possibility wasalso put forth by Haehnelt, Natarayan & Rees (1998), although theauthors do mention alternative explanations, including the possibilitythat the Magorrian et al. (1998) local SBH mass density could havebeen “strongly overestimated”. The latter was shown to be the case byFerrarese & Merritt (2000). Merritt & Ferrarese’s (2001a) reassesmentof the local SBH mass density gave values in acceptable agreement withthe SBH mass density at high redshifts. Today, the emerging pictureis one in which the total cumulative SBH mass density does not seemto depend on look-back time, although the SBH mass function (themass density per unit SBH mass interval) might. Again, much has beenread into this (e.g. Yu & Tremaine 2002) although, as we will see, firmconclusions are still premature. In the following we will briefly discusshow SBH mass functions are derived, paying particular attention topotential systematic errors which might affect the results.
Lacking a dynamical way of measuring SBH masses in high red-shift quasars, these have been inferred directly from quasar counts inthe optical (Soltan 1982; Small & Blandford 1992; Chokshi & Turner1992) and, most recently, X-rays. Andrzej Soltan (1982) first pointedout that under the assumption that the QSO luminosity is produced by
ferrarese_ford.tex; 11/05/2004; 22:31; no v.; p.89
90 Laura Ferrarese and Holland Ford
gas accretion onto the central SBH, i.e. Lbol = εMc2, the total cumula-tive SBH mass density can be derived directly from the mean comovingenergy density in QSO light. Once a bolometric correction and a con-version efficiency ε of mass into energy are assumed, the latter is simplythe integral, over luminosity, of the optical quasar luminosity functionmultiplied by luminosity. Based on these arguments, Soltan concludedthat the SBHs powering high redshift (z > 0.3) quasars comprise atotal mass density of ∼ 5 × 10⁴ M Mpc−3, each SBH having a massin the 108 −109 M range. It was Soltan’s argument which first lead tothe inescapable conclusion that most, if not all, nearby galaxies musthost dormant black holes in their nuclei. This realization has been themain driver for SBH searches in nearby quiescent galaxies and has kin-dled interest in the accretion crisis in nearby galactic nuclei (Fabian &Canizares 1988), ultimately leading to the revival of accretion mecha-nisms with low radiative efficiencies (Rees et al. 1982; Narayan & Yi1995).
Small & Blandford (1992) proposed a different formalism to describethe time evolution of the SBH mass function, based on a continuityequation of the type:
δN
δt+
δ
δM(N < M
.>) = S(M, t) (23)
where N(M, t) is the number density of SBH per unit comoving volume
and unit mass, < M.
(M, t) > is the mean accretion rate of a SBH ofmass M , and S(M, t) is a source function. Under the assumption thatduring the optically bright phase quasars and bright AGNs accreteat an essentially constant M
./M , Small & Blandford relate the mass
accretion rate M.
to the luminosity as L = λMc2/tS = εM.c2, where λ
is the fraction of the Eddington rate at which the SBH is accreting, andtS is the Salpeter time (equation 2). N(M, t) is related to the opticalluminosity function Φ(L, t) as Φ(L, t) = N(M, t)δ(M, t)M . δ(M, t) isthe QSO “duty cycle”, i.e. the fraction of the time which the QSOspends accreting from the surrounding medium, so that < M
.(M, t) >=
δ(M, t)M.
(M, t). Under the assumption that SBHs are originally inplace with a minimum mass, and that subsequently no SBHs are formedor destroyed (for instance through merging processes), equation (23)can then be written as
δN
δt= −
(
λc
tE
)2 1
ε
δΦ
δL, (24)
which can be integrated for a given set of initial conditions (Small& Blandford 1992; Yu & Tremaine 2002; Ferrarese 2002a; Marconi &Salvati 2002).
ferrarese_ford.tex; 11/05/2004; 22:31; no v.; p.90
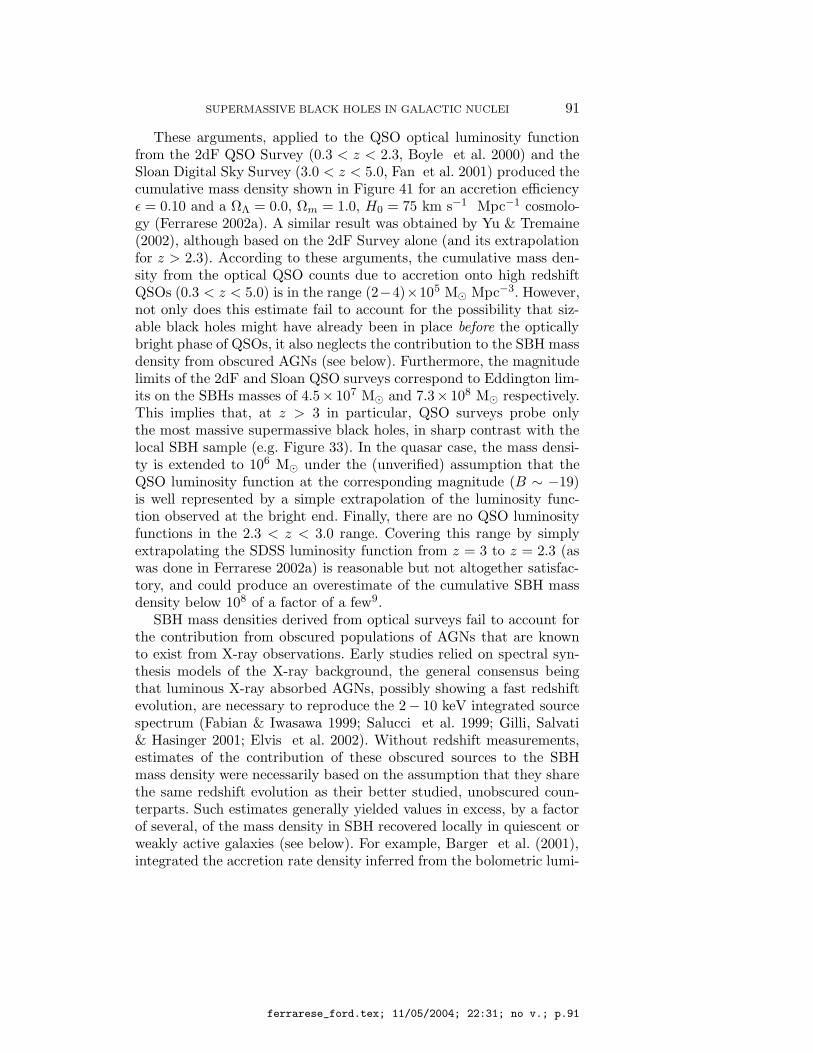
SUPERMASSIVE BLACK HOLES IN GALACTIC NUCLEI 91
These arguments, applied to the QSO optical luminosity functionfrom the 2dF QSO Survey (0.3 < z < 2.3, Boyle et al. 2000) and theSloan Digital Sky Survey (3.0 < z < 5.0, Fan et al. 2001) produced thecumulative mass density shown in Figure 41 for an accretion efficiencyε = 0.10 and a ΩΛ = 0.0, Ωm = 1.0, H0 = 75 km s−1 Mpc−1 cosmolo-gy (Ferrarese 2002a). A similar result was obtained by Yu & Tremaine(2002), although based on the 2dF Survey alone (and its extrapolationfor z > 2.3). According to these arguments, the cumulative mass den-sity from the optical QSO counts due to accretion onto high redshiftQSOs (0.3 < z < 5.0) is in the range (2−4)×105 M Mpc−3. However,not only does this estimate fail to account for the possibility that siz-able black holes might have already been in place before the opticallybright phase of QSOs, it also neglects the contribution to the SBH massdensity from obscured AGNs (see below). Furthermore, the magnitudelimits of the 2dF and Sloan QSO surveys correspond to Eddington lim-its on the SBHs masses of 4.5× 10⁷ M and 7.3× 10⁸ M respectively.This implies that, at z > 3 in particular, QSO surveys probe onlythe most massive supermassive black holes, in sharp contrast with thelocal SBH sample (e.g. Figure 33). In the quasar case, the mass densi-ty is extended to 106 M under the (unverified) assumption that theQSO luminosity function at the corresponding magnitude (B ∼ −19)is well represented by a simple extrapolation of the luminosity func-tion observed at the bright end. Finally, there are no QSO luminosityfunctions in the 2.3 < z < 3.0 range. Covering this range by simplyextrapolating the SDSS luminosity function from z = 3 to z = 2.3 (aswas done in Ferrarese 2002a) is reasonable but not altogether satisfac-tory, and could produce an overestimate of the cumulative SBH massdensity below 108 of a factor of a few9.
SBH mass densities derived from optical surveys fail to account forthe contribution from obscured populations of AGNs that are knownto exist from X-ray observations. Early studies relied on spectral syn-thesis models of the X-ray background, the general consensus beingthat luminous X-ray absorbed AGNs, possibly showing a fast redshiftevolution, are necessary to reproduce the 2− 10 keV integrated sourcespectrum (Fabian & Iwasawa 1999; Salucci et al. 1999; Gilli, Salvati& Hasinger 2001; Elvis et al. 2002). Without redshift measurements,estimates of the contribution of these obscured sources to the SBHmass density were necessarily based on the assumption that they sharethe same redshift evolution as their better studied, unobscured coun-terparts. Such estimates generally yielded values in excess, by a factorof several, of the mass density in SBH recovered locally in quiescent orweakly active galaxies (see below). For example, Barger et al. (2001),integrated the accretion rate density inferred from the bolometric lumi-
ferrarese_ford.tex; 11/05/2004; 22:31; no v.; p.91

92 Laura Ferrarese and Holland Ford
nosity of a sample of 69 hard X-ray sources to obtain a total cumulativemass density of SBHs of ∼ 2 × 10⁶ MMpc−3 (for ε = 0.1), a factor5 − 10 larger than recovered locally (Yu & Tremaine 2002; Ferrarese2002a; Marconi & Salvati 2001).
The launch of the Chandra and the XMM-Newton satellites madeit possible to resolve most of the X-ray background into individualsources; optical followups revealed that the bulk of the sources are at aredshift z ∼ 0.7, which is significantly lower than the one which char-acterizes the optically bright phase of the quasars (Alexander et al.2001; Barger et al. 2002; Hasinger 2002; Rosati et al. 2002; Cowieet al. 2003). The redshift distribution of the obscured sources affectsboth their intrinsic luminosity and the bolometric correction to theobserved X-ray fluxes (which differs for high luminosity and low lumi-nosity AGNs). Accounting for this led to a downward revision in thecumulative SBH mass density in obscured AGNs to 2× 10⁵ MMpc−3
(Cowie et al. 2003; Fabian 2003). The current scenario is therefore of apopulation of unobscured, high luminosity quasars which dominate theaccretion at high redshift, and a lower redshift population of obscuredAGNs accreting at much lower rates (for instance, Cowie et al. esti-mate that obscured AGNs accrete at no more than a few 10−5 Myr−1
Mpc−3).The SBH mass function in local (z < 0.1) AGNs (unobscured and
obscured) has received considerably less attention for several reasons.Compared to QSOs, lower-luminosity AGNs have a small ratio of nucle-ar to stellar luminosity, making it difficult to assess what fraction ofthe total luminosity is due to accretion onto the central black hole.Furthermore, the past accretion history is not known, and it is quitelikely that a significant fraction of the SBH mass predates the onset ofthe present nuclear activity. Finally, it is unlikely that lower luminos-ity AGNs are accreting at a constant fraction of the Eddington rate.Padovani, Burg & Edelson (1990) estimated a total cumulative massdensity in local Seyfert 1 galaxies of ∼ 600 MMpc−3, based on thephotoionization method (§ 8.5) applied to the CfA magnitude limitedsample. A recent revision of this result (Ferrarese 2002a), led to anestimate a factor ∼ 8 larger (Figure 41). This notwithstanding, themain conclusion reached by Padovani et al. still holds: “the bulk ofthe mass related to the accretion processes connected with past QSOactivity does not reside in Seyfert 1 nuclei. Instead, the remnants of
9 While the extrapolation to z = 2.3 of the mass density of the SDSS QSOsjoins smoothly with those measured from the 2dF survey at the same redshift forM• <∼ 108 M, this is not true for smaller masses, where the SDSS mass densityextrapolated to z = 2.3 overpredicts the QSO mass density (per unit redshift)derived from the 2dF data by an order of magnitude.
ferrarese_ford.tex; 11/05/2004; 22:31; no v.; p.92
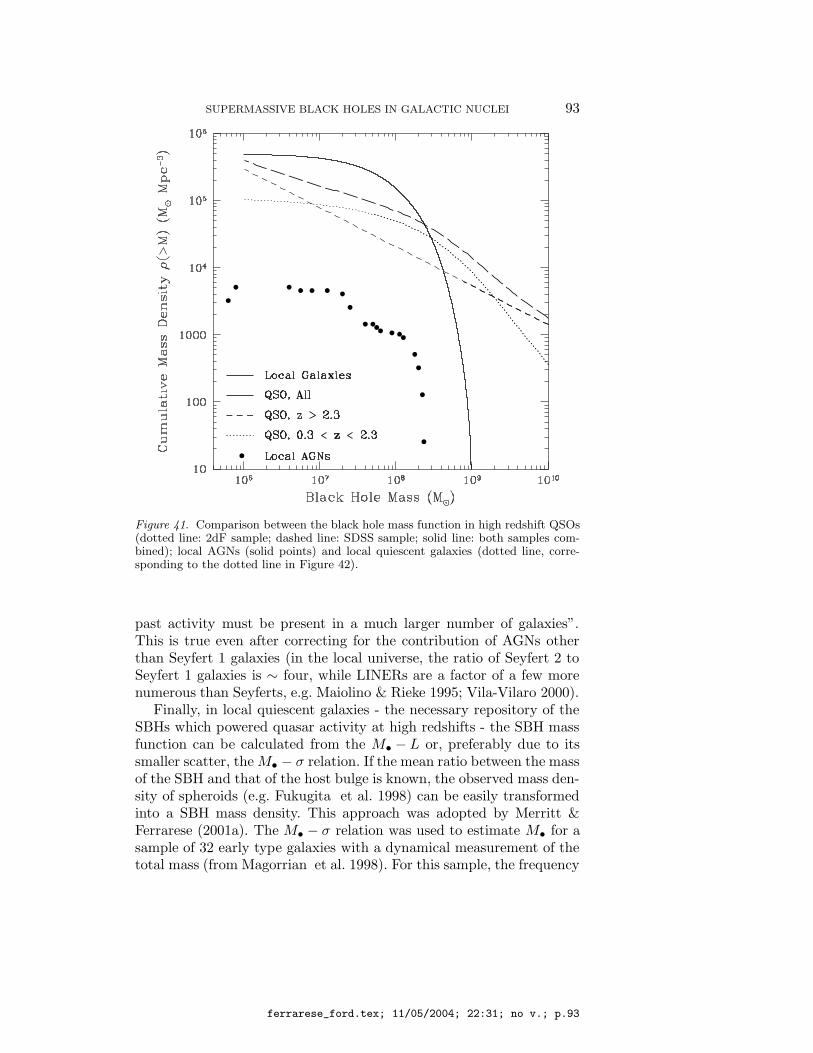
SUPERMASSIVE BLACK HOLES IN GALACTIC NUCLEI 93
Figure 41. Comparison between the black hole mass function in high redshift QSOs(dotted line: 2dF sample; dashed line: SDSS sample; solid line: both samples com-bined); local AGNs (solid points) and local quiescent galaxies (dotted line, corre-sponding to the dotted line in Figure 42).
past activity must be present in a much larger number of galaxies”.This is true even after correcting for the contribution of AGNs otherthan Seyfert 1 galaxies (in the local universe, the ratio of Seyfert 2 toSeyfert 1 galaxies is ∼ four, while LINERs are a factor of a few morenumerous than Seyferts, e.g. Maiolino & Rieke 1995; Vila-Vilaro 2000).
Finally, in local quiescent galaxies - the necessary repository of theSBHs which powered quasar activity at high redshifts - the SBH massfunction can be calculated from the M• − L or, preferably due to itssmaller scatter, the M• − σ relation. If the mean ratio between the massof the SBH and that of the host bulge is known, the observed mass den-sity of spheroids (e.g. Fukugita et al. 1998) can be easily transformedinto a SBH mass density. This approach was adopted by Merritt &Ferrarese (2001a). The M• − σ relation was used to estimate M• for asample of 32 early type galaxies with a dynamical measurement of thetotal mass (from Magorrian et al. 1998). For this sample, the frequency
ferrarese_ford.tex; 11/05/2004; 22:31; no v.; p.93

94 Laura Ferrarese and Holland Ford
function N [log(M•/Mbulge)] is well approximated by a Gaussian with〈log(M•/Mbulge)〉 ∼ −2.90 and standard deviation ∼ 0.45. This impliesM•/Mbulge ∼ 1.3 × 10⁻³ or, when combined with the mass density inlocal spheroids from Fukugita et al. (1998), ρ• ∼ 5 × 10⁵ MMpc−3.
Alternatively, ρ• can be derived by combining the M• − σ rela-tion with the velocity function of galaxies. Compared to the previousmethod, this has the added bonus of producing an analytical repre-sentation of the cumulative SBH mass density as a function of M•.The process, however, can be rather involved. The velocity function isgenerally constructed starting from a galaxy luminosity function (e.g.Marzke et al. 1998). This needs to be converted to a bulge luminosityfunction, which entails the adoption of a ratio between total and bulgeluminosity (e.g. from Fukugita et al. 1998). Both steps need to be car-ried out separately for galaxies of different Hubble types. The derivedbulge luminosity function can be combined directly with the M• − Lrelation to give a SBH mass function, or it can first be transformedto a velocity dispersion function (through the Faber-Jackson relation,which again depends on the Hubble type), and then combined with theM• − σ relation. Both approaches have drawbacks. The M• − L rela-tion has significant (and possibly Hubble-type dependent) scatter, whilethe Faber-Jackson relation has large scatter and is ill defined, especiallyfor bulges. The approach above was followed by Salucci et al. (1999),Marconi & Salvati (2001), Ferrarese (2002a), Yu & Tremaine (2002),and Aller & Richstone (2002). Figure 42 shows the cumulative SBHmass functions separately for the E/S0 and spiral populations, derivedby Ferrarese (2002a) from the M• − L relation and the M• − σ relationcombined with the Faber-Jackson relations for ellipticals and spirals.While the two distributions differ in the details, there is little differ-ence in the total mass density, which falls in the range (4 − 5) × 105
MMpc−3. This is in excellent agreement with the estimate of Merritt& Ferrarese (2001a).
Wyithe & Loeb (2003) used a more direct approach, and employedthe velocity dispersion function directly measured by Sheth et al.(2003) from SDSS data. The only disadvantage of this approach isthat the SDSS velocity dispersion function is not defined below 200 kms−1, i.e. in the regime populated by spiral galaxies (M• <∼ 1.5 × 10⁸
M). The derived mass function is shown in Figure 43. As pointedout by Wyithe & Loeb, the mass function is different from the onederived in the previous case, declining more gradually at the high massend (where the velocity dispersion function is measured directly). Bycomparing the local mass function with that derived by combining thePress-Schechter (1974) halo mass function with the M• − MDM rela-tion, Wyithe & Loeb find that SBHs with M• <∼ 108 M formed during
ferrarese_ford.tex; 11/05/2004; 22:31; no v.; p.94
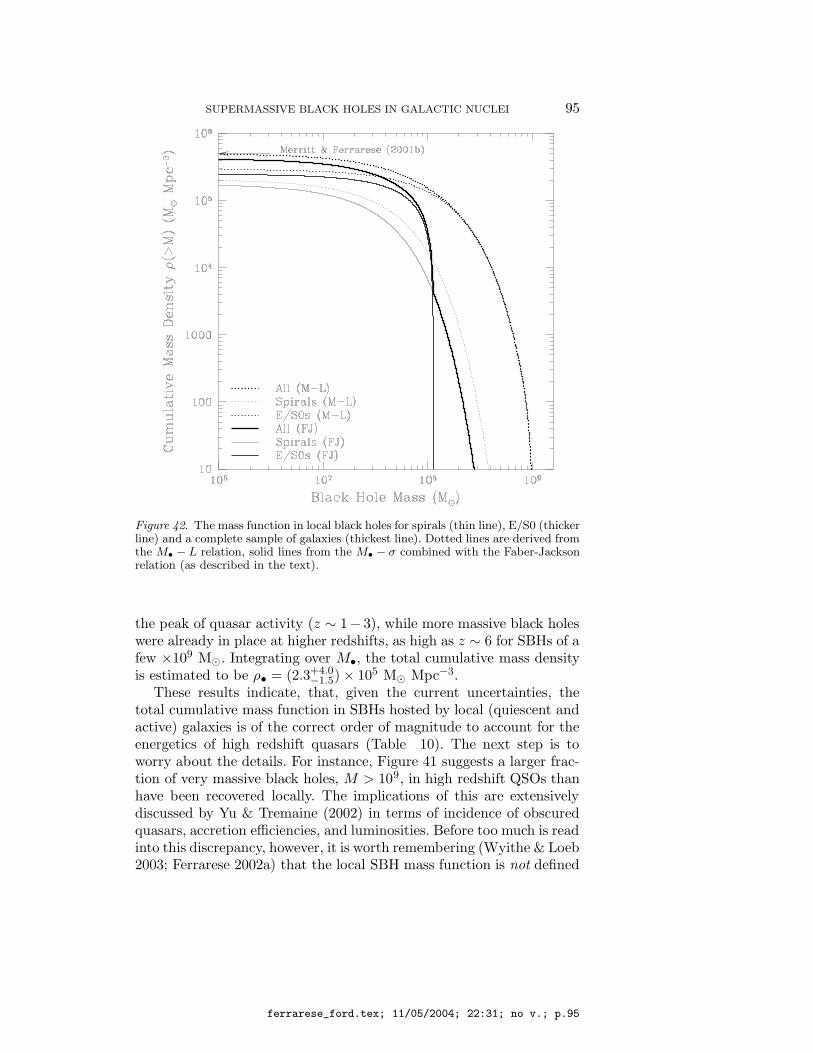
SUPERMASSIVE BLACK HOLES IN GALACTIC NUCLEI 95
Figure 42. The mass function in local black holes for spirals (thin line), E/S0 (thickerline) and a complete sample of galaxies (thickest line). Dotted lines are derived fromthe M• − L relation, solid lines from the M• − σ combined with the Faber-Jacksonrelation (as described in the text).
the peak of quasar activity (z ∼ 1− 3), while more massive black holeswere already in place at higher redshifts, as high as z ∼ 6 for SBHs of afew ×109 M. Integrating over M•, the total cumulative mass densityis estimated to be ρ• = (2.3+4.0
−1.5) × 105 M Mpc−3.These results indicate, that, given the current uncertainties, the
total cumulative mass function in SBHs hosted by local (quiescent andactive) galaxies is of the correct order of magnitude to account for theenergetics of high redshift quasars (Table 10). The next step is toworry about the details. For instance, Figure 41 suggests a larger frac-tion of very massive black holes, M > 109, in high redshift QSOs thanhave been recovered locally. The implications of this are extensivelydiscussed by Yu & Tremaine (2002) in terms of incidence of obscuredquasars, accretion efficiencies, and luminosities. Before too much is readinto this discrepancy, however, it is worth remembering (Wyithe & Loeb2003; Ferrarese 2002a) that the local SBH mass function is not defined
ferrarese_ford.tex; 11/05/2004; 22:31; no v.; p.95

96 Laura Ferrarese and Holland Ford
Figure 43. The mass function of SBHs derived by Wyithe & Loeb (2003) from thevelocity function of Sheth et al. (2003) and the Mbh − σ relation of Merritt &Ferrarese (2001b) (gray area). The lower bound corresponds to the lower limit indensity for the observed velocity function, while the grey lines show the extrapolationto lower densities. The black lines show the mass function computed at z = 1, 3 and6 from the Press-Schechter (1974) halo mass function.
Table V. Summary of SBH Mass Densities
Method ρ• Reference
and Redshift (105 MMpc−3)
QSO optical counts, 2 − 4 Ferrarese 2002a; Yu & Tremaine 2002
0.3 < z < 5.0
AGN X-ray counts, ∼ 2 Fabian 2003; Cowie et al. 2003
z(peak) ∼ 0.7
Local AGNs, 0.05 − 0.6 Padovani et al. 1990; Ferrarese 2002a
z < 0.1
Local Quiescent Galaxies, 2.5 − 5 Ferrarese 2002a; Yu & Tremaine 2002
z < 0.03 Wyithe & Loeb (2003)
in the high (≥ 1010 M) mass range. In this context, targeting SBHsin brightest cluster galaxies (§ 11), will be particularly illuminating.
ferrarese_ford.tex; 11/05/2004; 22:31; no v.; p.96
SUPERMASSIVE BLACK HOLES IN GALACTIC NUCLEI 97
11. THE FUTURE OF SUPERMASSIVE BLACK HOLESTUDIES.
The past sections dealt with the measurements of SBH masses in a(relatively) large number of nearby galaxies, and the scaling relationswhich have ensued between SBH masses and the properties of theirhost galaxies or nuclei. A graphic summary is given in Figure 44. It isa remarkable fact that most of the information contained in the Figurehas surfaced only in the past few years; even more remarkable to thinkthat, in spite of the tremendous progress made, we are still only atthe beginning of a long, fascinating journey. We have yet to find out,for instance, if SBHs spin and how fast, whether binary SBHs existand how quickly they coalesce following galaxy mergers, what are thedetailed modalities of accretion, and what controls the character andlevel of nuclear activity. We have not yet probed the morphology andkinematics of the gas within a few thousands of Schwarzschild radii fromthe central SBH. On a grander scale, we do not know how supermassiveblack holes form. We are, however, for the first time, in a position inwhich it does not appear hopelessly optimistic to think that answerswill be found in the near future.
We will conclude this review with a brief discussion of what observa-tional breakthroughs are required to catalyse further progress. To thisday, the field has been propelled forward largely by a single event, thelaunch of the Hubble Space Telescope in 1990. With (at the time) a10-fold boost in spatial resolution compared to ground based opticaltelescopes, HST could resolve the sphere of influence of putative SBHsin a significant number of galaxies. HSTalso enabled the discovery ofthe nuclear, regular gas and dust disks which opened a new, unexpect-ed, and ultimately very successful way to constrain the central potential(§ 7). It remains true that the case for a singularity is airtight only inthe Galactic center and NGC 4258, both of which were studied usingground based facilities. However, proper motion studies are not feasi-ble in extragalactic nuclei (although Galactic globular clusters mightbe promising targets), and though water masers hold great promise(Greenhill et al. 2003), they have not yet and are unlikely to producemore than a few (albeit superlative, if NGC 4258 is any indication)more detections. The natural question to ask is therefore, what will bethe role of HST in the years to come? The answer is, unfortunately, notas optimistic as one might hope, making it necessary to look elsewherefor new ways to boost our knowledge in this field.
To further our understanding of SBH formation and evolution, itis imperative to target SBH environments as diverse and extreme aspossible. For instance, if the evolution of SBHs follows a “merger tree”
ferrarese_ford.tex; 11/05/2004; 22:31; no v.; p.97
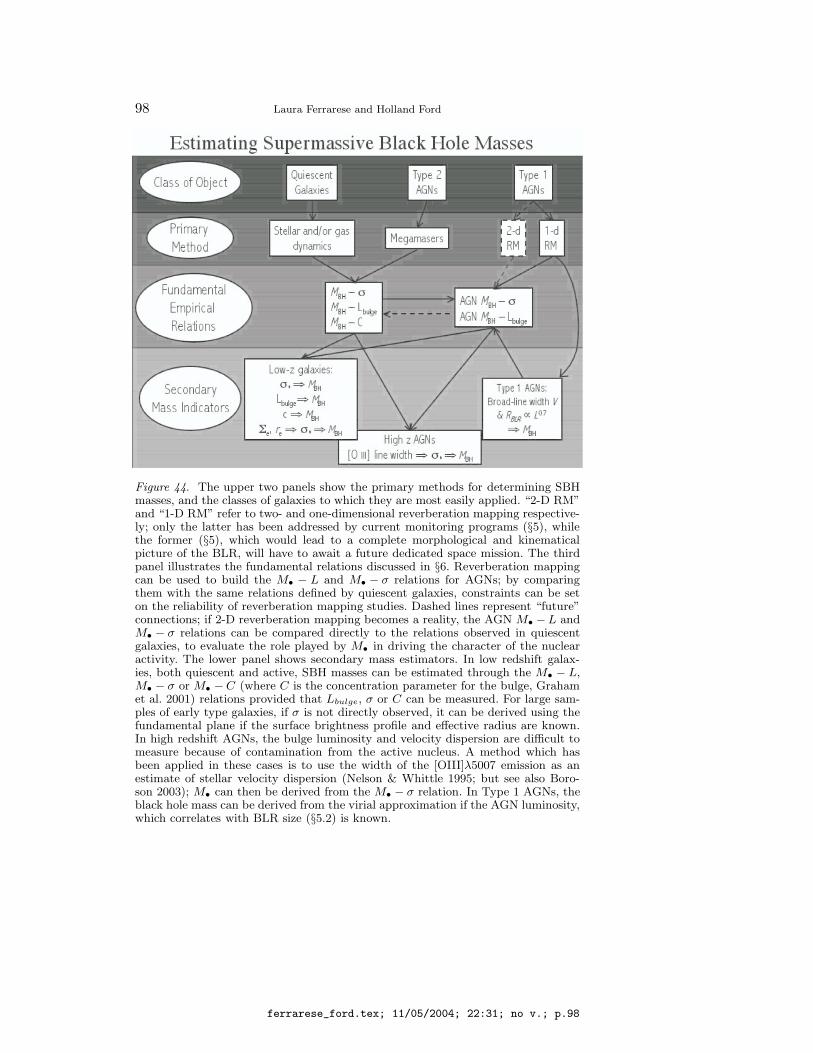
98 Laura Ferrarese and Holland Ford
Figure 44. The upper two panels show the primary methods for determining SBHmasses, and the classes of galaxies to which they are most easily applied. “2-D RM”and “1-D RM” refer to two- and one-dimensional reverberation mapping respective-ly; only the latter has been addressed by current monitoring programs (§5), whilethe former (§5), which would lead to a complete morphological and kinematicalpicture of the BLR, will have to await a future dedicated space mission. The thirdpanel illustrates the fundamental relations discussed in §6. Reverberation mappingcan be used to build the M• − L and M• − σ relations for AGNs; by comparingthem with the same relations defined by quiescent galaxies, constraints can be seton the reliability of reverberation mapping studies. Dashed lines represent “future”connections; if 2-D reverberation mapping becomes a reality, the AGN M• −L andM• − σ relations can be compared directly to the relations observed in quiescentgalaxies, to evaluate the role played by M• in driving the character of the nuclearactivity. The lower panel shows secondary mass estimators. In low redshift galax-ies, both quiescent and active, SBH masses can be estimated through the M• − L,M• − σ or M• − C (where C is the concentration parameter for the bulge, Grahamet al. 2001) relations provided that Lbulge, σ or C can be measured. For large sam-ples of early type galaxies, if σ is not directly observed, it can be derived using thefundamental plane if the surface brightness profile and effective radius are known.In high redshift AGNs, the bulge luminosity and velocity dispersion are difficult tomeasure because of contamination from the active nucleus. A method which hasbeen applied in these cases is to use the width of the [OIII]λ5007 emission as anestimate of stellar velocity dispersion (Nelson & Whittle 1995; but see also Boro-son 2003); M• can then be derived from the M• − σ relation. In Type 1 AGNs, theblack hole mass can be derived from the virial approximation if the AGN luminosity,which correlates with BLR size (§5.2) is known.
ferrarese_ford.tex; 11/05/2004; 22:31; no v.; p.98
SUPERMASSIVE BLACK HOLES IN GALACTIC NUCLEI 99
scenario, the very small and very large SBHs, the dwarf and brightestgalaxies, occupy a precious niche in the parameter space, the former asthe building blocks and the latter as the end results of the evolutionarychain. Dark matter dominated low surface brightness galaxies can tellus whether it is the bulge, or the dark matter halo that catalysizesthe formation of SBHs (§ 9.2, 9.5). Unfortunately, not only have dwarfgalaxies, brightest cluster galaxies and low surface brightness galaxiesnot been probed yet, the sample of galaxies listed in Table II is uncom-fortably homogeneous. Most are early type galaxies in small groupsor clusters (M87 is the only cD) within 30 Mpc. Most detected SBHsare in the 108 <∼ M• <∼ 109 M range, there are no detections below
106 M (the “building block” range) or above 1010 M (the brightestquasar range), and even the 106 <∼ M• <∼ 107 M range is very poorlysampled.
How much can HST broaden these horizons? Figure 45 shows M•
(calculated using the M• − L relation, after transforming the totalluminosity to bulge luminosity following Fukugita et al. 1998) againstdistance (for H0 = 75 km s−1 Mpc−1) for all galaxies in the CfA red-shift sample (Huchra et al. 1990). Exposure time requirements (HST’smirror is rather small and the throughput is relatively low) are includedin Figure 46, which is restricted, for simplicity, to early type galaxiesonly. Based on these two figures, it is clear HST can only (and prettymuch has already) scrape the top of the iceberg. For instance, ironical-ly, most of the very largest SBHs (M• >∼ 109 M) are beyond the reachof HST, since the low surface brightness which characterizes giant ellip-ticals makes stellar dynamical studies prohibitively time consuming10.Similarly, the less massive SBHs, typically expected to be hosted in
dwarf elliptical galaxies, are beyond HST capabilities: the stellar pop-ulation in the nearest dwarfs – where HST can resolve the sphere ofinfluence of a small, hundred thousand solar masses SBH, is resolved inindividual stars, each too faint to be handled by HST’s small mirror11.
It seems unavoidable that a 10-meter class, diffraction limited (at8500 A) telescope12 will be needed to fully explore the incidence ofSBHs as small as 106 and as large as 1010 M, or to target galaxiesfully sampling the Hubble sequence. If one wishes to reach galaxies inthe most nearby rich Abell clusters, and study the influence of envi-ronment on the formation and evolution of SBHs, the requirementsare even more stringent, demanding a 30-meter class, diffraction limit-ed telescope. While there are currently no plans to replace HST with a
10 For instance, measuring M• in M87 (d ∼ 15 Mpc) using stellar dynamics wouldrequire over 100 orbits of STIS time.
11 For instance, a constraint on the central mass in NGC 147 (d ∼ 660 kpc) wouldrequire several hundred orbits with STIS.
ferrarese_ford.tex; 11/05/2004; 22:31; no v.; p.99
100 Laura Ferrarese and Holland Ford
new optical space telescope (HST’s replacement, the James Webb SpaceTelescope, will operate at near and mid-infrared wavelengths), sever-al ground based 10m class telescopes are already in operation (Keck,Gemini, VLT, Subaru, etc.). Designs for 30m (CELT - the CaliforniaExtremely Large Telescope; GSMT - the Giant Segmented Mirror Tele-scope; VLOT - the Very Large Optical Telescope) and 100m (OWL -the Overwhelmingly Large Telescope) are at various stages of devel-opment. For all of these telescopes, diffraction limited performance inthe near infrared using Adaptive Optics techniques is a priority, andwill soon become routine operation. In the near infrared, stellar kine-matics can be obtained through observations of the CO bandhead at2.3 µm; at these wavelengths, a ground based, AO-equipped, 8m-classtelescope will have resolution comparable to the one HST achieves atthe CaII triplet near 8500 A. The availability of Integral Field Spec-trographs (IFUs), several of which are either commissioned or in oper-ation, is another important advantage of ground-based telescopes overHST, since a full kinematical map is critical to fully understand thedynamical structure of galactic cores (e.g. de Zeeuw 2003)
Multiple-conjugate adaptive optics (MCAO), producing diffractionlimited images over wide field of views, are being developed at severalexisting observatories (e.g. Gemini and the VLT) in the near infrared. Inthe more distant future, the hope is that MCAO will become a realityin the optical as well. The increased sensitivity, combined with thecritical increase in resolving power, will provide the perfect conditionsfor systematic and complete surveys of SBHs in the local universe.
Until then, reverberation mapping (§ 8.3) is likely to replace tra-ditional resolved dynamics as the method of choice to probe the verysmallest, largest and most distant SBHs. The implementation of queuescheduling at some large ground based optical facilities (Gemini, SALT,and the VLT) will greatly increase the efficiency of the monitoring pro-grams. The masses inferred from the time-delays will receive a finalstamp of approval once the morphology and kinematics of the BLR arefirmly established. The latter task, which requires multi-wavelengthsmonitoring with very stringent conditions for the time resolution andlength of the program, will remain the prerogative of dedicated spacemissions (Peterson & Horne 2003; Peterson, Polidan & Robinson 2003).There are three dozen galaxies for which time delays have been mea-sured to date, it doesn’t seem unreasonable to think that this sample
12 This is a somewhat loose requirement, which is made by simply scaling theperformance of HST/STIS to a telescope with larger collective area/resolution. It ispossible that a ground based telescope with adaptive optics working at 8500 A mightprove sufficient - although more detailed modeling, accounting for the PSF shape,should be carried out to verify this point.
ferrarese_ford.tex; 11/05/2004; 22:31; no v.; p.100

SUPERMASSIVE BLACK HOLES IN GALACTIC NUCLEI 101
Figure 45. SBH mass vs. distance for all galaxies in the CfA Redshift Sample(Huchra et al. 1990). Only for the galaxies which lie above the solid lines the sphereof influence of the putative nuclear SBH can be resolved by HST/STIS, an 8m anda 30m diffraction limited telescope. A few nearby groups and clusters are marked.It should be noted that because of the large scatter in the M• − L relation (a factorof several in M•), this figure has only statistical value. From Ferrarese (2003).
could be doubled in the near future. Even then, studying the redshiftevolution of SBH scaling relations will more realistically be done usingsecondary mass estimators tied to reverberation mapping (§ 8.4).
Detecting SBH binaries is another important goal for future research.The formation of SBH binaries following galaxy merging seems unavoid-able (Begelman, Blandford & Rees 1980), and indeed the coalescenceof binary SBHs has been called into action to account for the peculiarproperties of the jets/lobes in some radio galaxies (Merritt & Ekers2002; Liu, Wu & Cao 2003). The existence of a SBH binary has alsorecently been claimed in the radio galaxy 3C 66, based on the positionalchange of the radio core detected in VLBI observations (Sudou et al.2003). The elliptical orbit traveled by the core in a 1.05 ± 0.03 yearperiod (apparently not a result of the orbital motion of the Earth) isinterpreted as due to a SBH binary with a separation of ∼ 1017 cm, and
ferrarese_ford.tex; 11/05/2004; 22:31; no v.; p.101
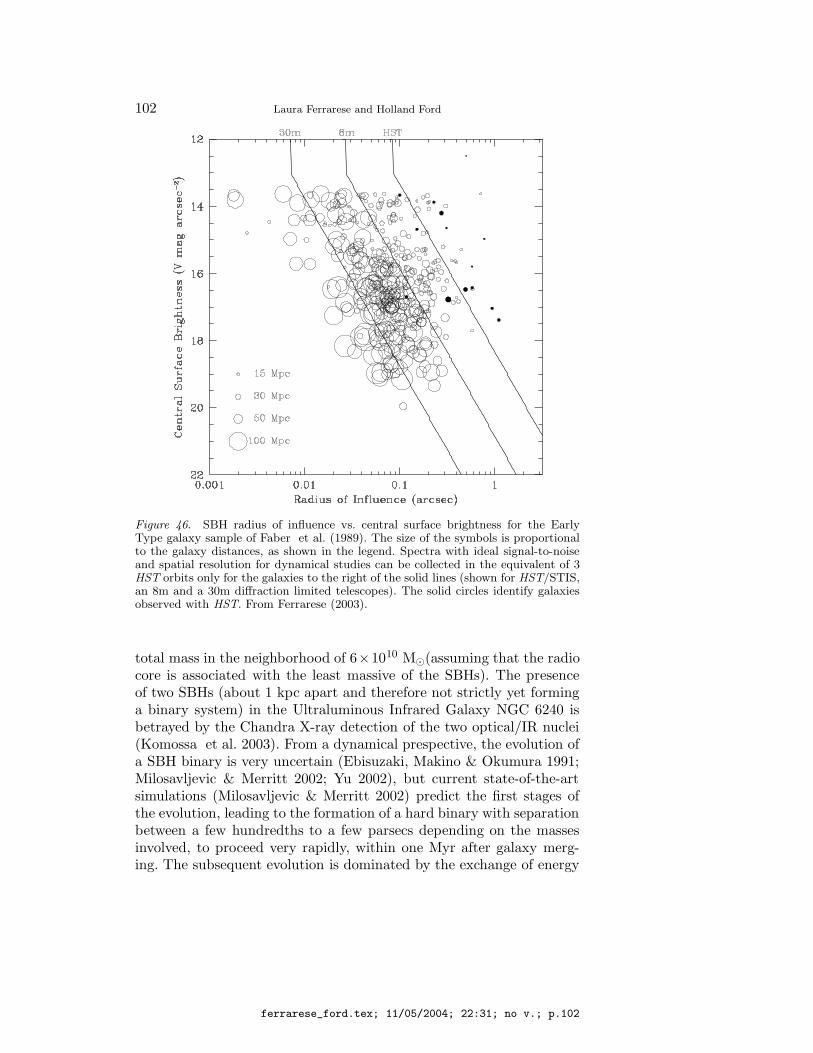
102 Laura Ferrarese and Holland Ford
Figure 46. SBH radius of influence vs. central surface brightness for the EarlyType galaxy sample of Faber et al. (1989). The size of the symbols is proportionalto the galaxy distances, as shown in the legend. Spectra with ideal signal-to-noiseand spatial resolution for dynamical studies can be collected in the equivalent of 3HST orbits only for the galaxies to the right of the solid lines (shown for HST/STIS,an 8m and a 30m diffraction limited telescopes). The solid circles identify galaxiesobserved with HST. From Ferrarese (2003).
total mass in the neighborhood of 6×10¹⁰ M(assuming that the radiocore is associated with the least massive of the SBHs). The presenceof two SBHs (about 1 kpc apart and therefore not strictly yet forminga binary system) in the Ultraluminous Infrared Galaxy NGC 6240 isbetrayed by the Chandra X-ray detection of the two optical/IR nuclei(Komossa et al. 2003). From a dynamical prespective, the evolution ofa SBH binary is very uncertain (Ebisuzaki, Makino & Okumura 1991;Milosavljevic & Merritt 2002; Yu 2002), but current state-of-the-artsimulations (Milosavljevic & Merritt 2002) predict the first stages ofthe evolution, leading to the formation of a hard binary with separationbetween a few hundredths to a few parsecs depending on the massesinvolved, to proceed very rapidly, within one Myr after galaxy merg-ing. The subsequent evolution is dominated by the exchange of energy
ferrarese_ford.tex; 11/05/2004; 22:31; no v.; p.102
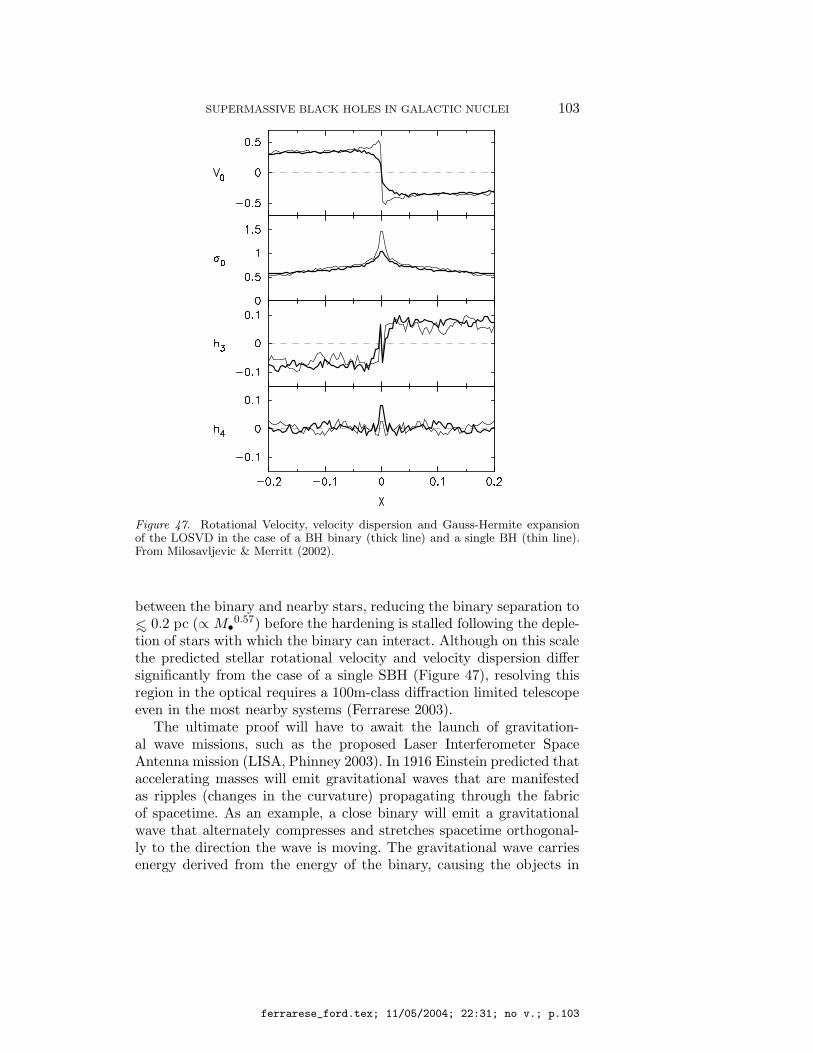
SUPERMASSIVE BLACK HOLES IN GALACTIC NUCLEI 103
Figure 47. Rotational Velocity, velocity dispersion and Gauss-Hermite expansionof the LOSVD in the case of a BH binary (thick line) and a single BH (thin line).From Milosavljevic & Merritt (2002).
between the binary and nearby stars, reducing the binary separation to<∼ 0.2 pc (∝ M•
0.57) before the hardening is stalled following the deple-tion of stars with which the binary can interact. Although on this scalethe predicted stellar rotational velocity and velocity dispersion differsignificantly from the case of a single SBH (Figure 47), resolving thisregion in the optical requires a 100m-class diffraction limited telescopeeven in the most nearby systems (Ferrarese 2003).
The ultimate proof will have to await the launch of gravitation-al wave missions, such as the proposed Laser Interferometer SpaceAntenna mission (LISA, Phinney 2003). In 1916 Einstein predicted thataccelerating masses will emit gravitational waves that are manifestedas ripples (changes in the curvature) propagating through the fabricof spacetime. As an example, a close binary will emit a gravitationalwave that alternately compresses and stretches spacetime orthogonal-ly to the direction the wave is moving. The gravitational wave carriesenergy derived from the energy of the binary, causing the objects in
ferrarese_ford.tex; 11/05/2004; 22:31; no v.; p.103
104 Laura Ferrarese and Holland Ford
the binary to spiral together with an ever-decreasing orbital period.Because spacetime is very “stiff”, the amplitude of the ripples, andthe corresponding stretching and compression of objects imbedded inspacetime, is exceedingly small and difficult to detect. A neutron star(NS) binary system at 300 Mpc produces a spacetime strain h ∼ 10−21
(Thorne 1994; Barish 2000), where the change in length by compressionand stretching is given by ∆L = hL. The amplitude of the wave thatproduces the strain is directly proportional to the mass of the accel-erating object, and, in contrast to electromagnetic radiation, inverselyproportional to the distance to the source (e.g. de Araujo, Miranda,& Aguiar 2001). A gravitational wave with a strain of 10−21 movingthrough the solar system will change the mean Earth-Moon separationby ∼ 4×10⁻⁸ microns! The endeavors to measure gravitation waves aretestimonies to the ingenuity, sophistication, and boldness of physicists.The payoff from the formidable task of detecting gravitational waveswill be an unprecedented opportunity to observe and study generalrelativistic phenomena in extremis.
Terrestrial gravitational wave observatories eventually will be ableto detect the characteristic “chirp” (rapid increase in frequency) fromthe last moments during the mergers of NS/NS, NS/BH, and BH/BHbinary systems and the burst signals from the formation of black holesin asymmetrical supernova explosions within tens of Mpc (Abbott, B. etal. 2003). The first generation of space-based gravitational wave obser-vatories will be able to detect the formation and mergers of massiveblack holes at the cosmological distances where the first galaxies form(z ∼ 7 to 10). At present there is a worldwide network of terrestri-al gravitational wave observatories; the American LIGO (Barish 2000;Abbott, B. 2004), the British-German GEO600 detector (Danzmann,K. 1995; Willke et al. 2002; Abbott et al. 2004), the French-Italian VIR-GO detector (Acernese et al. 2002), the Japanese TAMA300 detector(Ando et al. 2002), and five resonant-bar detectors (Allen et al. 2000).Here we briefly describe LIGO and the results from its first data run in2002. There are two sites for LIGO, one in Hanford Washington, andone in Livingston Louisiana. Both facilities are optical laser interfer-ometers with two equal 4-km long (1-m diameter) evacuated arms inan L-configuration (Barish 2000; Abbott, B. 2004). The Hanford inter-ferometer also has an independent 2-km interferometer enclosed withinthe 4-km arms. LIGO has a design sensitivity hrms(ν) ≤ 10−21 (equiva-lent RMS strain amplitude spectral density) for the strain (differentialfractional change in the length of the two arms) induced by gravita-tional waves with frequencies between ∼30 Hz and 7000 Hz (Abbott etal. 2004).
ferrarese_ford.tex; 11/05/2004; 22:31; no v.; p.104
SUPERMASSIVE BLACK HOLES IN GALACTIC NUCLEI 105
The most likely sources of these high frequency gravitational wavesare the last few minutes of coalescence of NS-NS and BH-NS bina-ries. The coalescence produces a characteristic chirp as the frequencyincreases as the compact objects spiral together. Although the NS/NSmerger rate may be 10 times higher than the BH/NS or BH/BH merg-er rate, because the amplitude of the wave is proportional to the massin the system, BH mergers may be ten times more detectable thanNS mergers (Lipunov, Postnov, & Prokhorov 1997). The seismic noisefloor at low frequencies (∼10 Hz) will prevent terrestrial interferome-ters from detecting the low frequency gravitational waves emitted bymerging SBHs. LIGO’s first data run in 2002 used the 4-km and 2-kmarms at Hanford and the 4-km arms at Livingston (Abbott et al. 2003;Abbott et al. 2004). The 17 day run was sensitive to binary inspiralevents at maximum distances between 30 and 180 Kpc, depending onthe instrument configurations during the run. At peak sensitivity, theinterferometers were sensitive to binary mergers throughout the galaxyand in the Magellanic clouds.
The run established an upper limit R < 170 events per year perequivalent Milky Way Galaxy (Abbott et al. 2003). A second run inFebruary and April of 2003 had 10 times the sensitivity of the firstrun. Depending on the uncertain rate of NS/NS and BH/BH mergersin galaxies (Lipunov, Postnov, & Prokhorov 1997; Kalogera et al. 2001),LIGO will be able to detect NS/NS mergers out to 20 Mpc (Abbott etal. 2004) when it achieves its design sensitivity. The next extraordinari-ly ambitious step in gravitational wave astronomy is the proposed jointNASA/ESA mission to launch a Laser Interferometer Space Antenna(LISA) in 2015. LISA will consist of three spacecraft at the corners ofan equilateral triangle with 5× 10⁶ km arms in an orbit that trails theearth by 20 degrees (Danzmann 2000). The angle between the plane ofthe triangle and the ecliptic will be 60. Each spacecraft has two inter-ferometers in a Y-shaped arm that send/receive a laser beam to/fromeach of the other spacecraft. The remarkable return mirror in each ofthe interferometer arms is a highly polished, free-flying 4-cm platinum-gold cube. The cubes within their vacuum enclosures are maintained ina drag-free inertial orbit by sensing the cubes positions relative to thespacecraft and moving the spacecraft with micro-newton field emissionthrusters to follow the cubes. The spacecraft must follow the orbits ofthe reference cubes with an accuracy of 10 nanometers, and measurethe distance between the spacecraft with an accuracy of 10−5 microns.When these challenges are met, LISA will be able to measure strainsof 10−23 (SNR = 5) at frequencies from 10−4 Hz to 1 Hz with a yearof observations (Danzmann 2000).
ferrarese_ford.tex; 11/05/2004; 22:31; no v.; p.105
106 Laura Ferrarese and Holland Ford
LISA then will be able to observe the formation and merger of SBHsthroughout the Universe. With persistence and sustained funding, grav-itational wave observatories will usher in a new era in relativistic astro-physics that will allow us to observe the most extreme and most ener-getic events in the Universe.
References
Abbott, B., et al. 2003, arXiv:grqc/ 0308069 v1 21 Aug 2003Abbott, B., et al. 2004, NIMPA, 517, 154Acernese, F., et al. 2002, CQGra, 19, 1421Adams, F. C., Graff, D. S., & Richstone, D. 2000, ApJ, 551, L31Akritas, M. G., & Bershady, M. A. 1996, ApJ, 470, 706Alexander, D.M., et al. 2001, ApJ, 122, 2156Allen, C.R., etal. 1962, MNRAS, 124, 477Allen, Z.A., et al. 2000, PhRvL, 85, 5046Alonso-Herrero, A., Ivanov, V.D., Jayawardhana, R., & Hosokawa, T. 2002, ApJ,
571, L1Ando, M., et al. 2002, CQGra, 19, 1409Antonucci, R.R.J. 1993, ARA&A, 31, 473Antonucci, R.R.J., & Miller, J.S. 1985, ApJ, 297, 621.Arav, N., Barlow, T.A., Laor, A., & Blandford, R.D. 1997, MNRAS, 288, 1015Arav, N., Barlow, T.A., Laor, A., Sargent, W.L.W., & Blandford, R.D. 1998,
MNRAS, 297, 990Baade, W., & Minkowski, R. 1954, ApJ, 119, 206Baade, W. 1955 ApJ, 123, 550Bacon, R., Emsellem, E., Combes, F., Copin, Y., Monnet, G., & Martin, P. 2001,
A&A, 371, 409Baes, M., Buyle, P., Hau, G.K.T., & Dejonghe, H. 2003, MNRAS, 341, L44Balick, B., & Brown, R.L. 1974, ApJ, 194, 264Bao, G., & Abramowicz, M.A. 1996, ApJ, 465, 646Barger, A. J. et al. 2001, AJ, 122, 2177Barger, A. J. et al. 2002, AJ, 124, 1839Barish, B.C. 2000, AdSpR, 25, 1165Barth, A. et al. 2001, ApJ, 555, 685Barth, A., Ho, L.C., & Sargent, W.L.W. 2002, ApJ, 566, L13Barth, A., Ho, L.C., & Sargent, W.L.W. 2003, ApJ, 583, 134Begelman, M. C., Blandford, R. D., & Rees, M. J. 1980, Nature, 287, 307Begelman, M.C. 2001, ApJ, 551, 897Belloni, T., & Hasinger, G. 1990, A&A, 227, L33Bian, W.-H., & Zhao, Y.-H. 2003, PASJ, 55, 143Binney, J., & Mamon, G.A. 1982, MNRAS, 200, 361Binney, J. & Tremaine, S. 1987 Galactic Dynamics, Princeton University Press
(Princeton)Blandford, R.D., & McKee, C.F. 1982, ApJ, 255, 419 R.D., & Begelman, M.C. 1999,
MNRAS, 303, L1Blandford, R. D., & Begelman, M. C. 1999, MNRAS, 303, L1Blumenthal, G.R., & Mathews, W.G. 1975, ApJ, 198, 517Bolton, C.T. 1972, Nature, 235, 271Boroson, T.A. 2002, ApJ, 565, 78Bottorff, M., Korista, K.T., Shlosman, I., & Blandfrod, R.D. 1997, ApJ, 479, 200Boyle, B.J., et al. , 2000, MNRAS, 317, 1014
ferrarese_ford.tex; 11/05/2004; 22:31; no v.; p.106
SUPERMASSIVE BLACK HOLES IN GALACTIC NUCLEI 107
Bower, G., et al. 1998, ApJ, 492, L111Braatz, J.A., Wilson, A.S., & Henkel, C. 1994, ApJ, 437, L99Braatz, J.A., Wilson, A.S., & Henkel, C. 1996, ApJS, 106, 51Braatz, J.A., Wilson, A.S., & Henkel, C. 1997, ApJS, 110, 321Brucato, R.J., & Kristian, J. 1972, ApJ, 173, 105Bryan, G. L., & Norman, M. L. 1998, ApJ, 495, 80Bullock, J.S., et al. 2001, MNRAS, 321, 559Burbidge, G.R. 1962, in ‘Problems of Extra-Galactic Research’ Proceedings from
IAU Symposium no. 15. Eds George Cunliffe McVittie. Macmillan Press, NewYork, p.258
Cappellari, M. et al. 2002, 578, 787Cattaneo, A., Haehnelt, M. G., & Rees, M. J. 1999, MNRAS, 308, 77Cecil, G., Wilson, A.S., & Tully, R.B. 1992, ApJ, 390, 365Cecil, G., et al. 2000, ApJ, 536, 675Chandrasekhar, S. 1931, ApJ, 74, 81Chandrasekhar, S. 1935, MNRAS, 95, 226Cheung, et al. 1969, Nature, 221, 626Chiang, J., & Murray, N. 1996, ApJ, 466, 704Chokshi, A. & Turner, E. L., 1992, MNRAS, 259, 421Cipollina, M., & Bertin, G. 1994, A&A, 288, 43Claussen, M.J., Hellingman, G.M., & Lo, K.Y., 1984, Nature, 310, 298Claussen, M.J., & Lo, K.Y., 1986, ApJ, 308, 592Collin-Souffrin, S., Dyson, J.E., McDowell, J.C., Perry, J.J. 1988, MNRAS, 232, 539Cowie, L.L., et al. 2003, ApJ, 584, L57Crane, P., et al. 1993, AJ, 106, 1371Crawford, M. K., Genzel, R., Harris, A. I., Jaffe, D. T., Lugten, J. B., Serabyn, E.,
Townes, C. H., & Lacy, J. H. 1985, Nature, 315, 467Cretton, N., & van den Bosch, F.C. 1999, ApJ, 514, 704Curtis, H.D. 1918, Pub.Lick.Obs., 13, 31Dabrowski, Y., Fabian, A.C., Iwasawa, K., Lasenby, A.N., Reynolds, C.S. 1997,
MNRAS, 288, L11Danzmann, K. 1995, GEO600 - A 600-m Laser Interferometric Gravitational Wave
Antenna, in First Edoardo Amaldi Conference on gravitational wave experimentsE. Coccia, G. Pizella and F. Ronga, eds., (World Scientific, Singapore), p.100-111
Danzmann, K. 2000, AdSpR, 25, 1129de Araujo, J.C.N., Miranda, O.D, & Aguiar, O.D. 2001, ApJ, 550, 368Dettmar, R.-J., & Koribalski, B. 1990, A&A, 240, 15de Vaucouleurs, G., de Vaucouleurs, A., Corwin, H. G., Jr., Buta, R. J., Pasturel,
G., & Fouqu, P. 1991, Third Reference Catalogue of Bright Galaxies (New York:Springer)
Devereux, N., Ford, H.C., Tsvetanov, Z., & Jacoby, G. 2003, AJ, 125, 1226de Zeeuw, T. 2003, in ”Hubble Science Legacy: Future Optical/Ultraviolet Astron-
omy from Space”, eds. K.R.Sembach, J.C.Blades, G.D.Illingworth, & R.C. Ken-nicutt, ASPC Conference Series, vol. 291, P. 205.
Dietrich, M., Wagner, S.J., Courvoisier, T.J.-L., Bock, H., & North, P. 1999, A&A,351, 31
di Matteo, T., Fabian, A.C., Rees, M.J., Carilli, C.L., & Ivison, R.J. 1999, MNRAS,305, 492
Doeleman, S.S., et al. 2001, AJ, 121, 2610Done, C., & Krolik, J.H. 1996, ApJ, 463, 144Done, C., Madejski, G.M., & Zycki, P.T. 2000, ApJ, 536, 213dos Santos, P.M. and Lepine, J.R.D. 1979, Nature, 278, 34Ebisuzaki, T., Makino, J., & Okumura, S. K. 1991, Nature,354, 212Eckart, A., Genzel, R., Hofmann, R., Sams, B. J., Tacconi-Garman, L. E. 1993, ApJ,
407, L77
ferrarese_ford.tex; 11/05/2004; 22:31; no v.; p.107
108 Laura Ferrarese and Holland Ford
Eddington, A.S. 1930, ‘The internal Constitution of Stars’, Cambridge UniversityPress, Cambridge, England
Edelson, R., & Nandra, K. 1999, ApJ, 514, 682Einstein, A. 1915, Sitzungsberichte der Deutschen Akademie der Wissenschaften zu
Berlin, Klasse fur Mathematik, Physik, und Technik, 844Eisenhauer, F., Schodel, R., Genzel, R., Ott, T., Tecza, M., Abuter, R., Eckart, A.,
& Alexander, T. 2003, ApJ, 597, L121Ekers, R. D., Goss, W. M., Schwarz, U. J., Downes, D., & Rogstad, D. H. 1975,
A&A, 43, 159Elvis, M., Risaliti, G., & Zamorani, G. 2002, ApJ, 565, 75Emmering, R.T., Blandford, R.D., & Schlosman, I. 1992, ApJ, 385, 460Emsellem, E., et al. 1999, MNRAS, 303, 495Faber, S. M., et al. 1989, ApJS, 69, 763Fabian, A.C., & Canizares, C.A 1988, Nature, 333, 829Fabian, A.C., Rees, M.J., Stella, L., & White, N. 1989, MNRAS, 238, 729Fabian, A.C., et al. 1995, MNRAS, 277, L11Fabian, A. C. & Iwasawa, K. 1999, MNRAS, 303, L34, 121, 662Fabian, A.C., Iwasawa, K., Reynolds, C.S., & Young, A.J. 2000, PASP, 112, 1145Fabian, A.C. 2003, Astron.Nach., 324, 4Falcke, H., Henkel, Chr., Peck, A. B., Hagiwara, Y., Almudena Prieto, M., & Gal-
limore, J. F. 2000, A&A, 358, L17Falomo, R., Kotilainen, J.K., Carangelo, N., & Treves, A. 2003, ApJ, 595, 624Fan, X., et al. , AJ, 2001, 121, 54Ferland, G.J., Peterson, B.M., Horne, K., Welsh, W.F., & Nahar, S.N. 1992, ApJ,
387, 95Ferrarese, L.. van den Bosch, F.C.. Ford, H.C., Jaffe, W. & O’Connell, R.W. 1994,
AJ, 108, 1598Ferrarese, L., Ford, H.C., & Jaffe, W. 1996, ApJ, 470, 444Ferrarese, L., & Ford, H.C. 1999, ApJ, 515, 583Ferrarese, L. & Merritt, D., 2000, ApJ, 539 L9Ferrarese, L., Pogge, R.W., Peterson, B.M., Merritt, D., Wandel, A. & Joseph, C.M.
2001, ApJ, 555, L79Ferrarese, L. 2002a, in ‘Current high-energy emission around black holes’ Proceed-
ings of the 2nd KIAS Astrophysics Workshop, Eds Chang-Hwan Lee and Heon-Young Chang. Singapore: World Scientific Publishing, p.3
Ferrarese, L. 2002b, ApJ, 578, 90Ferrarese, L. 2003, in ”Hubble Science Legacy: Future Optical/Ultraviolet Astrono-
my from Space”, eds. K.R.Sembach, J.C.Blades, G.D.Illingworth, & R.C. Ken-nicutt, ASPC Conference Series, vol. 291, P. 196.
Field, G.B., 1964, ApJ, 140, 1434Filippenko, A.V., & Ho, L.C. 2003, ApJ, 588, L13Ford, H.C., Dahari, O., Jacoby, G.H., Crane, P.C., & Ciardullo, R. 1986, ApJ, 311,
L7.Ford, H.C., et al. 1994, ApJ, 435, L27Fowler, R.H. 1926, MNRAS, 87, 114Franceschini, A., Vercellone, S., & Fabian, A.C. 1998, MNRAS, 297, 817Fukugita, M., Hogan, C.J., & Peebles, P.J.E. 1998, ApJ, 503, 518Gallimore, J.F., Baum, S.A., O’Dea, C.P., & Pedlar, A. 1996a, ApJ, 458, 136Gallimore, J.F., Baum, S.A., O’Dea, C.P., Brinks, E., & Pedlar, A. 1996b, ApJ, 462,
740Gallimore,J.F., Baum, S.A., & O’Dea, C.P. 1996c, ApJ, 464, 198Gallimore,J.F., Baum, S.A., & O’Dea, C.P. 1997, Ap&SS, 248, 253Gardner, F.F., & Whiteoak, J.B. 1982, MNRAS, 201, 13Gebhardt, K., et al. 2000a, AJ, 119, 1157Gebhardt, K., et al. , 2000b, ApJ, 539, L13
ferrarese_ford.tex; 11/05/2004; 22:31; no v.; p.108
SUPERMASSIVE BLACK HOLES IN GALACTIC NUCLEI 109
Gebhardt, K., et al. , 2003, ApJ, 583, 92Genzel, R., & Townes, C. H. 1987, ARA&A, 25, 377George, I.M., & Fabian, A.C. 1991, MNRAS, 249, 352Gerhard, O. 1993, MNRAS, 265, 213Gerhard, O., Kronawitter, A., Saglia, R. P., & Bender, R. 2001, AJ, 121, 1936Ghez, A. M., Klein, B. L., Morris, M., & Becklin, E. E. 1998, ApJ, 509, 678Ghez, A. M., Morris, M., Becklin, E. E., Tanner, A., & Kremenek, T. 2000, Nature,
407, 349Ghez, A.M., et al. 2003, ApJ, 586, L127Gilli, G.M., Salviati, M., & Hasinger, G., 2001, A&A, 366, 407Gondoin, P., Barr, P., Lumb, D., Oosterbroek, T., Orr, A., Parmar, A.N. 2001a,
A&A 378, 806Gondoin, P., Lumb, D., Siddiqui, H., Guainazzi, M., Schartel, N., 2001b, A&A 373,
805Graham, A.W., Erwin, P., Caon, N., & Trujillo, I. 2001, ApJ, 563, L11Greenhill, L.J., Jiang, D.R., Moran, J.M., Reid, M.J., Lo, K.Y., & Claussen, M. J.
1995a, ApJ, 440, 619Greenhill, L.J., Henkel, C., Becker, R., Wilson, T.L., & Wouterloot, J.G.A. 1995b,
A&A, 304, 21Greenhill, L.J., Gwinn, C.R., Antonucci, R., & Barvainis, R. 1996, ApJ, 472, L21Greenhill, L.J. & Gwinn, C.R. 1997, Astrophysics and Space Science, v. 248, 261Greenhill, L.J., Moran, J.M., & Herrnstein, J.R. 1997, ApJ, 481, L23Greenhill, L., et al. 1997, ApJ, 486, L15Greenhill, L., et al. 2002, ApJ, 565, 836Greenhill, L., et al. 2003, ApJ, 582, L11Greenstein, J.L., & Schmidt, M. 1964, ApJ, 140, 1Haardt, F., & Maraschi, L. 1991, ApJ, 380, L51Haardt, F., & Maraschi, L. 1993, ApJ, 413, 507Haehnelt, M. G., Natarajan, P., & Rees, M. J. 1998, MNRAS, 300, 817Haehnelt, M. G., & Kauffmann, G. 2000, MNRAS, 318, L35Hagiwara, Y., Henkel, C., Menten, K.,M., & Nakai, N. 2001a, ApJ, 560, L37Hagiwara, Y., Diamond, P.J., Nakai, N., & Kawabe, R. 2001b, ApJ, 560, 119Hagiwara, Y., Diamond, P. J., & Miyoshi, M. 2002, A&A, 383, 65Harms, R.J., et al. 1994, ApJ, 435, L35Harrower, G.A. 1960, ApJ, 132, 22Harwit, M. 1998, “Astrophysical concepts”, New York: Springer.Haschick, A.D., & Baan, W.A. 1990, ApJ, 355, L23Haschick, A.D., Baan, W.A., & Peng, E.W. 1994, ApJ, 437, L35Hasinger, G. 2002, in “X-ray astronomy in the new millennium”, R. D. Blandford,
A. C. Fabian and K. Pounds eds. Roy Soc of London Phil Tr A, vol. 360, Issue1798, p.2077
Hazard, MacKay & Shimmins 1965, in “ Quasi-Stellar Sources and GravitationalCollapse”, Proceedings of the 1st Texas Symposium on Relativistic Astrophysics.Ivor Robinson, Alfred Schild and E.L. Schucking eds. Chicago: University ofChicago Press, p.448
Henkel, C., Guesten, R., Downes, D., Thum, C., Wilson, T.L., & Biermann, P. 1984,A&A, 141, L1
Henkel, C., Braatz, J.A., Greenhill, L.J., & Wilson, A.S. 2002, A&A, 394, L23Heraudean, Ph., Simien, F. 1998 A&AS 133, 317Herrnstein, J.R., Greenhill, L.J., & Moran, J.M. 1996, ApJ, 468, L17Herrnstein, J.R., et al. 1999, Nature, 400, 539Ho, L. C. 1999, in Observational Evidence for Black Holes in the Universe, eds. S.
K. Chakrabarti (Dordrecht: Reidel), p. 157Ho, L.C. 2002, ApJ, 564, 120Hoyle, F., & Fowler, W.A. 1963, MNRAS, 125, 169
ferrarese_ford.tex; 11/05/2004; 22:31; no v.; p.109
110 Laura Ferrarese and Holland Ford
Huchra, J. P., Geller, M. J., de Lapparent, V., & Corwin, H. G., Jr. 1990, ApJS, 72,433
Illingworth, G. 1977, ApJ, 218, L43Ishihara, Y., Nakai, N., Iyomoto, N., Makishima, K., Diamond, P., & Hall, P. 2001,
PASJ 53, 215Iwasawa, K., et al. 1996, MNRAS, 281, L41Jaffe, W., Ford, H.C., Ferrarese, L., van den Bosch, F., & O’Connell, R.W. 1993,
Nature, 364, 213Jennison, R.C., & Das Gupta M.K. 1953, Nature, 172, 996Jones, D.L., Wehrle, A.E., Meier, D.L., & Piner, B.G. 2000, ApJ, 534, 165Jorgensen, I., Franx, M., & Kjaergaard 1995, MNRAS, 276, 1371Kalogera, V., R. Narayan, R., Spergel, D.N. & Taylor, J.H. 2001, Astrophys. J. 556,
340Kaspi, S., Smith, P.S., Netzer, H., Maoz, D., Jannuzi, B.T., & Giveon, U. 2000, ApJ,
533, 631Kollatschny, W. 2003, A&A, 407, 461Komossa, S. et al. 2003, ApJ, 582, L15Koratkar, A. P., & Gaskell, C. M. 1991, ApJ, 370, L71Kormendy, J., et al. 1988, ApJ, 335, 40Kormendy, J., & Richstone, D. 1992, ApJ, 393, 559Kormendy, J., & Richstone, D., 1995, ARA&A, 581Kormendy, J., & Gebhardt, K. 2001, in AIP Conf. Proc. 586, The 20th Texas Sym-
posium on Relativistic Astrophysics, ed. J. C. Wheeler & H. Martel (Melville:AIP), 363
Krolik, J.H. 1998, in ”Theory of Black Hole Accretion Disks”, eds. Marek A.Abramowicz, Gunnlaugur Bjornsson, and James E. Pringle. Cambridge Univer-sity Press, p.134
Krolik, J.H. 2001, ApJ, 551, 72Kronawitter, A., Saglia, R. P., Gerhard, O., & Bender, R. 2000, A&AS, 144, 53Lacy, J. H., Townes, C. H., Geballe, T. R., & Hollenbach, D. J. 1980, ApJ, 241, 132Lacy, J. H., Townes, C. H., & Hollenbach, D. J. 1982, ApJ, 262, 120Lacy, M. et al. 2001, ApJ, 551, L17Landau, L. D. 1932, Phys. Z. Sowjetunion, 1, 285Laor, A. 1991, ApJ, 376, 90Laor, A. 2000, ApJ, 543, L111Lauer, T.R. 1995, AJ, 110, 2622Lee, M./H., & Goodman, J. 1989, ApJ, 343, 594Lipunov, V.M., Postnov, K.A., & Prokhorov, M.E. 1997, NewA., 2, 43Liu, F. K., Wu, X.-B., & Cao, S.L. 2003, MNRAS, 340, 411Loeb, A., & Rasio, F. 1994, ApJ, 432, L52Lynden-Bell, D. 1969, Nature, 223, 690Mauder, H. 1973, A&A, 28, 473Macchetto, D.F., et al. 1997, ApJ, 489, 579Maciejewski, W., & Binney, J. 2001, MNRAS, 323, 831Magorrian, J., et al. 1998, AJ, 115, 2285Maiolino, R., & Rieke, G.H. 1995, ApJ, 454, 95Malkan, M.A., & Sargent, W.L.W. 1982, ApJ, 254, 22Malkan, M.A. 1983, ApJ, 268, 582Maoz, E. 1998, ApJL, 494, 181Marchesini, D., Ferrarese, L. & Celotti, A., 2004, MNRAS, in pressMarconi, A., et al. 2001, ApJ, 549, 915Marconi, A., & Salvati, M. 2002, in ”Issues in Unification of AGNs”, R. Maiolino,
A. Marconi and N. Nagar eds., ASP Conf. SeriesMarconi, A., & Hunt, L.K. 2003, ApJ, 589, L21Marconi, A., et al. 2003, ApJ, 586, 868Martocchia, A., & Matt, G. 1996, MNRAS, 282, L53
ferrarese_ford.tex; 11/05/2004; 22:31; no v.; p.110
SUPERMASSIVE BLACK HOLES IN GALACTIC NUCLEI 111
Marzke, R.O., et al. 1998, ApJ, 503, 617Matt, G., Perola, G.C., & Piro, L. 1991, A&A 247, 25Matt, G., Perola, G.C., Piro, L., & Stella, L. 1992, A&A 257, 63Mauder, H. 1973, A&A, 28, 473McHardy, I., 1988, Mem.Soc.Astr.It, 59, 239McLure, R.J., & Dunlop, J.S. 2000, MNRAS, 317, 249McLure, R.J., & Dunlop, J.S. 2001, MNRAS, 327, 199McLure, R.J., & Jarvis, M.J. 2002, MNRAS, 337, 109Melia, F., & Falcke, H. 2001, ARA&A, 39 309Merritt, D., & Ferrarese, L. 2001a, MNRAS, 320, L30Merritt, D., & Ferrarese, L. 2001b, ApJ, 547, 140Merritt, D., & Ferrarese, L. 2001c, in “The Central Kiloparsec of Starbursts and
AGN: The La Palma Connection”, ASP Conference Proceedings Vol. 249. J. H.Knapen, J. E. Beckman, I. Shlosman, and T. J. Mahoney eds. San Francisco:Astronomical Society of the Pacific, p. 335.
Merritt, D., & Ekers, R.D. 2003, Science, 297, 1310Mezger, P. G., & Wink, J. E. 1986, A&A, 157, 252Miller, M.C., & Colbert, E.J.M. 2004, Int.J.Mod.Phys., 13, 1Milosavljevic, M., & Merritt, D. 2001, ApJ, 563, 34Miyoshi, M., Moran, J., Herrnstein, J., Greenhill, L., Nakai, N., Diamond, P., &
Inoue, M. 1995, Nature, 373, 127Monaco, P., Salucci, P., & Danese, L. 2000, MNRAS, 311, 279Moran, J., Greenhill, L., Herrnstein, J., Diamond, P., Miyoshi, M., Nakai, N., &
Inoue 1995, in ”Quasars and AGN: High Resolution Imaging,” Proceedings ofthe National Academy of Sciences, Volume 92, Issue 25, pp. 11427
Moran, J., Greenhill, L., & Herrnstein, J. 1999, J. Astroph. Astr., 20, 165Murray, N., Chiang, J., Grossman, S.A., & Voit, G.M. 1995, ApJ, 451, 498Murray, N., & Chiang, J. 1997, ApJ, 474, 91Mushotzky, R.F., Done, C., & Pounds, K.A. 1993, ARA&A, 31, 717Nakai, N., Inoue, M., & Miyoshi, M., 1993, Nature, 361, 45Nakai, N., Inoue, M., Miyazawa, K., Miyoski, M., & Hall, P. 1995, PASJ, 47, 771Nakano, T., & Makino, J. 1999, ApJ, 510, 155Nandra, K., Pounds, K.A., Stewart, G.C., Fabian, A.C., & Rees, M.J. 1989, MNRAS,
236, 39Nandra, K., George, I.M., Mushotzky, R.F., Turner, T.J., & Yaqoob, T. 1997, ApJ,
477, 602Nandra, K., George, I. M., Mushotzky, R. F., Turner, T. J., & Yaqoob, T. 1999,
ApJ, 523, L17Narayan, R., & Yi, I, 1994, ApJ, 428, L13Navarro, J. F., & Steinmetz, M. 2000, ApJ, 538, 477Nelson, C. H., & Whittle, M. 1996, ApJ, 465, 96Netzer, H. 2003, ApJ, 583, L5Neufeld, D.A., & Melnick 1991, ApJ, 368, 215Neufeld, D.A., Maloney, P.R., & Conger, 1994 ApJ, 436, L127Neufeld, D.A., & Maloney, P.R. 1995 ApJ, 447, L17O’Brien, P. T., et al. 1998, ApJ, 509, 163Onken, C.A., & Peterson, B.M. 2002, ApJ, 572, 746Onken, C.A., Peterson, B.M., Dietrich, M., Robinson, A., & Salamanca, I.M., 2003,
ApJ, 585, 121Onken, C.A., et al., 2004, ApJ, in pressOppenheimer, J.R., & Snyder, H. 1939, PhRv, 56, 455OOppenheimer, J.R., & Volkoff, G.M. 1938, Phys. Rev., 55, 374Oshlack, A.Y.K.N., Webster, R.L., & Whiting, M.T. 2002, ApJ, 576, 81Padovani, P., Burg, R., & Edelson, R.A., 1990, 353, 438Peebles, P. J. E. 1972, Gen. Relativ. Gravitation, 3, 63
ferrarese_ford.tex; 11/05/2004; 22:31; no v.; p.111
112 Laura Ferrarese and Holland Ford
Pelletier, G., & Pudritz, R.E. 1992, ApJ, 394, 117Peterson, B.M., 1993, PASP, 105, 247Peterson, B.M. 1999, in ”Structure and Kinematics of Quasar Broad Line Regions”,
ASP Conference Series, Vol. 175. Eds. C. M. Gaskell, W. N. Brandt, M. Dietrich,D. Dultzin-Hacyan, and M. Eracleous. p.49
Peterson, B.M., et al. 2000, ApJ, 542, 161Peterson, B.M., et al. 2002, ApJ, 581, 197Peterson, B.M., 2002, in ”Advanced Lectures on the Starburst-AGN Connection”,
2001 (Singapore:World Scientific), p.3Peterson, B.M., 2003 in ”Future EUV/UV and Visible Space Astrophysics Missions
and Instrumentation”. Eds J. Chris Blades, Oswald H. W. Siegmund. Proceed-ings of the SPIE, Volume 4854, p. 311
Peterson, B.M., & Horne, K. 2003 in ”Astrotomography, 25th meeting of the IAU”.Peterson, B.M., Polidan, R.S., & Robinson, E.L. 2003, in ‘Future EUV/UV and
Visible Space Astrophysics Missions and Instrumentation’. Eds J. Chris Blades,Oswald H. W. Siegmund. Vol. 4854, pp. 311-318
Phinney, E.S., 2003, HEAD, 35, 2703Piro, L., Yamauchi, M., & Matsuoka, M. 1990, ApJ, 360, L35Pogge, R.W. 1989, ApJS, 71, 433Press, W.H., & Schechter, P. 1974, ApJ, 187, 425Quinlan, G. D., Hernquist, L., & Sigurdsson, S. 1995, ApJ, 440, 554Quinlan, G. D., & Hernquist, L. 1997, NewA, 2, 533Rees, M.J., Phinney, E.S., Begelman, M.C., & Blandford, R.D. 1982, Nature, 295,
17Rees, M.J. 1984, ARA&A, 22, 471Reid, M. J., Menten, K. M., Genzel, R., Ott, T., Schodel, R., & Eckart, A. 2003,
ApJ, 587, 208Rest, A., et al. 2001, AJ, 121, 2431Reynolds, C.S. 1996, PhD Thesis, University of Cambridge.Reynolds, C.S. 1997, MNRAS, 286, 513Reynolds, C.S., & Nowak, M.A., 2003, Phys.Rept., 377, 389Rhoades, C. E., & Ruffini, R. 1974, Phys. Rev. Lett., 32, 324Richstone, D.O., & Schmidt, M. 1980, ApJ, 235, 361Richstone, D.O., & Tremaine, S. 1985, ApJ, 286, 370Richstone, D. O. et al. 1998, Nature, 395, A14Robinson, I., Schild, A., & Schucking, E.L., Proceedings of the 1st Texas Symposium
on Relativistic Astrophysics, Chicago: University of Chicago Press, 1965Rosati, P., et al. 2002, ApJ, 566, 667Ross, R.R., Fabian, A.C., & Mineshige, S. 1992, MNRAS, 258, 189Salpeter, E.E. 1964, ApJ, 140, 796Salucci, P. et al. 1999, MNRAS, 307, 637Sandage, A. 1964, ApJ, 139, 416Sargent, W.L.W., et al. 1978, ApJ, 221, 731Sarzi, M., et al. 2001, ApJ, 550, 65Schlegel, D. J., Finkbeiner, D. P., & Davis, M. 1998, ApJ, 500, 525Schodel, R., Ott, T., Genzel, R., Eckart, A., Mouawad, N., & Alexander, T. 2003,
ApJ, 596, 1015Schwarzschild, K. (1916a), 1916, Sitzungsberichte der Deutschen Akademie der Wis-
senschaften zu Berlin, Klasse fur Mathematik, Physik, und Technik, 189Schwarzschild, K. (1916b), 1916, Sitzungsberichte der Deutschen Akademie der Wis-
senschaften zu Berlin, Klasse fur Mathematik, Physik, und Technik, 424Schwarzschild, M. 1979 ApJ, 232, 236Scorza, C., & Bender, R. 1995, A&A, 293, 20Serabyn, E., & Lacy, J. H. 1985, ApJ, 293, 445
ferrarese_ford.tex; 11/05/2004; 22:31; no v.; p.112
SUPERMASSIVE BLACK HOLES IN GALACTIC NUCLEI 113
Sergeev, S.G., Pronik, V.I., Peterson, B.M., Sergeeva, E.A., & Zheng, W. 2002, ApJ,576, 660
Seyfert, C.K. 1943, ApJ, 97, 28Sheth, R.K., et al. 2003, ApJ, 594, 225Shields, G.A. 1978, Nature, 272, 706Shields, G.A. et al. 2003, ApJ, 583, 124Shklovski, I.S. 1954, Doklady Akad.Nauk., 98, 353Sigurdsson, S., Hernquist, L., & Quinlan, G. D. 1995, ApJ, 446, 75Siemiginowska, A., Kuhn, O., Elvis, M., Fiore, F., McDowell, J., & Wilkes, B.J.
1995, ApJ, 454, 77Silk, J., & Rees, M. J. 1998, A&A, 331, L1Simien, F., & de Vaucouleurs, G. 1986, ApJ, 302, 564Sincell, M.W., & Krolik, J.H. 1998, ApJ, 496, 737Smith, H.J., & Hoffleit, D. 1963, AJ, 68, 292Smith, M.D., & Raine, D.J. 1985, MNRAS, 212, 425Smith, M. D., & Raine, D. J. 1988, MNRAS, 234, 297Small, T., & Blandford, R.D. 1992, MNRAS, 259, 725Snellen, I.A.G., Lehnert, M.D., Bremer, M.N., & Schilizzi, R.T. 2003, MNRAS, 342,
889Sofue, Y., & Irwin, J.A. 1992, PASJ, 44, 353Soltan, A. 1982, MNRAS, 200, 115Steinmetz, M., & Muller, E. 1995, MNRAS, 276, 549Stern, B.E., Poutanen, J., Svensson, R., Sikora, M., & Begelman, M.C. 1995, ApJ,
449, L13Stirpe, G.M., et al. 1994, A&A, 285, 857Sudou, H., Iguchi, S., Murata, Y., & Taniguchi, Y. 2003, Science, 300, 1263Sun, W.-H, & Malkan, M.A. 1989, ApJ, 346, 68Sunyaev, R.A., & Truemper, J.1979, Nature, 279, 506Szuszkiewicz, E., Malkan, M.A., & Abramowicz, M.A. 1996, ApJ, 458, 474Tadhunter, C., Marconi, A., Axon, D., Wills, K., Robinson, T. G., & Jackson, N.
2003, MNRAS, 342, 861Takahashi, K., Inoue, H., & Dotani, T. 2002, PASJ, 54, 373Tanaka, Y., et al. 1995, Nature, 375, 659Tennant, A.F. & Mushotzky, R.F. 1983, ApJ, 264, 92Thatte, N., Quirrenbach, A., Genzel, R., Maiolino, R., & Tecza 1997, ApJ, 490, 238Thorne, K.S., & Price, R. H. 1975, ApJ, 195, 101Thorne, K.S. 1994, Black Holes and Time Warps, Einstein’s Outrageous Legacy, W
W Norton & Company, New York and LondonTonry, J.L. et al. 2001, ApJ, 546, 681Tran, H.D., et al. 2001, AJ, 121, 2928Tremaine, S., et al. 2002, ApJ, 574, 740Trotter, A.S., et al. 1998, ApJ, 495, 740Turler, M., et al. 1999, A&AS, 134, 89Turner, J.L., & Ho, P.T.P. 1994, ApJ, 421, 122Ulrich, M.-H., & Horne, K. 1996, MNRAS, 283, 748Urry, C.M., & Padovani, P. 1995, PASP, 107, 803Valluri, M., Merritt, D., & Emsellem, E. 2004, ApJ, 602, 66van de Ven, G., Hunter, C., Verolme, E.K., & de Zeeuw, P.T. 2003, MNRAS, 342,
1056van den Bosch, F. C., & de Zeeuw, P. T. 1996, MNRAS, 283, 381van den Bosch, F. C., Jaffe, W., & van der Marel, R. P. 1998, MNRAS, 293, 343van der Kruit, P.C., Oort, J.H., Mathewson, D.S. 1972, A&A, 21, 169van der Marel, R.P., Franx, M.1993, ApJ, 407, 525van der Marel, R.P. 1994, MNRAS, 270, 271van der Marel, R.P., & van den Bosch, F.C. 1998, AJ, 116, 2220
ferrarese_ford.tex; 11/05/2004; 22:31; no v.; p.113
114 Laura Ferrarese and Holland Ford
van der Marel, R.P. 1999, AJ, 117, 744Verolme, E.K., et al. 2002, MNRAS, 335, 517Vestergaard, M., Wilkes, B.J., & Barthel, P.D. 2000, ApJ, 538, L103Vestergaard, M. 2002, ApJ, 571, 733Vila-Vilaro, B. 2000, PASPJ, 52, 305Walker, R.C., Matsakis, D.N., and Garcia-Barreto, J.A. 1982, ApJ, 255, 128.Wandel A., 1999, ApJ, 519, 39Wandel, A., Peterson, B.M., & Malkan, M.A. 1999, ApJ, 526, 579Wandel, A. 2002, ApJ, 565, 762Wanders, I., & Horne, K. 1994, A&A, 289, 76Wanders, I., et al. 1995, ApJ, 453, L87Wanders, I., & Peterson, B. M. 1996, ApJ, 466, 174Wanders, I., et al. 1997, ApJS, 113, 69Wang, J.-M., Szuszkiewicz, E., Lu, F.-J., & Zhou, Y.-Y. 1999, ApJ, 522, 839Wang, J.-X., Wang, T.-G., & Zhou, Y.-Y. 2001, ApJ, 549, 891Watson, W.D., & Wallin, B.K. 1994, ApJ, 432, L35Wyithe, J.S.B., & Loeb, A. 2002, ApJ, 581, 886Wyithe, J.S.B., & Loeb, A. 2003, ApJ, in press (astro-ph/0304156)Willke, B., et al. 2002, CQGra, 19, 1377Wilms, et al. 2001 MNRAS, 328, L27Wollman, E. R., Geballe, T. R., Lacy, J. H., Townes, C. H., & Rank, D. M. 1977,
ApJ, 218, L103Woo, J.-H., & Urry, C. M. 2002a, ApJ, 579, 530Woo, J.-H., Urry, C. M. 2002b, ApJ, 581, L5Wu, X.-B., & Han, J.L. 2001, A&A, 380, 31Young, P. J. 1980, ApJ, 242, 1232Young, J.S., Claussen, M.J., & Scoville, N.Z. 1988, ApJ, 324, 115Young, A.J., & Reynolds, C.S. 2000, ApJ, 529, 101Yu, Q. 2002, MNRAS, 331, 935Yu, Q., & Tremaine, S. 2002, MNRAS, 335, 965Zdziarski, A.A., et al. 1994, MNRAS, 269, L55Zel’dovich, Y. B., & Novikov, I. D. 1964, Sov. Phys. Dokl., 158, 811
ferrarese_ford.tex; 11/05/2004; 22:31; no v.; p.114