superior - waco, texasall drinking water may contain . contaminants. when drinking water meets...
TRANSCRIPT


1
City of Waco drinking water meets or exceeds all federal and state drinking water requirements. The City of Waco Water Utility Services Department (Public Water System #1550008) is proud to maintain a Superior water quality rating from the Texas Commission on Environmental Quality (TCEQ).
This report is a summary of the quality of the water we provided our customers during 2019. The analysis was made by using data from the most recent U.S. Environmental Protection Agency (EPA) required tests. Our goal is that this information will help you become more knowledgeable about what’s in your drinking water.
The tables that follow (pp. 3-5) list all of the federally regulated and/or monitored contaminants that have been found in your drinking water. The U.S. EPA requires water systems to test for up to 97 different contaminants.
Where Does Our Water Come From?Our drinking water is 99% surface water with less than 1% coming from ground water sources. The primary source of drinking water for residents of the City of Waco and surrounding communities is Lake Waco, located within the City of Waco, with less than 1% coming from the Trinity Aquifer.
Source Water Assessment and Protection The TCEQ completed an assessment of our source water and results indicate that some of our sources are susceptible to certain contaminants. The sampling requirements for our water system are based on this susceptibility and previous sample data. Any detections of these contaminants will be found in this report. For more information on source water assessments and protection efforts in our system, contact the City of Waco Water Quality Lab at (254) 750-1662.
Special NoticeYou may be more vulnerable than the general population to certain microbial contaminants, such as Cryptosporidium, in drinking water. Infants, some elderly or immunocompromised, such as those undergoing chemotherapy for cancer; those who have undergone organ transplants; those who are undergoing treatment with steroids; and people with HIV/AIDS or other immune system disorders can be particularly at risk for infection. You should seek advice about drinking water from your physician or health care provider. Additional guidelines on appropriate means to lessen the risk of infection by Cryptosporidium are available from the Safe Drinking Water Hotline at (800) 426-4791.
En EspañolEste reporte incluye informacion importante sobre el agua para tomar. Si tiene preguntas o comentarios sobre éste informe en español, favor de llamar al (254) 299-2489 para hablar con una persona bilingüe en español.
ABOUT THIS REPORT

2
All Drinking Water May Contain ContaminantsWhen drinking water meets federal standards, there may not be any health based benefits to purchasing bottled water or point of use devices. Drinking water, including bottled water, may reasonably be expected to contain at least small amounts of some contaminants. The presence of contaminants does not necessarily indicate that water poses a health risk. More information about contaminants and potential health effects can be obtained by calling the EPA’s Safe Drinking Water Hotline (1-800-426-4791).
Secondary ConstituentsContaminants may be found in drinking water that may cause taste, color, and odor problems. These types of problems are not necessarily causes for health concerns. For more information on taste, odor or color of drinking water, please contact Waco Water Utility Services.
Water LossIn the water loss audit submitted to the Texas Water Development Board for the time period of January - December 2019, the City of Waco water system lost an estimated 864,641,464 gallons of water. This is 8.3% of the total water system input volume.
Water loss from a system occurs, primarily, due to leaks and line breaks, customer meter inaccuracy, data handling errors and unauthorized usage.
If you have any questions about the water loss audit, you may call: (254) 299-CITY (2489).
Water SourcesThe sources of drinking water (both tap water and bottled water) include rivers, lakes, streams, ponds, reservoirs, springs, and wells. As water travels over the surface of the land or through the ground, it dissolves naturally-occurring minerals, and in some cases, radioactive material, and can pick up substances resulting from the presence of animals or from human activity. Contaminants that may be present in source water before treatment include:
• Microbial Contaminants, such as viruses and bacteria, which may come from sewage treatment plants, septic systems, agricultural livestock operations and wildlife
• Inorganic Contaminants, such as salts and metals, which can be naturally-occurring or result from urban stormwater runoff, industrial or domestic wastewater discharges, oil and gas production, mining or farming
• Pesticides and Herbicides, which may come from a variety of sources such as agriculture, urban stormwater runoff and residential uses
• Organic Chemical contaminants, including synthetic and volatile organic chemicals, which are by-products of industrial processes and petroleum production, and can also come from gas stations, urban stormwater runoff and septic systems
• Radioactive contaminants, which can be naturally-occurring or be the result of oil and gas production and mining activities
DefinitionsAction level (AL) - The concentration of a contaminant which, if exceeded, triggers treatment or other requirements that a water system must follow.
Level 1 Assessment - A study of the water system to identify potential problems and determine (if possible) why total coliform bacteria were found.
Level 2 Assessment - A very detailed study of the water system to iden-tify potential problems and determine (if possible) why an Escherichia coli (E. coli) maximum contaminant level (MCL) violation has occurred and/or why total coliform bacteria were found on multiple occasions.
Maximum Contaminant Level (MCL) - Highest permissible level of a contaminant in drinking water. MCLs are set as close to the MCLGs as feasible using the best available treatment technology.
Maximum Contaminant Level Goal (MCLG) - Level of a contaminant in drinking water below which there is no known or expected health risk. MCLGs allow for a margin of safety.
Maximum Residual Disinfectant Level (MRDL) - The highest level of disinfectant allowed in drinking water. There is convincing evidence that addition of a disinfectant is necessary for control of microbial contaminants.
Maximum Residual Disinfectant Level Goal (MRDLG) - The level of a drinking water disinfectant below which there is no known or expected risk to health. MRDLGs do not reflect the benefits of the use of disinfectants to control microbial contamination.
Treatment technique (TT) - A required process intended to reduce the level of a contaminant in drinking water.
AbbreviationsAvg - Regulatory compliance with some MCLs is based on running annual average of monthly samples
MFL - million fibers per liter (a measure of asbestos)
mrem - millirems (a measure of radiation absorbed by the body)
NTU - Nephelometric Turbidity Units (a measure of turbidity)
pCi/L - picocuries per liter (a measure of radioactivity)
ppm - parts per million, or milligrams per liter (mg/L), or one ounce in 7,350 gallons of water
ppb - parts per billion, or micrograms per liter (µg/L), or one ounce in 7,350,000 gallons of water
ppt - parts per trillion, or nanograms per liter (ng/L)
ppq - parts per quadrillion, or picograms per liter (pg/L)
Drinking Water StandardsIn order to ensure that tap water is safe to drink, the EPA prescribes regulations that limit the amount of certain contaminants in water provided by public water systems. FDA regulations establish limits for contaminants in bottled water that must provide the same protection for public health.

3
WACO WATER QUALITY TEST RESULTS
Inorganic ContaminantsCollec-
tion Date or Year
ContaminantHighest
Level Detected
Min - Max Levels MCL/MCLG Units Viola-
tion Likely Source of Contamination
2019 Barium 0.0441 0.0433 - 0.0441 2 2 ppm No Decay of natural and man-made deposits
2019 Cyanide 180 180 - 180 200 200 ppb No Discharge from plastic and fertilizer factories; Discharge from steel/metal factories
2019 Fluoride 0.9 0.63 - 0.85 4 4 ppm NoErosion of natural deposits; water additive which promotes strong teeth; discharge from fertilizer and aluminum factories
2019 Nitrate 1 0 - 1.14 10 10 ppm No Runoff from fertilizer use; leaching from septic tanks, sewage; erosion of natural deposits
Residual Disinfectant LevelCollec-
tion Date or Year
Disinfectant Avg Level Min - Max Levels
MRDL/MRDLG Units Viola-
tion Likely Source of Contamination
2019 Monochloramine 2.44 0.5 - 4.0 4.0 4.0 ppm No Disinfectant used to control microbes.
Disinfection ByproductsCollec-
tion Date or Year
ContaminantHighest
Level Detected
Min - Max Levels MCL/MCLG Units Viola-
tion Likely Source of Contamination
2019 Bromate 2 0 - 14.5 10 0 ppb No By-product of drinking water disinfection
2019 Haloacetic Acids (HAA5) 22 6.5 - 30.8 60 No
Goal ppb No By-product of drinking water disinfection
The value in the Highest Level Detected column is the highest average of all HAA5 sample results collected at a location over a year.
2019 Trihalomethanes (TTHM) 42 14 - 66.4 80 No
Goal ppb No By-product of drinking water disinfection
The value in the Highest Level Detected column is the highest average of all TTHM sample results collected at a location over a year.
Synthetic Organic ContaminantsCollec-
tion Date or Year
ContaminantHighest
Level Detected
Min - Max Levels MCL/MCLG Units Viola-
tion Likely Source of Contamination
2019 Atrazine 0.13 0.12 - 0.13 3 3 ppb No Runoff from herbicide used on row crops
Total Organic CarbonThe percentage of Total Organic Carbon (TOC) removal was measured each month and the system met all TOC removal requirements set.

4
Coliform Bacteria
Year Contaminant Highest Number of Positive Samples MCL/MCLG Violation Likely Source of Contamination
2019 Total Coliform Bacteria 6 5% 0% No Naturally present in the environment
2019 Fecal Coliform or E. Coli 0 0% 0% No Naturally present in the environment
TurbidityYear Limit
(TT) Level Detected Unit of Measure Violation Likely Source of Contamination
2019 Highest single measurement 1 0.23 NTU No Soil Runoff2019 Lowest monthly % meeting limit 0.3 100% NTU No Soil Runoff
Turbidity is a measurement of the cloudiness of water caused by suspended particles. It is a good indicator of water quality and the effectiveness of filtration.
Lead and CopperAction Level Goal (ALG): The concentration of a contaminant in drinking water below which there is no known or expected risk to health. ALGs allow for a margin of safety.
Action Level: The concentration of a contaminant which, if exceeded, triggers treatment or other requirements which a water system must follow.
Year Contaminant 90thPercentile
Sites Exceeding
Action Level
MCLG Action Level
Unit of Measure Violation Likely Source of
Contamination
2018 Lead 2.4 2 0 15 ppb No Erosion of natural deposits; Corrosion of household plumbing systems; leaching from wood preservatives2018 Copper 0.14 0 1.3 1.3 ppm No
HEALTH INFORMATION FOR LEADIf present, elevated levels of lead can cause serious health problems, especially for pregnant women and young children. Lead in drinking water is primarily from materials and components associated with service lines and home plumbing. This water supply is responsible for providing high quality drinking water, but cannot control the variety of materials used in plumbing components. When your water has been sitting for several hours, you can minimize the potential for lead exposure by flushing your tap for 30 seconds to 2 minutes before using water for drinking or cooking. If you are concerned about lead in your water, you may wish to have your water tested. Information on lead in drinking water, testing methods, and steps you can take to minimize exposure are available from the Safe Drinking Water Hotline or at http://www.epa.gov/safewater/lead.
Radioactive ContaminantsCollec-
tion Date or Year
ContaminantHighest
Level Detected
Min - Max Levels MCL/MCLG Units Violation Likely Source of Contamination
2017 Radium 226/228 1.5 1.5 - 1.5 5 0 pCi/L No Erosion of natural deposits
WACO WATER QUALITY TEST RESULTS (CONT)

5
Water Conservation TipsA few small changes can add up to make a big difference!• Turn off the water while you brush your teeth. You’ll save up to 4 gallons a minute.• Leave lawn clippings on your grass. The clippings cool the ground and hold in moisture. • Put food coloring in your toilet tank. If it seeps into the bowl without flushing, there’s a leak. Fix it and start saving.
Inorganic ContaminantsCollection
Date or Year
ContaminantHighest
Level Detected
Min - Max Levels MCL/MCLG Units Violation Likely Source of Contamination
2019 Barium 0.0820 0.0721 - 0.0820 2 2 ppm No Decay of natural and man-made deposits
2019 Fluoride 1.05 0.97 - 1.05 4 4 ppm NoErosion of natural deposits; water additive which promotes strong teeth; discharge from fertilizer and aluminum factories
2019 Selenium <0.0036 <0.0030 - <0.0036 50 50 ppb NoDischarge from petroleum and metal refineries; Erosion of natural deposits; Discharge from mines
Radioactive ContaminantsCollection
Date or Year
ContaminantHighest
Level Detected
Min - Max Levels MCL/MCLG Units Violation Likely Source of Contamination
2017 Radium 226/228 1.5 1.5 - 1.5 5 0 pCi/L No Erosion of natural deposits
Synthetic Organic ContaminantsCollection
Date or Year
ContaminantHighest
Level Detected
Min - Max Levels MCL/MCLG Units Violation Likely Source of Contamination
2019 Di(2-ethylhexyl) adipate <0.6 <0 - <0.6 400 400 ppb No Discharge from chemical factories
2019 Di(2-ethylhexyl) phthalate <0.6 <0 - <0.6 0 6 ppb No Discharge from rubber and chemical factories
Volatile Organic ContaminantsCollection
Date or Year
ContaminantHighest
Level Detected
Min - Max Levels MCL/MCLG Units Violation Likely Source of Contamination
2019 Xylenes 0.0005 0 - 0.0005 10 10 ppm No Discharge from petroleum factories; Discharge from chemical factories
CITY OF HEWITT WATER QUALITY TEST RESULTS**Information in the tables below has been included in this report because the City of Waco temporarily received some water (to serve the Old Lorena Rd. / Spring Valley Rd. area) from the City of Hewitt, during 2019.
6
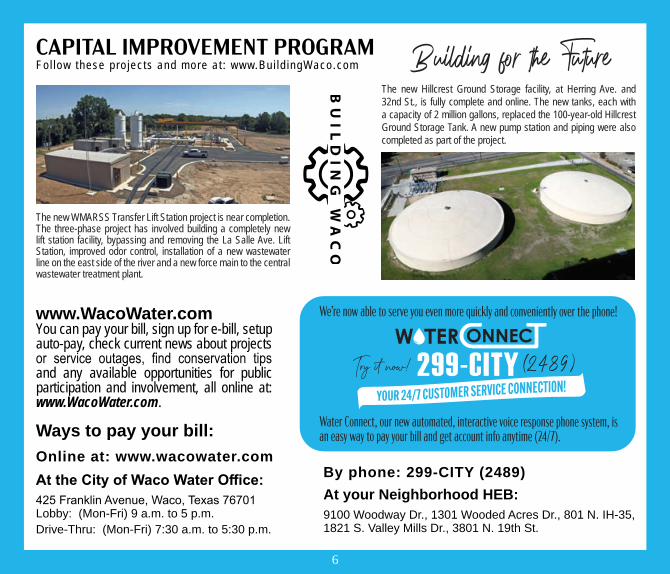
CAPITAL IMPROVEMENT PROGRAMFo l low these p ro jec ts and more a t : www.Bu i ld ingWaco.com
www.WacoWater.comYou can pay your bill, sign up for e-bill, setup auto-pay, check current news about projects or service outages, find conservation tips and any available opportunities for public participation and involvement, all online at: www.WacoWater.com.
At your Neighborhood HEB:9100 Woodway Dr., 1301 Wooded Acres Dr., 801 N. IH-35, 1821 S. Valley Mills Dr., 3801 N. 19th St.
At the City of Waco Water Office:425 Franklin Avenue, Waco, Texas 76701Lobby: (Mon-Fri) 9 a.m. to 5 p.m.Drive-Thru: (Mon-Fri) 7:30 a.m. to 5:30 p.m.
The new WMARSS Transfer Lift Station project is near completion. The three-phase project has involved building a completely new lift station facility, bypassing and removing the La Salle Ave. Lift Station, improved odor control, installation of a new wastewater line on the east side of the river and a new force main to the central wastewater treatment plant.
The new Hillcrest Ground Storage facility, at Herring Ave. and 32nd St., is fully complete and online. The new tanks, each with a capacity of 2 million gallons, replaced the 100-year-old Hillcrest Ground Storage Tank. A new pump station and piping were also completed as part of the project.
Try it now! (2489)
Ways to pay your bill:Online at: www.wacowater.com
Water Connect, our new automated, interactive voice response phone system, is an easy way to pay your bill and get account info anytime (24/7).
We’re now able to serve you even more quickly and conveniently over the phone!
By phone: 299-CITY (2489)
Building for the Future
City of Waco Water Utility ServicesP.O. Box 2570Waco, TX 76702-2570(254) 299-CITY (2489)www.wacowater.com
For more information about this report, contact Jonathan Echols, (254) 750-8416Designed by City of Waco Water Ut i l i ty Services ©2020