super yeast. why did we do the lab? apply steps of scientific method apply key terminology of...
TRANSCRIPT

Super Yeast

Why did we do the lab? Apply steps of scientific method Apply key terminology of scientific method
variables, controls, constants, hypotheses Data collection, data graphing and data analysis Hands-on scientific techniques and proper use of
scientific equipment – proper measuring Error analysis Introduction into biochemistry and cellular
respiration

What we did well during the lab and not so well?(error analysis)
Correct procedures were followed Could go smoother if read ahead as instructed
Excellent behavior in the lab setting – on task Team work was great – lots of helping one
another Measurements – pretty good, although some
initial errors but corrections were made Ex. not adding any drops of sucrose at first and
wondering why it wasn’t changing color – opps!

What we did well AFTER the lab and not so well? (post lab write-ups need some work)
First – hypotheses need to be done before the experiment is performed. This WILL be checked next time.
Graphing data – titles, labels and units! Maximize graph space for best analysis of data

Compare graphs

Post lab reflection continued
Analyzing data Does it support or not support your hypotheses?
Your lab results do NOT prove anything – just support or not support your prediction
Part 1 - reviewed
Recap: What were we trying to find out in part 1 of the Super Yeast lab? Which type of sugar will cause the yeast to have
the fastest rate of cellular respiration? How did we measure cellular respiration?
CO2 bubble produced
Biggest CO2 bubble = fastest rate of cellular respiration

Review data for part 1 Rate of cellular respiration was measured by?
CO2 produced (mL)/ the time (min) = __mL/min Do the calculations: the solutions below stayed in
the incubator for 10 mins.
Yeast and sugar solution
Volume of solution remaining (mL)
Volume of CO2
produced (mL)Rate of cellular respiration (mL/min of CO2)
Sample 1 with glucose
7.1 mL 2.9 mL .29 mL/min
Sample 2 with fructose
8.5 mL 1.5 mL .15 mL/min

So what does the rate mean? Which yeast sample had the faster rate of cellular respiration
according to the data? Sample 1 because it produced .29 mL of CO2 every minute Sample 2 only produced .15 mL of CO2 every minute
Yeast and sugar solution
Volume of solution remaining (mL)
Volume of CO2
produced (mL)Rate of cellular respiration (mL/min of CO2)
Sample 1 with glucose
7.1 mL 2.9 mL .29 mL/min
Sample 2 with fructose
8.5 mL 1.5 mL .15 mL/min

Why would Sample 1 yeast be faster than Sample 2 yeast? Glucose was the better sugar for the yeast to
use for cellular respiration when compared to the fructose
Ok – so now what question(s) should you be asking and answering? Why does glucose increase rate of cellular
respiration for yeast? What is the difference between glucose and
fructose?

What is the difference between all of the sugars in part 1 of Super Yeast lab? Such an important question – we asked you
twice! Glucose, fructose = monosaccharides Sucrose = disaccharides Starch = polysaccharide
Different structures = different functions Glucose= smaller, faster energy source, main
energy molecule for all cells to break down

Know and love glucose – the sooner the better!

Part 2 - reviewed Recap: what were we trying to find out in part
2 of the Super Yeast lab? Does the concentration of sucrose cause a faster
rate of cellular respiration? How did we measure cellular respiration?
Increase in CO2 causes increase in acid
Measure how fast it turns acidic (blue to green using Bromothymol blue indicator)

Review data for part 2 Rate of cellular respiration was measured by?
time for color change to occur Faster color change = faster production of CO2
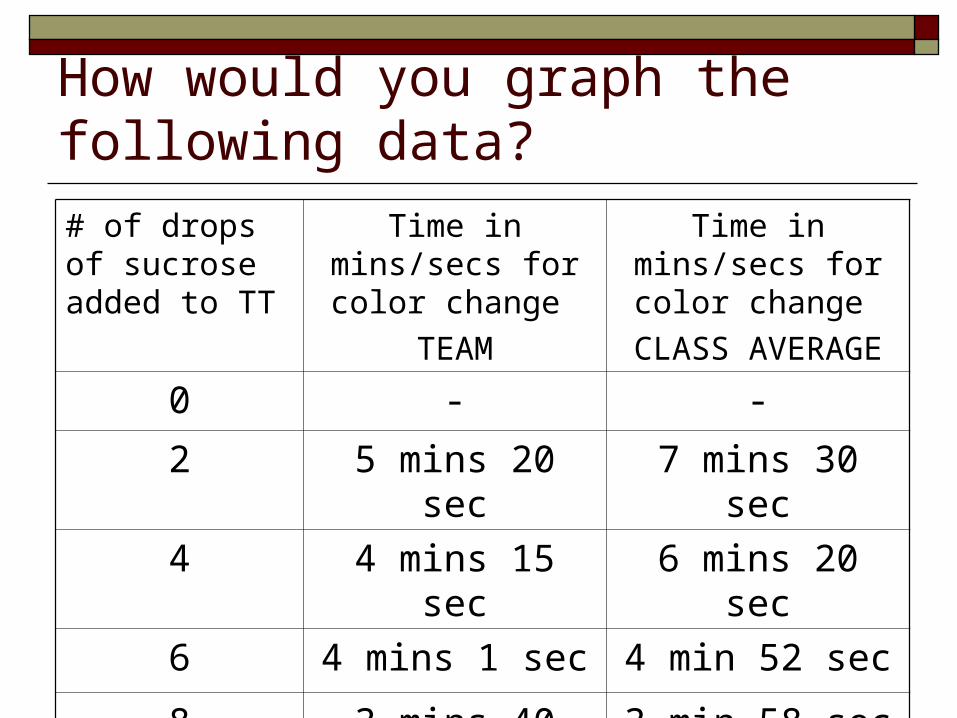
How would you graph the following data?
# of drops of sucrose added to TT
Time in mins/secs for color change
TEAM
Time in mins/secs for color change
CLASS AVERAGE
0 - -
2 5 mins 20 sec 7 mins 30 sec
4 4 mins 15 sec 6 mins 20 sec
6 4 mins 1 sec 4 min 52 sec
8 3 mins 40 sec 3 min 58 sec
10 3 mins 5 sec 2 min 49 sec
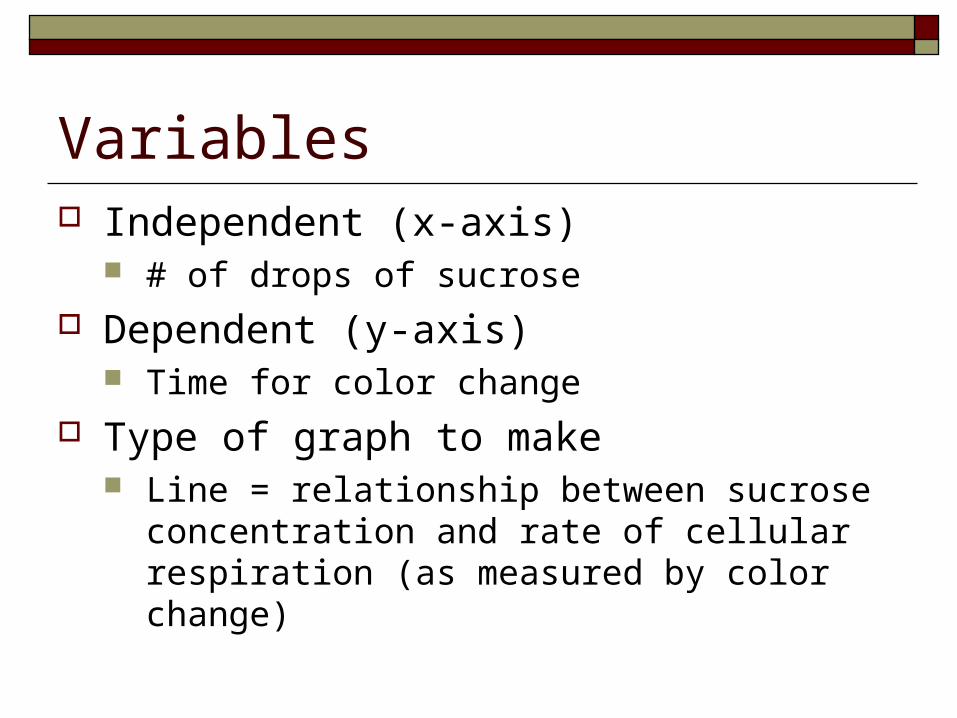
Variables Independent (x-axis)
# of drops of sucrose Dependent (y-axis)
Time for color change Type of graph to make
Line = relationship between sucrose concentration and rate of cellular respiration (as measured by color change)

0
2
4
6
8
10
2 4 6 8 10
Red = class average
Blue =team results
Various amounts of sucrose drops added to yeast solution and the time in minutes for the color change
Drops of 2% sucrose added to the yeast solution
Time
In Minutes for color change
Was there a relationship between sucrose concentration and rate of cellular respiration?
Yes – how did you know? More sucrose drops = faster color change
meaning CO2 was being produced at a faster rate.

Cellular respiration: two types presented in the introduction of lab Aerobic- with oxygen
C6H12O6 + 6O2 ---- 6CO2 + 6 H2O + 36 ATP
Anaerobic (aka fermentation) – without oxygen C6H12O6 ---- 2CO2 + 2C2H5OH + 2 ATP
YEAST CELLS DO BOTH TYPES OF CELLULAR RESPIRATION!!!!!!
What do they produce in each?

Controls vs constants Control for part 1?
Distilled water added to yeast solution Control for part 2?
Zero drops of sucrose added to yeast solution Purpose of having a control?
Needed as a base or standard to compare the experimental groups

Controls vs constants Constants for part 1?
Amount of yeast, amount of sugar, time in incubator, temperature
Constants for part 2? Amount of yeast, amount of indicator, start time,
temperature What is the purpose of constants?
To ensure that you are only testing one experimental variable

How would you test the effect of temperature on cellular respiration in yeast?
Question Background research on the effects of
temperature on… Hypothesis Materials Procedure Data to be collected (tables and calculations)

Review your lab What did you do well? What do you need to improve upon next
time? Did you procrastinate?