summary tables 1995-2017 - philippine statistics authority 2018...system, and philippine health...
TRANSCRIPT

Decent Work Statistics
(DeWS)-Philippines
Summary Tables
1995-2017

FOREWORD
About DeWs-Philippines Decent Work Statistics-Philippines (DeWS-Philippines) is an interactive database that contains data from 1995 to the latest available from the source agencies at the time of compilation. The data up to 2010 are contained in the ILO publication “Philippines Decent Work Country Profile” released in October 2012 by the International Labor Office. It should be noted though, that some of the statistics in this ILO publication have been revised with the availability of more recent data or updates, e.g. GDP per capita in PPP, poverty indicators, working poverty rate, inflation rate (with 2006 as base year) and consequently all data related to real wages. There have been changes too in administrative data on social security, among others. The development of the Interactive Database on Philippine Decent Work Indicators or the Decent Work Statistics-Philippines (DeWS-Philippines) is one of the components of the ILO/EC Project on Monitoring and Assessing Progress on Decent Work (MAP) with funding from the European Union. The database development used the PC-Axis family of software of Statistics Sweden. The Philippine Statistics Authority (PSA) is the main source of the statistics particularly its Labor Force Survey, other PSA Surveys (Integrated Survey on Labor and Employment, Family Income and Expenditures Survey, Functional Literacy, Education and Mass Media Survey) and other information from the National Accounts. Other data came from the Department of Labor and Employment (Bureau of Working Conditions, Bureau of Labor Relations), National Wages and Productivity Commission, Technical Education and Skills Development Authority, National Conciliation and Mediation Board, Department of Health-Epidemiology Bureau, Social Security System, Government Service Insurance System, and Philippine Health Insurance Corporation. The World Development Indicators of the World Bank is the source of data on GDP per capita in PPP. DeWS-Philippines will be updated annually by PSA in terms of statistics or statistical indicators as new measurements are developed. Starting October 2018, the DeWS-Philippines will now be part of the PSA OpenStat website of the PSA. As a one-stop portal for decent work statistics, it is envisioned to widen the awareness of decent work among policymakers (including those outside the labor sphere), unions and employers, and researchers, and more importantly to facilitate effective monitoring and assessment of progress toward decent work in the country. LISA GRACE S. BERSALES, Ph. D. Undersecretary National Statistician and Civil Registrar General Manila, Philippines September 2018

About Decent Work Decent work is integral to efforts to reduce poverty and is a key mechanism for achieving equitable, inclusive and sustainable development. It involves opportunities for work that is productive and delivers a fair income, provides security in the workplace and social protection for workers and their families, and gives people the freedom to express their concerns, to organize and to participate in decisions that affect their lives. The 2008 ILO Declaration on Social Justice for a Fair Globalization recommended the establishment of indicators to track progress made in promoting decent work. In September of the same year, the ILO convened an international Tripartite Meeting of Experts (TME) on the Measurement of Decent Work. It gathered experts’ views and recommendations on the conceptual framework proposed by the ILO. Later in the year, the ILO Governing Body and the 18th International Conference of Labour Statisticians (ICLS) adopted the proposed framework of Decent Work Indicators. The measurement framework on decent work covers ten substantive elements corresponding to the four strategic pillars of the Decent Work Agenda: employment opportunities; adequate earnings and productive work; decent hours; combining work, family and personal life; work that should be abolished; stability and security of work; equal opportunity and treatment in employment; safe work environment; social security; and, social dialogue, workers’ and employers’ representation. An additional element, economic and social context of decent work, helps determine what constitute decency in society as well as the extent to which the achievement of decent work enhances national economic, social and labor market performance. Pillars of Decent Work Employment - promotes the creation of sustainable enterprises and increased efficiencies in the economy (requisites if countries are to move out of poverty). It also explores opportunities for increased investments in human resource development and improved working conditions and seeks to achieve full and productive employment. Rights at work - aims to strengthen observance of the constitutionally protected rights of workers. It seeks to ensure the ratification of core and governance conventions and respect for fundamental principles and rights at work. Social protection - seeks to improve access to social protection mechanisms, improved wages, better working conditions and expanded employment opportunities for all. Social dialogue - seeks to strengthen tripartism and broaden representation of workers as a tool for attaining employment goals.

List of Decent Work Elements and Underlying Tables
Element 1
Economic and Social Context for Decent Work
GDP by Branch of Economic Activity, at Constant 2000 Prices
Labor Productivity by Branch of Economic Activity, at Constant 2000 Prices
Real GDP per Capita
Wage share in GDP
Capital Formation, at Constant 2000 Prices
Inflation Rate
Poverty Incidence
Income Gap
Annual Per Capita Threshold
Income Inequality
Employment by Branch of Economic Activity, % Distribution
Employment by Branch of Economic Activity, Growth Rate
Female Share of Employment by Branch of Economic Activity
Adult Functional Literacy Rate, 25-64 Years Old
Adult Secondary-School Graduation Rate, 25+ Years Old
Children Not in School, % of Children Population
Working Age Population who are HIV Positive per 100,000 Persons
Element 2
Employment Opportunities
Employment-to-Population Ratio
Unemployment Rate
Youth Not in Education and Not in Employment (15-24 Years), % of Youth Population
Labor Force Participation Rate
Labor Force Participation Gap
Youth Unemployment Rate, 15-24 Years
Unemployment by Level of Education, % Distribution
Employment by Class of Worker, % Distribution
Proportion of Self-Employed and Unpaid Family Workers in Total Employment
Share of Wage Employment in Non-Agricultural Employment
Wage and Salary Workers in Non-Agricultural Employment, % Distribution

Element 3
Adequate Earnings and Productive Work
Working Poverty Rate
Low-Paid Employees, % of Employed
Low-Paid Employees, % of Employees
Average Real Daily Basic Pay by Major Occupation Group
Average Real Daily Basic Pay by Branch of Economic Activity
Average Real Daily Basic Pay by Category of Employee
Average Real Daily Basic Pay by Major Occupation Group (Based on 2012 PSOC)
Consumer Price Index
Minimum Hourly Basic Pay as % of Median Hourly Basic Pay, Non-Agriculture in Metro Manila
Manufacturing Wage Index
Employees with Recent Job Training (Past 12 months)
Workers Certified, % of Workers Assessed (Certification Rate)
Element 4
Decent Hours Employed with Excessive Hours (More than 48 Hours Actually Worked per Week), in All Jobs, % of Employed
Employed with Excessive Hours (More than 48 Hours Actually Worked per Week), in All Jobs, % Distribution
Employed by Hours Actually Worked per Week, in All Jobs, % Distribution
Employed with Excessive Hours (More than 48 Hours Actually Worked per Week), in Primary Job, % of Employed
Employed with Excessive Hours (More than 48 Hours Actually Worked per Week), in Primary Job, % Distribution
Employed by Hours Actually Worked per Week, in Primary Job, % Distribution
Average Weekly Hours Actually Worked
Underemployment Rate
Visible Underemployment
Time-Related Underemployment Rate
Element 5
Combining Work, Family and Personal Life
Economically Inactive Due to Household/Family Duties
Employed Who Are Married
Employed Who Are Household Heads
Element 6
Work That Should be Abolished
Economic Activity Rate of Children, % of Children Population
Working Children, Not Currently Attending School, % of Working Children
Working Children by Major Industry Group, % Distribution
Working Children by Major Occupation Group, % Distribution
Working Children by Major Occupation Group, % Distribution (Based on 2012 PSOC)

Element 7
Stability and Security of Work
Employees in Precarious Work, % of Employed - Household Survey Data
Employees in Precarious Work, % of Employees - Household Survey Data
Short-Term, Seasonal or Casual Workers - Household Survey Data
Average Real Daily Basic Pay of Short Term, Seasonal and Casual Workers - Household Survey Data
Consumer Price Index
Employees in Precarious Work, % of Employed - Establishment Survey Data
Casual Employees – Establishment Survey Data
Element 8
Equal Opportunity and Treatment in Employment
Female Share in Occupational Employment (Based on 1977 PSOC)
Female Share in Occupational Employment (Based on 1992 PSOC)
Female Share in Occupational Employment (Based on 2012 PSOC)
Duncan Index of Dissimilarity
Female Share of Employment in Senior and Middle Management (Based on 1977 PSOC)
Female Share of Employment in Senior and Middle Management
(Based on 1992 PSOC)
Female Share of Employment in Senior and Middle Management (Based on 2012 PSOC)
Share of Women in Wage Employment in the Non-Agricultural Sector
Gender Wage Gap
Gender Wage Gap (Based on 2012 PSOC)
Element 9
Safe Work Environment
Incidence Rate of Occupational Injuries, Fatalities per 100,000 Employed Persons
Incidence Rate of Occupational Injuries, Non-fatalities per 100,000 Employed Persons
Average Days Lost Due to Temporary Incapacity Cases
Incidence Rate of Occupational Diseases per 100,000 Employed Persons
Incidence Rate of Tuberculosis per 100,000 Employed Persons
Labor Inspectors per 100,000 Employees in Private Establishments

Element 10
Social Security
Share of Economically Active Population Contributing to a Pension Scheme
SSS/GSIS Contributing Members
Total Labor Force
Share of Population Aged 60 and Above Benefitting from Retirement/Old Age Pension
Total Household Population 60 Years Old and Over
Average Monthly Pensions, SSS
Average Monthly Pensions, GSIS
Social Security Benefits, % of GDP
Health-Care Expenditures Not Financed Out of Pocket by Private Households, % of Total Health-Care Expenditures
Estimated Share of Population Covered by National Health Insurance Program
Estimated Beneficiaries and Total Registered Members of National Health Insurance program
Estimated Beneficiaries and Total Registered Members of National Health Insurance program (Starting 2014)
Element 11
Social Dialogue, Workers’ and Employers’ Representation
Union Density Rate
Union Membership, % Distribution
Collective Bargaining Coverage Rate
Collective Bargaining Coverage, % Distribution
Strikes and Lockouts
Tripartism
Element 1
Economic and Social Context
for Decent Work

Table 1. Economic and social context for decent workDecent Work Indicator 1995 1996 1997 1998 1999 2000 2001 2002 2003 2004 2005 2006 2007 2008 2009 2010 2011 2012 2013 2014 2015 2016 2017
GDP by branch of economicactivity, at constant 2000 prices Growth rate, in % 4.7 5.8 5.2 -0.6 3.1 4.4 2.9 3.6 5.0 6.7 4.8 5.2 6.6 4.2 1.1 7.6 3.7 6.7 7.1 6.1 6.1 6.9 6.7 Agriculture 0.6 3.7 2.9 -7.0 9.6 3.4 3.4 3.3 4.7 4.3 2.2 3.6 4.7 3.2 -0.7 -0.2 2.6 2.8 1.1 1.7 0.1 -1.2 4.0 Industry 6.4 6.3 6.0 -2.7 -1.5 6.5 1.0 2.9 4.3 5.2 4.2 4.6 5.8 4.8 -1.9 11.6 1.9 7.3 9.2 7.8 6.4 8.0 7.2 Services 4.7 6.2 5.3 2.8 4.5 3.3 4.0 4.2 5.5 8.3 5.8 6.0 7.6 4.0 3.4 7.2 4.9 7.1 7.0 6.0 6.9 7.5 6.8% distribution 100.0 100.0 100.0 100.0 100.0 100.0 100.0 100.0 100.0 100.0 100.0 100.0 100.0 100.0 100.0 100.0 100.0 100.0 100.0 100.0 100.0 100.0 100.0 Agriculture 14.8 14.5 14.2 13.3 14.1 14.0 14.0 14.0 14.0 13.6 13.3 13.1 12.9 12.8 12.5 11.6 11.5 11.1 10.5 10.0 9.5 8.8 8.5 Industry 35.7 35.8 36.1 35.3 33.8 34.5 33.8 33.6 33.3 32.9 32.7 32.5 32.2 32.4 31.5 32.6 32.0 32.2 32.9 33.3 33.5 33.9 34.0 Services 49.5 49.7 49.7 51.4 52.1 51.6 52.1 52.4 52.7 53.5 54.0 54.4 54.9 54.8 56.0 55.8 56.5 56.7 56.7 56.6 57.0 57.4 57.5Labor productivity by branch of economic activity, at constant 2000 pricesLevel, in PhP '000 117 117 127 125 124 130 126 127 131 135 139 145 150 154 151 158 159 168 177 185 196 198 215 Agriculture 40 40 46 44 45 49 48 48 50 51 51 53 55 56 55 55 55 58 60 61 64 64 72 Industry 259 257 264 259 256 277 264 273 276 281 292 307 317 337 327 344 342 354 374 388 406 384 400 Services 143 142 146 143 144 144 141 141 145 150 154 161 166 169 166 170 172 181 188 196 205 205 219Growth rate1, in % 2.0 * 3.2a -1.6 -1.0 5.5 -3.1 0.5 3.0 3.4 2.5 3.2b 3.7 2.5 -1.7 4.7 0.4 5.5 5.6 2.7 5.6 2.1 8.4 Agriculture 1.8 -0.8 6.0a -4.0 2.7 9.4 -2.9 0.8 3.8 2.8 0.1 2.0b 3.8 1.1 -0.8 0.6 * 4.3 3.3 0.3 5.2 -2.2 12.1 Industry 1.5 -0.7 1.4a -1.9 -0.9 8.0 -4.6 3.3 1.2 1.9 3.7 5.0b 3.2 6.3 -2.8 5.2 -0.6 3.3 5.7 2.6 3.4 -3.9 4.1 Services -1.3 -0.7 -0.6a -2.6 0.7 0.4 -1.9 -0.6 3.1 3.6 2.9 2.8b 3.1 1.8 -1.9 2.8 1.1 5.1 3.9 2 4.0 3.1 7.2Real GDP per capita in PPP, in constant 2011 international $ Level 3960 4097 4214 4098 4133 4224 4255 4319 4442 4647 4779 4942 5181 5309 5285 5597 5707 5989 6307 6586 6875 7233 7599 Growth rate, in % 2.3 3.5 2.9 -2.7 0.9 2.2 0.7 1.5 2.8 4.6 2.8 3.4 4.8 2.5 -0.5 5.9 2.0 4.9 5.3 4.4 4.4 5.2 5.1Real GDP per capita, in constant 2000 PhP Level 42771 44245 45508 44264 44666 46630 46881 47638 48955 51184 52561 54226 56684 57896 58199 61570 62332 65332 68746 71741 74833 78676 82592 Growth rate, in % 2.2 3.4 2.9 -2.7 0.9 4.4 0.5 1.6 2.8 4.6 2.7 3.2 4.5 2.1 0.5 5.8 1.2 4.8 5.2 4.4 4.3 5.1 5.0Wage share in GDP2, in % 25.3 26.0 27.2 28.3 27.1 26.2 25.2 24.5 24.5 27.6 27.7 27.8 27.8 27.8 30.0 32.2 35.0 35.0 34.7 34.9 35.3 35.7 36.3
Capital formation, at constant 2000 prices Growth rate, in % 2.7 11.6 11.0 -14.8 -13.1 1.1 24.0 15.7 -0.4 -2.2 3.0 -15.1 -0.5 23.4 -8.7 31.6 2.8 -4.3 27.9 4.2 18.4 24.5 9.4 As % of GDP 23.6 24.9 26.2 22.5 19.0 18.4 22.1 24.7 23.4 21.5 21.1 17.0 15.9 18.8 17.0 20.8 20.6 18.5 22.1 21.7 24.2 28.2 28.9Inflation rate, in % (2006 base year) 6.7 8.3 5.8 9.4 6.0 6.7 5.3 2.7 2.3 4.8 6.5 5.5 2.9 8.3 4.1 3.9 4.6 3.2 3.0 4.1 1.4 1.8 3.2Poverty indicators3
Poverty incidence, in % Families .. .. .. .. .. .. .. .. .. .. .. 21.0 .. .. 20.5 .. .. 19.7 .. .. 16.5 .. .. Population .. .. .. .. .. .. .. .. .. .. .. 26.6 .. .. 26.3 .. .. 25.2 .. .. 21.6 .. ..Subsistence incidence, in % Families .. .. .. .. .. .. .. .. .. .. .. 8.8 .. .. 7.9 .. .. 7.5 .. .. 5.7 .. .. Population .. .. .. .. .. .. .. .. .. .. .. 12.0 .. .. 10.9 .. .. 10.4 .. .. 8.1 .. ..Income gap, in % .. .. .. .. .. .. .. .. .. .. .. 27.5 .. .. 26.2 .. .. 26.2 .. .. 24.6 .. ..Magnitude of poor, in millions Families .. .. .. .. .. .. .. .. .. .. .. 3.81 .. .. 4.04 .. .. 4.21 .. .. 3.75 .. .. Population .. .. .. .. .. .. .. .. .. .. .. 22.64 .. .. 23.30 .. .. 23.75 .. .. 21.93 .. ..Magnitude of core/food poor, in millions Families .. .. .. .. .. .. .. .. .. .. .. 1.60 .. .. 1.55 .. .. 1.61 .. .. 1.3 .. .. Population .. .. .. .. .. .. .. .. .. .. .. 10.23 .. .. 9.70 .. .. 9.81 .. .. 8.23 .. ..Annual per capita threshold, in PhP Poverty .. .. .. .. .. .. .. .. .. .. .. 13357 .. .. 16871 .. .. 18935 .. .. 21753 .. .. Food .. .. .. .. .. .. .. .. .. .. .. 9308 .. .. 11780 .. .. 13232 .. .. 15189 .. ..

Table 1. Economic and social context for decent workDecent Work Indicator 1995 1996 1997 1998 1999 2000 2001 2002 2003 2004 2005 2006 2007 2008 2009 2010 2011 2012 2013 2014 2015 2016 2017
Income inequality Ratio of income of top 10% of families to bottom 10%4 .. .. 14.8 .. .. 13.8 .. .. 12.3 .. .. 11.7 .. .. 10.3 .. .. 10.4 .. .. 9.1 .. .. Gini coefficient .. .. 0.4841 .. .. 0.4769 .. .. 0.4803 .. .. 0.4742 .. .. 0.4641 .. .. 0.4605 .. .. 0.4439 .. ..Employment by branch of economic activity Growth rate, in % 2.6 5.9 1.9f 1.0 4.2 -1.0 6.2 3.1 1.9 3.2 2.2 2.0g 2.8 1.6 2.9 2.8 3.2 1.1 1.4 3.4h 0.5i NA -1.6 Agriculture -1.2 4.5 -2.8f -3.1 6.8 -5.5 6.6 2.5 0.9 1.4 2.2 1.6g 0.9 2.1 0.1 -0.7 2.6 -1.4 -2.1 1.4h -4.9i NA -7.3 Industry 4.8 7.0 4.5f -0.9 -0.6 -1.4 5.8 -0.4 3.1 3.3 0.5 -0.4g 2.5 -1.4 0.9 6.0 2.4 3.9 3.4 5.1h 2.9i NA 2.9 Services 6.1 6.9 5.9f 5.6 3.8 2.9 6.1 4.8 2.3 4.5 2.8 3.1g 4.4 2.1 5.4 4.2 3.8 1.9 2.9 4.0h 2.8i NA -0.3% distribution, total 100.0 100.0 100.0 100.0 100.0 100.0 100.0 100.0 100.0 100.0 100.0 100.0 100.0 100.0 100.0 100.0 100.0 100.0 100.0 100.0 100.0 100.0 100.0 Agriculture 43.4 42.8 39.5 37.9 38.8 37.1 37.2 37.0 36.6 36.0 36.0 35.8 35.1 35.3 34.4 33.2 33.0 32.2 31.0 30.5 29.2 27.0 25.4 Industry 16.1 16.3 17.4 17.1 16.3 16.2 16.2 15.6 15.8 15.8 15.6 15.3 15.3 14.8 14.5 15.0 14.9 15.3 15.6 16.0 16.2 17.5 18.3 Services 40.5 40.9 43.1 45.1 44.9 46.7 46.6 47.4 47.6 48.2 48.5 48.9 49.6 49.9 51.1 51.8 52.1 52.6 53.4 53.5 54.7 55.6 56.3Men 100.0 100.0 100.0 100.0 100.0 100.0 100.0 100.0 100.0 100.0 100.0 100.0 100.0 100.0 100.0 100.0 100.0 100.0 100.0 100.0 100.0 100.0 100.0 Agriculture 51.1 49.8 46.3 45.0 46.0 45.0 45.1 44.8 44.3 43.7 43.6 43.5 42.7 42.9 41.9 40.5 40.3 39.4 38.1 37.2 35.8 33.2 31.6 Industry 17.6 18.4 19.8 19.5 18.3 18.0 18.4 18.1 18.2 18.2 17.8 17.6 17.9 17.5 17.5 18.2 18.1 18.6 19.1 19.7 20.2 22.2 23.4 Services 31.3 31.8 33.9 35.5 35.7 37.1 36.5 37.1 37.6 38.1 38.6 38.8 39.5 39.6 40.6 41.2 41.7 42.0 42.8 43.0 43.9 44.6 45.0Women 100.0 100.0 100.0 100.0 100.0 100.0 100.0 100.0 100.0 100.0 100.0 100.0 100.0 100.0 100.0 100.0 100.0 100.0 100.0 100.0 100.0 100.0 100.0 Agriculture 29.9 31.0 27.9 25.9 27.1 23.9 24.6 24.8 24.3 23.3 23.7 23.6 23.2 23.2 22.5 21.8 21.7 21.0 20.1 20.3 19.0 17.3 15.3 Industry 13.6 12.7 13.2 12.9 12.9 13.3 12.6 11.8 12.0 12.0 12.0 11.6 11.1 10.5 9.9 9.9 10.0 10.1 10.1 10.2 10.0 10.0 9.9 Services 56.5 56.4 58.9 61.2 60.0 62.8 62.8 63.4 63.7 64.7 64.3 64.8 65.7 66.3 67.6 68.3 68.3 69.0 69.7 69.5 71.0 72.8 74.8Female share of employment by branch of economic activity, in % 36.4 36.8 37.0 37.2 37.8 37.4 38.5 39.1 38.4 37.9 38.4 38.7 38.8 38.5 39.0 39.2 39.3 39.2 39.3 39.5 39.6 38.9 37.9 Agriculture 25.1 26.6 26.2 25.5 26.4 24.0 25.5 26.2 25.5 24.5 25.3 25.4 25.6 25.3 25.5 25.7 25.9 25.6 25.5 26.3 25.7 24.9 22.7 Industry 30.6 28.6 28.1 28.2 30.0 30.6 30.0 29.5 29.1 28.6 29.6 29.3 28.3 27.2 26.6 25.9 26.3 25.9 25.5 25.2 24.5 22.2 20.5 Services 50.9 50.8 50.5 50.6 50.5 50.3 51.9 52.3 51.4 50.8 50.9 51.3 51.3 51.2 51.5 51.6 51.5 51.5 51.3 51.4 51.4 51.0 50.3Education of adult populationAdult functional literacy rate, 25-64 years old, in % 82.7j .. .. .. .. .. .. .. 83.4 .. .. .. .. 85.8 .. .. .. .. 90.2 .. .. .. .. Men 81.2j .. .. .. .. .. .. .. 81.9 .. .. .. .. 84.1 .. .. .. .. 88.7 .. .. .. .. Women 84.0j .. .. .. .. .. .. .. 84.9 .. .. .. .. 87.6 .. .. .. .. 91.7 .. .. .. ..Adult secondary-school graduation rate, 25+ years old, in % 38.5 41.6 43.1 43.6 44.3 45.0 44.8 45.3 47.0 48.2 49.5 50.2 51.0 52.0 53.0 54.0 54.6 55.3 56.4 57.5 57.9 57.8 57.8 Men 39.6 42.6 43.9 44.1 44.7 45.5 45.3 45.5 46.7 47.5 48.5 49.2 49.8 50.6 51.5 52.5 52.9 53.3 54.1 55.2 55.4 55.3 55.2 Women 37.4 40.7 42.3 43.1 44.0 44.6 44.4 45.1 47.2 48.9 50.4 51.1 52.1 53.3 54.5 55.5 56.3 57.3 58.6 59.8 60.4 60.3 60.4Children not in school5, % of children population .. .. .. .. .. .. .. .. .. .. .. 17.9 17.4 16.0 15.1 14.4 12.6 11.8 10.8 9.1 8.8 8.4 7.9 5-9 years old .. .. .. .. .. .. .. .. .. .. .. 19.8 18.3 17.0 15.4 13.9 11.1 8.4 7.4 5.8 5.9 6.2 6.5 10-14 .. .. .. .. .. .. .. .. .. .. .. 8.3 8.2 6.8 6.7 6.5 5.4 5.7 5.1 4.0 4.0 4.0 4.4 15-17 .. .. .. .. .. .. .. .. .. .. .. 31.4 31.9 30.2 29.5 29.4 28.3 28.7 26.9 24.4 22.9 19.7 16.2Boys .. .. .. .. .. .. .. .. .. .. .. 19.8 19.3 17.8 16.9 16.2 14.4 13.6 12.5 10.6 10.3 9.9 9.5 5-9 years old .. .. .. .. .. .. .. .. .. .. .. 20.7 19.4 18.0 16.6 15.1 12.1 9.1 8.0 6.3 6.3 6.9 7.0 10-14 .. .. .. .. .. .. .. .. .. .. .. 9.9 9.8 8.4 8.2 8.0 7.0 7.4 6.4 5.1 5.1 4.9 5.4 15-17 .. .. .. .. .. .. .. .. .. .. .. 35.6 35.9 34.1 33.0 33.1 32.2 32.4 31.0 28.2 26.7 23.2 20.5Girls .. .. .. .. .. .. .. .. .. .. .. 15.9 15.5 14.0 13.3 12.4 10.7 10.0 9.1 7.6 7.3 6.9 6.2 5-9 years old .. .. .. .. .. .. .. .. .. .. .. 18.8 17.2 15.9 14.2 12.6 10.0 7.7 6.7 5.2 5.5 5.6 6.0 10-14 .. .. .. .. .. .. .. .. .. .. .. 6.8 6.5 5.1 5.1 4.8 3.7 3.9 3.7 2.7 2.8 3.0 3.3 15-17 .. .. .. .. .. .. .. .. .. .. .. 27.1 28.0 26.2 26.1 25.6 24.4 24.8 22.7 20.6 18.9 15.9 11.5

Table 1. Economic and social context for decent workDecent Work Indicator 1995 1996 1997 1998 1999 2000 2001 2002 2003 2004 2005 2006 2007 2008 2009 2010 2011 2012 2013 2014 2015 2016 2017
Working age population who are HIV positive6 per 100,000 persons 0.2 0.3 0.2 0.3 0.2 0.1 0.2 0.2 0.2 0.2 0.2 0.3 0.4 0.7 1.1 2.3 3.4 4.8 6.7 8.4 11.0 12.5 14.7 Men 0.3 0.3 0.2 0.3 0.2 0.1 0.2 0.2 0.2 0.3 0.3 0.5 0.7 1.3 2.1 4.4 6.4 9.2 12.9 16.3 21.2 24.1 28.1 Women 0.2 0.2 0.1 0.3 0.1 0.1 0.2 0.1 0.1 0.2 0.1 0.2 0.1 0.1 0.2 0.3 0.4 0.3 0.5 0.5 0.8 1.0 1.2 15-24 years old 0.1 0.1 0.1 0.1 0.1 * 0.1 * 0.1 0.1 0.1 0.2 0.2 0.6 1.2 2.6 3.7 4.6 6.9 8.3 11.0 13.0 17.0 25+ 0.3 0.3 0.2 0.4 0.2 0.2 0.2 0.2 0.2 0.3 0.2 0.4 0.5 0.8 1.1 2.2 3.2 4.8 6.6 8.4 11.0 12.4 13.7Notes: 1. Annualized data for 2014 from the Labor Force Survey is the average of estimates for April, July and October survey rounds. The estimates for these rounds exclude data for Leyte province only while that of January exclude Region VIII. 2. Annualized data for 2015 from the Labor Force Survey is the average of estimates for January, April, July and October survey rounds. The estimates for these rounds exclude data for Leyte Province only. The use of the survey rounds that exclude Leyte was based on the results of the referendum conducted among members of the Inter-Agency Committee on Labor and Productivity Statistics.1 MDG indicator on employment.2 Data from 2009 based on 2008 SNA. Thus, data not strictly comparable with earlier years.3 Data from 2006 based on refinements in the old methodology for poverty estimation to ensure comparability of estimates across space and over time.
Thus, data not strictly comparable with earlier years.4 Total family income distribution disaggregated by per capita income decile.5 Labor Force Survey began collecting data on school attendance for ages 5-24 years in April 2005 survey round. 6 The HIV/AIDS and Art Registry of the Philippines is the official record of the total number of laboratory-confirmed HIV positive individuals, AID cases and deaths,
and HIV positive blood units in the Philippines. The Registry is a passive surveillance system. Except for HIV confirmation by the National Reference Laboratories all other data submitted to the Registry (example, place of residence) are secondary and can not be verified. The statistics for this indicator exclude cases of Filipinos working overseas because they are not part of the LFS data on working age population.a For comparability of 1997 growth rate with that of 1996, the labor productivity for these two years both used employment data based on 1980 Census-based
population projections.b For comparability of 2006 growth rate with that of 2005, the labor productivity for these two years both used employment data based on 1995 Census-based
population projections.c Labor productivity data for 2014 were computed using employment data which excluded that of Leyte. For comparability, 2014 growth rates were computed
using 2013 labor productivity whose employment data also excluded that of Leyte. d Labor productivity data for 2015 were computed using average employment data of the four survey rounds. For comparability, 2015 growth rates were computed using average employment data from April,
July and October survey rounds which also excluded that of Leyte.e Labor productivity data for 2016 were computed using the average of the four survey rounds employment data with the January 2016 data based on the 2010 Census-based population projections.e For comparability, the 2016 growth rates were computed using the average of July and October employment data for 2015 and 2016.f For comparability of 1997 growth rate with that of 1996, the employment data for these two years were based on 1980 Census-based population projections.g For comparability of 2006 growth rate with that of 2005, the employment data for these two years were based on 1995 Census-based population projections.h For comparability of 2014 growth rate with that of 2013, the employment data for these two years were based on the averages of April, July and October employment estimates.i For comparability of 2015 growth rate with that of 2014, the employment data for these two years were based on the averages of April, July and October employment estimates.
j 1994 data.* Less than half the unit used.Sources: Philippine Statistics Authority, Labor Force Survey/Official Poverty Statistics/Family Income and Expenditures Survey/Functional Literacy, Education and Mass Media Survey/ Consumer Price Index/National Accounts of the Philippines; Department of Health, National Epidemiology Center (Philippine HIV and AIDS Registry); and World Bank, World Development Indicators.Date updated: 2/1/2019

Table 1. Economic and social context for decent work
Decent Work Indicator and
Underlying Data1995 1996 1997 1998 1999 2000 2001 2002 2003 2004 2005 2006 2007 2008 2009 2010 2011 2012 2013 2014 2015 2016 2017
GDP by branch of economic
activity, at constant 2000
prices
Growth rate (%) 4.7 5.8 5.2 -0.6 3.1 4.4 2.9 3.6 5.0 6.7 4.8 5.2 6.6 4.2 1.1 7.6 3.7 6.7 7.1 6.1 6.1 6.9 6.7
Agriculture 0.6 3.7 2.9 -7.0 9.6 3.4 3.4 3.3 4.7 4.3 2.2 3.6 4.7 3.2 -0.7 -0.2 2.6 2.8 1.1 1.7 0.1 -1.2 4.0
Industry 6.4 6.3 6.0 -2.7 -1.5 6.5 1.0 2.9 4.3 5.2 4.2 4.6 5.8 4.8 -1.9 11.6 1.9 7.3 9.2 7.8 6.4 8.0 7.2
Services 4.7 6.2 5.3 2.8 4.5 3.3 4.0 4.2 5.5 8.3 5.8 6.0 7.6 4.0 3.4 7.2 4.9 7.1 7.0 6.0 6.9 7.5 6.8
% distribution 100.0 100.0 100.0 100.0 100.0 100.0 100.0 100.0 100.0 100.0 100.0 100.0 100.0 100.0 100.0 100.0 100.0 100.0 100.0 100.0 100.0 100.0 100.0
Agriculture 14.8 14.5 14.2 13.3 14.1 14.0 14.0 14.0 14.0 13.6 13.3 13.1 12.9 12.8 12.5 11.6 11.5 11.1 10.5 10.0 9.5 8.8 8.5
Industry 35.7 35.8 36.1 35.3 33.8 34.5 33.8 33.6 33.3 32.9 32.7 32.5 32.2 32.4 31.5 32.6 32.0 32.2 32.9 33.4 33.5 33.9 34.0
Services 49.5 49.7 49.7 51.4 52.1 51.6 52.1 52.4 52.7 53.5 54.0 54.4 54.9 54.8 56.0 55.8 56.5 56.7 56.7 56.6 57.0 57.4 57.5
Gross Domestic Product, at
constant 2000 prices
(PhP million) 3005541 3181241 3346200 3326902 3429434 3580714 3684340 3818667 4008469 4276941 4481279 4716231 5028288 5237101 5297240 5701539 5910201 6305229 6750631 7165478 7600175 8122741 8665708
Agriculture 444454 460680 474230 441167 483739 500111 517332 534509 559470 583629 596727 618457 647687 668550 663744 662665 679835 698978 706957 718797 719742 710926 739029
Industry 1073061 1140257 1208518 1175381 1157967 1233773 1245634 1281634 1336430 1406338 1465272 1532814 1621226 1699171 1666601 1859515 1893950 2031443 2219068 2391268 2545411 2750034 2947103
Services 1488026 1580304 1663452 1710354 1787728 1846830 1921373 2002525 2112569 2286974 2419280 2564959 2759375 2869379 2966895 3179359 3336416 3574808 3824606 4055413 4335022 4661781 4979575
Note: See Metadata of Statistical Indicators on Decent Work for definitions and other information.
Source: Philippine Statistics Authority, National Accounts of the Philippines.
GDP by branch of economic activity, at constant 2000 prices

Table 1. Economic and social context for decent workLabor productivity by branch of economic activity, at constant 2000 prices
Decent Work Indicator and
Underlying Data1995 1996 1997 1998 1999 2000 2001 2002 2003 2004 2005 2006 2007 2008 2009 2010 2011 2012 2013 2014 2015 2016 2017
Labor productivity by branch
of economic activity, at
constant 2000 prices
Level (PhP) 117052 117018 126918 124926 123619 130435 126366 127026 130846 135291 138683 144510 149830 153630 151086 158222 158911 167692 177098 185389 196179 198125 214849
Agriculture 39872 39560 45529 43719 44899 49122 47680 48059 49864 51281 51318 52941 54954 55574 55110 55425 55420 57800 59734 60910 63728 64256 72023
Industry 259193 257336 263753 258780 256471 277003 264297 272978 276122 281324 291596 306747 316584 336603 327298 344418 342486 353725 373769 387752 405643 384137 399878
Services 143203 142216 146340 142553 143570 144092 141350 140568 144925 150093 154478 160742 165688 168668 165526 170183 172033 180875 187988 196075 204753 204689 219336
Growth rate1/2/3/4
(%) 2.0 * 3.2 -1.6 -1.0 5.5 -3.1 0.5 3.0 3.4 2.5 3.2 3.7 2.5 -1.7 4.7 0.4 5.5 5.6 2.7 5.6 2.1 8.4
Agriculture 1.8 -0.8 6.0 -4.0 2.7 9.4 -2.9 0.8 3.8 2.8 0.1 2.0 3.8 1.1 -0.8 0.6 * 4.3 3.3 0.3 5.2 -2.2 12.1
Industry 1.5 -0.7 1.4 -1.9 -0.9 8.0 -4.6 3.3 1.2 1.9 3.7 5.0 3.2 6.3 -2.8 5.2 -0.6 3.3 5.7 2.6 3.4 -3.9 4.1
Services -1.3 -0.7 -0.6 -2.6 0.7 0.4 -1.9 -0.6 3.1 3.6 2.9 2.8 3.1 1.8 -1.9 2.8 1.1 5.1 3.9 2.0 4.0 3.1 7.2
Gross Domestic Product, at
constant 2000 prices (PhP
million) 3005541 3181241 3346200 3326902 3429434 3580714 3684340 3818667 4008469 4276941 4481279 4716231 5028288 5237101 5297240 5701539 5910201 6305229 6750631 7165478 7600175 8122741 8665708
Agriculture 444454 460680 474230 441167 483739 500111 517332 534509 559470 583629 596727 618457 647687 668550 663744 662665 679835 698978 706957.2 718797 719742 710926 739029
Industry 1073061 1140257 1208518 1175381 1157967 1233773 1245634 1281634 1336430 1406338 1465272 1532814 1621226 1699171 1666601 1859515 1893950 2031443 2219068 2391268 2545411 2750034 2947103
Services 1488026 1580304 1663452 1710354 1787728 1846830 1921373 2002525 2112569 2286974 2419280 2564959 2759375 2869379 2966895 3179359 3336416 3574808 3824606 4055413 4335022 4661781 4979575
Total employed (000) 25677 27186 26365 26631 27742 27452 29156 30062 30635 31613 32313 32636 33560 34089 35061 36035 37192 37600 38118 38651 38741 40998 40334
Agriculture 11147 11645 10416 10091 10774 10181 10850 11122 11220 11381 11628 11682 11786 12030 12044 11956 12267 12093 11835 11801 11294 11064 10261
Industry 4140 4431 4582 4542 4515 4454 4713 4695 4840 4999 5025 4997 5121 5048 5092 5399 5530 5743 5937 6167 6275 7159 7370
Services 10391 11112 11367 11998 12452 12817 13593 14246 14577 15237 15661 15957 16654 17012 17924 18682 19394 19764 20345 20683 21172 22775 22703
Note: See Metadata of Statistical Indicators on Decent Work for definitions and other information.1. For comparability of 1997 growth rate with that of 1996, the labor productivity for these two years both used employment data based on 1980 Census-based population projections.2. For comparability of 2006 growth rate with that of 2005, the labor productivity for these two years both used employment data based on 1995 Census-based population projections.3. Labor productivity data for 2014 were computed using average employment data from April, July and October survey rounds which excluded that of Leyte. For comparability, 2014 growth rates were computed using 2013 labor productivity whose average employment data from April, July and October survey rounds that also excluded that of Leyte. 4. Labor productivity data for 2015 were computed using average employment data from the four survey rounds which excluded that of Leyte. For comparability, 2015 growth rates were computed using 2015 labor productivity whose average employment data were from April, July and October survey rounds that also excluded that of Leyte. 5. Labor productivity data for 2016 were computed using the average of the four survey rounds employment data with the January 2016 data based on the 2010 Census-based population projections.6. For comparability, the 2016 growth rates were computed using the average of July and October employment data for 2015 and 2016.r revised* Less than half the unit used.Source: Philippine Statistics Authority, National Accounts of the Philippines and Labor Force Survey.

Table 1. Economic and social context for decent workReal GDP per capita
Decent Work Indicator and
Underlying Data1995 1996 1997 1998 1999 2000 2001 2002 2003 2004 2005 2006 2007 2008 2009 2010 2011 2012 2013 2014 2015 2016 2017
GDP per capita in PPP,
in constant 2011 international $
Level 3960 4097 4214 4098 4133 4224 4255 4319 4442 4647 4779 4942 5181 5309 5285 5597 5707 5989 6307 6586 6875 7233 7599
Growth rate (%) 2.3 3.5 2.9 -2.7 0.9 2.2 0.7 1.5 2.8 4.6 2.8 3.4 4.8 2.5 -0.5 5.9 2.0 4.9 5.3 4.4 4.4 5.2 5.1
Real GDP per capita, in constant
2000 PhP
Level 42771 44245 45508 44264 44666 46630 46881 47638 48955 51184 52561 54226 56684 57896 58199 61570 62332 65332 68746 71741 74833 78676 82592
Growth rate (%) 2.2 3.4 2.9 -2.7 0.9 4.4 0.5 1.6 2.8 4.6 2.7 3.2 4.5 2.1 0.5 5.8 1.2 4.8 5.2 4.4 4.3 5.1 5.0
Note: See Metadata of Statistical Indicators on Decent Work for definitions and other information.
Sources: World Bank, World Development Indicators;
Philippine Statistics Authority, National Accounts of the Philippines.
Table 1. Economic and social context for decent work
Decent Work Indicator and
Underlying Data1995 1996 1997 1998 1999 2000 2001 2002 2003 2004 2005 2006 2007 2008 2009 2010 2011 2012 2013 2014 2015 2016 2017
Wage share in GDP1 (%) 25.3 26.0 27.2 28.3 27.1 26.2 25.2 24.5 24.5 27.6 27.7 27.8 27.8 27.8 30.0 32.2 35.0 35.0 34.7 34.9 35.3 35.7 36.3
Compensation of employees, at
current prices1
(PhP million) 482570 563686 660133 752964 807637 878800 913561 970270 1055380 1345521 1507768 1675067 1850894 2057707 2407843 2901044 3399943 3701318 4006253 4406622 4697958 5165585 5736629
Gross Domestic Product, at
current prices1 (PhP million) 1905951 2171922 2426743 2665060 2976905 3354727 3631474 3963873 4316402 4871555 5444039 6031164 6648619 7409371 8026143 9003480 9708332 10561089 11538410 12634187 13322041 14479945 15806359
Note: See Metadata of Statistical Indicators on Decent Work for definitions and other information.
1 Data from 2009 based on 2008 SNA. Thus, data not strictly comparable with earlier years.
Source: Philippine Statistics Authority, National Accounts of the Philippines.
Table 1. Economic and social context for decent work
Decent Work Indicator and
Underlying Data1995 1996 1997 1998 1999 2000 2001 2002 2003 2004 2005 2006 2007 2008 2009 2010 2011 2012 2013 2014 2015 2016 2017
Capital formation, at constant
2000 prices
Growth rate (%) 2.7 11.6 11.0 -14.8 -13.1 1.1 24.0 15.7 -0.4 -2.2 3.0 -15.1 -0.5 23.4 -8.7 31.6 2.8 -4.3 27.9 4.2 18.4 24.5 9.4
As % of GDP 23.6 24.9 26.2 22.5 19.0 18.4 22.1 24.7 23.4 21.5 21.1 17.0 15.9 18.8 17.0 20.8 20.6 18.5 22.1 21.7 24.2 28.2 28.9
Capital formation, at constant
2000 prices (PhP million) 708977 791164 878162 748344 650557 657691 815374 943086 938864 917875 945024 802113 798328 984810 899333 1183650 1216884 1164718 1490196 1553029 1838432 2289675 2504502
Gross Domestic Product, at
constant 2000 prices (PhP
million) 3005541 3181241 3346200 3326902 3429434 3580714 3684340 3818667 4008469 4276941 4481279 4716231 5028288 5237101 5297240 5701539 5910201 6305229 6750631 7165478 7600175 8122741 8665708
Note: See Metadata of Statistical Indicators on Decent Work for definitions and other information.
Source: Philippine Statistics Authority, National Accounts of the Philippines.
Wage share in GDP
Capital formation, at constant 2000 prices

Table 1. Economic and social context for decent work
Decent Work Indicator and
Underlying Data1995 1996 1997 1998 1999 2000 2001 2002 2003 2004 2005 2006 2007 2008 2009 2010 2011 2012 2013 2014 2015 2016 2017
Inflation rate (%) 6.7 8.3 5.8 9.4 6.0 6.7 5.3 2.7 2.3 4.8 6.5 5.5 2.9 8.3 4.1 3.9 4.6 3.2 3.0 4.1 1.4 1.8 3.2
Consumer price index
(2006=100) 54.1 58.6 62.0 67.8 71.9 76.7 80.8 83.0 84.9 89.0 94.8 100.0 102.9 111.4 116.0 120.5 126.1 130.1 134.0 139.5 141.5 144.0 148.6
Note: See Metadata of Statistical Indicators on Decent Work for definitions and other information.
Source: Philippine Statistics Authority, Consumer Price Index.
Table 1. Economic and social context for decent work
Decent Work Indicator and
Underlying Data1995 1996 1997 1998 1999 2000 2001 2002 2003 2004 2005 2006 2007 2008 2009 2010 2011 2012 2013 2014 2015 2016 2017
Poverty incidence (%)
Families .. .. .. .. .. .. .. .. .. .. .. 21.0 .. .. 20.5 .. .. 19.7 .. .. 16.5 .. ..
Population .. .. .. .. .. .. .. .. .. .. .. 26.6 .. .. 26.3 .. .. 25.2 .. .. 21.6 .. ..
Subsistence incidence (%)
Families .. .. .. .. .. .. .. .. .. .. .. 8.8 .. .. 7.9 .. .. 7.5 .. .. 5.7 .. ..
Population .. .. .. .. .. .. .. .. .. .. .. 12.0 .. .. 10.9 .. .. 10.4 .. .. 8.1 .. ..
Income gap (%) .. .. .. .. .. .. .. .. .. .. .. 27.5 .. .. 26.2 .. .. 26.2 .. .. 24.6 .. ..
Magnitude of poor (million)
Families .. .. .. .. .. .. .. .. .. .. .. 3.81 .. .. 4.04 .. .. 4.21 .. .. 3.75 .. ..
Population .. .. .. .. .. .. .. .. .. .. .. 22.64 .. .. 23.30 .. .. 23.75 .. .. 21.93 .. ..
Magnitude of core/food poor
(million)
Families .. .. .. .. .. .. .. .. .. .. .. 1.60 .. .. 1.55 .. .. 1.61 .. .. 1.30 .. ..
Population .. .. .. .. .. .. .. .. .. .. .. 10.23 .. .. 9.70 .. .. 9.81 .. .. 8.23 .. ..
Annual per capita threshold
(PhP)
Poverty .. .. .. .. .. .. .. .. .. .. .. 13357 .. .. 16871 .. .. 18935 .. .. 21753 .. ..
Food .. .. .. .. .. .. .. .. .. .. .. 9308 .. .. 11780 .. .. 13232 .. .. 15189 .. ..
Note: See Metadata of Statistical Indicators on Decent Work for definitions and other information.
Source: Philippine Statistics Authority, Official Poverty Statistics.
Table 1. Economic and social context for decent work
Decent Work Indicator and
Underlying Data1995 1996 1997 1998 1999 2000 2001 2002 2003 2004 2005 2006 2007 2008 2009 2010 2011 2012 2013 2014 2015 2016 2017
Ratio of income of top 10%
of families to bottom 10%1
.. .. 14.8 .. .. 13.8 .. .. 12.3 .. .. 11.7 .. .. 10.3 .. .. 10.4 .. .. 9.1 .. ..
% of total family income1
Bottom 10% .. .. 2.4 .. .. 2.5 .. .. 2.6 .. .. 2.7 .. .. 3.0 .. .. 2.9 .. .. 3.2 .. ..
Top 10% .. .. 35.5 .. .. 34.6 .. .. 32.0 .. .. 31.7 .. .. 30.8 .. .. 30.5 .. .. 29.5 .. ..
Gini coefficient .. .. 0.4841 .. .. 0.4769 .. .. 0.4803 .. .. 0.4742 .. .. 0.4641 .. .. 0.4605 .. .. 0.4439 .. ..
Note: See Metadata of Statistical Indicators on Decent Work for definitions and other information.
1 Total family income distribution disaggregated by per capita income decile.
Source: Philippine Statistics Authority, Family Income and Expenditures Survey.
Inflation rate
Poverty indicators (incidence and gap)
Income inequality

Table 1. Economic and social context for decent workEmployment by branch of economic activity
Decent Work Indicator and
Underlying Data1995 1996 1997 1998 1999 2000 2001 2002 2003 2004 2005 2006 2007 2008 2009 2010 2011 2012 2013 2014 2015 2016 2017
Employment by branch of
economic activity
Growth rate1/2/3/4
(%) 2.6 5.9 1.9 1.0 4.2 -1.0 6.2 3.1 1.9 3.2 2.2 2.0 2.8 1.6 2.9 2.8 3.2 1.1 1.4 3.4 0.5 NA -1.6
Agriculture -1.2 4.5 -2.8 -3.1 6.8 -5.5 6.6 2.5 0.9 1.4 2.2 1.6 0.9 2.1 0.1 -0.7 2.6 -1.4 -2.1 1.4 -4.9 NA -7.3
Industry 4.8 7.0 4.5 -0.9 -0.6 -1.4 5.8 -0.4 3.1 3.3 0.5 -0.4 2.5 -1.4 0.9 6.0 2.4 3.9 3.4 5.1 2.9 NA 2.9
Services 6.1 6.9 5.9 5.6 3.8 2.9 6.1 4.8 2.3 4.5 2.8 3.1 4.4 2.1 5.4 4.2 3.8 1.9 2.9 4.0 2.8 NA -0.3
% distribution, total 100.0 100.0 100.0 100.0 100.0 100.0 100.0 100.0 100.0 100.0 100.0 100.0 100.0 100.0 100.0 100.0 100.0 100.0 100.0 100.0 100.0 100.0 100.0
Agriculture 43.4 42.8 39.5 37.9 38.8 37.1 37.2 37.0 36.6 36.0 36.0 35.8 35.1 35.3 34.4 33.2 33.0 32.2 31.0 30.5 29.2 27.0 25.4
Industry 16.1 16.3 17.4 17.1 16.3 16.2 16.2 15.6 15.8 15.8 15.6 15.3 15.3 14.8 14.5 15.0 14.9 15.3 15.6 16.0 16.2 17.5 18.3
Services 40.5 40.9 43.1 45.1 44.9 46.7 46.6 47.4 47.6 48.2 48.5 48.9 49.6 49.9 51.1 51.8 52.1 52.6 53.4 53.5 54.7 55.6 56.3
Men 100.0 100.0 100.0 100.0 100.0 100.0 100.0 100.0 100.0 100.0 100.0 100.0 100.0 100.0 100.0 100.0 100.0 100.0 100.0 100.0 100.0 100.0 100.0
Agriculture 51.1 49.8 46.3 45.0 46.0 45.0 45.1 44.8 44.3 43.7 43.6 43.5 42.7 42.9 41.9 40.5 40.3 39.4 38.1 37.2 35.8 33.2 31.6
Industry 17.6 18.4 19.8 19.5 18.3 18.0 18.4 18.1 18.2 18.2 17.8 17.6 17.9 17.5 17.5 18.2 18.1 18.6 19.1 19.7 20.2 22.2 23.4
Services 31.3 31.8 33.9 35.5 35.7 37.1 36.5 37.1 37.6 38.1 38.6 38.8 39.5 39.6 40.6 41.2 41.7 42.0 42.8 43.0 43.9 44.6 45.0
Women 100.0 100.0 100.0 100.0 100.0 100.0 100.0 100.0 100.0 100.0 100.0 100.0 100.0 100.0 100.0 100.0 100.0 100.0 100.0 100.0 100.0 100.0 100.0
Agriculture 29.9 31.0 27.9 25.9 27.1 23.9 24.6 24.8 24.3 23.3 23.7 23.6 23.2 23.2 22.5 21.8 21.7 21.0 20.1 20.3 19.0 17.3 15.3
Industry 13.6 12.7 13.2 12.9 12.9 13.3 12.6 11.8 12.0 12.0 12.0 11.6 11.1 10.5 9.9 9.9 10.0 10.1 10.1 10.2 10.0 10.0 9.9
Services 56.5 56.4 58.9 61.2 60.0 62.8 62.8 63.4 63.7 64.7 64.3 64.8 65.7 66.3 67.6 68.3 68.3 69.0 69.7 69.5 71.0 72.8 74.8
Employment by branch of
economic activity (000) 25677 27186 26365 26631 27742 27452 29156 30062 30635 31613 32313 32636 33560 34089 35061 36035 37192 37600 38118 38651 38741 40998 40334
Agriculture 11147 11645 10416 10091 10774 10181 10850 11122 11220 11381 11628 11682 11786 12030 12044 11956 12267 12093 11835 11801 11294 11064 10261
Industry 4140 4431 4582 4542 4515 4454 4713 4695 4840 4999 5025 4997 5121 5048 5092 5399 5530 5743 5937 6167 6275 7159 7370
Services 10391 11112 11367 11998 12452 12817 13593 14246 14577 15237 15661 15957 16654 17012 17924 18682 19394 19764 20345 20683 21172 22775 227030
Men 16322 17170 16610 16714 17253 17193 17923 18306 18873 19646 19910 20013 20542 20959 21404 21921 22573 22849 23150 23365 23406 25035 25067
Agriculture 8348 8545 7691 7522 7932 7733 8086 8205 8357 8588 8687 8709 8764 8982 8966 8887 9094 8999 8822 8696 8386 8307 7929
Industry 2871 3162 3295 3262 3162 3091 3300 3308 3431 3568 3539 3532 3673 3676 3740 3998 4076 4257 4421 4613 4737 5569 5862
Services 5102 5462 5624 5931 6160 6371 6539 6792 7088 7494 7686 7771 8105 8301 8698 9036 9403 9593 9908 10057 10283 11159 112760Women 9354 10016 9754 9917 10489 10259 11232 11756 11762 11968 12403 12622 13018 13129 13657 14114 14619 14751 14968 15286 15335 15963 15267
Agriculture 2799 3100 2724 2569 2843 2448 2765 2917 2863 2792 2942 2973 3022 3047 3077 3070 3173 3094 3014 3106 2908 2757 2332
Industry 1268 1268 1287 1279 1354 1364 1413 1386 1410 1431 1486 1464 1448 1372 1353 1400 1455 1486 1516 1554 1538 1590 1508
Services 5289 5647 5743 6069 6294 6447 7054 7453 7493 7745 7978 8185 8549 8709 9228 9644 9990 10172 10438 10626 10889 11616 11427Notes:
Notes: 1. Annualized data for 2014 from the Labor Force Survey is the average of estimates for April, July and October survey rounds. The estimates for these rounds exclude data for Leyte province only while that of January exclude Region VIII.
2. Annualized data for 2015 from the Labor Force Survey is the average of estimates for January, April, July and October survey rounds. The estimates for these rounds exclude data for Leyte Province only. The use of the survey rounds
that exclude Leyte was based on the results of the referendum conducted among members of the Inter-Agency Committee on Labor and Productivity Statistics.
3. See Metadata of Statistical Indicators on Decent Work for definitions and other information.
1 For comparability of 1997 growth rate with that of 1996, the employment data for these two years were based on 1980 Census-based population projections.
2 For comparability of 2006 growth rate with that of 2005, the employment data for these two years were based on 1995 Census-based population projections.
3 For comparability of 2014 growth rate with that of 2013, the employment data for these two years were based on the averages of April, July and October employment estimates.
4 For comparability of 2015 growth rate with that of 2014, the employment data for these two years were based on the averages of April, July and October employment estimates.
Source: Philippine Statistics Authority, Labor Force Survey.

Table 1. Economic and social context for decent workFemale share of employment by branch of economic activity
Decent Work Indicator and
Underlying Data1995 1996 1997 1998 1999 2000 2001 2002 2003 2004 2005 2006 2007 2008 2009 2010 2011 2012 2013 2014 2015 2016 2017
Female share of employment
by branch of economic activity (%) 36.4 36.8 37.0 37.2 37.8 37.4 38.5 39.1 38.4 37.9 38.4 38.7 38.8 38.5 39.0 39.2 39.3 39.2 39.3 39.5 39.6 38.9 37.9
Agriculture 25.1 26.6 26.2 25.5 26.4 24.0 25.5 26.2 25.5 24.5 25.3 25.4 25.6 25.3 25.5 25.7 25.9 25.6 25.5 26.3 25.7 24.9 22.7
Industry 30.6 28.6 28.1 28.2 30.0 30.6 30.0 29.5 29.1 28.6 29.6 29.3 28.3 27.2 26.6 25.9 26.3 25.9 25.5 25.2 24.5 22.2 20.5
Services 50.9 50.8 50.5 50.6 50.5 50.3 51.9 52.3 51.4 50.8 50.9 51.3 51.3 51.2 51.5 51.6 51.5 51.5 51.3 51.4 51.4 51.0 50.3
Total employed women (000) 9354 10016 9754 9917 10489 10259 11232 11756 11762 11968 12403 12622 13018 13129 13657 14114 14619 14751 14968 15286 15335 15963 15267
Agriculture 2799 3100 2724 2569 2843 2448 2765 2917 2863 2792 2942 2973 3022 3047 3077 3070 3173 3094 3014 3106 2908 2757 2332
Industry 1268 1268 1287 1279 1354 1364 1413 1386 1410 1431 1486 1464 1448 1372 1353 1400 1455 1486 1516 1554 1538 1590 1508
Services 5289 5647 5743 6069 6294 6447 7054 7453 7493 7745 7978 8185 8549 8709 9228 9644 9990 10172 10438 10626 10889 11616 11427
Total employed (000) 25677 27186 26365 26631 27742 27452 29156 30062 30635 31613 32313 32636 33560 34089 35061 36035 37192 37600 38118 38651 38741 40998 40334
Agriculture 11147 11645 10416 10091 10774 10181 10850 11122 11220 11381 11628 11682 11786 12030 12044 11956 12267 12093 11835 11801 11294 11064 10261
Industry 4140 4431 4582 4542 4515 4454 4713 4695 4840 4999 5025 4997 5121 5048 5092 5399 5530 5743 5937 6167 6275 7159 7370
Services 10391 11112 11367 11998 12452 12817 13593 14246 14577 15237 15661 15957 16654 17012 17924 18682 19394 19764 20345 20683 21172 22775 22703Notes:
Notes: 1. Annualized data for 2014 from the Labor Force Survey is the average of estimates for April, July and October survey rounds. The estimates for these rounds exclude data for Leyte province only while that of January exclude Region VIII.
2. Annualized data for 2015 from the Labor Force Survey is the average of estimates for January, April, July and October survey rounds. The estimates for these rounds exclude data for Leyte Province only. The use of the survey rounds
that exclude Leyte was based on the results of the referendum conducted among members of the Inter-Agency Committee on Labor and Productivity Statistics.
3. See Metadata of Statistical Indicators on Decent Work for definitions and other information.
Source: Philippine Statistics Authority, Labor Force Survey.

Table 1. Economic and social context for decent work
Decent Work Indicator and
Underlying Data1995 1996 1997 1998 1999 2000 2001 2002 2003 2004 2005 2006 2007 2008 2009 2010 2011 2012 2013 2014 2015 2016 2017
Adult functional literacy,
25-64 years old1 (%) 82.7 .. .. .. .. .. .. .. 83.4 .. .. .. .. 85.8 .. .. .. .. 90.2 .. .. .. ..
Men 81.2 .. .. .. .. .. .. .. 81.9 .. .. .. .. 84.1 .. .. .. .. 88.7 .. .. .. ..
Women 84.0 .. .. .. .. .. .. .. 84.9 .. .. .. .. 87.6 .. .. .. .. 91.7 .. .. .. ..
Total adult population who are
functionally literate, 25-64 years
old1 (000) 21312 .. .. .. .. .. .. .. 26428 .. .. .. .. 32069 .. .. .. .. 37133 .. .. .. ..
Men 10229 .. .. .. .. .. .. .. 13018 .. .. .. .. 15751 .. .. .. .. 18367 .. .. .. ..
Women 11083 .. .. .. .. .. .. .. 13410 .. .. .. .. 16317 .. .. .. .. 18762 .. .. .. ..
Total adult population, 25-64 years
old1 (000) 25785 .. .. .. .. .. .. .. 31685 .. .. .. .. 37361 .. .. .. .. 41167 .. .. .. ..
Men 12593 .. .. .. .. .. .. .. 15899 .. .. .. .. 18739 .. .. .. .. 20707 .. .. .. ..
Women 13191 .. .. .. .. .. .. .. 15786 .. .. .. .. 18623 .. .. .. .. 20460 .. .. .. ..
Note: See Metadata of Statistical Indicators on Decent Work for definitions and other information.
1 Figures under 1995 (year) refer to 1994 data.
Source: Philippine Statistics Authority, Functional Literacy, Education and Mass Media Survey.
Table 1. Economic and social context for decent workAdult secondary-school graduation rate, 25+ years old
Decent Work Indicator and
Underlying Data1995 1996 1997 1998 1999 2000 2001 2002 2003 2004 2005 2006 2007 2008 2009 2010 2011 2012 2013 2014 2015 2016 2017
Adult secondary-school
graduation rate, 25+ years old (%) 38.5 41.6 43.1 43.6 44.3 45.0 44.8 45.3 47.0 48.2 49.5 50.2 51.0 52.0 53.0 54.0 54.6 55.3 56.4 57.5 57.9 57.8 57.8
Men 39.6 42.6 43.9 44.1 44.7 45.5 45.3 45.5 46.7 47.5 48.5 49.2 49.8 50.6 51.5 52.5 52.9 53.3 54.1 55.2 55.4 55.3 55.2
Women 37.4 40.7 42.3 43.1 44.0 44.6 44.4 45.1 47.2 48.9 50.4 51.1 52.1 53.3 54.5 55.5 56.3 57.3 58.6 59.8 60.4 60.3 60.4
Total adult population who
completed secondary school, 25+
years old1 (000) 11419 12757 13350 13960 14710 15260 15242 15926 16933 17867 18815 19203 20028 20935 21919 22962 23645 24382 25312 25779 26305 28128 28993
Men 5722 6403 6690 6918 7259 7519 7484 7783 8218 8688 9106 9320 9669 10051 10490 11002 11282 11587 11998 12206 12453 13334 13717
Women 5697 6355 6659 7042 7450 7743 7758 8142 8713 9178 9709 9882 10359 10883 11429 11960 12363 12793 13313 13573 13852 14794 15276
Total adult household population,
25+ years old1 (000) 29683 30630 30995 32038 33187 33900 34020 35141 36054 37057 38044 38263 39290 40253 41327 42497 43305 44058 44888 44810 45414 48641 50157
Men 14462 15015 15236 15681 16238 16540 16531 17087 17591 18296 18779 18930 19425 19851 20359 20944 21347 21734 22162 22128 22479 24095 24861
Women 15220 15616 15759 16357 16949 17360 17490 18054 18463 18761 19265 19332 19865 20402 20968 21553 21959 22322 22726 22683 22935 24546 25296
Notes: 1. Annualized data for 2014 from the Labor Force Survey is the average of estimates for April, July and October survey rounds. The estimates for these rounds exclude data for Leyte province only while that of January exclude Region VIII.
2. Annualized data for 2015 from the Labor Force Survey is the average of estimates for January, April, July and October survey rounds. The estimates for these rounds exclude data for Leyte Province only. The use of the survey rounds
that exclude Leyte was based on the results of the referendum conducted among members of the Inter-Agency Committee on Labor and Productivity Statistics.
3. See Metadata of Statistical Indicators on Decent Work for definitions and other information.
1 Includes persons with age not reported.
Source: Philippine Statistics Authority, Labor Force Survey.
Adult functional literacy rate, 25-64 years old

Table 1. Economic and social context for decent work
Decent Work Indicator and
Underlying Data1995 1996 1997 1998 1999 2000 2001 2002 2003 2004 2005 2006 2007 2008 2009 2010 2011 2012 2013 2014 2015 2016 2017
Children not in school,
% of children population .. .. .. .. .. .. .. .. .. .. .. 17.9 17.4 16.0 15.1 14.4 12.6 11.8 10.8 9.1 8.8 8.4 7.9
5-9 years old .. .. .. .. .. .. .. .. .. .. .. 19.8 18.3 17.0 15.4 13.9 11.1 8.4 7.4 5.8 5.9 6.2 6.5
10-14 .. .. .. .. .. .. .. .. .. .. .. 8.3 8.2 6.8 6.7 6.5 5.4 5.7 5.1 4.0 4.0 4.0 4.4
15-17 .. .. .. .. .. .. .. .. .. .. .. 31.4 31.9 30.2 29.5 29.4 28.3 28.7 26.9 24.4 22.9 19.7 16.2
Boys .. .. .. .. .. .. .. .. .. .. .. 19.8 19.3 17.8 16.9 16.2 14.4 13.6 12.5 10.6 10.3 9.9 9.5
5-9 years old .. .. .. .. .. .. .. .. .. .. .. 20.7 19.4 18.0 16.6 15.1 12.1 9.1 8.0 6.3 6.3 6.9 7.0
10-14 .. .. .. .. .. .. .. .. .. .. .. 9.9 9.8 8.4 8.2 8.0 7.0 7.4 6.4 5.1 5.1 4.9 5.4
15-17 .. .. .. .. .. .. .. .. .. .. .. 35.6 35.9 34.1 33.0 33.1 32.2 32.4 31.0 28.2 26.7 23.2 20.5
Girls .. .. .. .. .. .. .. .. .. .. .. 15.9 15.5 14.0 13.3 12.4 10.7 10.0 9.1 7.6 7.3 6.9 6.2
5-9 years old .. .. .. .. .. .. .. .. .. .. .. 18.8 17.2 15.9 14.2 12.6 10.0 7.7 6.7 5.2 5.5 5.6 6.0
10-14 .. .. .. .. .. .. .. .. .. .. .. 6.8 6.5 5.1 5.1 4.8 3.7 3.9 3.7 2.7 2.8 3.0 3.3
15-17 .. .. .. .. .. .. .. .. .. .. .. 27.1 28.0 26.2 26.1 25.6 24.4 24.8 22.7 20.6 18.9 15.9 11.5
Total children not currently
attending school (000) .. .. .. .. .. .. .. .. .. .. .. 4913 4871 4542 4344 4153 3660 3500 3249 2742 2707 2451 2315
5-9 years old .. .. .. .. .. .. .. .. .. .. .. 2074 1939 1804 1646 1477 1175 909 812 643 669 698 745
10-14 .. .. .. .. .. .. .. .. .. .. .. 898 904 769 771 763 649 688 628 491 494 449 493
15-17 .. .. .. .. .. .. .. .. .. .. .. 1941 2028 1969 1927 1913 1836 1904 1809 1608 1545 1305 1077
Boys .. .. .. .. .. .. .. .. .. .. .. 2763 2740 2581 2463 2385 2135 2048 1910 1616 1604 1471 1432
5-9 years old .. .. .. .. .. .. .. .. .. .. .. 1114 1046 980 905 820 654 499 453 360 366 395 410
10-14 .. .. .. .. .. .. .. .. .. .. .. 539 554 484 483 484 430 455 404 323 324 280 313
15-17 .. .. .. .. .. .. .. .. .. .. .. 1110 1140 1117 1075 1081 1051 1093 1053 933 914 796 709
Girls .. .. .. .. .. .. .. .. .. .. .. 2150 2132 1960 1881 1766 1526 1453 1339 1125 1103 980 882
5-9 years old .. .. .. .. .. .. .. .. .. .. .. 960 893 823 742 657 522 410 359 283 303 303 335
10-14 .. .. .. .. .. .. .. .. .. .. .. 359 351 285 287 278 219 232 224 167 170 168 179
15-17 .. .. .. .. .. .. .. .. .. .. .. 831 888 852 852 831 785 811 756 675 631 509 368
Total household population of
children (000) 21300 21877 23195 23659 24194 24991 25349 25696 25493 24906 25564 27449 28013 28459 28701 28934 29118 29541 30078 30059 30593 29102 29398
5-9 years old 8485 8592 9502 9679 9832 9852 9833 9853 9716 9602 9784 10491 10584 10608 10671 10633 10623 10784 11022 11108 11331 11182 11448
10-14 7702 8021 8736 8971 9330 9919 10271 10433 10221 9710 9977 10767 11072 11328 11502 11798 12011 12115 12325 12371 12502 11293 11289
15-17 5113 5264 4958 5009 5032 5220 5245 5410 5556 5594 5803 6191 6357 6523 6528 6503 6484 6642 6732 6579 6760 6627 6661
Boys 10943 11233 11866 12130 12498 12954 13149 13204 13052 12691 13061 13954 14220 14464 14598 14734 14822 15040 15300 15274 15545 14933 15153
5-9 years old 4359 4406 4868 4972 5123 5123 5093 5044 4943 4915 5049 5372 5400 5435 5447 5433 5421 5482 5630 5676 5777 5739 5883
10-14 3939 4064 4439 4601 4765 5101 5305 5332 5222 4951 5067 5460 5641 5757 5889 6039 6132 6189 6268 6293 6342 5764 5808
15-17 2645 2763 2559 2558 2610 2730 2751 2828 2887 2825 2945 3122 3179 3272 3262 3262 3268 3369 3402 3305 3425 3431 3462
Girls 10357 10643 11329 11529 11696 12037 12200 12491 12441 12215 12503 13494 13792 13996 14101 14200 14297 14500 14778 14785 15048 14169 14244
5-9 years old 4126 4185 4634 4708 4709 4729 4740 4808 4773 4688 4736 5118 5184 5174 5223 5200 5202 5301 5392 5432 5554 5443 5566
10-14 3763 3957 4297 4371 4566 4818 4966 5101 4999 4758 4910 5307 5431 5571 5613 5759 5878 5926 6056 6078 6159 5530 5480
15-17 2468 2501 2398 2451 2421 2490 2494 2582 2669 2769 2858 3069 3177 3251 3265 3241 3216 3273 3330 3274 3335 3196 3199
Notes: 1. Details may not add up to totals due to rounding.
2. Annualized data for 2014 from the Labor Force Survey is the average of estimates for April, July and October survey rounds. The estimates for these rounds exclude data for Leyte province only while that of January exclude Region VIII.
3. Annualized data for 2015 from the Labor Force Survey is the average of estimates for January, April, July and October survey rounds. The estimates for these rounds exclude data for Leyte Province only. The use of the survey rounds
that exclude Leyte was based on the results of the referendum conducted among members of the Inter-Agency Committee on Labor and Productivity Statistics.
4. See Metadata of Statistical Indicators on Decent Work for definitions and other information.
Source: Philippine Statistics Authority, Labor Force Survey.
Children not in school, % of children population

Table 1. Economic and social context for decent workWorking age population who are HIV positive per 100,000 persons
Decent Work Indicator and
Underlying Data1995 1996 1997 1998 1999 2000 2001 2002 2003 2004 2005 2006 2007 2008 2009 2010 2011 2012 2013 2014 2015 2016 2017
Working age population
who are HIV positive
per 100,000 persons 0.2 0.3 0.2 0.3 0.2 0.1 0.2 0.2 0.2 0.2 0.2 0.3 0.4 0.7 1.1 2.3 3.4 4.8 6.7 8.4 11.0 12.5 14.7
Men 0.3 0.3 0.2 0.3 0.2 0.1 0.2 0.2 0.2 0.3 0.3 0.5 0.7 1.3 2.1 4.4 6.4 9.2 12.9 16.3 21.2 24.1 28.1
Women 0.2 0.2 0.1 0.3 0.1 0.1 0.2 0.1 0.1 0.2 0.1 0.2 0.1 0.1 0.2 0.3 0.4 0.3 0.5 0.5 0.8 1.0 1.2
15-24 years old 0.1 0.1 0.1 0.1 0.1 * 0.1 * 0.1 0.1 0.1 0.2 0.2 0.6 1.2 2.6 3.7 4.6 6.9 8.3 11.0 13.0 17.0
25+a
0.3 0.3 0.2 0.4 0.2 0.2 0.2 0.2 0.2 0.3 0.2 0.4 0.5 0.8 1.1 2.2 3.2 4.8 6.6 8.4 11.0 12.4 13.7
Total persons reported as HIV
positive1
92 115 87 136 87 63 90 87 97 110 118 175 227 404 669 1414 2075 2992 4303 5356 7130 8571 10249
Men 59 78 55 78 55 36 50 61 63 70 79 130 186 374 614 1319 1963 2882 4132 5185 6875 8242 9819
Women 33 37 32 58 32 24 40 26 33 40 39 45 41 30 55 95 112 110 171 171 255 329 430
Not reported 0 0 0 0 0 3 0 0 1 0 0 0 0 0 0 0 0 0 0 0 0 0 0
15-24 years old 11 15 13 18 12 6 22 7 13 15 23 37 37 102 211 472 682 869 1338 1605 2148 2558 3362
25+a
81 100 74 118 75 57 68 80 84 95 95 138 190 302 458 942 1393 2123 2965 3751 4982 6013 6887
Total working age population
(000) 43156 44599 44658 45964 47270 48587 48929 50344 51793 53144 54388 55230 56565 57848 59237 60717 61882 62985 64173 64033 64936 68311 69891
Men 21565 22307 22232 22818 23568 24245 24396 25108 25799 26485 27111 27521 28184 28784 29464 30223 30805 31369 31974 31905 32417 34184 35004
Women 21591 22292 22426 23147 23704 24342 24532 25237 25994 26660 27277 27708 28381 29064 29773 30493 31076 31616 32199 32128 32519 34127 34887
15-24 years old 13473 13969 13663 13927 14084 14687 14908 15203 15738 16088 16344 16967 17275 17594 17910 18220 18576 18928 19285 19223 19522 19669 19734
25+a
29683 30630 30995 32038 33187 33900 34020 35141 36054 37057 38044 38263 39290 40253 41327 42497 43305 44058 44888 44810 45414 48641 50157
Notes: 1. Details may not add up to totals due to rounding. 2. Annualized data for 2014 from the Labor Force Survey is the average of estimates for April, July and October survey rounds. The estimates for these rounds exclude data for Leyte province only while that of January exclude Region VIII. 3. Annualized data for 2015 from the Labor Force Survey is the average of estimates for January, April, July and October survey rounds. The estimates for these rounds exclude data for Leyte Province only. The use of the survey rounds that exclude Leyte was based on the results of the referendum conducted among members of the Inter-Agency Committee on Labor and Productivity Statistics. 4. See Metadata of Statistical Indicators on Decent Work for definitions and other information.1 The statistics for this indicator exclude cases of Filipinos working overseas because they are not part of the LFS data on working age population.a Includes persons with age not reported.* Less than half the unit used. Sources: Department of Health, Epidemiology Bureau (HIV/AIDS and Art Registry of the Philippines); and Philippine Statistics Authority, Labor Force Survey.

Element 2
Employment
Opportunities

Table 2. Employment opportunities
Decent Work Indicator 1995 1996 1997 1998 1999 2000 2001 2002 2003 2004 2005 2006 2007 2008 2009 2010 2011 2012 2013 2014 2015 2016 2017
Employment-to-population
ratio1, in % 59.5 61.0 59.0 57.9 58.7 56.5 59.6 59.7 59.1 59.5 59.4 59.1 59.3 58.9 59.2 59.3 60.1 59.7 59.4 60.4 59.7 60.0 59.7
Men 75.7 77.0 74.7 73.2 73.2 70.9 73.5 72.9 73.2 74.2 73.4 72.7 72.9 72.8 72.6 72.5 73.3 72.8 72.4 73.2 72.2 73.2 72.2
Women 43.3 44.9 43.5 42.8 44.2 42.1 45.8 46.6 45.2 44.9 45.5 45.6 45.9 45.2 45.9 46.3 47.0 46.7 46.5 47.6 47.2 46.8 47.2
15-24 years old 42.2 43.9 42.2 40.2 40.6 37.6 40.2 39.6 39.1 39.7 39.3 38.5 38.4 37.4 37.6 37.4 39.1 38.7 38.0 39.1 37.2 36.9 37.2
25-54 71.5 72.8 70.1 69.3 70.3 68.6 72.6 73.0 72.3 72.0 72.0 72.2 72.6 72.5 72.8 73.0 73.4 73.2 73.0 74.0 73.8 74.4 73.8
55+ 54.0 54.8 53.4 52.8 53.2 51.6 53.7 54.0 53.4 53.7 53.6 53.0 53.4 52.9 53.3 53.6 53.8 52.9 52.6 53.3 53.3 53.3 53.3
Unemployment rate2, in % 9.5 8.6 8.8 10.3 9.8 11.2 11.1 11.4 11.4 11.8 7.8 8.0 7.3 7.4 7.5 7.4 7.0 7.0 7.1 6.6 6.3 5.4 6.3
Men 8.9 7.9 8.2 9.8 9.7 10.9 10.8 11.1 11.0 11.5 7.8 8.2 7.5 7.6 7.6 7.6 7.3 7.2 7.3 6.9 6.6 5.6 6.6
Women 10.7 9.7 9.8 11.0 10.0 11.6 11.6 11.8 11.9 12.4 7.8 7.6 7.0 7.1 7.2 6.9 6.6 6.7 6.8 6.1 5.8 5.2 5.8##### #####
15-24 years old 19.8 17.7 18.3 21.4 21.0 24.2 23.3 24.2 23.2 23.9 17.2 17.8 16.8 17.4 17.6 17.6 16.3 16.2 16.1 15.3 15.0 13.5 15.0
25 and over 6.1 5.5 5.7 6.7 6.4 7.2 7.3 7.5 7.8 8.2 5.1 5.1 4.7 4.6 4.7 4.6 4.5 4.5 4.6 4.2 4.0 3.5 4.0
25-54 6.3 5.6 5.8 6.8 6.5 7.4 7.6 7.8 8.0 8.1 5.6 5.7 5.1 5.1 5.2 5.1 4.9 4.9 5.1 4.7 4.5 3.9 4.5
55+ 5.4 5.2 5.5 6.3 5.5 6.0 6.4 6.3 7.1 8.2 2.3 2.3 2.3 2.2 2.2 2.1 2.0 2.2 2.3 1.9 1.7 1.7 1.7
Youth not in education and not
in employment (15-24 years)3,
% of youth population .. .. .. .. .. .. .. .. .. .. .. 24.5 24.9 24.6 24.7 25.2 24.3 24.8 24.2 23.1 22.7 22.1 22.7
Men .. .. .. .. .. .. .. .. .. .. .. 18.0 18.4 17.8 18.0 18.7 17.4 17.7 17.5 16.5 17.1 15.4 17.1
Women .. .. .. .. .. .. .. .. .. .. .. 31.2 31.5 31.7 31.6 31.9 31.4 32.1 31.1 29.9 28.6 29.2 28.6
Labor force participation rate2,
in % 65.8 66.7 64.7 64.6 65.1 63.6 67.1 67.4 66.7 67.5 64.7 64.2 64.0 63.6 64.0 64.1 64.6 64.2 63.9 64.6 63.7 63.5 63.7
Men 83.0 83.5 81.3 81.2 81.1 79.6 82.4 82.0 82.2 83.8 79.6 79.3 78.8 78.8 78.6 78.5 79.0 78.5 78.1 78.6 77.3 77.6 77.3
Women 48.5 49.8 48.2 48.1 49.2 47.7 51.8 52.8 51.4 51.2 49.9 49.3 49.3 48.6 49.4 49.7 50.4 50.0 49.9 50.7 50.1 49.3 50.1
15-24 years old 52.6 53.3 51.6 51.2 51.4 49.6 52.4 52.3 50.9 52.2 48.0 46.8 46.1 45.3 45.6 45.4 46.7 46.1 45.3 46.1 43.7 42.7 43.7
25-54 76.3 77.1 74.4 74.4 75.2 74.1 78.6 79.2 78.5 78.4 76.6 76.6 76.5 76.4 76.7 76.9 77.2 76.9 77.0 77.7 77.3 77.5 77.3
55+ 57.0 57.7 56.4 56.4 56.3 54.9 57.4 57.6 57.5 58.5 55.0 54.2 54.7 54.1 54.5 54.8 55.0 54.1 53.9 54.4 54.2 54.2 54.2
Labor force participation gap2
34.5 33.7 33.1 33.1 31.9 31.9 30.6 29.2 30.8 32.6 29.7 30.0 29.5 30.2 29.2 28.8 28.6 28.5 28.2 27.9 27.2 28.3 27.2
Youth unemployment rate2,
15-24 years, in % 19.8 17.7 18.3 21.4 21.0 24.2 23.3 24.2 23.2 23.9 17.2 17.8 16.8 17.4 17.6 17.6 16.3 16.2 16.1 15.3 15.0 13.5 15.0
Men 17.5 15.4 16.4 19.5 19.1 22.1 20.8 21.8 20.8 21.6 15.8 16.8 15.7 16.2 16.2 16.5 15.2 14.9 15.1 14.3 14.3 12.7 14.3
Women 24.0 21.7 21.5 24.7 24.4 27.9 27.4 28.0 27.2 27.8 19.5 19.4 18.4 19.4 19.8 19.5 18.3 18.3 17.8 16.9 16.0 14.9 16.0
Unemployment2
by level
of education, % distribution 100.0 100.0 100.0 100.0 100.0 100.0 100.0 100.0 100.0 100.0 100.0 100.0 100.0 100.0 100.0 100.0 100.0 100.0 100.0 100.0 100.0 100.0 100.0
No schooling 2.0 2.2 2.1 2.2 1.8 1.9 2.0 1.9 2.0 2.4 0.7 0.7 0.7 0.5 0.5 0.5 0.4 0.5 0.5 0.4 0.3 0.7 0.3
Primary 23.3 23.4 23.5 24.1 21.7 21.8 21.3 20.6 20.9 20.7 15.2 15.2 15.1 14.0 13.3 13.1 12.6 13.2 13.0 11.8 12.1 12.9 12.1
Secondary 42.6 42.2 42.6 42.4 42.7 42.3 43.2 42.8 42.2 43.0 44.5 45.7 46.1 45.5 45.2 45.2 45.1 45.1 44.4 43.4 44.6 42.8 44.6
Post secondary a a a a a a a a a a a a a a a a a 8.2 8.0 8.2 8.1 8.5 8.1
Tertiary 31.6 31.6 31.1 30.6 33.0 32.9 33.5 34.7 34.9 34.0 39.5 38.5 38.2 40.0 41.1 41.2 42.0 32.9 34.1 36.2 34.9 35.2 34.9
Not reported 0.4 0.6 0.7 0.8 0.8 1.1 0.0 * * 0.0 0.0 0.0 0.0 0.0 0.0 0.0 0.0 0.0 0.0 0.0 0.0 0.0 0.0
Men 100.0 100.0 100.0 100.0 100.0 100.0 100.0 100.0 100.0 100.0 100.0 100.0 100.0 100.0 100.0 100.0 100.0 100.0 100.0 100.0 100.0 100.0 100.0
No schooling 1.8 2.0 1.9 1.8 1.5 1.6 1.6 1.5 1.7 2.0 0.6 0.6 0.7 0.6 0.4 0.6 0.4 0.5 0.6 0.5 0.4 0.7 0.4
Primary 24.3 24.6 24.6 25.3 23.1 23.4 22.4 22.0 22.3 22.4 17.3 17.6 17.6 16.6 16.2 15.9 14.9 15.6 15.5 14.2 14.6 15.3 14.6
Secondary 45.0 43.6 44.4 44.3 44.1 43.8 46.0 45.5 44.0 43.9 45.7 46.4 46.8 46.8 46.7 46.7 46.5 46.2 45.7 45.5 46.7 44.1 46.7
Post secondary a a a a a a a a a a a a a a a a a 8.0 7.6 7.9 7.5 8.0 7.5
Tertiary 28.5 29.0 28.3 27.6 30.5 30.1 30.0 31.0 32.0 31.7 36.4 35.3 35.0 36.1 36.8 36.8 38.2 29.7 30.6 32.0 30.9 31.9 30.9
Not reported 0.6 0.8 0.8 0.9 0.9 1.2 0.0 * * 0.0 0.0 0.0 0.0 0.0 0.0 0.1 0.0 0.0 0.0 0.0 0.0 0.0 0.0
Women 100.0 100.0 100.0 100.0 100.0 100.0 100.0 100.0 100.0 100.0 100.0 100.0 100.0 100.0 100.0 100.0 100.0 100.0 100.0 100.0 100.0 100.0 100.0
No schooling 2.3 2.4 2.4 2.6 2.2 2.5 2.6 2.5 2.3 2.8 0.9 0.7 0.7 0.4 0.6 0.4 0.4 0.5 0.4 0.3 0.3 0.7 0.3
Primary 22.1 21.8 22.0 22.2 19.5 19.5 19.7 18.6 18.9 18.0 11.9 10.9 10.9 9.6 8.6 8.3 8.6 9.3 8.9 7.8 7.7 8.8 7.7
Secondary 39.4 40.4 40.3 39.7 40.7 39.9 39.2 38.9 39.5 41.5 42.7 44.4 44.7 43.5 42.8 42.6 42.7 43.3 42.1 39.7 41.1 40.5 41.1
Post secondary a a a a a a a a a a a a a a a a a 8.7 8.6 8.8 9.0 9.2 9.0
Tertiary 36.0 35.0 34.8 35.0 36.9 37.4 38.6 40.0 39.3 37.6 44.6 43.9 43.7 46.6 48.2 48.7 48.4 38.3 39.9 43.5 42.0 40.7 42.0
Not reported 0.2 0.4 0.5 0.5 0.7 0.9 0.0 0.0 0.0 0.0 0.0 0.0 0.0 0.0 0.0 0.1 0.0 0.0 0.0 0.0 0.0 0.0 0.0
Employment by class
of worker, % distribution 100.0 100.0 100.0 100.0 100.0 100.0 100.0 100.0 100.0 100.0 100.0 100.0 100.0 100.0 100.0 100.0 100.0 100.0 100.0 100.0 100.0 100.0 100.0
Wage and salary workers 46.2 46.5 49.5 49.9 49.6 50.7 49.5 48.7 50.1 52.1 50.5 51.1 52.2 52.4 53.3 54.5 55.2 57.2 58.4 58.0 59.3 61.6 59.3
Employers 3.5 3.7 3.6 3.6 4.8 4.8 5.3 5.5 5.2 5.1 4.7 4.4 4.3 4.2 4.1 3.9 3.6 3.6 3.3 3.1 3.1 3.4 3.1
Self-employed 35.5 34.3 33.3 33.4 32.0 32.3 32.2 32.4 32.4 31.7 32.8 32.2 31.5 31.3 30.6 30.1 29.6 28.3 28.0 28.1 27.6 27.1 27.6
Unpaid family workers 14.8 15.5 13.7 13.1 13.6 12.2 13.0 13.3 12.3 11.2 12.0 12.3 12.1 12.2 12.0 11.5 11.6 11.0 10.3 10.8 10.0 8.0 10.0
Men 100.0 100.0 100.0 100.0 100.0 100.0 100.0 100.0 100.0 100.0 100.0 100.0 100.0 100.0 100.0 100.0 100.0 100.0 100.0 100.0 100.0 100.0 100.0
Wage and salary workers 46.7 47.1 50.1 50.5 50.1 50.7 50.1 49.3 50.6 52.8 50.9 51.5 52.7 52.9 54.1 55.4 56.5 58.8 60.0 59.7 60.8 63.9 60.8
Employers 4.2 4.5 4.3 4.3 6.1 6.1 6.9 7.3 6.8 6.6 6.0 5.6 5.4 5.3 5.2 4.9 4.5 4.4 4.2 4.0 3.9 4.1 3.9
Self-employed 37.8 37.2 35.8 35.3 33.6 33.8 33.0 33.3 33.4 32.5 34.4 33.8 33.0 32.8 32.0 31.4 30.7 28.9 28.5 28.7 28.0 26.6 28.0
Unpaid family workers 11.3 11.2 9.8 9.8 10.2 9.4 10.0 10.1 9.2 8.1 8.7 9.1 8.9 9.0 8.8 8.4 8.3 7.9 7.4 7.7 7.2 5.4 7.2
Women 100.0 100.0 100.0 100.0 100.0 100.0 100.0 100.0 100.0 100.0 100.0 100.0 100.0 100.0 100.0 100.0 100.0 100.0 100.0 100.0 100.0 100.0 100.0
Wage and salary workers 45.4 45.5 48.4 48.8 48.8 50.8 48.6 47.9 49.3 51.0 49.9 50.4 51.3 51.4 52.0 53.1 53.3 54.6 55.8 55.3 56.9 58.0 56.9
Employers 2.3 2.2 2.4 2.4 2.7 2.6 2.8 2.8 2.7 2.6 2.5 2.5 2.5 2.4 2.5 2.3 2.2 2.3 2.0 1.9 1.9 2.1 1.9
Self-employed 31.4 29.5 28.9 30.1 29.2 29.9 30.9 31.0 30.7 30.2 30.1 29.8 29.1 28.8 28.4 28.2 27.8 27.2 27.3 27.3 27.0 27.9 27.0
Unpaid family workers 20.9 22.8 20.3 18.7 19.2 16.8 17.7 18.3 17.3 16.1 17.5 17.4 17.0 17.4 17.2 16.4 16.7 15.9 14.9 15.5 14.2 12.0 14.2

Table 2. Employment opportunities
Decent Work Indicator 1995 1996 1997 1998 1999 2000 2001 2002 2003 2004 2005 2006 2007 2008 2009 2010 2011 2012 2013 2014 2015 2016 2017
Proportion of self-employed
and unpaid family workers
in total employment1/4
, in % 50.3 49.8 46.9 46.5 45.6 44.5 45.2 45.7 44.6 42.8 44.8 44.5 43.6 43.5 42.6 41.7 41.1 39.3 38.3 38.9 37.6 35.1 37.6
Men 49.1 48.4 45.6 45.1 43.8 43.2 43.0 43.4 42.6 40.7 43.1 42.9 41.9 41.8 40.7 39.8 39.0 36.8 35.8 36.3 35.2 32.0 35.2
Women 52.3 52.3 49.2 48.8 48.5 46.7 48.6 49.3 48.0 46.4 47.6 47.2 46.1 46.1 45.6 44.6 44.5 43.1 42.1 42.8 41.2 39.9 41.260.6
Agriculture 74.0 74.5 73.4 72.6 68.7 67.1 66.9 67.0 66.6 64.7 68.2 67.9 67.2 67.0 66.4 65.6 64.0 62.3 61.4 64.0 63.1 60.6 63.1
Industry 20.7 18.7 17.1 17.7 17.7 18.5 18.4 18.6 18.1 17.0 17.6 17.5 16.6 16.4 16.7 15.8 15.8 14.3 12.9 12.3 11.6 9.5 11.6
Services 36.6 36.4 34.8 35.4 35.6 35.6 37.1 38.0 36.6 34.9 36.2 35.9 35.1 34.8 34.0 33.8 33.9 32.5 32.2 32.5 31.7 30.7 31.7
Share of wage employment
in non-agricultural employment,
in % 65.5 66.1 67.8 66.9 66.4 66.3 65.0 64.0 65.4 66.9 65.7 66.0 66.7 66.8 67.2 67.9 67.9 69.4 70.1 70.3 71.1 84.3 71.1
Men 72.3 72.6 73.8 72.7 72.1 71.5 71.1 69.8 70.9 72.6 71.0 71.0 71.6 71.8 72.3 72.8 73.1 74.9 75.6 75.9 76.3 95.6 76.3
Women 57.2 58.0 60.2 59.6 59.5 59.9 57.9 57.4 58.8 60.1 59.5 60.1 60.9 61.0 61.3 62.1 61.8 62.8 63.6 63.6 64.8 70.1 64.8
Wage and salary workers in
non-agricultural employment,
% distribution 100.0 100.0 100.0 100.0 100.0 100.0 100.0 100.0 100.0 100.0 100.0 100.0 100.0 100.0 100.0 100.0 100.0 100.0 100.0 100.0 100.0 100.0 100.0
Men 60.6 61.0 60.9 60.4 59.6 59.1 58.8 58.1 58.7 59.3 58.6 58.1 58.1 58.3 58.1 58.1 58.2 58.6 58.8 59.0 58.7 63.3 58.7
Women1
39.4 39.0 39.1 39.6 40.4 40.9 41.2 41.9 41.3 40.7 41.4 42.0 41.9 41.7 41.9 42.0 41.8 41.4 41.2 41.0 41.3 36.7 41.3
Note: 1. Annualized data for 2014 from the Labor Force Survey is the average of estimates for April, July and October survey rounds. The estimates for these rounds exclude data
of Leyte province only while that of January exclude Region VIII. 2. Annualized data for 2015 from the Labor Force Survey is the average of estimates for January, April, July and October survey rounds. The estimates for these rounds exclude data of Leyte province only.1
MDG indicator on employment.2
Definition of unemployment revised beginning April 2005 to include availability criterion in conformance with international standard. Thus, data series
beginning 2005 not strictly comparable with previous. 2005 data refer to averages of the estimates for April, July and October.3
LFS began collecting data on school attendance for ages 5-24 years in April 2005 survey round. 4
The MDG indicator on employment "proportion of own-account workers and contributing family workers in total employment" was changed to "proportion
of self-employed and unpaid family workers in total employment" in order to use national terminology. The computation conforms to the international standards.a
Included in tertiary education.
* Less than half the unit used.
Source: Philippine Statistics Authority, Labor Force Survey.
Date updated:09/21/2016

Table 2. Employment opportunities
Decent Work Indicator and
Underlying Data1995 1996 1997 1998 1999 2000 2001 2002 2003 2004 2005 2006 2007 2008 2009 2010 2011 2012 2013 2014 2015 2016 2017
Employment-to-population
ratio (%) 59.5 61.0 59.0 57.9 58.7 56.5 59.6 59.7 59.1 59.5 59.4 59.1 59.3 58.9 59.2 59.3 60.1 59.7 59.4 60.4 59.7 60.0 57.7
Men 75.7 77.0 74.7 73.2 73.2 70.9 73.5 72.9 73.2 74.2 73.4 72.7 72.9 72.8 72.6 72.5 73.3 72.8 72.4 73.2 72.2 73.2 71.6
Women 43.3 44.9 43.5 42.8 44.2 42.1 45.8 46.6 45.2 44.9 45.5 45.6 45.9 45.2 45.9 46.3 47.0 46.7 46.5 47.6 47.2 46.8 43.8
15-24 years old 42.2 43.9 42.2 40.2 40.6 37.6 40.2 39.6 39.1 39.7 39.3 38.5 38.4 37.4 37.6 37.4 39.1 38.7 38.0 39.1 37.2 36.9 34.4
25-54 71.5 72.8 70.1 69.3 70.3 68.6 72.6 73.0 72.3 72.0 72.0 72.2 72.6 72.5 72.8 73.0 73.4 73.2 73.0 74.0 73.8 74.4 72.5
55+a
54.0 54.8 53.4 52.8 53.2 51.6 53.7 54.0 53.4 53.7 53.6 53.0 53.4 52.9 53.3 53.6 53.8 52.9 52.6 53.3 53.3 53.3 49.5
Total employed (000) 25677 27186 26365 26631 27742 27452 29156 30062 30635 31613 32313 32636 33560 34089 35061 36035 37192 37600 38118 38651 38741 40998 40334
Men 16322 17170 16610 16714 17253 17193 17923 18306 18873 19646 19910 20013 20542 20959 21404 21921 22573 22849 23150 23365 23406 25035 25067
Women 9354 10016 9754 9917 10489 10259 11232 11756 11762 11968 12403 12622 13018 13129 13657 14114 14619 14751 14968 15286 15335 15963 15267
15-24 years old 5679 6129 5760 5602 5714 5524 5992 6027 6154 6387 6430 6532 6628 6579 6731 6816 7258 7322 7335 7508 7255 7265 6780
25-54 16218 17269 17027 17234 17991 17887 18782 19424 20025 20970 21472 21889 22515 22962 23568 24233 24829 25174 25602 25905 26182 27500 27492
55+a
3779 3789 3577 3795 4036 4040 4382 4611 4456 4257 4411 4215 4418 4547 4762 4985 5106 5105 5180 5238 5305 6232 6062
Total working age population
(000) 43156 44599 44658 45964 47270 48587 48929 50344 51793 53144 54388 55230 56565 57848 59237 60717 61882 62985 64173 64033 64936 68311 69891
Men 21565 22307 22232 22818 23568 24245 24396 25108 25799 26485 27111 27521 28184 28784 29464 30223 30805 31369 31974 31905 32417 34184 35004
Women 21591 22292 22426 23147 23704 24342 24532 25237 25994 26660 27277 27708 28381 29064 29773 30493 31076 31616 32199 32128 32519 34127 34887
15-24 years old 13473 13969 13663 13927 14084 14687 14908 15203 15738 16088 16344 16967 17275 17594 17910 18220 18576 18928 19285 19223 19522 19669 19734
25-54 22680 23712 24291 24855 25600 26078 25861 26597 27706 29129 29814 30303 31023 31664 32393 33201 33820 34403 35048 34991 35453 36940 37907
55+a
7003 6918 6704 7184 7586 7822 8160 8545 8350 7926 8230 7960 8268 8590 8935 9295 9486 9655 9840 9819 9962 11701 12250
Notes:
1. Annualized data for 2014 from the Labor Force Survey is the average of estimates for April, July and October survey rounds. The estimates for these rounds exclude data of Leyte province only while that of January exclude Region VIII.
2. Annualized data for 2015 from the Labor Force Survey is the average of estimates for January, April, July and October survey rounds. The estimates for these rounds exclude data of Leyte province only.
3. Starting April 2016 round, the Labor Force Survey adopted the 2013 Master Sample Design as well as the population projections based on the 2010 Census of Population and Housing (2010 CPH)
while previous survey rounds were derived using the 2000 CPH population projections.
4. Annualized data for 2016 from the Labor Force Survey is the average of the four survey rounds using the January 2016 that were based on the 2010 CPH population projections.
5. See Metadata of Statistical Indicators on Decent Work for definitions and other information.
a Includes persons with age not reported.
Source: Philippine Statistics Authority, Labor Force Survey.
Employment-to-population ratio

Table 2. Employment opportunities
Decent Work Indicator and
Underlying Data1995 1996 1997 1998 1999 2000 2001 2002 2003 2004 2005 2006 2007 2008 2009 2010 2011 2012 2013 2014 2015 2016 2017
Unemployment rate1 (%) 9.5 8.6 8.8 10.3 9.8 11.2 11.1 11.4 11.4 11.8 7.8 8.0 7.3 7.4 7.5 7.4 7.0 7.0 7.1 6.6 6.3 5.4 5.7
Men 8.9 7.9 8.2 9.8 9.7 10.9 10.8 11.1 11.0 11.5 7.8 8.2 7.5 7.6 7.6 7.6 7.3 7.2 7.3 6.9 6.6 5.6 6.0
Women 10.7 9.7 9.8 11.0 10.0 11.6 11.6 11.8 11.9 12.4 7.8 7.6 7.0 7.1 7.2 6.9 6.6 6.7 6.8 6.1 5.8 5.2 5.2
15-24 years old 19.8 17.7 18.3 21.4 21.0 24.2 23.3 24.2 23.2 23.9 17.2 17.8 16.8 17.4 17.6 17.6 16.3 16.2 16.1 15.3 15 13.5 14.4
25 and over 6.1 5.5 5.7 6.7 6.4 7.2 7.3 7.5 7.8 8.2 5.1 5.1 4.7 4.6 4.7 4.6 4.5 4.5 4.6 4.2 4 3.5 3.7
25-54 6.3 5.6 5.8 6.8 6.5 7.4 7.6 7.8 8.0 8.1 5.6 5.7 5.1 5.1 5.2 5.1 4.9 4.9 5.1 4.7 4.5 3.9 4.1
55+a
5.4 5.2 5.5 6.3 5.5 6.0 6.4 6.3 7.1 8.2 2.3 2.3 2.3 2.2 2.2 2.1 2.0 2.2 2.3 1.9 1.7 1.7 2.1
Total unemployed1
(000) 2704 2546 2537 3043 3017 3459 3653 3874 3936 4249 2748 2829 2653 2716 2831 2859 2814 2826 2905 2728 2602 2363 2441
Men 1585 1464 1474 1819 1852 2113 2174 2295 2343 2558 1685 1798 1675 1714 1770 1808 1772 1767 1818 1728 1656 1486 1601
Women 1118 1082 1062 1223 1165 1346 1478 1579 1592 1692 1062 1031 978 1002 1062 1051 1041 1059 1087 1000 945 877 840
15-24 years old 1405 1321 1292 1527 1520 1766 1819 1919 1861 2009 1353 1415 1335 1389 1437 1460 1417 1412 1409 1351 1276 1137 1139
25 and over 1299 1225 1246 1516 1497 1694 1834 1954 2074 2239 1395 1414 1317 1327 1393 1399 1395 1413 1495 1377 1326 1226 1302
25-54 1084 1019 1039 1262 1260 1438 1535 1643 1731 1859 1291 1314 1213 1223 1284 1293 1289 1296 1375 1275 1233 1119 1172
55+a
215 206 207 254 237 256 299 311 343 380 104 100 104 104 109 106 106 117 120 102 92 108 130
Total labor force1 (000) 28380 29733 28901 29674 30759 30911 32809 33936 34571 35862 35286 35464 36213 36805 37892 38893 40006 40426 41022 41379 41342 43361 42775
Men 17907 18634 18085 18533 19104 19307 20098 20601 21216 22204 21646 21811 22217 22673 23173 23729 24345 24616 24968 25093 25062 26521 26667
Women 10473 11098 10817 11141 11654 11605 12711 13335 13354 13659 13641 13653 13995 14132 14719 15164 15660 15810 16055 16286 16280 16840 16107
15-24 years old 7084 7450 7051 7129 7234 7290 7811 7946 8015 8396 7851 7947 7962 7968 8168 8276 8675 8734 8744 8859 8531 8402 7919
25 and over 21296 22283 21850 22545 23524 23621 24998 25989 26555 27466 27433 27518 28250 28836 29723 30617 31330 31694 32277 32520 32812 34959 34856
25-54 17302 18288 18066 18496 19251 19325 20317 21067 21756 22829 22886 23203 23728 24185 24852 25526 26118 26471 26977 27180 27415 28619 28664
55+a
3994 3995 3784 4049 4273 4296 4681 4922 4799 4637 4547 4315 4522 4651 4871 5091 5212 5223 5300 5340 5397 6340 6192
Notes:
1. Annualized data for 2014 from the Labor Force Survey is the average of estimates for April, July and October survey rounds. The estimates for these rounds exclude data of Leyte province only while that of January exclude Region VIII.
2. Annualized data for 2015 from the Labor Force Survey is the average of estimates for January, April, July and October survey rounds. The estimates for these rounds exclude data of Leyte province only.
3. Starting April 2016 round, the Labor Force Survey adopted the 2013 Master Sample Design as well as the population projections based on the 2010 Census of Population and Housing (2010 CPH)
while previous survey rounds were derived using the 2000 CPH population projections.
4. Annualized data for 2016 from the Labor Force Survey is the average of the four survey rounds using the January 2016 that were based on the 2010 CPH population projections.
5. See Metadata of Statistical Indicators on Decent Work for definitions and other information.
1 Definition of unemployment revised beginning April 2005 to include availability criterion in conformance with international standard. Thus, data series beginning 2005 not strictly comparable
with previous. 2005 data refer to averages of the estimates for April, July and October.
a Includes persons with age not reported.
Source: Philippine Statistics Authority, Labor Force Survey.
Unemployment rate

Table 2. Employment opportunities
Decent Work Indicator and
Underlying Data1995 1996 1997 1998 1999 2000 2001 2002 2003 2004 2005 2006 2007 2008 2009 2010 2011 2012 2013 2014 2015 2016 2017
Youth not in education and not
in employment (15-24 years), %
of youth population .. .. .. .. .. .. .. .. .. .. .. 24.5 24.9 24.6 24.7 25.2 24.3 24.8 24.2 23.1 22.7 22.1 21.7
Men .. .. .. .. .. .. .. .. .. .. .. 18.0 18.4 17.8 18.0 18.7 17.4 17.7 17.5 16.5 17.1 15.4 15.2
Women .. .. .. .. .. .. .. .. .. .. .. 31.2 31.5 31.7 31.6 31.9 31.4 32.1 31.1 29.9 28.6 29.2 28.5
Total youth not in education
and not in employment (000) .. .. .. .. .. .. .. .. .. .. .. 4162 4295 4333 4425 4591 4514 4690 4669 4435 4439 4354 4274
Men .. .. .. .. .. .. .. .. .. .. .. 1545 1614 1590 1641 1738 1648 1706 1722 1609 1695 1558 1545
Women .. .. .. .. .. .. .. .. .. .. .. 2617 2681 2743 2784 2853 2866 2983 2947 2826 2744 2796 2729
Total youth household
population (000) 13473 13969 13663 13927 14084 14687 14908 15203 15738 16088 16344 16967 17275 17594 17910 18220 18576 18928 19285 19223 19522 19669 19734
Men 7103 7292 6996 7137 7330 7706 7866 8020 8207 8189 8333 8591 8758 8933 9105 9280 9459 9634 9812 9777 9938 10089 10143
Women 6370 6678 6666 6790 6755 6982 7042 7182 7532 7899 8011 8376 8517 8662 8805 8940 9118 9293 9473 9445 9584 9580 9591
Notes:
1. Annualized data for 2014 from the Labor Force Survey is the average of estimates for April, July and October survey rounds. The estimates for these rounds exclude data of Leyte province only while that of January exclude Region VIII.
2. Annualized data for 2015 from the Labor Force Survey is the average of estimates for January, April, July and October survey rounds. The estimates for these rounds exclude data of Leyte province only.
3. Starting April 2016 round, the Labor Force Survey adopted the 2013 Master Sample Design as well as the population projections based on the 2010 Census of Population and Housing (2010 CPH)
while previous survey rounds were derived using the 2000 CPH population projections.
4. Annualized data for 2016 from the Labor Force Survey is the average of the four survey rounds using the January 2016 that were based on the 2010 CPH population projections.
5. See Metadata of Statistical Indicators on Decent Work for definitions and other information.
Source: Philippine Statistics Authority, Labor Force Survey.
Youth not in education and not in employment, 15-24 years, % of youth population
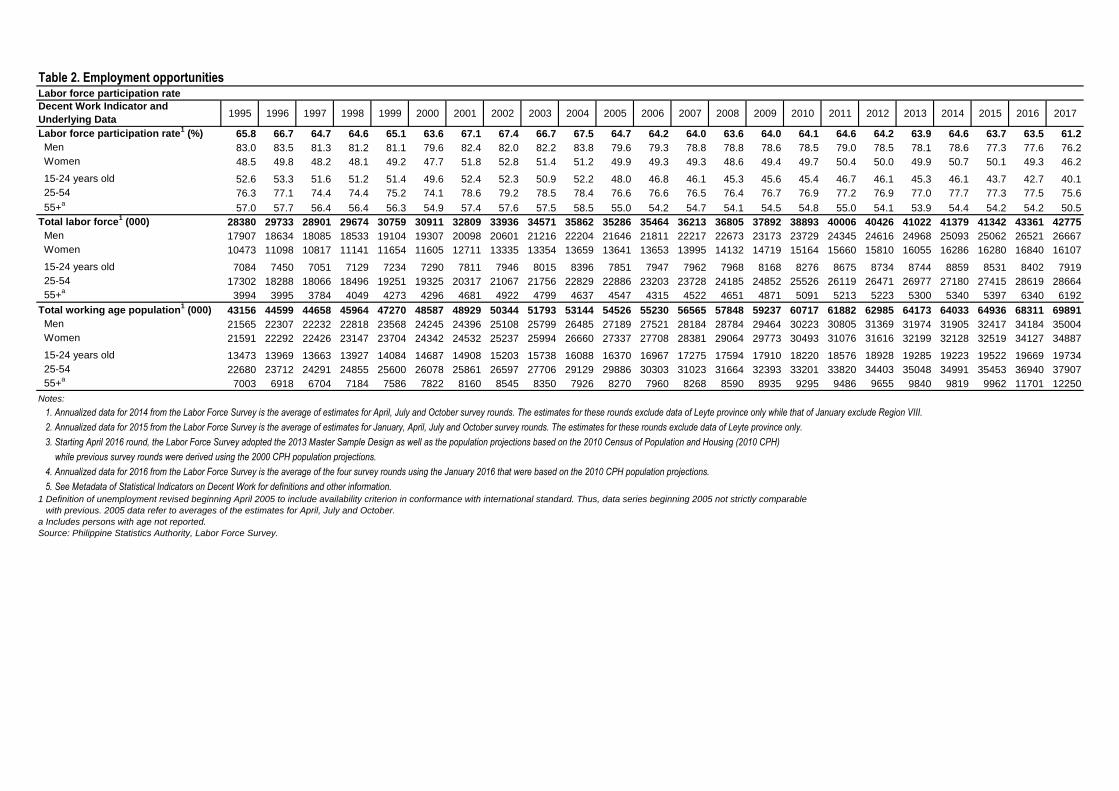
Table 2. Employment opportunities
Decent Work Indicator and
Underlying Data1995 1996 1997 1998 1999 2000 2001 2002 2003 2004 2005 2006 2007 2008 2009 2010 2011 2012 2013 2014 2015 2016 2017
Labor force participation rate1 (%) 65.8 66.7 64.7 64.6 65.1 63.6 67.1 67.4 66.7 67.5 64.7 64.2 64.0 63.6 64.0 64.1 64.6 64.2 63.9 64.6 63.7 63.5 61.2
Men 83.0 83.5 81.3 81.2 81.1 79.6 82.4 82.0 82.2 83.8 79.6 79.3 78.8 78.8 78.6 78.5 79.0 78.5 78.1 78.6 77.3 77.6 76.2
Women 48.5 49.8 48.2 48.1 49.2 47.7 51.8 52.8 51.4 51.2 49.9 49.3 49.3 48.6 49.4 49.7 50.4 50.0 49.9 50.7 50.1 49.3 46.2
15-24 years old 52.6 53.3 51.6 51.2 51.4 49.6 52.4 52.3 50.9 52.2 48.0 46.8 46.1 45.3 45.6 45.4 46.7 46.1 45.3 46.1 43.7 42.7 40.1
25-54 76.3 77.1 74.4 74.4 75.2 74.1 78.6 79.2 78.5 78.4 76.6 76.6 76.5 76.4 76.7 76.9 77.2 76.9 77.0 77.7 77.3 77.5 75.6
55+a
57.0 57.7 56.4 56.4 56.3 54.9 57.4 57.6 57.5 58.5 55.0 54.2 54.7 54.1 54.5 54.8 55.0 54.1 53.9 54.4 54.2 54.2 50.5
Total labor force1 (000) 28380 29733 28901 29674 30759 30911 32809 33936 34571 35862 35286 35464 36213 36805 37892 38893 40006 40426 41022 41379 41342 43361 42775
Men 17907 18634 18085 18533 19104 19307 20098 20601 21216 22204 21646 21811 22217 22673 23173 23729 24345 24616 24968 25093 25062 26521 26667
Women 10473 11098 10817 11141 11654 11605 12711 13335 13354 13659 13641 13653 13995 14132 14719 15164 15660 15810 16055 16286 16280 16840 16107
15-24 years old 7084 7450 7051 7129 7234 7290 7811 7946 8015 8396 7851 7947 7962 7968 8168 8276 8675 8734 8744 8859 8531 8402 7919
25-54 17302 18288 18066 18496 19251 19325 20317 21067 21756 22829 22886 23203 23728 24185 24852 25526 26119 26471 26977 27180 27415 28619 28664
55+a
3994 3995 3784 4049 4273 4296 4681 4922 4799 4637 4547 4315 4522 4651 4871 5091 5213 5223 5300 5340 5397 6340 6192
Total working age population1 (000) 43156 44599 44658 45964 47270 48587 48929 50344 51793 53144 54526 55230 56565 57848 59237 60717 61882 62985 64173 64033 64936 68311 69891
Men 21565 22307 22232 22818 23568 24245 24396 25108 25799 26485 27189 27521 28184 28784 29464 30223 30805 31369 31974 31905 32417 34184 35004
Women 21591 22292 22426 23147 23704 24342 24532 25237 25994 26660 27337 27708 28381 29064 29773 30493 31076 31616 32199 32128 32519 34127 34887
15-24 years old 13473 13969 13663 13927 14084 14687 14908 15203 15738 16088 16370 16967 17275 17594 17910 18220 18576 18928 19285 19223 19522 19669 19734
25-54 22680 23712 24291 24855 25600 26078 25861 26597 27706 29129 29886 30303 31023 31664 32393 33201 33820 34403 35048 34991 35453 36940 37907
55+a
7003 6918 6704 7184 7586 7822 8160 8545 8350 7926 8270 7960 8268 8590 8935 9295 9486 9655 9840 9819 9962 11701 12250
Notes:
1. Annualized data for 2014 from the Labor Force Survey is the average of estimates for April, July and October survey rounds. The estimates for these rounds exclude data of Leyte province only while that of January exclude Region VIII.
2. Annualized data for 2015 from the Labor Force Survey is the average of estimates for January, April, July and October survey rounds. The estimates for these rounds exclude data of Leyte province only.
3. Starting April 2016 round, the Labor Force Survey adopted the 2013 Master Sample Design as well as the population projections based on the 2010 Census of Population and Housing (2010 CPH)
while previous survey rounds were derived using the 2000 CPH population projections.
4. Annualized data for 2016 from the Labor Force Survey is the average of the four survey rounds using the January 2016 that were based on the 2010 CPH population projections.
5. See Metadata of Statistical Indicators on Decent Work for definitions and other information.
1 Definition of unemployment revised beginning April 2005 to include availability criterion in conformance with international standard. Thus, data series beginning 2005 not strictly comparable
with previous. 2005 data refer to averages of the estimates for April, July and October.
a Includes persons with age not reported.
Source: Philippine Statistics Authority, Labor Force Survey.
Labor force participation rate

Table 2. Employment opportunities
Decent Work Indicator and
Underlying Data1995 1996 1997 1998 1999 2000 2001 2002 2003 2004 2005 2006 2007 2008 2009 2010 2011 2012 2013 2014 2015 2016 2017
Labor force participation rate1 (%) 65.8 66.7 64.7 64.6 65.1 63.6 67.1 67.4 66.7 67.5 64.7 64.2 64.0 63.6 64.0 64.1 64.6 64.2 63.9 64.6 63.7 63.5 61.2
Men 83.0 83.5 81.3 81.2 81.1 79.6 82.4 82.0 82.2 83.8 79.6 79.3 78.8 78.8 78.6 78.5 79.0 78.5 78.1 78.6 77.3 77.6 76.2
Women 48.5 49.8 48.2 48.1 49.2 47.7 51.8 52.8 51.4 51.2 49.9 49.3 49.3 48.6 49.4 49.7 50.4 50.0 49.9 50.7 50.1 49.3 46.2
Labor force participation gap1
34.5 33.7 33.1 33.1 31.9 31.9 30.6 29.2 30.8 32.6 29.7 30.0 29.5 30.2 29.2 28.8 28.6 28.5 28.2 27.9 27.2 28.3 30.0
Notes:
1. Annualized data for 2014 from the Labor Force Survey is the average of estimates for April, July and October survey rounds. The estimates for these rounds exclude data of Leyte province only while that of January exclude Region VIII.
2. Annualized data for 2015 from the Labor Force Survey is the average of estimates for January, April, July and October survey rounds. The estimates for these rounds exclude data of Leyte province only.
3. Starting April 2016 round, the Labor Force Survey adopted the 2013 Master Sample Design as well as the population projections based on the 2010 Census of Population and Housing (2010 CPH)
while previous survey rounds were derived using the 2000 CPH population projections.
4. Annualized data for 2016 from the Labor Force Survey is the average of the four survey rounds using the January 2016 that were based on the 2010 CPH population projections.
5. See Metadata of Statistical Indicators on Decent Work for definitions and other information.
1 Definition of unemployment revised beginning April 2005 to include availability criterion in conformance with international standard. Thus, data series beginning 2005 not strictly comparable
with previous. 2005 data refer to averages of the estimates for April, July and October.
Source: Philippine Statistics Authority, Labor Force Survey.
Labor force participation gap

Table 2. Employment opportunities
Decent Work Indicator and
Underlying Data1995 1996 1997 1998 1999 2000 2001 2002 2003 2004 2005 2006 2007 2008 2009 2010 2011 2012 2013 2014 2015 2016 2017
Youth unemployment rate,
15-24 years1
(%) 19.8 17.7 18.3 21.4 21.0 24.2 23.3 24.2 23.2 23.9 17.2 17.8 16.8 17.4 17.6 17.6 16.3 16.2 16.1 15.3 15.0 13.5 14.4
Men 17.5 15.4 16.4 19.5 19.1 22.1 20.8 21.8 20.8 21.6 15.8 16.8 15.7 16.2 16.2 16.5 15.2 14.9 15.1 14.3 14.3 12.7 13.7
Women 24.0 21.7 21.5 24.7 24.4 27.9 27.4 28.0 27.2 27.8 19.5 19.4 18.4 19.4 19.8 19.5 18.3 18.3 17.8 16.9 16.0 14.9 15.6
Total unemployed youth1 1405 1321 1292 1527 1520 1766 1819 1919 1861 2009 1353 1415 1335 1389 1437 1460 1417 1412 1409 1351 1276 1137 1139
Men 795 725 729 877 878 1018 1019 1081 1043 1127 767 826 777 808 823 846 819 809 825 789 760 674 695
Women 610 596 562 649 642 748 801 838 819 882 585 588 558 580 614 613 599 603 584 562 516 463 445
Total youth labor force1 (000) 7084 7450 7051 7129 7234 7290 7811 7946 8015 8396 7851 7947 7962 7968 8168 8276 8675 8734 8744 8859 8531 8402 7919
Men 4546 4704 4440 4498 4607 4605 4888 4952 5007 5217 4857 4923 4936 4983 5073 5132 5399 5431 5465 5527 5297 5301 5070
Women 2538 2746 2611 2630 2627 2685 2923 2993 3010 3178 2994 3025 3026 2985 3095 3144 3276 3303 3279 3333 3233 3101 2848
Notes:
1. Annualized data for 2014 from the Labor Force Survey is the average of estimates for April, July and October survey rounds. The estimates for these rounds exclude data of Leyte province only while that of January exclude Region VIII.
2. Annualized data for 2015 from the Labor Force Survey is the average of estimates for January, April, July and October survey rounds. The estimates for these rounds exclude data of Leyte province only.
3. Starting April 2016 round, the Labor Force Survey adopted the 2013 Master Sample Design as well as the population projections based on the 2010 Census of Population and Housing (2010 CPH)
while previous survey rounds were derived using the 2000 CPH population projections.
4. Annualized data for 2016 from the Labor Force Survey is the average of the four survey rounds using the January 2016 that were based on the 2010 CPH population projections.
5. See Metadata of Statistical Indicators on Decent Work for definitions and other information.
1 Definition of unemployment revised beginning April 2005 to include availability criterion in conformance with international standard. Thus, data series beginning 2005 not strictly comparable
with previous. 2005 data refer to averages of the estimates for April, July and October.
Source: Philippine Statistics Authority, Labor Force Survey.
Youth unemployment rate, 15-24 years

Table 2. Employment opportunities
Decent Work Indicator and
Underlying Data1995 1996 1997 1998 1999 2000 2001 2002 2003 2004 2005 2006 2007 2008 2009 2010 2011 2012 2013 2014 2015 2016 2017
Unemployment by level of
education1, % distribution 100.0 100.0 100.0 100.0 100.0 100.0 100.0 100.0 100.0 100.0 100.0 100.0 100.0 100.0 100.0 100.0 100.0 100.0 100.0 100.0 100.0 100.0 100.0
No schooling 2.0 2.2 2.1 2.2 1.8 1.9 2.0 1.9 2.0 2.4 0.7 0.7 0.7 0.5 0.5 0.5 0.4 0.5 0.5 0.4 0.3 0.7 0.7
Primary 23.3 23.4 23.5 24.1 21.7 21.8 21.3 20.6 20.9 20.7 15.2 15.2 15.1 14.0 13.3 13.1 12.6 13.2 13.0 11.8 12.1 12.9 13.4
Secondary 42.6 42.2 42.6 42.4 42.7 42.3 43.2 42.8 42.2 43.0 44.5 45.7 46.1 45.5 45.2 45.2 45.1 45.1 44.4 43.4 44.6 42.8 43.8
Post secondary a a a a a a a a a a a a a a a a a 8.2 8.0 8.2 8.1 8.5 8.3
Tertiary 31.6 31.6 31.1 30.6 33.0 32.9 33.5 34.7 34.9 34.0 39.5 38.5 38.2 40.0 41.1 41.2 42.0 32.9 34.1 36.2 34.9 35.2 33.8
Not reported 0.4 0.6 0.7 0.8 0.8 1.1 0.0 * * 0.0 0.0 0.0 0.0 0.0 0.0 0.0 0.0 0.0 0.0 0.0 0.0 0.0 0.0
Men 100.0 100.0 100.0 100.0 100.0 100.0 100.0 100.0 100.0 100.0 100.0 100.0 100.0 100.0 100.0 100.0 100.0 100.0 100.0 100.0 100.0 100.0 100.0
No schooling 1.8 2.0 1.9 1.8 1.5 1.6 1.6 1.5 1.7 2.0 0.6 0.6 0.7 0.6 0.4 0.6 0.4 0.5 0.6 0.5 0.4 0.7 0.7
Primary 24.3 24.6 24.6 25.3 23.1 23.4 22.4 22.0 22.3 22.4 17.3 17.6 17.6 16.6 16.2 15.9 14.9 15.6 15.5 14.2 14.6 15.3 15.9
Secondary 45.0 43.6 44.4 44.3 44.1 43.8 46.0 45.5 44.0 43.9 45.7 46.4 46.8 46.8 46.7 46.7 46.5 46.2 45.7 45.5 46.7 44.1 46.1
Post secondary a a a a a a a a a a a a a a a a a 8.0 7.6 7.9 7.5 8.0 7.5
Tertiary 28.5 29.0 28.3 27.6 30.5 30.1 30.0 31.0 32.0 31.7 36.4 35.3 35.0 36.1 36.8 36.8 38.2 29.7 30.6 32.0 30.9 31.9 29.9
Not reported 0.6 0.8 0.8 0.9 0.9 1.2 0.0 * * 0.0 0.0 0.0 0.0 0.0 0.0 0.1 0.0 0.0 0.0 0.0 0.0 0.0 0.0
Women 100.0 100.0 100.0 100.0 100.0 100.0 100.0 100.0 100.0 100.0 100.0 100.0 100.0 100.0 100.0 100.0 100.0 100.0 100.0 100.0 100.0 100.0 100.0
No schooling 2.3 2.4 2.4 2.6 2.2 2.5 2.6 2.5 2.3 2.8 0.9 0.7 0.7 0.4 0.6 0.4 0.4 0.5 0.4 0.3 0.3 0.7 0.6
Primary 22.1 21.8 22.0 22.2 19.5 19.5 19.7 18.6 18.9 18.0 11.9 10.9 10.9 9.6 8.6 8.3 8.6 9.3 8.9 7.8 7.7 8.8 8.6
Secondary 39.4 40.4 40.3 39.7 40.7 39.9 39.2 38.9 39.5 41.5 42.7 44.4 44.7 43.5 42.8 42.6 42.7 43.3 42.1 39.7 41.1 40.5 39.6
Post secondary a a a a a a a a a a a a a a a a a 8.7 8.6 8.8 9.0 9.2 9.9
Tertiary 36.0 35.0 34.8 35.0 36.9 37.4 38.6 40.0 39.3 37.6 44.6 43.9 43.7 46.6 48.2 48.7 48.4 38.3 39.9 43.5 42.0 40.7 41.3
Not reported 0.2 0.4 0.5 0.5 0.7 0.9 0.0 0.0 0.0 0.0 0.0 0.0 0.0 0.0 0.0 0.1 0.0 0.0 0.0 0.0 0.0 0.0 0.0
Total unemployed by level of
education1
(000) 2704 2546 2537 3043 3017 3459 3653 3874 3936 4249 2748 2829 2653 2716 2831 2859 2814 2826 2905 2728 2602 2363 2441
No schooling 55 55 53 66 53 66 73 73 78 100 20 19 18 14 13 14 11 14 15 10 9 16 16
Primary 631 596 596 732 656 755 777 799 824 879 418 429 401 380 377 374 354 373 379 322 314 305 326
Secondary 1152 1075 1082 1291 1289 1463 1579 1659 1660 1826 1223 1293 1222 1237 1280 1293 1268 1275 1289 1183 1161 1011 1070
Post secondary a a a a a a a a a a a a a a a a a 233 231 224 210 200 203
Tertiary 854 804 788 930 996 1139 1223 1343 1373 1446 1086 1089 1013 1086 1163 1178 1181 931 991 988 908 831 825
Not reported 11 16 17 24 25 38 0 * * 0 0 0 0 0 0 0 0 0 0 0 0 0 0
Men 1585 1464 1474 1819 1852 2113 2174 2295 2343 2558 1685 1798 1675 1714 1770 1808 1772 1767 1818 1728 1656 1486 1601
No schooling 28 29 28 33 27 33 35 35 41 52 10 11 12 11 7 10 7 9 10 8 7 10 11
Primary 385 360 363 461 427 494 487 506 523 574 292 317 294 284 287 287 264 275 282 245 241 227 255
Secondary 713 638 654 805 816 925 1000 1045 1031 1122 770 835 784 802 827 845 824 816 831 786 773 656 738
Post secondary a a a a a a a a a a a a a a a a a 141 138 136 125 119 120
Tertiary 451 425 417 502 565 636 653 712 750 810 613 635 586 619 651 666 677 525 557 553 512 474 478
Not reported 9 11 12 17 17 26 0 * * 0 0 0 0 0 0 1 0 0 0 0 0 0 0
Unemployment by level of education

Table 2. Employment opportunities
Decent Work Indicator and
Underlying Data1995 1996 1997 1998 1999 2000 2001 2002 2003 2004 2005 2006 2007 2008 2009 2010 2011 2012 2013 2014 2015 2016 2017
Women 1118 1082 1062 1223 1165 1346 1478 1579 1592 1692 1062 1031 978 1002 1062 1051 1041 1059 1087 1000 945 877 840
No schooling 26 26 26 32 26 33 38 39 37 48 10 7 7 4 6 4 4 5 4 3 3 6 5
Primary 247 236 234 272 227 262 291 294 301 304 126 112 107 96 91 87 90 98 97 78 73 77 72
Secondary 440 437 428 485 474 537 580 615 629 703 453 458 437 436 455 448 444 459 458 397 388 355 333
Post secondary a a a a a a a a a a a a a a a a a 92 93 88 85 81 83
Tertiary 403 379 370 428 430 503 570 631 625 636 474 453 427 467 512 512 504 406 434 435 397 357 347
Not reported 2 4 5 6 8 12 0 0 0 0 0 0 0 0 0 1 0 0 0 0 0 0 0
Notes:
1. Annualized data for 2014 from the Labor Force Survey is the average of estimates for April, July and October survey rounds. The estimates for these rounds exclude data of Leyte province only while that of January exclude Region VIII.
2. Annualized data for 2015 from the Labor Force Survey is the average of estimates for January, April, July and October survey rounds. The estimates for these rounds exclude data of Leyte province only.
3. Starting April 2016 round, the Labor Force Survey adopted the 2013 Master Sample Design as well as the population projections based on the 2010 Census of Population and Housing (2010 CPH)
while previous survey rounds were derived using the 2000 CPH population projections.
4. Annualized data for 2016 from the Labor Force Survey is the average of the four survey rounds using the January 2016 that were based on the 2010 CPH population projections.
5. See Metadata of Statistical Indicators on Decent Work for definitions and other information.
1 Definition of unemployment revised beginning April 2005 to include availability criterion in conformance with international standard. Thus, data series beginning 2005 not strictly comparable
with previous. 2005 data refer to averages of the estimates for April, July and October.
a Included in tertiary education.
* Less than half the unit used.
Source: Philippine Statistics Authority, Labor Force Survey.
Unemployment by level of education

Table 2. Employment opportunities
Decent Work Indicator and
Underlying Data1995 1996 1997 1998 1999 2000 2001 2002 2003 2004 2005 2006 2007 2008 2009 2010 2011 2012 2013 2014 2015 2016 2017
Employment by class of
worker, % distribution 100.0 100.0 100.0 100.0 100.0 100.0 100.0 100.0 100.0 100.0 100.0 100.0 100.0 100.0 100.0 100.0 100.0 100.0 100.0 100.0 100.0 100.0 100.0
Wage and salary workers 46.2 46.5 49.5 49.9 49.6 50.7 49.5 48.7 50.1 52.1 50.5 51.1 52.2 52.4 53.3 54.5 55.2 57.2 58.4 58.0 59.3 61.6 62.5
Employers 3.5 3.7 3.6 3.6 4.8 4.8 5.3 5.5 5.2 5.1 4.7 4.4 4.3 4.2 4.1 3.9 3.6 3.6 3.3 3.1 3.1 3.4 3.7
Self-employed 35.5 34.3 33.3 33.4 32.0 32.3 32.2 32.4 32.4 31.7 32.8 32.2 31.5 31.3 30.6 30.1 29.6 28.3 28.0 28.1 27.6 27.1 27.8
Unpaid family workers 14.8 15.5 13.7 13.1 13.6 12.2 13.0 13.3 12.3 11.2 12.0 12.3 12.1 12.2 12.0 11.5 11.6 11.0 10.3 10.8 10.0 8.0 6.0
Men 100.0 100.0 100.0 100.0 100.0 100.0 100.0 100.0 100.0 100.0 100.0 100.0 100.0 100.0 100.0 100.0 100.0 100.0 100.0 100.0 100.0 100.0 100.0
Wage and salary workers 46.7 47.1 50.1 50.5 50.1 50.7 50.1 49.3 50.6 52.8 50.9 51.5 52.7 52.9 54.1 55.4 56.5 58.8 60.0 59.7 60.8 63.9 64.3
Employers 4.2 4.5 4.3 4.3 6.1 6.1 6.9 7.3 6.8 6.6 6.0 5.6 5.4 5.3 5.2 4.9 4.5 4.4 4.2 4.0 3.9 4.1 4.4
Self-employed 37.8 37.2 35.8 35.3 33.6 33.8 33.0 33.3 33.4 32.5 34.4 33.8 33.0 32.8 32.0 31.4 30.7 28.9 28.5 28.7 28.0 26.6 27.3
Unpaid family workers 11.3 11.2 9.8 9.8 10.2 9.4 10.0 10.1 9.2 8.1 8.7 9.1 8.9 9.0 8.8 8.4 8.3 7.9 7.4 7.7 7.2 5.4 4.0
Women 100.0 100.0 100.0 100.0 100.0 100.0 100.0 100.0 100.0 100.0 100.0 100.0 100.0 100.0 100.0 100.0 100.0 100.0 100.0 100.0 100.0 100.0 100.0
Wage and salary workers 45.4 45.5 48.4 48.8 48.8 50.8 48.6 47.9 49.3 51.0 49.9 50.4 51.3 51.4 52.0 53.1 53.3 54.6 55.8 55.3 56.9 58.0 59.6
Employers 2.3 2.2 2.4 2.4 2.7 2.6 2.8 2.8 2.7 2.6 2.5 2.5 2.5 2.4 2.5 2.3 2.2 2.3 2.0 1.9 1.9 2.1 2.5
Self-employed 31.4 29.5 28.9 30.1 29.2 29.9 30.9 31.0 30.7 30.2 30.1 29.8 29.1 28.8 28.4 28.2 27.8 27.2 27.3 27.3 27.0 27.9 28.6
Unpaid family workers 20.9 22.8 20.3 18.7 19.2 16.8 17.7 18.3 17.3 16.1 17.5 17.4 17.0 17.4 17.2 16.4 16.7 15.9 14.9 15.5 14.2 12.0 9.4
Total employed (000) 25677 27186 26365 26631 27742 27452 29156 30062 30635 31613 32313 32636 33560 34089 35061 36035 37192 37600 38118 38651 38741 40998 40334
Wage and salary workers 11870 12649 13043 13285 13761 13925 14438 14653 15354 16472 16316 16673 17508 17846 18681 19626 20538 21492 22247 22407 22960 25240 25209
Employers 894 996 949 966 1341 1315 1552 1662 1605 1604 1520 1425 1430 1426 1438 1394 1354 1335 1272 1210 1212 1376 1491
Self-employed 9111 9330 8774 8891 8864 8869 9375 9737 9912 10011 10584 10525 10570 10654 10724 10858 10994 10626 10668 10869 10705 11097 11198
Unpaid family workers 3801 4211 3600 3490 3775 3344 3792 4009 3765 3527 3893 4012 4052 4161 4218 4157 4306 4147 3930 4166 3863 3285 2437
Men 16322 17170 16610 16714 17253 17193 17923 18306 18873 19646 19910 20013 20542 20959 21404 21921 22573 22849 23150 23365 23406 25035 25067
Wage and salary workers 7625 8091 8319 8446 8645 8717 8978 9022 9554 10368 10130 10316 10827 11093 11581 12137 12750 13440 13892 13955 14238 15986 16117
Employers 680 777 718 726 1054 1053 1238 1338 1287 1291 1203 1114 1100 1107 1103 1065 1026 999 966 924 922 1037 1113
Self-employed 6171 6380 5953 5905 5799 5805 5907 6091 6296 6391 6854 6766 6784 6877 6846 6881 6929 6609 6589 6696 6560 6648 6834
Unpaid family workers 1846 1922 1620 1637 1756 1618 1800 1854 1736 1597 1723 1818 1832 1882 1873 1838 1868 1801 1703 1790 1687 1364 1004
Women 9354 10016 9754 9917 10489 10259 11232 11756 11762 11968 12403 12622 13018 13129 13657 14114 14619 14751 14968 15286 15335 15963 15267
Wage and salary workers 4246 4558 4723 4839 5116 5208 5459 5631 5800 6105 6187 6357 6682 6754 7099 7489 7787 8052 8355 8452 8722 9254 9092
Employers 214 219 231 240 288 262 313 324 318 313 316 311 330 320 335 328 328 336 306 286 291 339 378
Self-employed 2939 2950 2820 2986 3066 3063 3468 3646 3616 3620 3730 3759 3787 3777 3878 3977 4065 4017 4080 4173 4145 4449 4364
Unpaid family workers 1955 2288 1980 1853 2019 1726 1992 2155 2029 1931 2170 2195 2219 2279 2345 2319 2438 2346 2227 2375 2177 1922 1433
Notes:
1. Annualized data for 2014 from the Labor Force Survey is the average of estimates for April, July and October survey rounds. The estimates for these rounds exclude data of Leyte province only while that of January exclude Region VIII.
2. Annualized data for 2015 from the Labor Force Survey is the average of estimates for January, April, July and October survey rounds. The estimates for these rounds exclude data of Leyte province only.
3. Starting April 2016 round, the Labor Force Survey adopted the 2013 Master Sample Design as well as the population projections based on the 2010 Census of Population and Housing (2010 CPH)
while previous survey rounds were derived using the 2000 CPH population projections.
4. Annualized data for 2016 from the Labor Force Survey is the average of the four survey rounds using the January 2016 that were based on the 2010 CPH population projections.
5. See Metadata of Statistical Indicators on Decent Work for definitions and other information.
Source: Philippine Statistics Authority, Labor Force Survey.
Employment by class of worker

Table 2. Employment opportunities
Decent Work Indicator and
Underlying Data1995 1996 1997 1998 1999 2000 2001 2002 2003 2004 2005 2006 2007 2008 2009 2010 2011 2012 2013 2014 2015 2016 2017
Proportion of self-employed
and unpaid family workers in
total employment (%) 50.3 49.8 46.9 46.5 45.6 44.5 45.2 45.7 44.6 42.8 44.8 44.5 43.6 43.5 42.6 41.7 41.1 39.3 38.3 38.9 37.6 35.1 33.8
Men 49.1 48.4 45.6 45.1 43.8 43.2 43.0 43.4 42.6 40.7 43.1 42.9 41.9 41.8 40.7 39.8 39.0 36.8 35.8 36.3 35.2 32.0 31.3
Women 52.3 52.3 49.2 48.8 48.5 46.7 48.6 49.3 48.0 46.4 47.6 47.2 46.1 46.1 45.6 44.6 44.5 43.1 42.1 42.8 41.2 39.9 38.0
Agriculture 74.0 74.5 73.4 72.6 68.7 67.1 66.9 67.0 66.6 64.7 68.2 67.9 67.2 67.0 66.4 65.6 64.0 62.3 61.4 64.0 63.1 60.6 60.9
Industry 20.7 18.7 17.1 17.7 17.7 18.5 18.4 18.6 18.1 17.0 17.6 17.5 16.6 16.4 16.7 15.8 15.8 14.3 12.9 12.3 11.6 9.5 7.4
Services 36.6 36.4 34.8 35.4 35.6 35.6 37.1 38.0 36.6 34.9 36.2 35.9 35.1 34.8 34.0 33.8 33.9 32.5 32.2 32.5 31.7 30.7 30.1
Total self-employed and
unpaid family workers (000) 12912 13541 12374 12381 12639 12213 13167 13746 13677 13538 14477 14537 14622 14815 14942 15015 15300 14773 14598 15035 14569 14383 13634
Men 8017 8302 7573 7542 7555 7423 7707 7945 8032 7988 8577 8584 8616 8759 8719 8719 8797 8410 8291 8486 8247 8012 7837
Women 4894 5238 4800 4839 5085 4789 5460 5801 5645 5551 5900 5954 6006 6056 6223 6296 6503 6363 6307 6548 6322 6371 5797
Agriculture 8253 8670 7642 7323 7406 6832 7263 7454 7467 7366 7927 7934 7921 8058 7994 7846 7857 7529 7269 7557 7131 6706 6245
Industry 856 828 782 805 801 823 865 871 878 849 886 873 848 830 851 851 874 820 768 760 726 681 549
Services 3803 4043 3951 4251 4432 4559 5038 5419 5329 5325 5666 5731 5852 5928 6098 6318 6569 6423 6561 6718 6712 6996 6840
Total employed (000) 25677 27186 26365 26631 27742 27452 29156 30062 30635 31613 32313 32636 33560 34089 35061 36035 37192 37600 38118 38651 38741 40998 40334
Men 16322 17170 16610 16714 17253 17193 17923 18306 18873 19646 19910 20013 20542 20959 21404 21921 22573 22849 23150 23365 23406 25035 25067
Women 9354 10016 9754 9917 10489 10259 11232 11756 11762 11968 12403 12622 13018 13129 13657 14114 14619 14751 14968 15286 15335 15963 152670 0 0
Agriculture 11147 11645 10416 10091 10774 10181 10850 11122 11220 11381 11628 11682 11786 12030 12044 11956 12267 12093 11835 11801 11294 11064 10261
Industry 4140 4431 4582 4542 4515 4454 4713 4695 4840 4999 5025 4997 5121 5048 5092 5399 5530 5743 5937 6167 6275 7159 7370
Services 10391 11112 11367 11998 12452 12817 13593 14246 14577 15237 15661 15957 16654 17012 17924 18682 19394 19764 20345 20683 21172 22775 22703
Notes:
1. Annualized data for 2014 from the Labor Force Survey is the average of estimates for April, July and October survey rounds. The estimates for these rounds exclude data of Leyte province only while that of January exclude Region VIII.
2. Annualized data for 2015 from the Labor Force Survey is the average of estimates for January, April, July and October survey rounds. The estimates for these rounds exclude data of Leyte province only.
3. Starting April 2016 round, the Labor Force Survey adopted the 2013 Master Sample Design as well as the population projections based on the 2010 Census of Population and Housing (2010 CPH)
while previous survey rounds were derived using the 2000 CPH population projections.
4. Annualized data for 2016 from the Labor Force Survey is the average of the four survey rounds using the January 2016 that were based on the 2010 CPH population projections.
5. See Metadata of Statistical Indicators on Decent Work for definitions and other information.
Source: Philippine Statistics Authority, Labor Force Survey.
Proportion of self-employed and unpaid family workers in total employment

Table 2. Employment opportunities
Decent Work Indicator and
Underlying Data1995 1996 1997 1998 1999 2000 2001 2002 2003 2004 2005 2006 2007 2008 2009 2010 2011 2012 2013 2014 2015 2016 2017
Share of wage employment in non-
agricultural employment (%) 65.5 66.1 67.8 66.9 66.4 66.3 65.0 64.0 65.4 66.9 65.7 66.0 66.7 66.8 67.2 67.9 67.9 69.4 70.1 70.3 71.1 84.3 73.3
Men 72.3 72.6 73.8 72.7 72.1 71.5 71.1 69.8 70.9 72.6 71.0 71.0 71.6 71.8 72.3 72.8 73.1 74.9 75.6 75.9 76.3 95.6 78.9
Women 57.2 58.0 60.2 59.6 59.5 59.9 57.9 57.4 58.8 60.1 59.5 60.1 60.9 61.0 61.3 62.1 61.8 62.8 63.6 63.6 64.8 70.1 65.9
Total wage and salary workers in
non-agricultural employment (000) 9514 10278 10813 11062 11269 11443 11898 12127 12692 13539 13598 13825 14517 14740 15478 16338 16922 17694 18436 18869 19513 25240 22056
Men 5766 6265 6581 6685 6716 6762 6996 7050 7456 8028 7966 8026 8434 8593 8992 9485 9847 10376 10834 11128 11456 15986 13526
Women 3747 4013 4232 4377 4553 4681 4902 5078 5236 5511 5633 5800 6083 6148 6486 6854 7075 7317 7601 7741 8057 9254 8530
Total non-agricultural employment
(000) 14529 15542 15949 16540 16968 17272 18306 18940 19416 20233 20685 20954 21775 22058 23018 24078 24924 25507 26282 26850 27447 29934 30073
Men 7974 8625 8919 9192 9321 9461 9838 10101 10517 11058 11224 11304 11779 11976 12438 13035 13479 13850 14328 14670 15020 16728 17138
Women 6556 6916 7030 7348 7646 7811 8467 8840 8900 9175 9462 9650 9995 10083 10580 11043 11445 11658 11954 12180 12427 13206 12935
Notes:
1. Annualized data for 2014 from the Labor Force Survey is the average of estimates for April, July and October survey rounds. The estimates for these rounds exclude data of Leyte province only while that of January exclude Region VIII.
2. Annualized data for 2015 from the Labor Force Survey is the average of estimates for January, April, July and October survey rounds. The estimates for these rounds exclude data of Leyte province only.
3. Starting April 2016 round, the Labor Force Survey adopted the 2013 Master Sample Design as well as the population projections based on the 2010 Census of Population and Housing (2010 CPH)
while previous survey rounds were derived using the 2000 CPH population projections.
4. Annualized data for 2016 from the Labor Force Survey is the average of the four survey rounds using the January 2016 that were based on the 2010 CPH population projections.
5. See Metadata of Statistical Indicators on Decent Work for definitions and other information.
Source: Philippine Statistics Authority, Labor Force Survey.
Table 2. Employment opportunities
Decent Work Indicator and
Underlying Data1995 1996 1997 1998 1999 2000 2001 2002 2003 2004 2005 2006 2007 2008 2009 2010 2011 2012 2013 2014 2015 2016 2017
Wage and salary workers in non-
agricultural employment,
% distribution 100.0 100.0 100.0 100.0 100.0 100.0 100.0 100.0 100.0 100.0 100.0 100.0 100.0 100.0 100.0 100.0 100.0 100.0 100.0 100.0 100.0 100.0 100.0
Men 60.6 61.0 60.9 60.4 59.6 59.1 58.8 58.1 58.7 59.3 58.6 58.1 58.1 58.3 58.1 58.1 58.2 58.6 58.8 59.0 58.7 63.3 61.3
Women 39.4 39.0 39.1 39.6 40.4 40.9 41.2 41.9 41.3 40.7 41.4 42.0 41.9 41.7 41.9 42.0 41.8 41.4 41.2 41.0 41.3 36.7 38.7
Total wage and salary workers in
non-agricultural employment (000) 9514 10278 10813 11062 11269 11443 11898 12127 12692 13539 13598 13825 14517 14740 15478 16338 16922 17694 18436 18869 19513 25240 22056
Men 5766 6265 6581 6685 6716 6762 6996 7050 7456 8028 7966 8026 8434 8593 8992 9485 9847 10376 10834 11128 11456 15986 13526
Women 3747 4013 4232 4377 4553 4681 4902 5078 5236 5511 5633 5800 6083 6148 6486 6854 7075 7317 7601 7741 8057 9254 8530
Notes:
1. Annualized data for 2014 from the Labor Force Survey is the average of estimates for April, July and October survey rounds. The estimates for these rounds exclude data of Leyte province only while that of January exclude Region VIII.
2. Annualized data for 2015 from the Labor Force Survey is the average of estimates for January, April, July and October survey rounds. The estimates for these rounds exclude data of Leyte province only.
3. Starting April 2016 round, the Labor Force Survey adopted the 2013 Master Sample Design as well as the population projections based on the 2010 Census of Population and Housing (2010 CPH)
while previous survey rounds were derived using the 2000 CPH population projections.
4. Annualized data for 2016 from the Labor Force Survey is the average of the four survey rounds using the January 2016 that were based on the 2010 CPH population projections.
5. See Metadata of Statistical Indicators on Decent Work for definitions and other information.
Source: Philippine Statistics Authority, Labor Force Survey.
Share of wage employment in non-agricultural employment
Wage and salary workers in non-agricultural employment

Element 3
Adequate Earnings and
Productive Work

Table 3. Adequate earnings and productive work
Decent Work Indicator 1995 1996 1997 1998 1999 2000 2001 2002 2003 2004 2005 2006 2007 2008 2009 2010 2011 2012 2013 2014 2015 2016 2017
Working poverty rate1, in % .. .. .. .. .. .. .. .. .. .. .. 22.9 .. .. 22.8 .. .. 21.9 .. .. 18.0 .. ..
Men .. .. .. .. .. .. .. .. .. .. .. 25.0 .. .. 25.1 .. .. 24.4 .. .. .. .. ..
Women .. .. .. .. .. .. .. .. .. .. .. 19.5 .. .. 19.3 .. .. 18.1 .. .. .. .. .... .. .. .. .. .. .. .. .. .. .. .. .. ..
Agriculture .. .. .. .. .. .. .. .. .. .. .. 43.5 .. .. 44.3 .. .. 44.0 .. .. .. .. ..
Industry .. .. .. .. .. .. .. .. .. .. .. 15.7 .. .. 16.2 .. .. 13.4 .. .. .. .. ..
Services .. .. .. .. .. .. .. .. .. .. .. 10.5 .. .. 11.1 .. .. 9.5 .. .. .. .. .... .. .. .. .. .. .. .. .. .. .. .. .. ..
Wage and salary workers .. .. .. .. .. .. .. .. .. .. .. 17.2 .. .. 18.3 .. .. 18.1 .. .. .. .. ..
Employers .. .. .. .. .. .. .. .. .. .. .. 16.9 .. .. 14.5 .. .. 11.7 .. .. .. .. ..
Self-employed .. .. .. .. .. .. .. .. .. .. .. 27.5 .. .. 26.3 .. .. 26.0 .. .. .. .. ..
Unpaid family workers .. .. .. .. .. .. .. .. .. .. .. 38.7 .. .. 39.6 .. .. 37.3 .. .. .. .. ..
Low-paid employees2,
% of employed .. .. .. .. .. .. 14.1 14.3 14.9 14.8 12.8 12.7 13.8 14.6 14.9 14.5 14.3 14.4 14.5 12.7 11.9 13.8 13.8
Men .. .. .. .. .. .. 12.4 12.8 13.3 13.1 10.4 10.2 11.2 12.4 12.5 12.1 12.0 12.1 12.2 10.1 9.2 11.6 11.8
Women .. .. .. .. .. .. 16.8 16.6 17.4 17.6 16.5 16.8 17.8 18.1 18.6 18.2 17.9 18.1 18.2 16.7 15.9 17.1 17.0
Agriculture .. .. .. .. .. .. 13.8 13.6 14.6 14.6 12.0 11.7 13.1 14.2 14.1 13.9 14.7 14.5 14.7 11.2 10.4 13.9 13.5
Industry .. .. .. .. .. .. 10.5 12.2 12.5 12.1 10.1 9.9 10.8 12.7 12.7 12.1 11.3 11.2 11.1 10.2 8.4 10.7 11.5
Services .. .. .. .. .. .. 15.6 15.5 15.9 15.8 14.2 14.4 15.1 15.5 16.0 15.6 14.9 15.4 15.4 14.3 13.7 14.7 14.6
Low-paid employees2,
% of employees .. .. .. .. .. .. 28.5 29.3 29.7 28.4 25.3 24.9 26.4 28.0 27.9 26.6 25.9 25.3 24.9 21.9 20.0 22.3 22.0
Men .. .. .. .. .. .. 24.8 25.9 26.2 24.8 20.5 19.8 21.3 23.5 23.1 21.9 21.2 20.5 20.3 16.9 15.1 18.2 18.3
Women .. .. .. .. .. .. 34.5 34.6 35.3 34.6 33.1 33.3 34.7 35.3 35.8 34.3 33.6 33.2 32.6 30.2 28.0 29.4 28.6
Agriculture .. .. .. .. .. .. 58.7 59.7 61.4 56.7 51.4 47.8 51.8 55.0 53.1 50.6 50.0 46.2 45.7 37.5 33.9 43.1 44.1
Industry .. .. .. .. .. .. 13.3 15.6 15.8 14.9 12.6 12.3 13.3 15.6 15.7 14.7 13.7 13.4 13.0 11.8 9.7 12.0 12.6
Services .. .. .. .. .. .. 26.0 26.2 26.1 25.4 23.2 23.4 24.3 24.8 25.3 24.5 23.3 23.6 23.5 21.8 20.6 21.8 21.6
Private household .. .. .. .. .. .. 63.7 65.0 68.0 71.8 73.9 73.2 73.1 74.8 75.5 73.8 71.6 71.0 69.9 69.4 66.8 66.7 64.5
Private establishment .. .. .. .. .. .. 27.4 28.6 29.0 27.5 23.4 22.5 23.9 26.1 25.7 24.2 23.8 23.0 22.6 19.3 17.2 20.0 19.9
Worked for government/
government corporation .. .. .. .. .. .. 9.0 7.6 7.4 8.0 4.9 4.9 6.3 7.0 7.2 7.7 6.4 6.8 8.0 6.3 6.2 7.6 9.6
With pay in own family-
operated farm or business .. .. .. .. .. .. 33.3 35.8 33.1 35.7 28.9 32.0 35.9 36.8 34.5 37.8 37.5 33.1 41.7 36.7 30.4 43.9 42.0
Average real daily basic pay3,
in 2006 PhP .. .. .. .. .. .. 275.11 272.76 271.05 263.02 258.84 261.90 259.14 250.39 250.63 254.38 251.74 256.59 260.57 263.33 267.60 278.44 279.39
Men .. .. .. .. .. .. 271.08 269.12 269.29 260.67 259.30 264.76 261.21 250.60 250.55 252.84 248.55 251.96 254.97 257.72 262.04 272.79 273.95
Women .. .. .. .. .. .. 281.58 278.45 273.88 266.89 258.13 257.60 256.00 250.05 250.76 256.70 256.57 263.67 269.18 271.93 276.10 287.70 288.58
Based on 2002 PSOC
Major occupation group, total .. .. .. .. .. 275.11 272.76 271.05 263.02 258.84 261.90 259.14 250.39 250.63 254.38 251.74 256.59 260.57 263.33 267.60 .. ..
Officials of government
and special interest-
organizations, corporate
executives, managers,
managing proprietors
and supervisors .. .. .. .. .. .. 604.89 614.76 627.87 628.70 612.58 629.78 626.11 604.83 592.88 601.00 593.72 616.96 629.23 614.77 612.50 .. ..
Professionals .. .. .. .. .. .. 593.02 591.18 579.73 573.43 532.06 518.26 519.29 501.09 507.78 524.77 538.31 554.24 569.37 567.56 571.29 .. ..
Technicians and associate
professionals .. .. .. .. .. .. 398.23 417.83 401.66 386.60 379.85 415.88 380.59 369.29 374.30 369.14 365.82 356.54 378.01 369.75 367.53 .. ..
Clerks .. .. .. .. .. .. 318.71 317.06 315.75 307.17 310.50 330.76 328.19 318.17 319.34 327.77 326.30 327.09 332.65 327.55 335.01 .. ..
Service workers and shop
and market sales workers .. .. .. .. .. .. 240.72 241.43 241.25 236.45 223.92 220.54 222.73 214.01 216.00 217.01 212.06 208.75 211.78 212.66 214.80 .. ..
Farmers, forestry workers
and fishermen .. .. .. .. .. .. 141.25 139.47 136.86 145.35 143.11 160.82 172.73 153.82 151.31 152.84 155.28 251.80 218.51 207.61 216.53 .. ..
Trades and related workers .. .. .. .. .. .. 245.77 245.73 249.18 245.06 241.43 248.53 245.00 236.45 235.09 233.59 231.17 234.14 232.92 233.17 238.73 .. ..
Plant and machine operators
and assemblers .. .. .. .. .. .. 274.33 266.02 269.28 262.10 262.26 263.97 270.26 257.19 255.83 257.40 255.02 258.52 259.56 258.07 261.64 .. ..
Laborers and unskilled workers .. .. .. .. .. .. 149.58 148.33 149.28 147.13 143.88 146.31 144.70 138.99 138.58 140.85 139.92 142.71 145.40 149.44 154.18 .. ..
Special occupations .. .. .. .. .. .. 395.99 420.28 455.31 435.75 458.08 458.28 484.13 437.59 452.86 426.10 460.35 555.30 568.78 604.85 582.19 .. ..
Based on 2012 PSOC
Major occupation group, total .. .. .. .. .. .. .. .. .. .. .. .. .. .. .. .. .. .. .. .. .. 278.44 279.39
Managers .. .. .. .. .. .. .. .. .. .. .. .. .. .. .. .. .. .. .. .. .. 679.41 621.95
Professionals .. .. .. .. .. .. .. .. .. .. .. .. .. .. .. .. .. .. .. .. .. 598.98 581.63
Technicians and associate
professionals .. .. .. .. .. .. .. .. .. .. .. .. .. .. .. .. .. .. .. .. .. 404.66 389.06
Clerical support workers .. .. .. .. .. .. .. .. .. .. .. .. .. .. .. .. .. .. .. .. .. 369.49 349.63
Service and sales workers .. .. .. .. .. .. .. .. .. .. .. .. .. .. .. .. .. .. .. .. .. 231.74 231.72
Skilled agricultural, forestry
and fishery workers .. .. .. .. .. .. .. .. .. .. .. .. .. .. .. .. .. .. .. .. .. 269.55 204.08
Craft and related trade workers .. .. .. .. .. .. .. .. .. .. .. .. .. .. .. .. .. .. .. .. .. 248.65 250.27
Plant and machine operators
and assemblers .. .. .. .. .. .. .. .. .. .. .. .. .. .. .. .. .. .. .. .. .. 269.60 273.55
Elementary occupations .. .. .. .. .. .. .. .. .. .. .. .. .. .. .. .. .. .. .. .. .. 161.11 169.90
Armed forces occupations and
special occupations .. .. .. .. .. .. .. .. .. .. .. .. .. .. .. .. .. .. .. .. .. 623.86 569.98
Others .. .. .. .. .. .. .. .. .. .. .. .. .. .. .. .. .. .. .. .. .. 321.22 ..

Table 3. Adequate earnings and productive work
Decent Work Indicator 1995 1996 1997 1998 1999 2000 2001 2002 2003 2004 2005 2006 2007 2008 2009 2010 2011 2012 2013 2014 2015 2016 2017
Based on 2002 PSOC
Men .. .. .. .. .. 271.08 269.12 269.29 260.67 259.30 264.76 261.21 250.60 250.55 252.84 248.55 251.96 254.97 257.72 262.04 .. ..
Officials of government
and special interest-
organizations, corporate
executives, managers,
managing proprietors
and supervisors .. .. .. .. .. .. 599.73 608.88 637.33 631.24 613.71 639.61 630.86 597.76 580.94 605.02 585.87 608.10 628.01 597.35 603.98 .. ..
Professionals .. .. .. .. .. .. 641.10 639.75 637.44 622.33 586.24 567.42 588.79 561.77 559.78 573.74 580.82 586.98 605.96 597.06 606.13 .. ..
Technicians and associate
professionals .. .. .. .. .. .. 410.16 433.42 417.18 405.84 402.56 445.28 406.08 390.75 406.47 397.39 388.02 368.63 398.22 392.21 388.61 .. ..
Clerks .. .. .. .. .. .. 329.48 321.45 324.11 311.25 312.70 323.97 333.28 326.13 329.68 335.65 338.32 332.49 333.94 332.65 342.95 .. ..
Service workers and shop
and market sales workers .. .. .. .. .. .. 282.50 286.94 285.82 277.96 263.99 263.29 263.26 252.52 253.49 256.92 249.37 247.18 249.31 247.42 249.08 .. ..
Farmers, forestry workers
and fishermen .. .. .. .. .. .. 143.92 140.71 138.36 146.03 146.53 163.36 177.95 156.53 154.42 155.60 156.53 248.52 220.04 210.68 210.33 .. ..
Trades and related workers .. .. .. .. .. .. 255.77 255.40 258.29 254.36 249.91 259.73 254.28 244.47 242.50 241.34 239.79 242.73 241.18 241.68 247.23 .. ..
Plant and machine operators
and assemblers .. .. .. .. .. .. 274.50 264.94 267.73 260.38 261.05 264.10 270.34 255.78 253.34 256.01 254.46 258.72 261.25 260.22 264.88 .. ..
Laborers and unskilled workers .. .. .. .. .. .. 162.74 161.00 162.89 160.52 160.56 166.35 160.74 155.26 155.00 156.55 155.27 157.52 159.62 165.01 169.56 .. ..
Special occupations .. .. .. .. .. .. 414.67 432.13 468.22 453.80 479.22 471.55 505.36 449.24 471.24 446.00 482.34 560.38 573.21 607.15 584.22 .. ..
Based on 2012 PSOC
Men .. .. .. .. .. .. .. .. .. .. .. .. .. .. .. .. .. .. .. .. .. 272.79 273.95
Managers .. .. .. .. .. .. .. .. .. .. .. .. .. .. .. .. .. .. .. .. .. 683.05 634.93
Professionals .. .. .. .. .. .. .. .. .. .. .. .. .. .. .. .. .. .. .. .. .. 640.57 619.82
Technicians and associate
professionals .. .. .. .. .. .. .. .. .. .. .. .. .. .. .. .. .. .. .. .. .. 414.97 400.13
Clerical support workers .. .. .. .. .. .. .. .. .. .. .. .. .. .. .. .. .. .. .. .. .. 368.49 357.01
Service and sales workers .. .. .. .. .. .. .. .. .. .. .. .. .. .. .. .. .. .. .. .. .. 264.13 261.03
Skilled agricultural, forestry
and fishery workers .. .. .. .. .. .. .. .. .. .. .. .. .. .. .. .. .. .. .. .. .. 268.83 196.51
Craft and related trade workers .. .. .. .. .. .. .. .. .. .. .. .. .. .. .. .. .. .. .. .. .. 257.22 257.77
Plant and machine operators
and assemblers .. .. .. .. .. .. .. .. .. .. .. .. .. .. .. .. .. .. .. .. .. 272.93 278.71
Elementary occupations .. .. .. .. .. .. .. .. .. .. .. .. .. .. .. .. .. .. .. .. .. 175.94 183.10
Armed forces occupations and
special occupations .. .. .. .. .. .. .. .. .. .. .. .. .. .. .. .. .. .. .. .. .. 628.49 560.77
Others .. .. .. .. .. .. .. .. .. .. .. .. .. .. .. .. .. .. .. .. .. 304.97 ..
Based on 2002 PSOC
Women .. .. .. .. .. 281.58 278.45 273.88 266.89 258.13 257.60 256.00 250.05 250.76 256.70 256.57 263.67 269.18 271.93 276.10 .. ..
Officials of government
and special interest-
organizations, corporate
executives, managers,
managing proprietors
and supervisors .. .. .. .. .. .. 613.70 625.07 612.52 624.61 610.84 614.94 618.84 615.19 610.43 595.34 604.72 629.24 630.87 637.66 624.00 .. ..
Professionals .. .. .. .. .. .. 572.17 570.17 555.18 552.55 508.89 497.60 490.37 474.93 485.26 503.68 519.52 539.47 552.39 553.13 554.49 .. ..
Technicians and associate
professionals .. .. .. .. .. .. 385.93 400.25 385.08 365.48 355.89 384.76 354.49 346.57 340.31 338.94 341.83 341.88 354.55 346.42 344.87 .. ..
Clerks .. .. .. .. .. .. 313.09 314.75 311.37 304.99 309.35 334.47 325.28 313.80 313.25 323.15 319.20 323.97 331.88 324.51 330.37 .. ..
Service workers and shop
and market sales workers .. .. .. .. .. .. 189.38 184.41 183.56 181.02 170.51 165.36 170.65 164.11 167.66 165.22 163.71 159.12 164.07 167.23 172.39 .. ..
Farmers, forestry workers
and fishermen .. .. .. .. .. .. 114.39 123.17 116.05 122.63 102.34 122.29 112.04 103.57 110.81 117.63 135.65 310.89 149.31 125.41 251.66 .. ..
Trades and related workers .. .. .. .. .. .. 206.03 206.04 211.77 203.70 204.15 195.22 199.64 189.47 187.78 184.61 177.37 180.92 182.53 176.42 179.32 .. ..
Plant and machine operators
and assemblers .. .. .. .. .. .. 272.97 273.83 280.25 273.09 267.96 263.40 269.94 263.37 268.64 263.94 257.33 257.65 252.77 249.51 248.94 .. ..
Laborers and unskilled workers .. .. .. .. .. .. 129.54 129.65 127.68 124.46 117.44 114.94 119.05 112.50 111.97 114.95 113.24 115.60 118.79 120.67 124.67 .. ..
Special occupations .. .. .. .. .. .. 253.02 268.36 269.32 243.73 258.23 295.81 283.18 302.86 259.86 289.33 304.99 468.35 463.44 565.87 551.11 .. ..
Based on 2012 PSOC
Women .. .. .. .. .. .. .. .. .. .. .. .. .. .. .. .. .. .. .. .. .. 287.70 288.58
Managers .. .. .. .. .. .. .. .. .. .. .. .. .. .. .. .. .. .. .. .. .. 674.85 605.38
Professionals .. .. .. .. .. .. .. .. .. .. .. .. .. .. .. .. .. .. .. .. .. 578.03 561.90
Technicians and associate
professionals .. .. .. .. .. .. .. .. .. .. .. .. .. .. .. .. .. .. .. .. .. 391.49 374.79
Clerical support workers .. .. .. .. .. .. .. .. .. .. .. .. .. .. .. .. .. .. .. .. .. 370.19 344.61
Service and sales workers .. .. .. .. .. .. .. .. .. .. .. .. .. .. .. .. .. .. .. .. .. 193.42 197.41
Skilled agricultural, forestry
and fishery workers .. .. .. .. .. .. .. .. .. .. .. .. .. .. .. .. .. .. .. .. .. 277.99 262.50
Craft and related trade workers .. .. .. .. .. .. .. .. .. .. .. .. .. .. .. .. .. .. .. .. .. 193.72 192.15
Plant and machine operators
and assemblers .. .. .. .. .. .. .. .. .. .. .. .. .. .. .. .. .. .. .. .. .. 252.25 251.24
Elementary occupations .. .. .. .. .. .. .. .. .. .. .. .. .. .. .. .. .. .. .. .. .. 130.29 140.10
Armed forces occupations and
special occupations .. .. .. .. .. .. .. .. .. .. .. .. .. .. .. .. .. .. .. .. .. 477.79 873.43
Others .. .. .. .. .. .. .. .. .. .. .. .. .. .. .. .. .. .. .. .. .. 339.64 ..

Table 3. Adequate earnings and productive work
Decent Work Indicator 1995 1996 1997 1998 1999 2000 2001 2002 2003 2004 2005 2006 2007 2008 2009 2010 2011 2012 2013 2014 2015 2016 2017
Branch of economic activity .. .. .. .. .. 275.11 272.76 271.05 263.02 258.84 261.90 259.14 250.39 250.63 254.38 251.74 256.59 260.57 263.33 267.60 278.44 279.39
Agriculture .. .. .. .. .. .. 136.67 133.22 132.54 132.39 128.87 132.25 128.91 124.64 125.12 126.15 125.46 128.16 127.12 132.84 137.46 145.36 148.22
Industry .. .. .. .. .. .. 276.11 272.87 274.28 266.22 260.37 268.97 265.22 255.45 253.58 252.34 248.66 252.47 251.57 246.35 250.93 261.39 260.85
Services .. .. .. .. .. .. 316.13 313.72 310.47 301.07 293.16 294.20 292.74 282.77 282.55 288.55 288.71 294.76 300.75 302.62 305.38 316.46 313.62
Category of employee .. .. .. .. .. .. 275.11 272.76 271.05 263.02 258.84 261.90 259.14 250.39 250.63 254.38 251.74 256.59 260.57 263.33 267.60 278.44 279.39
Private household .. .. .. .. .. .. 141.29 137.48 135.31 125.42 113.62 114.16 119.87 110.69 108.49 110.54 110.22 112.80 116.32 115.68 120.03 127.10 135.15
Private establishment .. .. .. .. .. .. 254.90 250.50 252.45 245.13 243.04 250.88 249.08 241.89 241.58 244.14 237.20 240.21 243.39 246.09 251.10 263.97 264.62
Worked for government/
government corporation .. .. .. .. .. .. 457.20 474.99 464.16 450.67 443.12 433.13 423.05 402.24 408.26 417.22 442.43 469.80 480.60 487.29 482.69 492.40 469.38
With pay in own family-
operated farm or business .. .. .. .. .. .. 259.33 229.08 233.84 203.80 203.83 199.60 220.51 187.97 216.20 185.13 194.51 190.94 166.91 189.24 197.20 185.24 187.23
Minimum hourly basic pay
as % of median hourly basic
pay, non-agriculture in Metro
Manila .. .. .. .. .. .. 100.0 98.1 90.1 89.3 93.4 96.7 107.2 106.1 100.1 104.5 101.3 102.0 98.7 102.2 101.6 102.1 104.3
Manufacturing wage index,
in nominal terms (2006=100) .. .. .. .. .. .. 85.1 86.5 90.0 90.9 93.4 100.0 103.8 108.2 112.4 116.3 118.1 123.9 129.0 130.3 134.2 142.6 147.7
Employees with recent job
training (past 12 months),
% of employed .. .. .. .. .. .. .. .. .. .. .. .. .. .. .. .. 33.7 .. 32.7 .. 32.6 .. ..
Agriculture .. .. .. .. .. .. .. .. .. .. .. .. .. .. .. .. 24.2 .. 32.1 .. 26.7 .. ..
Industry .. .. .. .. .. .. .. .. .. .. .. .. .. .. .. .. 32.8 .. 30.2 .. 28.3 .. ..
Services .. .. .. .. .. .. .. .. .. .. .. .. .. .. .. .. 34.8 .. 34.0 .. 35.2 .. ..
Workers certified,
% of workers assessed
(certification rate) 49.1 51.1 41.1 27.2 53.2 63.7 78.1 43.3 35.2 58.9 48.4 62.4 73.5 78.5 82.6 83.0 84.2 85.7 88.7 91.3 91.1 91.9 93.2
Men .. .. .. .. .. .. .. .. .. 55.5 54.1 67.1 72.1 76.8 81.7 81.9 83.6 84.6 87.5 90.6 .. 91.5 92.5
Women .. .. .. .. .. .. .. .. .. 62.1 33.0 47.6 75.9 80.4 83.8 84.3 84.8 87.0 89.8 92.0 .. 92.3 93.7
Notes: 1. Annualized data for 2014 from the Labor Force Survey is the average of estimates for April, July and October survey rounds. The estimates for these rounds exclude data for Leyte province only while that of
January exclude Region VIII.
2. Annualized data for 2015 from the Labor Force Survey is the average of estimates for January, April, July and October survey rounds. The estimates for these rounds exclude data for Leyte Province only.
The use of the four survey rounds that exclude Leyte was based on the results of the referendum conducted among members of the Inter-Agency Committee on Labor and Productivity Statistics (IACLPS).
3. See Metadata of Statistical Indicators on Decent Work for definitions and other information.1
MDG indicator on employment. 2
Refer to wage and salary workers with hourly basic pay (in primary job) below 2/3 of the median hourly basic pay of total wage and salary workers.3
LFS began collecting data on basic pay in January 2001 survey round. The inquiry is on basic pay per day in cash or in kind (imputed value) of employees from their primary jobs and not their total earnings.
Not all employees, e.g., commission basis, were able to report their basic pay and as such posed difficulty in determining their pay on a per day basis.
Sources: Philippine Statistics Authority, Labor Force Survey/Consumer Price Index/Merged Files of the Labor Force Survey and Family Income and Expenditure Survey/BLES
Integrated Survey/Integrated Survey on Labor and Employment;
National Wages and Productivity Commission;
Technical Education and Skills Development Authority.
Date updated: 09/18/2018
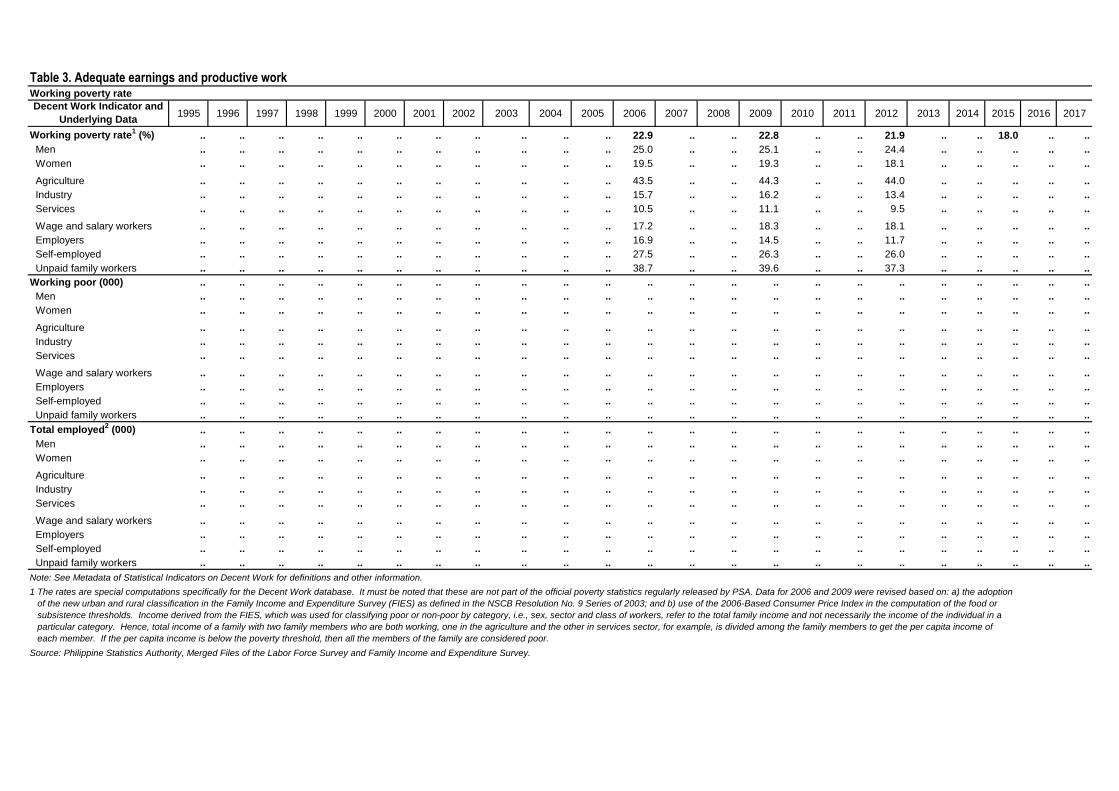
Table 3. Adequate earnings and productive work
Decent Work Indicator and
Underlying Data1995 1996 1997 1998 1999 2000 2001 2002 2003 2004 2005 2006 2007 2008 2009 2010 2011 2012 2013 2014 2015 2016 2017
Working poverty rate1 (%) .. .. .. .. .. .. .. .. .. .. .. 22.9 .. .. 22.8 .. .. 21.9 .. .. 18.0 .. ..
Men .. .. .. .. .. .. .. .. .. .. .. 25.0 .. .. 25.1 .. .. 24.4 .. .. .. .. ..
Women .. .. .. .. .. .. .. .. .. .. .. 19.5 .. .. 19.3 .. .. 18.1 .. .. .. .. ..
Agriculture .. .. .. .. .. .. .. .. .. .. .. 43.5 .. .. 44.3 .. .. 44.0 .. .. .. .. ..
Industry .. .. .. .. .. .. .. .. .. .. .. 15.7 .. .. 16.2 .. .. 13.4 .. .. .. .. ..
Services .. .. .. .. .. .. .. .. .. .. .. 10.5 .. .. 11.1 .. .. 9.5 .. .. .. .. ..
Wage and salary workers .. .. .. .. .. .. .. .. .. .. .. 17.2 .. .. 18.3 .. .. 18.1 .. .. .. .. ..
Employers .. .. .. .. .. .. .. .. .. .. .. 16.9 .. .. 14.5 .. .. 11.7 .. .. .. .. ..
Self-employed .. .. .. .. .. .. .. .. .. .. .. 27.5 .. .. 26.3 .. .. 26.0 .. .. .. .. ..
Unpaid family workers .. .. .. .. .. .. .. .. .. .. .. 38.7 .. .. 39.6 .. .. 37.3 .. .. .. .. ..
Working poor (000) .. .. .. .. .. .. .. .. .. .. .. .. .. .. .. .. .. .. .. .. .. .. ..
Men .. .. .. .. .. .. .. .. .. .. .. .. .. .. .. .. .. .. .. .. .. .. ..
Women .. .. .. .. .. .. .. .. .. .. .. .. .. .. .. .. .. .. .. .. .. .. ..
Agriculture .. .. .. .. .. .. .. .. .. .. .. .. .. .. .. .. .. .. .. .. .. .. ..
Industry .. .. .. .. .. .. .. .. .. .. .. .. .. .. .. .. .. .. .. .. .. .. ..
Services .. .. .. .. .. .. .. .. .. .. .. .. .. .. .. .. .. .. .. .. .. .. ..
Wage and salary workers .. .. .. .. .. .. .. .. .. .. .. .. .. .. .. .. .. .. .. .. .. .. ..
Employers .. .. .. .. .. .. .. .. .. .. .. .. .. .. .. .. .. .. .. .. .. .. ..
Self-employed .. .. .. .. .. .. .. .. .. .. .. .. .. .. .. .. .. .. .. .. .. .. ..
Unpaid family workers .. .. .. .. .. .. .. .. .. .. .. .. .. .. .. .. .. .. .. .. .. .. ..
Total employed2 (000) .. .. .. .. .. .. .. .. .. .. .. .. .. .. .. .. .. .. .. .. .. .. ..
Men .. .. .. .. .. .. .. .. .. .. .. .. .. .. .. .. .. .. .. .. .. .. ..
Women .. .. .. .. .. .. .. .. .. .. .. .. .. .. .. .. .. .. .. .. .. .. ..
Agriculture .. .. .. .. .. .. .. .. .. .. .. .. .. .. .. .. .. .. .. .. .. .. ..
Industry .. .. .. .. .. .. .. .. .. .. .. .. .. .. .. .. .. .. .. .. .. .. ..
Services .. .. .. .. .. .. .. .. .. .. .. .. .. .. .. .. .. .. .. .. .. .. ..
Wage and salary workers .. .. .. .. .. .. .. .. .. .. .. .. .. .. .. .. .. .. .. .. .. .. ..
Employers .. .. .. .. .. .. .. .. .. .. .. .. .. .. .. .. .. .. .. .. .. .. ..
Self-employed .. .. .. .. .. .. .. .. .. .. .. .. .. .. .. .. .. .. .. .. .. .. ..
Unpaid family workers .. .. .. .. .. .. .. .. .. .. .. .. .. .. .. .. .. .. .. .. .. .. ..
Note: See Metadata of Statistical Indicators on Decent Work for definitions and other information.
Source: Philippine Statistics Authority, Merged Files of the Labor Force Survey and Family Income and Expenditure Survey.
Working poverty rate
1 The rates are special computations specifically for the Decent Work database. It must be noted that these are not part of the official poverty statistics regularly released by PSA. Data for 2006 and 2009 were revised based on: a) the adoption
of the new urban and rural classification in the Family Income and Expenditure Survey (FIES) as defined in the NSCB Resolution No. 9 Series of 2003; and b) use of the 2006-Based Consumer Price Index in the computation of the food or
subsistence thresholds. Income derived from the FIES, which was used for classifying poor or non-poor by category, i.e., sex, sector and class of workers, refer to the total family income and not necessarily the income of the individual in a
particular category. Hence, total income of a family with two family members who are both working, one in the agriculture and the other in services sector, for example, is divided among the family members to get the per capita income of
each member. If the per capita income is below the poverty threshold, then all the members of the family are considered poor.

Table 3. Adequate earnings and productive workLow-paid employees, % of employed
Decent Work Indicator and
Underlying Data1995 1996 1997 1998 1999 2000 2001 2002 2003 2004 2005 2006 2007 2008 2009 2010 2011 2012 2013 2014 2015 2016 2017
Low-paid employees, % of
employed .. .. .. .. .. .. 14.1 14.3 14.9 14.8 12.8 12.7 13.8 14.6 14.9 14.5 14.3 14.4 14.5 12.7 11.9 13.8 13.8
Men .. .. .. .. .. .. 12.4 12.8 13.3 13.1 10.4 10.2 11.2 12.4 12.5 12.1 12.0 12.1 12.2 10.1 9.2 11.6 11.8
Women .. .. .. .. .. .. 16.8 16.6 17.4 17.6 16.5 16.8 17.8 18.1 18.6 18.2 17.9 18.1 18.2 16.7 15.9 17.1 17.0
Agriculture .. .. .. .. .. .. 13.8 13.6 14.6 14.6 12.0 11.7 13.1 14.2 14.1 13.9 14.7 14.5 14.7 11.2 10.4 13.9 13.5
Industry .. .. .. .. .. .. 10.5 12.2 12.5 12.1 10.1 9.9 10.8 12.7 12.7 12.1 11.3 11.2 11.1 10.2 8.4 10.7 11.5
Services .. .. .. .. .. .. 15.6 15.5 15.9 15.8 14.2 14.4 15.1 15.5 16.0 15.6 14.9 15.4 15.4 14.3 13.7 14.7 14.6
Total low-paid employees (000) .. .. .. .. .. .. 4112 4291 4553 4679 4123 4153 4624 4989 5221 5226 5313 5433 5542 4914 4597 5641 5552
Men .. .. .. .. .. .. 2230 2341 2506 2569 2079 2038 2304 2607 2677 2660 2698 2756 2819 2362 2156 2916 2955
Women .. .. .. .. .. .. 1883 1947 2047 2110 2045 2117 2320 2382 2544 2566 2616 2677 2723 2551 2442 2725 2597
Agriculture .. .. .. .. .. .. 1492 1509 1635 1664 1398 1361 1549 1709 1700 1664 1807 1755 1743 1325 1170 1538 1389
Industry .. .. .. .. .. .. 494 575 606 603 506 493 555 642 647 654 624 643 661 627 530 763 844
Services .. .. .. .. .. .. 2125 2208 2311 2413 2219 2299 2518 2637 2875 2910 2883 3036 3139 2963 2897 3339 3319
Total employed (000) 25677 27186 26365 26631 27742 27452 29156 30062 30635 31613 32313 32636 33560 34089 35061 36035 37192 37600 38118 38651 38741 40998 40334
Men 16322 17170 16610 16714 17253 17193 17923 18306 18873 19646 19910 20013 20542 20959 21404 21921 22573 22849 23150 23365 23406 25035 25067
Women 9354 10016 9754 9917 10489 10259 11232 11756 11762 11968 12403 12622 13018 13129 13657 14114 14619 14751 14968 15286 15335 15963 15267
Agriculture 11147 11645 10416 10091 10774 10181 10850 11122 11220 11381 11628 11682 11786 12030 12044 11956 12267 12093 11835 11801 11294 11064 10261
Industry 4140 4431 4582 4542 4515 4454 4713 4695 4840 4999 5025 4997 5121 5048 5092 5399 5530 5743 5937 6167 6275 7159 7370
Services 10391 11112 11367 11998 12452 12817 13593 14246 14577 15237 15661 15957 16654 17012 17924 18682 19394 19764 20345 20683 21172 22775 22703
Notes: 1. Annualized data for 2014 from the Labor Force Survey is the average of estimates for April, July and October survey rounds. The estimates for these rounds exclude data for Leyte province only while that of January exclude Region VIII.
2. Annualized data for 2015 from the Labor Force Survey is the average of estimates for January, April, July and October survey rounds. The estimates for these rounds exclude data for Leyte Province only.
The use of the four survey rounds that exclude Leyte was based on the results of the referendum conducted among members of the Inter-Agency Committee on Labor and Productivity Statistics (IACLPS).
3. See Metadata of Statistical Indicators on Decent Work for definitions and other information.
Source: Philippine Statistics Authority, Labor Force Survey.

Table 3. Adequate earnings and productive workLow-paid employees, % of employees
Decent Work Indicator and
Underlying Data1995 1996 1997 1998 1999 2000 2001 2002 2003 2004 2005 2006 2007 2008 2009 2010 2011 2012 2013 2014 2015 2016 2017
Low-paid employees, % of
employees .. .. .. .. .. .. 28.5 29.3 29.7 28.4 25.3 24.9 26.4 28.0 27.9 26.6 25.9 25.3 24.9 21.9 20.0 22.3 22.0
Men .. .. .. .. .. .. 24.8 25.9 26.2 24.8 20.5 19.8 21.3 23.5 23.1 21.9 21.2 20.5 20.3 16.9 15.1 18.2 18.3
Women 34.5 34.6 35.3 34.6 33.1 33.3 34.7 35.3 35.8 34.3 33.6 33.2 32.6 30.2 28.0 29.4 28.6
Agriculture .. .. .. .. .. .. 58.7 59.7 61.4 56.7 51.4 47.8 51.8 55.0 53.1 50.6 50.0 46.2 45.7 37.5 33.9 43.1 44.1
Industry .. .. .. .. .. .. 13.3 15.6 15.8 14.9 12.6 12.3 13.3 15.6 15.7 14.7 13.7 13.4 13.0 11.8 9.7 12.0 12.6
Services .. .. .. .. .. .. 26.0 26.2 26.1 25.4 23.2 23.4 24.3 24.8 25.3 24.5 23.3 23.6 23.5 21.8 20.6 21.8 21.6
Private household .. .. .. .. .. .. 63.7 65.0 68.0 71.8 73.9 73.2 73.1 74.8 75.5 73.8 71.6 71.0 69.9 69.4 66.8 66.7 64.5
Private establishment .. .. .. .. .. .. 27.4 28.6 29.0 27.5 23.4 22.5 23.9 26.1 25.7 24.2 23.8 23.0 22.6 19.3 17.2 20.0 19.9
Worked for government/
government corporation .. .. .. .. .. .. 9.0 7.6 7.4 8.0 4.9 4.9 6.3 7.0 7.2 7.7 6.4 6.8 8.0 6.3 6.2 7.6 9.6
With pay in own family-operated
farm or business .. .. .. .. .. .. 33.3 35.8 33.1 35.7 28.9 32.0 35.9 36.8 34.5 37.8 37.5 33.1 41.7 36.7 30.4 43.9 42.0
Total low-paid employees (000) .. .. .. .. .. .. 4112 4291 4553 4679 4123 4153 4624 4989 5221 5226 5313 5433 5542 4914 4597 5641 5552
Men .. .. .. .. .. .. 2230 2341 2506 2569 2079 2038 2304 2607 2677 2660 2698 2756 2819 2362 2156 2916 2955
Women .. .. .. .. .. .. 1883 1947 2047 2110 2045 2117 2320 2382 2544 2566 2616 2677 2723 2551 2442 2725 2597
Agriculture .. .. .. .. .. .. 1492 1509 1635 1664 1398 1361 1549 1709 1700 1664 1807 1755 1743 1325 1170 1538 1389
Industry .. .. .. .. .. .. 494 575 606 603 506 493 555 642 647 654 624 643 661 627 530 763 844
Services .. .. .. .. .. .. 2125 2208 2311 2413 2219 2299 2518 2637 2875 2910 2883 3036 3139 2963 2897 3339 3319
Private household .. .. .. .. .. .. 1017 1047 1056 985 1090 1191 1303 1299 1420 1421 1397 1416 1376 1335 1324 1397 1242
Private establishment .. .. .. .. .. .. 2838 3019 3277 3454 2875 2800 3101 3461 3558 3529 3679 3774 3870 3341 3041 3933 3933
Worked for government/
government corporation .. .. .. .. .. .. 211 181 174 194 121 122 165 191 205 234 196 203 243 193 199 253 326
With pay in own family-operated
farm or business .. .. .. .. .. .. 46 43 46 46 37 40 55 39 38 42 42 40 53 44 34 58 50
Total employees (000) 11870 12649 13043 13285 13761 13925 14438 14653 15354 16472 16316 16673 17508 17846 18681 19626 20538 21492 22247 22407 22960 25240 25209
Men 7625 8091 8319 8446 8645 8717 8978 9022 9554 10368 10130 10316 10827 11093 11581 12137 12750 13440 13892 13955 14238 15986 16117
Women 4246 4558 4723 4839 5116 5208 5459 5631 5800 6105 6187 6357 6682 6754 7099 7489 7787 8052 8355 8452 8722 9254 9092
Agriculture 2357 2372 2230 2222 2492 2482 2541 2526 2662 2933 2718 2848 2992 3107 3203 3288 3616 3798 3812 3538 3447 3570 3153
Industry 3195 3502 3702 3635 3600 3521 3713 3693 3845 4034 4025 4016 4171 4103 4123 4437 4545 4807 5070 5308 5451 6363 6689
Services 6319 6776 7110 7426 7672 7923 8187 8438 8850 9506 9573 9811 10347 10638 11356 11901 12378 12887 13366 13561 14062 15307 15368
Private household 1263 1298 1387 1566 1498 1583 1597 1610 1553 1371 1474 1626 1783 1736 1880 1926 1950 1993 1969 1925 1981 2096 1925
Private establishment 8398 9093 9442 9461 9946 9860 10366 10546 11294 12552 12261 12423 12950 13283 13824 14565 15431 16377 17114 17319 17669 19694 19776
Worked for government/
government corporation 2041 2079 2031 2082 2143 2268 2336 2378 2367 2420 2454 2500 2623 2723 2866 3025 3044 3000 3037 3043 3197 3317 3388
With pay in own family-operated
farm or business 167 180 183 176 174 215 138 120 139 129 128 125 153 106 110 111 112 121 127 120 112 132 119
Notes: 1. Annualized data for 2014 from the Labor Force Survey is the average of estimates for April, July and October survey rounds. The estimates for these rounds exclude data for Leyte province only while that of January exclude Region VIII.
2. Annualized data for 2015 from the Labor Force Survey is the average of estimates for January, April, July and October survey rounds. The estimates for these rounds exclude data for Leyte Province only.
The use of the four survey rounds that exclude Leyte was based on the results of the referendum conducted among members of the Inter-Agency Committee on Labor and Productivity Statistics (IACLPS).
3. See Metadata of Statistical Indicators on Decent Work for definitions and other information.
Source: Philippine Statistics Authority, Labor Force Survey.

Table 3. Adequate earnings and productive work
Decent Work Indicator and Underlying
Data1995 1996 1997 1998 1999 2000 2001 2002 2003 2004 2005 2006 2007 2008 2009 2010 2011 2012 2013 2014 2015
Average real daily basic pay by major
occupation group, in 2006 PhP .. .. .. .. .. .. 275.11 272.76 271.05 263.02 258.84 261.90 259.14 250.39 250.63 254.38 251.74 256.59 260.57 263.33 267.60
Officials of government and special
interest-organizations, corporate
executives, managers, managing
proprietors and supervisors .. .. .. .. .. .. 604.89 614.76 627.87 628.70 612.58 629.78 626.11 604.83 592.88 601.00 593.72 616.96 629.23 614.77 612.50
Professionals .. .. .. .. .. .. 593.02 591.18 579.73 573.43 532.06 518.26 519.29 501.09 507.78 524.77 538.31 554.24 569.37 567.56 571.29
Technicians & associate professionals .. .. .. .. .. .. 398.23 417.83 401.66 386.60 379.85 415.88 380.59 369.29 374.30 369.14 365.82 356.54 378.01 369.75 367.53
Clerks .. .. .. .. .. .. 318.71 317.06 315.75 307.17 310.50 330.76 328.19 318.17 319.34 327.77 326.30 327.09 332.65 327.55 335.01
Service workers and shop and market
sales workers .. .. .. .. .. .. 240.72 241.43 241.25 236.45 223.92 220.54 222.73 214.01 216.00 217.01 212.06 208.75 211.78 212.66 214.80
Farmers, forestry workers & fishermen .. .. .. .. .. .. 141.25 139.47 136.86 145.35 143.11 160.82 172.73 153.82 151.31 152.84 155.28 251.80 218.51 207.61 216.53
Trades and related workers .. .. .. .. .. .. 245.77 245.73 249.18 245.06 241.43 248.53 245.00 236.45 235.09 233.59 231.17 234.14 232.92 233.17 238.73
Plant & machine operators
& assemblers .. .. .. .. .. .. 274.33 266.02 269.28 262.10 262.26 263.97 270.26 257.19 255.83 257.40 255.02 258.52 259.56 258.07 261.64
Laborers and unskilled workers .. .. .. .. .. .. 149.58 148.33 149.28 147.13 143.88 146.31 144.70 138.99 138.58 140.85 139.92 142.71 145.4 149.44 154.18
Special occupations .. .. .. .. .. .. 395.99 420.28 455.31 435.75 458.08 458.28 484.13 437.59 452.86 426.10 460.35 555.30 568.78 604.85 582.19
Men .. .. .. .. .. .. 271.08 269.12 269.29 260.67 259.30 264.76 261.21 250.60 250.55 252.84 248.55 251.96 254.97 257.72 262.04
Officials of government and special
interest-organizations, corporate
executives, managers, managing
proprietors and supervisors .. .. .. .. .. .. 599.73 608.88 637.33 631.24 613.71 639.61 630.86 597.76 580.94 605.02 585.87 608.10 628.01 597.35 603.98
Professionals .. .. .. .. .. .. 641.10 639.75 637.44 622.33 586.24 567.42 588.79 561.77 559.78 573.74 580.82 586.98 605.96 597.06 606.13
Technicians & associate professionals .. .. .. .. .. .. 410.16 433.42 417.18 405.84 402.56 445.28 406.08 390.75 406.47 397.39 388.02 368.63 398.22 392.21 388.61
Clerks .. .. .. .. .. .. 329.48 321.45 324.11 311.25 312.70 323.97 333.28 326.13 329.68 335.65 338.32 332.49 333.94 332.65 342.95
Service workers and shop and market
sales workers .. .. .. .. .. .. 282.50 286.94 285.82 277.96 263.99 263.29 263.26 252.52 253.49 256.92 249.37 247.18 249.31 247.42 249.08
Farmers, forestry workers & fishermen .. .. .. .. .. .. 143.92 140.71 138.36 146.03 146.53 163.36 177.95 156.53 154.42 155.60 156.53 248.52 220.04 210.68 210.33
Trades and related workers .. .. .. .. .. .. 255.77 255.40 258.29 254.36 249.91 259.73 254.28 244.47 242.50 241.34 239.79 242.73 241.18 241.68 247.23
Plant & machine operators
& assemblers .. .. .. .. .. .. 274.50 264.94 267.73 260.38 261.05 264.10 270.34 255.78 253.34 256.01 254.46 258.72 261.25 260.22 264.88
Laborers and unskilled workers .. .. .. .. .. .. 162.74 161.00 162.89 160.52 160.56 166.35 160.74 155.26 155.00 156.55 155.27 157.52 159.62 165.01 169.56
Special occupations .. .. .. .. .. .. 414.67 432.13 468.22 453.80 479.22 471.55 505.36 449.24 471.24 446.00 482.34 560.38 573.21 607.15 584.22
Average real daily basic pay by major occupation group (Based on 2002 PSOC)
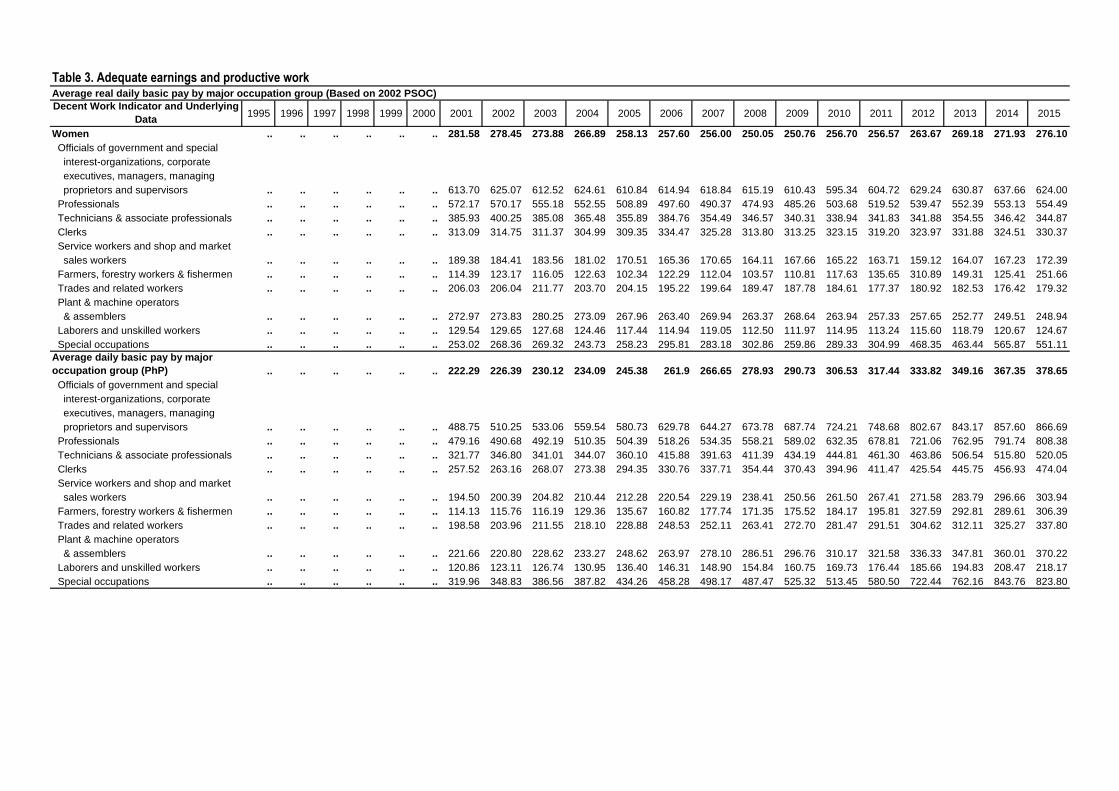
Table 3. Adequate earnings and productive work
Decent Work Indicator and Underlying
Data1995 1996 1997 1998 1999 2000 2001 2002 2003 2004 2005 2006 2007 2008 2009 2010 2011 2012 2013 2014 2015
Women .. .. .. .. .. .. 281.58 278.45 273.88 266.89 258.13 257.60 256.00 250.05 250.76 256.70 256.57 263.67 269.18 271.93 276.10
Officials of government and special
interest-organizations, corporate
executives, managers, managing
proprietors and supervisors .. .. .. .. .. .. 613.70 625.07 612.52 624.61 610.84 614.94 618.84 615.19 610.43 595.34 604.72 629.24 630.87 637.66 624.00
Professionals .. .. .. .. .. .. 572.17 570.17 555.18 552.55 508.89 497.60 490.37 474.93 485.26 503.68 519.52 539.47 552.39 553.13 554.49
Technicians & associate professionals .. .. .. .. .. .. 385.93 400.25 385.08 365.48 355.89 384.76 354.49 346.57 340.31 338.94 341.83 341.88 354.55 346.42 344.87
Clerks .. .. .. .. .. .. 313.09 314.75 311.37 304.99 309.35 334.47 325.28 313.80 313.25 323.15 319.20 323.97 331.88 324.51 330.37
Service workers and shop and market
sales workers .. .. .. .. .. .. 189.38 184.41 183.56 181.02 170.51 165.36 170.65 164.11 167.66 165.22 163.71 159.12 164.07 167.23 172.39
Farmers, forestry workers & fishermen .. .. .. .. .. .. 114.39 123.17 116.05 122.63 102.34 122.29 112.04 103.57 110.81 117.63 135.65 310.89 149.31 125.41 251.66
Trades and related workers .. .. .. .. .. .. 206.03 206.04 211.77 203.70 204.15 195.22 199.64 189.47 187.78 184.61 177.37 180.92 182.53 176.42 179.32
Plant & machine operators
& assemblers .. .. .. .. .. .. 272.97 273.83 280.25 273.09 267.96 263.40 269.94 263.37 268.64 263.94 257.33 257.65 252.77 249.51 248.94
Laborers and unskilled workers .. .. .. .. .. .. 129.54 129.65 127.68 124.46 117.44 114.94 119.05 112.50 111.97 114.95 113.24 115.60 118.79 120.67 124.67
Special occupations .. .. .. .. .. .. 253.02 268.36 269.32 243.73 258.23 295.81 283.18 302.86 259.86 289.33 304.99 468.35 463.44 565.87 551.11
Average daily basic pay by major
occupation group (PhP) .. .. .. .. .. .. 222.29 226.39 230.12 234.09 245.38 261.9 266.65 278.93 290.73 306.53 317.44 333.82 349.16 367.35 378.65
Officials of government and special
interest-organizations, corporate
executives, managers, managing
proprietors and supervisors .. .. .. .. .. .. 488.75 510.25 533.06 559.54 580.73 629.78 644.27 673.78 687.74 724.21 748.68 802.67 843.17 857.60 866.69
Professionals .. .. .. .. .. .. 479.16 490.68 492.19 510.35 504.39 518.26 534.35 558.21 589.02 632.35 678.81 721.06 762.95 791.74 808.38
Technicians & associate professionals .. .. .. .. .. .. 321.77 346.80 341.01 344.07 360.10 415.88 391.63 411.39 434.19 444.81 461.30 463.86 506.54 515.80 520.05
Clerks .. .. .. .. .. .. 257.52 263.16 268.07 273.38 294.35 330.76 337.71 354.44 370.43 394.96 411.47 425.54 445.75 456.93 474.04
Service workers and shop and market
sales workers .. .. .. .. .. .. 194.50 200.39 204.82 210.44 212.28 220.54 229.19 238.41 250.56 261.50 267.41 271.58 283.79 296.66 303.94
Farmers, forestry workers & fishermen .. .. .. .. .. .. 114.13 115.76 116.19 129.36 135.67 160.82 177.74 171.35 175.52 184.17 195.81 327.59 292.81 289.61 306.39
Trades and related workers .. .. .. .. .. .. 198.58 203.96 211.55 218.10 228.88 248.53 252.11 263.41 272.70 281.47 291.51 304.62 312.11 325.27 337.80
Plant & machine operators
& assemblers .. .. .. .. .. .. 221.66 220.80 228.62 233.27 248.62 263.97 278.10 286.51 296.76 310.17 321.58 336.33 347.81 360.01 370.22
Laborers and unskilled workers .. .. .. .. .. .. 120.86 123.11 126.74 130.95 136.40 146.31 148.90 154.84 160.75 169.73 176.44 185.66 194.83 208.47 218.17
Special occupations .. .. .. .. .. .. 319.96 348.83 386.56 387.82 434.26 458.28 498.17 487.47 525.32 513.45 580.50 722.44 762.16 843.76 823.80
Average real daily basic pay by major occupation group (Based on 2002 PSOC)

Table 3. Adequate earnings and productive workAverage real daily basic pay by major occupation group (Based on 2002 PSOC)
Decent Work Indicator and Underlying
Data1995 1996 1997 1998 1999 2000 2001 2002 2003 2004 2005 2006 2007 2008 2009 2010 2011 2012 2013 2014 2015
Men .. .. .. .. .. .. 219.03 223.37 228.63 232.00 245.82 264.76 268.79 279.17 290.64 304.67 313.42 327.80 341.66 359.52 370.79
Officials of government and special
interest-organizations, corporate
executives, managers, managing
proprietors and supervisors .. .. .. .. .. .. 484.58 505.37 541.09 561.80 581.80 639.61 649.15 665.90 673.89 729.05 738.78 791.14 841.53 833.31 854.63
Professionals .. .. .. .. .. .. 518.01 530.99 541.19 553.87 555.76 567.42 605.87 625.81 649.35 691.36 732.41 763.66 811.99 832.90 857.68
Technicians & associate professionals .. .. .. .. .. .. 331.41 359.74 354.19 361.20 381.63 445.28 417.86 435.30 471.51 478.85 489.29 479.59 533.62 547.13 549.88
Clerks .. .. .. .. .. .. 266.22 266.80 275.17 277.01 296.44 323.97 342.95 363.31 382.43 404.46 426.62 432.57 447.48 464.04 485.28
Service workers and shop and market
sales workers .. .. .. .. .. .. 228.26 238.16 242.66 247.38 250.26 263.29 270.89 281.31 294.05 309.59 314.45 321.58 334.08 345.15 352.45
Farmers, forestry workers & fishermen .. .. .. .. .. .. 116.29 116.79 117.47 129.97 138.91 163.36 183.11 174.37 179.13 187.50 197.39 323.33 294.85 293.90 297.62
Trades and related workers .. .. .. .. .. .. 206.66 211.98 219.29 226.38 236.91 259.73 261.65 272.34 281.30 290.81 302.37 315.79 323.18 337.14 349.83
Plant & machine operators
& assemblers .. .. .. .. .. .. 221.80 219.90 227.30 231.74 247.48 264.10 278.18 284.94 293.87 308.49 320.88 336.59 350.07 363.01 374.81
Laborers and unskilled workers .. .. .. .. .. .. 131.49 133.63 138.29 142.86 152.21 166.35 165.40 172.96 179.80 188.64 195.79 204.94 213.89 230.19 239.93
Special occupations .. .. .. .. .. .. 335.05 358.67 397.52 403.88 454.30 471.55 520.02 500.45 546.64 537.43 608.23 729.05 768.10 846.97 826.67
Women .. .. .. .. .. .. 227.52 231.11 232.52 237.53 244.71 257.6 263.42 278.56 290.88 309.32 323.53 343.04 360.70 379.34 390.68
Officials of government and special
interest-organizations, corporate
executives, managers, managing
proprietors and supervisors .. .. .. .. .. .. 495.87 518.81 520.03 555.9 579.08 614.94 636.79 685.32 708.10 717.39 762.55 818.64 845.37 889.53 882.96
Professionals .. .. .. .. .. .. 462.31 473.24 471.35 491.77 482.43 497.6 504.59 529.07 562.90 606.93 655.12 701.85 740.20 771.61 784.60
Technicians & associate professionals .. .. .. .. .. .. 311.83 332.21 326.93 325.28 337.38 384.76 364.77 386.08 394.76 408.42 431.05 444.78 475.10 483.25 487.99
Clerks .. .. .. .. .. .. 252.98 261.24 264.35 271.44 293.26 334.47 334.71 349.57 363.37 389.40 402.51 421.48 444.72 452.69 467.47
Service workers and shop and market
sales workers .. .. .. .. .. .. 153.02 153.06 155.84 161.11 161.64 165.36 175.6 182.82 194.49 199.09 206.44 207.01 219.86 233.29 243.93
Farmers, forestry workers & fishermen .. .. .. .. .. .. 92.43 102.23 98.53 109.14 97.02 122.29 115.29 115.38 128.54 141.74 171.06 404.47 200.08 174.94 356.10
Trades and related workers .. .. .. .. .. .. 166.47 171.01 179.79 181.29 193.53 195.22 205.43 211.07 217.82 222.45 223.66 235.38 244.59 246.10 253.74
Plant & machine operators
& assemblers .. .. .. .. .. .. 220.56 227.28 237.93 243.05 254.03 263.4 277.77 293.39 311.62 318.05 324.49 335.20 338.71 348.07 352.25
Laborers and unskilled workers .. .. .. .. .. .. 104.67 107.61 108.4 110.77 111.33 114.94 122.5 125.33 129.88 138.52 142.80 150.40 159.18 168.33 176.41
Special occupations .. .. .. .. .. .. 204.44 222.74 228.65 216.92 244.8 295.81 291.39 337.39 301.44 348.64 384.59 609.32 621.01 789.39 779.82
Consumer price index (2006=100) 54.1 58.6 62.0 67.8 71.9 76.7 80.8 83.0 84.9 89.0 94.8 100.0 102.9 111.4 116.0 120.5 126.1 130.1 134.0 139.5 141.5
Notes: 1. Annualized data for 2014 from the Labor Force Survey is the average of estimates for April, July and October survey rounds. The estimates for these rounds exclude data for Leyte province only while that of January exclude Region VIII.
2. Annualized data for 2015 from the Labor Force Survey is the average of estimates for January, April, July and October survey rounds. The estimates for these rounds exclude data for Leyte Province only.
The use of the four survey rounds that exclude Leyte was based on the results of the referendum conducted among members of the Inter-Agency Committee on Labor and Productivity Statistics (IACLPS).
3. See Metadata of Statistical Indicators on Decent Work for definitions and other information.
Source: Philippine Statistics Authority, Labor Force Survey.

Table 3. Adequate earnings and productive work
Decent Work Indicator and Underlying
Data2016 2017
Average real daily basic pay by major
occupation group, in 2006 PhP 278.44 279.39
Managers 679.41 621.95
Professionals 598.98 581.63
Technicians and associate
professionals 404.66 389.06
Clerical support workers 369.49 349.63
Service and sales workers 231.74 231.72
Skilled agricultural, forestry
and fishery workers 269.55 204.08
Craft and related trade workers 248.65 250.27
Plant and machine operators
and assemblers 269.60 273.55
Elementary occupations 161.11 169.90
Armed forces occupations and
special occupations 623.86 569.98
Others 321.22 ..
Men 272.79 273.95
Managers 683.05 634.93
Professionals 640.57 619.82
Technicians and associate
professionals 414.97 400.13
Clerical support workers 368.49 357.01
Service and sales workers 264.13 261.03
Skilled agricultural, forestry
and fishery workers 268.83 196.51
Craft and related trade workers 257.22 257.77
Plant and machine operators
and assemblers 272.93 278.71
Elementary occupations 175.94 183.10
Armed forces occupations and
special occupations 628.49 560.77
Others 304.97 ..
Average real daily basic pay by major occupation group (Based on 2012 PSOC)

Table 3. Adequate earnings and productive work
Decent Work Indicator and Underlying
Data2016 2017
Women 287.70 288.58
Managers 674.85 605.38
Professionals 578.03 561.90
Technicians and associate
professionals 391.49 374.79
Clerical support workers 370.19 344.61
Service and sales workers 193.42 197.41
Skilled agricultural, forestry
and fishery workers 277.99 262.50
Craft and related trade workers 193.72 192.15
Plant and machine operators
and assemblers 252.25 251.24
Elementary occupations 130.29 140.10
Armed forces occupations and
special occupations 477.79 873.43
Others 339.64 ..
Average daily basic pay by major
occupation group (PhP) 400.95 415.17
Managers 978.35 924.22
Professionals 862.53 864.30
Technicians and associate
professionals 582.71 578.14
Clerical support workers 532.06 519.55
Service and sales workers 333.71 344.33
Skilled agricultural, forestry
and fishery workers 388.15 303.27
Craft and related trade workers 358.06 371.90
Plant and machine operators
and assemblers 388.23 406.49
Elementary occupations 232.00 252.47
Armed forces occupations and
special occupations 898.36 846.99
Others 462.55 ..
Average real daily basic pay by major occupation group (Based on 2012 PSOC)

Table 3. Adequate earnings and productive work
Decent Work Indicator and Underlying
Data2016 2017
Men 392.82 407.09
Managers 983.59 943.51
Professionals 922.42 921.05
Technicians and associate
professionals 597.55 594.59
Clerical support workers 530.62 530.52
Service and sales workers 380.34 387.89
Skilled agricultural, forestry
and fishery workers 387.11 292.02
Craft and related trade workers 370.40 383.05
Plant and machine operators
and assemblers 393.02 414.16
Elementary occupations 253.36 272.09
Armed forces occupations and
special occupations 905.03 833.30
Others 439.16 ..
Women 414.29 428.83
Managers 971.79 899.59
Professionals 832.36 834.99
Technicians and associate
professionals 563.75 556.94
Clerical support workers 533.08 512.09
Service and sales workers 278.52 293.35
Skilled agricultural, forestry
and fishery workers 400.31 390.08
Craft and related trade workers 278.96 285.54
Plant and machine operators
and assemblers 363.24 373.34
Elementary occupations 187.62 208.19
Armed forces occupations and
special occupations 688.02 1297.91
Others 489.08 ..
Consumer price index (2006=100) 144.0 148.6
Notes: See Metadata of Statistical Indicators on Decent Work for definitions and other information.
Source: Philippine Statistics Authority, Labor Force Survey.
Average real daily basic pay by major occupation group (Based on 2012 PSOC)

Table 3. Adequate earnings and productive work
Decent Work Indicator and
Underlying Data1995 1996 1997 1998 1999 2000 2001 2002 2003 2004 2005 2006 2007 2008 2009 2010 2011 2012 2013 2014 2015 2016 2017
Average real daily basic pay by
branch of economic activity, in 2006
PhP .. .. .. .. .. .. 275.11 272.76 271.05 263.02 258.84 261.90 259.14 250.39 250.63 254.38 251.74 256.59 260.57 263.33 267.60 278.44 279.39
Agriculture .. .. .. .. .. .. 136.67 133.22 132.54 132.39 128.87 132.25 128.91 124.64 125.12 126.15 125.46 128.16 127.12 132.84 137.46 145.36 148.22
Industry .. .. .. .. .. .. 276.11 272.87 274.28 266.22 260.37 268.97 265.22 255.45 253.58 252.34 248.66 252.47 251.57 246.35 250.93 261.39 260.85
Services .. .. .. .. .. .. 316.13 313.72 310.47 301.07 293.16 294.20 292.74 282.77 282.55 288.55 288.71 294.76 300.75 302.62 305.38 316.46 313.62
Average daily basic pay by branch of
economic activity (PhP) .. .. .. .. .. .. 222.29 226.39 230.12 234.09 245.38 261.90 266.65 278.93 290.73 306.53 317.44 333.82 349.16 367.35 378.65 400.95 415.17
Agriculture .. .. .. .. .. .. 110.43 110.57 112.53 117.83 122.17 132.25 132.65 138.85 145.14 152.01 158.20 166.74 170.34 185.31 194.50 209.32 220.26
Industry .. .. .. .. .. .. 223.10 226.48 232.86 236.94 246.83 268.97 272.91 284.57 294.15 304.07 313.56 328.46 337.11 343.66 355.06 376.40 387.63
Services .. .. .. .. .. .. 255.43 260.39 263.59 267.95 277.92 294.20 301.23 315.01 327.76 347.70 364.06 383.48 403.00 422.15 432.11 455.70 466.04
Consumer price index (2006=100) 54.1 58.6 62.0 67.8 71.9 76.7 80.8 83.0 84.9 89.0 94.8 100.0 102.9 111.4 116.0 120.5 126.1 130.1 134.0 139.5 141.5 144.0 148.6
Notes: 1. Annualized data for 2014 from the Labor Force Survey is the average of estimates for April, July and October survey rounds. The estimates for these rounds exclude data for Leyte province only while that of January exclude Region VIII.
2. Annualized data for 2015 from the Labor Force Survey is the average of estimates for January, April, July and October survey rounds. The estimates for these rounds exclude data for Leyte Province only.
The use of the four survey rounds that exclude Leyte was based on the results of the referendum conducted among members of the Inter-Agency Committee on Labor and Productivity Statistics (IACLPS).
3. See Metadata of Statistical Indicators on Decent Work for definitions and other information.
Source: Philippine Statistics Authority, Labor Force Survey.
Table 3. Adequate earnings and productive work
Decent Work Indicator and
Underlying Data1995 1996 1997 1998 1999 2000 2001 2002 2003 2004 2005 2006 2007 2008 2009 2010 2011 2012 2013 2014 2015 2016 2017
Average real daily basic pay by
category of employee, in 2006 PhP .. .. .. .. .. .. 275.11 272.76 271.05 263.02 258.84 261.90 259.14 250.39 250.63 254.38 251.74 256.59 260.57 263.33 267.60 278.44 279.39
Private household .. .. .. .. .. .. 141.29 137.48 135.31 125.42 113.62 114.16 119.87 110.69 108.49 110.54 110.22 112.80 116.32 115.68 120.03 127.10 135.15
Private establishment .. .. .. .. .. .. 254.90 250.50 252.45 245.13 243.04 250.88 249.08 241.89 241.58 244.14 237.20 240.21 243.39 246.09 251.10 263.97 264.62
Worked for government/
government corporation .. .. .. .. .. .. 457.20 474.99 464.16 450.67 443.12 433.13 423.05 402.24 408.26 417.22 442.43 469.80 480.60 487.29 482.69 492.40 469.38
With pay in own family-operated
farm or business .. .. .. .. .. .. 259.33 229.08 233.84 203.80 203.83 199.60 220.51 187.97 216.20 185.13 194.51 190.94 166.91 189.24 197.20 185.24 187.23
Average daily basic pay by category
of employee (PhP) .. .. .. .. .. .. 222.29 226.39 230.12 234.09 245.38 261.90 266.65 278.93 290.73 306.53 317.44 333.82 349.16 367.35 378.65 400.95 415.17
Private household .. .. .. .. .. .. 114.16 114.11 114.88 111.63 107.71 114.16 123.35 123.30 125.85 133.20 138.99 146.75 155.87 161.38 169.84 183.02 200.84
Private establishment .. .. .. .. .. .. 205.96 207.91 214.33 218.17 230.40 250.88 256.31 269.47 280.23 294.19 299.11 312.51 326.14 343.29 355.30 380.11 393.23
Worked for government/
government corporation .. .. .. .. .. .. 369.42 394.24 394.07 401.10 420.08 433.13 435.32 448.10 473.58 502.75 557.91 611.21 644.00 679.77 683.01 709.05 697.50
With pay in own family-operated
farm or business .. .. .. .. .. .. 209.54 190.14 198.53 181.38 193.23 199.60 226.90 209.40 250.79 223.08 245.28 248.41 223.66 263.99 279.04 266.75 278.23
Consumer price index (2006=100) 54.1 58.6 62.0 67.8 71.9 76.7 80.8 83.0 84.9 89.0 94.8 100.0 102.9 111.4 116.0 120.5 126.1 130.1 134.0 139.5 141.5 144.0 148.6
Notes: 1. Annualized data for 2014 from the Labor Force Survey is the average of estimates for April, July and October survey rounds. The estimates for these rounds exclude data for Leyte province only while that of January exclude Region VIII.
2. Annualized data for 2015 from the Labor Force Survey is the average of estimates for January, April, July and October survey rounds. The estimates for these rounds exclude data for Leyte Province only.
The use of the four survey rounds that exclude Leyte was based on the results of the referendum conducted among members of the Inter-Agency Committee on Labor and Productivity Statistics (IACLPS).
3. See Metadata of Statistical Indicators on Decent Work for definitions and other information.
Source: Philippine Statistics Authority, Labor Force Survey.
Average real daily basic pay by branch of economic activity
Average real daily basic pay by category of employee

Table 3. Adequate earnings and productive workMinimum hourly basic pay as % of median hourly basic pay, non-agriculture in Metro Manila
Decent Work Indicator and
Underlying Data1995 1996 1997 1998 1999 2000 2001 2002 2003 2004 2005 2006 2007 2008 2009 2010 2011 2012 2013 2014 2015 2016 2017
Minimum hourly basic pay
as % of median hourly basic
pay, non-agriculture in Metro
Manila .. .. .. .. .. .. 100.0 98.1 90.1 89.3 93.4 96.7 107.2 106.1 100.1 104.5 101.3 102.0 98.7 102.2 101.6 102.1 104.3
Hourly equivalent of daily
minimum basic pay,
non-agriculture in Metro
Manila (PhP) 18.13 20.63 23.13 24.75 27.94 31.25 31.25 31.25 31.25 31.25 34.38 37.50 45.25 47.75 47.75 50.50 50.50 53.25 54.50 58.25 60.13 61.38 64.00
Daily basic pay 145.00 165.00 185.00 198.00 223.50 250.00 250.00 250.00 250.00 250.00 275.00 300.00 362.00 382.00 382.00 404.00 404.00 426.00 436.00 466.00 481.00 491.00 512.00
Median hourly basic pay, non-
agriculture in Metro Manila
(PhP) .. .. .. .. .. .. 31.25 31.85 34.70 35.00 36.82 38.78 42.23 45.02 47.69 48.32 49.85 52.20 55.23 57.00 59.19 60.13 61.38
Notes:
1. Annualized data for 2014 from the Labor Force Survey is the average of estimates for April, July and October survey rounds. The estimates for these rounds exclude data for Leyte province only while that of January exclude Region VIII.
2. Annualized data for 2015 from the Labor Force Survey is the average of estimates for January, April, July and October survey rounds. The estimates for these rounds exclude data for Leyte Province only.
The use of the four survey rounds that exclude Leyte was based on the results of the referendum conducted among members of the Inter-Agency Committee on Labor and Productivity Statistics (IACLPS).
3. See Metadata of Statistical Indicators on Decent Work for definitions and other information.
Sources : Philippine Statistics Authority, Labor Force Survey; and National Wages and Productivity Commission.
Table 3. Adequate earnings and productive workManufacturing wage index
Decent Work Indicator and
Underlying Data1995 1996 1997 1998 1999 2000 2001 2002 2003 2004 2005 2006 2007 2008 2009 2010 2011 2012 2013 2014 2015 2016 2017
Manufacturing wage index,
nominal terms (2006=100) .. .. .. .. .. .. 85.1 86.5 90.0 90.9 93.4 100.0 103.8 108.2 112.4 116.3 118.1 123.9 129.0 130.3 134.2 142.58 147.7
Average daily basic pay
in manufacturing (PhP) .. .. .. .. .. .. 226.17 228.98 237.42 239.36 246.59 264.99 277.19 289.56 299.93 310.57 316.49 330.03 343.97 346.74 358.71 383.65 394.15
Notes:
1. Annualized data for 2014 from the Labor Force Survey is the average of estimates for April, July and October survey rounds. The estimates for these rounds exclude data for Leyte province only while that of January exclude Region VIII.
2. Annualized data for 2015 from the Labor Force Survey is the average of estimates for January, April, July and October survey rounds. The estimates for these rounds exclude data for Leyte Province only.
The use of the four survey rounds that exclude Leyte was based on the results of the referendum conducted among members of the Inter-Agency Committee on Labor and Productivity Statistics (IACLPS).
3. See Metadata of Statistical Indicators on Decent Work for definitions and other information.
Source: Philippine Statistics Authority, Labor Force Survey.

Table 3. Adequate earnings and productive workEmployees with recent job training (past 12 months)
Decent Work Indicator and
Underlying Data1995 1996 1997 1998 1999 2000 2001 2002 2003 2004 2005 2006 2007 2008 2009 2010 2011 2012 2013 2014 2015 2016 2017
Employees with recent job
training (past 12 months), %
of employed .. .. .. .. .. .. .. .. .. .. .. .. .. .. .. .. 33.7 .. 32.7 .. 32.6 .. ..
Agriculture .. .. .. .. .. .. .. .. .. .. .. .. .. .. .. .. 24.2 .. 32.1 .. 26.7 .. ..
Industry .. .. .. .. .. .. .. .. .. .. .. .. .. .. .. .. 32.8 .. 30.2 .. 28.3 .. ..
Services .. .. .. .. .. .. .. .. .. .. .. .. .. .. .. .. 34.8 .. 34.0 .. 35.2 .. ..
Total employees trained
(000) .. .. .. .. .. .. .. .. .. .. .. .. .. .. .. .. 1221 .. 1379 .. 1341 .. ..
Agriculture .. .. .. .. .. .. .. .. .. .. .. .. .. .. .. .. 39 .. 67 .. 40 .. ..
Industry .. .. .. .. .. .. .. .. .. .. .. .. .. .. .. .. 382 .. 391 .. 391 .. ..
Services .. .. .. .. .. .. .. .. .. .. .. .. .. .. .. .. 800 .. 921 .. 910 .. ..
Total employed (000) .. .. .. .. .. .. .. .. .. .. .. .. .. .. .. .. 3624 .. 4218 .. 4118 .. ..
Agriculture .. .. .. .. .. .. .. .. .. .. .. .. .. .. .. .. 161 .. 209 .. 150 .. ..
Industry .. .. .. .. .. .. .. .. .. .. .. .. .. .. .. .. 1164 .. 1296 .. 1384 .. ..
Services .. .. .. .. .. .. .. .. .. .. .. .. .. .. .. .. 2299 .. 2712 .. 2584 .. ..
Note: See Metadata of Statistical Indicators on Decent Work for definitions and other information.
Source: Philippine Statistics Authority, Integrated Survey on Labor and Employment.

Table 3. Adequate earnings and productive workWorkers certified, % of workers assessed (certification rate)
Decent Work Indicator
and Underlying Data1995 1996 1997 1998 1999 2000 2001 2002 2003 2004 2005 2006 2007 2008 2009 2010 2011 2012 2013 2014 2015 2016 2017
Workers certified,
% of workers assessed
(certification rate) 1
49.1 51.1 41.1 27.2 53.2 63.7 78.1 43.3 35.2 58.9 48.4 62.4 73.5 78.5 82.6 83.0 84.2 85.7 88.7 91.3 91.1 91.9 93.2
Men .. .. .. .. .. .. .. .. .. 55.5 54.1 67.1 72.1 76.8 81.7 81.9 83.6 84.6 87.5 90.6 90.5 91.5 92.5
Women .. .. .. .. .. .. .. .. .. 62.1 33.0 47.6 75.9 80.4 83.8 84.3 84.8 87.0 89.8 92.0 91.6 92.3 93.7
Total workers certified 1
24414 49744 28304 23379 38822 57637 144746 68529 39208 122453 108361 160941 293219 431071 690836 594323 703360 830458 936007 1125273 1297927 1398780 1241152
Men .. .. .. .. .. .. .. .. .. 55432 88309 131868 178014 222514 387087 325904 369131 421951 455500 519963 600674 657736 563574
Women .. .. .. .. .. .. .. .. .. 67021 20052 29073 115205 208557 303749 268419 334229 408507 480507 605310 697253 741044 677578
Total workers assessed 1
49686 97405 68797 85838 72952 90487 185399 158305 111251 207918 223984 257796 398711 549121 836131 716220 835572 968535 1055576 1232116 1424814 1521530 1332380
Men .. .. .. .. .. .. .. .. .. 99927 163183 196663 246974 289867 473801 397972 441629 498958 520464 574227 663664 719040 609578
Women .. .. .. .. .. .. .. .. .. 107991 60801 61133 151737 259254 362330 318248 393943 469577 535112 657889 761150 802490 722802
Note: See Metadata of Statistical Indicators on Decent Work for definitions and other information.1 No gender disaggregation for 1995 to 2003.
Source: Technical Education and Skills Development Authority.
Element 4
Decent Hours

Table 4. Decent hours
Decent Work Indicator 1995 1996 1997 1998 1999 2000 2001 2002 2003 2004 2005 2006 2007 2008 2009 2010 2011 2012 2013 2014 2015 2016 2017
IN ALL JOBS1
Employed with excessive
hours (more than 48 hours
actually worked per week),
% of employed .. .. .. .. .. .. .. .. .. .. 26.0 25.3 25.0 25.2 24.7 24.6 24.0 24.7 24.7 23.2 22.8 25.0 22.8
Men .. .. .. .. .. .. .. .. .. .. 24.6 23.6 23.3 23.4 22.8 22.7 22.1 23.0 23.2 21.4 21.2 23.6 20.9
Women .. .. .. .. .. .. .. .. .. .. 28.3 28.0 27.8 28.1 27.6 27.5 26.9 27.4 27.0 26.0 25.4 27.1 26.1
Agriculture .. .. .. .. .. .. .. .. .. .. 14.2 13.1 13.0 12.7 11.7 11.7 11.3 12.3 12.1 10.3 10.2 13.3 11.1
Industry .. .. .. .. .. .. .. .. .. .. 18.3 17.4 16.3 15.7 15.4 15.8 15.0 16.5 16.7 15.3 14.8 17.0 14.6
Services .. .. .. .. .. .. .. .. .. .. 37.3 36.7 36.2 36.9 36.1 35.3 34.6 34.8 34.3 33.0 32.0 33.1 30.8
Wage and salary workers .. .. .. .. .. .. .. .. .. .. 25.0 24.2 23.4 23.2 23.0 22.3 21.7 22.7 22.2 20.9 20.2 22.0 19.6
Employers .. .. .. .. .. .. .. .. .. .. 27.0 26.3 27.2 26.3 26.7 25.9 26.9 26.4 25.9 22.5 23.7 27.2 24.4
Self-employed .. .. .. .. .. .. .. .. .. .. 31.4 31.1 31.7 32.7 31.9 32.6 32.1 32.8 33.7 32.3 31.9 34.3 31.9
Unpaid family workers .. .. .. .. .. .. .. .. .. .. 15.2 14.4 14.0 14.1 13.3 14.0 13.1 14.2 14.0 12.5 13.2 15.5 13.2
Employed with excessive
hours (more than 48 hours
actually worked per week),
% distribution .. .. .. .. .. .. .. .. .. .. 100.0 100.0 100.0 100.0 100.0 100.0 100.0 100.0 100.0 100.0 100.0 100.0 100.0
Men .. .. .. .. .. .. .. .. .. .. 57.9 57.2 57.0 57.0 56.4 56.2 55.9 56.6 57.1 55.7 56.0 57.8 56.7
Women .. .. .. .. .. .. .. .. .. .. 42.1 42.8 43.0 43.0 43.6 43.9 44.1 43.4 42.9 44.3 44.0 42.2 43.3
Agriculture .. .. .. .. .. .. .. .. .. .. 19.7 18.6 18.3 17.8 16.3 15.9 15.6 15.9 15.3 13.5 13.0 14.4 12.3
Industry .. .. .. .. .. .. .. .. .. .. 10.9 10.5 9.9 9.2 9.0 9.6 9.3 10.2 10.5 10.5 10.5 11.9 11.7
Services .. .. .. .. .. .. .. .. .. .. 69.5 71.0 71.8 73.0 74.6 74.5 75.1 73.9 74.2 76.0 76.5 73.7 76.0
Wage and salary workers .. .. .. .. .. .. .. .. .. .. 48.4 48.9 48.7 48.3 49.6 49.4 50.0 52.4 52.5 52.0 52.4 54.2 53.7
Employers .. .. .. .. .. .. .. .. .. .. 4.9 4.5 4.6 4.4 4.4 4.1 4.1 3.8 3.5 3.0 3.2 3.7 4.0
Self-employed .. .. .. .. .. .. .. .. .. .. 39.6 39.6 39.9 40.6 39.4 40.0 39.5 37.5 38.2 39.1 38.6 37.2 38.8
Unpaid family workers 7.1 7.0 6.7 6.8 6.5 6.6 6.3 6.3 5.9 5.8 5.8 5.0 3.5
Employed by hours actually
worked per week, % distribution .. .. .. .. .. .. .. .. .. .. 100.0 100.0 100.0 100.0 100.0 100.0 100.0 100.0 100.0 100.0 100.0 100.0 100.0
Less than 20 hours .. .. .. .. .. .. .. .. .. .. 11.9 12.5 11.5 11.1 11.9 11.1 12.1 12.5 11.7 12.9 12.7 11.6 12.6
20-29 .. .. .. .. .. .. .. .. .. .. 10.5 11.0 10.9 10.2 10.8 10.3 10.4 10.7 10.0 10.7 10.5 9.3 9.8
30-39 .. .. .. .. .. .. .. .. .. .. 11.3 11.3 11.6 11.3 11.7 11.3 11.0 11.4 10.9 11.0 10.5 9.6 9.9
40-48 .. .. .. .. .. .. .. .. .. .. 39.0 38.4 39.8 41.0 39.5 41.7 41.3 39.6 41.8 41.0 42.4 43.7 44.0
49 and over .. .. .. .. .. .. .. .. .. .. 26.0 25.3 25.0 25.2 24.7 24.6 24.0 24.7 24.7 23.2 22.8 25.0 22.8
Not reported .. .. .. .. .. .. .. .. .. .. 0.0 0.0 0.0 0.0 0.0 0.0 0.0 0.0 0.0 0.0 0.0 0.0 0.8
Did not work .. .. .. .. .. .. .. .. .. .. 1.3 1.4 1.2 1.3 1.5 1.1 1.1 1.1 1.0 1.2 1.0 0.8 0.8
Men .. .. .. .. .. .. .. .. .. .. 100.0 100.0 100.0 100.0 100.0 100.0 100.0 100.0 100.0 100.0 100.0 100.0 100.0
Less than 20 hours .. .. .. .. .. .. .. .. .. .. 9.8 10.5 9.6 9.1 9.9 9.1 10.1 10.5 9.6 10.8 10.5 9.3 10.8
20-29 .. .. .. .. .. .. .. .. .. .. 10.1 10.7 10.5 9.8 10.6 9.9 10.1 10.4 9.9 10.6 10.3 9.2 10.0
30-39 .. .. .. .. .. .. .. .. .. .. 12.5 12.6 12.7 12.4 12.9 12.5 12.3 12.6 12.0 12.1 11.8 10.6 11.1
40-48 .. .. .. .. .. .. .. .. .. .. 41.8 41.3 42.8 44.1 42.4 44.7 44.3 42.4 44.4 44.1 45.3 46.5 46.5
49 and over .. .. .. .. .. .. .. .. .. .. 24.6 23.6 23.3 23.4 22.8 22.7 22.1 23.0 23.2 21.4 21.2 23.6 20.9
Not reported .. .. .. .. .. .. .. .. .. .. 0.0 0.0 0.0 0.0 0.0 0.0 0.0 0.0 0.0 0.0 0.0 0.0 0.0
Did not work .. .. .. .. .. .. .. .. .. .. 1.2 1.3 1.1 1.2 1.4 1.1 1.1 1.0 0.9 1.1 0.9 0.7 0.8
Women .. .. .. .. .. .. .. .. .. .. 100.0 100.0 100.0 100.0 100.0 100.0 100.0 100.0 100.0 100.0 100.0 100.0 100.0
Less than 20 hours .. .. .. .. .. .. .. .. .. .. 15.2 15.7 14.6 14.1 14.9 14.0 15.2 15.7 14.9 16.2 16.0 15.1 15.7
20-29 .. .. .. .. .. .. .. .. .. .. 11.0 11.5 11.5 10.8 11.2 10.8 10.9 11.1 10.2 10.9 10.7 9.6 9.4
30-39 .. .. .. .. .. .. .. .. .. .. 9.4 9.4 9.9 9.5 9.8 9.4 9.1 9.4 9.0 9.3 8.6 8.2 7.8
40-48 .. .. .. .. .. .. .. .. .. .. 34.5 33.8 35.0 36.0 34.9 37.0 36.5 35.2 37.8 36.4 38.1 39.2 40.1
49 and over .. .. .. .. .. .. .. .. .. .. 28.3 28.0 27.8 28.1 27.6 27.5 26.9 27.4 27.0 26.0 25.4 27.1 26.1
Not reported .. .. .. .. .. .. .. .. .. .. 0.0 0.0 0.0 0.0 0.0 0.0 0.0 0.0 0.0 0.0 0.0 0.0 0.0
Did not work .. .. .. .. .. .. .. .. .. .. 1.5 1.6 1.3 1.5 1.6 1.2 1.3 1.2 1.1 1.3 1.2 0.9 0.9

Table 4. Decent hours
Decent Work Indicator 1995 1996 1997 1998 1999 2000 2001 2002 2003 2004 2005 2006 2007 2008 2009 2010 2011 2012 2013 2014 2015 2016 2017
Average weekly hours actually
worked per employed person .. .. .. .. .. .. .. .. .. .. 42.8 42.2 42.5 42.9 42.3 42.8 42.2 42.2 42.7 41.8 42.0 43.2 42.2
Men .. .. .. .. .. .. .. .. .. .. 42.8 42.1 42.4 42.7 42.1 42.6 42.2 42.2 42.7 41.8 42.0 43.3 42.0
Women .. .. .. .. .. .. .. .. .. .. 42.8 42.4 42.7 43.1 42.6 43.0 42.4 42.3 42.8 41.9 41.9 43.0 42.4
Agriculture .. .. .. .. .. .. .. .. .. .. 34.7 33.8 34.2 34.2 33.4 33.8 33.3 33.5 33.6 32.3 32.4 33.7 31.9
Industry .. .. .. .. .. .. .. .. .. .. 44.6 43.8 44.1 44.7 43.8 44.7 44.3 43.9 44.9 44.0 44.0 45.5 44.3
Services .. .. .. .. .. .. .. .. .. .. 48.2 47.9 47.9 48.5 47.8 47.9 47.3 47.1 47.4 46.6 46.4 47.1 46.1
Wage and salary workers .. .. .. .. .. .. .. .. .. .. 45.7 45.0 45.1 45.4 44.9 45.1 44.7 44.3 44.7 44.0 44.0 44.9 43.9
Employers .. .. .. .. .. .. .. .. .. .. 42.2 41.4 42.1 41.2 41.2 41.4 41.2 40.9 41.0 39.3 39.4 41.0 39.6
Self-employed .. .. .. .. .. .. .. .. .. .. 42.1 41.7 42.2 42.9 42.2 42.7 42.1 42.4 42.8 41.9 41.8 42.9 41.4
Unpaid family workers .. .. .. .. .. .. .. .. .. .. 32.8 32.2 32.2 32.6 31.7 32.4 31.1 31.9 32.1 30.7 31.0 32.1 29.0
IN PRIMARY JOB
Employed with excessive
hours (more than 48 hours
actually worked per week),
% of employed 22.4 21.5 23.2 22.1 21.6 24.0 21.5 22.2 22.6 23.2 23.6 23.0 22.6 23.0 22.5 22.3 21.7 22.5 22.5 21.3 20.9 22.7 21.3
Men 20.8 19.8 21.7 20.0 19.5 21.9 18.6 19.5 20.1 20.6 21.3 20.5 20.1 20.3 19.8 19.7 19.1 20.1 20.2 18.8 18.6 20.7 18.9
Women 25.1 24.4 25.8 25.6 25.0 27.5 26.0 26.5 26.5 27.5 27.3 26.9 26.6 27.1 26.6 26.4 25.8 26.3 25.9 25.1 24.4 26.0 25.3
Agriculture 12.3 11.1 12.6 10.6 10.2 13.0 8.9 9.4 10.2 10.2 10.6 9.5 9.2 9.1 8.3 8.2 7.8 8.7 8.6 7.2 7.2 9.5 8.6
Industry 13.8 13.1 14.6 12.5 11.4 14.9 12.0 13.4 13.2 14.9 15.9 15.6 14.5 13.9 13.4 13.9 13.1 14.4 14.8 13.5 12.9 14.8 13.2
Services 36.6 35.6 36.4 35.3 35.1 35.9 34.8 35.2 35.3 35.7 35.7 35.2 34.6 35.4 34.6 33.8 33.0 33.3 32.8 31.7 30.6 31.6 29.7
Wage and salary workers 21.0 20.6 22.3 20.7 20.2 22.1 19.7 20.7 21.3 22.1 22.9 22.3 21.5 21.5 21.3 20.5 19.9 20.7 20.4 19.2 18.6 20.1 18.4
Employers 26.1 22.1 27.0 25.7 21.0 23.5 18.9 19.5 19.0 19.5 22.0 22.1 22.9 22.4 22.7 22.2 23.4 22.9 22.0 19.8 20.6 23.6 22.2
Self-employed 28.2 27.3 28.6 27.7 28.0 30.6 28.6 28.8 29.0 29.4 28.6 27.9 28.4 29.6 28.8 29.5 28.8 29.8 30.5 29.5 29.1 31.1 29.8
Unpaid family workers 11.6 11.1 12.3 12.0 11.5 14.9 11.4 12.8 12.3 12.8 13.7 13.0 12.6 12.5 11.8 12.5 11.7 12.8 12.7 11.5 12.2 14.2 12.4
Employed with excessive
hours (more than 48 hours
actually worked per week),
% distribution 100.0 100.0 100.0 100.0 100.0 100.0 100.0 100.0 100.0 100.0 100.0 100.0 100.0 100.0 100.0 100.0 100.0 100.0 100.0 100.0 100.0 100.0 100.0
Men 59.1 58.1 58.9 56.8 56.2 57.2 53.3 53.5 54.9 55.2 55.6 54.8 54.4 54.5 53.9 53.7 53.3 54.2 54.7 53.5 53.8 55.5 55.1
Women 40.9 41.9 41.1 43.2 43.8 42.8 46.7 46.5 45.1 44.8 44.4 45.2 45.6 45.5 46.1 46.3 46.7 45.8 45.3 46.5 46.2 44.5 44.9
Agriculture 23.9 22.2 21.4 18.2 18.4 20.1 15.4 15.6 16.5 15.8 16.2 14.8 14.3 14.0 12.6 12.2 11.8 12.5 11.8 10.3 10.1 11.3 10.2
Industry 9.9 10.0 11.0 9.6 8.6 10.1 9.0 9.4 9.2 10.1 10.5 10.4 9.8 9.0 8.7 9.3 9.0 9.8 10.2 10.1 10.0 11.4 11.3
Services 66.1 67.9 67.6 72.1 73.0 69.9 75.5 75.0 74.3 74.1 73.3 74.8 75.9 77.0 78.7 78.5 79.3 77.8 77.9 79.6 80.0 77.3 78.5
Wage and salary workers 43.5 44.6 47.5 46.8 46.5 46.6 45.5 45.5 47.3 49.5 49.0 49.6 49.5 49.0 50.4 50.0 50.6 52.7 53.0 52.3 52.6 54.5 53.8
Employers 4.1 3.8 4.2 4.2 4.7 4.7 4.7 4.8 4.4 4.3 4.4 4.2 4.3 4.1 4.1 3.8 3.9 3.6 3.3 2.9 3.1 3.5 3.8
Self-employed 44.8 43.6 41.1 41.8 41.5 41.1 42.9 42.0 41.6 40.1 39.6 39.2 39.5 40.3 39.1 39.8 39.2 37.4 38.0 38.9 38.5 37.0 38.8
Unpaid family workers 7.7 8.0 7.2 7.1 7.3 7.6 6.9 7.7 6.7 6.2 7.0 6.9 6.7 6.7 6.3 6.4 6.2 6.3 5.8 5.8 5.8 5.0 3.5
Employed by hours actually
worked per week, % distribution 100.0 100.0 100.0 100.0 100.0 100.0 100.0 100.0 100.0 100.0 100.0 100.0 100.0 100.0 100.0 100.0 100.0 100.0 100.0 100.0 100.0 100.0 100.0
Less than 20 hours 9.4 10.9 9.9 10.4 10.4 10.1 12.7 13.5 13.1 13.8 13.2 14.0 12.9 12.4 13.3 12.4 13.7 14.0 13.1 14.4 14.1 12.9 13.8
20-29 11.4 12.0 10.4 11.2 11.2 10.8 12.3 12.1 11.9 11.7 11.4 11.9 11.8 11.1 11.8 11.2 11.3 11.5 10.8 11.4 11.2 10.0 10.3
30-39 13.2 13.4 12.2 12.4 12.9 11.9 12.4 11.9 11.9 11.2 11.4 11.5 11.9 11.6 11.8 11.5 11.2 11.5 11.0 11.0 10.5 9.7 9.8
40-48 42.4 41.1 43.1 42.1 42.5 41.9 39.3 38.2 38.9 38.0 38.9 38.0 39.5 40.6 39.0 41.2 40.8 39.2 41.5 40.6 42.1 43.7 43.9
49 and over 22.4 21.5 23.2 22.1 21.6 24.0 21.5 22.2 22.6 23.2 23.6 23.0 22.6 23.0 22.5 22.3 21.7 22.5 22.5 21.3 20.9 22.7 21.3
Not reported * * 0.0 0.0 0.0 0.0 0.0 0.0 0.0 0.0 0.0 0.0 0.0 0.0 0.0 0.0 0.0 0.0 0.0 0.0 0.0 0.0 0.0
Did not work 1.2 1.1 1.3 1.8 1.5 1.3 1.8 2.1 1.6 2.0 1.5 1.6 1.4 1.5 1.6 1.3 1.3 1.3 1.1 1.3 1.2 1.0 0.9
Men 100.0 100.0 100.0 100.0 100.0 100.0 100.0 100.0 100.0 100.0 100.0 100.0 100.0 100.0 100.0 100.0 100.0 100.0 100.0 100.0 100.0 100.0 100.0
Less than 20 hours 7.3 8.3 7.5 8.6 8.2 8.3 10.7 11.6 11.2 12.1 11.3 12.1 11.1 10.6 11.5 10.6 11.8 12.2 11.3 12.5 12.2 10.9 12.1
20-29 10.2 11.1 9.4 10.4 10.5 10.4 12.3 12.2 11.9 11.9 11.5 12.0 11.8 11.0 11.9 11.2 11.4 11.7 11.1 11.7 11.4 10.1 10.7
30-39 14.1 14.5 13.1 13.6 14.0 13.1 14.0 13.4 13.3 12.6 12.9 13.0 13.3 13.0 13.4 13.0 12.7 12.9 12.4 12.3 11.9 10.8 11.1
40-48 46.6 45.4 47.2 45.9 46.4 45.1 42.7 41.3 41.9 40.9 41.5 40.8 42.4 43.6 41.8 44.2 43.7 41.9 44.0 43.5 44.8 46.6 46.3
49 and over 20.8 19.8 21.7 20.0 19.5 21.9 18.6 19.5 20.1 20.6 21.3 20.5 20.1 20.3 19.8 19.7 19.1 20.1 20.2 18.8 18.6 20.7 18.9
Not reported * * 0.0 0.0 0.0 0.0 0.0 0.0 0.0 0.0 0.0 0.0 0.0 0.0 0.0 0.0 0.0 0.0 0.0 0.0 0.0 0.0 0.0
Did not work 1.0 1.0 1.1 1.5 1.3 1.2 1.7 2.0 1.5 1.9 1.5 1.5 1.3 1.4 1.6 1.3 1.3 1.2 1.0 1.3 1.1 1.0 0.9

Table 4. Decent hours
Decent Work Indicator 1995 1996 1997 1998 1999 2000 2001 2002 2003 2004 2005 2006 2007 2008 2009 2010 2011 2012 2013 2014 2015 2016 2017
Women 100.0 100.0 100.0 100.0 100.0 100.0 100.0 100.0 100.0 100.0 100.0 100.0 100.0 100.0 100.0 100.0 100.0 100.0 100.0 100.0 100.0 100.0 100.0
Less than 20 hours 13.2 15.3 13.9 13.6 13.8 13.1 15.9 16.6 16.1 16.8 16.4 17.0 15.7 15.2 16.2 15.2 16.5 17.0 16.0 17.3 17.1 16.1 16.6
20-29 13.4 13.5 12.0 12.6 12.5 11.5 12.3 12.0 12.0 11.5 11.3 11.8 11.8 11.2 11.5 11.1 11.2 11.3 10.4 11.1 10.9 9.7 9.6
30-39 11.6 11.5 10.5 10.3 11.0 9.9 10.0 9.5 9.6 8.7 8.9 9.0 9.6 9.3 9.5 9.2 8.8 9.2 8.9 9.0 8.3 8.0 7.6
40-48 35.1 33.8 36.1 35.8 36.0 36.5 33.8 33.3 34.2 33.4 34.6 33.6 34.8 35.7 34.5 36.7 36.3 35.0 37.6 36.2 38.0 39.2 40.0
49 and over 25.1 24.4 25.8 25.6 25.0 27.5 26.0 26.5 26.5 27.5 27.3 26.9 26.6 27.1 26.6 26.4 25.8 26.3 25.9 25.1 24.4 26.0 25.3
Not reported 0.0 * 0.0 0.0 0.0 0.0 0.0 0.0 0.0 0.0 0.0 0.0 0.0 0.0 0.0 0.0 0.0 0.0 0.0 0.0 0.0 0.0 0.0
Did not work 1.6 1.4 1.7 2.1 1.8 1.5 2.0 2.2 1.6 2.2 1.5 1.7 1.4 1.6 1.7 1.3 1.4 1.3 1.2 1.4 1.3 1.0 0.9
Average weekly hours actually
worked per employed person 42.0 41.2 42.5 41.8 41.6 42.7 40.9 40.8 41.1 41.2 41.6 41.1 41.4 41.8 41.2 41.7 41.1 41.2 41.7 40.8 41.0 42.2 41.4
Men 42.3 41.5 42.8 41.8 41.6 42.5 40.5 40.4 40.8 40.8 41.3 40.7 41.1 41.4 40.8 41.3 40.8 40.9 41.4 40.5 40.8 42.1 41.1
Women 41.5 40.5 41.9 41.8 41.5 43.0 41.5 41.3 41.5 41.9 42.1 41.7 42.0 42.5 42.0 42.3 41.7 41.7 42.1 41.2 41.3 42.4 41.845.8 45.8 45.8
Agriculture 35.2 34.1 34.8 33.6 33.8 35.0 32.1 31.7 32.0 32.0 32.5 31.7 32.2 32.3 31.4 31.8 31.1 31.4 31.5 30.3 30.4 31.7 30.3
Industry 44.4 43.5 45.0 44.2 43.9 44.6 42.9 43.1 43.3 43.3 44.0 43.3 43.6 44.2 43.2 44.1 43.7 43.4 44.3 43.5 43.5 45.0 43.9
Services 48.3 47.6 48.4 47.8 47.5 48.1 47.1 47.0 47.2 47.4 47.6 47.2 47.3 47.9 47.2 47.3 46.7 46.5 46.8 46.0 45.8 46.5 45.6
Wage and salary workers 45.4 44.7 46.0 45.2 44.9 45.4 44.0 44.1 44.3 44.3 45.0 44.3 44.4 44.8 44.2 44.5 44.0 43.6 44.0 43.4 43.4 44.3 43.4
Employers 42.6 40.5 42.9 42.2 40.5 40.9 37.9 37.7 37.6 37.6 39.3 39.4 40.0 39.2 39.1 39.3 39.2 39.0 39.0 37.5 37.5 39.0 37.9
Self-employed 41.7 41.0 41.7 40.8 40.9 42.2 40.7 40.4 40.6 40.6 40.5 40.1 40.6 41.2 40.5 41.0 40.3 40.6 41.1 40.1 40.2 41.2 40.1
Unpaid family workers 32.2 30.8 31.7 31.6 31.6 33.7 30.4 30.5 30.4 30.3 31.4 31.1 31.2 31.6 30.6 31.3 30.0 30.8 30.9 29.7 30.1 31.2 28.2
Difference between average
weekly hours actually worked
in all jobs and primary job .. .. .. .. .. .. .. .. .. .. 1.2 1.1 1.1 1.1 1.1 1.1 1.1 1.0 1.0 1.0 1.0 1.0 0.8
Men .. .. .. .. .. .. .. .. .. .. 1.5 1.4 1.3 1.3 1.3 1.3 1.4 1.3 1.3 1.3 1.2 1.2 0.9
Women .. .. .. .. .. .. .. .. .. .. 0.7 0.7 0.7 0.6 0.6 0.7 0.7 0.6 0.7 0.7 0.6 0.6 0.6
Agriculture .. .. .. .. .. .. .. .. .. .. 2.2 2.1 2.0 1.9 2.0 2.0 2.2 2.1 2.1 2.0 2.0 2.0 1.6
Industry .. .. .. .. .. .. .. .. .. .. 0.6 0.5 0.5 0.5 0.6 0.6 0.6 0.5 0.6 0.5 0.5 0.5 0.4
Services .. .. .. .. .. .. .. .. .. .. 0.6 0.7 0.6 0.6 0.6 0.6 0.6 0.6 0.6 0.6 0.6 0.6 0.5
Wage and salary workers .. .. .. .. .. .. .. .. .. .. 0.7 0.7 0.7 0.6 0.7 0.6 0.7 0.7 0.7 0.6 0.6 0.6 0.5
Employers .. .. .. .. .. .. .. .. .. .. 2.9 2.0 2.1 2.0 2.1 2.1 2.0 1.9 2.0 1.8 1.9 2.0 1.7
Self-employed .. .. .. .. .. .. .. .. .. .. 1.6 1.6 1.6 1.7 1.7 1.7 1.8 1.8 1.7 1.8 1.6 1.7 1.3
Unpaid family workers .. .. .. .. .. .. .. .. .. .. 1.4 1.1 1.0 1.0 1.1 1.1 1.1 1.1 1.2 1.0 0.9 0.9 0.8
Underemployment rate2, in % 20.0 21.0 21.9 21.6 22.1 21.7 17.2 17.0 17.0 17.6 21.0 22.6 20.1 19.3 19.1 18.8 19.3 20.0 19.3 18.4 18.5 18.3 16.1
Men 21.8 23.0 23.8 23.9 24.9 24.0 19.8 19.7 19.6 20.1 23.6 25.4 22.9 22.0 21.7 21.3 21.8 22.4 21.8 20.8 20.9 20.7 17.8
Women 16.9 17.7 18.6 17.8 17.5 17.8 13.0 12.8 13.0 13.5 16.8 18.1 15.8 14.9 15.0 14.8 15.4 16.2 15.5 14.7 14.9 14.6 13.4
Agriculture 24.5 25.5 26.5 26.5 26.2 26.2 22.1 22.2 22.6 23.5 26.7 28.7 26.7 26.1 25.6 25.6 25.4 26.8 26.4 25.2 25.7 25.9 21.3
Industry 19.2 21.2 21.9 22.3 23.5 22.2 18.2 18.4 17.1 17.5 21.9 23.6 20.2 19.7 19.8 19.3 20.6 20.8 19.9 19.9 20.3 19.0 17.6
Services 15.5 16.3 17.7 17.3 18.0 17.9 12.9 12.4 12.7 13.3 16.5 17.8 15.4 14.4 14.5 14.2 15.0 15.6 15.1 14.1 14.2 14.4 13.3
Wage and salary workers 18.7 19.7 20.8 21.0 22.1 21.2 17.3 16.8 16.7 17.0 20.0 21.5 18.6 17.9 17.8 17.5 18.5 19.3 18.4 17.4 17.4 17.1 15.6
Employers 15.9 18.6 16.9 18.0 19.2 19.2 16.1 17.3 18.0 17.0 17.9 19.0 18.0 16.8 16.7 16.6 16.0 15.7 16.0 14.5 14.8 15.2 15.2
Self-employed 21.6 22.8 23.8 22.8 22.9 22.8 17.2 17.7 17.6 18.7 23.3 25.0 22.8 21.7 21.6 21.2 21.6 22.3 21.9 21.3 21.7 21.7 18.1
Unpaid family workers 21.4 21.6 22.6 22.0 21.4 21.9 16.9 16.1 16.4 18.1 20.0 21.9 20.3 20.0 19.2 19.0 18.1 19.3 18.7 17.5 17.6 17.4 13.6
Visible underemployment
rate3, in % 10.2 11.2 10.7 11.5 11.7 11.1 11.0 11.1 10.5 11.0 12.6 13.9 12.0 11.8 11.8 11.1 11.7 11.9 11.3 11.3 10.9 10.1 9.3
Men 10.3 11.3 10.6 12.0 12.4 11.6 12.2 12.5 11.7 12.2 13.8 15.2 13.3 13.1 13.0 12.2 12.8 13.0 12.4 12.4 11.9 11.0 9.9
Women 10.0 10.9 10.8 10.7 10.5 10.1 9.0 8.8 8.7 9.0 10.8 11.8 10.1 9.7 9.8 9.4 9.9 10.3 9.7 9.7 9.4 8.7 8.2
Agriculture 15.1 16.4 16.4 17.9 17.1 16.7 16.7 17.1 16.7 17.9 19.8 21.7 19.8 19.7 19.6 19.2 19.7 20.2 20.0 19.7 19.6 18.9 16.7
Industry 7.1 8.5 6.9 8.2 9.0 8.2 9.1 9.5 8.1 8.3 9.9 11.1 9.0 8.8 9.2 8.2 8.7 9.1 8.1 8.7 8.5 7.1 7.4
Services 6.1 6.8 7.0 7.5 7.9 7.6 7.1 6.8 6.6 6.7 8.2 9.0 7.5 7.1 7.3 6.8 7.5 7.7 7.2 7.2 7.0 6.8 6.5
Wage and salary workers 7.3 8.5 7.6 8.8 9.3 8.6 9.4 9.3 8.6 8.8 9.9 10.9 9.1 8.9 9.2 8.4 9.1 9.8 9.1 9.0 8.6 7.9 7.5
Employers 8.9 11.0 9.7 10.4 10.7 10.6 11.3 12.3 12.4 12.2 11.6 12.2 11.0 11.2 10.9 11.0 10.5 10.1 10.5 10.1 9.9 9.7 10.1
Self-employed 11.9 12.9 13.1 13.9 13.9 13.4 12.2 12.7 12.2 12.9 16.0 17.5 15.4 15.1 15.0 14.6 15.3 15.3 14.8 15.0 14.9 14.2 12.8
Unpaid family workers 15.3 15.7 16.2 16.2 15.5 15.4 13.7 13.0 13.0 15.0 15.4 17.4 16.1 15.8 15.5 15.0 14.8 15.3 14.7 14.2 13.9 13.4 11.2

Table 4. Decent hours
Decent Work Indicator 1995 1996 1997 1998 1999 2000 2001 2002 2003 2004 2005 2006 2007 2008 2009 2010 2011 2012 2013 2014 2015 2016 2017
Time-related underemployment
rate1/4
, in % .. .. .. .. .. .. .. .. .. .. 11.8 12.2 10.5 10.3 10.3 9.6 10.2 10.5 10.0 10.1 9.7 8.9 8.4
Men .. .. .. .. .. .. .. .. .. .. 12.4 12.9 11.2 11.0 11.0 10.2 10.8 11.1 10.5 10.8 10.3 9.3 8.8
Women .. .. .. .. .. .. .. .. .. .. 10.8 11.1 9.4 9.0 9.2 8.7 9.2 9.7 9.0 9.2 8.8 8.2 7.8
Agriculture .. .. .. .. .. .. .. .. .. .. 17.2 18.2 16.6 16.4 16.3 15.8 16.3 17.0 16.9 17.0 16.8 15.7 14.5
Industry .. .. .. .. .. .. .. .. .. .. 9.8 10.4 8.3 8.1 8.5 7.5 8.0 8.4 7.3 8.1 7.9 6.4 7.0
Services .. .. .. .. .. .. .. .. .. .. 8.4 8.4 6.9 6.6 6.8 6.3 6.9 7.2 6.7 6.8 6.5 6.3 6.1
Wage and salary workers .. .. .. .. .. .. .. .. .. .. 9.7 10.1 8.3 8.2 8.4 7.7 8.4 9.0 8.3 8.4 7.9 7.2 7.0
Employers .. .. .. .. .. .. .. .. .. .. 8.8 9.0 8.5 8.5 8.3 8.0 7.8 7.8 8.4 8.0 7.8 7.6 8.3
Self-employed .. .. .. .. .. .. .. .. .. .. 14.6 14.9 12.9 12.5 12.5 12.0 12.6 12.8 12.4 12.9 12.8 11.9 11.2
Unpaid family workers .. .. .. .. .. .. .. .. .. .. 14.1 15.4 14.6 14.0 13.8 13.0 13.1 13.4 13.2 13.0 12.7 11.9 10.3
Notes: 1. Annualized data for 2014 from the Labor Force Survey is the average of estimates for April, July and October survey rounds. The estimates for these rounds exclude data
for Leyte province only while that of January exclude Region VIII.
2. Annualized data for 2015 from the Labor Force Survey is the average of estimates for January, April, July and October survey rounds. The estimates for these rounds exclude data
for Leyte province only. The use of the four survey rounds that exclude Leyte was based on the results of the referendum conducted among members of the Inter-Agency Committee
1 LFS began collecting data on the number of persons with more than one job and hours worked in all jobs in April 2005 survey round. 2005 data refer
to averages of the estimates for April, July and October. Data disaggregation based on primary job.2
Total employed who wanted additional work (wanted additional hours of work in their present job, or to have additional job, or a new job with longer
working hours) as a percentage share of total employed.3
Total employed who wanted additional work and worked less than 40 hours in primary job as a percentage share of total employed. Visible underemployment
is the concept used in the Philippine LFS.4
Total employed who wanted additional work and worked less than 40 hours in all jobs as a percentage share of total employed. Definition of time-related
underemployment not strictly comparable with international standard as the criterion of availability for additional work not asked in the LFS.
* Less than half the unit used.
Source: Philippine Statistics Authority, Labor Force Survey.
Date updated: 09/21/2018
on Labor and Productivity Statistics.

Table 4. Decent hours
Decent Work Indicator and
Underlying Data1995 1996 1997 1998 1999 2000 2001 2002 2003 2004 2005 2006 2007 2008 2009 2010 2011 2012 2013 2014 2015 2016 2017
Employed with excessive hours
(more than 48 hours actually
worked per week), in all jobs1/2
,
% of employed .. .. .. .. .. .. .. .. .. .. 26.0 25.3 25.0 25.2 24.7 24.6 24.0 24.7 24.7 23.2 22.8 25.0 22.8
Men .. .. .. .. .. .. .. .. .. .. 24.6 23.6 23.3 23.4 22.8 22.7 22.1 23.0 23.2 21.4 21.2 23.6 20.9
Women .. .. .. .. .. .. .. .. .. .. 28.3 28.0 27.8 28.1 27.6 27.5 26.9 27.4 27.0 26.0 25.4 27.1 26.1
Agriculture .. .. .. .. .. .. .. .. .. .. 14.2 13.1 13.0 12.7 11.7 11.7 11.3 12.3 12.1 10.3 10.2 13.3 11.1
Industry .. .. .. .. .. .. .. .. .. .. 18.3 17.4 16.3 15.7 15.4 15.8 15.0 16.5 16.7 15.3 14.8 17.0 14.6
Services .. .. .. .. .. .. .. .. .. .. 37.3 36.7 36.2 36.9 36.1 35.3 34.6 34.8 34.3 33.0 32.0 33.1 30.8
Wage and salary workers .. .. .. .. .. .. .. .. .. .. 25.0 24.2 23.4 23.2 23.0 22.3 21.7 22.7 22.2 20.9 20.2 22.0 19.6
Employers .. .. .. .. .. .. .. .. .. .. 27.0 26.3 27.2 26.3 26.7 25.9 26.9 26.4 25.9 22.5 23.7 27.2 24.4
Self-employed .. .. .. .. .. .. .. .. .. .. 31.4 31.1 31.7 32.7 31.9 32.6 32.1 32.8 33.7 32.3 31.9 34.3 31.9
Unpaid family workers .. .. .. .. .. .. .. .. .. .. 15.2 14.4 14.0 14.1 13.3 14.0 13.1 14.2 14.0 12.5 13.2 15.5 13.2
Employed with excessive hours
(more than 48 hours actually
worked per week), in all jobs1/2
,
% distribution .. .. .. .. .. .. .. .. .. .. 100.0 100.0 100.0 100.0 100.0 100.0 100.0 100.0 100.0 100.0 100.0 100.0 100.0
Men .. .. .. .. .. .. .. .. .. .. 57.9 57.2 57.0 57.0 56.4 56.2 55.9 56.6 57.1 55.7 56.0 57.8 56.7
Women .. .. .. .. .. .. .. .. .. .. 42.1 42.8 43.0 43.0 43.6 43.9 44.1 43.4 42.9 44.3 44.0 42.2 43.30.0
Agriculture .. .. .. .. .. .. .. .. .. .. 19.7 18.6 18.3 17.8 16.3 15.9 15.6 15.9 15.3 13.5 13.0 14.4 12.3
Industry .. .. .. .. .. .. .. .. .. .. 10.9 10.5 9.9 9.2 9.0 9.6 9.3 10.2 10.5 10.5 10.5 11.9 11.7
Services .. .. .. .. .. .. .. .. .. .. 69.5 71.0 71.8 73.0 74.6 74.5 75.1 73.9 74.2 76.0 76.5 73.7 76.0
Wage and salary workers .. .. .. .. .. .. .. .. .. .. 48.4 48.9 48.7 48.3 49.6 49.4 50.0 52.4 52.5 52.0 52.4 54.2 53.7
Employers .. .. .. .. .. .. .. .. .. .. 4.9 4.5 4.6 4.4 4.4 4.1 4.1 3.8 3.5 3.0 3.2 3.7 4.0
Self-employed .. .. .. .. .. .. .. .. .. .. 39.6 39.6 39.9 40.6 39.4 40.0 39.5 37.5 38.2 39.1 38.6 37.2 38.8
Unpaid family workers .. .. .. .. .. .. .. .. .. .. 7.1 7.0 6.7 6.8 6.5 6.6 6.3 6.3 5.9 5.8 5.8 5.0 3.5
Total employed with excessive
hours (more than 48 hoursactually worked per week), in
all jobs1/2
(000) .. .. .. .. .. .. .. .. .. .. 8467 8264 8395 8595 8660 8848 8923 9304 9413 8980 8845 10231 9213
Men .. .. .. .. .. .. .. .. .. .. 4902 4725 4781 4901 4884 4969 4989 5264 5371 5005 4952 5912 5227
Women .. .. .. .. .. .. .. .. .. .. 3564 3539 3614 3694 3776 3880 3934 4040 4042 3976 3893 4319 39866876
Agriculture .. .. .. .. .. .. .. .. .. .. 1666 1533 1534 1526 1415 1404 1390 1482 1437 1213 1152 1477 1136
Industry .. .. .. .. .. .. .. .. .. .. 920 867 834 792 783 853 831 946 992 942 926 1215 1079
Services .. .. .. .. .. .. .. .. .. .. 5881 5864 6027 6277 6462 6592 6703 6876 6984 6825 6767 7540 6998
Employed with excessive hours (more than 48 hours actually worked per week), in all jobs

Table 4. Decent hours
Decent Work Indicator and
Underlying Data1995 1996 1997 1998 1999 2000 2001 2002 2003 2004 2005 2006 2007 2008 2009 2010 2011 2012 2013 2014 2015 2016 2017
Wage and salary workers .. .. .. .. .. .. .. .. .. .. 4099 4039 4092 4149 4299 4368 4464 4872 4939 4672 4636 5543 4951
Employers .. .. .. .. .. .. .. .. .. .. 413 375 389 375 384 361 364 353 330 272 287 374 364
Self-employed .. .. .. .. .. .. .. .. .. .. 3353 3275 3348 3487 3416 3537 3529 3489 3592 3515 3411 3807 3577
Unpaid family workers .. .. .. .. .. .. .. .. .. .. 602 576 566 585 561 582 566 590 552 521 510 508 321
Total employed2 (000) 25677 27186 26365 26631 27742 27452 29156 30062 30635 31613 32539 32636 33560 34089 35061 36035 37192 37600 38118 38651 38741 40998 40334
Men 16322 17170 16610 16714 17253 17193 17923 18306 18873 19646 19961 20013 20542 20959 21404 21921 22573 22849 23150 23365 23406 25035 25067
Women 9354 10016 9754 9917 10489 10259 11232 11756 11762 11968 12579 12622 13018 13129 13657 14114 14619 14751 14968 15286 15335 15963 15267
Agriculture 11147 11645 10416 10091 10774 10181 10850 11122 11220 11381 11718 11682 11786 12030 12044 11956 12267 12093 11835 11801 11294 11064 10261
Industry 4140 4431 4582 4542 4515 4454 4713 4695 4840 4999 5040 4997 5121 5048 5092 5399 5530 5743 5937 6167 6275 7159 7370
Services 10391 11112 11367 11998 12452 12817 13593 14246 14577 15237 15782 15957 16654 17012 17924 18682 19394 19764 20345 20683 21172 22775 22703
Wage and salary workers 11870 12649 13043 13285 13761 13925 14438 14653 15354 16472 16384 16673 17508 17846 18681 19626 20538 21492 22247 22407 22960 25240 25209
Employers 894 996 949 966 1341 1315 1552 1662 1605 1604 1528 1425 1430 1426 1438 1394 1354 1335 1272 1210 1212 1376 1491
Self-employed 9111 9330 8774 8891 8864 8869 9375 9737 9912 10011 10669 10525 10570 10654 10724 10858 10994 10626 10668 10869 10705 11097 11198
Unpaid family workers 3801 4211 3600 3490 3775 3344 3792 4009 3765 3527 3958 4012 4052 4161 4218 4157 4306 4147 3930 4166 3863 3285 2437
Notes: 1. Annualized data for 2014 from the Labor Force Survey is the average of estimates for April, July and October survey rounds. The estimates for these rounds exclude data for Leyte province only while that of January exclude Region VIII.
2. Annualized data for 2015 from the Labor Force Survey is the average of estimates for January, April, July and October survey rounds. The estimates for these rounds exclude data for Leyte province only. The use of the
four survey rounds was based on the results of the referendum conducted among members of the Inter-Agency Committee on Labor and Productivity Statistics.
3. See Metadata of Statistical Indicators on Decent Work for definitions and other information.
1 Data disaggregation based on primary job.
2 2005 data refer to average of April, July and October as the inquiry on hours worked in all jobs began in April 2005 round of the LFS.
Source: Philippine Statistics Authority, Labor Force Survey.
Employed with excessive hours (more than 48 hours actually worked per week), in all jobs
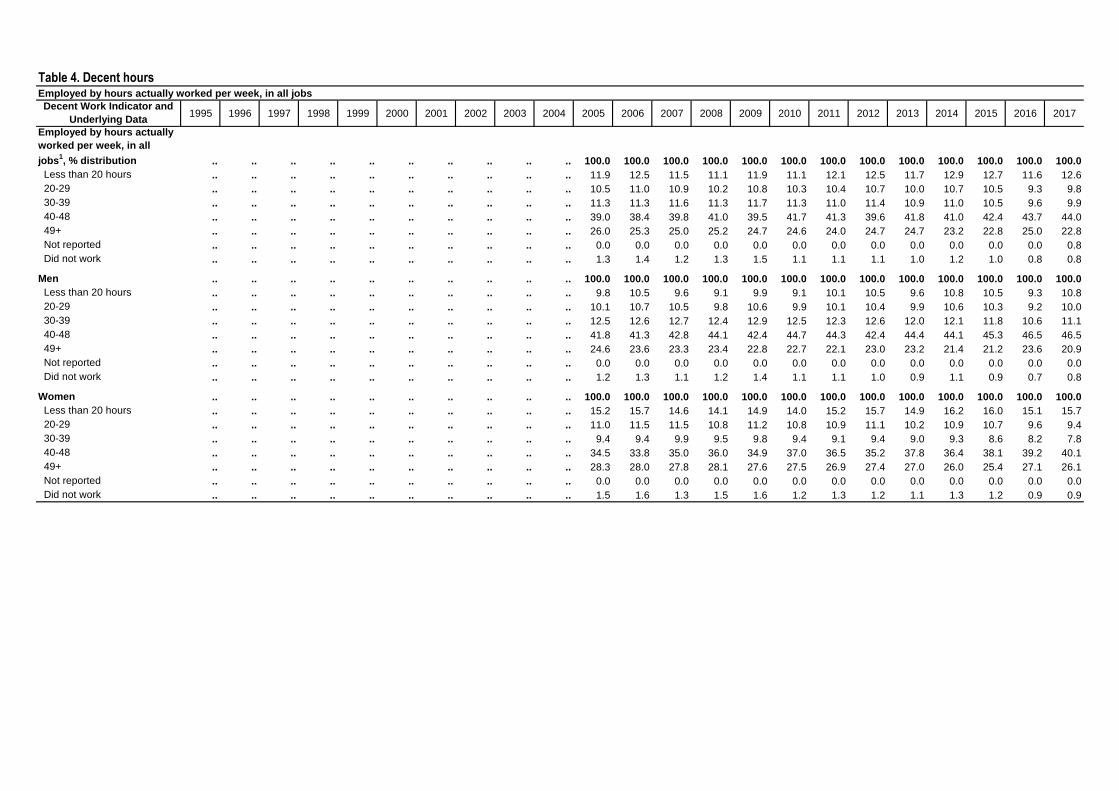
Table 4. Decent hoursEmployed by hours actually worked per week, in all jobs
Decent Work Indicator and
Underlying Data1995 1996 1997 1998 1999 2000 2001 2002 2003 2004 2005 2006 2007 2008 2009 2010 2011 2012 2013 2014 2015 2016 2017
Employed by hours actually
worked per week, in all
jobs1, % distribution .. .. .. .. .. .. .. .. .. .. 100.0 100.0 100.0 100.0 100.0 100.0 100.0 100.0 100.0 100.0 100.0 100.0 100.0
Less than 20 hours .. .. .. .. .. .. .. .. .. .. 11.9 12.5 11.5 11.1 11.9 11.1 12.1 12.5 11.7 12.9 12.7 11.6 12.6
20-29 .. .. .. .. .. .. .. .. .. .. 10.5 11.0 10.9 10.2 10.8 10.3 10.4 10.7 10.0 10.7 10.5 9.3 9.8
30-39 .. .. .. .. .. .. .. .. .. .. 11.3 11.3 11.6 11.3 11.7 11.3 11.0 11.4 10.9 11.0 10.5 9.6 9.9
40-48 .. .. .. .. .. .. .. .. .. .. 39.0 38.4 39.8 41.0 39.5 41.7 41.3 39.6 41.8 41.0 42.4 43.7 44.0
49+ .. .. .. .. .. .. .. .. .. .. 26.0 25.3 25.0 25.2 24.7 24.6 24.0 24.7 24.7 23.2 22.8 25.0 22.8
Not reported .. .. .. .. .. .. .. .. .. .. 0.0 0.0 0.0 0.0 0.0 0.0 0.0 0.0 0.0 0.0 0.0 0.0 0.8
Did not work .. .. .. .. .. .. .. .. .. .. 1.3 1.4 1.2 1.3 1.5 1.1 1.1 1.1 1.0 1.2 1.0 0.8 0.8
Men .. .. .. .. .. .. .. .. .. .. 100.0 100.0 100.0 100.0 100.0 100.0 100.0 100.0 100.0 100.0 100.0 100.0 100.0
Less than 20 hours .. .. .. .. .. .. .. .. .. .. 9.8 10.5 9.6 9.1 9.9 9.1 10.1 10.5 9.6 10.8 10.5 9.3 10.8
20-29 .. .. .. .. .. .. .. .. .. .. 10.1 10.7 10.5 9.8 10.6 9.9 10.1 10.4 9.9 10.6 10.3 9.2 10.0
30-39 .. .. .. .. .. .. .. .. .. .. 12.5 12.6 12.7 12.4 12.9 12.5 12.3 12.6 12.0 12.1 11.8 10.6 11.1
40-48 .. .. .. .. .. .. .. .. .. .. 41.8 41.3 42.8 44.1 42.4 44.7 44.3 42.4 44.4 44.1 45.3 46.5 46.5
49+ .. .. .. .. .. .. .. .. .. .. 24.6 23.6 23.3 23.4 22.8 22.7 22.1 23.0 23.2 21.4 21.2 23.6 20.9
Not reported .. .. .. .. .. .. .. .. .. .. 0.0 0.0 0.0 0.0 0.0 0.0 0.0 0.0 0.0 0.0 0.0 0.0 0.0
Did not work .. .. .. .. .. .. .. .. .. .. 1.2 1.3 1.1 1.2 1.4 1.1 1.1 1.0 0.9 1.1 0.9 0.7 0.8
Women .. .. .. .. .. .. .. .. .. .. 100.0 100.0 100.0 100.0 100.0 100.0 100.0 100.0 100.0 100.0 100.0 100.0 100.0
Less than 20 hours .. .. .. .. .. .. .. .. .. .. 15.2 15.7 14.6 14.1 14.9 14.0 15.2 15.7 14.9 16.2 16.0 15.1 15.7
20-29 .. .. .. .. .. .. .. .. .. .. 11.0 11.5 11.5 10.8 11.2 10.8 10.9 11.1 10.2 10.9 10.7 9.6 9.4
30-39 .. .. .. .. .. .. .. .. .. .. 9.4 9.4 9.9 9.5 9.8 9.4 9.1 9.4 9.0 9.3 8.6 8.2 7.8
40-48 .. .. .. .. .. .. .. .. .. .. 34.5 33.8 35.0 36.0 34.9 37.0 36.5 35.2 37.8 36.4 38.1 39.2 40.1
49+ .. .. .. .. .. .. .. .. .. .. 28.3 28.0 27.8 28.1 27.6 27.5 26.9 27.4 27.0 26.0 25.4 27.1 26.1
Not reported .. .. .. .. .. .. .. .. .. .. 0.0 0.0 0.0 0.0 0.0 0.0 0.0 0.0 0.0 0.0 0.0 0.0 0.0
Did not work .. .. .. .. .. .. .. .. .. .. 1.5 1.6 1.3 1.5 1.6 1.2 1.3 1.2 1.1 1.3 1.2 0.9 0.9

Table 4. Decent hoursEmployed by hours actually worked per week, in all jobs
Decent Work Indicator and
Underlying Data1995 1996 1997 1998 1999 2000 2001 2002 2003 2004 2005 2006 2007 2008 2009 2010 2011 2012 2013 2014 2015 2016 2017
Total employed by hours
actually worked per week,
in all jobs1
(000) .. .. .. .. .. .. .. .. .. .. 32539 32636 33560 34089 35061 36035 37192 37600 38118 38651 38741 40998 40334
Less than 20 hours .. .. .. .. .. .. .. .. .. .. 3862 4084 3868 3767 4158 3988 4507 4706 4457 4995 4929 4740 5102
20-29 .. .. .. .. .. .. .. .. .. .. 3406 3586 3653 3470 3793 3705 3883 4020 3806 4137 4053 3831 3938
30-39 .. .. .. .. .. .. .. .. .. .. 3684 3700 3883 3844 4096 4067 4100 4279 4137 4237 4068 3950 3978
40-48 .. .. .. .. .. .. .. .. .. .. 12684 12538 13358 13964 13837 15019 15352 14872 15939 15850 16441 17913 17766
49+ .. .. .. .. .. .. .. .. .. .. 8467 8264 8395 8595 8660 8848 8923 9304 9413 8980 8845 10231 9213
Not reported .. .. .. .. .. .. .. .. .. .. 0 0 0 0 0 0 0 0 0 0 0 0 0
Did not work .. .. .. .. .. .. .. .. .. .. 436 462 404 449 516 407 426 418 366 452 405 332 337
Men .. .. .. .. .. .. .. .. .. .. 19961 20013 20542 20959 21404 21921 22573 22849 23150 23365 23406 25035 25067
Less than 20 hours .. .. .. .. .. .. .. .. .. .. 1953 2107 1971 1915 2125 2005 2281 2389 2228 2525 2468 2333 2704
20-29 .. .. .. .. .. .. .. .. .. .. 2020 2134 2158 2051 2261 2177 2284 2386 2282 2468 2413 2306 2500
30-39 .. .. .. .. .. .. .. .. .. .. 2498 2516 2600 2603 2761 2740 2770 2886 2784 2823 2757 2649 2781
40-48 .. .. .. .. .. .. .. .. .. .. 8341 8268 8801 9241 9076 9796 10010 9687 10288 10293 10593 11649 11650
49+ .. .. .. .. .. .. .. .. .. .. 4902 4725 4781 4901 4884 4969 4989 5264 5371 5005 4952 5912 5227
Not reported .. .. .. .. .. .. .. .. .. .. 0 0 0 0 0 0 0 0 0 0 0 0 0
Did not work .. .. .. .. .. .. .. .. .. .. 246 263 231 249 296 234 240 238 198 252 222 186 204
Women .. .. .. .. .. .. .. .. .. .. 12579 12622 13018 13129 13657 14114 14619 14751 14968 15286 15335 15963 15267
Less than 20 hours .. .. .. .. .. .. .. .. .. .. 1909 1977 1898 1853 2033 1983 2227 2318 2229 2470 2461 2407 2398
20-29 .. .. .. .. .. .. .. .. .. .. 1386 1452 1495 1419 1531 1528 1600 1634 1524 1668 1640 1525 1438
30-39 .. .. .. .. .. .. .. .. .. .. 1186 1184 1283 1241 1335 1327 1329 1393 1353 1414 1312 1302 1197
40-48 .. .. .. .. .. .. .. .. .. .. 4342 4271 4556 4723 4761 5224 5343 5186 5651 5557 5848 6264 6116
49+ .. .. .. .. .. .. .. .. .. .. 3564 3539 3614 3694 3776 3880 3934 4040 4042 3976 3893 4319 3986
Not reported .. .. .. .. .. .. .. .. .. .. 0 0 0 0 0 0 0 0 0 0 0 0 0
Did not work .. .. .. .. .. .. .. .. .. .. 190 199 173 200 220 173 186 180 168 201 182 147 133
Notes: 1. Annualized data for 2014 from the Labor Force Survey is the average of estimates for April, July and October survey rounds. The estimates for these rounds exclude data for Leyte province only while that of January exclude Region VIII.
2. Annualized data for 2015 from the Labor Force Survey is the average of estimates for January, April, July and October survey rounds. The estimates for these rounds exclude data for Leyte province only. The use of the
four survey rounds was based on the results of the referendum conducted among members of the Inter-Agency Committee on Labor and Productivity Statistics.
3. See Metadata of Statistical Indicators on Decent Work for definitions and other information.
1 2005 data refers to average of April, July and October as the inquiry on hours worked in all jobs began in April 2005 round of the LFS.
Source: Philippine Statistics Authority, Labor Force Survey.

Table 4. Decent hours
Decent Work Indicator and
Underlying Data1995 1996 1997 1998 1999 2000 2001 2002 2003 2004 2005 2006 2007 2008 2009 2010 2011 2012 2013 2014 2015 2016 2017
Employed with excessive hours
(more than 48 hours actually
worked per week), in primary
job, % of employed 22.4 21.5 23.2 22.1 21.6 24.0 21.5 22.2 22.6 23.2 23.6 23.0 22.6 23.0 22.5 22.3 21.7 22.5 22.5 21.3 20.9 22.7 21.3
Men 20.8 19.8 21.7 20.0 19.5 21.9 18.6 19.5 20.1 20.6 21.3 20.5 20.1 20.3 19.8 19.7 19.1 20.1 20.2 18.8 18.6 20.7 18.9
Women 25.1 24.4 25.8 25.6 25.0 27.5 26.0 26.5 26.5 27.5 27.3 26.9 26.6 27.1 26.6 26.4 25.8 26.3 25.9 25.1 24.4 26.0 25.3
Agriculture 12.3 11.1 12.6 10.6 10.2 13.0 8.9 9.4 10.2 10.2 10.6 9.5 9.2 9.1 8.3 8.2 7.8 8.7 8.6 7.2 7.2 9.5 8.6
Industry 13.8 13.1 14.6 12.5 11.4 14.9 12.0 13.4 13.2 14.9 15.9 15.6 14.5 13.9 13.4 13.9 13.1 14.4 14.8 13.5 12.9 14.8 13.2
Services 36.6 35.6 36.4 35.3 35.1 35.9 34.8 35.2 35.3 35.7 35.7 35.2 34.6 35.4 34.6 33.8 33.0 33.3 32.8 31.7 30.6 31.6 29.7
Wage and salary workers 21.0 20.6 22.3 20.7 20.2 22.1 19.7 20.7 21.3 22.1 22.9 22.3 21.5 21.5 21.3 20.5 19.9 20.7 20.4 19.2 18.6 20.1 18.4
Employers 26.1 22.1 27.0 25.7 21.0 23.5 18.9 19.5 19.0 19.5 22.0 22.1 22.9 22.4 22.7 22.2 23.4 22.9 22.0 19.8 20.6 23.6 22.2
Self-employed 28.2 27.3 28.6 27.7 28.0 30.6 28.6 28.8 29.0 29.4 28.6 27.9 28.4 29.6 28.8 29.5 28.8 29.8 30.5 29.5 29.1 31.1 29.8
Unpaid family workers 11.6 11.1 12.3 12.0 11.5 14.9 11.4 12.8 12.3 12.8 13.7 13.0 12.6 12.5 11.8 12.5 11.7 12.8 12.7 11.5 12.2 14.2 12.4
Employed with excessive hours
(more than 48 hours actually
worked per week), in primary
job, % distribution 100.0 100.0 100.0 100.0 100.0 100.0 100.0 100.0 100.0 100.0 100.0 100.0 100.0 100.0 100.0 100.0 100.0 100.0 100.0 100.0 100.0 100.0 100.0
Men 59.1 58.1 58.9 56.8 56.2 57.2 53.3 53.5 54.9 55.2 55.6 54.8 54.4 54.5 53.9 53.7 53.3 54.2 54.7 53.5 53.8 55.5 55.1
Women 40.9 41.9 41.1 43.2 43.8 42.8 46.7 46.5 45.1 44.8 44.4 45.2 45.6 45.5 46.1 46.3 46.7 45.8 45.3 46.5 46.2 44.5 44.9
Agriculture 23.9 22.2 21.4 18.2 18.4 20.1 15.4 15.6 16.5 15.8 16.2 14.8 14.3 14.0 12.6 12.2 11.8 12.5 11.8 10.3 10.1 11.3 10.2
Industry 9.9 10.0 11.0 9.6 8.6 10.1 9.0 9.4 9.2 10.1 10.5 10.4 9.8 9.0 8.7 9.3 9.0 9.8 10.2 10.1 10.0 11.4 11.3
Services 66.1 67.9 67.6 72.1 73.0 69.9 75.5 75.0 74.3 74.1 73.3 74.8 75.9 77.0 78.7 78.5 79.3 77.8 77.9 79.6 80.0 77.3 78.5
Wage and salary workers 43.5 44.6 47.5 46.8 46.5 46.6 45.5 45.5 47.3 49.5 49.0 49.6 49.5 49.0 50.4 50.0 50.6 52.7 53.0 52.3 52.6 54.5 53.8
Employers 4.1 3.8 4.2 4.2 4.7 4.7 4.7 4.8 4.4 4.3 4.4 4.2 4.3 4.1 4.1 3.8 3.9 3.6 3.3 2.9 3.1 3.5 3.8
Self-employed 44.8 43.6 41.1 41.8 41.5 41.1 42.9 42.0 41.6 40.1 39.6 39.2 39.5 40.3 39.1 39.8 39.2 37.4 38.0 38.9 38.5 37.0 38.8
Unpaid family workers 7.7 8.0 7.2 7.1 7.3 7.6 6.9 7.7 6.7 6.2 7.0 6.9 6.7 6.7 6.3 6.4 6.2 6.3 5.8 5.8 5.8 5.0 3.5
Total employed with excessive
hours (more than 48 hours
actually worked per week), in
primary job (000) 5742 5836 6114 5876 5981 6589 6261 6683 6921 7348 7629 7495 7601 7824 7883 8048 8081 8461 8561 8233 8105 9323 8607
Men 3394 3392 3602 3336 3359 3772 3335 3573 3802 4054 4242 4105 4136 4263 4245 4318 4311 4586 4679 4401 4358 5177 4744
Women 2348 2444 2512 2540 2621 2817 2925 3110 3119 3294 3387 3390 3465 3562 3638 3730 3770 3875 3882 3832 3747 4146 3863
Agriculture 1374 1294 1309 1071 1099 1322 967 1041 1142 1163 1234 1107 1090 1093 997 979 952 1054 1012 850 815 1054 881
Industry 570 582 671 567 515 664 564 628 638 743 800 779 742 704 683 752 724 827 877 833 807 1063 972
Services 3798 3960 4134 4238 4367 4604 4729 5014 5140 5442 5595 5610 5770 6027 6203 6317 6405 6579 6672 6550 6484 7206 6753
Wage and salary workers 2498 2605 2903 2751 2782 3071 2850 3039 3276 3639 3738 3720 3759 3832 3973 4022 4092 4456 4534 4309 4264 5080 4633
Employers 233 220 256 248 282 309 293 324 305 313 335 315 328 319 327 309 317 306 280 240 250 325 331
Self-employed 2570 2544 2512 2459 2482 2710 2684 2807 2877 2943 3023 2940 3005 3153 3085 3200 3171 3168 3249 3205 3118 3451 3342
Unpaid family workers 441 467 443 419 434 499 433 513 463 453 532 520 509 521 498 518 502 531 498 479 472 467 301
Employed with excessive hours (more than 48 hours actually worked per week), in primary job

Table 4. Decent hours
Decent Work Indicator and
Underlying Data1995 1996 1997 1998 1999 2000 2001 2002 2003 2004 2005 2006 2007 2008 2009 2010 2011 2012 2013 2014 2015 2016 2017
Total employed (000) 25677 27186 26365 26631 27742 27452 29156 30062 30635 31613 32313 32636 33560 34089 35061 36035 37192 37600 38118 38651 38741 40998 40334
Men 16322 17170 16610 16714 17253 17193 17923 18306 18873 19646 19910 20013 20542 20959 21404 21921 22573 22849 23150 23365 23406 25035 25067
Women 9354 10016 9754 9917 10489 10259 11232 11756 11762 11968 12403 12622 13018 13129 13657 14114 14619 14751 14968 15286 15335 15963 15267
Agriculture 11147 11645 10416 10091 10774 10181 10850 11122 11220 11381 11628 11682 11786 12030 12044 11956 12267 12093 11835 11801 11294 11064 10261
Industry 4140 4431 4582 4542 4515 4454 4713 4695 4840 4999 5025 4997 5121 5048 5092 5399 5530 5743 5937 6167 6275 7159 7370
Services 10391 11112 11367 11998 12452 12817 13593 14246 14577 15237 15661 15957 16654 17012 17924 18682 19394 19764 20345 20683 21172 22775 22703
Wage and salary workers 11870 12649 13043 13285 13761 13925 14438 14653 15354 16472 16316 16673 17508 17846 18681 19626 20538 21492 22247 22407 22960 25240 25209
Employers 894 996 949 966 1341 1315 1552 1662 1605 1604 1520 1425 1430 1426 1438 1394 1354 1335 1272 1210 1212 1376 1491
Self-employed 9111 9330 8774 8891 8864 8869 9375 9737 9912 10011 10584 10525 10570 10654 10724 10858 10994 10626 10668 10869 10705 11097 11198
Unpaid family workers 3801 4211 3600 3490 3775 3344 3792 4009 3765 3527 3893 4012 4052 4161 4218 4157 4306 4147 3930 4166 3863 3285 2437
Notes: 1. Annualized data for 2014 from the Labor Force Survey is the average of estimates for April, July and October survey rounds. The estimates for these rounds exclude data for Leyte province only while that of January exclude Region VIII.
2. Annualized data for 2015 from the Labor Force Survey is the average of estimates for January, April, July and October survey rounds. The estimates for these rounds exclude data for Leyte province only. The use of the
four survey rounds was based on the results of the referendum conducted among members of the Inter-Agency Committee on Labor and Productivity Statistics.
3. See Metadata of Statistical Indicators on Decent Work for definitions and other information.
Source: Philippine Statistics Authority, Labor Force Survey.
Employed with excessive hours (more than 48 hours actually worked per week), in primary job

Table 4. Decent hours
Decent Work Indicator and
Underlying Data1995 1996 1997 1998 1999 2000 2001 2002 2003 2004 2005 2006 2007 2008 2009 2010 2011 2012 2013 2014 2015 2016 2017
Employed by hours actually
worked per week, in primary
job, % distribution 100.0 100.0 100.0 100.0 100.0 100.0 100.0 100.0 100.0 100.0 100.0 100.0 100.0 100.0 100.0 100.0 100.0 100.0 100.0 100.0 100.0 100.0 100.0
Less than 20 hours 9.4 10.9 9.9 10.4 10.4 10.1 12.7 13.5 13.1 13.8 13.2 14.0 12.9 12.4 13.3 12.4 13.7 14.0 13.1 14.4 14.1 12.9 13.8
20-29 11.4 12.0 10.4 11.2 11.2 10.8 12.3 12.1 11.9 11.7 11.4 11.9 11.8 11.1 11.8 11.2 11.3 11.5 10.8 11.4 11.2 10.0 10.3
30-39 13.2 13.4 12.2 12.4 12.9 11.9 12.4 11.9 11.9 11.2 11.4 11.5 11.9 11.6 11.8 11.5 11.2 11.5 11.0 11.0 10.5 9.7 9.8
40-48 42.4 41.1 43.1 42.1 42.5 41.9 39.3 38.2 38.9 38.0 38.9 38.0 39.5 40.6 39.0 41.2 40.8 39.2 41.5 40.6 42.1 43.7 43.9
49+ 22.4 21.5 23.2 22.1 21.6 24.0 21.5 22.2 22.6 23.2 23.6 23.0 22.6 23.0 22.5 22.3 21.7 22.5 22.5 21.3 20.9 22.7 21.3
Not reported * * 0.0 0.0 0.0 0.0 0.0 0.0 0.0 0.0 0.0 0.0 0.0 0.0 0.0 0.0 0.0 0.0 0.0 0.0 0.0 0.0 0.0
Did not work 1.2 1.1 1.3 1.8 1.5 1.3 1.8 2.1 1.6 2.0 1.5 1.6 1.4 1.5 1.6 1.3 1.3 1.3 1.1 1.3 1.2 1.0 0.9
Men 100.0 100.0 100.0 100.0 100.0 100.0 100.0 100.0 100.0 100.0 100.0 100.0 100.0 100.0 100.0 100.0 100.0 100.0 100.0 100.0 100.0 100.0 100.0
Less than 20 hours 7.3 8.3 7.5 8.6 8.2 8.3 10.7 11.6 11.2 12.1 11.3 12.1 11.1 10.6 11.5 10.6 11.8 12.2 11.3 12.5 12.2 10.9 12.1
20-29 10.2 11.1 9.4 10.4 10.5 10.4 12.3 12.2 11.9 11.9 11.5 12.0 11.8 11.0 11.9 11.2 11.4 11.7 11.1 11.7 11.4 10.1 10.7
30-39 14.1 14.5 13.1 13.6 14.0 13.1 14.0 13.4 13.3 12.6 12.9 13.0 13.3 13.0 13.4 13.0 12.7 12.9 12.4 12.3 11.9 10.8 11.1
40-48 46.6 45.4 47.2 45.9 46.4 45.1 42.7 41.3 41.9 40.9 41.5 40.8 42.4 43.6 41.8 44.2 43.7 41.9 44.0 43.5 44.8 46.6 46.3
49+ 20.8 19.8 21.7 20.0 19.5 21.9 18.6 19.5 20.1 20.6 21.3 20.5 20.1 20.3 19.8 19.7 19.1 20.1 20.2 18.8 18.6 20.7 18.9
Not reported * * 0.0 0.0 0.0 0.0 0.0 0.0 0.0 0.0 0.0 0.0 0.0 0.0 0.0 0.0 0.0 0.0 0.0 0.0 0.0 0.0 0.0
Did not work 1.0 1.0 1.1 1.5 1.3 1.2 1.7 2.0 1.5 1.9 1.5 1.5 1.3 1.4 1.6 1.3 1.3 1.2 1.0 1.3 1.1 1.0 0.9
Women 100.0 100.0 100.0 100.0 100.0 100.0 100.0 100.0 100.0 100.0 100.0 100.0 100.0 100.0 100.0 100.0 100.0 100.0 100.0 100.0 100.0 100.0 100.0
Less than 20 hours 13.2 15.3 13.9 13.6 13.8 13.1 15.9 16.6 16.1 16.8 16.4 17.0 15.7 15.2 16.2 15.2 16.5 17.0 16.0 17.3 17.1 16.1 16.6
20-29 13.4 13.5 12.0 12.6 12.5 11.5 12.3 12.0 12.0 11.5 11.3 11.8 11.8 11.2 11.5 11.1 11.2 11.3 10.4 11.1 10.9 9.7 9.6
30-39 11.6 11.5 10.5 10.3 11.0 9.9 10.0 9.5 9.6 8.7 8.9 9.0 9.6 9.3 9.5 9.2 8.8 9.2 8.9 9.0 8.3 8.0 7.6
40-48 35.1 33.8 36.1 35.8 36.0 36.5 33.8 33.3 34.2 33.4 34.6 33.6 34.8 35.7 34.5 36.7 36.3 35.0 37.6 36.2 38.0 39.2 40.0
49+ 25.1 24.4 25.8 25.6 25.0 27.5 26.0 26.5 26.5 27.5 27.3 26.9 26.6 27.1 26.6 26.4 25.8 26.3 25.9 25.1 24.4 26.0 25.3
Not reported 0.0 * 0.0 0.0 0.0 0.0 0.0 0.0 0.0 0.0 0.0 0.0 0.0 0.0 0.0 0.0 0.0 0.0 0.0 0.0 0.0 0.0 0.0
Did not work 1.6 1.4 1.7 2.1 1.8 1.5 2.0 2.2 1.6 2.2 1.5 1.7 1.4 1.6 1.7 1.3 1.4 1.3 1.2 1.4 1.3 1.0 0.9
Employed by hours actually worked per week, in primary job

Table 4. Decent hours
Decent Work Indicator and
Underlying Data1995 1996 1997 1998 1999 2000 2001 2002 2003 2004 2005 2006 2007 2008 2009 2010 2011 2012 2013 2014 2015 2016 2017
Total employed by hours
actually worked per week,
in primary job (000) 25677 27186 26365 26631 27742 27452 29156 30062 30635 31613 32313 32636 33560 34089 35061 36035 37192 37600 38118 38651 38741 40998 40334
Less than 20 hours 2419 2958 2599 2778 2873 2772 3702 4072 4021 4374 4281 4568 4320 4212 4671 4477 5078 5280 5005 5561 5477 5298 5577
20-29 2925 3256 2734 2992 3117 2966 3593 3647 3647 3710 3681 3890 3951 3779 4121 4029 4214 4333 4117 4423 4331 4080 4138
30-39 3383 3641 3207 3292 3570 3269 3622 3564 3644 3528 3678 3753 3982 3946 4153 4148 4156 4313 4192 4234 4064 3984 3935
40-48 10896 11181 11359 11224 11777 11496 11448 11473 11925 12019 12558 12410 13243 13831 13661 14857 15177 14741 15820 15684 16302 17915 17707
49+ 5742 5836 6114 5876 5981 6589 6261 6683 6921 7348 7629 7495 7601 7824 7883 8048 8081 8461 8561 8233 8105 9323 8607
Not reported * 1 0 0 0 0 0 0 0 0 0 0 0 0 0 0 0 0 0 0 0 0 0
Did not work 301 308 351 467 421 356 531 623 479 634 486 519 462 496 571 475 486 474 423 516 461 398 370
Men 16322 17170 16610 16714 17253 17193 17923 18306 18873 19646 19910 20013 20542 20959 21404 21921 22573 22849 23150 23365 23406 25035 25067
Less than 20 hours 1188 1426 1246 1431 1422 1423 1919 2124 2123 2369 2249 2426 2277 2220 2466 2332 2672 2778 2606 2917 2850 2722 3040
20-29 1667 1899 1559 1743 1812 1787 2207 2233 2239 2339 2285 2396 2415 2311 2549 2456 2573 2666 2562 2725 2663 2525 2672
30-39 2301 2494 2182 2267 2421 2256 2501 2449 2515 2484 2576 2611 2728 2732 2861 2848 2864 2958 2867 2863 2791 2714 2773
40-48 7611 7791 7837 7678 8006 7752 7651 7560 7906 8026 8264 8165 8709 9148 8944 9681 9866 9580 10196 10157 10478 11657 11606
49+ 3394 3392 3602 3336 3359 3772 3335 3573 3802 4054 4242 4105 4136 4263 4245 4318 4311 4586 4679 4401 4358 5177 4744
Not reported * * 0 0 0 0 0 0 0 0 0 0 0 0 0 0 0 0 0 0 0 0 0
Did not work 156 165 184 259 231 201 310 366 289 374 295 309 277 286 339 288 288 281 240 301 267 240 231
Women 9354 10016 9754 9917 10489 10259 11232 11756 11762 11968 12403 12622 13018 13129 13657 14114 14619 14751 14968 15286 15335 15963 15267
Less than 20 hours 1233 1533 1353 1347 1451 1349 1783 1948 1898 2005 2032 2142 2045 1992 2206 2145 2406 2502 2399 2645 2627 2576 2537
20-29 1258 1357 1175 1249 1306 1180 1386 1414 1408 1371 1396 1494 1536 1468 1572 1573 1642 1666 1554 1698 1669 1554 1465
30-39 1082 1147 1024 1025 1149 1012 1121 1116 1129 1045 1102 1142 1253 1215 1293 1301 1292 1355 1325 1371 1273 1270 1162
40-48 3285 3390 3523 3546 3771 3744 3796 3913 4020 3993 4294 4245 4533 4683 4717 5176 5311 5161 5624 5526 5824 6259 6101
49+ 2348 2444 2512 2540 2621 2817 2925 3110 3119 3294 3387 3390 3465 3562 3638 3730 3770 3875 3882 3832 3747 4146 3863
Not reported 0 * 0 0 0 0 0 0 0 0 0 0 0 0 0 0 0 0 0 0 0 0 0
Did not work 145 143 168 209 190 154 221 257 190 259 192 209 185 209 232 188 198 192 183 214 194 159 138
Notes: 1. Annualized data for 2014 from the Labor Force Survey is the average of estimates for April, July and October survey rounds. The estimates for these rounds exclude data for Leyte province only while that of January exclude Region VIII.
2. Annualized data for 2015 from the Labor Force Survey is the average of estimates for January, April, July and October survey rounds. The estimates for these rounds exclude data for Leyte province only. The use of the
four survey rounds was based on the results of the referendum conducted among members of the Inter-Agency Committee on Labor and Productivity Statistics.
3. See Metadata of Statistical Indicators on Decent Work for definitions and other information.
* Less than half the unit used.
Source: Philippine Statistics Authority, Labor Force Survey.
Employed by hours actually worked per week, in primary job

Table 4. Decent hours
Decent Work Indicator and
Underlying Data1995 1996 1997 1998 1999 2000 2001 2002 2003 2004 2005 2006 2007 2008 2009 2010 2011 2012 2013 2014 2015 2016 2017
Average weekly hours actually
worked per employed person,
in all jobs1
.. .. .. .. .. .. .. .. .. .. 42.8 42.2 42.5 42.9 42.3 42.8 42.2 42.2 42.7 41.8 42.0 43.2 42.2
Men .. .. .. .. .. .. .. .. .. .. 42.8 42.1 42.4 42.7 42.1 42.6 42.2 42.2 42.7 41.8 42.0 43.3 42.0
Women .. .. .. .. .. .. .. .. .. .. 42.8 42.4 42.7 43.1 42.6 43.0 42.4 42.3 42.8 41.9 41.9 43.0 42.4
Agriculture .. .. .. .. .. .. .. .. .. .. 34.7 33.8 34.2 34.2 33.4 33.8 33.3 33.5 33.6 32.3 32.4 33.7 31.9
Industry .. .. .. .. .. .. .. .. .. .. 44.6 43.8 44.1 44.7 43.8 44.7 44.3 43.9 44.9 44.0 44.0 45.5 44.3
Services .. .. .. .. .. .. .. .. .. .. 48.2 47.9 47.9 48.5 47.8 47.9 47.3 47.1 47.4 46.6 46.4 47.1 46.1
Wage and salary workers .. .. .. .. .. .. .. .. .. .. 45.7 45.0 45.1 45.4 44.9 45.1 44.7 44.3 44.7 44.0 44.0 44.9 43.9
Employers .. .. .. .. .. .. .. .. .. .. 42.2 41.4 42.1 41.2 41.2 41.4 41.2 40.9 41.0 39.3 39.4 41.0 39.6
Self-employed .. .. .. .. .. .. .. .. .. .. 42.1 41.7 42.2 42.9 42.2 42.7 42.1 42.4 42.8 41.9 41.8 42.9 41.4
Unpaid family workers .. .. .. .. .. .. .. .. .. .. 32.8 32.2 32.2 32.6 31.7 32.4 31.1 31.9 32.1 30.7 31.0 32.1 29.0
Average weekly hours actually
worked per employed person,
in primary job 42.0 41.2 42.5 41.8 41.6 42.7 40.9 40.8 41.1 41.2 41.6 41.1 41.4 41.8 41.2 41.7 41.1 41.2 41.7 40.8 41.0 42.2 41.4
Men 42.3 41.5 42.8 41.8 41.6 42.5 40.5 40.4 40.8 40.8 41.3 40.7 41.1 41.4 40.8 41.3 40.8 40.9 41.4 40.5 40.8 42.1 41.1
Women 41.5 40.5 41.9 41.8 41.5 43.0 41.5 41.3 41.5 41.9 42.1 41.7 42.0 42.5 42.0 42.3 41.7 41.7 42.1 41.2 41.3 42.4 41.845.8 45.8 45.8
Agriculture 35.2 34.1 34.8 33.6 33.8 35.0 32.1 31.7 32.0 32.0 32.5 31.7 32.2 32.3 31.4 31.8 31.1 31.4 31.5 30.3 30.4 31.7 30.3
Industry 44.4 43.5 45.0 44.2 43.9 44.6 42.9 43.1 43.3 43.3 44.0 43.3 43.6 44.2 43.2 44.1 43.7 43.4 44.3 43.5 43.5 45.0 43.9
Services 48.3 47.6 48.4 47.8 47.5 48.1 47.1 47.0 47.2 47.4 47.6 47.2 47.3 47.9 47.2 47.3 46.7 46.5 46.8 46.0 45.8 46.5 45.6
Wage and salary workers 45.4 44.7 46.0 45.2 44.9 45.4 44.0 44.1 44.3 44.3 45.0 44.3 44.4 44.8 44.2 44.5 44.0 43.6 44.0 43.4 43.4 44.3 43.4
Employers 42.6 40.5 42.9 42.2 40.5 40.9 37.9 37.7 37.6 37.6 39.3 39.4 40.0 39.2 39.1 39.3 39.2 39.0 39.0 37.5 37.5 39.0 37.9
Self-employed 41.7 41.0 41.7 40.8 40.9 42.2 40.7 40.4 40.6 40.6 40.5 40.1 40.6 41.2 40.5 41.0 40.3 40.6 41.1 40.1 40.2 41.2 40.1
Unpaid family workers 32.2 30.8 31.7 31.6 31.6 33.7 30.4 30.5 30.4 30.3 31.4 31.1 31.2 31.6 30.6 31.3 30.0 30.8 30.9 29.7 30.1 31.2 28.2
Difference between average
weekly hours actually worked in
all jobs and primary job .. .. .. .. .. .. .. .. .. .. 1.2 1.1 1.1 1.1 1.1 1.1 1.1 1.0 1.0 1.0 1.0 1.0 0.8
Men .. .. .. .. .. .. .. .. .. .. 1.5 1.4 1.3 1.3 1.3 1.3 1.4 1.3 1.3 1.3 1.2 1.2 0.9
Women .. .. .. .. .. .. .. .. .. .. 0.7 0.7 0.7 0.6 0.6 0.7 0.7 0.6 0.7 0.7 0.6 0.6 0.60.0
Agriculture .. .. .. .. .. .. .. .. .. .. 2.2 2.1 2.0 1.9 2.0 2.0 2.2 2.1 2.1 2.0 2.0 2.0 1.6
Industry .. .. .. .. .. .. .. .. .. .. 0.6 0.5 0.5 0.5 0.6 0.6 0.6 0.5 0.6 0.5 0.5 0.5 0.4
Services .. .. .. .. .. .. .. .. .. .. 0.6 0.7 0.6 0.6 0.6 0.6 0.6 0.6 0.6 0.6 0.6 0.6 0.5
Wage and salary workers .. .. .. .. .. .. .. .. .. .. 0.7 0.7 0.7 0.6 0.7 0.6 0.7 0.7 0.7 0.6 0.6 0.6 0.5
Employers .. .. .. .. .. .. .. .. .. .. 2.9 2.0 2.1 2.0 2.1 2.1 2.0 1.9 2.0 1.8 1.9 2.0 1.7
Self-employed .. .. .. .. .. .. .. .. .. .. 1.6 1.6 1.6 1.7 1.7 1.7 1.8 1.8 1.7 1.8 1.6 1.7 1.3
Unpaid family workers .. .. .. .. .. .. .. .. .. .. 1.4 1.1 1.0 1.0 1.1 1.1 1.1 1.1 1.2 1.0 0.9 0.9 0.8
Notes: 1. Annualized data for 2014 from the Labor Force Survey is the average of estimates for April, July and October survey rounds. The estimates for these rounds exclude data for Leyte province only while that of January exclude Region VIII.
2. Annualized data for 2015 from the Labor Force Survey is the average of estimates for January, April, July and October survey rounds. The estimates for these rounds exclude data for Leyte province only. The use of the
four survey rounds was based on the results of the referendum conducted among members of the Inter-Agency Committee on Labor and Productivity Statistics.
3. See Metadata of Statistical Indicators on Decent Work for definitions and other information.
1 Data disaggregation based on primary job. 2005 data refers to average of April, July and October as the inquiry on hours worked in all jobs began in April 2005 round of the LFS.
Source: Philippine Statistics Authority, Labor Force Survey.
Average weekly hours actually worked per employed person

Table 4. Decent hours
Decent Work Indicator and
Underlying Data1995 1996 1997 1998 1999 2000 2001 2002 2003 2004 2005 2006 2007 2008 2009 2010 2011 2012 2013 2014 2015 2016 2017
Underemployment rate (%) 20.0 21.0 21.9 21.6 22.1 21.7 17.2 17.0 17.0 17.6 21.0 22.6 20.1 19.3 19.1 18.8 19.3 20.0 19.3 18.4 18.5 18.3 16.1
Men 21.8 23.0 23.8 23.9 24.9 24.0 19.8 19.7 19.6 20.1 23.6 25.4 22.9 22.0 21.7 21.3 21.8 22.4 21.8 20.8 20.9 20.7 17.8
Women 16.9 17.7 18.6 17.8 17.5 17.8 13.0 12.8 13.0 13.5 16.8 18.1 15.8 14.9 15.0 14.8 15.4 16.2 15.5 14.7 14.9 14.6 13.4
Agriculture 24.5 25.5 26.5 26.5 26.2 26.2 22.1 22.2 22.6 23.5 26.7 28.7 26.7 26.1 25.6 25.6 25.4 26.8 26.4 25.2 25.7 25.9 21.3
Industry 19.2 21.2 21.9 22.3 23.5 22.2 18.2 18.4 17.1 17.5 21.9 23.6 20.2 19.7 19.8 19.3 20.6 20.8 19.9 19.9 20.3 19.0 17.6
Services 15.5 16.3 17.7 17.3 18.0 17.9 12.9 12.4 12.7 13.3 16.5 17.8 15.4 14.4 14.5 14.2 15.0 15.6 15.1 14.1 14.2 14.4 13.3
Wage and salary workers 18.7 19.7 20.8 21.0 22.1 21.2 17.3 16.8 16.7 17.0 20.0 21.5 18.6 17.9 17.8 17.5 18.5 19.3 18.4 17.4 17.4 17.1 15.6
Employers 15.9 18.6 16.9 18.0 19.2 19.2 16.1 17.3 18.0 17.0 17.9 19.0 18.0 16.8 16.7 16.6 16.0 15.7 16.0 14.5 14.8 15.2 15.2
Self-employed 21.6 22.8 23.8 22.8 22.9 22.8 17.2 17.7 17.6 18.7 23.3 25.0 22.8 21.7 21.6 21.2 21.6 22.3 21.9 21.3 21.7 21.7 18.1
Unpaid family workers 21.4 21.6 22.6 22.0 21.4 21.9 16.9 16.1 16.4 18.1 20.0 21.9 20.3 20.0 19.2 19.0 18.1 19.3 18.7 17.5 17.6 17.4 13.6
Total underemployed (000) 5137 5719 5773 5758 6127 5955 5006 5109 5221 5575 6785 7371 6757 6579 6692 6762 7163 7514 7371 7118 7180 7513 6506
Men 3555 3943 3955 3989 4295 4131 3551 3609 3692 3957 4703 5091 4699 4619 4642 4680 4913 5126 5056 4866 4897 5176 4466
Women 1582 1777 1818 1769 1833 1824 1455 1500 1530 1617 2082 2280 2058 1960 2050 2082 2251 2388 2315 2253 2283 2337 2040
Agriculture 2732 2971 2758 2670 2828 2666 2401 2470 2536 2675 3107 3347 3152 3139 3079 3063 3110 3235 3125 2970 2906 2862 2186
Industry 793 941 1004 1015 1061 989 858 866 829 875 1098 1178 1032 996 1009 1043 1139 1197 1183 1228 1271 1361 1294
Services 1612 1807 2011 2072 2239 2299 1747 1773 1857 2025 2581 2846 2572 2444 2604 2656 2914 3082 3064 2920 3003 3289 3025
Wage and salary workers 2217 2496 2708 2787 3035 2950 2498 2455 2564 2794 3267 3591 3264 3199 3330 3437 3793 4138 4100 3899 3998 4325 3921
Employers 142 185 160 174 257 253 250 288 289 273 272 271 257 239 240 232 216 210 203 175 179 209 227
Self-employed 1966 2130 2090 2030 2028 2019 1616 1720 1749 1868 2468 2631 2411 2309 2313 2304 2374 2368 2336 2317 2324 2407 2027
Unpaid family workers 812 909 815 767 808 734 642 646 619 640 779 878 824 832 810 789 780 799 733 728 680 572 331
Total employed (000) 25677 27186 26365 26631 27742 27452 29156 30062 30635 31613 32313 32636 33560 34089 35061 36035 37192 37600 38118 38651 38741 40998 40334
Men 16322 17170 16610 16714 17253 17193 17923 18306 18873 19646 19910 20013 20542 20959 21404 21921 22573 22849 23150 23365 23406 25035 25067
Women 9354 10016 9754 9917 10489 10259 11232 11756 11762 11968 12403 12622 13018 13129 13657 14114 14619 14751 14968 15286 15335 15963 15267
Agriculture 11147 11645 10416 10091 10774 10181 10850 11122 11220 11381 11628 11682 11786 12030 12044 11956 12267 12093 11835 11801 11294 11064 10261
Industry 4140 4431 4582 4542 4515 4454 4713 4695 4840 4999 5025 4997 5121 5048 5092 5399 5530 5743 5937 6167 6275 7159 7370
Services 10391 11112 11367 11998 12452 12817 13593 14246 14577 15237 15661 15957 16654 17012 17924 18682 19394 19764 20345 20683 21172 22775 22703
Wage and salary workers 11870 12649 13043 13285 13761 13925 14438 14653 15354 16472 16316 16673 17508 17846 18681 19626 20538 21492 22247 22407 22960 25240 25209
Employers 894 996 949 966 1341 1315 1552 1662 1605 1604 1520 1425 1430 1426 1438 1394 1354 1335 1272 1210 1212 1376 1491
Self-employed 9111 9330 8774 8891 8864 8869 9375 9737 9912 10011 10584 10525 10570 10654 10724 10858 10994 10626 10668 10869 10705 11097 11198
Unpaid family workers 3801 4211 3600 3490 3775 3344 3792 4009 3765 3527 3893 4012 4052 4161 4218 4157 4306 4147 3930 4166 3863 3285 2437
Notes: 1. Annualized data for 2014 from the Labor Force Survey is the average of estimates for April, July and October survey rounds. The estimates for these rounds exclude data for Leyte province only while that of January exclude Region VIII.
2. Annualized data for 2015 from the Labor Force Survey is the average of estimates for January, April, July and October survey rounds. The estimates for these rounds exclude data for Leyte province only. The use of the
four survey rounds was based on the results of the referendum conducted among members of the Inter-Agency Committee on Labor and Productivity Statistics.
3. See Metadata of Statistical Indicators on Decent Work for definitions and other information.
Source: Philippine Statistics Authority, Labor Force Survey.
Underemployment rate

Table 4. Decent hours
Decent Work Indicator and
Underlying Data1995 1996 1997 1998 1999 2000 2001 2002 2003 2004 2005 2006 2007 2008 2009 2010 2011 2012 2013 2014 2015 2016 2017
Visible underemployment rate (%) 10.2 11.2 10.7 11.5 11.7 11.1 11.0 11.1 10.5 11.0 12.6 13.9 12.0 11.8 11.8 11.1 11.7 11.9 11.3 11.3 10.9 10.1 9.3
Men 10.3 11.3 10.6 12.0 12.4 11.6 12.2 12.5 11.7 12.2 13.8 15.2 13.3 13.1 13.0 12.2 12.8 13.0 12.4 12.4 11.9 11.0 9.9
Women 10.0 10.9 10.8 10.7 10.5 10.1 9.0 8.8 8.7 9.0 10.8 11.8 10.1 9.7 9.8 9.4 9.9 10.3 9.7 9.7 9.4 8.7 8.2
Agriculture 15.1 16.4 16.4 17.9 17.1 16.7 16.7 17.1 16.7 17.9 19.8 21.7 19.8 19.7 19.6 19.2 19.7 20.2 20.0 19.7 19.6 18.9 16.7
Industry 7.1 8.5 6.9 8.2 9.0 8.2 9.1 9.5 8.1 8.3 9.9 11.1 9.0 8.8 9.2 8.2 8.7 9.1 8.1 8.7 8.5 7.1 7.4
Services 6.1 6.8 7.0 7.5 7.9 7.6 7.1 6.8 6.6 6.7 8.2 9.0 7.5 7.1 7.3 6.8 7.5 7.7 7.2 7.2 7.0 6.8 6.5
Wage and salary workers 7.3 8.5 7.6 8.8 9.3 8.6 9.4 9.3 8.6 8.8 9.9 10.9 9.1 8.9 9.2 8.4 9.1 9.8 9.1 9.0 8.6 7.9 7.5
Employers 8.9 11.0 9.7 10.4 10.7 10.6 11.3 12.3 12.4 12.2 11.6 12.2 11.0 11.2 10.9 11.0 10.5 10.1 10.5 10.1 9.9 9.7 10.1
Self-employed 11.9 12.9 13.1 13.9 13.9 13.4 12.2 12.7 12.2 12.9 16.0 17.5 15.4 15.1 15.0 14.6 15.3 15.3 14.8 15.0 14.9 14.2 12.8
Unpaid family workers 15.3 15.7 16.2 16.2 15.5 15.4 13.7 13.0 13.0 15.0 15.4 17.4 16.1 15.8 15.5 15.0 14.8 15.3 14.7 14.2 13.9 13.4 11.2
Total visibly underemployed (000) 2614 3042 2821 3073 3238 3040 3202 3322 3229 3472 4082 4532 4043 4018 4135 4015 4340 4489 4321 4365 4222 4149 3739
Men 1676 1946 1765 2011 2132 2000 2193 2285 2211 2398 2747 3038 2731 2744 2790 2682 2900 2965 2876 2886 2781 2753 2488
Women 937 1096 1056 1062 1106 1040 1010 1037 1018 1074 1336 1494 1312 1274 1345 1333 1440 1525 1445 1478 1441 1396 1251
Agriculture 1685 1910 1705 1804 1846 1703 1815 1907 1879 2040 2297 2536 2339 2371 2362 2294 2411 2438 2371 2327 2214 2088 1712
Industry 295 377 316 372 408 366 428 445 394 417 495 557 460 443 470 442 481 524 478 539 531 505 546
Services 633 755 799 895 983 970 959 971 955 1014 1290 1439 1244 1205 1303 1279 1448 1528 1472 1499 1478 1556 1482
Wage and salary workers 870 1070 996 1172 1277 1198 1359 1362 1325 1453 1616 1819 1599 1595 1712 1657 1878 2098 2028 2023 1966 1998 1882
Employers 80 110 92 100 144 139 175 204 199 195 177 174 157 160 157 153 142 135 134 122 120 133 151
Self-employed 1082 1199 1149 1234 1231 1186 1147 1234 1213 1294 1690 1840 1632 1605 1611 1581 1684 1624 1580 1629 1599 1578 1433
Unpaid family workers 582 663 584 567 586 516 521 522 491 530 600 699 654 659 655 624 636 633 578 591 538 440 273
Total employed (000) 25677 27186 26365 26631 27742 27452 29156 30062 30635 31613 32313 32636 33560 34089 35061 36035 37192 37600 38118 38651 38741 40998 40334
Men 16322 17170 16610 16714 17253 17193 17923 18306 18873 19646 19910 20013 20542 20959 21404 21921 22573 22849 23150 23365 23406 25035 25067
Women 9354 10016 9754 9917 10489 10259 11232 11756 11762 11968 12403 12622 13018 13129 13657 14114 14619 14751 14968 15286 15335 15963 15267
Agriculture 11147 11645 10416 10091 10774 10181 10850 11122 11220 11381 11628 11682 11786 12030 12044 11956 12267 12093 11835 11801 11294 11064 10261
Industry 4140 4431 4582 4542 4515 4454 4713 4695 4840 4999 5025 4997 5121 5048 5092 5399 5530 5743 5937 6167 6275 7159 7370
Services 10391 11112 11367 11998 12452 12817 13593 14246 14577 15237 15661 15957 16654 17012 17924 18682 19394 19764 20345 20683 21172 22775 22703
Wage and salary workers 11870 12649 13043 13285 13761 13925 14438 14653 15354 16472 16316 16673 17508 17846 18681 19626 20538 21492 22247 22407 22960 25240 25209
Employers 894 996 949 966 1341 1315 1552 1662 1605 1604 1520 1425 1430 1426 1438 1394 1354 1335 1272 1210 1212 1376 1491
Self-employed 9111 9330 8774 8891 8864 8869 9375 9737 9912 10011 10584 10525 10570 10654 10724 10858 10994 10626 10668 10869 10705 11097 11198
Unpaid family workers 3801 4211 3600 3490 3775 3344 3792 4009 3765 3527 3893 4012 4052 4161 4218 4157 4306 4147 3930 4166 3863 3285 2437
Notes: 1. Annualized data for 2014 from the Labor Force Survey is the average of estimates for April, July and October survey rounds. The estimates for these rounds exclude data for Leyte province only while that of January exclude Region VIII.
2. Annualized data for 2015 from the Labor Force Survey is the average of estimates for January, April, July and October survey rounds. The estimates for these rounds exclude data for Leyte province only. The use of the
four survey rounds was based on the results of the referendum conducted among members of the Inter-Agency Committee on Labor and Productivity Statistics.
4. See Metadata of Statistical Indicators on Decent Work for definitions and other information.
Source: Philippine Statistics Authority, Labor Force Survey.
Visible underemployment rate

Table 4. Decent hours
Decent Work Indicator and
Underlying Data1995 1996 1997 1998 1999 2000 2001 2002 2003 2004 2005 2006 2007 2008 2009 2010 2011 2012 2013 2014 2015 2016 2017
Time-related underemployment
rate1/2
(%) .. .. .. .. .. .. .. .. .. .. 11.8 12.2 10.5 10.3 10.3 9.6 10.2 10.5 10.0 10.1 9.7 8.9 8.4
Men .. .. .. .. .. .. .. .. .. .. 12.4 12.9 11.2 11.0 11.0 10.2 10.8 11.1 10.5 10.8 10.3 9.3 8.8
Women .. .. .. .. .. .. .. .. .. .. 10.8 11.1 9.4 9.0 9.2 8.7 9.2 9.7 9.0 9.2 8.8 8.2 7.8
Agriculture .. .. .. .. .. .. .. .. .. .. 17.2 18.2 16.6 16.4 16.3 15.8 16.3 17.0 16.9 17.0 16.8 15.7 14.5
Industry .. .. .. .. .. .. .. .. .. .. 9.8 10.4 8.3 8.1 8.5 7.5 8.0 8.4 7.3 8.1 7.9 6.4 7.0
Services .. .. .. .. .. .. .. .. .. .. 8.4 8.4 6.9 6.6 6.8 6.3 6.9 7.2 6.7 6.8 6.5 6.3 6.1
Wage and salary workers .. .. .. .. .. .. .. .. .. .. 9.7 10.1 8.3 8.2 8.4 7.7 8.4 9.0 8.3 8.4 7.9 7.2 7.0
Employers .. .. .. .. .. .. .. .. .. .. 8.8 9.0 8.5 8.5 8.3 8.0 7.8 7.8 8.4 8.0 7.8 7.6 8.3
Self-employed .. .. .. .. .. .. .. .. .. .. 14.6 14.9 12.9 12.5 12.5 12.0 12.6 12.8 12.4 12.9 12.8 11.9 11.2
Unpaid family workers .. .. .. .. .. .. .. .. .. .. 14.1 15.4 14.6 14.0 13.8 13.0 13.1 13.4 13.2 13.0 12.7 11.9 10.3
Time-related
underemployment1/2
(000) .. .. .. .. .. .. .. .. .. .. 3829 3989 3533 3495 3609 3469 3783 3953 3795 3916 3766 3629 3389
Men .. .. .. .. .. .. .. .. .. .. 2468 2588 2304 2311 2352 2239 2440 2526 2440 2517 2409 2327 2204
Women .. .. .. .. .. .. .. .. .. .. 1362 1401 1229 1184 1257 1230 1343 1427 1354 1399 1357 1302 1185
Agriculture .. .. .. .. .. .. .. .. .. .. 2012 2126 1956 1969 1967 1885 1996 2054 1997 2003 1894 1735 1485
Industry .. .. .. .. .. .. .. .. .. .. 492 519 423 408 431 403 443 484 436 501 495 457 517
Services .. .. .. .. .. .. .. .. .. .. 1325 1343 1154 1118 1211 1180 1343 1414 1361 1412 1377 1438 1387
Wage and salary workers .. .. .. .. .. .. .. .. .. .. 1582 1681 1457 1456 1568 1511 1724 1930 1844 1877 1814 1817 1761
Employers .. .. .. .. .. .. .. .. .. .. 134 128 121 121 120 111 105 104 107 97 94 104 124
Self-employed .. .. .. .. .. .. .. .. .. .. 1555 1564 1365 1333 1336 1306 1390 1364 1327 1403 1365 1317 1253
Unpaid family workers .. .. .. .. .. .. .. .. .. .. 559 616 591 584 584 541 564 555 517 540 492 391 250
Total employed2 (000) 25677 27186 26365 26631 27742 27452 29156 30062 30635 31613 32539 32636 33560 34089 35061 36035 37192 37600 38118 38651 38741 40998 40334
Men 16322 17170 16610 16714 17253 17193 17923 18306 18873 19646 19961 20013 20542 20959 21404 21921 22573 22849 23150 23365 23406 25035 25067
Women 9354 10016 9754 9917 10489 10259 11232 11756 11762 11968 12579 12622 13018 13129 13657 14114 14619 14751 14968 15286 15335 15963 15267
Agriculture 11147 11645 10416 10091 10774 10181 10850 11122 11220 11381 11718 11682 11786 12030 12044 11956 12267 12093 11835 11801 11294 11064 10261
Industry 4140 4431 4582 4542 4515 4454 4713 4695 4840 4999 5040 4997 5121 5048 5092 5399 5530 5743 5937 6167 6275 7159 7370
Services 10391 11112 11367 11998 12452 12817 13593 14246 14577 15237 15782 15957 16654 17012 17924 18682 19394 19764 20345 20683 21172 22775 22703
Wage and salary workers 11870 12649 13043 13285 13761 13925 14438 14653 15354 16472 16384 16673 17508 17846 18681 19626 20538 21492 22247 22407 22960 25240 25209
Employers 894 996 949 966 1341 1315 1552 1662 1605 1604 1528 1425 1430 1426 1438 1394 1354 1335 1272 1210 1212 1376 1491
Self-employed 9111 9330 8774 8891 8864 8869 9375 9737 9912 10011 10669 10525 10570 10654 10724 10858 10994 10626 10668 10869 10705 11097 11198
Unpaid family workers 3801 4211 3600 3490 3775 3344 3792 4009 3765 3527 3958 4012 4052 4161 4218 4157 4306 4147 3930 4166 3863 3285 2437
Notes: 1. Annualized data for 2014 from the Labor Force Survey is the average of estimates for April, July and October survey rounds. The estimates for these rounds exclude data for Leyte province only while that of January exclude Region VIII.
2. Annualized data for 2015 from the Labor Force Survey is the average of estimates for January, April, July and October survey rounds. The estimates for these rounds exclude data for Leyte province only. The use of the
four survey rounds was based on the results of the referendum conducted among members of the Inter-Agency Committee on Labor and Productivity Statistics.
3. See Metadata of Statistical Indicators on Decent Work for definitions and other information.
1 Total employed who wanted additional work and worked less than 40 hours in all jobs as a percentage share of total employed. Definition of time-related underemployment
not strictly comparable with international standard as the criterion of availability for additional work not asked in the LFS. Data disaggregation based on primary job.
2 2005 data refers to average of April, July and October as the inquiry on hours worked in all jobs began in April 2005 round of the LFS.
Source: Philippine Statistics Authority, Labor Force Survey.
Time-related underemployment rate

Element 5
Combining Work, Family and
Personal Life

Table 5. Combining work, family and personal life
Decent Work Indicator 1995 1996 1997 1998 1999 2000 2001 2002 2003 2004 2005 2006 2007 2008 2009 2010 2011 2012 2013 2014 2015 2016 2017
Economically inactive due
to household/family duties
% of working age population 18.0 .. .. .. 17.1 .. 16.3 15.7 16.7 17.3 16.9 17.1 17.3 17.7 17.2 17.0 16.9 16.9 16.7 16.4 16.2 16.3 17.2
Men 1.0 .. .. .. 1.2 .. 1.2 1.2 1.3 1.5 1.9 2.5 3.0 2.9 2.8 2.9 2.9 3.1 3.1 2.8 3.1 2.8 2.4
Women 35.0 .. .. .. 32.9 .. 31.3 30.1 31.9 33.1 31.8 31.5 31.6 32.3 31.4 31.0 30.8 30.7 30.3 29.8 29.2 29.8 32.0
15-24 years old 9.9 .. .. .. 10.5 .. 9.1 9.0 9.8 11.4 11.1 12.0 12.5 12.7 12.2 12.2 12.2 12.6 12.1 11.7 11.3 11.5 11.1
25-54 22.2 .. .. .. 20.2 .. 19.9 19.1 20.1 20.5 20.5 20.4 20.5 20.8 20.3 20.2 19.9 19.9 19.8 19.3 19.3 19.4 20.8
55+ 20.1 .. .. .. 19.2 .. 18.1 17.1 18.3 17.5 15.7 15.2 15.8 16.1 15.8 15.0 15.3 15.1 14.8 15.0 14.8 14.5 15.8
% distribution 100.0 .. .. .. 100.0 .. 100.0 100.0 100.0 100.0 100.0 100.0 100.0 100.0 100.0 100.0 100.0 100.0 100.0 100.0 100.0 100.0 100.0
Men 2.8 .. .. .. 3.6 .. 3.8 3.8 3.8 4.2 5.7 7.4 8.7 8.1 8.1 8.4 8.5 9.0 9.1 8.6 9.6 8.5 7.1
Women 97.2 .. .. .. 96.4 .. 96.2 96.2 96.2 95.8 94.3 92.6 91.3 91.9 91.9 91.6 91.5 91.0 90.9 91.4 90.4 91.5 92.9.. .. .. ..
15-24 years old 17.1 .. .. .. 18.3 .. 17.0 17.3 17.8 19.9 19.7 21.6 22.1 21.9 21.5 21.5 21.7 22.3 21.8 21.5 20.9 20.4 18.3
25-54 64.7 .. .. .. 63.7 .. 64.5 64.3 64.5 65.1 66.3 65.6 64.7 64.5 64.7 64.9 64.4 64.1 64.6 64.5 65.0 64.3 65.5
55+ 18.2 .. .. .. 18.0 .. 18.5 18.5 17.7 15.1 14.0 12.8 13.3 13.5 13.9 13.6 13.9 13.6 13.6 14.1 14.0 15.3 16.2
Employed who are married,
% of employed 63.7 64.0 65.0 64.9 64.7 64.7 64.0 64.3 65.4 66.2 65.6 65.4 64.9 64.7 64.7 64.4 63.8 63.8 63.6 63.3 63.2 65.7 66.1
Men 66.2 66.6 68.1 68.0 67.2 67.6 66.5 66.4 67.9 68.8 67.9 67.5 66.9 66.5 66.3 66.0 65.4 65.5 65.1 64.6 64.7 67.7 68.5
Women 59.5 59.6 59.7 59.9 60.4 59.8 60.0 60.9 61.3 61.9 61.9 62.2 61.9 61.8 62.1 61.8 61.4 61.3 61.3 61.3 60.9 62.5 62.2##### ##### ##### ##### ##### ##### ##### ##### ##### ##### ##### ##### ##### ##### ##### #####
15-24 years old 10.3 13.4 14.4 13.2 12.8 12.5 11.7 11.9 15.1 17.3 15.5 15.0 14.5 14.1 14.6 14.8 15.2 16.0 16.4 16.5 16.7 20.9 21.1
25-54 79.1 78.9 79.5 79.0 78.4 78.2 77.9 77.6 78.4 79.1 78.4 78.4 77.6 77.0 76.7 75.9 75.7 75.4 74.8 74.5 73.7 75.5 75.2
55+ 77.8 77.6 77.2 77.6 77.1 76.2 76.1 76.4 76.3 75.9 76.2 76.1 76.1 75.9 75.7 75.8 75.5 75.3 74.9 75.2 74.8 74.4 75.2
% distribution 100.0 100.0 100.0 100.0 100.0 100.0 100.0 100.0 100.0 100.0 100.0 100.0 100.0 100.0 100.0 100.0 100.0 100.0 100.0 100.0 100.0 100.0 100.0
Men 66.0 65.7 66.0 65.7 64.7 65.5 63.9 63.0 64.0 64.6 63.8 63.2 63.0 63.2 62.6 62.4 62.2 62.3 62.2 61.7 61.8 62.9 64.4
Women 34.0 34.3 34.0 34.3 35.3 34.5 36.1 37.0 36.0 35.4 36.2 36.8 37.0 36.8 37.4 37.6 37.8 37.7 37.8 38.3 38.2 37.1 35.6
15-24 years old 3.6 4.7 4.8 4.3 4.1 3.9 3.7 3.7 4.6 5.3 4.7 4.6 4.4 4.2 4.3 4.4 4.6 4.9 5.0 5.1 5.0 5.6 5.4
25-54 78.4 78.4 79.0 78.7 78.6 78.8 78.4 78.1 78.4 79.3 79.5 80.4 80.2 80.1 79.8 79.3 79.1 79.1 79.0 78.8 78.8 77.1 77.5
55+ 18.0 16.9 16.1 17.0 17.4 17.3 17.9 18.2 17.0 15.4 15.9 15.0 15.4 15.7 15.9 16.3 16.2 16.0 16.0 16.1 16.2 17.2 17.1
Employed who are household
heads, % of employed 43.9 43.9 44.8 44.4 43.7 43.9 42.4 41.6 44.0 45.0 43.5 42.4 41.8 41.4 40.6 40.2 39.7 39.5 39.5 38.7 38.7 43.8 45.0
Men 62.2 63.0 64.0 63.3 62.6 62.3 61.1 60.6 63.3 64.3 62.9 61.5 60.4 59.5 58.4 57.8 57.0 56.5 56.3 55.4 55.4 61.6 61.8
Women 11.9 11.2 12.2 12.5 12.6 13.0 12.4 11.9 13.1 13.2 12.4 12.2 12.5 12.5 12.6 13.0 13.0 13.1 13.6 13.2 13.2 15.9 17.3##### ##### ##### ##### ##### ##### ##### ##### ##### ##### ##### ##### ##### ##### ##### ##### ##### #####
15-24 years old 2.7 4.9 5.4 4.1 3.7 3.2 2.5 2.3 5.8 7.0 5.4 4.3 3.7 3.5 3.5 3.5 3.7 3.8 4.1 3.9 4.0 8.6 9.0
25-54 51.5 51.6 52.5 51.5 50.2 50.0 48.5 47.0 49.9 51.3 49.5 48.5 47.6 46.6 45.4 44.6 44.1 43.9 43.7 42.8 42.2 47.6 48.7
55+ 72.9 72.1 71.9 71.7 71.5 72.1 70.7 69.9 70.7 70.8 70.2 69.9 69.7 69.8 69.3 69.5 69.3 69.1 69.1 68.5 69.0 68.5 68.4
% distribution 100.0 100.0 100.0 100.0 100.0 100.0 100.0 100.0 100.0 100.0 100.0 100.0 100.0 100.0 100.0 100.0 100.0 100.0 100.0 100.0 100.0 100.0 100.0
Men 90.1 90.6 89.9 89.5 89.1 88.9 88.7 88.8 88.6 88.9 89.1 88.9 88.4 88.4 87.9 87.4 87.1 87.0 86.5 86.5 86.5 85.9 85.4
Women 9.9 9.4 10.1 10.5 10.9 11.1 11.3 11.2 11.4 11.1 10.9 11.1 11.6 11.6 12.1 12.6 12.9 13.0 13.5 13.5 13.5 14.1 14.6
15-24 years old 1.4 2.5 2.6 2.0 1.8 1.5 1.2 1.1 2.6 3.1 2.5 2.0 1.7 1.6 1.7 1.6 1.8 1.9 2.0 2.0 1.9 3.5 3.4
25-54 74.2 74.6 75.6 75.0 74.4 74.3 73.7 73.1 74.0 75.7 75.5 76.7 76.3 75.9 75.1 74.5 74.2 74.4 74.2 74.1 73.7 72.8 73.8
55+ 24.5 22.9 21.8 23.0 23.8 24.2 25.1 25.8 23.4 21.2 22.0 21.3 22.0 22.5 23.2 23.9 24.0 23.8 23.8 24.0 24.4 23.7 22.9
Notes: 1. Annualized data for 2014 from the Labor Force Survey is the average of estimates for April, July and October survey rounds. The estimates for these rounds exclude data
for Leyte province only while that of January exclude Region VIII.
2. Annualized data for 2015 from the Labor Force Survey is the average of estimates for January, April, July and October survey rounds. The estimates for these rounds exclude data for Leyte
Province only. The use of the survey rounds that exclude Leyte was based on the results of the referendum conducted among members of the Inter-Agency Committee on Labor and
Productivity Statistics.
Source: Philippine Statistics Authority, Labor Force Survey.
Date updated: 09/21/2018

Table 5. Combining work, family and personal life
Decent Work Indicator and
Underlying Data1995 1996 1997 1998 1999 2000 2001 2002 2003 2004 2005 2006 2007 2008 2009 2010 2011 2012 2013 2014 2015 2016 2017
Economically inactive due to
household/family duties,
% of working age population 18.0 .. .. .. 17.1 .. 16.3 15.7 16.7 17.3 16.9 17.1 17.3 17.7 17.2 17.0 16.9 16.9 16.7 16.4 16.2 16.3 17.2
Men 1.0 .. .. .. 1.2 .. 1.2 1.2 1.3 1.5 1.9 2.5 3.0 2.9 2.8 2.9 2.9 3.1 3.1 2.8 3.1 2.8 2.4
Women 35.0 .. .. .. 32.9 .. 31.3 30.1 31.9 33.1 31.8 31.5 31.6 32.3 31.4 31.0 30.8 30.7 30.3 29.8 29.2 29.8 32.0
15-24 years old 9.9 .. .. .. 10.5 .. 9.1 9.0 9.8 11.4 11.1 12.0 12.5 12.7 12.2 12.2 12.2 12.6 12.1 11.7 11.3 11.5 11.1
25-54 22.2 .. .. .. 20.2 .. 19.9 19.1 20.1 20.5 20.5 20.4 20.5 20.8 20.3 20.2 19.9 19.9 19.8 19.3 19.3 19.4 20.8
55+a
20.1 .. .. .. 19.2 .. 18.1 17.1 18.3 17.5 15.7 15.2 15.8 16.1 15.8 15.0 15.3 15.1 14.8 15.0 14.8 14.5 15.8
% distribution 100.0 .. .. .. 100.0 .. 100.0 100.0 100.0 100.0 100.0 100.0 100.0 100.0 100.0 100.0 100.0 100.0 100.0 100.0 100.0 100.0 100.0
Men 2.8 .. .. .. 3.6 .. 3.8 3.8 3.8 4.2 5.7 7.4 8.7 8.1 8.1 8.4 8.5 9.0 9.1 8.6 9.6 8.5 7.1
Women 97.2 .. .. .. 96.4 .. 96.2 96.2 96.2 95.8 94.3 92.6 91.3 91.9 91.9 91.6 91.5 91.0 90.9 91.4 90.4 91.5 92.9
15-24 years old 17.1 .. .. .. 18.3 .. 17.0 17.3 17.8 19.9 19.7 21.6 22.1 21.9 21.5 21.5 21.7 22.3 21.8 21.5 20.9 20.4 18.3
25-54 64.7 .. .. .. 63.7 .. 64.5 64.3 64.5 65.1 66.3 65.6 64.7 64.5 64.7 64.9 64.4 64.1 64.6 64.5 65.0 64.3 65.5
55+a
18.2 .. .. .. 18.0 .. 18.5 18.5 17.7 15.1 14.0 12.8 13.3 13.5 13.9 13.6 13.9 13.6 13.6 14.1 14.0 15.3 16.2
Total economically inactive due
to household/family duties (000) 7765 .. .. .. 8102 .. 7985 7900 8627 9202 9197 9437 9814 10222 10177 10314 10449 10670 10718 10493 10502 11126 12009
Men 215 .. .. .. 293 .. 304 298 328 386 525 701 857 824 826 870 884 962 977 907 1003 944 851
Women 7549 .. .. .. 7810 .. 7681 7602 8299 8816 8673 8735 8958 9398 9352 9445 9565 9708 9741 9587 9499 10182 11158.. .. .. ..
15-24 years old 1328 .. .. .. 1481 .. 1359 1365 1536 1830 1810 2034 2166 2241 2184 2220 2268 2377 2340 2252 2199 2269 2197
25-54 5025 .. .. .. 5165 .. 5151 5076 5565 5986 6098 6195 6345 6596 6584 6696 6730 6839 6924 6764 6829 7157 7871
55+a
1411 .. .. .. 1457 .. 1476 1459 1526 1387 1290 1208 1303 1385 1410 1398 1451 1454 1454 1477 1474 1699 1941
Total working age population
(000) 43156 44599 44658 45964 47270 48587 48929 50344 51793 53144 54388 55230 56565 57848 59237 60717 61882 62985 64173 64033 64936 68311 69891
Men 21565 22307 22232 22818 23568 24245 24396 25108 25799 26485 27111 27521 28184 28784 29464 30223 30805 31369 31974 31905 32417 34184 35004
Women 21591 22292 22426 23147 23704 24342 24532 25237 25994 26660 27277 27708 28381 29064 29773 30493 31076 31616 32199 32128 32519 34127 34887
15-24 years old 13473 13969 13663 13927 14084 14687 14908 15203 15738 16088 16344 16967 17275 17594 17910 18220 18576 18928 19285 19223 19522 19669 19734
25-54 22680 23712 24291 24855 25600 26078 25861 26597 27706 29129 29814 30303 31023 31664 32393 33201 33820 34403 35048 34991 35453 36940 37907
55+a
7003 6918 6704 7184 7586 7822 8160 8545 8350 7926 8230 7960 8268 8590 8935 9295 9486 9655 9840 9819 9962 11701 12250
Notes: 1. Details may not add up to totals due to rounding.
2. Annualized data for 2014 from the Labor Force Survey is the average of estimates for April, July and October survey rounds. The estimates for these rounds exclude data for Leyte province only while that of January exclude Region VIII.
3. Annualized data for 2015 from the Labor Force Survey is the average of estimates for January, April, July and October survey rounds. The estimates for these rounds exclude data for Leyte Province only. The use of the survey rounds
that exclude Leyte was based on the results of the referendum conducted among members of the Inter-Agency Committee on Labor and Productivity Statistics.
4. See Metadata of Statistical Indicators on Decent Work for definitions and other information.
a Includes persons with age not reported.
Source: Philippine Statistics Authority, Labor Force Survey.
Economically inactive due to household/family duties

Table 5. Combining work, family and personal life
Decent Work Indicator and
Underlying Data1995 1996 1997 1998 1999 2000 2001 2002 2003 2004 2005 2006 2007 2008 2009 2010 2011 2012 2013 2014 2015 2016 2017
Employed who are married,
% of employed 63.7 64.0 65.0 64.9 64.7 64.7 64.0 64.3 65.4 66.2 65.6 65.4 64.9 64.7 64.7 64.4 63.8 63.8 63.6 63.3 63.2 65.7 66.1
Men 66.2 66.6 68.1 68.0 67.2 67.6 66.5 66.4 67.9 68.8 67.9 67.5 66.9 66.5 66.3 66.0 65.4 65.5 65.1 64.6 64.7 67.7 68.5
Women 59.5 59.6 59.7 59.9 60.4 59.8 60.0 60.9 61.3 61.9 61.9 62.2 61.9 61.8 62.1 61.8 61.4 61.3 61.3 61.3 60.9 62.5 62.2
15-24 years old 10.3 13.4 14.4 13.2 12.8 12.5 11.7 11.9 15.1 17.3 15.5 15.0 14.5 14.1 14.6 14.8 15.2 16.0 16.4 16.5 16.7 20.9 21.1
25-54 79.1 78.9 79.5 79.0 78.4 78.2 77.9 77.6 78.4 79.1 78.4 78.4 77.6 77.0 76.7 75.9 75.7 75.4 74.8 74.5 73.7 75.5 75.2
55+a
77.8 77.6 77.2 77.6 77.1 76.2 76.1 76.4 76.3 75.9 76.2 76.1 76.1 75.9 75.7 75.8 75.5 75.3 74.9 75.2 74.8 74.4 75.2
% distribution 100.0 100.0 100.0 100.0 100.0 100.0 100.0 100.0 100.0 100.0 100.0 100.0 100.0 100.0 100.0 100.0 100.0 100.0 100.0 100.0 100.0 100.0 100.0
Men 66.0 65.7 66.0 65.7 64.7 65.5 63.9 63.0 64.0 64.6 63.8 63.2 63.0 63.2 62.6 62.4 62.2 62.3 62.2 61.7 61.8 62.9 64.4
Women 34.0 34.3 34.0 34.3 35.3 34.5 36.1 37.0 36.0 35.4 36.2 36.8 37.0 36.8 37.4 37.6 37.8 37.7 37.8 38.3 38.2 37.1 35.6
15-24 years old 3.6 4.7 4.8 4.3 4.1 3.9 3.7 3.7 4.6 5.3 4.7 4.6 4.4 4.2 4.3 4.4 4.6 4.9 5.0 5.1 5.0 5.6 5.4
25-54 78.4 78.4 79.0 78.7 78.6 78.8 78.4 78.1 78.4 79.3 79.5 80.4 80.2 80.1 79.8 79.3 79.1 79.1 79.0 78.8 78.8 77.1 77.5
55+a
18.0 16.9 16.1 17.0 17.4 17.3 17.9 18.2 17.0 15.4 15.9 15.0 15.4 15.7 15.9 16.3 16.2 16.0 16.0 16.1 16.2 17.2 17.1
Total employed who are
married (000) 16359 17397 17129 17296 17940 17761 18654 19321 20037 20921 21196 21351 21797 22055 22671 23191 23747 23997 24231 24469 24481 26935 26654
Men 10798 11431 11306 11359 11600 11630 11919 12164 12824 13508 13513 13501 13743 13947 14184 14464 14770 14956 15061 15097 15141 16950 17166
Women 5562 5965 5823 5937 6340 6131 6735 7157 7214 7414 7683 7850 8054 8108 8487 8727 8977 9041 9171 9372 9341 9984 9489
15-24 years old 586 824 828 740 730 693 699 719 929 1102 994 982 959 926 985 1010 1102 1173 1203 1239 1213 1521 1432
25-54 12832 13632 13538 13612 14097 13989 14623 15081 15706 16587 16842 17164 17475 17676 18081 18401 18790 18979 19147 19292 19302 20774 20663
55+a
2941 2941 2763 2944 3113 3078 3333 3521 3401 3232 3360 3206 3361 3452 3605 3780 3855 3845 3881 3938 3966 4639 4559
Total employed (000) 25677 27186 26365 26631 27742 27452 29156 30062 30635 31613 32313 32636 33560 34089 35061 36035 37192 37600 38118 38651 38741 40998 40334
Men 16322 17170 16610 16714 17253 17193 17923 18306 18873 19646 19910 20013 20542 20959 21404 21921 22573 22849 23150 23365 23406 25035 25067
Women 9354 10016 9754 9917 10489 10259 11232 11756 11762 11968 12403 12622 13018 13129 13657 14114 14619 14751 14968 15286 15335 15963 15267
15-24 years old 5679 6129 5760 5602 5714 5524 5992 6027 6154 6387 6430 6532 6628 6579 6731 6816 7258 7322 7335 7508 7255 7265 6780
25-54 16218 17269 17027 17234 17991 17887 18782 19424 20025 20970 21472 21889 22515 22962 23568 24233 24829 25174 25602 25905 26182 27500 27492
55+a
3779 3789 3577 3795 4036 4040 4382 4611 4456 4257 4411 4215 4418 4547 4762 4985 5106 5105 5180 5238 5305 6232 6062
Notes: 1. Details may not add up to totals due to rounding.
2. Annualized data for 2014 from the Labor Force Survey is the average of estimates for April, July and October survey rounds. The estimates for these rounds exclude data for Leyte province only while that of January exclude Region VIII.
3. Annualized data for 2015 from the Labor Force Survey is the average of estimates for January, April, July and October survey rounds. The estimates for these rounds exclude data for Leyte Province only. The use of the survey rounds
that exclude Leyte was based on the results of the referendum conducted among members of the Inter-Agency Committee on Labor and Productivity Statistics.
4. See Metadata of Statistical Indicators on Decent Work for definitions and other information.
a Includes persons with age not reported.
Source: Philippine Statistics Authority, Labor Force Survey.
Employed who are married

Table 5. Combining work, family and personal life
Decent Work Indicator and
Underlying Data1995 1996 1997 1998 1999 2000 2001 2002 2003 2004 2005 2006 2007 2008 2009 2010 2011 2012 2013 2014 2015 2016 2017
Employed who are household
heads, % of employed 43.9 43.9 44.8 44.4 43.7 43.9 42.4 41.6 44.0 45.0 43.5 42.4 41.8 41.4 40.6 40.2 39.7 39.5 39.5 38.7 38.7 43.8 45.0
Men 62.2 63.0 64.0 63.3 62.6 62.3 61.1 60.6 63.3 64.3 62.9 61.5 60.4 59.5 58.4 57.8 57.0 56.5 56.3 55.4 55.4 61.6 61.8
Women 11.9 11.2 12.2 12.5 12.6 13.0 12.4 11.9 13.1 13.2 12.4 12.2 12.5 12.5 12.6 13.0 13.0 13.1 13.6 13.2 13.2 15.9 17.3
15-24 years old 2.7 4.9 5.4 4.1 3.7 3.2 2.5 2.3 5.8 7.0 5.4 4.3 3.7 3.5 3.5 3.5 3.7 3.8 4.1 3.9 4.0 8.6 9.0
25-54 51.5 51.6 52.5 51.5 50.2 50.0 48.5 47.0 49.9 51.3 49.5 48.5 47.6 46.6 45.4 44.6 44.1 43.9 43.7 42.8 42.2 47.6 48.7
55+a
72.9 72.1 71.9 71.7 71.5 72.1 70.7 69.9 70.7 70.8 70.2 69.9 69.7 69.8 69.3 69.5 69.3 69.1 69.1 68.5 69.0 68.5 68.4
% distribution 100.0 100.0 100.0 100.0 100.0 100.0 100.0 100.0 100.0 100.0 100.0 100.0 100.0 100.0 100.0 100.0 100.0 100.0 100.0 100.0 100.0 100.0 100.0
Men 90.1 90.6 89.9 89.5 89.1 88.9 88.7 88.8 88.6 88.9 89.1 88.9 88.4 88.4 87.9 87.4 87.1 87.0 86.5 86.5 86.5 85.9 85.4
Women 9.9 9.4 10.1 10.5 10.9 11.1 11.3 11.2 11.4 11.1 10.9 11.1 11.6 11.6 12.1 12.6 12.9 13.0 13.5 13.5 13.5 14.1 14.6
15-24 years old 1.4 2.5 2.6 2.0 1.8 1.5 1.2 1.1 2.6 3.1 2.5 2.0 1.7 1.6 1.7 1.6 1.8 1.9 2.0 2.0 1.9 3.5 3.4
25-54 74.2 74.6 75.6 75.0 74.4 74.3 73.7 73.1 74.0 75.7 75.5 76.7 76.3 75.9 75.1 74.5 74.2 74.4 74.2 74.1 73.7 72.8 73.8
55+a
24.5 22.9 21.8 23.0 23.8 24.2 25.1 25.8 23.4 21.2 22.0 21.3 22.0 22.5 23.2 23.9 24.0 23.8 23.8 24.0 24.4 23.7 22.9
Total employed who are
household heads (000) 11267 11938 11820 11827 12125 12039 12354 12493 13491 14211 14071 13838 14030 14102 14227 14504 14765 14849 15064 14965 15001 17974 18146
Men 10153 10813 10626 10583 10804 10706 10957 11090 11953 12637 12531 12298 12405 12463 12504 12675 12864 12919 13026 12951 12975 15434 15498
Women 1113 1125 1194 1243 1322 1333 1396 1403 1538 1574 1540 1540 1625 1638 1723 1829 1902 1930 2038 2014 2027 2540 2648
15-24 years old 154 298 310 232 214 178 150 139 355 446 349 280 244 228 235 236 269 278 298 294 288 623 612
25-54 8358 8906 8937 8874 9026 8950 9105 9132 9984 10751 10627 10614 10706 10700 10690 10802 10958 11041 11185 11082 11053 13084 13385
55+a
2755 2733 2573 2721 2885 2912 3099 3223 3152 3013 3095 2945 3080 3173 3302 3466 3538 3530 3581 3589 3660 4267 4149
Total employed (000) 25677 27186 26365 26631 27742 27452 29156 30062 30635 31613 32313 32636 33560 34089 35061 36035 37192 37600 38118 38651 38741 40998 40334
Men 16322 17170 16610 16714 17253 17193 17923 18306 18873 19646 19910 20013 20542 20959 21404 21921 22573 22849 23150 23365 23406 25035 25067
Women 9354 10016 9754 9917 10489 10259 11232 11756 11762 11968 12403 12622 13018 13129 13657 14114 14619 14751 14968 15286 15335 15963 15267
15-24 years old 5679 6129 5760 5602 5714 5524 5992 6027 6154 6387 6430 6532 6628 6579 6731 6816 7258 7322 7335 7508 7255 7265 6780
25-54 16218 17269 17027 17234 17991 17887 18782 19424 20025 20970 21472 21889 22515 22962 23568 24233 24829 25174 25602 25905 26182 27500 27492
55+a
3779 3789 3577 3795 4036 4040 4382 4611 4456 4257 4411 4215 4418 4547 4762 4985 5106 5105 5180 5238 5305 6232 6062
Notes: 1. Details may not add up to totals due to rounding.
2. Annualized data for 2014 from the Labor Force Survey is the average of estimates for April, July and October survey rounds. The estimates for these rounds exclude data for Leyte province only while that of January exclude Region VIII.
3. Annualized data for 2015 from the Labor Force Survey is the average of estimates for January, April, July and October survey rounds. The estimates for these rounds exclude data for Leyte Province only. The use of the survey rounds
that exclude Leyte was based on the results of the referendum conducted among members of the Inter-Agency Committee on Labor and Productivity Statistics.
4. See Metadata of Statistical Indicators on Decent Work for definitions and other information.
a Includes persons with age not reported.
Source: Philippine Statistics Authority, Labor Force Survey.
Employed who are household heads

Element 6
Work That Should be
Abolished

Table 6. Work that should be abolished
Decent Work Indicator 1995 1996 1997 1998 1999 2000 2001 2002 2003 2004 2005 2006 2007 2008 2009 2010 2011 2012 2013 2014 2015 2016 2017
Economic activity rate of children,
% of children population .. .. .. .. .. .. .. .. .. 9.5 9.0 8.6 8.3 7.6 7.7 7.2 8.5 7.7 6.9 7.2 6.0 5.2 4.6
5-9 years old .. .. .. .. .. .. .. .. .. 1.7 1.5 1.2 1.1 0.8 0.8 1.1 1.3 0.9 0.8 0.9 0.8 0.8 0.5
10-14 11.3 11.6 10.9 9.7 10.2 7.5 9.5 9.5 7.8 8.7 7.8 7.3 6.7 5.7 5.9 5.3 7.2 5.8 5.0 5.6 4.4 3.5 3.5
15-17 27.7 29.6 27.5 25.6 26.5 22.3 24.4 24.4 22.8 24.1 23.6 23.4 22.9 21.8 21.9 20.8 22.9 22.1 20.3 20.9 17.8 15.6 13.4
Boys .. .. .. .. .. .. .. .. .. 12.0 11.2 10.7 10.3 9.4 9.5 9.0 10.6 9.6 8.7 9.0 7.5 6.5 6.0
5-9 years old .. .. .. .. .. .. .. .. .. 2.0 1.7 1.4 1.3 0.9 0.9 1.2 1.5 1.0 0.9 1.0 0.8 0.8 0.5
10-14 14.4 14.5 13.3 12.2 13.1 9.6 12.0 11.9 9.7 11.1 9.8 9.1 8.3 7.0 7.3 6.5 8.7 7.2 6.1 6.8 5.1 4.1 4.1
15-17 36.1 37.2 34.8 32.7 34.0 28.5 31.0 30.6 28.9 31.2 30.0 29.4 29.1 28.0 27.6 26.6 29.2 28.2 26.5 26.9 23.0 20.3 18.4
Girls .. .. .. .. .. .. .. .. .. 6.8 6.6 6.4 6.2 5.6 5.8 5.4 6.4 5.7 5.0 5.4 4.5 3.7 3.1
5-9 years old .. .. .. .. .. .. .. .. .. 1.4 1.2 1.0 1.0 0.7 0.7 0.9 1.1 0.8 0.8 0.8 0.7 0.6 0.5
10-14 8.2 8.6 8.4 7.1 7.2 5.2 6.8 6.9 5.8 6.3 5.7 5.4 5.1 4.3 4.5 4.2 5.5 4.4 3.8 4.4 3.6 2.9 2.8
15-17 18.8 21.3 19.7 18.1 18.4 15.5 17.2 17.6 16.3 16.9 17.0 17.2 16.7 15.7 16.2 14.9 16.4 15.9 14.0 14.7 12.5 10.5 8.1
Working children, not
currently attending school,
% of working children .. .. .. .. .. .. .. .. .. .. .. 56.7 57.9 58.5 56.2 54.8 46.4 49.9 50.0 43.5 45.4 44.9 39.1
5-9 years old .. .. .. .. .. .. .. .. .. .. .. 20.3 21.7 17.6 15.6 13.4 8.7 6.1 6.5 4.9 4.7 6.0 1.8
10-14 .. .. .. .. .. .. .. .. .. .. .. 33.6 34.4 32.1 31.2 27.3 20.4 21.4 20.8 15.8 16.5 13.7 14.2
15-17 .. .. .. .. .. .. .. .. .. .. .. 72.3 73.0 72.8 70.7 71.1 64.9 66.3 66.2 60.3 61.4 59.9 52.5
Boys .. .. .. .. .. .. .. .. .. .. .. 60.2 61.0 62.4 59.1 58.2 50.4 54.4 54.6 48.5 51.2 50.5 46.9
5-9 years old .. .. .. .. .. .. .. .. .. .. .. 23.3 21.4 20.4 17.6 13.8 11.4 5.6 7.8 5.1 4.1 8.3 3.3
10-14 .. .. .. .. .. .. .. .. .. .. .. 38.3 39.2 37.9 35.9 32.3 25.0 26.5 25.2 20.7 22.8 17.5 19.5
15-17 .. .. .. .. .. .. .. .. .. .. .. 74.8 74.9 75.3 72.6 73.1 67.8 70.2 69.6 64.6 65.8 64.7 59.4
Girls .. .. .. .. .. .. .. .. .. .. .. 50.8 52.7 51.6 51.3 49.1 39.5 42.1 41.8 34.8 35.5 34.5 23.2
5-9 years old .. .. .. .. .. .. .. .. .. .. .. 15.7 22.0 13.9 12.8 10.6 6.9 6.7 2.4 4.5 2.7 5.7 3.7
10-14 .. .. .. .. .. .. .. .. .. .. .. 25.4 26.2 22.3 23.2 19.2 13.2 12.8 12.9 8.5 7.6 8.8 5.9
15-17 .. .. .. .. .. .. .. .. .. .. .. 67.9 69.4 68.2 67.4 67.6 59.5 59.6 59.5 52.5 53.4 49.7 35.7
Working children by major
industry group, % distribution .. .. .. .. .. .. .. .. .. 100.0 100.0 100.0 100.0 100.0 100.0 100.0 100.0 100.0 100.0 100.0 100.0 100.0 100.0
Agriculture, hunting and forestry .. .. .. .. .. .. .. .. .. 58.2 56.8 55.0 55.6 55.6 55.1 54.0 51.4 53.9 52.7 52.3 50.1 46.4 42.3
Fishing .. .. .. .. .. .. .. .. .. 6.3 6.3 6.4 6.0 5.6 6.2 6.2 5.3 5.5 5.2 5.4 4.8 5.2 4.8
Mining and quarrying 0.5 0.6 0.7 0.6 0.7 0.8 0.8 0.8 0.8 0.8 0.7 0.7 0.5 0.7
Manufacturing 4.5 5.4 5.4 5.0 4.3 4.3 4.7 4.9 4.4 4.9 4.7 5.4 4.8 5.4
Construction 1.2 1.2 1.1 1.2 1.5 1.3 1.6 1.4 1.8 2.2 2.4 2.6 3.8 4.2
Wholesale and retail trade; repair
of motor vehicles and motorcycles .. .. .. .. .. .. .. .. .. 15.0 15.1 16.5 16.2 17.0 16.6 17.2 21.9 18.9 19.5 21.4 22.5 24.7 28.5
Other service activities/Activities
of households as employers .. .. .. .. .. .. .. .. .. 9.6 10.0 10.4 10.7 10.2 10.8 10.8 9.2 8.5 7.9 6.7 7.2 7.3 6.3
Others .. .. .. .. .. .. .. .. .. 4.6 4.7 4.6 4.6 5.2 5.0 4.8 5.1 6.2 6.9 6.4 6.7 7.3 7.7
Boys .. .. .. .. .. .. .. .. .. 100.0 100.0 100.0 100.0 100.0 100.0 100.0 100.0 100.0 100.0 100.0 100.0 100.0 100.0
Agriculture, hunting and forestry .. .. .. .. .. .. .. .. .. 67.0 66.4 65.5 64.8 65.4 65.1 63.1 60.9 63.3 61.5 61.0 58.2 54.7 50.8
Fishing .. .. .. .. .. .. .. .. .. 9.0 8.9 9.3 8.7 8.3 8.7 8.8 7.5 7.6 7.3 7.2 6.7 6.9 6.7
Mining and quarrying 0.7 0.8 0.8 0.9 1.0 1.1 1.1 1.0 1.2 1.2 1.1 0.9 0.8 0.9
Manufacturing 4.2 4.6 4.1 4.2 3.6 3.7 4.2 4.3 3.8 4.0 4.1 4.8 4.6 5.4
Construction 1.8 1.8 1.7 1.9 2.3 2.0 2.5 2.2 2.8 3.4 3.6 4.0 5.6 6.2
Wholesale and retail trade; repair
of motor vehicles and motorcycles .. .. .. .. .. .. .. .. .. 10.3 10.3 11.4 11.9 12.2 12.0 12.3 16.0 13.3 13.8 15.5 16.3 17.7 19.7
Other service activities/Activities
of households as employers .. .. .. .. .. .. .. .. .. 2.4 2.4 2.6 2.9 2.4 2.7 3.2 3.1 2.2 2.2 1.7 2.5 2.1 2.5
Others .. .. .. .. .. .. .. .. .. 4.7 4.8 4.4 4.7 4.8 4.7 4.8 5.0 5.9 6.7 5.8 6.5 7.5 7.7
Girls .. .. .. .. .. .. .. .. .. 100.0 100.0 100.0 100.0 100.0 100.0 100.0 100.0 100.0 100.0 100.0 100.0 100.0 100.0
Agriculture, hunting and forestry .. .. .. .. .. .. .. .. .. 42.1 39.8 37.0 39.9 38.6 38.1 38.3 35.2 37.5 36.9 37.3 36.1 31.1 24.5
Fishing .. .. .. .. .. .. .. .. .. 1.6 1.7 1.5 1.5 1.0 1.8 1.8 1.5 1.7 1.4 2.1 1.3 2.1 0.9
Mining and quarrying 0.2 0.4 0.3 0.2 0.3 0.2 0.1 0.2 0.2 0.1 0.1 0.1 0.2 0.5
Manufacturing 5.1 6.7 7.4 6.3 5.5 5.4 5.6 5.9 5.6 6.5 5.8 6.7 5.1 5.5
Construction 0.0 0.1 0.1 * 0.1 0.1 0.1 * * * * 0.1 0.4 *
Wholesale and retail trade; repair
of motor vehicles and motorcycles .. .. .. .. .. .. .. .. .. 23.5 23.5 25.1 23.5 25.4 24.4 25.5 32.1 28.7 29.7 31.7 33.3 37.5 46.8
Other service activities/Activities
of households as employers .. .. .. .. .. .. .. .. .. 23.0 23.4 23.7 24.0 23.6 24.5 23.8 19.7 19.6 18.0 15.3 15.2 16.8 14.2
Others .. .. .. .. .. .. .. .. .. 4.5 4.4 4.8 4.4 5.8 5.4 4.8 5.3 6.5 7.3 7.4 6.8 7.0 7.8

Table 6. Work that should be abolished*
Decent Work Indicator 1995 1996 1997 1998 1999 2000 2001 2002 2003 2004 2005 2006 2007 2008 2009 2010 2011 2012 2013 2014 2015 2016 2017
Working children by major
occupation group, % distribution .. .. .. .. .. .. .. .. .. 100.0 100.0 100.0 100.0 100.0 100.0 100.0 100.0 100.0 100.0 100.0 100.0 .. ..
Farmers, forestry workers
and fishermen .. .. .. .. .. .. .. .. .. 5.8 6.8 7.3 6.6 5.1 4.5 3.9 3.7 2.9 2.6 2.8 2.5 .. ..
Service workers and shop
and market sales workers .. .. .. .. .. .. .. .. .. 11.5 11.5 12.6 12.9 14.0 14.8 15.4 17.6 19.9 20.4 22.4 24.1 .. ..
Trade and related workers .. .. .. .. .. .. .. .. .. 2.7 3.4 3.0 2.7 2.4 2.1 2.0 1.9 1.8 2.3 1.9 2.1 .. ..
Plant and machine operators
and assemblers .. .. .. .. .. .. .. .. .. 1.0 1.1 1.1 1.0 0.8 0.6 0.8 0.6 0.6 0.8 0.6 0.7 .. ..
Laborers and unskilled workers .. .. .. .. .. .. .. .. .. 77.3 75.5 74.5 75.0 75.3 76.2 76.0 73.4 72.6 71.2 70.0 67.9 .. ..
Others .. .. .. .. .. .. .. .. .. 1.7 1.6 1.7 1.9 2.3 1.9 2.1 2.7 2.2 2.7 2.4 2.7 .. ..
Boys .. .. .. .. .. .. .. .. .. 100.0 100.0 100.0 100.0 100.0 100.0 100.0 100.0 100.0 100.0 100.0 100.0 .. ..
Farmers, forestry workers
and fishermen .. .. .. .. .. .. .. .. .. 7.5 8.9 9.7 8.7 7.0 5.9 5.4 5.1 3.9 3.6 3.7 3.4 .. ..
Service workers and shop
and market sales workers .. .. .. .. .. .. .. .. .. 6.8 6.8 6.9 7.7 8.3 8.9 9.4 11.0 12.6 12.9 14.4 16.0 .. ..
Trade and related workers .. .. .. .. .. .. .. .. .. 2.6 3.3 2.8 2.7 2.3 2.1 2.1 2.0 1.9 2.4 2.1 2.1 .. ..
Plant and machine operators
and assemblers .. .. .. .. .. .. .. .. .. 1.4 1.4 1.3 1.3 1.2 0.9 1.1 0.9 0.8 0.9 0.7 0.8 .. ..
Laborers and unskilled workers .. .. .. .. .. .. .. .. .. 80.5 78.4 78.2 78.0 79.5 80.7 80.1 78.5 78.7 77.8 77.0 75.1 .. ..
Others .. .. .. .. .. .. .. .. .. 1.2 1.2 1.1 1.5 1.8 1.5 1.8 2.5 2.1 2.5 2.2 2.6 .. ..
Girls .. .. .. .. .. .. .. .. .. 100.0 100.0 100.0 100.0 100.0 100.0 100.0 100.0 100.0 100.0 100.0 100.0 .. ..
Farmers, forestry workers
and fishermen .. .. .. .. .. .. .. .. .. 2.5 3.0 3.1 2.9 1.9 2.1 1.3 1.3 1.1 1.1 1.1 0.9 .. ..
Service workers and shop
and market sales workers .. .. .. .. .. .. .. .. .. 20.3 20.0 22.2 21.8 24.0 24.8 25.5 29.0 32.7 34.1 36.2 38.0 .. ..
Trade and related workers .. .. .. .. .. .. .. .. .. 2.7 3.6 3.3 2.8 2.4 2.0 1.7 1.6 1.5 2.0 1.6 1.9 .. ..
Plant and machine operators
and assemblers .. .. .. .. .. .. .. .. .. 0.5 0.5 0.7 0.4 0.3 0.2 0.1 0.1 0.2 0.5 0.4 0.6 .. ..
Laborers and unskilled workers .. .. .. .. .. .. .. .. .. 71.4 70.6 68.1 69.7 68.1 68.5 68.9 64.8 61.9 59.3 57.9 55.5 .. ..
Others .. .. .. .. .. .. .. .. .. 2.8 2.3 2.5 2.5 3.3 2.6 2.5 3.2 2.7 3.1 2.8 3.0 .. ..
Working children by major
occupation group, % distribution .. .. .. .. .. .. .. .. .. .. .. .. .. .. .. .. .. .. .. .. .. 100.0 100.0
Skilled Agricultural, Forestry
and Fishery Workers .. .. .. .. .. .. .. .. .. .. .. .. .. .. .. .. .. .. .. .. .. 2.8 5.2
Service and Sales Workers .. .. .. .. .. .. .. .. .. .. .. .. .. .. .. .. .. .. .. .. .. 19.7 22.5
Craft and Related Trades
Workers .. .. .. .. .. .. .. .. .. .. .. .. .. .. .. .. .. .. .. .. .. 2.3 2.6
Plant and Machine Operators
and Assemblers .. .. .. .. .. .. .. .. .. .. .. .. .. .. .. .. .. .. .. .. .. 1.1 1.3
Elementary Occupations .. .. .. .. .. .. .. .. .. .. .. .. .. .. .. .. .. .. .. .. .. 71.2 65.8
Others .. .. .. .. .. .. .. .. .. .. .. .. .. .. .. .. .. .. .. .. .. 2.9 2.6
Boys .. .. .. .. .. .. .. .. .. .. .. .. .. .. .. .. .. .. .. .. .. 100.0 100.0
Skilled Agricultural, Forestry
and Fishery Workers .. .. .. .. .. .. .. .. .. .. .. .. .. .. .. .. .. .. .. .. .. 3.7 6.9
Service and Sales Workers .. .. .. .. .. .. .. .. .. .. .. .. .. .. .. .. .. .. .. .. .. 13.6 15.0
Craft and Related Trades
Workers .. .. .. .. .. .. .. .. .. .. .. .. .. .. .. .. .. .. .. .. .. 2.7 2.8
Plant and Machine Operators
and Assemblers .. .. .. .. .. .. .. .. .. .. .. .. .. .. .. .. .. .. .. .. .. 1.4 1.7
Elementary Occupations .. .. .. .. .. .. .. .. .. .. .. .. .. .. .. .. .. .. .. .. .. 76.0 71.4
Others .. .. .. .. .. .. .. .. .. .. .. .. .. .. .. .. .. .. .. .. .. 2.7 2.2
Girls .. .. .. .. .. .. .. .. .. .. .. .. .. .. .. .. .. .. .. .. .. 100.0 100.0
Skilled Agricultural, Forestry
and Fishery Workers .. .. .. .. .. .. .. .. .. .. .. .. .. .. .. .. .. .. .. .. .. 1.3 1.6
Service and Sales Workers .. .. .. .. .. .. .. .. .. .. .. .. .. .. .. .. .. .. .. .. .. 30.9 38.1
Craft and Related Trades
Workers .. .. .. .. .. .. .. .. .. .. .. .. .. .. .. .. .. .. .. .. .. 1.9 2.3
Plant and Machine Operators
and Assemblers .. .. .. .. .. .. .. .. .. .. .. .. .. .. .. .. .. .. .. .. .. 0.4 0.5
Elementary Occupations .. .. .. .. .. .. .. .. .. .. .. .. .. .. .. .. .. .. .. .. .. 62.1 54.1
Others .. .. .. .. .. .. .. .. .. .. .. .. .. .. .. .. .. .. .. .. .. 3.2 3.2
Notes: 1. Data based on past week reference period.
2. Annualized data for 2014 from the Labor Force Survey is the average of estimates for April, July and October survey rounds. The estimates for these rounds exclude data for Leyte province
only while that of January exclude Region VIII.
3. Annualized data for 2015 from the Labor Force Survey is the average of estimates for January, April, July and October survey rounds. The estimates for these rounds exclude data
for Leyte province only. The use of the four survey rounds that exclude Leyte was based on the results of the referendum conducted among members of theInter-Agency Committee on
Labor and Productivity Statistics.
* Less than half the unit used.
Source: Philippine Statistics Authority, Labor Force Survey.
Date updated: 09/20/2018

Table 6. Work that should be abolishedEconomic activity rate of children
Decent Work Indicator and
Underlying Data1995 1996 1997 1998 1999 2000 2001 2002 2003 2004 2005 2006 2007 2008 2009 2010 2011 2012 2013 2014 2015 2016 2017
Economic activity rate of children1,
% of children population .. .. .. .. .. .. .. .. .. 9.5 9.0 8.6 8.3 7.6 7.7 7.2 8.5 7.7 6.9 7.2 6.0 5.2 4.6
5-9 years old .. .. .. .. .. .. .. .. .. 1.7 1.5 1.2 1.1 0.8 0.8 1.1 1.3 0.9 0.8 0.9 0.8 0.8 0.5
10-14 11.3 11.6 10.9 9.7 10.2 7.5 9.5 9.5 7.8 8.7 7.8 7.3 6.7 5.7 5.9 5.3 7.2 5.8 5.0 5.6 4.4 3.5 3.5
15-17 27.7 29.6 27.5 25.6 26.5 22.3 24.4 24.4 22.8 24.1 23.6 23.4 22.9 21.8 21.9 20.8 22.9 22.1 20.3 20.9 17.8 15.6 13.4
Boys .. .. .. .. .. .. .. .. .. 12.0 11.2 10.7 10.3 9.4 9.5 9.0 10.6 9.6 8.7 9.0 7.5 6.5 6.0
5-9 years old .. .. .. .. .. .. .. .. .. 2.0 1.7 1.4 1.3 0.9 0.9 1.2 1.5 1.0 0.9 1.0 0.8 0.8 0.5
10-14 14.4 14.5 13.3 12.2 13.1 9.6 12.0 11.9 9.7 11.1 9.8 9.1 8.3 7.0 7.3 6.5 8.7 7.2 6.1 6.8 5.1 4.1 4.1
15-17 36.1 37.2 34.8 32.7 34.0 28.5 31.0 30.6 28.9 31.2 30.0 29.4 29.1 28.0 27.6 26.6 29.2 28.2 26.5 26.9 23.0 20.3 18.4
Girls .. .. .. .. .. .. .. .. .. 6.8 6.6 6.4 6.2 5.6 5.8 5.4 6.4 5.7 5.0 5.4 4.5 3.7 3.1
5-9 years old .. .. .. .. .. .. .. .. .. 1.4 1.2 1.0 1.0 0.7 0.7 0.9 1.1 0.8 0.8 0.8 0.7 0.6 0.5
10-14 8.2 8.6 8.4 7.1 7.2 5.2 6.8 6.9 5.8 6.3 5.7 5.4 5.1 4.3 4.5 4.2 5.5 4.4 3.8 4.4 3.6 2.9 2.8
15-17 18.8 21.3 19.7 18.1 18.4 15.5 17.2 17.6 16.3 16.9 17.0 17.2 16.7 15.7 16.2 14.9 16.4 15.9 14.0 14.7 12.5 10.5 8.1
Total working children1 (000) .. .. .. .. .. .. .. .. .. 2356 2290 2354 2316 2153 2199 2095 2482 2273 2076 2170 1839 1509 1344
5-9 years old .. .. .. .. .. .. .. .. .. 162 143 123 120 85 90 112 138 99 92 103 86 84 57
10-14 874 932 951 874 953 740 971 986 798 849 776 783 742 642 682 630 861 704 616 695 547 394 393
15-17 1418 1558 1363 1280 1333 1165 1281 1320 1269 1346 1370 1447 1454 1425 1427 1353 1483 1471 1368 1372 1205 1031 894
Boys .. .. .. .. .. .. .. .. .. 1527 1466 1487 1462 1365 1383 1323 1567 1448 1336 1374 1163 978 907
5-9 years old .. .. .. .. .. .. .. .. .. 98 86 73 70 49 51 65 79 54 51 59 49 48 30
10-14 567 589 591 563 622 492 634 635 509 550 497 496 467 401 432 390 535 446 385 425 324 234 241
15-17 954 1027 891 836 888 779 852 866 834 880 884 919 926 915 899 869 954 949 901 890 789 696 636
Girls .. .. .. .. .. .. .. .. .. 829 824 866 854 788 816 772 914 825 740 796 676 531 436
5-9 years old .. .. .. .. .. .. .. .. .. 64 57 51 50 36 39 47 58 45 42 44 37 35 27
10-14 307 342 360 312 331 249 337 351 289 299 280 287 275 242 250 240 326 258 232 270 223 160 152
15-17 464 532 472 444 445 386 429 454 434 467 487 529 529 510 528 484 529 522 467 482 416 336 258
Total household population of
children (000) 21300 21877 23195 23659 24194 24991 25349 25696 25493 24906 25564 27449 28013 28459 28701 28934 29118 29541 30078 30059 30592 29103 29398
5-9 years old 8485 8592 9502 9679 9832 9852 9833 9853 9716 9602 9784 10491 10584 10608 10671 10633 10623 10784 11022 11108 11331 11181 11448
10-14 7702 8021 8736 8971 9330 9919 10271 10433 10221 9710 9977 10767 11072 11328 11502 11798 12011 12115 12325 12371 12502 11294 11289
15-17 5113 5264 4958 5009 5032 5220 5245 5410 5556 5594 5803 6191 6357 6523 6528 6503 6484 6642 6732 6579 6760 6628 6661
Boys 10943 11233 11866 12130 12498 12954 13149 13204 13052 12691 13061 13954 14220 14464 14598 14734 14822 15040 15300 15274 15545 14933 15153
5-9 years old 4359 4406 4868 4972 5123 5123 5093 5044 4943 4915 5049 5372 5400 5435 5447 5433 5421 5482 5630 5676 5777 5739 5883
10-14 3939 4064 4439 4601 4765 5101 5305 5332 5222 4951 5067 5460 5641 5757 5889 6039 6132 6189 6268 6293 6342 5764 5808
15-17 2645 2763 2559 2558 2610 2730 2751 2828 2887 2825 2945 3122 3179 3272 3262 3262 3268 3369 3402 3305 3425 3431 3462
Girls 10357 10643 11329 11529 11696 12037 12200 12491 12441 12215 12503 13494 13792 13996 14101 14200 14297 14500 14778 14785 15048 14169 14245
5-9 years old 4126 4185 4634 4708 4709 4729 4740 4808 4773 4688 4736 5118 5184 5174 5223 5200 5202 5301 5392 5432 5554 5443 5566
10-14 3763 3957 4297 4371 4566 4818 4966 5101 4999 4758 4910 5307 5431 5571 5613 5759 5878 5926 6056 6078 6159 5530 5480
15-17 2468 2501 2398 2451 2421 2490 2494 2582 2669 2769 2858 3069 3177 3251 3265 3241 3216 3273 3330 3274 3334 3197 3199
Notes: 1. Annualized data for 2014 from the Labor Force Survey is the average of estimates for April, July and October survey rounds. The estimates for these rounds exclude data for Leyte province only while that of January exclude Region VIII.
2. Annualized data for 2015 from the Labor Force Survey is the average of estimates for January, April, July and October survey rounds. The estimates for these rounds exclude data for Leyte province only. The use of the
four survey rounds that exclude Leyte was based on the results of the referendum conducted among members of the Inter-Agency Committee on Labor and Productivity Statistics.
3. See Metadata of Statistical Indicators on Decent Work for definitions and other information.
1 Data based on past week reference period.
Source: Philippine Statistics Authority, Labor Force Survey.

Table 6. Work that should be abolished
Decent Work Indicator and
Underlying Data1995 1996 1997 1998 1999 2000 2001 2002 2003 2004 2005 2006 2007 2008 2009 2010 2011 2012 2013 2014 2015 2016 2017
Working children1, not currently
attending school, % of working
children .. .. .. .. .. .. .. .. .. .. .. 56.7 57.9 58.5 56.2 54.8 46.4 49.9 50.0 43.5 45.4 44.9 39.1
5-9 years old .. .. .. .. .. .. .. .. .. .. .. 20.3 21.7 17.6 15.6 13.4 8.7 6.1 6.5 4.9 4.7 6.0 1.8
10-14 .. .. .. .. .. .. .. .. .. .. .. 33.6 34.4 32.1 31.2 27.3 20.4 21.4 20.8 15.8 16.5 13.7 14.2
15-17 .. .. .. .. .. .. .. .. .. .. .. 72.3 73.0 72.8 70.7 71.1 64.9 66.3 66.2 60.3 61.4 59.9 52.5
Boys .. .. .. .. .. .. .. .. .. .. .. 60.2 61.0 62.4 59.1 58.2 50.4 54.4 54.6 48.5 51.2 50.5 46.9
5-9 years old .. .. .. .. .. .. .. .. .. .. .. 23.3 21.4 20.4 17.6 13.8 11.4 5.6 7.8 5.1 4.1 8.3 3.3
10-14 .. .. .. .. .. .. .. .. .. .. .. 38.3 39.2 37.9 35.9 32.3 25 26.5 25.2 20.7 22.8 17.5 19.5
15-17 .. .. .. .. .. .. .. .. .. .. .. 74.8 74.9 75.3 72.6 73.1 67.8 70.2 69.6 64.6 65.8 64.7 59.4
Girls .. .. .. .. .. .. .. .. .. .. .. 50.8 52.7 51.6 51.3 49.1 39.5 42.1 41.8 34.8 35.5 34.5 23.2
5-9 years old .. .. .. .. .. .. .. .. .. .. .. 15.7 22.0 13.9 12.8 10.6 6.9 6.7 2.4 4.5 2.7 5.7 3.7
10-14 .. .. .. .. .. .. .. .. .. .. .. 25.4 26.2 22.3 23.2 19.2 13.2 12.8 12.9 8.5 7.6 8.8 5.9
15-17 .. .. .. .. .. .. .. .. .. .. .. 67.9 69.4 68.2 67.4 67.6 59.5 59.6 59.5 52.5 53.4 49.7 35.7
Total working children1,
not currently attending school
(000) .. .. .. .. .. .. .. .. .. .. .. 1334 1342 1259 1236 1149 1151 1134 1038 943 834 677 526
5-9 years old .. .. .. .. .. .. .. .. .. .. .. 25 26 15 14 15 12 6 6 5 4 5 1
10-14 .. .. .. .. .. .. .. .. .. .. .. 263 255 206 213 172 176 151 128 110 90 54 56
15-17 .. .. .. .. .. .. .. .. .. .. .. 1046 1061 1037 1009 962 962 976 905 828 740 618 469
Boys .. .. .. .. .. .. .. .. .. .. .. 895 892 852 817 770 790 787 729 666 595 494 425
5-9 years old .. .. .. .. .. .. .. .. .. .. .. 17 15 10 9 9 9 3 4 3 2 4 1
10-14 .. .. .. .. .. .. .. .. .. .. .. 190 183 152 155 126 134 118 97 88 74 41 47
15-17 .. .. .. .. .. .. .. .. .. .. .. 687 694 689 653 635 647 666 627 575 519 450 378
Girls .. .. .. .. .. .. .. .. .. .. .. 440 450 407 419 379 361 347 309 277 240 183 101
5-9 years old .. .. .. .. .. .. .. .. .. .. .. 8 11 5 5 5 4 3 1 2 1 2 1
10-14 .. .. .. .. .. .. .. .. .. .. .. 73 72 54 58 46 43 33 30 23 17 14 9
15-17 .. .. .. .. .. .. .. .. .. .. .. 359 367 348 356 327 315 311 278 253 222 167 92
Total working children1 (000) .. .. .. .. .. .. .. .. .. 2356 2290 2354 2316 2153 2199 2095 2482 2273 2076 2170 1839 1509 1344
5-9 years old .. .. .. .. .. .. .. .. .. 162 143 123 120 85 90 112 138 99 92 103 86 84 57
10-14 874 932 951 874 953 740 971 986 798 849 776 783 742 642 682 630 861 704 616 695 547 394 393
15-17 1418 1558 1363 1280 1333 1165 1281 1320 1269 1346 1370 1447 1454 1425 1427 1353 1483 1471 1368 1372 1205 1031 894
Boys .. .. .. .. .. .. .. .. .. 1527 1466 1487 1462 1365 1383 1323 1567 1448 1336 1374 1163 978 907
5-9 years old .. .. .. .. .. .. .. .. .. 98 86 73 70 49 51 65 79 54 51 59 49 48 30
10-14 567 589 591 563 622 492 634 635 509 550 497 496 467 401 432 390 535 446 385 425 325 234 241
15-17 954 1027 891 836 888 779 852 866 834 880 884 919 926 915 899 869 954 949 901 890 789 696 636
Girls .. .. .. .. .. .. .. .. .. 829 824 866 854 788 816 772 914 825 740 796 676 531 436
5-9 years old .. .. .. .. .. .. .. .. .. 64 57 51 50 36 39 47 58 45 42 44 37 35 27
10-14 307 342 360 312 331 249 337 351 289 299 280 287 275 242 250 240 326 258 232 270 223 160 152
15-17 464 532 472 444 445 386 429 454 434 467 487 529 529 510 528 484 529 522 467 482 416 336 258
Notes: 1. Annualized data for 2014 from the Labor Force Survey is the average of estimates for April, July and October survey rounds. The estimates for these rounds exclude data for Leyte province only while that of January exclude Region VIII.
2. Annualized data for 2015 from the Labor Force Survey is the average of estimates for January, April, July and October survey rounds. The estimates for these rounds exclude data for Leyte province only. The use of the
four survey rounds that exclude Leyte was based on the results of the referendum conducted among members of the Inter-Agency Committee on Labor and Productivity Statistics.
3. See Metadata of Statistical Indicators on Decent Work for definitions and other information.
1 Data based on past week reference period.
Source: Philippine Statistics Authority, Labor Force Survey.
Working children, not currently attending school

Table 6. Work that should be abolished
Decent Work Indicator and
Underlying Data1995 1996 1997 1998 1999 2000 2001 2002 2003 2004 2005 2006 2007 2008 2009 2010 2011 2012 2013 2014 2015 2016 2017
Working children1 by major industry
group, % distribution .. .. .. .. .. .. .. .. .. 100.0 100.0 100.0 100.0 100.0 100.0 100.0 100.0 100.0 100.0 100.0 100.0 100.0 100.0
Agriculture, hunting and forestry .. .. .. .. .. .. .. .. .. 58.2 56.8 55.0 55.6 55.6 55.1 54.0 51.4 53.9 52.7 52.3 50.1 46.4 42.3
Fishing .. .. .. .. .. .. .. .. .. 6.3 6.3 6.4 6.0 5.6 6.2 6.2 5.3 5.5 5.2 5.4 4.8 5.2 4.8
Mining and quarrying .. .. .. .. .. .. .. .. .. 0.5 0.6 0.7 0.6 0.7 0.8 0.8 0.8 0.8 0.8 0.7 0.7 0.5 0.7
Manufacturing .. .. .. .. .. .. .. .. .. 4.5 5.4 5.4 5.0 4.3 4.3 4.7 4.9 4.4 4.9 4.7 5.4 4.8 5.4
Construction .. .. .. .. .. .. .. .. .. 1.2 1.2 1.1 1.2 1.5 1.3 1.6 1.4 1.8 2.2 2.4 2.6 3.8 4.2
Wholesale and retail trade; repair
of motor vehicles and motorcycles .. .. .. .. .. .. .. .. .. 15.0 15.1 16.5 16.2 17.0 16.6 17.2 21.9 18.9 19.5 21.4 22.5 24.7 28.5
Other service activities/Activities
of households as employers .. .. .. .. .. .. .. .. .. 9.6 10.0 10.4 10.7 10.2 10.8 10.8 9.2 8.5 7.9 6.7 7.2 7.3 6.3
Others .. .. .. .. .. .. .. .. .. 4.6 4.7 4.6 4.6 5.2 5.0 4.8 5.1 6.2 6.9 6.4 6.7 7.3 7.7
Boys .. .. .. .. .. .. .. .. .. 100.0 100.0 100.0 100.0 100.0 100.0 100.0 100.0 100.0 100.0 100.0 100.0 100.0 100.0
Agriculture, hunting and forestry .. .. .. .. .. .. .. .. .. 67.0 66.4 65.5 64.8 65.4 65.1 63.1 60.9 63.3 61.5 61.0 58.2 54.7 50.8
Fishing .. .. .. .. .. .. .. .. .. 9.0 8.9 9.3 8.7 8.3 8.7 8.8 7.5 7.6 7.3 7.2 6.7 6.9 6.7
Mining and quarrying .. .. .. .. .. .. .. .. .. 0.7 0.8 0.8 0.9 1.0 1.1 1.1 1.0 1.2 1.2 1.1 0.9 0.8 0.9
Manufacturing .. .. .. .. .. .. .. .. .. 4.2 4.6 4.1 4.2 3.6 3.7 4.2 4.3 3.8 4.0 4.1 4.8 4.6 5.4
Construction .. .. .. .. .. .. .. .. .. 1.8 1.8 1.7 1.9 2.3 2.0 2.5 2.2 2.8 3.4 3.6 4.0 5.6 6.2
Wholesale and retail trade; repair
of motor vehicles and motorcycles .. .. .. .. .. .. .. .. .. 10.3 10.3 11.4 11.9 12.2 12.0 12.3 16.0 13.3 13.8 15.5 16.3 17.7 19.7
Other service activities/Activities
of households as employers .. .. .. .. .. .. .. .. .. 2.4 2.4 2.6 2.9 2.4 2.7 3.2 3.1 2.2 2.2 1.7 2.5 2.1 2.5
Others .. .. .. .. .. .. .. .. .. 4.7 4.8 4.4 4.7 4.8 4.7 4.8 5.0 5.9 6.7 5.8 6.5 7.5 7.7
Girls .. .. .. .. .. .. .. .. .. 100.0 100.0 100.0 100.0 100.0 100.0 100.0 100.0 100.0 100.0 100.0 100.0 100.0 100.0
Agriculture, hunting and forestry .. .. .. .. .. .. .. .. .. 42.1 39.8 37.0 39.9 38.6 38.1 38.3 35.2 37.5 36.9 37.3 36.1 31.1 24.5
Fishing .. .. .. .. .. .. .. .. .. 1.6 1.7 1.5 1.5 1.0 1.8 1.8 1.5 1.7 1.4 2.1 1.3 2.1 0.9
Mining and quarrying .. .. .. .. .. .. .. .. .. 0.2 0.4 0.3 0.2 0.3 0.2 0.1 0.2 0.2 0.1 0.1 0.1 0.2 0.5
Manufacturing .. .. .. .. .. .. .. .. .. 5.1 6.7 7.4 6.3 5.5 5.4 5.6 5.9 5.6 6.5 5.8 6.7 5.1 5.5
Construction .. .. .. .. .. .. .. .. .. 0.0 0.1 0.1 * 0.1 0.1 0.1 * * * * 0.1 0.4 *
Wholesale and retail trade; repair
of motor vehicles and motorcycles .. .. .. .. .. .. .. .. .. 23.5 23.5 25.1 23.5 25.4 24.4 25.5 32.1 28.7 29.7 31.7 33.3 37.5 46.8
Other service activities/Activities
of households as employers .. .. .. .. .. .. .. .. .. 23.0 23.4 23.7 24.0 23.6 24.5 23.8 19.7 19.6 18.0 15.3 15.2 16.8 14.2
Others .. .. .. .. .. .. .. .. .. 4.5 4.4 4.8 4.4 5.8 5.4 4.8 5.3 6.5 7.3 7.4 6.8 7.0 7.8
Notes: 1. Annualized data for 2014 from the Labor Force Survey is the average of estimates for April, July and October survey rounds. The estimates for these rounds exclude data for Leyte province only while that of January exclude Region VIII.
2. Annualized data for 2015 from the Labor Force Survey is the average of estimates for January, April, July and October survey rounds. The estimates for these rounds exclude data for Leyte province only. The use of the
four survey rounds that exclude Leyte was based on the results of the referendum conducted among members of the Inter-Agency Committee on Labor and Productivity Statistics.
3. See Metadata of Statistical Indicators on Decent Work for definitions and other information.
1 Data based on past week reference period.
* Less than half the unit used.
Source: Philippine Statistics Authority, Labor Force Survey.
Working children by major industry group

Table 6. Work that should be abolished
Decent Work Indicator and
Underlying Data1995 1996 1997 1998 1999 2000 2001 2002 2003 2004 2005 2006 2007 2008 2009 2010 2011 2012 2013 2014 2015 2016 2017
Total working children1 by major
industry group (000) .. .. .. .. .. .. .. .. .. 2356 2290 2354 2316 2153 2199 2095 2482 2273 2076 2170 1839 1509 1344
Agriculture, hunting and forestry .. .. .. .. .. .. .. .. .. 1372 1301 1295 1288 1196 1211 1131 1275 1226 1095 1135 921 700 568
Fishing .. .. .. .. .. .. .. .. .. 149 144 151 140 121 136 130 131 125 107 117 88 79 65
Mining and quarrying .. .. .. .. .. .. .. .. .. 11 14 16 15 15 17 16 19 19 17 15 13 8 10
Manufacturing .. .. .. .. .. .. .. .. .. 106 123 126 116 92 95 99 121 101 102 102 100 72 72
Construction .. .. .. .. .. .. .. .. .. 28 28 27 28 32 28 33 35 40 45 51 47 57 57
Wholesale and retail trade; repair
of motor vehicles and motorcycles .. .. .. .. .. .. .. .. .. 353 345 388 375 367 364 360 544 430 405 465 414 372 383
Other service activities/Activities
of households as employers .. .. .. .. .. .. .. .. .. 227 228 244 247 219 238 226 229 193 163 146 132 110 85
Others .. .. .. .. .. .. .. .. .. 109 107 108 106 112 109 101 127 140 143 139 124 110 104
Boys .. .. .. .. .. .. .. .. .. 1527 1466 1487 1462 1365 1383 1323 1567 1448 1336 1374 1163 978 907
Agriculture, hunting and forestry .. .. .. .. .. .. .. .. .. 1023 973 974 948 893 900 835 954 917 822 838 677 535 461
Fishing .. .. .. .. .. .. .. .. .. 137 130 138 127 113 121 116 117 110 97 99 78 67 61
Mining and quarrying .. .. .. .. .. .. .. .. .. 10 11 12 13 13 15 15 16 17 16 15 11 8 8
Manufacturing .. .. .. .. .. .. .. .. .. 64 68 61 62 49 51 55 67 55 54 56 56 45 49
Construction .. .. .. .. .. .. .. .. .. 28 27 26 28 31 28 33 35 40 45 50 46 55 56
Wholesale and retail trade; repair
of motor vehicles and motorcycles .. .. .. .. .. .. .. .. .. 158 151 170 174 167 166 163 251 193 185 213 189 173 179
Other service activities/Activities
of households as employers .. .. .. .. .. .. .. .. .. 37 35 39 42 33 38 42 48 32 30 24 29 21 23
Others .. .. .. .. .. .. .. .. .. 72 71 66 68 66 65 64 79 86 89 80 76 73 70
Girls .. .. .. .. .. .. .. .. .. 829 824 866 854 788 816 772 914 825 740 796 676 531 436
Agriculture, hunting and forestry .. .. .. .. .. .. .. .. .. 349 328 320 341 304 311 296 322 309 273 297 244 165 107
Fishing .. .. .. .. .. .. .. .. .. 13 14 13 13 8 15 14 14 14 10 17 9 11 4
Mining and quarrying .. .. .. .. .. .. .. .. .. 2 3 3 2 2 2 1 2 2 1 1 1 1 2
Manufacturing .. .. .. .. .. .. .. .. .. 42 55 64 54 43 44 43 54 46 48 46 45 27 24
Construction .. .. .. .. .. .. .. .. .. 0 1 1 * 1 1 1 * * * * 1 2 *
Wholesale and retail trade; repair
of motor vehicles and motorcycles .. .. .. .. .. .. .. .. .. 195 194 217 201 200 199 197 293 237 220 252 225 199 204
Other service activities/Activities
of households as employers .. .. .. .. .. .. .. .. .. 191 193 205 205 186 200 184 180 162 133 122 103 89 62
Others .. .. .. .. .. .. .. .. .. 37 36 42 38 46 44 37 48 54 54 59 46 37 34
Notes: 1. Annualized data for 2014 from the Labor Force Survey is the average of estimates for April, July and October survey rounds. The estimates for these rounds exclude data for Leyte province only while that of January exclude Region VIII.
2. Annualized data for 2015 from the Labor Force Survey is the average of estimates for January, April, July and October survey rounds. The estimates for these rounds exclude data for Leyte province only. The use of the
four survey rounds that exclude Leyte was based on the results of the referendum conducted among members of the Inter-Agency Committee on Labor and Productivity Statistics.
3. See Metadata of Statistical Indicators on Decent Work for definitions and other information.
1 Data based on past week reference period.
* Less than half the unit used.
Source: Philippine Statistics Authority, Labor Force Survey.
Working children by major industry group

Table 6. Work that should be abolished
Decent Work Indicator and
Underlying Data1995 1996 1997 1998 1999 2000 2001 2002 2003 2004 2005 2006 2007 2008 2009 2010 2011 2012 2013 2014 2015
Working children1 by major
occupation group, % distribution .. .. .. .. .. .. .. .. .. 100.0 100.0 100.0 100.0 100.0 100.0 100.0 100.0 100.0 100.0 100.0 100.0
Farmers, forestry workers
and fishermen .. .. .. .. .. .. .. .. .. 5.8 6.8 7.3 6.6 5.1 4.5 3.9 3.7 2.9 2.6 2.8 2.5
Service workers and shop
and market sales workers .. .. .. .. .. .. .. .. .. 11.5 11.5 12.6 12.9 14.0 14.8 15.4 17.6 19.9 20.4 22.4 24.1
Trade and related workers .. .. .. .. .. .. .. .. .. 2.7 3.4 3.0 2.7 2.4 2.1 2.0 1.9 1.8 2.3 1.9 2.1
Plant and machine operators
and assemblers .. .. .. .. .. .. .. .. .. 1.0 1.1 1.1 1.0 0.8 0.6 0.8 0.6 0.6 0.8 0.6 0.7
Laborers and unskilled workers .. .. .. .. .. .. .. .. .. 77.3 75.5 74.5 75.0 75.3 76.2 76.0 73.4 72.6 71.2 70.0 67.9
Others .. .. .. .. .. .. .. .. .. 1.7 1.6 1.7 1.9 2.3 1.9 2.1 2.7 2.2 2.7 2.4 2.7
Boys .. .. .. .. .. .. .. .. .. 100.0 100.0 100.0 100.0 100.0 100.0 100.0 100.0 100.0 100.0 100.0 100.0
Farmers, forestry workers
and fishermen .. .. .. .. .. .. .. .. .. 7.5 8.9 9.7 8.7 7.0 5.9 5.4 5.1 3.9 3.6 3.7 3.4
Service workers and shop
and market sales workers .. .. .. .. .. .. .. .. .. 6.8 6.8 6.9 7.7 8.3 8.9 9.4 11.0 12.6 12.9 14.4 16.0
Trade and related workers .. .. .. .. .. .. .. .. .. 2.6 3.3 2.8 2.7 2.3 2.1 2.1 2.0 1.9 2.4 2.1 2.1
Plant and machine operators
and assemblers .. .. .. .. .. .. .. .. .. 1.4 1.4 1.3 1.3 1.2 0.9 1.1 0.9 0.8 0.9 0.7 0.8
Laborers and unskilled workers .. .. .. .. .. .. .. .. .. 80.5 78.4 78.2 78.0 79.5 80.7 80.1 78.5 78.7 77.8 77.0 75.1
Others .. .. .. .. .. .. .. .. .. 1.2 1.2 1.1 1.5 1.8 1.5 1.8 2.5 2.1 2.5 2.2 2.6
Girls .. .. .. .. .. .. .. .. .. 100.0 100.0 100.0 100.0 100.0 100.0 100.0 100.0 100.0 100.0 100.0 100.0
Farmers, forestry workers
and fishermen .. .. .. .. .. .. .. .. .. 2.5 3.0 3.1 2.9 1.9 2.1 1.3 1.3 1.1 1.1 1.1 0.9
Service workers and shop
and market sales workers .. .. .. .. .. .. .. .. .. 20.3 20.0 22.2 21.8 24.0 24.8 25.5 29.0 32.7 34.1 36.2 38.0
Trade and related workers .. .. .. .. .. .. .. .. .. 2.7 3.6 3.3 2.8 2.4 2.0 1.7 1.6 1.5 2.0 1.6 1.9
Plant and machine operators
and assemblers .. .. .. .. .. .. .. .. .. 0.5 0.5 0.7 0.4 0.3 0.2 0.1 0.1 0.2 0.5 0.4 0.6
Laborers and unskilled workers .. .. .. .. .. .. .. .. .. 71.4 70.6 68.1 69.7 68.1 68.5 68.9 64.8 61.9 59.3 57.9 55.5
Others .. .. .. .. .. .. .. .. .. 2.8 2.3 2.5 2.5 3.3 2.6 2.5 3.2 2.7 3.1 2.8 3.0
Notes: 1. Annualized data for 2014 from the Labor Force Survey is the average of estimates for April, July and October survey rounds. The estimates for these rounds exclude data for Leyte province only while that of January exclude
Region VIII.
2. Annualized data for 2015 from the Labor Force Survey is the average of estimates for January, April, July and October survey rounds. The estimates for these rounds exclude data for Leyte province only. The use of the
four survey rounds that exclude Leyte was based on the results of the referendum conducted among members of the Inter-Agency Committee on Labor and Productivity Statistics.
3. See Metadata of Statistical Indicators on Decent Work for definitions and other information.
1 Data based on past week reference period.
Source: Philippine Statistics Authority, Labor Force Survey.
Working children by major occupation group
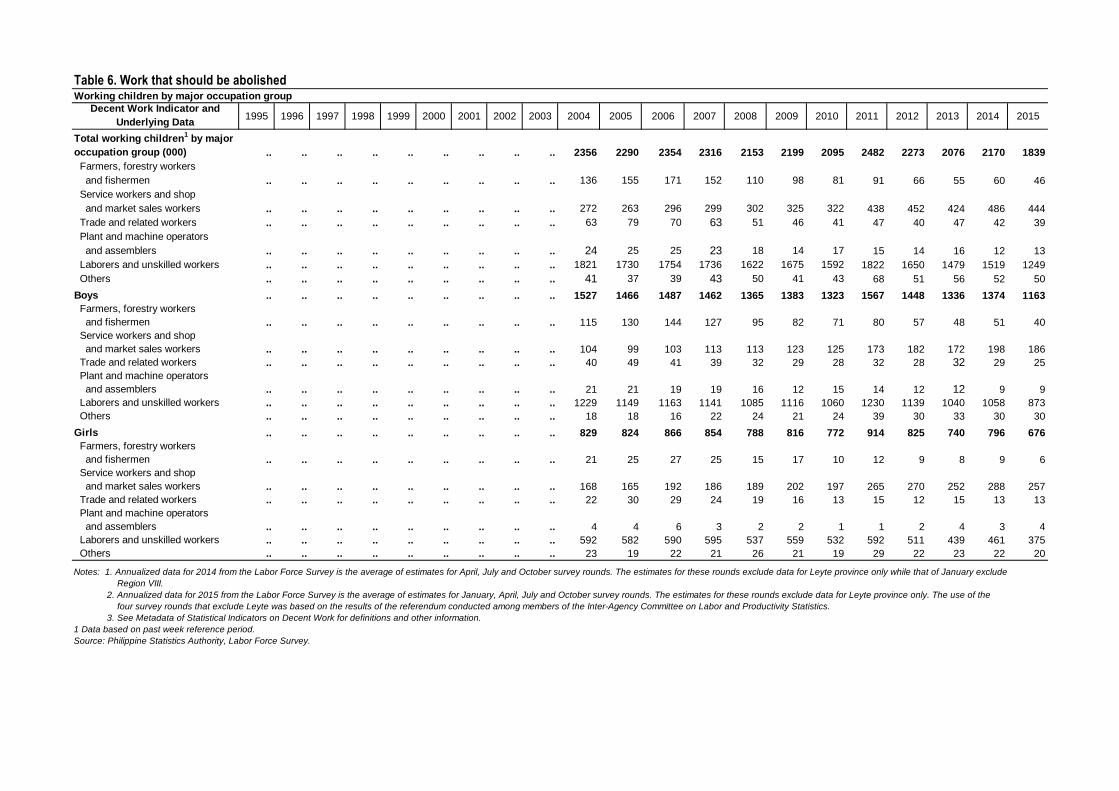
Table 6. Work that should be abolished
Decent Work Indicator and
Underlying Data1995 1996 1997 1998 1999 2000 2001 2002 2003 2004 2005 2006 2007 2008 2009 2010 2011 2012 2013 2014 2015
Total working children1 by major
occupation group (000) .. .. .. .. .. .. .. .. .. 2356 2290 2354 2316 2153 2199 2095 2482 2273 2076 2170 1839
Farmers, forestry workers
and fishermen .. .. .. .. .. .. .. .. .. 136 155 171 152 110 98 81 91 66 55 60 46
Service workers and shop
and market sales workers .. .. .. .. .. .. .. .. .. 272 263 296 299 302 325 322 438 452 424 486 444
Trade and related workers .. .. .. .. .. .. .. .. .. 63 79 70 63 51 46 41 47 40 47 42 39
Plant and machine operators
and assemblers .. .. .. .. .. .. .. .. .. 24 25 25 23 18 14 17 15 14 16 12 13
Laborers and unskilled workers .. .. .. .. .. .. .. .. .. 1821 1730 1754 1736 1622 1675 1592 1822 1650 1479 1519 1249
Others .. .. .. .. .. .. .. .. .. 41 37 39 43 50 41 43 68 51 56 52 50
Boys .. .. .. .. .. .. .. .. .. 1527 1466 1487 1462 1365 1383 1323 1567 1448 1336 1374 1163
Farmers, forestry workers
and fishermen .. .. .. .. .. .. .. .. .. 115 130 144 127 95 82 71 80 57 48 51 40
Service workers and shop
and market sales workers .. .. .. .. .. .. .. .. .. 104 99 103 113 113 123 125 173 182 172 198 186
Trade and related workers .. .. .. .. .. .. .. .. .. 40 49 41 39 32 29 28 32 28 32 29 25
Plant and machine operators
and assemblers .. .. .. .. .. .. .. .. .. 21 21 19 19 16 12 15 14 12 12 9 9
Laborers and unskilled workers .. .. .. .. .. .. .. .. .. 1229 1149 1163 1141 1085 1116 1060 1230 1139 1040 1058 873
Others .. .. .. .. .. .. .. .. .. 18 18 16 22 24 21 24 39 30 33 30 30
Girls .. .. .. .. .. .. .. .. .. 829 824 866 854 788 816 772 914 825 740 796 676
Farmers, forestry workers
and fishermen .. .. .. .. .. .. .. .. .. 21 25 27 25 15 17 10 12 9 8 9 6
Service workers and shop
and market sales workers .. .. .. .. .. .. .. .. .. 168 165 192 186 189 202 197 265 270 252 288 257
Trade and related workers .. .. .. .. .. .. .. .. .. 22 30 29 24 19 16 13 15 12 15 13 13
Plant and machine operators
and assemblers .. .. .. .. .. .. .. .. .. 4 4 6 3 2 2 1 1 2 4 3 4
Laborers and unskilled workers .. .. .. .. .. .. .. .. .. 592 582 590 595 537 559 532 592 511 439 461 375
Others .. .. .. .. .. .. .. .. .. 23 19 22 21 26 21 19 29 22 23 22 20
Notes: 1. Annualized data for 2014 from the Labor Force Survey is the average of estimates for April, July and October survey rounds. The estimates for these rounds exclude data for Leyte province only while that of January exclude
Region VIII.
2. Annualized data for 2015 from the Labor Force Survey is the average of estimates for January, April, July and October survey rounds. The estimates for these rounds exclude data for Leyte province only. The use of the
four survey rounds that exclude Leyte was based on the results of the referendum conducted among members of the Inter-Agency Committee on Labor and Productivity Statistics.
3. See Metadata of Statistical Indicators on Decent Work for definitions and other information.
1 Data based on past week reference period.
Source: Philippine Statistics Authority, Labor Force Survey.
Working children by major occupation group

Table 6. Work that should be abolishedWorking children by major occupation group
Decent Work Indicator and
Underlying Data2016 2017
Working children1 by major
occupation group, % distribution 100.0 100.0
Skilled Agricultural, Forestry
and Fishery Workers 2.8 5.2
Service and Sales Workers 19.7 22.5
Craft and Related Trades
Workers 2.3 2.6
Plant and Machine Operators
and Assemblers 1.1 1.3
Elementary Occupations 71.2 65.8
Others 2.9 2.6
Boys 100.0 100.0
Skilled Agricultural, Forestry
and Fishery Workers 3.7 6.9
Service and Sales Workers 13.6 15.0
Craft and Related Trades
Workers 2.7 2.8
Plant and Machine Operators
and Assemblers 1.4 1.7
Elementary Occupations 76.0 71.4
Others 2.7 2.2
Girls 100.0 100.0
Skilled Agricultural, Forestry
and Fishery Workers 1.3 1.6
Service and Sales Workers 30.9 38.1
Craft and Related Trades
Workers 1.9 2.3
Plant and Machine Operators
and Assemblers 0.4 0.5
Elementary Occupations 62.1 54.1
Others 3.2 3.2
Notes: See Metadata of Statistical Indicators on Decent Work for definitions and other information.
1 Data based on past week reference period.
Source: Philippine Statistics Authority, Labor Force Survey.

Table 6. Work that should be abolishedWorking children by major occupation group
Decent Work Indicator and
Underlying Data2016 2017
Total working children1 by major
occupation group (000) 1509 1344
Skilled Agricultural, Forestry
and Fishery Workers 43 70
Service and Sales Workers 297 302
Craft and Related Trades
Workers 35 35
Plant and Machine Operators
and Assemblers 16 18
Elementary Occupations 1074 884
Others 44 35
Boys 978 907
Skilled Agricultural, Forestry
and Fishery Workers 36 63
Service and Sales Workers 133 136
Craft and Related Trades
Workers 26 25
Plant and Machine Operators
and Assemblers 14 15
Elementary Occupations 743 648
Others 26 20
Girls 531 436
Skilled Agricultural, Forestry
and Fishery Workers 7 7
Service and Sales Workers 164 166
Craft and Related Trades
Workers 10 10
Plant and Machine Operators
and Assemblers 2 2
Elementary Occupations 330 236
Others 17 14
Notes: See Metadata of Statistical Indicators on Decent Work for definitions and other information.
1 Data based on past week reference period.
Source: Philippine Statistics Authority, Labor Force Survey.

Element 7
Stability and Security of Work

Table 7. Stability and security of work
Decent Work Indicator 1995 1996 1997 1998 1999 2000 2001 2002 2003 2004 2005 2006 2007 2008 2009 2010 2011 2012 2013 2014 2015 2016 2017
HOUSEHOLD SURVEY DATA
Employees in precarious work1,
% of employed 13.9 13.1 14.0 13.7 13.3 14.4 14.1 13.6 14.5 14.6 13.2 14.1 14.7 13.7 13.4 14.6 15.0 17.4 18.8 17.4 18.2 18.9 17.8
Men 15.0 14.2 15.1 15.0 14.4 15.7 15.4 14.9 15.8 15.8 14.1 15.1 15.7 14.6 14.4 15.8 16.1 19.1 20.7 19.2 20.2 21.0 19.5
Women 12.0 11.4 12.1 11.6 11.4 12.2 12.1 11.6 12.4 12.8 11.7 12.6 13.2 12.2 11.7 12.8 13.2 14.7 15.8 14.7 15.1 15.6 15.1
Agriculture 12.0 11.5 11.8 12.0 12.9 13.2 13.1 12.5 13.4 13.1 10.6 11.5 12.0 11.5 11.3 12.7 13.8 16.5 18.0 16.7 17.6 17.6 13.4
Industry 24.0 23.0 24.2 23.6 22.1 25.2 24.6 24.3 25.4 25.8 25.2 26.7 26.9 24.9 24.4 26.5 25.6 30.0 32.6 30.4 32.3 33.1 35.4
Services 12.0 10.9 11.8 11.4 10.5 11.5 11.3 10.9 11.7 12.2 11.3 12.1 12.8 11.9 11.6 12.4 12.7 14.2 15.2 13.9 14.3 15.1 14.1
Employees in precarious work1,
% of employees 30.1 28.2 28.2 27.5 26.8 28.3 28.5 27.9 28.9 28.1 26.2 27.6 28.2 26.1 25.1 26.9 27.1 30.4 32.2 30.0 30.7 30.7 28.5
Men 32.1 30.0 30.1 29.6 28.8 30.9 30.7 30.2 31.2 29.9 27.7 29.3 29.7 27.6 26.7 28.6 28.5 32.5 34.5 32.1 33.2 32.9 30.3
Women 26.5 25.0 24.9 23.7 23.4 23.9 24.8 24.2 25.1 25.0 23.5 25.0 25.6 23.6 22.5 24.1 24.7 27.0 28.3 26.5 26.5 27.0 25.4
Agriculture 56.6 56.5 55.2 54.5 55.7 54.0 56.0 55.1 56.3 50.7 45.4 47.3 47.4 44.6 42.4 46.3 46.8 52.7 55.9 55.8 57.7 54.5 43.7
Industry 31.1 29.1 29.9 29.5 27.7 31.9 31.2 30.8 32.0 32.0 31.4 33.2 33.1 30.6 30.1 32.3 31.2 35.8 38.2 35.3 37.1 37.3 39.0
Services 19.7 17.9 18.8 18.4 17.0 18.6 18.7 18.4 19.3 19.5 18.5 19.6 20.6 19.0 18.3 19.5 19.8 21.8 23.1 21.2 21.5 22.5 20.9
Private household 39.3 34.6 34.8 36.5 29.7 31.4 29.9 28.0 29.1 24.0 23.7 25.8 27.3 24.8 23.7 25.6 25.5 28.0 30.4 28.2 27.9 29.4 30.2
Private establishment 33.5 31.4 31.1 30.0 30.4 32.0 32.5 31.8 32.5 31.6 29.4 31.0 31.4 29.0 28.0 30.0 30.0 33.8 35.5 33.2 34.0 33.8 31.0
Worked for government/
government corporation 11.0 10.3 10.3 9.8 9.0 10.3 10.1 10.7 12.0 12.7 11.7 12.0 12.8 12.9 12.0 12.8 13.4 13.9 14.8 13.2 14.2 13.8 13.5
With pay in own family-
operated farm or business 23.4 26.1 27.9 21.0 19.0 26.0 24.6 21.7 25.9 24.0 21.9 27.2 25.5 18.9 14.5 20.7 21.4 24.8 25.2 21.7 25.9 16.7 23.5
Short-term, seasonal or casual
workers
Number, in 000 2629 2566 2774 2730 2676 2937 3106 3198 3525 3797 3519 3852 4112 3832 3964 4513 4675 5300 5726 5399 5586 6208 5928
Men 1789 1745 1881 1857 1788 1980 2045 2093 2329 2495 2277 2476 2634 2465 2556 2922 2999 3451 3744 3488 3626 4085 3912
Women 839 821 893 873 888 957 1061 1106 1196 1302 1242 1376 1478 1367 1408 1591 1676 1850 1983 1912 1959 2123 20163006
Agriculture 685 653 646 614 675 718 762 817 919 966 777 905 957 875 962 1101 1142 1220 1264 1155 1154 1154 825
Industry 844 852 944 905 840 934 963 957 1046 1113 1101 1167 1187 1068 1058 1246 1229 1458 1605 1534 1622 1880 2098
Services 1100 1061 1183 1211 1162 1284 1381 1425 1559 1717 1641 1780 1968 1889 1945 2166 2304 2623 2857 2711 2810 3174 3006
Private household 324 290 332 397 299 336 335 335 347 280 290 352 401 354 368 402 407 449 478 453 439 478 471
Private establishment 2056 2028 2194 2102 2155 2329 2506 2588 2866 3183 2921 3177 3349 3113 3242 3707 3839 4409 4774 4522 4670 5255 4985
Worked for government/
government corporation 215 210 203 199 189 226 232 252 280 305 285 293 330 349 340 384 405 415 447 400 451 455 449
With pay in own family-
operated farm or business 34 36 45 32 33 46 32 24 31 28 24 29 32 17 14 20 23 28 27 24 25 20 23100
% distribution 100.0 100.0 100.0 100.0 100.0 100.0 100.0 100.0 100.0 100.0 100.0 100.0 100.0 100.0 100.0 100.0 100.0 100.0 100.0 100.0 100.0 100.0 100.0
Men 68.0 68.0 67.8 68.0 66.8 67.4 65.8 65.4 66.1 65.7 64.7 64.3 64.1 64.3 64.5 64.7 64.1 65.1 65.4 64.6 64.9 67.8 66.0
Women 31.9 32.0 32.2 32.0 33.2 32.6 34.2 34.6 33.9 34.3 35.3 35.7 35.9 35.7 35.5 35.3 35.9 34.9 34.6 35.4 35.1 35.2 34.0
Agriculture 26.1 25.4 23.3 22.5 25.2 24.4 24.5 25.5 26.1 25.4 22.1 23.5 23.3 22.8 24.3 24.4 24.4 23.0 22.1 21.4 20.7 19.1 13.9
Industry 32.1 33.2 34.0 33.2 31.4 31.8 31.0 29.9 29.7 29.3 31.3 30.3 28.9 27.9 26.7 27.6 26.3 27.5 28.0 28.4 29.0 31.2 35.4
Services 41.8 41.3 42.6 44.4 43.4 43.7 44.5 44.6 44.2 45.2 46.6 46.2 47.9 49.3 49.1 48.0 49.3 49.5 49.9 50.2 50.3 52.7 50.7
Private household 12.3 11.3 12.0 14.5 11.2 11.4 10.8 10.5 9.8 7.4 8.2 9.1 9.8 9.2 9.3 8.9 8.7 8.5 8.3 8.4 7.9 7.9 7.9
Private establishment 78.2 79.0 79.1 77.0 80.5 79.3 80.7 80.9 81.3 83.8 83.0 82.5 81.4 81.2 81.8 82.1 82.1 83.2 83.4 83.8 83.6 87.2 84.1
Worked for government/
government corporation 8.2 8.2 7.3 7.3 7.1 7.7 7.5 7.9 7.9 8.0 8.1 7.6 8.0 9.1 8.6 8.5 8.7 7.8 7.8 7.4 8.1 7.5 7.6
With pay in own family-
operated farm or business 1.3 1.4 1.6 1.2 1.2 1.6 1.0 0.8 0.9 0.7 0.7 0.8 0.8 0.4 0.4 0.4 0.5 0.5 0.5 0.4 0.4 0.3 0.4

Table 7. Stability and security of work
Decent Work Indicator 1995 1996 1997 1998 1999 2000 2001 2002 2003 2004 2005 2006 2007 2008 2009 2010 2011 2012 2013 2014 2015 2016 2017
Average real daily basic pay of
short term, seasonal and casual
workers2, in 2006 PhP .. .. .. .. .. .. 193.91 191.16 191.24 187.96 187.01 191.00 186.72 178.90 176.55 178.25 179.02 182.94 184.64 187.11 193.25 196.12 211.09
Men .. .. .. .. .. .. 199.20 195.80 197.60 194.12 195.80 199.40 195.62 187.15 184.41 186.27 185.51 190.89 192.13 194.92 199.92 203.72 217.66
Women .. .. .. .. .. .. 183.87 182.40 179.02 176.25 171.40 176.42 171.37 164.59 162.76 164.07 167.79 168.70 171.01 173.40 181.29 181.92 198.470.00 0.00
Agriculture .. .. .. .. .. .. 127.74 126.28 121.65 120.43 119.27 122.89 119.95 115.29 116.34 117.84 117.51 124.91 124.01 125.30 132.66 124.97 135.94
Industry .. .. .. .. .. .. 219.58 219.30 223.23 219.27 217.32 232.38 214.66 208.91 207.53 208.45 208.92 211.87 210.17 209.05 213.84 219.39 239.70
Services .. .. .. .. .. .. 211.72 208.93 209.73 204.16 196.00 194.49 199.70 189.00 186.75 188.41 191.09 190.78 194.48 196.97 203.68 208.72 209.25
Private household .. .. .. .. .. .. 142.52 136.45 135.05 120.74 105.78 100.10 119.46 98.34 98.91 98.87 100.29 104.22 106.78 104.82 108.90 111.85 123.72
Private establishment .. .. .. .. .. .. 194.08 191.83 192.14 188.70 190.23 197.57 191.32 185.87 182.14 184.40 184.60 188.30 189.62 192.59 198.11 201.81 218.47
Worked for government/
government corporation .. .. .. .. .. .. 271.16 269.14 268.30 253.55 254.54 249.20 239.64 212.28 221.47 216.77 220.62 229.36 232.01 240.61 242.98 239.22 231.35
With pay in own family-
operated farm or business .. .. .. .. .. .. 167.83 166.45 145.49 150.12 146.97 139.07 123.63 142.50 150.94 134.15 141.90 124.42 124.03 126.37 132.05 118.03 153.42
ESTABLISHMENT SURVEY
DATA3
Employees in precarious work4,
% of employed .. .. .. .. .. .. .. .. 19.2 19.6 .. .. .. 18.0 .. 21.2 .. 22.8 .. 22.0 .. 18.5 ..
Agriculture .. .. .. .. .. .. .. .. .. .. .. .. .. .. .. .. .. 26.5 .. 40.6 .. 32.9 ..
Industry .. .. .. .. .. .. .. .. 19.6 20.6 .. .. .. 19.6 .. 23.2 .. 28.1 .. 26.0 .. 27.2 ..
Services .. .. .. .. .. .. .. .. 18.9 18.9 .. .. .. 17.0 .. 20.1 .. 19.8 .. 18.6 .. 13.7 ..
Casual employees
Number, in 000 .. .. .. .. .. .. .. .. 158 141 .. .. .. 147 .. 171 .. 202 .. 208 .. 159 ..
Agriculture .. .. .. .. .. .. .. .. .. .. .. .. .. .. .. .. .. 7 .. 10 .. 12 ..
Industry .. .. .. .. .. .. .. .. 75 66 .. .. .. 60 .. 60 .. 95 .. 87 .. 70 ..
Services .. .. .. .. .. .. .. .. 83 75 .. .. .. 87 .. 110 .. 100 .. 111 .. 77 ..100 ..
% distribution .. .. .. .. .. .. .. .. 100.0 100.0 .. .. .. 100.0 .. 100.0 .. 100.0 .. 100.0 .. 100.0 ..
Agriculture .. .. .. .. .. .. .. .. .. .. .. .. .. .. .. .. .. 3.5 .. 4.8 .. 7.5 ..
Industry .. .. .. .. .. .. .. .. 47.5 46.8 .. .. .. 40.8 .. 35.4 .. 47.0 .. 41.8 .. 44.0 ..
Services .. .. .. .. .. .. .. .. 52.5 53.2 .. .. .. 59.2 .. 64.6 .. 49.5 .. 53.4 .. 48.4 ..
Notes: 1. Annualized data for 2014 from the Labor Force Survey is the average of estimates for April, July and October survey rounds. The estimates for these rounds exclude data
for Leyte province only while that of January exclude Region VIII.
2. Annualized data for 2015 from the Labor Force Survey is the average of estimates for January, April, July and October survey rounds. The estimates for these rounds exclude data for Leyte province only.
The use of the four survey rounds that exclude Leyte was based on the results of the referendum conducted among members of Inter-Agency Committee on Labor and Productivity Statistics.1
Workers whose nature of employment is short-term or seasonal or casual or those who worked for different employers on day-to-day or week-to-week basis.2
LFS began collecting data on basic pay in January 2001 survey round. The inquiry is on basic pay per day in cash or in kind (imputed value) of employees
from their primary jobs and not their total earnings. Not all employees, e.g., commission basis, were able to report their basic pay and as such posed difficulty
in determining their pay on a per day basis. 3
Data collected through a survey of establishments employing 20 or more workers (before 2012, non-agricultural establishments only). The survey coverage
excludes public administration and defense, compulsory social security; public education and health; and extra-territorial organizations and bodies.4
Workers whose nature of employment is casual, seasonal, contractual or project-based.
Sources: Philippine Statistics Authority, Labor Force Survey/Consumer Price Index/BLES Integrated Survey/Integrated Survey on Labor and Employment.
Date updated: 09/23/2016

Table 7. Stability and security of workEmployees in precarious work, % of employed (Household survey data)
Decent Work Indicator and
Underlying Data1995 1996 1997 1998 1999 2000 2001 2002 2003 2004 2005 2006 2007 2008 2009 2010 2011 2012 2013 2014 2015 2016 2017
Household survey data
Employees in precarious work,
% of employed 13.9 13.1 14.0 13.7 13.3 14.4 14.1 13.6 14.5 14.6 13.2 14.1 14.7 13.7 13.4 14.6 15.0 17.4 18.8 17.4 18.2 18.9 17.8
Men 15.0 14.2 15.1 15.0 14.4 15.7 15.4 14.9 15.8 15.8 14.1 15.1 15.7 14.6 14.4 15.8 16.1 19.1 20.7 19.2 20.2 21.0 19.5
Women 12.0 11.4 12.1 11.6 11.4 12.2 12.1 11.6 12.4 12.8 11.7 12.6 13.2 12.2 11.7 12.8 13.2 14.7 15.8 14.7 15.1 15.6 15.1
Agriculture 12.0 11.5 11.8 12.0 12.9 13.2 13.1 12.5 13.4 13.1 10.6 11.5 12.0 11.5 11.3 12.7 13.8 16.5 18.0 16.7 17.6 17.6 13.4
Industry 24.0 23.0 24.2 23.6 22.1 25.2 24.6 24.3 25.4 25.8 25.2 26.7 26.9 24.9 24.4 26.5 25.6 30.0 32.6 30.4 32.3 33.1 35.4
Services 12.0 10.9 11.8 11.4 10.5 11.5 11.3 10.9 11.7 12.2 11.3 12.1 12.8 11.9 11.6 12.4 12.7 14.2 15.2 13.9 14.3 15.1 14.1
Total employees in precarious
work (000) 3574 3569 3678 3650 3689 3940 4114 4085 4440 4631 4267 4606 4931 4660 4682 5276 5564 6538 7154 6718 7040 7757 7194
Men 2450 2431 2502 2502 2492 2693 2759 2726 2983 3102 2811 3019 3219 3062 3088 3474 3640 4366 4793 4479 4726 5262 4884
Women 1124 1138 1176 1148 1198 1247 1355 1360 1457 1529 1455 1587 1712 1597 1594 1802 1925 2173 2361 2240 2314 2495 2310
Agriculture 1333 1340 1231 1211 1388 1341 1423 1392 1499 1486 1233 1348 1418 1385 1358 1522 1693 2001 2131 1973 1990 1946 1379
Industry 993 1018 1107 1071 996 1124 1158 1139 1231 1290 1265 1335 1379 1257 1242 1432 1417 1723 1935 1872 2025 2371 2609
Services 1248 1212 1338 1369 1306 1474 1532 1555 1709 1855 1769 1923 2134 2018 2083 2322 2454 2815 3088 2873 3025 3440 3206
Total employed (000) 25677 27186 26365 26631 27742 27452 29156 30062 30635 31613 32313 32636 33560 34089 35061 36035 37192 37600 38118 38651 38741 40998 40334
Men 16322 17170 16610 16714 17253 17193 17923 18306 18873 19646 19910 20013 20542 20959 21404 21921 22573 22849 23150 23365 23406 25035 25067
Women 9354 10016 9754 9917 10489 10259 11232 11756 11762 11968 12403 12622 13018 13129 13657 14114 14619 14751 14968 15286 15335 15963 1526719764
Agriculture 11147 11645 10416 10091 10774 10181 10850 11122 11220 11381 11628 11682 11786 12030 12044 11956 12267 12093 11835 11801 11294 11064 10261
Industry 4140 4431 4582 4542 4515 4454 4713 4695 4840 4999 5025 4997 5121 5048 5092 5399 5530 5743 5937 6167 6275 7159 7370
Services 10391 11112 11367 11998 12452 12817 13593 14246 14577 15237 15661 15957 16654 17012 17924 18682 19394 19764 20345 20683 21172 22775 22703
Notes: 1. Annualized data for 2014 from the Labor Force Survey is the average of estimates for April, July and October survey rounds. The estimates for these rounds exclude data
for Leyte province only while that of January exclude Region VIII.
2. Annualized data for 2015 from the Labor Force Survey is the average of estimates for January, April, July and October survey rounds. The estimates for these rounds exclude data for Leyte province only.
The use of the four survey rounds that exclude Leyte was based on the results of the referendum conducted among members of Inter-Agency Committee on Labor and Productivity Statistics.
3. See Metadata of Statistical Indicators on Decent Work for definitions and other information.
Sources: Philippine Statistics Authority, Labor Force Survey.

Table 7. Stability and security of workEmployees in precarious work, % of employees (Household survey data)
Decent Work Indicator and
Underlying Data1995 1996 1997 1998 1999 2000 2001 2002 2003 2004 2005 2006 2007 2008 2009 2010 2011 2012 2013 2014 2015 2016 2017
Household survey data
Employees in precarious work, %
of employees 30.1 28.2 28.2 27.5 26.8 28.3 28.5 27.9 28.9 28.1 26.2 27.6 28.2 26.1 25.1 26.9 27.1 30.4 32.2 30.0 30.7 30.7 28.5
Men 32.1 30.0 30.1 29.6 28.8 30.9 30.7 30.2 31.2 29.9 27.7 29.3 29.7 27.6 26.7 28.6 28.5 32.5 34.5 32.1 33.2 32.9 30.3
Women 26.5 25.0 24.9 23.7 23.4 23.9 24.8 24.2 25.1 25.0 23.5 25.0 25.6 23.6 22.5 24.1 24.7 27.0 28.3 26.5 26.5 27.0 25.4
Agriculture 56.6 56.5 55.2 54.5 55.7 54.0 56.0 55.1 56.3 50.7 45.4 47.3 47.4 44.6 42.4 46.3 46.8 52.7 55.9 55.8 57.7 54.5 43.7
Industry 31.1 29.1 29.9 29.5 27.7 31.9 31.2 30.8 32.0 32.0 31.4 33.2 33.1 30.6 30.1 32.3 31.2 35.8 38.2 35.3 37.1 37.3 39
Services 19.7 17.9 18.8 18.4 17.0 18.6 18.7 18.4 19.3 19.5 18.5 19.6 20.6 19.0 18.3 19.5 19.8 21.8 23.1 21.2 21.5 22.5 20.9
Private household 39.3 34.6 34.8 36.5 29.7 31.4 29.9 28.0 29.1 24.0 23.7 25.8 27.3 24.8 23.7 25.6 25.5 28.0 30.4 28.2 27.9 29.4 30.2
Private establishment 33.5 31.4 31.1 30.0 30.4 32.0 32.5 31.8 32.5 31.6 29.4 31.0 31.4 29.0 28.0 30.0 30.0 33.8 35.5 33.2 34.0 33.8 31
Worked for government/
government corporation 11.0 10.3 10.3 9.8 9.0 10.3 10.1 10.7 12.0 12.7 11.7 12.0 12.8 12.9 12.0 12.8 13.4 13.9 14.8 13.2 14.2 13.8 13.5
With pay in own family-operated
farm or business 23.4 26.1 27.9 21.0 19.0 26.0 24.6 21.7 25.9 24.0 21.9 27.2 25.5 18.9 14.5 20.7 21.4 24.8 25.2 21.7 25.9 16.7 23.5
Total employees in precarious
work (000) 3574 3569 3678 3650 3689 3940 4114 4085 4440 4631 4267 4606 4931 4660 4682 5276 5564 6538 7154 6718 7040 7757 7194
Men 2450 2431 2502 2502 2492 2693 2759 2726 2983 3102 2811 3019 3219 3062 3088 3474 3640 4366 4793 4479 4726 5262 4884
Women 1124 1138 1176 1148 1198 1247 1355 1360 1457 1529 1455 1587 1712 1597 1594 1802 1925 2173 2361 2240 2314 2495 2310
Agriculture 1333 1340 1231 1211 1388 1341 1423 1392 1499 1486 1233 1348 1418 1385 1358 1522 1693 2001 2131 1973 1990 1946 1379
Industry 993 1018 1107 1071 996 1124 1158 1139 1231 1290 1265 1335 1379 1257 1242 1432 1417 1723 1935 1872 2025 2371 2609
Services 1248 1212 1338 1369 1306 1474 1532 1555 1709 1855 1769 1923 2134 2018 2083 2322 2454 2815 3088 2873 3025 3440 3206
Private household 496 449 482 571 445 497 478 450 452 329 350 420 486 430 446 493 497 558 598 542 553 617 582
Private establishment 2815 2858 2936 2837 3019 3153 3365 3355 3668 3963 3601 3852 4070 3858 3876 4374 4634 5534 6074 5748 6003 6660 6125
Worked for government/
government corporation 224 215 209 205 192 233 236 255 283 307 288 299 337 352 344 386 409 417 450 401 455 458 459
With pay in own family-operated
farm or business 39 47 51 37 33 56 34 26 36 31 28 34 39 20 16 23 24 30 32 26 29 22 28
Total employees (000) 11870 12649 13043 13285 13761 13925 14438 14653 15354 16472 16316 16673 17508 17846 18681 19626 20538 21492 22247 22407 22960 25240 25209
Men 7625 8091 8319 8446 8645 8717 8978 9022 9554 10368 10130 10316 10827 11093 11581 12137 12750 13440 13892 13955 14238 15986 16117
Women 4246 4558 4723 4839 5116 5208 5459 5631 5800 6105 6187 6357 6682 6754 7099 7489 7787 8052 8355 8452 8722 9254 9092
Agriculture 2357 2372 2230 2222 2492 2482 2541 2526 2662 2933 2718 2848 2992 3107 3203 3288 3616 3798 3812 3538 3447 3570 3153
Industry 3195 3502 3702 3635 3600 3521 3713 3693 3845 4034 4025 4016 4171 4103 4123 4437 4545 4807 5070 5308 5451 6363 6689
Services 6319 6776 7110 7426 7672 7923 8187 8438 8850 9506 9573 9811 10347 10638 11356 11901 12378 12887 13366 13561 14062 15307 15368
Private household 1263 1298 1387 1566 1498 1583 1597 1610 1553 1371 1474 1626 1783 1736 1880 1926 1950 1993 1969 1925 1981 2096 1925
Private establishment 8398 9093 9442 9461 9946 9860 10366 10546 11294 12552 12261 12423 12950 13283 13824 14565 15431 16377 17114 17319 17669 19694 19776
Worked for government/
government corporation 2041 2079 2031 2082 2143 2268 2336 2378 2367 2420 2454 2500 2623 2723 2866 3025 3044 3000 3037 3043 3197 3317 3388
With pay in own family-operated
farm or business 167 180 183 176 174 215 138 120 139 129 128 125 153 106 110 111 112 121 127 120 112 132 119
Notes: 1. Annualized data for 2014 from the Labor Force Survey is the average of estimates for April, July and October survey rounds. The estimates for these rounds exclude data
for Leyte province only while that of January exclude Region VIII.
2. Annualized data for 2015 from the Labor Force Survey is the average of estimates for January, April, July and October survey rounds. The estimates for these rounds exclude data for Leyte province only.
The use of the four survey rounds that exclude Leyte was based on the results of the referendum conducted among members of Inter-Agency Committee on Labor and Productivity Statistics.
3. See Metadata of Statistical Indicators on Decent Work for definitions and other information.
Sources: Philippine Statistics Authority, Labor Force Survey.

Table 7. Stability and security of workNumber and average real daily basic pay of short-term, seasonal or casual workers (Household survey data)
Decent Work Indicator and
Underlying Data1995 1996 1997 1998 1999 2000 2001 2002 2003 2004 2005 2006 2007 2008 2009 2010 2011 2012 2013 2014 2015 2016 2017
Household survey data
Short-term, seasonal or casual
workers (000) 2629 2566 2774 2730 2676 2937 3106 3198 3525 3797 3519 3852 4112 3832 3964 4513 4675 5300 5726 5399 5586 6028 5928
Men 1789 1745 1881 1857 1788 1980 2045 2093 2329 2495 2277 2476 2634 2465 2556 2922 2999 3451 3744 3488 3626 4085 3912
Women 839 821 893 873 888 957 1061 1106 1196 1302 1242 1376 1478 1367 1408 1591 1676 1850 1983 1912 1959 2123 20163006
Agriculture 685 653 646 614 675 718 762 817 919 966 777 905 957 875 962 1101 1142 1220 1264 1155 1154 1154 825
Industry 844 852 944 905 840 934 963 957 1046 1113 1101 1167 1187 1068 1058 1246 1229 1458 1605 1534 1622 1880 2098
Services 1100 1061 1183 1211 1162 1284 1381 1425 1559 1717 1641 1780 1968 1889 1945 2166 2304 2623 2857 2711 2810 3174 3006
Private household 324 290 332 397 299 336 335 335 347 280 290 352 401 354 368 402 407 449 478 453 439 478 471
Private establishment 2056 2028 2194 2102 2155 2329 2506 2588 2866 3183 2921 3177 3349 3113 3242 3707 3839 4409 4774 4522 4670 5255 4985
Worked for government/
government corporation 215 210 203 199 189 226 232 252 280 305 285 293 330 349 340 384 405 415 447 400 451 455 449
With pay in own family-operated
farm or business 34 36 45 32 33 46 32 24 31 28 24 29 32 17 14 20 23 28 27 24 25 20 23
Short-term, seasonal or casual
workers, % distribution 100.0 100.0 100.0 100.0 100.0 100.0 100.0 100.0 100.0 100.0 100.0 100.0 100.0 100.0 100.0 100.0 100.0 100.0 100.0 100.0 100.0 100.0 100.0
Men 68.0 68.0 67.8 68.0 66.8 67.4 65.8 65.4 66.1 65.7 64.7 64.3 64.1 64.3 64.5 64.7 64.1 65.1 65.4 64.6 64.9 67.8 66.0
Women 31.9 32.0 32.2 32.0 33.2 32.6 34.2 34.6 33.9 34.3 35.3 35.7 35.9 35.7 35.5 35.3 35.9 34.9 34.6 35.4 35.1 35.2 34.0
Agriculture 26.1 25.4 23.3 22.5 25.2 24.4 24.5 25.5 26.1 25.4 22.1 23.5 23.3 22.8 24.3 24.4 24.4 23.0 22.1 21.4 20.7 19.1 13.9
Industry 32.1 33.2 34.0 33.2 31.4 31.8 31.0 29.9 29.7 29.3 31.3 30.3 28.9 27.9 26.7 27.6 26.3 27.5 28.0 28.4 29.0 31.2 35.4
Services 41.8 41.3 42.6 44.4 43.4 43.7 44.5 44.6 44.2 45.2 46.6 46.2 47.9 49.3 49.1 48.0 49.3 49.5 49.9 50.2 50.3 52.7 50.7
Private household 12.3 11.3 12.0 14.5 11.2 11.4 10.8 10.5 9.8 7.4 8.2 9.1 9.8 9.2 9.3 8.9 8.7 8.5 8.3 8.4 7.9 7.9 7.9
Private establishment 78.2 79.0 79.1 77.0 80.5 79.3 80.7 80.9 81.3 83.8 83.0 82.5 81.4 81.2 81.8 82.1 82.1 83.2 83.4 83.8 83.6 87.2 84.1
Worked for government/
government corporation 8.2 8.2 7.3 7.3 7.1 7.7 7.5 7.9 7.9 8.0 8.1 7.6 8.0 9.1 8.6 8.5 8.7 7.8 7.8 7.4 8.1 7.5 7.6
With pay in own family-operated
farm or business 1.3 1.4 1.6 1.2 1.2 1.6 1.0 0.8 0.9 0.7 0.7 0.8 0.8 0.4 0.4 0.4 0.5 0.5 0.5 0.4 0.4 0.3 0.4
Average real daily basic pay of
short-term, seasonal or casual
workers, in 2006 PhP .. .. .. .. .. .. 193.91 191.16 191.24 187.96 187.01 191.00 186.72 178.90 176.55 178.25 179.02 182.94 184.64 187.11 193.25 196.12 211.09
Men .. .. .. .. .. .. 199.20 195.80 197.60 194.12 195.80 199.40 195.62 187.15 184.41 186.27 185.51 190.89 192.13 194.92 199.92 203.72 217.66
Women .. .. .. .. .. .. 183.87 182.40 179.02 176.25 171.40 176.42 171.37 164.59 162.76 164.07 167.79 168.70 171.01 173.40 181.29 181.92 198.47
Agriculture .. .. .. .. .. .. 127.74 126.28 121.65 120.43 119.27 122.89 119.95 115.29 116.34 117.84 117.51 124.91 124.01 125.30 132.66 124.97 135.94
Industry .. .. .. .. .. .. 219.58 219.30 223.23 219.27 217.32 232.38 214.66 208.91 207.53 208.45 208.92 211.87 210.17 209.05 213.84 219.39 239.70
Services .. .. .. .. .. .. 211.72 208.93 209.73 204.16 196.00 194.49 199.70 189.00 186.75 188.41 191.09 190.78 194.48 196.97 203.68 208.72 209.25

Table 7. Stability and security of workNumber and average real daily basic pay of short-term, seasonal or casual workers (Household survey data)
Decent Work Indicator and
Underlying Data1995 1996 1997 1998 1999 2000 2001 2002 2003 2004 2005 2006 2007 2008 2009 2010 2011 2012 2013 2014 2015 2016 2017
Private household .. .. .. .. .. .. 142.52 136.45 135.05 120.74 105.78 100.10 119.46 98.34 98.91 98.87 100.29 104.22 106.78 104.82 108.90 111.85 123.72
Private establishment .. .. .. .. .. .. 194.08 191.83 192.14 188.70 190.23 197.57 191.32 185.87 182.14 184.40 184.60 188.30 189.62 192.59 198.11 201.81 218.47
Worked for government/
government corporation .. .. .. .. .. .. 271.16 269.14 268.30 253.55 254.54 249.20 239.64 212.28 221.47 216.77 220.62 229.36 232.01 240.61 242.98 239.22 231.35
With pay in own family-operated
farm or business .. .. .. .. .. .. 167.83 166.45 145.49 150.12 146.97 139.07 123.63 142.50 150.94 134.15 141.90 124.42 124.03 126.37 132.05 118.03 153.42
Average daily basic pay of short-
term, seasonal or casual workers
(PhP) .. .. .. .. .. .. 156.68 158.66 162.36 167.28 177.29 191.00 192.14 199.30 204.80 214.79 225.75 238.01 247.42 261.02 273.45 282.41 313.68
Men .. .. .. .. .. .. 160.95 162.51 167.76 172.77 185.62 199.40 201.29 208.49 213.92 224.46 233.93 248.35 257.46 271.91 282.89 293.36 323.44
Women .. .. .. .. .. .. 148.57 151.39 151.99 156.86 162.49 176.42 176.34 183.35 188.80 197.71 211.58 219.48 229.16 241.89 256.52 261.96 294.93
Agriculture .. .. .. .. .. .. 103.21 104.81 103.28 107.18 113.07 122.89 123.43 128.43 134.95 142.00 148.18 162.51 166.17 174.80 187.71 179.96 202.00
Industry .. .. .. .. .. .. 177.42 182.02 189.52 195.15 206.02 232.38 220.89 232.73 240.73 251.18 263.45 275.64 281.63 291.62 302.58 315.92 356.19
Services .. .. .. .. .. .. 171.07 173.41 178.06 181.70 185.81 194.49 205.49 210.55 216.63 227.03 240.96 248.21 260.60 274.77 288.21 300.55 310.95
Private household .. .. .. .. .. .. 115.16 113.25 114.66 107.46 100.28 100.10 122.92 109.55 114.74 119.14 126.47 135.59 143.08 146.22 154.09 161.06 183.85
Private establishment .. .. .. .. .. .. 156.82 159.22 163.13 167.94 180.34 197.57 196.87 207.06 211.28 222.20 232.78 244.98 254.09 268.66 280.33 290.61 324.64
Worked for government/
government corporation .. .. .. .. .. .. 219.10 223.39 227.79 225.66 241.30 249.20 246.59 236.48 256.91 261.21 278.20 298.40 310.89 335.65 343.82 344.47 343.78
With pay in own family-operated
farm or business .. .. .. .. .. .. 135.61 138.15 123.52 133.61 139.33 139.07 127.22 158.75 175.09 161.65 178.93 161.87 166.20 176.28 186.85 169.96 227.98
Consumer price index
(2006=100) 54.1 58.6 62.0 67.8 71.9 76.7 80.8 83.0 84.9 89.0 94.8 100.0 102.9 111.4 116.0 120.5 126.1 130.1 134.0 139.5 141.5 144.0 148.6
Notes: 1. Annualized data for 2014 from the Labor Force Survey is the average of estimates for April, July and October survey rounds. The estimates for these rounds exclude data
for Leyte province only while that of January exclude Region VIII. 2. Annualized data for 2015 from the Labor Force Survey is the average of estimates for January, April, July and October survey rounds. The estimates for these rounds exclude data for Leyte province only.
The use of the four survey rounds that exclude Leyte was based on the results of the referendum conducted among members of Inter-Agency Committee on Labor and Productivity Statistics.
3. See Metadata of Statistical Indicators on Decent Work for definitions and other information.
Sources: Philippine Statistics Authority, Labor Force Survey.
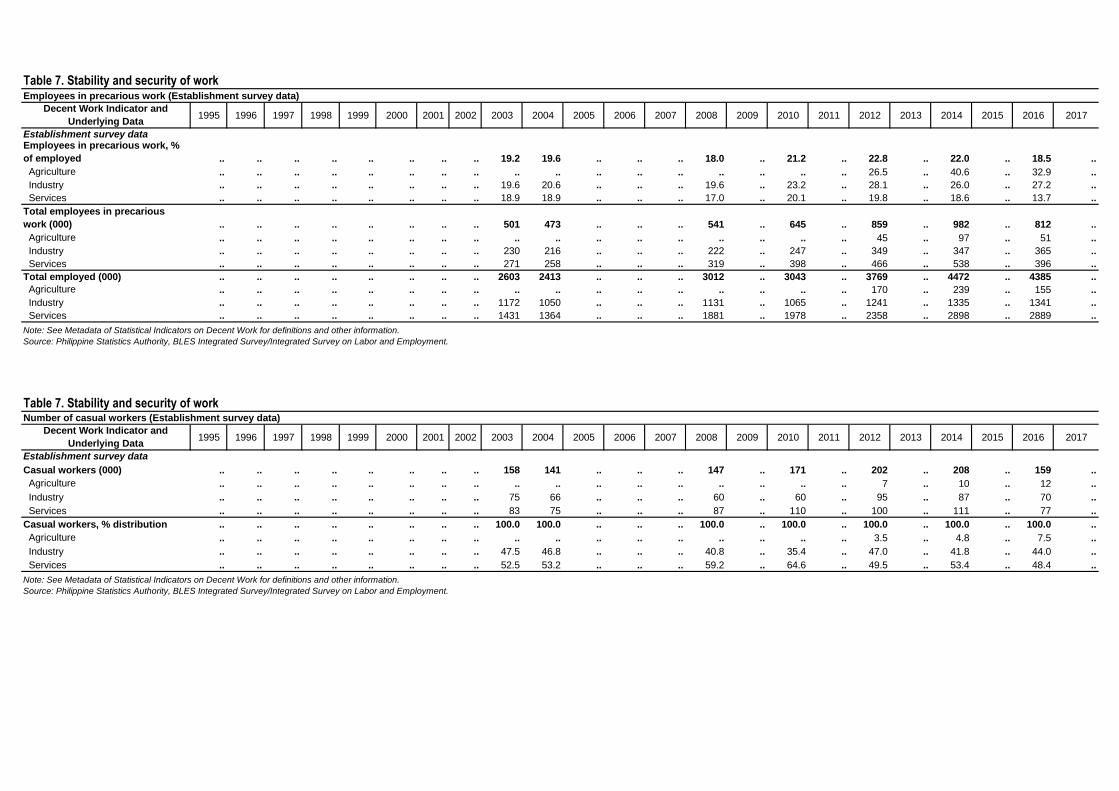
Table 7. Stability and security of workEmployees in precarious work (Establishment survey data)
Decent Work Indicator and
Underlying Data1995 1996 1997 1998 1999 2000 2001 2002 2003 2004 2005 2006 2007 2008 2009 2010 2011 2012 2013 2014 2015 2016 2017
Establishment survey dataEmployees in precarious work, %
of employed .. .. .. .. .. .. .. .. 19.2 19.6 .. .. .. 18.0 .. 21.2 .. 22.8 .. 22.0 .. 18.5 ..
Agriculture .. .. .. .. .. .. .. .. .. .. .. .. .. .. .. .. .. 26.5 .. 40.6 .. 32.9 ..
Industry .. .. .. .. .. .. .. .. 19.6 20.6 .. .. .. 19.6 .. 23.2 .. 28.1 .. 26.0 .. 27.2 ..
Services .. .. .. .. .. .. .. .. 18.9 18.9 .. .. .. 17.0 .. 20.1 .. 19.8 .. 18.6 .. 13.7 ..
Total employees in precarious
work (000) .. .. .. .. .. .. .. .. 501 473 .. .. .. 541 .. 645 .. 859 .. 982 .. 812 ..
Agriculture .. .. .. .. .. .. .. .. .. .. .. .. .. .. .. .. .. 45 .. 97 .. 51 ..
Industry .. .. .. .. .. .. .. .. 230 216 .. .. .. 222 .. 247 .. 349 .. 347 .. 365 ..
Services .. .. .. .. .. .. .. .. 271 258 .. .. .. 319 .. 398 .. 466 .. 538 .. 396 ..
Total employed (000) .. .. .. .. .. .. .. .. 2603 2413 .. .. .. 3012 .. 3043 .. 3769 .. 4472 .. 4385 ..
Agriculture .. .. .. .. .. .. .. .. .. .. .. .. .. .. .. .. .. 170 .. 239 .. 155 ..
Industry .. .. .. .. .. .. .. .. 1172 1050 .. .. .. 1131 .. 1065 .. 1241 .. 1335 .. 1341 ..
Services .. .. .. .. .. .. .. .. 1431 1364 .. .. .. 1881 .. 1978 .. 2358 .. 2898 .. 2889 ..
Note: See Metadata of Statistical Indicators on Decent Work for definitions and other information.
Source: Philippine Statistics Authority, BLES Integrated Survey/Integrated Survey on Labor and Employment.
Table 7. Stability and security of workNumber of casual workers (Establishment survey data)
Decent Work Indicator and
Underlying Data1995 1996 1997 1998 1999 2000 2001 2002 2003 2004 2005 2006 2007 2008 2009 2010 2011 2012 2013 2014 2015 2016 2017
Establishment survey data
Casual workers (000) .. .. .. .. .. .. .. .. 158 141 .. .. .. 147 .. 171 .. 202 .. 208 .. 159 ..
Agriculture .. .. .. .. .. .. .. .. .. .. .. .. .. .. .. .. .. 7 .. 10 .. 12 ..
Industry .. .. .. .. .. .. .. .. 75 66 .. .. .. 60 .. 60 .. 95 .. 87 .. 70 ..
Services .. .. .. .. .. .. .. .. 83 75 .. .. .. 87 .. 110 .. 100 .. 111 .. 77 ..
Casual workers, % distribution .. .. .. .. .. .. .. .. 100.0 100.0 .. .. .. 100.0 .. 100.0 .. 100.0 .. 100.0 .. 100.0 ..
Agriculture .. .. .. .. .. .. .. .. .. .. .. .. .. .. .. .. .. 3.5 .. 4.8 .. 7.5 ..
Industry .. .. .. .. .. .. .. .. 47.5 46.8 .. .. .. 40.8 .. 35.4 .. 47.0 .. 41.8 .. 44.0 ..
Services .. .. .. .. .. .. .. .. 52.5 53.2 .. .. .. 59.2 .. 64.6 .. 49.5 .. 53.4 .. 48.4 ..
Note: See Metadata of Statistical Indicators on Decent Work for definitions and other information.
Source: Philippine Statistics Authority, BLES Integrated Survey/Integrated Survey on Labor and Employment.

Element 8
Equal Opportunity and
Treatment in Employment

Table 8. Equal opportunity and treatment in employment
Decent Work Indicator 1995 1996 1997 1998 1999 2000 2001 2002 2003 2004 2005 2006 2007 2008 2009 2010 2011 2012 2013 2014 2015 2016 2017
OCCUPATIONAL SEGREGATION
BY SEX
Female share in occupational
employment, in %
Based on 1977 PSOC1
36.4 36.8 37.0 37.2 37.8 37.4 .. .. .. .. .. .. .. .. .. .. .. .. .. .. .. .. ..
Professional, technical
and related workers 64.0 63.2 63.7 63.6 63.3 63.8 .. .. .. .. .. .. .. .. .. .. .. .. .. .. .. .. ..
Administrative, executive
and managerial workers 31.9 33.6 33.2 32.8 33.7 35.2 .. .. .. .. .. .. .. .. .. .. .. .. .. .. .. .. ..
Clerical and related workers2
56.1 57.3 58.3 57.9 58.7 58.1 .. .. .. .. .. .. .. .. .. .. .. .. .. .. .. .. ..
Sales workers3
68.2 67.5 66.4 67.0 66.6 67.3 .. .. .. .. .. .. .. .. .. .. .. .. .. .. .. .. ..
Service workers4
54.9 55.6 56.3 57.4 57.7 57.4 .. .. .. .. .. .. .. .. .. .. .. .. .. .. .. .. ..
Agricultural, animal husbandry
and forestry workers,
fishermen and hunters 25.2 26.7 26.3 25.6 26.5 24.0 .. .. .. .. .. .. .. .. .. .. .. .. .. .. .. .. ..
Production and related
equipment workers, transport
operators and laborers 20.1 18.5 18.1 17.9 18.8 18.8 .. .. .. .. .. .. .. .. .. .. .. .. .. .. .. .. ..
Occupations, n.e.c. 38.5 33.3 41.2 35.0 32.4 39.5 .. .. .. .. .. .. .. .. .. .. .. .. .. .. .. .. ..
Based on 1992 PSOC1
.. .. .. .. .. .. 38.5 39.1 38.4 37.9 38.4 38.7 38.8 38.5 39.0 39.2 39.3 39.2 39.3 39.5 39.6 .. ..
Officials of government
and special interest-
organizations, corporate
executives, managers,
managing proprietors
and supervisors .. .. .. .. .. .. 59.0 57.8 57.5 57.3 57.4 57.9 57.6 54.8 53.4 52.7 52.1 47.6 47.1 47.3 46.6 .. ..
Professionals .. .. .. .. .. .. 68.1 68.2 68.3 68.4 68.3 68.8 69.3 68.6 68.4 68.5 68.3 68.0 67.5 66.3 66.9 .. ..
Technicians and associate
professionals .. .. .. .. .. .. 49.1 50.3 50.9 50.1 51.9 50.9 51.2 50.7 51.9 51.9 51.3 48.1 49.8 51.7 51.1 .. ..
Clerks .. .. .. .. .. .. 67.1 66.4 66.2 64.9 65.1 64.1 63.1 63.8 62.0 62.4 62.0 62.3 62.0 62.1 62.2 .. ..
Service workers and shop
and market sales workers .. .. .. .. .. .. 53.3 52.5 51.2 49.7 50.1 51.2 51.3 50.6 50.8 50.7 50.8 50.8 50.9 50.7 51.2 .. ..
Farmers, forestry workers
and fishermen .. .. .. .. .. .. 17.0 16.6 16.0 13.9 14.1 15.2 15.3 14.3 14.3 14.7 14.7 15.5 15.6 16.6 17.3 .. ..
Trades and related workers .. .. .. .. .. .. 28.3 27.6 26.8 25.8 25.6 25.1 24.5 21.9 21.2 20.7 20.8 18.1 17.2 16.1 15.4 .. ..
Plant and machine operators
and assemblers .. .. .. .. .. .. 8.1 7.7 7.9 8.6 9.0 9.2 9.4 9.6 8.5 9.7 11.0 12.2 13.4 13.4 14.1 .. ..
Laborers and unskilled workers .. .. .. .. .. .. 45.4 46.4 44.8 43.4 44.6 44.1 43.5 43.2 43.3 42.8 42.1 41.4 40.4 40.9 40.1 .. ..
Special occupations5
.. .. .. .. .. .. 14.8 11.3 9.8 12.6 12.3 12.2 13.8 12.9 14.7 19.2 20.5 14.7 13.9 14.3 15.8 .. ..
Based on 2012 PSOC .. .. .. .. .. .. .. .. .. .. .. .. .. .. .. .. .. .. .. .. .. 38.9 37.9
Managers 6
.. .. .. .. .. .. .. .. .. .. .. .. .. .. .. .. .. .. .. .. .. 48.9 51.5
Professionals .. .. .. .. .. .. .. .. .. .. .. .. .. .. .. .. .. .. .. .. .. 65.5 65.2
Technicians and associate
professionals 7
.. .. .. .. .. .. .. .. .. .. .. .. .. .. .. .. .. .. .. .. .. 47.6 48.4
Clerical support workers .. .. .. .. .. .. .. .. .. .. .. .. .. .. .. .. .. .. .. .. .. 58.2 59.0
Service and sales workers 8
.. .. .. .. .. .. .. .. .. .. .. .. .. .. .. .. .. .. .. .. .. 51.8 51.4
Skilled agricultural, forestry
and fishery workers 18.1 17.0
Craft and related trades workers .. .. .. .. .. .. .. .. .. .. .. .. .. .. .. .. .. .. .. .. .. 16.6 14.6
Plant and machine operators
and assemblers .. .. .. .. .. .. .. .. .. .. .. .. .. .. .. .. .. .. .. .. .. 11.2 12.7
Elementary occupations .. .. .. .. .. .. .. .. .. .. .. .. .. .. .. .. .. .. .. .. .. 36.6 34.1
Armed forces occupations and
special occupations 9
.. .. .. .. .. .. .. .. .. .. .. .. .. .. .. .. .. .. .. .. .. 6.0 3.2
Others .. .. .. .. .. .. .. .. .. .. .. .. .. .. .. .. .. .. .. .. .. 51.6 -
Duncan Index of Dissimilarity 10
0.368 0.364 0.375 0.390 0.377 0.400 0.349 0.346 0.343 0.338 0.343 0.335 0.328 0.326 0.315 0.305 0.291 0.264 0.254 0.256 0.248 0.269 0.310
Female share of employment
in senior and middle
management 11
, in % 31.9 33.6 33.2 32.8 33.7 35.2 40.0 37.4 39.9 39.0 38.8 38.5 38.8 41.7 42.7 42.2 41.1 42.2 43.1 42.2 42.7 43.7 47.1
Share of women in wage
employment in the
non-agricultural sector 12
, in % 39.4 39.0 39.1 39.6 40.4 40.9 41.2 41.9 41.3 40.7 41.4 42.0 41.9 41.7 41.9 42.0 41.8 41.4 41.2 41.0 41.3 39.7 38.7

Table 8. Equal opportunity and treatment in employment
Decent Work Indicator 1995 1996 1997 1998 1999 2000 2001 2002 2003 2004 2005 2006 2007 2008 2009 2010 2011 2012 2013 2014 2015 2016 2017
Gender wage gap 13
, in % .. .. .. .. .. .. -3.9 -3.5 -1.7 -2.4 0.5 2.7 2.0 0.2 -0.1 -1.5 -3.2 -4.6 -5.6 -5.5 -5.4 .. ..
Officials of government .. ..
and special interest- .. ..
organizations, corporate .. ..
executives, managers, .. ..
managing proprietors .. ..
and supervisors .. .. .. .. .. .. -2.3 -2.7 3.9 1.1 0.5 3.9 1.9 -2.9 -5.1 1.6 -3.2 -3.5 -0.5 -6.7 -3.3 .. ..
Professionals .. .. .. .. .. .. 10.8 10.9 12.9 11.2 13.2 12.3 16.7 15.5 13.3 12.2 10.6 8.1 8.8 7.4 8.5 .. ..
Technicians and associate .. ..
professionals .. .. .. .. .. .. 5.9 7.7 7.7 9.9 11.6 13.6 12.7 11.3 16.3 14.7 11.9 7.3 11.0 11.7 11.3 .. ..
Clerks .. .. .. .. .. .. 5.0 2.1 3.9 2.0 1.1 -3.2 2.4 3.8 5.0 3.7 5.7 2.6 0.6 2.4 3.7 .. ..
Service workers and shop .. ..
and market sales workers .. .. .. .. .. .. 33.0 35.7 35.8 34.9 35.4 37.2 35.2 35.0 33.9 35.7 34.3 35.6 34.2 32.4 30.8 .. ..
Farmers, forestry workers .. ..
and fishermen .. .. .. .. .. .. 20.5 12.5 16.1 16.0 30.2 25.1 37.0 33.8 28.2 24.4 13.3 -25.1 32.1 40.5 -19.6 .. ..
Trades and related workers .. .. .. .. .. .. 19.4 19.3 18.0 19.9 18.3 24.8 21.5 22.5 22.6 23.5 26.0 25.5 24.3 27.0 27.5 .. ..
Plant and machine operators .. ..
and assemblers .. .. .. .. .. .. 0.6 -3.4 -4.7 -4.9 -2.6 0.3 0.1 -3.0 -6.0 -3.1 -1.1 0.4 3.2 4.1 6.0 .. ..
Laborers and unskilled workers .. .. .. .. .. .. 20.4 19.5 21.6 22.5 26.9 30.9 25.9 27.5 27.8 26.6 27.1 26.6 25.6 26.9 26.5 .. ..
Special occupations .. .. .. .. .. .. 39.0 37.9 42.5 46.3 46.1 37.3 44.0 32.6 44.9 35.1 36.8 16.4 19.1 6.8 5.7 .. ..
Based on 2012 PSOC .. .. .. .. .. .. .. .. .. .. .. .. .. .. .. .. .. .. .. .. .. -5.5 -5.3
Managers .. .. .. .. .. .. .. .. .. .. .. .. .. .. .. .. .. .. .. .. .. 1.5 4.7
Professionals .. .. .. .. .. .. .. .. .. .. .. .. .. .. .. .. .. .. .. .. .. 9.4 9.3
Technicians and associate
professionals .. .. .. .. .. .. .. .. .. .. .. .. .. .. .. .. .. .. .. .. .. 6.0 6.3
Clerical support workers .. .. .. .. .. .. .. .. .. .. .. .. .. .. .. .. .. .. .. .. .. 1.8 3.5
Service and sales workers .. .. .. .. .. .. .. .. .. .. .. .. .. .. .. .. .. .. .. .. .. 26.9 24.4
Skilled agricultural, forestry
and fishery workers -3.4 -33.6
Craft and related trades workers .. .. .. .. .. .. .. .. .. .. .. .. .. .. .. .. .. .. .. .. .. 24.2 25.5
Plant and machine operators
and assemblers .. .. .. .. .. .. .. .. .. .. .. .. .. .. .. .. .. .. .. .. .. 7.4 9.9
Elementary occupations .. .. .. .. .. .. .. .. .. .. .. .. .. .. .. .. .. .. .. .. .. 26.0 23.5
Armed forces occupations and
special occupations .. .. .. .. .. .. .. .. .. .. .. .. .. .. .. .. .. .. .. .. .. 24.0 -55.8
Others .. .. .. .. .. .. .. .. .. .. .. .. .. .. .. .. .. .. .. .. .. 1.8 -
Notes: 1. Annualized data for 2014 from the Labor Force Survey is the average of estimates for April, July and October survey rounds. The estimates for these rounds exclude data
for Leyte province only while that of January exclude Region VIII.
2. Annualized data for 2015 from the Labor Force Survey is the average of estimates for January, April, July and October survey rounds. The estimates for these rounds exclude
data for Leyte province only. The use of the four survey rounds that exclude Leyte was based on the results of the referendum conducted among members of the Inter-Agency
Committee on Labor and Productivity Statistics.1
The 1977, 1992 and 2012 PSOC are patterned after ISCO 1968, ISCO-88 and ISCO-08, respectively. 2
Include clerical supervisors.3
Include managers, working proprietors and supervisors (wholesale and retail trade).4
Include managers, working proprietors and supervisors (catering and lodging services), officers and enlisted personnel of armed forces.5
Include officers and enlisted personnel of armed forces and occupations, n.e.c.6
Exclude supervisors.7
Include occupations which require more advanced skills/education or extensive training. 8
Include cashiers and ticket clerks.9
Consist of military occupations only.10
A summary indicator of occupational segregation. It ranges from 0 to 1, with 0 meaning no occupational segregation and 1 being complete segregation
between the two sexes. It is computed as: 1/2 Σ|W i /W - M i /M| where W i and M i are the shares of the employed women and men in the i
th major
occupation group relative to their respective totals, employed women (W) and employed men (M).11
Refer to legislators and senior officials, and corporate managers (ISCO-88 groups 11 and 12). Data from 1995-2000 and 2001 onwards not strictly comparable
because of differences in coverage in the 1977 and 1992 PSOC.12
MDG indicator on employment.13
Defined as the difference between average daily basic pay of men and women as a percentage of average daily basic pay of men.
Source: Philippine Statistics Authority, Labor Force Survey.
Date updated: 09/24/2018

Table 8. Equal opportunity and treatment in employmentOccupational segregation by sex (Female share in occupational employment) Based on 1977 PSOC
Decent Work Indicator and
Underlying Data1995 1996 1997 1998 1999 2000 2001 2002 2003 2004 2005 2006 2007 2008 2009 2010 2011 2012 2013 2014 2015 2016 2017
Based on 1977 PSOC
Female share in occupational
employment (%) 36.4 36.8 37.0 37.2 37.8 37.4 .. .. .. .. .. .. .. .. .. .. .. .. .. .. .. .. ..
Professional, technical
and related workers 64.0 63.2 63.7 63.6 63.3 63.8 .. .. .. .. .. .. .. .. .. .. .. .. .. .. .. .. ..
Administrative, executive
and managerial workers 31.9 33.6 33.2 32.8 33.7 35.2 .. .. .. .. .. .. .. .. .. .. .. .. .. .. .. .. ..
Clerical and related workers1
56.1 57.3 58.3 57.9 58.7 58.1 .. .. .. .. .. .. .. .. .. .. .. .. .. .. .. .. ..
Sales workers2
68.2 67.5 66.4 67.0 66.6 67.3 .. .. .. .. .. .. .. .. .. .. .. .. .. .. .. .. ..
Service workers3
54.9 55.6 56.3 57.4 57.7 57.4 .. .. .. .. .. .. .. .. .. .. .. .. .. .. .. .. ..
Agricultural, animal husbandry
and forestry workers,
fishermen and hunters 25.2 26.7 26.3 25.6 26.5 24.0 .. .. .. .. .. .. .. .. .. .. .. .. .. .. .. .. ..
Production and related
equipment workers, transport
operators and laborers 20.1 18.5 18.1 17.9 18.8 18.8 .. .. .. .. .. .. .. .. .. .. .. .. .. .. .. .. ..
Occupations, n.e.c. 38.5 33.3 41.2 35.0 32.4 39.5 .. .. .. .. .. .. .. .. .. .. .. .. .. .. .. .. ..
Total employed (000) 25677 27186 26365 26631 27742 27452 .. .. .. .. .. .. .. .. .. .. .. .. .. .. .. .. ..
Professional, technical
and related workers 1430 1567 1585 1597 1666 1664 .. .. .. .. .. .. .. .. .. .. .. .. .. .. .. .. ..
Administrative, executive
and managerial workers 408 432 503 555 599 613 .. .. .. .. .. .. .. .. .. .. .. .. .. .. .. .. ..
Clerical and related workers1
1130 1194 1212 1223 1260 1307 .. .. .. .. .. .. .. .. .. .. .. .. .. .. .. .. ..
Sales workers2
3582 3850 3767 3944 4135 4230 .. .. .. .. .. .. .. .. .. .. .. .. .. .. .. .. ..
Service workers3
2342 2462 2670 2880 2936 2967 .. .. .. .. .. .. .. .. .. .. .. .. .. .. .. .. ..
Agricultural, animal husbandry
and forestry workers,
fishermen and hunters 11026 11539 10304 9977 10672 10072 .. .. .. .. .. .. .. .. .. .. .. .. .. .. .. .. ..
Production and related
equipment workers, transport
operators and laborers 5730 6117 6289 6416 6440 6560 .. .. .. .. .. .. .. .. .. .. .. .. .. .. .. .. ..
Occupations, n.e.c. 26 27 34 40 34 38 .. .. .. .. .. .. .. .. .. .. .. .. .. .. .. .. ..

Table 8. Equal opportunity and treatment in employment
Decent Work Indicator and
Underlying Data1995 1996 1997 1998 1999 2000 2001 2002 2003 2004 2005 2006 2007 2008 2009 2010 2011 2012 2013 2014 2015 2016 2017
Men 16322 17170 16610 16714 17253 17193 .. .. .. .. .. .. .. .. .. .. .. .. .. .. .. .. ..
Professional, technical
and related workers 515 576 576 580 610 603 .. .. .. .. .. .. .. .. .. .. .. .. .. .. .. .. ..
Administrative, executive
and managerial workers 277 288 336 373 397 397 .. .. .. .. .. .. .. .. .. .. .. .. .. .. .. .. ..
Clerical and related workers1
496 509 505 515 522 547 .. .. .. .. .. .. .. .. .. .. .. .. .. .. .. .. ..
Sales workers2
1138 1250 1267 1301 1383 1383 .. .. .. .. .. .. .. .. .. .. .. .. .. .. .. .. ..
Service workers3
1056 1093 1167 1226 1243 1264 .. .. .. .. .. .. .. .. .. .. .. .. .. .. .. .. ..
Agricultural, animal husbandry
and forestry workers,
fishermen and hunters 8245 8453 7589 7425 7846 7651 .. .. .. .. .. .. .. .. .. .. .. .. .. .. .. .. ..
Production and related
equipment workers, transport
operators and laborers 4577 4984 5150 5268 5229 5326 .. .. .. .. .. .. .. .. .. .. .. .. .. .. .. .. ..
Occupations, n.e.c. 16 17 20 26 24 24 .. .. .. .. .. .. .. .. .. .. .. .. .. .. .. .. ..
Women 9354 10016 9754 9917 10489 10259 .. .. .. .. .. .. .. .. .. .. .. .. .. .. .. .. ..
Professional, technical
and related workers 915 991 1009 1016 1055 1062 .. .. .. .. .. .. .. .. .. .. .. .. .. .. .. .. ..
Administrative, executive
and managerial workers 130 145 167 182 202 216 .. .. .. .. .. .. .. .. .. .. .. .. .. .. .. .. ..
Clerical and related workers1
634 684 707 708 739 760 .. .. .. .. .. .. .. .. .. .. .. .. .. .. .. .. ..
Sales workers2
2444 2600 2500 2643 2753 2848 .. .. .. .. .. .. .. .. .. .. .. .. .. .. .. .. ..
Service workers3
1286 1368 1503 1654 1693 1704 .. .. .. .. .. .. .. .. .. .. .. .. .. .. .. .. ..
Agricultural, animal husbandry
and forestry workers,
fishermen and hunters 2781 3086 2715 2552 2827 2422 .. .. .. .. .. .. .. .. .. .. .. .. .. .. .. .. ..
Production and related
equipment workers, transport
operators and laborers 1154 1133 1139 1148 1211 1235 .. .. .. .. .. .. .. .. .. .. .. .. .. .. .. .. ..
Occupations, n.e.c. 10 9 14 14 11 15 .. .. .. .. .. .. .. .. .. .. .. .. .. .. .. .. ..
Note: See Metadata of Statistical Indicators on Decent Work for definitions and other information.
1 Include clerical supervisors.
2 Include managers, working proprietors and supervisors (wholesale and retail trade).
3 Include managers, working proprietors and supervisors (catering and lodging services), officers and enlisted personnel of armed forces.
Source: Philippine Statistics Authority, Labor Force Survey.
Occupational segregation by sex (Female share in occupational employment) Based on 1977 PSOC

Table 8. Equal opportunity and treatment in employment
Decent Work Indicator and
Underlying Data1995 1996 1997 1998 1999 2000 2001 2002 2003 2004 2005 2006 2007 2008 2009 2010 2011 2012 2013 2014 2015
Based on 1992 PSOC
Female share in occupational
employment (%) .. .. .. .. .. .. 38.5 39.1 38.4 37.9 38.4 38.7 38.8 38.5 39.0 39.2 39.3 39.2 39.3 39.5 39.6
Officials of government
and special interest-
organizations, corporate
executives, managers,
managing proprietors
and supervisors .. .. .. .. .. .. 59.0 57.8 57.5 57.3 57.4 57.9 57.6 54.8 53.4 52.7 52.1 47.6 47.1 47.3 46.6
Professionals .. .. .. .. .. .. 68.1 68.2 68.3 68.4 68.3 68.8 69.3 68.6 68.4 68.5 68.3 68.0 67.5 66.3 66.9
Technicians and associate
professionals .. .. .. .. .. .. 49.1 50.3 50.9 50.1 51.9 50.9 51.2 50.7 51.9 51.9 51.3 48.1 49.8 51.7 51.1
Clerks .. .. .. .. .. .. 67.1 66.4 66.2 64.9 65.1 64.1 63.1 63.8 62.0 62.4 62.0 62.3 62.0 62.1 62.2
Service workers and shop
and market sales workers .. .. .. .. .. .. 53.3 52.5 51.2 49.7 50.1 51.2 51.3 50.6 50.8 50.7 50.8 50.8 50.9 50.7 51.2
Farmers, forestry workers
and fishermen .. .. .. .. .. .. 17.0 16.6 16.0 13.9 14.1 15.2 15.3 14.3 14.3 14.7 14.7 15.5 15.6 16.6 17.3
Trades and related workers .. .. .. .. .. .. 28.3 27.6 26.8 25.8 25.6 25.1 24.5 21.9 21.2 20.7 20.8 18.1 17.2 16.1 15.4
Plant and machine operators
and assemblers .. .. .. .. .. .. 8.1 7.7 7.9 8.6 9.0 9.2 9.4 9.6 8.5 9.7 11.0 12.2 13.4 13.4 14.1
Laborers and unskilled workers .. .. .. .. .. .. 45.4 46.4 44.8 43.4 44.6 44.1 43.5 43.2 43.3 42.8 42.1 41.4 40.4 40.9 40.1
Special occupations1
.. .. .. .. .. .. 14.8 11.3 9.8 12.6 12.3 12.2 13.8 12.9 14.7 19.2 20.5 14.7 13.9 14.3 15.8
Total employed (000) .. .. .. .. .. .. 29156 30062 30635 31613 32313 32636 33560 34089 35061 36035 37192 37600 38118 38651 38741
Officials of government
and special interest-
organizations, corporate
executives, managers,
managing proprietors
and supervisors .. .. .. .. .. .. 2921 3217 3398 3775 3784 3811 3958 4327 4722 4979 5217 5608 6173 6166 6292
Professionals .. .. .. .. .. .. 1323 1385 1349 1353 1395 1404 1454 1526 1608 1686 1732 1807 1874 1925 1989
Technicians and associate
professionals .. .. .. .. .. .. 748 819 882 883 858 880 908 876 932 954 985 1030 996 990 1030
Clerks .. .. .. .. .. .. 1317 1332 1356 1352 1454 1505 1652 1715 1860 2003 2109 2116 2248 2403 2492
Service workers and shop
and market sales workers .. .. .. .. .. .. 2582 2658 2715 2888 3005 3121 3248 3394 3672 3838 4141 4554 4694 4856 4925
Farmers, forestry workers
and fishermen .. .. .. .. .. .. 6353 6240 6220 5921 6161 6127 6069 5999 5851 5747 5715 5297 4994 5218 5000
Occupational segregation by sex (Female share in occupational employment) Based on 1992 PSOC

Table 8. Equal opportunity and treatment in employment
Decent Work Indicator and
Underlying Data1995 1996 1997 1998 1999 2000 2001 2002 2003 2004 2005 2006 2007 2008 2009 2010 2011 2012 2013 2014 2015
Trades and related workers .. .. .. .. .. .. 3075 2993 2932 2866 2887 2803 2811 2730 2662 2792 2769 2511 2600 2626 2592
Plant and machine operators
and assemblers .. .. .. .. .. .. 2283 2197 2348 2429 2446 2495 2573 2354 2218 2259 2245 2014 2027 2001 2083
Laborers and unskilled workers .. .. .. .. .. .. 8420 9097 9303 10005 10176 10343 10749 11021 11385 11622 12118 12547 12403 12348 12223
Special occupations1
.. .. .. .. .. .. 135 124 133 143 146 147 138 147 150 156 161 116 108 119 114
Men .. .. .. .. .. .. 17923 18306 18873 19646 19910 20013 20542 20959 21404 21921 22573 22849 23150 23365 23406
Officials of government
and special interest-
organizations, corporate
executives, managers,
managing proprietors
and supervisors .. .. .. .. .. .. 1198 1358 1444 1613 1613 1605 1677 1955 2202 2354 2497 2941 3264 3248 3362
Professionals .. .. .. .. .. .. 422 442 428 427.5 443 439 447 479 508 531 549 578 609 648 659
Technicians and associate
professionals .. .. .. .. .. .. 381 407 434 441.5 413 432 443 431 448 458 480 534 500 478 505
Clerks .. .. .. .. .. .. 433 447 459 474.5 508 539 609 621 706 753 801 798 855 912 940
Service workers and shop
and market sales workers .. .. .. .. .. .. 1205 1262 1324 1453 1499 1524 1583 1678 1808 1891 2039 2240 2307 2393 2402
Farmers, forestry workers
and fishermen .. .. .. .. .. .. 5274 5207 5225 5099 5293 5195 5139 5143 5017 4904 4875 4478 4215 4352 4134
Trades and related workers .. .. .. .. .. .. 2205 2166 2145 2128 2148 2099 2121 2133 2098 2213 2193 2057 2154 2204 2193
Plant and machine operators
and assemblers .. .. .. .. .. .. 2097 2027 2162 2219 2228 2265 2332 2129 2030 2040 1998 1768 1755 1732 1789
Laborers and unskilled workers .. .. .. .. .. .. 4594 4878 5134 5664 5637 5786 6072 6262 6459 6652 7013 7354 7398 7298 7325
Special occupations1
.. .. .. .. .. .. 115 110 120 125.5 128 130 120 128 128 125 129 100 93 101 96
Women .. .. .. .. .. .. 11232 11756 11762 11968 12403 12622 13018 13129 13657 14114 14619 14751 14968 15286 15335
Officials of government
and special interest-
organizations, corporate
executives, managers,
managing proprietors
and supervisors .. .. .. .. .. .. 1722 1859 1954 2162 2171 2206 2281 2372 2520 2625 2720 2667 2909 2918 2929
Professionals .. .. .. .. .. .. 901 944 921 925 953 966 1007 1047 1100 1155 1183 1229 1265 1277 1330
Technicians and associate
professionals .. .. .. .. .. .. 367 412 449 442 445 448 465 444 484 495 505 495 496 512 526
Clerks .. .. .. .. .. .. 884 885 898 878 946 965 1043 1095 1154 1250 1308 1318 1393 1492 1551
Service workers and shop
and market sales workers .. .. .. .. .. .. 1377 1396 1391 1435 1507 1597 1665 1716 1864 1947 2102 2313 2387 2463 2523
Occupational segregation by sex (Female share in occupational employment) Based on 1992 PSOC

Table 8. Equal opportunity and treatment in employment
Decent Work Indicator and
Underlying Data1995 1996 1997 1998 1999 2000 2001 2002 2003 2004 2005 2006 2007 2008 2009 2010 2011 2012 2013 2014 2015
Farmers, forestry workers
and fishermen .. .. .. .. .. .. 1079 1033 995 822 868 932 930 856 834 843 840 819 779 866 866
Trades and related workers .. .. .. .. .. .. 870 826 787 738 740 704 690 597 564 579 576 454 446 422 399
Plant and machine operators
and assemblers .. .. .. .. .. .. 186 170 186 210 219 230 241 225 189 219 247 246 272 268 294
Laborers and unskilled workers .. .. .. .. .. .. 3826 4219 4169 4341 4539 4557 4677 4759 4926 4970 5104 5193 5005 5050 4898
Special occupations1
.. .. .. .. .. .. 20 14 13 18 18 18 19 19 22 30 33 17 15 17 18
Notes: 1. Annualized data for 2014 from the Labor Force Survey is the average of estimates for April, July and October survey rounds. The estimates for these rounds exclude data for
Leyte province only while that of January exclude Region VIII.
2. Annualized data for 2015 from the Labor Force Survey is the average of estimates for January, April, July and October survey rounds. The estimates for these rounds exclude
data for Leyte province only. The use of the four survey rounds that exclude Leyte was based on the results of the referendum conducted among members of the Inter-Agency
Committee on Labor and Productivity Statistics. 3. See Metadata of Statistical Indicators on Decent Work for definitions and other information.
1 Include officers and enlisted personnel of armed forces and occupations, n.e.c.
Source: Philippine Statistics Authority, Labor Force Survey.
Occupational segregation by sex (Female share in occupational employment) Based on 1992 PSOC

Table 8. Equal opportunity and treatment in employment
Decent Work Indicator and
Underlying Data2016 2017
Based on 2012 PSOC
Female share in occupational
employment (%) 38.9 37.9
Managers 1
48.9 51.5
Professionals 65.5 65.2
Technicians and associate
professionals 2
47.6 48.4
Clerical support workers 58.2 59.0
Service and sales workers 3
51.8 51.4
Skilled agricultural, forestry
and fishery workers 18.1 17.0
Craft and related trades workers 16.6 14.6
Plant and machine operators
and assemblers 11.2 12.7
Elementary occupations 36.6 34.1
Armed forces occupations and
special occupations 4
6.0 3.2
Others 51.6 -
Total employed (000) 40998 40334
Managers 6992 6490
Professionals 1973 2149
Technicians and associate
professionals 1296 1533
Clerical support workers 1798 2283
Service and sales workers 5930 6069
Skilled agricultural, forestry
and fishery workers 5108 5426
Craft and related trades workers 2879 3198
Plant and machine operators
and assemblers 2239 2552
Elementary occupations 11267 10538
Armed forces occupations and
special occupations 100 95
Others 1415 -
Occupational segregation by sex (Female share in occupational employment) Based on 2012 PSOC

Table 8. Equal opportunity and treatment in employment
Decent Work Indicator and
Underlying Data2016 2017
Men 25035 25067
Managers 3570 3147
Professionals 681 747
Technicians and associate
professionals 679 791
Clerical support workers 752 936
Service and sales workers 2859 2947
Skilled agricultural, forestry
and fishery workers 4184 4502
Craft and related trades workers 2401 2732
Plant and machine operators
and assemblers 1989 2229
Elementary occupations 7142 6943
Armed forces occupations and
special occupations 93 92
Others 685 -
Women 15963 15267
Managers 3422 3342
Professionals 1293 1402
Technicians and associate
professionals 617 742
Clerical support workers 1046 1347
Service and sales workers 3072 3122
Skilled agricultural, forestry
and fishery workers 924 924
Craft and related trades workers 478 466
Plant and machine operators
and assemblers 250 323
Elementary occupations 4125 3595
Armed forces occupations and
special occupations 6 3
Others 730 -
Note: See Metadata of Statistical Indicators on Decent Work for definitions and other information.
1 Exclude supervisors.
2 Include occupations which require more advanced skills/education or extensive training.
3 Include cashiers and ticket clerks.
4 Consist of military occupations only.
Source: Philippine Statistics Authority, Labor Force Survey.
Occupational segregation by sex (Female share in occupational employment) Based on 1992 PSOC

Table 8. Equal opportunity and treatment in employment
Decent Work Indicator and
Underlying Data1995 1996 1997 1998 1999 2000 2001 2002 2003 2004 2005 2006 2007 2008 2009 2010 2011 2012 2013 2014 2015 2016 2017
Duncan Index of Dissimilarity 0.368 0.364 0.375 0.390 0.377 0.400 0.349 0.346 0.343 0.338 0.343 0.335 0.328 0.326 0.315 0.305 0.291 0.264 0.254 0.256 0.248 0.269 0.310
Notes: 1. Annualized data for 2014 from the Labor Force Survey is the average of estimates for April, July and October survey rounds. The estimates for these rounds exclude data for Leyte province only while that of January
exclude Region VIII.
2. Annualized data for 2015 from the Labor Force Survey is the average of estimates for January, April, July and October survey rounds. The estimates for these rounds exclude data for Leyte province only. The use of the
four survey rounds that exclude Leyte was based on the results of the referendum conducted among members of the Inter-Agency Committee on Labor and Productivity Statistics. 3. See Metadata of Statistical Indicators on Decent Work for definitions and other information.
Source: Philippine Statistics Authority, Labor Force Survey.
Table 8. Equal opportunity and treatment in employment
Decent Work Indicator and
Underlying Data1995 1996 1997 1998 1999 2000 2001 2002 2003 2004 2005 2006 2007 2008 2009 2010 2011 2012 2013 2014 2015
Based on 1977 PSOCFemale share of employment in
senior and middle management
ISCO-88 groups 11 and 121
(%) 31.9 33.6 33.2 32.8 33.7 35.2 .. .. .. .. .. .. .. .. .. .. .. .. .. .. ..
Administrative, executive
and managerial workers1 (000) 408 432 503 555 599 613 .. .. .. .. .. .. .. .. .. .. .. .. .. .. ..
Men 277 288 336 373 397 397 .. .. .. .. .. .. .. .. .. .. .. .. .. .. ..
Women 130 145 167 182 202 216 .. .. .. .. .. .. .. .. .. .. .. .. .. .. ..
Note: See Metadata of Statistical Indicators on Decent Work for definitions and other information.1 Include other managers which are excluded in the 1992 PSOC-based data. Hence, the two data series are not strictly comparable.
Source: Philippine Statistics Authority, Labor Force Survey.
Table 8. Equal opportunity and treatment in employment
Decent Work Indicator and
Underlying Data1995 1996 1997 1998 1999 2000 2001 2002 2003 2004 2005 2006 2007 2008 2009 2010 2011 2012 2013 2014 2015
Based on 1992 PSOC
Female share of employment in
senior and middle management
ISCO-88 groups 11 and 12 (%) .. .. .. .. .. .. 40.0 37.4 39.9 39.0 38.8 38.5 38.8 41.7 42.7 42.2 41.1 42.2 43.1 42.2 42.7
Officials of government
and special-interest organizations,
corporate
executives and specialized
managers (000) .. .. .. .. .. .. 490 446 434 426 420 418 456 494 518 557 569 592 606 618 634
Men .. .. .. .. .. .. 294 279 260 259 256 258 280 288 296 321 335 342 345 357 364
Women .. .. .. .. .. .. 196 167 173 166 163 161 177 206 221 235 234 250 261 261 271
Notes: 1. Annualized data for 2014 from the Labor Force Survey is the average of estimates for April, July and October survey rounds. The estimates for these rounds exclude data for Leyte province only while that of January
exclude Region VIII.
2. Annualized data for 2015 from the Labor Force Survey is the average of estimates for January, April, July and October survey rounds. The estimates for these rounds exclude data for Leyte province only. The use of the
four survey rounds that exclude Leyte was based on the results of the referendum conducted among members of the Inter-Agency Committee on Labor and Productivity Statistics. 3. See Metadata of Statistical Indicators on Decent Work for definitions and other information.
Source: Philippine Statistics Authority, Labor Force Survey.
Occupational segregation by sex (Duncan Index of Dissimilarity)
Female share of employment in senior and middle management (ISCO-88 groups 11 and 12) Based on 1977 PSOC
Female share of employment in senior and middle management (ISCO-88 groups 11 and 12) Based on 1992 PSOC

Table 8. Equal opportunity and treatment in employment
Decent Work Indicator and
Underlying Data2016 2017
Based on 2012 PSOC
Female share of employment in
senior and middle management
ISCO-08 groups 11 and 12 (%) 43.7 47.1
Chief executives, senior officials
and legislators; Administrative and
commercial managers (000) 678 683
Men 381 361
Women 296 322
Note: See Metadata of Statistical Indicators on Decent Work for definitions and other information.
Source: Philippine Statistics Authority, Labor Force Survey.
Female share of employment in senior and middle management (ISCO-2008 groups 11 and 12) Based on 2012 PSOC

Table 8. Equal opportunity and treatment in employment
Decent Work Indicator and
Underlying Data1995 1996 1997 1998 1999 2000 2001 2002 2003 2004 2005 2006 2007 2008 2009 2010 2011 2012 2013 2014 2015 2016 2017
Wage and salary workers in non-
agricultural employment, 100.0 100.0 100.0 100.0 100.0 100.0 100.0 100.0 100.0 100.0 100.0 100.0 100.0 100.0 100.0 100.0 100.0 100.0 100.0 100.0 100.0 100.0 100.0
% distribution
Men 60.6 61.0 60.9 60.4 59.6 59.1 58.8 58.1 58.7 59.3 58.6 58.1 58.1 58.3 58.1 58.1 58.2 58.6 58.8 59.0 58.7 60.3 61.3
Women 39.4 39.0 39.1 39.6 40.4 40.9 41.2 41.9 41.3 40.7 41.4 42.0 41.9 41.7 41.9 42.0 41.8 41.4 41.2 41.0 41.3 39.7 38.7
Total wage and salary workers in
non-agricultural employment (000) 9514 10278 10813 11062 11269 11443 11898 12127 12692 13539 13598 13825 14517 14740 15478 16338 16922 17694 18436 18869 19513 21670 22056
Men 5766 6265 6581 6685 6716 6762 6996 7050 7456 8028 7966 8026 8434 8593 8992 9485 9847 10376 10834 11128 11456 13073 13526
Women 3747 4013 4232 4377 4553 4681 4902 5078 5236 5511 5633 5800 6083 6148 6486 6854 7075 7317 7601 7741 8057 8597 8530
Notes: 1. Annualized data for 2014 from the Labor Force Survey is the average of estimates for April, July and October survey rounds. The estimates for these rounds exclude data for Leyte province only while that of January
exclude Region VIII.
2. Annualized data for 2015 from the Labor Force Survey is the average of estimates for January, April, July and October survey rounds. The estimates for these rounds exclude data for Leyte province only. The use of the
four survey rounds that exclude Leyte was based on the results of the referendum conducted among members of the Inter-Agency Committee on Labor and Productivity Statistics. 3. See Metadata of Statistical Indicators on Decent Work for definitions and other information.
Source: Philippine Statistics Authority, Labor Force Survey.
Share of women in wage employment in the non-agricultural sector
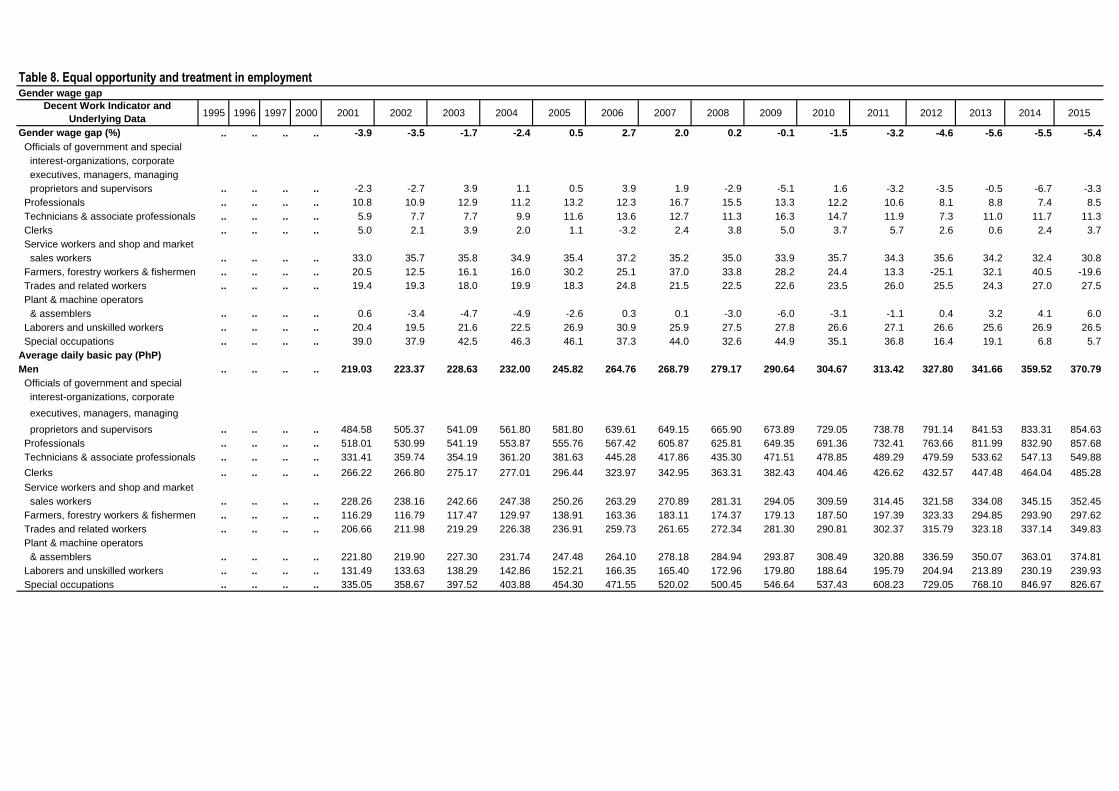
Table 8. Equal opportunity and treatment in employment
Decent Work Indicator and
Underlying Data1995 1996 1997 2000 2001 2002 2003 2004 2005 2006 2007 2008 2009 2010 2011 2012 2013 2014 2015
Gender wage gap (%) .. .. .. .. -3.9 -3.5 -1.7 -2.4 0.5 2.7 2.0 0.2 -0.1 -1.5 -3.2 -4.6 -5.6 -5.5 -5.4
Officials of government and special
interest-organizations, corporate
executives, managers, managing
proprietors and supervisors .. .. .. .. -2.3 -2.7 3.9 1.1 0.5 3.9 1.9 -2.9 -5.1 1.6 -3.2 -3.5 -0.5 -6.7 -3.3
Professionals .. .. .. .. 10.8 10.9 12.9 11.2 13.2 12.3 16.7 15.5 13.3 12.2 10.6 8.1 8.8 7.4 8.5
Technicians & associate professionals .. .. .. .. 5.9 7.7 7.7 9.9 11.6 13.6 12.7 11.3 16.3 14.7 11.9 7.3 11.0 11.7 11.3
Clerks .. .. .. .. 5.0 2.1 3.9 2.0 1.1 -3.2 2.4 3.8 5.0 3.7 5.7 2.6 0.6 2.4 3.7
Service workers and shop and market
sales workers .. .. .. .. 33.0 35.7 35.8 34.9 35.4 37.2 35.2 35.0 33.9 35.7 34.3 35.6 34.2 32.4 30.8
Farmers, forestry workers & fishermen .. .. .. .. 20.5 12.5 16.1 16.0 30.2 25.1 37.0 33.8 28.2 24.4 13.3 -25.1 32.1 40.5 -19.6
Trades and related workers .. .. .. .. 19.4 19.3 18.0 19.9 18.3 24.8 21.5 22.5 22.6 23.5 26.0 25.5 24.3 27.0 27.5
Plant & machine operators
& assemblers .. .. .. .. 0.6 -3.4 -4.7 -4.9 -2.6 0.3 0.1 -3.0 -6.0 -3.1 -1.1 0.4 3.2 4.1 6.0
Laborers and unskilled workers .. .. .. .. 20.4 19.5 21.6 22.5 26.9 30.9 25.9 27.5 27.8 26.6 27.1 26.6 25.6 26.9 26.5
Special occupations .. .. .. .. 39.0 37.9 42.5 46.3 46.1 37.3 44.0 32.6 44.9 35.1 36.8 16.4 19.1 6.8 5.7
Average daily basic pay (PhP)
Men .. .. .. .. 219.03 223.37 228.63 232.00 245.82 264.76 268.79 279.17 290.64 304.67 313.42 327.80 341.66 359.52 370.79
Officials of government and special
interest-organizations, corporate
executives, managers, managing
proprietors and supervisors .. .. .. .. 484.58 505.37 541.09 561.80 581.80 639.61 649.15 665.90 673.89 729.05 738.78 791.14 841.53 833.31 854.63
Professionals .. .. .. .. 518.01 530.99 541.19 553.87 555.76 567.42 605.87 625.81 649.35 691.36 732.41 763.66 811.99 832.90 857.68
Technicians & associate professionals .. .. .. .. 331.41 359.74 354.19 361.20 381.63 445.28 417.86 435.30 471.51 478.85 489.29 479.59 533.62 547.13 549.88
Clerks .. .. .. .. 266.22 266.80 275.17 277.01 296.44 323.97 342.95 363.31 382.43 404.46 426.62 432.57 447.48 464.04 485.28
Service workers and shop and market
sales workers .. .. .. .. 228.26 238.16 242.66 247.38 250.26 263.29 270.89 281.31 294.05 309.59 314.45 321.58 334.08 345.15 352.45
Farmers, forestry workers & fishermen .. .. .. .. 116.29 116.79 117.47 129.97 138.91 163.36 183.11 174.37 179.13 187.50 197.39 323.33 294.85 293.90 297.62
Trades and related workers .. .. .. .. 206.66 211.98 219.29 226.38 236.91 259.73 261.65 272.34 281.30 290.81 302.37 315.79 323.18 337.14 349.83
Plant & machine operators
& assemblers .. .. .. .. 221.80 219.90 227.30 231.74 247.48 264.10 278.18 284.94 293.87 308.49 320.88 336.59 350.07 363.01 374.81
Laborers and unskilled workers .. .. .. .. 131.49 133.63 138.29 142.86 152.21 166.35 165.40 172.96 179.80 188.64 195.79 204.94 213.89 230.19 239.93
Special occupations .. .. .. .. 335.05 358.67 397.52 403.88 454.30 471.55 520.02 500.45 546.64 537.43 608.23 729.05 768.10 846.97 826.67
Gender wage gap

Table 8. Equal opportunity and treatment in employment
Decent Work Indicator and
Underlying Data1995 1996 1997 2000 2001 2002 2003 2004 2005 2006 2007 2008 2009 2010 2011 2012 2013 2014 2015
Women .. .. .. .. 227.52 231.11 232.52 237.53 244.71 257.60 263.42 278.56 290.88 309.32 323.53 343.04 360.70 379.34 390.68
Officials of government and special
interest-organizations, corporate
executives, managers, managing
proprietors and supervisors .. .. .. .. 495.87 518.81 520.03 555.90 579.08 614.94 636.79 685.32 708.10 717.39 762.55 818.64 845.37 889.53 882.96
Professionals .. .. .. .. 462.31 473.24 471.35 491.77 482.43 497.60 504.59 529.07 562.90 606.93 655.12 701.85 740.20 771.61 784.60
Technicians & associate professionals .. .. .. .. 311.83 332.21 326.93 325.28 337.38 384.76 364.77 386.08 394.76 408.42 431.05 444.78 475.10 483.25 487.99
Clerks .. .. .. .. 252.98 261.24 264.35 271.44 293.26 334.47 334.71 349.57 363.37 389.40 402.51 421.48 444.72 452.69 467.47
Service workers and shop and market
sales workers .. .. .. .. 153.02 153.06 155.84 161.11 161.64 165.36 175.60 182.82 194.49 199.09 206.44 207.01 219.86 233.29 243.93
Farmers, forestry workers & fishermen .. .. .. .. 92.43 102.23 98.53 109.14 97.02 122.29 115.29 115.38 128.54 141.74 171.06 404.47 200.08 174.94 356.10
Trades and related workers .. .. .. .. 166.47 171.01 179.79 181.29 193.53 195.22 205.43 211.07 217.82 222.45 223.66 235.38 244.59 246.1 253.74
Plant & machine operators
& assemblers .. .. .. .. 220.56 227.28 237.93 243.05 254.03 263.40 277.77 293.39 311.62 318.05 324.49 335.20 338.71 348.07 352.25
Laborers and unskilled workers .. .. .. .. 104.67 107.61 108.40 110.77 111.33 114.94 122.50 125.33 129.88 138.52 142.80 150.40 159.18 168.33 176.41
Special occupations .. .. .. .. 204.44 222.74 228.65 216.92 244.80 295.81 291.39 337.39 301.44 348.64 384.59 609.32 621.01 789.39 779.82
Notes: 1. Annualized data for 2014 from the Labor Force Survey is the average of estimates for April, July and October survey rounds. The estimates for these rounds exclude data for Leyte province only while that of January
exclude Region VIII.
2. Annualized data for 2015 from the Labor Force Survey is the average of estimates for January, April, July and October survey rounds. The estimates for these rounds exclude data for Leyte province only. The use of the
four survey rounds that exclude Leyte was based on the results of the referendum conducted among members of the Inter-Agency Committee on Labor and Productivity Statistics.
3. See Metadata of Statistical Indicators on Decent Work for definitions and other information.
Source: Philippine Statistics Authority, Labor Force Survey.
Gender wage gap

Table 8. Equal opportunity and treatment in employment
Decent Work Indicator and
Underlying Data2016 2017
Gender wage gap (%) -5.5 -5.3
Managers 1
1.5 4.7
Professionals 9.4 9.3
Technicians and associate
professionals 2
6.0 6.3
Clerical support workers 1.8 3.5
Service and sales workers 3
26.9 24.4
Skilled agricultural, forestry
and fishery workers -3.4 -33.6
Craft and related trades workers 24.2 25.5
Plant and machine operators
and assemblers 7.4 9.9
Elementary occupations 26.0 23.5
Armed forces occupations and
special occupations 4
24.0 -55.8
Others 1.8 -
Average daily basic pay (PhP)
Men 392.82 407.09
Managers 987.16 943.51
Professionals 917.61 921.05
Technicians and associate
professionals 595.23 594.59
Clerical support workers 531.47 530.52
Service and sales workers 380.31 387.89
Skilled agricultural, forestry
and fishery workers 387.11 292.02
Craft and related trades workers 368.33 383.05
Plant and machine operators
and assemblers 392.83 414.16
Elementary occupations 253.34 272.09
Armed forces occupations
special occupations 905.03 833.3
Others 439.16 -
Gender wage gap

Table 8. Equal opportunity and treatment in employment
Decent Work Indicator and
Underlying Data2016 2017
Women 414.29 428.83
Managers 972.16 899.59
Professionals 831.59 834.99
Technicians and associate
professionals 559.4 556.94
Clerical support workers 521.86 512.09
Service and sales workers 277.95 293.35
Skilled agricultural, forestry
and fishery workers 400.31 390.08
Craft and related trades workers 279.03 285.54
Plant and machine operators
and assemblers 363.83 373.34
Elementary occupations 187.46 208.19
Armed forces occupations
special occupations 688.02 1297.91
Others 431.12 -
Note: See Metadata of Statistical Indicators on Decent Work for definitions and other information.
1 Exclude supervisors.
2 Include occupations which require more advanced skills/education or extensive training.
3 Include cashiers and ticket clerks.
4 Consist of military occupations only.
Source: Philippine Statistics Authority, Labor Force Survey.
Gender wage gap

Element 9
Safe Work Environment

Table 9. Safe work environment
Decent Work Indicator 2000 2001 2002 2003 2004 2005 2006 2007 2008 2009 2010 2011 2012 2013 2014 2015 2016 2017
Incidence rate of occupational
injuries, fatalities per 100,000
employed persons 9.5 .. 11.8 7.1 .. .. .. 4.0 .. 3.9 .. 4.4 .. 6.4 .. 3.8 .. ..
Agriculture .. .. .. .. .. .. .. .. .. .. .. 9.3 .. 48.8 .. 10.9 .. ..
Industry 9.3 .. 11.0 5.5 .. .. .. 7.1 .. 5.4 .. 7.6 .. 6.3 .. 3.8 .. ..
Services 9.7 .. 12.5 8.4 .. .. .. 2.0 .. 3.2 .. 2.4 .. 3.2 .. 3.4 .. ..
Incidence rate of occupational
injuries, non-fatalities per 100,000
employed persons 1399 .. 842 968 .. .. .. 695 .. 615 .. 565 .. 484 .. 426 .. ..
Agriculture .. .. .. .. .. .. .. .. .. .. .. 1539 .. 1313 .. 1349 .. ..
Industry 2308 .. 1406 1553 .. .. .. 1263 .. 1136 .. 1001 .. 871 .. 750 .. ..
Services 578 .. 380 507 .. .. .. 346 .. 338 .. 276 .. 236 .. 222 .. .... .. .. .. ..
Permanent incapacity 10 .. 13 5 .. .. .. 6 .. 5 .. 8 .. 4 .. 9 .. ..
Temporary incapacity 1390 .. 829 962 .. .. .. 689 .. 609 .. 557 .. 480 .. 456 .. ..
Average days lost due
to temporary incapacity cases 7.8 .. 15.1 6.8 .. .. .. 6.9 .. 7.0 .. 8.4 .. 5.4 .. 6.5 .. ..
Agriculture .. .. .. .. .. .. .. .. .. .. .. 5.4 .. 4.7 .. 5.8 .. ..
Industry 7.5 .. 17.0 6.3 .. .. .. 7.3 .. 7.3 .. 8.7 .. 5.3 .. 6.5 .. ..
Services 8.8 .. 9.1 8.1 .. .. .. 6.0 .. 6.3 .. 8.8 .. 5.9 .. 6.7 .. ..
Incidence rate of occupational
diseases, per 100,000 employed
persons .. .. .. 2322 .. .. .. 1619 .. 2510 .. 2359 .. 4073 .. 3031 .. ..
Agriculture .. .. .. .. .. .. .. .. .. .. .. 1712 .. 2298 .. 3728 .. ..
Industry .. .. .. 3670 .. .. .. 2455 .. 4288 .. 3072 .. 5317 .. 3418 .. ..
Services .. .. .. 1262 .. .. .. 1107 .. 1568 .. 2043 .. 3616 .. 2808 .. ..
Incidence rate of tuberculosis,
per 100,000 employed persons .. .. .. .. .. .. .. .. .. 102 .. 124 .. 87 .. 80 .. ..
Agriculture .. .. .. .. .. .. .. .. .. .. .. 348 .. 49 .. 145 .. ..
Industry .. .. .. .. .. .. .. .. .. 164 .. 153 .. 147 .. 113 .. ..
Services .. .. .. .. .. .. .. .. .. 69 .. 94 .. 62 .. 60 .. ..
Labor inspectors per 100,000
employees in private
establishments 2.4 2.2 2.1 .. 1.7 .. 1.6 .. .. 1.4 1.5 1.6 1.7 1.3 2.7 3.0 2.8 2.8
Notes: 1. Data on occupational injuries and diseases were collected through a survey of establishments employing 20 or more workers (before 2012, non-agricultural
establishments only). The survey coverage excludes public administration and defense, compulsory social security; public education and health;
and extra-territorial organizations and bodies.
2. Annualized data for 2014 from the Labor Force Survey is the average of estimates for April, July and October survey rounds. The estimates for these rounds exclude data
for Leyte province only while that of January exclude Region VIII.
3. Annualized data for 2015 from the Labor Force Survey is the average of estimates for January, April, July and October survey rounds. The estimates for these rounds exclude
data for Leyte province only. The use of the four survey rounds that exclude Leyte was based on the results of the referendum conducted among members of the Inter-Agency
Committee on Labor and Productivity Statistics.
Sources: Philippine Statistics Authority, BLES Integrated Survey/Occupational Injuries Survey/Integrated Survey on Labor and Employment; Labor Force Survey
and Department of Labor and Employment, Bureau of Working Conditions.
Date updated: 9/24/2018

Table 9. Safe work environment
Decent Work Indicator and
Underlying Data1996 1997 2000 2001 2002 2003 2004 2005 2006 2007 2008 2009 2010 2011 2012 2013 2014 2015 2016 2017
Incidence rate of occupational
injuries, fatalities per 100,000
employed persons .. .. 9.5 .. 11.8 7.1 .. .. .. 4.0 .. 3.9 .. 4.4 .. 6.4 .. 3.8 .. ..
Agriculture .. .. .. .. .. .. .. .. .. .. .. .. .. 9.3 .. 48.8 .. 10.9 .. ..
Industry .. .. 9.3 .. 11.0 5.5 .. .. .. 7.1 .. 5.4 .. 7.6 .. 6.3 .. 3.8 .. ..
Services .. .. 9.7 .. 12.5 8.4 .. .. .. 2.0 .. 3.2 .. 2.4 .. 3.2 .. 3.4 .. ..
Total cases of occupational
injuries, fatal1
.. .. 178 .. 302 170 .. .. .. 116 .. 113 .. 161 .. 270 .. 156 .. ..
Agriculture .. .. .. .. .. .. .. .. .. .. .. .. .. 15 .. 102 .. 15 .. ..
Industry .. .. 83 .. 126 58 .. .. .. 79 .. 54 .. 89 .. 82 .. 50 .. ..
Services .. .. 96 .. 176 112 .. .. .. 36 .. 59 .. 56 .. 86 .. 91 .. ..
Total employed (000) .. .. 1879 .. 2551 2386 .. .. .. 2918 .. 2864 .. 3624 .. 4218 .. 4156 .. ..
Agriculture .. .. .. .. .. .. .. .. .. .. .. .. .. 161 .. 209 .. 138 .. ..
Industry .. .. 892 .. 1148 1051 .. .. .. 1109 .. 992 .. 1164 .. 1,296 .. 1313 .. ..
Services .. .. 987 .. 1403 1335 .. .. .. 1808 .. 1872 .. 2299 .. 2,712 .. 2705 .. ..
Note: See Metadata of Statistical Indicators on Decent Work for definitions and other information.
1 Sample data are estimated by application of the raising factor. Thus, details may not add up to totals due to rounding of estimates.
Source: Philippine Statistics Authority, BLES Integrated Survey/Occupational Injuries Survey/Integrated Survey on Labor and Employment.
Table 9. Safe work environment
Decent Work Indicator and
Underlying Data1996 1997 2000 2001 2002 2003 2004 2005 2006 2007 2008 2009 2010 2011 2012 2013 2014 2015 2016 2017
Incidence rate of occupational
injuries, non-fatalities per
100,000 employed persons .. .. 1399 .. 842 968 .. .. .. 695 .. 615 .. 565 .. 484 .. 426 .. ..
Agriculture .. .. .. .. .. .. .. .. .. .. .. .. .. 1539 .. 1313 .. 1349 .. ..
Industry .. .. 2308 .. 1406 1553 .. .. .. 1263 .. 1136 .. 1001 .. 871 .. 750 .. ..
Services .. .. 578 .. 380 507 .. .. .. 346 .. 338 .. 276 .. 236 .. 222 .. .... ..
Permanent incapacity .. .. 10 .. 13 5 .. .. .. 6 .. 5 .. 8 .. 4 .. 9 .. ..
Temporary incapacity .. .. 1390 .. 829 962 .. .. .. 689 .. 609 .. 557 .. 480 .. 456 .. ..
Total cases of occupational
injuries, non-fatal1
.. .. 26289 .. 21477 23095 .. .. .. 20270 .. 17601 .. 20474 .. 20432 .. 17703 .. ..
Agriculture .. .. .. .. .. .. .. .. .. .. .. .. .. 2477 .. 2744 .. 1862 .. ..
Industry .. .. 20583 .. 16143 16324 .. .. .. 14009 .. 11272 .. 11652 .. 11288 .. 9849 .. ..
Services .. .. 5706 .. 5335 6772 .. .. .. 6260 .. 6328 .. 6346 .. 6400 .. 5992 .. ..
Permanent incapacity .. .. 179 .. 321 131 .. .. .. 162 .. 154 .. 289 .. 175 .. 358 .. ..
Temporary incapacity .. .. 26110 .. 21156 22964 .. .. .. 20109 .. 17447 .. 20185 .. 20257 .. 17346 .. ..
Total employed (000) .. .. 1879 .. 2551 2386 .. .. .. 2918 .. 2864 .. 3624 .. 4218 .. 4156 .. ..
Agriculture .. .. .. .. .. .. .. .. .. .. .. .. .. 161 .. 209 .. 138 .. ..
Industry .. .. 892 .. 1148 1051 .. .. .. 1109 .. 992 .. 1164 .. 1296 .. 1313 .. ..
Services .. .. 987 .. 1403 1335 .. .. .. 1808 .. 1872 .. 2299 .. 2712 .. 2705 .. ..
Note: See Metadata of Statistical Indicators on Decent Work for definitions and other information.
1 Sample data are estimated by application of the raising factor. Thus, details may not add up to totals due to rounding of estimates.
Source: Philippine Statistics Authority, BLES Integrated Survey/Occupational Injuries Survey/Integrated Survey on Labor and Employment.
Occupational injury rate, fatal
Occupational injury rate, non-fatal

Table 9. Safe work environment
Decent Work Indicator and
Underlying Data2000 2001 2002 2003 2004 2005 2006 2007 2008 2009 2010 2011 2012 2013 2014 2015 2016 2017
Average days lost due to
temporary incapacity cases 7.8 .. 15.1 6.8 .. .. .. 6.9 .. 7.0 .. 8.4 .. 5.4 .. 6.5 .. ..
Agriculture .. .. .. .. .. .. .. .. .. .. .. 5.4 .. 4.7 .. 5.8 .. ..
Industry 7.5 .. 17.0 6.3 .. .. .. 7.3 .. 7.3 .. 8.7 .. 5.3 .. 6.5 .. ..
Services 8.8 .. 9.1 8.1 .. .. .. 6.0 .. 6.3 .. 8.8 .. 5.9 .. 6.7 .. ..
Total days lost of temporary
incapacity cases1
202902 .. 318532 156019 .. .. .. 139191 .. 121683 .. 168830 .. 109761 .. 112564 .. ..
Agriculture .. .. .. .. .. .. .. .. .. .. .. 13431 .. 12776 .. 9971 .. ..
Industry 153406 .. 270621 101805 .. .. .. 101489 .. 82052 .. 100656 .. 59965 .. 63435 .. ..
Services 49496 .. 47911 54213 .. .. .. 37702 .. 39632 .. 54746 .. 37020 .. 39157 .. ..
Total cases of temporary
incapacity1
26110 .. 21156 22964 .. .. .. 20109 .. 17447 .. 20185 .. 20257 .. 17346 .. ..
Agriculture .. .. .. .. .. .. .. .. .. .. .. 2467 .. 2741 .. 1731 .. ..
Industry 20478 .. 15899 16242 .. .. .. 13870 .. 11167 .. 11511 .. 11213 .. 9764 .. ..
Services 5629 .. 5256 6723 .. .. .. 6237 .. 6279 .. 6208 .. 6303 .. 5851 .. ..
Note: See Metadata of Statistical Indicators on Decent Work for definitions and other information.
1 Sample data are estimated by application of the raising factor. Thus, details may not add up to totals due to rounding of estimates.
Source: Philippine Statistics Authority, BLES Integrated Survey/Occupational Injuries Survey/Integrated Survey on Labor and Employment.
Average days lost due to temporary incapacity cases

Table 9. Safe work environment
Decent Work Indicator and
Underlying Data2000 2001 2002 2003 2004 2005 2006 2007 2008 2009 2010 2011 2012 2013 2014 2015 2016 2017
Incidence rate of occupational
diseases, per 100,000 employed
persons .. .. .. 2322 .. .. .. 1619 .. 2510 .. 2359 .. 4073 .. 3031 .. ..
Agriculture .. .. .. .. .. .. .. .. .. .. .. 1712 .. 2298 .. 3728 .. ..
Industry .. .. .. 3670 .. .. .. 2455 .. 4288 .. 3072 .. 5317 .. 3418 .. ..
Services .. .. .. 1262 .. .. .. 1107 .. 1568 .. 2043 .. 3616 .. 2808 .. ..
Total cases of occupational
diseases1
.. .. .. 55413 .. .. .. 47235 .. 71894 .. 85483 .. 171787 .. 125973 .. ..
Agriculture .. .. .. .. .. .. .. .. .. .. .. 2757 .. 4803 .. 5145 .. ..
Industry .. .. .. 38567 .. .. .. 27231 .. 42539 .. 35755 .. 68914 .. 44883 .. ..
Services .. .. .. 16847 .. .. .. 20006 .. 29355 .. 46971 .. 98073 .. 75945 .. ..
Total employed (000) .. .. .. 2386 .. .. .. 2918 .. 2864 .. 3624 .. 4218 .. 4156 .. ..
Agriculture .. .. .. .. .. .. .. .. .. .. .. 161 .. 209 .. 138 .. ..
Industry .. .. .. 1051 .. .. .. 1109 .. 992 .. 1164 .. 1296 .. 1313 .. ..
Services .. .. .. 1335 .. .. .. 1808 .. 1872 .. 2299 .. 2712 .. 2705 .. ..
Note: See Metadata of Statistical Indicators on Decent Work for definitions and other information.
1 Sample data are estimated by application of the raising factor. Thus, details may not add up to totals due to rounding of estimates.
Source: Philippine Statistics Authority, BLES Integrated Survey/Integrated Survey on Labor and Employment.
Table 9. Safe work environment
Decent Work Indicator and
Underlying Data2000 2001 2002 2003 2004 2005 2006 2007 2008 2009 2010 2011 2012 2013 2014 2015 2016 2017
Incidence rate of tuberculosis,
per 100,000 employed persons .. .. .. .. .. .. .. .. .. 102 .. 124 .. 87 .. 80 .. ..
Agriculture .. .. .. .. .. .. .. .. .. .. .. 348 .. 49 .. 145 .. ..
Industry .. .. .. .. .. .. .. .. .. 164 .. 153 .. 147 .. 113 .. ..
Services .. .. .. .. .. .. .. .. .. 69 .. 94 .. 62 .. 60 .. ..
Total cases of tuberculosis1
.. .. .. .. .. .. .. .. .. 2921 .. 4505 .. 3670 .. 3320 .. ..
Agriculture .. .. .. .. .. .. .. .. .. .. .. 560 .. 103 .. 200 .. ..
Industry .. .. .. .. .. .. .. .. .. 1625 .. 1781 .. 1901 .. 1484 .. ..
Services .. .. .. .. .. .. .. .. .. 1295 .. 2164 .. 1671 .. 1636 .. ..
Total employed (000) .. .. .. 2386 .. .. .. 2918 .. 2864 .. 3624 .. 4218 .. 4156 .. ..
Agriculture .. .. .. .. .. .. .. .. .. .. .. 161 .. 209 .. 138 .. ..
Industry .. .. .. 1051 .. .. .. 1109 .. 992 .. 1164 .. 1296 .. 1313 .. ..
Services .. .. .. 1335 .. .. .. 1808 .. 1872 .. 2299 .. 2712 .. 2705 .. ..
Note: See Metadata of Statistical Indicators on Decent Work for definitions and other information.
1 Sample data are estimated by application of the raising factor. Thus, details may not add up to totals due to rounding of estimates.
Source: Philippine Statistics Authority, BLES Integrated Survey/Integrated Survey on Labor and Employment.
Incidence rate of occupational diseases
Incidence rate of tuberculosis

Table 9. Safe work environment
Decent Work Indicator and
Underlying Data2000 2001 2002 2003 2004 2005 2006 2007 2008 2009 2010 2011 2012 2013 2014 2015 2016 2017
Labor inspectors per 100,000
employees in private
establishments 2.4 2.2 2.1 .. 1.7 .. 1.6 .. .. 1.4 1.5 1.6 1.7 1.3 2.7 3.0 2.8 2.8
Labor inspectors 234 224 221 .. 214 .. 198 .. .. 196 219 254 271 228 462 536 553 562
Total employees in private
establishments (000) 9860 10366 10546 11294 12552 12261 12423 12950 13283 13824 14565 15431 16377 17114 17319 17669 19694 19776
Notes: 1. Annualized data for 2014 from the Labor Force Survey is the average of estimates for April, July and October survey rounds. The estimates for these rounds exclude data for Leyte province only while that of January exclude Region VIII.
2. Annualized data for 2015 from the Labor Force Survey is the average of estimates for January, April, July and October survey rounds. The estimates for these rounds exclude data for Leyte province only. The use of the
four survey rounds that exclude Leyte was based on the results of the referendum conducted among members of the Inter-Agency Committee on Labor and Productivity Statistics.
3. See Metadata of Statistical Indicators on Decent Work for definitions and other information.
Source: Department of Labor and Employment, Bureau of Working Conditions, Administrative records (labor inspectors); and Philippine Statistics Authority, Labor Force Survey.
Labor inspectors per 100,000 employees in private establishments

Element 10
Social Security

Table 10. Social securityDecent Work Indicator 2001 2002 2003 2004 2005 2006 2007 2008 2009 2010 2011 2012 2013 2014 2014 2016 2017
Share of economically active populationcontributing to a pension scheme1, in % 25.6 25.4 24.7 24.2 25.0 26.0 26.3 27.3 26.8 27.7 27.8 29.4 30.6 32.0 34.3 35.2 38.4 Social Security System1 21.0 21.0 20.9 20.6 21.3 22.2 22.5 23.6 23.2 24.2 24.4 26.0 27.1 28.4 30.6 31.5 34.4 Government Service Insurance System 4.6 4.4 3.8 3.7 3.7 3.8 3.7 3.7 3.6 3.5 3.5 3.5 3.5 3.6 3.7 3.7 4.0Share of population aged 60 and above benefiting from retirement/old age pension 2, in % 8.5 8.8 9.7 11.0 11.3 12.7 13.3 14.1 14.7 15.2 .. 16.3 17.5 19.0 20.5 19.1 19.6 Social Security System 6.7 6.8 7.7 8.6 9.0 10.2 10.7 11.1 11.6 12.1 12.8 12.7 13.9 14.9 16.4 15.2 15.9 Government Service Insurance System 1.9 1.9 2.0 2.4 2.3 2.6 2.7 3.1 3.1 3.2 .. 3.6 3.6 4.2 4.1 3.9 3.8Average monthly pensions, in PhP Social Security System Social security Retirement 2934 2953 2929 2993 2967 3011 3440 3623 3572 3524 3520 3707 3577 3792 3780 4425 5123 Disability 2737 2759 2851 2996 2982 2952 3327 3338 3289 3261 3304 3536 3467 3633 3713 3938 5000 Survivorship 2317 2331 2318 2603 2395 2392 2705 2897 2852 2839 2852 3144 2920 3021 3689 3466 4457 Employees' compensation Disability 3748 3845 4066 4324 4073 3987 4108 4074 4085 4082 4189 4329 4153 4517 4624 4623 4642 Survivorship 3553 3547 3550 3990 3658 3593 3539 3635 3587 3589 3602 4017 3684 4151 4820 4277 4201 Government Service Insurance System Social security Retirement 10754 12158 14208 13418 14413 13556 13851 13602 13499 13589 .. 17908 21526 18427 18682 17231 18525 Disability 11230 4316 2237 2764 1580 2168 2150 1044 3327 3730 .. .. .. 3934 7115 4630 4917 Survivorship 3382 3005 2767 2680 2753 2805 3650 2748 3031 3508 .. 3061 3664 3765 2908 4030 3934 Employees' compensation .. .. .. .. .. .. .. .. .. .. .. 1023 685 .. 984 2551 2443Social security benefits3, % of GDP 1.9 1.9 1.9 1.8 1.7 1.7 1.7 1.6 1.6 1.5 1.8 1.8 1.5 1.7 1.9 2.1 1.9Health-care expenditures not financedout of pocket by private households4, % of total health-care expenditures 56.1 53.2 53.1 53.1 48.1 46.0 45.0 43.3 46.7 47.5 42.3 42.8 43.7 43.3 43.9 44.4 43.7Estimated share of population covered by National Health InsuranceProgram, in % 48.0 54.0 52.0 83.0 64.0 59.0 73.0 76.0 86.0 74.0 82.0 84.0 79.0 87.0 92.0 91.0 93.0
Notes: 1.Annualized data for 2014 from the Labor Force Survey is the average of estimates for April, July and October survey rounds. The estimates for these rounds exclude data for Leyte province only while that of January exclude Region VIII. 2. Annualized data for 2015 from the Labor Force Survey is the average of estimates for January, April, July and October survey rounds. The estimates for these rounds exclude data for Leyte province only. The use of the four survey rounds that exclude Leyte was based on the results of the referendum conducted among members of Inter-Agancy Committee on Labor and Productivity Statistics.1 SSS data on Overseas Filipino Workers excluded in the computation as they are not counted as part of the country's economically active population or labor force.2 Some pensioners may no longer be Philippine residents and as such not counted in the population denominator. 3 Government Social Security Retirement includes Monthly Pension.4 Data from 2009 based on the updated 1993/2008 SNA. Thus, data not strictly comparable with earlier years.
Sources: Social Security System (SSS, for private sector); Government Service Insurance System (GSIS, for public sector); Philippine Statistics Authority, Labor Force
Survey/National Accounts of the Philippines/Philippine National Health Accounts based on System of Health Accounts 2011; and Philippine Health Insurance Corporation.Date updated: 02/1/2019
5 Data from 2005 based on revised estimation methodologies and improved coverage. Thus, data not strictly comparable with earlier years.

Table 10. Social security
Decent Work Indicator and Underlying Data 1995 1996 1997 1998 1999 2000 2001 2002 2003 2004 2005 2006 2007 2008 2009 2010 2011 2012 2013 2014 2015 2016 2017
Share of economically active population contributing to a pension scheme1 (%) .. .. .. .. .. 27.0 25.6 25.4 24.7 24.2 25.0 26.0 26.3 27.3 26.8 27.7 27.8 29.4 30.6 32.0 34.3 35.2 38.4 SSS
1 .. .. .. .. .. 22.2 21.0 21.0 20.9 20.6 21.3 22.2 22.5 23.6 23.2 24.2 24.4 26.0 27.1 28.4 30.6 31.5 34.4
GSIS 5.6 5.3 5.3 5.1 5.2 4.8 4.6 4.4 3.8 3.7 3.7 3.8 3.7 3.7 3.6 3.5 3.5 3.5 3.5 3.6 3.7 3.7 4.0
Contributing members (000) .. .. .. .. .. 8443 8481 8715 8636 8808 8939 9350 9679 10227 10380 11030 11412 12223 12937 13675 14660 15786 16999 SSS .. .. .. .. .. 6951 6985 7215 7326 7497 7629 8001 8323 8862 9012 9659 10024 10824 11498 12193 13134 14165 15287
Employees .. .. .. .. .. 5519 5491 5587 5678 5875 6034 6303 6564 6851 6845 7339 7666 8194 8621 9132 9749 10462 11137
Domestic workers * * 1 8 17 20 24 28 32 26 35 34 33 49 60 66 68 71
Self-employed .. .. .. .. .. 1007 969 923 826 719 693 662 632 664 658 690 687 716 777 859 979 1057 1137
Voluntary2 .. .. .. .. .. 336 437 612 714 774 770 870 941 1127 1265 1348 1363 1557 1655 1713 1877 2070 2356
Overseas Filipino Workers .. .. .. .. .. 89 88 93 99 112 112 141 158 189 218 248 273 325 396 430 463 509 585
GSIS 1586 1584 1537 1528 1598 1492 1496 1500 1310 1311 1310 1349 1356 1365 1368 1371 1388 1399 1439 1482 1526 1621 1712
Total labor force3 (000) 28380 29733 28901 29674 30759 30911 32809 33936 34571 35862 35286 35464 36213 36805 37892 38893 40006 40426 41022 41379 41342 43361 42775Notes: 1. Annualized data for 2014 from the Labor Force Survey is the average of estimates for April, July and October survey rounds. The estimates for these rounds exclude data for Leyte province only while that of January exclude Region VIII. 2. Annualized data for 2015 from the Labor Force Survey is the average of estimates for January, April, July and October survey rounds. The estimates for these rounds exclude data for Leyte province only. The use of the four survey rounds that exclude Leyte was based on the results of the referendum conducted among members of the Inter-Agency Committee on Labor and Productivity Statistics. 3. See Metadata of Statistical Indicators on Decent Work for definitions and other information.1 SSS data on Overseas Filipino Workers excluded in the computation as they are not counted as part of the country's economically active population/labor force.2 Refers to separated workers and non-working spouses.3 2005 data refers to average of April, July and October as definition of unemployment revised beginning April 2005 to include availability criterion in conformance with international standard.* Less than half the unit used.Sources: Social Security System (SSS, for private sector); Government Service Insurance System (GSIS, for public sector); and Philippine Statistics Authority, Labor Force Survey.
Share of economically active population contributing to a pension scheme

Table 10. Social security
Decent Work Indicator and Underlying Data 1995 1996 1997 1998 1999 2000 2001 2002 2003 2004 2005 2006 2007 2008 2009 2010 2011 2012 2013 2014 2015 2016 2017
Share of population aged 60 and above benefiting from retirement/old age pension1 (%) .. .. .. .. .. 8.3 8.5 8.8 9.7 11.0 11.3 12.7 13.3 14.1 14.7 15.2 .. 16.3 17.5 19.0 20.5 19.1 19.6 SSS 5.2 5.6 6.3 6.4 6.3 6.5 6.7 6.8 7.7 8.6 9.0 10.2 10.7 11.1 11.6 12.1 12.8 12.7 13.9 14.9 16.4 15.2 15.9
GSIS .. .. .. .. .. 1.9 1.9 1.9 2.0 2.4 2.3 2.6 2.7 3.1 3.1 3.2 .. 3.6 3.6 4.2 4.1 3.9 3.8
Total population aged 60 and above benefiting from retirement/old age pension1 .. .. .. .. .. 463710 495854 538204 573806 605727 635515 690055 746069 821694 886290 955423 .. 1070783 1178759 1283520 1402699 1539527 1666414 SSS 248847 270618 292852 317799 333945 358826 387756 418936 453701 475220 507542 550374 596798 642843 697805 757317 824009 833528 937616 1001446 1120174 1223682 1345287
GSIS .. .. .. .. .. 104884 108098 119268 120105 130507 127973 139681 149271 178851 188485 198106 .. 237255 241143 282074 282525 315845 321127
Total household population 60 years old and over (000) 4820 4827 4655 4985 5305 5557 5821 6123 5906 5498 5641 5415 5598 5817 6025 6282 6452 6575 6726 6739 6840 8068 8486Notes: 1. Annualized data for 2014 from the Labor Force Survey is the average of estimates for April, July and October survey rounds. The estimates for these rounds exclude data for Leyte province only while that of January exclude Region VIII. 2. Annualized data for 2015 from the Labor Force Survey is the average of estimates for January, April, July and October survey rounds. The estimates for these rounds exclude data for Leyte province only. The use of the four survey rounds that exclude Leyte was based on the results of the referendum conducted among members of the Inter-Agency Committee on Labor and Productivity Statistics. 3. See Metadata of Statistical Indicators on Decent Work for definitions and other information.1 Some pensioners may no longer be Philippine residents and as such not counted in the population denominator. Sources: Social Security System (SSS, for private sector); Government Service Insurance System (GSIS, for public sector); and Philippine Statistics Authority, Labor Force Survey.
Share of population aged 60 and above benefiting from retirement/old age pension

Table 10. Social securityAverage monthly pensions
Decent Work Indicator and Underlying Data 1995 1996 1997 1998 1999 2000 2001 2002 2003 2004 2005 2006 2007 2008 2009 2010 2011 2012 2013 2014 2015 2016 2017
Average monthly pension, SSS (PhP)Social security
Retirement 1745 1781 1919 2222 2470 2843 2934 2953 2929 2993 2967 3011 3440 3623 3572 3524 3520 3707 3577 3792 3780 4425 5123
Disability 1669 1813 2044 2440 2605 2642 2737 2759 2851 2996 2982 2952 3327 3338 3289 3261 3304 3536 3467 3633 3713 3938 5000
Death (Survivorship) 1527 1568 1676 1846 1981 2171 2317 2331 2318 2603 2395 2392 2705 2897 2852 2839 2852 3144 2920 3021 3689 3466 4457
Employees compensation
Disability 5286 3030 3213 3561 3613 3762 3748 3845 4066 4324 4073 3987 4108 4074 4085 4082 4189 4329 4153 4517 4624 4623 4642
Death (Survivorship) 3042 2567 2778 2936 3381 3328 3553 3547 3550 3990 3658 3593 3539 3635 3587 3589 3602 4017 3684 4151 4820 4277 4201
Pension disbursements(PhP million) 11803 12884 14704 17562 20153 24053 27220 29607 31653 33578 35020 38025 46449 52332 55396 59075 63624 66296 69494 77705 84439 102774 134420Social security
Retirement 5210 5785 6744 8473 9899 12241 13650 14845 15946 17066 18069 19886 24638 27952 29910 32023 34804 37079 40245 45566 50804 64978 82704
Disability 1780 1847 1874 1830 1809 1899 2103 2218 2190 2138 2053 2036 2300 2337 2320 2386 2495 2504 2387 2585 2740 3150 4497
Death (Survivorship) 4286 4808 5577 6697 7774 9219 10694 11727 12682 13538 14083 15279 18686 21201 22320 23810 25462 25886 26056 28643 30034 33773 46349
Employees compensation
Disability 123 73 78 80 79 86 95 107 107 99 93 92 91 88 87 87 85 80 75 80 75 77 85
Death (Survivorship) 404 371 430 481 592 609 678 709 729 737 722 732 734 754 758 769 777 747 732 832 785 796 785
Pensioners 584566 625082 661412 698155 735268 789830 854422 924126 993039 985456 1073336 1159005 1249191 1330223 1428059 1536807 1650569 1595741 1756663Social security
Retirement 248847 270618 292852 317799 333945 358826 387756 418936 453701 475220 507542 550374 596798 642843 697805 757317 824009 833528 937616 1001446 1120174 1223682 1345287
Disability 88872 84897 76395 62494 57868 59903 64033 66985 64014 59464 57376 57476 57614 58348 58788 60970 62921 59014 57381 59292 61496 66664 74946
Death (Survivorship) 233839 255517 277243 302336 327041 353948 384619 419230 456016 433470 490068 532253 575647 609945 652080 698888 743974 686164 743604 789984 678486 812002 866547
Employees compensation
Disability 1939 2008 2023 1872 1822 1905 2112 2319 2193 1908 1903 1923 1846 1800 1775 1776 1691 1540 1505 1476 1352 1388 1526
Death (Survivorship) 11069 12042 12899 13654 14592 15248 15902 16656 17115 15394 16447 16979 17286 17287 17611 17856 17974 15495 16557 16703 13577 15510 15573

Table 10. Social securityAverage monthly pensions
Decent Work Indicator and Underlying Data 1995 1996 1997 1998 1999 2000 2001 2002 2003 2004 2005 2006 2007 2008 2009 2010 2011 2012 2013 2014 2015 2016 2017
Average monthly pension, GSIS (PhP)Social security
Retirement .. .. .. .. .. 9955 10754 12158 14208 13418 14413 13556 13851 13602 13499 13589 .. 17908 21526 18427 18682 17231 18525
Disability .. .. .. .. .. 8994 11230 4316 2237 2764 1580 2168 2150 1044 3327 3730 .. .. .. 3934 7115 4630 4917
Death (Survivorship) .. .. .. .. .. 2211 3382 3005 2767 2680 2753 2805 3650 2748 3031 3508 .. 3061 3664 3765 2908 4030 3934
Employees compensation .. .. .. .. .. .. .. .. .. .. .. .. .. .. .. .. .. 1023 685 .. 984 2551 2443
Pension disbursements(PhP million)Social security
Retirement 1 .. .. .. .. .. 12530 13950 17401 20478 21014 22134 22723 24810 29192 30532 32304 .. 50985 62289 62375 63339 65307 71387
Disability .. .. .. .. .. 181 278 137 75 100 58 81 79 42 120 146 .. .. .. 172 196 233 231
Death (Survivorship) .. .. .. .. .. 1476 2493 2478 2348 2529 2733 2757 2834 2685 3183 3869 .. 4129 4952 5658 5988 6630 7013
Cash gift .. .. .. .. .. .. .. .. .. .. .. .. .. .. .. .. .. .. .. 1905 2600 2089 2265
Employees compensation .. .. .. .. .. 729 768 763 532 556 560 174 66 47 65 31 .. 19 39 160 177 223 221
Pensioners Social security
Retirement .. .. .. .. .. 104884 108098 119268 120105 130507 127973 139681 149271 178851 188485 198106 .. 237255 241143 282074 282525 315845 321127
Disability .. .. .. .. .. 1677 2063 2645 2794 3015 3060 3114 3062 3354 3006 3262 .. .. .. 3635 3685 4194 3915
Death (Survivorship) .. .. .. .. .. 55639 61435 68720 70702 78646 82717 81897 64700 81418 87520 91921 .. 112430 112614 125227 130362 137091 148548
Employees compensation .. .. .. .. .. .. .. .. .. .. .. .. .. .. .. .. .. 1583 4724 .. 11669 7286 7539
Note: See Metadata of Statistical Indicators on Decent Work for definitions and other information1 Include monthly pensions.Sources: Social Security System (SSS, for private sector); Government Service Insurance System (GSIS, for public sector).

Table 10. Social security
Decent Work Indicator and Underlying Data 1995 1996 1997 1998 1999 2000 2001 2002 2003 2004 2005 2006 2007 2008 2009 2010 2011 2012 2013 2014 2015 2016 2017
Social security benefits1, % of GDP 1.4 1.3 1.4 1.5 1.6 1.7 1.9 1.9 1.9 1.8 1.7 1.7 1.7 1.6 1.6 1.5 1.8 1.8 1.5 1.7 1.9 2.1 1.9Total social security benefits1
at current prices (PhP million) 26205 28793 33238 38846 48855 58283 68850 74162 80527 88365 94647 99897 112101 121879 129884 139121 170005 189994 177371 215947 249580 302713 296212
Gross Domestic Product, at current prices1 (PhP million) 1905951 2171922 2426743 2665060 2976905 3354727 3631474 3963873 4316402 4871555 5444039 6031164 6648619 7409371 8026143 9003480 9708332 10561089 11538410 12645271 13322041 14480720 15797503
Note: See Metadata of Statistical Indicators on Decent Work for definitions and other information.1 Data from 2009 based on the updated 1993/2008 SNA. Thus, data not strictly comparable with earlier years.Source: Philippine Statistics Authority, National Accounts of the Philippines.
Table 10. Social security
Decent Work Indicator and Underlying Data 1995 1996 1997 1998 1999 2000 2001 2002 2003 2004 2005 2006 2007 2008 2009 2010 2011 2012 2013 2014 2015 2016 2017
Health-care expenditures not financed out of pocket by private households1, % of total health-care expenditures 50.0 51.7 53.5 53.7 56.7 59.5 56.1 53.2 53.1 53.1 48.1 46.0 45.0 43.3 46.7 47.5 42.3 42.8 43.7 43.3 43.9 44.4 43.7Total health-care expenditures not financed out of pocket by private households1 (PhP million) 32862 39809 47005 50717 59418 68376 65468 62369 78446 87771 106826 114104 121055 130927 159794 180843 175995 201689 229803 231043 260284 292520 311593
Total health-care expenditures1 (PhP million) 65742 76927 87831 94454 104827 114911 116602 117183 147683 165295 222219 247815 268928 302043 342164 380826 416480 471108 526342 534008 592768 659324 712341
Note: See Metadata of Statistical Indicators on Decent Work for definitions and other information.1 Data from 2005 based on revised estimation methodologies and improved coverage. Thus, data not strictly comparable with earlier years.Source: Philippine Statistics Authority, Philippine National Health Accounts based on System of Health Accounts 2011.
Social security benefits, % of GDP
Health-care expenditures not financed out of pocket by private households

Table 10. Social security
Decent Work Indicator and Underlying Data 1995 1996 1997 1998 1999 2000 2001 2002 2003 2004 2005 2006 2007 2008 2009 2010 2011 2012 2013
Estimated share of population covered by National Health Insurance Program (%) .. .. .. .. .. 38.0 48.0 54.0 52.0 83.0 64.0 59.0 73.0 76.0 58.0 74.0 82.0 84.0 79.0Estimated beneficiaries(members and dependents) of national health insuranceprogram (000) .. .. .. .. .. 29597 37460 43565 42401 69506 54599 51035 64467 68669 53392 69985 78386 80919 76897Employed .. .. .. .. .. 26093 29715 29775 30787 31422 30681 23268 32279 30925 20687 29214 24001 25939 26348
Government .. .. .. .. .. 6967 8948 10199 7632 7866 7493 4314 7420 7740 5597 6581 5904 6432 5914
Private .. .. .. .. .. 19126 20767 19576 23155 23556 23188 18954 24858 23185 15090 22633 18097 19507 20435
Individually-paying .. .. .. .. .. 1908 4182 6755 2744 6563 8471 5898 11069 12509 7780 10920 9905 11818 11991
Sponsored program .. .. .. .. .. 1596 2847 6304 8741 31291 12440 17956 13635 16491 19752 22104 38449 36679 31378
Local government units .. .. .. .. .. .. .. .. .. .. .. .. .. .. .. 22104 19549 16250 10366
National Household Targetting
System for Poverty Reduction .. .. .. .. .. .. .. .. .. .. .. .. .. .. .. .. 18901 20429 21012
Lifetime program .. .. .. .. .. 0 716 730 130 230 334 435 572 685 751 846 945 1254 1318
Overseas workers program .. .. .. .. .. 0 0 0 0 0 2673 3478 6912 8059 4422 6900 5086 5230 5863
Total registered members (000) .. .. .. .. .. 7939 9328 10154 9976 15359 13419 16256 15850 16461 20182 22441 27916 28492 31267Employed .. .. .. .. .. 7161 7302 7042 7583 7636 8296 7846 8779 8234 8908 9812 10860 11640 12372
Government .. .. .. .. .. 1868 2011 2137 1645 1689 1846 1288 1781 1856 1902 1949 2010 2029 2073
Private .. .. .. .. .. 5293 5291 4905 5938 5947 6450 6558 6998 6379 7007 7863 8850 9611 10299
Individually-paying .. .. .. .. .. 431 930 1364 555 1329 1889 2013 2427 2723 3326 3748 4339 5056 5375
Sponsored program .. .. .. .. .. 347 619 1261 1762 6258 2492 4946 2721 3264 5382 6045 9574 8293 9611
Local government units .. .. .. .. .. .. .. .. .. .. .. .. .. .. .. .. 5331 3687 4454
National Household Targetting
System for Poverty Reduction .. .. .. .. .. .. .. .. .. .. .. .. .. .. .. .. 4242 4606 5157
Lifetime program .. .. .. .. .. .. 477 487 76 136 197 263 337 403 462 500 572 658 774
Overseas workers program .. .. .. .. .. .. .. .. .. .. 545 1187 1586 1837 2105 2337 2571 2845 3135
Note: See Metadata of Statistical Indicators on Decent Work for definitions and other information.Source: Philippine Health Insurance Corporation.
Estimated share of population covered by national health insurance program

Decent Work Indicator and Underlying Data 2014 2015 2016 2017
Estimated share of population covered by National Health Insurance Program (%) 87.0 92.0 91.0 93.0Estimated beneficiaries(members and dependents) of national health insuranceprogram (000) 86224 93445 93401 96974Members in the formal economy 27048 28319 29310 28856
Private 21226 22371 23305 23008
Government 5724 5837 5886 5724
Household help/Kasambahay 97 109 118 121
Enterprise owners and family drivers 1 2 2 3
Members in the informal economy 7385 8458 8168 22899
Migrant workers 1826 2080 1610 1316
Informal sector 4686 5373 5526 5747
Self-earning individuals 839 975 996 1036
Organized groups and others 34 30 34 36
Informal Economy Members w/o 3/6 contribution but
Entitled to Point of Service (POS) excluding Foreign
Nationals
- - - 14764
Indigents 43726 45407 43486 32030
Sponsored members 2117 2408 2778 2580
Senior citizens 4339 7123 7574 8473
Lifetime members 1610 1730 2084 2135
Total registered members (000) 36409 40502 41232 49584Members in the formal economy 13012 13869 14636 14904
Private 11003 11770 12465 12647
Government 1952 2035 2102 2186
Household help/Kasambahay 56 63 68 70
Enterprise owners and family drivers * 1 1 1
Members in the informal economy 3382 3425 3261 11078
Migrant workers 961 930 659 536
Informal sector 2024 2086 2177 2317
Self-earning individuals 382 394 409 436
Organized groups and others 16 14 14 15Informal Economy Members w/o 3/6 contribution but
Entitled to Point of Service (POS) excluding Foreign
Nationals 1
- - - 7774
Indigents 14707 15289 14642 14329
Sponsored members 848 1050 1218 1128
Senior citizens 3529 5868 6246 6899
Lifetime members 932 1002 1230 1246
Note: See Metadata of Statistical Indicators on Decent Work for definitions and other information.* Less than 1,000.1 IncludedSource: Philippine Health Insurance Corporation.
Table 10. Social securityEstimated share of population covered by national health insurance program

Element 11
Social Dialogue, Workers’ and
Employers’ Representation

Table 11. Social dialogue, workers' and employers' representation
Decent Work Indicator 2000 2001 2002 2003 2004 2005 2006 2007 2008 2009 2010 2011 2012 2013 2014 2015 2016 2017
Union density rate, in % .. .. .. 20.2 16.3 .. .. .. 12.5 .. 10.6 .. 9.9 .. 7.7 .. 6.5 ..
Men .. .. .. .. .. .. .. .. .. .. .. .. 10.5 .. 8.2 .. 7.4 ..
Women .. .. .. .. .. .. .. .. .. .. .. .. 9.0 .. 6.8 .. 5.3 ....
Agriculture .. .. .. .. .. .. .. .. .. .. .. .. 23.1 .. 13.3 .. 19.5 ..
Industry .. .. .. 22.7 20.1 .. .. .. 16.8 .. 15.7 .. 13.2 .. 11.2 .. 8.9 ..
Services .. .. .. 18.1 13.3 .. .. .. 9.9 .. 7.9 .. 7.2 .. 5.5 .. 4.7 ..
Union membership,
% distribution .. .. .. 100.0 100.0 .. 100.0 .. 100.0 .. 100.0 .. 100.0 .. 100.0 .. 100.0 ..
Men .. .. .. 68.9 64.6 .. 65.3 .. 63.0 .. 62.1 .. 63.9 .. 65.3 .. 65.0 ..
Women .. .. .. 31.1 35.4 .. 34.7 .. 37.0 .. 37.9 .. 36.1 .. 34.7 .. 35.0 ....
Agriculture .. .. .. .. .. .. .. .. .. .. .. .. 10.5 .. 9.4 .. 10.6 ..
Industry .. .. .. 50.9 54.0 .. 54.4 .. 50.5 .. 51.9 .. 43.9 .. 43.8 .. 42.0 ..
Services .. .. .. 49.1 46.0 .. 45.6 .. 49.5 .. 48.1 .. 45.6 .. 46.8 .. 47.3 ..
Collective bargaining coverage
rate, in % .. .. .. 19.7 17.3 .. .. .. 13.1 .. 10.9 .. 10.3 .. 8.1 .. 7.2 ..
Men .. .. .. .. .. .. .. .. .. .. .. .. 10.8 .. 8.8 .. 8.0 ..
Women .. .. .. .. .. .. .. .. .. .. .. .. 9.5 .. 7.1 .. 6.1 ..##### ##### #####
Agriculture .. .. .. .. .. .. .. .. .. .. .. .. 23.1 .. 14.4 .. 19.5 ..
Industry .. .. .. 23.2 21.1 .. .. .. 17.4 .. 15.9 .. 13.5 .. 12.1 .. 9.9 ..
Services .. .. .. 16.7 14.5 .. .. .. 10.5 .. 8.3 .. 7.6 .. 5.7 .. 5.3 .... .. .. 100.0 100.0 .. 100.0 .. 100.0 .. .. .. ..
Collective bargaining coverage,
% distribution .. .. .. 100.0 100.0 .. 100.0 .. 100.0 .. 100.0 .. 100.0 .. 100.0 .. 100.0 ..
Men .. .. .. .. .. .. 64.3 .. 62.4 .. 61.3 .. 63.2 .. 65.6 .. 63.9 ..
Women .. .. .. .. .. .. 35.7 .. 37.6 .. 38.7 .. 36.8 .. 34.2 .. 36.4 .... .. .. 100.0 100.0 .. .. .. 100.0 .. .. .. ..
Agriculture .. .. .. .. .. .. .. .. .. .. .. .. 10.2 .. 9.4 .. 9.6 ..
Industry .. .. .. 53.3 53.0 .. 55.3 .. 50.1 .. 50.9 .. 43.6 .. 44.7 .. 42.2 ..
Services .. .. .. 46.7 47.0 .. 44.7 .. 49.9 .. 49.1 .. 46.2 .. 45.8 .. 48.2 ..
Strikes and lockouts1
Number 60 43 36 38 25 26 12 6 5 4 8 2 3 1 2 5 15 9
Agriculture 2 0 0 3 1 1 1 0 1 1 1 0 1 0 0 0 0 3
Industry 36 32 22 25 16 21 7 4 3 3 5 1 0 1 1 3 9 3
Services 22 11 14 10 8 4 4 2 1 0 2 1 2 0 1 2 6 3
Rates of days not worked
per 1,000 employees in private
establishments 32.4 19.9 34.0 13.3 4.3 10.1 3.5 0.9 2.9 0.5 2.3 0.2 * 0.1 0.1 0.3 5.9 1.3
Agriculture 4.5 0.0 0.0 0.8 0.7 0.4 0.1 0.0 4.4 0.2 0.4 0.0 0.1 0.0 0.0 0.0 0.0 1.5
Industry 78.8 45.8 77.3 21.8 10.6 17.2 9.5 1.6 3.4 1.5 7.4 * 0.0 0.2 0.1 0.7 14.1 2.4
Services 11.1 10.2 18.5 13.4 1.7 9.6 1.1 1.0 1.9 0.0 0.1 0.5 * 0.0 0.1 0.1 2.8 0.4
Tripartism
Tripartite Industrial Peace Councils
created/reactivated .. .. .. 8 9 25 14 7 1 5 11 9 7 6 0 1 1 0
Industry Tripartite Councils
created/reactivated 22 15 16 17 20 6 5 8 5 26 15 71 62 18 43 24 10 1.. ..
Existing Industry Tripartite Councils .. .. .. .. .. .. .. .. .. .. 70 141 203 221 264 288 294 298.. ..
Voluntary Codes of Good
Practices adopted .. .. .. .. .. .. .. .. .. .. 8 33 45 35 37 21 8 0
Notes: 1. Data on unionism and collective were bargaining collected through a survey of establishments employing 20 or more workers (before 2012, non-agricultural
establishments only). The survey coverage excludes public administration and defense, compulsory social security; public education and health;
and extra-territorial organizations and bodies.
2. Annualized data for 2014 from the Labor Force Survey is the average of estimates for April, July and October survey rounds. The estimates for these rounds
exclude data for Leyte province only while that of January exclude Region VIII. 3. Annualized data for 2015 from the Labor Force Survey is the average of estimates for January, April, July and October survey rounds. The estimates for these rounds exclude data for Leyte Province only. The use of thefour survey rounds that exclude Leyte was based on the results of the referendum conducted among members of the Inter-Agency Committee on Labor and Productivity Statistics.*
Less than half the unit used.
Sources: Philippine Statistics Authority, Integrated Survey on Labor and Employment.
Labor Force Survey; National Conciliation and Mediation Board; and Department of Labor and Employment-Bureau of Labor Relations.
Date updated: 09/21/2018

Table 11. Social dialogue, workers' and employers' representationUnionism
Decent Work Indicator and
Underlying Data1995 1996 1997 1998 1999 2000 2001 2002 2003 2004 2005 2006 2007 2008 2009 2010 2011 2012 2013 2014 2015 2016 2017
Union density rate (%) 30.5 .. .. .. .. .. .. .. 20.2 16.3 .. .. .. 12.5 .. 10.6 .. 9.9 .. 7.7 .. 6.5 ..
Men 32.5 .. .. .. .. .. .. .. .. .. .. .. .. .. .. .. .. 10.5 .. 8.2 .. 7.4 ..
Women 27.0 .. .. .. .. .. .. .. .. .. .. .. .. .. .. .. .. 9.0 .. 6.8 .. 5.3 ....
Agriculture .. .. .. .. .. .. .. .. .. .. .. .. .. .. .. .. .. 23.1 .. 13.3 .. 19.5 ..
Industry 38.8 .. .. .. .. .. .. .. 22.7 20.1 .. .. .. 16.8 .. 15.7 .. 13.2 .. 11.2 .. 8.9 ..
Services 23.6 .. .. .. .. .. .. .. 18.1 13.3 .. .. .. 9.9 .. 7.9 .. 7.2 .. 5.5 .. 4.7 ..
Union membership,
% distribution 100.0 .. .. .. 100.0 .. .. .. 100.0 100.0 .. 100.0 .. 100.0 .. 100.0 .. 100.0 .. 100.0 .. 100.0 ..
Men 67.9 .. .. .. 64.4 .. .. .. 68.9 64.6 .. 65.3 .. 63.0 .. 62.1 .. 63.9 .. 65.3 .. 65.0 ..
Women 32.1 .. .. .. 35.6 .. .. .. 31.1 35.4 .. 34.7 .. 37.0 .. 37.9 .. 36.1 .. 34.7 .. 35.0 ....
Agriculture .. .. .. .. .. .. .. .. .. .. .. .. .. .. .. .. .. 10.5 .. 9.4 .. 10.6 ..
Industry 57.8 .. .. .. 59.4 .. .. .. 50.9 54.0 .. 54.4 .. 50.5 .. 51.9 .. 43.9 .. 43.8 .. 42.0 ..
Services 42.2 .. .. .. 40.6 .. .. .. 49.1 46.0 .. 45.6 .. 49.5 .. 48.1 .. 45.6 .. 46.8 .. 47.3 ..
Total union membership (000) 692 .. .. .. 541 .. .. .. 521 389 .. 401 .. 373 .. 319 .. 371 .. 340 .. 283 ..
Men 470 .. .. .. 349 .. .. .. 359 252 .. 262 .. 235 .. 198 .. 237 .. 222 .. 184 ..
Women 222 .. .. .. 193 .. .. .. 162 138 .. 139 .. 138 .. 121 .. 134 .. 118 .. 99 ....
Agriculture .. .. .. .. .. .. .. .. .. .. .. .. .. .. .. .. .. 39 .. 32 .. 30 ..
Industry 400 .. .. .. 322 .. .. .. 265 210 .. 218 .. 189 .. 166 .. 163 .. 149 .. 119 ..
Services 292 .. .. .. 220 .. .. .. 256 179 .. 183 .. 185 .. 154 .. 169 .. 159 .. 134 ..
Total employees (000) 2270 .. .. .. .. .. .. .. 2582 2393 .. .. .. 2991 .. 3020 .. 3739 .. 4437 .. 4365 ..
Men 1447 .. .. .. .. .. .. .. .. .. .. .. .. .. .. .. .. 2249 .. 2696 .. 2502 ..
Women 823 .. .. .. .. .. .. .. .. .. .. .. .. .. .. .. .. 1490 .. 1741 .. 1863 ....
Agriculture .. .. .. .. .. .. .. .. .. .. .. .. .. .. .. .. .. 169 .. 237 .. 154 ..
Industry 1032 .. .. .. .. .. .. .. 1165 1044 .. .. .. 1126 .. 1059 .. 1235 .. 1327 .. 1336 ..
Services 1238 .. .. .. .. .. .. .. 1417 1349 .. .. .. 1865 .. 1961 .. 2335 .. 2872 .. 2875 ..
Note: See Metadata of Statistical Indicators on Decent Work for definitions and other information.
Source: Philippine Statistics Authority, Integrated Survey on Labor and Employment.

Table 11. Social dialogue, workers' and employers' representation
Collective bargaining
Decent Work Indicator and
Underlying Data1995 1996 1997 1998 1999 2000 2001 2002 2003 2004 2005 2006 2007 2008 2009 2010 2011 2012 2013 2014 2015 2016 2017
Collective bargaining coverage
rate (%) .. .. .. .. .. .. .. .. 19.7 17.3 .. .. .. 13.1 .. 10.9 .. 10.3 .. 8.1 .. 7.2 ..
Men .. .. .. .. .. .. .. .. .. .. .. .. .. .. .. .. .. 10.8 .. 8.8 .. 8.0 ..
Women .. .. .. .. .. .. .. .. .. .. .. .. .. .. .. .. .. 9.5 .. 7.1 .. 6.1 ..#DIV/0! #DIV/0! #DIV/0! ..
Agriculture .. .. .. .. .. .. .. .. .. .. .. .. .. .. .. .. .. 23.1 .. 14.4 .. 19.5 ..
Industry .. .. .. .. .. .. .. .. 23.2 21.1 .. .. .. 17.4 .. 15.9 .. 13.5 .. 12.1 .. 9.9 ..
Services .. .. .. .. .. .. .. .. 16.7 14.5 .. .. .. 10.5 .. 8.3 .. 7.6 .. 5.7 .. 5.3 ..
Collective bargaining coverage,
% distribution .. .. .. .. 100.0 .. .. .. 100.0 100.0 .. 100.0 .. 100.0 .. 100.0 .. 100.0 .. 100.0 .. 100.0 ..
Men .. .. .. .. 63.9 .. .. .. .. .. .. 64.3 .. 62.4 .. 61.3 .. 63.2 .. 65.6 .. 63.9 ..
Women .. .. .. .. 36.1 .. .. .. .. 35.7 .. 37.6 .. 38.7 .. 36.8 .. 34.2 .. 36.4 ....
Agriculture .. .. .. .. .. .. .. .. .. .. .. .. .. .. .. .. .. 10.2 .. 9.4 .. 9.6 ..
Industry .. .. .. .. 60.1 .. .. .. 53.3 53.0 .. 55.3 .. 50.1 .. 50.9 .. 43.6 .. 44.7 .. 42.2 ..
Services .. .. .. .. 39.9 .. .. .. 46.7 47.0 .. 44.7 .. 49.9 .. 49.1 .. 46.2 .. 45.8 .. 48.2 ..
Total employees covered by
CBAs (000) .. .. .. .. 552 .. .. .. 508 415 .. 423 .. 391 .. 330 .. 383 .. 360 .. 313 ..
Men .. .. .. .. 353 .. .. .. .. .. .. 272 .. 244 .. 203 .. 242 .. 236 .. 200 ..
Women .. .. .. .. 199 .. .. .. .. .. .. 151 .. 147 .. 128 .. 141 .. 123 .. 114 ....
Agriculture .. .. .. .. .. .. .. .. .. .. .. .. .. .. .. .. .. 39 .. 34 .. 30 ..
Industry .. .. .. .. 332 .. .. .. 270 220 .. 234 .. 196 .. 168 .. 167 .. 161 .. 132 ..
Services .. .. .. .. 220 .. .. .. 237 195 .. 189 .. 195 .. 162 .. 177 .. 165 .. 151 ..
Total employees (000) 2270 .. .. .. .. .. .. .. 2582 2393 .. .. .. 2991 .. 3020 .. 3739 .. 4437 .. 4365 ..
Men 1447 .. .. .. .. .. .. .. .. .. .. .. .. .. .. .. .. 2249 .. 2696 .. 2502 ..
Women 823 .. .. .. .. .. .. .. .. .. .. .. .. .. .. .. .. 1490 .. 1741 .. 1863 ....
Agriculture .. .. .. .. .. .. .. .. .. .. .. .. .. .. .. .. .. 169 .. 237 .. 154 ..
Industry 1032 .. .. .. .. .. .. .. 1165 1044 .. .. .. 1126 .. 1059 .. 1235 .. 1327 .. 1336 ..
Services 1238 .. .. .. .. .. .. .. 1417 1349 .. .. .. 1865 .. 1961 .. 2335 .. 2872 .. 2875 ..
Note: See Metadata of Statistical Indicators on Decent Work for definitions and other information.
Source: Philippine Statistics Authority, Integrated Survey on Labor and Employment.
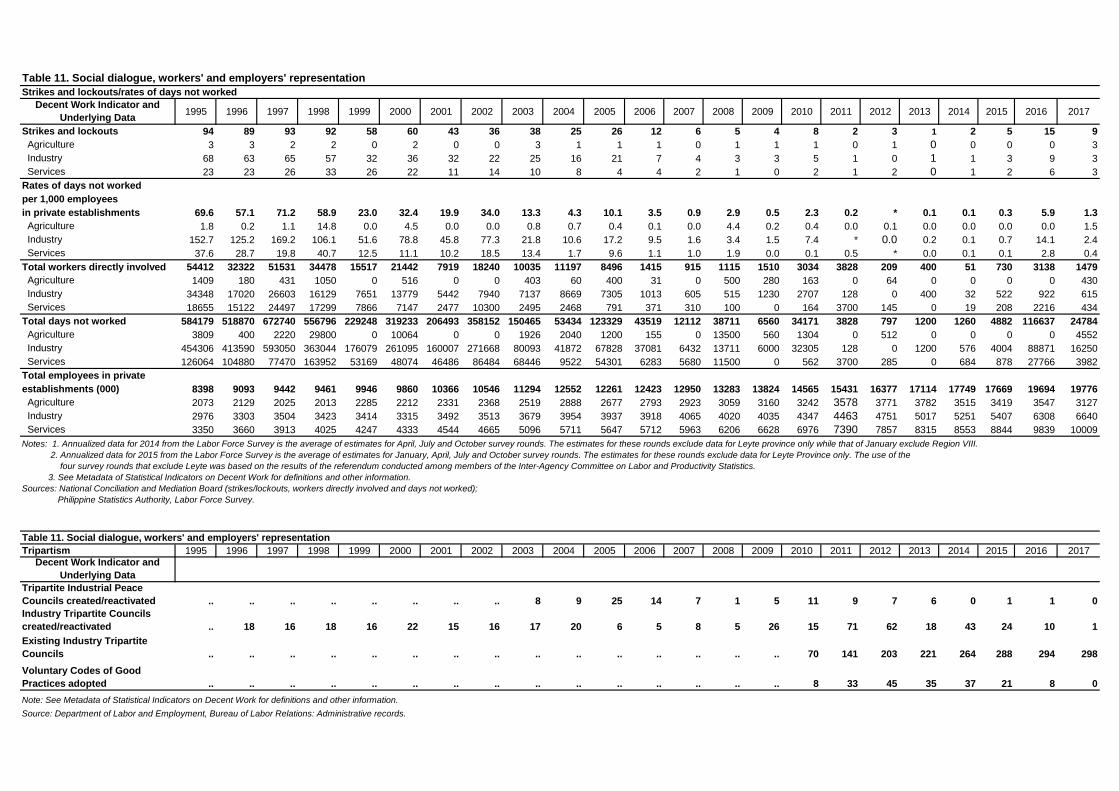
Table 11. Social dialogue, workers' and employers' representation
Strikes and lockouts/rates of days not worked
Decent Work Indicator and
Underlying Data1995 1996 1997 1998 1999 2000 2001 2002 2003 2004 2005 2006 2007 2008 2009 2010 2011 2012 2013 2014 2015 2016 2017
Strikes and lockouts 94 89 93 92 58 60 43 36 38 25 26 12 6 5 4 8 2 3 1 2 5 15 9
Agriculture 3 3 2 2 0 2 0 0 3 1 1 1 0 1 1 1 0 1 0 0 0 0 3
Industry 68 63 65 57 32 36 32 22 25 16 21 7 4 3 3 5 1 0 1 1 3 9 3
Services 23 23 26 33 26 22 11 14 10 8 4 4 2 1 0 2 1 2 0 1 2 6 3
Rates of days not worked
per 1,000 employees
in private establishments 69.6 57.1 71.2 58.9 23.0 32.4 19.9 34.0 13.3 4.3 10.1 3.5 0.9 2.9 0.5 2.3 0.2 * 0.1 0.1 0.3 5.9 1.3
Agriculture 1.8 0.2 1.1 14.8 0.0 4.5 0.0 0.0 0.8 0.7 0.4 0.1 0.0 4.4 0.2 0.4 0.0 0.1 0.0 0.0 0.0 0.0 1.5
Industry 152.7 125.2 169.2 106.1 51.6 78.8 45.8 77.3 21.8 10.6 17.2 9.5 1.6 3.4 1.5 7.4 * 0.0 0.2 0.1 0.7 14.1 2.4
Services 37.6 28.7 19.8 40.7 12.5 11.1 10.2 18.5 13.4 1.7 9.6 1.1 1.0 1.9 0.0 0.1 0.5 * 0.0 0.1 0.1 2.8 0.4
Total workers directly involved 54412 32322 51531 34478 15517 21442 7919 18240 10035 11197 8496 1415 915 1115 1510 3034 3828 209 400 51 730 3138 1479
Agriculture 1409 180 431 1050 0 516 0 0 403 60 400 31 0 500 280 163 0 64 0 0 0 0 430
Industry 34348 17020 26603 16129 7651 13779 5442 7940 7137 8669 7305 1013 605 515 1230 2707 128 0 400 32 522 922 615
Services 18655 15122 24497 17299 7866 7147 2477 10300 2495 2468 791 371 310 100 0 164 3700 145 0 19 208 2216 434
Total days not worked 584179 518870 672740 556796 229248 319233 206493 358152 150465 53434 123329 43519 12112 38711 6560 34171 3828 797 1200 1260 4882 116637 24784
Agriculture 3809 400 2220 29800 0 10064 0 0 1926 2040 1200 155 0 13500 560 1304 0 512 0 0 0 0 4552
Industry 454306 413590 593050 363044 176079 261095 160007 271668 80093 41872 67828 37081 6432 13711 6000 32305 128 0 1200 576 4004 88871 16250
Services 126064 104880 77470 163952 53169 48074 46486 86484 68446 9522 54301 6283 5680 11500 0 562 3700 285 0 684 878 27766 3982
Total employees in private
establishments (000) 8398 9093 9442 9461 9946 9860 10366 10546 11294 12552 12261 12423 12950 13283 13824 14565 15431 16377 17114 17749 17669 19694 19776
Agriculture 2073 2129 2025 2013 2285 2212 2331 2368 2519 2888 2677 2793 2923 3059 3160 3242 3578 3771 3782 3515 3419 3547 3127
Industry 2976 3303 3504 3423 3414 3315 3492 3513 3679 3954 3937 3918 4065 4020 4035 4347 4463 4751 5017 5251 5407 6308 6640
Services 3350 3660 3913 4025 4247 4333 4544 4665 5096 5711 5647 5712 5963 6206 6628 6976 7390 7857 8315 8553 8844 9839 1000916379Notes: 1. Annualized data for 2014 from the Labor Force Survey is the average of estimates for April, July and October survey rounds. The estimates for these rounds exclude data for Leyte province only while that of January exclude Region VIII.
2. Annualized data for 2015 from the Labor Force Survey is the average of estimates for January, April, July and October survey rounds. The estimates for these rounds exclude data for Leyte Province only. The use of the
four survey rounds that exclude Leyte was based on the results of the referendum conducted among members of the Inter-Agency Committee on Labor and Productivity Statistics.
3. See Metadata of Statistical Indicators on Decent Work for definitions and other information.
Sources: National Conciliation and Mediation Board (strikes/lockouts, workers directly involved and days not worked);
Philippine Statistics Authority, Labor Force Survey.
Table 11. Social dialogue, workers' and employers' representation
Tripartism 1995 1996 1997 1998 1999 2000 2001 2002 2003 2004 2005 2006 2007 2008 2009 2010 2011 2012 2013 2014 2015 2016 2017Decent Work Indicator and
Underlying Data
Tripartite Industrial Peace
Councils created/reactivated .. .. .. .. .. .. .. .. 8 9 25 14 7 1 5 11 9 7 6 0 1 1 0
Industry Tripartite Councils
created/reactivated .. 18 16 18 16 22 15 16 17 20 6 5 8 5 26 15 71 62 18 43 24 10 1
Existing Industry Tripartite
Councils .. .. .. .. .. .. .. .. .. .. .. .. .. .. .. 70 141 203 221 264 288 294 298
Voluntary Codes of Good
Practices adopted .. .. .. .. .. .. .. .. .. .. .. .. .. .. .. 8 33 45 35 37 21 8 0
Note: See Metadata of Statistical Indicators on Decent Work for definitions and other information.
Source: Department of Labor and Employment, Bureau of Labor Relations: Administrative records.

Metadata of Statistical
Indicators on Decent Work

Metadata of Statistical Indicators on Decent Work
Indicator Disaggregation Description and Technical Notes Data Source Remarks
Economic and social context for decent work
GDP (growth rate, % distribution)
Branch of economic activity
Indicator defined as: Value of all goods and services produced domestically, at constant 2000 prices.
Philippine Statistics Authority (PSA), National Accounts of the Philippines (NAP)
The current Philippines System of National Accounts (SNA) adopts the 2008 SNA.
Labor productivity (level and growth rate)
Branch of economic activity
Indicator defined as: Gross Domestic Product at constant 2000 prices divided by total employed.
PSA, NAP
PSA, Labor Force Survey (LFS)
Growth rate in labor productivity is a Millennium Development Goal indicator (MDG) on employment.
Annual employment statistics from the LFS refer to averages of the estimates for January, April, July and October survey rounds. This is the approved methodology contained in the National Statistical Coordination Board Resolution No. 9, Series of 2009 (July 2009).
LFS data from 1995-1996 were adjusted based on the 1980 Census-based population projections, those from 1997-2005 were adjusted based on the 1995 Census-based population projections, from 2006 to 2015 were adjusted based on the 2000 Census-based population projections and those starting 2016 were adjusted based on the 2010 Census of Population and Housing. Starting April 2016 round, the LFS adopted the 2013 Master Sample Design. As such, there are breaks in the data series.
GDP per capita (level and growth rate)
Indicators defined as:
1) GDP per capita in PPP$ - GDP at constant 2011 international $ divided by total population.
Purchasing Power Parity (PPP) rate- defined as the number of units of a country’s currency that is required to buy the same amount of goods and services in the country as one
World Bank, World Development Indicators

2
Indicator Disaggregation Description and Technical Notes Data Source Remarks
US$ would buy in the US. PPP as a rate of conversion ensures that money exchanged for a dollar buys the same volume of goods and services in every country. By equalizing prices, PPP rates deliver a measure of relative GDP which is based on what constitutes "real" income, the volume of goods and services embodied in GDP. The method of using PPP is analogous to measuring GDP in different years at fixed base year prices.
2) Real GDP per capita in PhP - GDP at constant 2000 prices divided by total population.
PSA, NAP
Wage share in GDP
Indicator defined as: Total compensation of employees as a percentage share of GDP, at current prices.
PSA, NAP-Consolidated Account I: Gross Domestic Product and Expenditure
Data from 2009 based on the 2008 SNA. Thus, data not strictly comparable with earlier years.
Capital formation (growth rate, as % of GDP)
Indicator defined as: Aggregate of fixed capital, changes in inventories and intellectual property products, at constant 2000 prices.
PSA, NAP
Inflation rate Indicator defined as: Year-on-year change of Consumer Price Index, expressed in percent.
PSA, Consumer Price Index (CPI)
Poverty indicators Indicators defined as:
1) Poverty incidence - proportion of families (or individuals) with per capita income/expenditure less than the per capita poverty threshold to the number of families (or individuals).
2) Subsistence incidence - proportion of families (or individuals) with per capita income/expenditure less than the per capita food threshold to the number of families (or individuals).
3) Income gap - average income shortfall, expressed in proportion to the poverty threshold, of individuals with income below the poverty threshold.
Poverty threshold - refers to minimum income/expenditure required for a family/individual to meet the basic food and non-food requirements.
PSA, Official Poverty Statistics
Data from 2006 based on refinements in the old methodology for poverty estimation to ensure comparability of estimates across space and over time. No computations made for earlier years using the refined methodology except for 1991, the benchmark year of the Millennium Development Goals.

3
Indicator Disaggregation Description and Technical Notes Data Source Remarks
Food threshold - refers to the minimum income/ expenditure required for a family (or individual) to meet the basic food needs, which satisfy the nutritional requirements for economically necessary and socially desirable physical activities.
Income inequality Indicators defined as:
1) Ratio of income of top 10% of families to bottom 10% -ratio of percentage share of total family income of top 10% of families to percentage share of total family income of bottom 10% of families.
2) Gini coefficient - a measure of the extent to which the distribution of income/expenditure among families/individuals deviates from a perfectly equal distribution, with limits 0 for perfect equality and 1 for perfect inequality.
PSA, Family Income and Expenditures Survey (FIES)
FIES, conducted every three years, is the source of data on poverty estimation. It has the household as its primary enumeration unit. But in the computation of family income and expenditures, those members of the households who are not related by blood or consanguinity are taken out.
Total family income distribution disaggregated by per capita income decile.
Employment by branch of economic activity
Total, men, women Ages 15+; Based on current status (past 7 days).
Indicator defined as: Percentage distribution of total employed by branch of economic activity.
PSA, LFS
Female share of employment by branch of economic activity
Ages 15+; Based on current status (past 7 days).
Indicator defined as: Total employed women in ith
branch of economic activity as a percentage share of total employed in the i
th branch of economic activity.
PSA, LFS
Education of adult population
Total, men, women Indicators defined as:
1) Adult functional literacy rate - total adults who possess a higher level of literacy which includes not only reading and writing skills but also numerical skills, as a percentage share of total adult population 25-64 years old. The skills must be sufficiently advanced to enable the individual to participate fully and efficiently in activities commonly occurring in his/her life situation that require a reasonable capability of communicating by written language
2) Adult secondary-school graduation rate - total adults who completed high school education as a percentage share of total adult household population 25 years old and over.
PSA, Functional Literacy, Education and Mass Media Survey (FLEMMS)
PSA, LFS
The inquiry on functional literacy is administered only to those 10-64 years old.

4
Indicator Disaggregation Description and Technical Notes Data Source Remarks
Children not in school, % of children population
Total, boys, girls; Age group: 5-9, 10-14, 15-17
Ages 5-17; Based on current status (past 7 days).
Indicator defined as: Total children not currently attending school in i
th age group as a percentage share of total
household population of children in ith
age group.
PSA, LFS LFS began collecting data on school attendance for ages 5-24 years in April 2005 survey round. However, 2005 annual data on school attendance was not computed because of unusually large figures for April. As it was the first time that the query was asked, there was a problem on interpretation. Those children on school vacation were treated as not attending school.
The Department of Education collects administrative data on school enrolment for primary and secondary education with age group breakdown 6-11 and 12-15 (official school-age population), respectively.
Working age population who are HIV positive per 100,000 persons
Total, men, women; Age group: 15-24, 25+
Ages: 15+.
Indicator defined as: Total persons reported as HIV positive divided by total working age population, then multiplied by 100,000.
HIV positive - refers to the presence of HIV infection as documented by the presence of HIV antibodies in the sample being tested by SACCL, which is the National Reference Laboratory for HIV.
Department of Health-Epidemiology Bureau (HIV/AIDS and Art Registry of the Philippines)
PSA, LFS
The Philippine HIV and AIDS Registry is the official record of the total number of laboratory-confirmed HIV positive individuals, AID cases and deaths, and HIV positive blood units in the Philippines. The Registry is a passive surveillance system. Except for HIV confirmation by the National Reference Laboratories all other data submitted to the Registry (example, place of residence) are secondary and can not be verified.
The statistics for this indicator exclude cases of Filipinos working overseas because they are not part of the LFS data on working age population.
Employment opportunities
Employment-to-population ratio
Total, men, women; Age group: 15-24, 25-54, 55+
Ages 15+; Based on current status (past 7 days).
Indicator defined as: Total employed as a percentage share of total working age population.
Working age population refers to household population 15 years old and over: This consists of: a) Persons who are present at the time of visit of the
enumerator:
PSA, LFS This is a Millennium Development Goal (MDG) indicator on employment.
Annual statistics from the LFS refer to averages of the estimates for January, April, July and October survey rounds. This is the approved methodology contained in the National Statistical Coordination Board Resolution No. 9,

5
Indicator Disaggregation Description and Technical Notes Data Source Remarks
- whose usual place of residence is the sample household regardless of their length of stay in the household,
- whose usual place of residence is outside the sample household but have stayed temporarily with the sample household for at least 30 days,
- whose usual place of residence is outside the sample household but have stayed with the sample household even for less than 30 days provided that they have been away from their usual place of residence for 30 days or more;
b) Persons who are not present at the time of visit but are expected to return within 30 days from date of departure to their usual place of residence, which is the sample household;
c) Students abroad/tourists who have been away for one year or less and are expected to be back within a year from date of departure. These also include those attending training abroad, medical treatment and missionaries.
Excludes:
Persons in institutions who are not expected to return within 30 days; members of the Armed Forces of the Philippines who have been away from their usual place of residence for more than 30 days; Filipinos, whose usual place of residence is in a foreign country, who are and will be in the Philippines for less than one year from arrival; citizens of foreign countries and members of their families who are in the Philippines as tourists, students, businessmen, or for employment provided they expect to stay in the country for one year or less from arrival; foreign ambassadors, ministers, consuls or other diplomatic representatives, and members of their families, regardless of the length of their stay; and citizens of foreign countries who are chiefs and officials of international organizations like UN, ILO or USAID and members of their families, regardless of their length of their stay; and Overseas Filipino Workers and employees in Philippine embassies, consulates and other missions.
Series of 2009 (July 2009).
LFS data from 1995-1996 were adjusted based on the 1980 Census-based population projections, those from 1997-2005 were adjusted based on the 1995 Census-based population projections, from 2006 to 2015 were adjusted based on the 2000 Census-based population projections and those starting 2016 were adjusted based on the 2010 Census of Population and Housing. Starting April 2016 round, the LFS adopted the 2013 Master Sample Design. As such, there are breaks in the data series.
Unemployment rate
Total, men, women; Age group: 15-24, 25-54, 55+
Ages 15+; Based on current status (past 7 days).
Indicator defined as: Total unemployed as a percentage share of total labor force.
PSA, LFS Beginning April, the definition of unemployment was revised to include the availability criterion in conformance with the international standard.
However, the LFS definition of unemployment

6
Indicator Disaggregation Description and Technical Notes Data Source Remarks
(even before the inclusion of the availability criterion) deviates from the international standard in some respect. Future starts (unemployed in the standard) are treated as employed. Those without work and available for work but not seeking work due to valid reasons (relaxation of the seeking work criterion) are considered as unemployed. These valid reasons are: 1) tired/ believed no work available, i.e., the discouraged workers; 2) awaiting results of previous job application; 3) temporary illness/ disability; 4) bad weather; and 5) waiting for rehire/job recall.
Youth not in education and not in employment, 15-24 years
Total, men, women Ages 15-24; Based on current status (past 7 days).
Indicator defined as: Total unemployed youth who are not currently attending school plus total youth not in the labor force who are not currently attending school, as a percentage share of total youth household population.
PSA, LFS LFS began collecting data on school attendance for ages 5-24 years in April 2005 survey round.
However, 2005 annual data on school attendance not computed because of unusually large figures for April. As it was the first time that the query was asked, there was a problem on interpretation. Those youth on school vacation were treated as not attending school.
Labor force participation rate
Total, men, women; Age group: 15-24, 25-54, 55+
Ages 15+; Based on current status (past 7 days).
Indicator defined as: Total labor force as a percentage share of total working age population.
Labor force participation gap - labor force participation rate of men less labor force participation rate of women.
PSA, LFS
Youth unemployment rate, 15-24 years
Total, men, women Ages 15-24; Based on current status (past 7 days).
Indicator defined as: Total unemployed youth as a percentage share of total youth labor force.
PSA, LFS
Unemployment by level of education
Total, men, women Ages 15+; Based on current status (past 7 days).
Indicator defined as: Percentage distribution of total unemployed by highest grade completed.
PSA, LFS Highest grade completed categories in the LFS: a) No grade completed (No schooling) b) Elementary undergraduate/graduate
(Primary) c) High school undergraduate/ graduate
(Secondary) d) Post secondary undergraduate/graduate e) College undergraduate/ graduate or higher
(Tertiary)
Employment by Total, men, women Ages 15+; Based on current status (past 7 days). PSA, LFS LFS class of worker categories correspond to

7
Indicator Disaggregation Description and Technical Notes Data Source Remarks
class of worker Indicator defined as: Percentage distribution of total employed by class of worker.
Class of worker categories:
a) Wage and salary workers
b) Employers in own family-operated farm or business
c) Self-employed without any paid employee
d) Unpaid family workers (worked without pay) in own family-operated farm or business
those of ILO status in employment as follows:
a) Employees
b) Employers
c) Own-account workers
d) Contributing family workers
Proportion of self-employed and unpaid family workers in total employment
Total, men, women; Branch of economic activity
Ages 15+; Based on current status (past 7 days).
Indicator defined as: Total self-employed plus total unpaid family workers, as a percentage share of total employed.
PSA, LFS This is a Millennium Development Goal indicator (MDG) on employment.
Share of wage employment in non-agricultural employment
Total, men, women Ages 15+; Based on current status (past 7 days).
Indicator defined as: Total wage and salary workers in non-agricultural employment as a percentage share of total non-agricultural employment.
PSA, LFS
Wage and salary workers in non-agricultural employment
Ages 15+; Based on current status (past 7 days).
Indicator defined as: Percentage distribution of men and women in non-agricultural wage employment.
PSA, LFS Share of women in wage employment in the non-agricultural sector is a Millennium Development Goal indicator (MDG) on employment.
Adequate earnings and productive work
Working poverty rate
Total, men, women; Branch of economic activity; Class of worker
Ages 15+.
Indicator defined as: Total employed living in a household whose members are estimated to be below the poverty threshold, as a percentage share of total employed. It is assumed that a household cannot have poor and non-poor members; either all members are poor or all members are non-poor since poverty is a characteristic of the household.
Poverty threshold - refers to minimum income/expenditure required for a family/individual to meet the basic food and non-food requirements.
PSA, Merged files of the LFS and FIES
Working poverty rate is a Millennium Development Goal (MDG) indicator on employment.
Employment data comes from the merged files of the FIES (conducted every three years) and LFS. The FIES is carried out in two phases: the first phase (covering the first six months of the reference year) at the same time as the July round of the LFS, e.g., July 2006 and the second phase (covering the remaining six months of the reference year) simultaneously with the LFS January round, e.g., January 2007. The same households are covered in both phases for consistency. The LFS component data (from the January round after the FIES reference year) is the basis for determining the

8
Indicator Disaggregation Description and Technical Notes Data Source Remarks
characteristics of the working poor. This means that the employment denominator used for estimating working poverty rate in 2006, for example, would be different from the employment average of 2006.
Low-paid employees
Total, men, women; Branch of economic activity; Category of employee
Ages 15+; Based on current status (past 7 days)
Indicators defined as:
1) Low-paid employees, % of employed - wage and salary workers with hourly basic pay (in primary job) below 2/3 of the median hourly basic pay of total wage and salary workers, as a percentage share of total employed.
2) Low-paid employees, % of employees - wage and salary workers with hourly basic pay (in primary job) below 2/3 of the median hourly basic pay of total wage and salary workers, as a percentage share of total wage and salary workers.
Hourly basic pay of an employee is a derived indicator. It was computed as basic pay per day divided by the corresponding normal working hours per day during the reference week.
Basic pay - pay for normal time, prior to deductions of social security contributions, withholding taxes, etc. It excludes allowances, bonuses, commissions, overtime pay, benefits in kind, etc.
Normal working hours - refer to the usual or prescribed working hours of a person in his/her primary job/business which is considered a full day’s work. These include the overtime hours if the person regularly works overtime. On average at the national level, normal working hours is around eight (8) per employee.
A primary job is determined in accordance with the following priority rules: 1) if only one job, then it is the primary job regardless of permanency or hours worked in the job; 2) if more than one job, the primary job is that which is permanent regardless of hours worked; 3) if more than one permanent job, consideration is given to the job where more hours of work are spent; 4) if equal hours are spent in the permanent jobs, the primary job is that which provides more income.
PSA, LFS LFS began collecting data on basic pay in January 2001 survey round.
The inquiry is on basic pay per day in cash or in kind (imputed value) of employees from their primary jobs and not their total earnings, which include allowances, overtime and premium pay.
Basic pay of employees paid on commission basis are excluded as it is difficult to determine their pay on a per day basis. The proportions of these workers have been growing over time, from 2% (0.652 million) of total employment and 5% of wage and salary employment in 2001 to about 8% (2.911 million) and 14%, respectively, in 2012.
Average real daily basic pay
Total, men, women; Major occupation group; Branch of
Ages 15+; Based on current status (past 7 days)
Indicator defined as: Average daily basic pay of wage and
PSA, LFS/CPI

9
Indicator Disaggregation Description and Technical Notes Data Source Remarks
economic activity; Category of employee
salary workers in nominal terms deflated by the Consumer Price Index.
Minimum hourly basic pay as % of median hourly basic pay, non-agriculture in Metro Manila
Non-agriculture in Metro Manila.
Indicator defined as: Minimum hourly basic pay in non-agriculture as a proportion of median hourly basic pay in non-agriculture.
National Wages and Productivity Commission (NWPC),
PSA, LFS
Data is on minimum basic pay for non-agriculture in Metro Manila as there are various minimum pay rates in the country.
This decent work indicator relates to basic pay because the LFS inquiry on wages is limited to this pay component.
Manufacturing wage index
Nominal terms.
Indicator defined as: The index formulated as a Laspeyres price index is as follows:
1
oot
ii i
o n oo
i i ii=1
xx
x
eww
w ew
n
i
where t
iw is the average daily basic pay of employees in
group i, for instance, employees working in the manufacturing
of food products at current year t, and o
iw is the average
daily basic pay of employees in group i at base year o. The number of employees in group i at base year o is given by
o
ie . The expression in the parenthesis comprises the
weight based on the base period.
PSA, LFS Source of formula is ILO Manual (First version), Decent Work Indicators Concepts and Definitions, May 2012.
Employees with recent job training (past 12 months)
Branch of economic activity
All establishments employing 20 or more workers.
Indicator defined as: Total employees provided job-related training by employers as a percentage of total employed.
Job-related training - include trainings conducted by the employer and those which were offered by other institutions but are financed by the employer.
PSA, BLES Integrated Survey (BITS)/ Integrated Survey on Labor and Employment (ISLE)
The conduct of BITS started in 2003; it is not done annually. The inquiry on this indicator began with 2011 reference period. With the creation of PSA in 2013, BITS will be known as ISLE starting 2014.
Services exclude public administration and defense, compulsory social security; public education and health; and extra-territorial organizations and bodies.

10
Indicator Disaggregation Description and Technical Notes Data Source Remarks
Workers certified, % of workers assessed (certification rate)
Total, men, women Indicator defined as: Total workers certified as a percentage share of total workers assessed under the Philippine Technical and Vocational Education and Training Qualification and Certification System.
Worker certified - refers to an individual who is provided certification after he/she has met the competency standards of the job.
Worker assessed - refers to an individual who undergoes an assessment process to determine whether he/she can perform to the standards expected in the workplace based on the defined competency standards. This ensures the productivity, quality and global competitiveness of the worker.
Technical Education and Skills Development Authority (TESDA), Administrative records
The underlying assumption on the use of the indicator is that certified workers would have higher productivity and could command higher pay as having met the competency standards of the job.
Decent hours
Employed with excessive hours (more than 48 hours actually worked per week)
Total, men, women; Branch of economic activity; Class of worker
Ages 15+; Based on current status (past 7 days); In all jobs/ primary job.
Indicator defined as: Total employed who worked more than 48 hours per week (in all jobs/primary job) as a percentage share of total employed.
Hours worked - refer to: (1) hours actually worked during normal periods of work; (2) over-time; (3) time spent at the place of work on activities such as the preparation of the workplace, repairs and maintenance, the preparation and
cleaning of tools, and the preparation of receipts, time sheets and reports; (4) time spent at the place of work waiting or standing-by for customers or for such reasons as lack of supply of work, breakdown of machinery, or accidents, or time spent at the place of work during which no work is done but for which payment is made under a guaranteed employment contract; and (5) time corresponding to short rest periods at the workplace, including tea and coffee breaks.
PSA, LFS The inquiry on hours worked in all jobs began in April 2005 round of the LFS.
Data disaggregation of employed with excessive hours in all jobs based on primary job.
Employed by hours actually worked per week
Total, men, women Ages 15+; Based on current status (past 7 days); In all jobs/ primary job.
Indicator defined as: Percentage distribution of total employed
PSA, LFS Data disaggregation of employed by hours actually worked in all jobs based on primary job.

11
Indicator Disaggregation Description and Technical Notes Data Source Remarks
by hours actually worked per week in standardized hour bands (in all jobs/primary job).
Standardized hour bands per week:
Less than 20 hours, 20-29, 30-39, 40-48, 49 and over
Average weekly hours actually worked per employed person
Total, men, women; Branch of economic activity; Class of worker
Ages 15+; Based on current status (past 7 days). In all jobs/primary job.
Indicator defined as: Average weekly hours worked of total employed persons at work (in all jobs/primary job).
PSA, LFS Data disaggregation of average weekly hours actually worked in all jobs per employed person based on primary job.
Underemployment rate
Total, men, women; Branch of economic activity; Class of worker
Ages 15+; Based on current status (past 7 days); In primary job.
Indicator defined as: Total employed who wanted additional work (wanted additional hours of work in their present job, or to have additional job, or a new job with longer working hours) as a percentage share of total employed.
PSA, LFS
Visible underemployment rate
Total, men, women; Branch of economic activity; Class of worker
Ages 15+; Based on current status (past 7 days); In primary job.
Indicator defined as: Total employed who wanted additional work and worked less than 40 hours in primary job as a percentage share of total employed.
PSA, LFS Visible underemployment is the concept used in the Philippine LFS.
Time-related underemployment rate
Total, men, women; Branch of economic activity; Class of worker
Ages 15+; Based on current status (past 7 days); In all jobs.
Indicator defined as: Total employed who wanted additional work and worked less than 40 hours in all jobs as a percentage share of total employed.
PSA, LFS Definition of time-related underemployment not strictly comparable with international standard as the criterion of availability for additional work not asked in the LFS.
Data disaggregation of time-related underemployment based on primary job.
Combining work, family and personal life
Economically inactive due to household/family duties
Total, men, women; Age group: 15-24, 25-54, 55+
Ages: 15 +; Based on current status (past 7 days).
Indicator defined as: Total persons who did not look for work due to household/family duties as a percentage share of total working age population.
PSA, LFS
Employed who are married
Total, men, women; Age group: 15-24, 25-54, 55+
Ages: 15 +; Based on current status (past 7 days).
Indicator defined as: Total employed who are married as a percentage share of total employed.
PSA, LFS
Employed who are household
Total, men, women; Age group: 15-24,
Ages: 15 +; Based on current status (past 7 days).
Indicator defined as: Total employed who are heads of
PSA, LFS

12
Indicator Disaggregation Description and Technical Notes Data Source Remarks
heads 25-54, 55+ households as a percentage share of total employed.
Household head - adult member of the household who is responsible for the care and organization of the household or the one who is regarded as such by the members of the household. The following may be considered as the household head: a. one who is responsible for the care and organization of the
household; b. one who makes the final decision even if he/she does not
contribute to the finances of the household; c. the oldest member of the household and is regarded as the
household head; and d. the household member who is now working abroad as an
Overseas Filipino Worker and is still regarded as the household head.
Work that should be abolished
Economic activity rate of children
Total, boys, girls; Age group: 5-9, 10-14, 15-17
Ages 5-17; Based on current status (past 7 days).
Indicator defined as: Total working children in ith age group as
a percentage share of total household population of children in i
th age group.
PSA, LFS LFS began regular collection of economic data on working children 5-14 years old in April 2005 survey round (also the start of the use of the internationally comparable definition of unemployment). However, the inquiry is limited to major occupation group and major industry group only. As such, it can not provide data on child labor as defined by the international standard.
Statistics on working children 10-14 years old are available prior to April 2005 because the LFS continued collection of their economic data even when the cut-off age was raised to 15 years in 1976. Statistics on working children 5-9 years old are available for 2004 because the LFS collected economic data for this group from October 2003 to January 2005.
Working children not currently attending school
Total, boys, girls;
Age group: 5-9, 10-14, 15-17
Ages 5-17; Based on current status (past 7 days).
Indicator defined as: Total working children not currently attending school in ith age group as a percentage share of working children in ith age group.
PSA, LFS
Working children Total, boys, girls;
Major industry
Ages 5-17; Based on current status (past 7 days).
Indicator defined as: Percentage distribution of working
PSA, LFS

13
Indicator Disaggregation Description and Technical Notes Data Source Remarks
group; Major occupation group
children by major industry group (or major occupation group).
Stability and security of work
Employees in precarious work (household survey data)
As % of employed: Total, men, women; Branch of economic activity
As % of employees: Total, men, women; Branch of economic activity; Category of employee
Ages 15+; Based on current status (past 7 days)
Indicators defined as:
1) Employees in precarious work, % of employed - total wage and salary workers whose nature of employment is short-term or seasonal or casual plus total wage and salary workers who worked for different employers on day-to-day or week-to-week basis, as a percentage share of total employed.
2) Employees in precarious work, % of employees - total wage and salary workers whose nature of employment is short-term or seasonal or casual plus total wage and salary workers who worked for different employers on day-to-day or week-to-week basis, as a percentage share of total employees.
Short-term or seasonal or casual workers - wage and salary
workers whose employment had lasted or expected to last less than one year since it started.
Worked for different employers or customers on day-to-day or week-to-week basis - for odd job workers/stevedores not on payroll or not connected with union/market and other cargo handlers receiving pay from individual customers.
PSA, LFS
Number and average real daily basic pay of short-term, seasonal or casual workers (household survey data)
Total, men, women; Branch of economic activity; Category of employee
Ages 15+; Based on current status (past 7 days).
Indicators defined as:
a) Short-term, seasonal or casual workers - wage and salary workers whose employment had lasted or expected to last less than one year since it started.
b) Average real daily basic pay - average daily basic pay of short-term, seasonal or casual employees in nominal terms in year t divided by the Consumer Price Index in year t, then multiplied by 100.
PSA, LFS Short-term, seasonal and casual workers are grouped as one category in the LFS.
The inquiry is on basic pay per day in cash or in kind (imputed value) of employees from their primary jobs and not their total earnings, which include allowances, overtime and premium pay.
Further, not all employees, e.g., commission basis, were able to report their basic pay and as such posed difficulty in determining their pay on a per day basis.
Employees in precarious work (establishment survey data)
Branch of economic activity
All establishments employing 20 or more workers. Before 2012, non-agricultural only.
Indicator defined as: Total employees hired on casual, seasonal or contractual/project-based basis as a percentage
PSA, BITS/ ISLE
The conduct of BITS started in 2003; it is not done annually. With the creation of PSA in 2013, BITS will be known as ISLE starting 2014.
Services exclude public administration and

14
Indicator Disaggregation Description and Technical Notes Data Source Remarks
share of total employed.
Casual worker - worker whose work is not usually necessary and desirable to the usual business or trade of the employer. The employment is not for a specific undertaking or seasonal
in nature.
Seasonal worker - worker whose employment, specifically its timing and duration, is significantly influenced by seasonal factors.
Contractual/project-based worker - worker whose employment has been fixed for a specific project or undertaking, the completion or termination of which has been determined at the time of engagement. An agency-hired worker (or hired through a contractor) is excluded.
defense, compulsory social security; public education and health; and extra-territorial organizations and bodies.
Casual workers (establishment survey data)
Branch of economic activity
All establishments employing 20 or more workers. Before 2012, non-agricultural only.
Indicator defined as: Employees whose work is not usually necessary and desirable to the usual business or trade of the employer. The employment is not for a specific undertaking or seasonal in nature.
PSA, BITS/ISLE
BITS does not inquire on wage data.
Equal opportunity and treatment in employment
Occupational segregation by sex
Ages 15+; Based on current status (past 7 days).
Indicators defined as:
1) Female share in occupational employment - total employed women in i
th major occupation group as a
percentage share of total employed in the ith
major occupation group.
2) Duncan Index of Dissimilarity - a summary indicator of occupational segregation. It ranges from 0 to 1, with 0 meaning no occupational segregation and 1 being complete segregation between the two sexes. It is computed as: 1/2 Σ|Wi/W - Mi/M| where Wi and Mi are the shares of the employed women and men in the i
th major
occupation group relative to their respective totals, employed women (W) and employed men (M).
PSA, LFS Source of definition for “index of dissimilarity” - ILO Manual on Decent Work Indicators, May 2012.
Female share of employment in senior and middle management
Ages 15+; Based on current status (past 7 days.
Indicator defined as:
1977 PSOC-based data: Total employed women who are
PSA, LFS ISCO-88 groups 11 and 12 correspond to: a) 1995-2000 data: Legislative officials,
government administrators and government executives (Code 20), and managers (Code

15
Indicator Disaggregation Description and Technical Notes Data Source Remarks
(ISCO-88 and ISCO-08 groups 11 and 12)
legislative officials, government administrators and government executives, and managers, as a percentage share of total employed in the same occupational groups.
1992 PSOC-based data: Total employed women who are officials of government and special-interest organizations, corporate executives and specialized managers, as a percentage share of total employed in the same occupational groups.
2012 PSOC-based data: Total employed women who are chief executives, senior officials and legislators, administrative and commercial managers, as a percentage share of total employed in the same occupational groups.
21) of 1977 Philippine Standard Occupational Classification (PSOC). These two groups make up Administrative, executive and managerial workers under the 1977 classification;
b) 2001-2015 data: Officials of government and special-interest organizations (Code 11), and corporate executives and specialized managers (Code 12) of 1992 PSOC. 1977 PSOC-based data include other managers which are excluded in the 1992 PSOC-based data. Hence, the two data series are not strictly comparable.
ISCO-08 groups 11 and 12 correspond to:
a) 2016 data – onwards: Chief executives, senior officials and legislators (Code 11), and administrative and commercial managers (Code 12) of 2012 PSOC. 1992 PSOC-based data include other managers which are excluded in the 2012 PSOC-based data. Hence, the two data series are not strictly comparable
Share of women in wage employment in the non-agricultural sector
Ages 15+; Based on current status (past 7 days).
Indicator defined as: Percentage share of women in total wage and salary workers in non-agriculture.
PSA, LFS This is a Millennium Development Goal indicator (MDG) on employment.
Gender wage gap Major occupation group
Ages 15+; Based on current status (past 7 days)
Indicator defined as: Difference between average daily basic pay of men and women as a percentage of average daily basic pay of men.
PSA, LFS Source of definition for “gender wage gap” - ILO Manual on Decent Work Indicators, May 2012.
Safe work environment
Incidence rate of occupational injuries, fatalities per 100,000 employed persons
Branch of economic activity
All establishments employing 20 or more workers. Before 2011, non-agricultural only.
Indicator defined as: Total cases of occupational injuries resulting to deaths whether death occurs immediately after the accident or within the same year as the accident, per 100,000 employed persons.
PSA, BITS/ Occupational Injuries Survey (OIS)/ISLE
The conduct of BITS started in 2003; it is not done annually. With the creation of PSA in 2013, BITS will be known as ISLE starting 2014.
The 2000 OIS was conducted as an independent survey.
Services exclude public administration and

16
Indicator Disaggregation Description and Technical Notes Data Source Remarks
defense, compulsory social security; public education and health; and extra-territorial organizations and bodies.
The use of incidence rate over frequency rate (which is calculated per million hours worked) is used as it is easier to interpret.
Incidence rate of occupational injuries, non-fatalities per 100,000 employed persons
Branch of economic activity; Permanent and temporary incapacity for work
All establishments employing 20 or more workers. Before 2011, non-agricultural only.
Indicator defined as: Total cases of occupational injuries resulting to permanent (or temporary) incapacity for work per 100,000 employed persons.
Permanent incapacity - case where an injured person was absent from work for at least one day, excluding the day of the accident, and 1) was never able to perform again the normal duties of the job or position occupied at the time of the occupational accident, or 2) will be able to perform the same job but his/her total absence from work is expected to exceed a year starting the day after the accident.
Temporary incapacity - case where an injured person was absent from work for at least one day, excluding the day of the accident, and 1) was able to perform again the normal duties of the job or position occupied at the time of the occupational accident or 2) will be able to perform in the same job but his/her total absence from work is expected not to exceed a year starting the day after the accident, or 3) did not return to the same job but the reason for changing the job is not related to his/her inability to perform the job at the time of the occupational accident.
PSA, BITS/ OIS/ISLE
Average days lost due to temporary incapacity cases
Branch of economic activity
All establishments employing 20 or more workers. Before 2011, non-agricultural only.
Indicator defined as: Total workdays lost of cases of occupational injuries resulting to temporary incapacity per case of occupational injury resulting to temporary incapacity.
Workdays lost - refer to working days (consecutive or staggered) an injured person was absent from work, starting the day after the accident. If the person is still absent from work by the end of the reference year, his/her days lost cover the period from the day after the accident up to the end of the reference year. Temporary absences from work of less than one day for medical treatment are not included in days lost.
PSA, BITS/ OIS/ISLE
The use of average days lost over severity rate (which is calculated per million hours worked) is used as it is easier to interpret.

17
Indicator Disaggregation Description and Technical Notes Data Source Remarks
Incidence rate of occupational diseases, per 100,000 employed persons
Branch of economic activity
All establishments employing 20 or more workers. Before 2011, non-agricultural only.
Indicator defined as: Total cases of occupational diseases per 100,000 employed persons.
Occupational disease - refers to an abnormal condition or disorder other than one resulting from an occupational injury caused by exposure over a period of time to risk factors associated with work activity such as contact with certain chemicals, inhaling coal dust, carrying out repetitive movements. These refer to new cases recognized, diagnosed and recorded during the year.
PSA, BITS/ISLE
The inquiry on occupational diseases started with 2003 data.
Incidence rate of tuberculosis, per 100,000 employed persons
Branch of economic activity
All establishments employing 20 or more workers. Before 2011, non-agricultural only.
Indicator defined as: Total cases of tuberculosis recognized, diagnosed and recorded during the year per 100,000 employed persons.
PSA, BITS/ISLE
The inquiry on tuberculosis cases started with 2009 data.
Labor inspectors per 100,000 employees in private establishments
Indicator defined as: Total labor inspectors (actually doing inspections) divided by total wage and salary workers in private establishments, then multiplied by 100,000.
Department of Labor and Employment (DOLE)-Bureau of Working Conditions (BWC), Administrative records
PSA, LFS
Labor inspections conducted only in private establishments. In 2012, additional inspectors (labor law compliance officers) were hired.
Social security
Share of economically active population contributing to a pension scheme
Ages: 15+.
Indicator defined as: - Total SSS and GSIS members (with at least one month posted contribution for the given year) as a percentage share of total labor force.
Social Security System (SSS, for private sector)/ Government Service Insurance System (GSIS, for public sector), Administrative
SSS data on Overseas Filipino Workers excluded in the computation as they are not counted as part of the country's economically active population or labor force.

18
Indicator Disaggregation Description and Technical Notes Data Source Remarks
records
PSA, LFS
Share of population aged 60 and above benefiting from retirement/old age pension
Ages: 60+.
Indicator defined as: Total pensioners (formerly employed in the private and public sectors) who receive retirement/old age pensions on a lifetime cash benefit paid every month as a percentage share of total household population 60 years old and over.
SSS/GSIS Administrative records
PSA, LFS
Qualified pensioners: 1) SSS: 60 years old, separated from
employment or ceases to be employed and has paid at least 120 monthly contributions prior to the semester of retirement; 65 years old whether employed or not and has paid at least 120 monthly contributions prior to the semester of retirement;
2) GSIS: 60 years old (optional retirement) or 65 years old (mandatory retirement) and have rendered at least 15 years of service.
SSS and GSIS can not provide data for those aged 60+ who are receiving disability and survivorship benefits.
Some pensioners may no longer be Philippine residents and as such not counted in the population denominator.
Average monthly pension
Indicator defined as: Average monthly pension benefits on social security (retirement, disability, death/survivorship) and employees compensation due to work-related injuries and diseases.
SSS/GSIS Administrative records
Social security benefits, % of GDP
Indicator defined as: Total social security benefits as a percentage share of Gross Domestic Product.
Social security benefits - social security payments to government and private employees and their beneficiaries by social security funds (Government Service Insurance System, Social Security System, National Health Insurance Program and Employees Compensation Program). These may take the form of retirement and survivorship pensions, sickness, disability and death benefits or other related allowances or benefits.
PSA, NAP-Income and Outlay Account IV: Households including NPISH
Data from 2009 based on 2008 SNA. Thus, data not strictly comparable with earlier years.
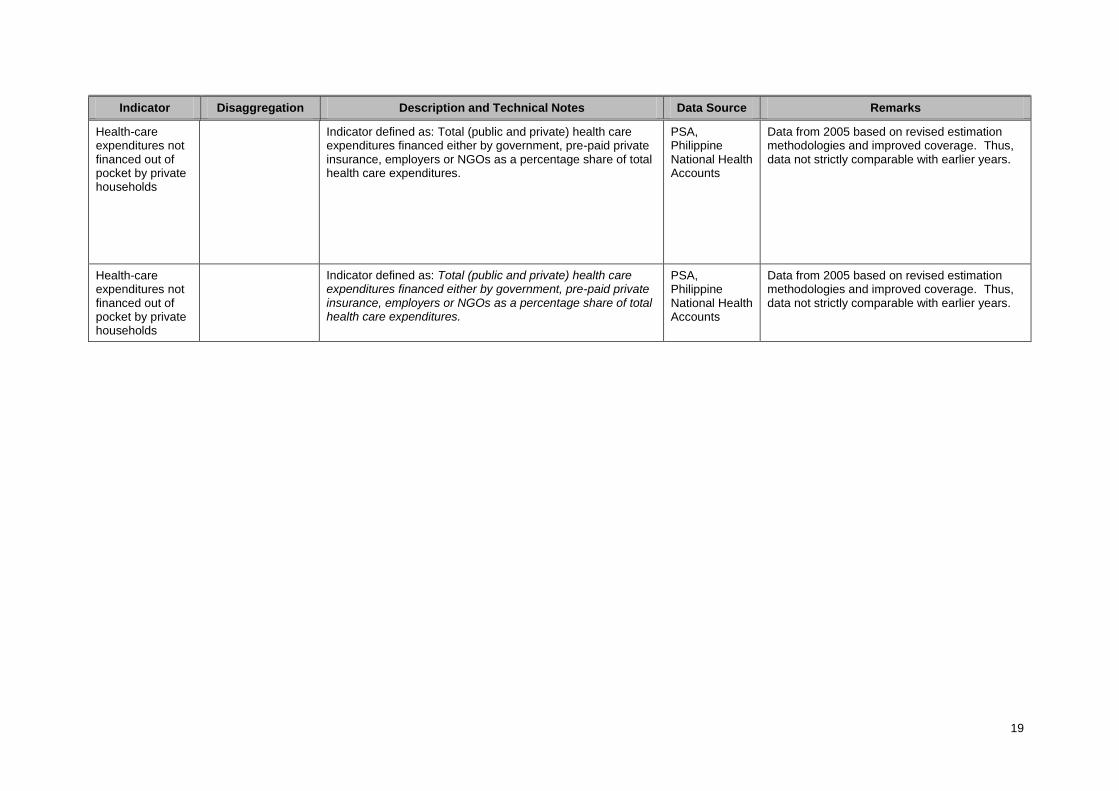
19
Indicator Disaggregation Description and Technical Notes Data Source Remarks
Health-care expenditures not financed out of pocket by private households
Indicator defined as: Total (public and private) health care expenditures financed either by government, pre-paid private insurance, employers or NGOs as a percentage share of total health care expenditures.
PSA, Philippine National Health Accounts
Data from 2005 based on revised estimation methodologies and improved coverage. Thus, data not strictly comparable with earlier years.

20
Indicator Disaggregation Description and Technical Notes Data Source Remarks
Estimated share of population covered by National Health Insurance Program
Ages: all.
Indicator defined as: Total beneficiaries (members and dependents) of the National Health Insurance Program as a percentage share of total population.
Philippine Health Insurance Corporation (PhilHealth)
The SSS (private sector) and GSIS (public sector) previously administered the Medicare Program prior to the creation of PhilHealth.
The PhilHealth assumed the responsibility of administering the Medicare Program, (implemented from August 1971) from GSIS in October 1997, from SSS in 1998 and the Overseas Workers Program from the Overseas Workers and Welfare Administration in March 2005. PhilHealth members who have reached the age of retirement and who have paid at least 120 months premium (including those who have paid in the former Medicare Program), are granted lifetime coverage. As lifetime members they are also qualified for full benefits together with their qualified dependents.
Beneficiaries are estimated as follows:
a) 2000 to 2008: members based on collection reports and membership database build-up and dependents based on average household size from the Philippine Statistics Authority (PSA).
b) 2009: members in the database and dependents based on average household size from the PSA.
c) 2010-2011: actual counts of members and dependents registered in the database except for dependents of the Sponsored Program (Department of Health and Regular) which were estimated based on the dependent multipliers from the Benefit Delivery Review Study of the UP School of Economics.
d) 2012: actual counts of members and dependents registered in the database except for dependents of LGU-sponsored Program which were estimated using the National Household Targeting System for Poverty Reduction member to dependent ratio.
e) From 2013: actual counts of members and dependents registered in the database.

21
Indicator Disaggregation Description and Technical Notes Data Source Remarks
Social dialogue, workers’ and employers’ representation
Union density rate Total, men, women; Branch of economic activity
All establishments employing 20 or more workers. Before 2012, non-agricultural only.
Indicator defined as: Total employees who are union members as a percentage share of total employees.
PSA, BITS/ Industrial Relations at the Workplace Survey (IRWS)/ ISLE
The conduct of BITS started in 2003; it is not done annually. With the creation of PSA in 2013, BITS will be known as ISLE starting 2014.
Data on union membership used to be collected through IRWS; available for 1995 and 1999. Services exclude public administration and defense, compulsory social security; public education and health; and extra-territorial organizations and bodies.
Collective bargaining coverage rate
Total, men, women; Branch of economic activity
All establishments employing 20 or more workers. Before 2012, non-agricultural only.
Indicator defined as: Total employees covered by CBAs as a percentage share of total employees.
PSA, BITS/ IRWS/ISLE
Data on CBA coverage used to be collected through IRWS; available for 1999.
Strikes and lockouts/rates of days not worked
Branch of economic activity
Indicators defined as:
1) Strike - any temporary stoppage of work by the concerted action of employees as a result of an industrial or labor dispute. It excludes general strike, political strike, mass leave, sympathy strike and the like; Lockout - temporary refusal of an employer to furnish work to his employees as a result of an industrial or labor dispute.
2) Rates of days not worked - total days not worked by workers involved due to strikes and lockouts divided by employees in private establishments, then multiplied by 1,000.
National Conciliation and Mediation Board (NCMB), Administrative records
PSA, LFS
Government workers are not allowed to go on strike.
Tripartite Industrial Peace Councils/ Industry Tripartite Councils created/reactivated
Indicator defined as: Tripartite councils that serve as fora for tripartite advisement and consultations among labor, employers and government sectors in the formulation of labor and employment policies.
DOLE-Bureau of Labor Relations (BLR), Administrative records
Voluntary Codes of Good Practice adopted
Indicator defined as: A set of agreements that define the tripartite partners shared responsibility in settling differences in the spirit of self-governance and self-regulation, thus further enhancing the tripartite engagement of the social partners in the industry.
DOLE-BLR, Administrative records
Date updated: 09/21/2018