Projects that benefit from software innovations in often face frustration with unforeseen obstacles of the total cost of ownership. VDI implementations share common components and thus are exposed to common challenges that often can be addressed with general improvements in system design.
Typical elements of VDI design
• Blade servers
• Shared storage
Presenter
Presentation Notes
Challenges with virtualization of desktop workloads are not unique and will be discussed during this session. To start, let’s state the obvious – VDI implementations gravitate to blade servers with high reliance on shared storage.
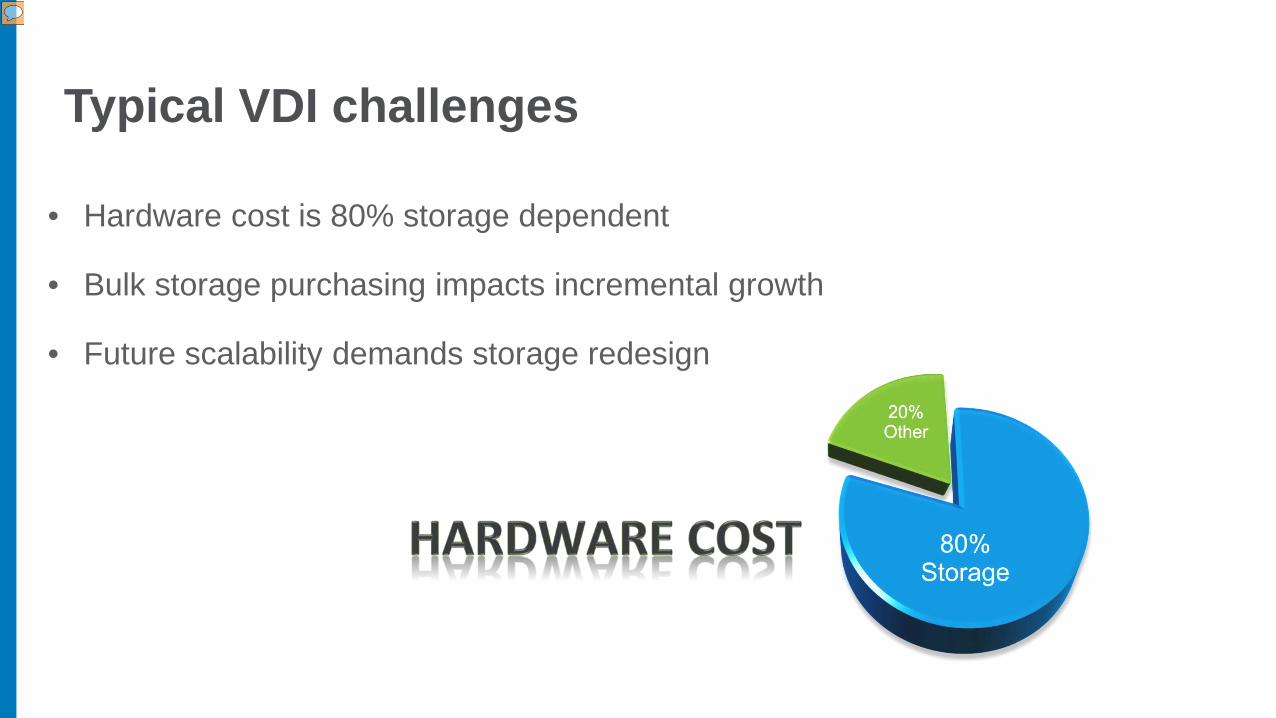
It is quite common that VDI hardware cost is 80% storage cost dependent. Bulk storage purchases a carried out to achieve the “economy of scale” which often impacts the prospects of incremental growth. At some point scalability demands require storage redesign and thus projects incur additional expenses unwelcome by the end users.
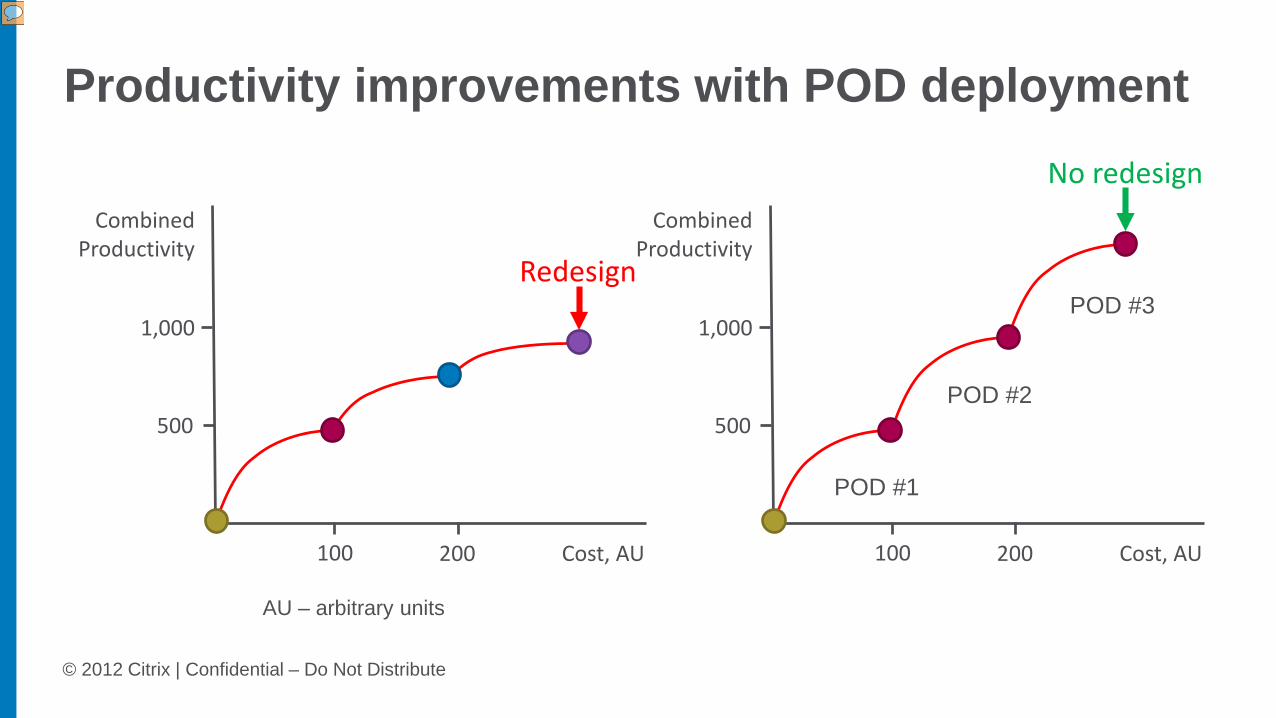
Relationship between shared storage growth, acquisition costs and user productivity can be traced through individual user experience with incremental performance change while available capacity is consumed.
With evolving deployment there is a time when combined user productivity growth with addition of new storage looses cost-effectiveness and thus storage redesign becomes inevitable. It is also often hard to avoid any potential bottlenecks even with successful small scale pilots. For example, a pilot with 500 users might miss a performance bottleneck at 600 user mark and thus jeopardize success of 2,500 user implementation.
POD Implementations
Presenter
Presentation Notes
These concerns with “monolithic” designs can be address by workload segmentation using PODs.
Here is an excellent quote from Cisco whitepaper that outlines the essence of PODs. Wikipedia deciphers the term POD as “Point of Delivery”. Depending on the vendor and implementation, we might hear other nicknames for this modular design, for example “block” design.
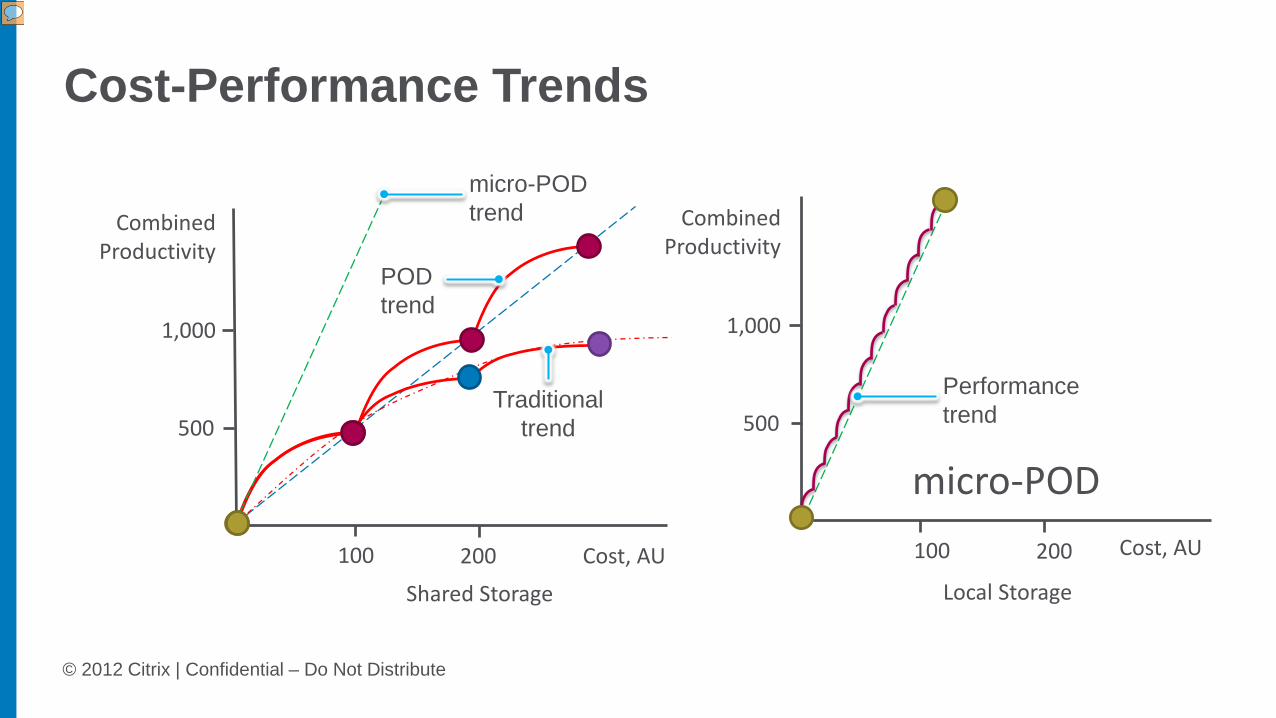
Here is a side-by-side comparison between productivity of monolithic design over time versus POD implementation where linear system growth can be achieved without necessity of redesign.
• Addresses performance uncertainties through resource segmentation
• Not cost effective at low utilization
• Targets large implementations
• Cost prohibitive for small deployments
• Hardware cost per user is $1,000 or higher
Presenter
Presentation Notes
In essence, POD architecture addresses performance uncertainties of the large systems through resource segmentation. Due to large POD capacities, 500 to 1,000 or more users, PODs are not cost-effective at low utilization. For the same reason they are well fit for large implementations but cost prohibitive for small deployments. Although POD offers performance predictability, PODs do not always reduce per user cost which is currently at about $1,000 or higher.
Can we do better?
Presenter
Presentation Notes
Can we do better? To answer this question let’s look into the core technologies behind Citrix FlexCast.
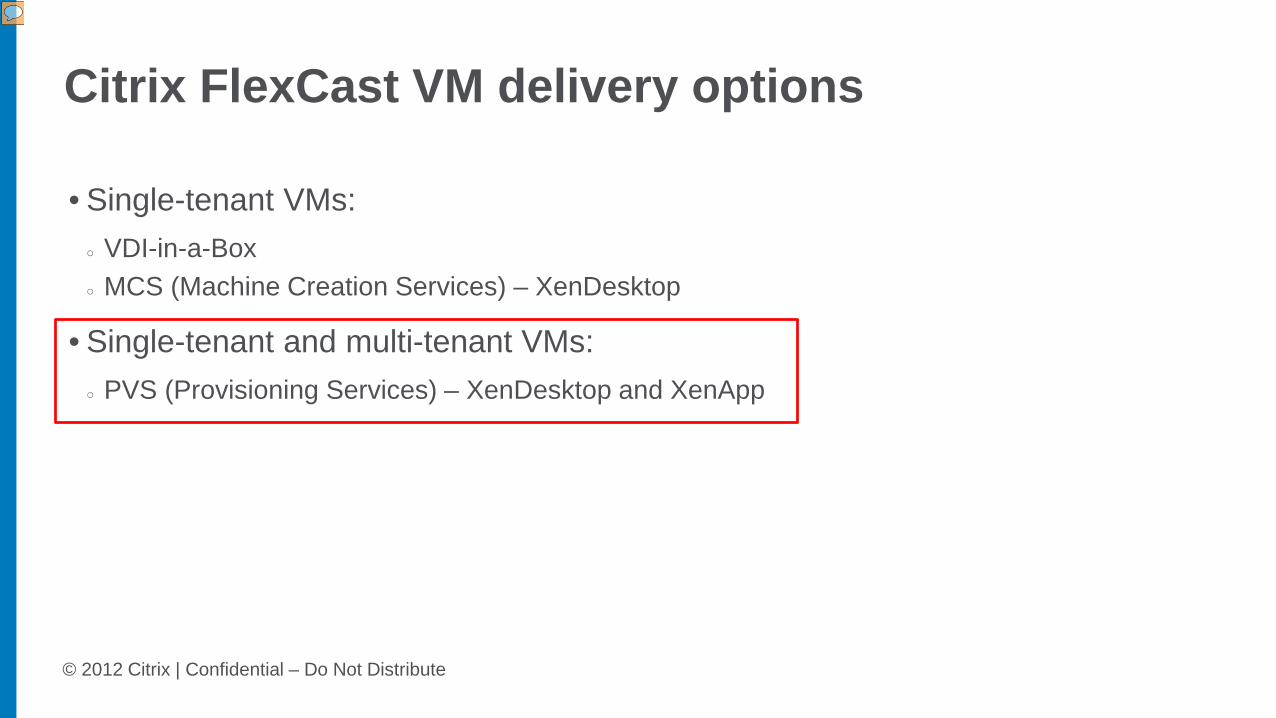
• Single-tenant and multi-tenant VMs:○ PVS (Provisioning Services) – XenDesktop and XenApp
Presenter
Presentation Notes
There are quite a few options when delivering virtualized user workloads via Citrix, most are hypervisor agnostic: VDI-in-a-Box: can be characterized as easy, affordable, “all in one” single-tenant VM implementation. Machine Creation Services also is focused on single-tenant VM delivery, often targeting larger deployments. Provisioning Services (“PVS”) offers universal delivery of virtualized or physical environments, is IO efficient, capable of single and multi-tenant VM delivery. Given the time limitation and the broader number of deployment scenarios covered by PVS, let’s review optimizations that can reduce the cost with uncompromised performance and reliability.
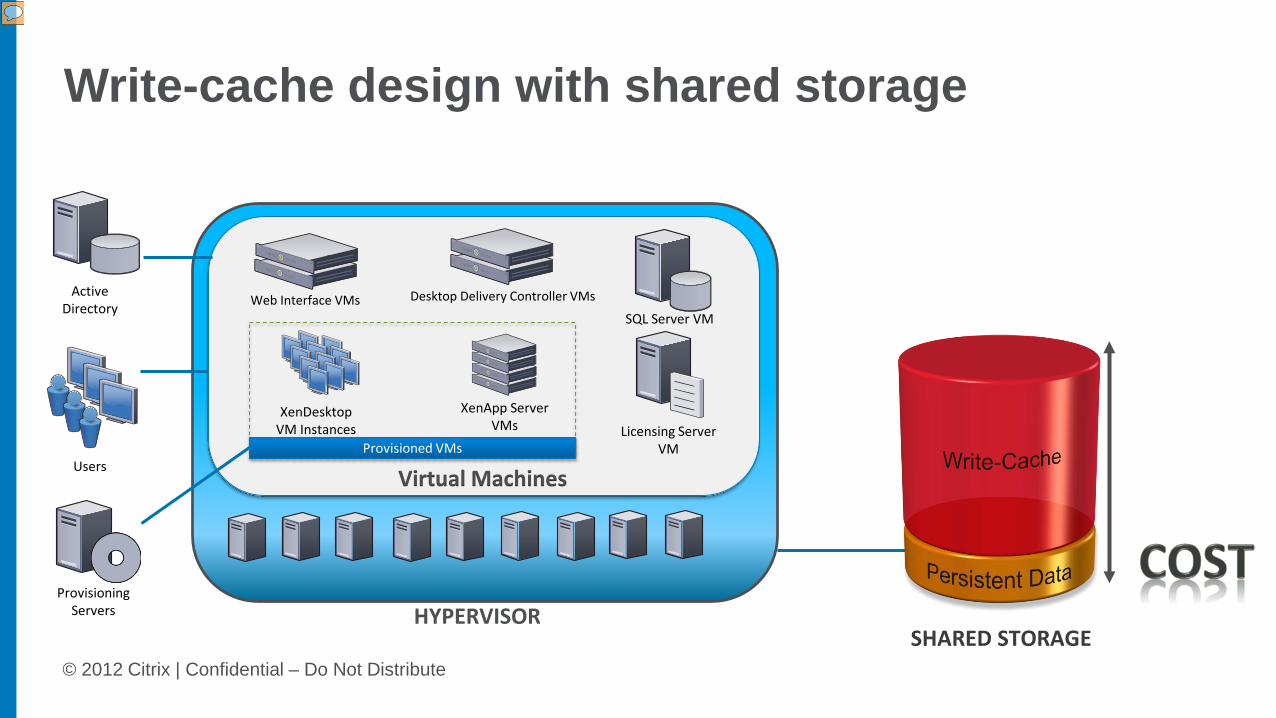
Here is a common layout of XenDesktop and XenApp delivery which is heavily reliant on shared storage. We can make a note however that the cost of the storage is largely defined by the need to support high performance and sometimes high capacity devoted to the write cache. This write-cache is not conducive for data tiering and , unlike persistent data, can be accommodated by… local storage.
A micro-pod is a miniature pod leveraging local storage
SUM230
Presenter
Presentation Notes
Here is an excellent quote from Cisco whitepaper that outlines the essence of PODs. Wikipedia deciphers the term POD as “Point of Delivery”. Depending on the vendor and implementation, we might hear other nicknames for this modular design, for example “block” design.
By getting back to user productivity analysis it is clear that micro-POD has POD-like characteristics but at a different scale. Due to the small-step incremental growth and intrinsically lower cost of local storage, combined user productivity does appear to have significant cost benefits while preserving POD advantages.
Here is a side-by-side comparison of combined productivity versus cost for: - Traditional “monolithic” shared storage design with hard to predict non-linear growth - POD design with linear growth but fairly high cost - Local storage design with significant cost savings and incremental linear growth, with no foreseeable needs of redesign.
Building micro-PODs
Presenter
Presentation Notes
Let’s review some options in the actual implementation of micro-PODs.
To avoid unwanted surprises let’s take a look at fundamentals – balanced design, where all system components such as CPU, Memory, Network and Storage are well fit to each other. Where none of performance, capacity, availability and cost are compromised.
Given different disk sizing and RAID options here is a way to estimate supportability of user count based on the overall storage capacity, total RAM, RAM per user, etc. The formula takes in consideration memory swap required by the hypervisor. From our experience, 800Gb of storage is often sufficient to support about 80-100 XenDesktop users. Although XenApp Storage requirements are lower, longer uptimes for XenApp servers that do not allow for write-cache flushing places storage capacity requirements on par with XenDesktop.
Given different disk sizing and RAID options here is a way to estimate supportability of user count based on the overall storage capacity, total RAM, RAM per user, etc. The formula takes in consideration memory swap required by the hypervisor. From our experience, 800Gb of storage is often sufficient to support about 80-100 XenDesktop users. Although XenApp Storage requirements are lower, longer uptimes for XenApp servers that do not allow for write-cache flushing make storage capacity requirements on par with XenDesktop.
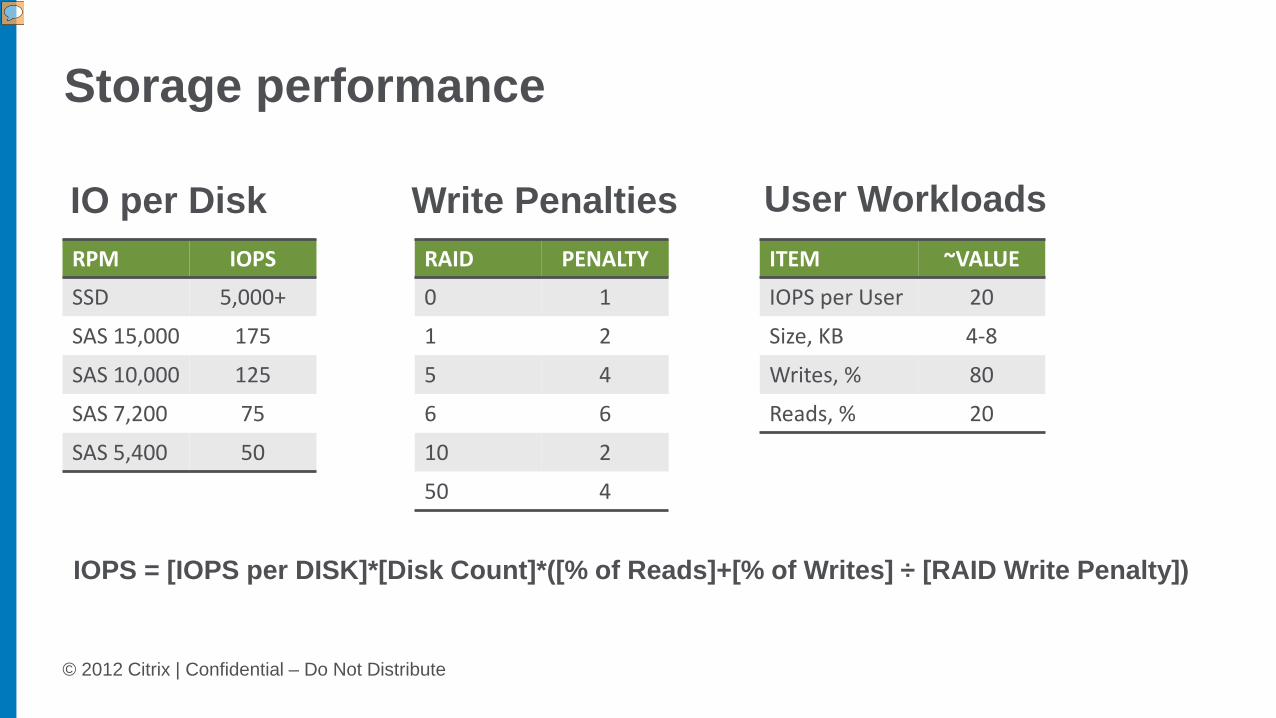
IOPS = [IOPS per DISK]*[Disk Count]*([% of Reads]+[% of Writes] ÷ [RAID Write Penalty])
Presenter
Presentation Notes
Here we continue with storage performance which has to be in balance with available capacity. Along with different drive capabilities come differences between RAID implementations. Usefulness of high IO potential of SSDs might be misleading given the high cost per megabyte and the background processing that can impact individual SSD disk performance especially in RAID configuration. It is also essential not to overlook the type of the workloads – VDI loads produce mostly 4-8KB random writes with only 20%, and sometimes even 10%, random reads.
Are mechanical disksaffordable but just too slow?
Presenter
Presentation Notes
Are mechanical disks affordable but just too slow? This is a question for the audience. Most everyone that have replaced mechanical disks in their laptops will support the idea of mechanical disk replacement with SSDs. Nevertheless, in VDI world the answer might surprise you.
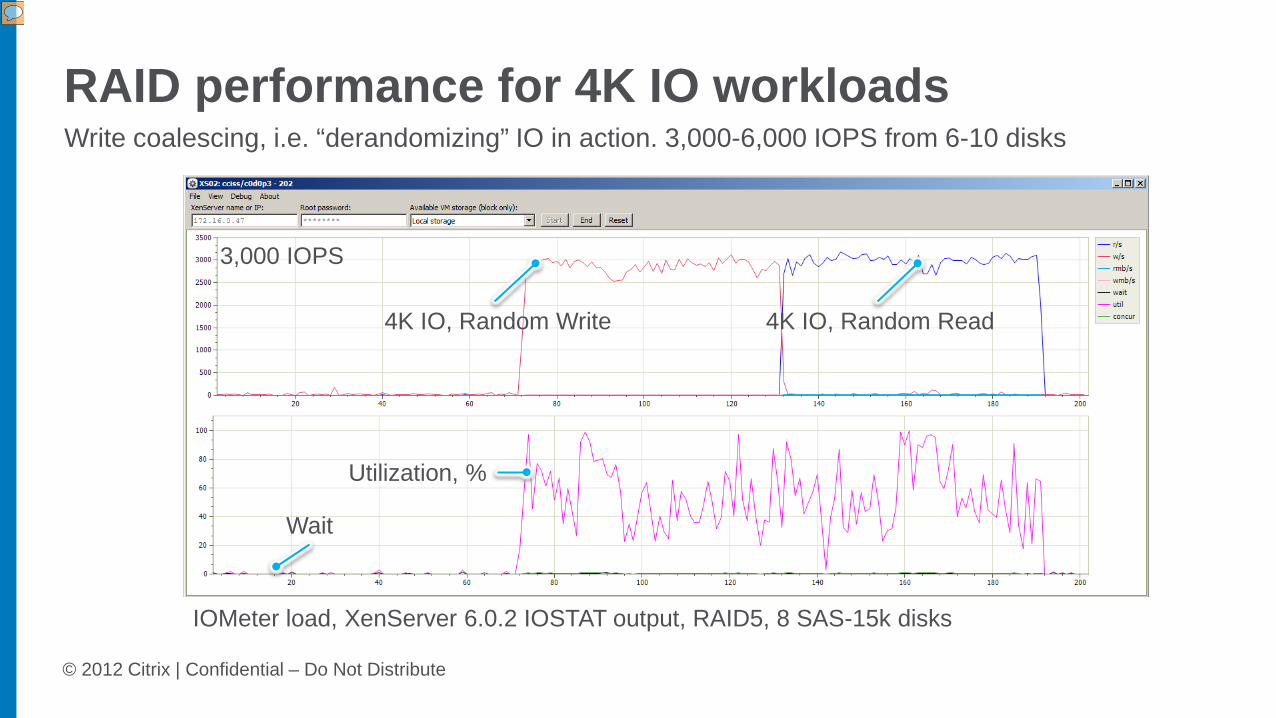
Given the write-cache nature of the discussed workloads, the use of storage grade RAID controllers with 15k SAS drives and pass-through caching enabled there is a significant benefit of write coalescing, in other words the ability to “derandomize” IO while passing it through the controllers cache. As an example, here is a 3,000 IOPS output from a 8 disk RAID5 array. Tests with 10 disks RAID6 and RAID10 arrays demonstrated 5,000-6,000 IOPs at 4K 100% random write load.
• For reliability, good performance under failure choose:○ RAID10
• For RAID with 5 disks or more:○ RAID6
Presenter
Presentation Notes
When selecting a RAID configuration that should support significant number of concurrent users, here is a few suggestions: RAID0 should not be considered due to the high risk of system loss with a single drive failure. RAID1 (“mirror) could be a good choice as long as capacity and performance is adequate, which is rarely the case with 200-400GB disk drives. RAID5 is often a favorite, but does not perform well in the degraded state especially on disk rebuild making system extremely vulnerable before the second disk failure. RAID6, although exposed to potentially slower write performance with higher white penalty, is an excellent choice for arrays with 5 and more disks due to ability to sustain 2. .consecutive random disk failures. New hardware did improve write performance significantly making it almost indistinguishable from other “high performance” RAIDs. RAID10(1+0), unlike parity based RAIDs, performs well in the degraded state and have less performance impact on disk rebuild. However it is often recommended to consider. RAID6 for larger arrays.
While SSD costs had subsided, the “enterprise grade” SSDs are expensive. SSD reliability had also improved with some vendors offering 5 year warranties with ability to sustain 10 full rewrites per day without much performance degradation. Background processes such as garbage collection can significantly impact SSD performance under continuous heavy write load. This aspect of SSDs can be the main obstacle for their wider adoption. This is where dedicated SSD arrays available from Citrix partners can provide an excellent alternative due to their advanced algorithms in handling SSDs (this subject is outside the scope of this presentation).
Quest for an agile well balanced server
Presenter
Presentation Notes
So, what will be the best choice of hardware that can be considered “an agile, well balanced” server?
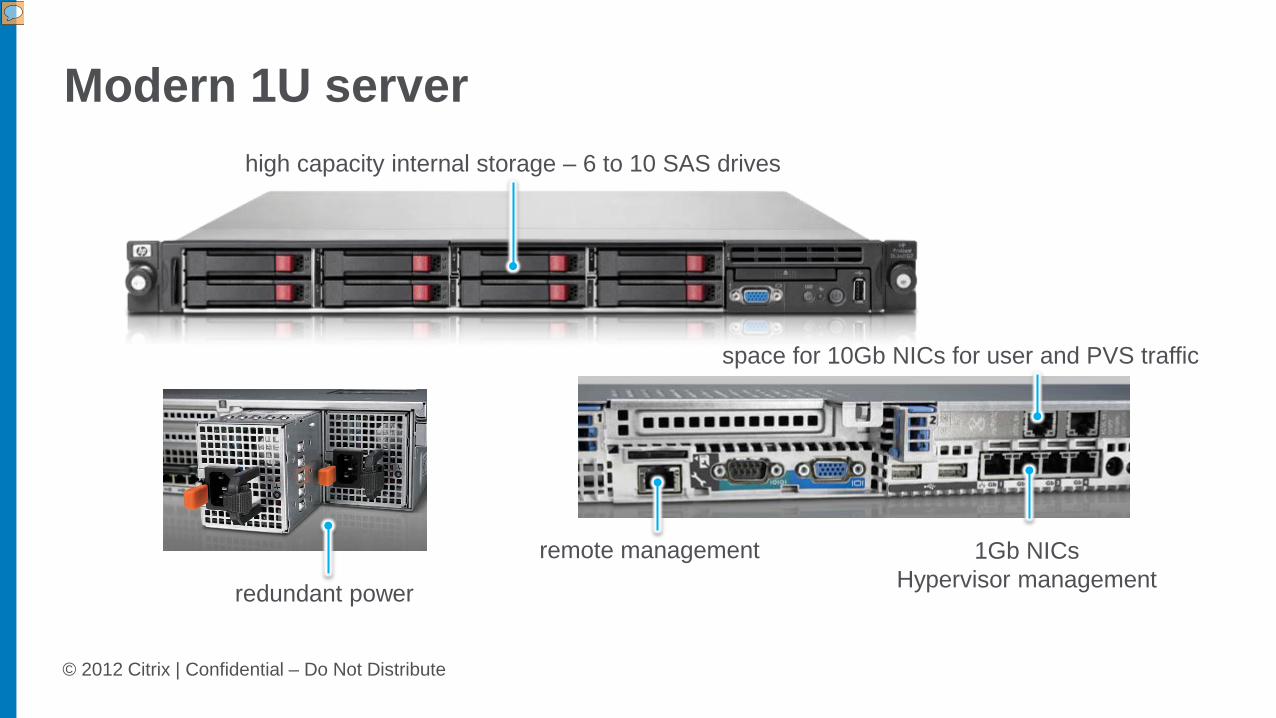
high capacity internal storage – 6 to 10 SAS drives
1Gb NICsHypervisor management
remote management
space for 10Gb NICs for user and PVS traffic
Presenter
Presentation Notes
Unlike a few years back, 1U server do offer 6 to 10 disk capacities and are equipped with redundant power supplies and abundance of connectivity options.
It is common to find a mainstream, “commodity” server with 2 socket, 12-16 core CPUs. 146-300Gb 15K SAS drives and storage grade RAID controllers with a large cache.
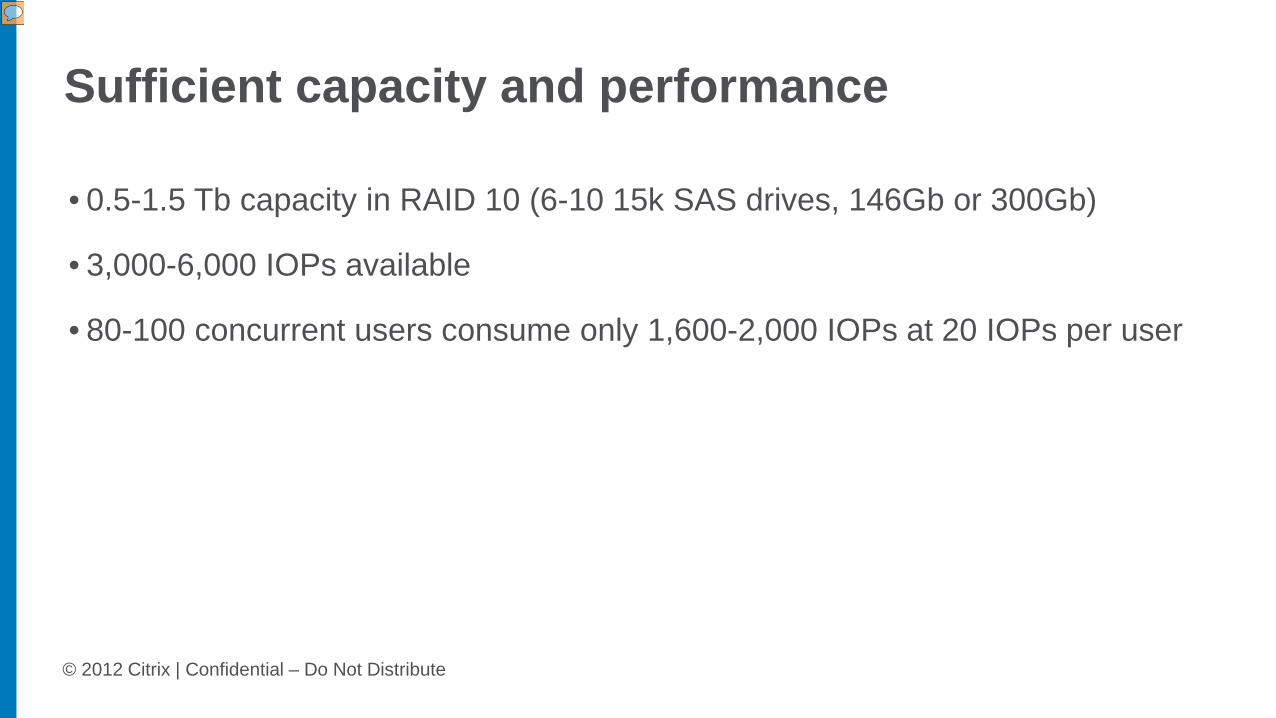
• 0.5-1.5 Tb capacity in RAID 10 (6-10 15k SAS drives, 146Gb or 300Gb)
• 3,000-6,000 IOPs available
• 80-100 concurrent users consume only 1,600-2,000 IOPs at 20 IOPs per user
Presenter
Presentation Notes
These servers have sufficient capacity to deliver even RAID10 configurations with 3,000 to 6,000 IOPs available. This is at the time when 80-100 concurrent users are likely to consume only 1,600 to 2,000 IOPs at 20 IOPs per user.
• Under $200 per user at 80-100 user density per server
Presenter
Presentation Notes
These mainstream servers come at a mainstream price - $10,000 to $16,000 and are available from most leading server vendors. At 80 to 100 user density per server the per user price is well below $200, which is significantly less the industry average at $1,000 per user.
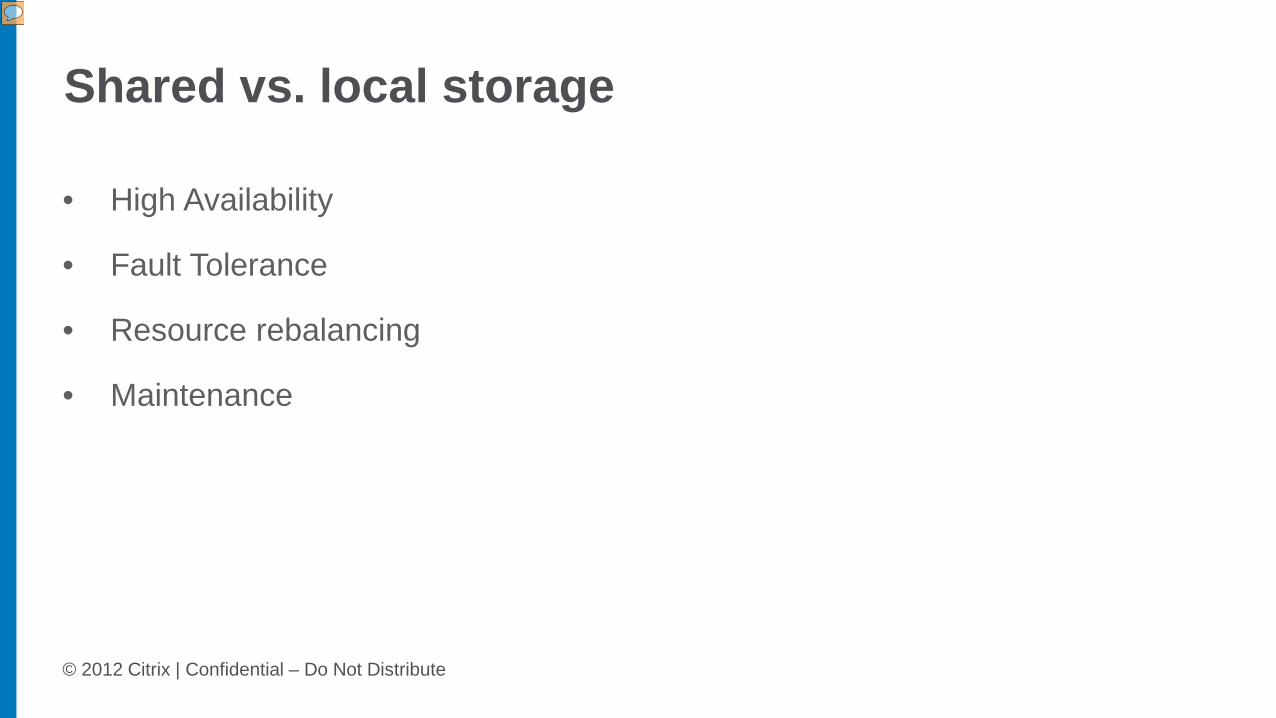
Design deltas: High availability (HA) with XenDesktop and PVS combination are achieved with both shared and internal storage. Although it is easier to achieve fault tolerance (FT) in a shared storage environment versus simple HA, most VDI implementations do not offer FT capabilities due to the prohibitive cost XenMotion, vMotion and LiveMigration allow for real time VM migration of individual VMs which is useful for on-the-fly hardware maintenance and resource rebalancing. However there are practical limits when migrating large number of VMs in a typical VDI implementation. Local storage design has provisions for planned VM migrations that can be accomplished by “bleeding” users to other physical hosts after the scheduled logoff and login. As of recently (September-October 2012), the introduction of Citrix XenServer 6.1 and Microsoft Hyper-V 2012 made live VM migration between hypervisors that do not share storage a reality.
Building block:○ 1 rack○ 2 PVS Servers○ 2-4 XenServer pools, ~8-16 servers each○ Local 10Gb interfaces○ Utilize PVS subnet affinity○ Estimated user count ~ 3,000 to 4,000
Presenter
Presentation Notes
When assembling micro-PODs the following might prove useful: Consider deployment of 2 PVS servers per rack Utilize PVS subnet affinity Avoid VM multi-homing by leveraging local 10Gb interfaces Depending on the load and hypervisor, deploy 8-16 server pools Replicate source VHDs to local PVS storage for redundancy Maintain VHD archives on shared storage With 80 to 100 users per server expect 3,000 to 4,000 users per rack Do not focus on user density as the only success criteria
• Implement modular design for consistent performance and achieve
sustainable growth
• $200 per user in hardware costs is feasible
Presenter
Presentation Notes
Hardware cost reduction from $1,000+ per user to under $200 Easy to benchmark and maintain Linear scalability from small implementations to very large deployments (author had implemented over 200 hosts in a single deployment)