sudan acute food insecurity situation - · pdf filethe mid-season report ... training and...
TRANSCRIPT
1
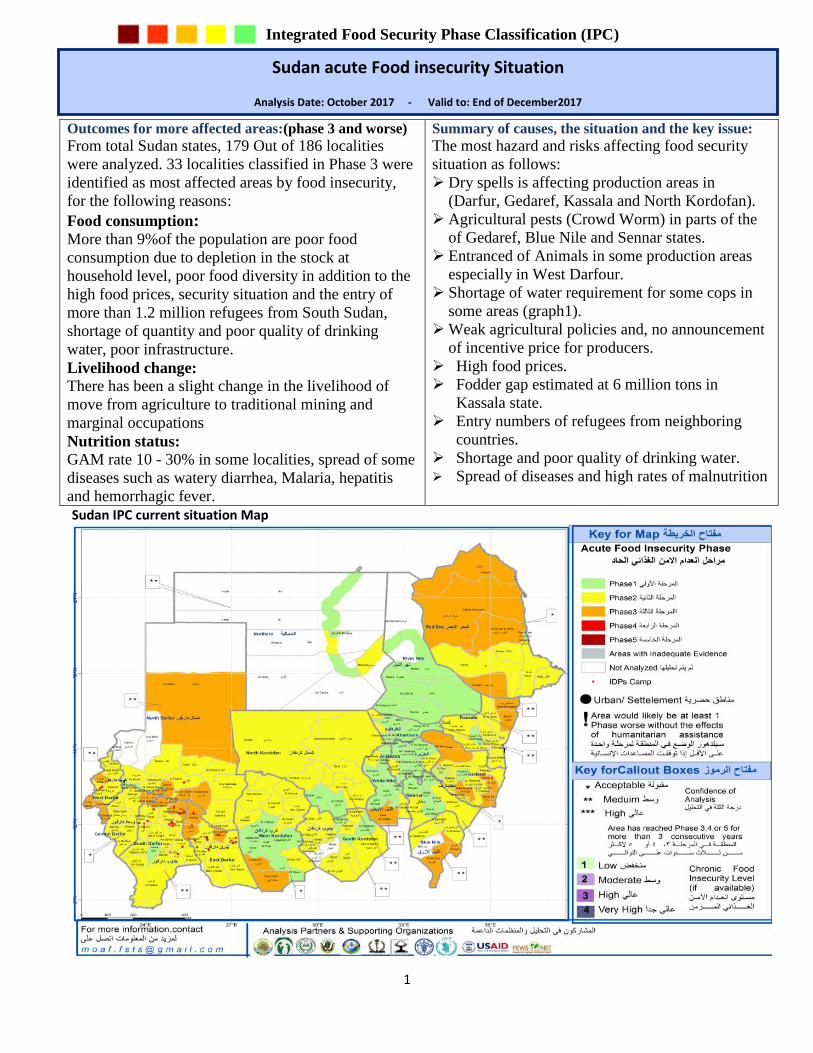
Summary of causes, the situation and the key issue:
The most hazard and risks affecting food security
situation as follows:
Dry spells is affecting production areas in
(Darfur, Gedaref, Kassala and North Kordofan).
Agricultural pests (Crowd Worm) in parts of the
of Gedaref, Blue Nile and Sennar states.
Entranced of Animals in some production areas
especially in West Darfour.
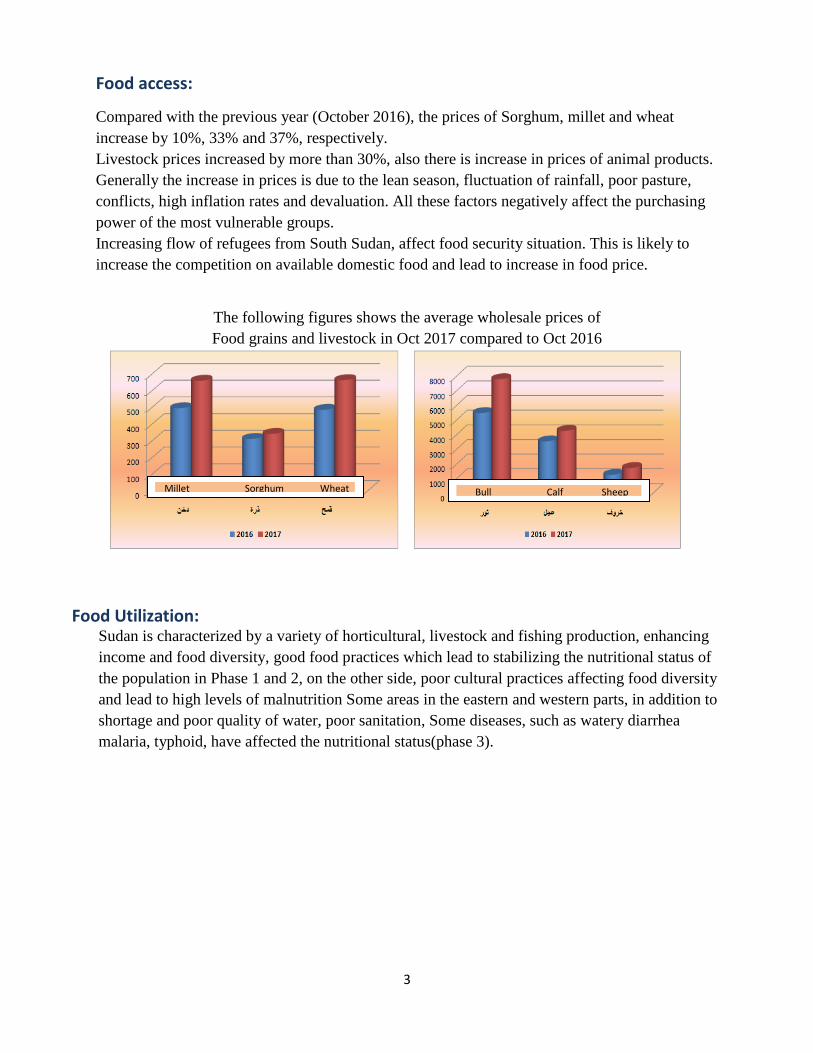
Shortage of water requirement for some cops in
some areas (graph1).
Weak agricultural policies and, no announcement
of incentive price for producers.
High food prices.
Fodder gap estimated at 6 million tons in
Kassala state.
Entry numbers of refugees from neighboring
countries.
Shortage and poor quality of drinking water.
Spread of diseases and high rates of malnutrition
Outcomes for more affected areas:(phase 3 and worse)
From total Sudan states, 179 Out of 186 localities
were analyzed. 33 localities classified in Phase 3 were
identified as most affected areas by food insecurity,
for the following reasons:
Food consumption: More than 9%of the population are poor food
consumption due to depletion in the stock at
household level, poor food diversity in addition to the
high food prices, security situation and the entry of
more than 1.2 million refugees from South Sudan,
shortage of quantity and poor quality of drinking
water, poor infrastructure.
Livelihood change: There has been a slight change in the livelihood of
move from agriculture to traditional mining and
marginal occupations
Nutrition status: GAM rate 10 - 30% in some localities, spread of some
diseases such as watery diarrhea, Malaria, hepatitis
and hemorrhagic fever.
Sudan IPC current situation Map
Integrated Food Security Phase Classification (IPC)
Sudan acute Food insecurity Situation
Analysis Date: October 2017 - Valid to: End of December2017
2
Part 2: Summary of Findings, Methods, and Next Steps
Food Availability: The mid-season report (Sep 2017) indicate that the agricultural season in most production
areas is good, Sorghum cultivated area (until the end of September) is estimated by 86% of the
total targeted area, while the cultivated area of Millet is increased by 21% of the target area due
to early rain in some areas of Millet production and the incentive price of millet.
Some Parts of North, South, West and Central Darfur, Kassala, Gedaref and North Kordofan
have been affected by dry spells.
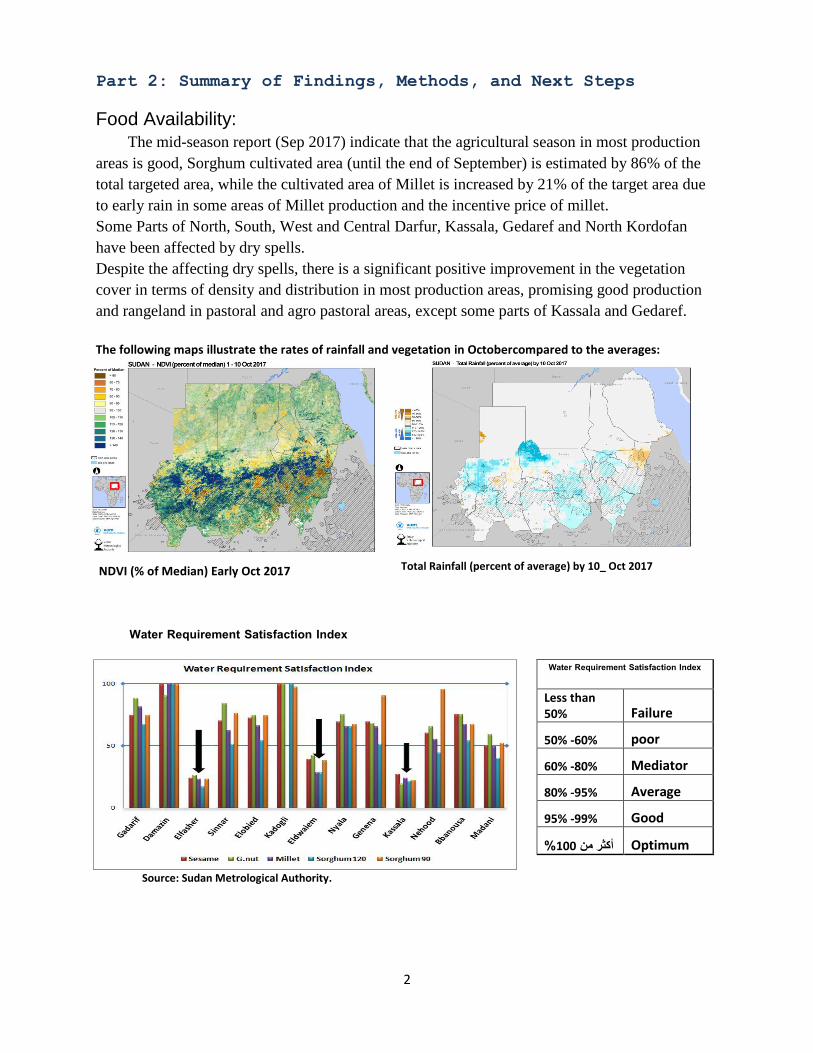
Despite the affecting dry spells, there is a significant positive improvement in the vegetation
cover in terms of density and distribution in most production areas, promising good production
and rangeland in pastoral and agro pastoral areas, except some parts of Kassala and Gedaref.
The following maps illustrate the rates of rainfall and vegetation in Octobercompared to the averages:
Water Requirement Satisfaction Index
Water Requirement Satisfaction Index
Less than 50% Failure
50% -60% poor
60% -80% Mediator
80% -95% Average
95% -99% Good
%011أكثر من Optimum
Source: Sudan Metrological Authority.
Total Rainfall (percent of average) by 10_ Oct 2017 NDVI (% of Median) Early Oct 2017
3
Food access:
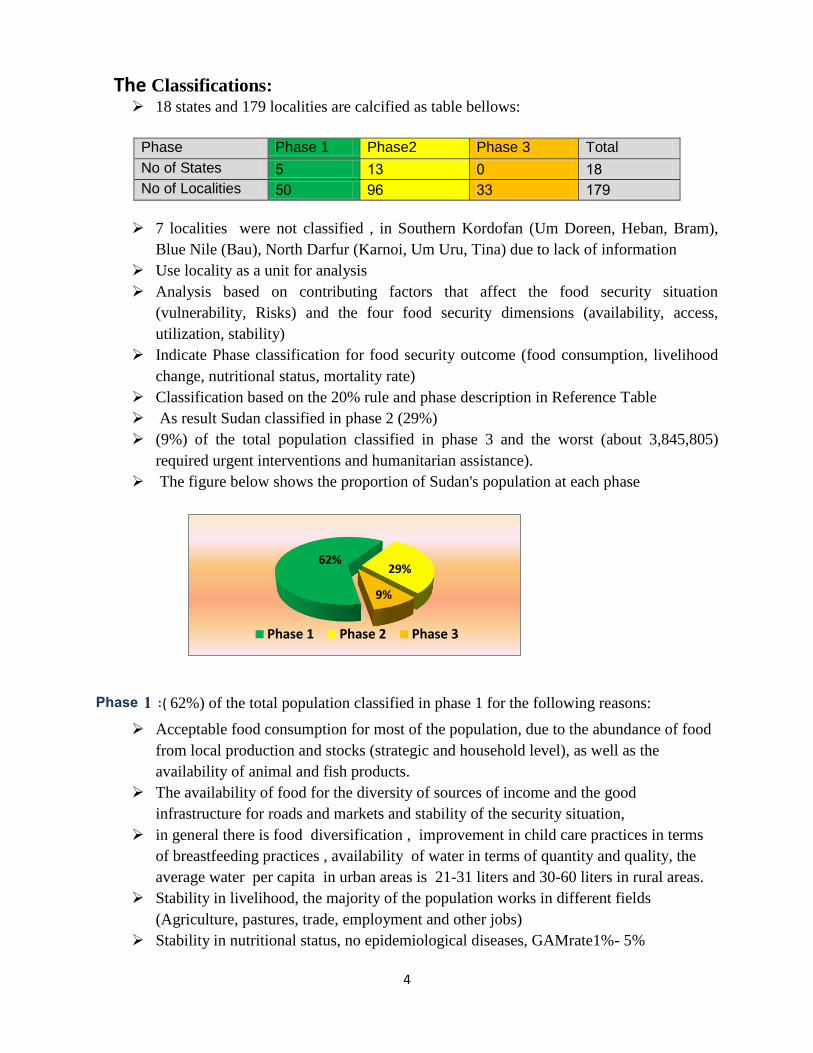
Compared with the previous year (October 2016), the prices of Sorghum, millet and wheat
increase by 10%, 33% and 37%, respectively.
Livestock prices increased by more than 30%, also there is increase in prices of animal products.
Generally the increase in prices is due to the lean season, fluctuation of rainfall, poor pasture,
conflicts, high inflation rates and devaluation. All these factors negatively affect the purchasing
power of the most vulnerable groups.
Increasing flow of refugees from South Sudan, affect food security situation. This is likely to
increase the competition on available domestic food and lead to increase in food price.
The following figures shows the average wholesale prices of
Food grains and livestock in Oct 2017 compared to Oct 2016
Food Utilization:
Sudan is characterized by a variety of horticultural, livestock and fishing production, enhancing
income and food diversity, good food practices which lead to stabilizing the nutritional status of
the population in Phase 1 and 2, on the other side, poor cultural practices affecting food diversity
and lead to high levels of malnutrition Some areas in the eastern and western parts, in addition to
shortage and poor quality of water, poor sanitation, Some diseases, such as watery diarrhea
malaria, typhoid, have affected the nutritional status(phase 3).
Millet Sorghum Wheat Bull Calf Sheep
4
The Classifications: 18 states and 179 localities are calcified as table bellows:
Phase Phase 1 Phase2 Phase 3 Total No of States 5 31 0 31 No of Localities 50 69 11 376
7 localities were not classified , in Southern Kordofan (Um Doreen, Heban, Bram),
Blue Nile (Bau), North Darfur (Karnoi, Um Uru, Tina) due to lack of information
Use locality as a unit for analysis
Analysis based on contributing factors that affect the food security situation
(vulnerability, Risks) and the four food security dimensions (availability, access,
utilization, stability)
Indicate Phase classification for food security outcome (food consumption, livelihood
change, nutritional status, mortality rate)
Classification based on the 20% rule and phase description in Reference Table
As result Sudan classified in phase 2 (29%)
(9%) of the total population classified in phase 3 and the worst (about 3,845,805)
required urgent interventions and humanitarian assistance).
The figure below shows the proportion of Sudan's population at each phase
Phase 1 :( 62%) of the total population classified in phase 1 for the following reasons:
Acceptable food consumption for most of the population, due to the abundance of food
from local production and stocks (strategic and household level), as well as the
availability of animal and fish products.
The availability of food for the diversity of sources of income and the good
infrastructure for roads and markets and stability of the security situation,
in general there is food diversification , improvement in child care practices in terms
of breastfeeding practices , availability of water in terms of quantity and quality, the
average water per capita in urban areas is 21-31 liters and 30-60 liters in rural areas.
Stability in livelihood, the majority of the population works in different fields
(Agriculture, pastures, trade, employment and other jobs)
Stability in nutritional status, no epidemiological diseases, GAMrate1%- 5%
62% 29%
9%
Phase 1 Phase 2 Phase 3
5
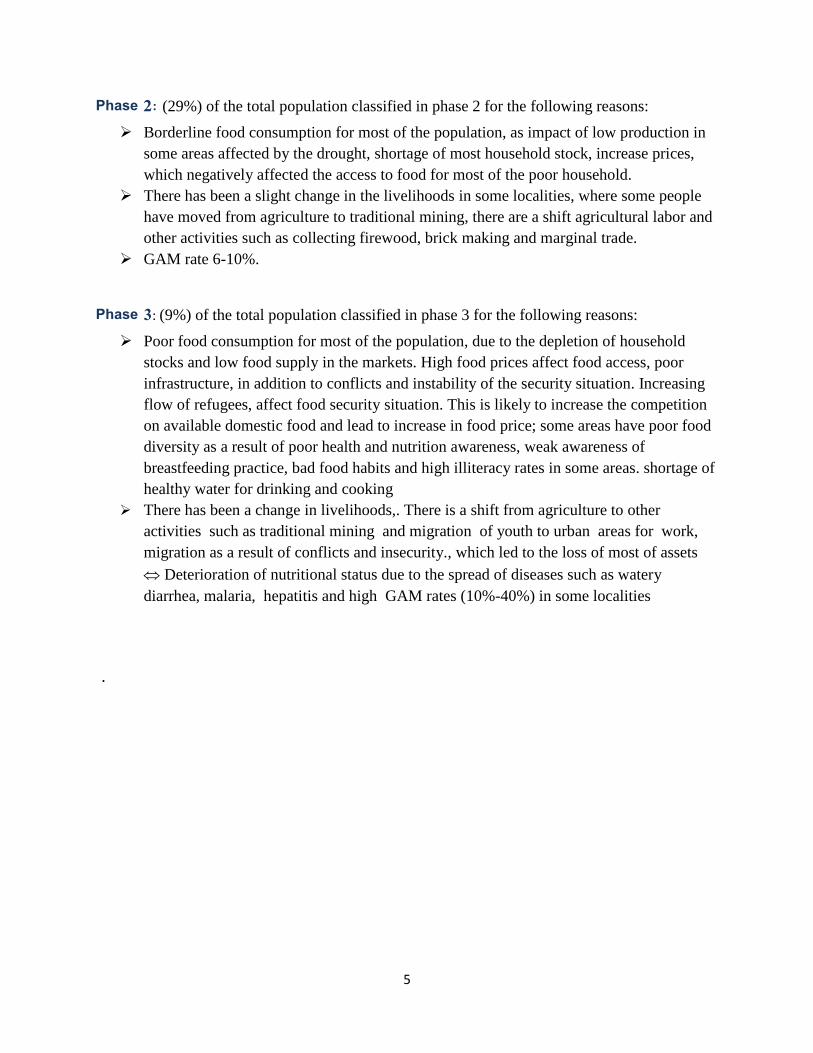
Phase 2: (29%) of the total population classified in phase 2 for the following reasons:
Borderline food consumption for most of the population, as impact of low production in
some areas affected by the drought, shortage of most household stock, increase prices,
which negatively affected the access to food for most of the poor household.
There has been a slight change in the livelihoods in some localities, where some people
have moved from agriculture to traditional mining, there are a shift agricultural labor and
other activities such as collecting firewood, brick making and marginal trade.
GAM rate 6-10%.
Phase 3: (9%) of the total population classified in phase 3 for the following reasons:
Poor food consumption for most of the population, due to the depletion of household
stocks and low food supply in the markets. High food prices affect food access, poor
infrastructure, in addition to conflicts and instability of the security situation. Increasing
flow of refugees, affect food security situation. This is likely to increase the competition
on available domestic food and lead to increase in food price; some areas have poor food
diversity as a result of poor health and nutrition awareness, weak awareness of
breastfeeding practice, bad food habits and high illiteracy rates in some areas. shortage of
healthy water for drinking and cooking
There has been a change in livelihoods,. There is a shift from agriculture to other
activities such as traditional mining and migration of youth to urban areas for work,
migration as a result of conflicts and insecurity., which led to the loss of most of assets
Deterioration of nutritional status due to the spread of diseases such as watery
diarrhea, malaria, hepatitis and high GAM rates (10%-40%) in some localities
.
6
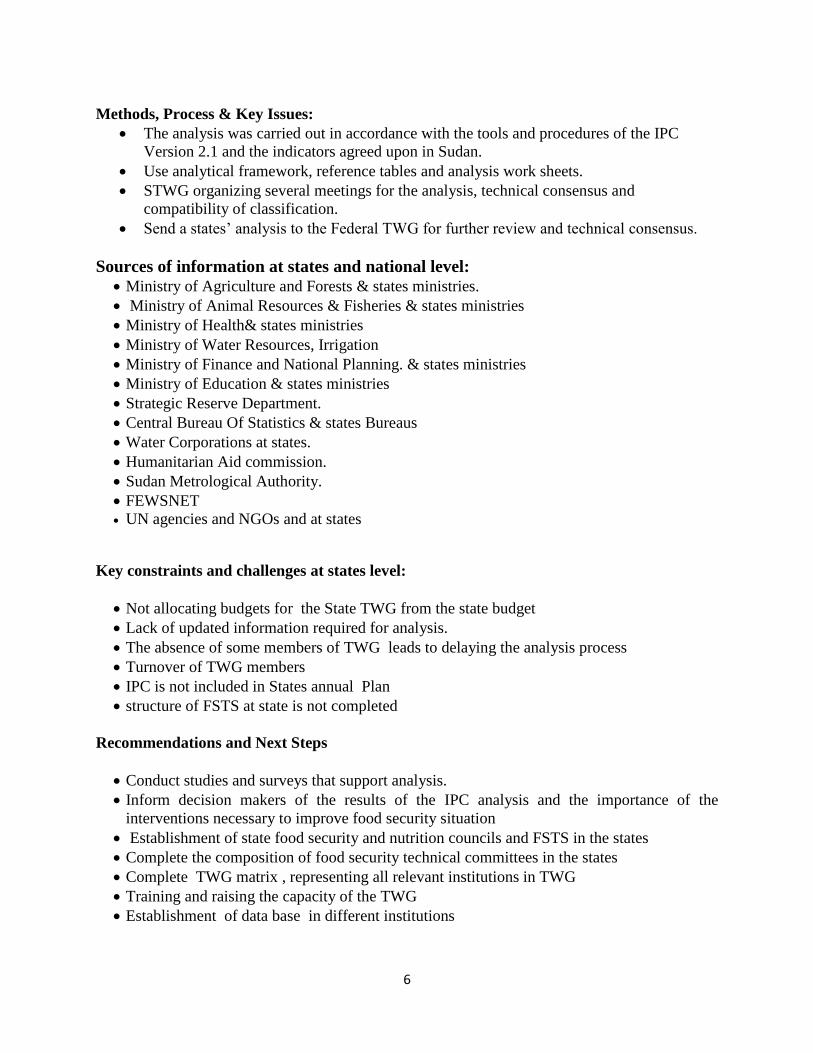
Methods, Process & Key Issues:
The analysis was carried out in accordance with the tools and procedures of the IPC
Version 2.1 and the indicators agreed upon in Sudan.
Use analytical framework, reference tables and analysis work sheets.
STWG organizing several meetings for the analysis, technical consensus and
compatibility of classification.
Send a states’ analysis to the Federal TWG for further review and technical consensus.
Sources of information at states and national level:
Ministry of Agriculture and Forests & states ministries.
Ministry of Animal Resources & Fisheries & states ministries
Ministry of Health& states ministries
Ministry of Water Resources, Irrigation
Ministry of Finance and National Planning. & states ministries
Ministry of Education & states ministries
Strategic Reserve Department.
Central Bureau Of Statistics & states Bureaus
Water Corporations at states.
Humanitarian Aid commission.
Sudan Metrological Authority.
FEWSNET
UN agencies and NGOs and at states
Key constraints and challenges at states level:
Not allocating budgets for the State TWG from the state budget
Lack of updated information required for analysis.
The absence of some members of TWG leads to delaying the analysis process
Turnover of TWG members
IPC is not included in States annual Plan
structure of FSTS at state is not completed
Recommendations and Next Steps
Conduct studies and surveys that support analysis.
Inform decision makers of the results of the IPC analysis and the importance of the
interventions necessary to improve food security situation
Establishment of state food security and nutrition councils and FSTS in the states
Complete the composition of food security technical committees in the states
Complete TWG matrix , representing all relevant institutions in TWG
Training and raising the capacity of the TWG
Establishment of data base in different institutions
7
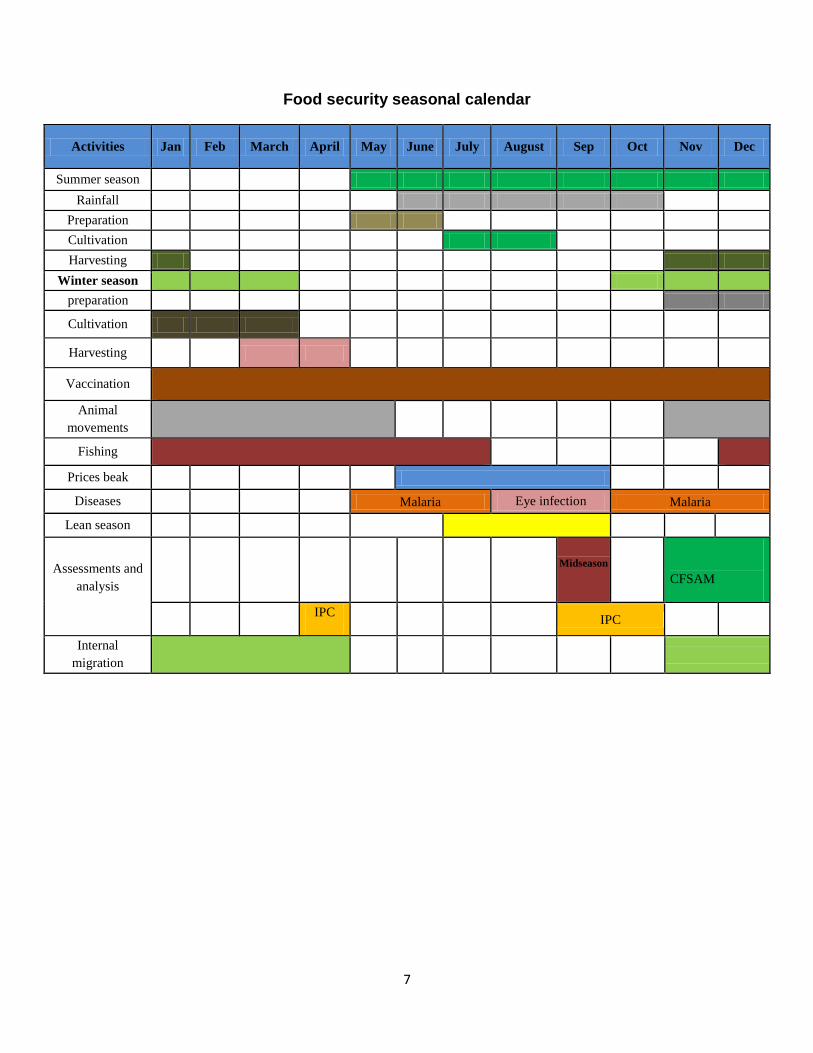
Food security seasonal calendar
Activities Jan Feb March April May June July August Sep Oct Nov Dec
Summer season
Rainfall
Preparation
Cultivation
Harvesting
Winter season
preparation
Cultivation
Harvesting
Vaccination
Animal
movements
Fishing
Prices beak
Diseases Malaria Eye infection Malaria
Lean season
Assessments and
analysis
Midseason
CFSAM
IPC
IPC
Internal
migration
8
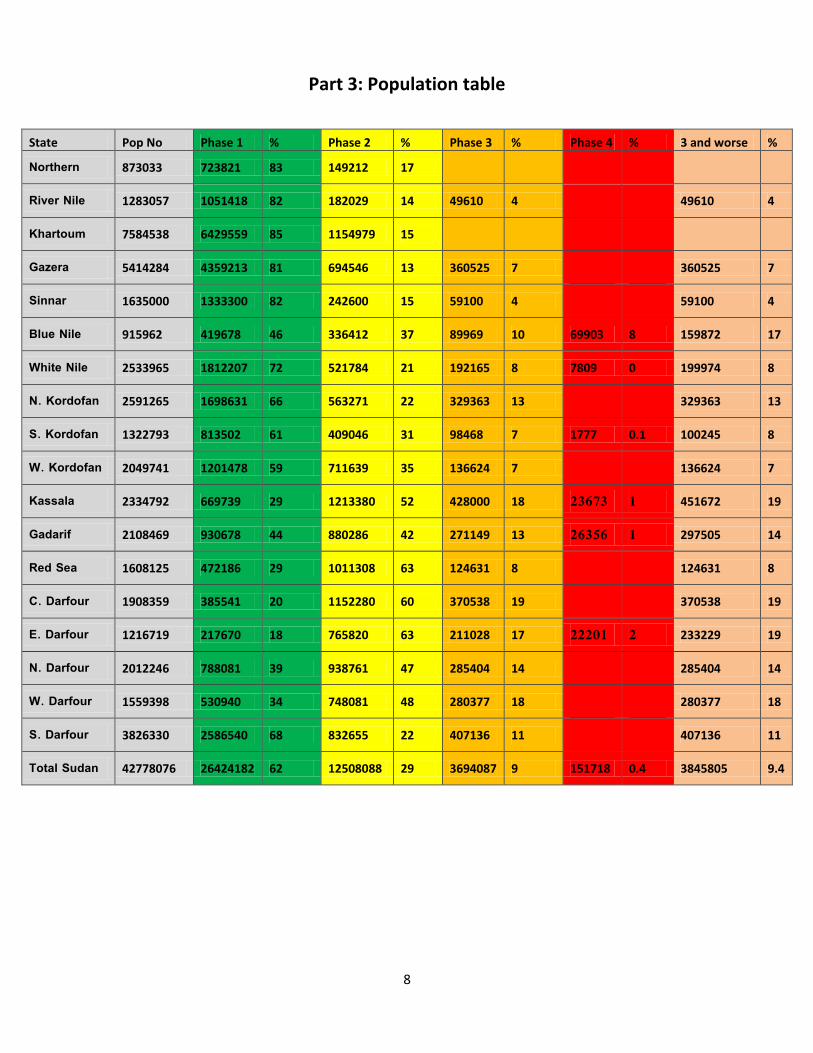
Part 3: Population table
State Pop No Phase 1 % Phase 2 % Phase 3 % Phase 4 % 3 and worse %
Northern 873033 723821 83 149212 17
River Nile 1283057 1051418 82 182029 14 49610 4
49610 4
Khartoum 7584538 6429559 85 1154979 15
Gazera 5414284 4359213 81 694546 13 360525 7
360525 7
Sinnar 1635000 1333300 82 242600 15 59100 4
59100 4
Blue Nile 915962 419678 46 336412 37 89969 10 69903 8 159872 17
White Nile 2533965 1812207 72 521784 21 192165 8 7809 0 199974 8
N. Kordofan 2591265 1698631 66 563271 22 329363 13
329363 13
S. Kordofan 1322793 813502 61 409046 31 98468 7 1777 0.1 100245 8
W. Kordofan 2049741 1201478 59 711639 35 136624 7
136624 7
Kassala 2334792 669739 29 1213380 52 428000 18 23673 1 451672 19
Gadarif 2108469 930678 44 880286 42 271149 13 26356 1 297505 14
Red Sea 1608125 472186 29 1011308 63 124631 8
124631 8
C. Darfour 1908359 385541 20 1152280 60 370538 19
370538 19
E. Darfour 1216719 217670 18 765820 63 211028 17 22201 2 233229 19
N. Darfour 2012246 788081 39 938761 47 285404 14
285404 14
W. Darfour 1559398 530940 34 748081 48 280377 18
280377 18
S. Darfour 3826330 2586540 68 832655 22 407136 11
407136 11
Total Sudan 42778076 26424182 62 12508088 29 3694087 9 151718 0.4 3845805 4.9
9
Strategic objectives
Recommendations for interventions:
Interventions range from short-term interventions to medium- and long-term interventions
population in phase 1 and 2 needs development programs that enable them to build capacity and
raise their resilience to cope with crises. While population in phase 3 need firstly food aid and
then other interventions for recovery and capacity-building.
Phase I and 2
Technical packages to improve productivity
Development and improve Agricultural marketing
Improve food processing and household farming
Support the extension services to improve the crop and animal performance.
Exemption agricultural inputs from taxes
Integration of Federal and states efforts to achieved food security
Set price policies to control food prices
Activate microfinance for small farmers
Activate of producers associations
Activate the role of strategic reserve department in price concentration.
Intensifying women and child care awareness campaigns
Programmes to change the poor cultural practices.
Supporting agricultural exports
Improve infrastructure (Roads, Markets, Transportation…)
Phase 3
Providing food aid to the most affected population
Protecting livelihood assets from deterioration
Reduce the effect of risks (high prices, floods, conflicts...)
Prevention nutrition programmes to improve the nutrition status
Open animal routes to avoid conflict between farmers and herders
Support the early warning systems for close monitoring and precautions
Continue supporting conflict resolutions and peace building