successful strategies in traditional trade around … · successful strategies in traditional trade...
TRANSCRIPT
Pedro Manosalva May 2016
SUCCESSFUL STRATEGIES IN TRADITIONAL TRADE AROUND THE GLOBE
Co
pyr
igh
t ©
2016
Th
e N
iels
en C
om
pan
y. C
on
fid
enti
al a
nd
pro
pri
etar
y.
2
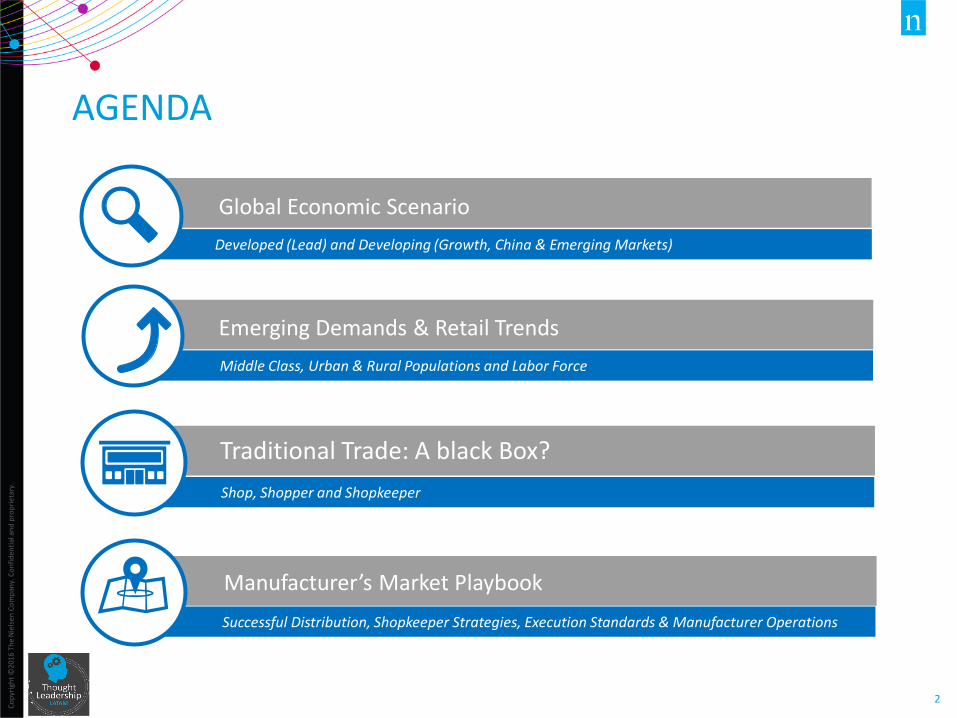
AGENDA
Global Economic Scenario
Developed (Lead) and Developing (Growth, China & Emerging Markets)
Middle Class, Urban & Rural Populations and Labor Force
Traditional Trade: A black Box?
Shop, Shopper and Shopkeeper
Manufacturer’s Market Playbook
Successful Distribution, Shopkeeper Strategies, Execution Standards & Manufacturer Operations
Emerging Demands & Retail Trends

GLOBAL ECONOMIC SCENARIO
Co
pyr
igh
t ©
2016
Th
e N
iels
en C
om
pan
y. C
on
fid
enti
al a
nd
pro
pri
etar
y.
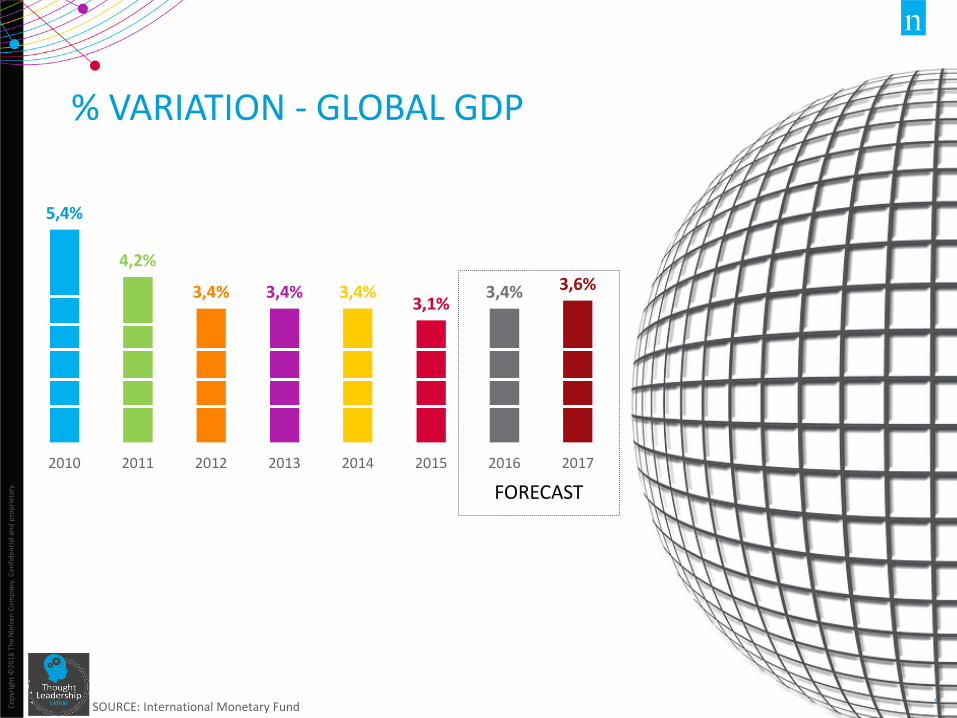
4 SOURCE: International Monetary Fund
% VARIATION - GLOBAL GDP
5,4%
4,2%
3,4% 3,4% 3,4% 3,1%
3,4% 3,6%
2010 2011 2012 2013 2014 2015 2016 2017
FORECAST
Co
pyr
igh
t ©
2016
Th
e N
iels
en C
om
pan
y. C
on
fid
enti
al a
nd
pro
pri
etar
y.
5
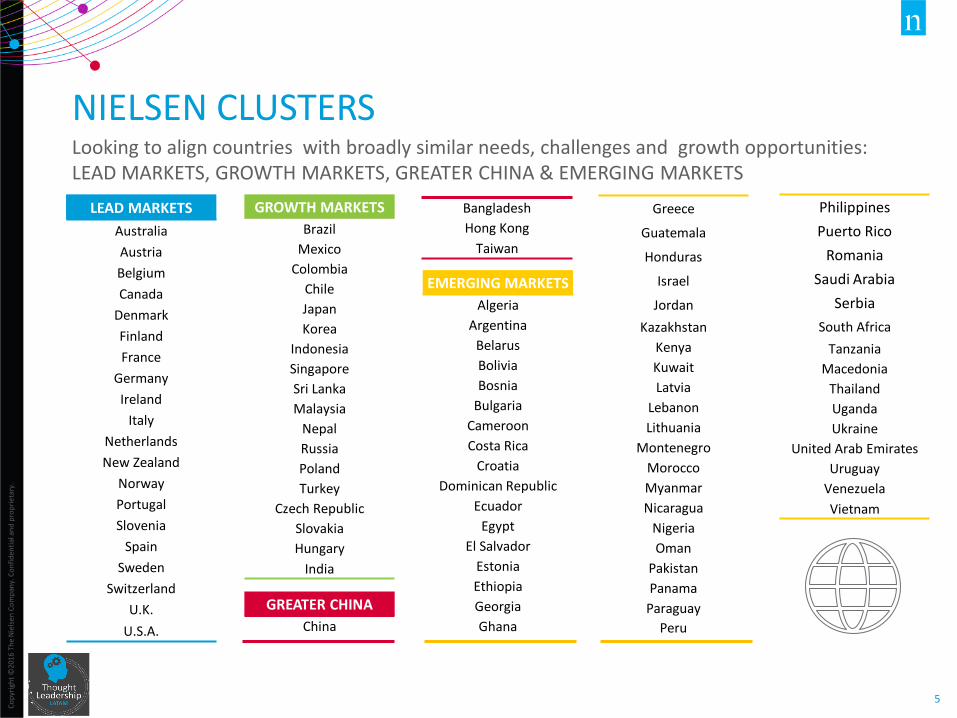
NIELSEN CLUSTERS Looking to align countries with broadly similar needs, challenges and growth opportunities: LEAD MARKETS, GROWTH MARKETS, GREATER CHINA & EMERGING MARKETS
GROWTH MARKETS
Brazil
Mexico
Colombia
Chile
Japan
Korea
Indonesia
Singapore
Sri Lanka
Malaysia
Nepal
Russia
Poland
Turkey
Czech Republic
Slovakia
Hungary
India
GREATER CHINA
China
LEAD MARKETS
Australia
Austria
Belgium
Canada
Denmark
Finland
France
Germany
Ireland
Italy
Netherlands
New Zealand
Norway
Portugal
Slovenia
Spain
Sweden
Switzerland
U.K.
U.S.A.
EMERGING MARKETS
Algeria
Argentina
Belarus
Bolivia
Bosnia
Bulgaria
Cameroon
Costa Rica
Croatia
Dominican Republic
Ecuador
Egypt
El Salvador
Estonia
Ethiopia
Georgia
Ghana
Greece
Guatemala
Honduras
Israel
Jordan
Kazakhstan
Kenya
Kuwait
Latvia
Lebanon
Lithuania
Montenegro
Morocco
Myanmar
Nicaragua
Nigeria
Oman
Pakistan
Panama
Paraguay
Peru
Philippines
Puerto Rico
Romania
Saudi Arabia
Serbia
South Africa
Tanzania
Macedonia
Thailand
Uganda
Ukraine
United Arab Emirates
Uruguay
Venezuela
Vietnam
Bangladesh
Hong Kong
Taiwan
Co
pyr
igh
t ©
2016
Th
e N
iels
en C
om
pan
y. C
on
fid
enti
al a
nd
pro
pri
etar
y.
6
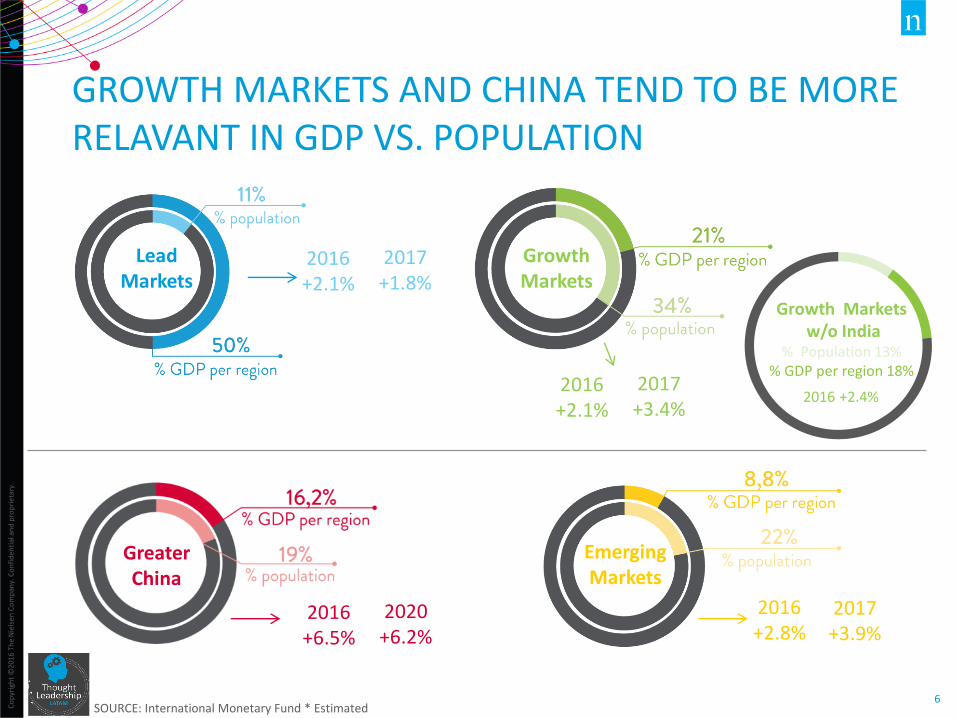
GROWTH MARKETS AND CHINA TEND TO BE MORE RELAVANT IN GDP VS. POPULATION
SOURCE: International Monetary Fund * Estimated
Lead Markets
2016 +2.1%
2017 +1.8%
Growth Markets w/o India
% Population 13% % GDP per region 18%
2016 +2.1%
2017 +3.4%
Growth Markets
2016 +6.5%
2020 +6.2%
Greater China
2016 +2.8%
2017 +3.9%
Emerging Markets
2016 +2.4%
Co
pyr
igh
t ©
2016
Th
e N
iels
en C
om
pan
y. C
on
fid
enti
al a
nd
pro
pri
etar
y.
7
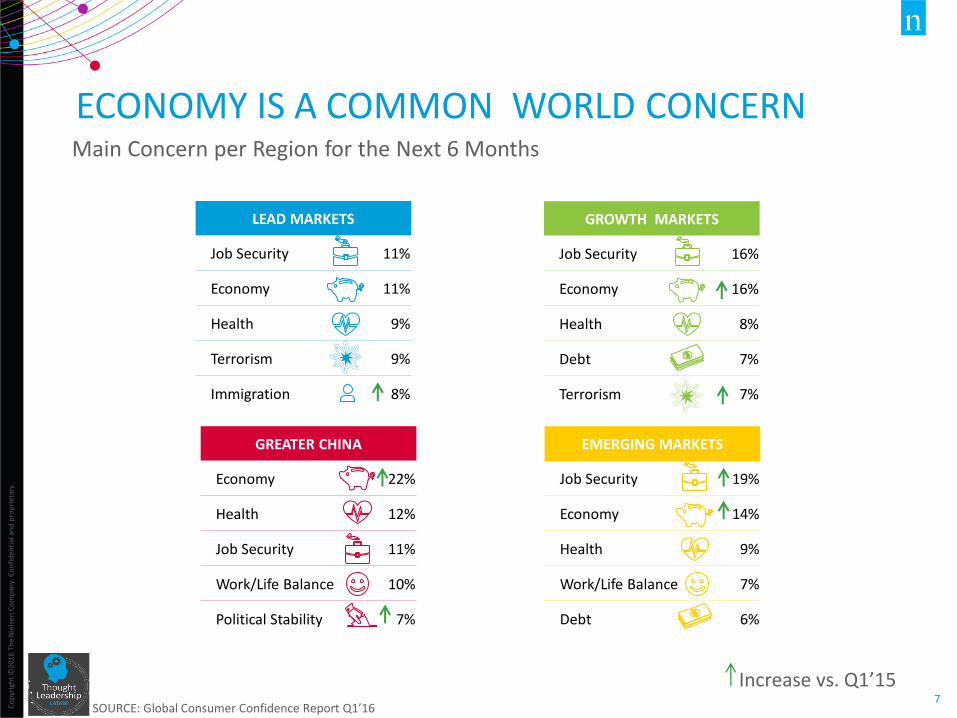
ECONOMY IS A COMMON WORLD CONCERN
Increase vs. Q1’15
EMERGING MARKETS
Job Security 19%
Economy 14%
Health 9%
Work/Life Balance 7%
Debt 6%
Main Concern per Region for the Next 6 Months
SOURCE: Global Consumer Confidence Report Q1’16
GREATER CHINA
Economy 22%
Health 12%
Job Security 11%
Work/Life Balance 10%
Political Stability 7%
GROWTH MARKETS
Job Security 16%
Economy 16%
Health 8%
Debt 7%
Terrorism 7%
LEAD MARKETS
Job Security 11%
Economy 11%
Health 9%
Terrorism 9%
Immigration 8%
Co
pyr
igh
t ©
2016
Th
e N
iels
en C
om
pan
y. C
on
fid
enti
al a
nd
pro
pri
etar
y.
8
0%
10%
20%
30%
40%
50%
60%
70%
80%
90%
100%
Den
mar
kN
ew Z
eala
nd
Ger
man
yC
zech
Rep
ub
licC
hin
aV
ietn
amA
ust
ralia
U.K
.P
hili
pp
ines
Swit
zerl
and
Slo
vaki
aLi
thu
ania
Swed
enSi
nga
po
reIs
rael
Ind
iaU
.S.
Ro
man
iaIr
elan
dP
ola
nd
UA
EIn
do
nes
iaN
eth
erla
nd
sLa
tvia
Sau
di A
rab
iaP
eru
Hu
nga
ryA
ust
ria
Bel
giu
mP
akis
tan
Ch
ileEs
ton
iaC
anad
aH
on
g K
on
gN
orw
ayB
ulg
aria
Slo
ven
iaSp
ain
Turk
ey
Po
rtu
gal
Co
lom
bia
Fran
ceEg
ypt
Tah
ilan
dJa
pan
Fin
lan
dG
ree
ceSo
uth
Afr
ica
Mal
aysi
aM
exic
oTa
iwan
Serb
iaA
rgen
tin
aIt
aly
Ru
ssia
Cro
atia
Ko
rea
Bra
sil
Ukr
ain
eV
enez
uel
a
LEAD MARKETS
GROWTH MARKETS
GREATER CHINA
EMERGING MARKETS
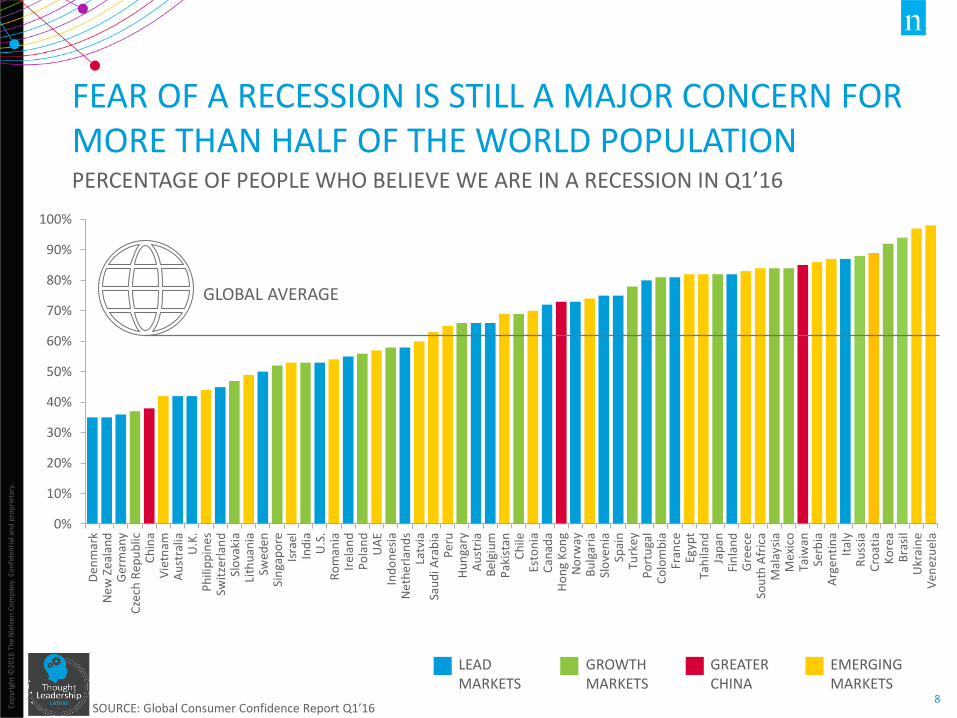
FEAR OF A RECESSION IS STILL A MAJOR CONCERN FOR MORE THAN HALF OF THE WORLD POPULATION PERCENTAGE OF PEOPLE WHO BELIEVE WE ARE IN A RECESSION IN Q1’16
SOURCE: Global Consumer Confidence Report Q1’16
GLOBAL AVERAGE
Co
pyr
igh
t ©
2016
Th
e N
iels
en C
om
pan
y. C
on
fid
enti
al a
nd
pro
pri
etar
y.
9
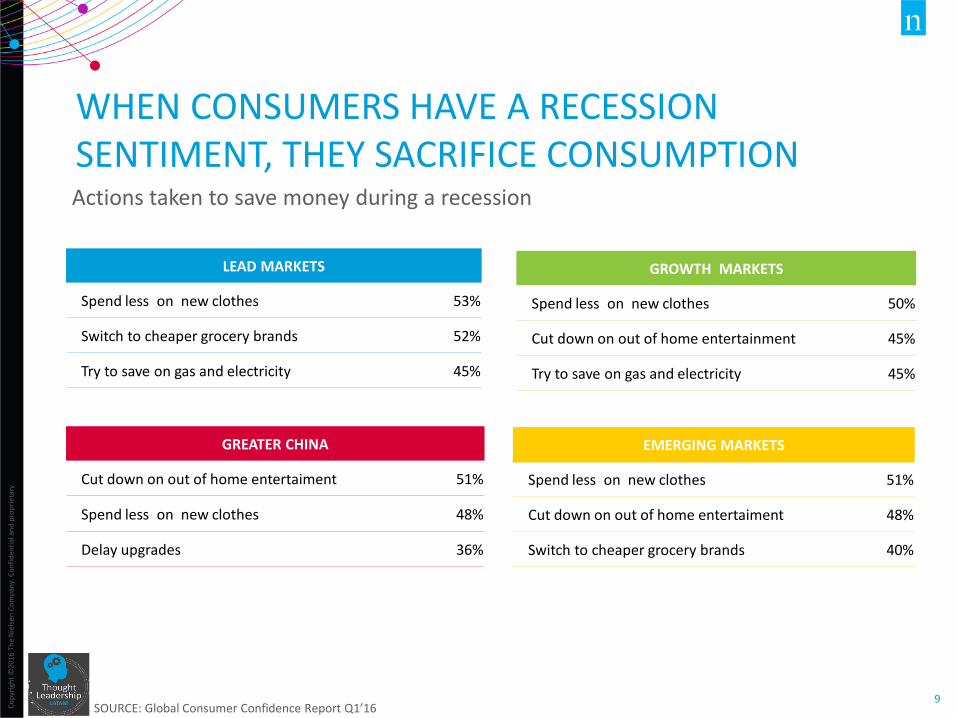
EMERGING MARKETS
Spend less on new clothes 51%
Cut down on out of home entertaiment 48%
Switch to cheaper grocery brands 40%
GREATER CHINA
Cut down on out of home entertaiment 51%
Spend less on new clothes 48%
Delay upgrades 36%
GROWTH MARKETS
Spend less on new clothes 50%
Cut down on out of home entertainment 45%
Try to save on gas and electricity 45%
LEAD MARKETS
Spend less on new clothes 53%
Switch to cheaper grocery brands 52%
Try to save on gas and electricity 45%
WHEN CONSUMERS HAVE A RECESSION SENTIMENT, THEY SACRIFICE CONSUMPTION Actions taken to save money during a recession
SOURCE: Global Consumer Confidence Report Q1’16

EMERGING DEMANDS & RETAIL TRENDS
Co
pyr
igh
t ©
2016
Th
e N
iels
en C
om
pan
y. C
on
fid
enti
al a
nd
pro
pri
etar
y.
11
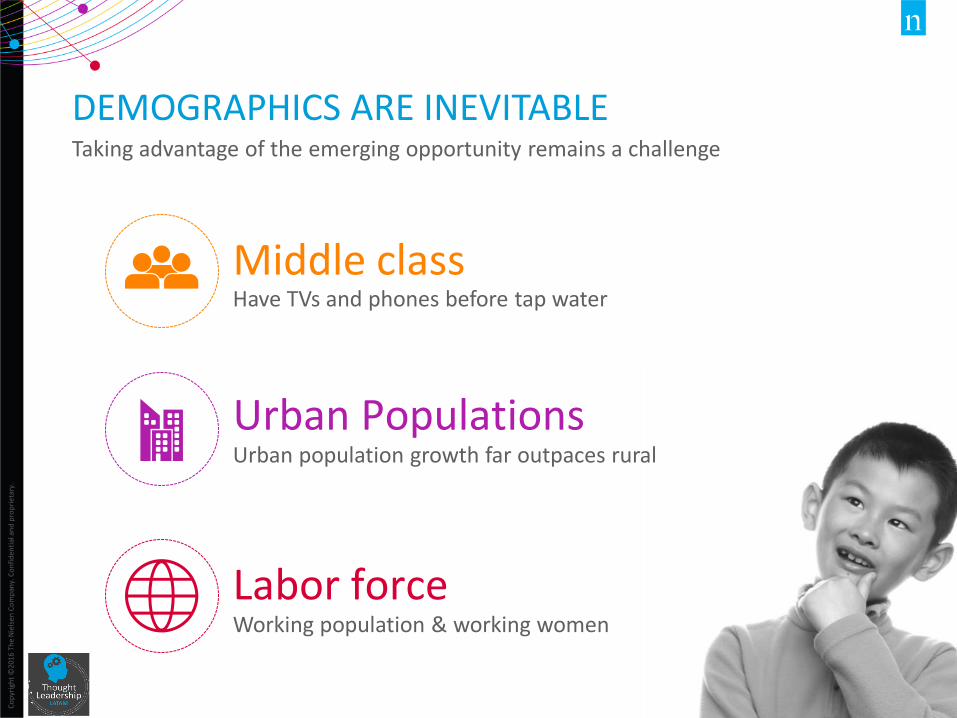
DEMOGRAPHICS ARE INEVITABLE Taking advantage of the emerging opportunity remains a challenge
Middle class
Labor force
Urban Populations
Working population & working women
Urban population growth far outpaces rural
Have TVs and phones before tap water

Co
pyr
igh
t ©
2016
Th
e N
iels
en C
om
pan
y. C
on
fid
enti
al a
nd
pro
pri
etar
y.
12
DEMOGRAPHICS ARE INEVITABLE Taking advantage of the emerging opportunity remains a challenge
LESS TIME AVAILABLE MORE CONVENIENCE MORE CONSCIOUS DECISIONS MORE VALUE-PRICE
Co
pyr
igh
t ©
2016
Th
e N
iels
en C
om
pan
y. C
on
fid
enti
al a
nd
pro
pri
etar
y.
13
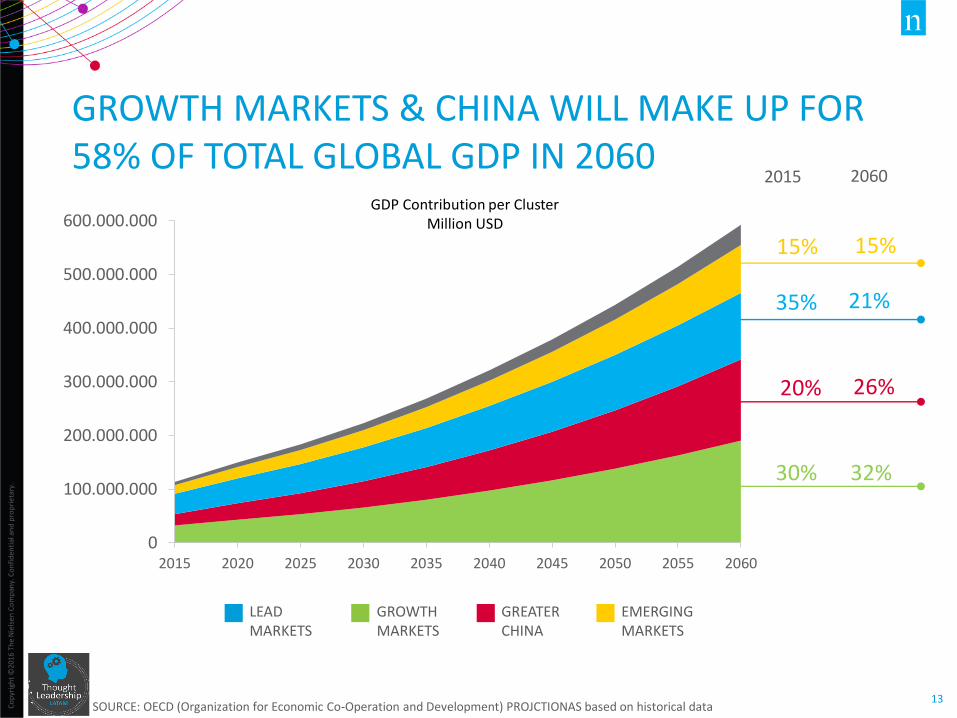
GROWTH MARKETS & CHINA WILL MAKE UP FOR 58% OF TOTAL GLOBAL GDP IN 2060
SOURCE: OECD (Organization for Economic Co-Operation and Development) PROJCTIONAS based on historical data
0
100.000.000
200.000.000
300.000.000
400.000.000
500.000.000
600.000.000
2015 2020 2025 2030 2035 2040 2045 2050 2055 2060
2015
2060
32%
26%
21%
15%
30%
20%
35%
15%
LEAD MARKETS
GROWTH MARKETS
GREATER CHINA
EMERGING MARKETS
GDP Contribution per Cluster Million USD
Co
pyr
igh
t ©
2016
Th
e N
iels
en C
om
pan
y. C
on
fid
enti
al a
nd
pro
pri
etar
y.
14
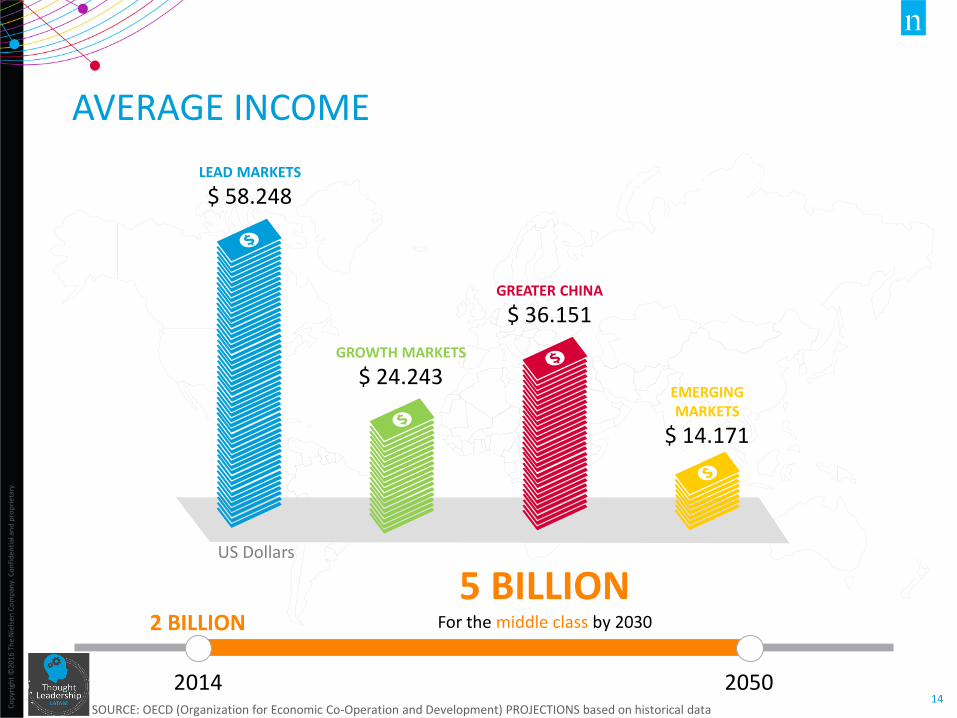
AVERAGE INCOME
2050 2014
5 BILLION For the middle class by 2030
2 BILLION
LEAD MARKETS
$ 58.248
GREATER CHINA
$ 36.151
GROWTH MARKETS
$ 24.243 EMERGING MARKETS
$ 14.171
GDP PER CAPITA 2050
US Dollars
SOURCE: OECD (Organization for Economic Co-Operation and Development) PROJECTIONS based on historical data
Co
pyr
igh
t ©
2016
Th
e N
iels
en C
om
pan
y. C
on
fid
enti
al a
nd
pro
pri
etar
y.
15
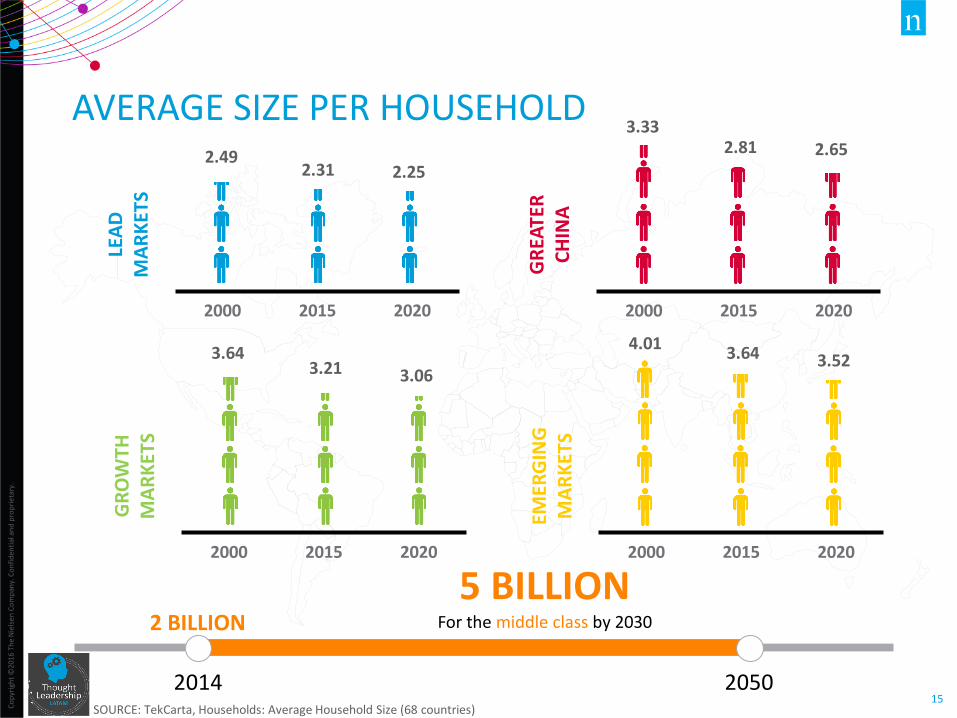
AVERAGE SIZE PER HOUSEHOLD
2050 2014
5 BILLION For the middle class by 2030
2 BILLION
SOURCE: TekCarta, Households: Average Household Size (68 countries)
LEA
D
MA
RK
ETS
2000 2015 2020
2.49 2.31 2.25
GR
OW
TH
MA
RK
ETS
2000 2015 2020
3.64 3.21 3.06
GR
EATE
R
CH
INA
2000 2015 2020
3.33 2.81 2.65
EMER
GIN
G
MA
RK
ETS
2000 2015 2020
4.01 3.64 3.52
Co
pyr
igh
t ©
2016
Th
e N
iels
en C
om
pan
y. C
on
fid
enti
al a
nd
pro
pri
etar
y.
16
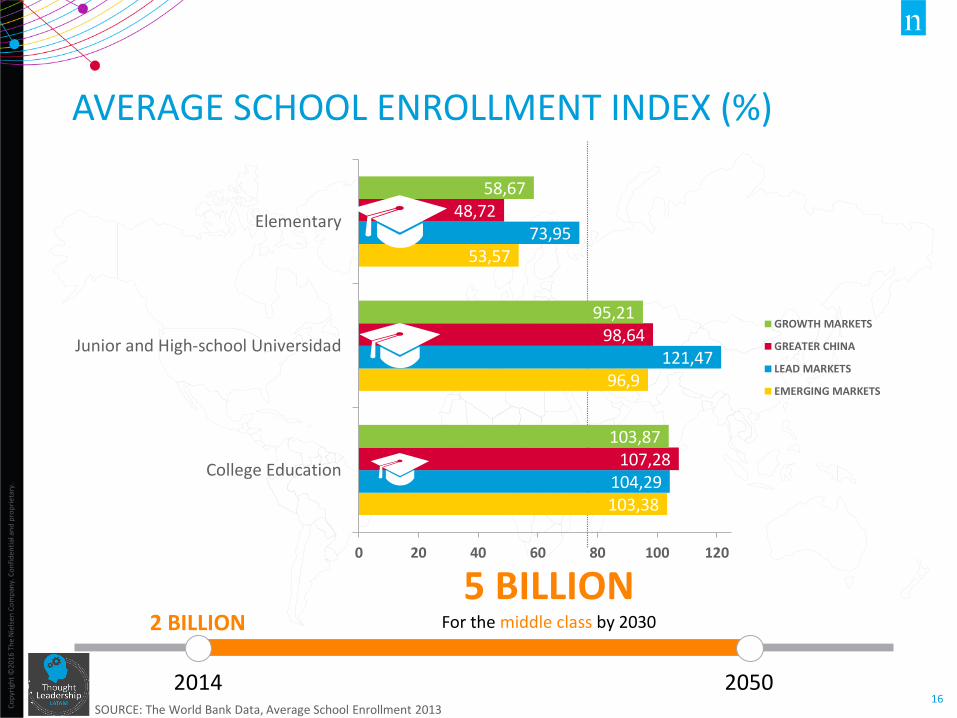
AVERAGE SCHOOL ENROLLMENT INDEX (%)
2050 2014
5 BILLION For the middle class by 2030
2 BILLION
SOURCE: The World Bank Data, Average School Enrollment 2013
103,38
96,9
53,57
104,29
121,47
73,95
107,28
98,64
48,72
103,87
95,21
58,67
0 20 40 60 80 100 120
College Education
Junior and High-school Universidad
Elementary
GROWTH MARKETS
GREATER CHINA
LEAD MARKETS
EMERGING MARKETS
Co
pyr
igh
t ©
2016
Th
e N
iels
en C
om
pan
y. C
on
fid
enti
al a
nd
pro
pri
etar
y.
17
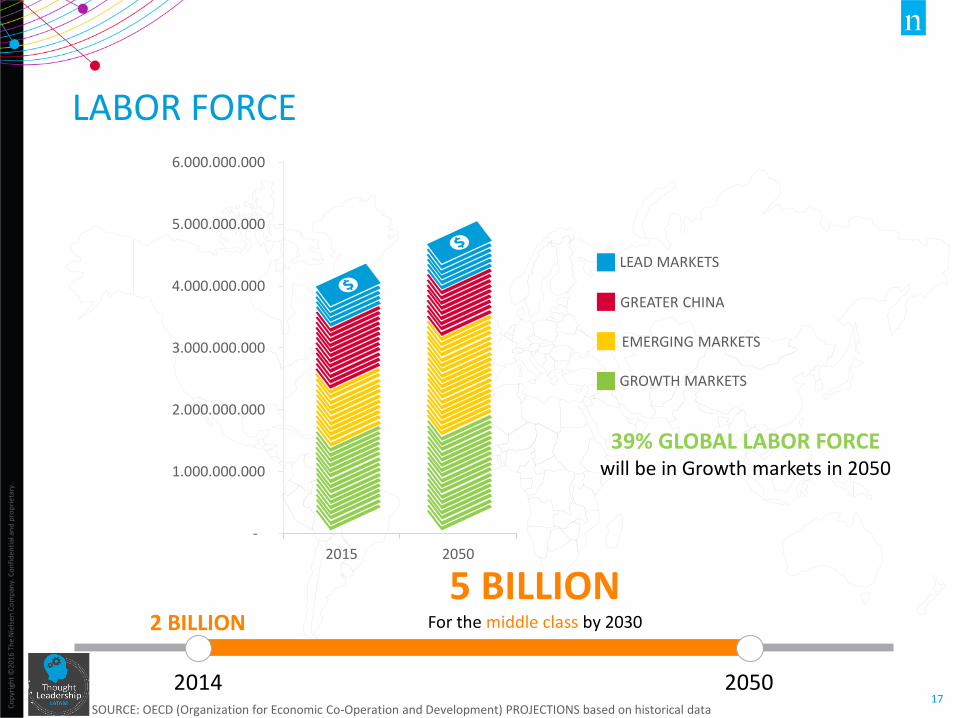
LABOR FORCE
39% GLOBAL LABOR FORCE will be in Growth markets in 2050
-
1.000.000.000
2.000.000.000
3.000.000.000
4.000.000.000
5.000.000.000
6.000.000.000
2015 2050
GREATER CHINA
LEAD MARKETS
GROWTH MARKETS
EMERGING MARKETS
2050 2014
5 BILLION For the middle class by 2030
2 BILLION
SOURCE: OECD (Organization for Economic Co-Operation and Development) PROJECTIONS based on historical data

Co
pyr
igh
t ©
2016
Th
e N
iels
en C
om
pan
y. C
on
fid
enti
al a
nd
pro
pri
etar
y.
18
WOMEN IN WORKFORCE
2050 2014
5 BILLION For the middle class by 2030
2 BILLION
SOURCE: OECD (Organization for Economic Co-Operation and Development) PROJECTIONS based on historical data
Employment to Population Ratio, 15+, Female (%)
40,1
68
41,5
48,8
43,4
61,5
44,9
50,9
47
63
47,6
51,9
35
40
45
50
55
60
65
70
EMERGING MARKETS GREATER CHINA GROWTH MARKETS LEAD MARKETS
2000
20
14
2020
Co
pyr
igh
t ©
2016
Th
e N
iels
en C
om
pan
y. C
on
fid
enti
al a
nd
pro
pri
etar
y.
19
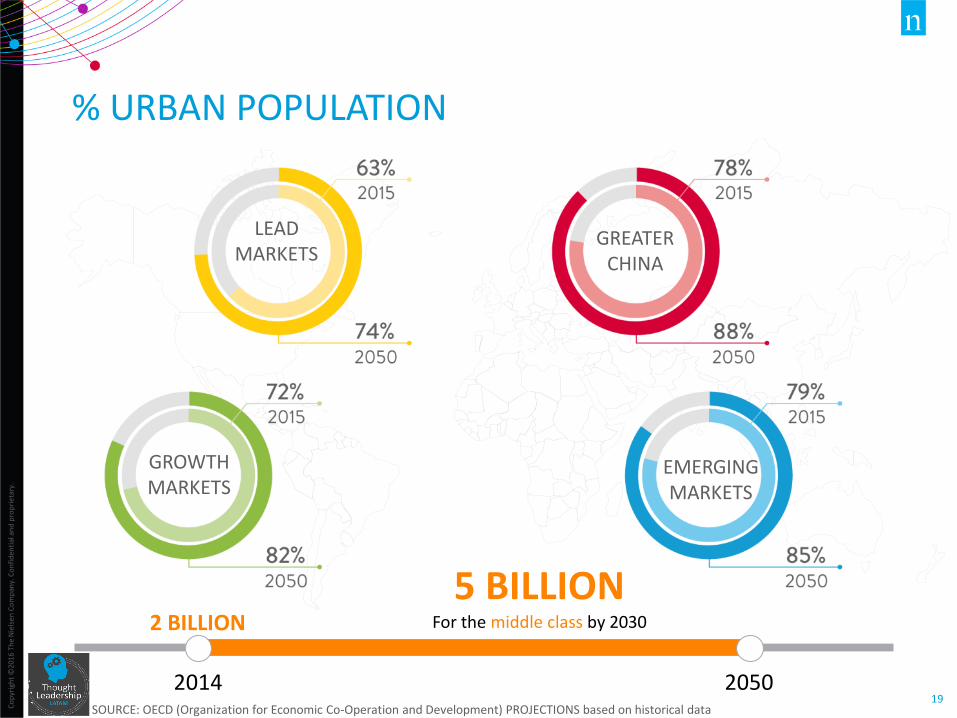
% URBAN POPULATION
LEAD MARKETS
GROWTH MARKETS
GREATER CHINA
EMERGING MARKETS
2050 2014
5 BILLION For the middle class by 2030
2 BILLION
SOURCE: OECD (Organization for Economic Co-Operation and Development) PROJECTIONS based on historical data
GLOBAL RETAIL DYNAMICS
Co
pyr
igh
t ©
2016
Th
e N
iels
en C
om
pan
y. C
on
fid
enti
al a
nd
pro
pri
etar
y.
21
29%
20% 26%
10%
4% 6% 2%
33%
22%
25%
7%
4% 5% 3%
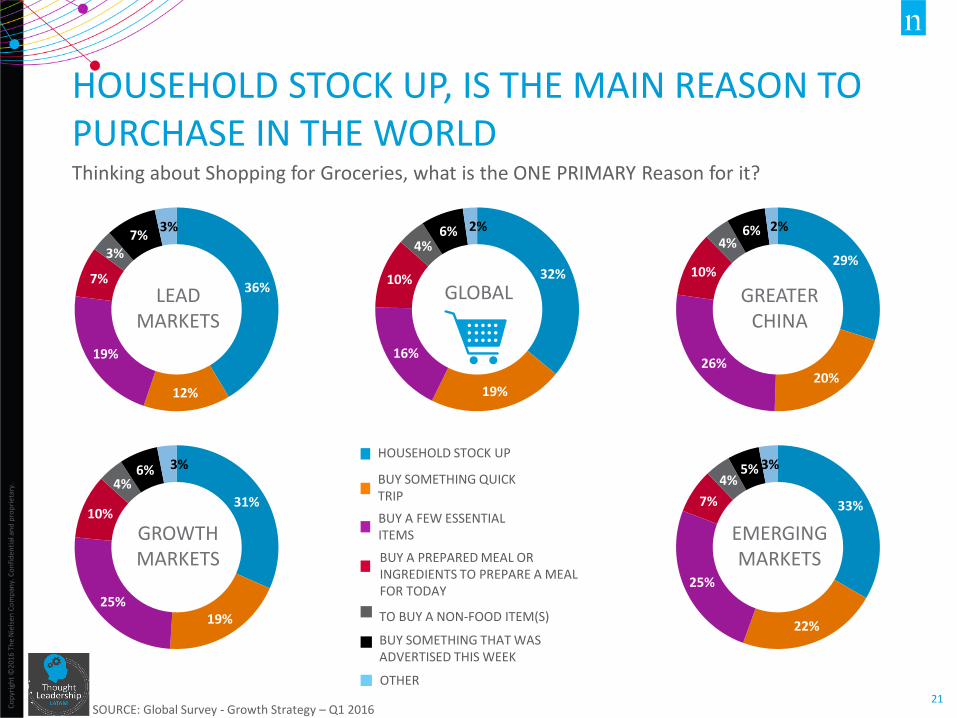
HOUSEHOLD STOCK UP, IS THE MAIN REASON TO PURCHASE IN THE WORLD Thinking about Shopping for Groceries, what is the ONE PRIMARY Reason for it?
SOURCE: Global Survey - Growth Strategy – Q1 2016
36%
12%
19%
7%
3% 7%
3%
LEAD MARKETS
GREATER CHINA
EMERGING MARKETS
31%
19% 25%
10%
4% 6% 3%
GROWTH MARKETS
32%
19%
16%
10%
4% 6% 2%
GLOBAL
BUY A FEW ESSENTIAL ITEMS
HOUSEHOLD STOCK UP
BUY A PREPARED MEAL OR INGREDIENTS TO PREPARE A MEAL FOR TODAY
BUY SOMETHING QUICK TRIP
OTHER
TO BUY A NON-FOOD ITEM(S)
BUY SOMETHING THAT WAS ADVERTISED THIS WEEK
Co
pyr
igh
t ©
2016
Th
e N
iels
en C
om
pan
y. C
on
fid
enti
al a
nd
pro
pri
etar
y.
22
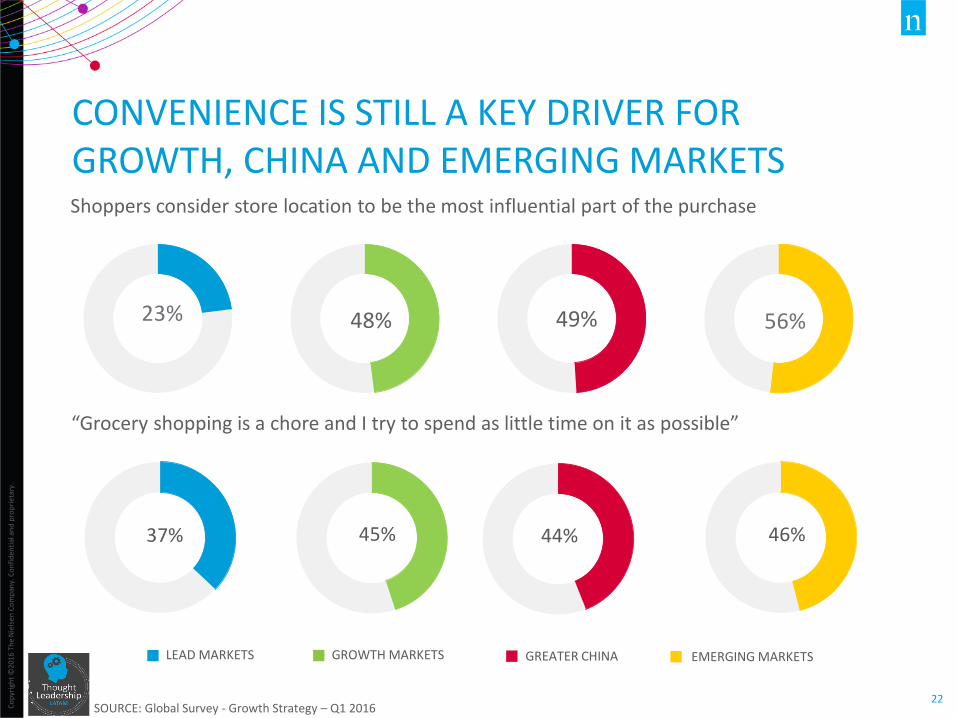
CONVENIENCE IS STILL A KEY DRIVER FOR GROWTH, CHINA AND EMERGING MARKETS
“Grocery shopping is a chore and I try to spend as little time on it as possible”
SOURCE: Global Survey - Growth Strategy – Q1 2016
Shoppers consider store location to be the most influential part of the purchase
23% 48% 49% 56%
37% 45% 44% 46%
GREATER CHINA LEAD MARKETS EMERGING MARKETS GROWTH MARKETS
Co
pyr
igh
t ©
2016
Th
e N
iels
en C
om
pan
y. C
on
fid
enti
al a
nd
pro
pri
etar
y.
23
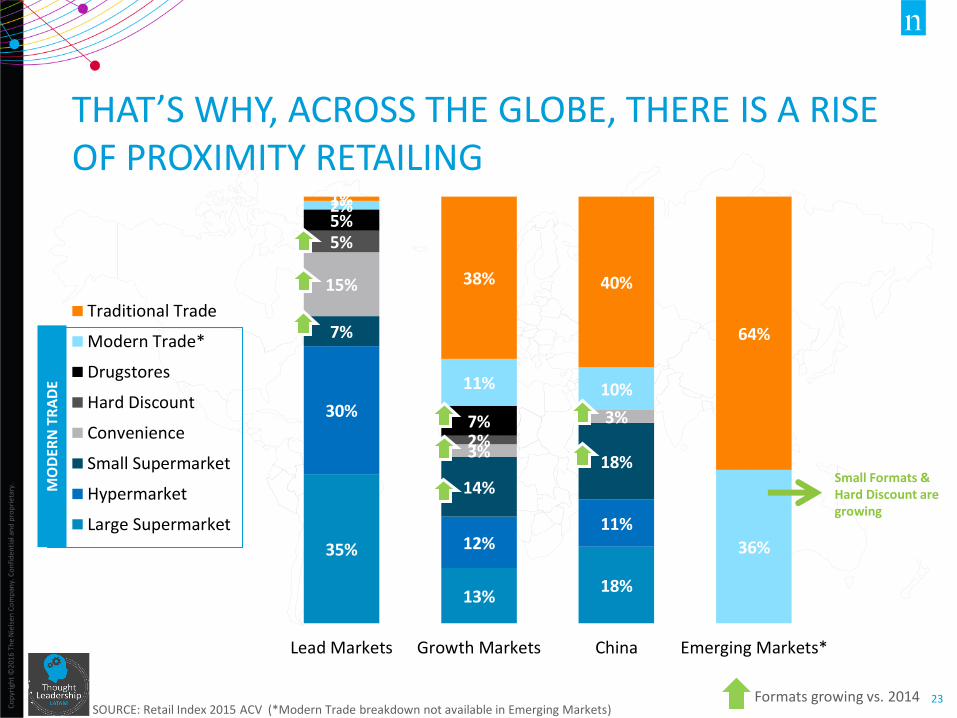
THAT’S WHY, ACROSS THE GLOBE, THERE IS A RISE OF PROXIMITY RETAILING
SOURCE: Retail Index 2015 ACV (*Modern Trade breakdown not available in Emerging Markets)
35%
13% 18%
30%
12% 11%
7%
14%
18%
15%
3%
3%
5%
2%
5%
7%
2%
11% 10%
36%
1%
38% 40%
64%
Lead Markets Growth Markets China Emerging Markets*
Traditional Trade
Modern Trade*
Drugstores
Hard Discount
Convenience
Small Supermarket
Hypermarket
Large Supermarket
MO
DER
N T
RA
DE
Small Formats & Hard Discount are growing
Formats growing vs. 2014
Co
pyr
igh
t ©
2016
Th
e N
iels
en C
om
pan
y. C
on
fid
enti
al a
nd
pro
pri
etar
y.
24
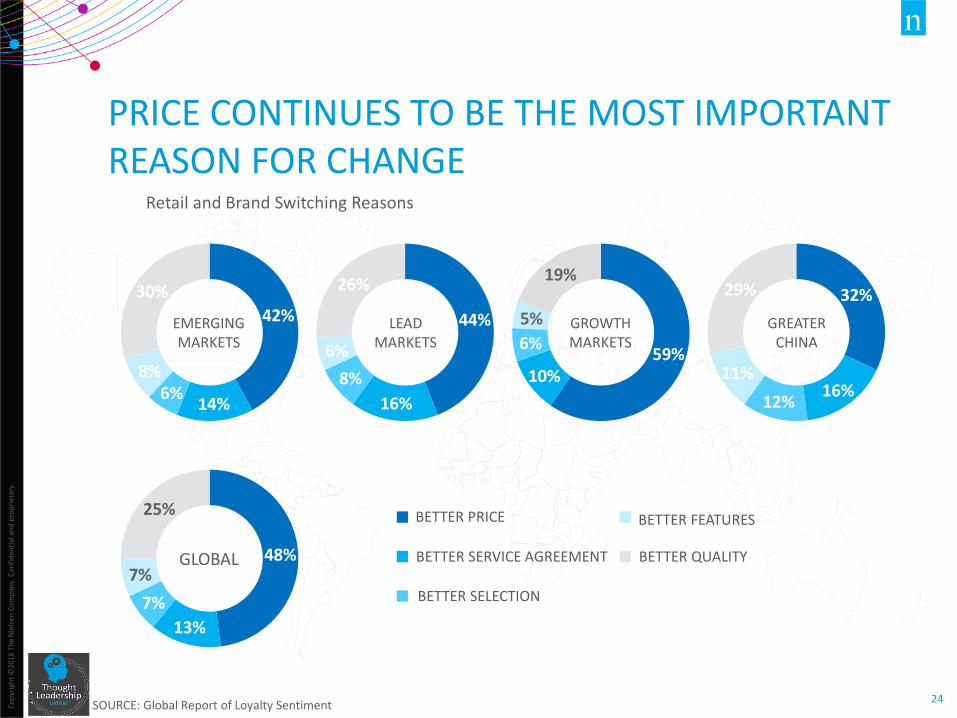
Retail and Brand Switching Reasons
PRICE CONTINUES TO BE THE MOST IMPORTANT REASON FOR CHANGE
SOURCE: Global Report of Loyalty Sentiment
44%
16%
8%
6%
26%
LEAD MARKETS
42%
14% 6%
8%
30%
EMERGING MARKETS
59% 10%
6%
5%
19% 32%
16% 12%
11%
29%
GREATER CHINA
GROWTH MARKETS
48%
13%
7%
7%
25%
BETTER SERVICE AGREEMENT
BETTER PRICE
BETTER SELECTION
BETTER QUALITY
BETTER FEATURES
GLOBAL
Co
pyr
igh
t ©
2016
Th
e N
iels
en C
om
pan
y. C
on
fid
enti
al a
nd
pro
pri
etar
y.
25
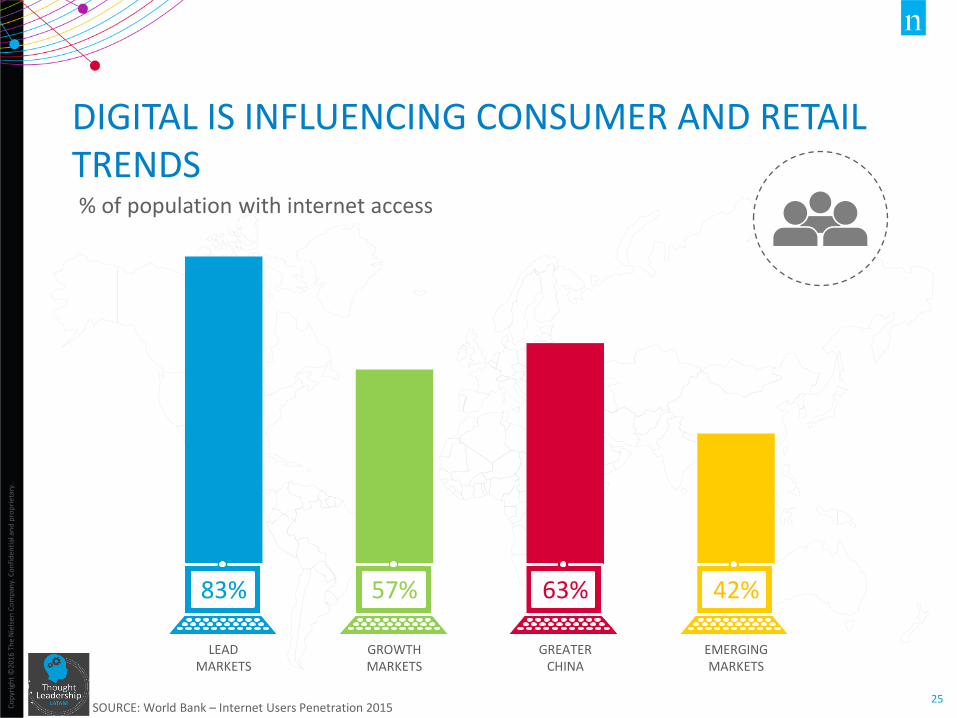
DIGITAL IS INFLUENCING CONSUMER AND RETAIL TRENDS
SOURCE: World Bank – Internet Users Penetration 2015
% of population with internet access
83%
LEAD MARKETS
EMERGING MARKETS
GREATER CHINA
GROWTH MARKETS
57% 63% 42%
Co
pyr
igh
t ©
2016
Th
e N
iels
en C
om
pan
y. C
on
fid
enti
al a
nd
pro
pri
etar
y.
26
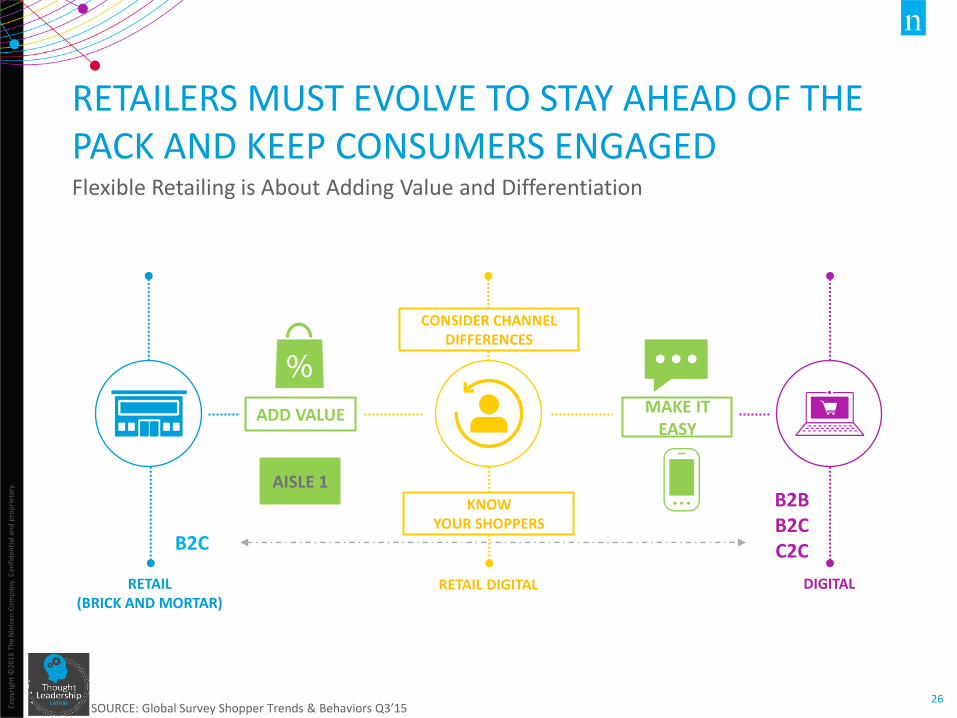
RETAILERS MUST EVOLVE TO STAY AHEAD OF THE PACK AND KEEP CONSUMERS ENGAGED Flexible Retailing is About Adding Value and Differentiation
SOURCE: Global Survey Shopper Trends & Behaviors Q3’15
ADD VALUE
AISLE 1
B2C
B2B B2C C2C
MAKE IT EASY
RETAIL (BRICK AND MORTAR)
DIGITAL
KNOW YOUR SHOPPERS
RETAIL DIGITAL
CONSIDER CHANNEL DIFFERENCES
Co
pyr
igh
t ©
2016
Th
e N
iels
en C
om
pan
y. C
on
fid
enti
al a
nd
pro
pri
etar
y.
27
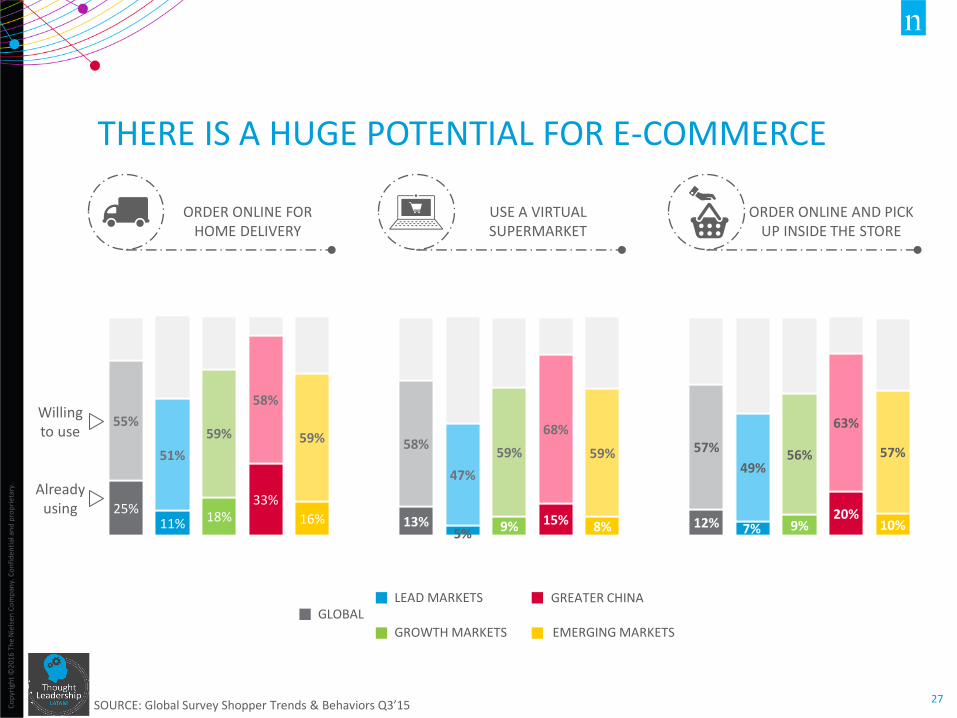
THERE IS A HUGE POTENTIAL FOR E-COMMERCE
SOURCE: Global Survey Shopper Trends & Behaviors Q3’15
Already using
Willing to use
25% 11% 18%
33%
16%
55%
51%
59%
58%
59%
ORDER ONLINE FOR HOME DELIVERY
USE A VIRTUAL SUPERMARKET
13% 5% 9% 15% 8%
58%
47%
59%
68%
59%
ORDER ONLINE AND PICK UP INSIDE THE STORE
12% 7% 9% 20%
10%
57%
49% 56%
63%
57%
GREATER CHINA LEAD MARKETS
EMERGING MARKETS GROWTH MARKETS
GLOBAL
Co
pyr
igh
t ©
2016
Th
e N
iels
en C
om
pan
y. C
on
fid
enti
al a
nd
pro
pri
etar
y.
28
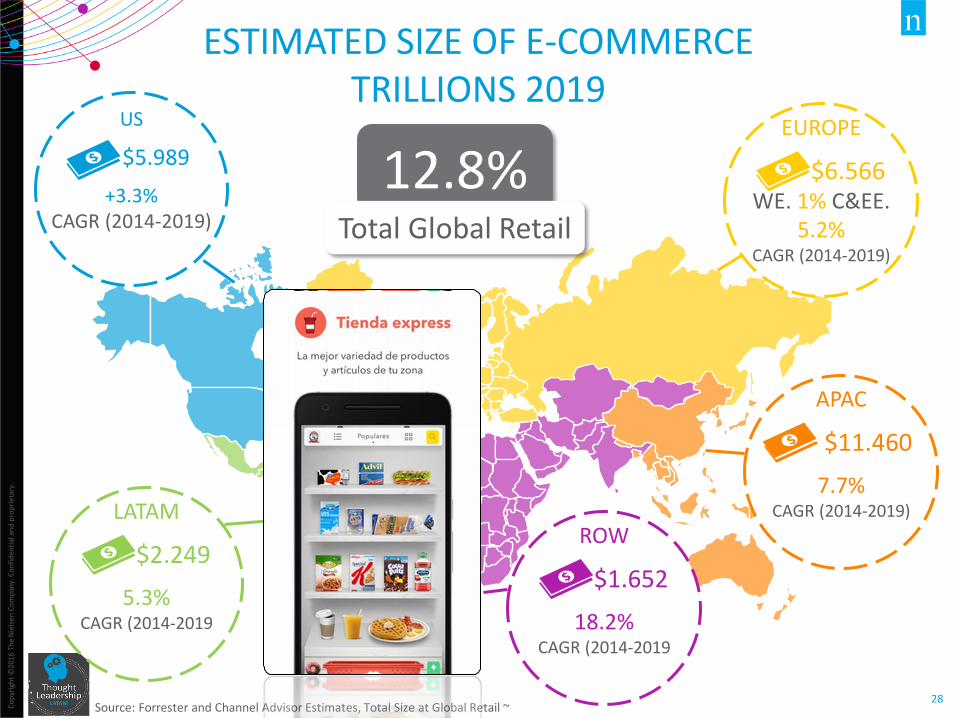
ESTIMATED SIZE OF E-COMMERCE TRILLIONS 2019
Source: Forrester and Channel Advisor Estimates, Total Size at Global Retail ~
LATAM
$2.249
5.3% CAGR (2014-2019
US
$5.989
+3.3% CAGR (2014-2019)
EUROPE
$6.566 WE. 1% C&EE.
5.2% CAGR (2014-2019)
APAC
$11.460
7.7% CAGR (2014-2019)
ROW
$1.652
18.2% CAGR (2014-2019
12.8% Total Global Retail
Co
pyr
igh
t ©
2016
Th
e N
iels
en C
om
pan
y. C
on
fid
enti
al a
nd
pro
pri
etar
y.
29
2009 2010 2011 2012 2013 2014 2015
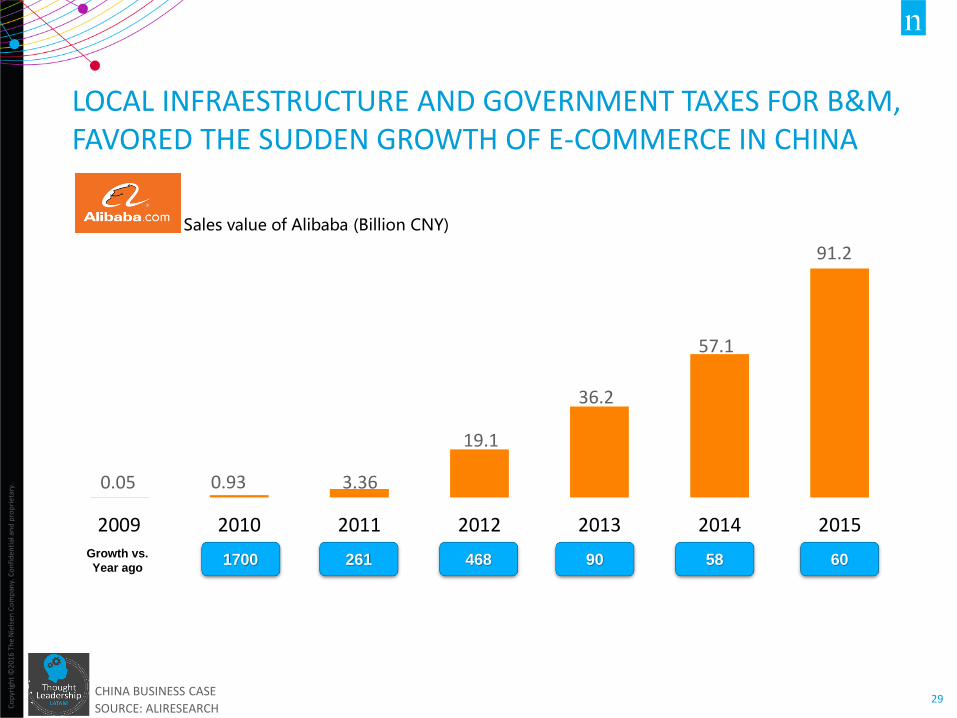
LOCAL INFRAESTRUCTURE AND GOVERNMENT TAXES FOR B&M, FAVORED THE SUDDEN GROWTH OF E-COMMERCE IN CHINA
CHINA BUSINESS CASE
SOURCE: ALIRESEARCH
Sales value of Alibaba (Billion CNY)
0.05 3.36 0.93
19.1
36.2
57.1
91.2
261 1700 468 90 58 60 Growth vs.
Year ago
Co
pyr
igh
t ©
2016
Th
e N
iels
en C
om
pan
y. C
on
fid
enti
al a
nd
pro
pri
etar
y.
30
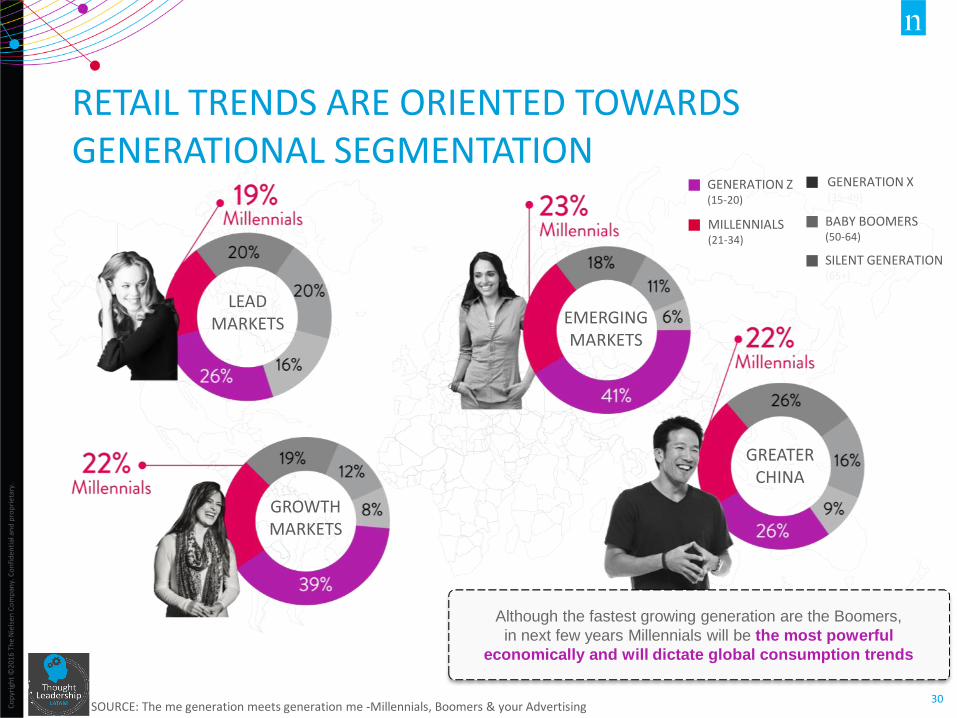
RETAIL TRENDS ARE ORIENTED TOWARDS GENERATIONAL SEGMENTATION
SOURCE: The me generation meets generation me -Millennials, Boomers & your Advertising
Although the fastest growing generation are the Boomers,
in next few years Millennials will be the most powerful
economically and will dictate global consumption trends
MILLENNIALS (21-34)
SILENT GENERATION (65+)
GENERATION X (35-49)
BABY BOOMERS (50-64)
GENERATION Z (15-20)
LEAD MARKETS
GROWTH MARKETS
GREATER CHINA
EMERGING MARKETS
Co
pyr
igh
t ©
2016
Th
e N
iels
en C
om
pan
y. C
on
fid
enti
al a
nd
pro
pri
etar
y.
31
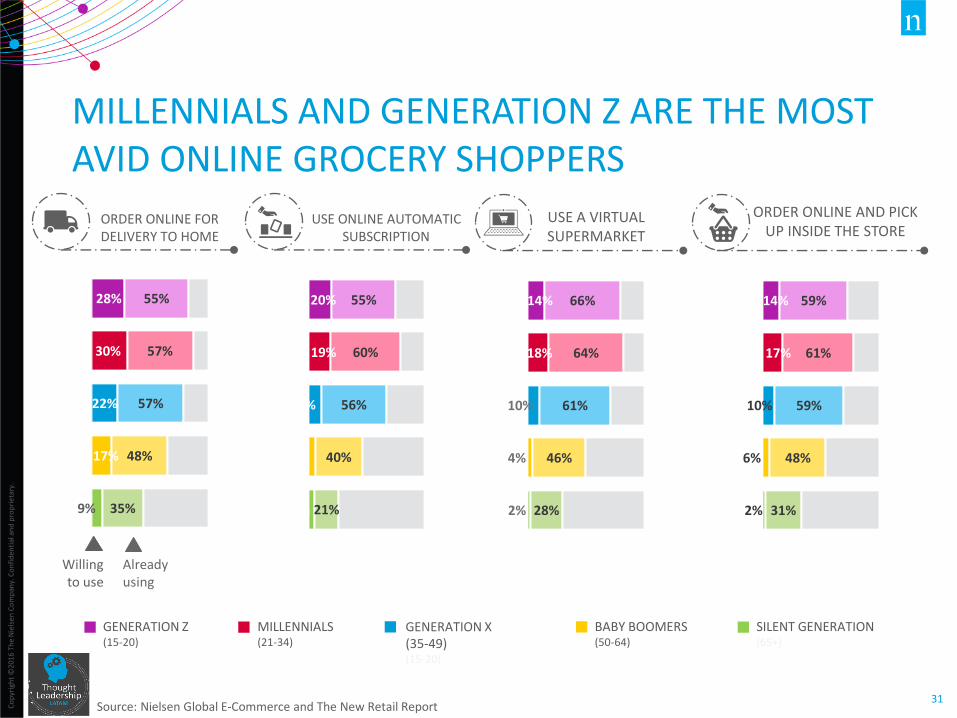
MILLENNIALS AND GENERATION Z ARE THE MOST AVID ONLINE GROCERY SHOPPERS
Source: Nielsen Global E-Commerce and The New Retail Report
9%
17%
22%
30%
28%
35%
48%
57%
57%
55%
ORDER ONLINE FOR DELIVERY TO HOME
MILLENNIALS (21-34)
SILENT GENERATION (65+)
GENERATION X (35-49) (15-20)
BABY BOOMERS (50-64)
GENERATION Z (15-20)
5%
6%
11%
19%
20%
21%
40%
56%
60%
55%
USE ONLINE AUTOMATIC SUBSCRIPTION
USE A VIRTUAL SUPERMARKET
2%
4%
10%
18%
14%
28%
46%
61%
64%
66%
ORDER ONLINE AND PICK UP INSIDE THE STORE
2%
6%
10%
17%
14%
31%
48%
59%
61%
59%
Already using
Willing to use
TRADITIONAL TRADE A BLACK BOX?
Co
pyr
igh
t ©
2016
Th
e N
iels
en C
om
pan
y. C
on
fid
enti
al a
nd
pro
pri
etar
y.
33
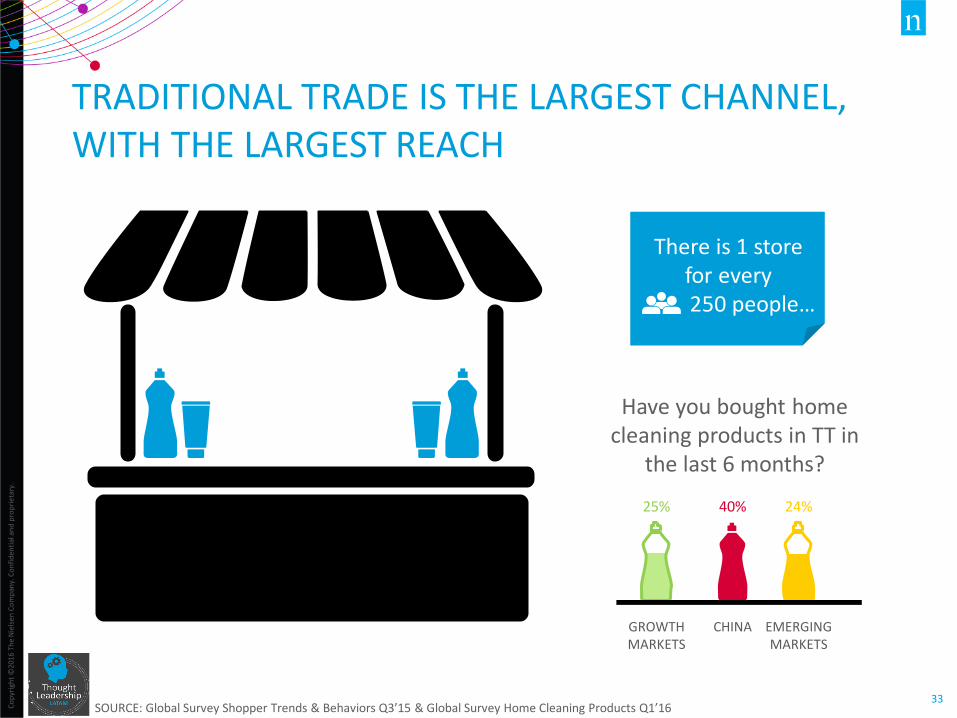
Have you bought home cleaning products in TT in
the last 6 months?
TRADITIONAL TRADE IS THE LARGEST CHANNEL, WITH THE LARGEST REACH
SOURCE: Global Survey Shopper Trends & Behaviors Q3’15 & Global Survey Home Cleaning Products Q1’16
There is 1 store for every
250 people…
GROWTH MARKETS
CHINA
EMERGING MARKETS
25%
40%
24%
Co
pyr
igh
t ©
2016
Th
e N
iels
en C
om
pan
y. C
on
fid
enti
al a
nd
pro
pri
etar
y.
34
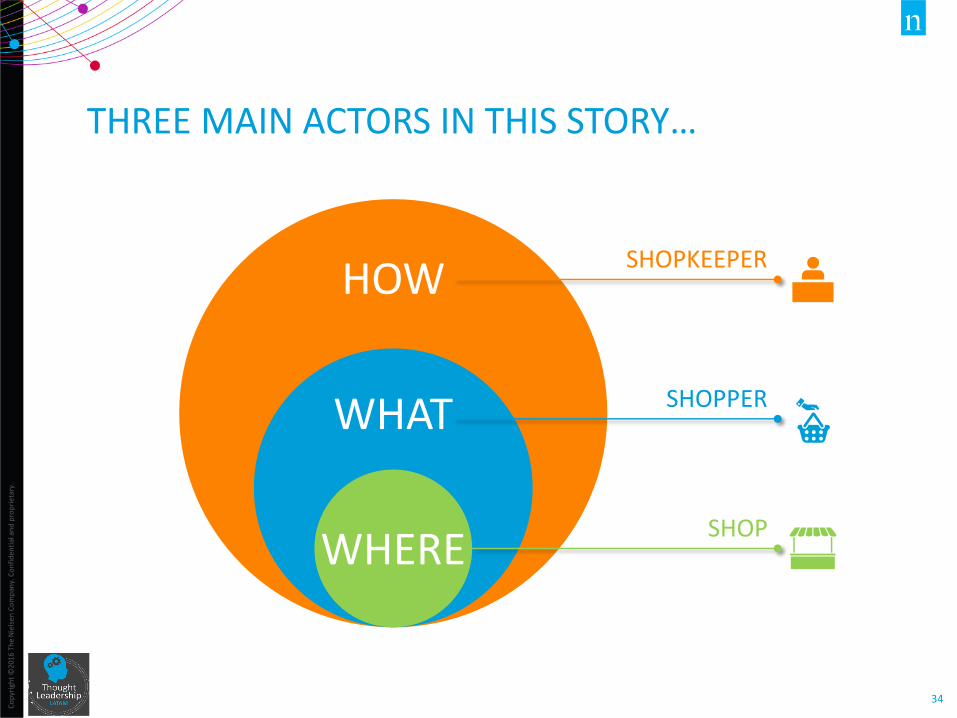
HOW
WHAT
WHERE
SHOPKEEPER
SHOPPER
SHOP
THREE MAIN ACTORS IN THIS STORY…
Co
pyr
igh
t ©
2012
Th
e N
iels
en C
om
pan
y. C
on
fid
enti
al a
nd
pro
pri
etar
y.
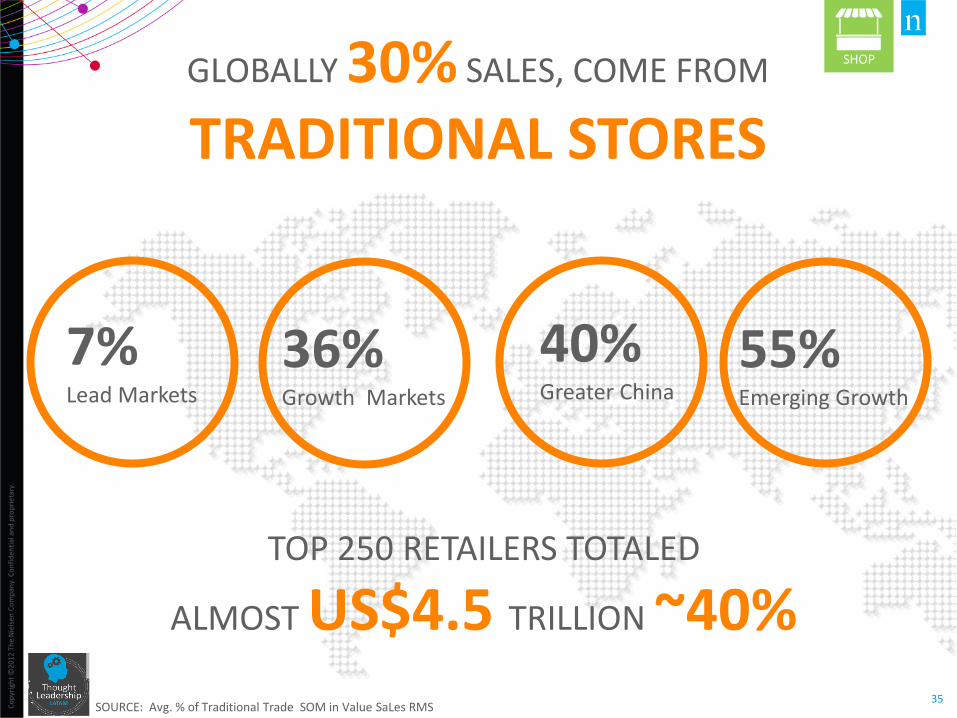
35 SOURCE: Avg. % of Traditional Trade SOM in Value SaLes RMS
GLOBALLY 30% SALES, COME FROM
TRADITIONAL STORES
SHOP
7% Lead Markets
36% Growth Markets
40% Greater China
55% Emerging Growth
TOP 250 RETAILERS TOTALED
ALMOST US$4.5 TRILLION ~40%
Co
pyr
igh
t ©
2012
Th
e N
iels
en C
om
pan
y. C
on
fid
enti
al a
nd
pro
pri
etar
y.
36
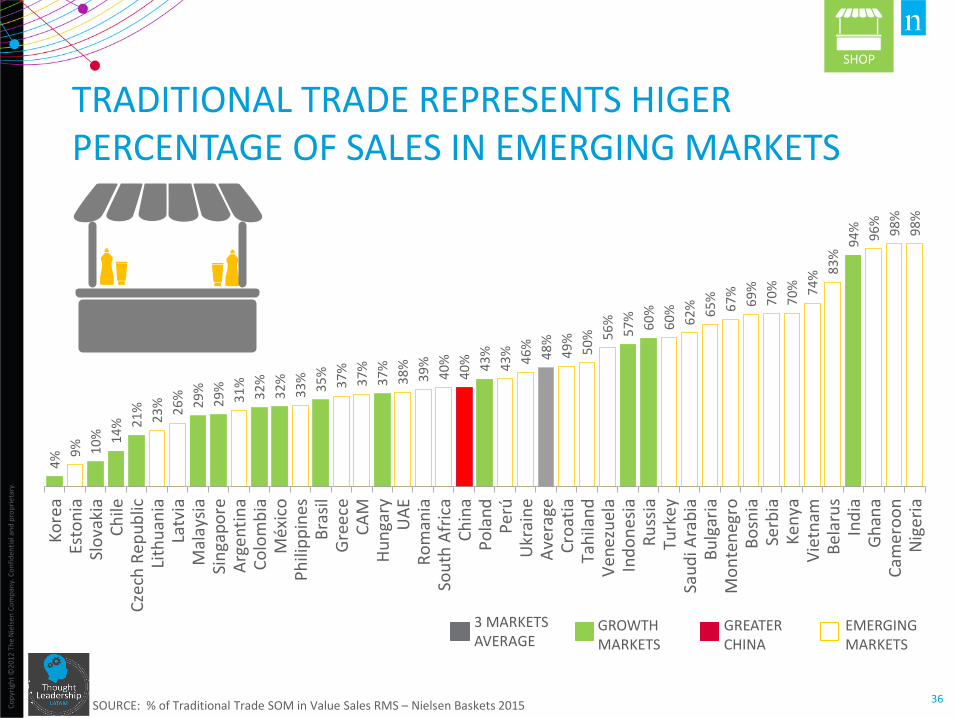
TRADITIONAL TRADE REPRESENTS HIGER PERCENTAGE OF SALES IN EMERGING MARKETS
GROWTH MARKETS
GREATER CHINA
EMERGING MARKETS
3 MARKETS AVERAGE
SOURCE: % of Traditional Trade SOM in Value Sales RMS – Nielsen Baskets 2015
SHOP 4
% 9%
10
%
14
%
21
%
23
%
26
%
29
%
29
%
31
%
32
%
32
%
33
%
35
%
37
%
37
%
37
%
38
%
39
%
40
%
40
%
43
%
43
%
46
%
48
%
49
%
50
%
56
%
57
%
60
%
60
%
62
%
65
%
67
%
69
%
70
%
70
%
74
% 83
% 9
4%
96
%
98
%
98
%
Ko
rea
Esto
nia
Slo
vaki
aC
hile
Cze
ch R
ep
ub
licLi
thu
ania
Latv
iaM
alay
sia
Sin
gap
ore
Arg
enti
na
Co
lom
bia
Mé
xico
Ph
ilip
pin
esB
rasi
lG
ree
ceC
AM
Hu
nga
ryU
AE
Ro
man
iaSo
uth
Afr
ica
Ch
ina
Po
lan
dP
erú
Ukr
ain
eA
vera
geC
roat
iaTa
hila
nd
Ven
ezu
ela
Ind
on
esia
Ru
ssia
Turk
ey
Sau
di A
rab
iaB
ulg
aria
Mo
nte
neg
roB
osn
iaSe
rbia
Ken
yaV
ietn
amB
elar
us
Ind
iaG
han
aC
amer
oo
nN
iger
ia

Co
pyr
igh
t ©
2016
Th
e N
iels
en C
om
pan
y. C
on
fid
enti
al a
nd
pro
pri
etar
y.
37
AVERAGE GROWTH OF TRADITIONAL TRADE Uruguay and Ukraine had a Significant Growth (More Than 10.1%). But in Half of the Reported Countries Growth is Less than 1% or has no Growth.
SOURCE: CS SURVEY: Traditional Trade Market Trends (Alpine, Brazil, Argentina, CAM, Colombia, Germany, Greece, Hungary, India, Kuwait, Malaysia, Peru, Poland, Russia, Saudi Arabia, Singapore, Ukraine, Uruguay) – Avg. growth in Value Sales
ALP
INE
BR
AZI
L
AR
GEN
TIN
A
CEN
TRA
L A
MER
ICA
CO
LOM
BIA
GER
MA
NY
GR
EEC
E
HU
NG
AR
Y
IND
IA
KUW
AIT
MA
LAYS
IA
PER
U
PO
LAN
D
RU
SSIA
SAU
DI
AR
AB
IA
SIN
GA
PO
RE
SLO
VEN
IA
UK
RA
INE
MEX
ICO
UR
UG
UA
Y
LOSING SALES LESS THAN -
1%
NO GROWTH REPORTED
+/- 1%
BETWEEN 1% TO 5%
5.1% TO 10%
MORE THAN 10.1%
SHOP
Co
pyr
igh
t ©
2016
Th
e N
iels
en C
om
pan
y. C
on
fid
enti
al a
nd
pro
pri
etar
y.
38
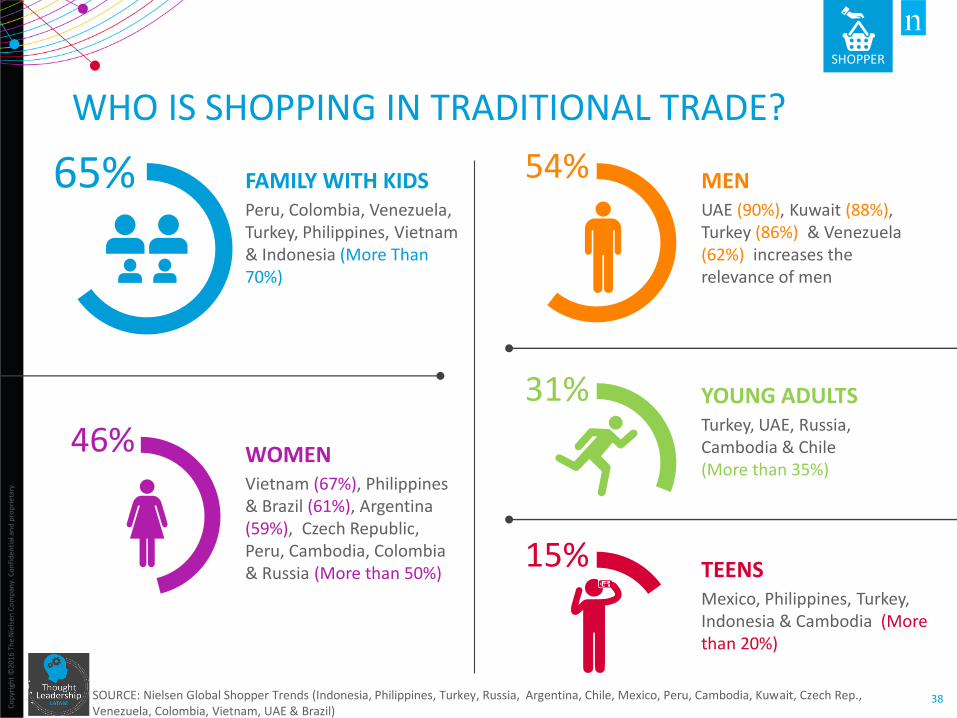
WHO IS SHOPPING IN TRADITIONAL TRADE?
SOURCE: Nielsen Global Shopper Trends (Indonesia, Philippines, Turkey, Russia, Argentina, Chile, Mexico, Peru, Cambodia, Kuwait, Czech Rep., Venezuela, Colombia, Vietnam, UAE & Brazil)
SHOPPER
Peru, Colombia, Venezuela, Turkey, Philippines, Vietnam & Indonesia (More Than 70%)
FAMILY WITH KIDS 65% UAE (90%), Kuwait (88%), Turkey (86%) & Venezuela (62%) increases the relevance of men
MEN 54%
Vietnam (67%), Philippines & Brazil (61%), Argentina (59%), Czech Republic, Peru, Cambodia, Colombia & Russia (More than 50%)
WOMEN 46% Turkey, UAE, Russia, Cambodia & Chile (More than 35%)
YOUNG ADULTS 31%
Mexico, Philippines, Turkey, Indonesia & Cambodia (More than 20%)
TEENS 15%
Co
pyr
igh
t ©
2016
Th
e N
iels
en C
om
pan
y. C
on
fid
enti
al a
nd
pro
pri
etar
y.
39
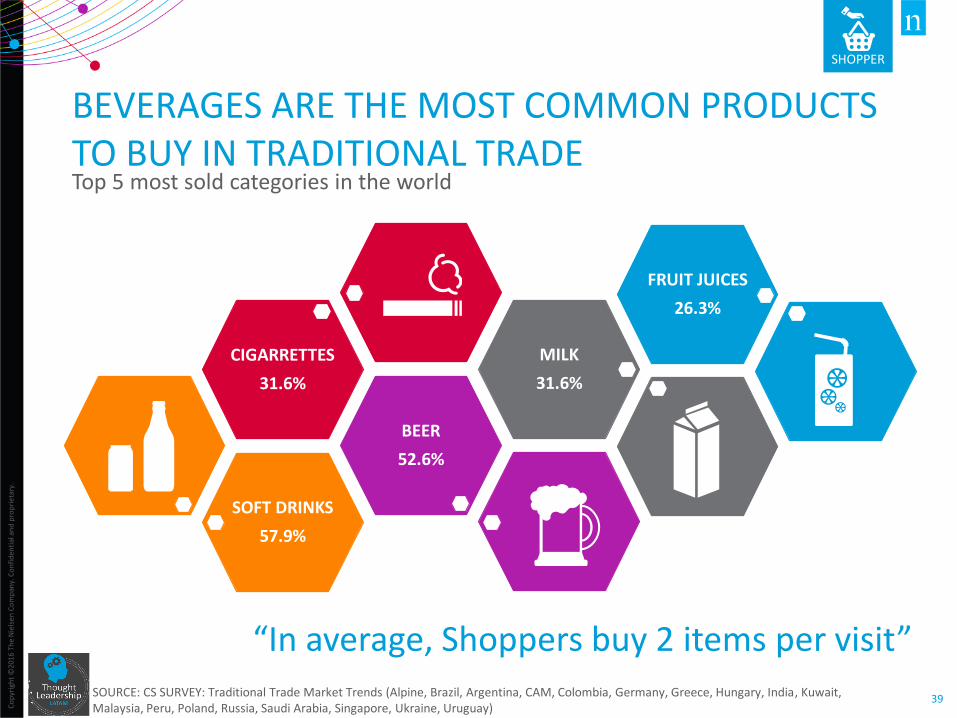
BEVERAGES ARE THE MOST COMMON PRODUCTS TO BUY IN TRADITIONAL TRADE Top 5 most sold categories in the world
SOURCE: CS SURVEY: Traditional Trade Market Trends (Alpine, Brazil, Argentina, CAM, Colombia, Germany, Greece, Hungary, India, Kuwait, Malaysia, Peru, Poland, Russia, Saudi Arabia, Singapore, Ukraine, Uruguay)
“In average, Shoppers buy 2 items per visit”
SHOPPER
SOFT DRINKS
57.9%
BEER
52.6%
CIGARRETTES
31.6%
MILK
31.6%
FRUIT JUICES
26.3%
Co
pyr
igh
t ©
2016
Th
e N
iels
en C
om
pan
y. C
on
fid
enti
al a
nd
pro
pri
etar
y.
40
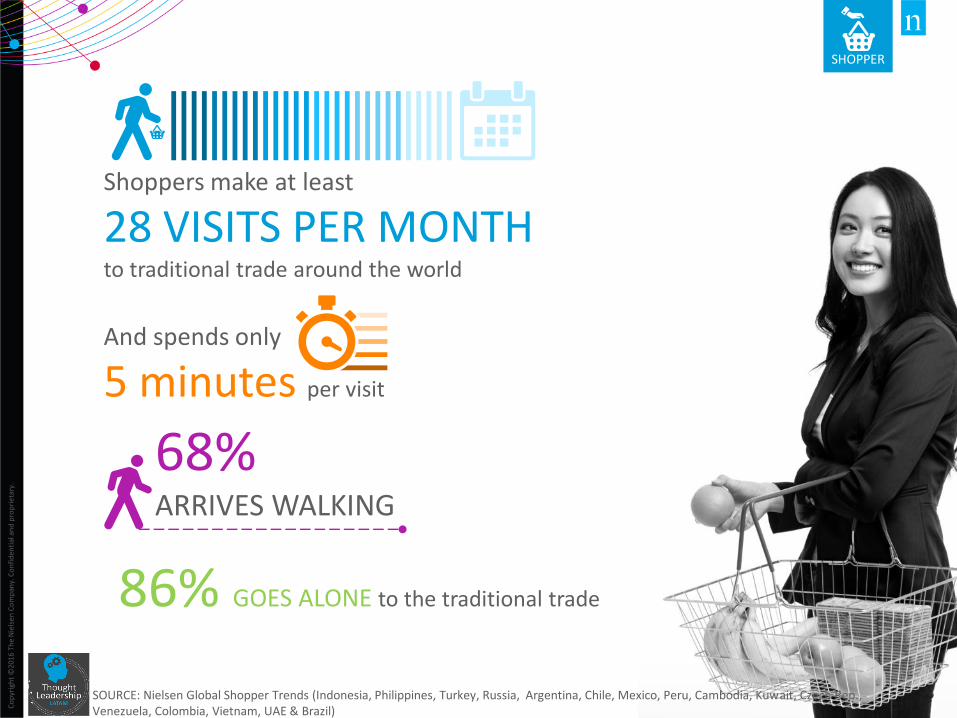
And spends only
5 minutes per visit
Shoppers make at least
28 VISITS PER MONTH to traditional trade around the world
86% GOES ALONE to the traditional trade
68% ARRIVES WALKING
SHOPPER
SOURCE: Nielsen Global Shopper Trends (Indonesia, Philippines, Turkey, Russia, Argentina, Chile, Mexico, Peru, Cambodia, Kuwait, Czech Rep., Venezuela, Colombia, Vietnam, UAE & Brazil)
Co
pyr
igh
t ©
2016
Th
e N
iels
en C
om
pan
y. C
on
fid
enti
al a
nd
pro
pri
etar
y.
41
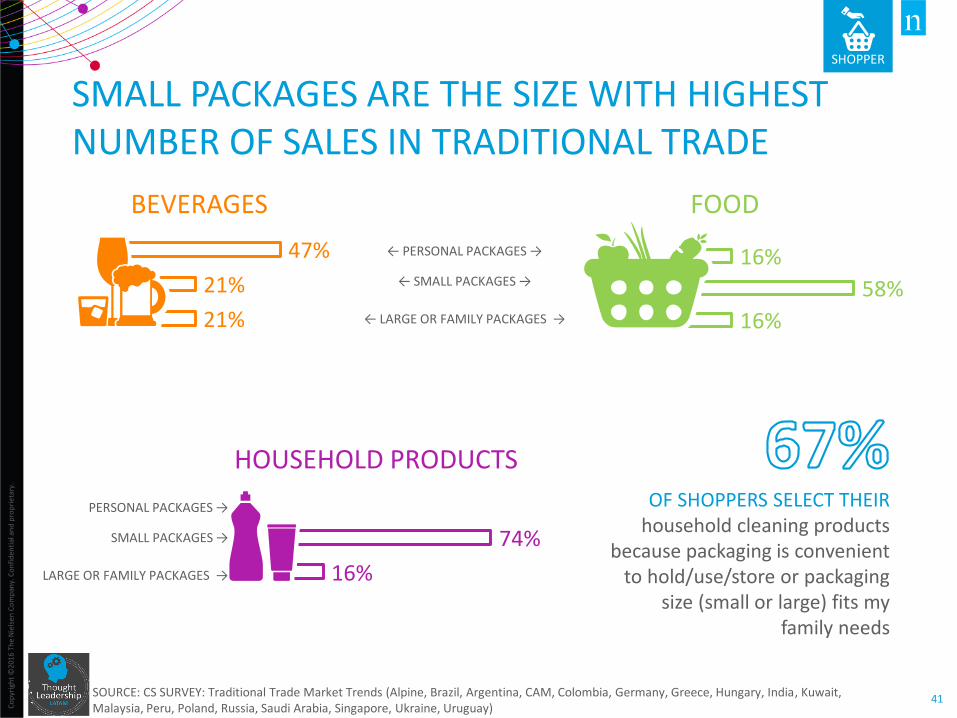
21%
21%
47%
BEVERAGES
SMALL PACKAGES ARE THE SIZE WITH HIGHEST NUMBER OF SALES IN TRADITIONAL TRADE
OF SHOPPERS SELECT THEIR household cleaning products
because packaging is convenient to hold/use/store or packaging
size (small or large) fits my family needs
16%
58%
16%
FOOD
16%
74%
← PERSONAL PACKAGES →
← SMALL PACKAGES →
← LARGE OR FAMILY PACKAGES →
PERSONAL PACKAGES →
SMALL PACKAGES →
LARGE OR FAMILY PACKAGES →
HOUSEHOLD PRODUCTS
SHOPPER
SOURCE: CS SURVEY: Traditional Trade Market Trends (Alpine, Brazil, Argentina, CAM, Colombia, Germany, Greece, Hungary, India, Kuwait, Malaysia, Peru, Poland, Russia, Saudi Arabia, Singapore, Ukraine, Uruguay)
Co
pyr
igh
t ©
2016
Th
e N
iels
en C
om
pan
y. C
on
fid
enti
al a
nd
pro
pri
etar
y.
42
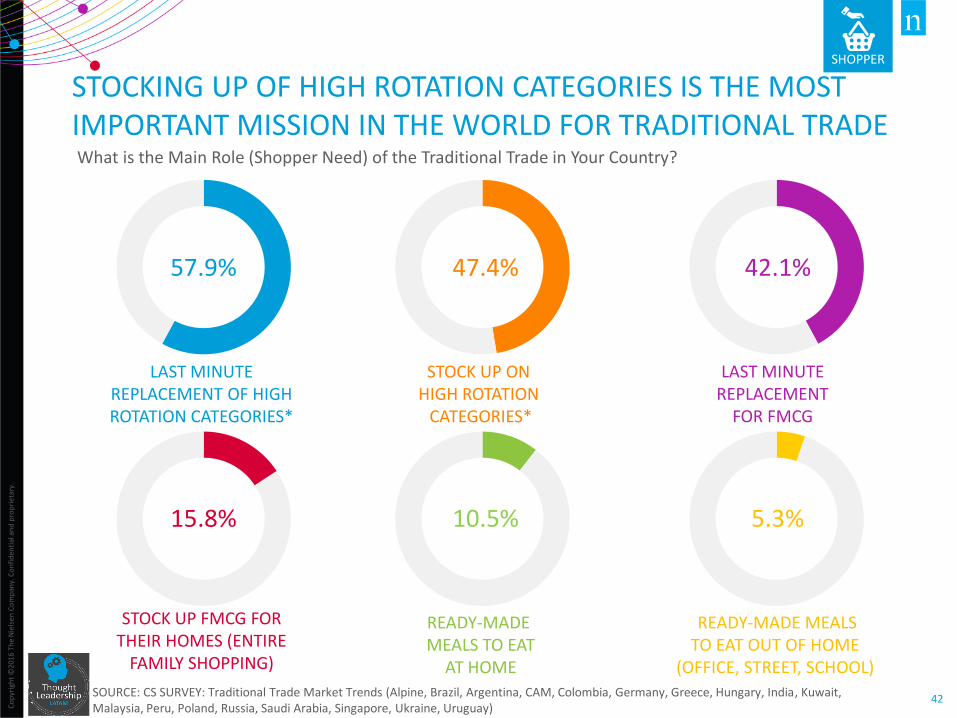
STOCKING UP OF HIGH ROTATION CATEGORIES IS THE MOST IMPORTANT MISSION IN THE WORLD FOR TRADITIONAL TRADE
57.9%
LAST MINUTE REPLACEMENT OF HIGH ROTATION CATEGORIES*
47.4%
STOCK UP ON HIGH ROTATION
CATEGORIES*
42.1%
LAST MINUTE REPLACEMENT
FOR FMCG
15.8%
STOCK UP FMCG FOR THEIR HOMES (ENTIRE
FAMILY SHOPPING)
10.5%
READY-MADE MEALS TO EAT
AT HOME
5.3%
READY-MADE MEALS TO EAT OUT OF HOME
(OFFICE, STREET, SCHOOL)
SHOPPER
What is the Main Role (Shopper Need) of the Traditional Trade in Your Country?
SOURCE: CS SURVEY: Traditional Trade Market Trends (Alpine, Brazil, Argentina, CAM, Colombia, Germany, Greece, Hungary, India, Kuwait, Malaysia, Peru, Poland, Russia, Saudi Arabia, Singapore, Ukraine, Uruguay)
Co
pyr
igh
t ©
2016
Th
e N
iels
en C
om
pan
y. C
on
fid
enti
al a
nd
pro
pri
etar
y.
43
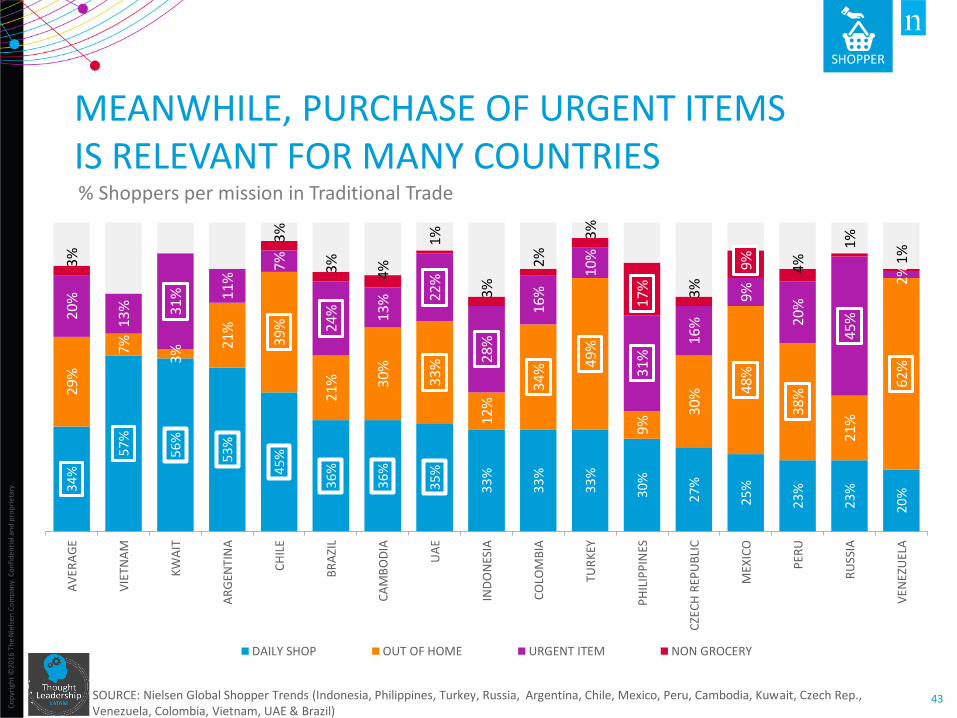
SHOPPER
MEANWHILE, PURCHASE OF URGENT ITEMS IS RELEVANT FOR MANY COUNTRIES
34
%
57
%
56
%
53
%
45
%
36
%
36
%
35
%
33
%
33
%
33
%
30
%
27
%
25
%
23
%
23
%
20
%
29%
7%
3% 21
%
39%
21%
30%
33%
12%
34%
49%
9% 30
% 48
%
38%
21
%
62%
20%
13%
31%
11%
7%
24%
13%
22%
28%
16%
10%
31%
16%
9%
20%
45%
2% 3%
3%
3%
4%
1%
3%
2%
3%
17%
3%
9%
4%
1%
1%
AV
ERA
GE
VIE
TNA
M
KW
AIT
AR
GEN
TIN
A
CH
ILE
BR
AZI
L
CA
MB
OD
IA
UA
E
IND
ON
ESIA
CO
LOM
BIA
TUR
KEY
PH
ILIP
PIN
ES
CZE
CH
REP
UB
LIC
MEX
ICO
PER
U
RU
SSIA
VEN
EZU
ELA
DAILY SHOP OUT OF HOME URGENT ITEM NON GROCERY
% Shoppers per mission in Traditional Trade
SOURCE: Nielsen Global Shopper Trends (Indonesia, Philippines, Turkey, Russia, Argentina, Chile, Mexico, Peru, Cambodia, Kuwait, Czech Rep., Venezuela, Colombia, Vietnam, UAE & Brazil)
Co
pyr
igh
t ©
2016
Th
e N
iels
en C
om
pan
y. C
on
fid
enti
al a
nd
pro
pri
etar
y.
44
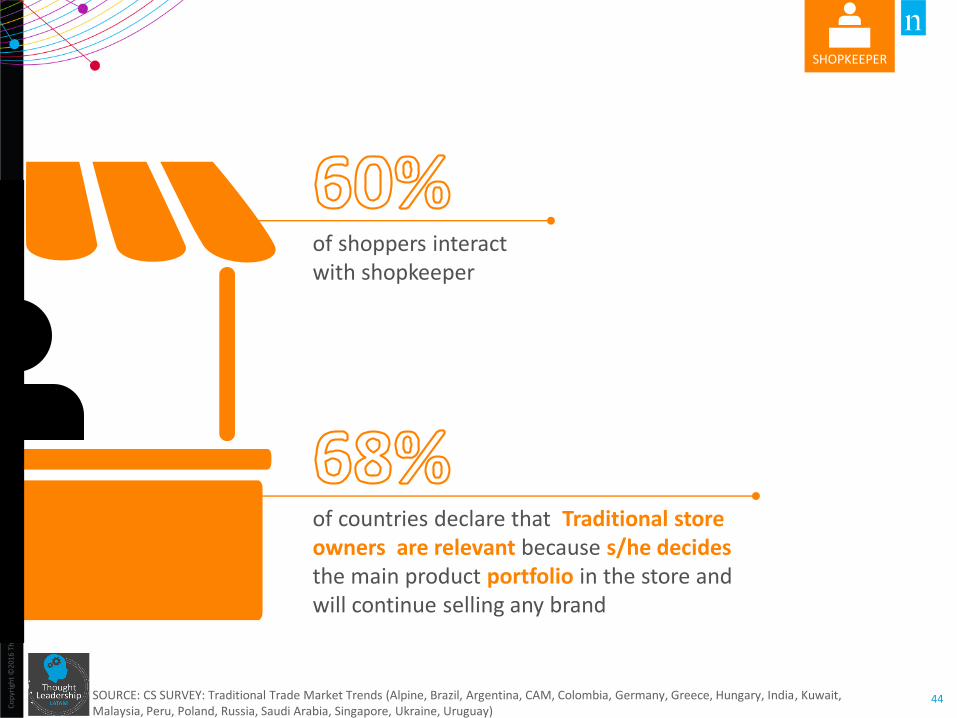
of shoppers interact with shopkeeper
of countries declare that Traditional store owners are relevant because s/he decides the main product portfolio in the store and will continue selling any brand
SHOPKEEPER
SOURCE: CS SURVEY: Traditional Trade Market Trends (Alpine, Brazil, Argentina, CAM, Colombia, Germany, Greece, Hungary, India, Kuwait, Malaysia, Peru, Poland, Russia, Saudi Arabia, Singapore, Ukraine, Uruguay)
Co
pyr
igh
t ©
2016
Th
e N
iels
en C
om
pan
y. C
on
fid
enti
al a
nd
pro
pri
etar
y.
45
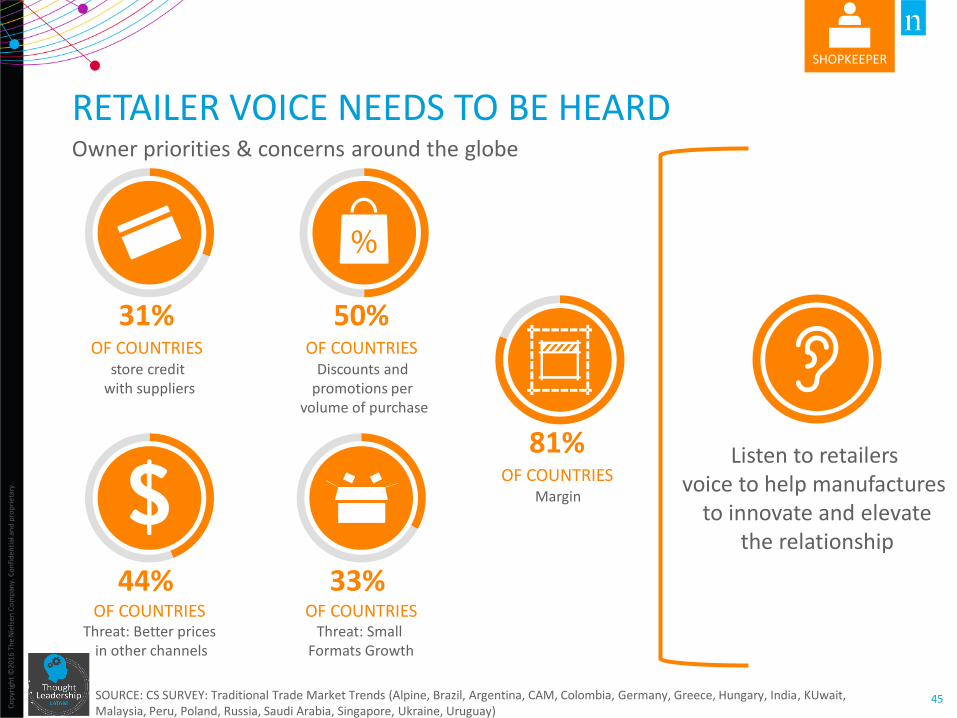
RETAILER VOICE NEEDS TO BE HEARD Owner priorities & concerns around the globe
SOURCE: CS SURVEY: Traditional Trade Market Trends (Alpine, Brazil, Argentina, CAM, Colombia, Germany, Greece, Hungary, India, KUwait, Malaysia, Peru, Poland, Russia, Saudi Arabia, Singapore, Ukraine, Uruguay)
31% OF COUNTRIES
store credit with suppliers
50% OF COUNTRIES
Discounts and promotions per
volume of purchase
44% OF COUNTRIES
Threat: Better prices in other channels
33% OF COUNTRIES
Threat: Small Formats Growth
81% OF COUNTRIES
Margin
Listen to retailers voice to help manufactures
to innovate and elevate the relationship
SHOPKEEPER
Co
pyr
igh
t ©
2016
Th
e N
iels
en C
om
pan
y. C
on
fid
enti
al a
nd
pro
pri
etar
y.
46
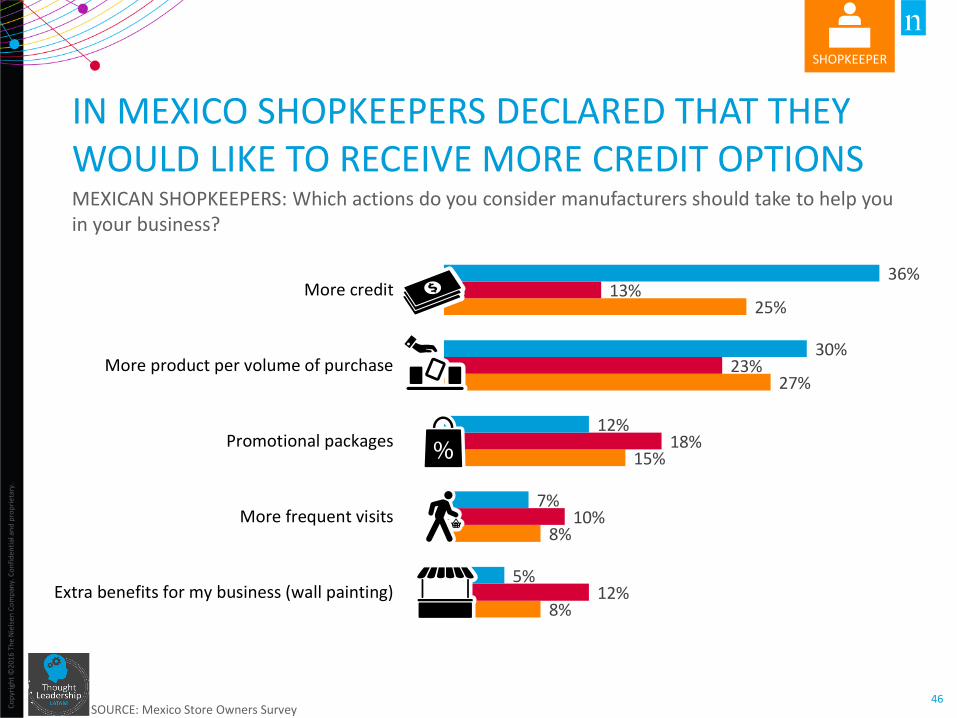
8%
8%
15%
27%
25%
12%
10%
18%
23%
13%
5%
7%
12%
30%
36%
Extra benefits for my business (wall painting)
More frequent visits
Promotional packages
More product per volume of purchase
More credit
IN MEXICO SHOPKEEPERS DECLARED THAT THEY WOULD LIKE TO RECEIVE MORE CREDIT OPTIONS MEXICAN SHOPKEEPERS: Which actions do you consider manufacturers should take to help you in your business?
SOURCE: Mexico Store Owners Survey
SHOPKEEPER
Co
pyr
igh
t ©
2012
Th
e N
iels
en C
om
pan
y. C
on
fid
enti
al a
nd
pro
pri
etar
y.
47
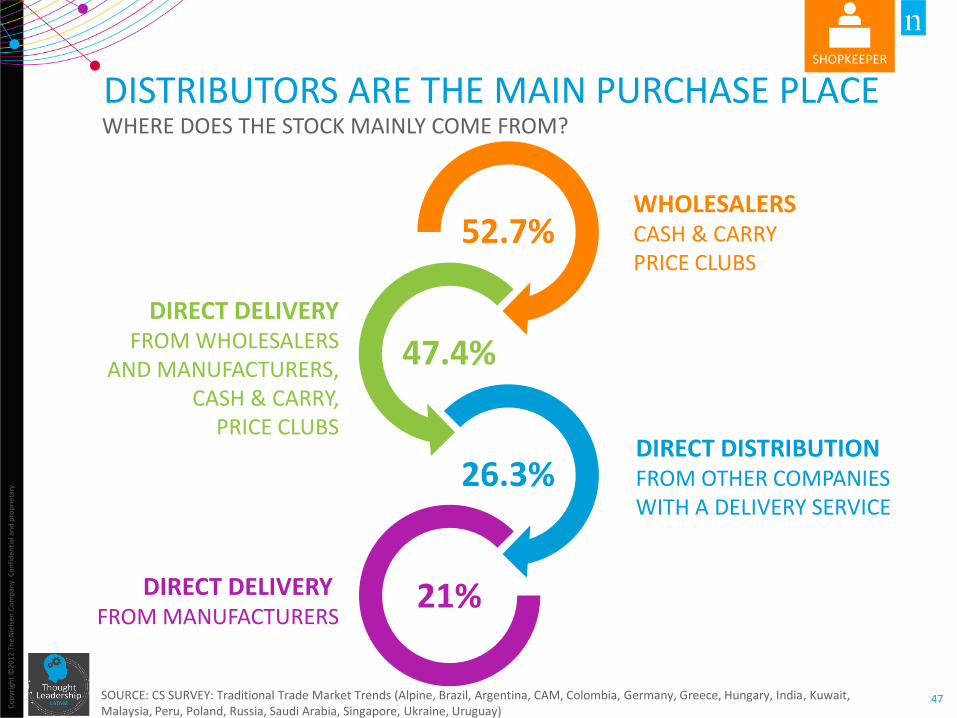
DISTRIBUTORS ARE THE MAIN PURCHASE PLACE WHERE DOES THE STOCK MAINLY COME FROM?
SOURCE: CS SURVEY: Traditional Trade Market Trends (Alpine, Brazil, Argentina, CAM, Colombia, Germany, Greece, Hungary, India, Kuwait, Malaysia, Peru, Poland, Russia, Saudi Arabia, Singapore, Ukraine, Uruguay)
52.7%
47.4%
26.3%
21%
WHOLESALERS CASH & CARRY PRICE CLUBS
DIRECT DELIVERY FROM WHOLESALERS
AND MANUFACTURERS, CASH & CARRY,
PRICE CLUBS DIRECT DISTRIBUTION FROM OTHER COMPANIES WITH A DELIVERY SERVICE
DIRECT DELIVERY FROM MANUFACTURERS
SHOPKEEPER
Co
pyr
igh
t ©
2016
Th
e N
iels
en C
om
pan
y. C
on
fid
enti
al a
nd
pro
pri
etar
y.
48
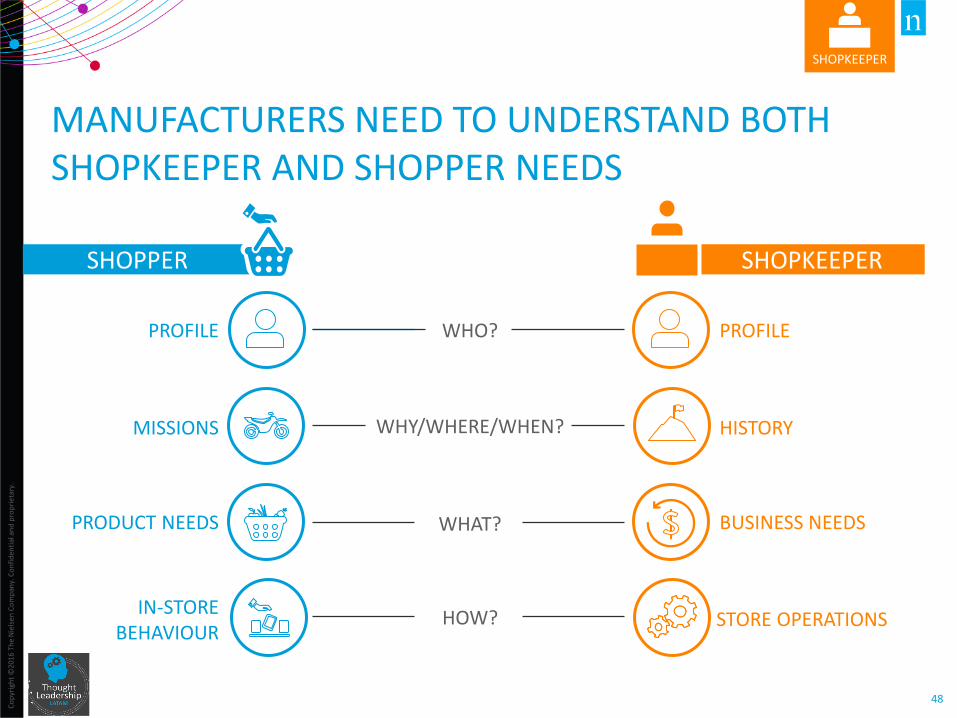
MANUFACTURERS NEED TO UNDERSTAND BOTH SHOPKEEPER AND SHOPPER NEEDS
SHOPKEEPER SHOPPER
PROFILE PROFILE WHO?
MISSIONS HISTORY WHY/WHERE/WHEN?
PRODUCT NEEDS BUSINESS NEEDS WHAT?
IN-STORE BEHAVIOUR
STORE OPERATIONS HOW?
SHOPKEEPER

MANUFACTURER’S MARKET PLAYBOOK
Co
pyr
igh
t ©
2016
Th
e N
iels
en C
om
pan
y. C
on
fid
enti
al a
nd
pro
pri
etar
y.
50
1. All successful strategies should take into account a deep understanding of how Shoppers differ in the world… How and Why they are choosing stores and products, how they arrive to the stores, etc. and which are the main concerns of Shopkeepers at local level
2. TT shopping is not a “monthly stock up trip”, nor is it always a ‘top up’ shop - it all depends on the size of the store, the range available (assortment depends of Shopkeeper budget -limited- and their deals with distributors) and the purchase occasion, Shoppers need, preferences and out of pocket
3. Merchandising can also take on a life of its own in a traditional trade environment where interior and display space is limited, especially for fridges or free standing units. Shopkeepers often use cross merchandising so color coding and labeling becomes key in order for products to stand out, packaging is key for offerings such as everyday staples which are displayed at the front of the store
SOMETHINGS TO CONSIDER…
Source: Nielsen Knowledge Center
Co
pyr
igh
t ©
2012
Th
e N
iels
en C
om
pan
y. C
on
fid
enti
al a
nd
pro
pri
etar
y.
51
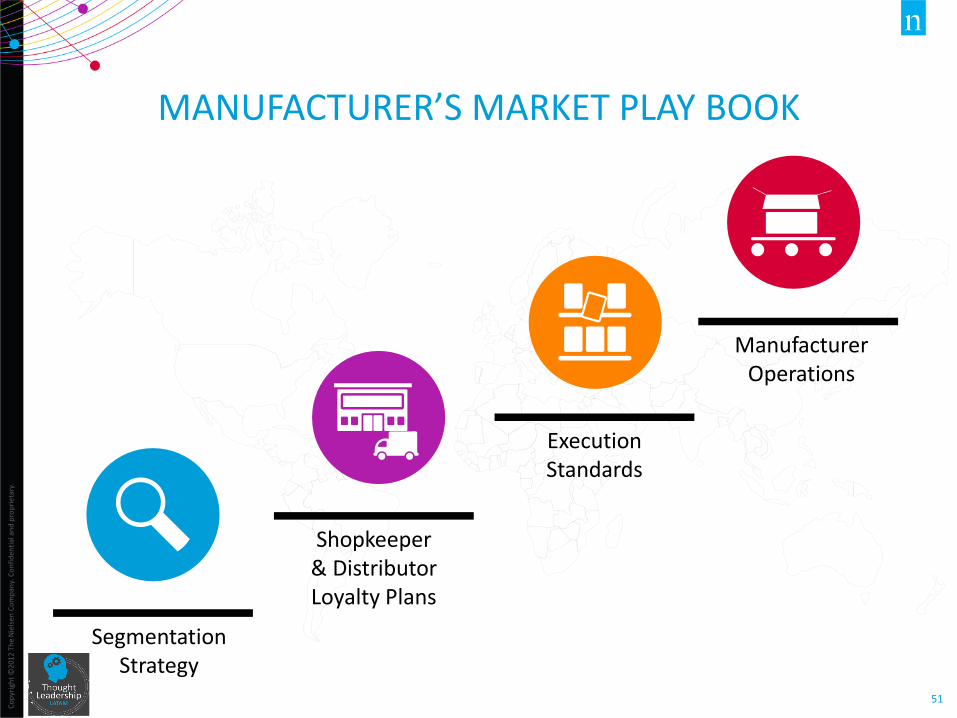
MANUFACTURER’S MARKET PLAY BOOK
Segmentation Strategy
Shopkeeper & Distributor Loyalty Plans
Execution Standards
Manufacturer Operations

Segmentation Strategy
MANUFACTURER’S MARKET PLAYBOOK
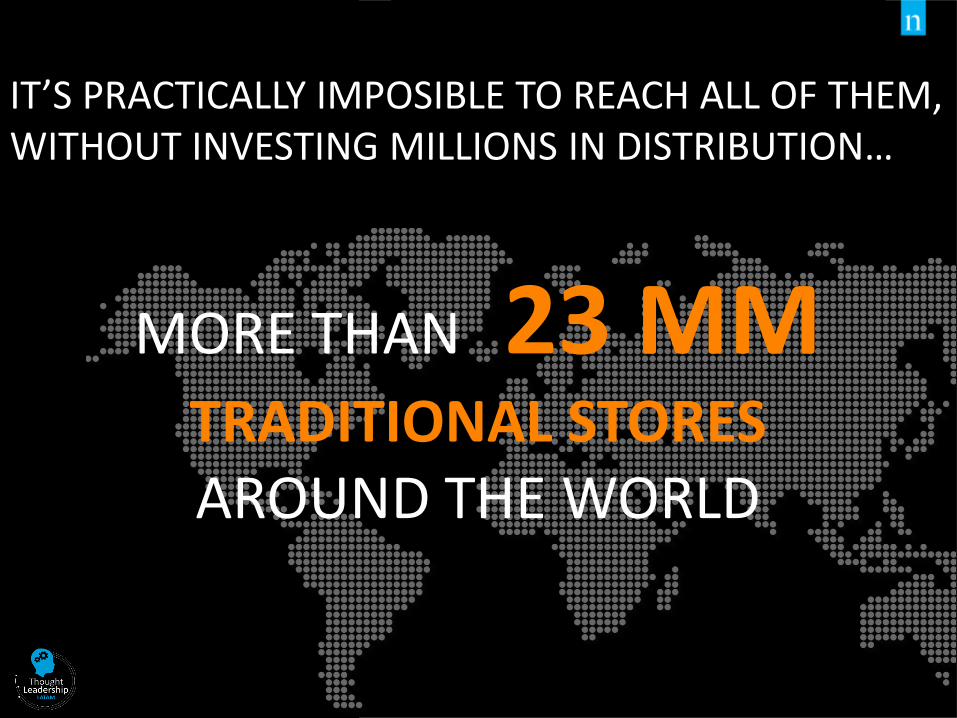
MORE THAN 23 MM TRADITIONAL STORES AROUND THE WORLD
IT’S PRACTICALLY IMPOSIBLE TO REACH ALL OF THEM, WITHOUT INVESTING MILLIONS IN DISTRIBUTION…
Co
pyr
igh
t ©
2012
Th
e N
iels
en C
om
pan
y. C
on
fid
enti
al a
nd
pro
pri
etar
y.
54
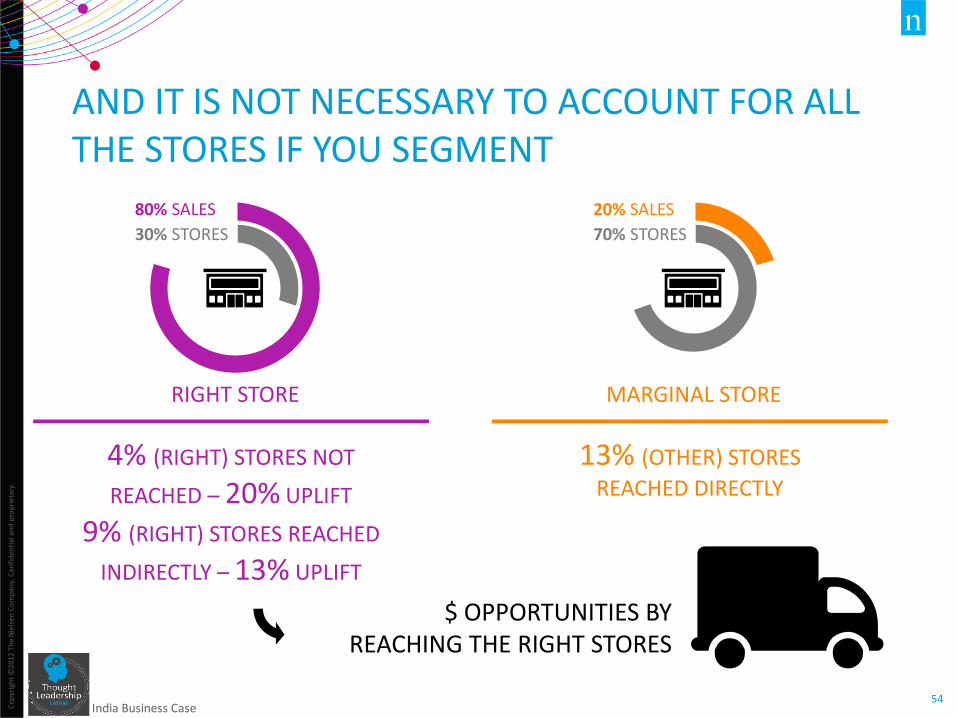
4% (RIGHT) STORES NOT
REACHED – 20% UPLIFT
9% (RIGHT) STORES REACHED
INDIRECTLY – 13% UPLIFT
13% (OTHER) STORES
REACHED DIRECTLY
AND IT IS NOT NECESSARY TO ACCOUNT FOR ALL THE STORES IF YOU SEGMENT
India Business Case
80% SALES
30% STORES
RIGHT STORE
$ OPPORTUNITIES BY REACHING THE RIGHT STORES
20% SALES
70% STORES
MARGINAL STORE
Co
pyr
igh
t ©
2016
Th
e N
iels
en C
om
pan
y. C
on
fid
enti
al a
nd
pro
pri
etar
y.
55
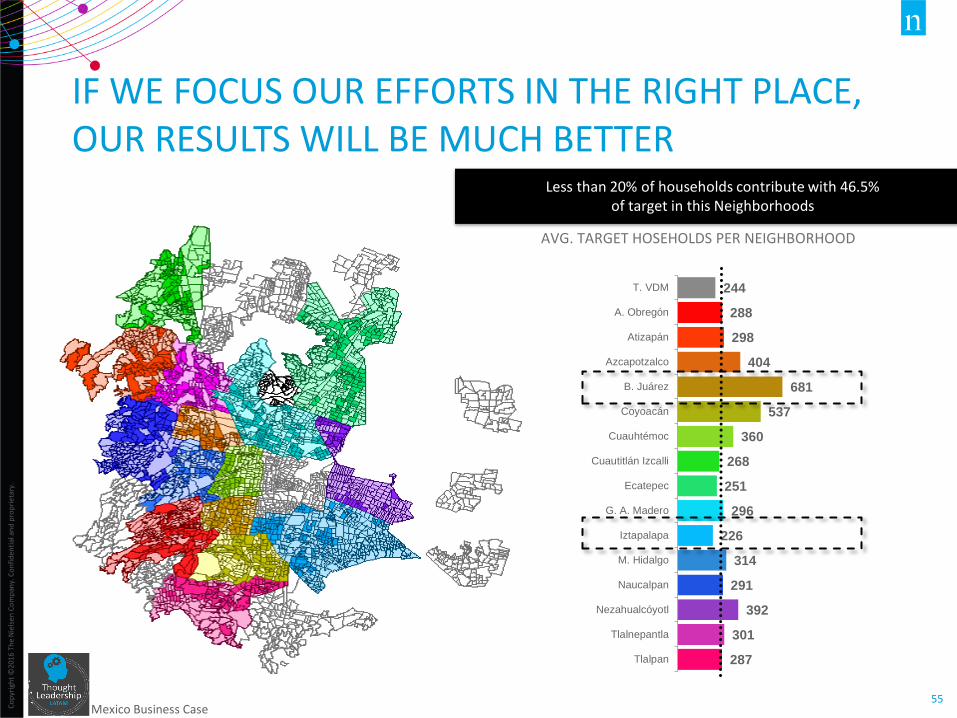
244
288
298
404
681
537
360
268
251
296
226
314
291
392
301
287
T. VDM
A. Obregón
Atizapán
Azcapotzalco
B. Juárez
Coyoacán
Cuauhtémoc
Cuautitlán Izcalli
Ecatepec
G. A. Madero
Iztapalapa
M. Hidalgo
Naucalpan
Nezahualcóyotl
Tlalnepantla
Tlalpan
AVG. TARGET HOSEHOLDS PER NEIGHBORHOOD
Less than 20% of households contribute with 46.5% of target in this Neighborhoods
Mexico Business Case
IF WE FOCUS OUR EFFORTS IN THE RIGHT PLACE, OUR RESULTS WILL BE MUCH BETTER
Co
pyr
igh
t ©
2012
Th
e N
iels
en C
om
pan
y. C
on
fid
enti
al a
nd
pro
pri
etar
y.
56
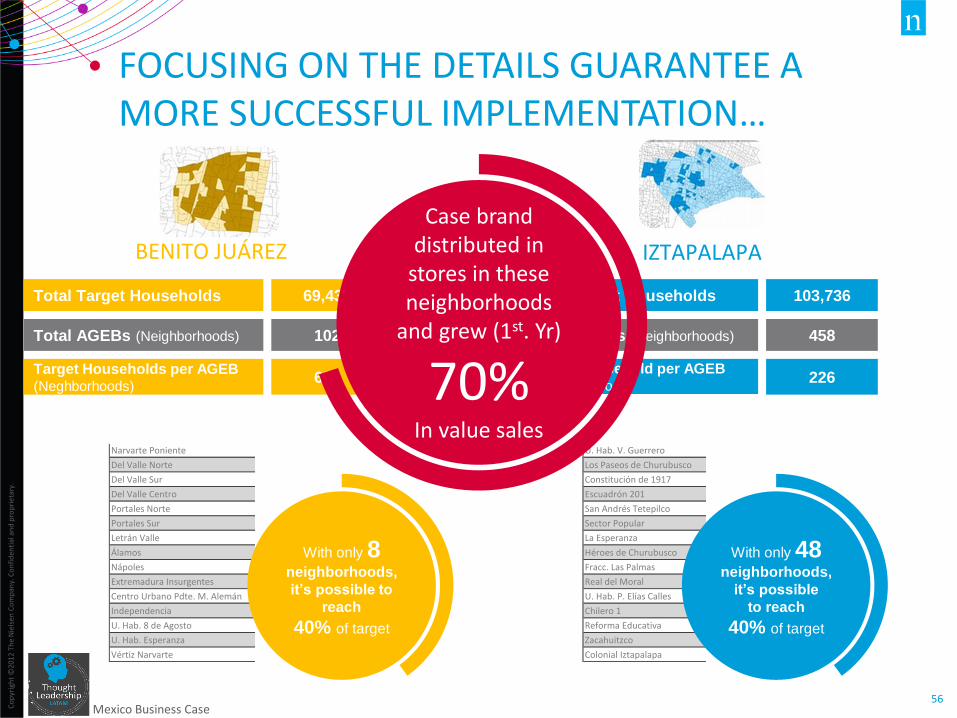
FOCUSING ON THE DETAILS GUARANTEE A MORE SUCCESSFUL IMPLEMENTATION…
Top ColoniasHogares
TargetNarvarte Poniente 7,737
Del Valle Norte 3,974
Del Valle Sur 3,861
Del Valle Centro 3,709
Portales Norte 3,200
Portales Sur 2,857
Letrán Valle 2,372
Álamos 2,352
Nápoles 1,575
Extremadura Insurgentes 1,156
Centro Urbano Pdte. M. Alemán 1,073
Independencia 1,045
U. Hab. 8 de Agosto 986
U. Hab. Esperanza 957
Vértiz Narvarte 846
Top ColoniasHogares
TargetU. Hab. V. Guerrero 2,237
Los Paseos de Churubusco 1,787
Constitución de 1917 1,784
Escuadrón 201 1,769
San Andrés Tetepilco 1,749
Sector Popular 1,356
La Esperanza 1,345
Héroes de Churubusco 1,296
Fracc. Las Palmas 1,243
Real del Moral 1,241
U. Hab. P. Elías Calles 1,210
Chilero 1 1,145
Reforma Educativa 1,069
Zacahuitzco 1,015
Colonial Iztapalapa 1,012
Total AGEBs (Neighborhoods) 102
Total Target Households 69,432
Target Households per AGEB (Neghborhoods)
681
BENITO JUÁREZ
Total AGEBs (Neighborhoods) 458
Total Target Households 103,736
Target Household per AGEB (Neighborhoods)
226
IZTAPALAPA
Case brand distributed in
stores in these neighborhoods
and grew (1st. Yr)
70% In value sales
Mexico Business Case
With only 8 neighborhoods,
it’s possible to
reach
40% of target
With only 48 neighborhoods,
it’s possible
to reach
40% of target
Co
pyr
igh
t ©
2016
Th
e N
iels
en C
om
pan
y. C
on
fid
enti
al a
nd
pro
pri
etar
y.
57
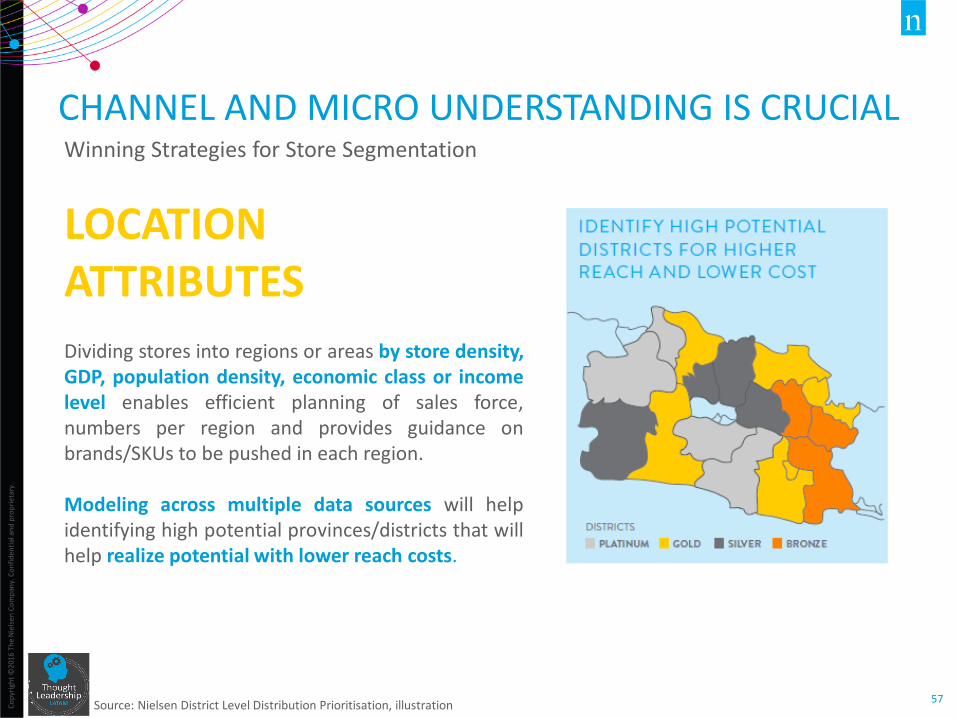
CHANNEL AND MICRO UNDERSTANDING IS CRUCIAL Winning Strategies for Store Segmentation
LOCATION ATTRIBUTES Dividing stores into regions or areas by store density, GDP, population density, economic class or income level enables efficient planning of sales force, numbers per region and provides guidance on brands/SKUs to be pushed in each region. Modeling across multiple data sources will help identifying high potential provinces/districts that will help realize potential with lower reach costs.
Source: Nielsen District Level Distribution Prioritisation, illustration
Co
pyr
igh
t ©
2016
Th
e N
iels
en C
om
pan
y. C
on
fid
enti
al a
nd
pro
pri
etar
y.
58
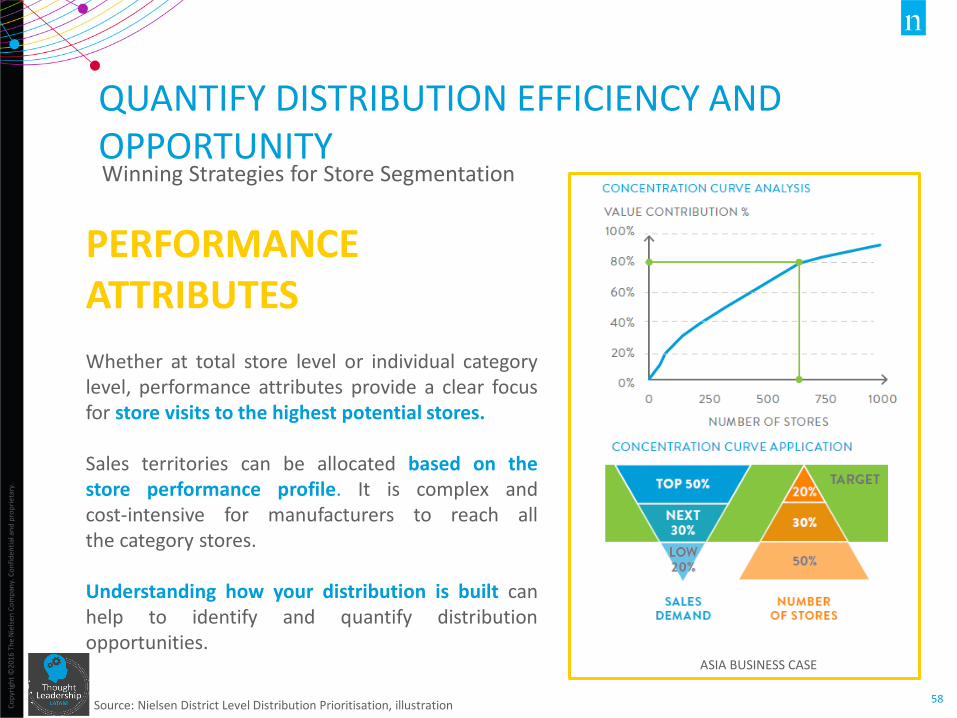
QUANTIFY DISTRIBUTION EFFICIENCY AND OPPORTUNITY Winning Strategies for Store Segmentation
PERFORMANCE ATTRIBUTES Whether at total store level or individual category level, performance attributes provide a clear focus for store visits to the highest potential stores. Sales territories can be allocated based on the store performance profile. It is complex and cost-intensive for manufacturers to reach all the category stores. Understanding how your distribution is built can help to identify and quantify distribution opportunities.
ASIA BUSINESS CASE
Source: Nielsen District Level Distribution Prioritisation, illustration
Co
pyr
igh
t ©
2012
Th
e N
iels
en C
om
pan
y. C
on
fid
enti
al a
nd
pro
pri
etar
y.
59
50
67
33
67
50
50
6
29
35
29
29
6
Typical consumption occasions
Socioeconomic level of the area
Profitability potential
Quality of the relationship
Potential share
Share at the store
100
67
50
71
47
35
Physical store characteristics
Own sales at the store
Channel
Forward looking criteria
Current performance
44%
32%
27%
38%
29%
15%
20%
21%
21%
Que tiene que ver el cost to serve?
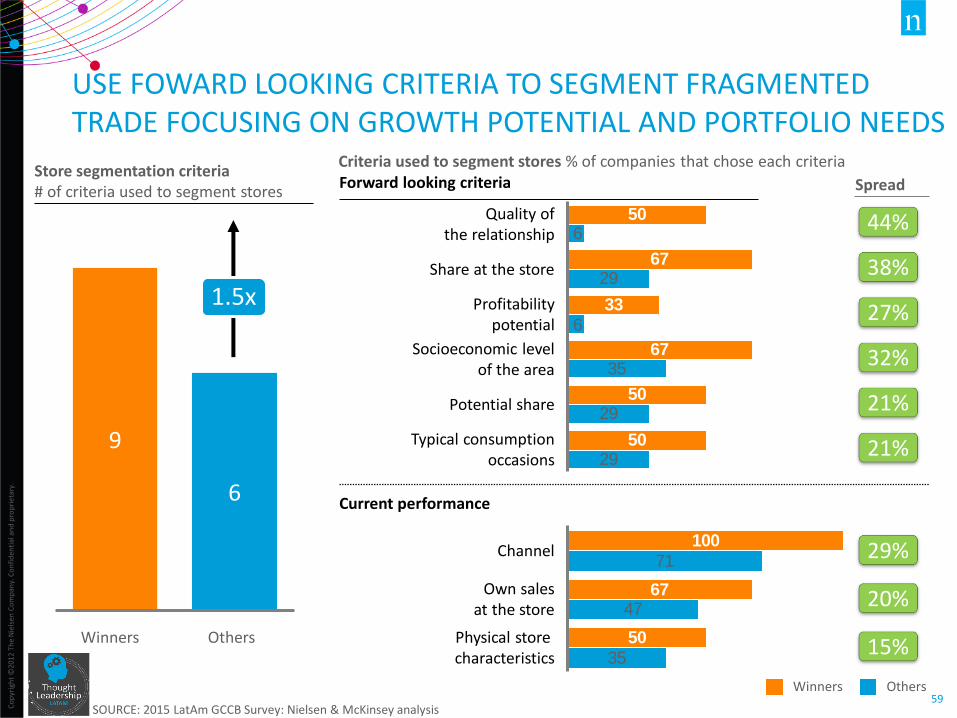
Store segmentation criteria # of criteria used to segment stores
9
6
Winners Others
1.5x
Criteria used to segment stores % of companies that chose each criteria
Spread
Winners Others
USE FOWARD LOOKING CRITERIA TO SEGMENT FRAGMENTED TRADE FOCUSING ON GROWTH POTENTIAL AND PORTFOLIO NEEDS
SOURCE: 2015 LatAm GCCB Survey: Nielsen & McKinsey analysis

MANUFACTURER’S MARKET PLAYBOOK
Shopkeeper & Distributor Loyalty Plans
Co
pyr
igh
t ©
2012
Th
e N
iels
en C
om
pan
y. C
on
fid
enti
al a
nd
pro
pri
etar
y.
61
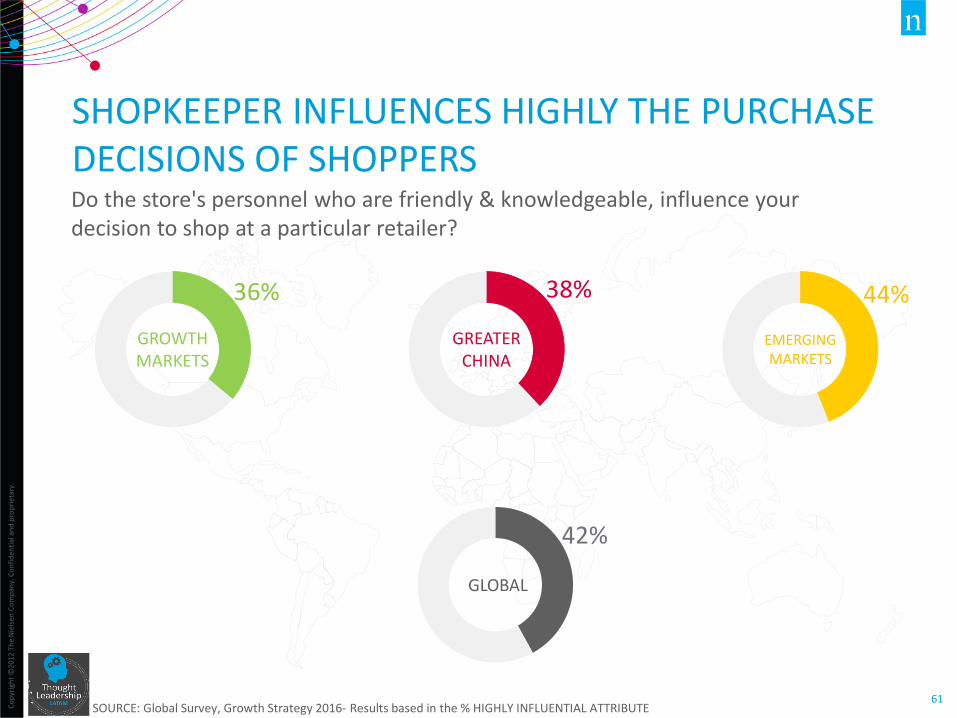
SHOPKEEPER INFLUENCES HIGHLY THE PURCHASE DECISIONS OF SHOPPERS
SOURCE: Global Survey, Growth Strategy 2016- Results based in the % HIGHLY INFLUENTIAL ATTRIBUTE
Do the store's personnel who are friendly & knowledgeable, influence your decision to shop at a particular retailer?
38%
GREATER CHINA
44%
EMERGING MARKETS
36%
GROWTH MARKETS
42%
GLOBAL
Co
pyr
igh
t ©
2016
Th
e N
iels
en C
om
pan
y. C
on
fid
enti
al a
nd
pro
pri
etar
y.
62
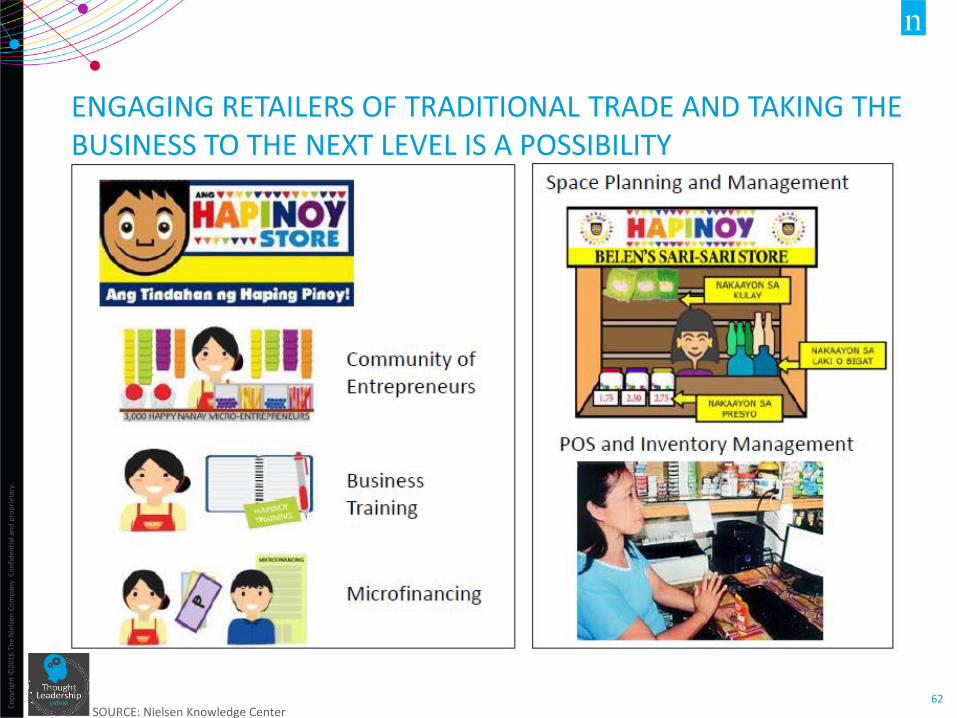
ENGAGING RETAILERS OF TRADITIONAL TRADE AND TAKING THE BUSINESS TO THE NEXT LEVEL IS A POSSIBILITY
SOURCE: Nielsen Knowledge Center
Co
pyr
igh
t ©
2016
Th
e N
iels
en C
om
pan
y. C
on
fid
enti
al a
nd
pro
pri
etar
y.
63
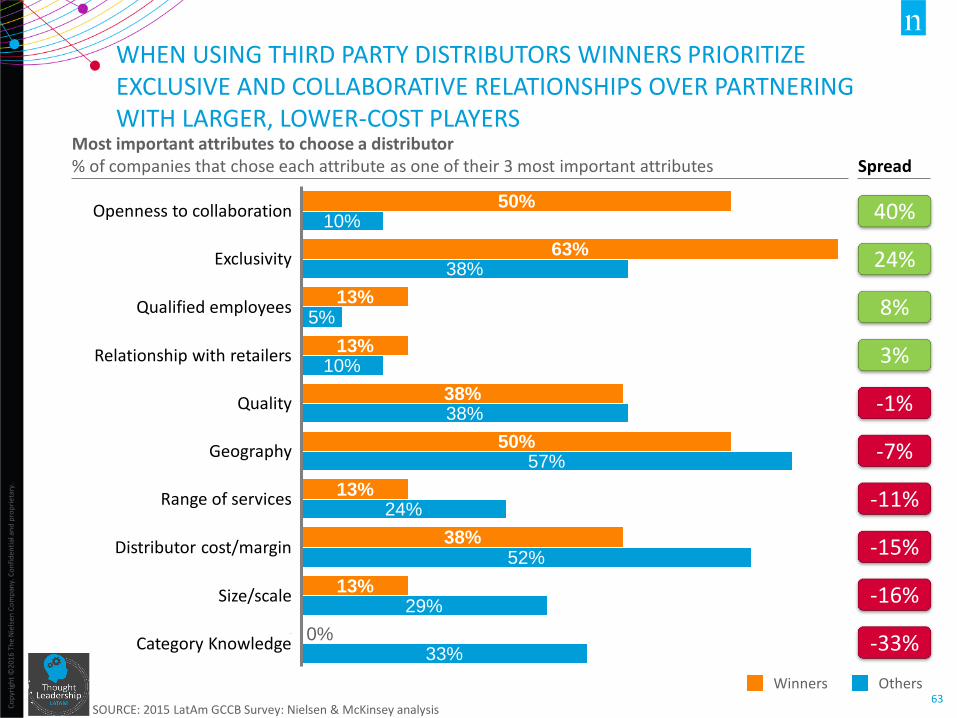
38%
13%
13%
Exclusivity 38%
63%
38%
10%
Qualified employees
Openness to collaboration
24%
13% Relationship with retailers
10%
50% Geography
5%
50%
38%
57%
Quality
52% Distributor cost/margin
13% Size/scale
0% Category Knowledge 33%
29%
Range of services
Winners Others
40%
-33%
8%
24%
3%
WHEN USING THIRD PARTY DISTRIBUTORS WINNERS PRIORITIZE EXCLUSIVE AND COLLABORATIVE RELATIONSHIPS OVER PARTNERING WITH LARGER, LOWER-COST PLAYERS
-16%
-7%
-1%
-15%
-11%
Most important attributes to choose a distributor % of companies that chose each attribute as one of their 3 most important attributes Spread
SOURCE: 2015 LatAm GCCB Survey: Nielsen & McKinsey analysis

Execution Standards
MANUFACTURER’S MARKET PLAYBOOK
Co
pyr
igh
t ©
2016
Th
e N
iels
en C
om
pan
y. C
on
fid
enti
al a
nd
pro
pri
etar
y.
65
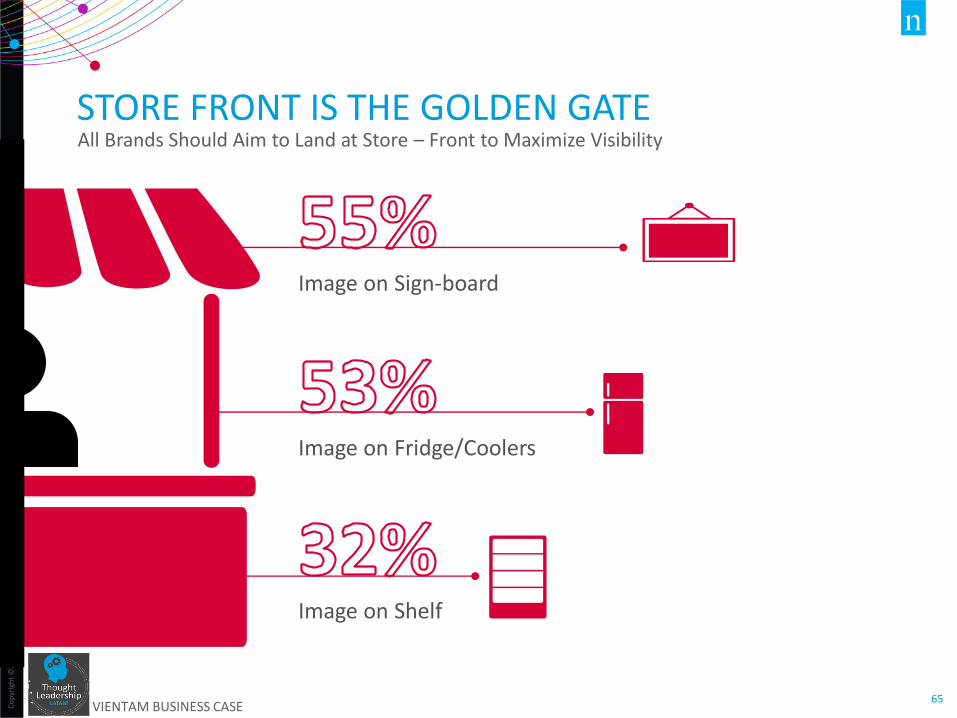
STORE FRONT IS THE GOLDEN GATE All Brands Should Aim to Land at Store – Front to Maximize Visibility
VIENTAM BUSINESS CASE
Image on Sign-board
Image on Fridge/Coolers
Image on Shelf
Co
pyr
igh
t ©
2016
Th
e N
iels
en C
om
pan
y. C
on
fid
enti
al a
nd
pro
pri
etar
y.
66
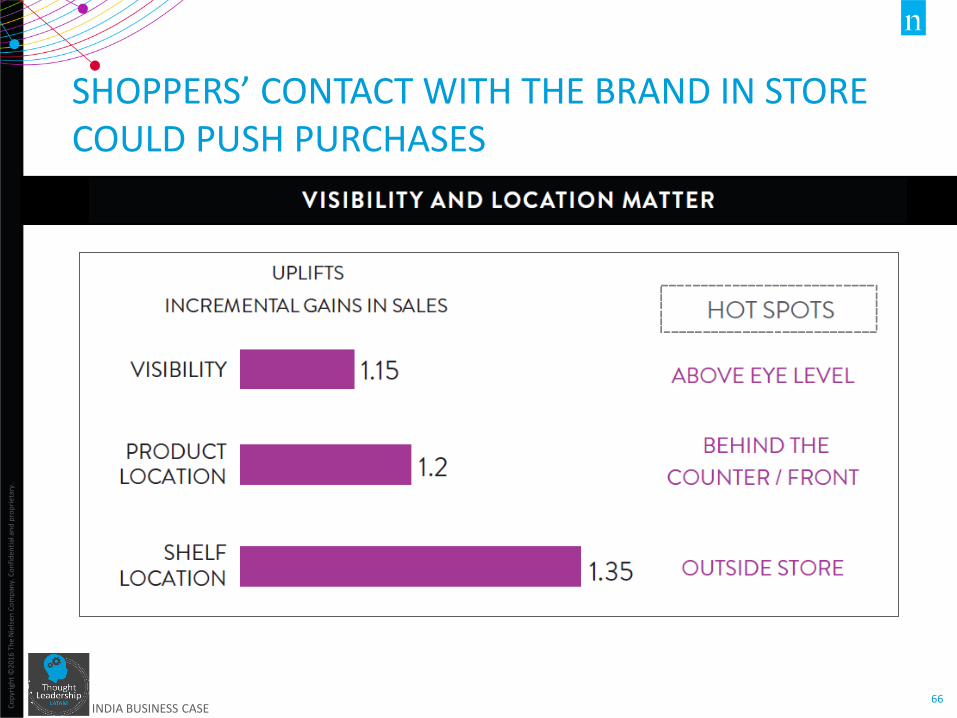
SHOPPERS’ CONTACT WITH THE BRAND IN STORE COULD PUSH PURCHASES
INDIA BUSINESS CASE
Co
pyr
igh
t ©
2016
Th
e N
iels
en C
om
pan
y. C
on
fid
enti
al a
nd
pro
pri
etar
y.
67
0,01,02,03,04,05,06,07,08,09,010,0
0
5
10
15
20
25
30
35
40
45
Brand A
Demand Accessibility
0,0
1,0
2,0
3,0
4,0
5,0
6,0
7,0
8,0
0,0
5,0
10,0
15,0
20,0
25,0
30,0
35,0
40,0
Brand B
Demand Accessibility
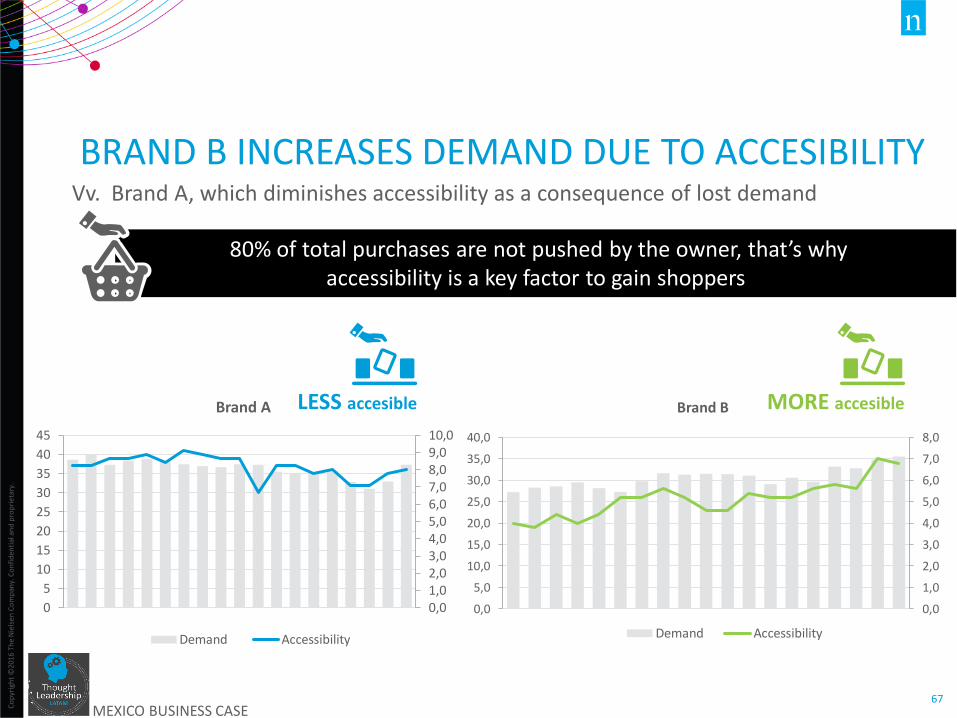
BRAND B INCREASES DEMAND DUE TO ACCESIBILITY Vv. Brand A, which diminishes accessibility as a consequence of lost demand
MEXICO BUSINESS CASE
LESS accesible
80% of total purchases are not pushed by the owner, that’s why accessibility is a key factor to gain shoppers
MORE accesible

Co
pyr
igh
t ©
2016
Th
e N
iels
en C
om
pan
y. C
on
fid
enti
al a
nd
pro
pri
etar
y.
68
Another challenge is achieving in-store effective communication with the shopper: only 11% of shoppers interact with POSM
SOURCE: Nielsen Global Shopper Trends (Indonesia, Phillipines, Turkey, Rusia, Argentina, Chile, Mexico, Peru, Cambodia, Kwait, Czech Rep., Venezuela, Colombia, Vietnam, UAE & Brazil) – POSM: Point of sale Marketing
Co
pyr
igh
t ©
2012
Th
e N
iels
en C
om
pan
y. C
on
fid
enti
al a
nd
pro
pri
etar
y.
69
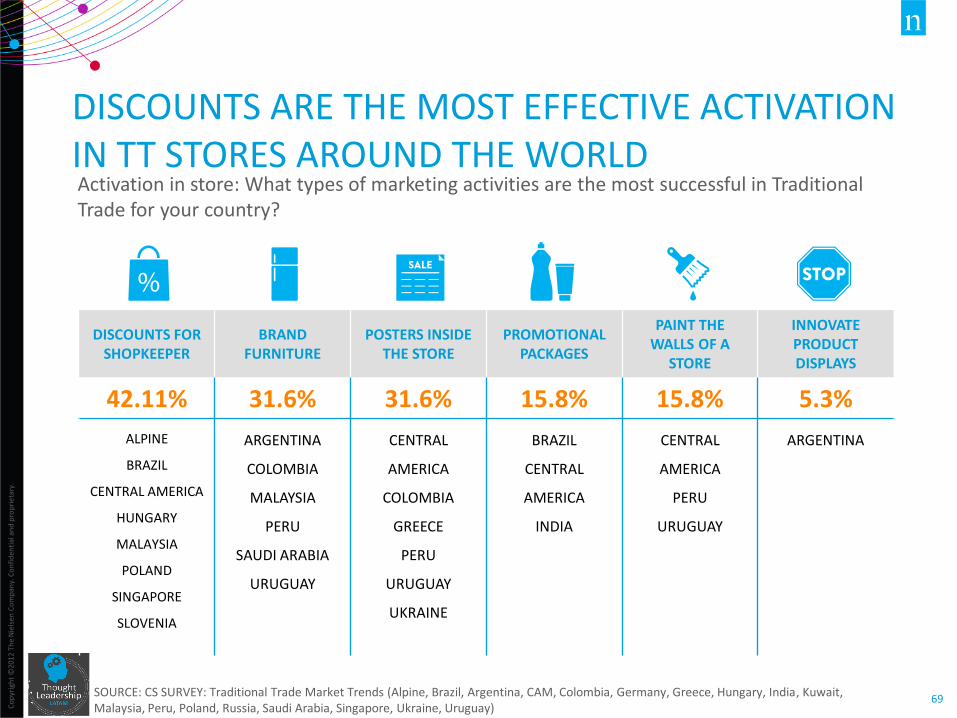
DISCOUNTS ARE THE MOST EFFECTIVE ACTIVATION IN TT STORES AROUND THE WORLD
SOURCE: CS SURVEY: Traditional Trade Market Trends (Alpine, Brazil, Argentina, CAM, Colombia, Germany, Greece, Hungary, India, Kuwait, Malaysia, Peru, Poland, Russia, Saudi Arabia, Singapore, Ukraine, Uruguay)
DISCOUNTS FOR SHOPKEEPER
BRAND FURNITURE
POSTERS INSIDE THE STORE
PROMOTIONAL PACKAGES
PAINT THE WALLS OF A
STORE
INNOVATE PRODUCT DISPLAYS
42.11% 31.6% 31.6% 15.8% 15.8% 5.3%
ALPINE
BRAZIL
CENTRAL AMERICA
HUNGARY
MALAYSIA
POLAND
SINGAPORE
SLOVENIA
ARGENTINA
COLOMBIA
MALAYSIA
PERU
SAUDI ARABIA
URUGUAY
CENTRAL
AMERICA
COLOMBIA
GREECE
PERU
URUGUAY
UKRAINE
BRAZIL
CENTRAL
AMERICA
INDIA
CENTRAL
AMERICA
PERU
URUGUAY
ARGENTINA
Activation in store: What types of marketing activities are the most successful in Traditional Trade for your country?
Co
pyr
igh
t ©
2012
Th
e N
iels
en C
om
pan
y. C
on
fid
enti
al a
nd
pro
pri
etar
y.
70
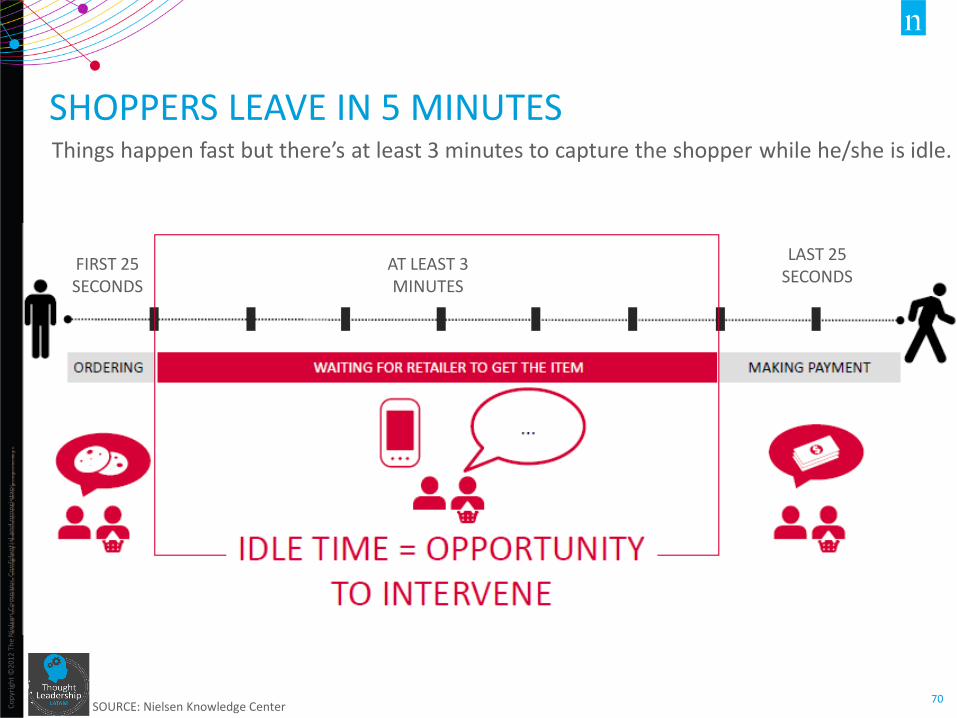
SHOPPERS LEAVE IN 5 MINUTES Things happen fast but there’s at least 3 minutes to capture the shopper while he/she is idle.
FIRST 25 SECONDS
AT LEAST 3 MINUTES
LAST 25 SECONDS
SOURCE: Nielsen Knowledge Center
Co
pyr
igh
t ©
2012
Th
e N
iels
en C
om
pan
y. C
on
fid
enti
al a
nd
pro
pri
etar
y.
71
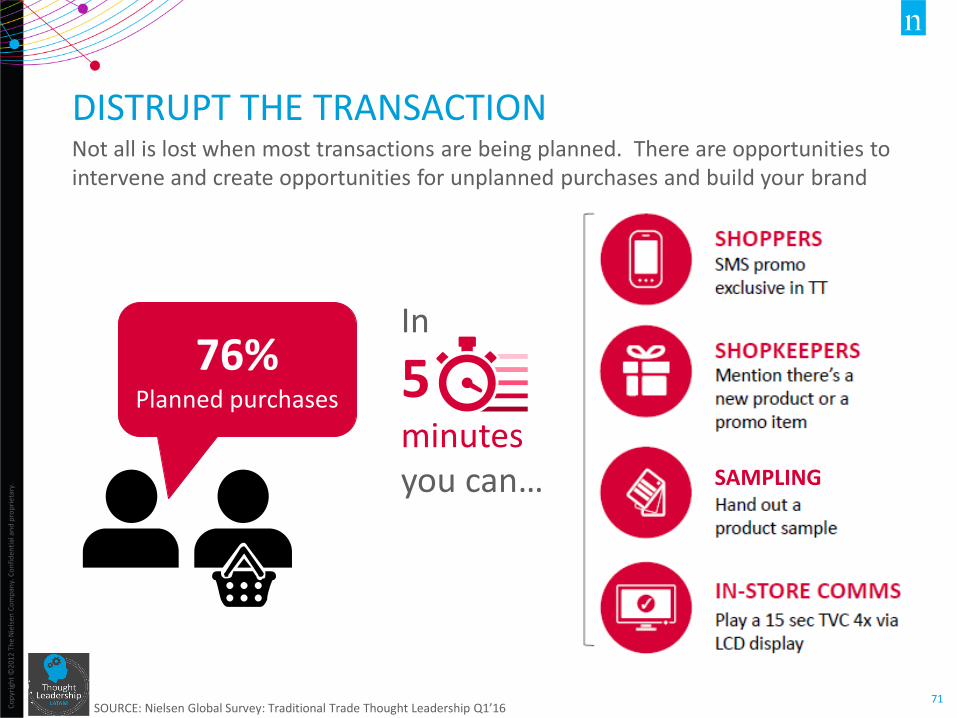
76% Planned purchases
DISTRUPT THE TRANSACTION Not all is lost when most transactions are being planned. There are opportunities to intervene and create opportunities for unplanned purchases and build your brand
SOURCE: Nielsen Global Survey: Traditional Trade Thought Leadership Q1’16
In
5 minutes you can… SAMPLING
Co
pyr
igh
t ©
2012
Th
e N
iels
en C
om
pan
y. C
on
fid
enti
al a
nd
pro
pri
etar
y.
72
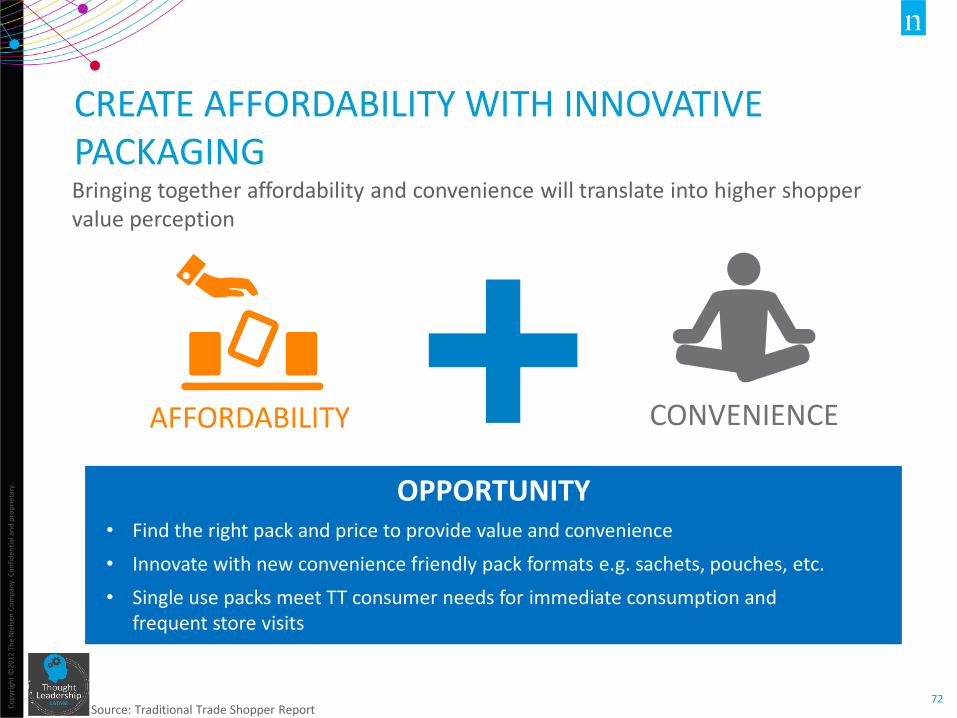
CREATE AFFORDABILITY WITH INNOVATIVE PACKAGING Bringing together affordability and convenience will translate into higher shopper value perception
Source: Traditional Trade Shopper Report
OPPORTUNITY • Find the right pack and price to provide value and convenience
• Innovate with new convenience friendly pack formats e.g. sachets, pouches, etc.
• Single use packs meet TT consumer needs for immediate consumption and frequent store visits
AFFORDABILITY CONVENIENCE
Co
pyr
igh
t ©
2012
Th
e N
iels
en C
om
pan
y. C
on
fid
enti
al a
nd
pro
pri
etar
y.
73
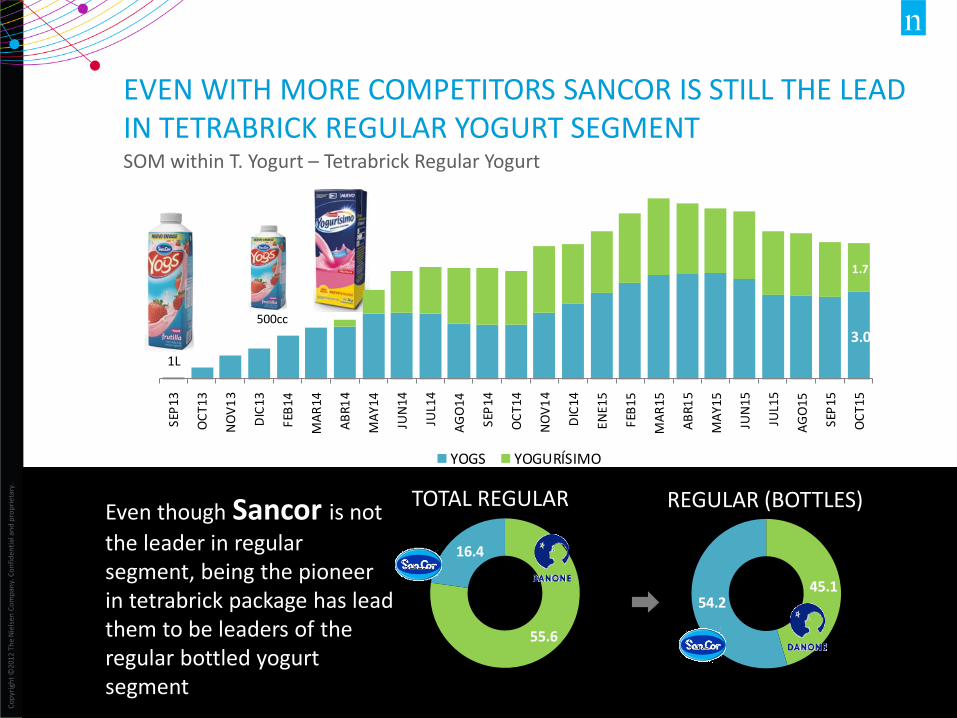
500cc
1L
EVEN WITH MORE COMPETITORS SANCOR IS STILL THE LEAD IN TETRABRICK REGULAR YOGURT SEGMENT
SOM within T. Yogurt – Tetrabrick Regular Yogurt
3.0
1.7
SEP
13
OC
T1
3
NO
V1
3
DIC
13
FEB
14
MA
R14
AB
R14
MA
Y1
4
JU
N1
4
JU
L14
AG
O14
SEP
14
OC
T1
4
NO
V1
4
DIC
14
EN
E15
FEB
15
MA
R15
AB
R15
MA
Y15
JU
N1
5
JU
L15
AG
O15
SEP
15
OC
T15
YOGS YOGURÍSIMO
TOTAL REGULAR
45.1 54.2
REGULAR (BOTTLES) Even though Sancor is not
the leader in regular segment, being the pioneer in tetrabrick package has lead them to be leaders of the regular bottled yogurt segment
55.6
16.4
Co
pyr
igh
t ©
2012
Th
e N
iels
en C
om
pan
y. C
on
fid
enti
al a
nd
pro
pri
etar
y.
74
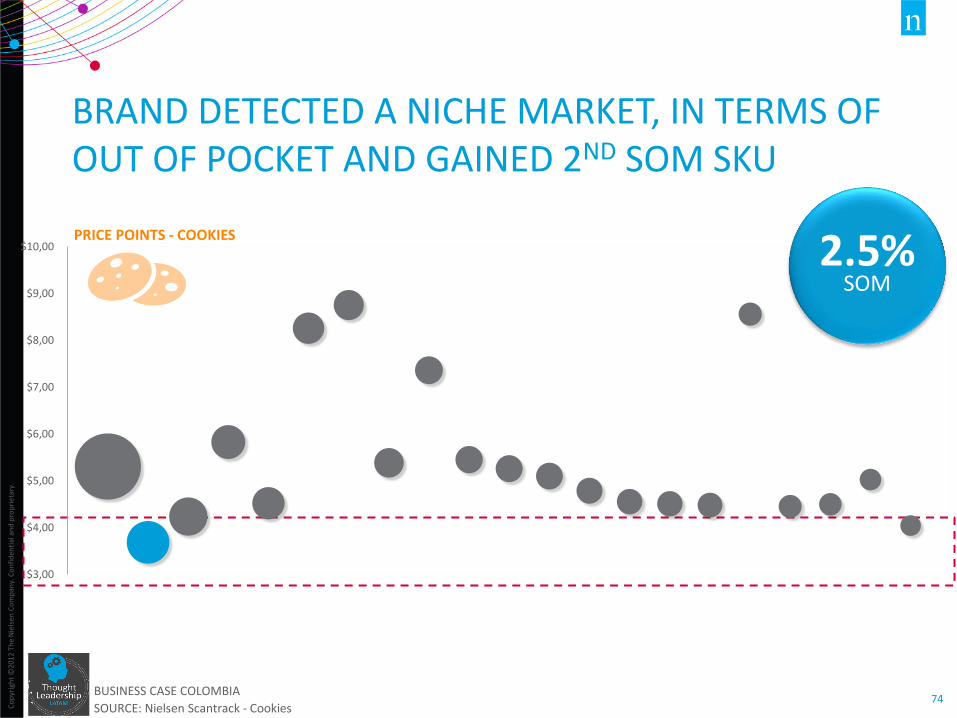
BRAND DETECTED A NICHE MARKET, IN TERMS OF OUT OF POCKET AND GAINED 2ND SOM SKU
BUSINESS CASE COLOMBIA
SOURCE: Nielsen Scantrack - Cookies
$3,00
$4,00
$5,00
$6,00
$7,00
$8,00
$9,00
$10,00 2.5% SOM
PRICE POINTS - COOKIES
Co
pyr
igh
t ©
2012
Th
e N
iels
en C
om
pan
y. C
on
fid
enti
al a
nd
pro
pri
etar
y.
75
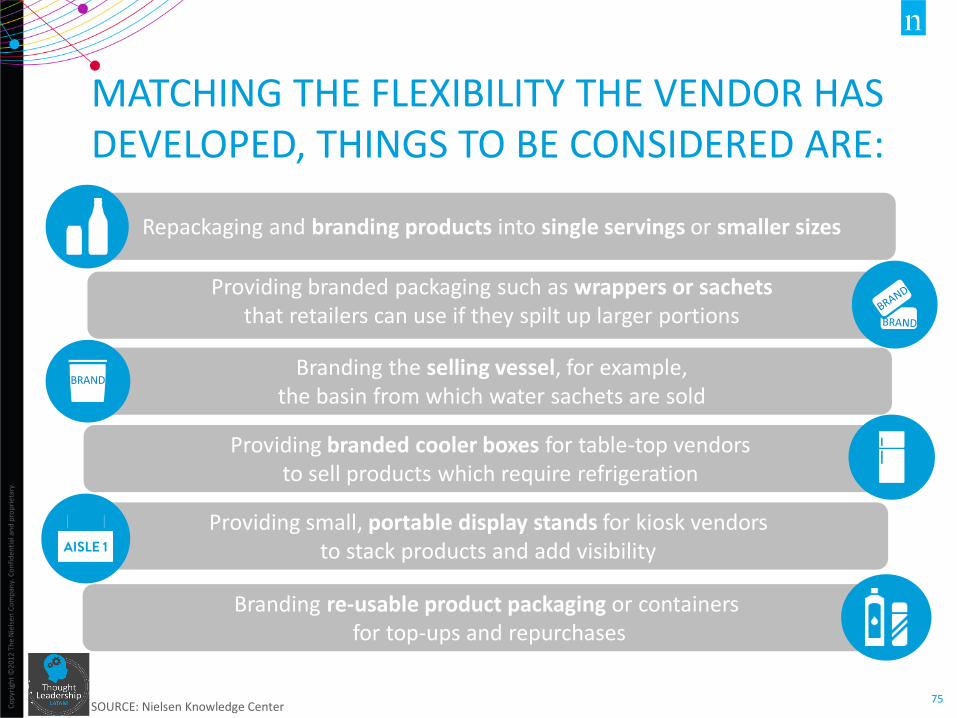
MATCHING THE FLEXIBILITY THE VENDOR HAS DEVELOPED, THINGS TO BE CONSIDERED ARE:
SOURCE: Nielsen Knowledge Center
Repackaging and branding products into single servings or smaller sizes
Providing branded packaging such as wrappers or sachets that retailers can use if they spilt up larger portions
Providing branded cooler boxes for table-top vendors to sell products which require refrigeration
Branding the selling vessel, for example, the basin from which water sachets are sold
BRAND
Branding re-usable product packaging or containers for top-ups and repurchases
Providing small, portable display stands for kiosk vendors to stack products and add visibility
Co
pyr
igh
t ©
2012
Th
e N
iels
en C
om
pan
y. C
on
fid
enti
al a
nd
pro
pri
etar
y.
76
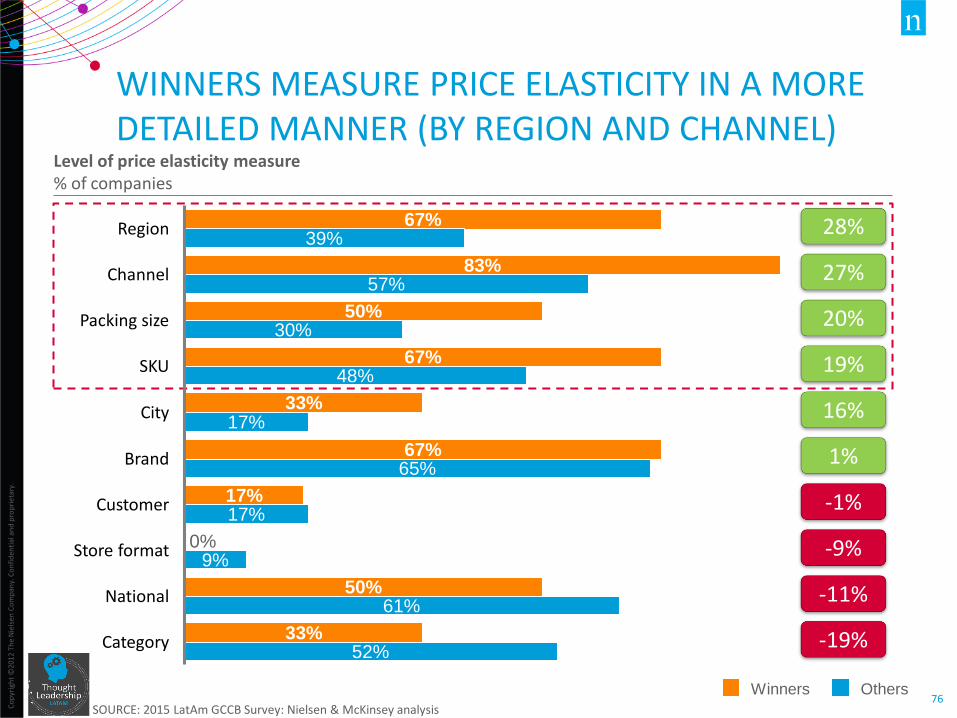
Level of price elasticity measure % of companies
WINNERS MEASURE PRICE ELASTICITY IN A MORE DETAILED MANNER (BY REGION AND CHANNEL)
National 61%
50%
Store format 9%
0%
Customer 17% 17%
Brand 65% 67%
City 17%
Category 52%
33%
33%
SKU 48%
67%
Packing size 30%
50%
Channel 57%
83%
Region 39%
67%
Others Winners
28%
27%
-1%
-9%
20%
19%
16%
-11%
-19%
1%
SOURCE: 2015 LatAm GCCB Survey: Nielsen & McKinsey analysis
Co
pyr
igh
t ©
2012
Th
e N
iels
en C
om
pan
y. C
on
fid
enti
al a
nd
pro
pri
etar
y.
77
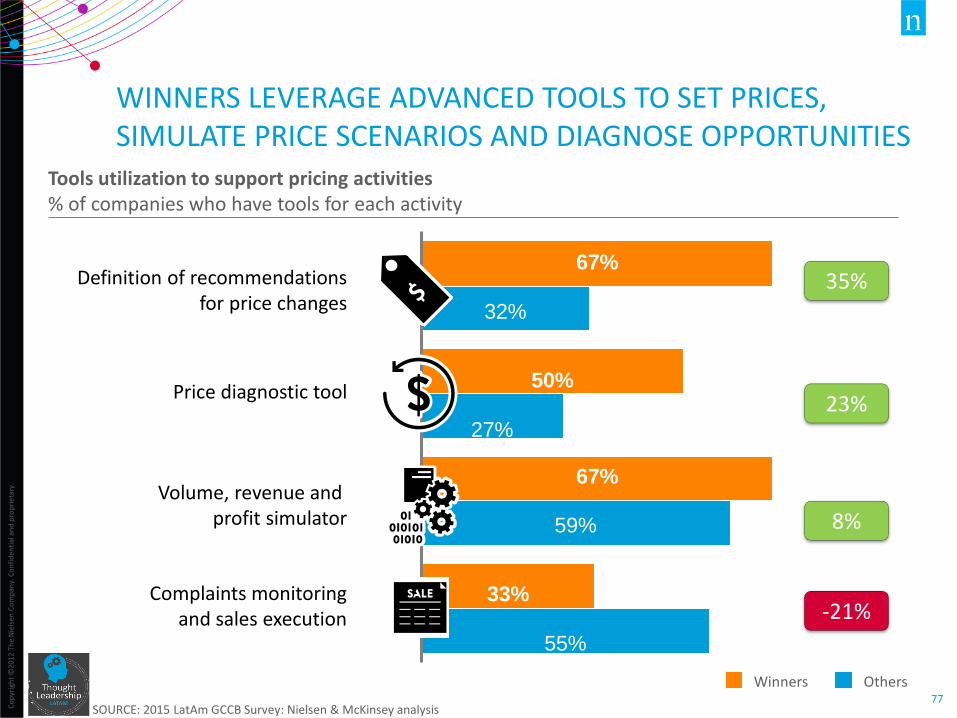
Tools utilization to support pricing activities % of companies who have tools for each activity
WINNERS LEVERAGE ADVANCED TOOLS TO SET PRICES, SIMULATE PRICE SCENARIOS AND DIAGNOSE OPPORTUNITIES
Volume, revenue and profit simulator
55%
59%
Complaints monitoring and sales execution
Price diagnostic tool 50%
67%
67%
27%
Definition of recommendations for price changes
33%
32%
Others Winners
35%
23%
-21%
8%
SOURCE: 2015 LatAm GCCB Survey: Nielsen & McKinsey analysis

Manufacturer Operations
MANUFACTURER’S MARKET PLAYBOOK
Co
pyr
igh
t ©
2016
Th
e N
iels
en C
om
pan
y. C
on
fid
enti
al a
nd
pro
pri
etar
y.
79
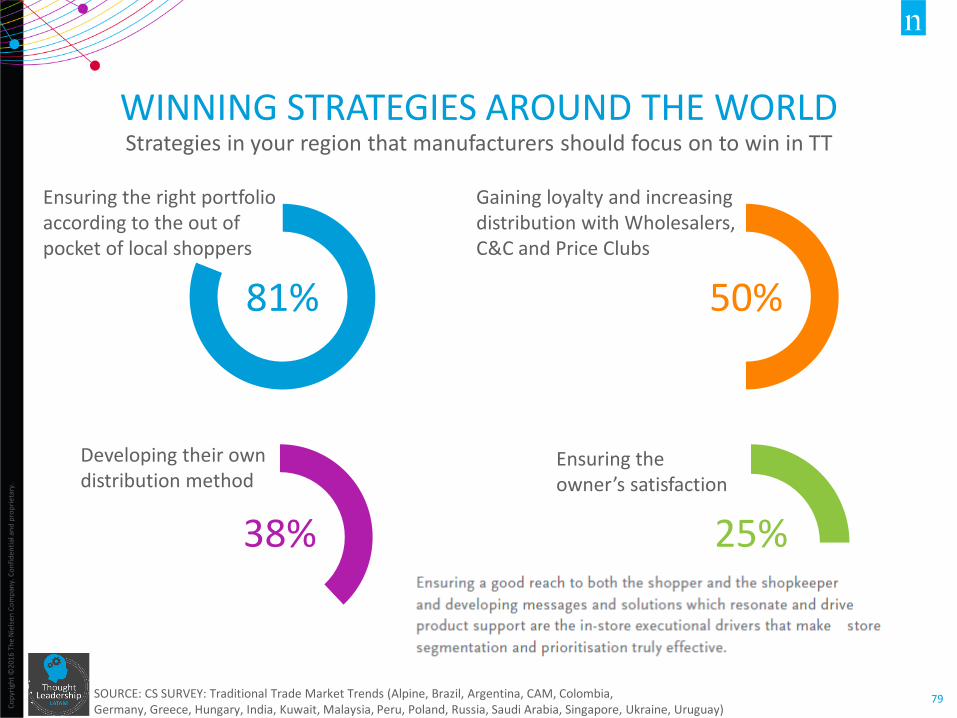
WINNING STRATEGIES AROUND THE WORLD Strategies in your region that manufacturers should focus on to win in TT
Ensuring the owner’s satisfaction
Developing their own distribution method
Gaining loyalty and increasing distribution with Wholesalers, C&C and Price Clubs
Ensuring the right portfolio according to the out of pocket of local shoppers
81% 50%
38% 25%
SOURCE: CS SURVEY: Traditional Trade Market Trends (Alpine, Brazil, Argentina, CAM, Colombia, Germany, Greece, Hungary, India, Kuwait, Malaysia, Peru, Poland, Russia, Saudi Arabia, Singapore, Ukraine, Uruguay)
Co
pyr
igh
t ©
2016
Th
e N
iels
en C
om
pan
y. C
on
fid
enti
al a
nd
pro
pri
etar
y.
80
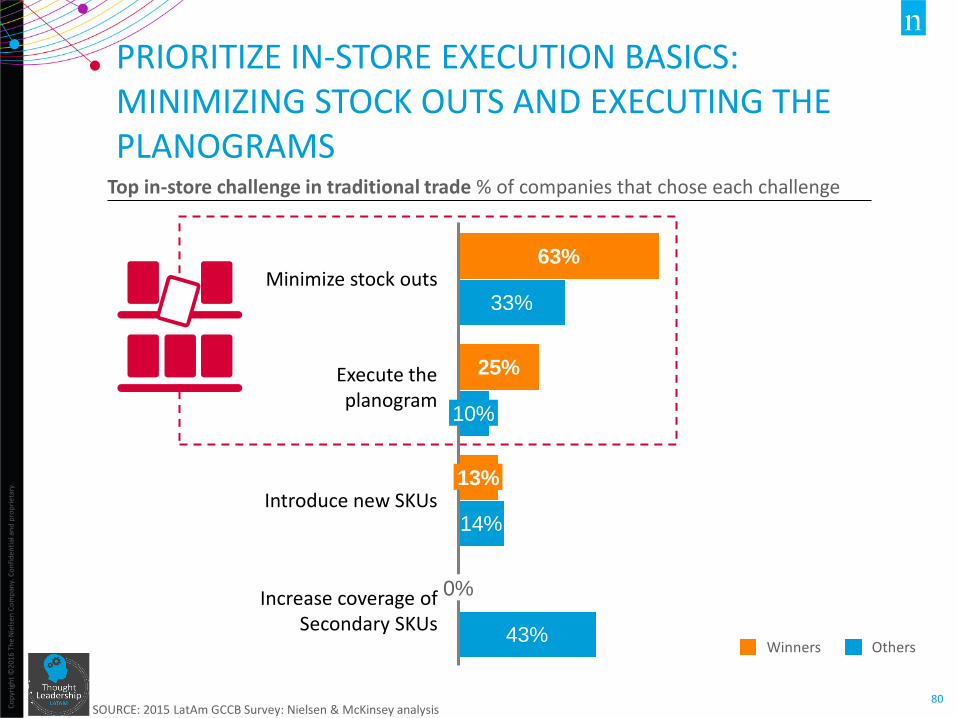
PRIORITIZE IN-STORE EXECUTION BASICS: MINIMIZING STOCK OUTS AND EXECUTING THE PLANOGRAMS
Increase coverage of Secondary SKUs
43%
0%
Introduce new SKUs 14%
13%
Execute the planogram
10%
25%
Minimize stock outs 33%
63%
Winners Others
Top in-store challenge in traditional trade % of companies that chose each challenge
SOURCE: 2015 LatAm GCCB Survey: Nielsen & McKinsey analysis
Co
pyr
igh
t ©
2016
Th
e N
iels
en C
om
pan
y. C
on
fid
enti
al a
nd
pro
pri
etar
y.
81
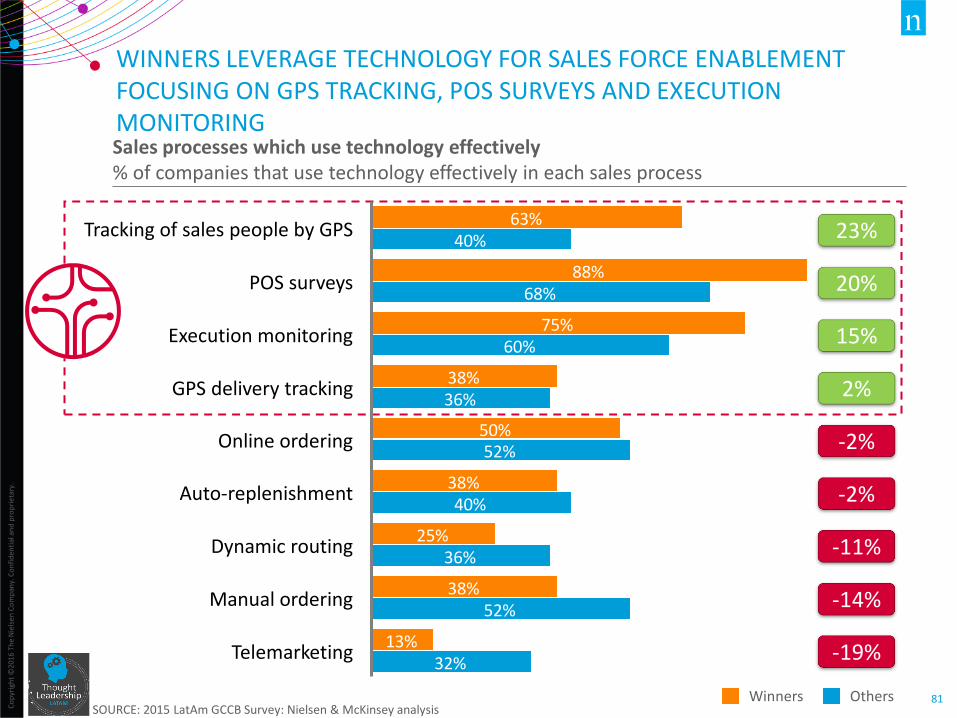
75%
38%
63%
52%
36%
32%
38%
88%
40% 38%
52%
40%
36% 25%
60%
13%
68%
50%
Dynamic routing
Auto-replenishment
Online ordering
Execution monitoring
GPS delivery tracking
Tracking of sales people by GPS
POS surveys
Manual ordering
Telemarketing
Winners Others
Sales processes which use technology effectively % of companies that use technology effectively in each sales process
23%
-19%
-11%
2%
15%
20%
-2%
-2%
-14%
WINNERS LEVERAGE TECHNOLOGY FOR SALES FORCE ENABLEMENT FOCUSING ON GPS TRACKING, POS SURVEYS AND EXECUTION MONITORING
SOURCE: 2015 LatAm GCCB Survey: Nielsen & McKinsey analysis
Co
pyr
igh
t ©
2016
Th
e N
iels
en C
om
pan
y. C
on
fid
enti
al a
nd
pro
pri
etar
y.
82
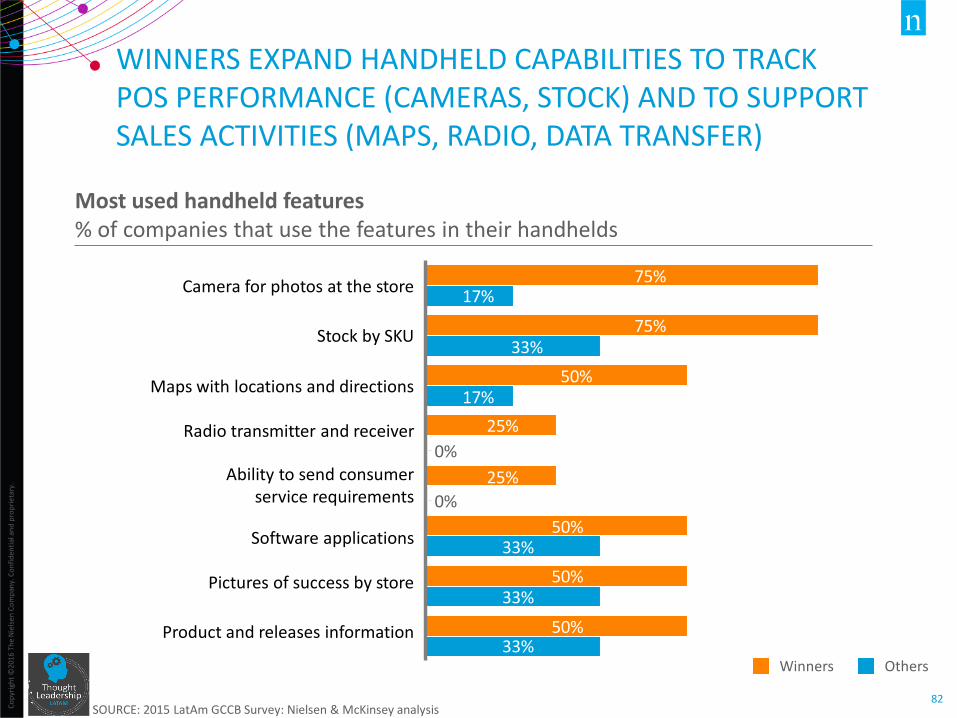
WINNERS EXPAND HANDHELD CAPABILITIES TO TRACK POS PERFORMANCE (CAMERAS, STOCK) AND TO SUPPORT SALES ACTIVITIES (MAPS, RADIO, DATA TRANSFER)
Product and releases information
Software applications
Camera for photos at the store
Maps with locations and directions
Stock by SKU
Ability to send consumer service requirements
Radio transmitter and receiver
Pictures of success by store
Most used handheld features % of companies that use the features in their handhelds
Winners Others 33%
50%
0%
17%
25%
17%
33%
75%
25%
50%
50%
33% 75%
0%
50% 33%
SOURCE: 2015 LatAm GCCB Survey: Nielsen & McKinsey analysis
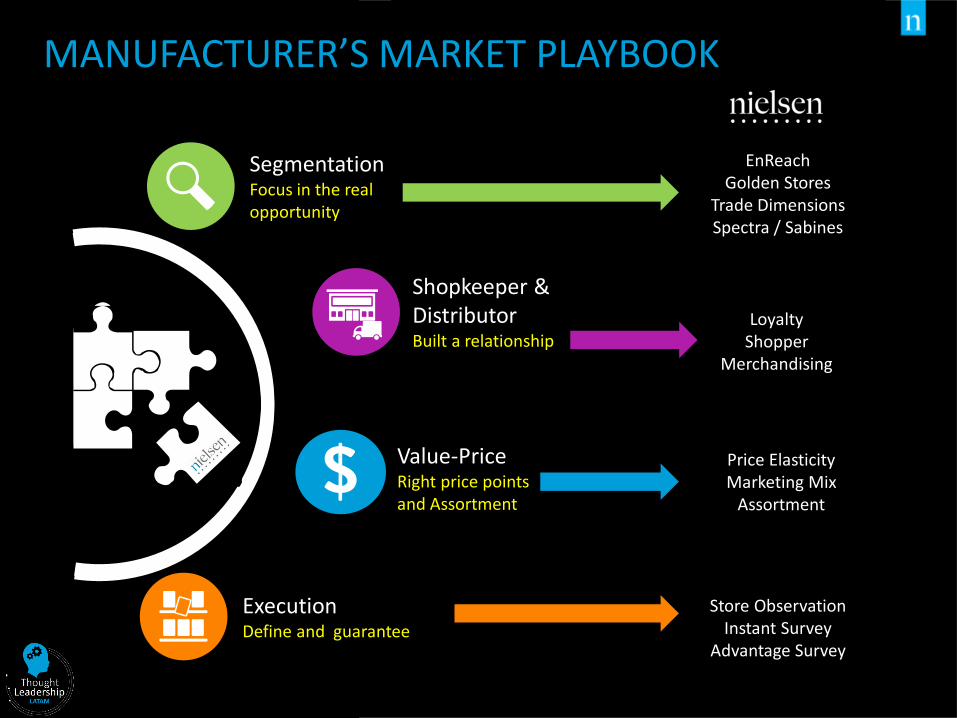
Segmentation Focus in the real opportunity
Shopkeeper & Distributor Built a relationship
Execution Define and guarantee
MANUFACTURER’S MARKET PLAYBOOK
Value-Price Right price points and Assortment
EnReach Golden Stores
Trade Dimensions Spectra / Sabines
Store Observation Instant Survey
Advantage Survey
Loyalty Shopper
Merchandising
Price Elasticity Marketing Mix
Assortment
