subsurface water movement in an upland coastal plain soil as influenced by plinthite1
TRANSCRIPT
Subsurface Water Movement in an Upland Coastal Plain Soil as Influenced by Plinthite1
L. J. BLUME, H. F. PERKINS, AND R. K. HuBBARD2
ABSTRACTWater movement in a Tifton loamy sand (Plinthic Paleudult) was
monitored using bromide as a tracer for 86 weeks under naturalrainfall conditions following treatment in late summer. Potassiumbromide (KBr) was placed at depths between 10 and 43 cm and 60and 102 cm in a soil having a 4.4% slope. Bromide content of waterfrom piezometers at distances up to 60 m downslope was determinedat 2- to 4-week intervals during periods of perched water starting22 weeks after the injection date. Determinations were then madefor a 65-week period. Soil samples taken at depths to 4.72 m 1 yrafter treatment were analyzed for bromide content. A perched orsecondary water table occurred during periods of high rainfall andlow evapotranspiration. Data indicate that subsurface flow down-slope occurred primarily above and within the plinthic horizon dur-ing periods when a perched water table was present. Data from soilsamples collected 1 yr after KBr treatment indicate that bromidemoved slowly through the plinthic layer, was intercepted by sub-surface layers of high density, and was retained in the watersheduntil removed by lateral flow.
Additional Index Words: Bromide, Tifton loamy sand, PlinthicPaleudult, perched water table, saturated conductivity, bulk density.
Blume, L.J., H.F. Perkins, and R.K. Hubbard. 1987- Subsurfacewater movement in an upland Coastal Plain soil as influenced byplinthite. Soil Sci. Soc. Am. J. 51:774-779.
SOILS OF THE GEORGIA COASTAL PLAIN are char-acterized by rapid surface infiltration and reduced
permeability in subsurface horizons (Fiskell and Per-kins, 1970; Asmussen and Ritchie, 1969; Asmussen,
' Contribution of the Univ. of Georgia, College of Agriculture,Agric. Exp. Stations, College Station, Athens, GA, and USDA-ARSSoutheast Watershed Research Laboratory, Tifton, GA. This re-search was supported by state and Hatch funds allocated to theUniv. of Georgia Agric. Exp. Stations and USDA-ARS SoutheastWatershed Research Laboratory. Rec. 13 Aug. 1986.2 Research Assistant and Professor of Agronomy, Univ. of Geor-gia, Athens, GA 30602, and Soil Scientist, USDA-ARS SoutheastWatershed Research Laboratory, Tifton, GA 31794.
1975). Plinthite, an Fe-rich, humus poor, material thathardens irreversibly upon repeated wetting and dryingoccurs in some Coastal Plain soils at depths of 1 to1.5m and is a suggested cause of the vertical reductionin hydraulic conductivity in some soils (Carlan et al.,1985; Daniels et al., 1978). Results of a 10-yr studyon an upland Coastal Plain watershed underlain byplinthite showed that horizontal shallow subsurfaceflow (SSF) was 79% of the sum of SSF and surfacerunoff, and that 99% of NO3-N loss was via SSF (Hub-bard and Sheridan, 1983).
Studies assessing water movement in plinthic soilsare few. Daniels et al. (1978) reported that soils having10% platy plinthite will perch water. Horizons withnodular plinthite do not perch water, but an associ-ated underlying reticulately mottled zone is a restric-tive horizon that does perch water. Carlan et al. (1985)used a bromide tracer to monitor saturated water flowon a Plinthic Paleudult for an 8-week period. Theyreported that water does not readily penetrate thesedense plinthic bodies but flows slowly in low chromamottles associated with the plinthite.
There were two objectives for this study, first todetermine the influence of plinthite on subsurfacewater movement using bromide to trace the flow ofnaturally occurring soil water, and second to deter-mine if bromide found primarily in low chroma mot-tles surrounding the plinthite was because of a highsoil bromide retention, or because of increased flow.
MATERIALS AND METHODSThe study was conducted on a Tifton gravelly loamy sand
(fine-loamy, siliceous, thermic family of Plinthic Paleudults)at the Coastal Plain Exp. Stn. in Tift County, Georgia. Se-lected morphological characteristics were determined by bothfield and laboratory examination (Table 1). Cores (7.6 cmdiam.) were collected near the midpoint from each soil ho-rizon at the site by carefully removing the overlying hori-zons and driving metal cylinders into the soil using an in-
BLUME ET AL.: SUBSURFACE WATER MOVEMENT IN AN UPLAND COASTAL PLAIN SOIL 775
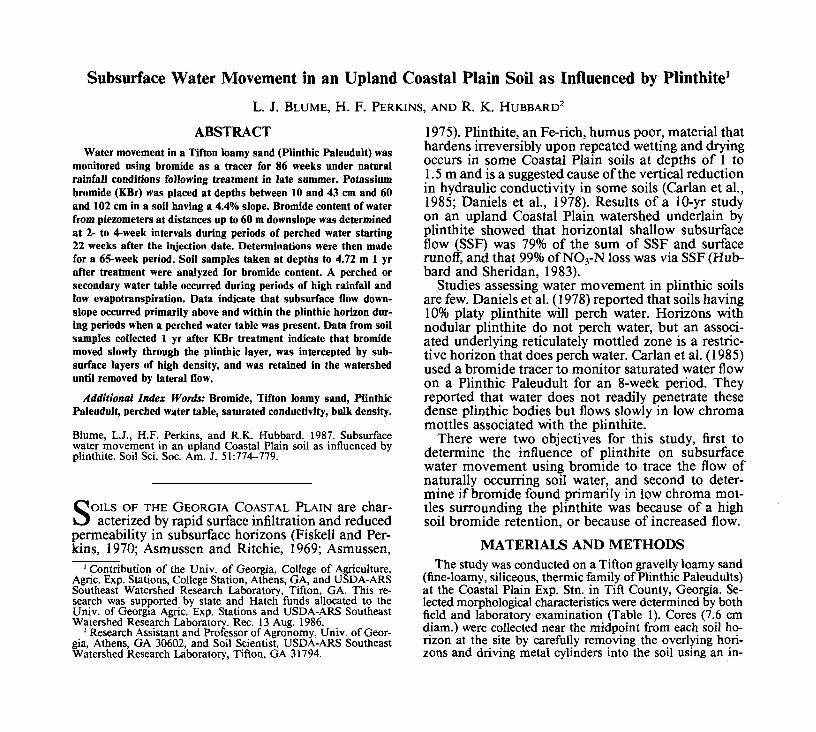
Table 1. Selected morphological and physical properties of Tifton loamy sand.
Horizon
ApeBtclBtc2BtvlBtv2BCC
Depth
0-2828-6060-120
120-138138-170170-200
200+
Range inthickness
20-3224-4050-72
6-2625-4515-40
-
Plinthite
00
<515
25-3000
Coarsefragments
27302019550
Sand
83655866626165
Silt
107999
178
Clay
7283325292227
BulkdensityMg m-J
1.691.631.611.671.821.841.79
Saturatedconductivity
23.0516.787.253.390.280.810.37
ertial hammer. Saturated conductivity (Ks) was determinedon undisturbed cores by the constant head method (Klute,1965). Bulk density (ph) measurements were obtained by thecore method (Blake, 1965). Ks and pb cores were replicatedeight times. Particle size distribution was determined by thehydrometer method (Day, 1965).
The gravelly surface horizon contained >20% ironstoneconcretions. Of a total of 15% plinthite found between 120to 138 cm, approximately 70% was platy and 30% was no-dular. Approximately equal mixtures of platy and nodularplinthite were present at the 138- to 170-cm depth. The soilis underlain by Coastal Plain marine sediments of the Haw-thorn Formation that contain irregularly bedded sands, clays,and gravel which are indurated in places.
Potassium bromide (KBr) used as a tracer of water move-ment was placed as a line source of point injections 2.5 mapart in unfertilized Bahiagrass (Paspalum notatum Flugge)along the crest of a 4.4% slope on 29 Aug. 1982 (Experimentday 1). Two separate injection lines were used, each lineconsisting of 10 injection points. A 20-m KBr-free intervalwas maintained between the two injection lines to preventcross contamination. At each injection point an intact sur-face plug of sod was first removed by spade, and then a 7.6-cm diam core of soil was removed to the prescribed depthusing a Central Mine Equipment drill rig. One kilogram ofcrystalline KBr mixed with equal amounts of silica sand wasplaced at each injection point between the 10- and 43-cmdepth for Site no. 1 and between 60 and 102 cm for Site no.2. After the KBr-sand mix was placed in the hole, the surfacesoil and sod were replaced.
Perpendicular to the injection line at distances of 2.5, 5.0,and 10.0 m downslope, sets of one suction lysimeter andtwo piezometers were installed with four replicates down-slope from each of four center injection points for each studysite. Lysimeters consisted of a 5-cm diam PVC pipe with aporous one-way suction cup sealed to the base and a 2-holedsealed stopper at the top. The lysimeters sampled soil so-lutions held at a maximum tension of 0.1 MPa at a depthof 0.96 m. Piezometers made from the 5-cm diam PVC pipewere open at the base and had 4 cm of gravel inside toseparate the soil from the well interior. Piezometers wereplaced to sample ground water at the top of the plinthichorizon (1.23 m from soil surface) and within the BC ho-rizon (1.80 m from the soil surface). Lysimeter and piezo-meter holes were made with a Giddings drill rig mountedon a farm tractor. Each PVC pipe was sealed in place witha 1:1 mixture of kaolin clay and sand to prevent abnormalsurface infiltration. Additional piezometers (four replicatesper downslope distance) were placed 15, 30, and 60 m down-slope from the KBr injection line at soil depths of 1.23 and1.80 m as movement of Br~ progressed downslope.
Soil solutions were sampled and water table depths re-corded at 2- to 4-week intervals from December to May1982 to 1983 and on three dates in the winter of 1984. Oneyear after the tracer was injected soil core samples were col-
3 Mention of a trademark or proprietary product does not con-stitute a guarantee or warranty of the product by the Univ. of Geor-gia or by the USDA and does not imply its approval to the exclusionof other products that may also be suitable.
lected by horizon randomly across the slope to a depth of4.72 m with a Case drill rig.
AnalysesSoil water samples were analyzed using a Br~ specific ion
electrode with a single junction silver/sulfide reference elec-trode (Orion Research, Inc., 1971). A 5 M NaNO3 solutionwas added to each standard and sample at a 2% (v/v) rateas an ionic strength adjuster to maintain a constant ionicbackground as used by Germann et al. (1984). Bromide wasnot detected in soil or soil solution prior to treatment (datanot reported) therefore no correction for Br~ contaminationwas necessary.
Bromide was extracted from soil samples with a 0.1 MCa(NO3)2 solution at a 1:2 soil solution (w/w) ratio. The soiland solution were shaken, allowed to equilibrate for 24 h inthe extracting solution and filtered. Solutions were analyzedby the electrode method cited above.
Retention StudyThree dominant mottles per horizon of the Btv and C
horizons were separated by hand using a dental pick to de-termine possible differences in bromide retention. They in-cluded: (i) the light yellowish brown (2.5Y 6/4), yellowishbrown (10YR 5/8) mottles and red (5YR 4/8) plinthic bodiesof the Btv horizons, and (ii) the white (2.5Y 8/2), yellowishbrown (10YR 5/8) and red (10R 4/8) mottles of the C ho-rizon. Samples were ground to pass a 2-mm sieve and 3 gwere added to 30 mL of solution that contained 0,0.25,0.50,0.75, or 1.0 mmolc L~' of bromide as KBr. The sample-solution mixtures were shaken for 30 s on an Adams3 cyclomixer and placed in a convection oven at 50°C and evap-orated to dryness. To each air-dry sample 30 mL of 0.1 MCa(NO3)2 were added, shaken for 1 h and allowed to equi-librate for 24 h. Samples were centrifuged for 10 min at43 000 X g and the supernatant was filtered through What-man no. 40 paper. Solutions were analyzed for Br~ by aspecific ion electrode as previously cited.
A problem of unstable readings in equilibration solutionswas corrected by grounding the meter and surrounding theelectrodes and solution with a grounded copper screen. Todetermine if interference from S2~ and CN~ affected mea-surement of BI-, 3 mL of 0.05 M NiCl2-6H2O were addedto complex S2~ and CN~ to each 30-mL sample of the Btvhorizons whose Br~ concentration had been determined 24h earlier. Samples were reanalyzed for Br~ as before. Equalamounts of NiCl2 • 6H2O were placed in the standard solu-tions. Recovery of the added Br~ was calculated by sub-tracting the respective control Br~ concentration from thatmeasured. To normalize the recovery values, a transfor-mation of (100 — % recovery)'72 was used (Steel and Torrie,1960). T-test values at a 0.05 level of error indicated nosignificant differences in measured Bry after Ni2+ was added.
To test for statistically significant differences between bro-mide concentrations by depth of injection, sampling depth,and distance downslope, an analysis of variance was com-pleted using the SAS general linear model (SAS Institute,Inc., 1982).
776 SOIL SCI. SOC. AM. J., VOL. 51, 1987
RESULTS AND DISCUSSION
Mean annual rainfall recorded at Tifton, GA from1925 to 1977 was 1190 mm. Maximum precipitationoccurs in July and August and minimum in Octoberand November. A seasonally dependent perchedgroundwater table typically exists from late winter toearly spring (Batten, 1979). A perched water table atdepths between 75 and 180 cm occurred within thestudy site from December 1982 to May 1983 and De-cember 1983 to May 1984.
Saturated hydraulic conductivities and bulk densi-ties at the site were determined for comparison withplinthite content and to aid in understanding lateralwater movement. The lowest undisturbed Ks valueswere found in the Btv2 and C horizons. The Btv2horizon contained the maximum amount of plinthite,25 to 30% (Table 1). The BC horizon also had a verylow Ks value. The Btvl horizon which had 15% plin-thite had a Ks value > 10-fold greater than that of theBtv2. Comparison of particle size distribution with Ksshowed positive correlation of percent sand with Ks (r= 0.94, p < 0.01) and a negative correlation of per-cent clay with Ks (r = 0.83, p < 0.03). Bulk densityin the Btvl and overlying horizons was <1.70 Mgm~3. Higher ph values, 1.79 to 1.84 Mg m~3, were notedin the Btv2, BC, and C horizons. Bulk densities mea-sured in this study were comparable to those observedat six sites in the Tifton upland physiographic area byHubbard et al. (1985). The patterns of Ks and pb valuesin the four horizons studied, and the 4.4% slope at thestudy site suggested that infiltrating rainfall could flowmore readily in a downslope direction above theplinthic horizons than through those horizons, as hy-pothesized.
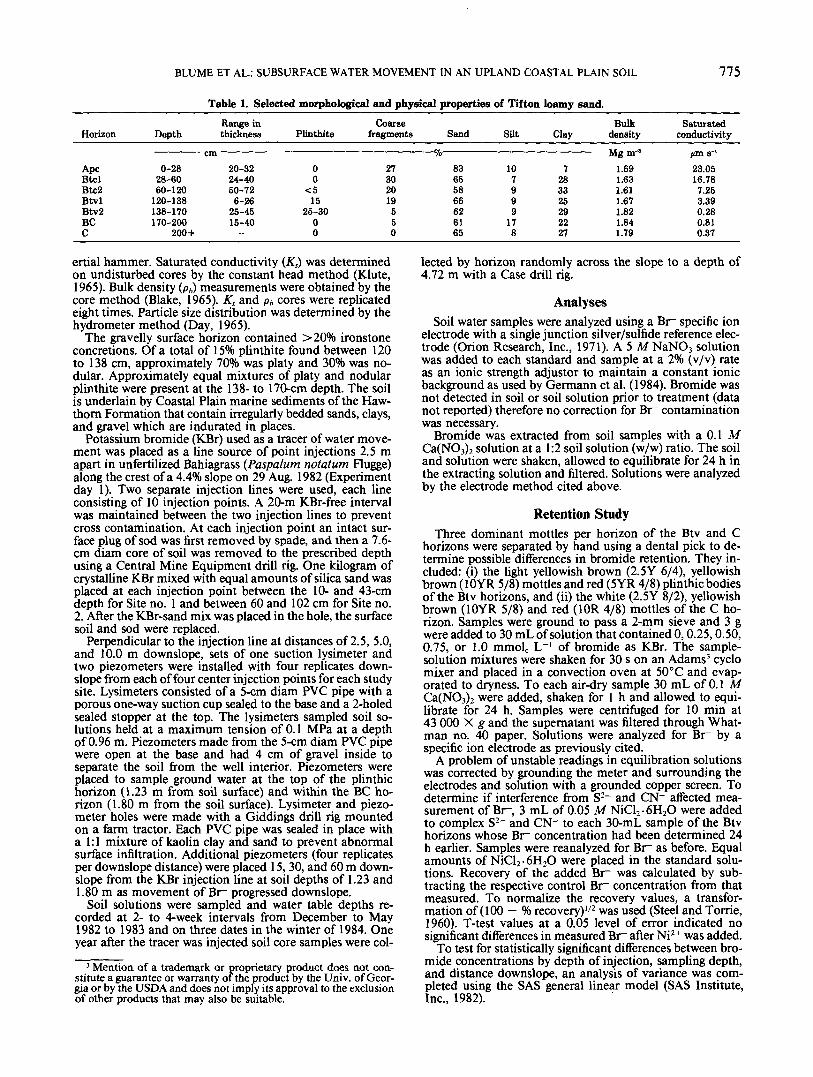
Soil water Br~ concentrations were first measuredon 8 Jan. 1983 (Experiment day 133). Concentrationsfound at both 2.5 and 5 m downslope from the injec-tion line indicate lateral downslope movement of Br~(Table 2). The highest concentration (190 fimol Lr')found at 5 m occurred at the 1.23 m sampling depthwhere Br~ had been injected from 60 to 102 cm. Soilwater Br~ concentrations measured on 25 Feb. 1983,180 d after KBr treatment, showed a significantlygreater (p < 0.01) Br~ concentration above the plin-thite at 1.23 m, than below at 1.80 m (Table 2). At 5and 10 m downslope Br~ levels at the 1.23-m depthwere more than twice the level at 1.80 m. Similar re-sults were obtained throughout the 1983 sampling pe-riod. Carlan et al. (1985) also reported maximum Br~concentrations in the upper part of the plinthic hori-zons. Potassium bromide placed at a depth between10 to 43 cm, resulted in less Br~ at the 1.80-m depthduring the first two dates as compared to KBr placedat a depth between 60 to 102 cm (Table 2). This trendwas reversed the remainder of the sampling periods.A greater concentration at 1.23 m would be expectedin the deepest injection site since lateral flow initiallywould tend to keep the Br~ at the same depth it wasplaced.
Subsurface water movement, and hence movementof Br~ and other tracers relate largely to properties ofporous media. Hillel (1980) reported that water mayseep into or out of the saturated zone by lateral flowthrough the sides of porous channels. This may par-tially explain observed differences in Br~ concentra-tion between different sampling sites, since many largemacropores that appeared to be root channels and/orworm holes were observed in the sides of the exca-vated pits and during installation of the sampling wells.
Table 2. Bromide concentration in soil water following shallow and deep placement of KBr.
Date of sampling (experiment day)t
DepthKBr
cm10-43
60-102
Sampling Distancedepth downslope
1.23 2.5510153060
1.80 2.5510153060
1.23 2.5510153060
1.80 2.5510153060
1-8-83(133)
374J212
ns§nsns21255nsnsns411901nsnsns126551
nsnsns
1-30-83(155)
2186921nsnsns61304nsnsns84836nsnsns914516nsnsns
2-13-83(169)
166840nsnsns88156nsnsns98768nsnsns263618nsnsns
2-25-83(181)
1459844nsnsns933510nsnsns985119nsnsns492918nsnsns
3-12-83(196)
5363362631ns711093525ns413816114ns331513105ns
3-26-83(210)
~ /imol L *•2644332926ns775112424ns363519103ns391313118ns
4-9-83(224)
11302514194
50181116<14031168
• 11361391410<1
4-24-83(239)
13311939191151210401011533120831
4016893
101
12-14-83(473)
111513169423515198535241810332010101031
2-11-84(532)
1015113119102991418139311614841
191014757
3-17-84(566)
7871013718481095271614751
21109553
t Experiment day counting 8-29-82 (Injection day) as day 1.| Each value is the mean of samples from four replicate piezometers per depth of KBr treatment, sampling depth, and distance down slope.§ Not sampled.

BLUME ET AL.: SUBSURFACE WATER MOVEMENT IN AN UPLAND COASTAL PLAIN SOIL 777
Germann et al. (1984) analyzed concentric circlesaround observed macropores with a Br~ tracer, andsuggested that macropores are the dominant and pos-sibly the only pathways of solute movement. Theyalso pointed out that a Br~ tracer will penetrate deeperin soils of greater macroporosity. Aubertin (1971) re-ported that open channels can have an overshadowingeffect on soil matrix conductivity and that free watercan rapidly move substantial distances in relativelydry soil. These macropores do not necessarily have tobe exposed at the surface (Quisenberry and Phillips,1976).
Macropore flow is tension-free flow in macroporesthat are embedded in a water-sorbing soil matrix. Forsuch flow to occur, water saturation is required at somepoint in the soil. This can be at the soil surface, wheninfiltrability into the matrix is exceeded, or near a sub-surface layer of low Ks which causes a perched watertable. When infiltrating water reaches a zone of lowKS, eventually a 0 or greater potential will result andwater will flow through channels due to the gravita-tional potential (Thomas and Phillips, 1979). Averageinfiltrability through the soil surface of the Tifton soilhas been reported as 15.25 ^m s~'. This is 55 timesgreater than the Ks of the Btv2 horizon, indicating thatthis horizon, and the underlying BC and C horizonswhich also have low Ks, act to cause a perched watertable. Another aspect to consider relating to subsur-face macroporosity at this site is that many of theCoastal Plain soils were cleared of forest and culti-vated for the first time during the past 100 yr. There-fore, root channels from the original forest may stillbe present.
Flow net calculations (Harr, 1962; Shirmoham-madi, 1986, personal communication) were made forJanuary through May 1983 to better understand lat-eral flow rates and hence Br~ movement at this site.Measurements of depth to water table in the piezo-meter network started 8 Jan. 1983 (Experiment day133). A perched water table above the plinthite is as-sumed to have first occurred in late December 1982following 147-mm total monthly precipitation, whichoccurred primarily during the second half of themonth. The flow net procedure is a graphical one in-volving plotting equipotential lines and stream lines.Once the flow net has been drawn with streamlinesand equipotential lines intersecting at 90° angles toform an orthogonal network in the flow regime, dis-charge is calculated from
q = K-D • (NJNJ-AHwhere q — discharge (volume/time), K = saturatedhydraulic conductivity, D — thickness of saturatedprofile, Nf = number of streamlines, Ne = number of
Table 3. Calculated drainage rates in Tifton soil by date.
DateExperiment Depth to top Thickness of Drainage
day of water table soil slab rate
1-08-831-30-832-25-833-27-834-24-835-07-83
133155181211239252
140129107118129150
405173625130
mm s"1
2.273.385.604.493.381.27
equipotentials, and A// = hydraulic head. For thesecalculations the plinthite was assumed to have suchlow permeability that it functioned as an impermeablelayer. The flow net method of calculating shallow sub-surface flow does not consider macropore flow. Hencedifferences between predicted water flow and flow nec-essary to account for observed Br~ movement in thisstudy would provide further evidence for the semi-permeability of plinthite via macropore flow.
The flow net calculations were made from a 75-m2
area for a soil slab from the top of the water table tothe 180-cm piezometer depth. Total drainage was cal-culated for a high water table condition and a lowwater table condition. A simple regression equationrelating these volumes to water table height in onepiezometer was then used to predict drainage on theother dates. Drainage rates through the cross sectionalface area according to these calculations varied from1.27 mm s~' on 7 May (Experiment day 252) to 5.6mm s"1 on 25 February (Experiment day 181). Thecalculated drainage rate for the first observation date8 January was 2.27 mm s-l (Table 3). Assuming aporosity of 0.35 for these subsoils, at the 2.27 mm s"1
rate one pore volume would drain from the soil slabin 534 d. At the 5.6 mm s~' drainage volume, onepore volume would drain in 397 d. According to thesecalculations and assuming complete plug flow, a con-servative tracer such as Br~ placed uniformly from thetop of the water table to a depth of 180 cm wouldhave migrated 7.5 m downslope at a rate of 0.01 md~' under the flow conditions of 8 January and at arate of 0.02 m d~' under the much higher water tableconditions of 25 Feb. 1983.
Bromide was detected 5.0 m from the injection lineof 8 Jan. 1983 particularly with the 60- to 102-cminjection depth. At the calculated high drainage rateBr~ would have taken 250 d to reach 5.0 m downslope.If Br~ were assumed to have traveled primarily throughthe Btvl, which had a conductivity 3 times that usedfor the flow net calculations, travel time to 5.0 mdownslope would have been 83 days. Total days fromthe injection date of 29 Aug. 1982 through 8 Jan. 1983are 133 and a perched water table did not occur untillate December. Since Br~ was placed above the zonefor which flow net calculations were made and thesimple flow net calculations predict much slowerdownslope migration of Br~ than was observed, itwould appear that most of the downslope migrationof Br~ was due to Br~ carried at the interface of thesaturated and unsaturated zones through material withgreater saturated hydraulic conductivity, and tomovement through macropores.
Soil samples collected and analyzed approximately1 yr after KBr injection indicate relatively high Br~concentrations at or above the 0.9 m depth near thepoint of placement of KBr (Fig. 1). Bromide contentat 2.3 m was relatively constant downslope with val-ues from the shallow placement tending to remainabove those from deep placement of KBr. A similarpattern of Br~ contents was found at 4.72 m. Thesedata are not presented for brevity sake.
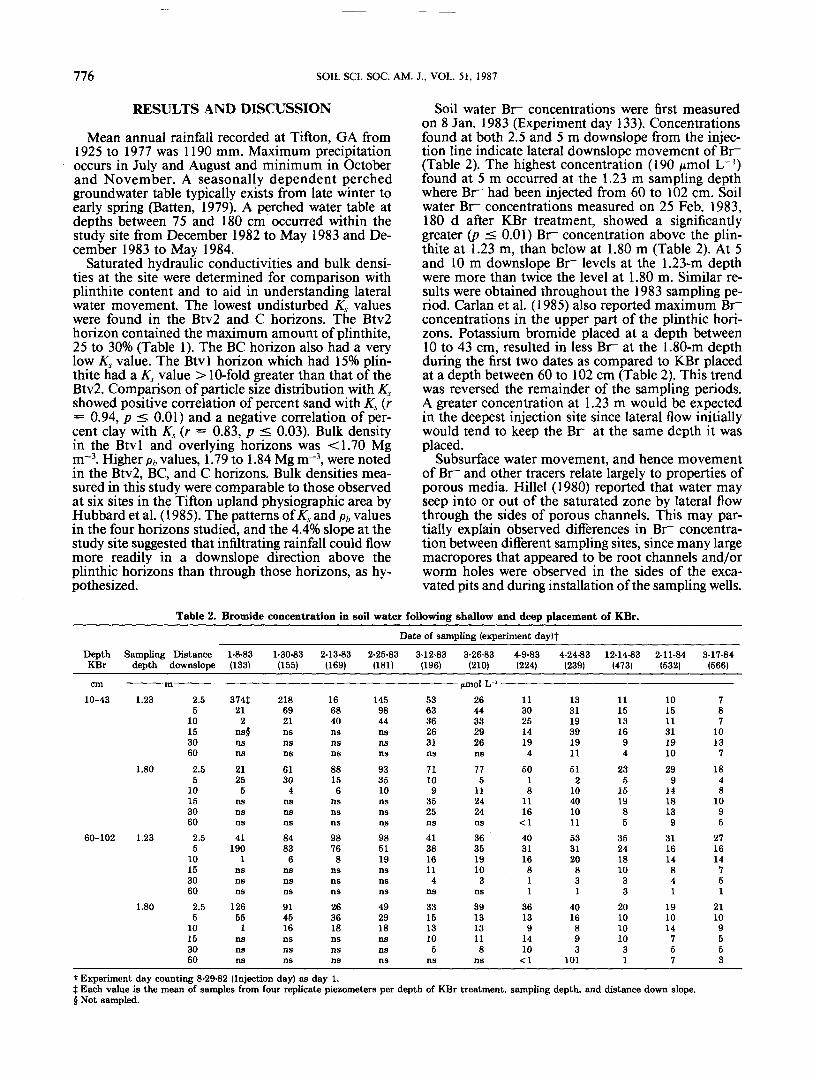
Mean soil bromide concentrations in soil sampledon 16 Aug. 1983, 352 d after KBr treatment are shownby horizon for both the deep and shallow study in Fig.2. Bromide levels of the Btc2 and Btv horizons are

778 SOIL SCI. SOC. AM. J., VOL. 51, 1987
20 X 40Distance Downs I ope
Fig. 1. Soil bromide concentration sampled on 16 Aug. 1983, 352 dafter KBr treatment.
significantly greater (p < 0.01) than all other horizons.These data indicate that during the first year most ofthe water remained above or within the plinthic ho-rizons. Again one may observe the effect of shallowinjection where preferential flow downslope was ex-pected, and there were relatively large Br~ concentra-tions in the deepest horizons. Based on the data fromall samplings, Br~ concentrations found above theplinthite layer at 1.23 m were 1.43 times greater thanthose found below the plinthite at 1.80 m. It is ofsignificance that in each instance a substantial amountof Br~ was found below the plinthite. From this weconclude as Daniels et al. (1978) did that the plinthiteis only semipermeable and that the reticulately mot-tled BC and C horizons also retard vertical flow. TheBr~ content of the Btv horizon (Fig. 2) may be ex-plained partially by the relatively high pb of the BCand C horizons.
Carlan et al. (1985) suggested that water flowsthrough the plinthite horizons in low chroma path-ways. This assumption was based on greater amountsof Br~ in the white and brown mottled soil than inplinthic bodies. To verify this hypothesis the retentionability of the three mottles were assessed. If the whitemottles had a greater ability to retain Br~ due to chem-ical and/or mineralogical properties, then the assump-tion of greater flow through these mottles could beerroneous.
No significant differences in retention ability werefound among mottles in the Btv2 or mottles of C ho-rizon. The average percent recovery for all concentra-tion levels of the Btv2 horizon was 96.6%. The averagetotal Br~ recovery from the C horizon was 94.0%. Netsurface charge probably accounts for recovery valuesof < 100,%. These data agree with those of Abdalla andLear (1975) who found an average recovery of soilapplied Br~ at 96.8%, using distilled water as the ex-tracting solution.
CONCLUSIONSThe study showed that when the conservative tracer
Br~ was placed in a plinthic soil, greater concentra-tions were found above the plinthite than beneath it,and that Br~ was carried downslope by lateral water
•8
m
I.U
0.9
0.8
0.7
o.e0.5
0.4
0.3
O.E
0.1h n
£
-
_ . Br- Injection
%V5
1
V'/y
\
D 1O-43 cm0 60- 1 02
fl -
I
cm
IRpc Btcl Btc2 Btv
HorizonSX - Scprol Ita at 4.72 m
Fig. 2. Soil bromide concentration by horizon for shallow (10-43cm) and deep (60-102 cm) injections on 16 Aug. 1983, 352 d afterKBr treatment.
movement both above and within the plinthite. Soilsamples collected 1 yr after Br~ injection indicatedthat during this time most of the water drainingthrough these soils remained above or within theplinthic horizons. Comparison of flow net calculationsof water draining laterally above and within the plin-thite indicate that Br~ was carried downslope primar-ily at the interface of the saturated and unsaturatedzones and/or by macropore flow. The detection of asubstantial amount of Br~ beneath the plinthite agreedwith the conclusion of Daniels et al. (1978) that plin-thite is only semipermeable.

ANGERS ET AL.: COMPACTION CHARACTERISTICS OF A SOIL CROPPED TO CORN AND BROMEGRASS 779
Plain. USDA-Agricultural Research Service. ARS-37. applied water in the field. Soil Sci. Soc. Am. J. 40:484-489.Klute, A. 1965. Laboratory measurements of hydraulic conductivity SAS Institute, Inc. 1982. SAS user's guide: Statistics, 1982 ed. SAS
of saturated soil. In C.A. Black et al. (ed.) Methods of soil anal- Institute Inc., Cary, NC.ysis, Part 1. Agronomy 9:210-221. Steel, R.G.D., and J.H. Torrie. 1960. Principles and procedures of
Orion Research, Inc. 1971. Specific ion electrode technique. News- statistics. McGraw-Hill, New York.letter 111 (1, 2)2-4. . Thomas, G.W., and R.E. Phillips. 1979. Consequences of water
Quisenberry, V.L., and R.E. Phillips. 1976. Percolation of surface- movement in macropores. J. Environ. Qual. 8:149-152.