subsidy to promote girls secondary education · munich personal repec archive subsidy to promote...
TRANSCRIPT
Munich Personal RePEc Archive
Subsidy to Promote Girls’ Secondary
Education: The Female Stipend Program
in Bangladesh
Khandker, Shahidur and Pitt, Mark and Fuwa, Nobuhiko
World Bank, Brown University, International Rice Research
Institute, Chiba University
March 2003
Online at https://mpra.ub.uni-muenchen.de/23688/
MPRA Paper No. 23688, posted 08 Jul 2010 19:33 UTC
Subsidy to Promote Girls’ Secondary Education:
The Female Stipend Program in Bangladesh
By
Shahidur R. Khandker World Bank
Mark M. Pitt
Brown University
and
Nobuhiko Fuwa International Rice Research Institute and
Chiba University
March, 2003
Abstract
Secondary school enrollment rates in the developing countries are usually lower for girls than boys, especially in rural areas. In the mid 1990’s a female school stipend program was introduced to subsidize girls’ secondary education in rural Bangladesh. Although all of rural Bangladesh was eventually covered by this program, it was not introduced at the same time in all areas and to all class cohorts. This variation in timing is the source of parameter identification in the analysis. Using two different datasets and school/village-level fixed effects, we estimate the effects of this stipend program on school enrollments. The analysis based upon two cross-sectional household surveys covering a common set of villages finds that the female stipend program increased girls’ secondary education substantially, but had no discernable effect on the schooling of boys. The analysis performed with an annual panel of school-level data also finds a significant effect of the stipend program on girl’s enrollment and reduced the enrollment of boys in coeducational secondary schools.
The paper benefited from comments and suggestions of participants of seminars at the World Bank in Washington and at the National Academy for Educational Management (NAEM) in Dhaka. In particular, we would like to thank Harold Alderman, Gershon Feder, Barbara Herz, Elizabeth King, Emmanuel Jimenez, Lutfur Rahman, and Martin Ravallion for useful comments. Views expressed in this paper are entirely those of the authors and do not reflect any way those of the World Bank or its affiliated organizations, or the organizations where the other authors belong.
1
1. Introduction
Gender disparity in adult literacy, school enrollment and attainment is severe in Africa,
the Middle East, and South Asia. Although this disparity in schooling exists for all ages,
it is more pronounced at the secondary school than at the primary level (Herz and others
1991). The situation in Bangladesh is not atypical. The country's literacy rate was only
22 percent for females in 1989, compared to 47 percent for males (World Bank 1992a).1
In 1991 only 5 percent of rural girls completed the 10th grade compared to 12 percent of
boys (Khandker and Samad 1995).
Gender disparities in schooling persist in many societies despite the fact that
economic returns to education may be higher for women than for men in many low
income countries (King and Hill 1993; Schultz 1987). In addition, higher women’s
education has been shown to be strongly related to reduced fertility and greater human
capital investment in children, and these effects are more pronounced for secondary than
for primary education of women. Girls’ schooling may suffer from the higher costs of
educating girls than boys in many developing countries (Herz and others 1991; Mannan
1988). Cultural practices dictate that parents may pay more for clothing and
transportation for girls than for boys. There is evidence that gender disparity is an inferior
good, becoming less pronounced as income rises (Herz and others 1991; King and Hill
1993; Schultz 1987).2 Nonetheless it would take many years for income growth to
greatly reduce gender disparity in most of the developing world. An important question
is whether there are government interventions that might more quickly reduce this gender
disparity.
Governments in some developing countries have intervened in various ways to
promote the schooling of girls.3 One such intervention that has been implemented is a
subsidy for girl’s school attendance. In Pakistan, a female fellowship program at the
1 Things have improved somewhat since then. In 1998, the adult literacy rate was 29 percent among females and 51 percent among males (World Bank 2000) 2 While economic growth reduces gender disparity, Dollar and Gatti (1999) find that female education, especially at the secondary level, promotes economic growth. 3 A detailed discussion of these measures appears in Herz and others (1991).
2
primary school level was found to increase the school enrollment of both girls and boys
(Kim, Alderman, and Orazem 1999). In Colombia, school voucher programs targeted to
girls are found to increase enrollment rates of both girls and boys (King, Orazem, and
Wohlgemuth 1999). The World Bank has argued that programs targeted at girls can
increase both girls' and boys’ schooling (World Bank 2000). There is, however, no clear
evidence as yet on the effect of school subsidies for girls on the schooling of boys.4
In early nineties, the Government of Bangladesh (GOB) sought to increase rural
female enrollment at the secondary school level by launching a female secondary stipend
program. Four separate projects, covering different thanas (districts), were begun with
donor support: Female Secondary School Assistance Project (FSSAP) funded by IDA
(118 thanas), Female Secondary Stipend Project (FSSP) funded by GOB (282 thanas),
Secondary Education Development Project (SEDP) funded by the Asian Development
Bank (ADB) (53 thanas), and Female Secondary Education Project (FSEP) funded by
NORAD (7 thanas). These projects introduced a similar nationwide stipend program
targeted to girls in grades 6 through 10 in 460 rural thanas (districts) starting in 19945.
The stated objectives of this program are to: (i) increase school enrollment
among secondary-aged girls; (ii) improve the secondary schooling completion rate for
girls; and (iii) increase female age at marriage. The program introduced a uniform
stipend and tuition subsidy program for each girl attending a secondary school in rural
areas who satisfy the following eligibility criteria: (i) attend 75 percent of school days;
(ii) attain some level of measured academic proficiency (45 percent of class-level test
scores); and (iii) remain unmarried. Once a school participates in the program, all female
students satisfying these criteria receive a specified amount of stipend and other
allowances as prescribed for each grade. The girl’s school is directly paid all of her
tuition by the project. The amounts of stipend and other allowances paid to eligible
female students are specified in Table 1. The stipend was expected to cover as much as
4 The Food for Education (FFE) program subsidizes the primary school education of both boys and girls in Bangladesh and has been found to increase the schooling of both (Ravallion and Wodon 2000). 5 In fact, the origin of the stipend program dates back to 1982 when a local NGO started a pilot project in a single thana.
3
50 percent of the costs of textbooks, uniforms, stationary, transportation, exam fees, and
miscellaneous direct educational expenses. The stipend is paid directly to an account in
the girl’s name in the nearest Agrani Bank, a state agricultural bank with branches all
over rural Bangladesh.
In addition, these stipend programs also have been complemented with other
components such as curriculum reforms and instructional materials development, teacher
training, recruitment of female teachers, improvement of school infrastructure, awareness
programs at the community level, and institutional capacity building. These additional
project components, however, differ across thanas depending on the agency funding the
stipend program (i. e., Asian Development Bank, World Bank, NORAD and GOB).
The combined stipend and tuition subsidy for each girl is Tk. 906 for non-
government schools and Tk. 847 for government schools. The stipend itself accounts for
two-thirds of the total outlay used to support the program. The female subsidy is about 6
percent of Bangladesh’s per capita income. Supporting over 2 million girls each year
under this program has evolved into a major expenditure obligation for the government.
The stipend budget alone accounts for more than 60 percent of the country's secondary
school development budget and 13 percent of the education sector budget (World Bank
1997).
Various reports, including the World Bank’s mid-term review, suggest the
success of this program in reducing gender disparity in secondary education. There has
been a marked increase in the secondary school enrollment among girls in recent years.
Aggregate statistics suggest that girls’ school enrollment has increased at a rate of 13
percent per year since 1994, while the rate of increase of boys has only been 2.5 percent
per year.6 Household surveys over a period of seven years (between 1991 and 1998) also
indicate remarkable gains for girls.7 To date, there has been no systematic study
measuring how much of this increase in girls' secondary school enrollments is due to the
6 In addition, there has been a marked decline in the proportion of girls marrying at early age. 7 The average performance of girls exceeded that of boys in the national post-secondary school level examination (Secondary School Certificate) of 1998.
4
stipend program. The Government of Bangladesh and donors are favorably disposed to
extend the program, and there is mounting public pressure to extend the program to cover
both boys and schools in urban areas. As resources are limited, targeting by other
attributes besides gender may be worth considering, but without an impact assessment, it
is difficult to ascertain whether the stipend program is worth continuing or how it might
best be targeted.8
This paper estimates the impact of the female secondary stipend program on
girls and boys using both school and household survey data. A key feature of the
program that we rely on to identify its effects on school enrollment is the varying times at
which it was instituted across the thanas (districts) of Bangladesh. Recognizing that the
timing of the program’s placement across Bangladesh may be endogenous, perhaps based
on the outcome of the perceived educational needs or demand’s of communities, we
make use of community fixed-effects methods to sweep out unobserved community-level
heterogeneity. Our results suggest that, after controlling for time trend, and school and
village-level observed and unobserved characteristics, the female stipend program has
increased girls’ secondary education substantially, and had no significant effects on boys’
schooling. Parameter identification rests on the limited variation in program duration
across the villages in our household sample. Our results are strengthened our
confirmatory results from an analysis based on a very different school-level data set.
Although these data have there own limitations, taken together our results strongly
suggest that the stipend program increased girl’s secondary school enrollment and
provides mixed evidence of their effects on that of boys.
The paper is organized as follows. Section two describes the program's
achievements in terms of aggregate secondary school statistics and MIS data from the
World Bank funded FSSAP project. Section three describes the household data used for
the analysis. Section four discusses the econometric model to be used to estimate the
program effect with household-level data collected jointly by the Bangladesh Institute of
8 The World Bank has already approved an IDA loan of $120 million to continue the FSSAP project in March 2002.
5
Development Studies (BIDS) and the World Bank. Section five discusses the estimated
program effects based on household survey data. Section six presents the impact
estimates based on the MIS data from the FSSAP project. Section seven discusses the
issues of targeting. And finally, the concluding section summarizes the results with
policy implications.
2. Bangladesh's achievements in female secondary education
Two data sources are used to examine Bangladesh's recent achievements in female
secondary education after the introduction of the female stipend program. The first is the
Management Information System (MIS) of the World Bank funded Female Secondary
School Assistance Project (FSSAP), which provides enrollment data for FSSAP schools
by grade and sex since the stipend program was introduced in 1994. The second source
is the published government statistics on nationwide school enrollment collected by the
Ministry of Education.
All the secondary schools participating in any of the female secondary stipend
programs are required to regularly provide the project offices with school and recipient
information using a uniform MIS format. This required information includes student
enrollment by gender and by class, information on school facilities (e.g., class room size,
availability of tube wells, latrines, etc.), attendance and examination record of the stipend
recipients, and other school information needed for administering the stipend program.
The FSSAP-MIS information on enrollment and other school characteristics is relatively
well organized. While all the other stipend program offices maintain essentially the same
set of information under the same MIS format, the MIS data from other project offices
were either not available, in some case because it had not yet been computerized, or was
not well enough organized to be accessible.9 Consequently, our analysis makes use only
of the FSSAP data available from 118 thanas (out of 460) in rural Bangladesh.
Furthermore, since male-only schools are not eligible for the program, the FSSAP-MIS
data include only female-only schools and coeducational schools. These data thus reveal
9 We requested that the project directors of the FSSP and SEDP programs provide similar MIS data. Despite repeated requests, we failed to obtain such data. We would like to thank Dr. Lutfur Rahman, the project director and his colleagues at FSSAP for releasing the MIS data for this study to us.
6
the pattern of enrollments over time in schools in which girl’s receiving FSSAP tuition
and stipend support can enroll, and not the overall pattern of enrollments. These FSSAP
school enrollment increase are probably only slightly inflated in the initial years by the
transfer of girls from non-FSSAP schools to FSSAP schools. By 1998, 98 percent of all
rural secondary schools that enroll girls were part of this program. Aggregate data on
girl’s school enrollment (shown in Table 3) also demonstrate very large rates of increase
during this period.
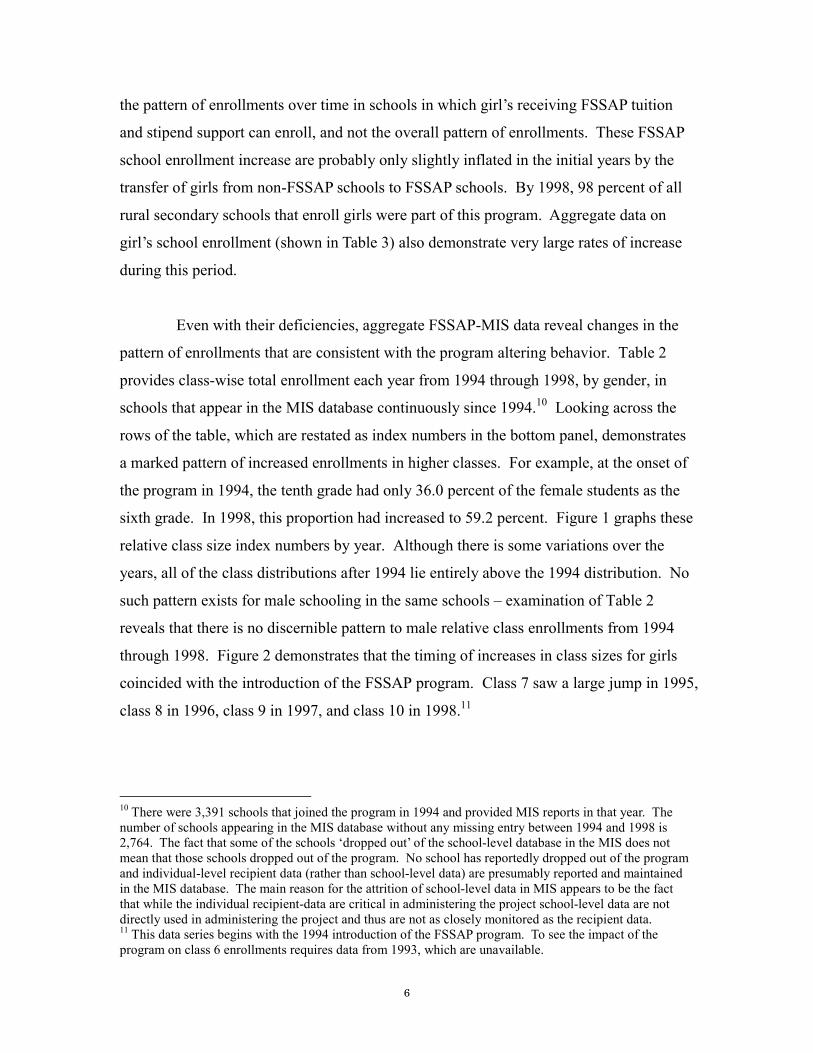
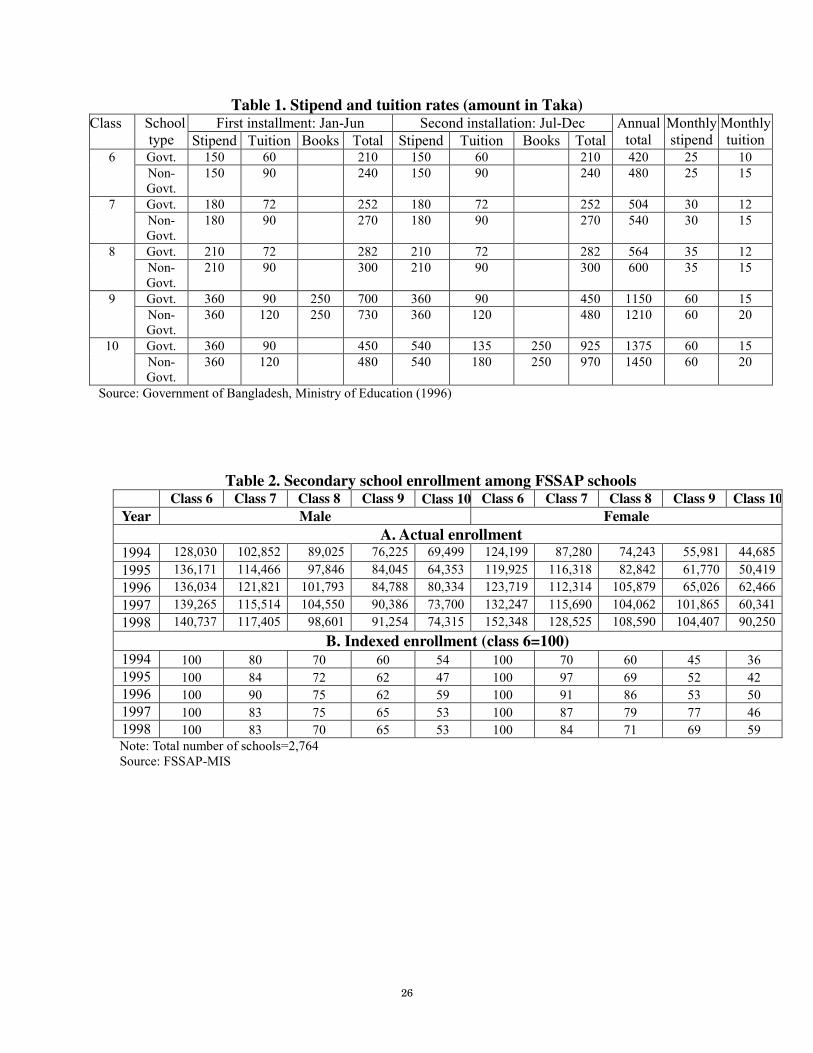
Even with their deficiencies, aggregate FSSAP-MIS data reveal changes in the
pattern of enrollments that are consistent with the program altering behavior. Table 2
provides class-wise total enrollment each year from 1994 through 1998, by gender, in
schools that appear in the MIS database continuously since 1994.10 Looking across the
rows of the table, which are restated as index numbers in the bottom panel, demonstrates
a marked pattern of increased enrollments in higher classes. For example, at the onset of
the program in 1994, the tenth grade had only 36.0 percent of the female students as the
sixth grade. In 1998, this proportion had increased to 59.2 percent. Figure 1 graphs these
relative class size index numbers by year. Although there is some variations over the
years, all of the class distributions after 1994 lie entirely above the 1994 distribution. No
such pattern exists for male schooling in the same schools – examination of Table 2
reveals that there is no discernible pattern to male relative class enrollments from 1994
through 1998. Figure 2 demonstrates that the timing of increases in class sizes for girls
coincided with the introduction of the FSSAP program. Class 7 saw a large jump in 1995,
class 8 in 1996, class 9 in 1997, and class 10 in 1998.11
10 There were 3,391 schools that joined the program in 1994 and provided MIS reports in that year. The number of schools appearing in the MIS database without any missing entry between 1994 and 1998 is 2,764. The fact that some of the schools ‘dropped out’ of the school-level database in the MIS does not mean that those schools dropped out of the program. No school has reportedly dropped out of the program and individual-level recipient data (rather than school-level data) are presumably reported and maintained in the MIS database. The main reason for the attrition of school-level data in MIS appears to be the fact that while the individual recipient-data are critical in administering the project school-level data are not directly used in administering the project and thus are not as closely monitored as the recipient data. 11 This data series begins with the 1994 introduction of the FSSAP program. To see the impact of the program on class 6 enrollments requires data from 1993, which are unavailable.

7
30
40
50
60
70
80
90
100
class 6 class 7 class 8 class 9 class 10
1994 1995 1996 1997 1998
Figure 1: National level gGirls’ class size index among FSSAP schools
by year (class 6=100) (Source: FSSAP-MIS data Bangladesh Statistical Yearbook, 1998)
40
60
80
100
120
140
160
1994 1995 1996 1997 1998
Th
ou
san
ds
Class 6 Class 7 Class 8 Class 9 Class 10

8
Figure 2: National level Girl’s class enrollment among FSSAP
schools by year (Source: FSSAP-MIS dataBangladesh Statistical Yearbook, 1998)
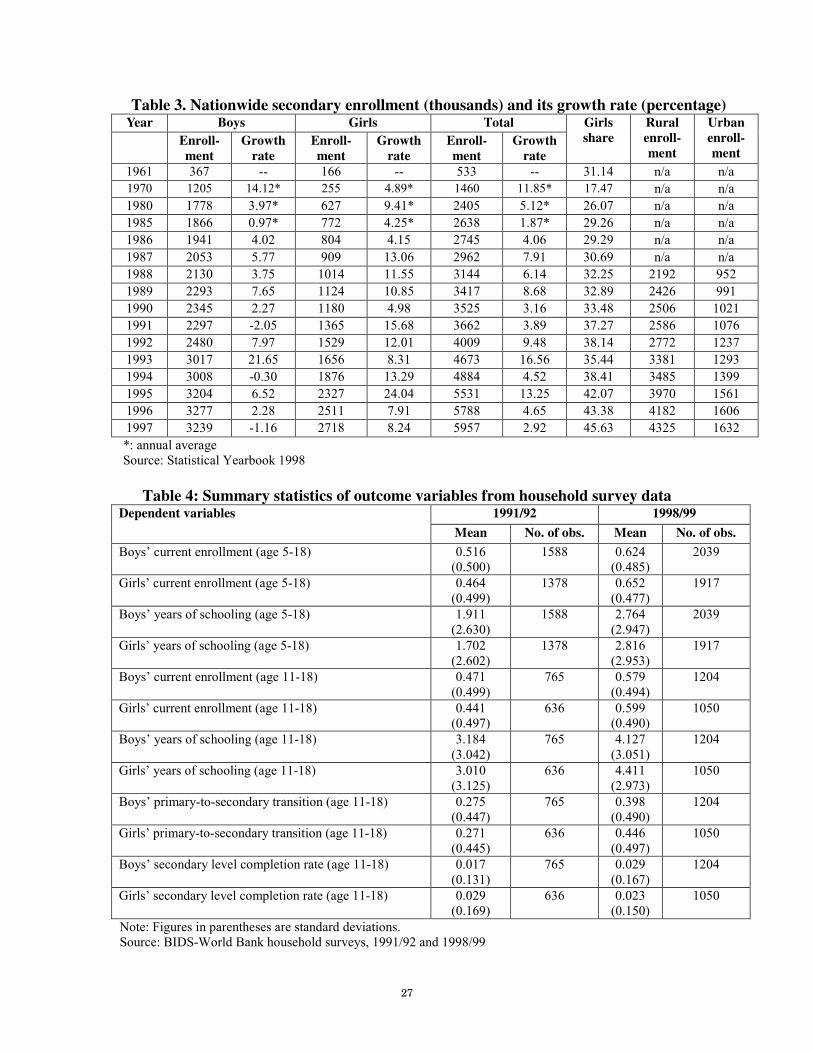
A nationwide picture of the changes in the secondary school enrollment of both
boys and girls is shown in table 3, and presented in figures 3-5.12 Figure 3 depicts the
steady upward trend in enrollment of both boys and girls attending secondary schools.
The dramatic upward trend in the country’s female secondary school enrollment since the
early nineties, the period in which school subsidies for girls were first introduced, were
followed by greatly reduced gender disparity in school enrollment (figure 4). Since
Figure 3: National level total secondary enrollment by year (Source: Bangladesh Statistical Yearbook, 1998)
12 The data covers both rural and urban area schools, with less than one quarter of the total secondary students representing urban schools.
0.5
1
1.5
2
2.5
3
3.5
1985 1987 1989 1991 1993 1995 1997
boys
girls
0.5
1
1.5
2
2.5
3
3.5
1985 1987 1989 1991 1993 1995 1997
boys
girls
9
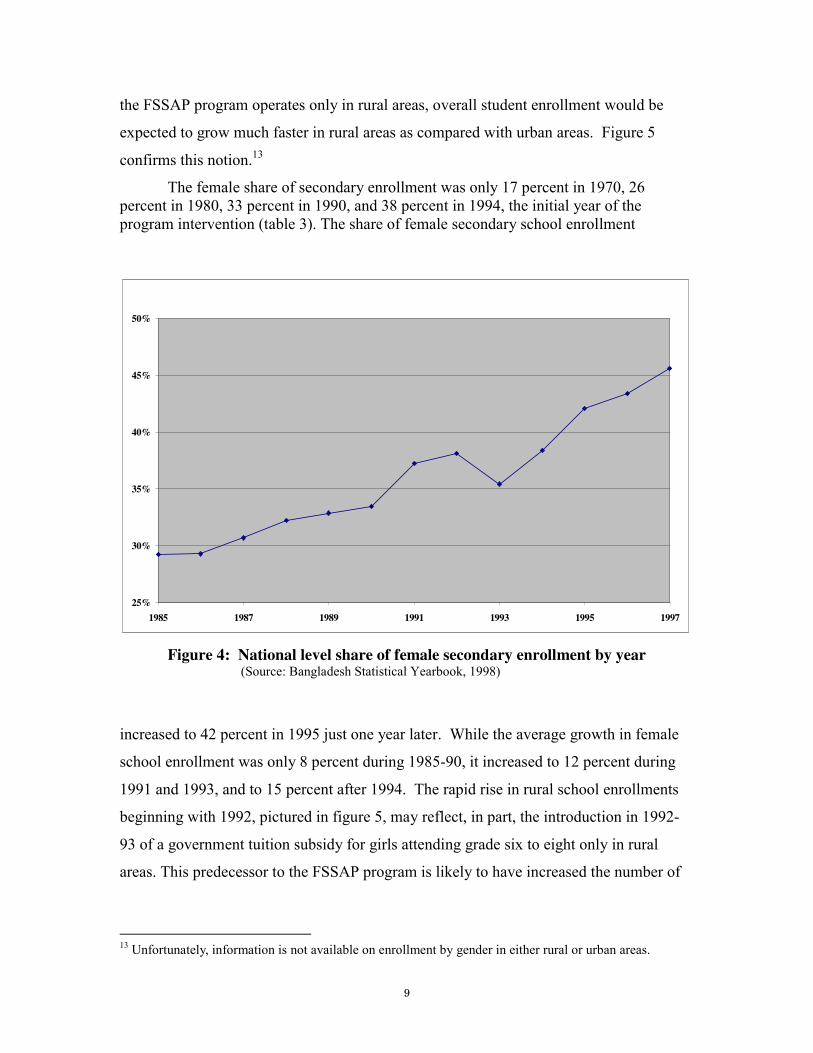
the FSSAP program operates only in rural areas, overall student enrollment would be
expected to grow much faster in rural areas as compared with urban areas. Figure 5
confirms this notion.13
The female share of secondary enrollment was only 17 percent in 1970, 26 percent in 1980, 33 percent in 1990, and 38 percent in 1994, the initial year of the program intervention (table 3). The share of female secondary school enrollment
25%
30%
35%
40%
45%
50%
1985 1987 1989 1991 1993 1995 1997
Figure 4: National level share of female secondary enrollment by year (Source: Bangladesh Statistical Yearbook, 1998)
increased to 42 percent in 1995 just one year later. While the average growth in female
school enrollment was only 8 percent during 1985-90, it increased to 12 percent during
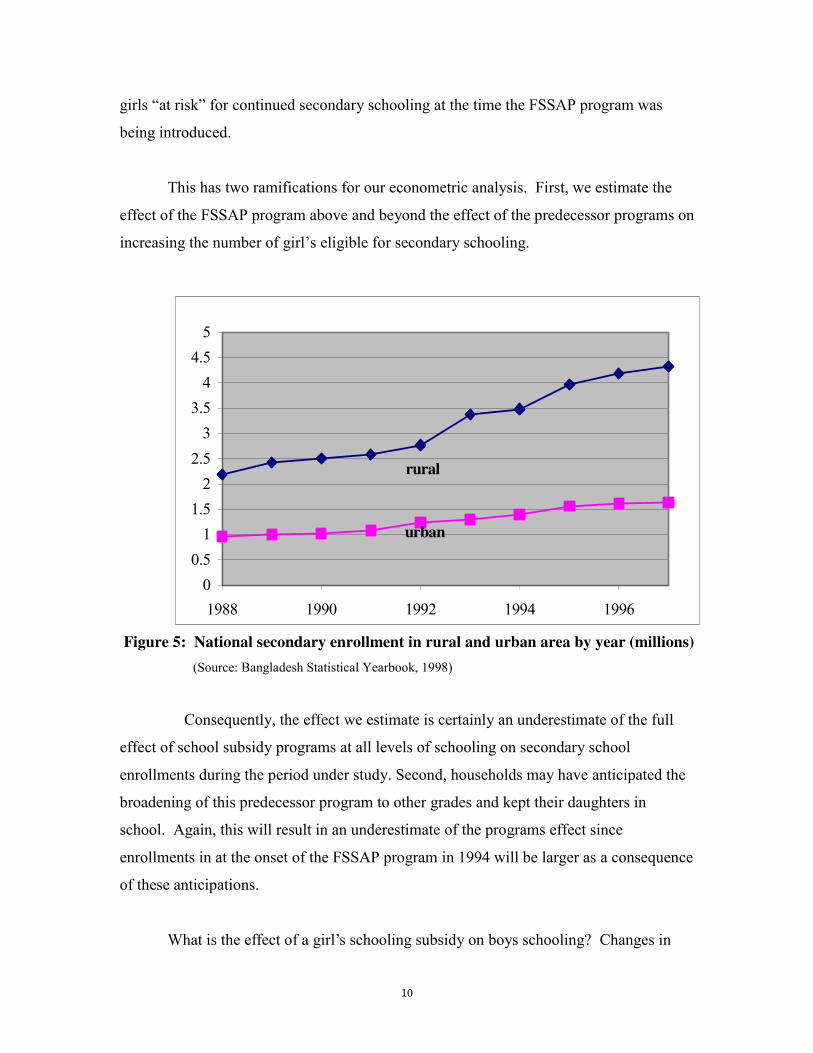
1991 and 1993, and to 15 percent after 1994. The rapid rise in rural school enrollments
beginning with 1992, pictured in figure 5, may reflect, in part, the introduction in 1992-
93 of a government tuition subsidy for girls attending grade six to eight only in rural
areas. This predecessor to the FSSAP program is likely to have increased the number of
13 Unfortunately, information is not available on enrollment by gender in either rural or urban areas.
10
girls “at risk” for continued secondary schooling at the time the FSSAP program was
being introduced.
This has two ramifications for our econometric analysis. First, we estimate the
effect of the FSSAP program above and beyond the effect of the predecessor programs on
increasing the number of girl’s eligible for secondary schooling.
0
0.5
1
1.5
2
2.5
3
3.5
4
4.5
5
1988 1990 1992 1994 1996
rural
urban
Figure 5: National secondary enrollment in rural and urban area by year (millions)
(Source: Bangladesh Statistical Yearbook, 1998)
Consequently, the effect we estimate is certainly an underestimate of the full
effect of school subsidy programs at all levels of schooling on secondary school
enrollments during the period under study. Second, households may have anticipated the
broadening of this predecessor program to other grades and kept their daughters in
school. Again, this will result in an underestimate of the programs effect since
enrollments in at the onset of the FSSAP program in 1994 will be larger as a consequence
of these anticipations.
What is the effect of a girl’s schooling subsidy on boys schooling? Changes in
11
the price of schooling girl’s arising from the stipend program will affect their schooling
and that of their brothers through the usual income and substitution effects. In the
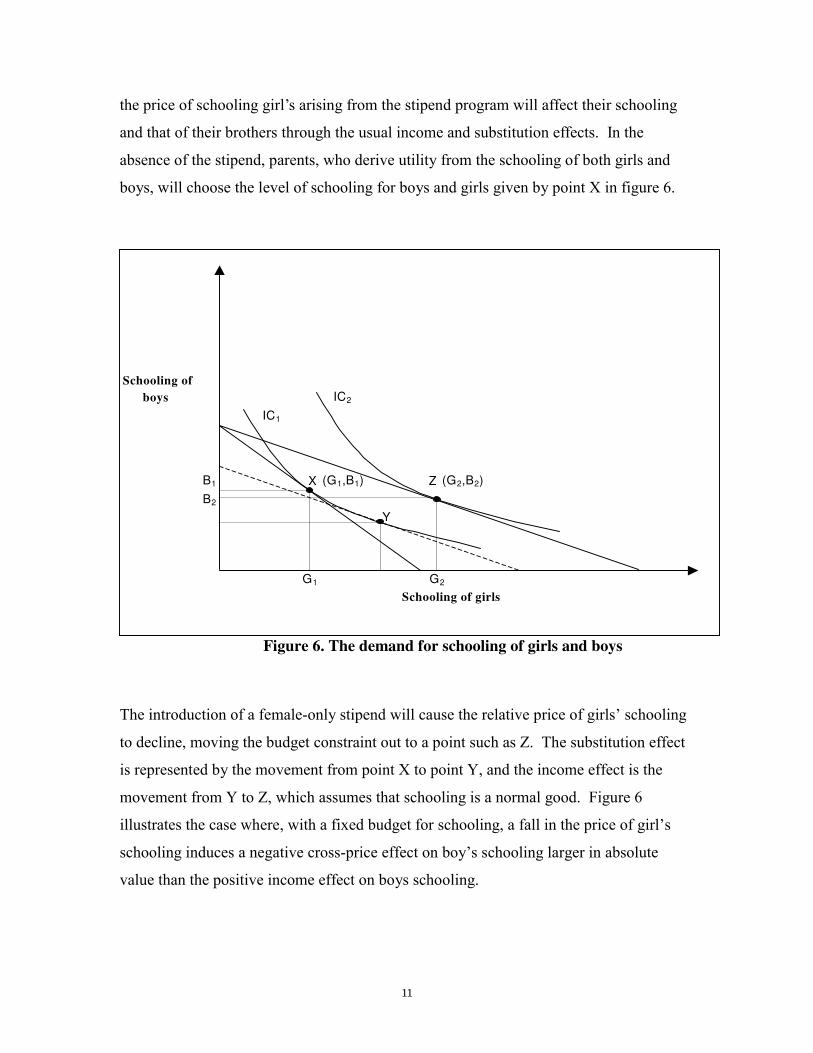
absence of the stipend, parents, who derive utility from the schooling of both girls and
boys, will choose the level of schooling for boys and girls given by point X in figure 6.
Figure 6. The demand for schooling of girls and boys
The introduction of a female-only stipend will cause the relative price of girls’ schooling
to decline, moving the budget constraint out to a point such as Z. The substitution effect
is represented by the movement from point X to point Y, and the income effect is the
movement from Y to Z, which assumes that schooling is a normal good. Figure 6
illustrates the case where, with a fixed budget for schooling, a fall in the price of girl’s
schooling induces a negative cross-price effect on boy’s schooling larger in absolute
value than the positive income effect on boys schooling.
Schooling of
boys IC2
IC1
B1 X (G1,B1) Z (G2,B2)
B2
Y
G1 G2
Schooling of girls
12
The subsidy to female secondary school enrollment may also change the sex-
specific school enrollment rate in lower grades. Girl’s must complete primary school in
order to gain entrance to secondary school, and hence forward looking parents will take
into account the relative cost of future schooling in deciding current enrollments of their
children.
3. Data and its characteristics
The household survey data used comes from two recent surveys carried out by the
Bangladesh Institute of Development Studies (BIDS) with funding from the World Bank
(WB). The BIDS-WB micro-credit project surveyed households and schools in 32
randomly drawn thanas (sub-districts) throughout Bangladesh (out of 460 thanas
convered by the FSSAP, FSSP and SEDP programs). The 1991/92 survey covered
roughly 1,800 households from 87 villages in 29 thanas, collecting household and
individual information on labor supply, income, employment, expenditure, borrowing
and savings. In conjunction with this survey, a school-level survey was simultaneously
administered covering the 687 primary, secondary and post-secondary schools attended
by members of households surveyed.14 The school-level survey collected information on
student enrollment by gender and by class and other information such as the number of
teachers and their gender and qualifications.
In 1998/99, a follow up survey of the same set of households and schools was
conducted. As part of the 1998/99 survey, an additional 180 households were selected
from 9 villages drawn randomly from three new thanas. These three thanas were drawn
from the south-east part of Bangladesh, which was excluded in 1991/92 survey due to the
damage caused by a devastating cyclone. The re-survey also added households from the
original 87 villages, covering a total of 2,599 households and 889 schools.15
Girl’s school enrollment and grade attainment well exceeded that of boys at the
end of the 1991-98 period in the BIDS-WB dataset. As table 4 indicates, 52 percent of
14 There were 301 primary schools and 384 secondary and other non-primary schools in the 1991/92 school survey. 15 Among the 889 schools, there were 476 primary schools and 413 secondary and non-primary schools included in the follow-up survey.
13
school-aged (5-18 year old) boys were enrolled in school in 1991, compared to 62
percent in 1998, implying an annual increase of about 1 percent. In contrast, 46 percent
of girls of the same age group attended schools in 1991/92 compared to 65 percent in
1998/99. If we focus on the target group of secondary school-aged children (aged 11-18),
we see more dramatic changes. For boys of age 11-18 in our sample, the secondary
school enrollment rate was 47 percent in 1991/92 and 58 percent in 1998/99. In contrast,
the corresponding rate for girls of the same cohort was 44 percent in 1991/92 and 60
percent in 1998/99. The mean years of schooling completed by girls of age 11-18
increased from 3.0 years to 4.4, while the mean years of schooling completed by boys of
the same age group increased from 3.2 to 4.1 over the same period. Among primary
school graduates, the transition to secondary school was 45 percent in 1998/99 compared
to 27 percent in 1991/92 for girls, while the corresponding rates for boys were 40 percent
in 1998/99 and 27.5 percent in 1991/92. However, the secondary school completion rate
has declined for females, while it has increased slightly for males over the same period.
FSSAP-MIS data contains school-level information on those schools that
participated in the FSSAP program during the period 1994-1998. Since only female
students are eligible for the program, the FSSAP-MIS data set includes information on
participating coeducational or female-only schools. Exclusion of the male-only schools
is the major source of discrepancy between our FSSAP-MIS data and the nationwide
statistics on total and male enrollment. There are 4,770 schools included in the FSSAP-
MIS data; among them, 3,391 joined the program in 1994, 352 in 1995, 467 in 1996, 303
in 1997 and 257 in 1998. Among the 4,770 schools, 4,046 (85%) are coeducational and
724(15%) are female only-schools. While all the participating schools presumably
reported/maintained student-level information (on attendance and examination marks) for
all female (but not male) students every year after joining the program —which is
essential for administering the stipend program— not all schools reported school-level
information (or school-level data entered in the MIS database) every year. For example,
while 3,391 schools reportedly joined the program in 1994, 5 consecutive observations
during 1994-1998 are found for 3,172 schools. In addition, there are cases where the
school identification number appears in the data but all the enrollment variables have
14
missing values in some of the data years. As a result, only 2,764 (out of 3,391) schools
report non-missing enrollment figures for 5 consecutive years.
4. Econometric issue in the household level analysis
The data available for the household-level analysis consists of two household surveys
conducted in 1991/92 and 1998/99 that sample households from a common set of villages.
These surveys are the source of our outcome measure, child-specific school enrollment,
as well as parental characteristics. These data were merged with school-level data on the
timing of the introduction of the FSSAP program. The crucial attributes of the data that
affect estimation and interpretation are these:
I. program’s were not in operation in any village during the first round;
II. program’s operated in every village during the second round;
III. the only source of program variation is the date of its introduction between the
two rounds.
Complicating estimation is the possible endogeneity of the date of program
introduction across the villages of rural Bangladesh. Fixed effect conditional logit
models are estimated to sweep out village-level heterogeneity that may both affect the
determinants of the dependent variable, individual school enrollment, and the timing of
the introduction of the FSSAP program into villages.
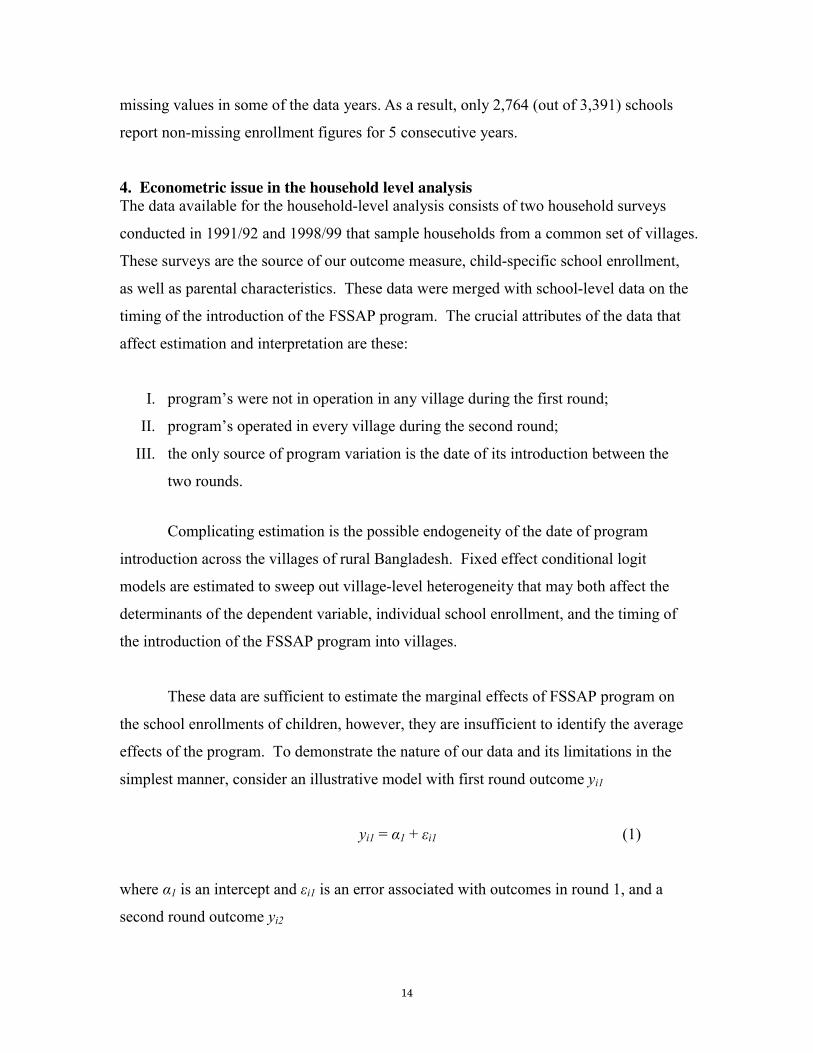
These data are sufficient to estimate the marginal effects of FSSAP program on
the school enrollments of children, however, they are insufficient to identify the average
effects of the program. To demonstrate the nature of our data and its limitations in the
simplest manner, consider an illustrative model with first round outcome yi1
yi1 = α1 + εi1 (1)
where α1 is an intercept and εi1 is an error associated with outcomes in round 1, and a
second round outcome yi2
15
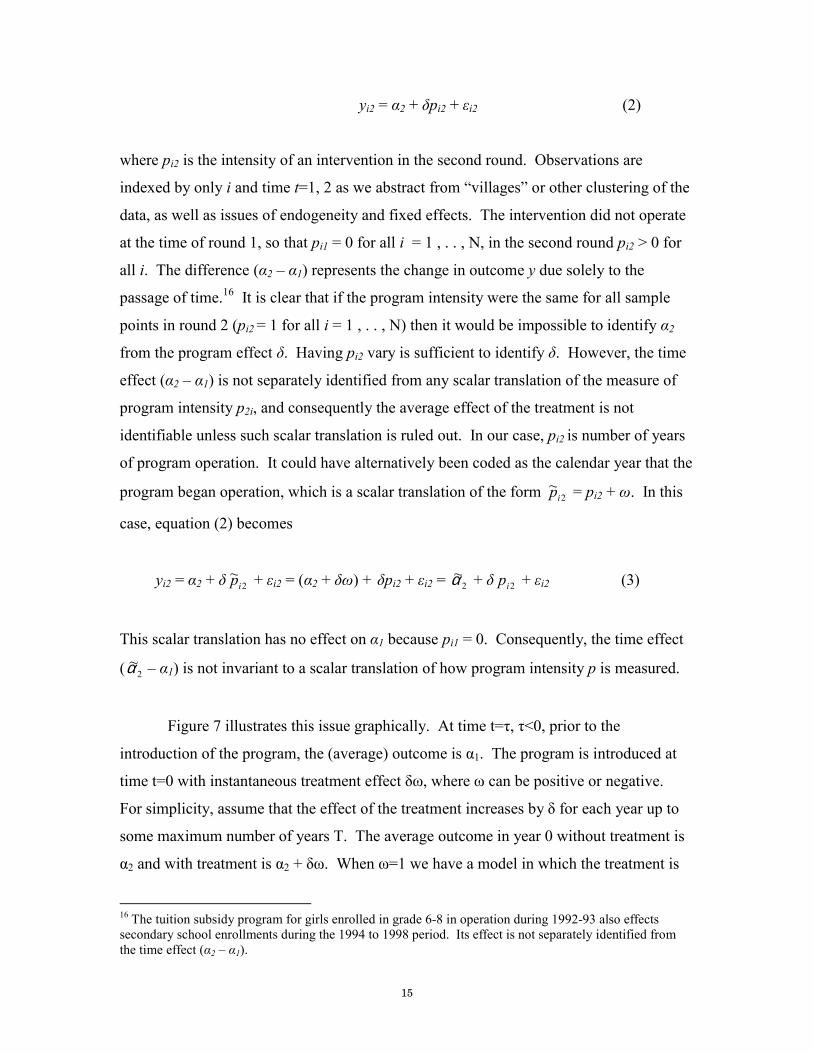
yi2 = α2 + δpi2 + εi2 (2)
where pi2 is the intensity of an intervention in the second round. Observations are
indexed by only i and time t=1, 2 as we abstract from “villages” or other clustering of the
data, as well as issues of endogeneity and fixed effects. The intervention did not operate
at the time of round 1, so that pi1 = 0 for all i = 1 , . . , N, in the second round pi2 > 0 for
all i. The difference (α2 – α1) represents the change in outcome y due solely to the
passage of time.16 It is clear that if the program intensity were the same for all sample
points in round 2 (pi2 = 1 for all i = 1 , . . , N) then it would be impossible to identify α2
from the program effect δ. Having pi2 vary is sufficient to identify δ. However, the time
effect (α2 – α1) is not separately identified from any scalar translation of the measure of
program intensity p2i, and consequently the average effect of the treatment is not
identifiable unless such scalar translation is ruled out. In our case, pi2 is number of years
of program operation. It could have alternatively been coded as the calendar year that the
program began operation, which is a scalar translation of the form 2~
ip = pi2 + ω. In this
case, equation (2) becomes
yi2 = α2 + δ 2~
ip + εi2 = (α2 + δω) + δpi2 + εi2 = 2~α + δ 2ip + εi2 (3)
This scalar translation has no effect on α1 because pi1 = 0. Consequently, the time effect
( 2~α – α1) is not invariant to a scalar translation of how program intensity p is measured.
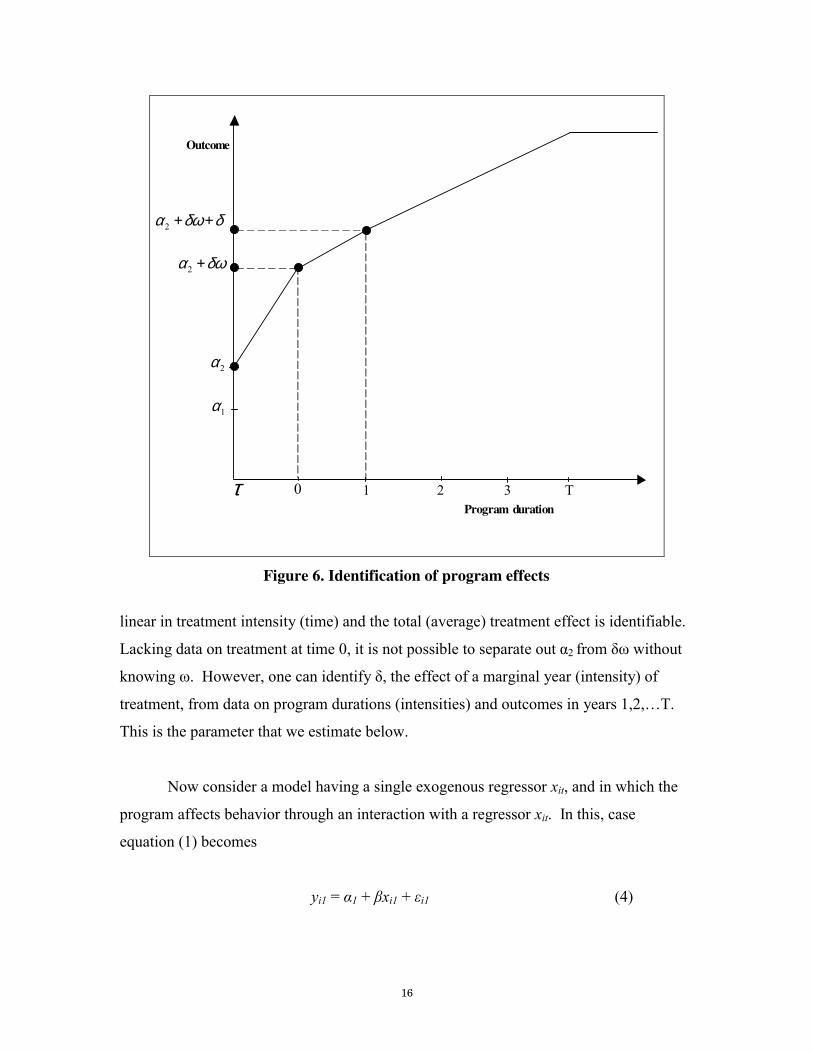
Figure 7 illustrates this issue graphically. At time t=τ, τ<0, prior to the
introduction of the program, the (average) outcome is α1. The program is introduced at
time t=0 with instantaneous treatment effect δω, where ω can be positive or negative.
For simplicity, assume that the effect of the treatment increases by δ for each year up to
some maximum number of years T. The average outcome in year 0 without treatment is
α2 and with treatment is α2 + δω. When ω=1 we have a model in which the treatment is
16 The tuition subsidy program for girls enrolled in grade 6-8 in operation during 1992-93 also effects secondary school enrollments during the 1994 to 1998 period. Its effect is not separately identified from the time effect (α2 – α1).
16
Outcome
_ _ _ _ _ _ _ _ _ _ _ _ _
_ _ _ _ _ _
0 1 2 3 T
Program duration
1α
2α
δωα +2
δδωα ++2
τ
Figure 6. Identification of program effects
linear in treatment intensity (time) and the total (average) treatment effect is identifiable.
Lacking data on treatment at time 0, it is not possible to separate out α2 from δω without
knowing ω. However, one can identify δ, the effect of a marginal year (intensity) of
treatment, from data on program durations (intensities) and outcomes in years 1,2,…T.
This is the parameter that we estimate below.
Now consider a model having a single exogenous regressor xit, and in which the
program affects behavior through an interaction with a regressor xit. In this, case
equation (1) becomes
yi1 = α1 + βxi1 + εi1 (4)
17
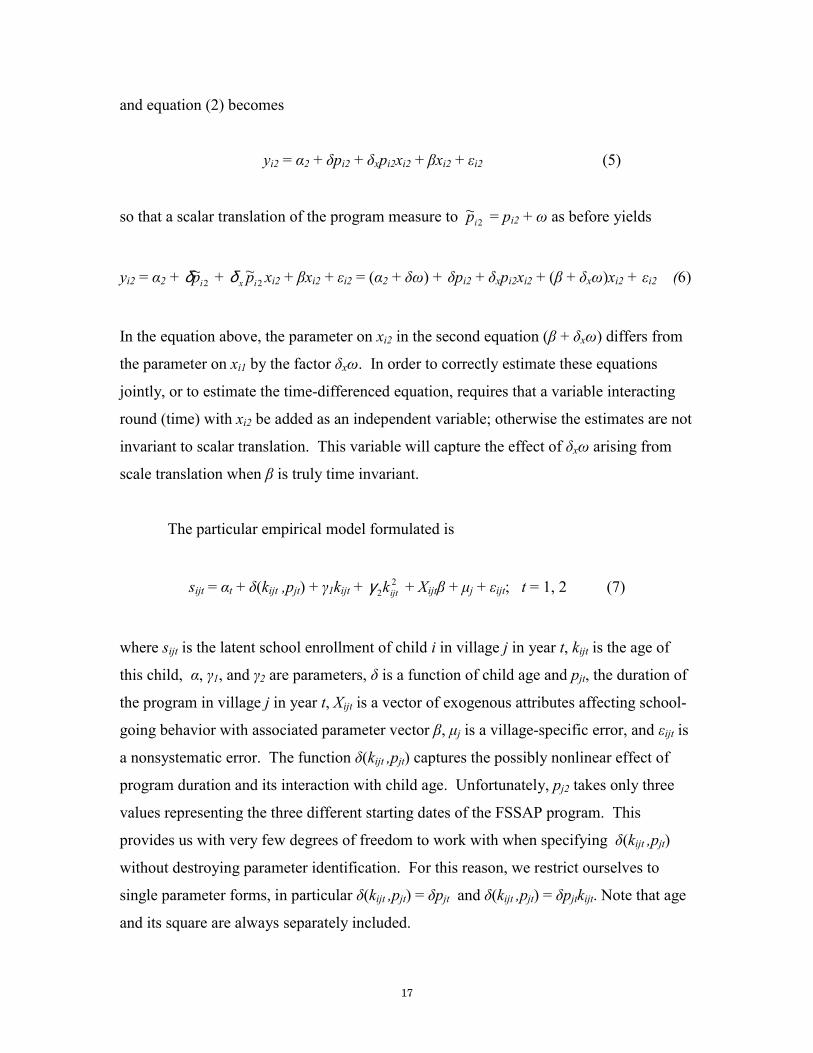
and equation (2) becomes
yi2 = α2 + δpi2 + δxpi2xi2 + βxi2 + εi2 (5)
so that a scalar translation of the program measure to 2~
ip = pi2 + ω as before yields
yi2 = α2 + 2~
ipδ + 2~
ix pδ xi2 + βxi2 + εi2 = (α2 + δω) + δpi2 + δxpi2xi2 + (β + δxω)xi2 + εi2 (6)
In the equation above, the parameter on xi2 in the second equation (β + δxω) differs from
the parameter on xi1 by the factor δxω. In order to correctly estimate these equations
jointly, or to estimate the time-differenced equation, requires that a variable interacting
round (time) with xi2 be added as an independent variable; otherwise the estimates are not
invariant to scalar translation. This variable will capture the effect of δxω arising from
scale translation when β is truly time invariant.
The particular empirical model formulated is
sijt = αt + δ(kijt ,pjt) + γ1kijt + 2
2 ijtkγ + Xijtβ + µj + εijt; t = 1, 2 (7)
where sijt is the latent school enrollment of child i in village j in year t, kijt is the age of
this child, α, γ1, and γ2 are parameters, δ is a function of child age and pjt, the duration of
the program in village j in year t, Xijt is a vector of exogenous attributes affecting school-
going behavior with associated parameter vector β, µj is a village-specific error, and εijt is
a nonsystematic error. The function δ(kijt ,pjt) captures the possibly nonlinear effect of
program duration and its interaction with child age. Unfortunately, pj2 takes only three
values representing the three different starting dates of the FSSAP program. This
provides us with very few degrees of freedom to work with when specifying δ(kijt ,pjt)
without destroying parameter identification. For this reason, we restrict ourselves to
single parameter forms, in particular δ(kijt ,pjt) = δpjt and δ(kijt ,pjt) = δpjtkijt. Note that age
and its square are always separately included.
18
The interaction of age and program effects and more general forms of δ(kijt ,pjt)
allow the effect of program duration on school enrollment to depend on age or,
equivalently, on the duration of exposure to the program and the age at which that
exposure began. Age at first exposure to the program is simply fijt = kijt - pjt. If first
exposure occurs when the child is older, he or she may already have left school. The
younger the child when first exposed, the greater the effect on subsequent school
behavior as the subsidy should, in principle, reduce the probability of leaving school (or
not entering) at every age above the minimal age of initial primary school entrance. On
the other hand, the discounted value of the stipend to younger students who would at
most be in primary school is smaller the further they are away from the entry into
secondary school. If there is non-independence in household decision-making within the
village, then observing one’s neighbors start to send their daughters to attend secondary
school in previous years may affect parent’s decision on the schooling of their daughters
in the current year. Consequently, the effect of the program can continue to grow well
beyond its date of introduction.
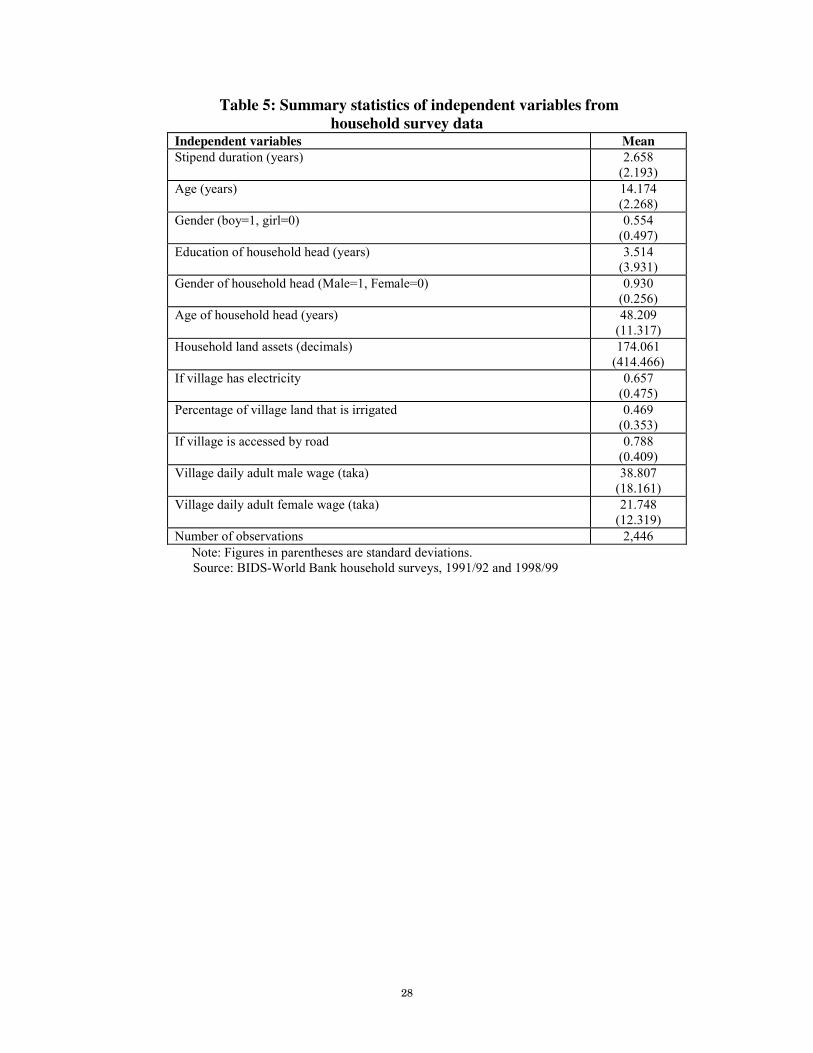
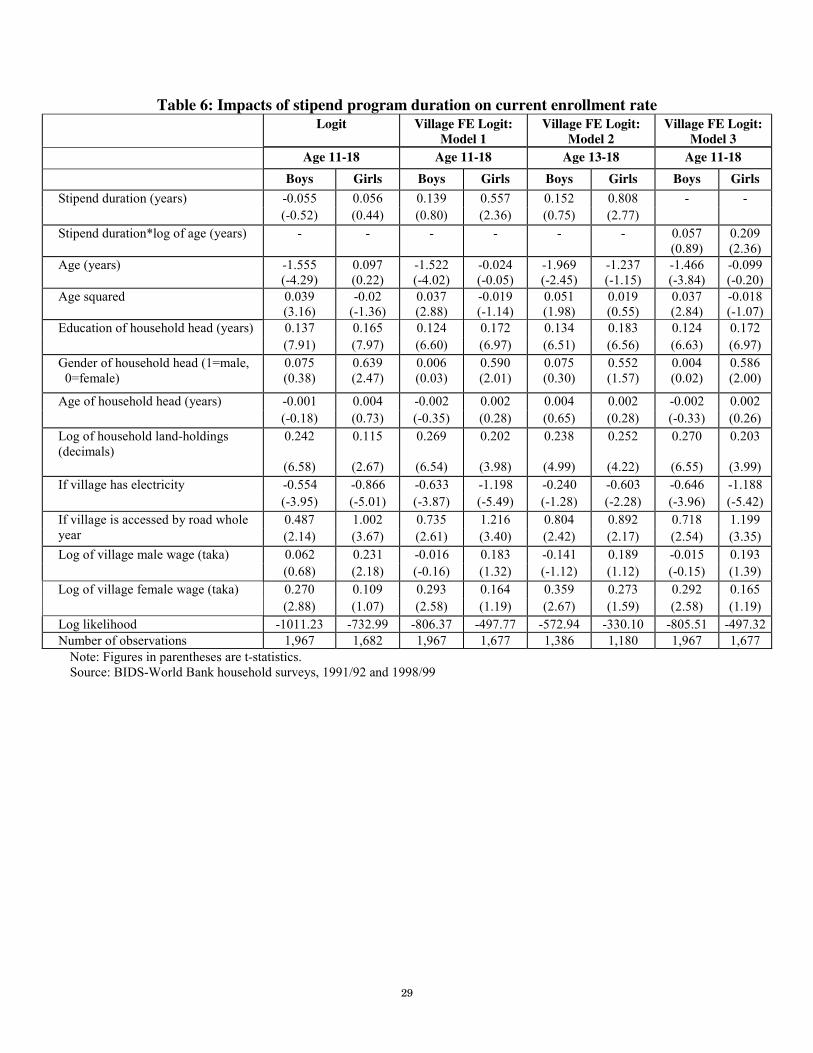
5. Results of the household-level analysis
Summary statistics of the independent variables is shown in table 5 and the results of the
household-level analysis are presented in table 6. The dependent variable in every case is
current school enrollment. The sample is broken between boys and girls of ages 11 to 18
years and 13 to 18 years, the ages at which students are at risk for school leaving. The
program duration variable reflects the date at which any school serving the children of a
village became associated with FSSAP, and is coded as the years since introduction
(1994=5, 1995=4, and 1996=3).
The first two columns of table 6 present standard logit estimates of the
determinants of current school enrollment. The duration of the FSSAP stipend program
in the village does not have a statistically significant effect on school enrollment for
either gender when village-level heterogeneity is not controlled for. The columns marked
“Model 1" present the same specification using village fixed effects logit. The estimated
19
coefficient on stipend duration for girls is positive (0.557) and statistically significant
(t=2.36) using village fixed effects. This parameter corresponds to a derivative of the
probability of school enrollment with respect to a year of stipend duration of
approximately 0.12. The effects on boys schooling remain statistically zero.
As argued above, the effect of the secondary school stipends on school enrollment
may depend on child age. One reason is that the value of the stipend to younger students
who would still be in primary school is smaller the further they are away from the
possible entry into secondary school. Moreover, school enrollment rates are quite high
(about 80 percent for both girls and boys) at these ages. In model 2, where we drop
children of 11 and 12 years of age from the sample, the estimated effect of stipend
duration on girls rises appreciably (from 0.557 to 0.808) and the coefficient has a t-ratio
of 2.77. With the limited variation on stipend duration available in these data, we allow
for age-varying stipend effects through an age-stipend interaction term without a level
stipend variable. The results of this specification are labeled Model 3 in Table 6. As
suggested, the age-stipend interaction is positive and significant for girls.
6. Stipend program impact: analysis with FSSAP MIS data
Although the analysis of the household survey data demonstrates a positive effect of the
female stipend program on girls’ secondary enrollment, parameter identification rests on
the limited variation in program duration across the villages in our sample. Our results
would be strengthened if we could get confirmatory results from an analysis based on a
very different data set. In particular, we make use of the aggregate school-level
information obtained from the MIS information of the FSSAP project for this
confirmation. The schools covered in the FSSAP MIS data provide information annually
for the years 1994 to 1998, but not prior to 1994. The basic source of identification is
the same — not all schools were enrolled in the FSSAP stipend program at the same time.
However, the annual MIS data allow us to make use of another source of variation — not
all grades were treated at the same year, even if the school was treated. We exploited
both sources of variation observed at the school level to estimate the stipend program
20
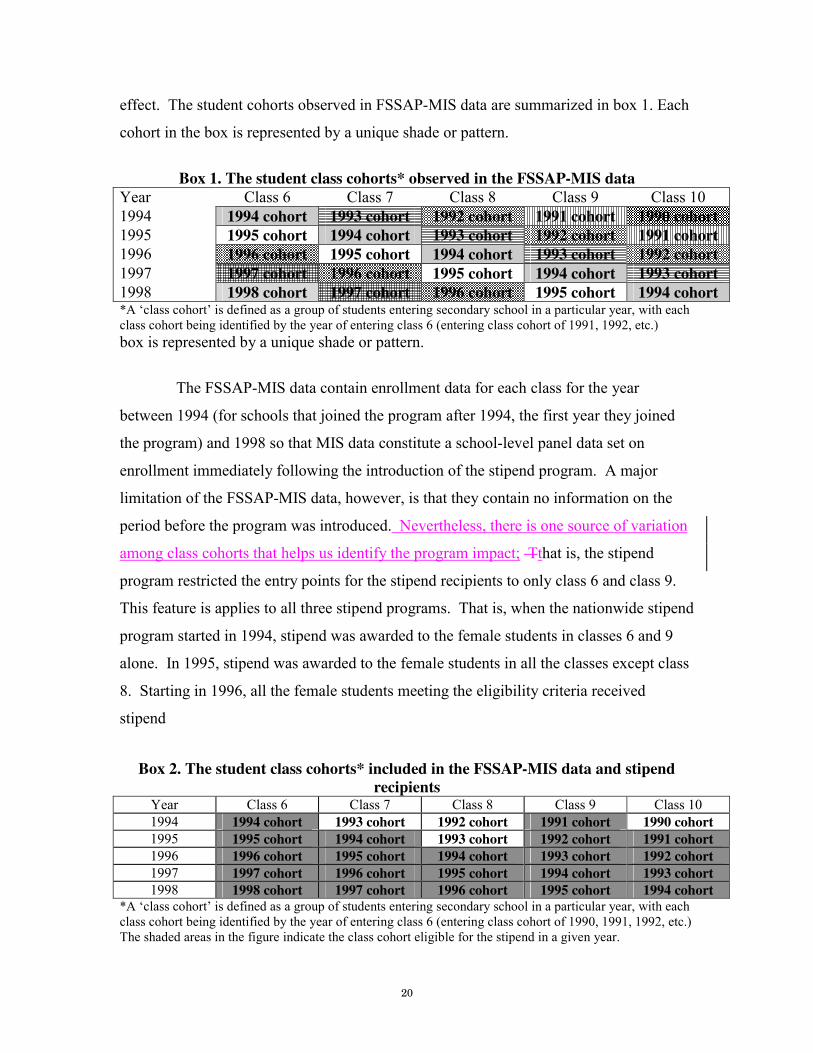
effect. The student cohorts observed in FSSAP-MIS data are summarized in box 1. Each
cohort in the box is represented by a unique shade or pattern.
Box 1. The student class cohorts* observed in the FSSAP-MIS data
Year Class 6 Class 7 Class 8 Class 9 Class 10
1994 1994 cohort 1993 cohort 1992 cohort 1991 cohort 1990 cohort
1995 1995 cohort 1994 cohort 1993 cohort 1992 cohort 1991 cohort
1996 1996 cohort 1995 cohort 1994 cohort 1993 cohort 1992 cohort
1997 1997 cohort 1996 cohort 1995 cohort 1994 cohort 1993 cohort
1998 1998 cohort 1997 cohort 1996 cohort 1995 cohort 1994 cohort*A ‘class cohort’ is defined as a group of students entering secondary school in a particular year, with each class cohort being identified by the year of entering class 6 (entering class cohort of 1991, 1992, etc.) box is represented by a unique shade or pattern.
The FSSAP-MIS data contain enrollment data for each class for the year
between 1994 (for schools that joined the program after 1994, the first year they joined
the program) and 1998 so that MIS data constitute a school-level panel data set on
enrollment immediately following the introduction of the stipend program. A major
limitation of the FSSAP-MIS data, however, is that they contain no information on the
period before the program was introduced. Nevertheless, there is one source of variation
among class cohorts that helps us identify the program impact; Tthat is, the stipend
program restricted the entry points for the stipend recipients to only class 6 and class 9.
This feature is applies to all three stipend programs. That is, when the nationwide stipend
program started in 1994, stipend was awarded to the female students in classes 6 and 9
alone. In 1995, stipend was awarded to the female students in all the classes except class
8. Starting in 1996, all the female students meeting the eligibility criteria received
stipend
Box 2. The student class cohorts* included in the FSSAP-MIS data and stipend
recipients Year Class 6 Class 7 Class 8 Class 9 Class 10
1994 1994 cohort 1993 cohort 1992 cohort 1991 cohort 1990 cohort
1995 1995 cohort 1994 cohort 1993 cohort 1992 cohort 1991 cohort
1996 1996 cohort 1995 cohort 1994 cohort 1993 cohort 1992 cohort
1997 1997 cohort 1996 cohort 1995 cohort 1994 cohort 1993 cohort
1998 1998 cohort 1997 cohort 1996 cohort 1995 cohort 1994 cohort *A ‘class cohort’ is defined as a group of students entering secondary school in a particular year, with each class cohort being identified by the year of entering class 6 (entering class cohort of 1990, 1991, 1992, etc.) The shaded areas in the figure indicate the class cohort eligible for the stipend in a given year.
21
regardless of the class cohort (the class cohorts of female students receiving stipend in
different years—indicated by the shaded area— are summarized in box 2).
Thus the coexistence of class cohorts receiving and not receiving the stipend in
the same school in the same year provide intra-school variation in program exposure, a
source of variation which is not available in the two cross-sections of household survey
data analyzed above. Although all class cohorts become eligible for stipend during the
time frame of these MIS data, relatively few cohorts did not receive stipends once the
program was introduced into their school (unshaded in Box 2). We also calculate the
future program duration, which is equal to the number of additional years that a girl in a
particular class would get the stipend if she continues her education. To estimate the
effect of the female stipend program on boy’s enrollment in FSSAP schools, we calculate
the mean of actual and future program durations across all classes.
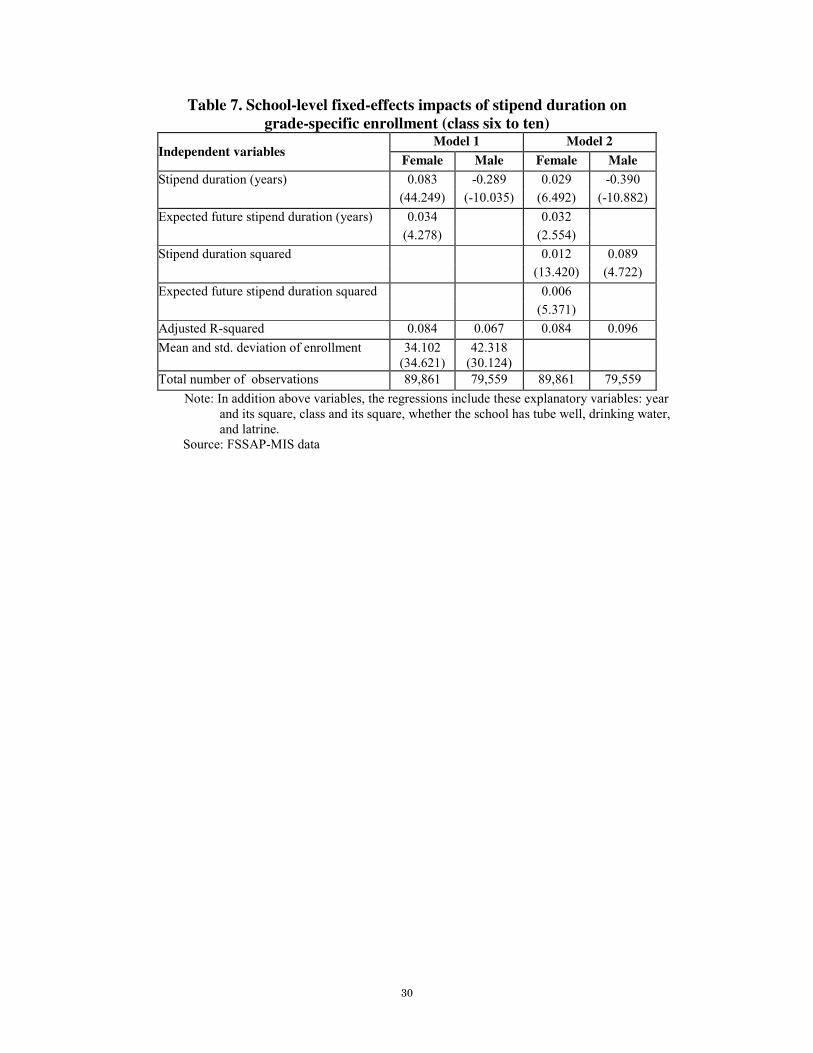
We used the FSSAP-MIS school-level data to estimate the net impact of the
stipend program on grade-specific enrollment. As we observed in section 2 above,
national level data on enrollment indicate that there had been an upward trend in the
enrollment before the stipend started. Thus it is likely that, even without the stipend
program, the enrollment would have kept increasing after 1994. In order to estimate the
net stipend impact controlling for the trend increase in demand for education as well as
for other factors, we have fitted a semi-logarithmic grade-specific school enrollment
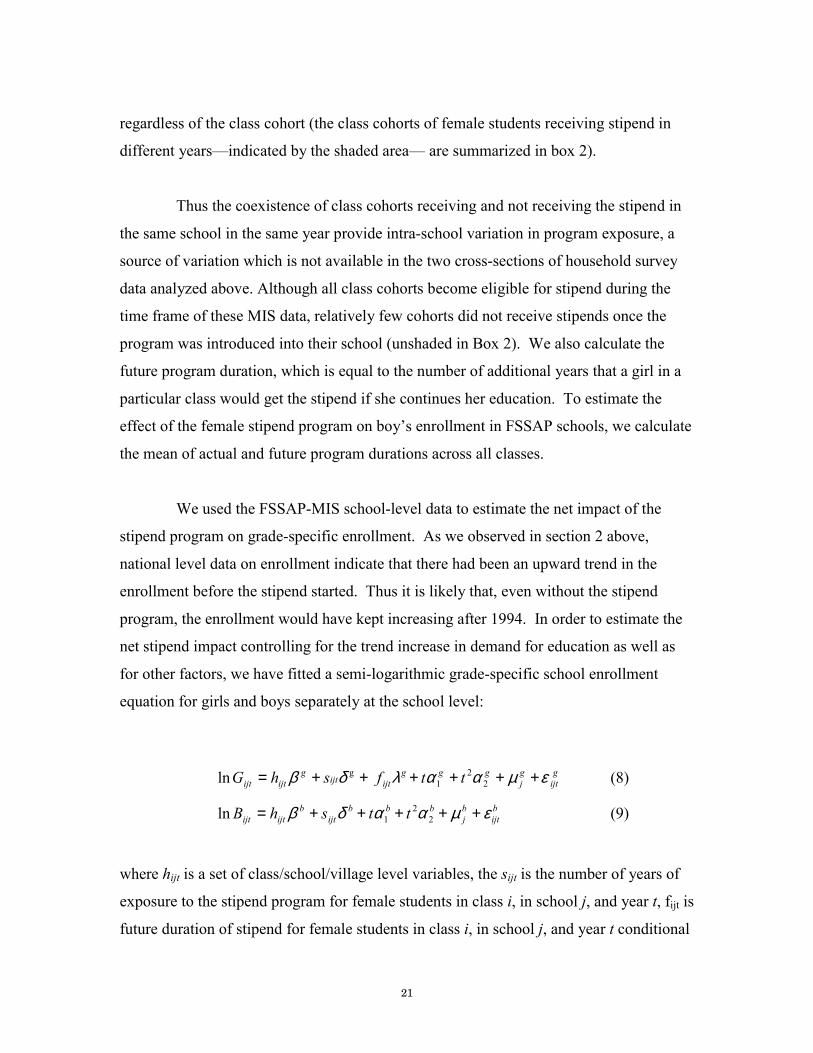
equation for girls and boys separately at the school level:
g
ijt
g
j
ggg
ijtijtg
ijtijt ttfshG εµααλδβ ++++++= 2
2
1
gln (8)
b
ijt
b
j
bbb
ijt
b
ijtijt ttshB εµααδβ +++++= 2
2
1ln (9)
where hijt is a set of class/school/village level variables, the sijt is the number of years of
exposure to the stipend program for female students in class i, in school j, and year t, fijt is
future duration of stipend for female students in class i, in school j, and year t conditional
22
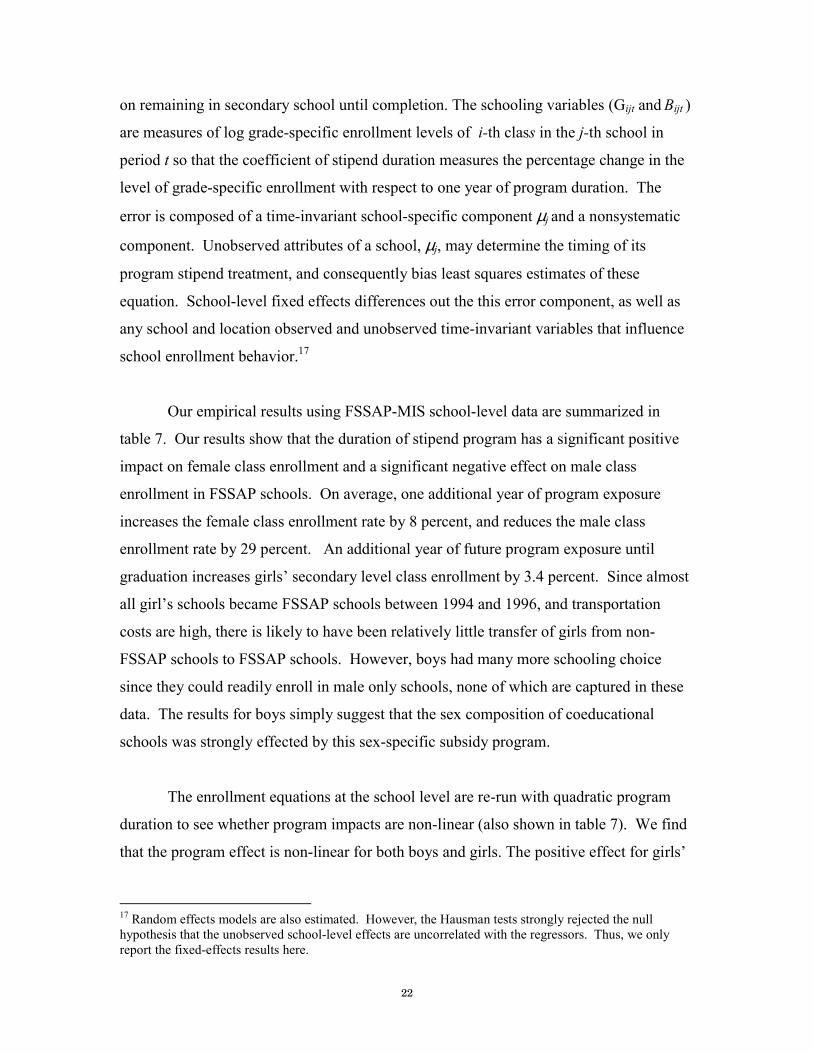
on remaining in secondary school until completion. The schooling variables (Gijt and Bijt )
are measures of log grade-specific enrollment levels of i-th class in the j-th school in
period t so that the coefficient of stipend duration measures the percentage change in the
level of grade-specific enrollment with respect to one year of program duration. The
error is composed of a time-invariant school-specific component µj and a nonsystematic
component. Unobserved attributes of a school, µj, may determine the timing of its
program stipend treatment, and consequently bias least squares estimates of these
equation. School-level fixed effects differences out the this error component, as well as
any school and location observed and unobserved time-invariant variables that influence
school enrollment behavior.17
Our empirical results using FSSAP-MIS school-level data are summarized in
table 7. Our results show that the duration of stipend program has a significant positive
impact on female class enrollment and a significant negative effect on male class
enrollment in FSSAP schools. On average, one additional year of program exposure
increases the female class enrollment rate by 8 percent, and reduces the male class
enrollment rate by 29 percent. An additional year of future program exposure until
graduation increases girls’ secondary level class enrollment by 3.4 percent. Since almost
all girl’s schools became FSSAP schools between 1994 and 1996, and transportation
costs are high, there is likely to have been relatively little transfer of girls from non-
FSSAP schools to FSSAP schools. However, boys had many more schooling choice
since they could readily enroll in male only schools, none of which are captured in these
data. The results for boys simply suggest that the sex composition of coeducational
schools was strongly effected by this sex-specific subsidy program.
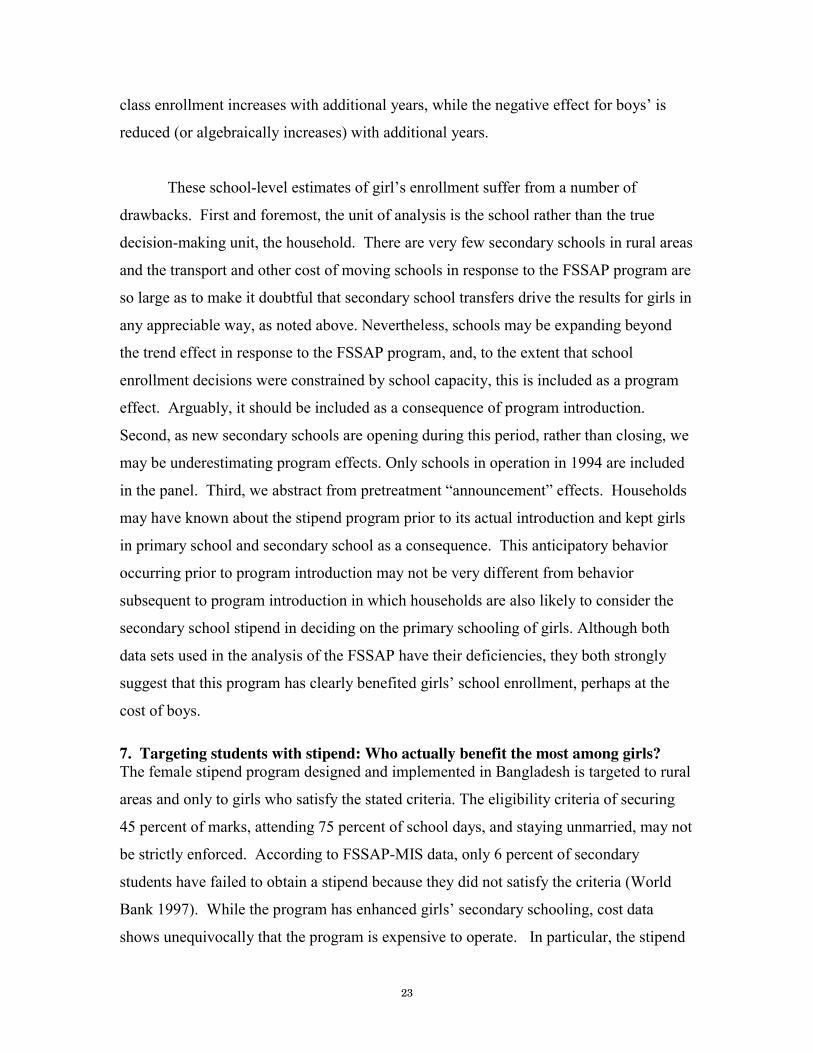
The enrollment equations at the school level are re-run with quadratic program
duration to see whether program impacts are non-linear (also shown in table 7). We find
that the program effect is non-linear for both boys and girls. The positive effect for girls’
17 Random effects models are also estimated. However, the Hausman tests strongly rejected the null hypothesis that the unobserved school-level effects are uncorrelated with the regressors. Thus, we only report the fixed-effects results here.
23
class enrollment increases with additional years, while the negative effect for boys’ is
reduced (or algebraically increases) with additional years.
These school-level estimates of girl’s enrollment suffer from a number of
drawbacks. First and foremost, the unit of analysis is the school rather than the true
decision-making unit, the household. There are very few secondary schools in rural areas
and the transport and other cost of moving schools in response to the FSSAP program are
so large as to make it doubtful that secondary school transfers drive the results for girls in
any appreciable way, as noted above. Nevertheless, schools may be expanding beyond
the trend effect in response to the FSSAP program, and, to the extent that school
enrollment decisions were constrained by school capacity, this is included as a program
effect. Arguably, it should be included as a consequence of program introduction.
Second, as new secondary schools are opening during this period, rather than closing, we
may be underestimating program effects. Only schools in operation in 1994 are included
in the panel. Third, we abstract from pretreatment “announcement” effects. Households
may have known about the stipend program prior to its actual introduction and kept girls
in primary school and secondary school as a consequence. This anticipatory behavior
occurring prior to program introduction may not be very different from behavior
subsequent to program introduction in which households are also likely to consider the
secondary school stipend in deciding on the primary schooling of girls. Although both
data sets used in the analysis of the FSSAP have their deficiencies, they both strongly
suggest that this program has clearly benefited girls’ school enrollment, perhaps at the
cost of boys.
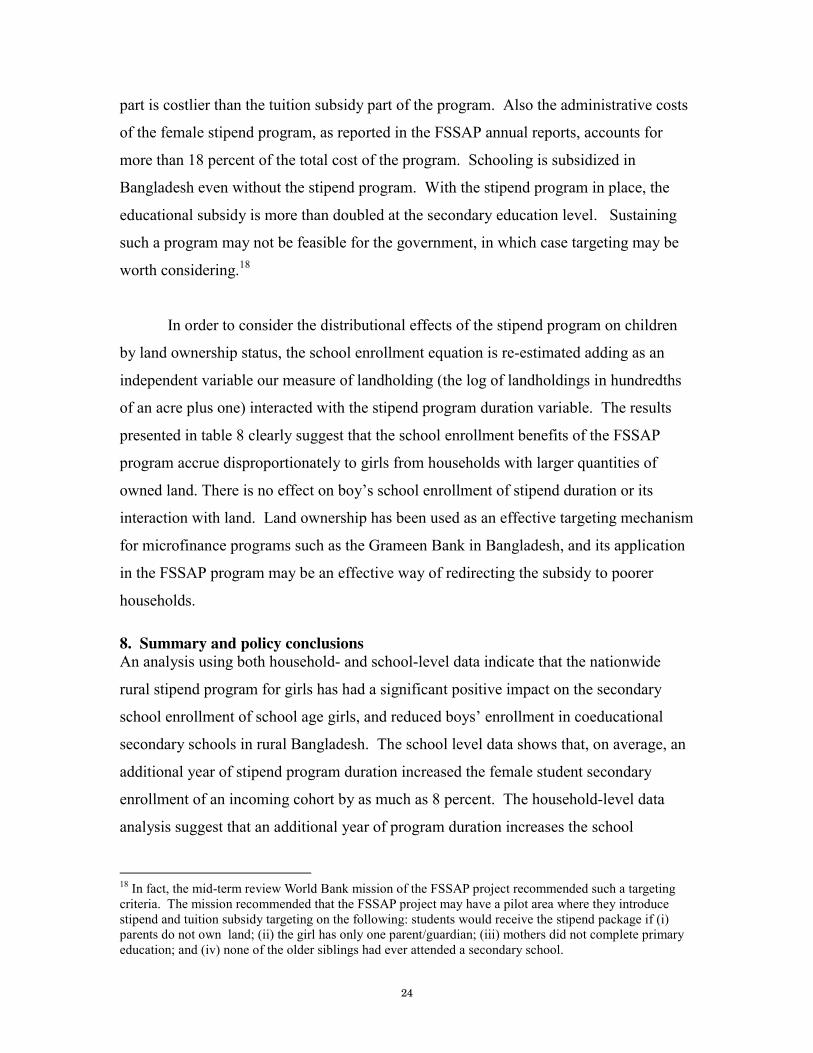
7. Targeting students with stipend: Who actually benefit the most among girls?
The female stipend program designed and implemented in Bangladesh is targeted to rural
areas and only to girls who satisfy the stated criteria. The eligibility criteria of securing
45 percent of marks, attending 75 percent of school days, and staying unmarried, may not
be strictly enforced. According to FSSAP-MIS data, only 6 percent of secondary
students have failed to obtain a stipend because they did not satisfy the criteria (World
Bank 1997). While the program has enhanced girls’ secondary schooling, cost data
shows unequivocally that the program is expensive to operate. In particular, the stipend
24
part is costlier than the tuition subsidy part of the program. Also the administrative costs
of the female stipend program, as reported in the FSSAP annual reports, accounts for
more than 18 percent of the total cost of the program. Schooling is subsidized in
Bangladesh even without the stipend program. With the stipend program in place, the
educational subsidy is more than doubled at the secondary education level. Sustaining
such a program may not be feasible for the government, in which case targeting may be
worth considering.18
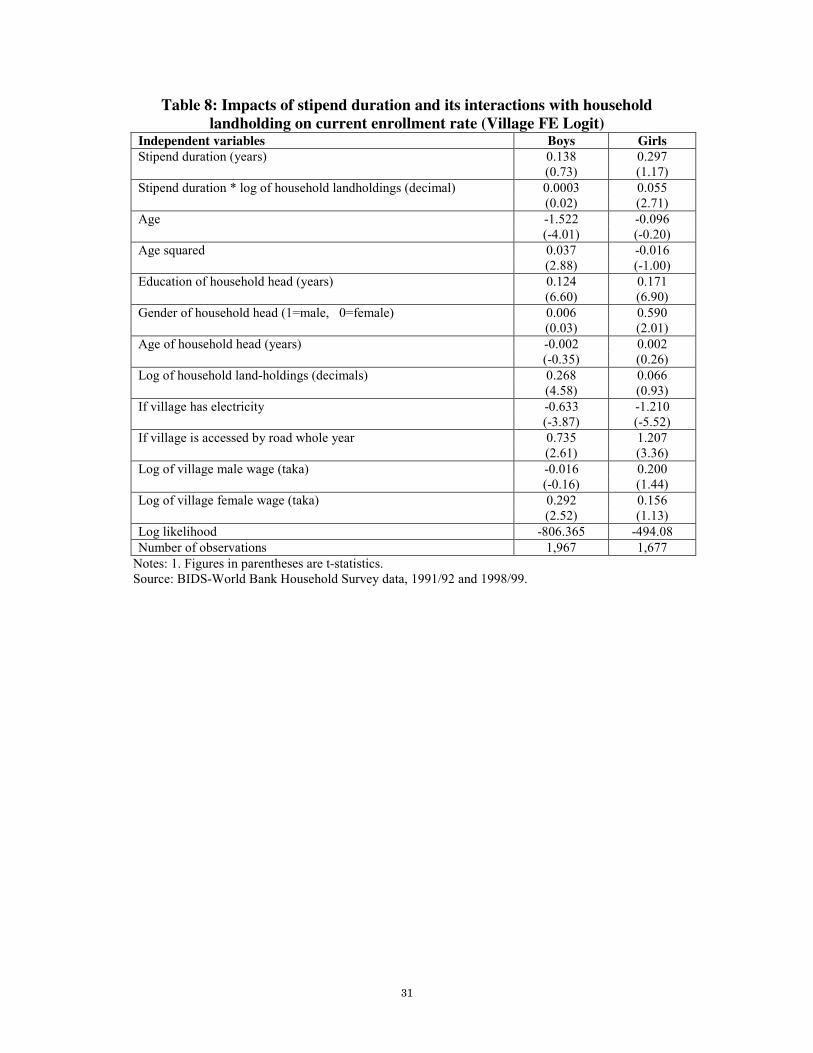
In order to consider the distributional effects of the stipend program on children
by land ownership status, the school enrollment equation is re-estimated adding as an
independent variable our measure of landholding (the log of landholdings in hundredths
of an acre plus one) interacted with the stipend program duration variable. The results
presented in table 8 clearly suggest that the school enrollment benefits of the FSSAP
program accrue disproportionately to girls from households with larger quantities of
owned land. There is no effect on boy’s school enrollment of stipend duration or its
interaction with land. Land ownership has been used as an effective targeting mechanism
for microfinance programs such as the Grameen Bank in Bangladesh, and its application
in the FSSAP program may be an effective way of redirecting the subsidy to poorer
households.
8. Summary and policy conclusions
An analysis using both household- and school-level data indicate that the nationwide
rural stipend program for girls has had a significant positive impact on the secondary
school enrollment of school age girls, and reduced boys’ enrollment in coeducational
secondary schools in rural Bangladesh. The school level data shows that, on average, an
additional year of stipend program duration increased the female student secondary
enrollment of an incoming cohort by as much as 8 percent. The household-level data
analysis suggest that an additional year of program duration increases the school
18 In fact, the mid-term review World Bank mission of the FSSAP project recommended such a targeting criteria. The mission recommended that the FSSAP project may have a pilot area where they introduce stipend and tuition subsidy targeting on the following: students would receive the stipend package if (i) parents do not own land; (ii) the girl has only one parent/guardian; (iii) mothers did not complete primary education; and (iv) none of the older siblings had ever attended a secondary school.
25
enrollment rate of girl’s aged 11-18 years by 12 percentage points, and has no discernable
effect on boy’s enrollment.
As the program is costly and requires donor support to sustain this program, a
natural question arises if the program can be targeted and if so how. One possibility is to
target the program by landholding class. Our findings indicate that the currently
untargeted stipend disproportionately effects the school enrollment of girls from
households with larger land wealth. Targeting towards the land poor may reduce the
overall enrollment gains of the program while equalizing enrollment effects across
landholding classes.
26
Table 1. Stipend and tuition rates (amount in Taka) First installment: Jan-Jun Second installation: Jul-Dec Class School
type Stipend Tuition Books Total Stipend Tuition Books Total
Annual total
Monthly stipend
Monthly tuition
Govt. 150 60 210 150 60 210 420 25 10 6
Non- Govt.
150 90 240 150 90 240 480 25 15
Govt. 180 72 252 180 72 252 504 30 12 7
Non- Govt.
180 90 270 180 90 270 540 30 15
Govt. 210 72 282 210 72 282 564 35 12 8
Non- Govt.
210 90 300 210 90 300 600 35 15
Govt. 360 90 250 700 360 90 450 1150 60 15 9
Non- Govt.
360 120 250 730 360 120 480 1210 60 20
Govt. 360 90 450 540 135 250 925 1375 60 15 10
Non- Govt.
360 120 480 540 180 250 970 1450 60 20
Source: Government of Bangladesh, Ministry of Education (1996)
Table 2. Secondary school enrollment among FSSAP schools Class 6 Class 7 Class 8 Class 9 Class 10 Class 6 Class 7 Class 8 Class 9 Class 10
Year Male Female
A. Actual enrollment 1994 128,030 102,852 89,025 76,225 69,499 124,199 87,280 74,243 55,981 44,685
1995 136,171 114,466 97,846 84,045 64,353 119,925 116,318 82,842 61,770 50,419
1996 136,034 121,821 101,793 84,788 80,334 123,719 112,314 105,879 65,026 62,466
1997 139,265 115,514 104,550 90,386 73,700 132,247 115,690 104,062 101,865 60,341
1998 140,737 117,405 98,601 91,254 74,315 152,348 128,525 108,590 104,407 90,250
B. Indexed enrollment (class 6=100)1994 100 80 70 60 54 100 70 60 45 36
1995 100 84 72 62 47 100 97 69 52 42
1996 100 90 75 62 59 100 91 86 53 50
1997 100 83 75 65 53 100 87 79 77 46
1998 100 83 70 65 53 100 84 71 69 59
Note: Total number of schools=2,764 Source: FSSAP-MIS
27
Table 3. Nationwide secondary enrollment (thousands) and its growth rate (percentage) Year Boys Girls Total
Enroll-
ment
Growth
rate
Enroll-
ment
Growth
rate
Enroll-
ment
Growth
rate
Girls
share
Rural
enroll-
ment
Urban
enroll-
ment
1961 367 -- 166 -- 533 -- 31.14 n/a n/a
1970 1205 14.12* 255 4.89* 1460 11.85* 17.47 n/a n/a
1980 1778 3.97* 627 9.41* 2405 5.12* 26.07 n/a n/a
1985 1866 0.97* 772 4.25* 2638 1.87* 29.26 n/a n/a
1986 1941 4.02 804 4.15 2745 4.06 29.29 n/a n/a
1987 2053 5.77 909 13.06 2962 7.91 30.69 n/a n/a
1988 2130 3.75 1014 11.55 3144 6.14 32.25 2192 952
1989 2293 7.65 1124 10.85 3417 8.68 32.89 2426 991
1990 2345 2.27 1180 4.98 3525 3.16 33.48 2506 1021
1991 2297 -2.05 1365 15.68 3662 3.89 37.27 2586 1076
1992 2480 7.97 1529 12.01 4009 9.48 38.14 2772 1237
1993 3017 21.65 1656 8.31 4673 16.56 35.44 3381 1293
1994 3008 -0.30 1876 13.29 4884 4.52 38.41 3485 1399
1995 3204 6.52 2327 24.04 5531 13.25 42.07 3970 1561
1996 3277 2.28 2511 7.91 5788 4.65 43.38 4182 1606
1997 3239 -1.16 2718 8.24 5957 2.92 45.63 4325 1632
*: annual average Source: Statistical Yearbook 1998
Table 4: Summary statistics of outcome variables from household survey data 1991/92 1998/99 Dependent variables
Mean No. of obs. Mean No. of obs.
Boys’ current enrollment (age 5-18) 0.516 (0.500)
1588 0.624 (0.485)
2039
Girls’ current enrollment (age 5-18) 0.464 (0.499)
1378 0.652 (0.477)
1917
Boys’ years of schooling (age 5-18) 1.911 (2.630)
1588 2.764 (2.947)
2039
Girls’ years of schooling (age 5-18) 1.702 (2.602)
1378 2.816 (2.953)
1917
Boys’ current enrollment (age 11-18) 0.471 (0.499)
765 0.579 (0.494)
1204
Girls’ current enrollment (age 11-18) 0.441 (0.497)
636 0.599 (0.490)
1050
Boys’ years of schooling (age 11-18) 3.184 (3.042)
765 4.127 (3.051)
1204
Girls’ years of schooling (age 11-18) 3.010 (3.125)
636 4.411 (2.973)
1050
Boys’ primary-to-secondary transition (age 11-18) 0.275 (0.447)
765 0.398 (0.490)
1204
Girls’ primary-to-secondary transition (age 11-18) 0.271 (0.445)
636 0.446 (0.497)
1050
Boys’ secondary level completion rate (age 11-18) 0.017 (0.131)
765 0.029 (0.167)
1204
Girls’ secondary level completion rate (age 11-18) 0.029 (0.169)
636 0.023 (0.150)
1050
Note: Figures in parentheses are standard deviations. Source: BIDS-World Bank household surveys, 1991/92 and 1998/99
28
Table 5: Summary statistics of independent variables from
household survey data Independent variables Mean
Stipend duration (years) 2.658 (2.193)
Age (years) 14.174 (2.268)
Gender (boy=1, girl=0) 0.554 (0.497)
Education of household head (years) 3.514 (3.931)
Gender of household head (Male=1, Female=0) 0.930 (0.256)
Age of household head (years) 48.209 (11.317)
Household land assets (decimals) 174.061 (414.466)
If village has electricity 0.657 (0.475)
Percentage of village land that is irrigated 0.469 (0.353)
If village is accessed by road 0.788 (0.409)
Village daily adult male wage (taka) 38.807 (18.161)
Village daily adult female wage (taka) 21.748 (12.319)
Number of observations 2,446
Note: Figures in parentheses are standard deviations. Source: BIDS-World Bank household surveys, 1991/92 and 1998/99
29
Table 6: Impacts of stipend program duration on current enrollment rate
Logit Village FE Logit:
Model 1
Village FE Logit:
Model 2
Village FE Logit:
Model 3
Age 11-18 Age 11-18 Age 13-18 Age 11-18
Boys Girls Boys Girls Boys Girls Boys Girls
Stipend duration (years) -0.055 0.056 0.139 0.557 0.152 0.808
(-0.52) (0.44) (0.80) (2.36) (0.75) (2.77)
- -
Stipend duration*log of age (years) - - - - - - 0.057 (0.89)
0.209(2.36)
Age (years) -1.555 (-4.29)
0.097 (0.22)
-1.522 (-4.02)
-0.024 (-0.05)
-1.969 (-2.45)
-1.237 (-1.15)
-1.466 (-3.84)
-0.099(-0.20)
Age squared 0.039 (3.16)
-0.02 (-1.36)
0.037 (2.88)
-0.019 (-1.14)
0.051 (1.98)
0.019 (0.55)
0.037 (2.84)
-0.018(-1.07)
Education of household head (years) 0.137 0.165 0.124 0.172 0.134 0.183 0.124 0.172
(7.91) (7.97) (6.60) (6.97) (6.51) (6.56) (6.63) (6.97)
Gender of household head (1=male, 0=female)
0.075 (0.38)
0.639 (2.47)
0.006 (0.03)
0.590 (2.01)
0.075 (0.30)
0.552 (1.57)
0.004 (0.02)
0.586(2.00)
Age of household head (years) -0.001 0.004 -0.002 0.002 0.004 0.002 -0.002 0.002
(-0.18) (0.73) (-0.35) (0.28) (0.65) (0.28) (-0.33) (0.26)
Log of household land-holdings (decimals)
0.242 0.115 0.269 0.202 0.238 0.252 0.270 0.203
(6.58) (2.67) (6.54) (3.98) (4.99) (4.22) (6.55) (3.99)
If village has electricity -0.554 -0.866 -0.633 -1.198 -0.240 -0.603 -0.646 -1.188
(-3.95) (-5.01) (-3.87) (-5.49) (-1.28) (-2.28) (-3.96) (-5.42)
0.487 1.002 0.735 1.216 0.804 0.892 0.718 1.199If village is accessed by road whole year (2.14) (3.67) (2.61) (3.40) (2.42) (2.17) (2.54) (3.35)
Log of village male wage (taka) 0.062 0.231 -0.016 0.183 -0.141 0.189 -0.015 0.193
(0.68) (2.18) (-0.16) (1.32) (-1.12) (1.12) (-0.15) (1.39)
0.270 0.109 0.293 0.164 0.359 0.273 0.292 0.165Log of village female wage (taka)
(2.88) (1.07) (2.58) (1.19) (2.67) (1.59) (2.58) (1.19)
Log likelihood -1011.23 -732.99 -806.37 -497.77 -572.94 -330.10 -805.51 -497.32
Number of observations 1,967 1,682 1,967 1,677 1,386 1,180 1,967 1,677
Note: Figures in parentheses are t-statistics. Source: BIDS-World Bank household surveys, 1991/92 and 1998/99
30
Table 7. School-level fixed-effects impacts of stipend duration on
grade-specific enrollment (class six to ten) Model 1 Model 2
Independent variables Female Male Female Male
Stipend duration (years) 0.083 -0.289 0.029 -0.390
(44.249) (-10.035) (6.492) (-10.882)
Expected future stipend duration (years) 0.034 0.032
(4.278) (2.554)
Stipend duration squared 0.012 0.089
(13.420) (4.722)
Expected future stipend duration squared 0.006
(5.371)
Adjusted R-squared 0.084 0.067 0.084 0.096
Mean and std. deviation of enrollment 34.102 (34.621)
42.318 (30.124)
Total number of observations 89,861 79,559 89,861 79,559
Note: In addition above variables, the regressions include these explanatory variables: year and its square, class and its square, whether the school has tube well, drinking water, and latrine. Source: FSSAP-MIS data
31
Table 8: Impacts of stipend duration and its interactions with household
landholding on current enrollment rate (Village FE Logit) Independent variables Boys Girls
Stipend duration (years) 0.138 0.297 (0.73) (1.17)
Stipend duration * log of household landholdings (decimal) 0.0003 0.055 (0.02) (2.71)
Age -1.522 -0.096 (-4.01) (-0.20)
Age squared 0.037 -0.016 (2.88) (-1.00)
Education of household head (years) 0.124 0.171 (6.60) (6.90)
Gender of household head (1=male, 0=female) 0.006 (0.03)
0.590 (2.01)
Age of household head (years) -0.002 0.002 (-0.35) (0.26)
Log of household land-holdings (decimals) 0.268 0.066 (4.58) (0.93)
If village has electricity -0.633 -1.210 (-3.87) (-5.52)
If village is accessed by road whole year 0.735 1.207 (2.61) (3.36)
Log of village male wage (taka) -0.016 0.200 (-0.16) (1.44)
Log of village female wage (taka) 0.292 0.156 (2.52) (1.13)
Log likelihood -806.365 -494.08
Number of observations 1,967 1,677
Notes: 1. Figures in parentheses are t-statistics. Source: BIDS-World Bank Household Survey data, 1991/92 and 1998/99.
32
References
Bangladesh Bureau of Statistics. 1998. Statistical Yearbook of Bangladesh 1997. Dollar, David, and Roberta Gatti. 1999. “Gender Inequality, Income, and Growth: Are
Good Times Good for Women?” Policy Research Report on Gender and Development, Working Paper Series 1, World Bank, Washington, DC.
Government of Bangladesh, Ministry of Education. 1996. Stipend Operation Manual for
Nationwide Female Stipend Program. Heckman, James J. 1981. "The Incidental Parameters Problem and the Problem of Initial
Conditions in Estimating a Discrete Time-Discrete Data Stochastic Process." In C. F. Manski and D. McFadden, ed., Structural Analysis of Discrete Data with
Econometric Applications. Cambridge, Mass.: MIT Press: 178-195. Herz, Barbara K. and others. 1991. “Letting girls learn : promising approaches in primary
and secondary education.” World Bank, Washington, DC. Khandker, Shahidur R., and Hussain A. Samad. 1995. “Education Achievements and
School Efficiency in Rural Bangladesh.” Bangladesh Development Studies 23 (1 & 2).
Kim, Jooseop, Harold Alderman, Peter F. Orazem. 1999. “Can private school subsidies
increase enrollment for the poor? The Quetta Urban Fellowship Program.” World
Bank Economic Review 13 (3): 443-65. King, Elizabeth M. and Ann M. Hill, eds. 1993. Women's education in developing
countries : barriers, benefits, and policies. Baltimore, MD: Johns Hopkins University Press.
King, Elizabeth M., Peter F. Orazem, and Darin Wohlgemuth. 1999. “Central mandates
and local incentives: the Colombia education voucher program.” World Bank
Economic Review (International) 13 (3): 467-91. Mannan, M. A. 1988. “Preference for son, desire for additional children and
contraceptive use in Bangladesh.” Bangladesh Development Studies 16 (September): 31-55.
Ravallion, Martin, and Quentin Wodon, 2000, "Does Child Labor Displace Schooling?
Evidence on Behavioral Responses to An Enrollment Subsidy", Economic
Journal, 110:158-175. Schultz, Paul T. 1987. Education investments and returns in economic development. Yale
University. Economic Growth Center. Discussion Paper 528: 1-115.

33
The World Bank. 1992a. World Development Report 1992. New York: Oxford
University Press. ______. 1992b. “Bangladesh Female Secondary School Assistance Project.” Staff
Appraisal Report. ______. 1997. “Bangladesh Female Secondary School Assistance Project.” Mid-term
Review Report. ______. 2000. World Development Report 2000/2001. New York: Oxford University
Press.