subgrain texture evolution during biaxial deformation in … · 2010-04-19 · figure 1 biaxial...
TRANSCRIPT
Subgrain Texture Evolution during Biaxial Deformation in Interstitial Free and Dual Phase Steels
H. N. Han1,2, S.-B. Lee2, A. D. Rollett2, D. H. Kim1, K. H. Oh1 and R. A. Lebensohn3 1 Department of Materials Science and Engineering, Seoul National University, Seoul 151-744, Korea 2 Department of Materials Science and Engineering, Carnegie-Mellon University, Pittsburgh, PA 15213, USA 3 Materials Science and Technology Division, Los Alamos National Laboratory, Los Alamos, NM 87544, USA Keywords: Biaxial Deformation, FFT, texture, IF steel, DP steel, local orientation
Abstract
A fast Fourier transform (FFT) based full-field formulation for viscoplastic polycrystals was applied to the analysis of subgrain texture evolution in both interstitial free (IF) and dual phase (DP) steels during biaxial deformation. An image measured by electron back-scattering diffraction (EBSD)-based orientation imaging microscopy (OIM) was used as an input microstructure after the construction to a 3-dimensional unit cell as a columnar structure. Changes in local orientation were measured by the EBSD-based OIM with a biaxial stretching device specially designed for this study. The average orientations and local misorientations of grains predicted by the FFT-based simulations were compared with the experimental data. The deformation behavior and texture evolution in IF and DP during biaxial forming steels were compared with each other.
Introduction
It is well known that the mechanical properties of materials are a function of their microstructural parameters. Many numerical approaches for the prediction of the mechanical behavior of plastically deforming polycrystalline materials have been proposed, based on microstructure-property linking methods including mean-field approaches [1-3]. Especially, the crystal plasticity finite element method (CP-FEM) has been applied to solve the micromechanical fields that develop inside grains of polycrystals with a particular microstructure during the plastic deformation [4-10]. However, the difficulties related to meshing and the large number of degrees of freedom required may limit the complexity and the size of the microstructures in FE calculation.
As a very efficient alternative method to obtain the full-field solutions for the deformation of polycrystalline materials, a fast numerical method using the Fast Fourier Transform (FFT) algorithm was proposed by Moulinec and Suquet [11, 12] for calculating the mechanical properties of two-dimensional materials by using the pixel-based microstructural
989
Materials Science and Technology (MS&T) 2009October 25-29, 2009, Pittsburgh, Pennsylvania • Copyright © 2009 MS&T’09®
Electron Backscattered Diffraction Analysis of Steels
data. While they calculated the linear and non-linear behavior of two-phase isotropic composites, Lebensohn et. al [13, 14] applied their scheme to calculate the local response of the anisotropic polycrystals in the context of viscoplasticity.
Owing to the image-processing technique, this FFT formulation is particularly suitable for use with direct input from actual images of the material, e.g. optical or scanning electron microscopy (SEM) images that show the phase distribution in the case of composites [12], or orientation images in the case of polycrystals. Here, a quantitative analysis of the pixel-based orientations and intragranular misorientations was performed for interstitial free (IF) and dual phase (DP) steels biaxially deformed. In addition to this numerical analysis, here, the microstructual changes in both steels were experimentally measured by the electron back-scattering diffraction (EBSD)-based orientation imaging microscopy (OIM) with a biaxial stretching device specially designed. We compared experimental data on the reorientation of individual grains and the development of intragranular misorientations with corresponding simulations. �
Experimental
The materials used in this study are IF and DP steels, whose chemical compositions were listed at Table 1. While IF steel is single ferrite phase, DP steel consists of the soft ferrite and the hard martensite. The volume fraction of the martensite in DP steel was measured as about 7.2%. The grain sizes of ferrite in IF and DP steels were 21.4μm and 10.2μm, respectively.
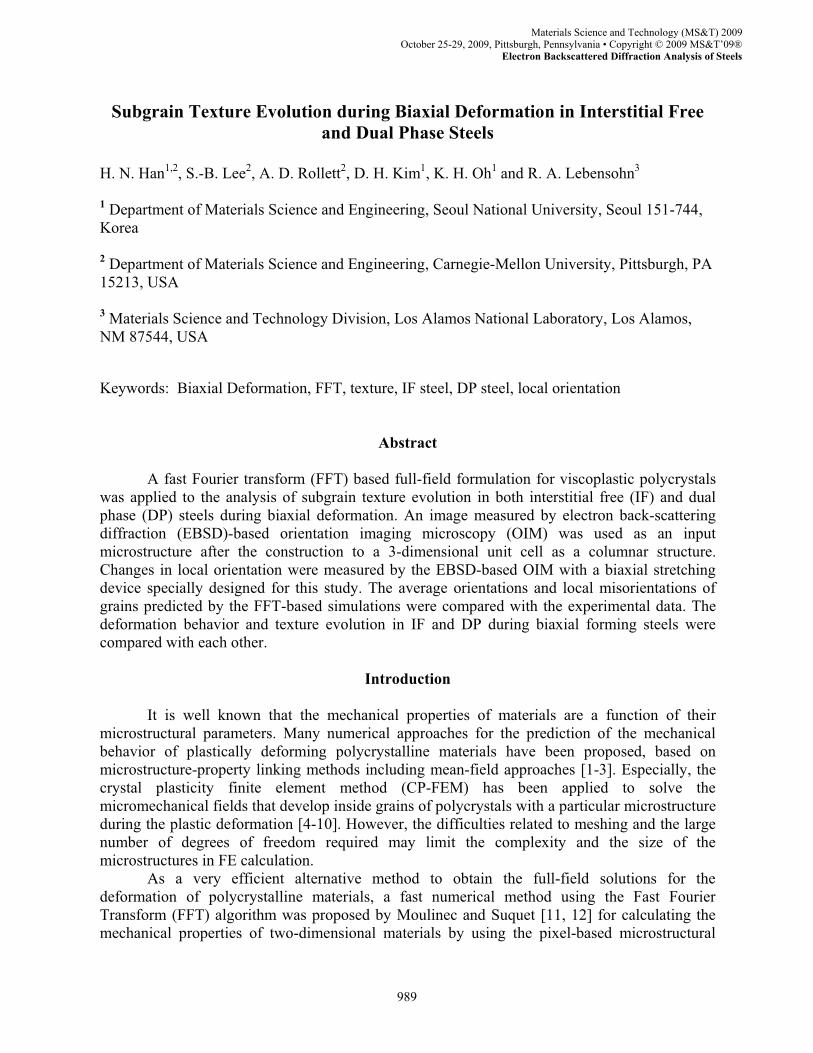
A new experimental setting was developed to perform biaxial tensile tests of both steel specimens, as shown in Fig. 1. The mechanical device was designed to develop equi-biaxial tension at the center-top part of the specimen, as the top part of screw rotates up. The hemisphere-shaped cap was used to minimize the frictional stress between the specimen and the screw. A disk-shaped specimen with a diameter of 16mm was prepared by a wire cutting method as shown in Fig. 1 (a). The specimen was mechanically polished down to the thickness of 300μm by using the diamond suspension. Then, a final surface polishing by colloidal silica was conducted for the measurement of high quality Electron Back-Scattered Pattern (EBSP).
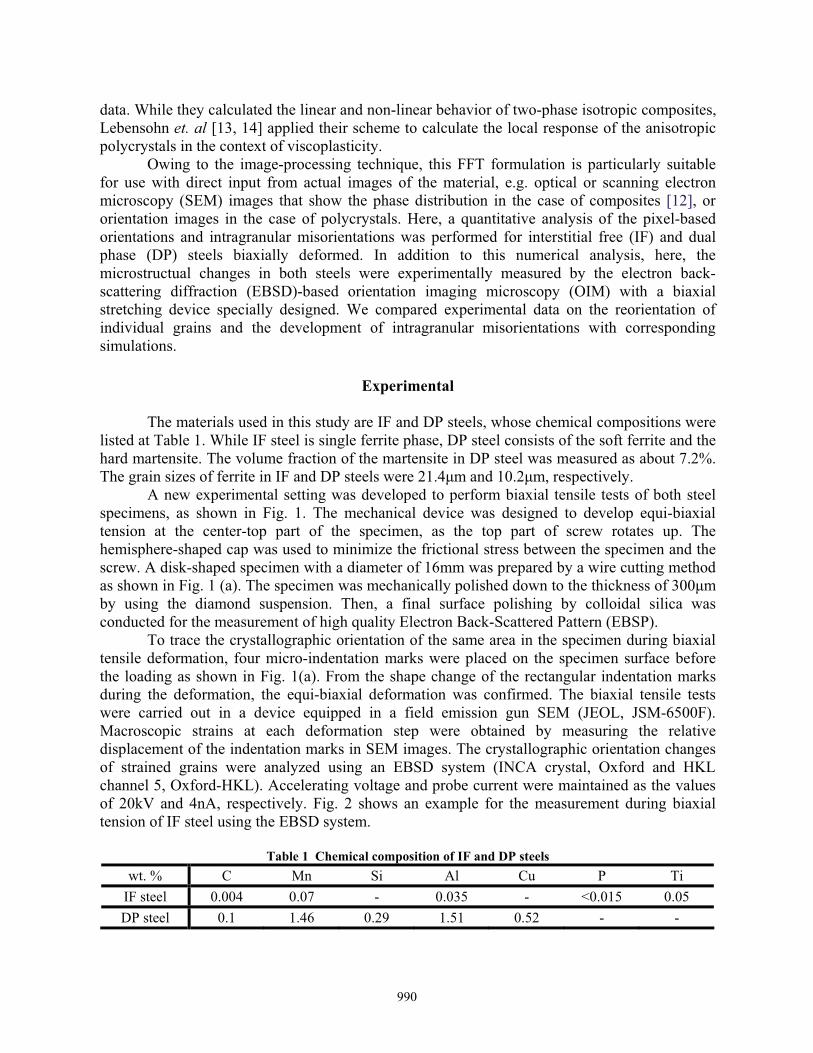
To trace the crystallographic orientation of the same area in the specimen during biaxial tensile deformation, four micro-indentation marks were placed on the specimen surface before the loading as shown in Fig. 1(a). From the shape change of the rectangular indentation marks during the deformation, the equi-biaxial deformation was confirmed. The biaxial tensile tests were carried out in a device equipped in a field emission gun SEM (JEOL, JSM-6500F). Macroscopic strains at each deformation step were obtained by measuring the relative displacement of the indentation marks in SEM images. The crystallographic orientation changes of strained grains were analyzed using an EBSD system (INCA crystal, Oxford and HKL channel 5, Oxford-HKL). Accelerating voltage and probe current were maintained as the values of 20kV and 4nA, respectively. Fig. 2 shows an example for the measurement during biaxial tension of IF steel using the EBSD system.
Table 1 Chemical composition of IF and DP steels
wt. % C Mn Si Al Cu P Ti IF steel 0.004 0.07 - 0.035 - <0.015 0.05 DP steel 0.1 1.46 0.29 1.51 0.52 - -
990
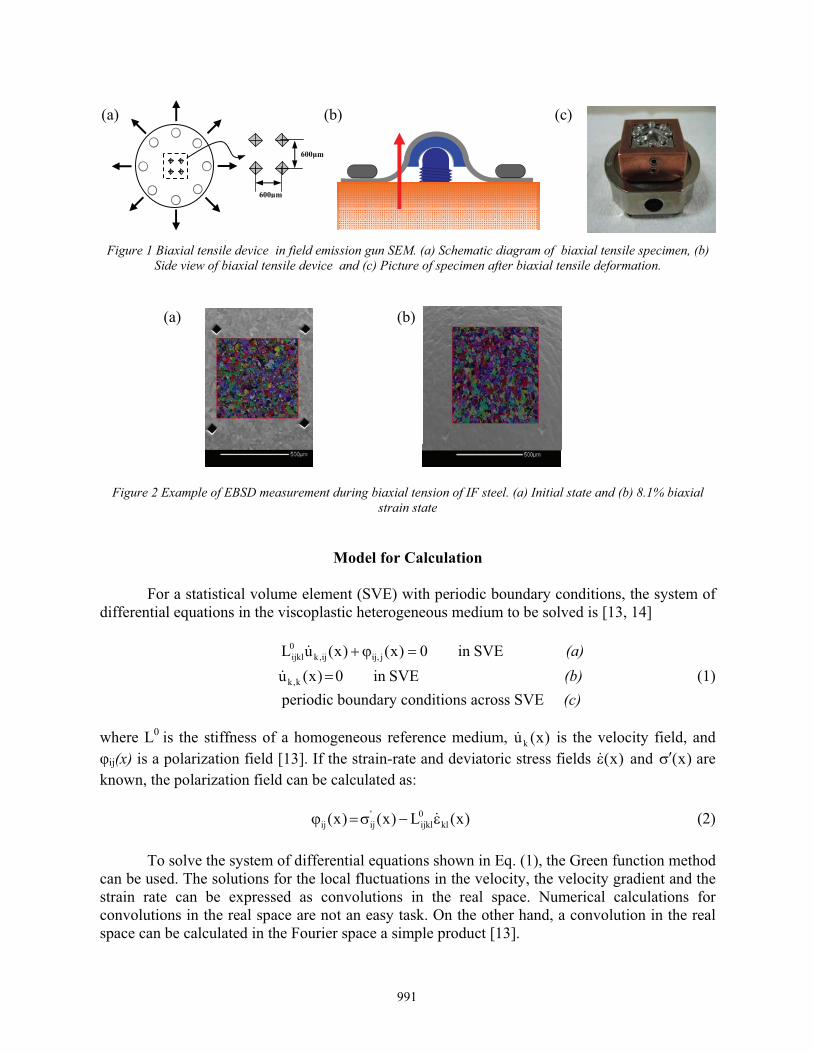
Figure 1 Biaxial tensile device in field emission gun SEM. (a) Schematic diagram of biaxial tensile specimen, (b)
Side view of biaxial tensile device and (c) Picture of specimen after biaxial tensile deformation.
Figure 2 Example of EBSD measurement during biaxial tension of IF steel. (a) Initial state and (b) 8.1% biaxial strain state
Model for Calculation For a statistical volume element (SVE) with periodic boundary conditions, the system of
differential equations in the viscoplastic heterogeneous medium to be solved is [13, 14]
SVEin0)x()x(uL j,ijij,k0ijkl ���� (a)
SVEin0)x(u k,k �� (b) (1) periodic boundary conditions across SVE (c)
where L0 is the stiffness of a homogeneous reference medium, )x(uk� is the velocity field, and �ij(x) is a polarization field [13]. If the strain-rate and deviatoric stress fields )x(�� and )x(�� are known, the polarization field can be calculated as:
)x(L)x()x( kl0ijkl
'ijij ����� � (2)
To solve the system of differential equations shown in Eq. (1), the Green function method
can be used. The solutions for the local fluctuations in the velocity, the velocity gradient and the strain rate can be expressed as convolutions in the real space. Numerical calculations for convolutions in the real space are not an easy task. On the other hand, a convolution in the real space can be calculated in the Fourier space a simple product [13].
(b) (c) (a)
600μm
600μm
(a) (b)
991
The perturbation stress field at each Fourier point cannot be determined unless the stress and strain-rate fields in Eq. (2) are known. This requires an iterative method with an initially specified strain rate. Once the initial strain rate field is given, the deviatoric stress tensor can be obtained by solving the following constitutive equation:
)x(:)x(msgn)x(/)x(:)x(m)x(m)x( 's
s
n
c'ss
0 ���� �� ��� (3)
where ms(x) is the Schmid tensor for a specific slip system s, �c(x) is the critical resolved stress as a threshold stress signifying the hardening of the material at local position x, and 0 � is a normalization factor. n is a rate-sensitivity exponent. In this work, n = 10 was used. As a hardening law of the material, we used here an extended Voce law [15], characterized by an evolution of the critical stress with accumulated shear strain. An iterative procedure based on augmented Lagrangians [16] was applied.
Neglecting the velocity fluctuation term, the updated coordinates of the Fourier points were obtained from the average velocity term. In this way, the Fourier grid remains regular after each deformation increment. The distances between adjacent Fourier points, however, do change, following the variations of the unit cell dimensions, thus determining an average stretching of the grains, following the macroscopic deformation.
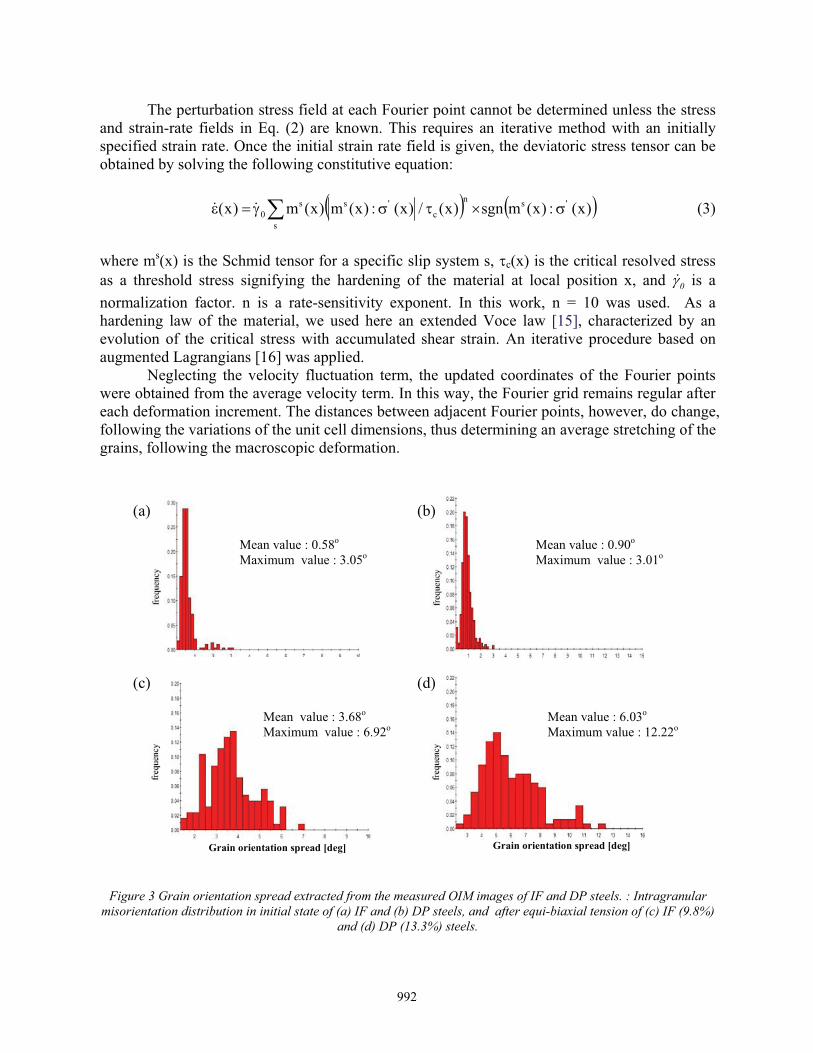
Figure 3 Grain orientation spread extracted from the measured OIM images of IF and DP steels. : Intragranular
misorientation distribution in initial state of (a) IF and (b) DP steels, and after equi-biaxial tension of (c) IF (9.8%) and (d) DP (13.3%) steels.
Grain orientation spread [deg] Grain orientation spread [deg]
(a) (b)
(c) (d)
Mean value : 0.58o Maximum value : 3.05o
Mean value : 3.68o Maximum value : 6.92o
Mean value : 0.90o Maximum value : 3.01o
Mean value : 6.03o Maximum value : 12.22o
992
Results and Discussion
By the EBSD-based OIM, the local orientations were measured in an area of about 600 � 600 �m, located in the rectangular indentation marks at the center-top part of the specimen. The spatial resolution (given by the distance between two consecutive pixels) was about 1�m in each direction. The OIM software gives the intragranular misorientation distribution (grain orientation spread) for every identified grain. Figs. 3 (a) and (b) show the misorientation distributions of IF and DP steels before the deformation, respectively. At the initial stage, the mean value of the misorientation per grain in the DP steel is slightly larger than that in IF steel. This may be related to the volume expansion associated with the martensitic transformation. After 9.8% (IF) and 13.3% (DP) biaxial strains, the mean values reached 3.68o (IF) and 6.03o (DP) as shown in Figs. 3 (c) and (d).
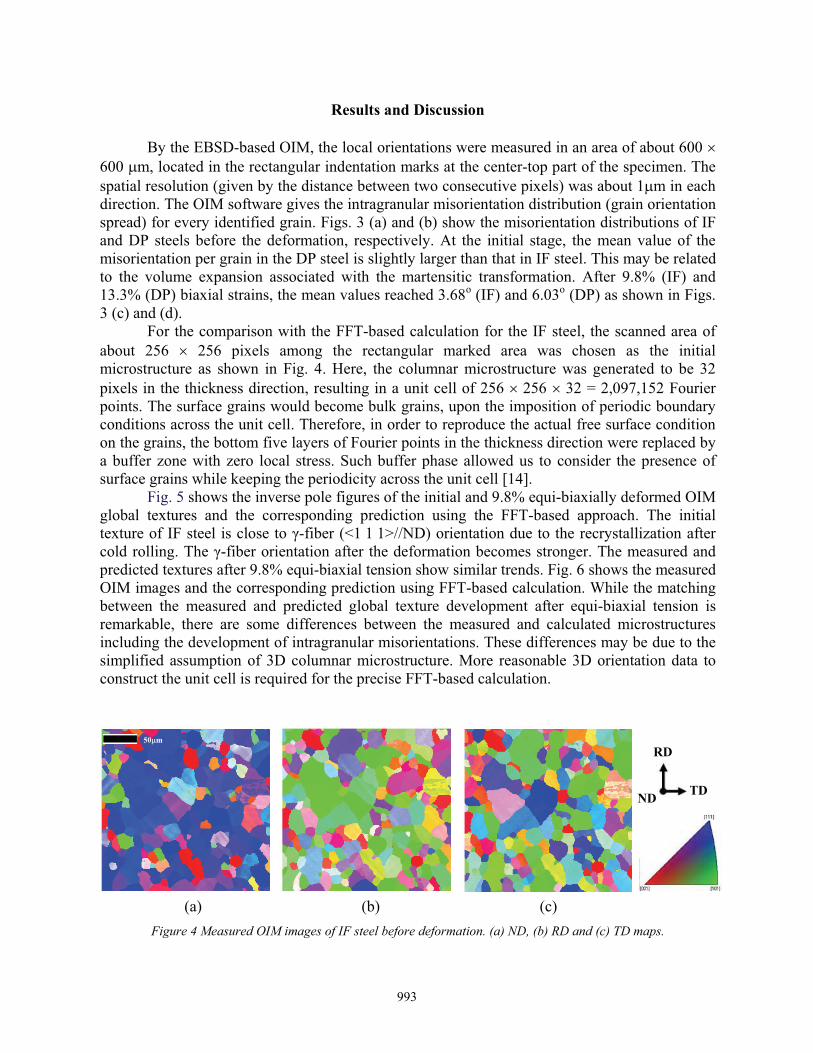
For the comparison with the FFT-based calculation for the IF steel, the scanned area of about 256 � 256 pixels among the rectangular marked area was chosen as the initial microstructure as shown in Fig. 4. Here, the columnar microstructure was generated to be 32 pixels in the thickness direction, resulting in a unit cell of 256 � 256 � 32 = 2,097,152 Fourier points. The surface grains would become bulk grains, upon the imposition of periodic boundary conditions across the unit cell. Therefore, in order to reproduce the actual free surface condition on the grains, the bottom five layers of Fourier points in the thickness direction were replaced by a buffer zone with zero local stress. Such buffer phase allowed us to consider the presence of surface grains while keeping the periodicity across the unit cell [14].
Fig. 5 shows the inverse pole figures of the initial and 9.8% equi-biaxially deformed OIM global textures and the corresponding prediction using the FFT-based approach. The initial texture of IF steel is close to �-fiber (<1 1 1>//ND) orientation due to the recrystallization after cold rolling. The �-fiber orientation after the deformation becomes stronger. The measured and predicted textures after 9.8% equi-biaxial tension show similar trends. Fig. 6 shows the measured OIM images and the corresponding prediction using FFT-based calculation. While the matching between the measured and predicted global texture development after equi-biaxial tension is remarkable, there are some differences between the measured and calculated microstructures including the development of intragranular misorientations. These differences may be due to the simplified assumption of 3D columnar microstructure. More reasonable 3D orientation data to construct the unit cell is required for the precise FFT-based calculation.
Figure 4 Measured OIM images of IF steel before deformation. (a) ND, (b) RD and (c) TD maps.
50�m
TD
RD
ND
(a) (b) (c)
993
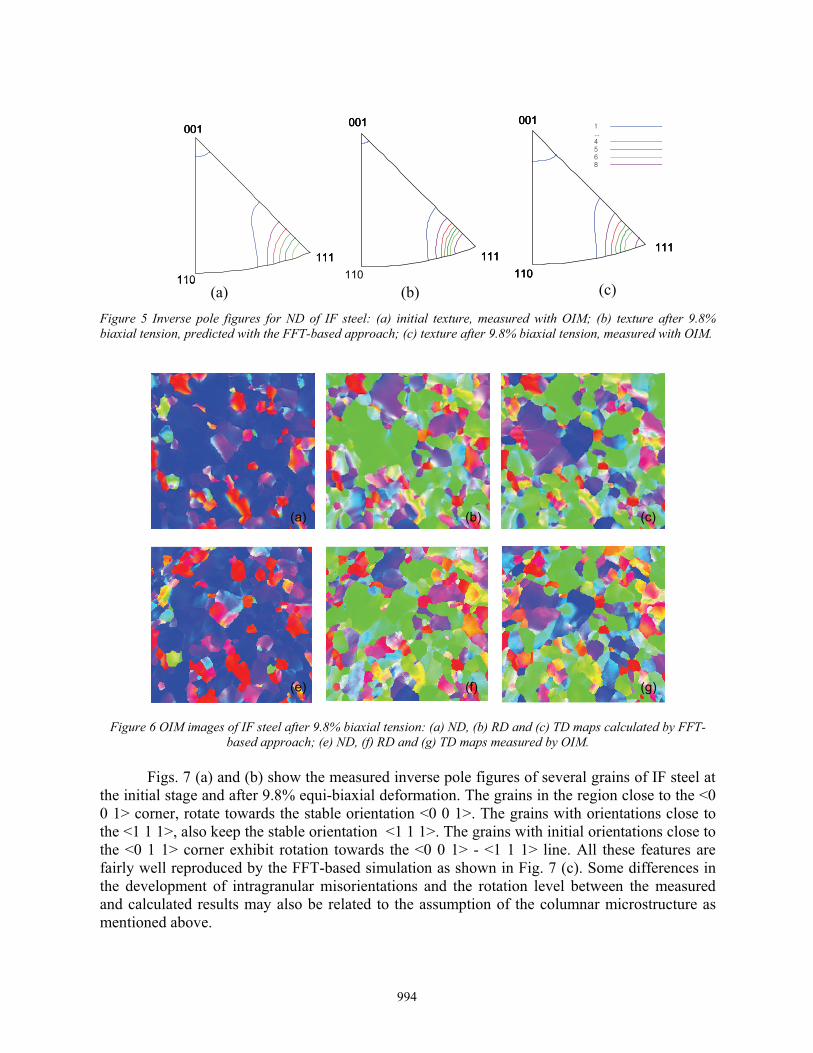
Figure 5 Inverse pole figures for ND of IF steel: (a) initial texture, measured with OIM; (b) texture after 9.8% biaxial tension, predicted with the FFT-based approach; (c) texture after 9.8% biaxial tension, measured with OIM.
Figure 6 OIM images of IF steel after 9.8% biaxial tension: (a) ND, (b) RD and (c) TD maps calculated by FFT-
based approach; (e) ND, (f) RD and (g) TD maps measured by OIM. Figs. 7 (a) and (b) show the measured inverse pole figures of several grains of IF steel at
the initial stage and after 9.8% equi-biaxial deformation. The grains in the region close to the <0 0 1> corner, rotate towards the stable orientation <0 0 1>. The grains with orientations close to the <1 1 1>, also keep the stable orientation <1 1 1>. The grains with initial orientations close to the <0 1 1> corner exhibit rotation towards the <0 0 1> - <1 1 1> line. All these features are fairly well reproduced by the FFT-based simulation as shown in Fig. 7 (c). Some differences in the development of intragranular misorientations and the rotation level between the measured and calculated results may also be related to the assumption of the columnar microstructure as mentioned above.
111
001
110
001
110
111
��������
111
001
110
111
001
110
111
001
110
001
110
111
001
110
111
��������
111
001
110111
001
110
(a) (b) (c)
(a) (b) (c)
(e) (f) (g)
(a) (b) (c)
(e) (f) (g)
994
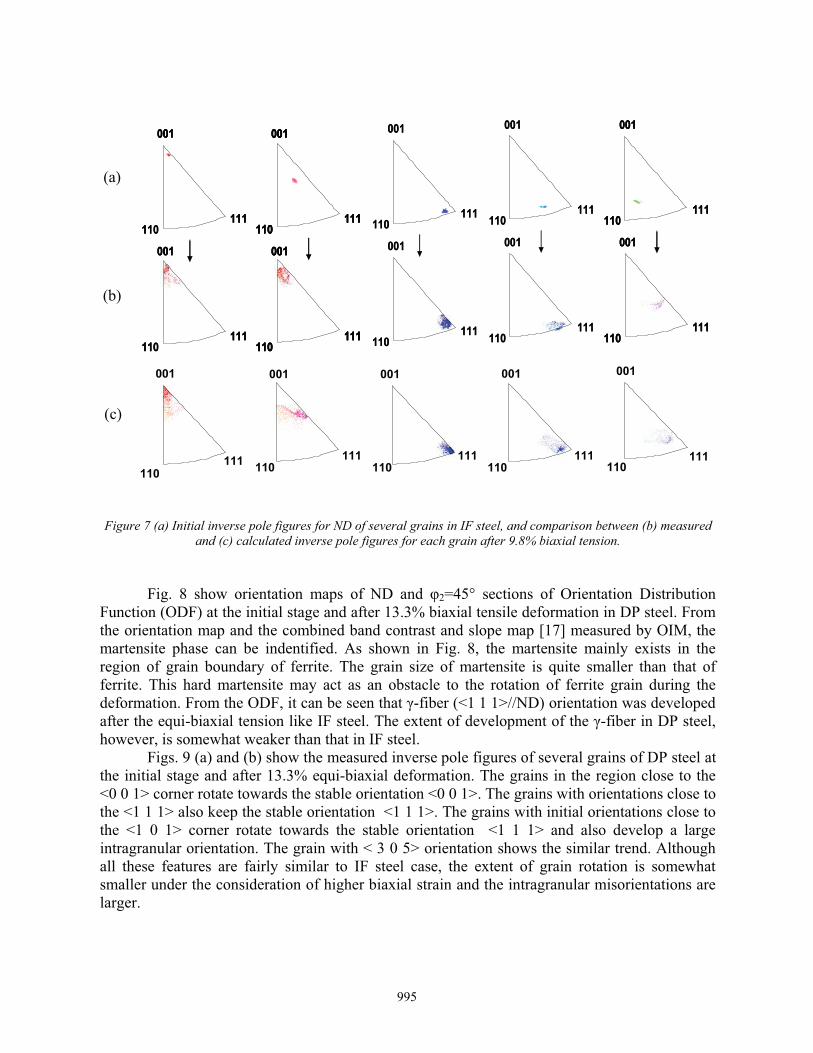
Figure 7 (a) Initial inverse pole figures for ND of several grains in IF steel, and comparison between (b) measured and (c) calculated inverse pole figures for each grain after 9.8% biaxial tension.
Fig. 8 show orientation maps of ND and �2=45° sections of Orientation Distribution
Function (ODF) at the initial stage and after 13.3% biaxial tensile deformation in DP steel. From the orientation map and the combined band contrast and slope map [17] measured by OIM, the martensite phase can be indentified. As shown in Fig. 8, the martensite mainly exists in the region of grain boundary of ferrite. The grain size of martensite is quite smaller than that of ferrite. This hard martensite may act as an obstacle to the rotation of ferrite grain during the deformation. From the ODF, it can be seen that �-fiber (<1 1 1>//ND) orientation was developed after the equi-biaxial tension like IF steel. The extent of development of the �-fiber in DP steel, however, is somewhat weaker than that in IF steel.
Figs. 9 (a) and (b) show the measured inverse pole figures of several grains of DP steel at the initial stage and after 13.3% equi-biaxial deformation. The grains in the region close to the <0 0 1> corner rotate towards the stable orientation <0 0 1>. The grains with orientations close to the <1 1 1> also keep the stable orientation <1 1 1>. The grains with initial orientations close to the <1 0 1> corner rotate towards the stable orientation <1 1 1> and also develop a large intragranular orientation. The grain with < 3 0 5> orientation shows the similar trend. Although all these features are fairly similar to IF steel case, the extent of grain rotation is somewhat smaller under the consideration of higher biaxial strain and the intragranular misorientations are larger.
(b)
(c)
(a)
� 001
110111
001
110111
001
110111
001
110111
001
110111
001
110111
001
110111
001
110111
001
110111
001
110111
001
110111
001
110111
001
110111
001
110111
001
110111
001
110111
001
110111
001
110111
001
110111
001
110111
001
110111
001
110111
001
110111
001
110111
001
110111
001
110111
001
110111
001
110111
001�
110�111
001�
110� 111
001
110111
001
110111�
001�
110� 111
995
Figure 8 ND maps and �2=45° sections of ODF measured by OIM (a) at initial state and (b) after 13.3% biaxial
tension of DP steel
Figure 9 Measured inverse pole figures for ND of several grains in DP steel : (a) initial state and (b) after 13.3% biaxial tension.
Summary An FFT-based full-field formulation for viscoplastic polycrystals was applied to the study
of the subgrain texture evolution in a IF steel under biaxial tension. Direct initial input for the calculation was obtained from OIM images. Changes in local orientation were measured by the EBSD-based OIM with a biaxial stretching device specially designed. In the calculation, the columnar microstructure was assumed for the 3D microstructure and the presence of a free
20�m 20�m
(a) (b)
001
110111
001
110111
001
110111
001
110111
001
110111
001
110111
001
110111
001
110111
001
110111
001
110111
001
110111
001
110111
001
110111
001
110111
001
110111
001
110111
001
110111
001
110111
001
110111
001
110111
001
110111
001
110111
001
110111
001
110111
001
110111
001
110111
001
110111
001
110111
001
110111
001
110111
001
110111
001
110111
001
110111
001
110111
001
110111
001
110111
001
110111
001
110111
001
110111
001
110111
(b)
(a)
996
surface was considered. The orientation changes of several grains after equi-biaxial tensile deformation, predicted with the FFT-based approach, were directly compared with OIM measurements. The experimental data and the predictions showed reasonable agreement. It was observed, however, that there were some differences between the measured and calculated microstructures including the development of intragranular misorientations. These differences might be deduced from the assumption of the simple 3D columnar microstructure. Therefore, more reasonable 3D orientation data to construct the unit cell should be required for the precise calculation. It could be seen that �-fiber (<1 1 1>//ND) orientation was developed after the equi-biaxial tension in both IF and DP steels. In DP steel case, the extent of grain rotation is somewhat smaller and the orientation difference between the pixels in a grain is larger after deformation.
Acknowledgement
This work was supported by the Korea Science and Engineering Foundation (KOSEF) grant funded by the Korea government (MOST) (R0A-2007-000-10014-0) and (MOST, No. R01-2007-000-10032-0)
References [1] Y. Liu, and P. P. Castaneda, Second-order Theory for the Effective Behavior and Field Fluctuations in Viscoplastic Polycrystals, J. Mech. Phys. Solids, Vol 52, 2004, p 467-495 [2] R. A. Lebensohn, Y. Liu, and P. P. Castaneda, On the Accuracy of the Self-consistent Approximation for Polycrystals: Comparison with Full-field Numerical Simulations, Acta Mater., Vol 52, 2004, p 5347-5361 [3] R. A. Lebensohn, C. N. Tome´, and P. P. Castaneda, Self-consistent Modelling of the Mechanical Behaviour of Viscoplastic Polycrystals incorporating Intragranular Field Fluctuations, Philos. Mag., Vol 87, (No. 28), 2007, p 4287-4322 [4] R. Becker, Ananysis of Texture Evolution in Channel Die Compression-I. Effects of Grain Interaction, Acta Metall. Mater., Vol 39, 1991, p 1211-1230 [5] D. P. Mika, and P. R. Dawson, Effects of Grain Interaction on Deformation in Polycrystals, Mater. Sci. Eng. A, Vol 257, 1998, p 62-76 [6] F. Delaire, J. L. Raphanel, and C. Rey, Plastic Heterogeneities of a Copper Multicrystal Deformed in Uniaxial Tension: Experimental Study and Finite Element Simulations, Acta Mater., Vol 48, 2000, p 1075-1087 [7] D. Raabe, M. Sachtleber, Z. Zhao, F. Roters, and S. Zaefferer, Micromechanical and Macromechanical Effects in Grain Scale Polycrystal Plasticity Experimentation and Simulation, Acta Mater., Vol 49, 2001, p 3433-3441 [8] A. Bhattacharyya, E. El-Danaf, S. R. Kalidindi, and R. D. Doherty, Evolution of Grain-scale Microstructure during Large Strain Simple Compression of Polycrystalline Aluminum with Quasi-columnar Grains: OIM Measurements and Numerical Simulations, Int. J. Plasticity, Vol 17, 2001, p 861-883 [9] K. -S. Cheong, and E. P. Busso, Discrete Dislocation Density Modelling of Single Phase FCC Polycrystal Aggregates, Acta Mater., Vol 52, 2004, p 5665-5675 [10] A. Musienko, A. Tatschl, K. Schmidegg, O. Kolednik, R. Pippan, and G. Cailletaud, Three-Dimensional Finite Element Simulation of a Polycrystalline Copper Specimen, Acta Mater., Vol
997
55, 2007, p 4121-4136 [11] H. Moulinec and P. Suquet, A Fast Numerical Method for Computing the Linear and Nonlinear Mechanical Properties of Composites, C. R. Acad. Sci. Paris Ser. II, Vol 318, 1994, p 1417-1423 [12] H. Moulinec and P. Suquet, A Numerical Method for Computing the Overall Response of Nonlinear Composites with Complex Microstructure, Comput. Methods Appl. Mech. Eng., Vol 157, 1998, p 69-94 [13] R.A. Lebensohn, N-site Modeling of a 3D Viscoplastic Polycrystal using Fast Fourier Transform, Acta Mater., Vol 49, 2001, p 2723- [14] R.A. Lebensohn, R. Brenner, O. Castelnau and A.D. Rollett, Orientation Image-based Micromechanical Modeling of Subgrain Texture Evolution in Polycrystalline Copper, Acta Mater., Vol 56, 2008, p 3914-3926 [15] C. Tome´, G. R. Canova, U. F. Kocks, N. Christodoulou, and J. J. Jonas, The Relation between Macroscopic and Microscopic Strain Hardening in F.C.C. Polycrystals, Acta Metall., Vol 32, 1984, p 1637-1653 [16] J. C. Michel, H. Moulinec, and P. Suquet, A Computational Method based on Augmented Lagrangians and Fast Fourier Transforms for Composites with High Contrast, Comput. Model. Eng. Sci., Vol 1, 2000, p 79-88 [17] H. -C. Lee, K. H. Oh, Y. -W. Kim, H. N. Han, J. Y. Kang, S. I. Baek, D. H. Kim, T. -H. Ahn, Quantitative Characterization of Phase Volume Fraction by EBSD Technique, Technical Report of POSCO Research Institute, 2007.
998