study on the drivers of over-indebtedness of microfinance ...uuid:2982b1e3... · study on the...
TRANSCRIPT
Study on the Drivers of Over-Indebtedness of Microfinance Borrowers in Cambodia: An In-depth
Investigation of Saturated Areas
Final Report
Dannet Liv Cambodia Institute of Development Study
March 2013
Study on the Drivers of Over-Indebtedness of Microfinance Borrowers in Cambodia 2
DISCLAIMER.
By consulting the Study, the user agrees to the following terms and conditions of use
and agrees to use the information only for its intended manner and purpose of use. -
Intellectual property rights. The user acknowledges that all information provided in
the Study remains the property of the Financing Partners1 and that this information
and data are copyright protected. All rights to trademarks, trade names, copyrights,
patents and other intellectual property rights in the information in the Study remain
reserved to the Financing Partners and they cannot be used without the prior written
consent of the latter. The Study and its content may in no way whatsoever—neither
partially nor entirely—be made public, copied, updated, changed, reproduced,
reissued, forwarded or distributed without the prior written consent of the Financing
Partners, except to enable displaying (by downloading, forwarding or copying) solely
for a personal, non-commercial private use and not for resale or distribution to
anyone else. - No investment advice. The Study does not include any investment
advice, nor is it a solicitation or a sale of financial instruments. - Liability. Neither the
Financing Partners, nor CIDS 2 can guarantee the correctness, completeness,
suitability, or topicality of the information. The Financing Partners and CIDS cannot
be held accountable for any liability for any loss or damage arising, whether direct or
indirect, caused by any errors or mistakes, and cannot be held responsible for any
decision or action the user may take based on the provided information. The same is
true for the parent companies, associated entities, directors, employees or
representatives of the Financing Partners and CIDS.
1 Financing Partners: Blue Orchard Finance, Oikocredit and Incofin Investment Management
2 CIDS: Cambodian Institute of Development Study.
Study on the Drivers of Over-Indebtedness of Microfinance Borrowers in Cambodia 3
Table of Contents Acronyms ................................................................................................................... 6 Acknowledgements .................................................................................................... 7 Foreword .................................................................................................................... 8 Abstract .................................................................................................................... 10 Executive Summary ................................................................................................. 11 1. Rationale ........................................................................................................... 19 2. Objectives .......................................................................................................... 20 3. Methodology ...................................................................................................... 21
3.1. Definitions and Measurements of OID ......................................... 21 3.2. Research Process ....................................................................... 23
3.2.1. Step One: Village Selection and Sampling .................... 23 3.2.2. Step Two: Analysis of Objective Measure (Desk Review)24 3.2.3. Step Three: Analysis of Subjective Measure (Survey) ... 24
3.3. Scope of Study and Limitations ................................................... 25 4. Step One: Village Selection and Sampling ........................................................ 27
4.1. Coverage ..................................................................................... 27 4.2. Market Penetration ...................................................................... 28
4.2.1. National Level ................................................................ 29 4.2.2. Provincial Level ............................................................. 29 4.2.3. Village Level .................................................................. 30
4.3. Village Selection .......................................................................... 33 5. Step Two: Measuring Objective Over-Indebtedness .......................................... 34
5.1. Are microfinance borrowers objective OID? ................................ 34 5.2. What are the drivers of objective over-indebtedness? ................. 36
5.2.1. Analysis of the Data from the Desk Review Database .. 36 Personal Factors ..................................................... 36 Economic Factors .................................................... 38 Borrowing Behavior ................................................. 41 MFI Policy and Practices ......................................... 45
5.2.2. Econometric Analysis .................................................... 48 6. Step Three: Measuring Subjective Over-Indebtedness ..................................... 50
6.1. Are microfinance borrowers subjective OID? .............................. 50 6.1.1. Struggled to Repay Debts .............................................. 50 6.1.2. Sacrifices ....................................................................... 51 6.1.3. Coping Strategies .......................................................... 52
6.2. Why have some borrowers struggled to repay? .......................... 54 6.2.1. Survey Findings on Borrowers’ Struggle to Repay ........ 54
Personal Factors ..................................................... 54 Economic Factors .................................................... 55 Borrowing Behavior ................................................. 59 MFI Policy and Practices ......................................... 63
6.2.2. Econometric Analysis .................................................... 67 7. What This All Means and Moving Forward ........................................................ 70 References ............................................................................................................... 74 Annex ....................................................................................................................... 75
Study on the Drivers of Over-Indebtedness of Microfinance Borrowers in Cambodia 4
List of Figures, Tables and Annex
Figures Figure 1: Net Indebtedness Index Formula .............................................................. 12 Figure 2: Multiple Borrowing at the National Level ................................................... 19 Figure 3: Net Indebtedness Index Formula .............................................................. 21 Figure 4: Map of Market Penetration at Commune Level ......................................... 32 Figure 5: Percentage of Insolvent Borrowers in each Education Level .................... 37 Figure 6: OID-Objective by Gender .......................................................................... 37 Figure 7: Economic Activity of Borrowers (Desk Review) ......................................... 39 Figure 8: Percentage of Insolvent Borrowers in each Main Economic Activity ......... 39 Figure 9: Borrowers by Number of Outstanding Loans (Percentage of 1,326 borrowers) ................................................................................................................ 41 Figure 10: Percentage of Insolvent Borrowers by Number of Loan Sources ............ 42 Figure 11: Loan Purpose by OID Threshold (Percentage of Number of Loans) ....... 43 Figure 12: Average Number of Loan Cycle by OID Threshold ................................. 43 Figure 13: Percentage of Insolvent Borrowers by Number of Loan Cycles .............. 44 Figure 14: Average Number of Outstanding Loans by Loan Cycles ......................... 45 Figure 15: Average Loan Size per Loan by Number of Outstanding Loan (USD) .... 47 Figure 16: Lending Methodology by OID Threshold (Percentage of Loans) ............. 47 Figure 17: Graphic Illustration of Subjective Measure of OID (Percentage of total respondents in survey) ............................................................................................. 52 Figure 18: Main Source of Household Income (% of 465 borrowers) ....................... 56 Figure 19: Main Source of Loan Repayment (% of 465 borrowers) ......................... 56 Figure 20: Profit from Entrepreneurial Activities versus Debt Payments (% of 465 borrowers) ................................................................................................................ 57 Figure 21: Percentage of Borrowers that Struggled to Repay by Number of Outstanding Loans ................................................................................................... 59 Figure 22: Struggled to Repay by Lending Methodology (% of total loans in each group) ....................................................................................................................... 65 Figure 23: Struggled to Repay by Loan Tenor (Average months) ............................ 65 Tables Table 1: Coverage .................................................................................................... 27 Table 2: Village Outreach by Number of MFI ........................................................... 28 Table 3: National Level Market Penetration ............................................................. 29 Table 4: Market Penetration by Province ................................................................. 29 Table 5: Household Penetration by Number of MFI ................................................. 31 Table 6: Villages with Penetration > 100% and 8 MFIs Active ................................. 33 Table 7: Profile of Sample versus Population ........................................................... 35 Table 8: Borrowers by OID Threshold ...................................................................... 35 Table 9: Household Size by Threshold..................................................................... 36 Table 10: Average Gross Income and Debt by Threshold in USD ........................... 38 Table 11: Profit from Entrepreneurial Activities vs. OID Objective ........................... 40 Table 12: Total Debt by OID-Objective..................................................................... 45 Table 13: Loan Size by OID-Objective (Borrowers with 1 Loan) .............................. 46 Table 14: Loan Tenor in Months by Threshold ......................................................... 48 Table 15: Parameter Estimates for a Multinomial Logit Model ................................. 49
Study on the Drivers of Over-Indebtedness of Microfinance Borrowers in Cambodia 5
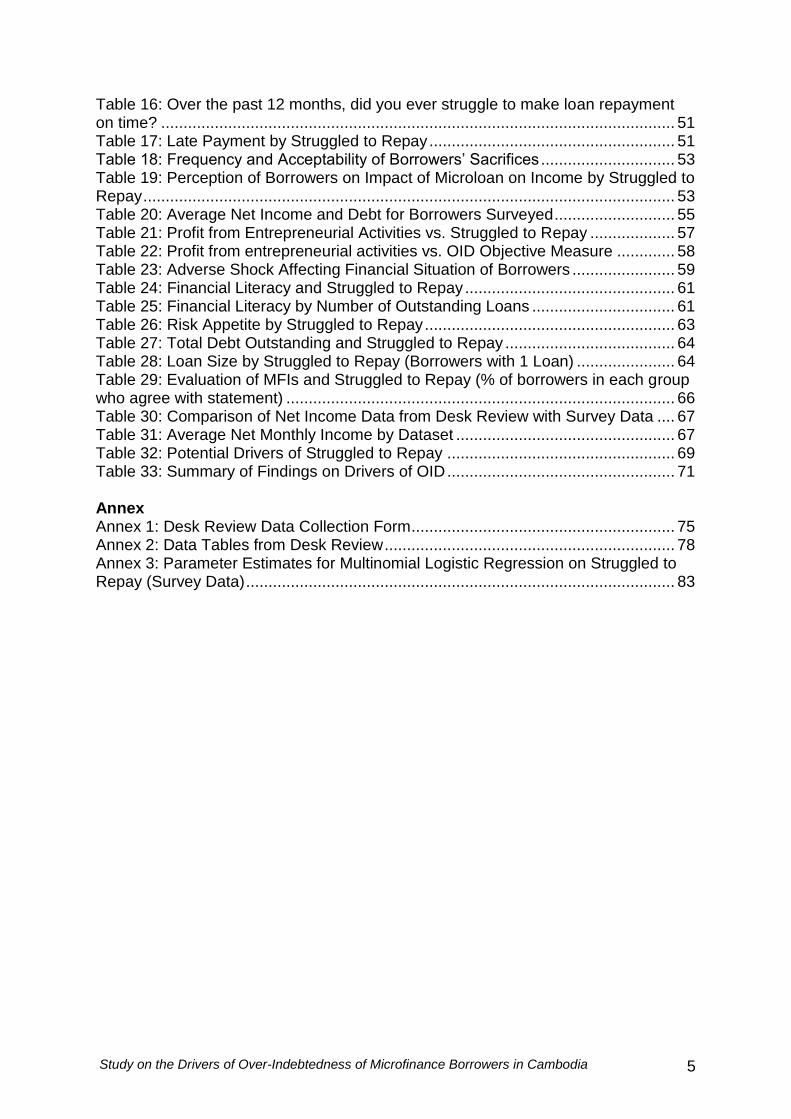
Table 16: Over the past 12 months, did you ever struggle to make loan repayment on time? ................................................................................................................... 51 Table 17: Late Payment by Struggled to Repay ....................................................... 51 Table 18: Frequency and Acceptability of Borrowers’ Sacrifices .............................. 53 Table 19: Perception of Borrowers on Impact of Microloan on Income by Struggled to Repay ....................................................................................................................... 53 Table 20: Average Net Income and Debt for Borrowers Surveyed ........................... 55 Table 21: Profit from Entrepreneurial Activities vs. Struggled to Repay ................... 57 Table 22: Profit from entrepreneurial activities vs. OID Objective Measure ............. 58 Table 23: Adverse Shock Affecting Financial Situation of Borrowers ....................... 59 Table 24: Financial Literacy and Struggled to Repay ............................................... 61 Table 25: Financial Literacy by Number of Outstanding Loans ................................ 61 Table 26: Risk Appetite by Struggled to Repay ........................................................ 63 Table 27: Total Debt Outstanding and Struggled to Repay ...................................... 64 Table 28: Loan Size by Struggled to Repay (Borrowers with 1 Loan) ...................... 64 Table 29: Evaluation of MFIs and Struggled to Repay (% of borrowers in each group who agree with statement) ....................................................................................... 66 Table 30: Comparison of Net Income Data from Desk Review with Survey Data .... 67 Table 31: Average Net Monthly Income by Dataset ................................................. 67 Table 32: Potential Drivers of Struggled to Repay ................................................... 69 Table 33: Summary of Findings on Drivers of OID ................................................... 71 Annex Annex 1: Desk Review Data Collection Form ........................................................... 75 Annex 2: Data Tables from Desk Review ................................................................. 78 Annex 3: Parameter Estimates for Multinomial Logistic Regression on Struggled to Repay (Survey Data) ................................................................................................ 83
Study on the Drivers of Over-Indebtedness of Microfinance Borrowers in Cambodia 6
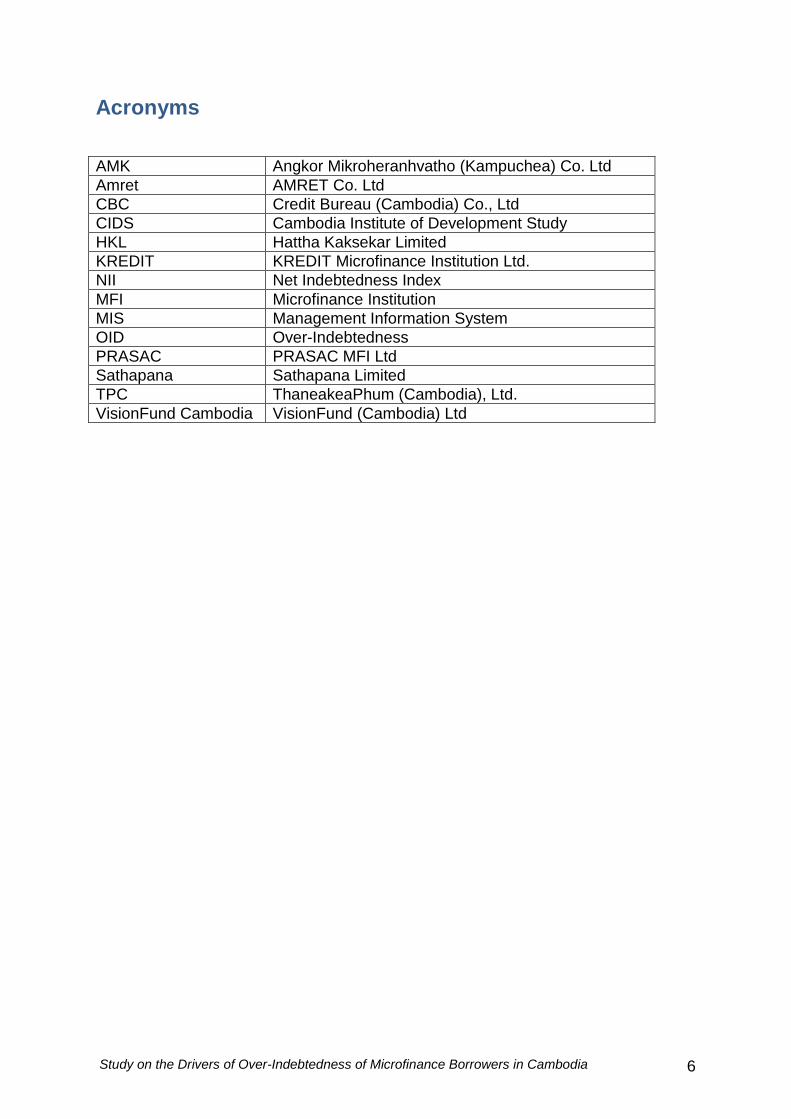
Acronyms
AMK Angkor Mikroheranhvatho (Kampuchea) Co. Ltd
Amret AMRET Co. Ltd
CBC Credit Bureau (Cambodia) Co., Ltd
CIDS Cambodia Institute of Development Study
HKL Hattha Kaksekar Limited
KREDIT KREDIT Microfinance Institution Ltd.
NII Net Indebtedness Index
MFI Microfinance Institution
MIS Management Information System
OID Over-Indebtedness
PRASAC PRASAC MFI Ltd
Sathapana Sathapana Limited
TPC ThaneakeaPhum (Cambodia), Ltd.
VisionFund Cambodia VisionFund (Cambodia) Ltd
Study on the Drivers of Over-Indebtedness of Microfinance Borrowers in Cambodia 7
Acknowledgements Given the importance, complexity and sensitivity of the issue of over-indebtedness among microfinance borrowers in Cambodia, this research project would not have been possible without the cooperation of many organizations and individuals. Firstly, the author would like to thank BlueOrchard Finance, Incofin Investment Management and Oikocredit for their financial support. Special thanks are due to the members of the Steering Committee: Arthur Dumas and Vuthy Chea from BlueOrchard Finance, Dina Pons from Incofin Investment Management and Tes Pilapil from Oikocredit, for their thoughtful engagement at each stage of this project and insightful feedbacks. The research design of this study has benefited from the advice and guidance of many microfinance researchers, especially Jessica Schicks from the Centre for European Research in Microfinance at the Université Libre de Bruxelles, Justyna Pytkowska from Microfinance Center, and Sylvia Spannuth from Finance in Motion. Many thanks also to the Credit Bureau Cambodia for its inputs. The author would also like to express thanks to the eight partner MFIs (AMK, Amret, HKL, KREDIT, PRASAC, Sathapana, TPC and VisionFund Cambodia), who have been key contributors in this research. Their cooperation, especially in sharing data and inputs, provided the researchers with an unmatched and comprehensive database to analyze the over-indebtedness situation of microfinance in an in-depth way. Their high level of ownership and commitment to client protection is particularly appreciated. Special thanks also to all the MFI branch staff for opening their doors to the research team for the desk review and for their logistical assistance during the field survey. Last but absolutely not least, thank you to all the microfinance borrowers who shared their stories with us. We hope that we have used the data with justice for their benefit.
Study on the Drivers of Over-Indebtedness of Microfinance Borrowers in Cambodia 8
Foreword Microfinance has grown rapidly over the last decade, directly reaching millions of poor people worldwide, providing credit and other forms of financial services. If used judiciously, it can serve as an effective instrument in promoting financial inclusion. It is mainly for this reason that BlueOrchard Finance, Incofin and Oikocredit have been investing significant amounts of capital and other resources in MFIs around the world. The microfinance sector in Cambodia has grown rapidly over the last ten years. It has successfully professionalized as one of the leading microfinance sectors in the Southeast Asian region. There are claims, however, that the sector might be nearing saturation. Concerns have been raised that the possibility of over-indebtedness among borrowers could undermine the social mission and the sustained healthy development of the sector. In some countries where microfinance services have rapidly expanded, the problem has shifted from the poor having too little access to finance, to having too much access, with the option of even borrowing from several MFIs. Aggressive growth of microfinance, even if driven by the desire to reach out to those with limited access to capital, could have a negative impact when borrowers take too much debt. Over-indebtedness has become among the most serious risks of microfinance today and impacts all stakeholders. Most importantly, borrowers who are unable to repay their loans risk losing their assets, even their livelihoods, potentially worsening their living conditions. Where client protection and safety nets are weak, microfinance borrowers are often left with no financial or social support once they become over-indebted. The potential economic, psychological and sociological consequences are far reaching. Significant loan defaults can also gravely affect the portfolio quality of MFIs, putting institutional stability and sustainability at serious risk as has been seen in various countries around the world. This in turn can hurt returns for investors in the sector, tarnish the overall image of the industry, and potentially jeopardize the excellent work that so many are doing to build a healthy and sustainable inclusive financial system. While over-indebtedness is a pressing and urgent challenge for the microfinance sector, the truth is that we know little about it and no industry level publication on multiple borrowing and OID in Cambodia exists. This is the reason that we embarked on this study, the aim of which is to contribute to a better understanding of the drivers of over-indebtedness among borrowers in selected saturated areas in Cambodia. As such, the study is limited to selected areas in the country. It will not be able to answer all our questions but we feel that it offers important insights from the borrowers and the factors that drove them to over-indebtedness. These should serve as key elements of our understanding of over-indebtedness. Oikocredit, Incofin and BlueOrchard Finance strive to finance MFIs that hold to their mission of providing access to finance for those excluded from the formal financial system. We are cognizant that the challenge for Cambodian MFIs has shifted from financial sustainability to responsibility in ethical lending. Anchored by our commitment to the fair treatment and protection of microfinance clients, we invest in
Study on the Drivers of Over-Indebtedness of Microfinance Borrowers in Cambodia 9
MFIs that offer services to disadvantaged people in a responsible, transparent and sustainable manner. As social investors, we want to ensure that as the microfinance sector grows, so does steadfast adherence to strict standards in responsible lending. We hope that this study will provide valuable inputs to improve collective efforts among stakeholders of the microfinance sector to prevent over-indebtedness and to ensure further protection of borrowers in Cambodia. We also hope that this study and its methodological framework could be used in other countries in order to better understand the drivers of multiple borrowing and over-indebtedness more broadly, to prevent their development and ensure the preservation of a sound and responsible microfinance industry. For any further information on the study, please feel free to contact:
At BlueOrchard Finance, Arthur Dumas at [email protected]
At Incofin Investment Management, Dina Pons at [email protected]
At Oikocredit, Tes Pilapil at [email protected]
BlueOrchard Finance S.A. was founded in 2001 as the first commercial manager of microfinance debt investments worldwide. To this day, the company has deployed approximately USD 2bn in loans to microfinance institutions, providing access to microcredit to over 30 million individuals across 50 countries. Investors in BlueOrchard-managed funds include private and institutional investors, supranational institutions as well as renowned foundations. The company employs 41 staff internationally including 22 investment professionals in Geneva, Luxembourg, Lima, Phnom Penh, Bishkek and Johannesburg. With over EUR 350 million under management, Incofin Investment Management (Incofin IM) manages funds that have invested in more than 115 microfinance institutions (MFIs) in 44 developing countries. As a specialist in rural microfinancing, Incofin IM’s main goal is to reach out to people who live in more secluded rural areas and/or who are active in the agricultural sector. From its offices in Belgium, Colombia, India and Kenya Incofin employs 36 staff around the world, all dedicated to the provision debt, equity and technical assistance to MFIs. Oikocredit is one of the world’s largest sources of private funding to the microfinance sector. It also provides loans to trade cooperatives, fair trade organizations and small-to-medium enterprises (SMEs) in the developing world. As of the end of 2012, Oikocredit has EUR 530 million in outstanding loans invested into 854 partners in over 70 countries, 583 of which are microfinance institutions. In addition to earning modest financial returns, Oikocredit investors are secure in the knowledge that their money is being used to fight poverty, promote fair trade and respect the planet’s natural resources. Oikocredit provides services to its partner organizations through its network of 37 regional and country offices all over the world.
Study on the Drivers of Over-Indebtedness of Microfinance Borrowers in Cambodia 10
Abstract Cambodia’s microfinance sector has grown at a rapid pace over the past two decades, allowing poor households to access financial services and enabling them to grow income-generating activities. However, the sharp growth of the sector has also resulted in substantial competition, and there have been concerns that it may be leading to cross-lending and possibly, over-indebtedness of borrowers. This study focuses on providing an in-depth understanding of the drivers of over-indebtedness (OID) in selected saturated areas, which represent less than 6% of total villages in Cambodia. This study does not attempt to measure the magnitude of over-indebtedness in Cambodia and our results regarding OID’s incidence cannot necessarily be extrapolated at a national level. In this study, we used two definitions of over-indebtedness:
An objective measure based on the traditional view of over-indebtedness that looks at the repayment capacity of the borrower by comparing the debt installments to the net income. Applying this measure, we found that 22% percent of clients in the sample of 1,480 were insolvent or over-indebted.
A subjective measure derived from a client protection perspective, which takes into account the struggles and sacrifices that borrowers make to repay their debts on time. 6% of clients in a sample of 465 borrowers fit this subjective definition and were classified as over-indebted.
Two separate econometrical analyses were conducted to identify the potential drivers of OID based on i) our objective definition and ii) clients’ struggle to repay3.
Both econometrical analyses pointed us to multiple borrowing: Clients with multiple loans, especially three or more loans, were far more likely both to be insolvent and to have struggled to repay.
Profit from entrepreneurial activities alone to cover debt obligations was a statistically significant factor in explaining differences in objective over-indebtedness, i.e. clients with insufficient profit from their own business were more likely to be insolvent.
Financial literacy was strongly associated with having struggled to repay, in which borrowers with low financial literacy were more likely to struggle.
Education had a negative, albeit moderate relationship with having struggled to repay.
The findings in this paper call for all actors of the Cambodian microfinance industry (MFIs, Lenders, NBC, Credit Bureau) to join forces to regularly monitor market penetration and multiple borrowing at the most local (i.e. village) level in Cambodia and to engage in a conversation on how to define precise guidelines on maximum level multiple borrowing in order to prevent over-indebtedness.
3 The number of over-indebted borrowers based on the subjective definition of OID being too small to
perform a robust econometrical analysis, we decided instead to analyze the drivers of clients’ struggle to repay. Despite their high level of tolerance, 51% of the borrowers admitted that they have struggled to make loan repayment.
Study on the Drivers of Over-Indebtedness of Microfinance Borrowers in Cambodia 11
Executive Summary Rationale Cambodia’s microfinance sector has grown tremendously over the past decade, expanding from just USD 3 million of outstanding loans and 50,000 borrowers in 1995, to a remarkable USD 732 million and 1,197,722 borrowers in 2012. The increase in the number of MFI operators to a current 32 institutions, all with a focus on portfolio growth, has resulted in increasing market penetration. For some years now, there has been a growing concern that the increase in competition among MFIs may be leading to cross-lending and possibly, the over-indebtedness of borrowers. Understanding the current state of multiple borrowing (defined as having more than one loan regardless of the loan provider), the extent of the possible struggles of borrowers with repayment capacity issues, and assessing the presence of over-indebtedness and the drivers behind it are critical to the financial stability of the Cambodian microfinance sector. Even more importantly, they are critical to the socio-economic welfare of MFIs’ borrowers, who are the poor and vulnerable. The challenge that has been faced thus far is that this data is not currently being collected or monitored in a systematic manner. This is the motivation behind this study. Co-financed by three key international microfinance investment vehicles present in Cambodia – BlueOrchard Finance, Incofin Investment Manager and Oikocredit -- this study was made possible thanks to the invaluable and constructive collaboration of the eight largest non-bank MFIs in Cambodia (AMK, Amret, HKL, KREDIT, PRASAC, Sathapana, TPC and VisionFund Cambodia). Accounting for 77% of the total number of microfinance borrowers in Cambodia, they agreed to share with us information on their clients, which made this study possible. Objectives An important point to mention from the onset is that this study does not attempt to measure the magnitude of over-indebtedness in Cambodia. The focus is on the drivers of over-indebtedness in saturated areas in order to gain a better understanding of the main factors behind over-indebtedness (OID) and the extent to which multiple borrowing can lead to OID. More specifically, the study explores the following:
The degree of multiple borrowing and OID in selected saturated areas
How OID is being felt and perceived by borrowers The relationship between multiple borrowing and OID The internal and external drivers of OID (e.g. MFI lending behavior and client
borrowing behavior) Definitions Building from the existing research on OID, such as analyses carried out in Kosovo and Ghana, this study defined two different measurements of over-indebtedness: an objective one and a subjective one: From an objective definition, we determined a microfinance borrower to be over-indebted when his/her total debt service is higher than his/her net income during a
Study on the Drivers of Over-Indebtedness of Microfinance Borrowers in Cambodia 12
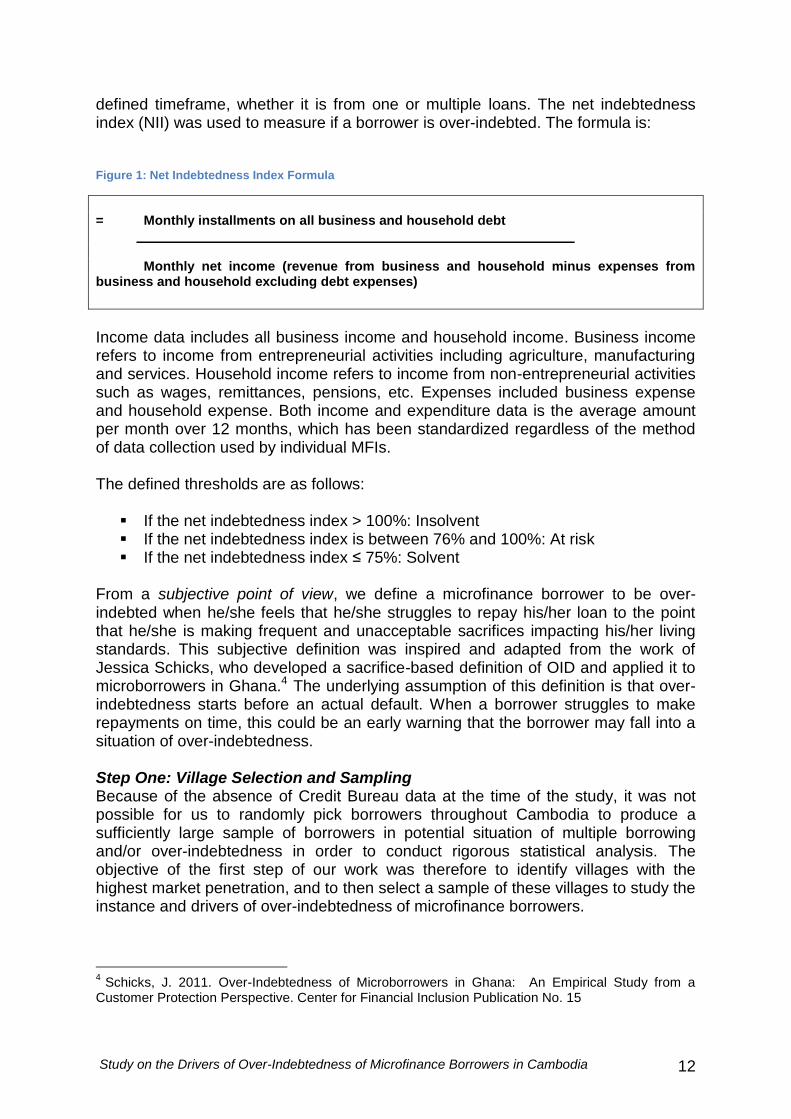
defined timeframe, whether it is from one or multiple loans. The net indebtedness index (NII) was used to measure if a borrower is over-indebted. The formula is: Figure 1: Net Indebtedness Index Formula
= Monthly installments on all business and household debt
Monthly net income (revenue from business and household minus expenses from business and household excluding debt expenses)
Income data includes all business income and household income. Business income refers to income from entrepreneurial activities including agriculture, manufacturing and services. Household income refers to income from non-entrepreneurial activities such as wages, remittances, pensions, etc. Expenses included business expense and household expense. Both income and expenditure data is the average amount per month over 12 months, which has been standardized regardless of the method of data collection used by individual MFIs. The defined thresholds are as follows:
If the net indebtedness index > 100%: Insolvent If the net indebtedness index is between 76% and 100%: At risk If the net indebtedness index ≤ 75%: Solvent
From a subjective point of view, we define a microfinance borrower to be over-indebted when he/she feels that he/she struggles to repay his/her loan to the point that he/she is making frequent and unacceptable sacrifices impacting his/her living standards. This subjective definition was inspired and adapted from the work of Jessica Schicks, who developed a sacrifice-based definition of OID and applied it to microborrowers in Ghana.4 The underlying assumption of this definition is that over-indebtedness starts before an actual default. When a borrower struggles to make repayments on time, this could be an early warning that the borrower may fall into a situation of over-indebtedness. Step One: Village Selection and Sampling Because of the absence of Credit Bureau data at the time of the study, it was not possible for us to randomly pick borrowers throughout Cambodia to produce a sufficiently large sample of borrowers in potential situation of multiple borrowing and/or over-indebtedness in order to conduct rigorous statistical analysis. The objective of the first step of our work was therefore to identify villages with the highest market penetration, and to then select a sample of these villages to study the instance and drivers of over-indebtedness of microfinance borrowers.
4 Schicks, J. 2011. Over-Indebtedness of Microborrowers in Ghana: An Empirical Study from a
Customer Protection Perspective. Center for Financial Inclusion Publication No. 15
Study on the Drivers of Over-Indebtedness of Microfinance Borrowers in Cambodia 13
The eight participating MFIs in the study provided us with village level data on their portfolios. We then looked at the total number of loan accounts5 divided by the total number of households in each village to arrive at an indication of market saturation. Household population was used instead of active borrowing population because: 1) no existing data on active borrowing population exists at the village level, 2) MFIs lend to the household unit and not individual unit; and 3) this indicator helped identify areas where there may be a high incidence of multiple borrowing and thus, potential over-indebtedness. The results show that out of the 14,074 villages in Cambodia: 6% of villages (914 villages) were saturated, which means that their market penetration was over 100%; 9% (1,260 villages) had very high market penetration, defined as levels between 75-100%; 17% (2,444 villages) had high penetration, defined as levels between 50-75%; 62% (the majority) of villages had moderate (levels between 25-50%) or low market penetration (levels less than 25%), and 6% (914 villages) had no penetration at all. Among the 914 saturated villages, all 8 MFIs had overlapping services in 44 villages. This study therefore covers these 44 villages. Step Two: Measuring Objective Over-Indebtedness The second step of our study consisted of building an aggregated database with data on 10,266 clients, which served as the sampling frame for the desk review. The consolidation of the database allowed us to identify overlapping names of clients, and thus those clients that had multiple borrowings. A random sample of 1,500 clients was selected from the consolidated database, and then stratified by the number of loans, locations, MFIs, etc. Individual client data of these 1,500 clients were then collected from loan files of the eight partner MFIs. Subsequently, a net indebtedness index was calculated for each client to identify those that were over-indebted. The descriptive analysis showed the following results:
The majority of borrowers in the sample (56%) were “solvent,” meaning that their monthly debt installments were 75% or less of their net monthly income. Within the sample, 12% of borrowers were categorized as “at risk”, 22% were “insolvent” and 10% could not be classified because no income data were available6.
Among the 1,326 borrowers7 in the sample, 56% had more than one loan: 28% had two loans, 13% had three loans, 9% had four loans, and 6% more than four loans.
There is a clear relationship between multiple borrowing and OID. The percentage of OID borrowers, as determined according to the objective definition, increased with the number of outstanding loans: 20% of the borrowers with two loans were insolvent, 48% of those with three loans, 70%
5 Includes only loan accounts of the 8 partner MFIs
6 The 10% of borrowers with no income data were not included in the analysis.
7 After removing from the sample clients with no income data, the total sample size was 1,326
borrowers.
Study on the Drivers of Over-Indebtedness of Microfinance Borrowers in Cambodia 14
of those with four loans, 84% of those with five loans, 94% of those with six loans and 100% of those with seven loans.
The percentage of borrowers who were insolvent increased as the number of loan cycle increased. Among borrowers on their first loan, 5% were insolvent. This rate increased to 16% for borrowers on their second cycle and continued to increase to a peak of 67% for borrowers on their eighth loan cycle.
Borrowers that had borrowed more cycles tended to be over-indebted because they also tended to have more outstanding loans. Among borrowers on their first loan cycle, the average number of outstanding loans was 1.2 loans. This number increased to 1.5 loans for borrowers on their second cycle, and continued to increase to a peak of 3.3 loans for borrowers on their eighth loan cycle.
Insolvent borrowers had much higher total debt levels than the average borrower (USD 2,461 versus USD 1,496), and at the same time, lower net incomes (USD 108 versus USD 204 per month).
When we isolated the “multiple loan effect” by looking at only borrowers with one loan, the data showed no relationship between OID and loan size.
There appears to be a connection between the economic activity of the borrower and OID. Among borrowers engaged in agricultural activities, 30% were insolvent. The rate among non-agriculture activities was much lower, at 21%, and for wage earners it was 18%.
We did not find any relationship between OID and lending methodology.
A final interesting finding is that if borrowers made sufficient profit from their business alone, before considering other income sources, then they were much less likely to be over-indebted. For many borrowers (43%), the profit from their entrepreneurial8 activities alone was sufficient to cover their debt payments, while for 16% it was not sufficient (when MFIs assess their clients’ repayment capacity, they include all sources of income, of which the business profit is only one). For 41% of borrowers in our sample, only wage income was registered in the loan file. Half of the borrowers who did not earn enough profit to finance their debt were insolvent, and 20% were at risk of being insolvent. In contrast, only 5% of borrowers who earned sufficient profit were insolvent.
A regression analysis was then conducted to identify empirically the drivers that are statistically significant in explaining OID. Overall, the results of the regression analysis confirm most of our descriptive analysis from the preceding sections. The regression finds that two variables were statistically significant in clarifying differences in objective OID: multiple loans and profit from entrepreneurial activity:
Having multiple loans increased a borrower’s odds of being over-indebted by 6 times, specifically when the borrower has 3 or more outstanding loans.
Having insufficient profit from entrepreneurial activities to cover debt obligations increased the chance of being insolvent by 180%, while having
8 Entrepreneurial activity means all the activities of the borrowers that are commercial (or self-
employed) regardless of the sector (agricultural, trade, industrial, services), contrary to wage incomes.
Study on the Drivers of Over-Indebtedness of Microfinance Borrowers in Cambodia 15
sufficient profit from entrepreneurial activities (vs. wage income) reduced the likelihood of being insolvent by 59%.
The correlation between OID and other factors such as assets, lending methodology, loan cycle, nonproductive use, loan tenor, economic activity, household size, and education were not statistically significant.
Step Three: Measuring Subjective Over-Indebtedness The third step of our study was to collect additional, qualitative data to deepen our understanding of the drivers of OID, the profile of OID borrowers and to know the borrowers’ perception of their debt burden (subjective measure of OID). The data was gathered through face-to-face interviews with a planned sample of 500 borrowers (of whom a total of 465 borrowers were interviewed). The 500 borrowers were randomly selected from the Desk Review Database of 1,500 borrowers. The descriptive analysis showed the following results:
51% of borrowers surveyed (237 people) said they had struggled to repay their micro loans on time (45% struggled a few times, 6% struggled most of the time and less than 1% always struggled). In order to meet their loan repayments, 227 of these struggling borrowers (49% of all borrowers interviewed) had made at least one sacrifice over the past 12 months. Among these borrowers, however, only 32 of them (7% of all respondents) felt that the sacrifices were unacceptable. Only 27 borrowers (6% of all borrowers) repeatedly made these unacceptable sacrifices and were, therefore, based on the subjective definition, over-indebted. The wide gap between the objective and subjective level of over-indebtedness may reflect borrowers’ high tolerance for making sacrifices to repay their debts. It may also reveal the high value borrowers place on their access to microcredit.
The most common sacrifice or coping strategy used by microfinance borrowers was to reduce the quality of food (48%) or the quantity of food (44%). More than a quarter of the borrowers (27%) dealt with the repayment pressure by sending a family member to find work outside the village. 25% of borrowers said they depleted their savings over the past 12 months to cover loan repayments, while 23% took out a new loan to be able to repay their existing loans.
Consistent with our finding in the desk review, no connection between loan size and struggled to repay were found.
Another interesting finding was that the main source of household income for 64% of the borrowers was from wages and remittances.9 The high contribution of wage income explains why most borrowers said that their income was regular (86%) and stable (73%).
9 This break down is different from the desk review, which showed that the majority of households
rely on agriculture activities. This is likely because MFIs listed the economic activity for which the loan was used on as the main activity rather than the activity that contributed most to income.
Study on the Drivers of Over-Indebtedness of Microfinance Borrowers in Cambodia 16
To determine the robustness of our descriptive analysis and to isolate the factors that had a strong and statistically significant correlation with the incidence of having struggled to repay, a contingency analysis10 was conducted on the survey data. The results of the econometric tests were mostly consistent with the descriptive analysis, which found that:
Multiple loans had the strongest, positive correlation with having struggled to repay. This means that borrowers with many multiple loans were more likely to struggle to repay. The association between multiple loans and struggled to repay was highly statistically significant.
Lack of or weak financial literacy was strongly associated with having struggled to repay, in which borrowers with low financial literacy are more likely to struggle. This factor was also highly statistically significant.
Education had a negative, moderate relationship with having struggled to repay. This means that as a borrower’s education increased, they were less likely to be in a situation of struggling. However, it is important to point out that almost all of the microborrowers in the survey had low education levels, and this finding was likely biased by the small sample of borrowers with high education.
Interestingly, and in contrast to what we saw with the objective measurement of OID, it appeared that from a subjective OID standpoint, profit from entrepreneurial activities did not show a strong or significant correlation with repayment struggles. This is likely because the majority of borrowers in the survey repaid their loans with wage income.
There was no statistically significant relationship between having struggled to repay and the other factors.
What This All Means and Moving Forward Our probe into the potential drivers of over-indebtedness based on both our objective and subjective measures of over-indebtedness consistently points us to multiple borrowing: Clients with multiple loans, especially three or more, were more likely to be insolvent and/or struggle to repay. The complete summary of our findings regarding the potential drivers of OID and of clients' struggle to repay is provided in the below table:
OID Measure / Data Source
Descriptive Analysis Econometrics Analysis
Objective OID - Desk Review Data
Possible correlation:
Income (-)
Profit from entrepreneurial activities (-)
Multiple loan (+)
Loan cycles (+)
Economic activity No correlation
Statistically significant:
Multiple loans (+)
Profit from entrepreneurial activities (-)
10
A contingency analysis in statistics refers to analyzing the correlations of variables through the use of cross tabulations.
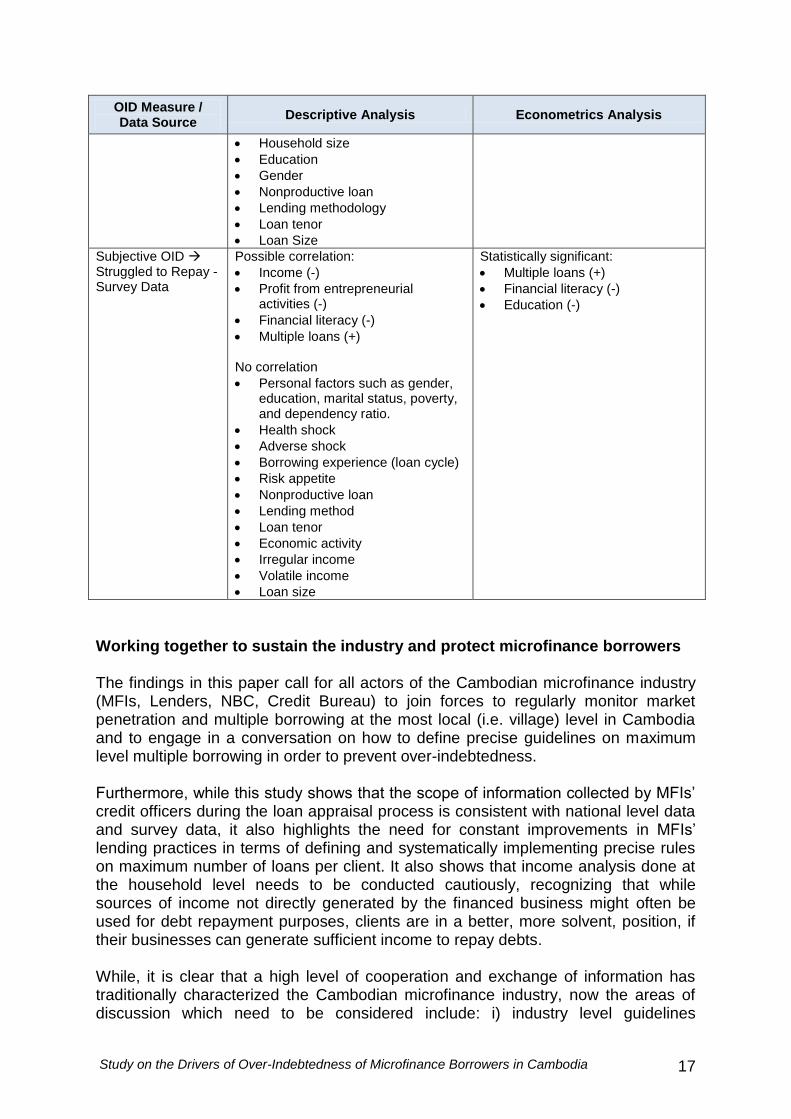
Study on the Drivers of Over-Indebtedness of Microfinance Borrowers in Cambodia 17
OID Measure / Data Source
Descriptive Analysis Econometrics Analysis
Household size
Education
Gender
Nonproductive loan
Lending methodology
Loan tenor
Loan Size
Subjective OID Struggled to Repay - Survey Data
Possible correlation:
Income (-)
Profit from entrepreneurial activities (-)
Financial literacy (-)
Multiple loans (+) No correlation
Personal factors such as gender, education, marital status, poverty, and dependency ratio.
Health shock
Adverse shock
Borrowing experience (loan cycle)
Risk appetite
Nonproductive loan
Lending method
Loan tenor
Economic activity
Irregular income
Volatile income
Loan size
Statistically significant:
Multiple loans (+)
Financial literacy (-)
Education (-)
Working together to sustain the industry and protect microfinance borrowers The findings in this paper call for all actors of the Cambodian microfinance industry (MFIs, Lenders, NBC, Credit Bureau) to join forces to regularly monitor market penetration and multiple borrowing at the most local (i.e. village) level in Cambodia and to engage in a conversation on how to define precise guidelines on maximum level multiple borrowing in order to prevent over-indebtedness. Furthermore, while this study shows that the scope of information collected by MFIs’ credit officers during the loan appraisal process is consistent with national level data and survey data, it also highlights the need for constant improvements in MFIs’ lending practices in terms of defining and systematically implementing precise rules on maximum number of loans per client. It also shows that income analysis done at the household level needs to be conducted cautiously, recognizing that while sources of income not directly generated by the financed business might often be used for debt repayment purposes, clients are in a better, more solvent, position, if their businesses can generate sufficient income to repay debts. While, it is clear that a high level of cooperation and exchange of information has traditionally characterized the Cambodian microfinance industry, now the areas of discussion which need to be considered include: i) industry level guidelines
Study on the Drivers of Over-Indebtedness of Microfinance Borrowers in Cambodia 18
regarding multiple borrowing; ii) refined repayment capacity analysis to make sure that financed businesses are profitable enough to cover interest payments; iii) enhanced credit appraisals for loan renewals taking into account the volatility of microfinance borrowers’ income. We hope that this report could be the first step in a national dialogue between microfinance institutions, their lenders and investors and policymakers to discuss creatively and openly how to manage multiple borrowing in a socially responsible way.
Study on the Drivers of Over-Indebtedness of Microfinance Borrowers in Cambodia 19
1. Rationale
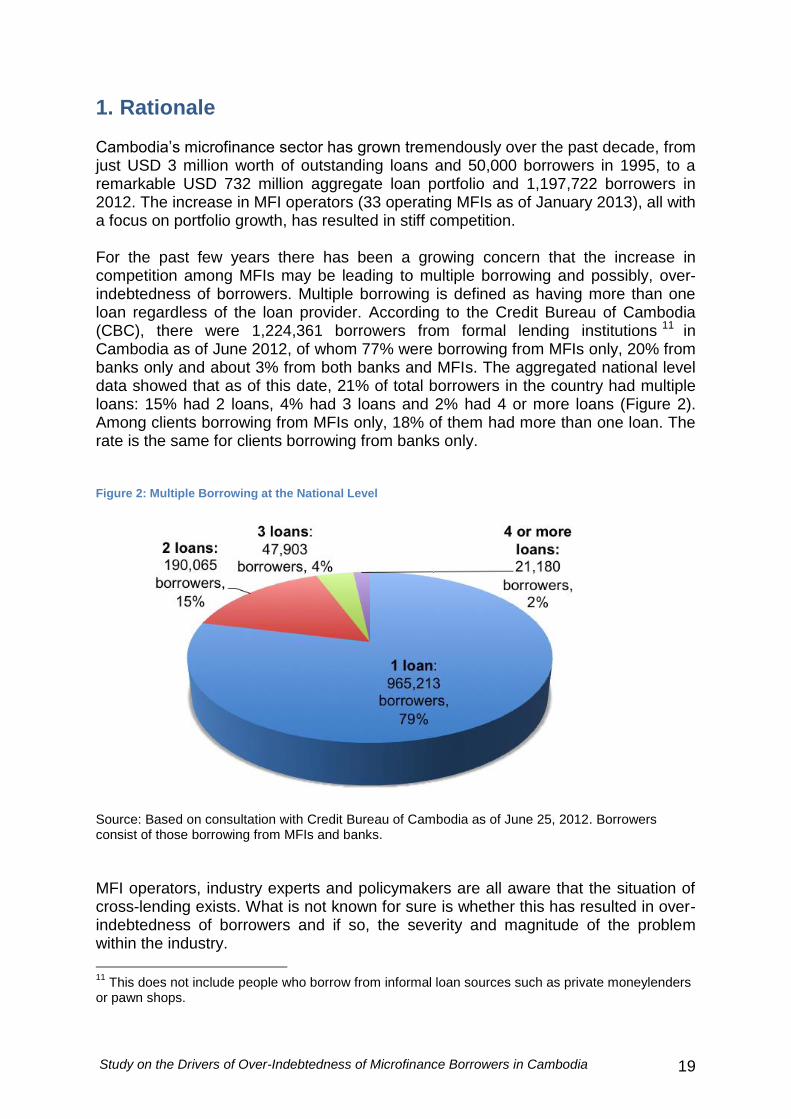
Cambodia’s microfinance sector has grown tremendously over the past decade, from just USD 3 million worth of outstanding loans and 50,000 borrowers in 1995, to a remarkable USD 732 million aggregate loan portfolio and 1,197,722 borrowers in 2012. The increase in MFI operators (33 operating MFIs as of January 2013), all with a focus on portfolio growth, has resulted in stiff competition. For the past few years there has been a growing concern that the increase in competition among MFIs may be leading to multiple borrowing and possibly, over-indebtedness of borrowers. Multiple borrowing is defined as having more than one loan regardless of the loan provider. According to the Credit Bureau of Cambodia (CBC), there were 1,224,361 borrowers from formal lending institutions 11 in Cambodia as of June 2012, of whom 77% were borrowing from MFIs only, 20% from banks only and about 3% from both banks and MFIs. The aggregated national level data showed that as of this date, 21% of total borrowers in the country had multiple loans: 15% had 2 loans, 4% had 3 loans and 2% had 4 or more loans (Figure 2). Among clients borrowing from MFIs only, 18% of them had more than one loan. The rate is the same for clients borrowing from banks only. Figure 2: Multiple Borrowing at the National Level
Source: Based on consultation with Credit Bureau of Cambodia as of June 25, 2012. Borrowers consist of those borrowing from MFIs and banks.
MFI operators, industry experts and policymakers are all aware that the situation of cross-lending exists. What is not known for sure is whether this has resulted in over-indebtedness of borrowers and if so, the severity and magnitude of the problem within the industry.
11
This does not include people who borrow from informal loan sources such as private moneylenders or pawn shops.
Study on the Drivers of Over-Indebtedness of Microfinance Borrowers in Cambodia 20
Though the industry has a high repayment rate (portfolio at risk more than 30 days of 0.25% as of Q2 of 2012) this figure might mask the struggles and high sacrifices that borrowers make to meet payment schedules. Indeed, over-indebtedness can be present without a borrower actually defaulting. Despite growing concern and increasing debate, no reliable and aggregated information on OID is being collected currently nor monitored by MFIs or regulators at the moment. Understanding the current state of multiple borrowing, OID, struggles of borrowers and the main drivers of over-indebtedness is critical to the financial stability of the MFI sector, but even more importantly, to the socio-economic welfare of MFIs’ borrowers, who are the poor and vulnerable. This is the motivation behind this study. The project was co-financed by three key international microfinance investment vehicles present in Cambodia: BlueOrchard Finance, Incofin Investment Manager and Oikocredit, and in collaboration with the eight largest non-bank MFIs in Cambodia (AMK, Amret, HKL, KREDIT, PRASAC, Sathapana, TPC and VisionFund Cambodia). The Cambodia Institute of Development Study (CIDS) implemented the research.
2. Objectives This study aims to conduct an in-depth investigation of saturated areas in Cambodia in order to get a better understanding of the main drivers behind over-indebtedness (OID) of microfinance borrowers and the extent to which multiple borrowing can lead to OID. More specifically, the study explores the following:
The degree of multiple borrowing and OID in selected saturated areas
How OID is being felt and perceived by borrowers The relationship between multiple borrowing and OID The internal and external drivers of OID (e.g. MFI lending behavior and client
borrowing behavior) It is important to mention from the onset that this study does not try to measure the magnitude of over-indebtedness in Cambodia. The focus is rather on the drivers of over-indebtedness in saturated areas. Indeed, because of the absence of Credit Bureau individual client data, it was not possible for us to randomly pick borrowers throughout Cambodia to build a sufficiently large sample of borrowers in a potential situation of multiple borrowing and/or over-indebtedness in order to conduct rigorous statistical analysis and draw relevant conclusions. We therefore purposely concentrated our efforts on saturated areas only.

Study on the Drivers of Over-Indebtedness of Microfinance Borrowers in Cambodia 21
3. Methodology
3.1. Definitions and Measurements of OID 3.1.1 Objective Definition Over-indebtedness of borrowers is an important concern in microfinance, especially in the context of client protection. However, there is currently no universal definition of over-indebtedness. A thorough literature review reveals that definitions vary depending on the scientific lens and purpose of the research, on data availability, and most importantly on the severity of debt problems that define the threshold to over-indebtedness. 12 For this study, two measurements of over-indebtedness were used: an objective measurement of OID and a subjective perception of OID. These two measurements of OID build on the valuable and pioneering research carried out in Kosovo13 and Ghana.14 As an objective definition, we determined that a microfinance borrower is over-indebted when his/her total debt service is higher than his/her net income during a defined timeframe, whether debt service is due to one or multiple lenders. The net indebtedness index (NII) is used to measure if a borrower is over-indebted. The formula is presented in Figure 3. Figure 3: Net Indebtedness Index Formula
= Monthly installments on all business and household debt
Monthly net income (revenue from business and household minus expenses from business and household excluding debt expenses)
Business income refers to income from entrepreneurial activities including agriculture, manufacturing and services. Household income refers to income from non-entrepreneurial activities such as wages, remittances, pensions, etc. Expenses include household expense and business expense.
12
For more on different definitions and measures of over-indebtedness, please refer to Jessica Schicks (2010). Microfinance Over-Indebtedness: Understanding its drivers and challenging the common myths. CEB Working Paper N° 10/048 2010 13
Pytkowska,J. and Spannuth, S. (2011). Indebtedness of Microcredit Clients in Kosovo: Results from a comprehensive field study. Published by Finance in Motion and the Microfinance Centre (MFC) 14
Schicks, J. 2011. Over-Indebtedness of Microborrowers in Ghana An Empirical Study from a Customer Protection Perspective. Center for Financial Inclusion Publication No. 15
Study on the Drivers of Over-Indebtedness of Microfinance Borrowers in Cambodia 22
The formula used to measure objective OID in this study was derived from the Kosovo study; however, defining the thresholds has been adapted to Cambodia’s context.15 Indeed, during consultations with the eight partner MFIs, it was agreed that the thresholds should be set at levels consistent with the current loan appraisal policy of MFIs. The thresholds agreed upon were the following:
If net indebtedness index > 100%: Insolvent If net indebtedness index between 76% and 100%: At risk If net indebtedness index ≤ 75%: Solvent
The objective measure of OID is highly dependent on the quality of the net income data. Given the limited practice of bookkeeping in Cambodia, and specifically in rural Cambodia, collecting accurate data on income and expenses is a challenging feat. For the desk review analysis, the net income data were based on the data recorded by MFIs in their clients’ loan applications. For the survey analysis, income and expense data were based on interviews with borrowers collected by trained and experienced enumerators. The method of recording incomes and expenses varied among the eight partner MFIs, as well as within each MFI depending on the loan product and lending methodology. In the majority of the client files reviewed 16 (57%), income and expense data were documented in monthly terms. For one MFI, however, almost all of their records were written on a yearly basis. In this case, we standardized the data by dividing the net income data by 12 months. One MFI collected income and expense data over the life of the loan. In this case, the data was divided by the loan tenor (expressed in months) to get the monthly net income. All net income data was converted into US dollars based on the exchange rate of 4,000 riels per US dollar. The net indebtedness index (NII) was calculated for each household, taking into account all of the households’ existing loans. When a household was borrowing from several MFIs, several net income data were available (i.e. one net income per loan file), and the NII was computed based on the average of the monthly net income collected from each of the loan files. As NII is based on average monthly data, it does not capture the seasonality of household income or the amortization structure of the loans. However, given that amortization schedules usually match the business cycle of the loans (for example bullet loans are usually provided for loans financing the agricultural sector, meaning that the principal is only repaid after the harvest season), we do believe this indicator is relevant for the purpose of this study.
15
In the Kosovo study, the thresholds are: Insolvent if NII ≥ 100%; Critical if NII is between 75-100%;
At risk if NII between 50-75%; and Not OID if NII is less than 50%. 16
Client files with no income data are not included

Study on the Drivers of Over-Indebtedness of Microfinance Borrowers in Cambodia 23
3.1.2 Subjective Definition From a subjective point of view, we define that a microfinance borrower is over-indebted when he/she feels that he/she struggles to repay his/her loan to the point that he/she is making frequent and unacceptable sacrifices impacting his/her living standards. This subjective definition was inspired and adapted from the work of Jessica Schicks, who developed a sacrifice-based definition of OID and applied it to microborrowers in Ghana.17 The underlying assumption of this definition is that over-indebtedness starts prior to, or irrespective of, an actual default. When a borrower struggles to make repayment on time, this is an indication that he or she may be over-indebted.
3.2. Research Process The research process consisted of three steps. At each step, the survey team and the steering group convened and consulted with the CEOs of the eight partner MFIs. This collaborative and transparent approach enabled all stakeholders to contribute and provide inputs. The data collected during the research process was carried respecting the client protection principle on “client data privacy.” In their loan contracts, all partner MFIs have disclosed to and received consent from their borrowers allowing the MFIs to share client data to third parties. In addition, the survey team received signed consents from all interviewees permitting the use of their data for research purposes. The data is treated with the utmost confidentiality and no individual names of clients appear in the report. Furthermore, there is a non-disclosure agreement in place between all partners of this research project specifying that data will be presented in a consolidated format only and no individual client data will be disclosed.
3.2.1. Step One: Village Selection and Sampling The first step of the study was to select the appropriate villages and sample borrowers. We compiled data on 14,073 villages from all eight partner MFIs to better understand the microfinance market penetration levels throughout Cambodia. The underlying assumption is that there is a greater likelihood of finding more over-indebted borrowers in villages with high market penetration, giving us a sufficient sample to draw conclusions on the drivers of over-indebtedness. For this reason, we decided to conduct this study in the 44 villages with the highest market penetration and in which all eight partner MFIs have operations. Once the locations were selected and agreed with all eight partner MFIs, the MFIs shared with us individual client data from their MIS for all their clients in the villages selected (a total of 10,266 clients). The client data from the MIS included the client
17
Schicks, J. 2011. Over-Indebtedness of Microborrowers in Ghana An Empirical Study from a Customer Protection Perspective. Center for Financial Inclusion Publication No. 15

Study on the Drivers of Over-Indebtedness of Microfinance Borrowers in Cambodia 24
name, gender, age or date of birth, village, commune, district, province, identification type, identification number, spouse name, spouse age, and loan information (lending methodology, loan size, loan cycle, PAR 30, etc.). We merged all this data to create a sampling frame (herewith referred to as the Sampling Frame Database). Using this Sampling Frame Database, we identified borrowers with multiple loans by filtering for the same identification number and village, and we then double-checked each case one-by-one to ensure that the name, age and other relevant information were also the same. A sample of 1,500 borrowers were randomly selected from the Sampling Frame Database, and then stratified by gender, geography, multiple loans, and lending methodology to compare with the profile of the total borrower population to ensure it was consistent and representative.
3.2.2. Step Two: Analysis of Objective Measure (Desk Review) Subsequently, with the collaboration of the eight partner MFIs, the research team conducted a desk review of the 1,500 borrowers by visiting the MFIs’ branch offices. During the desk review, we collected the most recent data on the net incomes, debts, economic activities and socioeconomic profile (household size, education, etc.) from the clients’ loan files. The client data collected from the desk review were consolidated into one database (herewith referred to as the Desk Review Database), which is the primary dataset used in the analysis of objective OID. The desk review was conducted from September to October 2012, gathering the most recent client data.
3.2.3. Step Three: Analysis of Subjective Measure (Survey) The third step of our study was to collect additional, qualitative data to deepen our understanding of the drivers of OID, the profile of OID borrowers and the borrowers’ perceptions of their debt burden (subjective measure of OID). This data was gathered through face-to-face interviews with a planned sample of 500 borrowers (of whom a total of 465 borrowers were successfully interviewed). The sample was drawn from the Desk Review Database from Step 2 and included insolvent as well as solvent borrowers. Insolvent borrowers were over-sampled to ensure that there would be a sufficient sample to make a conclusive analysis. The main objective of this step was to assess the borrowers’ own perceptions of their debt burden as well as to get a deeper and more qualitative understanding of the struggles and sacrifices that borrowers make to repay their debts. The aim was also to assess whether there are some common behavioral or socioeconomic characteristics of OID borrowers. This data was collected through a structured questionnaire based on 6 sections:
Study on the Drivers of Over-Indebtedness of Microfinance Borrowers in Cambodia 25
Section 1: Socioeconomic Characteristics: gender, education, household size, number of income earners, marital status
Section 2: Household Expenses: average monthly household spending such as on food, health, housing, fuel, transportation utilities, social affairs and household assets
Section 3: Economic Activities and Income: data on production volume, revenue and expenses of all household economic activities and income sources (wage, remittances, retirement), regularity of income, volatility of income, adverse shocks over the past 12 months
Section 4: Debt: data on loan use, loan repayment sources, financial literacy, and risk appetite
Section 5: Struggles and Sacrifices: data on whether the borrower was struggling, his/her perceptions of debt burden, late repayment, and sacrifices made over the past 12 months to meet loan repayments
Section 6: Experience with MFI – Borrower’s evaluation of MFIs’ service, terms and products, likelihood of borrowing again
The questionnaire was translated from English into Khmer. Interviewers received rigorous training on the project concept and questionnaire beforehand. They were also trained to explain and reiterate to the interviewees that the data collected was confidential and would not affect their future borrowings with MFIs, and that the research team was not an agent of the MFIs. Before the survey was officially launched, a pre-test was conducted to 1) evaluate the understanding, capabilities and readiness of interviewers and 2) check the appropriateness of the questions. There were no changes made to the questionnaire after the pre-test. The survey was carried out from October to December 2012.
3.3. Scope of Study and Limitations While this study tried to be as comprehensive as possible, the absence of key data on microfinance borrowers and multiple borrowing at the village level posed some constraints in the design of the research methodology and scope of the study. The limitations are:
Coverage: Because of the absence of Credit Bureau individual client data, it was not possible for us to randomly pick borrowers throughout Cambodia to build a sufficiently large sample of borrowers in a potential situation of multiple borrowing and/or over-indebtedness in order to conduct rigorous statistical analysis and draw relevant conclusions. We therefore purposely concentrated our efforts on saturated areas only. As will be illustrated in a subsequent section, saturated villages represented only 6% of total villages in Cambodia. Nevertheless, since our intent is to explore the drivers of over-indebtedness rather than to measure the magnitude of over-indebtedness, looking at this confined coverage area is appropriate to the purposes of this study.
Market penetration: To identify “saturated” areas, this study calculated market penetration by dividing the total loan accounts with the household population in a specific village (definition and method of calculation described
Study on the Drivers of Over-Indebtedness of Microfinance Borrowers in Cambodia 26
in Section 4). If a borrower has more than one loan, he/she is counted twice. Therefore, our definition does not measure the absorption of the market. This indicator was used solely for the purpose of identifying villages with multiple loans and thus, possible situations of over-indebtedness.
Household data based on 2008 Population Census. The most recent and comprehensive dataset on household population at the village level is the 2008 Population Census. As the population grew at a pace of 1.5% per annum on average18, our market penetration rates are slightly overestimated by roughly 0.4%. This overestimation is marginal and does not substantially impact our analysis, which aimed to identify villages with high incidence of multiple lending and possible situation of over-indebtedness. However, new villages created after the census, which MFIs are currently serving, are not included in this analysis because of the absence of household population data.
Correlation does not imply causality. In this study, our descriptive and econometric analyses look at the correlation of key factors and over-indebtedness. Correlation of two factors means that they tend to occur together, and does not necessarily mean causation. However, in order to know causality, it is necessary to first confirm the correlation. Therefore, this study is an important first step to understanding what causes over-indebtedness of microfinance borrowers. The term “driver” in this study is not used to imply causality in the scientific sense.
18
National Institute of Statistics
Study on the Drivers of Over-Indebtedness of Microfinance Borrowers in Cambodia 27
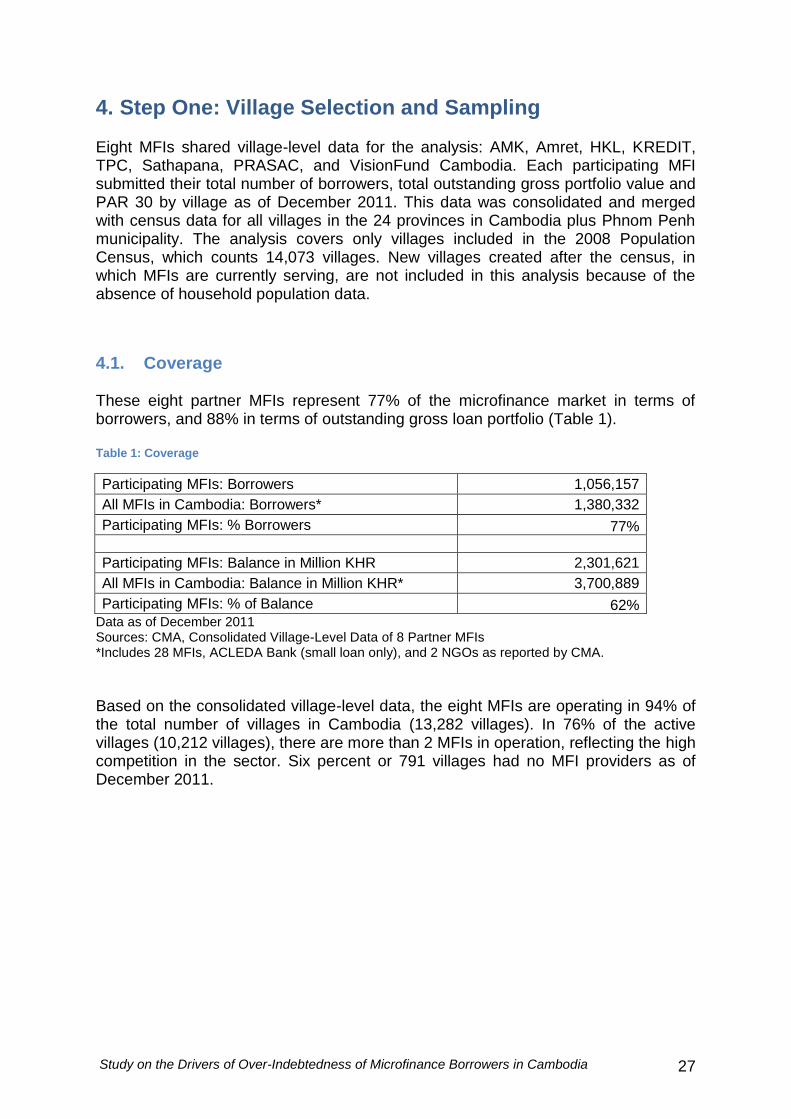
4. Step One: Village Selection and Sampling Eight MFIs shared village-level data for the analysis: AMK, Amret, HKL, KREDIT, TPC, Sathapana, PRASAC, and VisionFund Cambodia. Each participating MFI submitted their total number of borrowers, total outstanding gross portfolio value and PAR 30 by village as of December 2011. This data was consolidated and merged with census data for all villages in the 24 provinces in Cambodia plus Phnom Penh municipality. The analysis covers only villages included in the 2008 Population Census, which counts 14,073 villages. New villages created after the census, in which MFIs are currently serving, are not included in this analysis because of the absence of household population data.
4.1. Coverage These eight partner MFIs represent 77% of the microfinance market in terms of borrowers, and 88% in terms of outstanding gross loan portfolio (Table 1). Table 1: Coverage
Participating MFIs: Borrowers 1,056,157
All MFIs in Cambodia: Borrowers* 1,380,332
Participating MFIs: % Borrowers 77%
Participating MFIs: Balance in Million KHR 2,301,621
All MFIs in Cambodia: Balance in Million KHR* 3,700,889
Participating MFIs: % of Balance 62% Data as of December 2011 Sources: CMA, Consolidated Village-Level Data of 8 Partner MFIs *Includes 28 MFIs, ACLEDA Bank (small loan only), and 2 NGOs as reported by CMA.
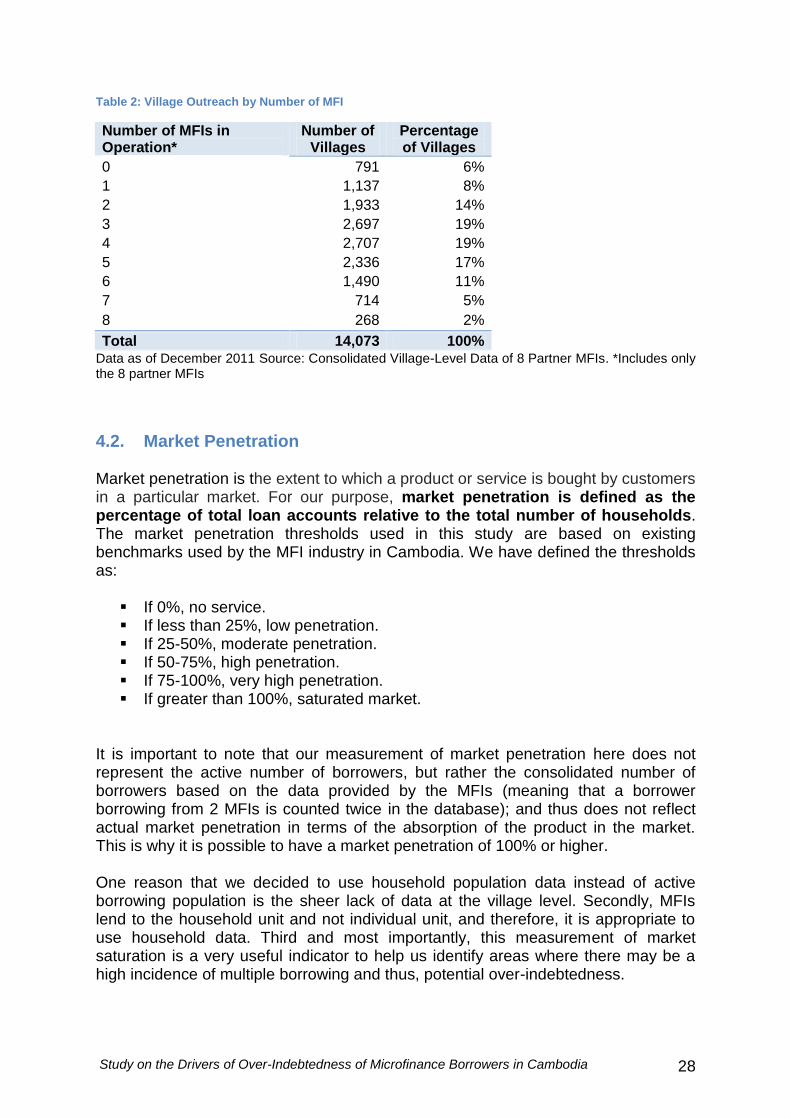
Based on the consolidated village-level data, the eight MFIs are operating in 94% of the total number of villages in Cambodia (13,282 villages). In 76% of the active villages (10,212 villages), there are more than 2 MFIs in operation, reflecting the high competition in the sector. Six percent or 791 villages had no MFI providers as of December 2011.
Study on the Drivers of Over-Indebtedness of Microfinance Borrowers in Cambodia 28
Table 2: Village Outreach by Number of MFI
Number of MFIs in Operation*
Number of Villages
Percentage of Villages
0 791 6%
1 1,137 8%
2 1,933 14%
3 2,697 19%
4 2,707 19%
5 2,336 17%
6 1,490 11%
7 714 5%
8 268 2%
Total 14,073 100% Data as of December 2011 Source: Consolidated Village-Level Data of 8 Partner MFIs. *Includes only the 8 partner MFIs
4.2. Market Penetration Market penetration is the extent to which a product or service is bought by customers in a particular market. For our purpose, market penetration is defined as the percentage of total loan accounts relative to the total number of households. The market penetration thresholds used in this study are based on existing benchmarks used by the MFI industry in Cambodia. We have defined the thresholds as:
If 0%, no service. If less than 25%, low penetration. If 25-50%, moderate penetration. If 50-75%, high penetration. If 75-100%, very high penetration. If greater than 100%, saturated market.
It is important to note that our measurement of market penetration here does not represent the active number of borrowers, but rather the consolidated number of borrowers based on the data provided by the MFIs (meaning that a borrower borrowing from 2 MFIs is counted twice in the database); and thus does not reflect actual market penetration in terms of the absorption of the product in the market. This is why it is possible to have a market penetration of 100% or higher. One reason that we decided to use household population data instead of active borrowing population is the sheer lack of data at the village level. Secondly, MFIs lend to the household unit and not individual unit, and therefore, it is appropriate to use household data. Third and most importantly, this measurement of market saturation is a very useful indicator to help us identify areas where there may be a high incidence of multiple borrowing and thus, potential over-indebtedness.
Study on the Drivers of Over-Indebtedness of Microfinance Borrowers in Cambodia 29
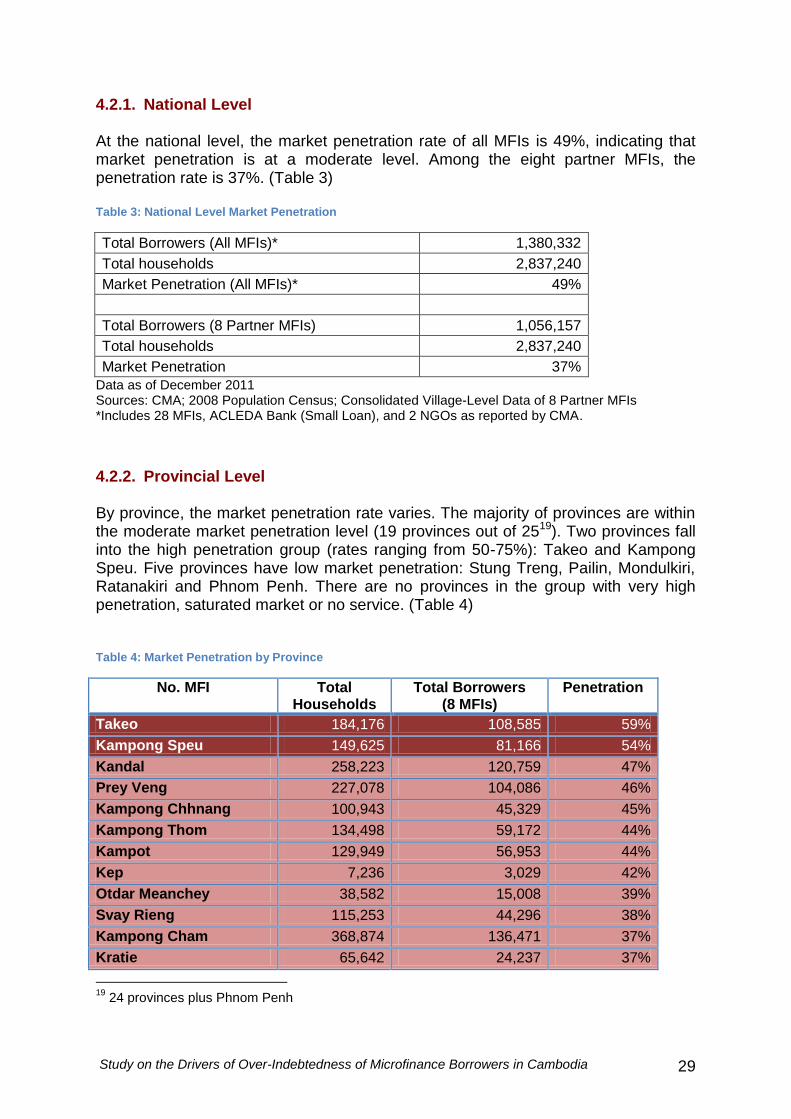
4.2.1. National Level At the national level, the market penetration rate of all MFIs is 49%, indicating that market penetration is at a moderate level. Among the eight partner MFIs, the penetration rate is 37%. (Table 3) Table 3: National Level Market Penetration
Total Borrowers (All MFIs)* 1,380,332
Total households 2,837,240
Market Penetration (All MFIs)* 49%
Total Borrowers (8 Partner MFIs) 1,056,157
Total households 2,837,240
Market Penetration 37%
Data as of December 2011 Sources: CMA; 2008 Population Census; Consolidated Village-Level Data of 8 Partner MFIs *Includes 28 MFIs, ACLEDA Bank (Small Loan), and 2 NGOs as reported by CMA.
4.2.2. Provincial Level By province, the market penetration rate varies. The majority of provinces are within the moderate market penetration level (19 provinces out of 2519). Two provinces fall into the high penetration group (rates ranging from 50-75%): Takeo and Kampong Speu. Five provinces have low market penetration: Stung Treng, Pailin, Mondulkiri, Ratanakiri and Phnom Penh. There are no provinces in the group with very high penetration, saturated market or no service. (Table 4) Table 4: Market Penetration by Province
No. MFI Total Households
Total Borrowers (8 MFIs)
Penetration
Takeo 184,176 108,585 59%
Kampong Speu 149,625 81,166 54%
Kandal 258,223 120,759 47%
Prey Veng 227,078 104,086 46%
Kampong Chhnang 100,943 45,329 45%
Kampong Thom 134,498 59,172 44%
Kampot 129,949 56,953 44%
Kep 7,236 3,029 42%
Otdar Meanchey 38,582 15,008 39%
Svay Rieng 115,253 44,296 38%
Kampong Cham 368,874 136,471 37%
Kratie 65,642 24,237 37%
19
24 provinces plus Phnom Penh
Study on the Drivers of Over-Indebtedness of Microfinance Borrowers in Cambodia 30
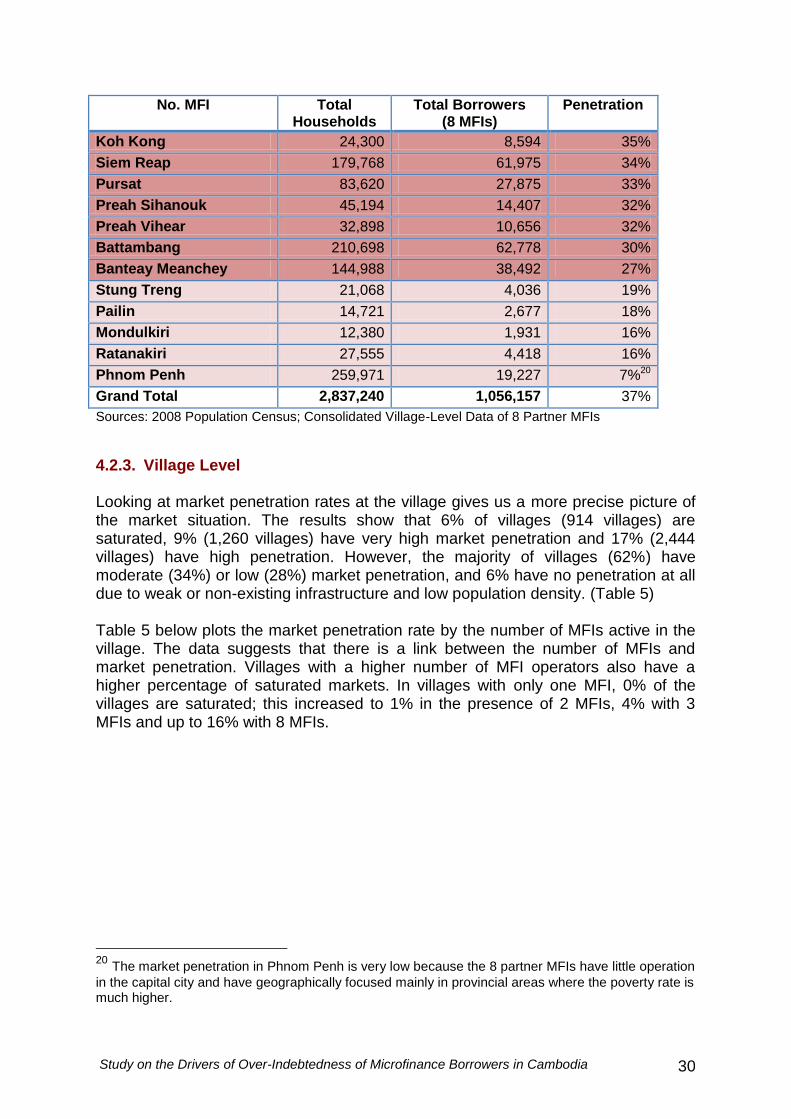
No. MFI Total Households
Total Borrowers (8 MFIs)
Penetration
Koh Kong 24,300 8,594 35%
Siem Reap 179,768 61,975 34%
Pursat 83,620 27,875 33%
Preah Sihanouk 45,194 14,407 32%
Preah Vihear 32,898 10,656 32%
Battambang 210,698 62,778 30%
Banteay Meanchey 144,988 38,492 27%
Stung Treng 21,068 4,036 19%
Pailin 14,721 2,677 18%
Mondulkiri 12,380 1,931 16%
Ratanakiri 27,555 4,418 16%
Phnom Penh 259,971 19,227 7%20
Grand Total 2,837,240 1,056,157 37%
Sources: 2008 Population Census; Consolidated Village-Level Data of 8 Partner MFIs
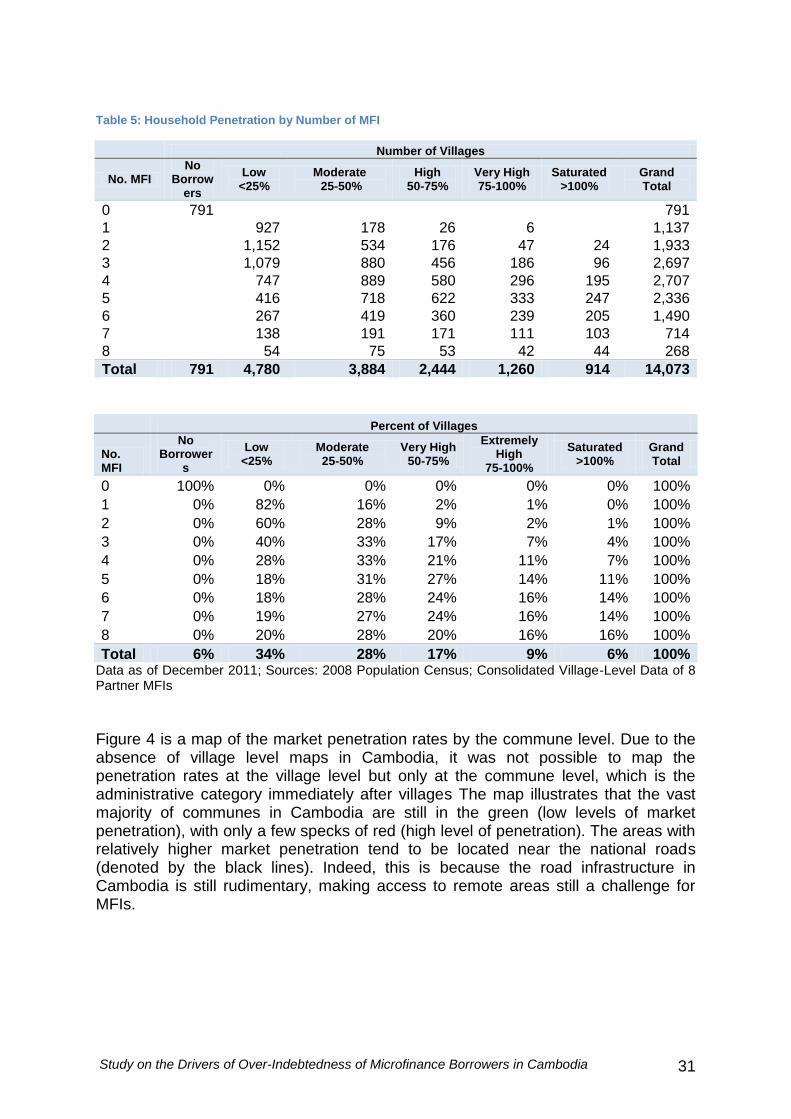
4.2.3. Village Level Looking at market penetration rates at the village gives us a more precise picture of the market situation. The results show that 6% of villages (914 villages) are saturated, 9% (1,260 villages) have very high market penetration and 17% (2,444 villages) have high penetration. However, the majority of villages (62%) have moderate (34%) or low (28%) market penetration, and 6% have no penetration at all due to weak or non-existing infrastructure and low population density. (Table 5) Table 5 below plots the market penetration rate by the number of MFIs active in the village. The data suggests that there is a link between the number of MFIs and market penetration. Villages with a higher number of MFI operators also have a higher percentage of saturated markets. In villages with only one MFI, 0% of the villages are saturated; this increased to 1% in the presence of 2 MFIs, 4% with 3 MFIs and up to 16% with 8 MFIs.
20 The market penetration in Phnom Penh is very low because the 8 partner MFIs have little operation
in the capital city and have geographically focused mainly in provincial areas where the poverty rate is much higher.
Study on the Drivers of Over-Indebtedness of Microfinance Borrowers in Cambodia 31
Table 5: Household Penetration by Number of MFI
Number of Villages
No. MFI No
Borrowers
Low <25%
Moderate 25-50%
High 50-75%
Very High 75-100%
Saturated >100%
Grand Total
0 791
791
1
927 178 26 6
1,137
2
1,152 534 176 47 24 1,933
3
1,079 880 456 186 96 2,697
4
747 889 580 296 195 2,707
5
416 718 622 333 247 2,336
6
267 419 360 239 205 1,490
7
138 191 171 111 103 714
8
54 75 53 42 44 268
Total 791 4,780 3,884 2,444 1,260 914 14,073
Percent of Villages
No. MFI
No Borrower
s
Low <25%
Moderate 25-50%
Very High 50-75%
Extremely High
75-100%
Saturated >100%
Grand Total
0 100% 0% 0% 0% 0% 0% 100%
1 0% 82% 16% 2% 1% 0% 100%
2 0% 60% 28% 9% 2% 1% 100%
3 0% 40% 33% 17% 7% 4% 100%
4 0% 28% 33% 21% 11% 7% 100%
5 0% 18% 31% 27% 14% 11% 100%
6 0% 18% 28% 24% 16% 14% 100%
7 0% 19% 27% 24% 16% 14% 100%
8 0% 20% 28% 20% 16% 16% 100%
Total 6% 34% 28% 17% 9% 6% 100% Data as of December 2011; Sources: 2008 Population Census; Consolidated Village-Level Data of 8 Partner MFIs
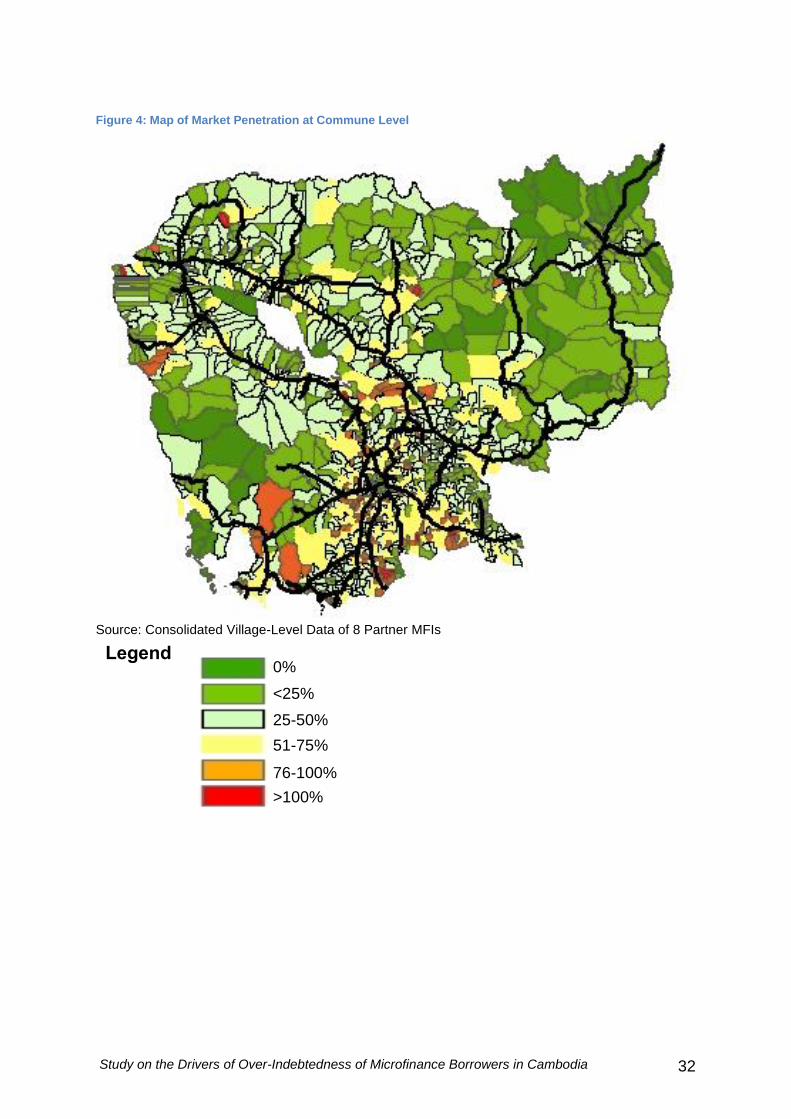
Figure 4 is a map of the market penetration rates by the commune level. Due to the absence of village level maps in Cambodia, it was not possible to map the penetration rates at the village level but only at the commune level, which is the administrative category immediately after villages The map illustrates that the vast majority of communes in Cambodia are still in the green (low levels of market penetration), with only a few specks of red (high level of penetration). The areas with relatively higher market penetration tend to be located near the national roads (denoted by the black lines). Indeed, this is because the road infrastructure in Cambodia is still rudimentary, making access to remote areas still a challenge for MFIs.
Study on the Drivers of Over-Indebtedness of Microfinance Borrowers in Cambodia 32
Figure 4: Map of Market Penetration at Commune Level
Source: Consolidated Village-Level Data of 8 Partner MFIs
Legend 0% <25% 25-50% 51-75% 76-100% >100%

Study on the Drivers of Over-Indebtedness of Microfinance Borrowers in Cambodia 33
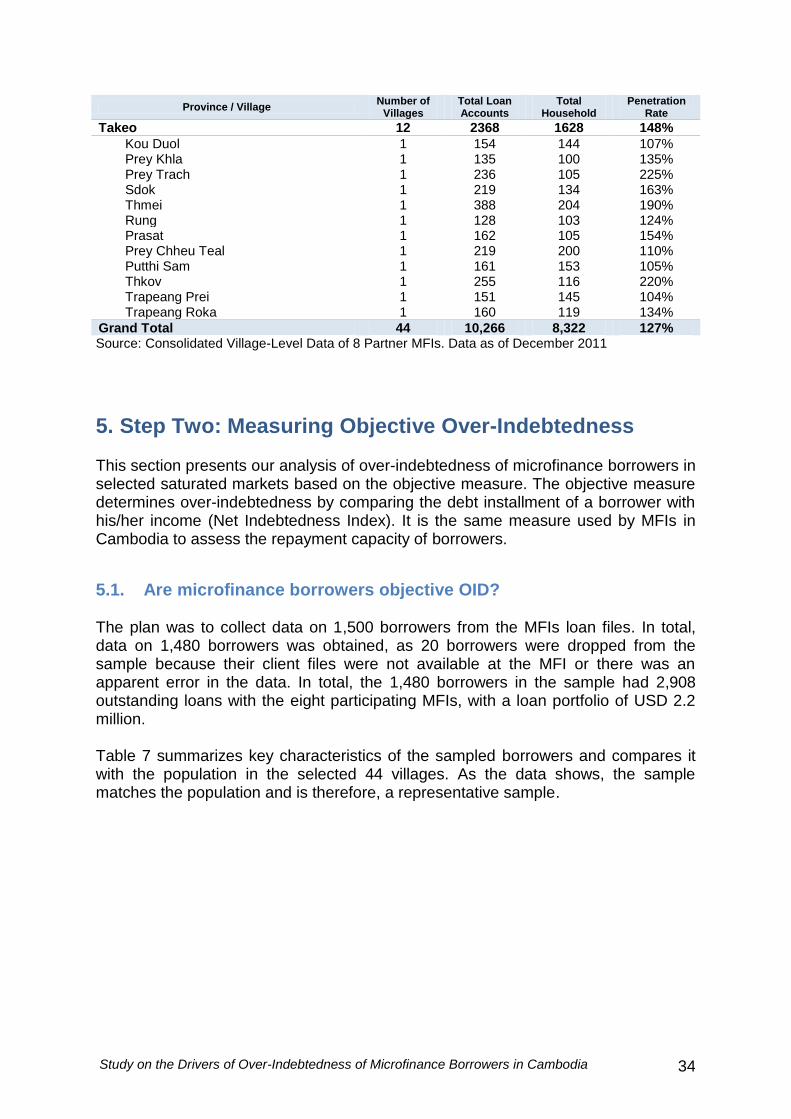
4.3. Village Selection For our purpose of selecting villages for the survey, we are interested in the villages with the highest market penetration. Our assumption is that there is a greater likelihood to find more over-indebted borrowers in villages with high market penetration, thus, giving us a sufficient sample to better understand on the drivers of over-indebtedness. As Table 6 shows, 914 villages have a greater than 100% penetration rate, and among this group, all eight MFIs are active in 44 villages. These were the 44 villages selected for this study. The 44 villages are located in 7 different provinces: Battambang, Kampong Cham, Kampong Speu, Kampong Chhnang, Kandal, Siem Reap and Takeo. In the 44 selected villages, there are a total of 10,266 loan accounts. Table 6: Villages with Penetration > 100% and 8 MFIs Active
Province / Village Number of
Villages Total Loan Accounts
Total Household
Penetration Rate
Battambang 1 387 365 106%
Koun Khlong 1 387 365 106% Kampong Cham 11 2071 1769 119%
Kok Kandal 1 118 71 166% Ou Ta Nov 1 245 239 103% Samraong 1 187 156 120% Tong Rong 1 145 124 117% Trapeang Ampil 1 110 109 101% Tuek Nuem 1 145 127 114% Angkor Chey 1 448 358 125% Kokir 1 125 118 106% Lngieng 1 217 182 119% Poun 1 91 72 126% Prey Kampeaeng 1 240 213 113%
Kampong Chhnang 2 564 408 139%
Phsar Trach 1 326 241 135% Thma Edth 1 238 167 143%
Kampong Speu 1 201 191 105%
Damnak Smach 1 201 191 105% Kandal 12 3475 2987 117%
Chambak 1 224 218 103% Chhmar Puon 1 225 177 127% Krapeu Troum 1 250 203 123% Prachum Angk 1 265 224 118% Prey Totueng 1 225 204 110% Chong Kaoh Kor 1 233 172 135% Peam Prachum 1 311 268 116% Preaek Kaev 1 317 259 122% Preaek Pang 1 295 244 121% Roka Leu 1 426 365 117% Tuol Sala 1 357 326 110% Veal 1 347 327 106%
Siem Reap 5 1200 974 126%
Anlong Pir 1 267 199 134% Chambak 1 348 322 108% Chea Sman 1 181 161 112% Kouk Ruessei Tboung 1 160 122 131% Srama Thum 1 244 170 144%
Study on the Drivers of Over-Indebtedness of Microfinance Borrowers in Cambodia 34
Province / Village Number of
Villages Total Loan Accounts
Total Household
Penetration Rate
Takeo 12 2368 1628 148%
Kou Duol 1 154 144 107% Prey Khla 1 135 100 135% Prey Trach 1 236 105 225% Sdok 1 219 134 163% Thmei 1 388 204 190% Rung 1 128 103 124% Prasat 1 162 105 154% Prey Chheu Teal 1 219 200 110% Putthi Sam 1 161 153 105% Thkov 1 255 116 220% Trapeang Prei 1 151 145 104% Trapeang Roka 1 160 119 134%
Grand Total 44 10,266 8,322 127% Source: Consolidated Village-Level Data of 8 Partner MFIs. Data as of December 2011
5. Step Two: Measuring Objective Over-Indebtedness This section presents our analysis of over-indebtedness of microfinance borrowers in selected saturated markets based on the objective measure. The objective measure determines over-indebtedness by comparing the debt installment of a borrower with his/her income (Net Indebtedness Index). It is the same measure used by MFIs in Cambodia to assess the repayment capacity of borrowers.
5.1. Are microfinance borrowers objective OID? The plan was to collect data on 1,500 borrowers from the MFIs loan files. In total, data on 1,480 borrowers was obtained, as 20 borrowers were dropped from the sample because their client files were not available at the MFI or there was an apparent error in the data. In total, the 1,480 borrowers in the sample had 2,908 outstanding loans with the eight participating MFIs, with a loan portfolio of USD 2.2 million. Table 7 summarizes key characteristics of the sampled borrowers and compares it with the population in the selected 44 villages. As the data shows, the sample matches the population and is therefore, a representative sample.
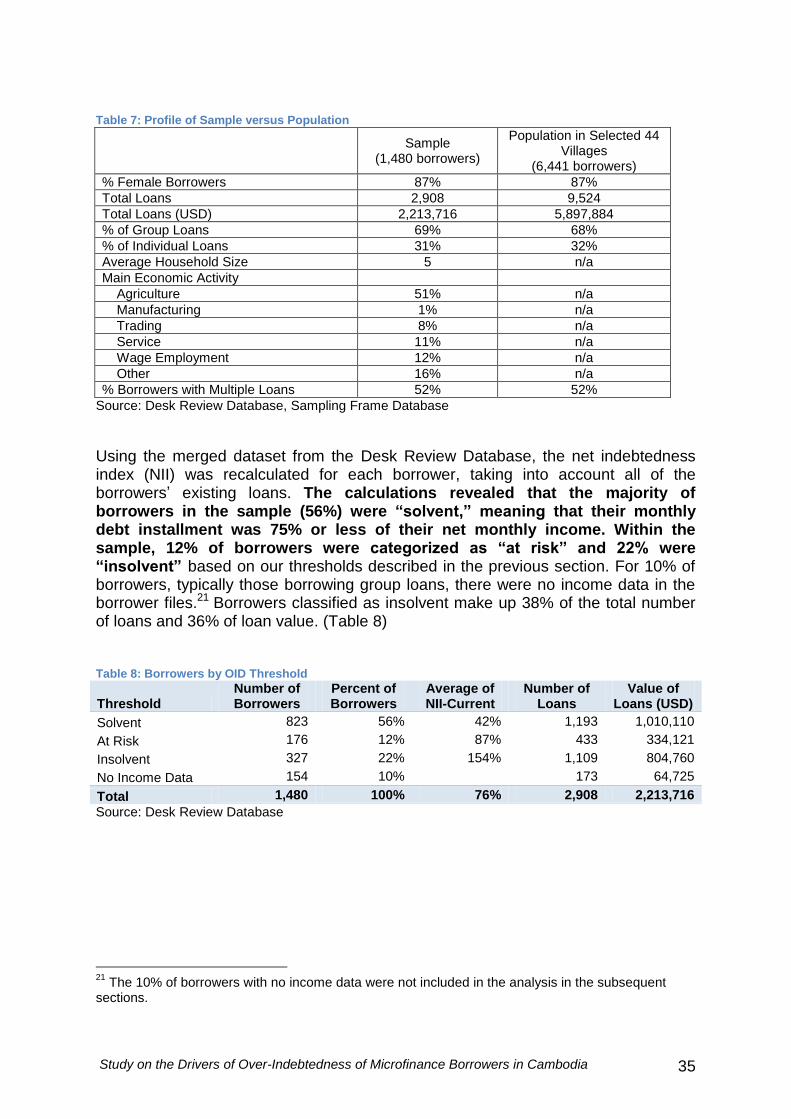
Study on the Drivers of Over-Indebtedness of Microfinance Borrowers in Cambodia 35
Table 7: Profile of Sample versus Population
Sample
(1,480 borrowers)
Population in Selected 44 Villages
(6,441 borrowers)
% Female Borrowers 87% 87%
Total Loans 2,908 9,524
Total Loans (USD) 2,213,716 5,897,884
% of Group Loans 69% 68%
% of Individual Loans 31% 32%
Average Household Size 5 n/a
Main Economic Activity
Agriculture 51% n/a
Manufacturing 1% n/a
Trading 8% n/a
Service 11% n/a
Wage Employment 12% n/a
Other 16% n/a
% Borrowers with Multiple Loans 52% 52%
Source: Desk Review Database, Sampling Frame Database
Using the merged dataset from the Desk Review Database, the net indebtedness index (NII) was recalculated for each borrower, taking into account all of the borrowers’ existing loans. The calculations revealed that the majority of borrowers in the sample (56%) were “solvent,” meaning that their monthly debt installment was 75% or less of their net monthly income. Within the sample, 12% of borrowers were categorized as “at risk” and 22% were “insolvent” based on our thresholds described in the previous section. For 10% of borrowers, typically those borrowing group loans, there were no income data in the borrower files.21 Borrowers classified as insolvent make up 38% of the total number of loans and 36% of loan value. (Table 8) Table 8: Borrowers by OID Threshold
Threshold Number of Borrowers
Percent of Borrowers
Average of NII-Current
Number of Loans
Value of Loans (USD)
Solvent 823 56% 42% 1,193 1,010,110
At Risk 176 12% 87% 433 334,121
Insolvent 327 22% 154% 1,109 804,760
No Income Data 154 10%
173 64,725
Total 1,480 100% 76% 2,908 2,213,716
Source: Desk Review Database
21
The 10% of borrowers with no income data were not included in the analysis in the subsequent sections.
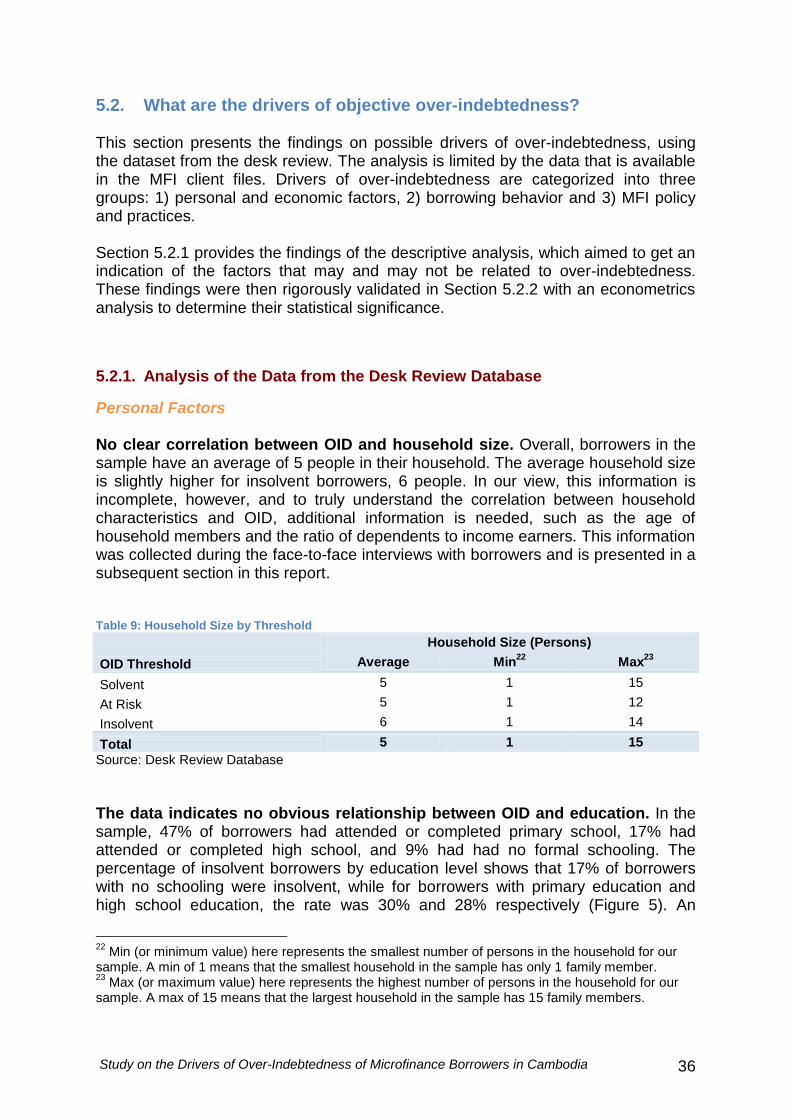
Study on the Drivers of Over-Indebtedness of Microfinance Borrowers in Cambodia 36
5.2. What are the drivers of objective over-indebtedness? This section presents the findings on possible drivers of over-indebtedness, using the dataset from the desk review. The analysis is limited by the data that is available in the MFI client files. Drivers of over-indebtedness are categorized into three groups: 1) personal and economic factors, 2) borrowing behavior and 3) MFI policy and practices. Section 5.2.1 provides the findings of the descriptive analysis, which aimed to get an indication of the factors that may and may not be related to over-indebtedness. These findings were then rigorously validated in Section 5.2.2 with an econometrics analysis to determine their statistical significance.
5.2.1. Analysis of the Data from the Desk Review Database
Personal Factors No clear correlation between OID and household size. Overall, borrowers in the sample have an average of 5 people in their household. The average household size is slightly higher for insolvent borrowers, 6 people. In our view, this information is incomplete, however, and to truly understand the correlation between household characteristics and OID, additional information is needed, such as the age of household members and the ratio of dependents to income earners. This information was collected during the face-to-face interviews with borrowers and is presented in a subsequent section in this report. Table 9: Household Size by Threshold
Household Size (Persons)
OID Threshold Average Min22
Max23
Solvent 5 1 15
At Risk 5 1 12
Insolvent 6 1 14
Total 5 1 15
Source: Desk Review Database
The data indicates no obvious relationship between OID and education. In the sample, 47% of borrowers had attended or completed primary school, 17% had attended or completed high school, and 9% had had no formal schooling. The percentage of insolvent borrowers by education level shows that 17% of borrowers with no schooling were insolvent, while for borrowers with primary education and high school education, the rate was 30% and 28% respectively (Figure 5). An
22
Min (or minimum value) here represents the smallest number of persons in the household for our sample. A min of 1 means that the smallest household in the sample has only 1 family member. 23
Max (or maximum value) here represents the highest number of persons in the household for our sample. A max of 15 means that the largest household in the sample has 15 family members.
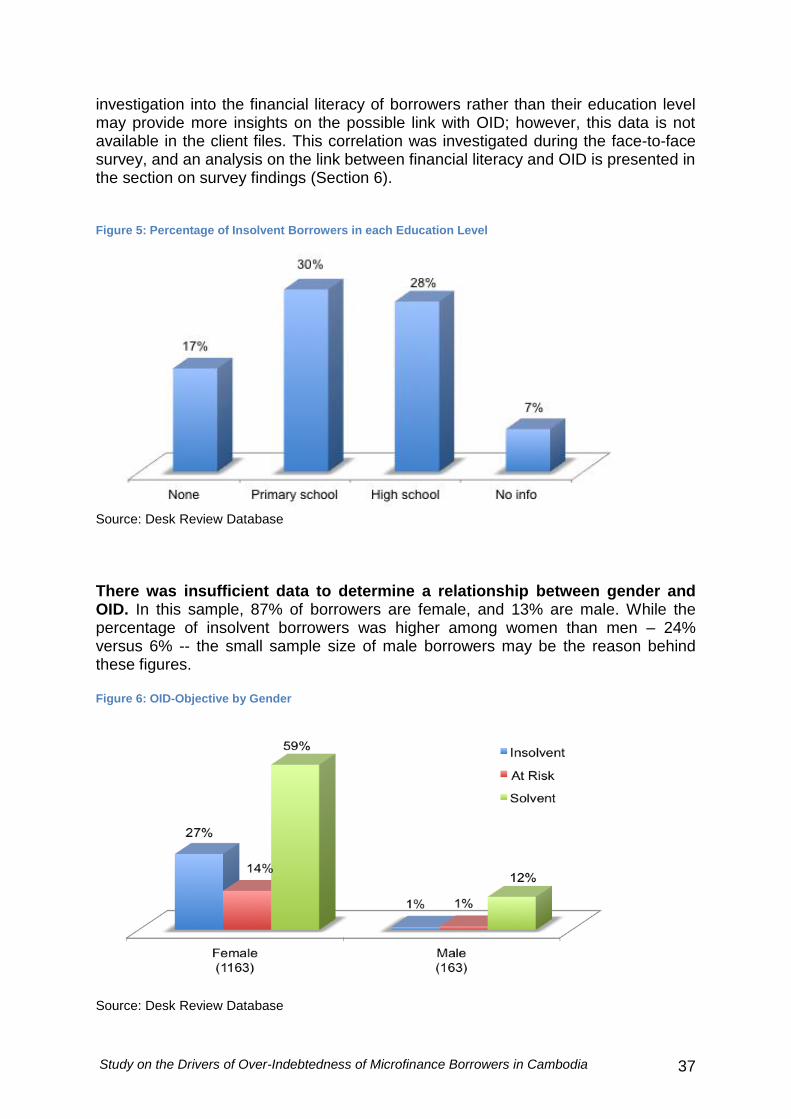
Study on the Drivers of Over-Indebtedness of Microfinance Borrowers in Cambodia 37
investigation into the financial literacy of borrowers rather than their education level may provide more insights on the possible link with OID; however, this data is not available in the client files. This correlation was investigated during the face-to-face survey, and an analysis on the link between financial literacy and OID is presented in the section on survey findings (Section 6). Figure 5: Percentage of Insolvent Borrowers in each Education Level
Source: Desk Review Database
There was insufficient data to determine a relationship between gender and OID. In this sample, 87% of borrowers are female, and 13% are male. While the percentage of insolvent borrowers was higher among women than men – 24% versus 6% -- the small sample size of male borrowers may be the reason behind these figures. Figure 6: OID-Objective by Gender
Source: Desk Review Database
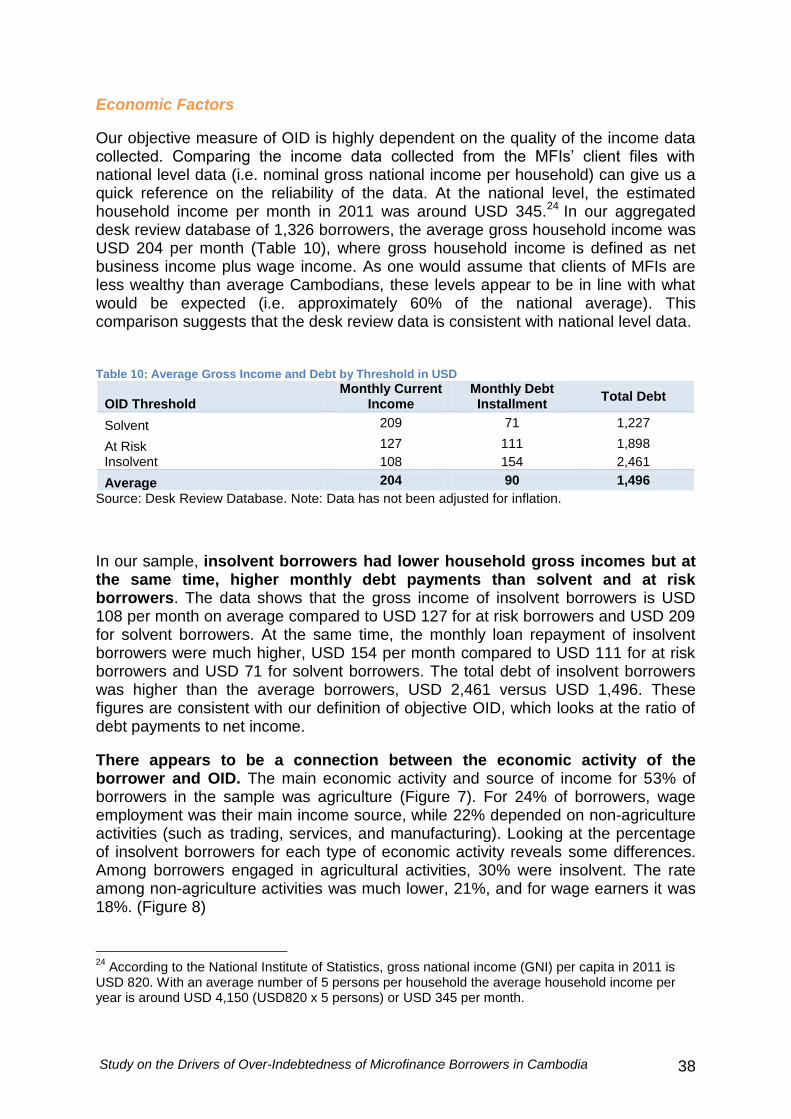
Study on the Drivers of Over-Indebtedness of Microfinance Borrowers in Cambodia 38
Economic Factors
Our objective measure of OID is highly dependent on the quality of the income data collected. Comparing the income data collected from the MFIs’ client files with national level data (i.e. nominal gross national income per household) can give us a quick reference on the reliability of the data. At the national level, the estimated household income per month in 2011 was around USD 345.24 In our aggregated desk review database of 1,326 borrowers, the average gross household income was USD 204 per month (Table 10), where gross household income is defined as net business income plus wage income. As one would assume that clients of MFIs are less wealthy than average Cambodians, these levels appear to be in line with what would be expected (i.e. approximately 60% of the national average). This comparison suggests that the desk review data is consistent with national level data. Table 10: Average Gross Income and Debt by Threshold in USD
OID Threshold Monthly Current
Income Monthly Debt Installment
Total Debt
Solvent 209 71 1,227
At Risk 127 111 1,898
Insolvent 108 154 2,461
Average 204 90 1,496
Source: Desk Review Database. Note: Data has not been adjusted for inflation.
In our sample, insolvent borrowers had lower household gross incomes but at the same time, higher monthly debt payments than solvent and at risk borrowers. The data shows that the gross income of insolvent borrowers is USD 108 per month on average compared to USD 127 for at risk borrowers and USD 209 for solvent borrowers. At the same time, the monthly loan repayment of insolvent borrowers were much higher, USD 154 per month compared to USD 111 for at risk borrowers and USD 71 for solvent borrowers. The total debt of insolvent borrowers was higher than the average borrowers, USD 2,461 versus USD 1,496. These figures are consistent with our definition of objective OID, which looks at the ratio of debt payments to net income.
There appears to be a connection between the economic activity of the borrower and OID. The main economic activity and source of income for 53% of borrowers in the sample was agriculture (Figure 7). For 24% of borrowers, wage employment was their main income source, while 22% depended on non-agriculture activities (such as trading, services, and manufacturing). Looking at the percentage of insolvent borrowers for each type of economic activity reveals some differences. Among borrowers engaged in agricultural activities, 30% were insolvent. The rate among non-agriculture activities was much lower, 21%, and for wage earners it was 18%. (Figure 8)
24
According to the National Institute of Statistics, gross national income (GNI) per capita in 2011 is USD 820. With an average number of 5 persons per household the average household income per year is around USD 4,150 (USD820 x 5 persons) or USD 345 per month.
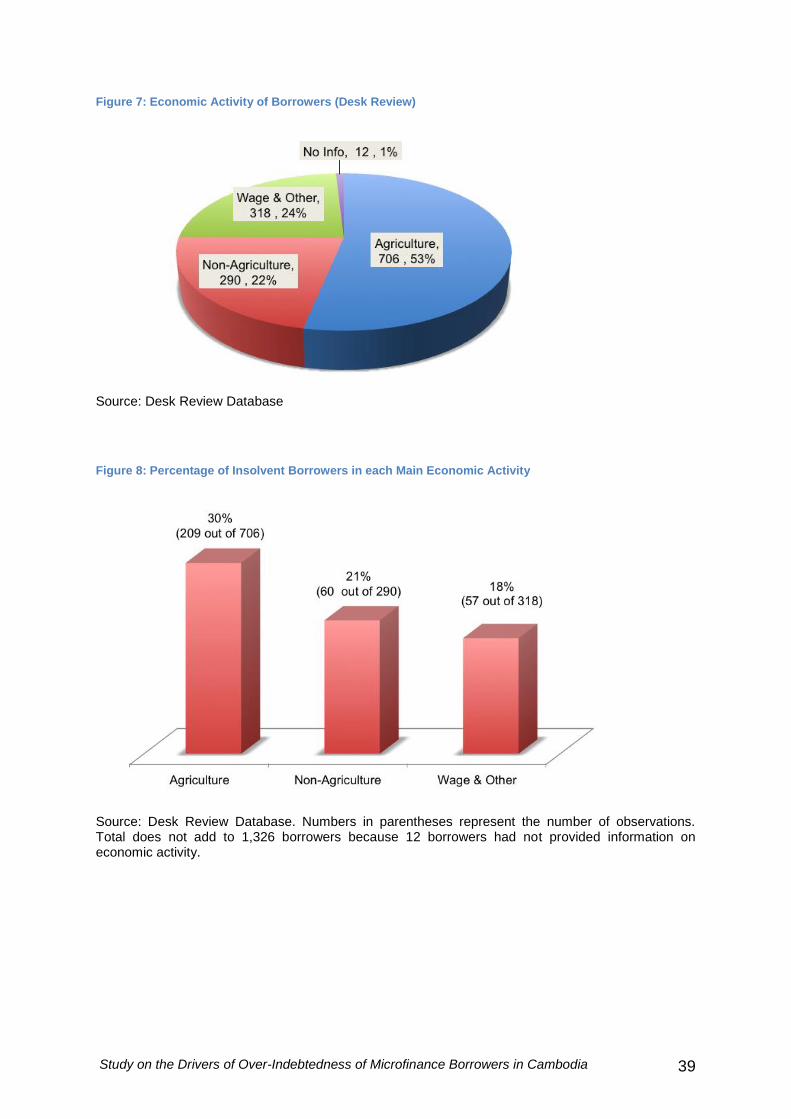
Study on the Drivers of Over-Indebtedness of Microfinance Borrowers in Cambodia 39
Figure 7: Economic Activity of Borrowers (Desk Review)
Source: Desk Review Database
Figure 8: Percentage of Insolvent Borrowers in each Main Economic Activity
Source: Desk Review Database. Numbers in parentheses represent the number of observations. Total does not add to 1,326 borrowers because 12 borrowers had not provided information on economic activity.
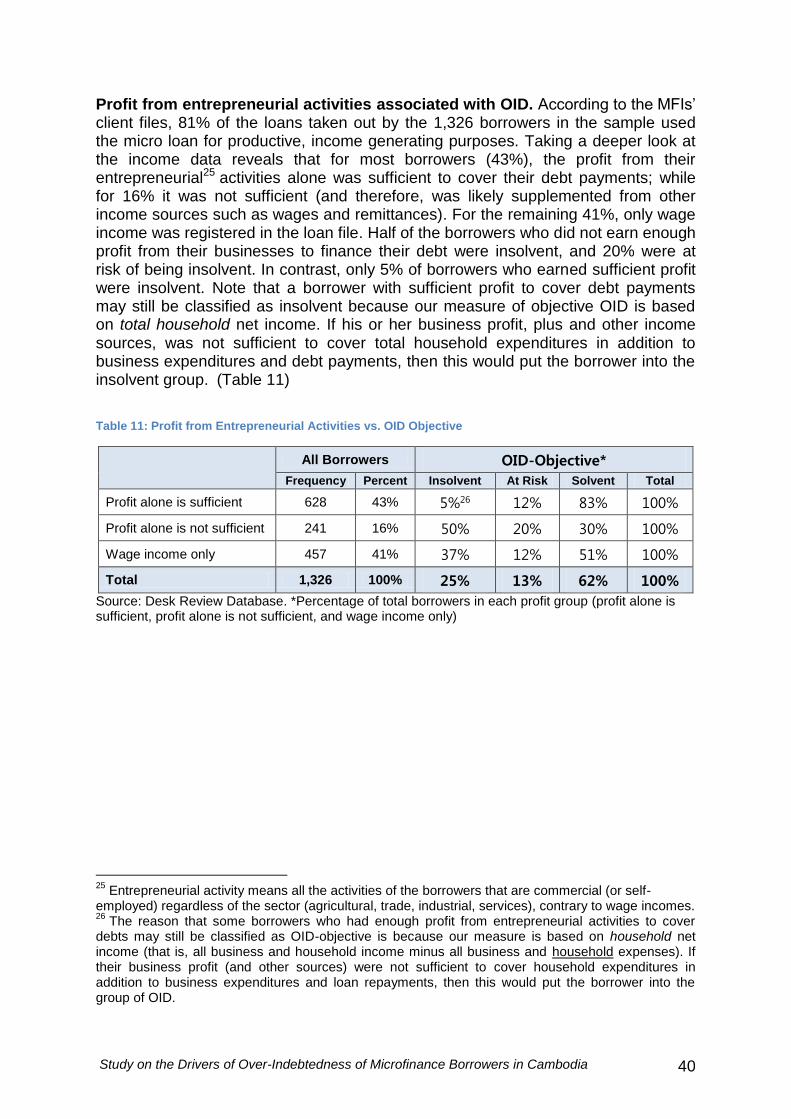
Study on the Drivers of Over-Indebtedness of Microfinance Borrowers in Cambodia 40
Profit from entrepreneurial activities associated with OID. According to the MFIs’ client files, 81% of the loans taken out by the 1,326 borrowers in the sample used the micro loan for productive, income generating purposes. Taking a deeper look at the income data reveals that for most borrowers (43%), the profit from their entrepreneurial25 activities alone was sufficient to cover their debt payments; while for 16% it was not sufficient (and therefore, was likely supplemented from other income sources such as wages and remittances). For the remaining 41%, only wage income was registered in the loan file. Half of the borrowers who did not earn enough profit from their businesses to finance their debt were insolvent, and 20% were at risk of being insolvent. In contrast, only 5% of borrowers who earned sufficient profit were insolvent. Note that a borrower with sufficient profit to cover debt payments may still be classified as insolvent because our measure of objective OID is based on total household net income. If his or her business profit, plus and other income sources, was not sufficient to cover total household expenditures in addition to business expenditures and debt payments, then this would put the borrower into the insolvent group. (Table 11) Table 11: Profit from Entrepreneurial Activities vs. OID Objective
All Borrowers OID-Objective*
Frequency Percent Insolvent At Risk Solvent Total
Profit alone is sufficient 628 43% 5%26 12% 83% 100%
Profit alone is not sufficient 241 16% 50% 20% 30% 100%
Wage income only 457 41% 37% 12% 51% 100%
Total 1,326 100% 25% 13% 62% 100%
Source: Desk Review Database. *Percentage of total borrowers in each profit group (profit alone is sufficient, profit alone is not sufficient, and wage income only)
25
Entrepreneurial activity means all the activities of the borrowers that are commercial (or self-employed) regardless of the sector (agricultural, trade, industrial, services), contrary to wage incomes. 26
The reason that some borrowers who had enough profit from entrepreneurial activities to cover debts may still be classified as OID-objective is because our measure is based on household net income (that is, all business and household income minus all business and household expenses). If their business profit (and other sources) were not sufficient to cover household expenditures in addition to business expenditures and loan repayments, then this would put the borrower into the group of OID.
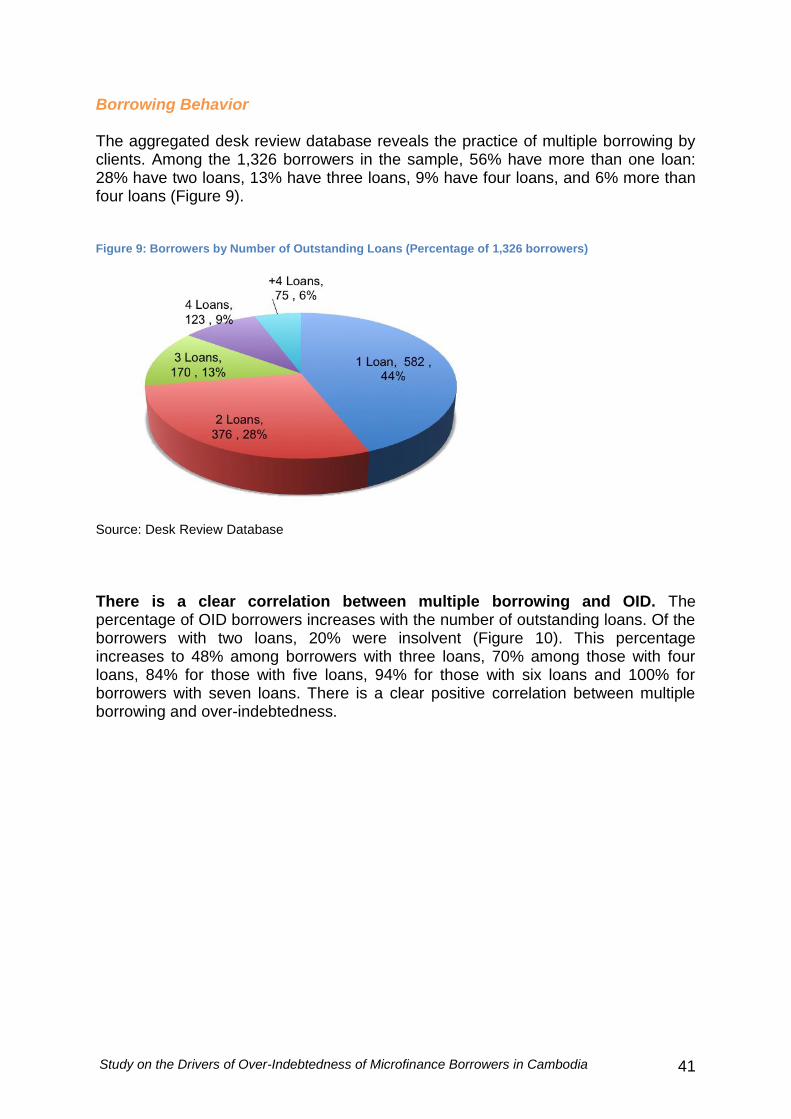
Study on the Drivers of Over-Indebtedness of Microfinance Borrowers in Cambodia 41
Borrowing Behavior The aggregated desk review database reveals the practice of multiple borrowing by clients. Among the 1,326 borrowers in the sample, 56% have more than one loan: 28% have two loans, 13% have three loans, 9% have four loans, and 6% more than four loans (Figure 9). Figure 9: Borrowers by Number of Outstanding Loans (Percentage of 1,326 borrowers)
Source: Desk Review Database
There is a clear correlation between multiple borrowing and OID. The percentage of OID borrowers increases with the number of outstanding loans. Of the borrowers with two loans, 20% were insolvent (Figure 10). This percentage increases to 48% among borrowers with three loans, 70% among those with four loans, 84% for those with five loans, 94% for those with six loans and 100% for borrowers with seven loans. There is a clear positive correlation between multiple borrowing and over-indebtedness.
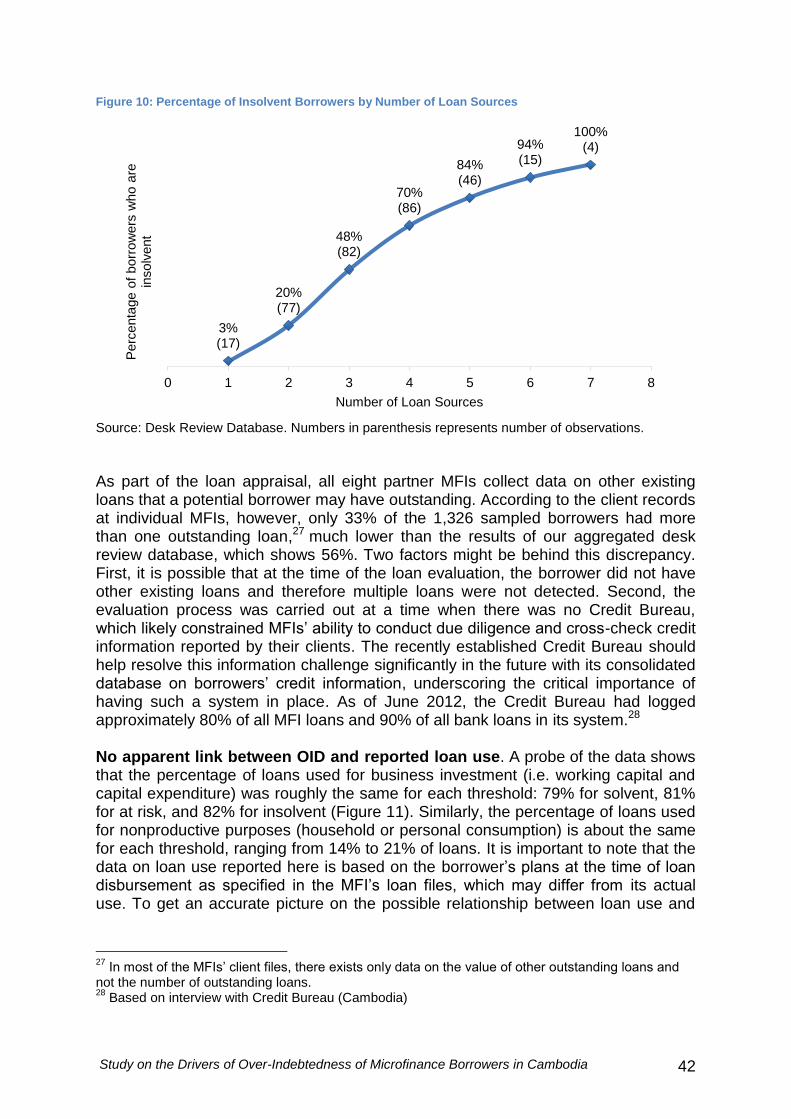
Study on the Drivers of Over-Indebtedness of Microfinance Borrowers in Cambodia 42
Figure 10: Percentage of Insolvent Borrowers by Number of Loan Sources
Source: Desk Review Database. Numbers in parenthesis represents number of observations.
As part of the loan appraisal, all eight partner MFIs collect data on other existing loans that a potential borrower may have outstanding. According to the client records at individual MFIs, however, only 33% of the 1,326 sampled borrowers had more than one outstanding loan,27 much lower than the results of our aggregated desk review database, which shows 56%. Two factors might be behind this discrepancy. First, it is possible that at the time of the loan evaluation, the borrower did not have other existing loans and therefore multiple loans were not detected. Second, the evaluation process was carried out at a time when there was no Credit Bureau, which likely constrained MFIs’ ability to conduct due diligence and cross-check credit information reported by their clients. The recently established Credit Bureau should help resolve this information challenge significantly in the future with its consolidated database on borrowers’ credit information, underscoring the critical importance of having such a system in place. As of June 2012, the Credit Bureau had logged approximately 80% of all MFI loans and 90% of all bank loans in its system.28 No apparent link between OID and reported loan use. A probe of the data shows that the percentage of loans used for business investment (i.e. working capital and capital expenditure) was roughly the same for each threshold: 79% for solvent, 81% for at risk, and 82% for insolvent (Figure 11). Similarly, the percentage of loans used for nonproductive purposes (household or personal consumption) is about the same for each threshold, ranging from 14% to 21% of loans. It is important to note that the data on loan use reported here is based on the borrower’s plans at the time of loan disbursement as specified in the MFI’s loan files, which may differ from its actual use. To get an accurate picture on the possible relationship between loan use and
27
In most of the MFIs’ client files, there exists only data on the value of other outstanding loans and not the number of outstanding loans. 28
Based on interview with Credit Bureau (Cambodia)
3% (17)
20% (77)
48% (82)
70% (86)
84% (46)
94% (15)
100% (4)
0 1 2 3 4 5 6 7 8
Perc
enta
ge o
f borr
ow
ers
who a
re
insolv
ent
Number of Loan Sources
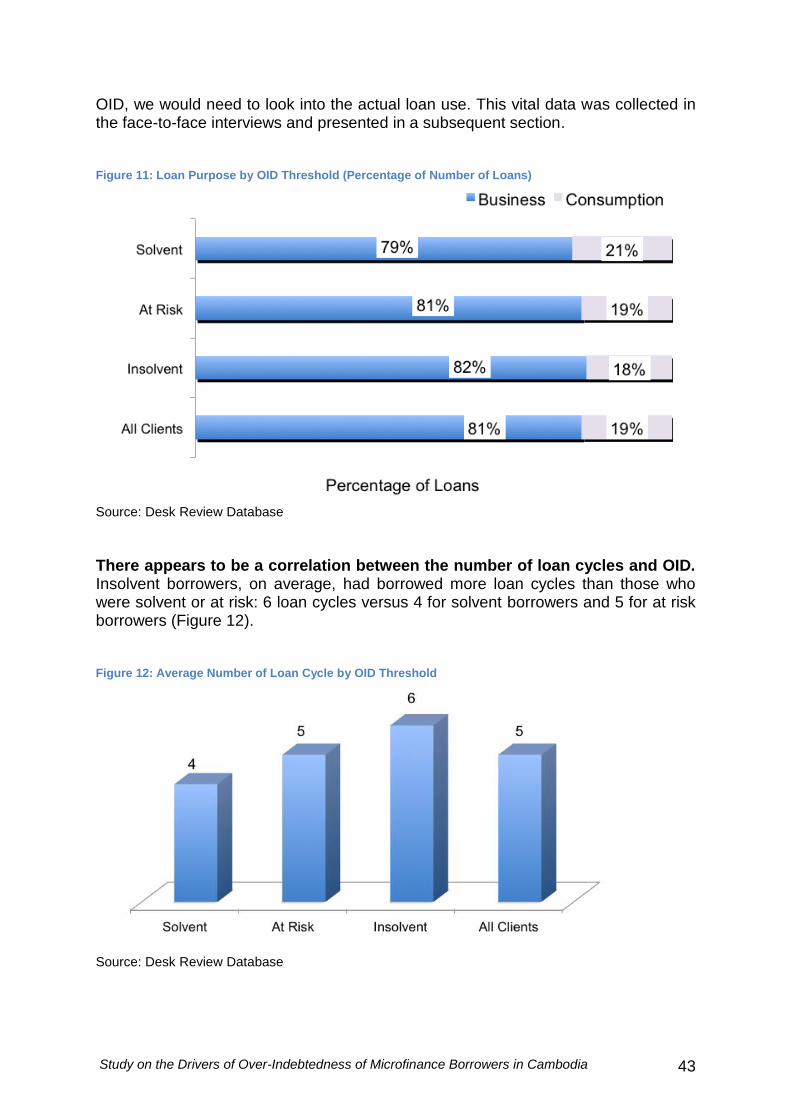
Study on the Drivers of Over-Indebtedness of Microfinance Borrowers in Cambodia 43
OID, we would need to look into the actual loan use. This vital data was collected in the face-to-face interviews and presented in a subsequent section. Figure 11: Loan Purpose by OID Threshold (Percentage of Number of Loans)
Source: Desk Review Database
There appears to be a correlation between the number of loan cycles and OID. Insolvent borrowers, on average, had borrowed more loan cycles than those who were solvent or at risk: 6 loan cycles versus 4 for solvent borrowers and 5 for at risk borrowers (Figure 12). Figure 12: Average Number of Loan Cycle by OID Threshold
Source: Desk Review Database
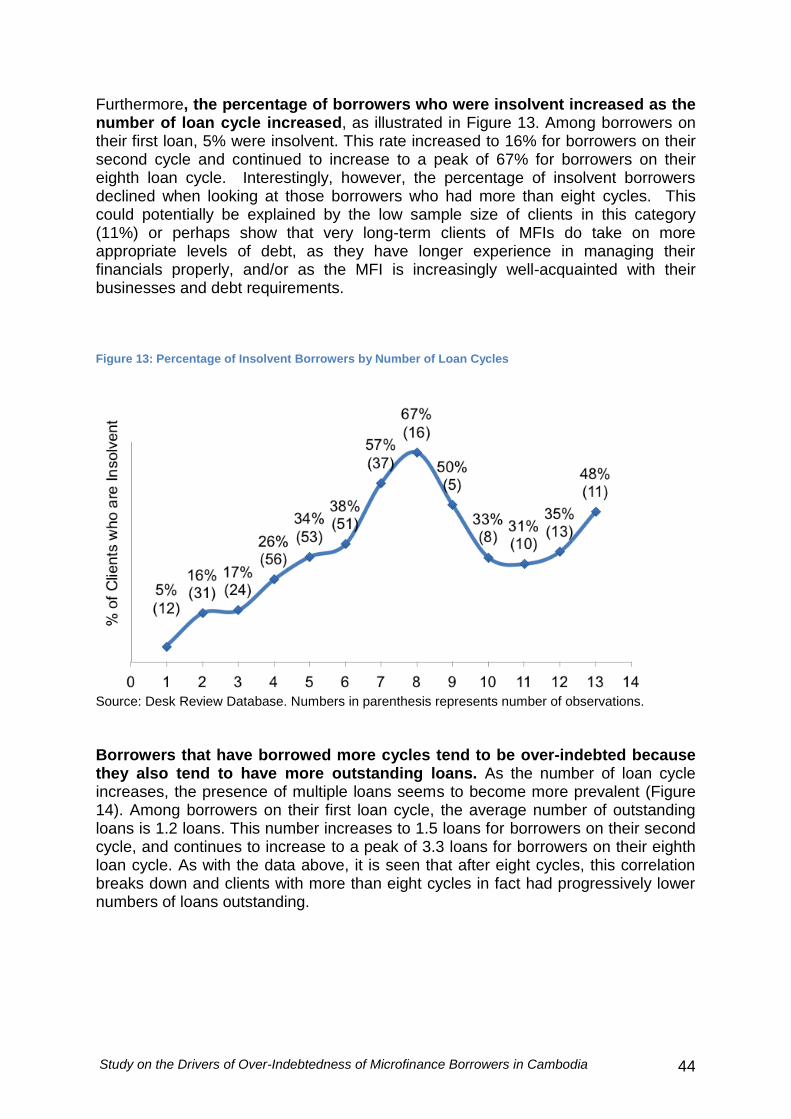
Study on the Drivers of Over-Indebtedness of Microfinance Borrowers in Cambodia 44
Furthermore, the percentage of borrowers who were insolvent increased as the number of loan cycle increased, as illustrated in Figure 13. Among borrowers on their first loan, 5% were insolvent. This rate increased to 16% for borrowers on their second cycle and continued to increase to a peak of 67% for borrowers on their eighth loan cycle. Interestingly, however, the percentage of insolvent borrowers declined when looking at those borrowers who had more than eight cycles. This could potentially be explained by the low sample size of clients in this category (11%) or perhaps show that very long-term clients of MFIs do take on more appropriate levels of debt, as they have longer experience in managing their financials properly, and/or as the MFI is increasingly well-acquainted with their businesses and debt requirements. Figure 13: Percentage of Insolvent Borrowers by Number of Loan Cycles
Source: Desk Review Database. Numbers in parenthesis represents number of observations.
Borrowers that have borrowed more cycles tend to be over-indebted because they also tend to have more outstanding loans. As the number of loan cycle increases, the presence of multiple loans seems to become more prevalent (Figure 14). Among borrowers on their first loan cycle, the average number of outstanding loans is 1.2 loans. This number increases to 1.5 loans for borrowers on their second cycle, and continues to increase to a peak of 3.3 loans for borrowers on their eighth loan cycle. As with the data above, it is seen that after eight cycles, this correlation breaks down and clients with more than eight cycles in fact had progressively lower numbers of loans outstanding.
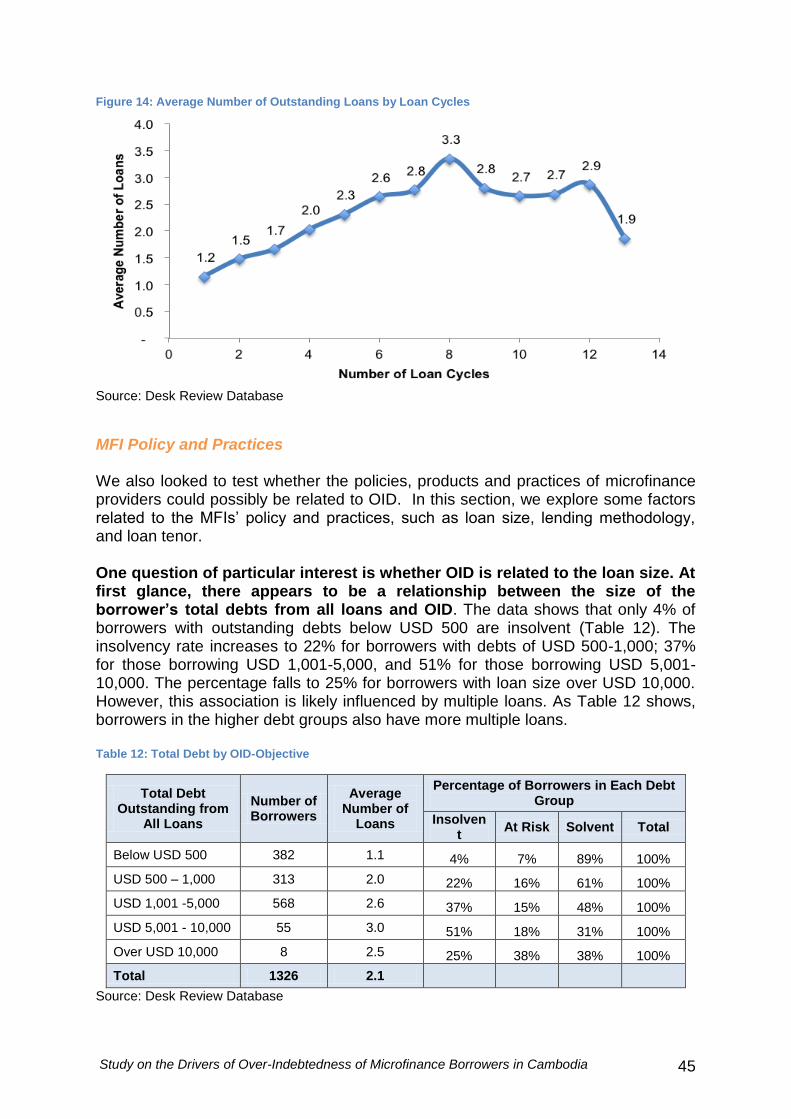
Study on the Drivers of Over-Indebtedness of Microfinance Borrowers in Cambodia 45
Figure 14: Average Number of Outstanding Loans by Loan Cycles
Source: Desk Review Database
MFI Policy and Practices We also looked to test whether the policies, products and practices of microfinance providers could possibly be related to OID. In this section, we explore some factors related to the MFIs’ policy and practices, such as loan size, lending methodology, and loan tenor. One question of particular interest is whether OID is related to the loan size. At first glance, there appears to be a relationship between the size of the borrower’s total debts from all loans and OID. The data shows that only 4% of borrowers with outstanding debts below USD 500 are insolvent (Table 12). The insolvency rate increases to 22% for borrowers with debts of USD 500-1,000; 37% for those borrowing USD 1,001-5,000, and 51% for those borrowing USD 5,001-10,000. The percentage falls to 25% for borrowers with loan size over USD 10,000. However, this association is likely influenced by multiple loans. As Table 12 shows, borrowers in the higher debt groups also have more multiple loans. Table 12: Total Debt by OID-Objective
Total Debt Outstanding from
All Loans
Number of Borrowers
Average Number of
Loans
Percentage of Borrowers in Each Debt Group
Insolvent
At Risk Solvent Total
Below USD 500 382 1.1 4% 7% 89% 100%
USD 500 – 1,000 313 2.0 22% 16% 61% 100%
USD 1,001 -5,000 568 2.6 37% 15% 48% 100%
USD 5,001 - 10,000 55 3.0 51% 18% 31% 100%
Over USD 10,000 8 2.5 25% 38% 38% 100%
Total 1326 2.1
Source: Desk Review Database
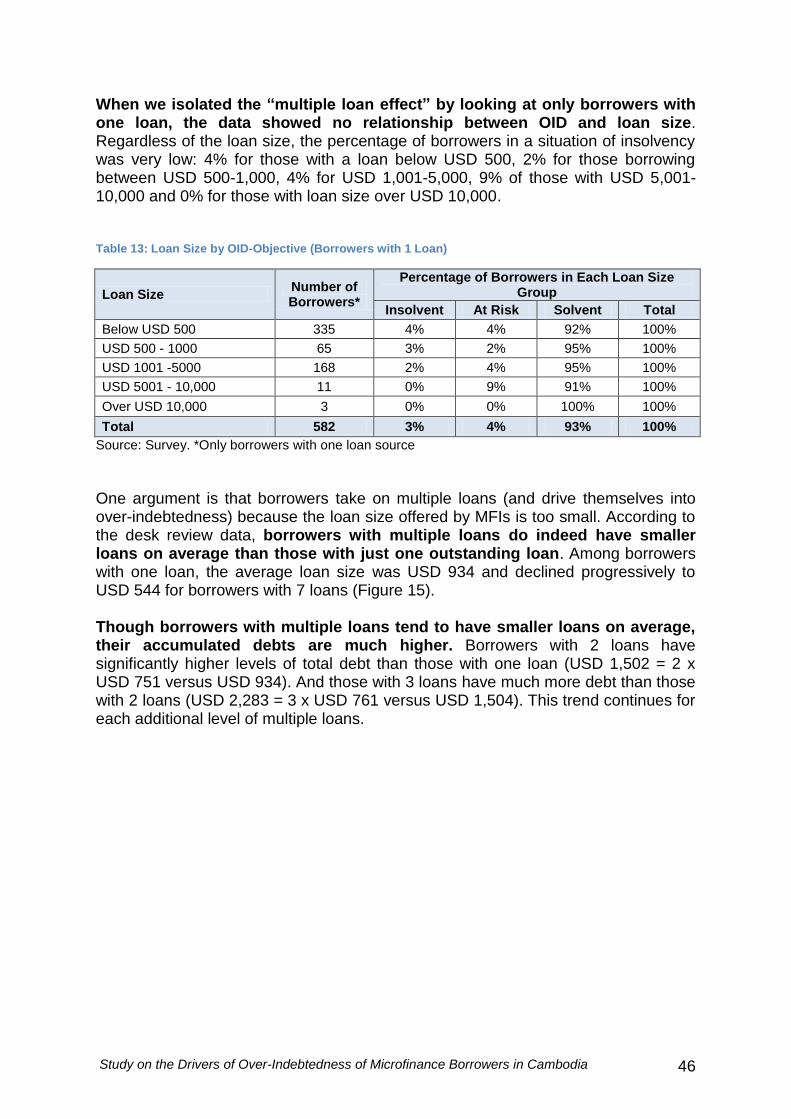
Study on the Drivers of Over-Indebtedness of Microfinance Borrowers in Cambodia 46
When we isolated the “multiple loan effect” by looking at only borrowers with one loan, the data showed no relationship between OID and loan size. Regardless of the loan size, the percentage of borrowers in a situation of insolvency was very low: 4% for those with a loan below USD 500, 2% for those borrowing between USD 500-1,000, 4% for USD 1,001-5,000, 9% of those with USD 5,001-10,000 and 0% for those with loan size over USD 10,000. Table 13: Loan Size by OID-Objective (Borrowers with 1 Loan)
Loan Size Number of Borrowers*
Percentage of Borrowers in Each Loan Size Group
Insolvent At Risk Solvent Total
Below USD 500 335 4% 4% 92% 100%
USD 500 - 1000 65 3% 2% 95% 100%
USD 1001 -5000 168 2% 4% 95% 100%
USD 5001 - 10,000 11 0% 9% 91% 100%
Over USD 10,000 3 0% 0% 100% 100%
Total 582 3% 4% 93% 100%
Source: Survey. *Only borrowers with one loan source
One argument is that borrowers take on multiple loans (and drive themselves into over-indebtedness) because the loan size offered by MFIs is too small. According to the desk review data, borrowers with multiple loans do indeed have smaller loans on average than those with just one outstanding loan. Among borrowers with one loan, the average loan size was USD 934 and declined progressively to USD 544 for borrowers with 7 loans (Figure 15). Though borrowers with multiple loans tend to have smaller loans on average, their accumulated debts are much higher. Borrowers with 2 loans have significantly higher levels of total debt than those with one loan (USD 1,502 = 2 x USD 751 versus USD 934). And those with 3 loans have much more debt than those with 2 loans (USD 2,283 = 3 x USD 761 versus USD 1,504). This trend continues for each additional level of multiple loans.
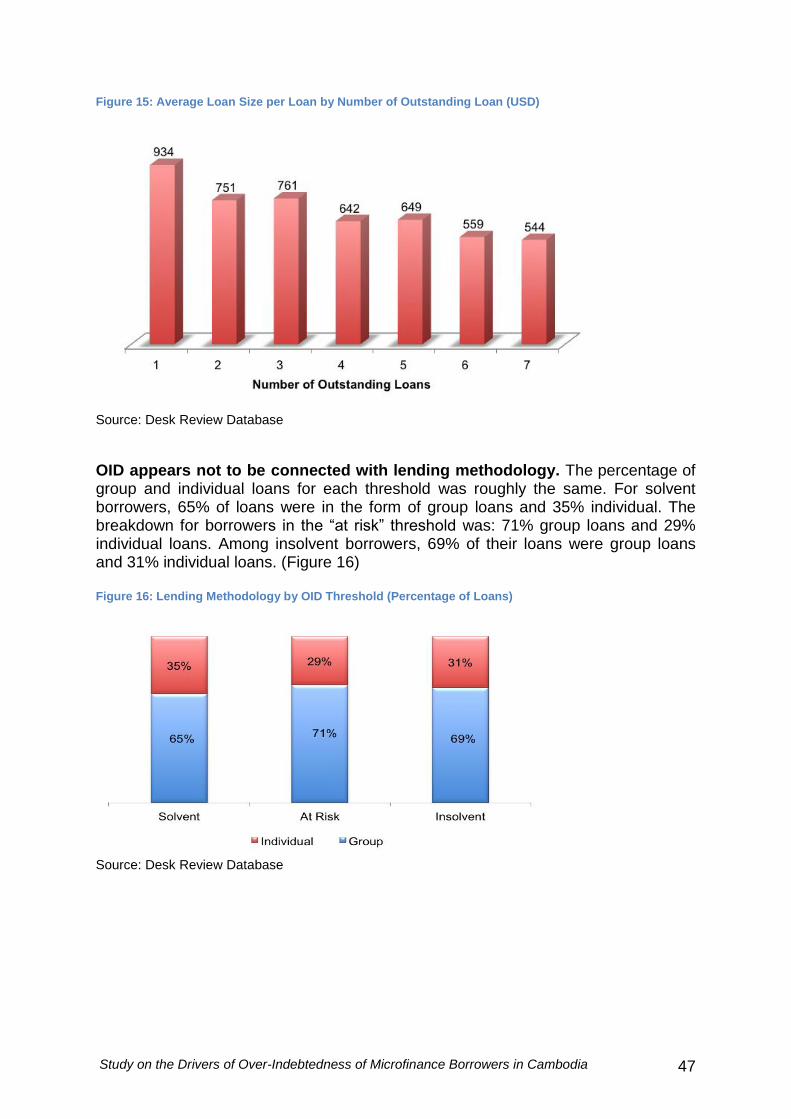
Study on the Drivers of Over-Indebtedness of Microfinance Borrowers in Cambodia 47
Figure 15: Average Loan Size per Loan by Number of Outstanding Loan (USD)
Source: Desk Review Database
OID appears not to be connected with lending methodology. The percentage of group and individual loans for each threshold was roughly the same. For solvent borrowers, 65% of loans were in the form of group loans and 35% individual. The breakdown for borrowers in the “at risk” threshold was: 71% group loans and 29% individual loans. Among insolvent borrowers, 69% of their loans were group loans and 31% individual loans. (Figure 16) Figure 16: Lending Methodology by OID Threshold (Percentage of Loans)
Source: Desk Review Database
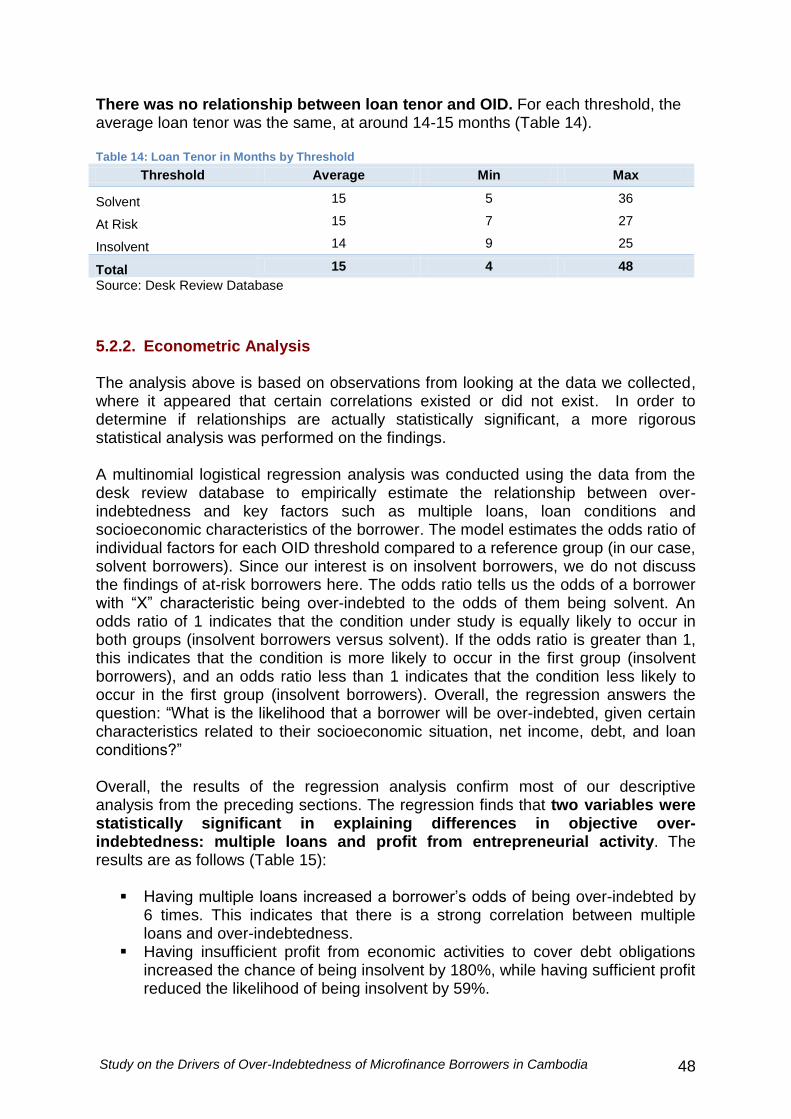
Study on the Drivers of Over-Indebtedness of Microfinance Borrowers in Cambodia 48
There was no relationship between loan tenor and OID. For each threshold, the average loan tenor was the same, at around 14-15 months (Table 14). Table 14: Loan Tenor in Months by Threshold
Threshold Average Min Max
Solvent 15 5 36
At Risk 15 7 27
Insolvent 14 9 25
Total 15 4 48
Source: Desk Review Database
5.2.2. Econometric Analysis The analysis above is based on observations from looking at the data we collected, where it appeared that certain correlations existed or did not exist. In order to determine if relationships are actually statistically significant, a more rigorous statistical analysis was performed on the findings. A multinomial logistical regression analysis was conducted using the data from the desk review database to empirically estimate the relationship between over-indebtedness and key factors such as multiple loans, loan conditions and socioeconomic characteristics of the borrower. The model estimates the odds ratio of individual factors for each OID threshold compared to a reference group (in our case, solvent borrowers). Since our interest is on insolvent borrowers, we do not discuss the findings of at-risk borrowers here. The odds ratio tells us the odds of a borrower with “X” characteristic being over-indebted to the odds of them being solvent. An odds ratio of 1 indicates that the condition under study is equally likely to occur in both groups (insolvent borrowers versus solvent). If the odds ratio is greater than 1, this indicates that the condition is more likely to occur in the first group (insolvent borrowers), and an odds ratio less than 1 indicates that the condition less likely to occur in the first group (insolvent borrowers). Overall, the regression answers the question: “What is the likelihood that a borrower will be over-indebted, given certain characteristics related to their socioeconomic situation, net income, debt, and loan conditions?” Overall, the results of the regression analysis confirm most of our descriptive analysis from the preceding sections. The regression finds that two variables were statistically significant in explaining differences in objective over-indebtedness: multiple loans and profit from entrepreneurial activity. The results are as follows (Table 15):
Having multiple loans increased a borrower’s odds of being over-indebted by 6 times. This indicates that there is a strong correlation between multiple loans and over-indebtedness.
Having insufficient profit from economic activities to cover debt obligations increased the chance of being insolvent by 180%, while having sufficient profit reduced the likelihood of being insolvent by 59%.
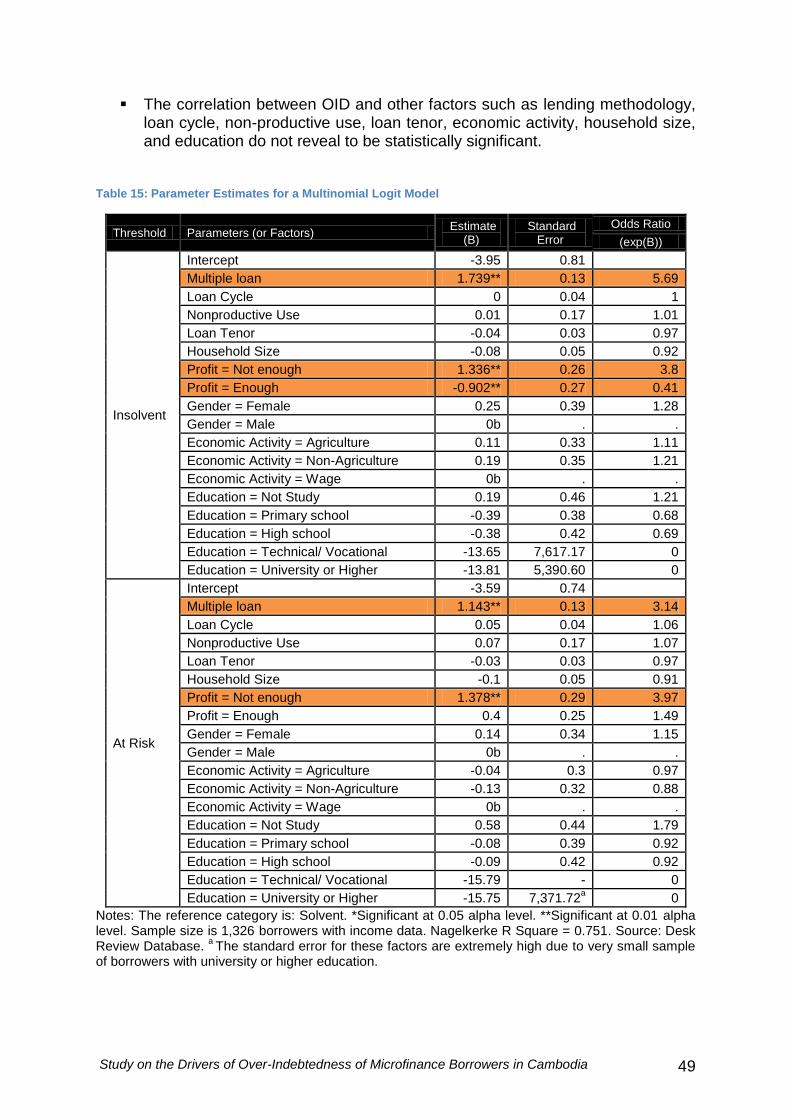
Study on the Drivers of Over-Indebtedness of Microfinance Borrowers in Cambodia 49
The correlation between OID and other factors such as lending methodology, loan cycle, non-productive use, loan tenor, economic activity, household size, and education do not reveal to be statistically significant.
Table 15: Parameter Estimates for a Multinomial Logit Model
Threshold Parameters (or Factors) Estimate
(B) Standard
Error
Odds Ratio
(exp(B))
Insolvent
Intercept -3.95 0.81
Multiple loan 1.739** 0.13 5.69
Loan Cycle 0 0.04 1
Nonproductive Use 0.01 0.17 1.01
Loan Tenor -0.04 0.03 0.97
Household Size -0.08 0.05 0.92
Profit = Not enough 1.336** 0.26 3.8
Profit = Enough -0.902** 0.27 0.41
Gender = Female 0.25 0.39 1.28
Gender = Male 0b . .
Economic Activity = Agriculture 0.11 0.33 1.11
Economic Activity = Non-Agriculture 0.19 0.35 1.21
Economic Activity = Wage 0b . .
Education = Not Study 0.19 0.46 1.21
Education = Primary school -0.39 0.38 0.68
Education = High school -0.38 0.42 0.69
Education = Technical/ Vocational -13.65 7,617.17 0
Education = University or Higher -13.81 5,390.60 0
At Risk
Intercept -3.59 0.74
Multiple loan 1.143** 0.13 3.14
Loan Cycle 0.05 0.04 1.06
Nonproductive Use 0.07 0.17 1.07
Loan Tenor -0.03 0.03 0.97
Household Size -0.1 0.05 0.91
Profit = Not enough 1.378** 0.29 3.97
Profit = Enough 0.4 0.25 1.49
Gender = Female 0.14 0.34 1.15
Gender = Male 0b . .
Economic Activity = Agriculture -0.04 0.3 0.97
Economic Activity = Non-Agriculture -0.13 0.32 0.88
Economic Activity = Wage 0b . .
Education = Not Study 0.58 0.44 1.79
Education = Primary school -0.08 0.39 0.92
Education = High school -0.09 0.42 0.92
Education = Technical/ Vocational -15.79 - 0
Education = University or Higher -15.75 7,371.72a 0
Notes: The reference category is: Solvent. *Significant at 0.05 alpha level. **Significant at 0.01 alpha level. Sample size is 1,326 borrowers with income data. Nagelkerke R Square = 0.751. Source: Desk Review Database.
a The standard error for these factors are extremely high due to very small sample
of borrowers with university or higher education.
Study on the Drivers of Over-Indebtedness of Microfinance Borrowers in Cambodia 50
6. Step Three: Measuring Subjective Over-Indebtedness One important concern that has emerged in the MFI industry in Cambodia over the past several years is that although microfinance borrowers are making payments regularly and on time (indicated by the low portfolio at risk of just 0.25% on average 29 ), it is possible that borrowers are struggling to meet these loan repayments and are making many sacrifices that affect their household’s current and future living conditions. From a client protection standpoint, this is clearly not the mission of microfinance. For this reason, this study included a second, subjective measure of over-indebtedness to explore this issue in greater depth by probing into the borrowers’ perception of over-indebtedness. The data needed to calculate and analyze the subjective OID measure was not available in the MFIs’ client files. Therefore, this data was collected through face-to-face interviews with 465 microfinance borrowers in the targeted villages. The findings of the survey are presented below.
6.1. Are microfinance borrowers subjective OID? From a subjective point of view, we defined that a microfinance borrower is over-indebted when he/she feels that he/she struggles to repay his/her loan to the point that he/she is making frequent and unacceptable sacrifices impacting his/her living standards.30 To measure the level of subjective OID in our sample, the first step is to determine the number of borrowers who struggled to repay their loans over the past 12 months (section 6.1.1). The second step is to find out how many of the borrowers who struggled had to make frequent and unacceptable sacrifices to cover their loan repayment (section 6.1.2).
6.1.1. Struggled to Repay Debts Struggling to meet loan repayments could be an indication of over-indebtedness. During interviews, 51% of microfinance borrowers confessed that they have struggled to make loan repayments over the past 12 months: 45% stated that they have struggled a few times, while 6% struggled most of the time, and less than 1% always struggled (Table 16).
29
As of June 2012, source: Cambodia Microfinance Association 30
This definition is adapted from the definition developed by Jessica Schicks. See Schicks, J. (2011). Over-Indebtedness of Microborrowers in Ghana: An Empirical Study from a Customer Protection Perspective.
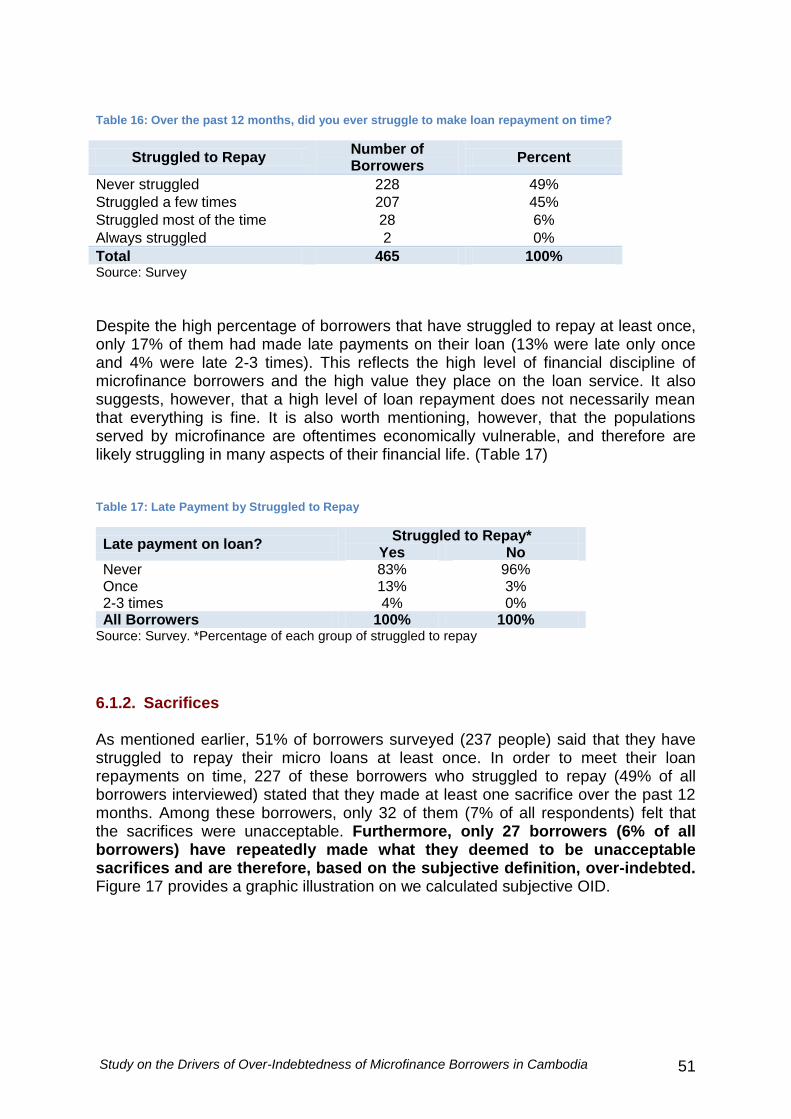
Study on the Drivers of Over-Indebtedness of Microfinance Borrowers in Cambodia 51
Table 16: Over the past 12 months, did you ever struggle to make loan repayment on time?
Struggled to Repay Number of Borrowers
Percent
Never struggled 228 49%
Struggled a few times 207 45%
Struggled most of the time 28 6%
Always struggled 2 0%
Total 465 100% Source: Survey
Despite the high percentage of borrowers that have struggled to repay at least once, only 17% of them had made late payments on their loan (13% were late only once and 4% were late 2-3 times). This reflects the high level of financial discipline of microfinance borrowers and the high value they place on the loan service. It also suggests, however, that a high level of loan repayment does not necessarily mean that everything is fine. It is also worth mentioning, however, that the populations served by microfinance are oftentimes economically vulnerable, and therefore are likely struggling in many aspects of their financial life. (Table 17) Table 17: Late Payment by Struggled to Repay
Late payment on loan? Struggled to Repay*
Yes No Never 83% 96% Once 13% 3% 2-3 times 4% 0% All Borrowers 100% 100%
Source: Survey. *Percentage of each group of struggled to repay
6.1.2. Sacrifices As mentioned earlier, 51% of borrowers surveyed (237 people) said that they have struggled to repay their micro loans at least once. In order to meet their loan repayments on time, 227 of these borrowers who struggled to repay (49% of all borrowers interviewed) stated that they made at least one sacrifice over the past 12 months. Among these borrowers, only 32 of them (7% of all respondents) felt that the sacrifices were unacceptable. Furthermore, only 27 borrowers (6% of all borrowers) have repeatedly made what they deemed to be unacceptable sacrifices and are therefore, based on the subjective definition, over-indebted. Figure 17 provides a graphic illustration on we calculated subjective OID.
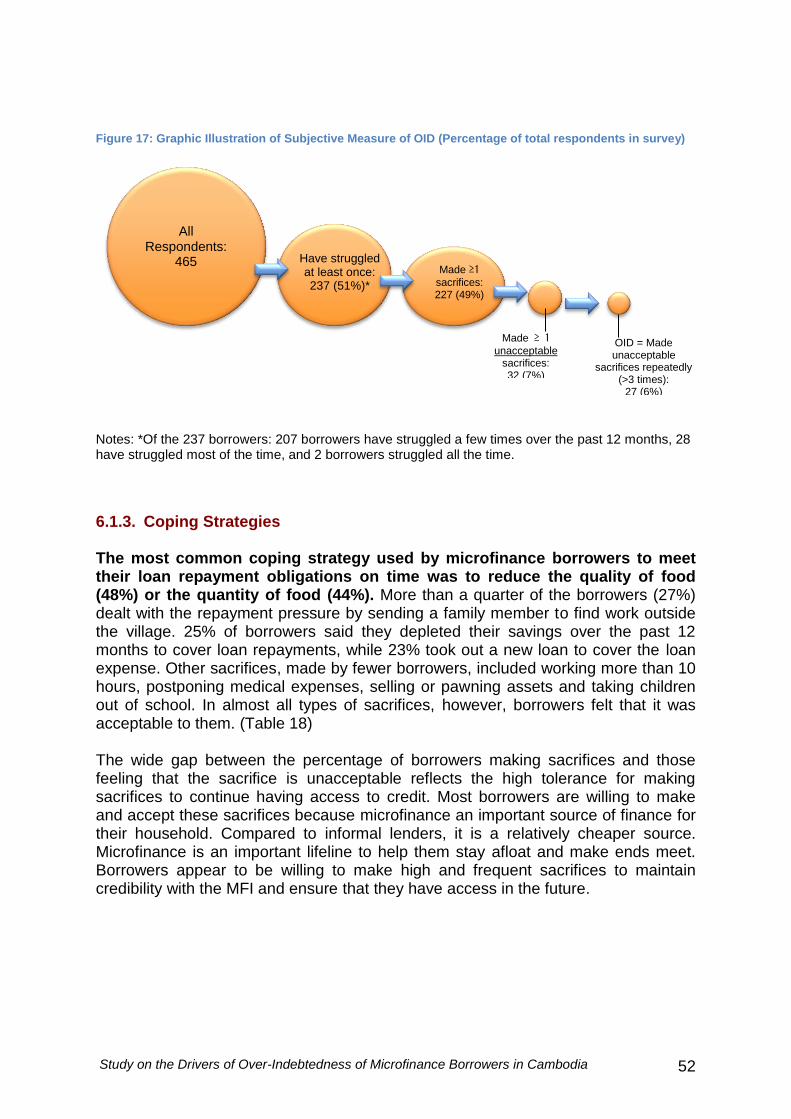
Study on the Drivers of Over-Indebtedness of Microfinance Borrowers in Cambodia 52
Figure 17: Graphic Illustration of Subjective Measure of OID (Percentage of total respondents in survey)
Notes: *Of the 237 borrowers: 207 borrowers have struggled a few times over the past 12 months, 28 have struggled most of the time, and 2 borrowers struggled all the time.
6.1.3. Coping Strategies The most common coping strategy used by microfinance borrowers to meet their loan repayment obligations on time was to reduce the quality of food (48%) or the quantity of food (44%). More than a quarter of the borrowers (27%) dealt with the repayment pressure by sending a family member to find work outside the village. 25% of borrowers said they depleted their savings over the past 12 months to cover loan repayments, while 23% took out a new loan to cover the loan expense. Other sacrifices, made by fewer borrowers, included working more than 10 hours, postponing medical expenses, selling or pawning assets and taking children out of school. In almost all types of sacrifices, however, borrowers felt that it was acceptable to them. (Table 18) The wide gap between the percentage of borrowers making sacrifices and those feeling that the sacrifice is unacceptable reflects the high tolerance for making sacrifices to continue having access to credit. Most borrowers are willing to make and accept these sacrifices because microfinance an important source of finance for their household. Compared to informal lenders, it is a relatively cheaper source. Microfinance is an important lifeline to help them stay afloat and make ends meet. Borrowers appear to be willing to make high and frequent sacrifices to maintain credibility with the MFI and ensure that they have access in the future.
All Respondents:
465
Have struggled at least once: 237 (51%)*
Made ≥1 sacrifices: 227 (49%)
Made ≥ 1 unacceptable
sacrifices: 32 (7%)
OID = Made unacceptable
sacrifices repeatedly (>3 times):
27 (6%)
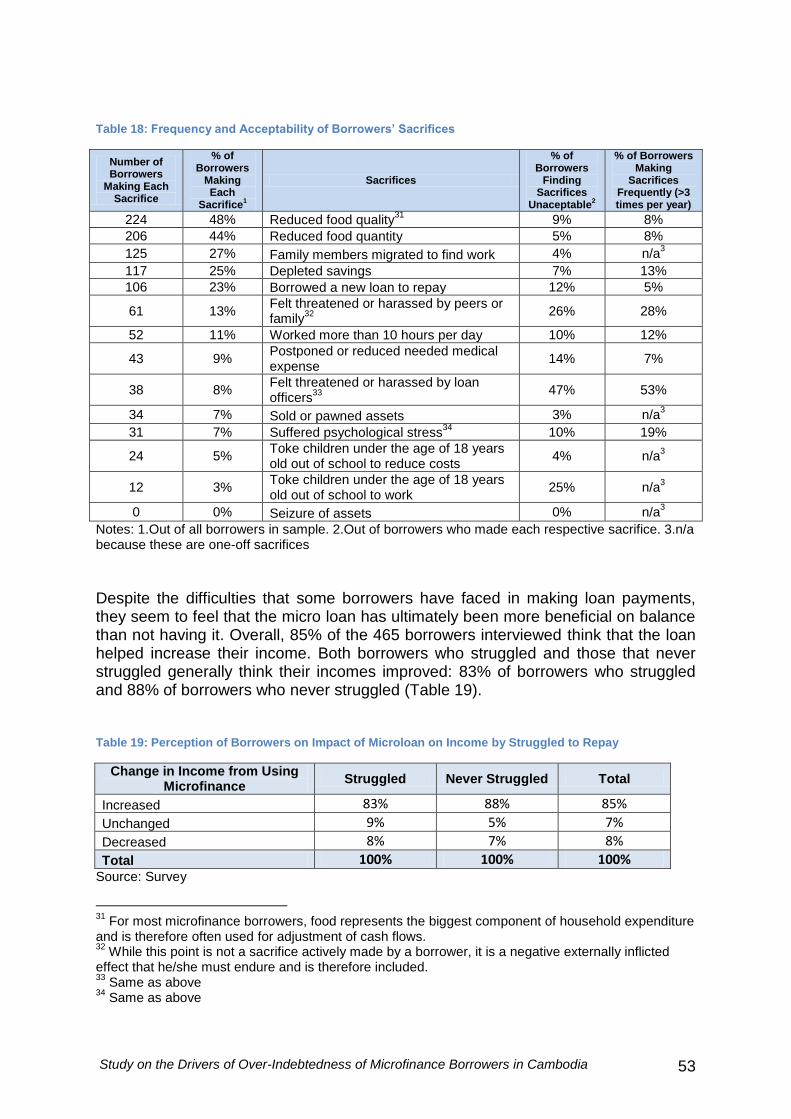
Study on the Drivers of Over-Indebtedness of Microfinance Borrowers in Cambodia 53
Table 18: Frequency and Acceptability of Borrowers’ Sacrifices
Number of Borrowers
Making Each Sacrifice
% of Borrowers
Making Each
Sacrifice1
Sacrifices
% of Borrowers
Finding Sacrifices
Unaceptable2
% of Borrowers Making
Sacrifices Frequently (>3 times per year)
224 48% Reduced food quality31
9% 8%
206 44% Reduced food quantity 5% 8%
125 27% Family members migrated to find work 4% n/a3
117 25% Depleted savings 7% 13%
106 23% Borrowed a new loan to repay 12% 5%
61 13% Felt threatened or harassed by peers or family
32
26% 28%
52 11% Worked more than 10 hours per day 10% 12%
43 9% Postponed or reduced needed medical expense
14% 7%
38 8% Felt threatened or harassed by loan officers
33
47% 53%
34 7% Sold or pawned assets 3% n/a3
31 7% Suffered psychological stress34
10% 19%
24 5% Toke children under the age of 18 years old out of school to reduce costs
4% n/a3
12 3% Toke children under the age of 18 years old out of school to work
25% n/a3
0 0% Seizure of assets 0% n/a3
Notes: 1.Out of all borrowers in sample. 2.Out of borrowers who made each respective sacrifice. 3.n/a because these are one-off sacrifices
Despite the difficulties that some borrowers have faced in making loan payments, they seem to feel that the micro loan has ultimately been more beneficial on balance than not having it. Overall, 85% of the 465 borrowers interviewed think that the loan helped increase their income. Both borrowers who struggled and those that never struggled generally think their incomes improved: 83% of borrowers who struggled and 88% of borrowers who never struggled (Table 19). Table 19: Perception of Borrowers on Impact of Microloan on Income by Struggled to Repay
Change in Income from Using Microfinance
Struggled Never Struggled Total
Increased 83% 88% 85%
Unchanged 9% 5% 7%
Decreased 8% 7% 8%
Total 100% 100% 100%
Source: Survey
31
For most microfinance borrowers, food represents the biggest component of household expenditure and is therefore often used for adjustment of cash flows. 32
While this point is not a sacrifice actively made by a borrower, it is a negative externally inflicted effect that he/she must endure and is therefore included. 33
Same as above 34
Same as above
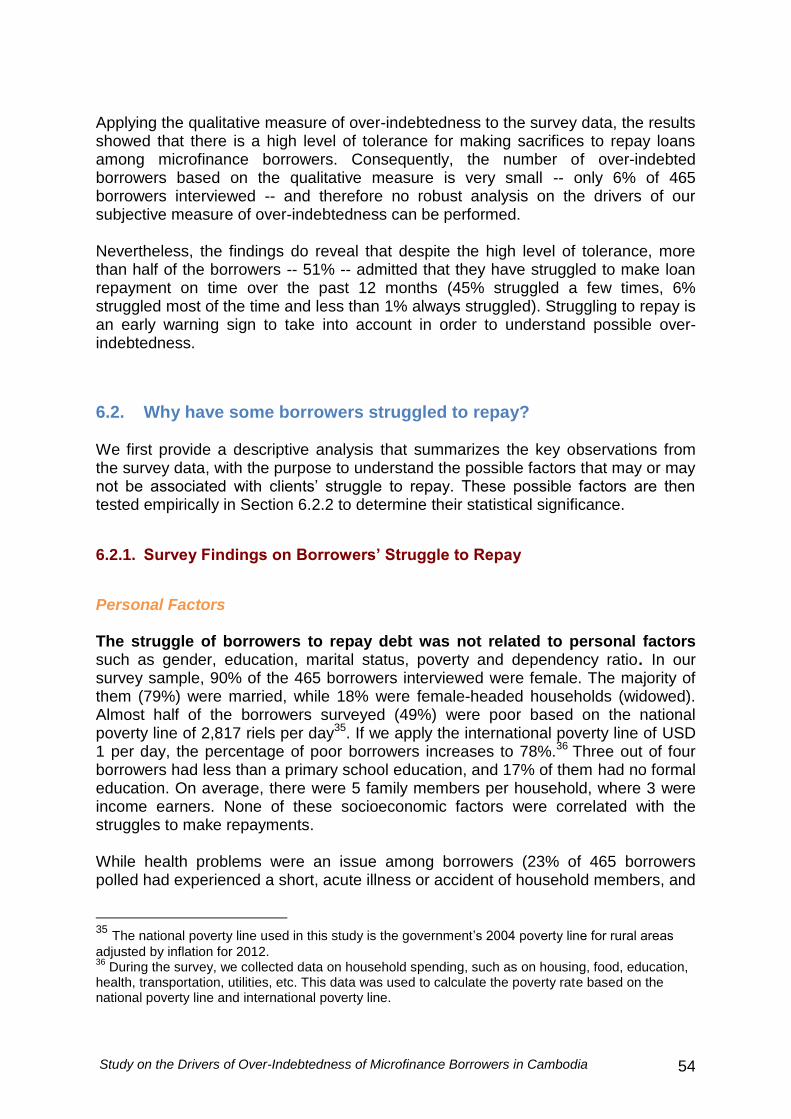
Study on the Drivers of Over-Indebtedness of Microfinance Borrowers in Cambodia 54
Applying the qualitative measure of over-indebtedness to the survey data, the results showed that there is a high level of tolerance for making sacrifices to repay loans among microfinance borrowers. Consequently, the number of over-indebted borrowers based on the qualitative measure is very small -- only 6% of 465 borrowers interviewed -- and therefore no robust analysis on the drivers of our subjective measure of over-indebtedness can be performed. Nevertheless, the findings do reveal that despite the high level of tolerance, more than half of the borrowers -- 51% -- admitted that they have struggled to make loan repayment on time over the past 12 months (45% struggled a few times, 6% struggled most of the time and less than 1% always struggled). Struggling to repay is an early warning sign to take into account in order to understand possible over-indebtedness.
6.2. Why have some borrowers struggled to repay? We first provide a descriptive analysis that summarizes the key observations from the survey data, with the purpose to understand the possible factors that may or may not be associated with clients’ struggle to repay. These possible factors are then tested empirically in Section 6.2.2 to determine their statistical significance.
6.2.1. Survey Findings on Borrowers’ Struggle to Repay
Personal Factors The struggle of borrowers to repay debt was not related to personal factors such as gender, education, marital status, poverty and dependency ratio. In our survey sample, 90% of the 465 borrowers interviewed were female. The majority of them (79%) were married, while 18% were female-headed households (widowed). Almost half of the borrowers surveyed (49%) were poor based on the national poverty line of 2,817 riels per day35. If we apply the international poverty line of USD 1 per day, the percentage of poor borrowers increases to 78%.36 Three out of four borrowers had less than a primary school education, and 17% of them had no formal education. On average, there were 5 family members per household, where 3 were income earners. None of these socioeconomic factors were correlated with the struggles to make repayments. While health problems were an issue among borrowers (23% of 465 borrowers polled had experienced a short, acute illness or accident of household members, and
35 The national poverty line used in this study is the government’s 2004 poverty line for rural areas
adjusted by inflation for 2012. 36
During the survey, we collected data on household spending, such as on housing, food, education, health, transportation, utilities, etc. This data was used to calculate the poverty rate based on the national poverty line and international poverty line.

Study on the Drivers of Over-Indebtedness of Microfinance Borrowers in Cambodia 55
19% had a household member in a situation of chronic illness or disability), there were little differences in the incidence of having struggled to repay between households with health problems and those with no health problems.
Economic Factors Borrowers who struggled to repay had lower incomes in combination with higher debts on average than those who never struggled. Borrowers who struggled earned USD 132 per month on average, compared with USD 175 for borrowers who never struggled. On the other hand, borrowers who struggled pay USD 122 per month on loans, compared to USD 101 among those who never struggled. The data from the survey shows that borrowers who struggled have much higher net indebtedness index levels than that never struggled. (Table 20) Table 20: Average Net Income and Debt for Borrowers Surveyed
Averages in USD Struggled Never
Struggled All
Borrowers
Monthly Net Income 132 175 153 Monthly Debt Payments 122 101 111 Total Debt 1,947 1,635 1,794 Average Net Indebtedness Index 92% 58% 73%
Source: Survey
Borrowers who struggled to repay loans were not clustered in any particular economic activity. The main source of household income for 64% of the borrowers was from wages and remittances.37 For 19% of the borrowers, they relied on income from non-agriculture businesses and 17% depended on agriculture activities (Figure 18). It is important to note that while agriculture activities were not the main income source for most households, 78% of borrowers did engage in subsistence agriculture, particularly rice farming, which is still an important part of the household’s food security. More than half (51%) of borrowers whose main source of income was from the agriculture sector said they have struggled to pay their loans on time. Likewise 52% for those depending on non-agriculture activities and 51% of wage earners also struggled. The high contribution of wage income explains why most borrowers said that their income was regular (86%) and stable (73%).
37 This breakdown is different from the desk review, which showed that the majority of households
rely on agriculture activities. This is likely because MFIs listed the economic activity for which the loan was used on as the main activity rather than the activity that contributed most to income.
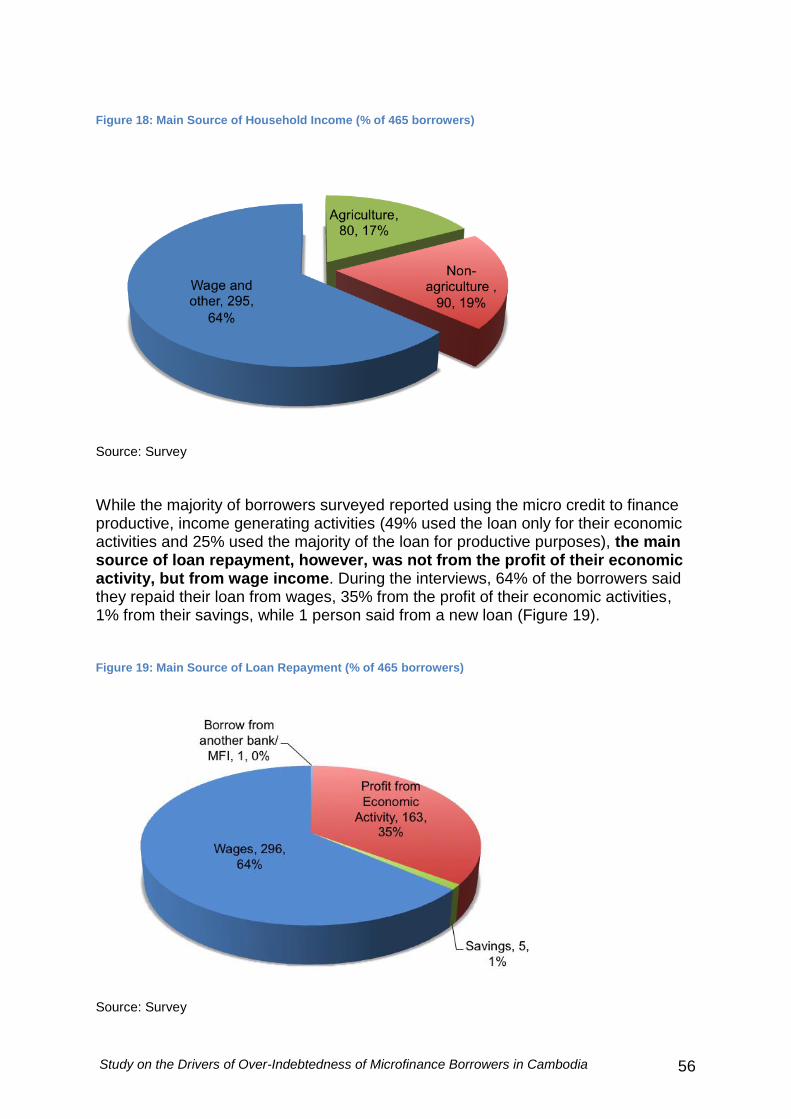
Study on the Drivers of Over-Indebtedness of Microfinance Borrowers in Cambodia 56
Figure 18: Main Source of Household Income (% of 465 borrowers)
Source: Survey
While the majority of borrowers surveyed reported using the micro credit to finance productive, income generating activities (49% used the loan only for their economic activities and 25% used the majority of the loan for productive purposes), the main source of loan repayment, however, was not from the profit of their economic activity, but from wage income. During the interviews, 64% of the borrowers said they repaid their loan from wages, 35% from the profit of their economic activities, 1% from their savings, while 1 person said from a new loan (Figure 19). Figure 19: Main Source of Loan Repayment (% of 465 borrowers)
Source: Survey
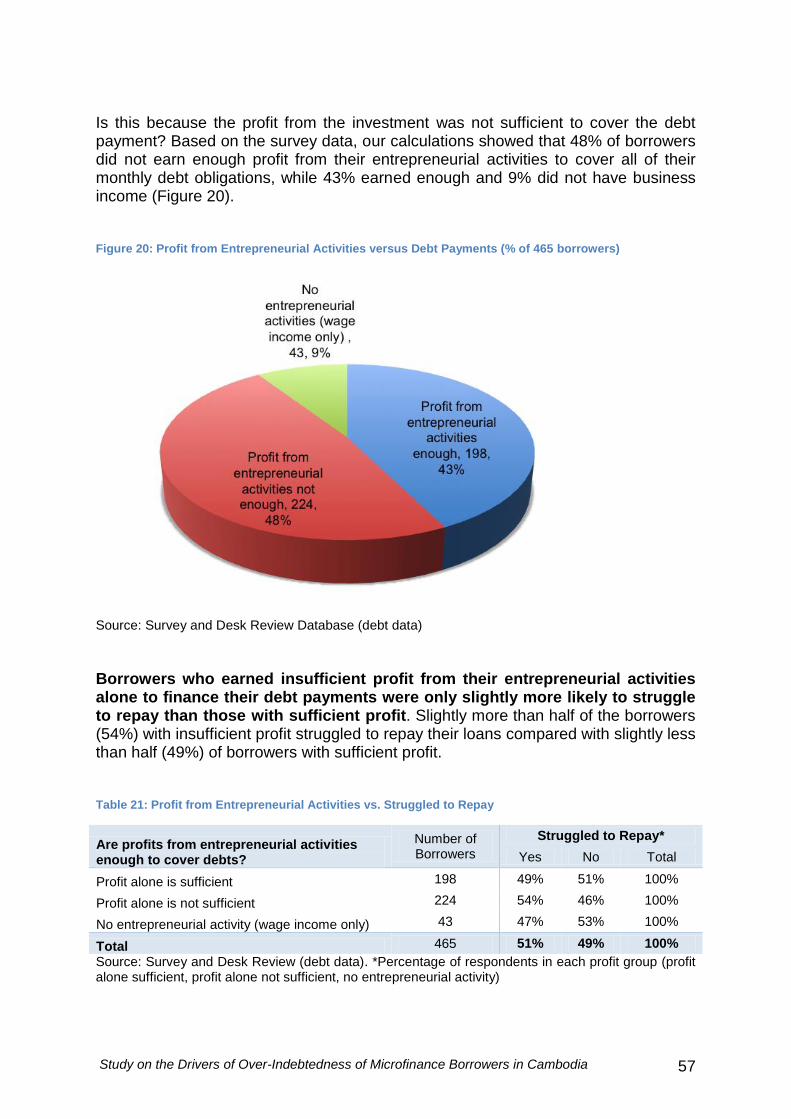
Study on the Drivers of Over-Indebtedness of Microfinance Borrowers in Cambodia 57
Is this because the profit from the investment was not sufficient to cover the debt payment? Based on the survey data, our calculations showed that 48% of borrowers did not earn enough profit from their entrepreneurial activities to cover all of their monthly debt obligations, while 43% earned enough and 9% did not have business income (Figure 20). Figure 20: Profit from Entrepreneurial Activities versus Debt Payments (% of 465 borrowers)
Source: Survey and Desk Review Database (debt data)
Borrowers who earned insufficient profit from their entrepreneurial activities alone to finance their debt payments were only slightly more likely to struggle to repay than those with sufficient profit. Slightly more than half of the borrowers (54%) with insufficient profit struggled to repay their loans compared with slightly less than half (49%) of borrowers with sufficient profit. Table 21: Profit from Entrepreneurial Activities vs. Struggled to Repay
Are profits from entrepreneurial activities enough to cover debts?
Number of Borrowers
Struggled to Repay*
Yes No Total
Profit alone is sufficient 198 49% 51% 100%
Profit alone is not sufficient 224 54% 46% 100%
No entrepreneurial activity (wage income only) 43 47% 53% 100%
Total 465 51% 49% 100%
Source: Survey and Desk Review (debt data). *Percentage of respondents in each profit group (profit alone sufficient, profit alone not sufficient, no entrepreneurial activity)
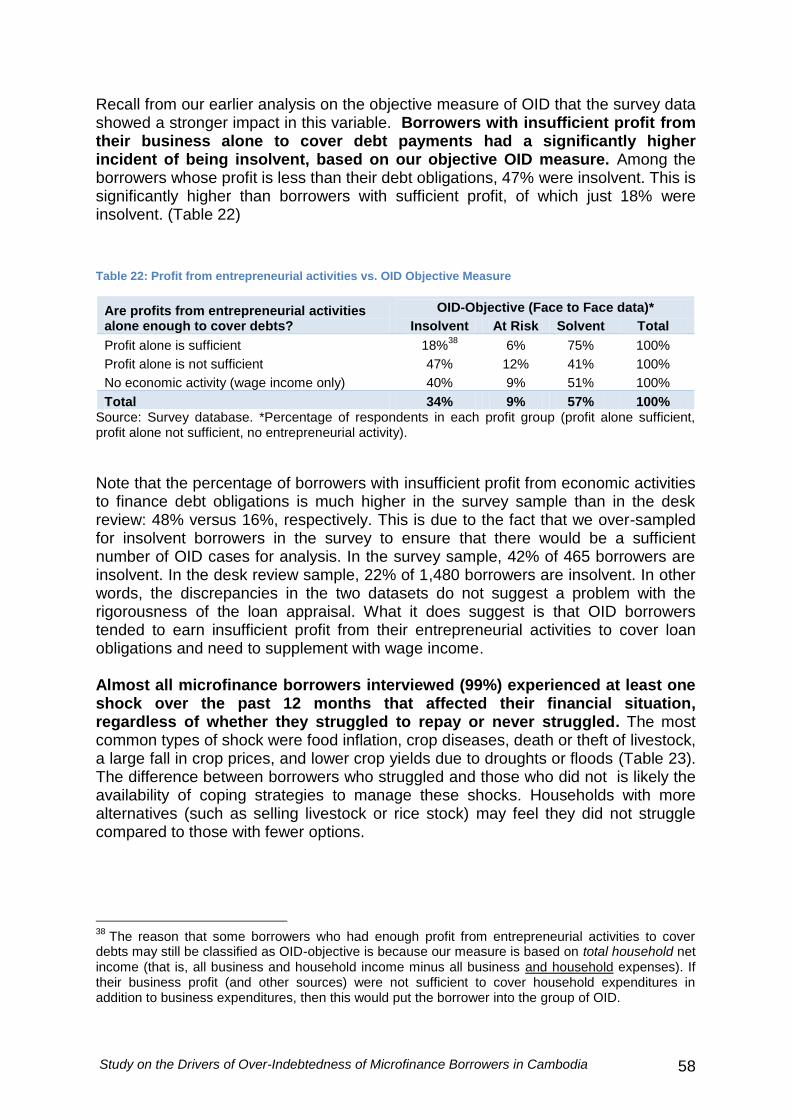
Study on the Drivers of Over-Indebtedness of Microfinance Borrowers in Cambodia 58
Recall from our earlier analysis on the objective measure of OID that the survey data showed a stronger impact in this variable. Borrowers with insufficient profit from their business alone to cover debt payments had a significantly higher incident of being insolvent, based on our objective OID measure. Among the borrowers whose profit is less than their debt obligations, 47% were insolvent. This is significantly higher than borrowers with sufficient profit, of which just 18% were insolvent. (Table 22) Table 22: Profit from entrepreneurial activities vs. OID Objective Measure
Are profits from entrepreneurial activities alone enough to cover debts?
OID-Objective (Face to Face data)*
Insolvent At Risk Solvent Total
Profit alone is sufficient 18%38
6% 75% 100%
Profit alone is not sufficient 47% 12% 41% 100%
No economic activity (wage income only) 40% 9% 51% 100%
Total 34% 9% 57% 100% Source: Survey database. *Percentage of respondents in each profit group (profit alone sufficient, profit alone not sufficient, no entrepreneurial activity).
Note that the percentage of borrowers with insufficient profit from economic activities to finance debt obligations is much higher in the survey sample than in the desk review: 48% versus 16%, respectively. This is due to the fact that we over-sampled for insolvent borrowers in the survey to ensure that there would be a sufficient number of OID cases for analysis. In the survey sample, 42% of 465 borrowers are insolvent. In the desk review sample, 22% of 1,480 borrowers are insolvent. In other words, the discrepancies in the two datasets do not suggest a problem with the rigorousness of the loan appraisal. What it does suggest is that OID borrowers tended to earn insufficient profit from their entrepreneurial activities to cover loan obligations and need to supplement with wage income. Almost all microfinance borrowers interviewed (99%) experienced at least one shock over the past 12 months that affected their financial situation, regardless of whether they struggled to repay or never struggled. The most common types of shock were food inflation, crop diseases, death or theft of livestock, a large fall in crop prices, and lower crop yields due to droughts or floods (Table 23). The difference between borrowers who struggled and those who did not is likely the availability of coping strategies to manage these shocks. Households with more alternatives (such as selling livestock or rice stock) may feel they did not struggle compared to those with fewer options.
38
The reason that some borrowers who had enough profit from entrepreneurial activities to cover debts may still be classified as OID-objective is because our measure is based on total household net income (that is, all business and household income minus all business and household expenses). If their business profit (and other sources) were not sufficient to cover household expenditures in addition to business expenditures, then this would put the borrower into the group of OID.
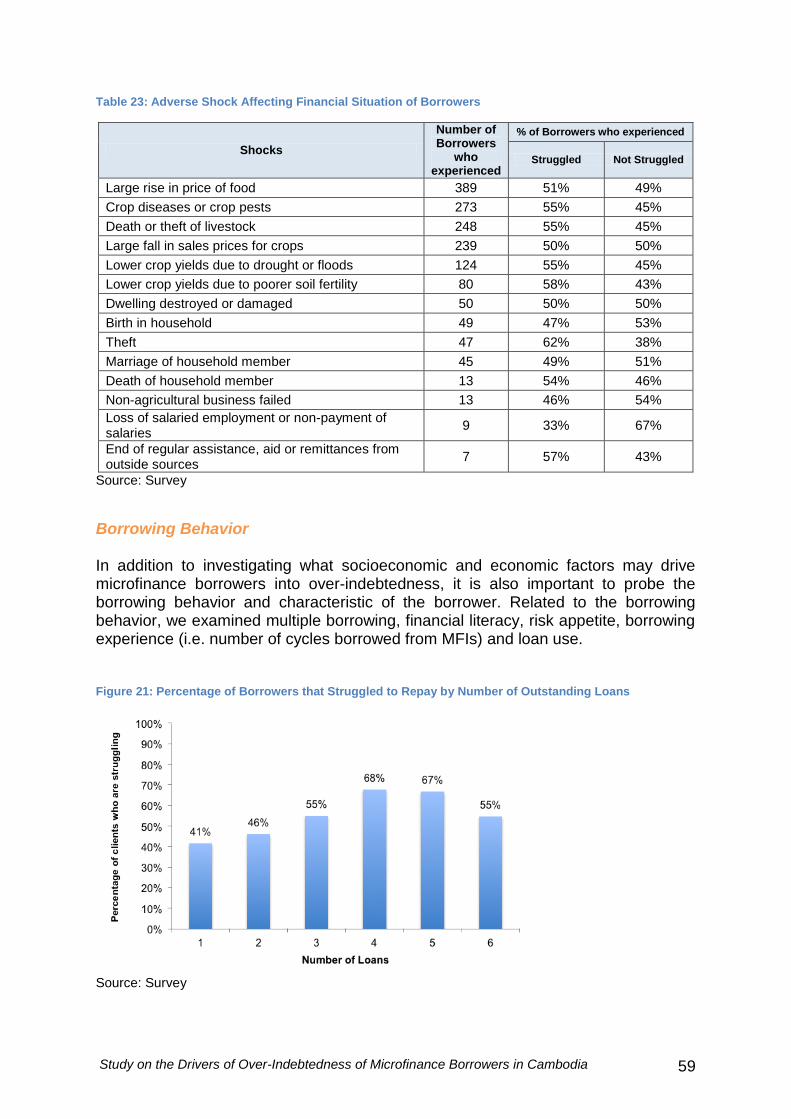
Study on the Drivers of Over-Indebtedness of Microfinance Borrowers in Cambodia 59
Table 23: Adverse Shock Affecting Financial Situation of Borrowers
Shocks
Number of Borrowers
who experienced
% of Borrowers who experienced
Struggled Not Struggled
Large rise in price of food 389 51% 49%
Crop diseases or crop pests 273 55% 45%
Death or theft of livestock 248 55% 45%
Large fall in sales prices for crops 239 50% 50%
Lower crop yields due to drought or floods 124 55% 45%
Lower crop yields due to poorer soil fertility 80 58% 43%
Dwelling destroyed or damaged 50 50% 50%
Birth in household 49 47% 53%
Theft 47 62% 38%
Marriage of household member 45 49% 51%
Death of household member 13 54% 46%
Non-agricultural business failed 13 46% 54%
Loss of salaried employment or non-payment of salaries
9 33% 67%
End of regular assistance, aid or remittances from outside sources
7 57% 43%
Source: Survey
Borrowing Behavior In addition to investigating what socioeconomic and economic factors may drive microfinance borrowers into over-indebtedness, it is also important to probe the borrowing behavior and characteristic of the borrower. Related to the borrowing behavior, we examined multiple borrowing, financial literacy, risk appetite, borrowing experience (i.e. number of cycles borrowed from MFIs) and loan use. Figure 21: Percentage of Borrowers that Struggled to Repay by Number of Outstanding Loans
Source: Survey
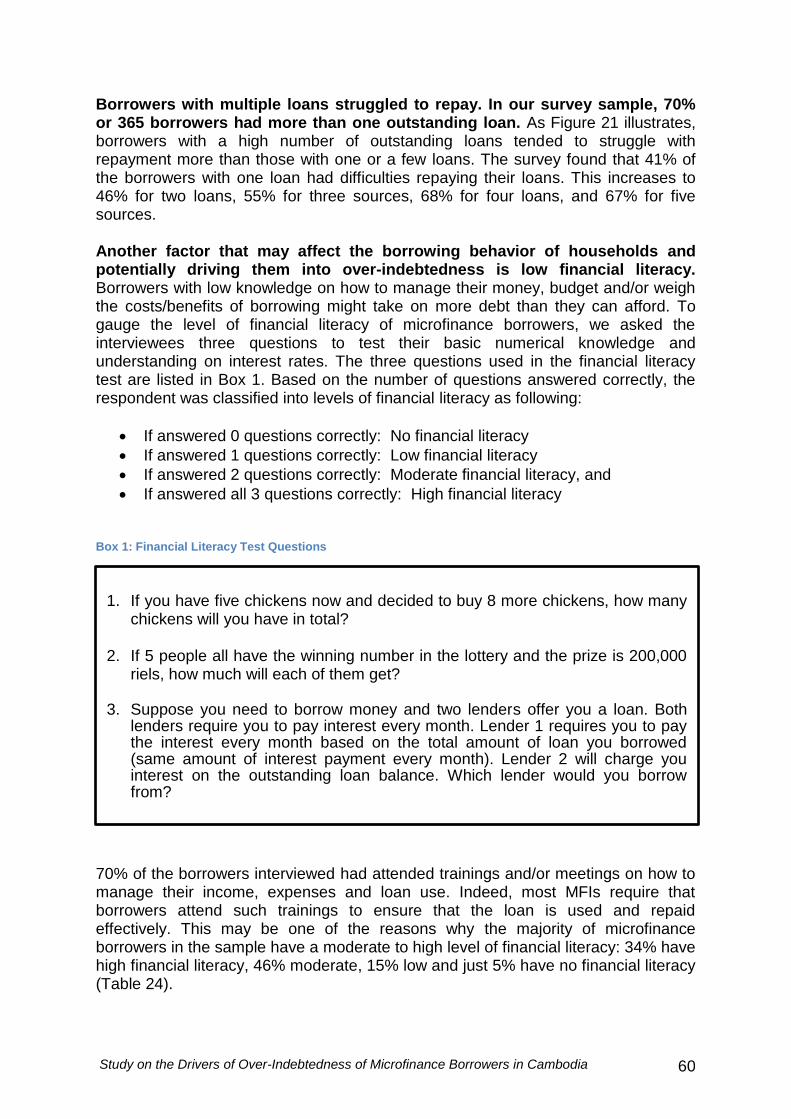
Study on the Drivers of Over-Indebtedness of Microfinance Borrowers in Cambodia 60
Borrowers with multiple loans struggled to repay. In our survey sample, 70% or 365 borrowers had more than one outstanding loan. As Figure 21 illustrates, borrowers with a high number of outstanding loans tended to struggle with repayment more than those with one or a few loans. The survey found that 41% of the borrowers with one loan had difficulties repaying their loans. This increases to 46% for two loans, 55% for three sources, 68% for four loans, and 67% for five sources. Another factor that may affect the borrowing behavior of households and potentially driving them into over-indebtedness is low financial literacy. Borrowers with low knowledge on how to manage their money, budget and/or weigh the costs/benefits of borrowing might take on more debt than they can afford. To gauge the level of financial literacy of microfinance borrowers, we asked the interviewees three questions to test their basic numerical knowledge and understanding on interest rates. The three questions used in the financial literacy test are listed in Box 1. Based on the number of questions answered correctly, the respondent was classified into levels of financial literacy as following:
If answered 0 questions correctly: No financial literacy
If answered 1 questions correctly: Low financial literacy
If answered 2 questions correctly: Moderate financial literacy, and
If answered all 3 questions correctly: High financial literacy Box 1: Financial Literacy Test Questions
70% of the borrowers interviewed had attended trainings and/or meetings on how to manage their income, expenses and loan use. Indeed, most MFIs require that borrowers attend such trainings to ensure that the loan is used and repaid effectively. This may be one of the reasons why the majority of microfinance borrowers in the sample have a moderate to high level of financial literacy: 34% have high financial literacy, 46% moderate, 15% low and just 5% have no financial literacy (Table 24).
1. If you have five chickens now and decided to buy 8 more chickens, how many
chickens will you have in total? 2. If 5 people all have the winning number in the lottery and the prize is 200,000
riels, how much will each of them get? 3. Suppose you need to borrow money and two lenders offer you a loan. Both
lenders require you to pay interest every month. Lender 1 requires you to pay the interest every month based on the total amount of loan you borrowed (same amount of interest payment every month). Lender 2 will charge you interest on the outstanding loan balance. Which lender would you borrow from?

Study on the Drivers of Over-Indebtedness of Microfinance Borrowers in Cambodia 61
Table 24: Financial Literacy and Struggled to Repay
Financial Literacy Number Percent Struggled to Repay*
Yes No Total
None 23 5% 57% 43% 100%
Low financial literacy 71 15% 65% 35% 100%
Moderate financial literacy 214 46% 52% 48% 100%
High financial literacy 157 34% 42% 58% 100%
All Borrowers 465 100% 51% 49% 100%
Source: Survey. *Percentage of total borrowers in each financial literacy group
The survey data shows that a slight majority of borrowers with high financial literacy never struggled to repay their loans (58% never struggled, 42% struggled). On the other hand, the majority of borrowers with no, low and moderate levels of financial literacy had struggled to repay (57%, 65% and 52% respectively). However, it is hard to make any definitive conclusions on the relationship between having struggled to repay and financial literacy because of the small number of borrowers with no and low financial literacy. There appears to be a connection between financial literacy and multiple borrowing. A deeper look at the survey data shows that a higher percentage of borrowers with no or low financial literacy had multiple loans compared to those with higher financial literacy. Among borrowers with no financial literacy, the majority (60%, Table 25) had three or more outstanding loans, and almost half (43%) had four or more loans outstanding. Among the borrowers with low financial literacy, 35% had four or more loans outstanding. By contrast, only 23% and 24%, respectively, of borrowers with moderate and high financial literacy had more than four outstanding loans. Again, we need to be cautious with this finding because of the small sample of borrowers with no or low financial literacy. Table 25: Financial Literacy by Number of Outstanding Loans
Financial Literacy Number of Outstanding Loans
1 2 3 4 5 6 7 All
Borrowers
None 17% 22% 17% 39% 4% 0% 0% 100%
Low 27% 31% 7% 23% 7% 4% 1% 100%
Moderate 33% 26% 18% 13% 7% 3% 0% 100%
High 30% 29% 17% 13% 10% 1% 1% 100%
All Borrowers 30% 28% 16% 16% 8% 2% 1% 100% Source: Survey and Desk Review Database (number of loans)
Study on the Drivers of Over-Indebtedness of Microfinance Borrowers in Cambodia 62
Lack of borrowing experience is not an issue. About half of the borrowers surveyed (49%) had borrowed more than four cycles from an MFI and therefore, had a high level of borrowing experience. Around a quarter (24%) had borrowed 3-4 cycles (medium level of borrowing experience) and 27% were on their first or second cycle (low level of borrowing experience). High experience does not prevent borrowers from falling into a situation of over-indebtedness: 54% of borrowers with high experience had struggled with repaying their debts. Another potential factor that may drive a borrower into over-indebtedness is risk appetite. Theoretically, borrowers with a high appetite for risk, that is, willing to accept high risks for potentially large business rewards, may drive themselves into over-indebtedness. Borrowers with a low risk appetite are averse to risk and will tend to avoid taking on any risk and uncertainty (such as multiple borrowing), and therefore, are less likely to be over-indebted. To measure the risk appetite of borrowers, they were about the likelihood of engaging in six risky scenarios. Box 2 lists the scenarios asked to interviewees. While the measurement is not a perfect tool for calculating risk appetite, it nevertheless is a useful indicator. Borrowers were then classified into risk appetite groups based on the number of risky scenarios they would likely engage in, as follows:39
If likely to engage in none of the risky scenarios: Conservative
If likely to engage in 1-3 of the risky scenarios: Moderate
If likely to engage 4-6 of the risky scenarios: Aggressive Box 2: Risk Appetite Scenarios
39 Our risk appetite test is adapted from a psychometric scale that assets risk taking in five content
domains: financial decisions (separately for investing versus gambling), health/safety, recreational, ethical and social decisions. See Weber, et.al, (2002) for more details.
How likely are you to engage in the following scenarios?
1. Spending money impulsively without thinking about the consequences. 2. Co-signing a loan for a friend 3. Lending a friend an amount of money equivalent to one month’s income. 4. Taking a job where you get paid exclusively on a commission basis. 5. Investing in a business that has high profit, but good chance of failing. 6. Betting a day’s income in a card game and/or sporting event
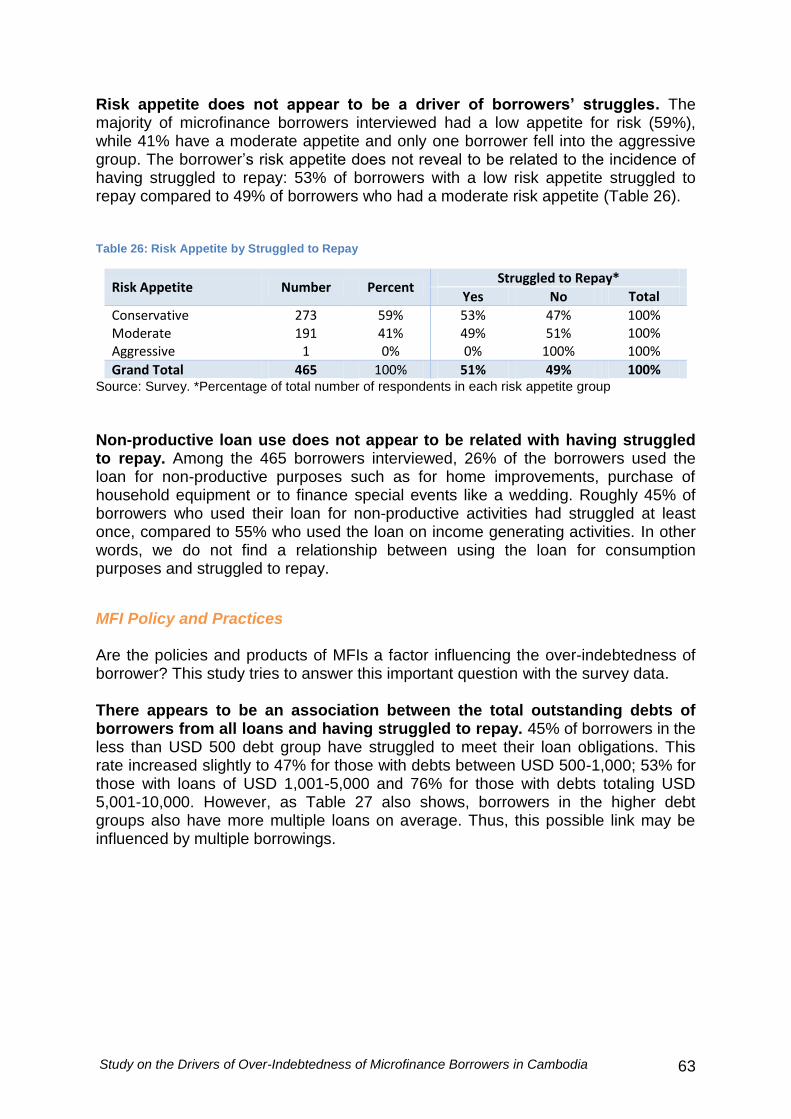
Study on the Drivers of Over-Indebtedness of Microfinance Borrowers in Cambodia 63
Risk appetite does not appear to be a driver of borrowers’ struggles. The majority of microfinance borrowers interviewed had a low appetite for risk (59%), while 41% have a moderate appetite and only one borrower fell into the aggressive group. The borrower’s risk appetite does not reveal to be related to the incidence of having struggled to repay: 53% of borrowers with a low risk appetite struggled to repay compared to 49% of borrowers who had a moderate risk appetite (Table 26). Table 26: Risk Appetite by Struggled to Repay
Risk Appetite Number Percent Struggled to Repay*
Yes No Total
Conservative 273 59% 53% 47% 100% Moderate 191 41% 49% 51% 100% Aggressive 1 0% 0% 100% 100%
Grand Total 465 100% 51% 49% 100% Source: Survey. *Percentage of total number of respondents in each risk appetite group
Non-productive loan use does not appear to be related with having struggled to repay. Among the 465 borrowers interviewed, 26% of the borrowers used the loan for non-productive purposes such as for home improvements, purchase of household equipment or to finance special events like a wedding. Roughly 45% of borrowers who used their loan for non-productive activities had struggled at least once, compared to 55% who used the loan on income generating activities. In other words, we do not find a relationship between using the loan for consumption purposes and struggled to repay.
MFI Policy and Practices Are the policies and products of MFIs a factor influencing the over-indebtedness of borrower? This study tries to answer this important question with the survey data. There appears to be an association between the total outstanding debts of borrowers from all loans and having struggled to repay. 45% of borrowers in the less than USD 500 debt group have struggled to meet their loan obligations. This rate increased slightly to 47% for those with debts between USD 500-1,000; 53% for those with loans of USD 1,001-5,000 and 76% for those with debts totaling USD 5,001-10,000. However, as Table 27 also shows, borrowers in the higher debt groups also have more multiple loans on average. Thus, this possible link may be influenced by multiple borrowings.

Study on the Drivers of Over-Indebtedness of Microfinance Borrowers in Cambodia 64
Table 27: Total Debt Outstanding and Struggled to Repay
Total Debt Outstanding
Number of Borrowers
Average Number of Loans
Percentage of Borrowers in Each Debt Group
Have Struggled
Never Struggled
Total
Less than USD 500 98 1.2 45% 55% 100%
USD 500 - 1,000 110 2.1 47% 53% 100%
USD 1,001 - 5,000 231 3.2 53% 47% 100%
USD 5,001 - 10,000 25 3.6 76% 24% 100%
Over USD 10,000 1 5.0 0% 100% 100%
Total 465 2.5 51% 49% 100%
Source: Survey When we isolated the “multiple loan effect” by looking only at borrowers with one loan, there reveals to be no connection between the loan size and having struggled to repay. 48% of borrowers with loans under USD 500 have struggled. The proportion of borrowers who have struggled to repay falls to 27% for borrowers with loan size in the USD 500-1,000 group, and then increases to 33% for USD 1,001-5,000 and 50% for USD 5,001-10,000. Table 28: Loan Size by Struggled to Repay (Borrowers with 1 Loan)
Loan Size Number of Borrowers*
Percentage of Borrowers in Each Debt Group
Have Struggled
Never Struggled
Total
Less than USD 500 83 48% 52% 100%
USD 500 - 1,000 22 27% 73% 100%
USD 1,001 - 5,000 33 33% 67% 100%
USD 5,001 - 10,000 2 50% 50% 100%
Over USD 10,000 0 - - -
Total 140 41% 59% 100%
Source: Survey. *Includes only borrowers with one loan. No link between the lending methodology and borrowers’ struggle. Consistent with findings from the desk review, the survey findings showed no connection between having struggled to repay loans and whether the loan was made in the form of group or individual loans. Among the borrowers that struggled to meet debt obligations, 71% of the loans were in the form of group loans and 29% in individual loans. Similarly, the distribution by lending method among borrowers that never struggled was 67% group loans and 33% individual loans. (Figure 22)
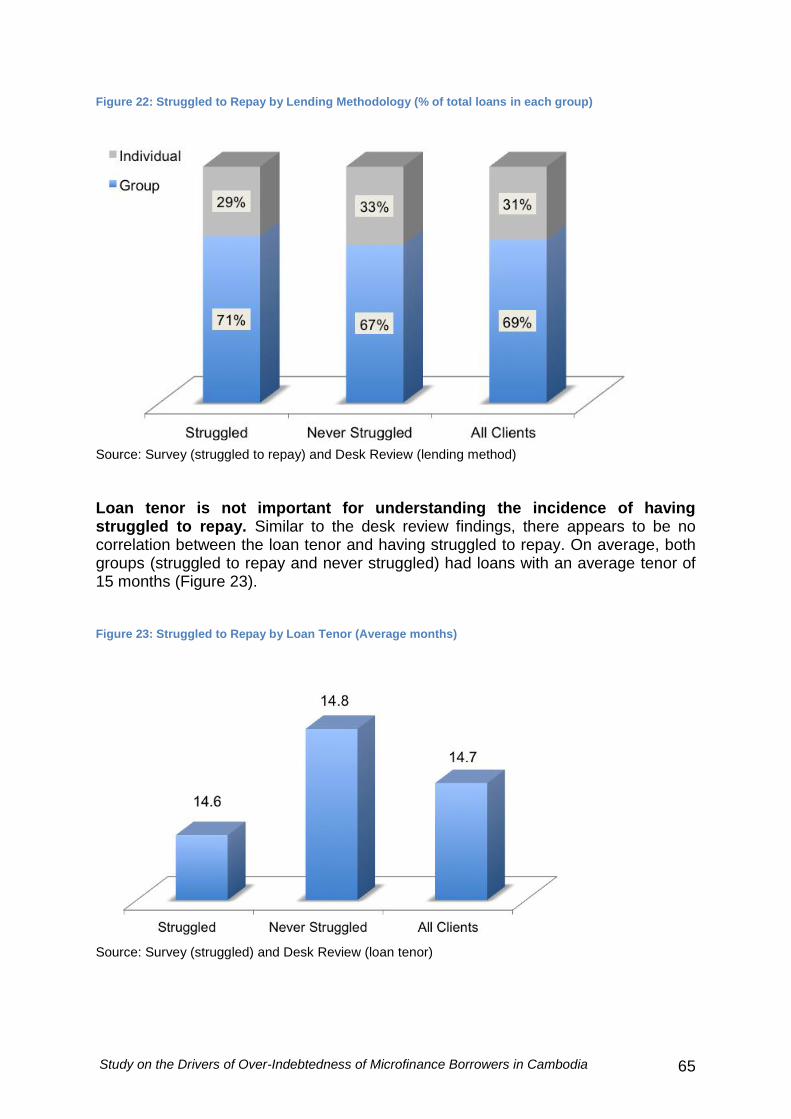
Study on the Drivers of Over-Indebtedness of Microfinance Borrowers in Cambodia 65
Figure 22: Struggled to Repay by Lending Methodology (% of total loans in each group)
Source: Survey (struggled to repay) and Desk Review (lending method)
Loan tenor is not important for understanding the incidence of having struggled to repay. Similar to the desk review findings, there appears to be no correlation between the loan tenor and having struggled to repay. On average, both groups (struggled to repay and never struggled) had loans with an average tenor of 15 months (Figure 23). Figure 23: Struggled to Repay by Loan Tenor (Average months)
Source: Survey (struggled) and Desk Review (loan tenor)
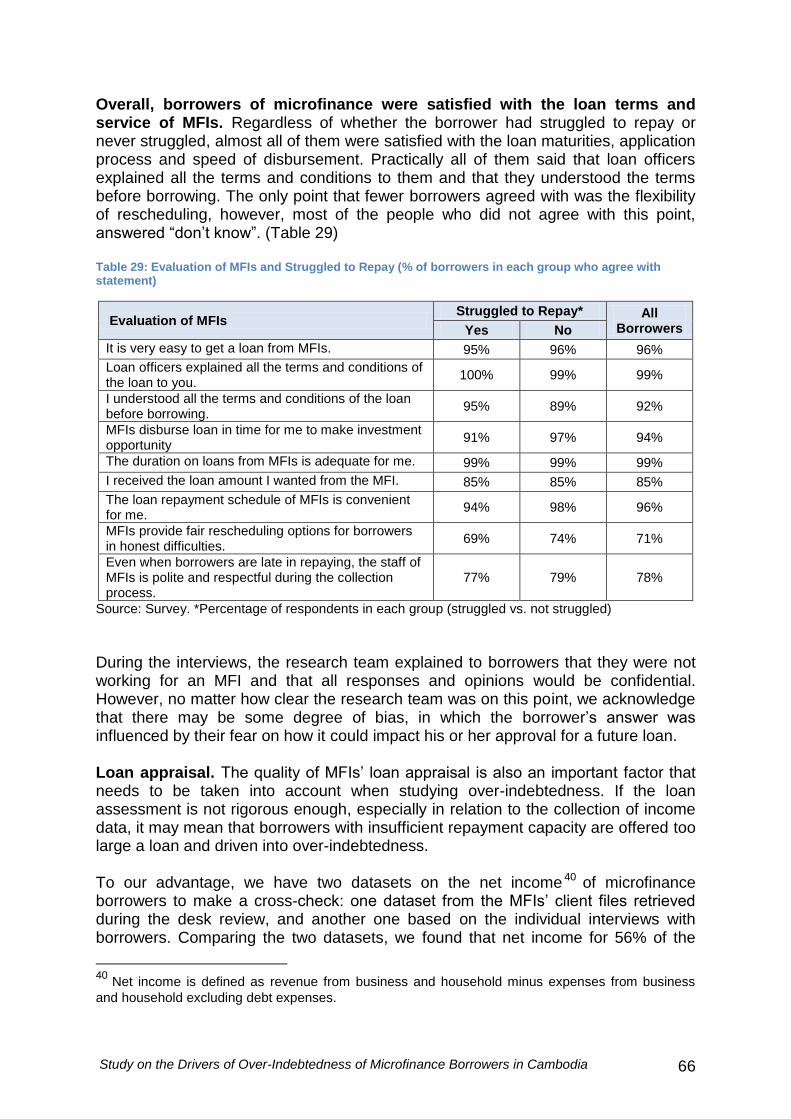
Study on the Drivers of Over-Indebtedness of Microfinance Borrowers in Cambodia 66
Overall, borrowers of microfinance were satisfied with the loan terms and service of MFIs. Regardless of whether the borrower had struggled to repay or never struggled, almost all of them were satisfied with the loan maturities, application process and speed of disbursement. Practically all of them said that loan officers explained all the terms and conditions to them and that they understood the terms before borrowing. The only point that fewer borrowers agreed with was the flexibility of rescheduling, however, most of the people who did not agree with this point, answered “don’t know”. (Table 29) Table 29: Evaluation of MFIs and Struggled to Repay (% of borrowers in each group who agree with statement)
Evaluation of MFIs Struggled to Repay* All
Borrowers Yes No
It is very easy to get a loan from MFIs. 95% 96% 96%
Loan officers explained all the terms and conditions of the loan to you.
100% 99% 99%
I understood all the terms and conditions of the loan before borrowing.
95% 89% 92%
MFIs disburse loan in time for me to make investment opportunity
91% 97% 94%
The duration on loans from MFIs is adequate for me. 99% 99% 99%
I received the loan amount I wanted from the MFI. 85% 85% 85%
The loan repayment schedule of MFIs is convenient for me.
94% 98% 96%
MFIs provide fair rescheduling options for borrowers in honest difficulties.
69% 74% 71%
Even when borrowers are late in repaying, the staff of MFIs is polite and respectful during the collection process.
77% 79% 78%
Source: Survey. *Percentage of respondents in each group (struggled vs. not struggled)
During the interviews, the research team explained to borrowers that they were not working for an MFI and that all responses and opinions would be confidential. However, no matter how clear the research team was on this point, we acknowledge that there may be some degree of bias, in which the borrower’s answer was influenced by their fear on how it could impact his or her approval for a future loan. Loan appraisal. The quality of MFIs’ loan appraisal is also an important factor that needs to be taken into account when studying over-indebtedness. If the loan assessment is not rigorous enough, especially in relation to the collection of income data, it may mean that borrowers with insufficient repayment capacity are offered too large a loan and driven into over-indebtedness. To our advantage, we have two datasets on the net income 40 of microfinance borrowers to make a cross-check: one dataset from the MFIs’ client files retrieved during the desk review, and another one based on the individual interviews with borrowers. Comparing the two datasets, we found that net income for 56% of the
40 Net income is defined as revenue from business and household minus expenses from business
and household excluding debt expenses.
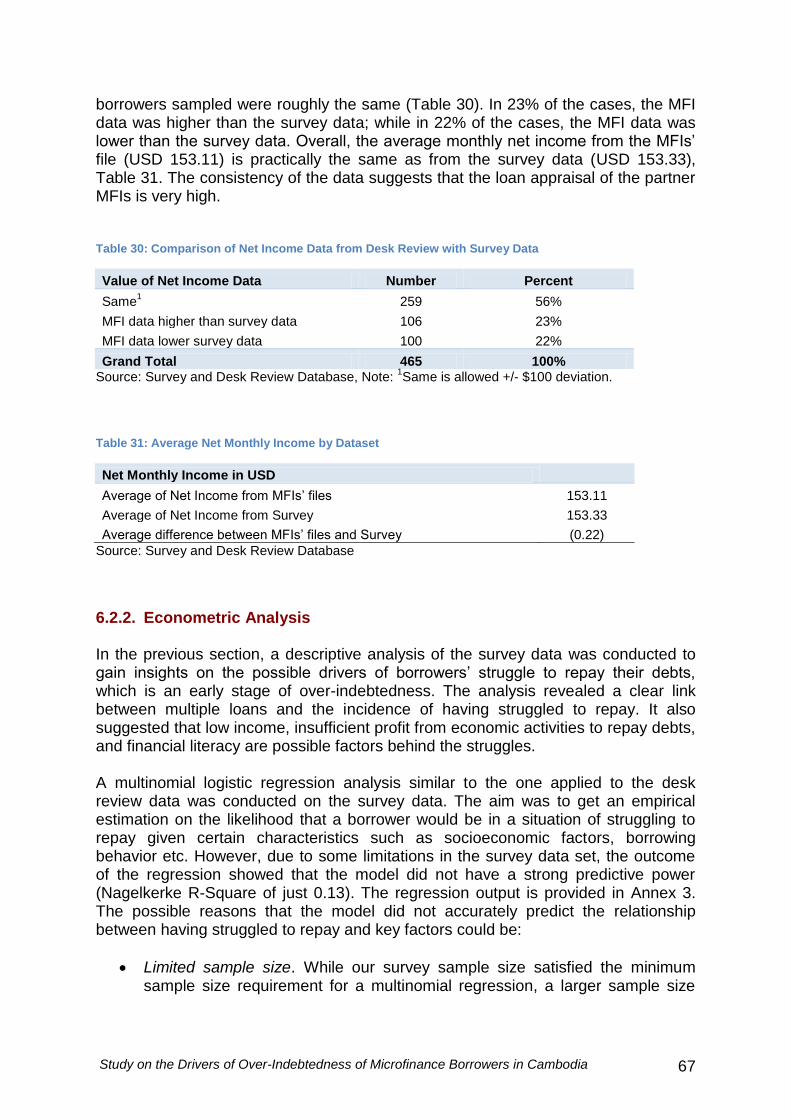
Study on the Drivers of Over-Indebtedness of Microfinance Borrowers in Cambodia 67
borrowers sampled were roughly the same (Table 30). In 23% of the cases, the MFI data was higher than the survey data; while in 22% of the cases, the MFI data was lower than the survey data. Overall, the average monthly net income from the MFIs’ file (USD 153.11) is practically the same as from the survey data (USD 153.33), Table 31. The consistency of the data suggests that the loan appraisal of the partner MFIs is very high. Table 30: Comparison of Net Income Data from Desk Review with Survey Data
Value of Net Income Data Number Percent
Same1 259 56%
MFI data higher than survey data 106 23%
MFI data lower survey data 100 22%
Grand Total 465 100% Source: Survey and Desk Review Database, Note:
1Same is allowed +/- $100 deviation.
Table 31: Average Net Monthly Income by Dataset
Net Monthly Income in USD Average of Net Income from MFIs’ files 153.11
Average of Net Income from Survey 153.33
Average difference between MFIs’ files and Survey (0.22)
Source: Survey and Desk Review Database
6.2.2. Econometric Analysis In the previous section, a descriptive analysis of the survey data was conducted to gain insights on the possible drivers of borrowers’ struggle to repay their debts, which is an early stage of over-indebtedness. The analysis revealed a clear link between multiple loans and the incidence of having struggled to repay. It also suggested that low income, insufficient profit from economic activities to repay debts, and financial literacy are possible factors behind the struggles. A multinomial logistic regression analysis similar to the one applied to the desk review data was conducted on the survey data. The aim was to get an empirical estimation on the likelihood that a borrower would be in a situation of struggling to repay given certain characteristics such as socioeconomic factors, borrowing behavior etc. However, due to some limitations in the survey data set, the outcome of the regression showed that the model did not have a strong predictive power (Nagelkerke R-Square of just 0.13). The regression output is provided in Annex 3. The possible reasons that the model did not accurately predict the relationship between having struggled to repay and key factors could be:
Limited sample size. While our survey sample size satisfied the minimum sample size requirement for a multinomial regression, a larger sample size
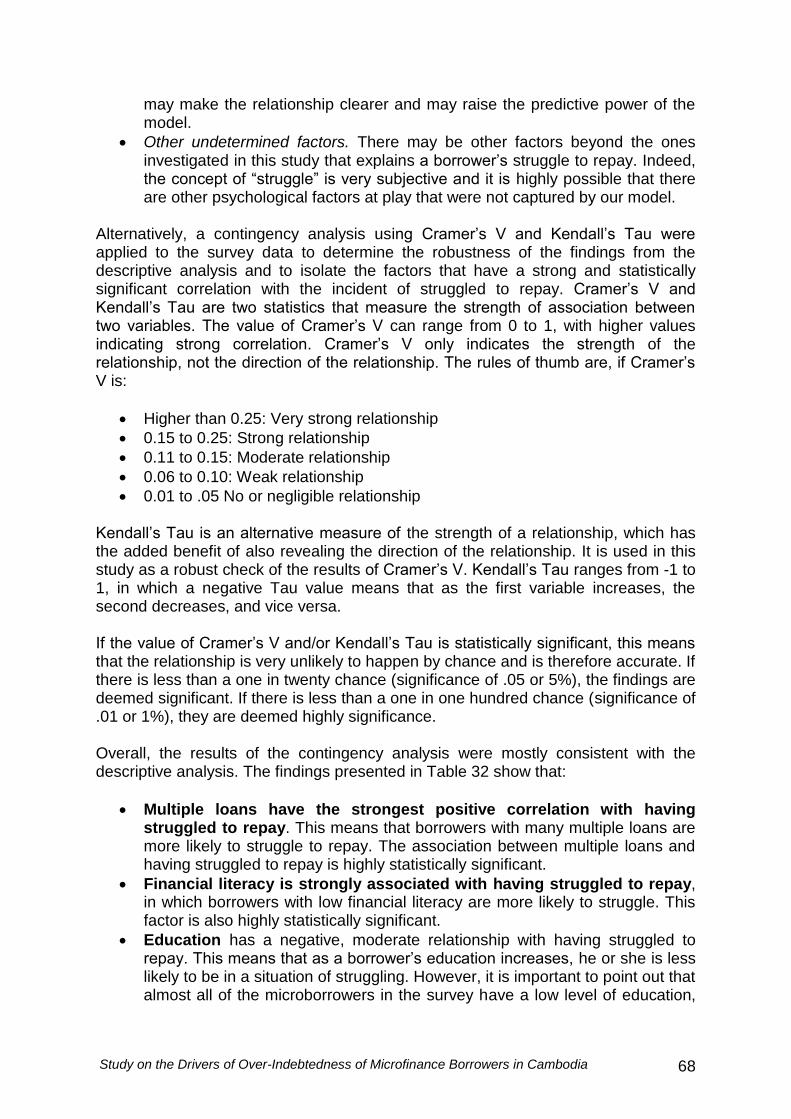
Study on the Drivers of Over-Indebtedness of Microfinance Borrowers in Cambodia 68
may make the relationship clearer and may raise the predictive power of the model.
Other undetermined factors. There may be other factors beyond the ones investigated in this study that explains a borrower’s struggle to repay. Indeed, the concept of “struggle” is very subjective and it is highly possible that there are other psychological factors at play that were not captured by our model.
Alternatively, a contingency analysis using Cramer’s V and Kendall’s Tau were applied to the survey data to determine the robustness of the findings from the descriptive analysis and to isolate the factors that have a strong and statistically significant correlation with the incident of struggled to repay. Cramer’s V and Kendall’s Tau are two statistics that measure the strength of association between two variables. The value of Cramer’s V can range from 0 to 1, with higher values indicating strong correlation. Cramer’s V only indicates the strength of the relationship, not the direction of the relationship. The rules of thumb are, if Cramer’s V is:
Higher than 0.25: Very strong relationship
0.15 to 0.25: Strong relationship
0.11 to 0.15: Moderate relationship
0.06 to 0.10: Weak relationship
0.01 to .05 No or negligible relationship
Kendall’s Tau is an alternative measure of the strength of a relationship, which has the added benefit of also revealing the direction of the relationship. It is used in this study as a robust check of the results of Cramer’s V. Kendall’s Tau ranges from -1 to 1, in which a negative Tau value means that as the first variable increases, the second decreases, and vice versa. If the value of Cramer’s V and/or Kendall’s Tau is statistically significant, this means that the relationship is very unlikely to happen by chance and is therefore accurate. If there is less than a one in twenty chance (significance of .05 or 5%), the findings are deemed significant. If there is less than a one in one hundred chance (significance of .01 or 1%), they are deemed highly significance. Overall, the results of the contingency analysis were mostly consistent with the descriptive analysis. The findings presented in Table 32 show that:
Multiple loans have the strongest positive correlation with having struggled to repay. This means that borrowers with many multiple loans are more likely to struggle to repay. The association between multiple loans and having struggled to repay is highly statistically significant.
Financial literacy is strongly associated with having struggled to repay, in which borrowers with low financial literacy are more likely to struggle. This factor is also highly statistically significant.
Education has a negative, moderate relationship with having struggled to repay. This means that as a borrower’s education increases, he or she is less likely to be in a situation of struggling. However, it is important to point out that almost all of the microborrowers in the survey have a low level of education,
Study on the Drivers of Over-Indebtedness of Microfinance Borrowers in Cambodia 69
and therefore, this finding is likely biased by the small sample of borrowers with a high education.
Unlike the findings in the objective OID analysis, profit from entrepreneurial activities does not show to have a strong or significant correlation with having struggled to repay. This is likely because the majority of borrowers in the survey repay with wage income.
There is no statistically significant relationship between having struggled to repay and the other factors.
Table 32: Potential Drivers of Struggled to Repay
Drivers Cramer's V Kendall's tau
a
Value Sig. Value Sig.
Multiple Loan 0.216 0.001 0.193 0.00
Financial Literacy 0.166 0.005 -0.17 0.00
Education 0.133 0.017 -0.095 0.007
Gender 0.086 0.063 - -
Economic Activity 0.094 0.125 - -
Nonproductive Use 0.07 0.129 - -
Marital Status 0.08 0.399 - -
Net Income 0.947 0.413 - -
Dependency Ratio 0.03 0.518 0.03 0.518
Irregular Income 0.017 0.717 - -
Poverty 0.011 0.809 - -
Individual Loan 0.01 0.836 - -
Group Loan 0.009 0.851 - -
Volatile Income 0.007 0.879 - -
Health Shock 0.004 0.933 - -
Profit enough 0.016 0.944 -0.011 0.822
Adverse Shock 0.002 0.962
Sample size=465 cases. a: Kendall’s Tau only used on ordinal or interval variables only, for which
Kendall’s Tau-b used for squared contingency tables and Kendal’s Tau-c used for rectangular contingency tables.
Study on the Drivers of Over-Indebtedness of Microfinance Borrowers in Cambodia 70
7. What This All Means and Moving Forward This study explores the drivers of over-indebtedness of micro borrowers in Cambodia. We specifically investigated areas with saturated markets to maximize the number of potentially over-indebted clients in our sample. The findings, therefore, do not represent the full national situation, but only a specific fraction. The degree of OID in selected saturated areas: In this study, we used two definitions of over-indebtedness: an objective one and a subjective one. The objective measure is based on the traditional view of over-indebtedness that looks at the repayment capacity of the borrower by comparing the debt installments to the net income. Applying this measure, we found that 22% percent of clients in the sample of 1,480 were insolvent or over-indebted. The subjective measure is derived from a client protection perspective and takes into account of the sacrifices that borrowers make to repay their debts on time. We defined that microfinance borrowers are considered over-indebted if they struggle to repay loans to the point that they are frequently making unacceptable sacrifices to repay their loans that affect their household’s living standards. In the survey sample of 465 clients, 6% of clients fit this subjective definition and were therefore considered to be over-indebted. 100% of the borrowers classified as OID based on our subjective definition were also identified as OID based on our objective definition. Borrowers’ high tolerance for making sacrifices to repay their debts While very few borrowers felt that the sacrifices they make are unacceptable, the reality is that 51% of borrowers expressed that they have struggled to make payments (45% struggled a few times, 6% struggled most of the time and less than 1% struggled all the time). This finding and the wide gap between the objective and subjective level of over-indebtedness reflect borrowers’ high tolerance for making sacrifices to repay their debts. It appears to reveal the high value that borrowers place on their access to microcredit. Potential drivers of OID and clients’ struggle to repay Two separate econometrical analyses were conducted to identify i) the potential drivers of OID based on our objective definition and ii) clients’ struggle to repay. The two variables statistically significant in clarifying differences in objective OID are multiple loans and profit from economic activity. Having multiple loans increased a borrower’s odds of being over-indebted by 6 times, specifically when the borrower has three or more outstanding loans. Having insufficient profit from entrepreneurial activities alone to cover debt obligations increased the chance of
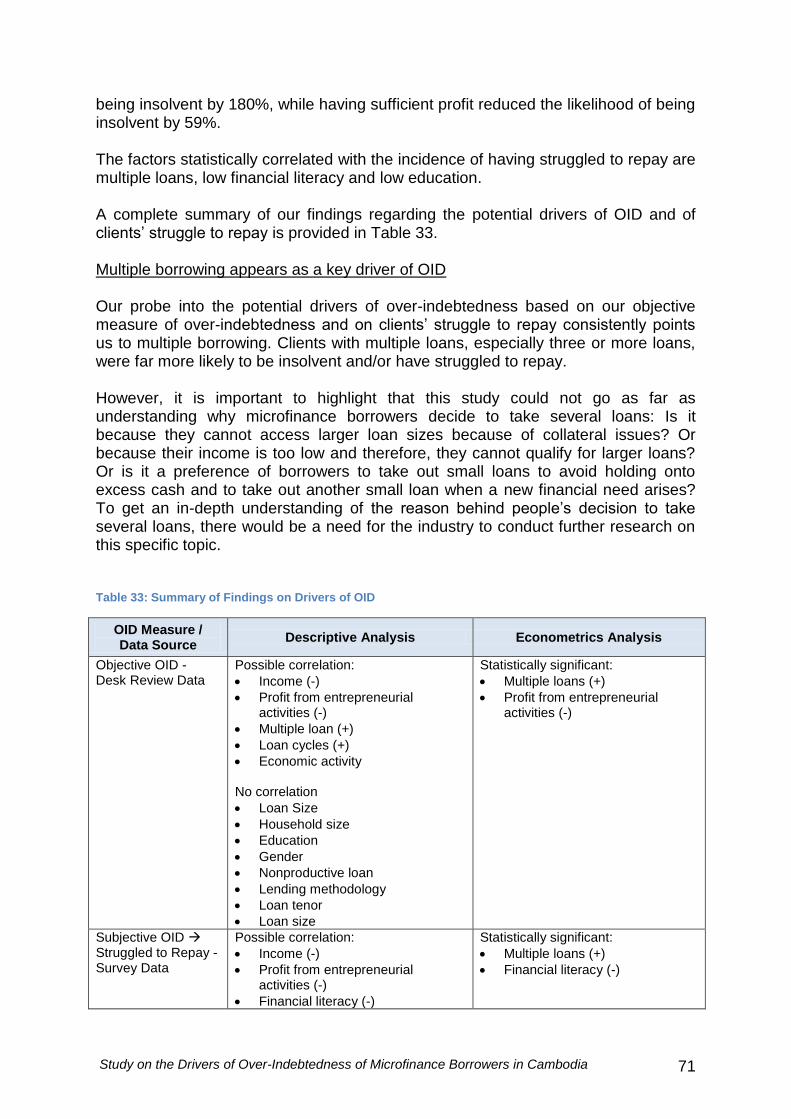
Study on the Drivers of Over-Indebtedness of Microfinance Borrowers in Cambodia 71
being insolvent by 180%, while having sufficient profit reduced the likelihood of being insolvent by 59%. The factors statistically correlated with the incidence of having struggled to repay are multiple loans, low financial literacy and low education. A complete summary of our findings regarding the potential drivers of OID and of clients’ struggle to repay is provided in Table 33. Multiple borrowing appears as a key driver of OID Our probe into the potential drivers of over-indebtedness based on our objective measure of over-indebtedness and on clients’ struggle to repay consistently points us to multiple borrowing. Clients with multiple loans, especially three or more loans, were far more likely to be insolvent and/or have struggled to repay. However, it is important to highlight that this study could not go as far as understanding why microfinance borrowers decide to take several loans: Is it because they cannot access larger loan sizes because of collateral issues? Or because their income is too low and therefore, they cannot qualify for larger loans? Or is it a preference of borrowers to take out small loans to avoid holding onto excess cash and to take out another small loan when a new financial need arises? To get an in-depth understanding of the reason behind people’s decision to take several loans, there would be a need for the industry to conduct further research on this specific topic. Table 33: Summary of Findings on Drivers of OID
OID Measure / Data Source
Descriptive Analysis Econometrics Analysis
Objective OID - Desk Review Data
Possible correlation:
Income (-)
Profit from entrepreneurial activities (-)
Multiple loan (+)
Loan cycles (+)
Economic activity No correlation
Loan Size
Household size
Education
Gender
Nonproductive loan
Lending methodology
Loan tenor
Loan size
Statistically significant:
Multiple loans (+)
Profit from entrepreneurial activities (-)
Subjective OID Struggled to Repay - Survey Data
Possible correlation:
Income (-)
Profit from entrepreneurial activities (-)
Financial literacy (-)
Statistically significant:
Multiple loans (+)
Financial literacy (-)
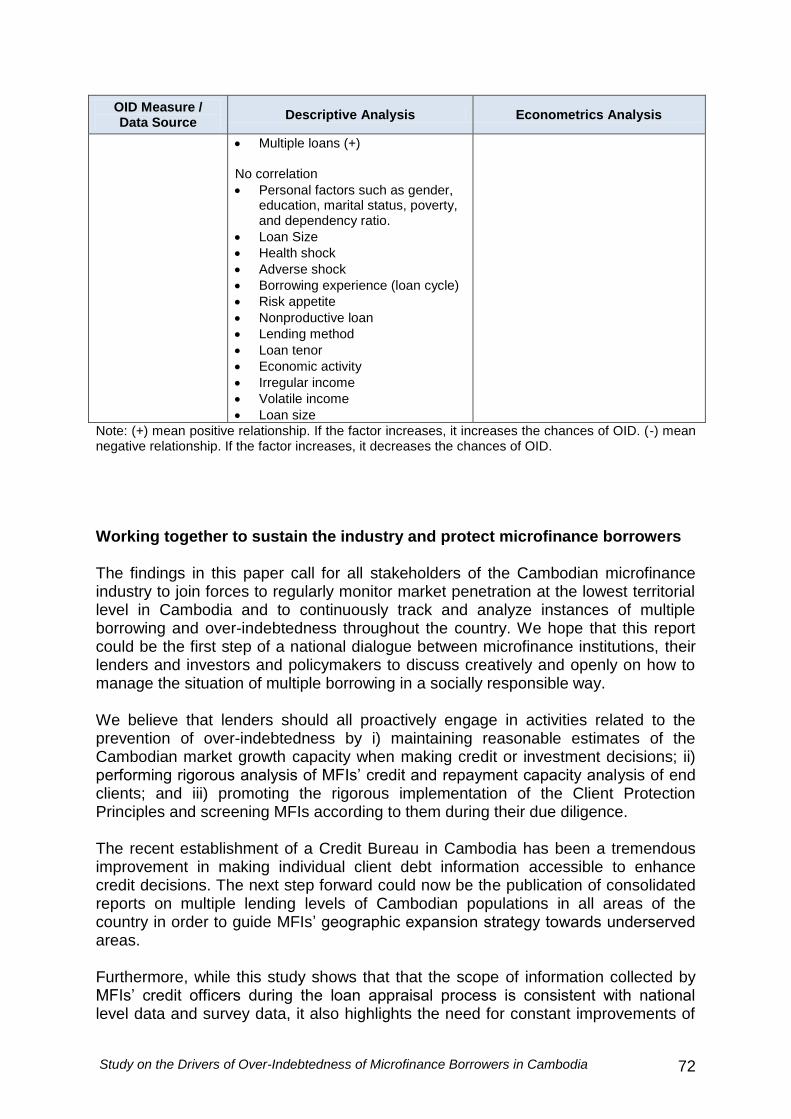
Study on the Drivers of Over-Indebtedness of Microfinance Borrowers in Cambodia 72
OID Measure / Data Source
Descriptive Analysis Econometrics Analysis
Multiple loans (+) No correlation
Personal factors such as gender, education, marital status, poverty, and dependency ratio.
Loan Size
Health shock
Adverse shock
Borrowing experience (loan cycle)
Risk appetite
Nonproductive loan
Lending method
Loan tenor
Economic activity
Irregular income
Volatile income
Loan size
Note: (+) mean positive relationship. If the factor increases, it increases the chances of OID. (-) mean negative relationship. If the factor increases, it decreases the chances of OID.
Working together to sustain the industry and protect microfinance borrowers The findings in this paper call for all stakeholders of the Cambodian microfinance industry to join forces to regularly monitor market penetration at the lowest territorial level in Cambodia and to continuously track and analyze instances of multiple borrowing and over-indebtedness throughout the country. We hope that this report could be the first step of a national dialogue between microfinance institutions, their lenders and investors and policymakers to discuss creatively and openly on how to manage the situation of multiple borrowing in a socially responsible way. We believe that lenders should all proactively engage in activities related to the prevention of over-indebtedness by i) maintaining reasonable estimates of the Cambodian market growth capacity when making credit or investment decisions; ii) performing rigorous analysis of MFIs’ credit and repayment capacity analysis of end clients; and iii) promoting the rigorous implementation of the Client Protection Principles and screening MFIs according to them during their due diligence. The recent establishment of a Credit Bureau in Cambodia has been a tremendous improvement in making individual client debt information accessible to enhance credit decisions. The next step forward could now be the publication of consolidated reports on multiple lending levels of Cambodian populations in all areas of the country in order to guide MFIs’ geographic expansion strategy towards underserved areas. Furthermore, while this study shows that that the scope of information collected by MFIs’ credit officers during the loan appraisal process is consistent with national level data and survey data, it also highlights the need for constant improvements of
Study on the Drivers of Over-Indebtedness of Microfinance Borrowers in Cambodia 73
MFIs’ lending practices in terms of defining and systematically implementing precise rules on maximum number of loans per client. It also shows that income analysis done at the household level need to be conducted cautiously, recognizing that while the sources of income not directly generated by the financed business might often be used for debt repayment purposes, clients are in a better, more solvent position if their businesses can generate sufficient income to repay debts. While it is clear that a high level of cooperation and exchange of information has traditionally characterized the Cambodian microfinance industry, now the areas of discussion that need to be considered include: i) industry level guidelines regarding multiple borrowing; ii) refined repayment capacity analysis to make sure that financed businesses are profitable enough to cover interest payments; iii) enhanced credit appraisals for loan renewals taking into account the volatility of microfinance borrowers’ income The professional supervision of the industry by the National Bank of Cambodia (NBC) needs to continue. Supervision may be expanded beyond financial and legal compliance, to possibly monitoring and ensuring that MFIs are consistent with ethical and responsible lending without detriment to the social mission the microfinance industry was originally founded to achieve. Consideration for putting in place rules on the number of multiple loans and reporting of multiple loans by MFIs as a preventive measure for over-indebtedness could also be explored. For example, in Peru the central bank has set up specific prudential guidelines and rules to limit OID risk for clients. Financial institutions’ risk departments have to present a quarterly report on OID risks to senior management and board. The Peruvian Central Bank also requires tracking of multiple loans by financial institutions with extra provisioning requirements: in case a loan from one financial institution falls into arrears, the other MFIs lending to the same client are required to increase their provisioning on their own outstanding loans with this client even if their loans to his or her are not delinquent.
Financial literacy is also important. Clients with low financial literacy seem to struggle more in repaying their loans than those with higher financial literacy levels. With many options available in the market now, the danger is that clients take on more loans than they can handle because they do not fully understand the ramifications. Most MFIs provide financial trainings to borrowers to ensure that the loan is used and repaid effectively. Although our financial literacy test suggested that only 20% of the borrowers have no or a low financial literacy, reflecting Cambodian MFIs’ important efforts in this area, it is crucial that MFIs spend time to restate more strongly to all their clients (and especially to clients living in saturated areas) the implication of availing of a loan. However, given the complexity of financial literacy, the burden should not just fall on MFIs. Each stakeholder in the general microfinance community can play an important role in enhancing financial literacy based on their own specialization, including development agencies and regulatory bodies. We look forward to participating in this debate and hope that this report could be the starting point of a fruitful, healthy and transparent national dialogue to be started now.

Study on the Drivers of Over-Indebtedness of Microfinance Borrowers in Cambodia 74
References Akhand Tiwari, Anvesha Khandelwal and Minakshi Ramji. 2008. How Do Microfinance Clients Understand their Loans? Centre for Micro Finance, Institute for Financial Management and Research, India Pytkowska, J. and Spannuth, S. 2011. Indebtedness of Microcredit Clients in Kosovo: Results from a comprehensive field study. Published by Finance in Motion and the Microfinance Centre (MFC) Schicks, J. 2011. Over-Indebtedness of Microborrowers in Ghana An Empirical Study from a Customer Protection Perspective. Center for Financial Inclusion Publication No. 15 Schicks, J. 2010. Microfinance Over-Indebtedness: Understanding its Drivers and Challenging the Common Myths. Centre for European Research in Micro- finance, Université Libre de Bruxelles CEB Working Paper No. 10/048. Vivien Kappel, Annette Krauss, Laura Lontzek. 2010. Over-Indebtedness and Microfinance – Constructing an Early Warning Index Center for Microfinance, University of Zurich Weber, E. , Blais, A., Betz, N. 2002. A Domain-specific Risk-attitude Scale: Measuring Risk Perceptions and Risk Behaviors. Journal of Behavioral Decision Making. 15: 263–290 (2002)

Study on the Drivers of Over-Indebtedness of Microfinance Borrowers in Cambodia 75
Annex Annex 1: Desk Review Data Collection Form
Enumerator Name Location
BASIC INFORMATION OF CLIENT
1. Client Name 2. Gender [ 1 ] Female [ 2 ] Male
3. Client ID Type [ ] National ID Card [ ] Family Book [ ] Passport [ ] Birth Certificate [ ] Resident Book
4. Client ID Number
5. Date of Birth 6. Age (if no Date of Birth)
7. Marital Status [ 1 ] Single [ 2 ] Married [ 3 ] Separated/Divorce [ 4 ] Widow/er
8. Household Size
9. Education [ 1 ] No formal education [ 2 ] Some primary education [ 3 ] Completed primary education [ 4 ] Some lower secondary education [ 5 ] Completed lower secondary education [ 6 ] Some upper secondary education [ 7 ] Completed upper secondary education [ 8 ] University level or higher
10. Main Economic Activity [ 1 ] Agriculture [ 2 ] Trade / Retail / Wholesale [ 3 ] Production [ 4 ] Service (Specify): …………………………………………… [ 5 ] Wage Income (Specify Job): ………………………………..

Study on the Drivers of Over-Indebtedness of Microfinance Borrowers in Cambodia 76
NET INCOME
MFI 1: …………. MFI 2: …………….
Currency: [ ] USD [ ] Riel [ ] Baht
Timeframe: [ ] month [ ] year [ ] over loan period:……months
Currency: [ ]USD [ ] Riel [ ] Baht
Timeframe: [ ] month [ ] year [ ] over loan period:……months
Current Projected Current Projected
Business Income
Other Income
Total Income (A)
Business Expense
Household Expense
Other Expense
Total Expense (B)
Net Income (A-B)
Net Income in Riel per Month
Average Net Income in Riel per Month
VALUE OF ASSET
Existing Asset
MFI 1: …….. MFI 2: ……..
Currency: [ ]USD [ ] Riel [ ] Baht
Currency: [ ]USD [ ] Riel [ ] Baht
Land
Building
Equipment
Cash
Other
Total Assets:
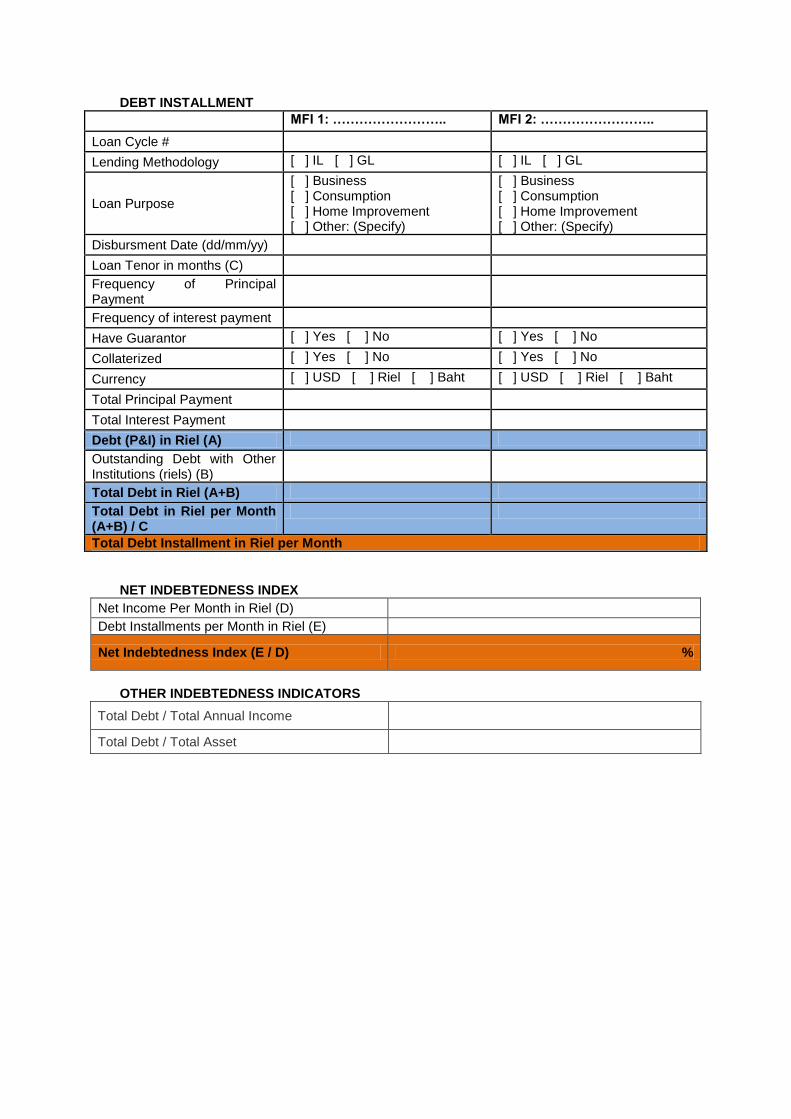
DEBT INSTALLMENT
MFI 1: …………………….. MFI 2: ……………………..
Loan Cycle #
Lending Methodology [ ] IL [ ] GL [ ] IL [ ] GL
Loan Purpose
[ ] Business [ ] Consumption [ ] Home Improvement [ ] Other: (Specify)
[ ] Business [ ] Consumption [ ] Home Improvement [ ] Other: (Specify)
Disbursment Date (dd/mm/yy)
Loan Tenor in months (C)
Frequency of Principal Payment
Frequency of interest payment
Have Guarantor [ ] Yes [ ] No [ ] Yes [ ] No
Collaterized [ ] Yes [ ] No [ ] Yes [ ] No
Currency [ ] USD [ ] Riel [ ] Baht [ ] USD [ ] Riel [ ] Baht
Total Principal Payment
Total Interest Payment
Debt (P&I) in Riel (A)
Outstanding Debt with Other Institutions (riels) (B)
Total Debt in Riel (A+B)
Total Debt in Riel per Month (A+B) / C
Total Debt Installment in Riel per Month
NET INDEBTEDNESS INDEX
Net Income Per Month in Riel (D)
Debt Installments per Month in Riel (E)
Net Indebtedness Index (E / D) %
OTHER INDEBTEDNESS INDICATORS
Total Debt / Total Annual Income
Total Debt / Total Asset
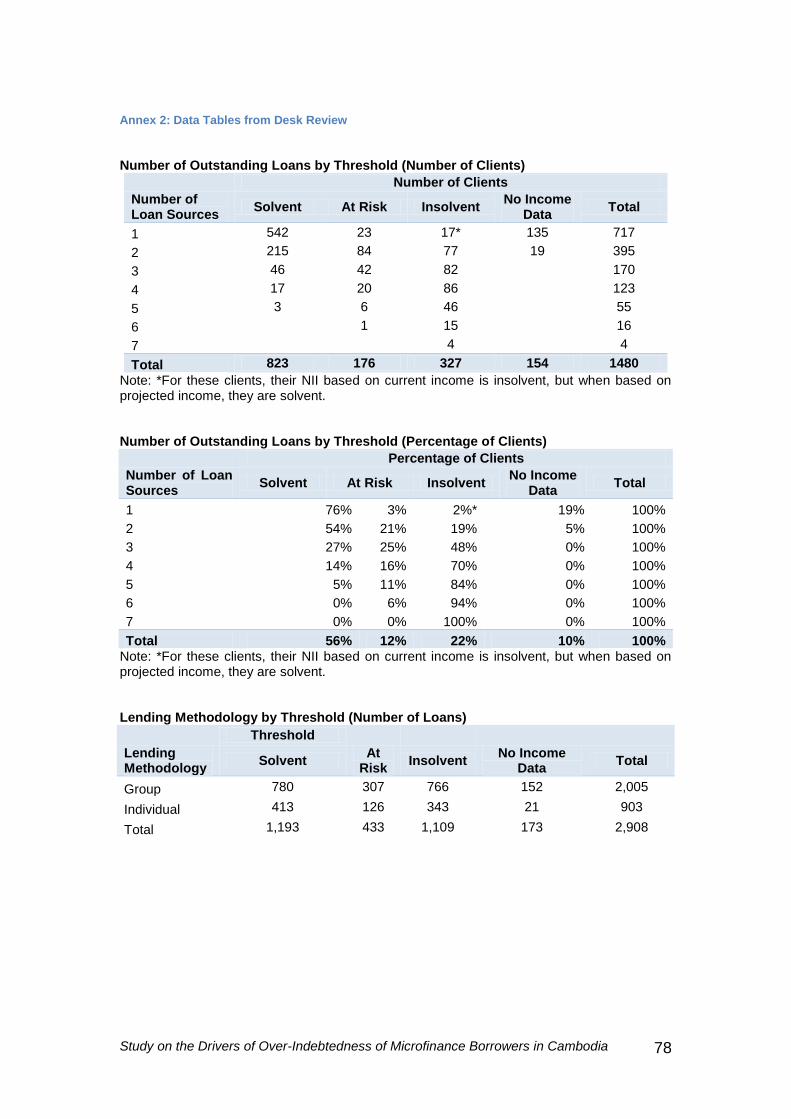
Study on the Drivers of Over-Indebtedness of Microfinance Borrowers in Cambodia
78
Annex 2: Data Tables from Desk Review
Number of Outstanding Loans by Threshold (Number of Clients)
Number of Loan Sources
Number of Clients
Solvent At Risk Insolvent No Income
Data Total
1 542 23 17* 135 717
2 215 84 77 19 395
3 46 42 82
170
4 17 20 86
123
5 3 6 46
55
6 1 15
16
7 4
4
Total 823 176 327 154 1480
Note: *For these clients, their NII based on current income is insolvent, but when based on projected income, they are solvent. Number of Outstanding Loans by Threshold (Percentage of Clients)
Number of Loan Sources
Percentage of Clients
Solvent At Risk Insolvent No Income
Data Total
1 76% 3% 2%* 19% 100%
2 54% 21% 19% 5% 100%
3 27% 25% 48% 0% 100%
4 14% 16% 70% 0% 100%
5 5% 11% 84% 0% 100%
6 0% 6% 94% 0% 100%
7 0% 0% 100% 0% 100%
Total 56% 12% 22% 10% 100% Note: *For these clients, their NII based on current income is insolvent, but when based on projected income, they are solvent. Lending Methodology by Threshold (Number of Loans)
Threshold
Lending Methodology
Solvent At
Risk Insolvent
No Income Data
Total
Group 780 307 766 152 2,005
Individual 413 126 343 21 903
Total 1,193 433 1,109 173 2,908
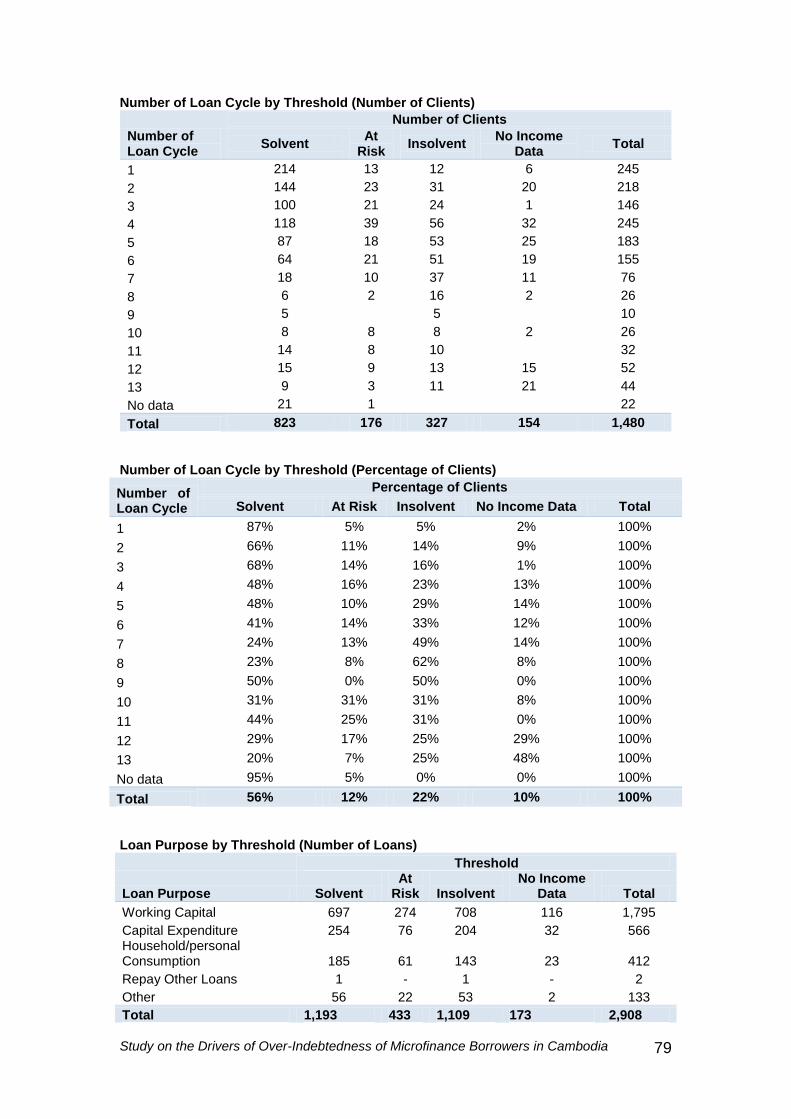
Study on the Drivers of Over-Indebtedness of Microfinance Borrowers in Cambodia
79
Number of Loan Cycle by Threshold (Number of Clients)
Number of Loan Cycle
Number of Clients
Solvent At
Risk Insolvent
No Income Data
Total
1 214 13 12 6 245
2 144 23 31 20 218
3 100 21 24 1 146
4 118 39 56 32 245
5 87 18 53 25 183
6 64 21 51 19 155
7 18 10 37 11 76
8 6 2 16 2 26
9 5
5
10
10 8 8 8 2 26
11 14 8 10
32
12 15 9 13 15 52
13 9 3 11 21 44
No data 21 1
22
Total 823 176 327 154 1,480
Number of Loan Cycle by Threshold (Percentage of Clients)
Number of Loan Cycle
Percentage of Clients
Solvent At Risk Insolvent No Income Data Total
1 87% 5% 5% 2% 100%
2 66% 11% 14% 9% 100%
3 68% 14% 16% 1% 100%
4 48% 16% 23% 13% 100%
5 48% 10% 29% 14% 100%
6 41% 14% 33% 12% 100%
7 24% 13% 49% 14% 100%
8 23% 8% 62% 8% 100%
9 50% 0% 50% 0% 100%
10 31% 31% 31% 8% 100%
11 44% 25% 31% 0% 100%
12 29% 17% 25% 29% 100%
13 20% 7% 25% 48% 100%
No data 95% 5% 0% 0% 100%
Total 56% 12% 22% 10% 100%
Loan Purpose by Threshold (Number of Loans)
Threshold
Loan Purpose Solvent At
Risk Insolvent No Income
Data Total
Working Capital 697 274 708 116 1,795
Capital Expenditure 254 76 204 32 566 Household/personal Consumption 185 61 143 23 412
Repay Other Loans 1 - 1 - 2
Other 56 22 53 2 133
Total 1,193 433 1,109 173 2,908
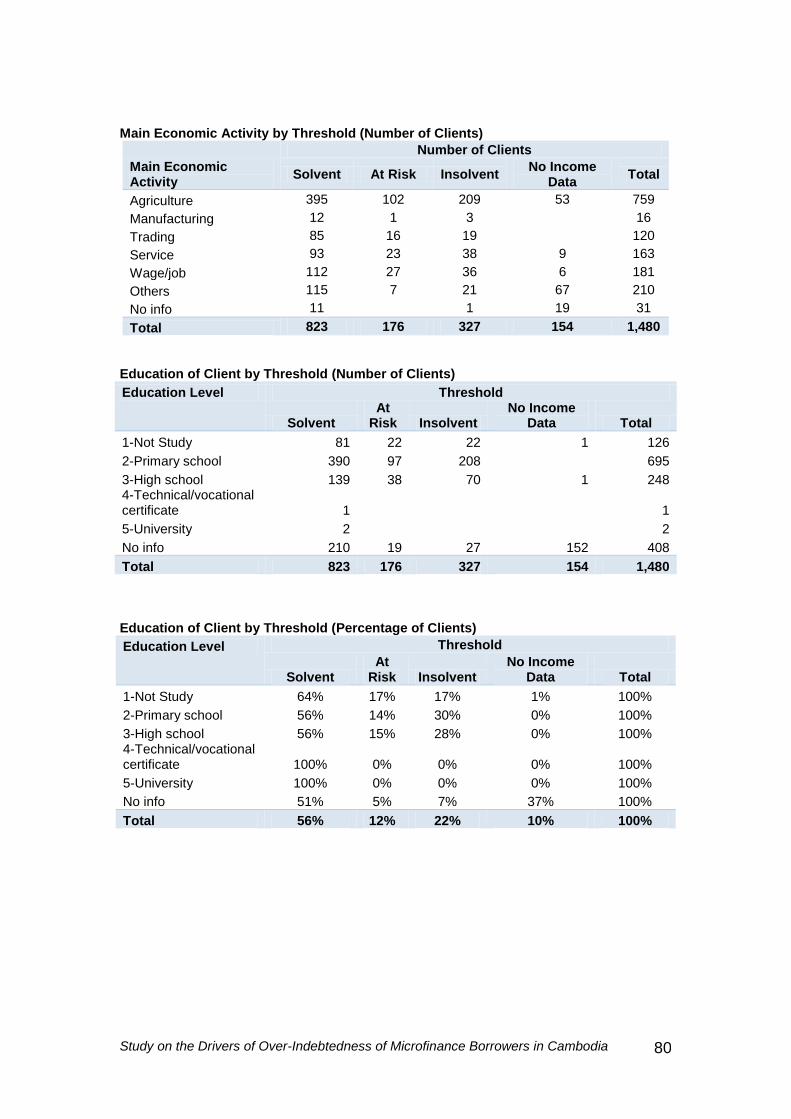
Study on the Drivers of Over-Indebtedness of Microfinance Borrowers in Cambodia
80
Main Economic Activity by Threshold (Number of Clients)
Main Economic Activity
Number of Clients
Solvent At Risk Insolvent No Income
Data Total
Agriculture 395 102 209 53 759
Manufacturing 12 1 3
16
Trading 85 16 19
120
Service 93 23 38 9 163
Wage/job 112 27 36 6 181
Others 115 7 21 67 210
No info 11
1 19 31
Total 823 176 327 154 1,480
Education of Client by Threshold (Number of Clients)
Education Level Threshold
Solvent
At Risk Insolvent
No Income Data Total
1-Not Study 81 22 22 1 126
2-Primary school 390 97 208
695
3-High school 139 38 70 1 248 4-Technical/vocational certificate 1
1
5-University 2
2
No info 210 19 27 152 408
Total 823 176 327 154 1,480 Education of Client by Threshold (Percentage of Clients)
Education Level Threshold
Solvent
At Risk Insolvent
No Income Data Total
1-Not Study 64% 17% 17% 1% 100%
2-Primary school 56% 14% 30% 0% 100%
3-High school 56% 15% 28% 0% 100% 4-Technical/vocational certificate 100% 0% 0% 0% 100%
5-University 100% 0% 0% 0% 100%
No info 51% 5% 7% 37% 100%
Total 56% 12% 22% 10% 100%
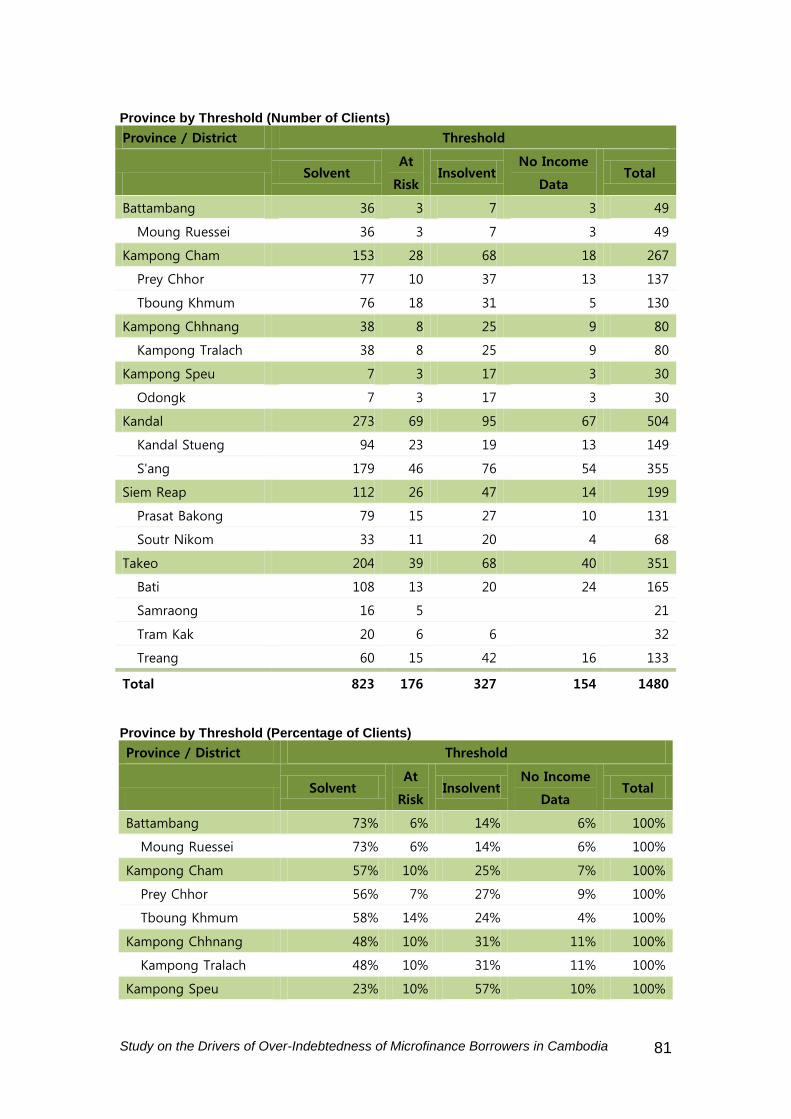
Study on the Drivers of Over-Indebtedness of Microfinance Borrowers in Cambodia
81
Province by Threshold (Number of Clients)
Province / District Threshold
Solvent
At
Risk Insolvent
No Income
Data Total
Battambang 36 3 7 3 49
Moung Ruessei 36 3 7 3 49
Kampong Cham 153 28 68 18 267
Prey Chhor 77 10 37 13 137
Tboung Khmum 76 18 31 5 130
Kampong Chhnang 38 8 25 9 80
Kampong Tralach 38 8 25 9 80
Kampong Speu 7 3 17 3 30
Odongk 7 3 17 3 30
Kandal 273 69 95 67 504
Kandal Stueng 94 23 19 13 149
S'ang 179 46 76 54 355
Siem Reap 112 26 47 14 199
Prasat Bakong 79 15 27 10 131
Soutr Nikom 33 11 20 4 68
Takeo 204 39 68 40 351
Bati 108 13 20 24 165
Samraong 16 5
21
Tram Kak 20 6 6
32
Treang 60 15 42 16 133
Total 823 176 327 154 1480
Province by Threshold (Percentage of Clients)
Province / District Threshold
Solvent
At
Risk Insolvent
No Income
Data Total
Battambang 73% 6% 14% 6% 100%
Moung Ruessei 73% 6% 14% 6% 100%
Kampong Cham 57% 10% 25% 7% 100%
Prey Chhor 56% 7% 27% 9% 100%
Tboung Khmum 58% 14% 24% 4% 100%
Kampong Chhnang 48% 10% 31% 11% 100%
Kampong Tralach 48% 10% 31% 11% 100%
Kampong Speu 23% 10% 57% 10% 100%
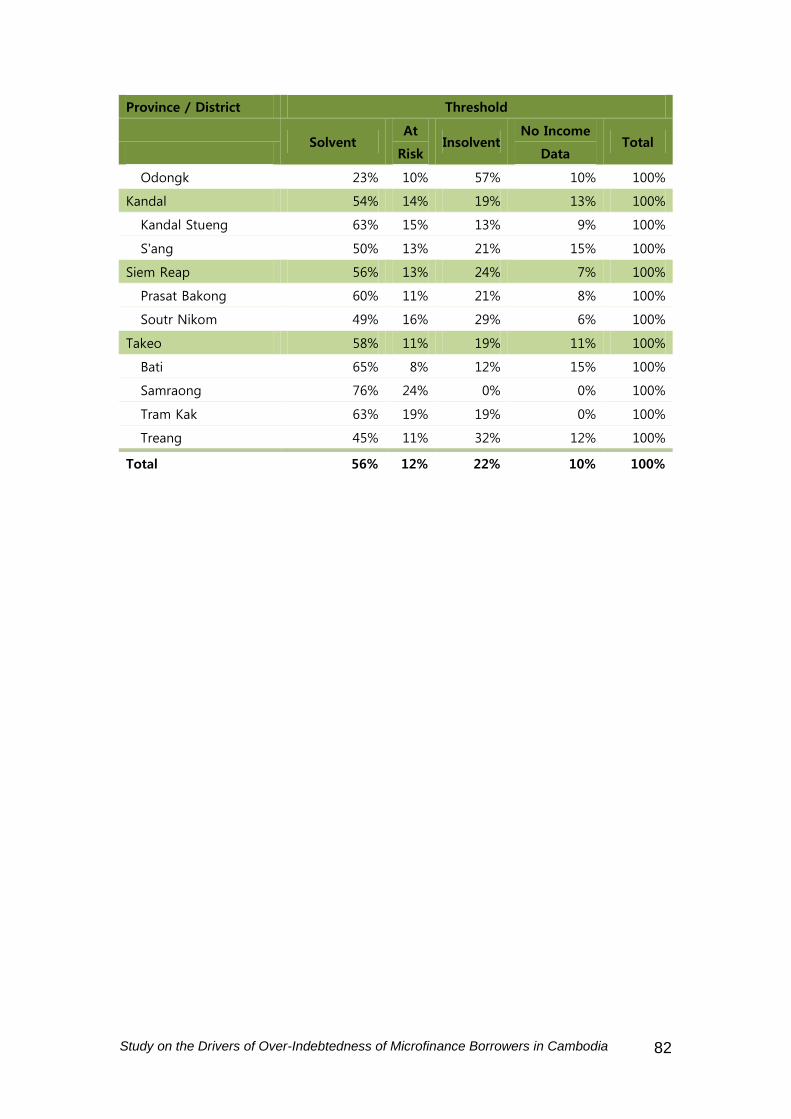
Study on the Drivers of Over-Indebtedness of Microfinance Borrowers in Cambodia
82
Province / District Threshold
Solvent
At
Risk Insolvent
No Income
Data Total
Odongk 23% 10% 57% 10% 100%
Kandal 54% 14% 19% 13% 100%
Kandal Stueng 63% 15% 13% 9% 100%
S'ang 50% 13% 21% 15% 100%
Siem Reap 56% 13% 24% 7% 100%
Prasat Bakong 60% 11% 21% 8% 100%
Soutr Nikom 49% 16% 29% 6% 100%
Takeo 58% 11% 19% 11% 100%
Bati 65% 8% 12% 15% 100%
Samraong 76% 24% 0% 0% 100%
Tram Kak 63% 19% 19% 0% 100%
Treang 45% 11% 32% 12% 100%
Total 56% 12% 22% 10% 100%
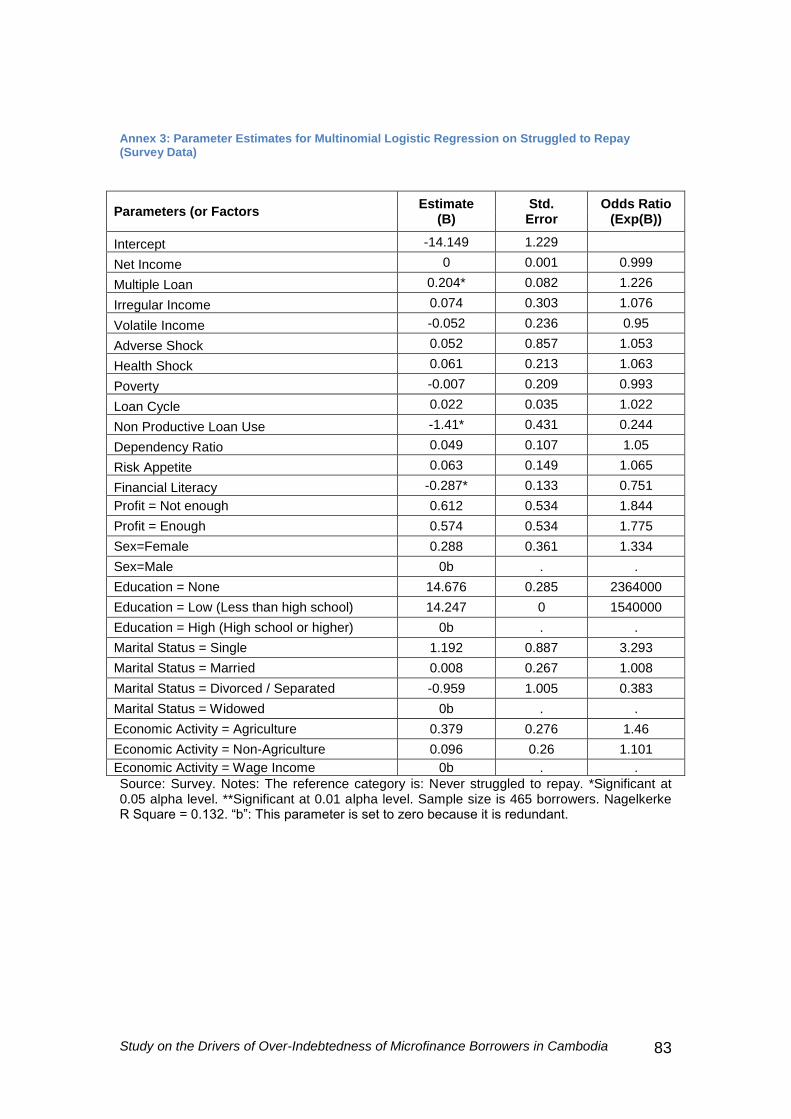
Study on the Drivers of Over-Indebtedness of Microfinance Borrowers in Cambodia
83
Annex 3: Parameter Estimates for Multinomial Logistic Regression on Struggled to Repay (Survey Data)
Parameters (or Factors Estimate
(B) Std. Error
Odds Ratio (Exp(B))
Intercept -14.149 1.229
Net Income 0 0.001 0.999
Multiple Loan 0.204* 0.082 1.226
Irregular Income 0.074 0.303 1.076
Volatile Income -0.052 0.236 0.95
Adverse Shock 0.052 0.857 1.053
Health Shock 0.061 0.213 1.063
Poverty -0.007 0.209 0.993
Loan Cycle 0.022 0.035 1.022
Non Productive Loan Use -1.41* 0.431 0.244
Dependency Ratio 0.049 0.107 1.05
Risk Appetite 0.063 0.149 1.065
Financial Literacy -0.287* 0.133 0.751
Profit = Not enough 0.612 0.534 1.844
Profit = Enough 0.574 0.534 1.775
Sex=Female 0.288 0.361 1.334
Sex=Male 0b . .
Education = None 14.676 0.285 2364000
Education = Low (Less than high school) 14.247 0 1540000
Education = High (High school or higher) 0b . .
Marital Status = Single 1.192 0.887 3.293
Marital Status = Married 0.008 0.267 1.008
Marital Status = Divorced / Separated -0.959 1.005 0.383
Marital Status = Widowed 0b . .
Economic Activity = Agriculture 0.379 0.276 1.46
Economic Activity = Non-Agriculture 0.096 0.26 1.101
Economic Activity = Wage Income 0b . .
Source: Survey. Notes: The reference category is: Never struggled to repay. *Significant at 0.05 alpha level. **Significant at 0.01 alpha level. Sample size is 465 borrowers. Nagelkerke R Square = 0.132. “b”: This parameter is set to zero because it is redundant.