study on potential economic impact of tppa on the ... · study on potential economic impact of tppa...
TRANSCRIPT
• Ministry of International Trade and Industry (MITI)
• Unit Peneraju Agenda Bumiputera (TERAJU)
December 2015
www.pwc.com
Study on Potential Economic Impact of TPPA on the Malaysian Economy and Selected Key Economic Sectors
Final Report

PwC
December 2015
Important notice
This Report has been prepared in accordance with the contract between Unit Peneraju Agenda Bumiputera
(“TERAJU”) and PwC Advisory Services Sdn Bhd that took effect from 12th March 2015, and the
contract between the Ministry of International Trade and Industry (“MITI”) and PwC Advisory
Services Sdn Bhd that took effect from 10th April 2015. This Report is subject to the terms and conditions
included in the contracts as well as the limitations contained in this Report. It is intended solely for the addressee
clients’ internal use and benefit and is not intended to nor may it be relied upon by any other party ("Third Party").
Any Third Party who has not signed and returned to PwC Advisory Services Sdn Bhd (“PwC”) a letter holding PwC
harmless, is not authorised to have access to this report.
Should any Third Party obtain access to and read this report contrary to the above provision, by reading this report
such Third Party accepts and agrees to the following terms:
1. That the work performed by PwC was performed in accordance with instructions provided by its addressee
clients and was performed exclusively for its addressee clients’ sole benefit and use.
2. That this report was prepared at the direction of our addressee clients and may not include all procedures
deemed necessary for the purposes of such Third Party.
3. That PwC, its directors, employees and agents neither owe nor accept any duty or responsibility to such Third
Party, whether in contract or in tort (including without limitation, negligence and breach of statutory duty), and
shall not be liable in respect of any loss, damage or expense of whatsoever nature which is caused by any use such
Third Party may choose to make of this report, or which is otherwise consequent upon the gaining of access to
the report by such Third Party. Further, such Third Party agrees that this report is not to be referred to or
quoted, in whole or in part, in any prospectus, registration statement, offering circular, public filing, loan, other
agreement or document and not to distribute the report without PwC’s prior written consent.
Economic Impact of the Trans-Pacific Partnership Agreement •

PwC
December 2015
Contents
Economic Impact of the Trans-Pacific Partnership Agreement •
1 About the Study 1
2 Executive Summary 7
2.1 Key findings 9
2.2 Overall economy 10
2.3 Sectoral analysis 17
2.4 Thematic Issues 42
2.5 Conclusion 51
3 Background on TPPA 53
4 Potential Impact on Malaysia Based on CGE Modelling 59
5 Sectoral Analysis 71
5.1 Electrical and electronics 75
5.2 Oil and gas 93
5.3 Palm oil 113
5.4 Construction 129
5.5 Textile 143
5.6 Retail 173
5.7 Automotive 191
5.8 Pharmaceutical 205
5.9 Wood and wood products 215
5.10 Plastic and plastic products 227
PwC
December 2015
Contents
Economic Impact of the Trans-Pacific Partnership Agreement •
6 Thematic Issues 241
6.1 Bumiputera & Small and Medium-Sized Enterprises 243
6.2 State-Owned Enterprise (SOE) 253
6.3 Investor-State Dispute Settlement (ISDS) 259
6.4 Labour 265
7 Conclusion 271
Appendix 277
1 About the Model 279
2 Detailed CGE Results 293
3 Sectoral Approach and Methodology 299
4 References/Bibliography 303
PwC
December 2015
Glossary of terms and abbreviations
Term Definition
1998 Declaration ILO Declaration of Fundamental Principles and
Rights at Work 1998
1MDB 1Malaysia Development Berhad
ADBI Asian Development Bank Institute
ATIGA ASEAN Trade in Goods Agreement
AVE Ad-valorem equivalent
BAA Buy American Act
BIT Bilateral Investment Treaties
BJC Builders’ joinery and carpentry
BPU Bahagian Pembangunan Usahawan
BS British Standards
BVDP Bumiputera Vendor Development Programme
CAGR Compound average growth rate
CBU Complete built up
Economic Impact of the Trans-Pacific Partnership Agreement •
Term Definition
CDE Constant Difference of Elasticities
CGE Computable General Equilibrium
CIDB Construction Industry Development Board
CKD Complete knock down
CPKO Crude palm kernel oil
CPO Crude palm oil
CREATE Centre For Responsible Enterprise and Trade
DCA Drug Control Authority
DOSM Department of Statistic Malaysia
DVD Digital versatile discs
E&E Electrical & electronics
EB Exabyte
EC Energy Commission
PwC
December 2015
Glossary of terms and abbreviations (cont’d)
Term Definition
EEV Energy Efficient Vehicle
EICC Electronics Industry Citizenship Coalition
EIU Economist Intelligence Unit
EKUINAS Ekuiti Nasional Berhad
EN Harmonised European Standards
ENT Economic Needs Test
EPU Economic Planning Unit
ETOU Enhanced time-of-use
ETP Economic Transformation Programme
EU European Union
EV Equivalent variation
FAR Federal Acquisition Regulation
FDI Foreign direct investment
Economic Impact of the Trans-Pacific Partnership Agreement •
Term Definition
FELCRA Federal Land Consolidation and Rehabilitation
Authority
FELDA Federal Land Development Authority
FFB Fresh Fruit Bunches
FGV Felda Global Ventures
FTA Free trade agreement
GATS General Agreement on Trade in Services
GB Gigabyte
GDP Gross domestic product
GLC Government-linked company
GMP Good Manufacturing Practice
GNI Gross national income
Government Government of Malaysia
PwC
December 2015
Glossary of terms and abbreviations (cont’d)
Term Definition
GPA Government Procurement Agreement
HIP High Impact Programmes
ICSID International Centre for Settlement of Investment
Disputes
ICT Information and communication technologies
IHPA International Hardwood Products Association
Standards
ILO International Labour Organisation
IMF International Monetary Fund
ISDS Investor-State Dispute Settlement
ISIS Malaysia Institute of Strategic and International Studies
Malaysia
IT Information technology
ITA Investment Tax Allowance
ITC International Trade Commission
ITUC International Trade Union Confederation
Economic Impact of the Trans-Pacific Partnership Agreement •
Term Definition
JAS Japan Agricultural Standards
JETRO Japan External Trade Organisation
JIT Just-in-time
Khazanah Khazanah Nasional Berhad
LHS Left hand side
LT Laminated timber
LVL Laminated veneer lumber
MAA Malaysian Automotive Association
MAI Malaysian Automotive Institute
MARA Majlis Amanah Rakyat
MDF Medium density fibreboard
MDTCC Ministry of Domestic Trade, Co-operatives and
Consumerism
PwC
December 2015
Glossary of terms and abbreviations (cont’d)
Term Definition
MEF Malaysian Employer's Federation
MFN Most Favoured Nation
MIDA Malaysia Investment Development Authority
MIFF Malaysian International Furniture Fair
MITI Ministry of International Trade and Industry
ML Manufacturing License
MOF Inc. Ministry of Finance Incorporated
MOH Ministry of Health
MOHR Ministry of Human Resource
MPC Malaysia Productivity Corporation
MPIC Ministry of Plantation Industries and Commodities
MPMA Malaysian Plastic Manufacturing Association
Economic Impact of the Trans-Pacific Partnership Agreement •
Term Definition
MPOB Malaysian Palm Oil Board
MRT Mass Rapid Transit
MTMA Malaysian Textile Manufacturers Association
MWIA Malaysian Wood Industries Association
MyIPO Intellectual Property Corporation of Malaysia
NAP National Automotive Policy
NCA Non-commercial assistance
NEDL National Essential Drugs List
NEM New Economic Model
NGO Non-governmental organisation
NKEA National Key Economic Area
NTB Non-tariff barrier
NTM Non-tariff measure
PwC
December 2015
Glossary of terms and abbreviations (cont’d)
Term Definition
O&G Oil and gas
OECD Organisation for Economic Co-operation and
Development
OEM Original Equipment Manufacturer
PCG Putrajaya Committee on GLC High Performance
PCT Patent Cooperation Treaty
PDA 1974 Petroleum Development Act 1974
PETRONAS Petroliam Nasional Berhad
PIC/S Pharmaceutical Inspection Convention and
Pharmaceutical Inspection Co-operation Scheme
PLC Public listed company
PNB Permodalan Nasional Berhad
PORAM Palm Oil Refiners Association Malaysia
PPO Processed Palm Oil
PPP Public-Private Partnership
Economic Impact of the Trans-Pacific Partnership Agreement •
Term Definition
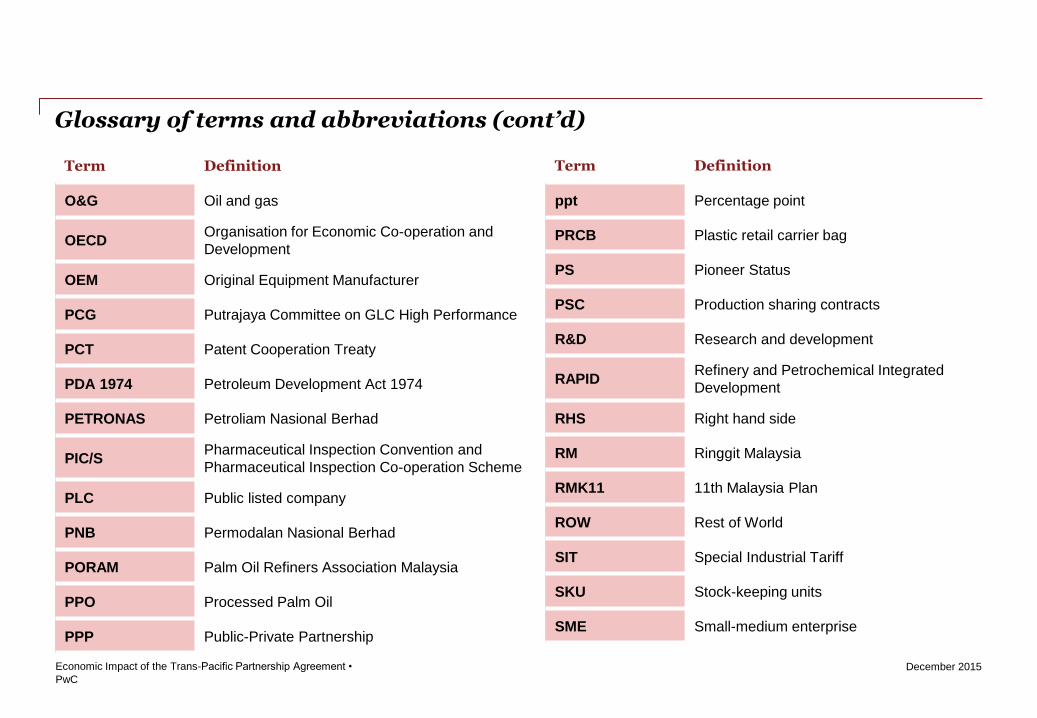
ppt Percentage point
PRCB Plastic retail carrier bag
PS Pioneer Status
PSC Production sharing contracts
R&D Research and development
RAPID Refinery and Petrochemical Integrated
Development
RHS Right hand side
RM Ringgit Malaysia
RMK11 11th Malaysia Plan
ROW Rest of World
SIT Special Industrial Tariff
SKU Stock-keeping units
SME Small-medium enterprise
PwC
December 2015
Glossary of terms and abbreviations (cont’d)
Term Definition
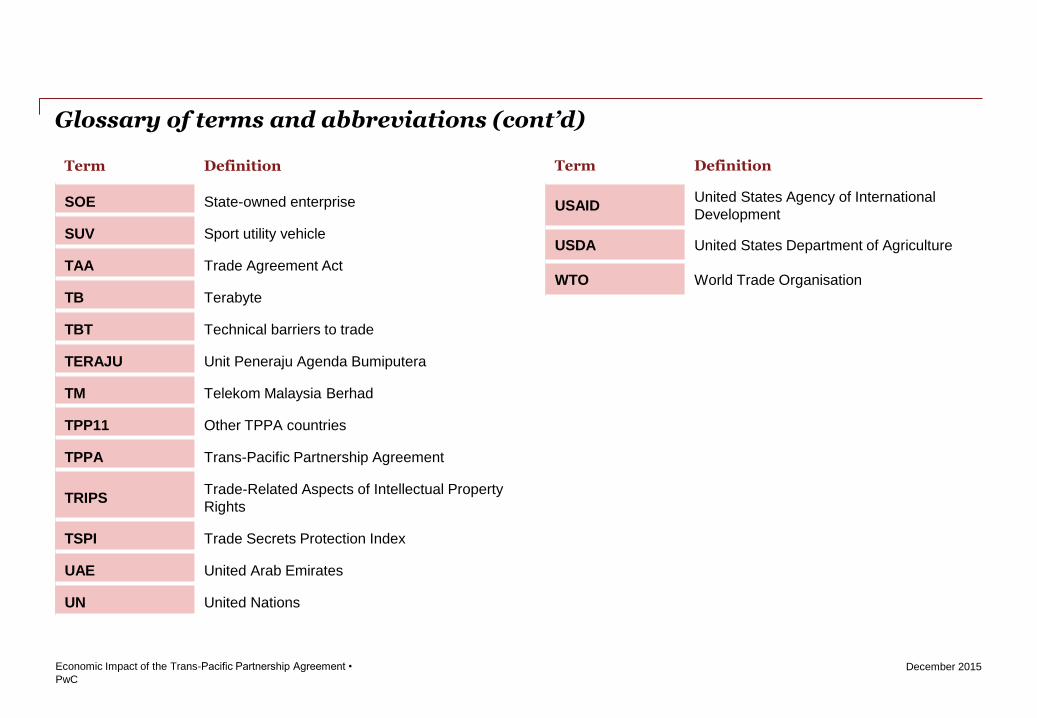
SOE State-owned enterprise
SUV Sport utility vehicle
TAA Trade Agreement Act
TB Terabyte
TBT Technical barriers to trade
TERAJU Unit Peneraju Agenda Bumiputera
TM Telekom Malaysia Berhad
TPP11 Other TPPA countries
TPPA Trans-Pacific Partnership Agreement
TRIPS Trade-Related Aspects of Intellectual Property
Rights
TSPI Trade Secrets Protection Index
UAE United Arab Emirates
UN United Nations
Economic Impact of the Trans-Pacific Partnership Agreement •
Term Definition
USAID United States Agency of International
Development
USDA United States Department of Agriculture
WTO World Trade Organisation
PwC
December 2015
Section 1 About the study
1
Economic Impact of the Trans-Pacific Partnership Agreement •
1

PwC
December 2015
2
Economic Impact of the Trans-Pacific Partnership Agreement •
Section 1 – About the study
PwC
December 2015
TPPA is a comprehensive free trade agreement that provides market access to ~40% of the global economy and harmonises rules for emerging trade issues
3
Economic Impact of the Trans-Pacific Partnership Agreement •
Who is involved in the TPPA?
The Trans-Pacific Partnership Agreement (“TPPA”) presently involves 12 prospective member countries in the Pacific Rim. They are Australia, Brunei, Canada, Chile, Japan, Malaysia, Mexico, New Zealand, Peru, Singapore, United States (“US”), and Vietnam. The 12 countries collectively accounted for about 40% of the global economy, with a cumulative gross domestic product (“GDP”) of almost USD30 trillion, and a population of more than 800 million, as of 2014. The TPPA will provide Malaysia with market access to 4 trading partners that Malaysia presently has no free trade agreements (“FTA”) with; Canada, Mexico, Peru and US. These 4 countries accounted for about 74% of the market size of the TPPA economic bloc, with a GDP of about USD21 trillion as of 2014.
Membership in the TPPA may be further expanded beyond the 12 prospective member countries in future. For example, Indonesia, Korea and Thailand have expressed interest to participate in the TPPA.
What does the TPPA cover?
The TPPA is a comprehensive FTA, comprising 30 legal chapters that cover trade and trade-related issues. Unlike traditional FTAs, the TPPA goes beyond providing market access to goods, services and investment, to also harmonising rules and disciplines for new and emerging trade and cross-sectoral issues, such as government procurement, competition with state-owned enterprises (“SOE”), intellectual property rights, the digital economy, labour and environment.
Why did Malaysia participate in the TPPA negotiations?
The TPPA is a prospective initiative by the Government of Malaysia (“Government”) to deepen Malaysia’s integration in the regional and global supply chain, by:
• Providing Malaysian companies with more open markets and trade facilitative measures, such as transparency and predictability, which will enable these companies to compete more efficiently and effectively at the global level; and
• Building investor confidence and drawing foreign investment into Malaysia, particularly from non-TPPA countries that are exploring Malaysia as a base to enjoy the benefits of the TPPA.
In the long run, greater competition and economies of scale arising from the TPPA are envisaged to compel firms to raise production efficiency and lower the cost of goods and services to consumers.
What is the status of the TPPA negotiations?
The TPPA negotiations began in March 2010, with Malaysia joining the negotiations in October 2010. The 12 prospective member countries reached agreement on the TPPA on 5 October 2015 in Atlanta, US, marking the conclusion of the TPPA negotiations. The full text, annexes and side letters of the TPPA were made publicly available on 5 November 2015, at: http://fta.miti.gov.my/index.php/pages/view/tppa.
Source: Ministry of International Trade and Industry (“MITI”), United States Trade Representative (“USTR”)
Section 1 – About the study
PwC
December 2015
This study analyses the potential economic costs and benefits of Malaysia’s participation in the TPPA
4
Economic Impact of the Trans-Pacific Partnership Agreement •
Purpose of the study
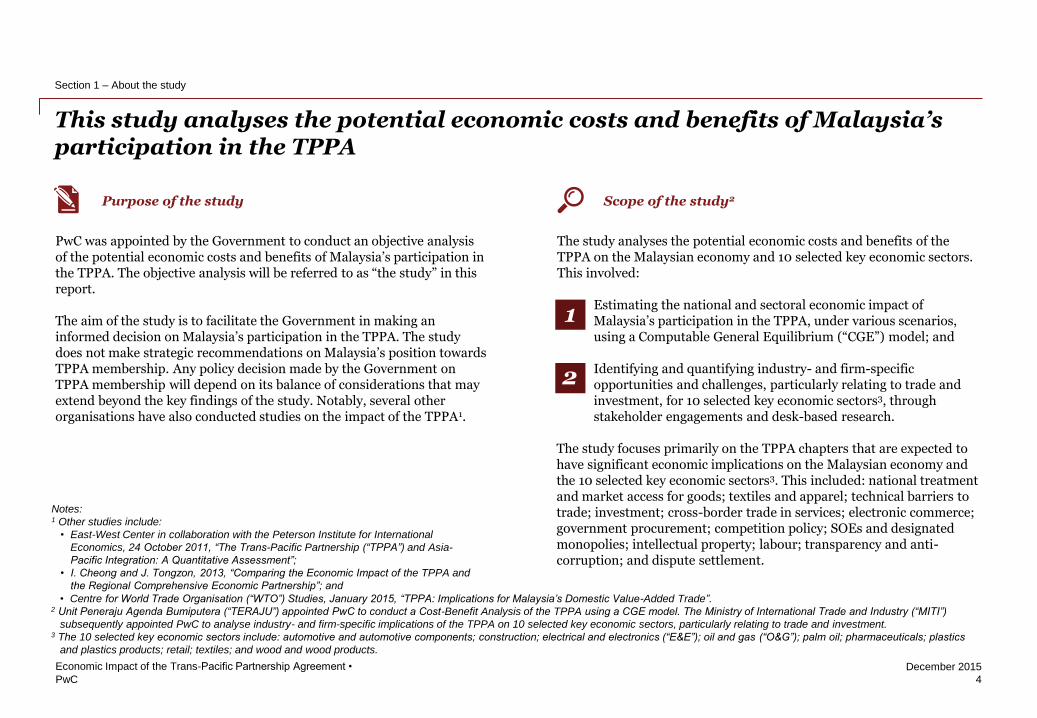
PwC was appointed by the Government to conduct an objective analysis of the potential economic costs and benefits of Malaysia’s participation in the TPPA. The objective analysis will be referred to as “the study” in this report.
The aim of the study is to facilitate the Government in making an informed decision on Malaysia’s participation in the TPPA. The study does not make strategic recommendations on Malaysia’s position towards TPPA membership. Any policy decision made by the Government on TPPA membership will depend on its balance of considerations that may extend beyond the key findings of the study. Notably, several other organisations have also conducted studies on the impact of the TPPA1.
Scope of the study2
The study analyses the potential economic costs and benefits of the TPPA on the Malaysian economy and 10 selected key economic sectors. This involved:
Estimating the national and sectoral economic impact of Malaysia’s participation in the TPPA, under various scenarios, using a Computable General Equilibrium (“CGE”) model; and
Identifying and quantifying industry- and firm-specific opportunities and challenges, particularly relating to trade and investment, for 10 selected key economic sectors3, through stakeholder engagements and desk-based research.
The study focuses primarily on the TPPA chapters that are expected to have significant economic implications on the Malaysian economy and the 10 selected key economic sectors3. This included: national treatment and market access for goods; textiles and apparel; technical barriers to trade; investment; cross-border trade in services; electronic commerce; government procurement; competition policy; SOEs and designated monopolies; intellectual property; labour; transparency and anti-corruption; and dispute settlement.
1
2
Notes:
1 Other studies include:
• East-West Center in collaboration with the Peterson Institute for International
Economics, 24 October 2011, “The Trans-Pacific Partnership (“TPPA”) and Asia-
Pacific Integration: A Quantitative Assessment”;
• I. Cheong and J. Tongzon, 2013, “Comparing the Economic Impact of the TPPA and
the Regional Comprehensive Economic Partnership”; and
• Centre for World Trade Organisation (“WTO”) Studies, January 2015, “TPPA: Implications for Malaysia’s Domestic Value-Added Trade”. 2 Unit Peneraju Agenda Bumiputera (“TERAJU”) appointed PwC to conduct a Cost-Benefit Analysis of the TPPA using a CGE model. The Ministry of International Trade and Industry (“MITI”)
subsequently appointed PwC to analyse industry- and firm-specific implications of the TPPA on 10 selected key economic sectors, particularly relating to trade and investment. 3 The 10 selected key economic sectors include: automotive and automotive components; construction; electrical and electronics (“E&E”); oil and gas (“O&G”); palm oil; pharmaceuticals; plastics
and plastics products; retail; textiles; and wood and wood products.
Section 1 – About the study
PwC
December 2015
The economic model simulates the Malaysian economy under several TPPA scenarios, conditional on other economic developments remaining unchanged
5
Economic Impact of the Trans-Pacific Partnership Agreement •
Limitations of the study
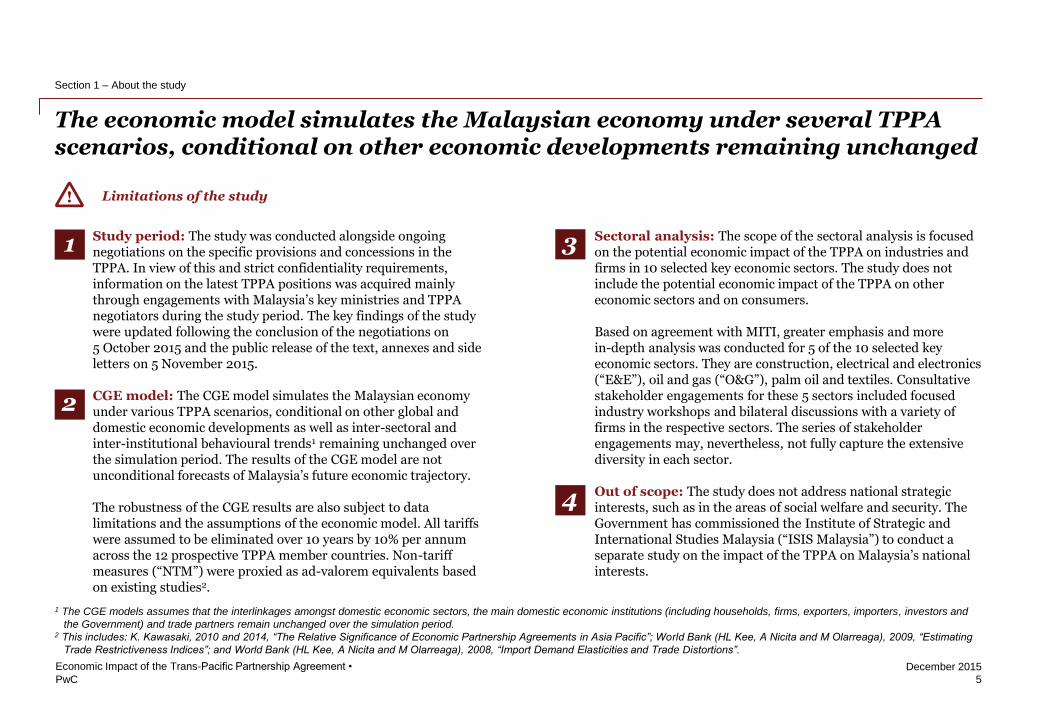
Study period: The study was conducted alongside ongoing negotiations on the specific provisions and concessions in the TPPA. In view of this and strict confidentiality requirements, information on the latest TPPA positions was acquired mainly through engagements with Malaysia’s key ministries and TPPA negotiators during the study period. The key findings of the study were updated following the conclusion of the negotiations on 5 October 2015 and the public release of the text, annexes and side letters on 5 November 2015.
CGE model: The CGE model simulates the Malaysian economy under various TPPA scenarios, conditional on other global and domestic economic developments as well as inter-sectoral and inter-institutional behavioural trends1 remaining unchanged over the simulation period. The results of the CGE model are not unconditional forecasts of Malaysia’s future economic trajectory.
The robustness of the CGE results are also subject to data limitations and the assumptions of the economic model. All tariffs were assumed to be eliminated over 10 years by 10% per annum across the 12 prospective TPPA member countries. Non-tariff measures (“NTM”) were proxied as ad-valorem equivalents based on existing studies2.
Sectoral analysis: The scope of the sectoral analysis is focused on the potential economic impact of the TPPA on industries and firms in 10 selected key economic sectors. The study does not include the potential economic impact of the TPPA on other economic sectors and on consumers.
Based on agreement with MITI, greater emphasis and more in-depth analysis was conducted for 5 of the 10 selected key economic sectors. They are construction, electrical and electronics (“E&E”), oil and gas (“O&G”), palm oil and textiles. Consultative stakeholder engagements for these 5 sectors included focused industry workshops and bilateral discussions with a variety of firms in the respective sectors. The series of stakeholder engagements may, nevertheless, not fully capture the extensive diversity in each sector.
Out of scope: The study does not address national strategic interests, such as in the areas of social welfare and security. The Government has commissioned the Institute of Strategic and International Studies Malaysia (“ISIS Malaysia”) to conduct a separate study on the impact of the TPPA on Malaysia’s national interests.
1
2
3
4
1 The CGE models assumes that the interlinkages amongst domestic economic sectors, the main domestic economic institutions (including households, firms, exporters, importers, investors and
the Government) and trade partners remain unchanged over the simulation period. 2 This includes: K. Kawasaki, 2010 and 2014, “The Relative Significance of Economic Partnership Agreements in Asia Pacific”; World Bank (HL Kee, A Nicita and M Olarreaga), 2009, “Estimating
Trade Restrictiveness Indices”; and World Bank (HL Kee, A Nicita and M Olarreaga), 2008, “Import Demand Elasticities and Trade Distortions”.
Section 1 – About the study

PwC
December 2015
Section 2 Executive Summary
7
Economic Impact of the Trans-Pacific Partnership Agreement •

PwC
December 2015
TPPA presents net economic benefits to Malaysia, but there will be adjustment costs to firms from increased competition and cross-sectoral TPPA obligations
9
Economic Impact of the Trans-Pacific Partnership Agreement •
Section 2.1 – Key findings
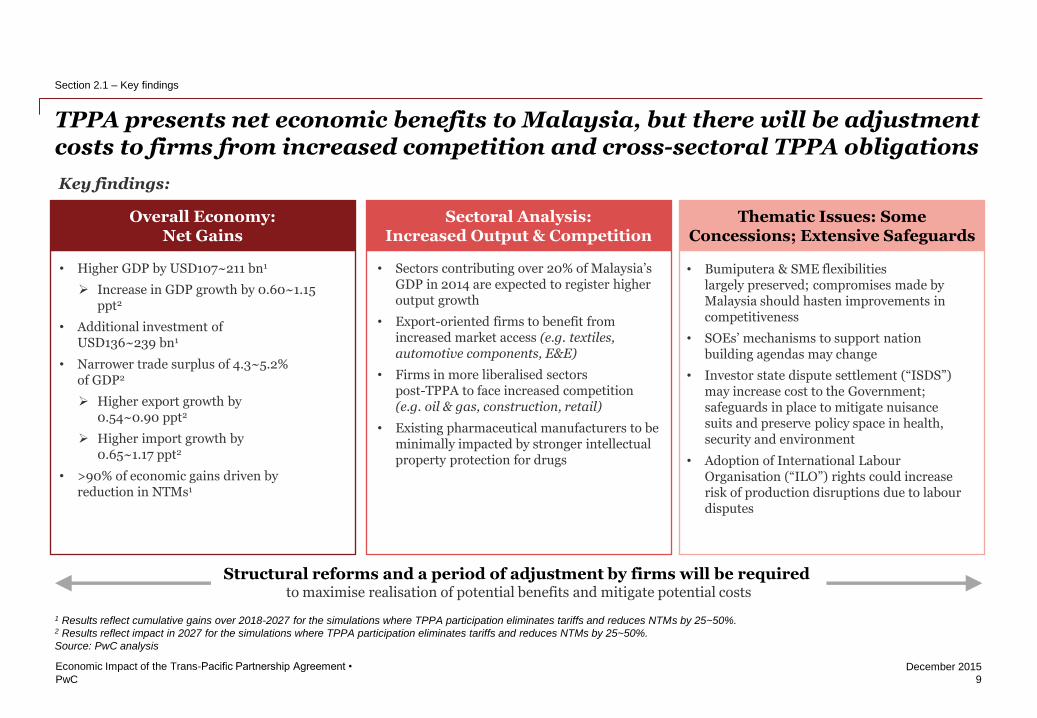
Overall Economy: Net Gains
• Higher GDP by USD107~211 bn1
Increase in GDP growth by 0.60~1.15 ppt2
• Additional investment of USD136~239 bn1
• Narrower trade surplus of 4.3~5.2% of GDP2
Higher export growth by 0.54~0.90 ppt2
Higher import growth by 0.65~1.17 ppt2
• >90% of economic gains driven by reduction in NTMs1
Key findings:
Sectoral Analysis: Increased Output & Competition
• Sectors contributing over 20% of Malaysia’s GDP in 2014 are expected to register higher output growth
• Export-oriented firms to benefit from increased market access (e.g. textiles, automotive components, E&E)
• Firms in more liberalised sectors post-TPPA to face increased competition (e.g. oil & gas, construction, retail)
• Existing pharmaceutical manufacturers to be minimally impacted by stronger intellectual property protection for drugs
Thematic Issues: Some Concessions; Extensive Safeguards
• Bumiputera & SME flexibilities largely preserved; compromises made by Malaysia should hasten improvements in competitiveness
• SOEs’ mechanisms to support nation building agendas may change
• Investor state dispute settlement (“ISDS”) may increase cost to the Government; safeguards in place to mitigate nuisance suits and preserve policy space in health, security and environment
• Adoption of International Labour Organisation (“ILO”) rights could increase risk of production disruptions due to labour disputes
Structural reforms and a period of adjustment by firms will be required to maximise realisation of potential benefits and mitigate potential costs
1 Results reflect cumulative gains over 2018-2027 for the simulations where TPPA participation eliminates tariffs and reduces NTMs by 25~50%. 2 Results reflect impact in 2027 for the simulations where TPPA participation eliminates tariffs and reduces NTMs by 25~50%.
Source: PwC analysis
PwC
December 2015
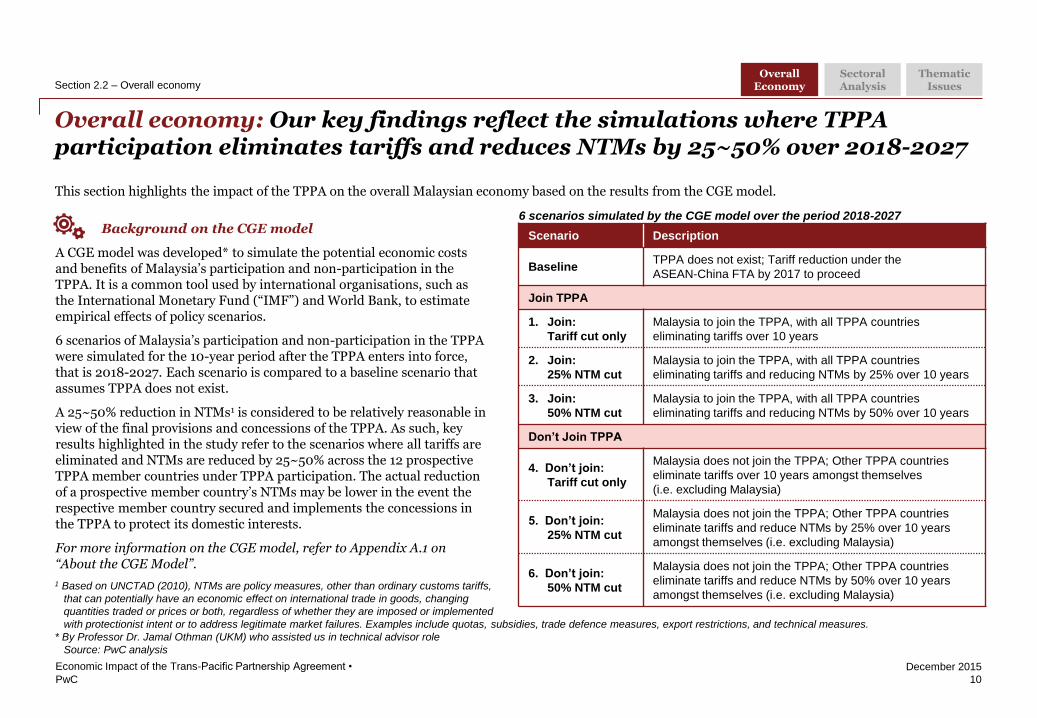
6 scenarios simulated by the CGE model over the period 2018-2027
Overall economy: Our key findings reflect the simulations where TPPA participation eliminates tariffs and reduces NTMs by 25~50% over 2018-2027
10
Economic Impact of the Trans-Pacific Partnership Agreement •
Background on the CGE model
A CGE model was developed* to simulate the potential economic costs and benefits of Malaysia’s participation and non-participation in the TPPA. It is a common tool used by international organisations, such as the International Monetary Fund (“IMF”) and World Bank, to estimate empirical effects of policy scenarios.
6 scenarios of Malaysia’s participation and non-participation in the TPPA were simulated for the 10-year period after the TPPA enters into force, that is 2018-2027. Each scenario is compared to a baseline scenario that assumes TPPA does not exist.
A 25~50% reduction in NTMs1 is considered to be relatively reasonable in view of the final provisions and concessions of the TPPA. As such, key results highlighted in the study refer to the scenarios where all tariffs are eliminated and NTMs are reduced by 25~50% across the 12 prospective TPPA member countries under TPPA participation. The actual reduction of a prospective member country’s NTMs may be lower in the event the respective member country secured and implements the concessions in the TPPA to protect its domestic interests.
For more information on the CGE model, refer to Appendix A.1 on “About the CGE Model”.
Scenario Description
Baseline TPPA does not exist; Tariff reduction under the
ASEAN-China FTA by 2017 to proceed
Join TPPA
1. Join:
Tariff cut only
Malaysia to join the TPPA, with all TPPA countries
eliminating tariffs over 10 years
2. Join:
25% NTM cut
Malaysia to join the TPPA, with all TPPA countries
eliminating tariffs and reducing NTMs by 25% over 10 years
3. Join:
50% NTM cut
Malaysia to join the TPPA, with all TPPA countries
eliminating tariffs and reducing NTMs by 50% over 10 years
Don’t Join TPPA
4. Don’t join:
Tariff cut only
Malaysia does not join the TPPA; Other TPPA countries
eliminate tariffs over 10 years amongst themselves
(i.e. excluding Malaysia)
5. Don’t join:
25% NTM cut
Malaysia does not join the TPPA; Other TPPA countries
eliminate tariffs and reduce NTMs by 25% over 10 years
amongst themselves (i.e. excluding Malaysia)
6. Don’t join:
50% NTM cut
Malaysia does not join the TPPA; Other TPPA countries
eliminate tariffs and reduce NTMs by 50% over 10 years
amongst themselves (i.e. excluding Malaysia)
Section 2.2 – Overall economy Overall
Economy Sectoral Analysis
Thematic Issues
This section highlights the impact of the TPPA on the overall Malaysian economy based on the results from the CGE model.
1 Based on UNCTAD (2010), NTMs are policy measures, other than ordinary customs tariffs,
that can potentially have an economic effect on international trade in goods, changing
quantities traded or prices or both, regardless of whether they are imposed or implemented
with protectionist intent or to address legitimate market failures. Examples include quotas, subsidies, trade defence measures, export restrictions, and technical measures.
* By Professor Dr. Jamal Othman (UKM) who assisted us in technical advisor role
Source: PwC analysis
PwC
December 2015
As of
2014
Join:
Tariff
Cut Only
Join:
25%
NTM Cut
Join:
50%
NTM Cut
Don’t
Join:
Tariff
Cut Only
Don’t
Join:
25%
NTM Cut
Don’t
Join:
50%
NTM Cut
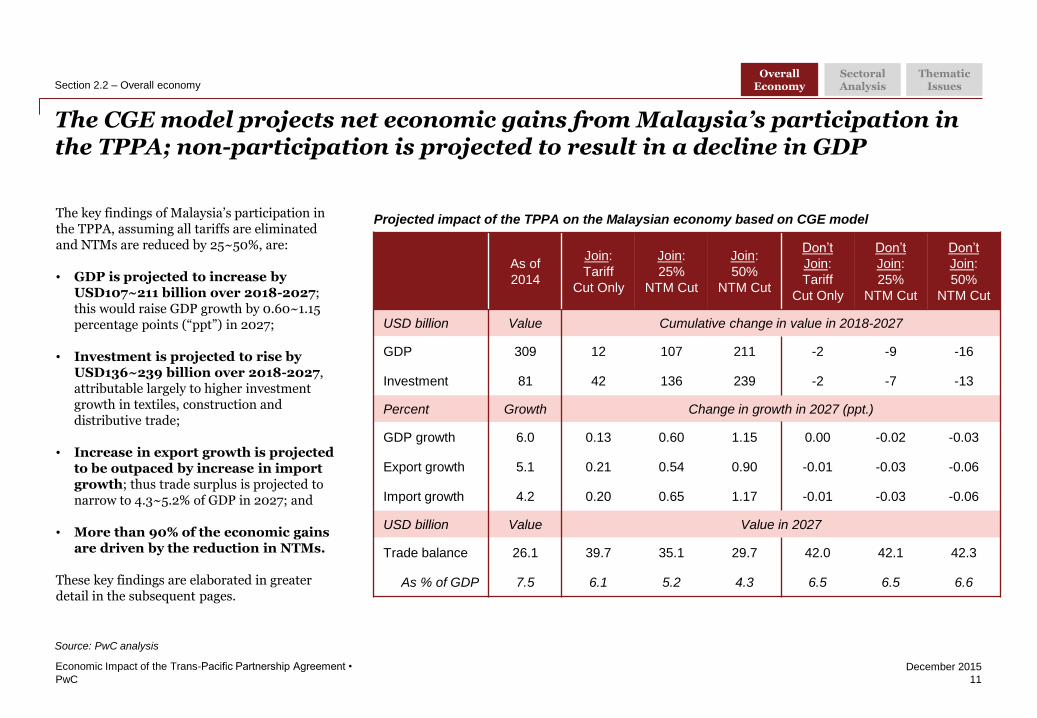
USD billion Value Cumulative change in value in 2018-2027
GDP 309 12 107 211 -2 -9 -16
Investment 81 42 136 239 -2 -7 -13
Percent Growth Change in growth in 2027 (ppt.)
GDP growth 6.0 0.13 0.60 1.15 0.00 -0.02 -0.03
Export growth 5.1 0.21 0.54 0.90 -0.01 -0.03 -0.06
Import growth 4.2 0.20 0.65 1.17 -0.01 -0.03 -0.06
USD billion Value Value in 2027
Trade balance 26.1 39.7 35.1 29.7 42.0 42.1 42.3
As % of GDP 7.5 6.1 5.2 4.3 6.5 6.5 6.6
Projected impact of the TPPA on the Malaysian economy based on CGE model
The CGE model projects net economic gains from Malaysia’s participation in the TPPA; non-participation is projected to result in a decline in GDP
11
Economic Impact of the Trans-Pacific Partnership Agreement •
The key findings of Malaysia’s participation in the TPPA, assuming all tariffs are eliminated and NTMs are reduced by 25~50%, are:
• GDP is projected to increase by USD107~211 billion over 2018-2027; this would raise GDP growth by 0.60~1.15 percentage points (“ppt”) in 2027;
• Investment is projected to rise by USD136~239 billion over 2018-2027, attributable largely to higher investment growth in textiles, construction and distributive trade;
• Increase in export growth is projected to be outpaced by increase in import growth; thus trade surplus is projected to narrow to 4.3~5.2% of GDP in 2027; and
• More than 90% of the economic gains are driven by the reduction in NTMs.
These key findings are elaborated in greater detail in the subsequent pages.
Section 2.2 – Overall economy Overall
Economy Sectoral Analysis
Thematic Issues
Source: PwC analysis
PwC
December 2015
400
500
600
700
2018 2021 2024 2027
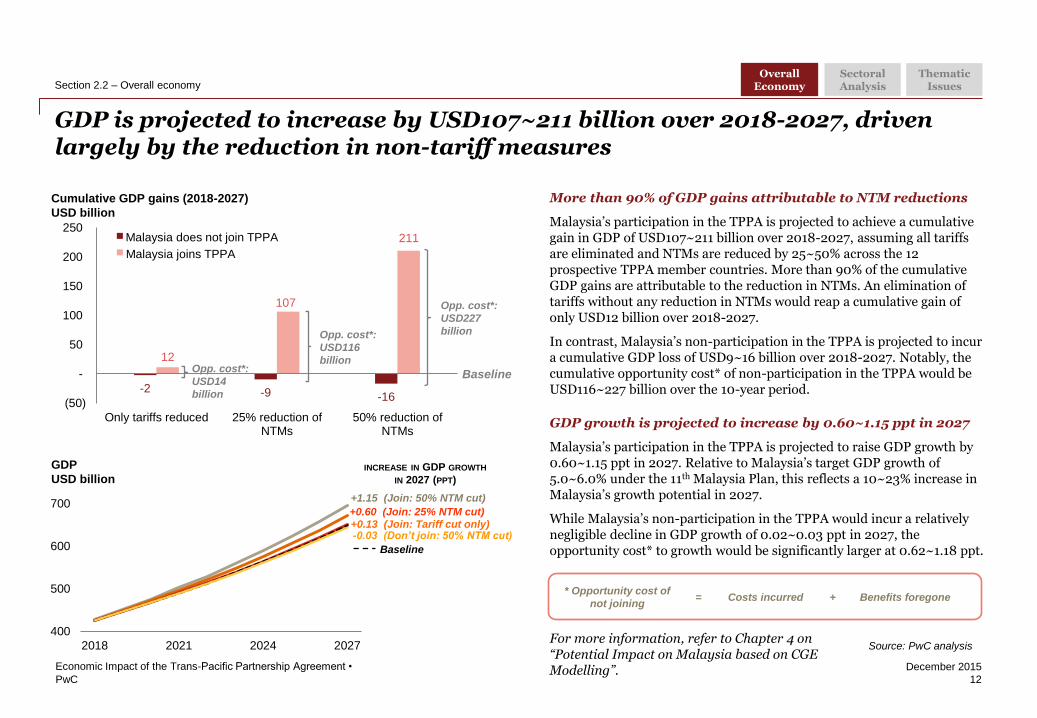
GDP is projected to increase by USD107~211 billion over 2018-2027, driven largely by the reduction in non-tariff measures
12
Economic Impact of the Trans-Pacific Partnership Agreement •
More than 90% of GDP gains attributable to NTM reductions
Malaysia’s participation in the TPPA is projected to achieve a cumulative gain in GDP of USD107~211 billion over 2018-2027, assuming all tariffs are eliminated and NTMs are reduced by 25~50% across the 12 prospective TPPA member countries. More than 90% of the cumulative GDP gains are attributable to the reduction in NTMs. An elimination of tariffs without any reduction in NTMs would reap a cumulative gain of only USD12 billion over 2018-2027.
In contrast, Malaysia’s non-participation in the TPPA is projected to incur a cumulative GDP loss of USD9~16 billion over 2018-2027. Notably, the cumulative opportunity cost* of non-participation in the TPPA would be USD116~227 billion over the 10-year period.
GDP growth is projected to increase by 0.60~1.15 ppt in 2027
Malaysia’s participation in the TPPA is projected to raise GDP growth by 0.60~1.15 ppt in 2027. Relative to Malaysia’s target GDP growth of 5.0~6.0% under the 11th Malaysia Plan, this reflects a 10~23% increase in Malaysia’s growth potential in 2027.
While Malaysia’s non-participation in the TPPA would incur a relatively negligible decline in GDP growth of 0.02~0.03 ppt in 2027, the opportunity cost* to growth would be significantly larger at 0.62~1.18 ppt.
For more information, refer to Chapter 4 on “Potential Impact on Malaysia based on CGE Modelling”.
* Opportunity cost of
not joining Costs incurred Benefits foregone = +
-2 -9 -16
12
107
211
(50)
-
50
100
150
200
250
Only tariffs reduced 25% reduction ofNTMs
50% reduction ofNTMs
Malaysia does not join TPP
Malaysia joins the TPP
Cumulative GDP gains (2018-2027)
USD billion
Opp. cost*:
USD14
billion
Baseline
Opp. cost*:
USD116
billion
Opp. cost*:
USD227
billion
+1.15 (Join: 50% NTM cut)
+0.60 (Join: 25% NTM cut)
-0.03 (Don’t join: 50% NTM cut) +0.13 (Join: Tariff cut only)
GDP
USD billion INCREASE IN GDP GROWTH
IN 2027 (PPT)
Baseline
Section 2.2 – Overall economy Overall
Economy Sectoral Analysis
Thematic Issues
Source: PwC analysis
Malaysia does not join TPPA
Malaysia joins TPPA

PwC
December 2015
-2 -7 -13
42
136
239
(50)
-
50
100
150
200
250
300
Only tariffs reduced 25% reduction ofNTMs
50% reduction ofNTMs
Malaysia does not join TPP
Malaysia joins the TPP
Investment is projected to rise by USD136~239 billion over 2018-2027, with higher investment growth in textiles, construction and distributive trade
13
Economic Impact of the Trans-Pacific Partnership Agreement •
Baseline
Investment gains attributable largely to foreign inflows
Investment is projected to increase by an additional USD136~239 billion over 2018-2027 following Malaysia’s participation in the TPPA. The textiles sector will register the largest increase in investment growth in 2027, followed by the construction and distributive trade sectors.
Simulation results from the CGE model also suggest that the growth of foreign wealth located in domestic assets would increase by 1.92~3.27 ppt in 2027, while the growth of domestic wealth located in domestic assets would increase by 0.30~0.52 ppt.
In contrast, Malaysia’s non-participation in the TPPA could result in a diversion of foreign investment away from Malaysia. Investment is projected to decline by USD7~13 billion over 2018-2027, with the growth of foreign wealth located in domestic assets declining slightly by 0.09~0.15 ppt in 2027. The growth of domestic wealth located in domestic assets would remain unchanged.
But CGE model does not account for the diverse risk-return profiles of individual firms and investors
The simulated increase in investment may, nevertheless, be an overestimation of potential gains. The CGE projections reflect the income effects of domestic and foreign wealth accumulation, as well as present trends in international capital mobility. They do not account for the diverse risk-return profiles of individual firms and investors.
For more information, refer to Chapter 4 on “Potential Impact on Malaysia based on CGE Modelling”.
Section 2.2 – Overall economy Overall
Economy Sectoral Analysis
Thematic Issues
Source: PwC analysis
Malaysia does not join TPPA
Malaysia joins TPPA
Cumulative investment gains (2018-2027)
USD billion
Motor vehicles &transport equipment
E&E
Distributive Trade
Construction
Textiles
Join: Tariff only Join: 25% NTM cut Join: 50% NTM cut
Increase in investment growth for selected key economic sectors (2027)
Ppt
3.42~4.29
1.31~2.45
1.09~1.99
0.88~1.54
0.82~1.49
PwC
December 2015
-0.01 -0.03 -0.06
0.21
0.54
0.90
-0.2
0.0
0.2
0.4
0.6
0.8
1.0
1.2
Only tariff reduced 25% reduction inNTMs
50% reduction inNTMs
Malaysia does not join TPP
Malaysia joins the TPP
-0.01 -0.03 -0.06
0.20
0.65
1.17
-0.2
0.0
0.2
0.4
0.6
0.8
1.0
1.2
Only tariff reduced 25% reduction inNTMs
50% reduction inNTMs
Malaysia does not join TPP
Malaysia joins the TPP
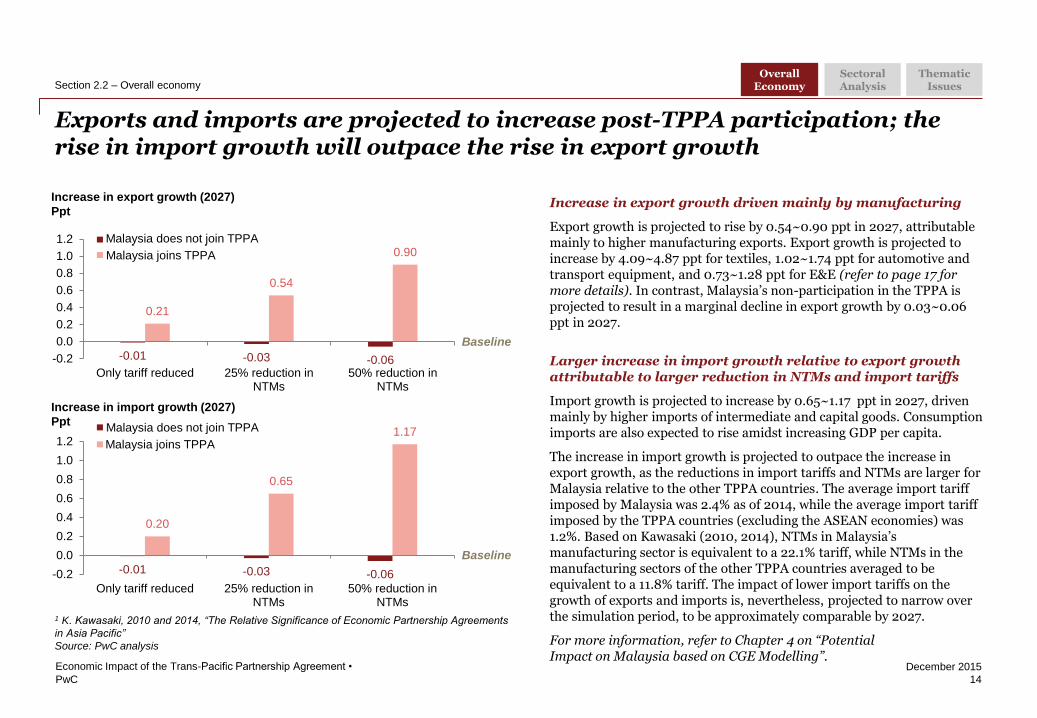
Exports and imports are projected to increase post-TPPA participation; the rise in import growth will outpace the rise in export growth
14
Economic Impact of the Trans-Pacific Partnership Agreement •
Increase in export growth (2027)
Ppt
Baseline
Increase in export growth driven mainly by manufacturing
Export growth is projected to rise by 0.54~0.90 ppt in 2027, attributable mainly to higher manufacturing exports. Export growth is projected to increase by 4.09~4.87 ppt for textiles, 1.02~1.74 ppt for automotive and transport equipment, and 0.73~1.28 ppt for E&E (refer to page 17 for more details). In contrast, Malaysia’s non-participation in the TPPA is projected to result in a marginal decline in export growth by 0.03~0.06 ppt in 2027.
Larger increase in import growth relative to export growth attributable to larger reduction in NTMs and import tariffs
Import growth is projected to increase by 0.65~1.17 ppt in 2027, driven mainly by higher imports of intermediate and capital goods. Consumption imports are also expected to rise amidst increasing GDP per capita.
The increase in import growth is projected to outpace the increase in export growth, as the reductions in import tariffs and NTMs are larger for Malaysia relative to the other TPPA countries. The average import tariff imposed by Malaysia was 2.4% as of 2014, while the average import tariff imposed by the TPPA countries (excluding the ASEAN economies) was 1.2%. Based on Kawasaki (2010, 2014), NTMs in Malaysia’s manufacturing sector is equivalent to a 22.1% tariff, while NTMs in the manufacturing sectors of the other TPPA countries averaged to be equivalent to a 11.8% tariff. The impact of lower import tariffs on the growth of exports and imports is, nevertheless, projected to narrow over the simulation period, to be approximately comparable by 2027.
For more information, refer to Chapter 4 on “Potential Impact on Malaysia based on CGE Modelling”.
Increase in import growth (2027)
Ppt
Baseline
Section 2.2 – Overall economy Overall
Economy Sectoral Analysis
Thematic Issues
1 K. Kawasaki, 2010 and 2014, “The Relative Significance of Economic Partnership Agreements
in Asia Pacific”
Source: PwC analysis
Malaysia does not join TPPA
Malaysia joins TPPA
Malaysia does not join TPPA
Malaysia joins TPPA
Amended for
page
reference –
should be pp
17, not pp 16
PwC
December 2015
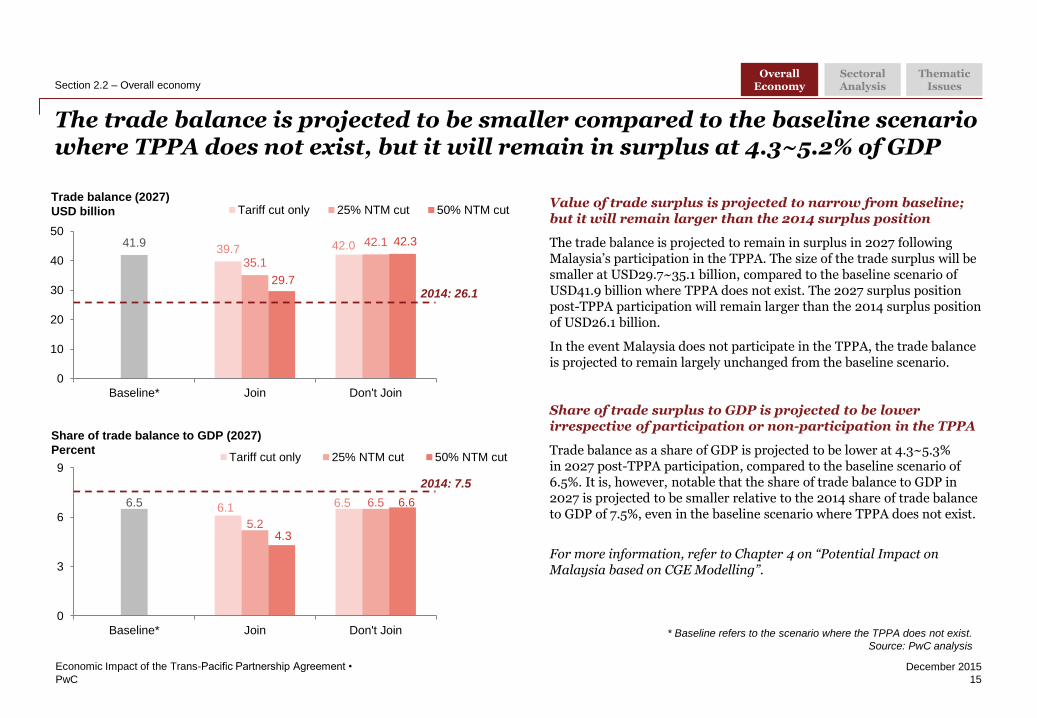
The trade balance is projected to be smaller compared to the baseline scenario where TPPA does not exist, but it will remain in surplus at 4.3~5.2% of GDP
15
Economic Impact of the Trans-Pacific Partnership Agreement •
Value of trade surplus is projected to narrow from baseline; but it will remain larger than the 2014 surplus position
The trade balance is projected to remain in surplus in 2027 following Malaysia’s participation in the TPPA. The size of the trade surplus will be smaller at USD29.7~35.1 billion, compared to the baseline scenario of USD41.9 billion where TPPA does not exist. The 2027 surplus position post-TPPA participation will remain larger than the 2014 surplus position of USD26.1 billion.
In the event Malaysia does not participate in the TPPA, the trade balance is projected to remain largely unchanged from the baseline scenario.
Share of trade surplus to GDP is projected to be lower irrespective of participation or non-participation in the TPPA
Trade balance as a share of GDP is projected to be lower at 4.3~5.3% in 2027 post-TPPA participation, compared to the baseline scenario of 6.5%. It is, however, notable that the share of trade balance to GDP in 2027 is projected to be smaller relative to the 2014 share of trade balance to GDP of 7.5%, even in the baseline scenario where TPPA does not exist.
For more information, refer to Chapter 4 on “Potential Impact on Malaysia based on CGE Modelling”.
Section 2.2 – Overall economy Overall
Economy Sectoral Analysis
Thematic Issues
* Baseline refers to the scenario where the TPPA does not exist.
Source: PwC analysis
39.7 42.0 41.9
35.1
42.1
29.7
42.3
0
10
20
30
40
50
Baseline* Join Don't Join
Tariff cut only 25% NTM cut 50% NTM cutTrade balance (2027)
USD billion
2014: 26.1
6.1 6.5 6.5
5.2
6.5
4.3
6.6
0
3
6
9
Baseline* Join Don't Join
Tariff cut only 25% NTM cut 50% NTM cut
Share of trade balance to GDP (2027)
Percent
2014: 7.5
PwC
December 2015
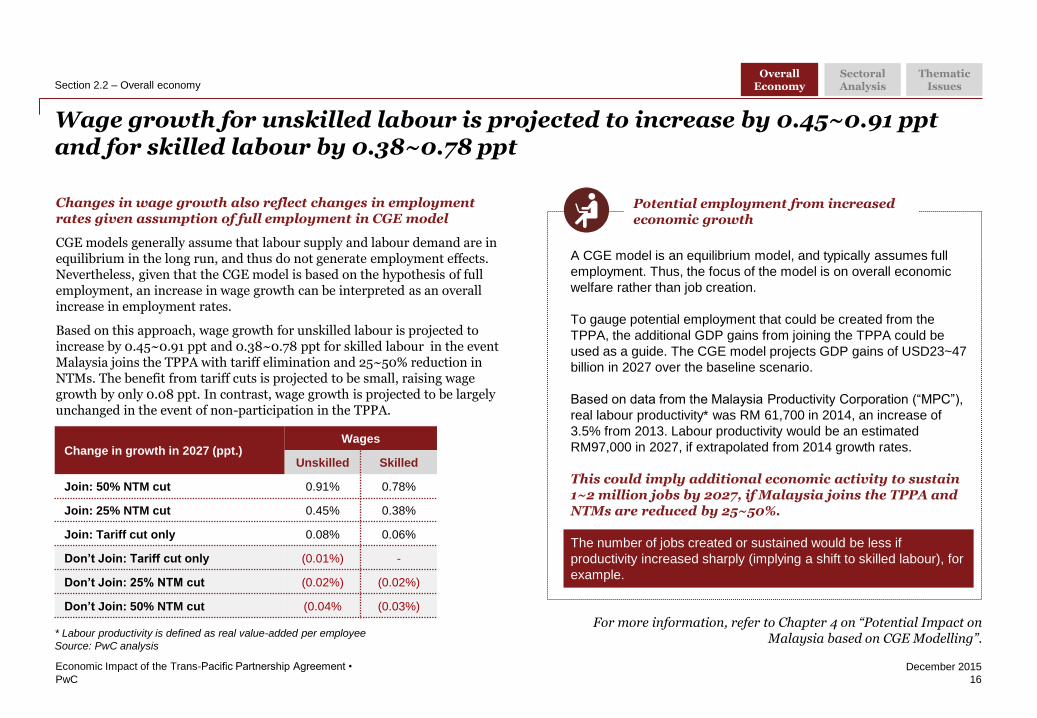
Wage growth for unskilled labour is projected to increase by 0.45~0.91 ppt and for skilled labour by 0.38~0.78 ppt
16
Economic Impact of the Trans-Pacific Partnership Agreement •
Section 2.2 – Overall economy
* Labour productivity is defined as real value-added per employee
Source: PwC analysis
Change in growth in 2027 (ppt.) Wages
Unskilled Skilled
Join: 50% NTM cut 0.91% 0.78%
Join: 25% NTM cut 0.45% 0.38%
Join: Tariff cut only 0.08% 0.06%
Don’t Join: Tariff cut only (0.01%) -
Don’t Join: 25% NTM cut (0.02%) (0.02%)
Don’t Join: 50% NTM cut (0.04% (0.03%)
Potential employment from increased economic growth
A CGE model is an equilibrium model, and typically assumes full
employment. Thus, the focus of the model is on overall economic
welfare rather than job creation.
To gauge potential employment that could be created from the
TPPA, the additional GDP gains from joining the TPPA could be
used as a guide. The CGE model projects GDP gains of USD23~47
billion in 2027 over the baseline scenario.
Based on data from the Malaysia Productivity Corporation (“MPC”),
real labour productivity* was RM 61,700 in 2014, an increase of
3.5% from 2013. Labour productivity would be an estimated
RM97,000 in 2027, if extrapolated from 2014 growth rates.
This could imply additional economic activity to sustain 1~2 million jobs by 2027, if Malaysia joins the TPPA and NTMs are reduced by 25~50%.
The number of jobs created or sustained would be less if
productivity increased sharply (implying a shift to skilled labour), for
example.
Changes in wage growth also reflect changes in employment rates given assumption of full employment in CGE model
CGE models generally assume that labour supply and labour demand are in equilibrium in the long run, and thus do not generate employment effects. Nevertheless, given that the CGE model is based on the hypothesis of full employment, an increase in wage growth can be interpreted as an overall increase in employment rates.
Based on this approach, wage growth for unskilled labour is projected to increase by 0.45~0.91 ppt and 0.38~0.78 ppt for skilled labour in the event Malaysia joins the TPPA with tariff elimination and 25~50% reduction in NTMs. The benefit from tariff cuts is projected to be small, raising wage growth by only 0.08 ppt. In contrast, wage growth is projected to be largely unchanged in the event of non-participation in the TPPA.
For more information, refer to Chapter 4 on “Potential Impact on Malaysia based on CGE Modelling”.
Overall Economy
Sectoral Analysis
Thematic Issues
PwC
December 2015
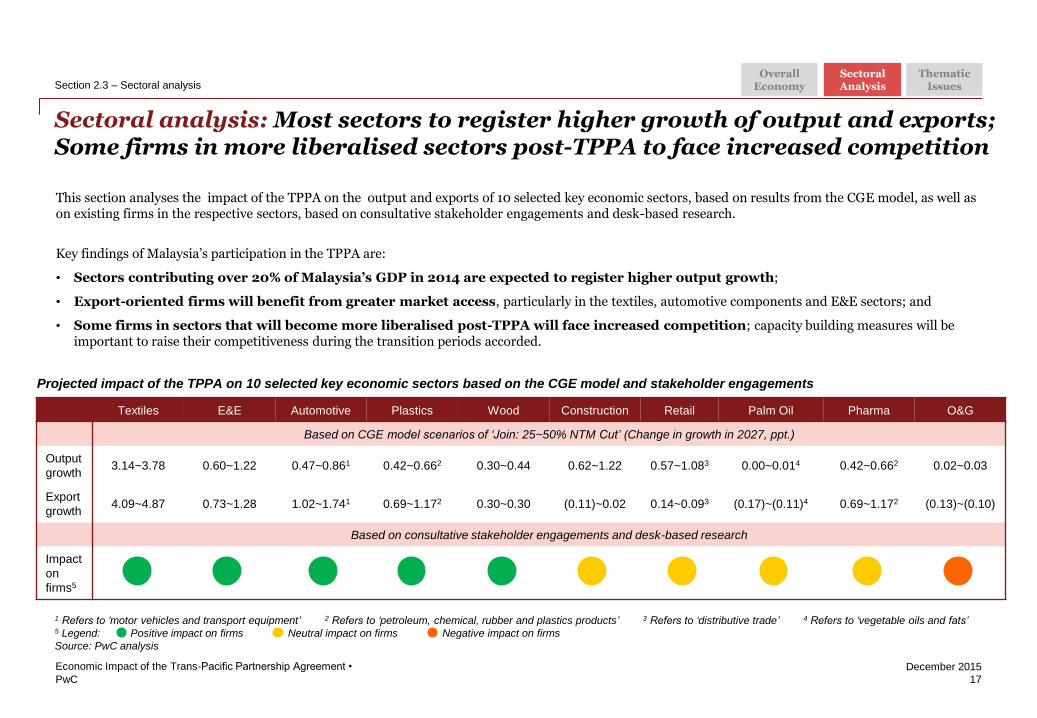
Sectoral analysis: Most sectors to register higher growth of output and exports; Some firms in more liberalised sectors post-TPPA to face increased competition
17
Economic Impact of the Trans-Pacific Partnership Agreement •
Section 2.3 – Sectoral analysis Overall
Economy Sectoral Analysis
Thematic Issues
1 Refers to ‘motor vehicles and transport equipment’ 2 Refers to ‘petroleum, chemical, rubber and plastics products’ 3 Refers to ‘distributive trade’ 4 Refers to ‘vegetable oils and fats’ 5 Legend: Positive impact on firms Neutral impact on firms Negative impact on firms
Source: PwC analysis
This section analyses the impact of the TPPA on the output and exports of 10 selected key economic sectors, based on results from the CGE model, as well as on existing firms in the respective sectors, based on consultative stakeholder engagements and desk-based research.
Key findings of Malaysia’s participation in the TPPA are:
• Sectors contributing over 20% of Malaysia’s GDP in 2014 are expected to register higher output growth;
• Export-oriented firms will benefit from greater market access, particularly in the textiles, automotive components and E&E sectors; and
• Some firms in sectors that will become more liberalised post-TPPA will face increased competition; capacity building measures will be important to raise their competitiveness during the transition periods accorded.
Textiles E&E Automotive Plastics Wood Construction Retail Palm Oil Pharma O&G
Based on CGE model scenarios of ‘Join: 25~50% NTM Cut’ (Change in growth in 2027, ppt.)
Output
growth 3.14~3.78 0.60~1.22 0.47~0.861 0.42~0.662 0.30~0.44 0.62~1.22 0.57~1.083 0.00~0.014 0.42~0.662 0.02~0.03
Export
growth 4.09~4.87 0.73~1.28 1.02~1.741 0.69~1.172 0.30~0.30 (0.11)~0.02 0.14~0.093 (0.17)~(0.11)4 0.69~1.172 (0.13)~(0.10)
Based on consultative stakeholder engagements and desk-based research
Impact
on
firms5
Projected impact of the TPPA on 10 selected key economic sectors based on the CGE model and stakeholder engagements
PwC
December 2015
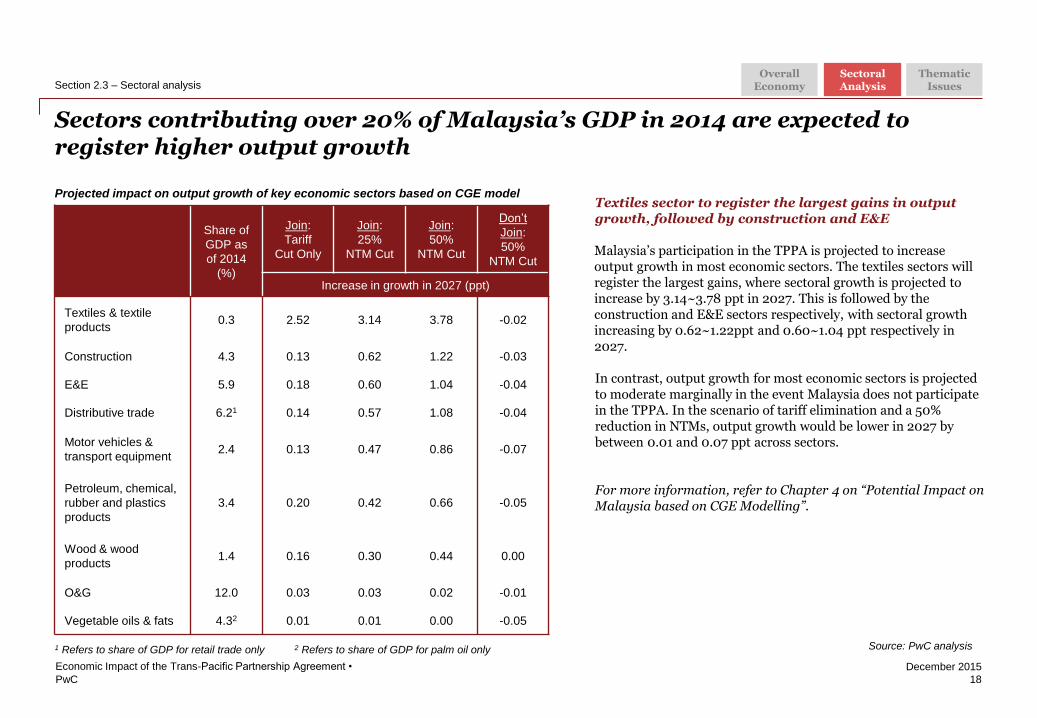
Sectors contributing over 20% of Malaysia’s GDP in 2014 are expected to register higher output growth
18
Economic Impact of the Trans-Pacific Partnership Agreement •
Textiles sector to register the largest gains in output growth, followed by construction and E&E
Malaysia’s participation in the TPPA is projected to increase output growth in most economic sectors. The textiles sectors will register the largest gains, where sectoral growth is projected to increase by 3.14~3.78 ppt in 2027. This is followed by the construction and E&E sectors respectively, with sectoral growth increasing by 0.62~1.22ppt and 0.60~1.04 ppt respectively in 2027.
In contrast, output growth for most economic sectors is projected to moderate marginally in the event Malaysia does not participate in the TPPA. In the scenario of tariff elimination and a 50% reduction in NTMs, output growth would be lower in 2027 by between 0.01 and 0.07 ppt across sectors.
For more information, refer to Chapter 4 on “Potential Impact on Malaysia based on CGE Modelling”.
Share of
GDP as
of 2014
(%)
Join:
Tariff
Cut Only
Join:
25%
NTM Cut
Join:
50%
NTM Cut
Don’t
Join:
50%
NTM Cut
Increase in growth in 2027 (ppt)
Textiles & textile
products 0.3 2.52 3.14 3.78 -0.02
Construction 4.3 0.13 0.62 1.22 -0.03
E&E 5.9 0.18 0.60 1.04 -0.04
Distributive trade 6.21 0.14 0.57 1.08 -0.04
Motor vehicles &
transport equipment 2.4 0.13 0.47 0.86 -0.07
Petroleum, chemical,
rubber and plastics
products
3.4 0.20 0.42 0.66 -0.05
Wood & wood
products 1.4 0.16 0.30 0.44 0.00
O&G 12.0 0.03 0.03 0.02 -0.01
Vegetable oils & fats 4.32 0.01 0.01 0.00 -0.05
Projected impact on output growth of key economic sectors based on CGE model
1 Refers to share of GDP for retail trade only 2 Refers to share of GDP for palm oil only
Section 2.3 – Sectoral analysis Overall
Economy Sectoral Analysis
Thematic Issues
Source: PwC analysis
PwC
December 2015
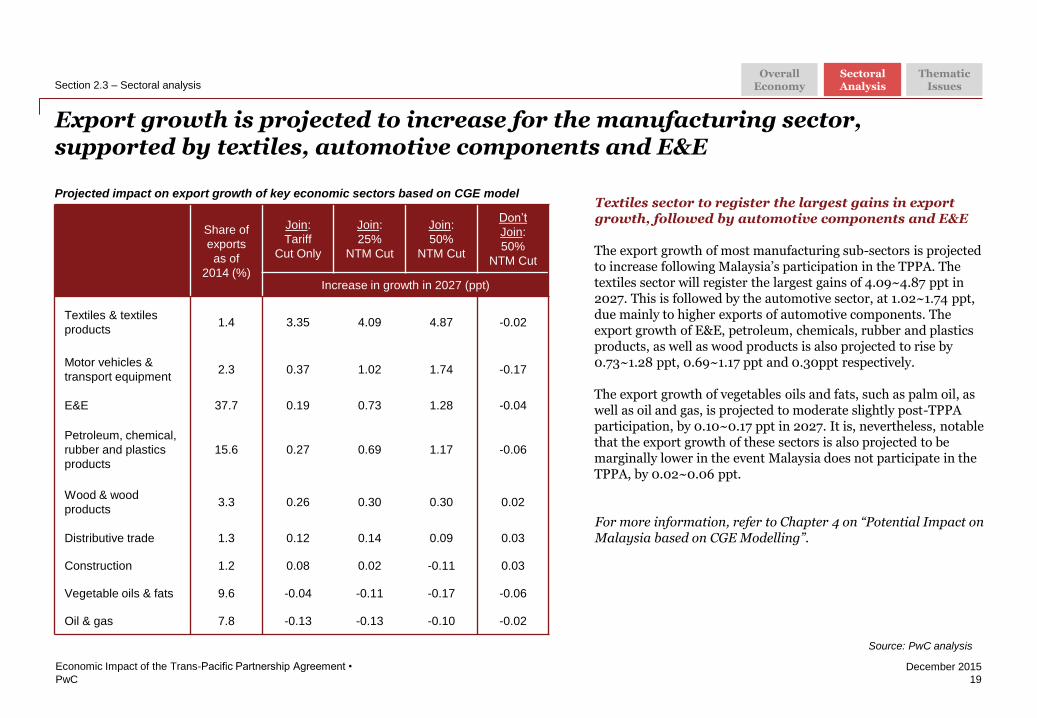
Export growth is projected to increase for the manufacturing sector, supported by textiles, automotive components and E&E
19
Economic Impact of the Trans-Pacific Partnership Agreement •
Textiles sector to register the largest gains in export growth, followed by automotive components and E&E
The export growth of most manufacturing sub-sectors is projected to increase following Malaysia’s participation in the TPPA. The textiles sector will register the largest gains of 4.09~4.87 ppt in 2027. This is followed by the automotive sector, at 1.02~1.74 ppt, due mainly to higher exports of automotive components. The export growth of E&E, petroleum, chemicals, rubber and plastics products, as well as wood products is also projected to rise by 0.73~1.28 ppt, 0.69~1.17 ppt and 0.30ppt respectively.
The export growth of vegetables oils and fats, such as palm oil, as well as oil and gas, is projected to moderate slightly post-TPPA participation, by 0.10~0.17 ppt in 2027. It is, nevertheless, notable that the export growth of these sectors is also projected to be marginally lower in the event Malaysia does not participate in the TPPA, by 0.02~0.06 ppt.
For more information, refer to Chapter 4 on “Potential Impact on Malaysia based on CGE Modelling”.
Share of
exports
as of
2014 (%)
Join:
Tariff
Cut Only
Join:
25%
NTM Cut
Join:
50%
NTM Cut
Don’t
Join:
50%
NTM Cut
Increase in growth in 2027 (ppt)
Textiles & textiles
products 1.4 3.35 4.09 4.87 -0.02
Motor vehicles &
transport equipment 2.3 0.37 1.02 1.74 -0.17
E&E 37.7 0.19 0.73 1.28 -0.04
Petroleum, chemical,
rubber and plastics
products
15.6 0.27 0.69 1.17 -0.06
Wood & wood
products 3.3 0.26 0.30 0.30 0.02
Distributive trade 1.3 0.12 0.14 0.09 0.03
Construction 1.2 0.08 0.02 -0.11 0.03
Vegetable oils & fats 9.6 -0.04 -0.11 -0.17 -0.06
Oil & gas 7.8 -0.13 -0.13 -0.10 -0.02
Projected impact on export growth of key economic sectors based on CGE model
Section 2.3 – Sectoral analysis Overall
Economy Sectoral Analysis
Thematic Issues
Source: PwC analysis
PwC
December 2015
Sector Positive Impact Negative Impact Page
Textiles • Yarn forward rule to boost exports & investment
in upstream activities - 21
E&E • Large export opportunities from access to US
government procurement - 24
Automotive • Component manufacturers to benefit from greater
market access • Displacement effect on national car manufacturers from
import of US cars to be small 27
Plastics • Cheaper imports and lower tariffs to enhance export
competitiveness - 29
Wood • Lower trade barriers to raise export prospects - 30
Construction • General contractors to remain competitive • Increased competition for specialised contractors, but
high threshold and long transition period accorded 31
Retail • Most sub-sectors to be minimally affected as prevailing
regulations are largely safeguarded • More transparent liberalisation of convenience stores may
increase competition 34
Palm oil • Small rise in exports as primary markets are
non-TPPA countries • Potential for production disruptions arising from labour
disputes 35
Pharmaceuticals • Minimal impact as marketing approval processes are
efficient and data exclusivity is safeguarded at 5 years • Introduction of soft patent linkage, but enhanced
capabilities of authorities can mitigate potential costs 38
Oil & gas • PETRONAS’ rights in the Petroleum Development Act
1974 (“PDA 1974”) are largely safeguarded • 12 goods and services to be liberalised • Flexibility to accord local preferences is capped
39
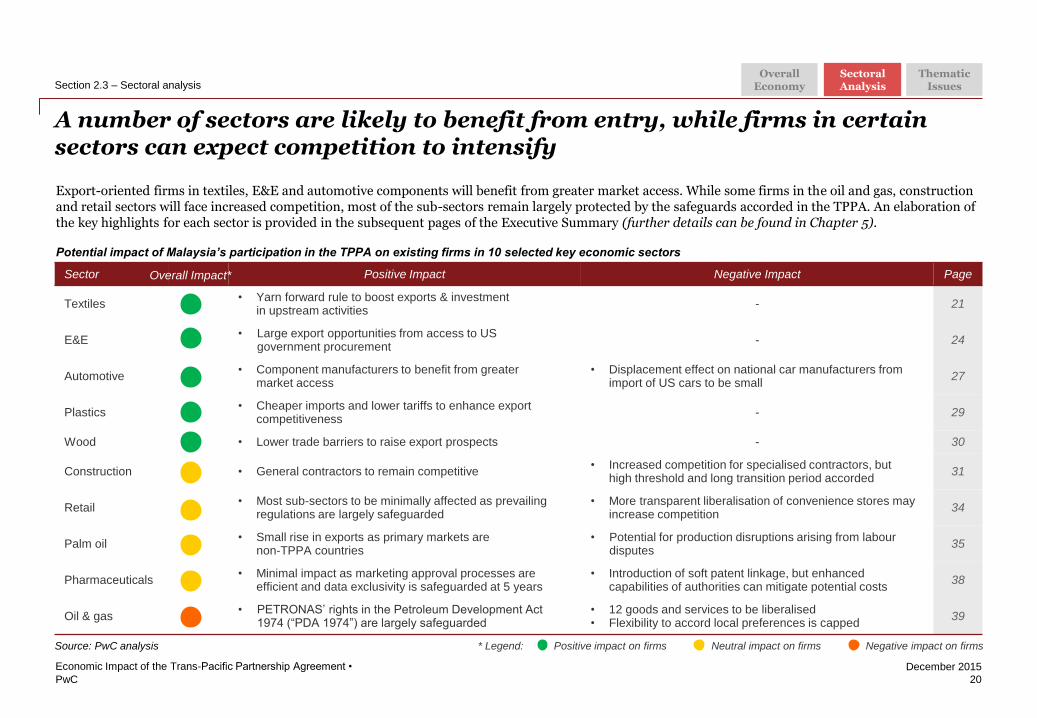
A number of sectors are likely to benefit from entry, while firms in certain sectors can expect competition to intensify
20
Economic Impact of the Trans-Pacific Partnership Agreement •
Section 2.3 – Sectoral analysis Overall
Economy Sectoral Analysis
Thematic Issues
Overall Impact*
* Legend: Positive impact on firms Neutral impact on firms Negative impact on firms
Source: PwC analysis
Potential impact of Malaysia’s participation in the TPPA on existing firms in 10 selected key economic sectors
Export-oriented firms in textiles, E&E and automotive components will benefit from greater market access. While some firms in the oil and gas, construction and retail sectors will face increased competition, most of the sub-sectors remain largely protected by the safeguards accorded in the TPPA. An elaboration of the key highlights for each sector is provided in the subsequent pages of the Executive Summary (further details can be found in Chapter 5).
Amended for
page
reference in
table
PwC
December 2015
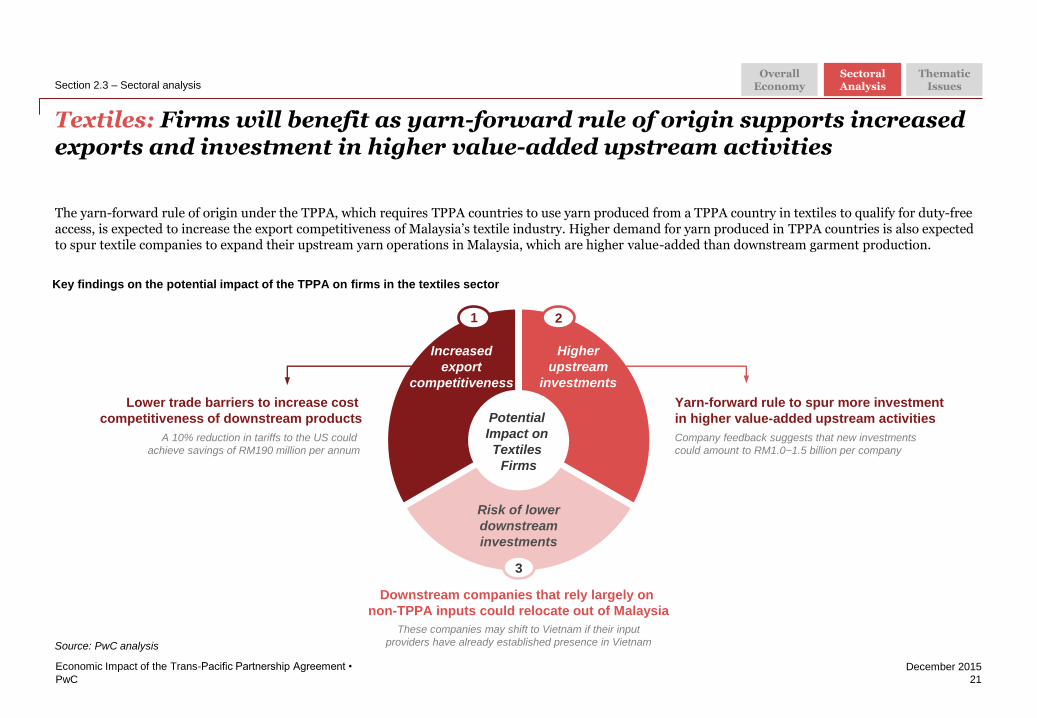
Textiles: Firms will benefit as yarn-forward rule of origin supports increased exports and investment in higher value-added upstream activities
21
Economic Impact of the Trans-Pacific Partnership Agreement •
Section 2.3 – Sectoral analysis
The yarn-forward rule of origin under the TPPA, which requires TPPA countries to use yarn produced from a TPPA country in textiles to qualify for duty-free access, is expected to increase the export competitiveness of Malaysia’s textile industry. Higher demand for yarn produced in TPPA countries is also expected to spur textile companies to expand their upstream yarn operations in Malaysia, which are higher value-added than downstream garment production.
Source: PwC analysis
Key findings on the potential impact of the TPPA on firms in the textiles sector
Yarn-forward rule to spur more investment
in higher value-added upstream activities
Company feedback suggests that new investments
could amount to RM1.0~1.5 billion per company
Downstream companies that rely largely on
non-TPPA inputs could relocate out of Malaysia
These companies may shift to Vietnam if their input
providers have already established presence in Vietnam
Potential
Impact on
Textiles
Firms
Increased
export
competitiveness
Risk of lower
downstream
investments
Higher
upstream
investments
1 2
3
Lower trade barriers to increase cost
competitiveness of downstream products
A 10% reduction in tariffs to the US could
achieve savings of RM190 million per annum
Overall Economy
Sectoral Analysis
Thematic Issues

PwC
December 2015
22
Economic Impact of the Trans-Pacific Partnership Agreement •
Section 2.3 – Sectoral analysis
Lower trade barriers to increase cost competitiveness of Malaysia’s downstream garment producers
The reduction in tariff lines for textile products is expected to benefit Malaysia’s downstream garment producers, as 59% of Malaysia’s garment exports were to the TPPA countries in 2014. Exports to the US are expected to benefit the most, given that 34% of the exports of made-up garments were to the US in 2014. A 10% reduction in tariffs across all textile products exported to the US could result in savings of RM190 million per annum, assuming the yarn-forward rule is fulfilled.
The removal of non-tariff barriers, particularly in Mexico and Peru, is also expected to increase Malaysia’s exports of textiles. Presently, these countries impose special industry sector registry requirements for the import of textiles, which increase the cost of custom clearance. Furthermore, changes may be made to the list of subjected items with immediate effect, disallowing companies sufficient time to fulfil the necessary requirements. The removal of these import requirements under the TPPA is thus expected to encourage higher trade between Malaysia and the TPPA countries in Latin America. Malaysia exported RM83 million of textiles to Mexico and Peru in 2014.
Source: PwC analysis
Lower trade barriers
Potential benefits from yarn-forward rule of origin
Yarn- Forward
Rule
Requirement to use yarn produced from a TPPA country in textiles production to qualify for duty free access
RM190 mn Potential savings from a
10% reduction in tariffs to the US across all textile products
Mexico / Peru Potential for higher exports given the
removal of non-tariff barriers
Overall Economy
Sectoral Analysis
Thematic Issues
PwC
December 2015
23
Economic Impact of the Trans-Pacific Partnership Agreement •
Section 2.3 – Sectoral analysis
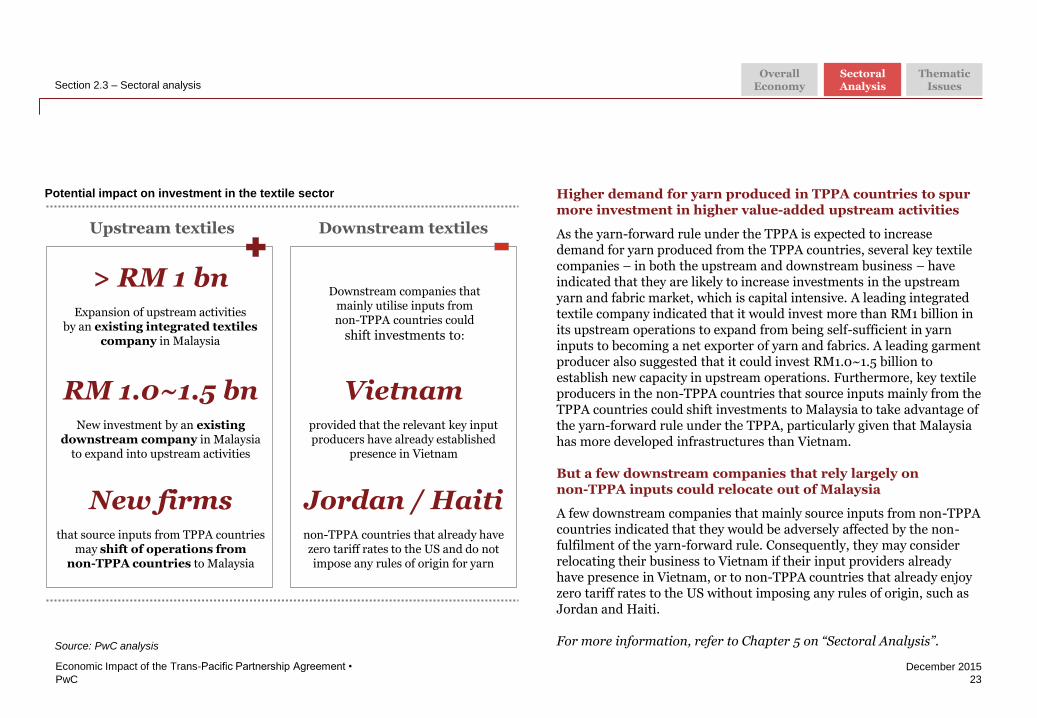
Higher demand for yarn produced in TPPA countries to spur more investment in higher value-added upstream activities
As the yarn-forward rule under the TPPA is expected to increase demand for yarn produced from the TPPA countries, several key textile companies – in both the upstream and downstream business – have indicated that they are likely to increase investments in the upstream yarn and fabric market, which is capital intensive. A leading integrated textile company indicated that it would invest more than RM1 billion in its upstream operations to expand from being self-sufficient in yarn inputs to becoming a net exporter of yarn and fabrics. A leading garment producer also suggested that it could invest RM1.0~1.5 billion to establish new capacity in upstream operations. Furthermore, key textile producers in the non-TPPA countries that source inputs mainly from the TPPA countries could shift investments to Malaysia to take advantage of the yarn-forward rule under the TPPA, particularly given that Malaysia has more developed infrastructures than Vietnam.
But a few downstream companies that rely largely on non-TPPA inputs could relocate out of Malaysia
A few downstream companies that mainly source inputs from non-TPPA countries indicated that they would be adversely affected by the non-fulfilment of the yarn-forward rule. Consequently, they may consider relocating their business to Vietnam if their input providers already have presence in Vietnam, or to non-TPPA countries that already enjoy zero tariff rates to the US without imposing any rules of origin, such as Jordan and Haiti.
For more information, refer to Chapter 5 on “Sectoral Analysis”. Source: PwC analysis
Upstream textiles Downstream textiles
Potential impact on investment in the textile sector
> RM 1 bn Expansion of upstream activities
by an existing integrated textiles company in Malaysia
RM 1.0~1.5 bn New investment by an existing
downstream company in Malaysia to expand into upstream activities
New firms that source inputs from TPPA countries
may shift of operations from non-TPPA countries to Malaysia
Downstream companies that mainly utilise inputs from non-TPPA countries could
shift investments to:
Vietnam provided that the relevant key input producers have already established
presence in Vietnam
Jordan / Haiti non-TPPA countries that already have zero tariff rates to the US and do not impose any rules of origin for yarn
Overall Economy
Sectoral Analysis
Thematic Issues
PwC
December 2015
E&E: Firms to benefit from access to US government procurement, greater digital liberalisation and stronger enforcement of trade secret protection
24
Economic Impact of the Trans-Pacific Partnership Agreement •
Section 2.3 – Sectoral analysis
Source: PwC analysis
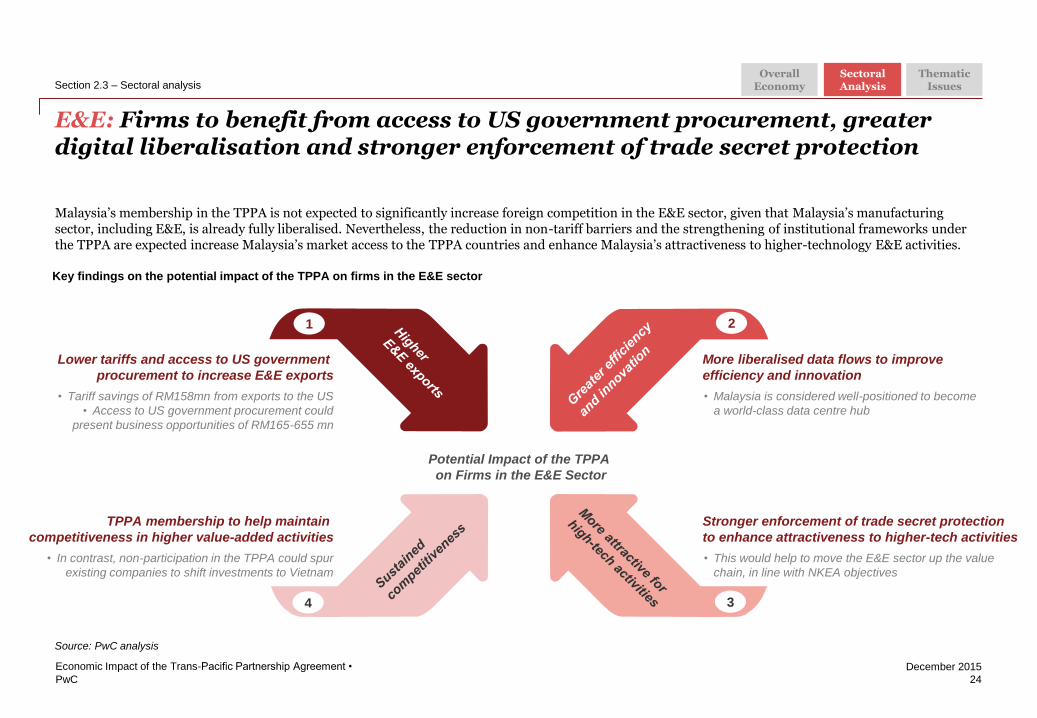
Malaysia’s membership in the TPPA is not expected to significantly increase foreign competition in the E&E sector, given that Malaysia’s manufacturing sector, including E&E, is already fully liberalised. Nevertheless, the reduction in non-tariff barriers and the strengthening of institutional frameworks under the TPPA are expected increase Malaysia’s market access to the TPPA countries and enhance Malaysia’s attractiveness to higher-technology E&E activities.
Key findings on the potential impact of the TPPA on firms in the E&E sector
Potential Impact of the TPPA
on Firms in the E&E Sector
Lower tariffs and access to US government
procurement to increase E&E exports
• Tariff savings of RM158mn from exports to the US
• Access to US government procurement could
present business opportunities of RM165-655 mn
More liberalised data flows to improve
efficiency and innovation
• Malaysia is considered well-positioned to become
a world-class data centre hub
Stronger enforcement of trade secret protection
to enhance attractiveness to higher-tech activities
• This would help to move the E&E sector up the value
chain, in line with NKEA objectives
TPPA membership to help maintain
competitiveness in higher value-added activities
• In contrast, non-participation in the TPPA could spur
existing companies to shift investments to Vietnam
1
4
2
3
Overall Economy
Sectoral Analysis
Thematic Issues
PwC
December 2015
25
Economic Impact of the Trans-Pacific Partnership Agreement •
Section 2.3 – Sectoral analysis
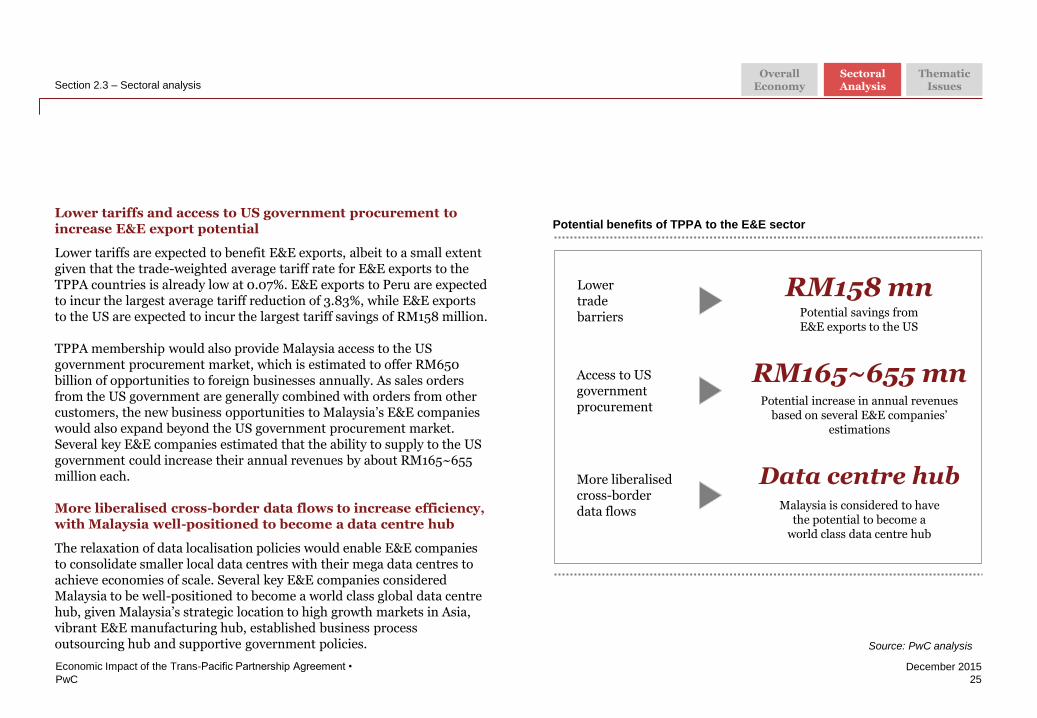
Lower tariffs and access to US government procurement to increase E&E export potential
Lower tariffs are expected to benefit E&E exports, albeit to a small extent given that the trade-weighted average tariff rate for E&E exports to the TPPA countries is already low at 0.07%. E&E exports to Peru are expected to incur the largest average tariff reduction of 3.83%, while E&E exports to the US are expected to incur the largest tariff savings of RM158 million.
TPPA membership would also provide Malaysia access to the US government procurement market, which is estimated to offer RM650 billion of opportunities to foreign businesses annually. As sales orders from the US government are generally combined with orders from other customers, the new business opportunities to Malaysia’s E&E companies would also expand beyond the US government procurement market. Several key E&E companies estimated that the ability to supply to the US government could increase their annual revenues by about RM165~655 million each.
More liberalised cross-border data flows to increase efficiency, with Malaysia well-positioned to become a data centre hub
The relaxation of data localisation policies would enable E&E companies to consolidate smaller local data centres with their mega data centres to achieve economies of scale. Several key E&E companies considered Malaysia to be well-positioned to become a world class global data centre hub, given Malaysia’s strategic location to high growth markets in Asia, vibrant E&E manufacturing hub, established business process outsourcing hub and supportive government policies. Source: PwC analysis
Potential benefits of TPPA to the E&E sector
RM158 mn Potential savings from E&E exports to the US
RM165~655 mn Potential increase in annual revenues
based on several E&E companies’ estimations
Lower trade barriers
Access to US government procurement
Data centre hub Malaysia is considered to have
the potential to become a world class data centre hub
More liberalised cross-border data flows
Overall Economy
Sectoral Analysis
Thematic Issues
PwC
December 2015
Country comparison of strength of trade secret protection1
26
Economic Impact of the Trans-Pacific Partnership Agreement •
Section 2.3 – Sectoral analysis
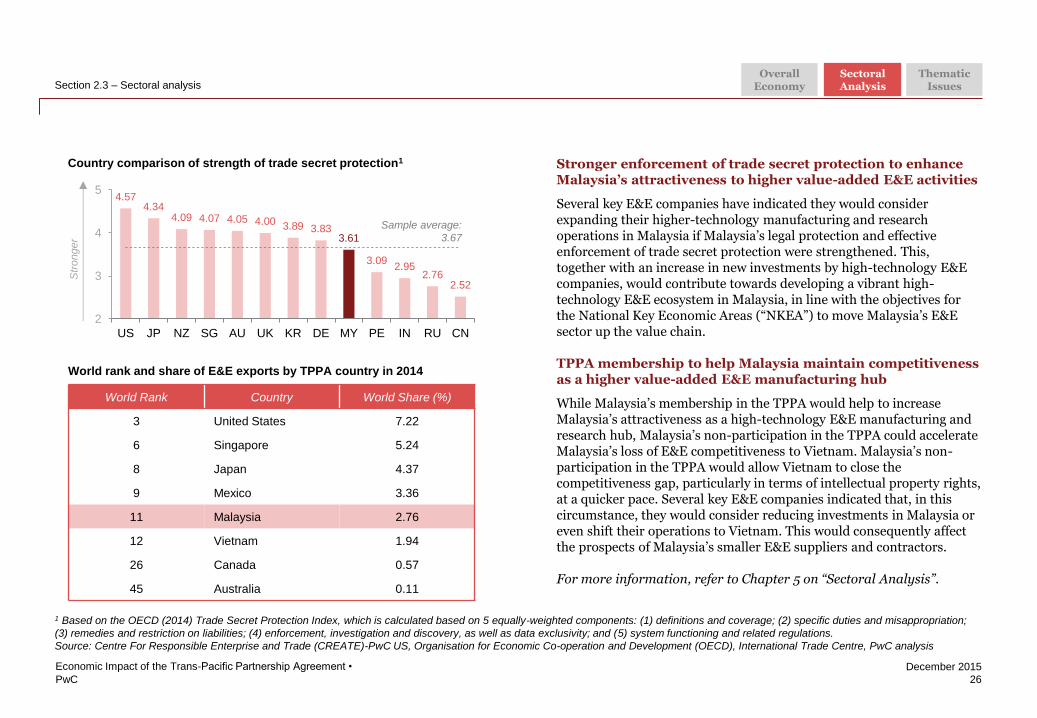
Stronger enforcement of trade secret protection to enhance Malaysia’s attractiveness to higher value-added E&E activities
Several key E&E companies have indicated they would consider expanding their higher-technology manufacturing and research operations in Malaysia if Malaysia’s legal protection and effective enforcement of trade secret protection were strengthened. This, together with an increase in new investments by high-technology E&E companies, would contribute towards developing a vibrant high-technology E&E ecosystem in Malaysia, in line with the objectives for the National Key Economic Areas (“NKEA”) to move Malaysia’s E&E sector up the value chain.
TPPA membership to help Malaysia maintain competitiveness as a higher value-added E&E manufacturing hub
While Malaysia’s membership in the TPPA would help to increase Malaysia’s attractiveness as a high-technology E&E manufacturing and research hub, Malaysia’s non-participation in the TPPA could accelerate Malaysia’s loss of E&E competitiveness to Vietnam. Malaysia’s non-participation in the TPPA would allow Vietnam to close the competitiveness gap, particularly in terms of intellectual property rights, at a quicker pace. Several key E&E companies indicated that, in this circumstance, they would consider reducing investments in Malaysia or even shift their operations to Vietnam. This would consequently affect the prospects of Malaysia’s smaller E&E suppliers and contractors.
For more information, refer to Chapter 5 on “Sectoral Analysis”.
1 Based on the OECD (2014) Trade Secret Protection Index, which is calculated based on 5 equally-weighted components: (1) definitions and coverage; (2) specific duties and misappropriation;
(3) remedies and restriction on liabilities; (4) enforcement, investigation and discovery, as well as data exclusivity; and (5) system functioning and related regulations.
Source: Centre For Responsible Enterprise and Trade (CREATE)-PwC US, Organisation for Economic Co-operation and Development (OECD), International Trade Centre, PwC analysis
4.57 4.34
4.09 4.07 4.05 4.00 3.89 3.83 3.61
3.09 2.95
2.76 2.52
2
3
4
5
US JP NZ SG AU UK KR DE MY PE IN RU CN
Sample average:
3.67
Str
onger
World rank and share of E&E exports by TPPA country in 2014
World Rank Country World Share (%)
3 United States 7.22
6 Singapore 5.24
8 Japan 4.37
9 Mexico 3.36
11 Malaysia 2.76
12 Vietnam 1.94
26 Canada 0.57
45 Australia 0.11
Overall Economy
Sectoral Analysis
Thematic Issues
PwC
December 2015
3,244 2,979
3,701 3,782
4,310 4,391 4,746
-
1,000
2,000
3,000
4,000
5,000
2008 2009 2010 2011 2012 2013 2014
Exports of automotive components
Automotive: Components manufacturers to benefit from greater market access; displacement effect on national car manufacturers to be small
27
Economic Impact of the Trans-Pacific Partnership Agreement •
Section 2.3 – Sectoral analysis
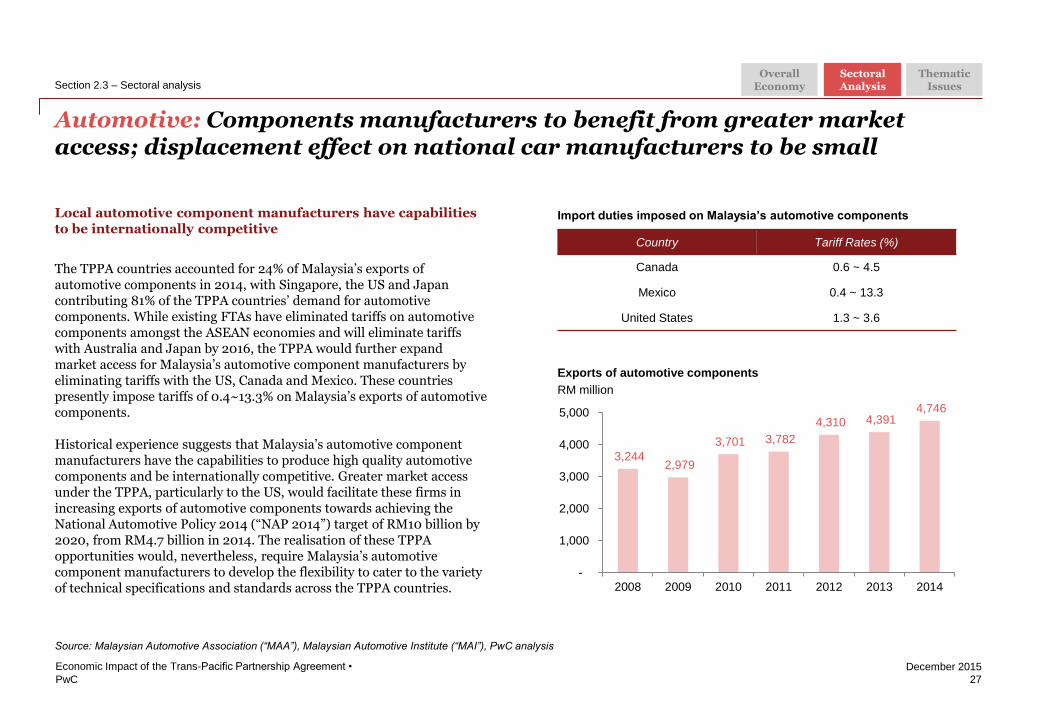
Local automotive component manufacturers have capabilities to be internationally competitive
The TPPA countries accounted for 24% of Malaysia’s exports of automotive components in 2014, with Singapore, the US and Japan contributing 81% of the TPPA countries’ demand for automotive components. While existing FTAs have eliminated tariffs on automotive components amongst the ASEAN economies and will eliminate tariffs with Australia and Japan by 2016, the TPPA would further expand market access for Malaysia’s automotive component manufacturers by eliminating tariffs with the US, Canada and Mexico. These countries presently impose tariffs of 0.4~13.3% on Malaysia’s exports of automotive components.
Historical experience suggests that Malaysia’s automotive component manufacturers have the capabilities to produce high quality automotive components and be internationally competitive. Greater market access under the TPPA, particularly to the US, would facilitate these firms in increasing exports of automotive components towards achieving the National Automotive Policy 2014 (“NAP 2014”) target of RM10 billion by 2020, from RM4.7 billion in 2014. The realisation of these TPPA opportunities would, nevertheless, require Malaysia’s automotive component manufacturers to develop the flexibility to cater to the variety of technical specifications and standards across the TPPA countries.
Source: Malaysian Automotive Association (“MAA”), Malaysian Automotive Institute (“MAI”), PwC analysis
Overall Economy
Sectoral Analysis
Thematic Issues
Import duties imposed on Malaysia’s automotive components
Country Tariff Rates (%)
Canada 0.6 ~ 4.5
Mexico 0.4 ~ 13.3
United States 1.3 ~ 3.6
RM million
PwC
December 2015
28
Economic Impact of the Trans-Pacific Partnership Agreement •
Section 2.3 – Sectoral analysis
Source: Malaysian Automotive Association (“MAA”), Malaysian Automotive Institute (“MAI”), PwC analysis
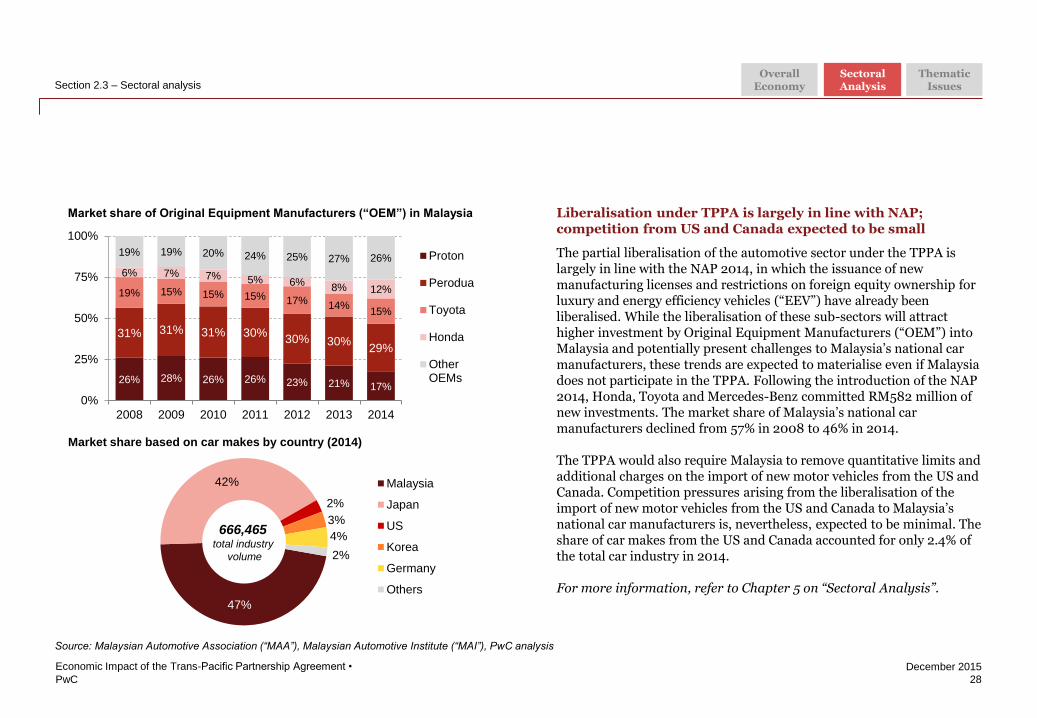
Liberalisation under TPPA is largely in line with NAP; competition from US and Canada expected to be small
The partial liberalisation of the automotive sector under the TPPA is largely in line with the NAP 2014, in which the issuance of new manufacturing licenses and restrictions on foreign equity ownership for luxury and energy efficiency vehicles (“EEV”) have already been liberalised. While the liberalisation of these sub-sectors will attract higher investment by Original Equipment Manufacturers (“OEM”) into Malaysia and potentially present challenges to Malaysia’s national car manufacturers, these trends are expected to materialise even if Malaysia does not participate in the TPPA. Following the introduction of the NAP 2014, Honda, Toyota and Mercedes-Benz committed RM582 million of new investments. The market share of Malaysia’s national car manufacturers declined from 57% in 2008 to 46% in 2014.
The TPPA would also require Malaysia to remove quantitative limits and additional charges on the import of new motor vehicles from the US and Canada. Competition pressures arising from the liberalisation of the import of new motor vehicles from the US and Canada to Malaysia’s national car manufacturers is, nevertheless, expected to be minimal. The share of car makes from the US and Canada accounted for only 2.4% of the total car industry in 2014.
For more information, refer to Chapter 5 on “Sectoral Analysis”.
Overall Economy
Sectoral Analysis
Thematic Issues
26% 28% 26% 26% 23% 21% 17%
31% 31% 31% 30% 30% 30%
29%
19% 15% 15% 15% 17% 14% 15%
6% 7% 7% 5% 6% 8% 12%
19% 19% 20% 24% 25% 27% 26%
0%
25%
50%
75%
100%
2008 2009 2010 2011 2012 2013 2014
Proton
Perodua
Toyota
Honda
OtherOEMs
Market share of Original Equipment Manufacturers (“OEM”) in Malaysia
Market share based on car makes by country (2014)
47%
42%
2%
3%
4%
2%
Malaysia
Japan
US
Korea
Germany
Others
666,465 total industry
volume
PwC
December 2015
Plastics: Firms to benefit from higher export prospects and greater access to cheaper inputs
29
Economic Impact of the Trans-Pacific Partnership Agreement •
Section 2.3 – Sectoral analysis
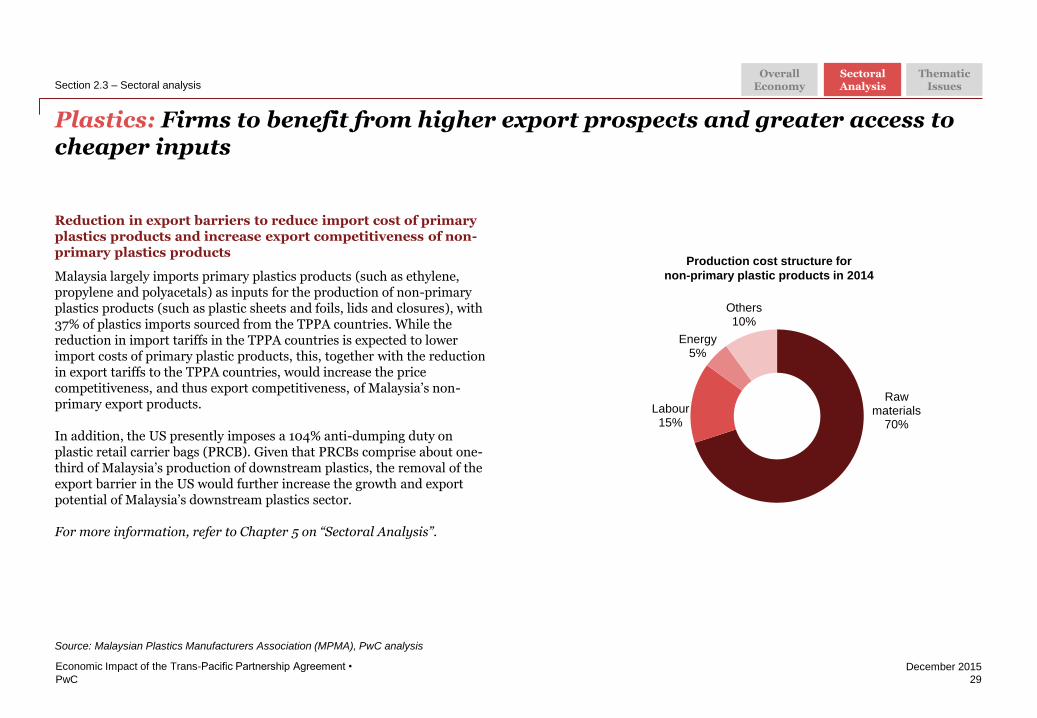
Reduction in export barriers to reduce import cost of primary plastics products and increase export competitiveness of non-primary plastics products
Malaysia largely imports primary plastics products (such as ethylene, propylene and polyacetals) as inputs for the production of non-primary plastics products (such as plastic sheets and foils, lids and closures), with 37% of plastics imports sourced from the TPPA countries. While the reduction in import tariffs in the TPPA countries is expected to lower import costs of primary plastic products, this, together with the reduction in export tariffs to the TPPA countries, would increase the price competitiveness, and thus export competitiveness, of Malaysia’s non-primary export products.
In addition, the US presently imposes a 104% anti-dumping duty on plastic retail carrier bags (PRCB). Given that PRCBs comprise about one-third of Malaysia’s production of downstream plastics, the removal of the export barrier in the US would further increase the growth and export potential of Malaysia’s downstream plastics sector.
For more information, refer to Chapter 5 on “Sectoral Analysis”.
Source: Malaysian Plastics Manufacturers Association (MPMA), PwC analysis
Raw materials
70%
Labour 15%
Energy 5%
Others 10%
Production cost structure for
non-primary plastic products in 2014
Overall Economy
Sectoral Analysis
Thematic Issues
Chapter reference
amended
PwC
December 2015
Wood: Lower trade barriers to enhance firms’ export competitiveness
30
Economic Impact of the Trans-Pacific Partnership Agreement •
Section 2.3 – Sectoral analysis
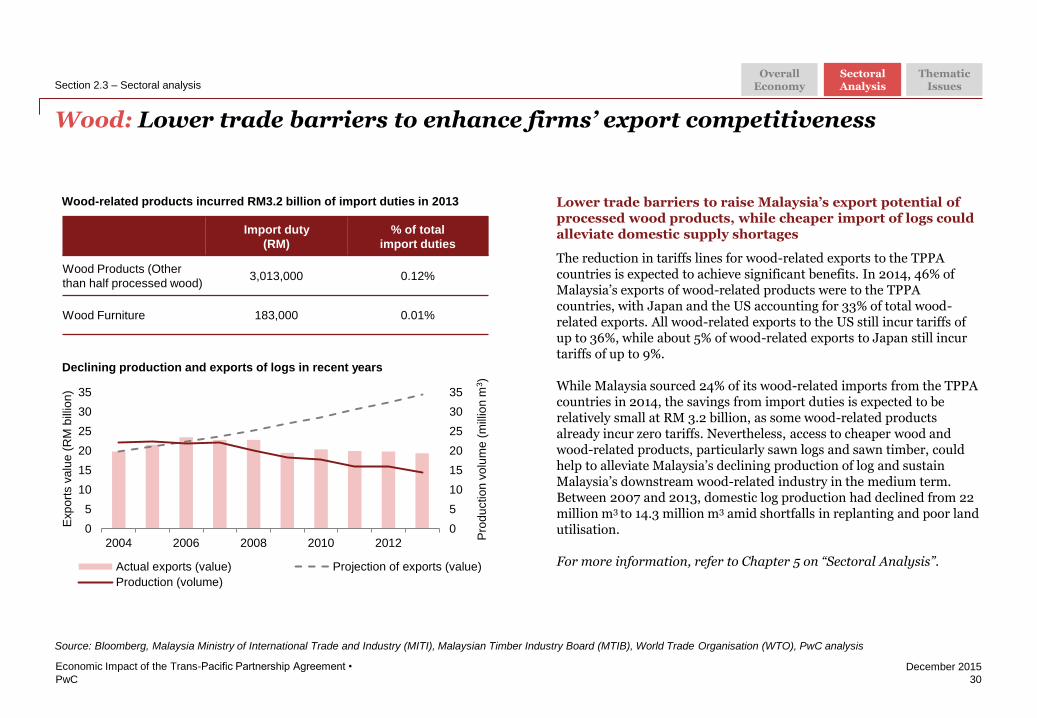
Lower trade barriers to raise Malaysia’s export potential of processed wood products, while cheaper import of logs could alleviate domestic supply shortages
The reduction in tariffs lines for wood-related exports to the TPPA countries is expected to achieve significant benefits. In 2014, 46% of Malaysia’s exports of wood-related products were to the TPPA countries, with Japan and the US accounting for 33% of total wood-related exports. All wood-related exports to the US still incur tariffs of up to 36%, while about 5% of wood-related exports to Japan still incur tariffs of up to 9%.
While Malaysia sourced 24% of its wood-related imports from the TPPA countries in 2014, the savings from import duties is expected to be relatively small at RM 3.2 billion, as some wood-related products already incur zero tariffs. Nevertheless, access to cheaper wood and wood-related products, particularly sawn logs and sawn timber, could help to alleviate Malaysia’s declining production of log and sustain Malaysia’s downstream wood-related industry in the medium term. Between 2007 and 2013, domestic log production had declined from 22 million m3 to 14.3 million m3 amid shortfalls in replanting and poor land utilisation.
For more information, refer to Chapter 5 on “Sectoral Analysis”.
Source: Bloomberg, Malaysia Ministry of International Trade and Industry (MITI), Malaysian Timber Industry Board (MTIB), World Trade Organisation (WTO), PwC analysis
Import duty
(RM)
% of total
import duties
Wood Products (Other
than half processed wood) 3,013,000 0.12%
Wood Furniture 183,000 0.01%
0
5
10
15
20
25
30
35
0
5
10
15
20
25
30
35
2004 2006 2008 2010 2012
Actual exports (value) Projection of exports (value)
Production (volume)
Exp
ort
s v
alu
e (
RM
bill
ion
)
Pro
du
ctio
n v
olu
me
(m
illio
n m
3)
Wood-related products incurred RM3.2 billion of import duties in 2013
Declining production and exports of logs in recent years
Overall Economy
Sectoral Analysis
Thematic Issues
PwC
December 2015
Construction: Specialised contractors to face increased competition; safeguards provide ample transition period to enhance capabilities
31
Economic Impact of the Trans-Pacific Partnership Agreement •
Section 2.3 – Sectoral analysis
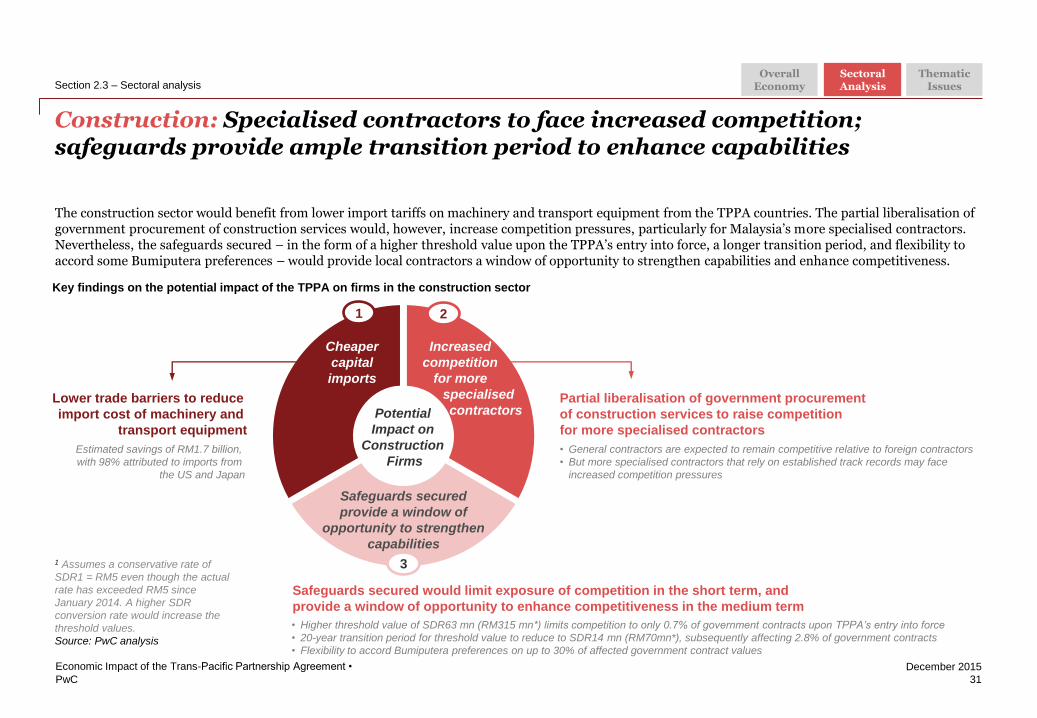
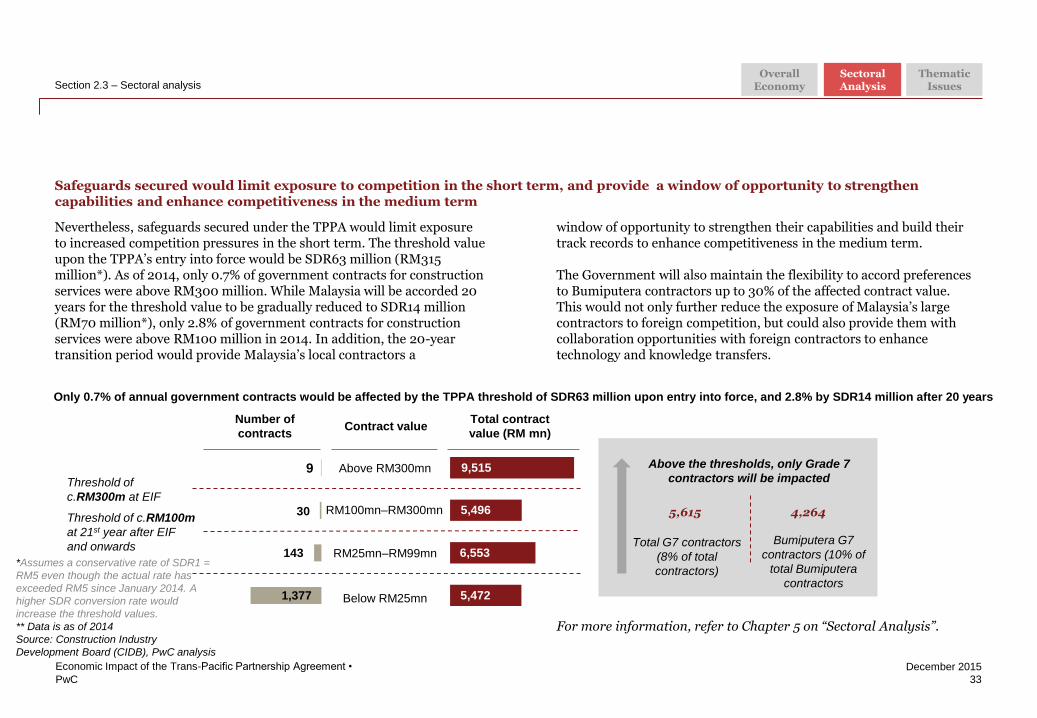
The construction sector would benefit from lower import tariffs on machinery and transport equipment from the TPPA countries. The partial liberalisation of government procurement of construction services would, however, increase competition pressures, particularly for Malaysia’s more specialised contractors. Nevertheless, the safeguards secured – in the form of a higher threshold value upon the TPPA’s entry into force, a longer transition period, and flexibility to accord some Bumiputera preferences – would provide local contractors a window of opportunity to strengthen capabilities and enhance competitiveness.
1 Assumes a conservative rate of
SDR1 = RM5 even though the actual
rate has exceeded RM5 since
January 2014. A higher SDR
conversion rate would increase the
threshold values.
Source: PwC analysis
Key findings on the potential impact of the TPPA on firms in the construction sector
Partial liberalisation of government procurement
of construction services to raise competition
for more specialised contractors
• General contractors are expected to remain competitive relative to foreign contractors
• But more specialised contractors that rely on established track records may face
increased competition pressures
Safeguards secured would limit exposure of competition in the short term, and
provide a window of opportunity to enhance competitiveness in the medium term
• Higher threshold value of SDR63 mn (RM315 mn*) limits competition to only 0.7% of government contracts upon TPPA’s entry into force
• 20-year transition period for threshold value to reduce to SDR14 mn (RM70mn*), subsequently affecting 2.8% of government contracts
• Flexibility to accord Bumiputera preferences on up to 30% of affected government contract values
Potential
Impact on
Construction
Firms
Cheaper
capital
imports
Safeguards secured
provide a window of
opportunity to strengthen
capabilities
Increased
competition
for more
specialised
contractors
1 2
3
Lower trade barriers to reduce
import cost of machinery and
transport equipment
Estimated savings of RM1.7 billion,
with 98% attributed to imports from
the US and Japan
Overall Economy
Sectoral Analysis
Thematic Issues
PwC
December 2015
32
Economic Impact of the Trans-Pacific Partnership Agreement •
Section 2.3 – Sectoral analysis
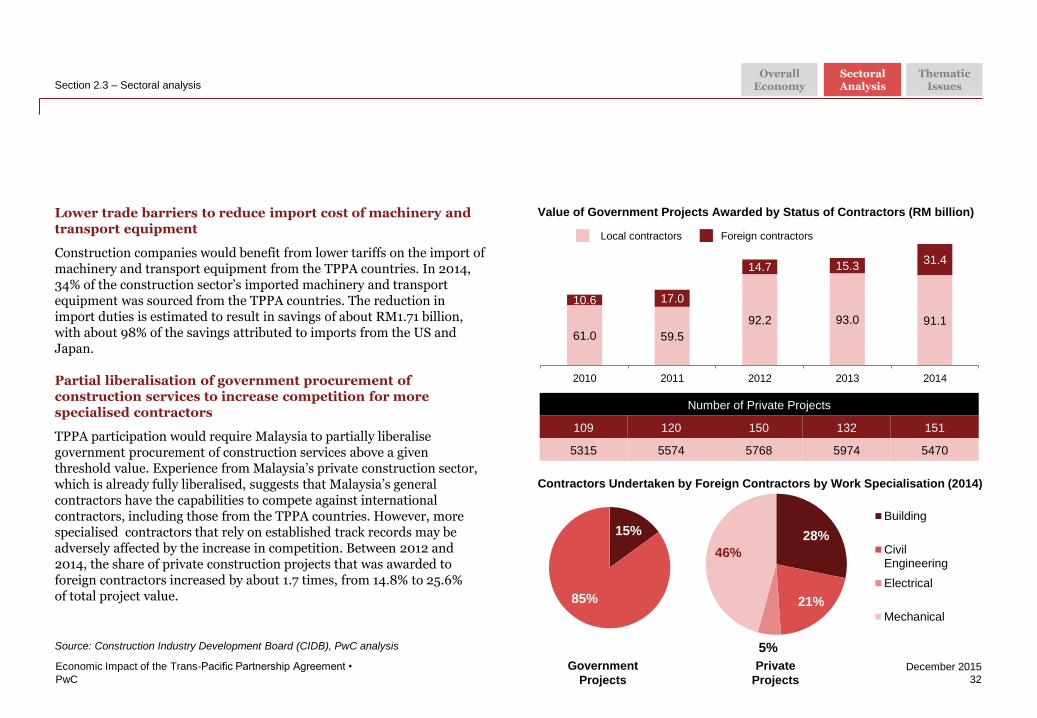
Lower trade barriers to reduce import cost of machinery and transport equipment
Construction companies would benefit from lower tariffs on the import of machinery and transport equipment from the TPPA countries. In 2014, 34% of the construction sector’s imported machinery and transport equipment was sourced from the TPPA countries. The reduction in import duties is estimated to result in savings of about RM1.71 billion, with about 98% of the savings attributed to imports from the US and Japan.
Partial liberalisation of government procurement of construction services to increase competition for more specialised contractors
TPPA participation would require Malaysia to partially liberalise government procurement of construction services above a given threshold value. Experience from Malaysia’s private construction sector, which is already fully liberalised, suggests that Malaysia’s general contractors have the capabilities to compete against international contractors, including those from the TPPA countries. However, more specialised contractors that rely on established track records may be adversely affected by the increase in competition. Between 2012 and 2014, the share of private construction projects that was awarded to foreign contractors increased by about 1.7 times, from 14.8% to 25.6% of total project value.
Source: Construction Industry Development Board (CIDB), PwC analysis
Overall Economy
Sectoral Analysis
Thematic Issues
Local contractors Foreign contractors
Contractors Undertaken by Foreign Contractors by Work Specialisation (2014)
Value of Government Projects Awarded by Status of Contractors (RM billion)
15%
85%
0%
28%
21%
5%
46%
Building
CivilEngineering
Electrical
Mechanical
Government
Projects
Private
Projects
Number of Private Projects
109 120 150 132 151
5315 5574 5768 5974 5470
61.0 59.5
92.2 93.0 91.1
10.6 17.0
14.7 15.3 31.4
2010 2011 2012 2013 2014
PwC
December 2015
Nevertheless, safeguards secured under the TPPA would limit exposure to increased competition pressures in the short term. The threshold value upon the TPPA’s entry into force would be SDR63 million (RM315 million*). As of 2014, only 0.7% of government contracts for construction services were above RM300 million. While Malaysia will be accorded 20 years for the threshold value to be gradually reduced to SDR14 million (RM70 million*), only 2.8% of government contracts for construction services were above RM100 million in 2014. In addition, the 20-year transition period would provide Malaysia’s local contractors a
33
Economic Impact of the Trans-Pacific Partnership Agreement •
Section 2.3 – Sectoral analysis
window of opportunity to strengthen their capabilities and build their track records to enhance competitiveness in the medium term.
The Government will also maintain the flexibility to accord preferences to Bumiputera contractors up to 30% of the affected contract value. This would not only further reduce the exposure of Malaysia’s large contractors to foreign competition, but could also provide them with collaboration opportunities with foreign contractors to enhance technology and knowledge transfers.
For more information, refer to Chapter 5 on “Sectoral Analysis”.
*Assumes a conservative rate of SDR1 =
RM5 even though the actual rate has
exceeded RM5 since January 2014. A
higher SDR conversion rate would
increase the threshold values.
** Data is as of 2014
Source: Construction Industry
Development Board (CIDB), PwC analysis
Overall Economy
Sectoral Analysis
Thematic Issues
Only 0.7% of annual government contracts would be affected by the TPPA threshold of SDR63 million upon entry into force, and 2.8% by SDR14 million after 20 years
Above RM300mn 9
RM100mn–RM300mn
RM25mn–RM99mn
Below RM25mn
Number of
contracts
Total contract
value (RM mn)
143
1,377
30
Contract value
9,515
5,496
6,553
5,472
Threshold of c.RM100m
at 21st year after EIF
and onwards
Threshold of
c.RM300m at EIF
Above the thresholds, only Grade 7
contractors will be impacted
5,615 4,264
Total G7 contractors
(8% of total
contractors)
Bumiputera G7
contractors (10% of
total Bumiputera
contractors
Safeguards secured would limit exposure to competition in the short term, and provide a window of opportunity to strengthen capabilities and enhance competitiveness in the medium term
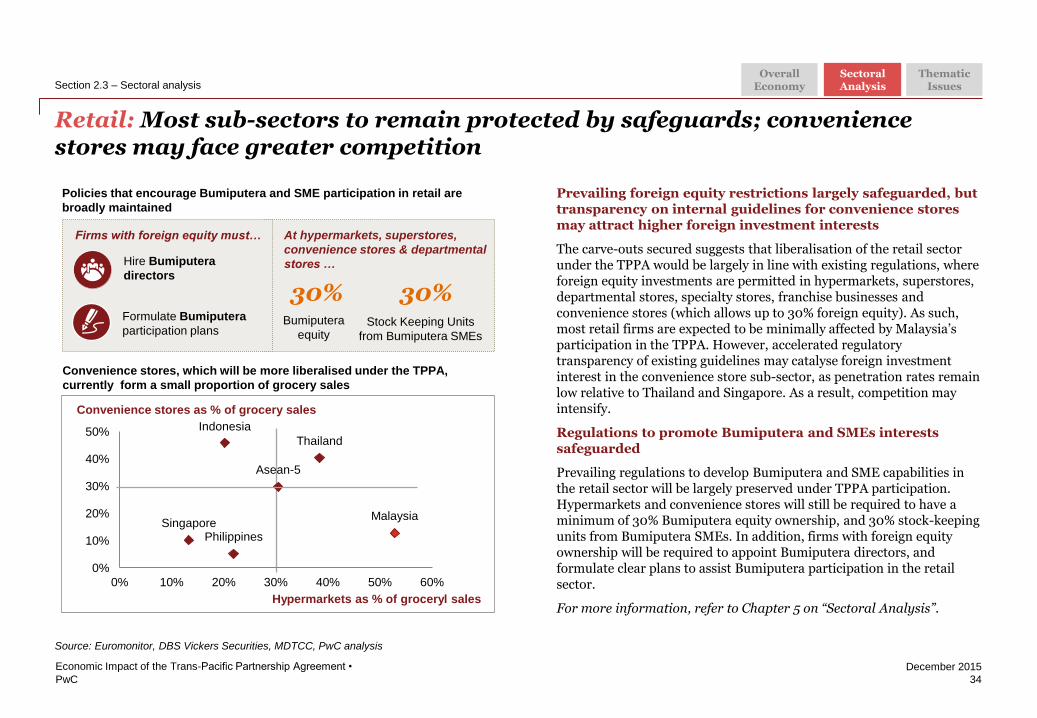
PwC
December 2015
Retail: Most sub-sectors to remain protected by safeguards; convenience stores may face greater competition
34
Economic Impact of the Trans-Pacific Partnership Agreement •
Section 2.3 – Sectoral analysis
Prevailing foreign equity restrictions largely safeguarded, but transparency on internal guidelines for convenience stores may attract higher foreign investment interests
The carve-outs secured suggests that liberalisation of the retail sector under the TPPA would be largely in line with existing regulations, where foreign equity investments are permitted in hypermarkets, superstores, departmental stores, specialty stores, franchise businesses and convenience stores (which allows up to 30% foreign equity). As such, most retail firms are expected to be minimally affected by Malaysia’s participation in the TPPA. However, accelerated regulatory transparency of existing guidelines may catalyse foreign investment interest in the convenience store sub-sector, as penetration rates remain low relative to Thailand and Singapore. As a result, competition may intensify.
Regulations to promote Bumiputera and SMEs interests safeguarded
Prevailing regulations to develop Bumiputera and SME capabilities in the retail sector will be largely preserved under TPPA participation. Hypermarkets and convenience stores will still be required to have a minimum of 30% Bumiputera equity ownership, and 30% stock-keeping units from Bumiputera SMEs. In addition, firms with foreign equity ownership will be required to appoint Bumiputera directors, and formulate clear plans to assist Bumiputera participation in the retail sector.
For more information, refer to Chapter 5 on “Sectoral Analysis”.
Policies that encourage Bumiputera and SME participation in retail are
broadly maintained
Source: Euromonitor, DBS Vickers Securities, MDTCC, PwC analysis
Indonesia
Malaysia
Philippines Singapore
Thailand
Asean-5
0%
10%
20%
30%
40%
50%
0% 10% 20% 30% 40% 50% 60%
Convenience stores as % of grocery sales
Hypermarkets as % of groceryl sales
Convenience stores, which will be more liberalised under the TPPA,
currently form a small proportion of grocery sales
Firms with foreign equity must…
Hire Bumiputera
directors
Formulate Bumiputera
participation plans
At hypermarkets, superstores,
convenience stores & departmental
stores …
30% 30% Bumiputera
equity Stock Keeping Units
from Bumiputera SMEs
Overall Economy
Sectoral Analysis
Thematic Issues
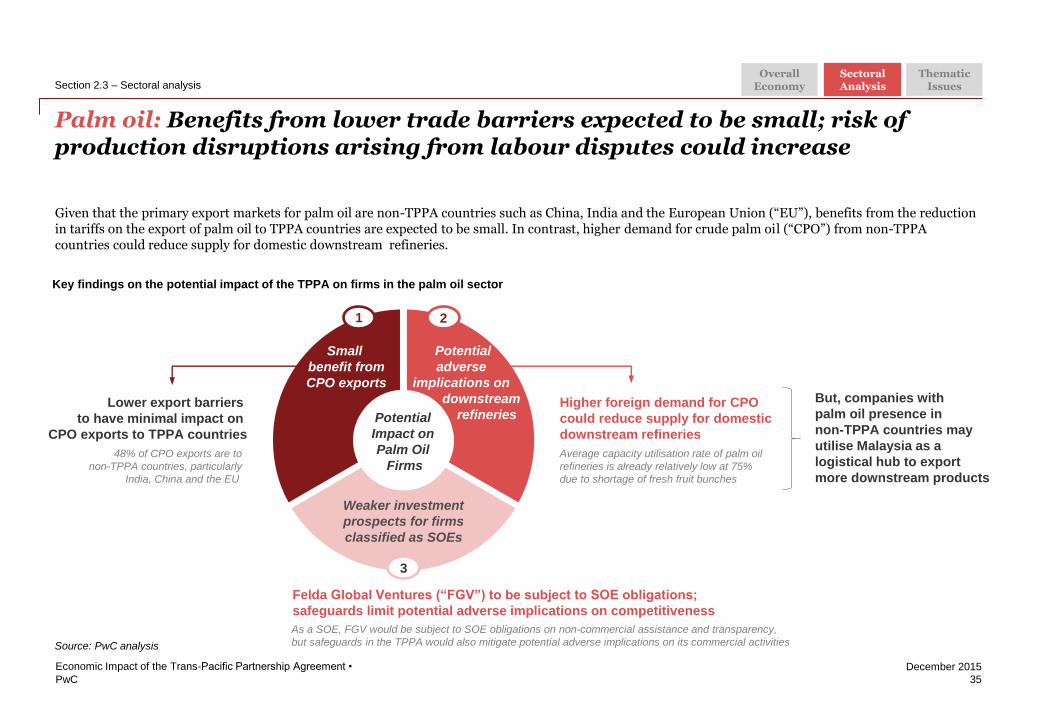
PwC
December 2015
Palm oil: Benefits from lower trade barriers expected to be small; risk of production disruptions arising from labour disputes could increase
35
Economic Impact of the Trans-Pacific Partnership Agreement •
Section 2.3 – Sectoral analysis
Given that the primary export markets for palm oil are non-TPPA countries such as China, India and the European Union (“EU”), benefits from the reduction in tariffs on the export of palm oil to TPPA countries are expected to be small. In contrast, higher demand for crude palm oil (“CPO”) from non-TPPA countries could reduce supply for domestic downstream refineries.
Source: PwC analysis
Key findings on the potential impact of the TPPA on firms in the palm oil sector
Higher foreign demand for CPO
could reduce supply for domestic
downstream refineries
Average capacity utilisation rate of palm oil
refineries is already relatively low at 75%
due to shortage of fresh fruit bunches
Felda Global Ventures (“FGV”) to be subject to SOE obligations;
safeguards limit potential adverse implications on competitiveness
As a SOE, FGV would be subject to SOE obligations on non-commercial assistance and transparency,
but safeguards in the TPPA would also mitigate potential adverse implications on its commercial activities
Potential
Impact on
Palm Oil
Firms
Small
benefit from
CPO exports
Weaker investment
prospects for firms
classified as SOEs
Potential
adverse
implications on
downstream
refineries
1 2
3
Lower export barriers
to have minimal impact on
CPO exports to TPPA countries
48% of CPO exports are to
non-TPPA countries, particularly
India, China and the EU
But, companies with
palm oil presence in
non-TPPA countries may
utilise Malaysia as a
logistical hub to export
more downstream products
Overall Economy
Sectoral Analysis
Thematic Issues
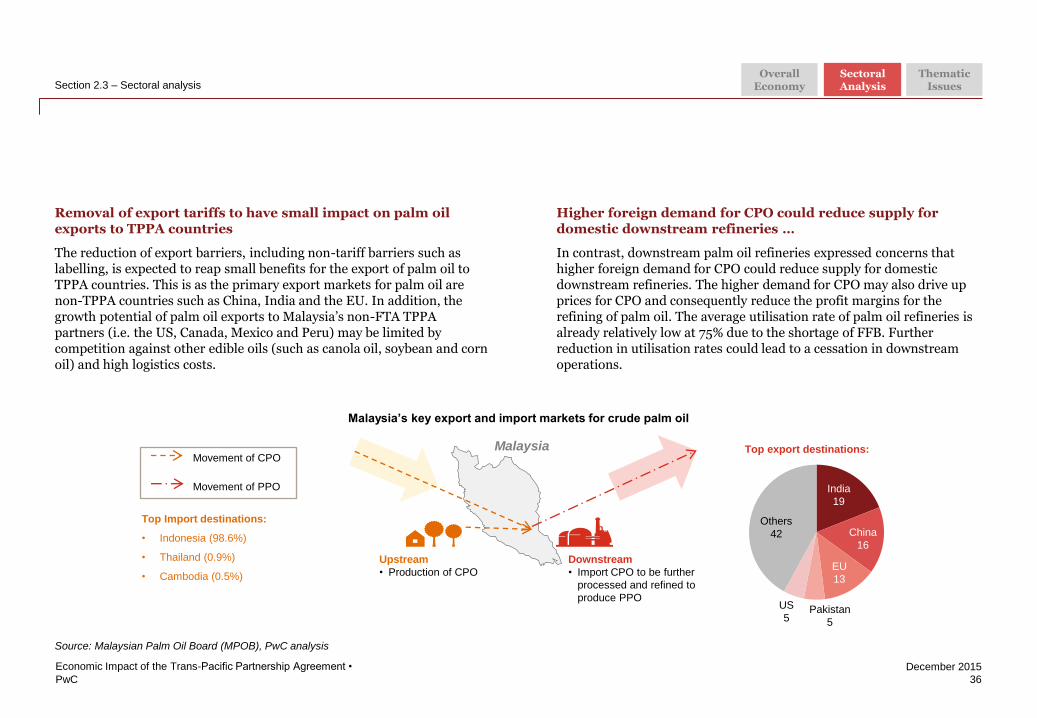
PwC
December 2015
36
Economic Impact of the Trans-Pacific Partnership Agreement •
Section 2.3 – Sectoral analysis
Removal of export tariffs to have small impact on palm oil exports to TPPA countries
The reduction of export barriers, including non-tariff barriers such as labelling, is expected to reap small benefits for the export of palm oil to TPPA countries. This is as the primary export markets for palm oil are non-TPPA countries such as China, India and the EU. In addition, the growth potential of palm oil exports to Malaysia’s non-FTA TPPA partners (i.e. the US, Canada, Mexico and Peru) may be limited by competition against other edible oils (such as canola oil, soybean and corn oil) and high logistics costs.
Higher foreign demand for CPO could reduce supply for domestic downstream refineries …
In contrast, downstream palm oil refineries expressed concerns that higher foreign demand for CPO could reduce supply for domestic downstream refineries. The higher demand for CPO may also drive up prices for CPO and consequently reduce the profit margins for the refining of palm oil. The average utilisation rate of palm oil refineries is already relatively low at 75% due to the shortage of FFB. Further reduction in utilisation rates could lead to a cessation in downstream operations.
Source: Malaysian Palm Oil Board (MPOB), PwC analysis
Upstream
• Production of CPO
Downstream
• Import CPO to be further
processed and refined to
produce PPO
Malaysia
Top Import destinations:
• Indonesia (98.6%)
• Thailand (0.9%)
• Cambodia (0.5%)
Top export destinations: Movement of CPO
Movement of PPO
Malaysia’s key export and import markets for crude palm oil
India
19
China
16
EU
13
Others
42
Pakistan
5
US
5
Overall Economy
Sectoral Analysis
Thematic Issues
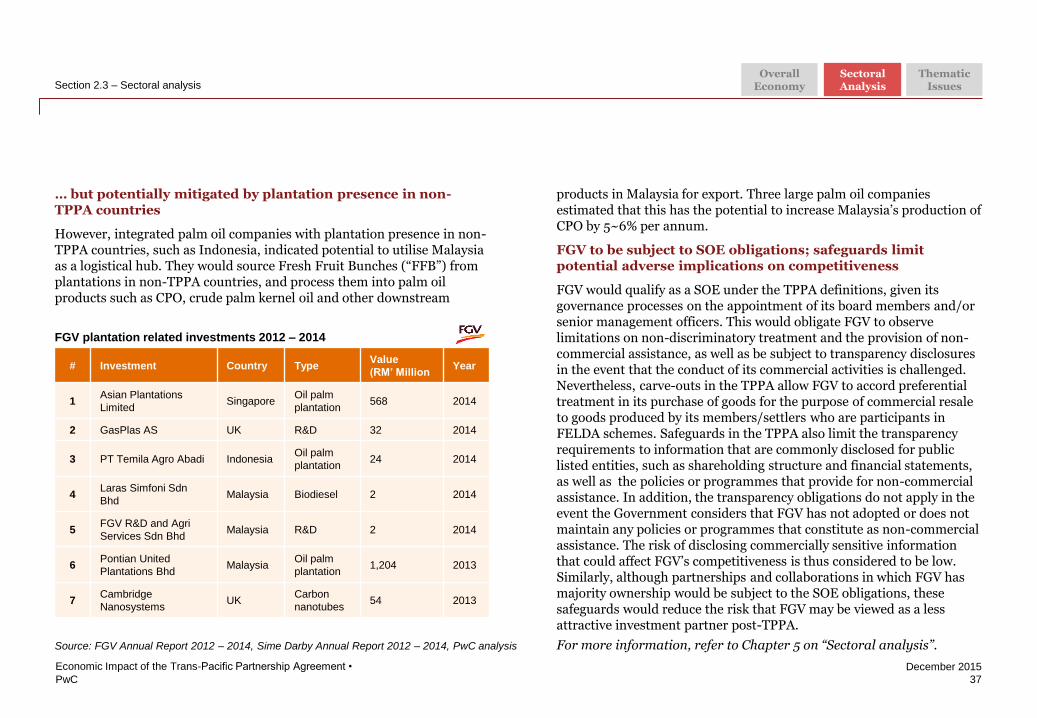
PwC
December 2015
FGV plantation related investments 2012 – 2014
37
Economic Impact of the Trans-Pacific Partnership Agreement •
Section 2.3 – Sectoral analysis
products in Malaysia for export. Three large palm oil companies estimated that this has the potential to increase Malaysia’s production of CPO by 5~6% per annum.
FGV to be subject to SOE obligations; safeguards limit potential adverse implications on competitiveness
FGV would qualify as a SOE under the TPPA definitions, given its governance processes on the appointment of its board members and/or senior management officers. This would obligate FGV to observe limitations on non-discriminatory treatment and the provision of non-commercial assistance, as well as be subject to transparency disclosures in the event that the conduct of its commercial activities is challenged. Nevertheless, carve-outs in the TPPA allow FGV to accord preferential treatment in its purchase of goods for the purpose of commercial resale to goods produced by its members/settlers who are participants in FELDA schemes. Safeguards in the TPPA also limit the transparency requirements to information that are commonly disclosed for public listed entities, such as shareholding structure and financial statements, as well as the policies or programmes that provide for non-commercial assistance. In addition, the transparency obligations do not apply in the event the Government considers that FGV has not adopted or does not maintain any policies or programmes that constitute as non-commercial assistance. The risk of disclosing commercially sensitive information that could affect FGV’s competitiveness is thus considered to be low. Similarly, although partnerships and collaborations in which FGV has majority ownership would be subject to the SOE obligations, these safeguards would reduce the risk that FGV may be viewed as a less attractive investment partner post-TPPA.
For more information, refer to Chapter 5 on “Sectoral analysis”. Source: FGV Annual Report 2012 – 2014, Sime Darby Annual Report 2012 – 2014, PwC analysis
# Investment Country Type Value
(RM’ Million Year
1 Asian Plantations
Limited Singapore
Oil palm
plantation 568 2014
2 GasPlas AS UK R&D 32 2014
3 PT Temila Agro Abadi Indonesia Oil palm
plantation 24 2014
4 Laras Simfoni Sdn
Bhd Malaysia Biodiesel 2 2014
5 FGV R&D and Agri
Services Sdn Bhd Malaysia R&D 2 2014
6 Pontian United
Plantations Bhd Malaysia
Oil palm
plantation 1,204 2013
7 Cambridge
Nanosystems UK
Carbon
nanotubes 54 2013
Overall Economy
Sectoral Analysis
Thematic Issues
… but potentially mitigated by plantation presence in non-TPPA countries
However, integrated palm oil companies with plantation presence in non-TPPA countries, such as Indonesia, indicated potential to utilise Malaysia as a logistical hub. They would source Fresh Fruit Bunches (“FFB”) from plantations in non-TPPA countries, and process them into palm oil products such as CPO, crude palm kernel oil and other downstream
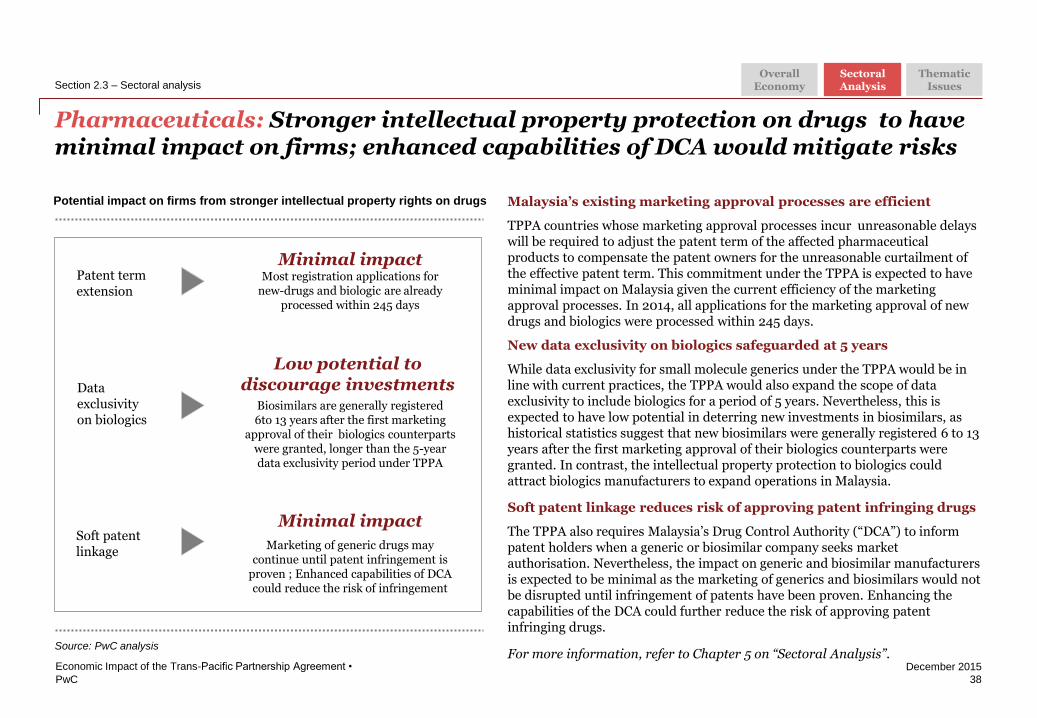
PwC
December 2015
Pharmaceuticals: Stronger intellectual property protection on drugs to have minimal impact on firms; enhanced capabilities of DCA would mitigate risks
38
Economic Impact of the Trans-Pacific Partnership Agreement •
Section 2.3 – Sectoral analysis
Malaysia’s existing marketing approval processes are efficient
TPPA countries whose marketing approval processes incur unreasonable delays will be required to adjust the patent term of the affected pharmaceutical products to compensate the patent owners for the unreasonable curtailment of the effective patent term. This commitment under the TPPA is expected to have minimal impact on Malaysia given the current efficiency of the marketing approval processes. In 2014, all applications for the marketing approval of new drugs and biologics were processed within 245 days.
New data exclusivity on biologics safeguarded at 5 years
While data exclusivity for small molecule generics under the TPPA would be in line with current practices, the TPPA would also expand the scope of data exclusivity to include biologics for a period of 5 years. Nevertheless, this is expected to have low potential in deterring new investments in biosimilars, as historical statistics suggest that new biosimilars were generally registered 6 to 13 years after the first marketing approval of their biologics counterparts were granted. In contrast, the intellectual property protection to biologics could attract biologics manufacturers to expand operations in Malaysia.
Soft patent linkage reduces risk of approving patent infringing drugs
The TPPA also requires Malaysia’s Drug Control Authority (“DCA”) to inform patent holders when a generic or biosimilar company seeks market authorisation. Nevertheless, the impact on generic and biosimilar manufacturers is expected to be minimal as the marketing of generics and biosimilars would not be disrupted until infringement of patents have been proven. Enhancing the capabilities of the DCA could further reduce the risk of approving patent infringing drugs.
For more information, refer to Chapter 5 on “Sectoral Analysis”.
Source: PwC analysis
Potential impact on firms from stronger intellectual property rights on drugs
Most registration applications for new-drugs and biologic are already
processed within 245 days
Low potential to discourage investments
Biosimilars are generally registered 6to 13 years after the first marketing
approval of their biologics counterparts were granted, longer than the 5-year data exclusivity period under TPPA
Patent term extension
Data exclusivity on biologics
Minimal impact
Marketing of generic drugs may continue until patent infringement is
proven ; Enhanced capabilities of DCA could reduce the risk of infringement
Soft patent linkage
Minimal impact
Overall Economy
Sectoral Analysis
Thematic Issues

PwC
December 2015
O&G: Safeguards largely preserve PETRONAS’ ability to drive sectoral growth and contribute to nation building; but 12 goods and services to face increased competition and flexibility to accord local preferences to be capped
39
Economic Impact of the Trans-Pacific Partnership Agreement •
Section 2.3 – Sectoral analysis
1 With regard to PDA 1974, the intent of the TPPA provisions in Annex I is that the Prime Minister preserves his authority to continue regulating the industry, but regulations will not be made more
restrictive especially with regard to foreign equity holding.
Source: PwC analysis
Benefits from lower trade barriers would likely be small given that most tariffs for the export of petroleum-related products are already at or close to zero. Safeguards that largely preserve PETRONAS’ rights vested in the Petroleum Development Act 1974 (“PDA 1974”) would allow PETRONAS to continue driving the sector’s growth and contribute to broader nation-building agendas, except in 12 goods and services1. While some domestic firms may face greater direct competition from foreign participation, measures can be undertaken to strengthen their competitiveness during the transition period. Furthermore, stronger investor protection could spur higher foreign investment by Malaysian firms in the TPPA countries.
Key findings on the potential impact of the TPPA on the O&G sector
Pending
PETRONAS
Potential Impact of the TPPA
on the O&G sector
Most tariffs for export of petroleum-related
products are already at or close to zero
• In addition, 74% of PETRONAS’
exports are to non-TPPA countries
PETRONAS maintains rights to determine
contractual arrangements for foreign
participation, except in 12 goods & services
• Nevertheless, the 12 goods and services are
already dominated by foreign participation
PETRONAS can accord local preferential
treatment, but only up to given thresholds
• Some local firms may face greater direct competition
• Measures to strengthen capabilities and
competitiveness could include industry
consolidation during transition period
Stronger investor protection to support and
spur growing investments in TPPA countries
• 5 out of 12 countries where PETRONAS has
foreign presence are TPPA countries
• Malaysian O&G firms have increased operational
presence in TPPA countries in recent years
1
4
2
3
Overall Economy
Sectoral Analysis
Thematic Issues
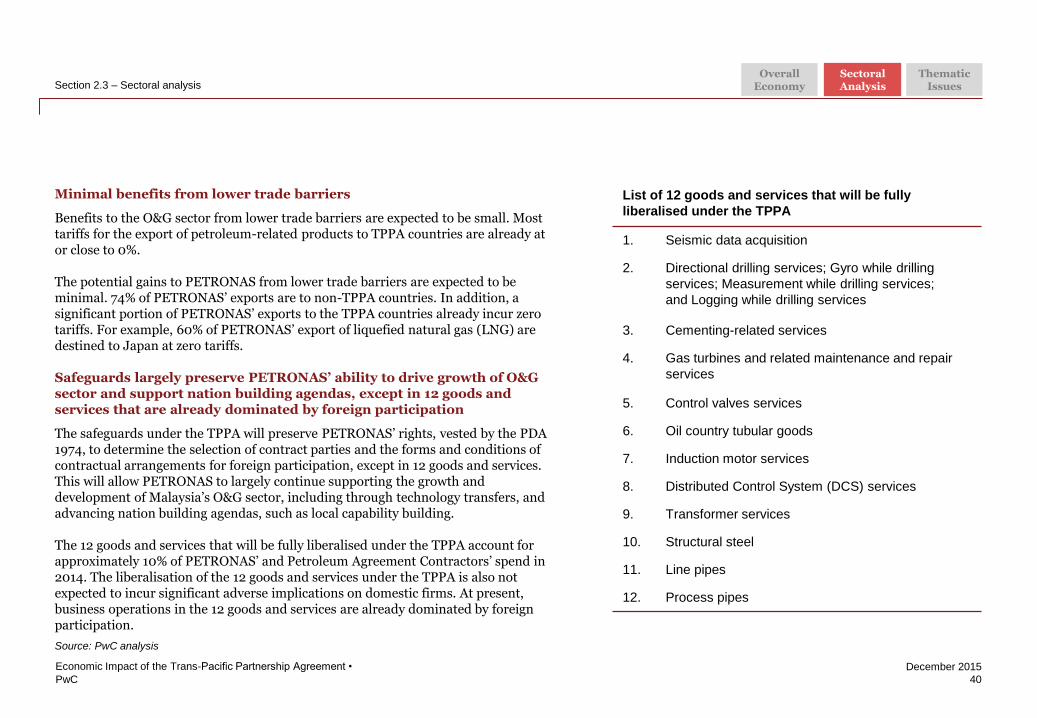
PwC
December 2015
40
Economic Impact of the Trans-Pacific Partnership Agreement •
Section 2.3 – Sectoral analysis
Minimal benefits from lower trade barriers
Benefits to the O&G sector from lower trade barriers are expected to be small. Most tariffs for the export of petroleum-related products to TPPA countries are already at or close to 0%.
The potential gains to PETRONAS from lower trade barriers are expected to be minimal. 74% of PETRONAS’ exports are to non-TPPA countries. In addition, a significant portion of PETRONAS’ exports to the TPPA countries already incur zero tariffs. For example, 60% of PETRONAS’ export of liquefied natural gas (LNG) are destined to Japan at zero tariffs.
Safeguards largely preserve PETRONAS’ ability to drive growth of O&G sector and support nation building agendas, except in 12 goods and services that are already dominated by foreign participation
The safeguards under the TPPA will preserve PETRONAS’ rights, vested by the PDA 1974, to determine the selection of contract parties and the forms and conditions of contractual arrangements for foreign participation, except in 12 goods and services. This will allow PETRONAS to largely continue supporting the growth and development of Malaysia’s O&G sector, including through technology transfers, and advancing nation building agendas, such as local capability building.
The 12 goods and services that will be fully liberalised under the TPPA account for approximately 10% of PETRONAS’ and Petroleum Agreement Contractors’ spend in 2014. The liberalisation of the 12 goods and services under the TPPA is also not expected to incur significant adverse implications on domestic firms. At present, business operations in the 12 goods and services are already dominated by foreign participation.
Source: PwC analysis
List of 12 goods and services that will be fully
liberalised under the TPPA
1. Seismic data acquisition
2. Directional drilling services; Gyro while drilling
services; Measurement while drilling services;
and Logging while drilling services
3. Cementing-related services
4. Gas turbines and related maintenance and repair
services
5. Control valves services
6. Oil country tubular goods
7. Induction motor services
8. Distributed Control System (DCS) services
9. Transformer services
10. Structural steel
11. Line pipes
12. Process pipes
Overall Economy
Sectoral Analysis
Thematic Issues
PwC
December 2015
41
Economic Impact of the Trans-Pacific Partnership Agreement •
Section 2.3 – Sectoral analysis
Maximum threshold on the accord of local preferential treatment could increase competition for domestic firms
Safeguards under TPPA allow PETRONAS to accord preferences to Malaysian firms in its purchase of goods and services in Malaysia, except for the 12 goods and services, up to the following thresholds:
• Downstream activities: No more than 40% of the total value of the annual budget for the purchase of goods and services for commercial activities in Malaysia upon the TPPA’s entry into force; and
• Upstream activities No more than 70% of the total value of the annual budget for the purchase of goods and services for commercial activities in Malaysia upon signing the TPPA; with a gradual decline to 40% by the sixth year of signing the TPPA.
As of 2014, PETRONAS contracted approximately 70% of its purchase of goods and services for commercial activities in Malaysia to majority Bumiputera companies. The total sum of contracts awarded to majority Bumiputera companies, nevertheless, does not distinguish between companies that were capable of winning open tender bids on merit and those that were provided local preferential treatment to advance capacity building agendas. It, therefore, remains to be seen if the respective maximum thresholds to accord local preferential treatment remain sufficient. In the event that the current award of local preferential treatment exceeds the respective maximum thresholds, some Malaysian firms in the O&G sector will likely face greater direct competition from foreign participation. Measures to strengthen the capabilities of domestic firms will be critical to sustain local competitiveness. This could potentially involve some consolidation within the industry during the transition period.
Source: PwC analysis
Stronger investor protection for investments in TPPA countries could spur higher investment in TPPA countries
Provisions in the investment chapter of the TPPA commit that the repatriation of profit, capital and payments should not be delayed or prevented, except in the circumstances when temporary safeguards are implemented to manage serious balance of payments concerns. In addition, the ISDS mechanisms in the TPPA provide a transparent legal framework that sets out investment norms and protection for investments in the respective TPPA countries.
The increase in investor protection will provide PETRONAS greater security for its investments in the TPPA countries. At present, 5 out of the 12 countries where PETRONAS has foreign operational presence are TPPA countries.
The stronger investment protection mechanism under the TPPA will also support, and potentially further spur, the growing investments by Malaysian firms in the O&G sectors of the TPPA countries. For example, a Malaysian O&G company was recently awarded a contract valued at about USD100 million in Mexico to install structures for fixed marine platforms, pipe laying and the lifting of major power generations. An integrated Malaysian O&G company also invested USD400 million in Vietnam in 2014 by acquiring a 50% stake in 3 upstream profit-sharing contracts (“PSC”), as well as acquired an Australian marine construction and offshore engineering operation for RM400 million in 2011 to expand its operations in sub-sea and deep water segments. Malaysia’s largest Offshore Support Vessel operator also launched a floating production storage and offloading vessel in Australia at a contract value of RM1.46 billion in 2011.
For more information, refer to Chapter 5 on “Sectoral Analysis”.
Overall Economy
Sectoral Analysis
Thematic Issues
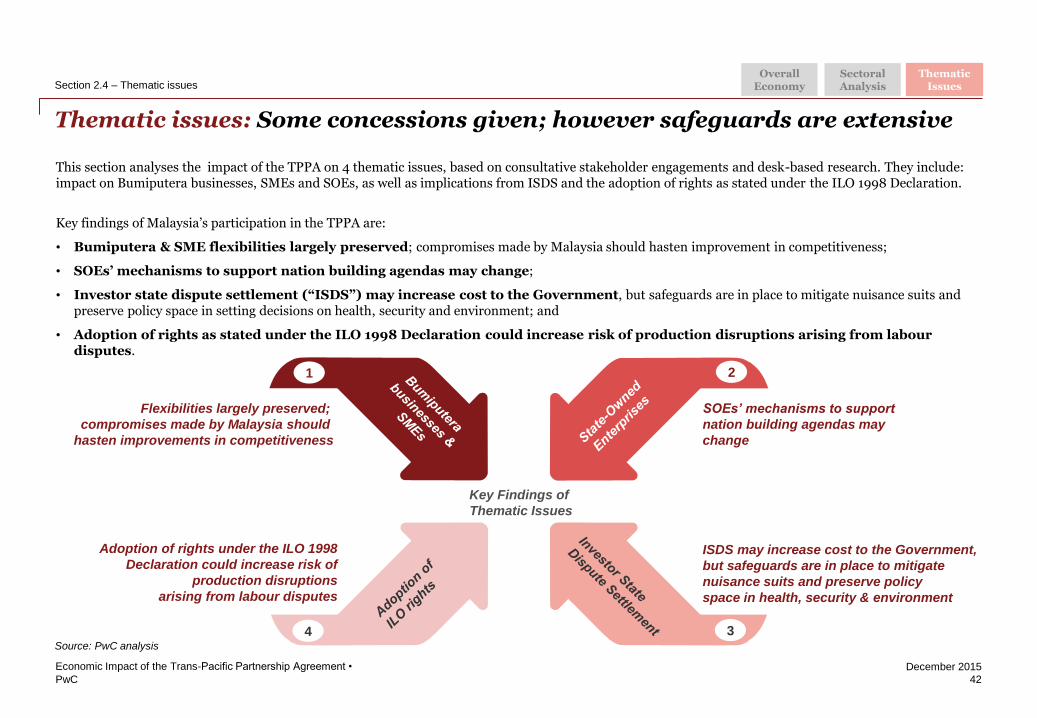
PwC
December 2015
Thematic issues: Some concessions given; however safeguards are extensive
42
Economic Impact of the Trans-Pacific Partnership Agreement •
Section 2.4 – Thematic issues
Source: PwC analysis
Overall Economy
Sectoral Analysis
Thematic Issues
This section analyses the impact of the TPPA on 4 thematic issues, based on consultative stakeholder engagements and desk-based research. They include: impact on Bumiputera businesses, SMEs and SOEs, as well as implications from ISDS and the adoption of rights as stated under the ILO 1998 Declaration.
Key findings of Malaysia’s participation in the TPPA are:
• Bumiputera & SME flexibilities largely preserved; compromises made by Malaysia should hasten improvement in competitiveness;
• SOEs’ mechanisms to support nation building agendas may change;
• Investor state dispute settlement (“ISDS”) may increase cost to the Government, but safeguards are in place to mitigate nuisance suits and preserve policy space in setting decisions on health, security and environment; and
• Adoption of rights as stated under the ILO 1998 Declaration could increase risk of production disruptions arising from labour disputes.
Key Findings of
Thematic Issues
Flexibilities largely preserved;
compromises made by Malaysia should
hasten improvements in competitiveness
SOEs’ mechanisms to support
nation building agendas may
change
ISDS may increase cost to the Government,
but safeguards are in place to mitigate
nuisance suits and preserve policy
space in health, security & environment
Adoption of rights under the ILO 1998
Declaration could increase risk of
production disruptions
arising from labour disputes
1
4
2
3
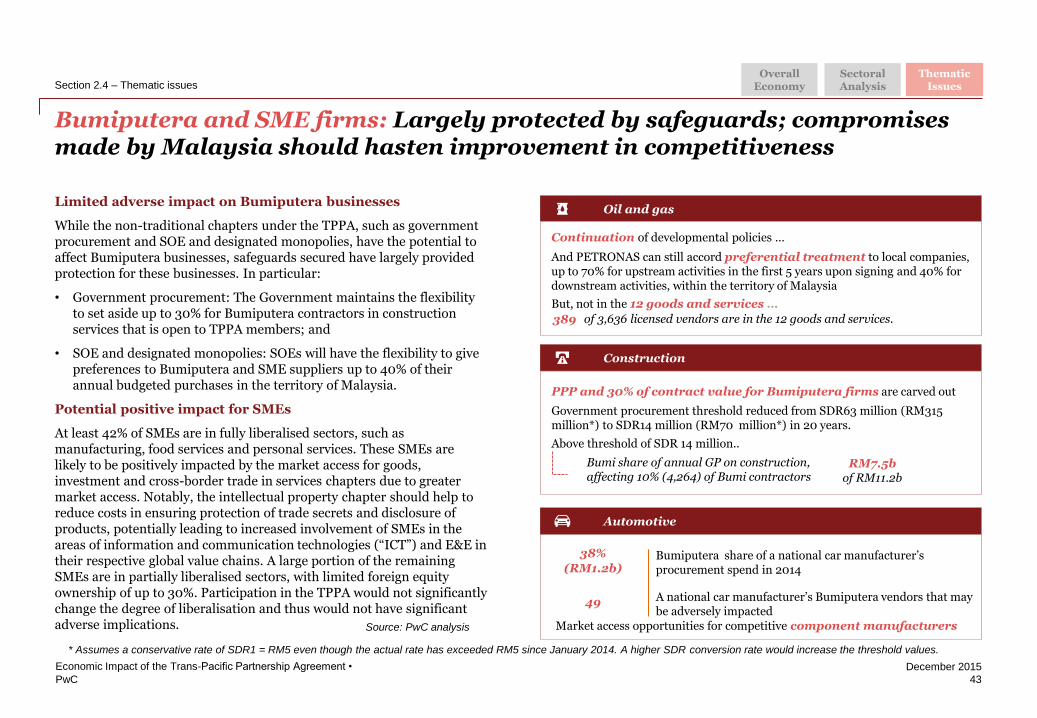
PwC
December 2015
Bumiputera and SME firms: Largely protected by safeguards; compromises made by Malaysia should hasten improvement in competitiveness
43
Economic Impact of the Trans-Pacific Partnership Agreement •
Section 2.4 – Thematic issues
Limited adverse impact on Bumiputera businesses
While the non-traditional chapters under the TPPA, such as government procurement and SOE and designated monopolies, have the potential to affect Bumiputera businesses, safeguards secured have largely provided protection for these businesses. In particular:
• Government procurement: The Government maintains the flexibility to set aside up to 30% for Bumiputera contractors in construction services that is open to TPPA members; and
• SOE and designated monopolies: SOEs will have the flexibility to give preferences to Bumiputera and SME suppliers up to 40% of their annual budgeted purchases in the territory of Malaysia.
Potential positive impact for SMEs
At least 42% of SMEs are in fully liberalised sectors, such as manufacturing, food services and personal services. These SMEs are likely to be positively impacted by the market access for goods, investment and cross-border trade in services chapters due to greater market access. Notably, the intellectual property chapter should help to reduce costs in ensuring protection of trade secrets and disclosure of products, potentially leading to increased involvement of SMEs in the areas of information and communication technologies (“ICT”) and E&E in their respective global value chains. A large portion of the remaining SMEs are in partially liberalised sectors, with limited foreign equity ownership of up to 30%. Participation in the TPPA would not significantly change the degree of liberalisation and thus would not have significant adverse implications.
Overall Economy
Sectoral Analysis
Thematic Issues
Oil and gas
Construction
Automotive
Continuation of developmental policies …
And PETRONAS can still accord preferential treatment to local companies, up to 70% for upstream activities in the first 5 years upon signing and 40% for downstream activities, within the territory of Malaysia
But, not in the 12 goods and services …
389 of 3,636 licensed vendors are in the 12 goods and services.
Government procurement threshold reduced from SDR63 million (RM315 million*) to SDR14 million (RM70 million*) in 20 years.
Above threshold of SDR 14 million..
RM7.5b of RM11.2b
Bumi share of annual GP on construction, affecting 10% (4,264) of Bumi contractors
PPP and 30% of contract value for Bumiputera firms are carved out
A national car manufacturer’s Bumiputera vendors that may be adversely impacted
49
Bumiputera share of a national car manufacturer’s procurement spend in 2014 (RM1.2b)
Market access opportunities for competitive component manufacturers
38%
Source: PwC analysis
* Assumes a conservative rate of SDR1 = RM5 even though the actual rate has exceeded RM5 since January 2014. A higher SDR conversion rate would increase the threshold values.
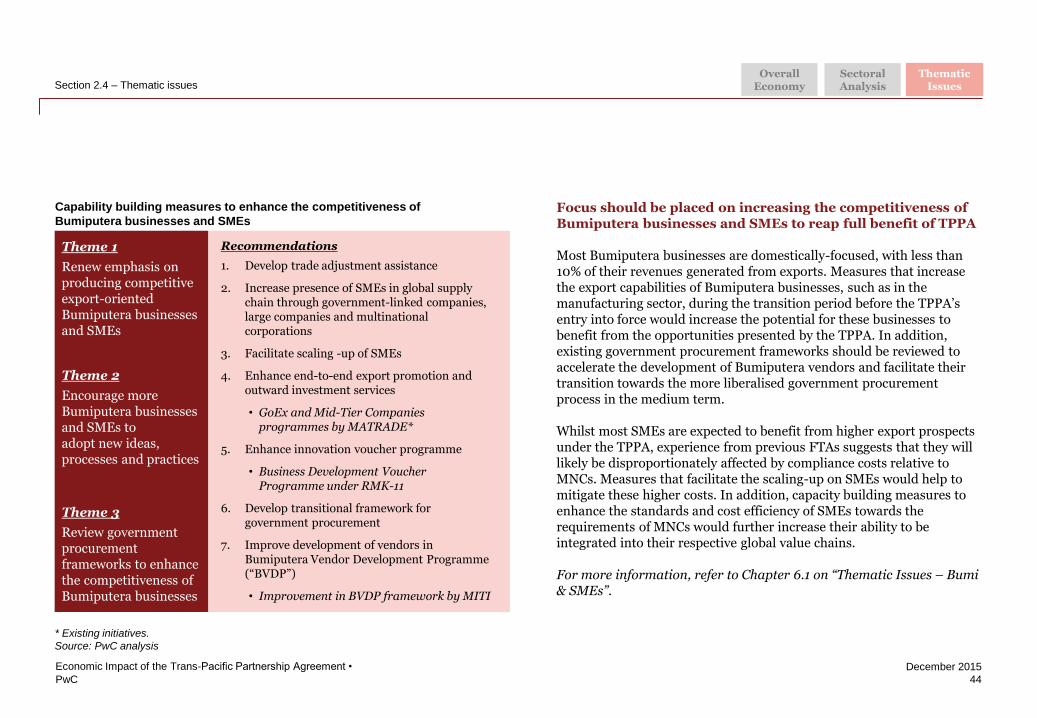
PwC
December 2015
44
Economic Impact of the Trans-Pacific Partnership Agreement •
Section 2.4 – Thematic issues
Focus should be placed on increasing the competitiveness of Bumiputera businesses and SMEs to reap full benefit of TPPA
Most Bumiputera businesses are domestically-focused, with less than 10% of their revenues generated from exports. Measures that increase the export capabilities of Bumiputera businesses, such as in the manufacturing sector, during the transition period before the TPPA’s entry into force would increase the potential for these businesses to benefit from the opportunities presented by the TPPA. In addition, existing government procurement frameworks should be reviewed to accelerate the development of Bumiputera vendors and facilitate their transition towards the more liberalised government procurement process in the medium term.
Whilst most SMEs are expected to benefit from higher export prospects under the TPPA, experience from previous FTAs suggests that they will likely be disproportionately affected by compliance costs relative to MNCs. Measures that facilitate the scaling-up on SMEs would help to mitigate these higher costs. In addition, capacity building measures to enhance the standards and cost efficiency of SMEs towards the requirements of MNCs would further increase their ability to be integrated into their respective global value chains.
For more information, refer to Chapter 6.1 on “Thematic Issues – Bumi & SMEs”.
Overall Economy
Sectoral Analysis
Thematic Issues
Theme 3
Review government procurement frameworks to enhance the competitiveness of Bumiputera businesses
Theme 1
Renew emphasis on producing competitive export-oriented Bumiputera businesses and SMEs
Theme 2
Encourage more Bumiputera businesses and SMEs to adopt new ideas, processes and practices
1. Develop trade adjustment assistance
2. Increase presence of SMEs in global supply chain through government-linked companies, large companies and multinational corporations
3. Facilitate scaling -up of SMEs
4. Enhance end-to-end export promotion and outward investment services
• GoEx and Mid-Tier Companies programmes by MATRADE*
5. Enhance innovation voucher programme
• Business Development Voucher Programme under RMK-11
6. Develop transitional framework for government procurement
7. Improve development of vendors in Bumiputera Vendor Development Programme (“BVDP”)
• Improvement in BVDP framework by MITI
Recommendations
Capability building measures to enhance the competitiveness of
Bumiputera businesses and SMEs
* Existing initiatives.
Source: PwC analysis
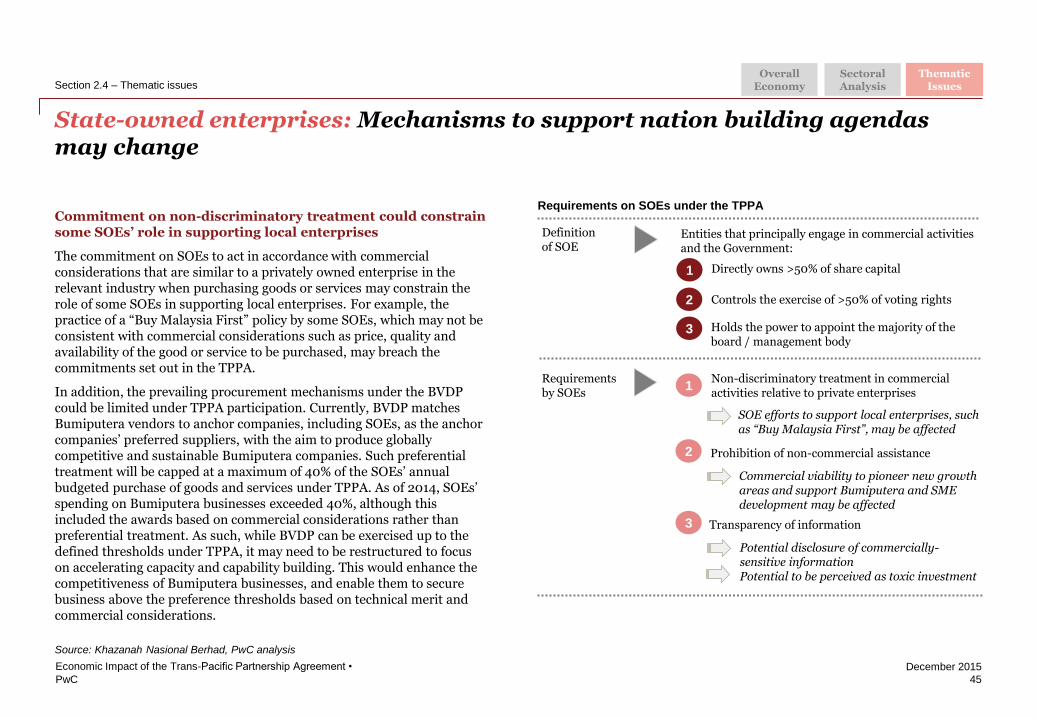
PwC
December 2015
Source: Khazanah Nasional Berhad, PwC analysis
State-owned enterprises: Mechanisms to support nation building agendas may change
45
Economic Impact of the Trans-Pacific Partnership Agreement •
Section 2.4 – Thematic issues
Commitment on non-discriminatory treatment could constrain some SOEs’ role in supporting local enterprises
The commitment on SOEs to act in accordance with commercial considerations that are similar to a privately owned enterprise in the relevant industry when purchasing goods or services may constrain the role of some SOEs in supporting local enterprises. For example, the practice of a “Buy Malaysia First” policy by some SOEs, which may not be consistent with commercial considerations such as price, quality and availability of the good or service to be purchased, may breach the commitments set out in the TPPA.
In addition, the prevailing procurement mechanisms under the BVDP could be limited under TPPA participation. Currently, BVDP matches Bumiputera vendors to anchor companies, including SOEs, as the anchor companies’ preferred suppliers, with the aim to produce globally competitive and sustainable Bumiputera companies. Such preferential treatment will be capped at a maximum of 40% of the SOEs’ annual budgeted purchase of goods and services under TPPA. As of 2014, SOEs’ spending on Bumiputera businesses exceeded 40%, although this included the awards based on commercial considerations rather than preferential treatment. As such, while BVDP can be exercised up to the defined thresholds under TPPA, it may need to be restructured to focus on accelerating capacity and capability building. This would enhance the competitiveness of Bumiputera businesses, and enable them to secure business above the preference thresholds based on technical merit and commercial considerations.
Requirements on SOEs under the TPPA
Entities that principally engage in commercial activities and the Government:
Directly owns >50% of share capital
Controls the exercise of >50% of voting rights
Holds the power to appoint the majority of the board / management body
1
2
3
Requirements by SOEs
Non-discriminatory treatment in commercial activities relative to private enterprises
Prohibition of non-commercial assistance
Transparency of information
1
2
3
SOE efforts to support local enterprises, such as “Buy Malaysia First”, may be affected
Commercial viability to pioneer new growth areas and support Bumiputera and SME development may be affected
Potential disclosure of commercially- sensitive information Potential to be perceived as toxic investment
Definition of SOE
Overall Economy
Sectoral Analysis
Thematic Issues
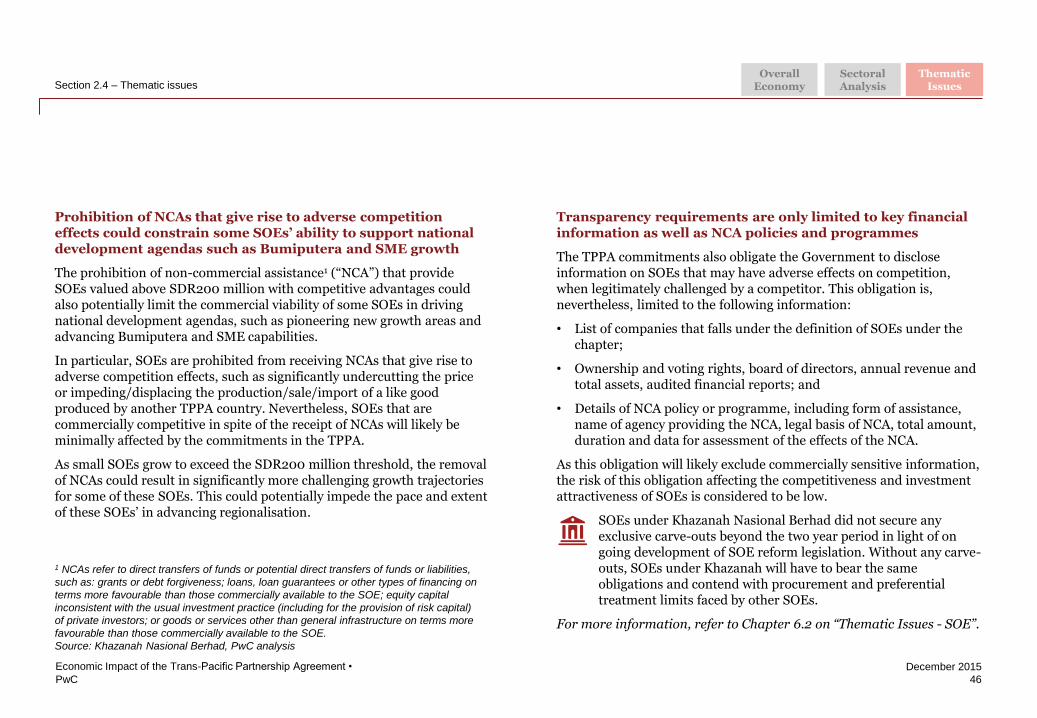
PwC
December 2015
46
Economic Impact of the Trans-Pacific Partnership Agreement •
Section 2.4 – Thematic issues
Prohibition of NCAs that give rise to adverse competition effects could constrain some SOEs’ ability to support national development agendas such as Bumiputera and SME growth
The prohibition of non-commercial assistance1 (“NCA”) that provide SOEs valued above SDR200 million with competitive advantages could also potentially limit the commercial viability of some SOEs in driving national development agendas, such as pioneering new growth areas and advancing Bumiputera and SME capabilities.
In particular, SOEs are prohibited from receiving NCAs that give rise to adverse competition effects, such as significantly undercutting the price or impeding/displacing the production/sale/import of a like good produced by another TPPA country. Nevertheless, SOEs that are commercially competitive in spite of the receipt of NCAs will likely be minimally affected by the commitments in the TPPA.
As small SOEs grow to exceed the SDR200 million threshold, the removal of NCAs could result in significantly more challenging growth trajectories for some of these SOEs. This could potentially impede the pace and extent of these SOEs’ in advancing regionalisation.
1 NCAs refer to direct transfers of funds or potential direct transfers of funds or liabilities,
such as: grants or debt forgiveness; loans, loan guarantees or other types of financing on
terms more favourable than those commercially available to the SOE; equity capital
inconsistent with the usual investment practice (including for the provision of risk capital)
of private investors; or goods or services other than general infrastructure on terms more
favourable than those commercially available to the SOE.
Source: Khazanah Nasional Berhad, PwC analysis
Transparency requirements are only limited to key financial information as well as NCA policies and programmes
The TPPA commitments also obligate the Government to disclose information on SOEs that may have adverse effects on competition, when legitimately challenged by a competitor. This obligation is, nevertheless, limited to the following information:
• List of companies that falls under the definition of SOEs under the chapter;
• Ownership and voting rights, board of directors, annual revenue and total assets, audited financial reports; and
• Details of NCA policy or programme, including form of assistance, name of agency providing the NCA, legal basis of NCA, total amount, duration and data for assessment of the effects of the NCA.
As this obligation will likely exclude commercially sensitive information, the risk of this obligation affecting the competitiveness and investment attractiveness of SOEs is considered to be low.
SOEs under Khazanah Nasional Berhad did not secure any exclusive carve-outs beyond the two year period in light of on going development of SOE reform legislation. Without any carve-outs, SOEs under Khazanah will have to bear the same obligations and contend with procurement and preferential treatment limits faced by other SOEs.
For more information, refer to Chapter 6.2 on “Thematic Issues - SOE”.
Overall Economy
Sectoral Analysis
Thematic Issues
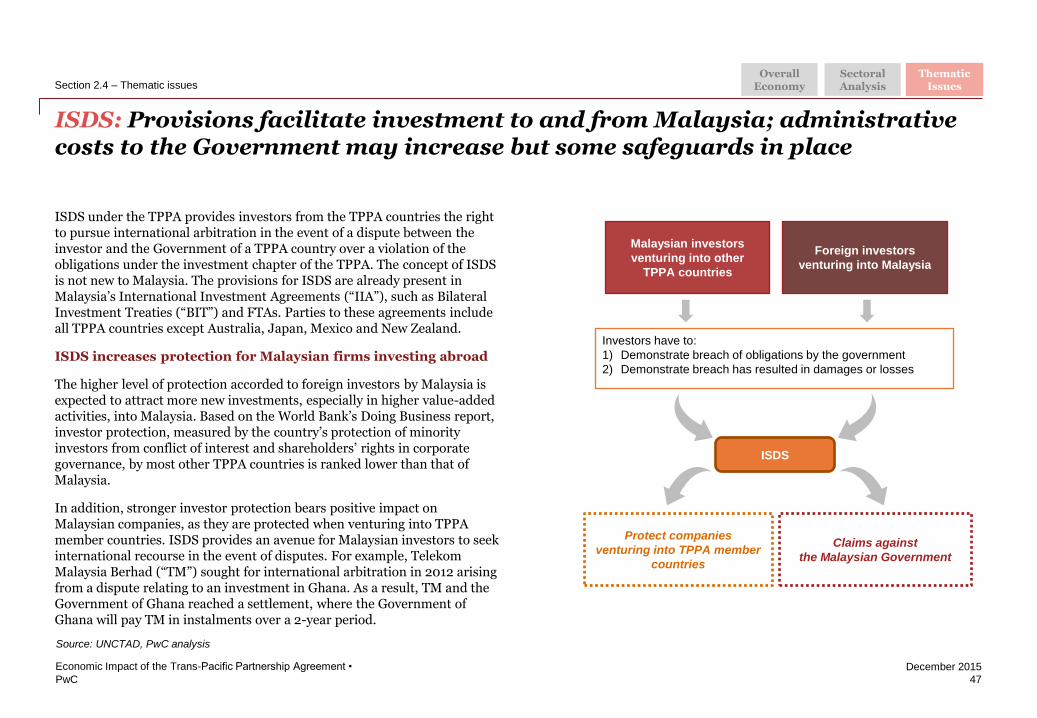
PwC
December 2015
47
ISDS under the TPPA provides investors from the TPPA countries the right to pursue international arbitration in the event of a dispute between the investor and the Government of a TPPA country over a violation of the obligations under the investment chapter of the TPPA. The concept of ISDS is not new to Malaysia. The provisions for ISDS are already present in Malaysia’s International Investment Agreements (“IIA”), such as Bilateral Investment Treaties (“BIT”) and FTAs. Parties to these agreements include all TPPA countries except Australia, Japan, Mexico and New Zealand.
ISDS increases protection for Malaysian firms investing abroad
The higher level of protection accorded to foreign investors by Malaysia is expected to attract more new investments, especially in higher value-added activities, into Malaysia. Based on the World Bank’s Doing Business report, investor protection, measured by the country’s protection of minority investors from conflict of interest and shareholders’ rights in corporate governance, by most other TPPA countries is ranked lower than that of Malaysia.
In addition, stronger investor protection bears positive impact on Malaysian companies, as they are protected when venturing into TPPA member countries. ISDS provides an avenue for Malaysian investors to seek international recourse in the event of disputes. For example, Telekom Malaysia Berhad (“TM”) sought for international arbitration in 2012 arising from a dispute relating to an investment in Ghana. As a result, TM and the Government of Ghana reached a settlement, where the Government of Ghana will pay TM in instalments over a 2-year period.
ISDS
Foreign investors
venturing into Malaysia
Malaysian investors
venturing into other
TPPA countries
Investors have to:
1) Demonstrate breach of obligations by the government
2) Demonstrate breach has resulted in damages or losses
Protect companies
venturing into TPPA member
countries
Claims against
the Malaysian Government
Source: UNCTAD, PwC analysis
Economic Impact of the Trans-Pacific Partnership Agreement •
Section 2.4 – Thematic issues
ISDS: Provisions facilitate investment to and from Malaysia; administrative costs to the Government may increase but some safeguards in place
Overall Economy
Sectoral Analysis
Thematic Issues
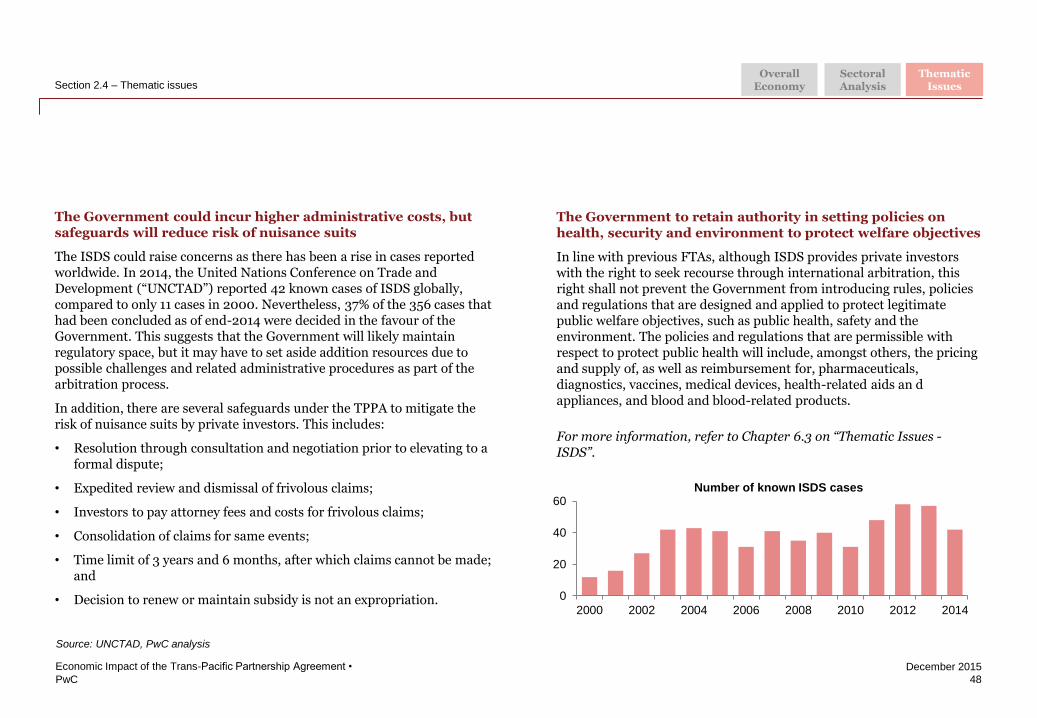
PwC
December 2015
The Government to retain authority in setting policies on health, security and environment to protect welfare objectives
In line with previous FTAs, although ISDS provides private investors with the right to seek recourse through international arbitration, this right shall not prevent the Government from introducing rules, policies and regulations that are designed and applied to protect legitimate public welfare objectives, such as public health, safety and the environment. The policies and regulations that are permissible with respect to protect public health will include, amongst others, the pricing and supply of, as well as reimbursement for, pharmaceuticals, diagnostics, vaccines, medical devices, health-related aids an d appliances, and blood and blood-related products.
For more information, refer to Chapter 6.3 on “Thematic Issues - ISDS”.
0
20
40
60
2000 2002 2004 2006 2008 2010 2012 2014
48
Number of known ISDS cases
Source: UNCTAD, PwC analysis
Economic Impact of the Trans-Pacific Partnership Agreement •
Section 2.4 – Thematic issues Overall
Economy Sectoral Analysis
Thematic Issues
The Government could incur higher administrative costs, but safeguards will reduce risk of nuisance suits
The ISDS could raise concerns as there has been a rise in cases reported worldwide. In 2014, the United Nations Conference on Trade and Development (“UNCTAD”) reported 42 known cases of ISDS globally, compared to only 11 cases in 2000. Nevertheless, 37% of the 356 cases that had been concluded as of end-2014 were decided in the favour of the Government. This suggests that the Government will likely maintain regulatory space, but it may have to set aside addition resources due to possible challenges and related administrative procedures as part of the arbitration process.
In addition, there are several safeguards under the TPPA to mitigate the risk of nuisance suits by private investors. This includes:
• Resolution through consultation and negotiation prior to elevating to a formal dispute;
• Expedited review and dismissal of frivolous claims;
• Investors to pay attorney fees and costs for frivolous claims;
• Consolidation of claims for same events;
• Time limit of 3 years and 6 months, after which claims cannot be made; and
• Decision to renew or maintain subsidy is not an expropriation.
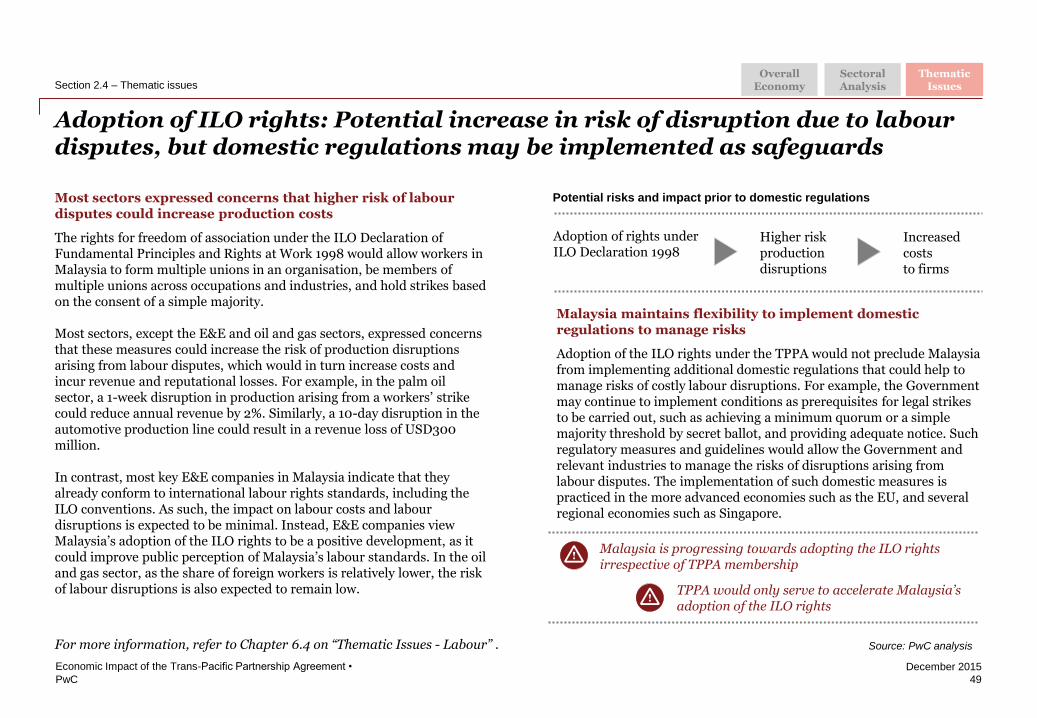
PwC
December 2015
Adoption of ILO rights: Potential increase in risk of disruption due to labour disputes, but domestic regulations may be implemented as safeguards
49
Economic Impact of the Trans-Pacific Partnership Agreement •
Section 2.4 – Thematic issues
Most sectors expressed concerns that higher risk of labour disputes could increase production costs
The rights for freedom of association under the ILO Declaration of Fundamental Principles and Rights at Work 1998 would allow workers in Malaysia to form multiple unions in an organisation, be members of multiple unions across occupations and industries, and hold strikes based on the consent of a simple majority.
Most sectors, except the E&E and oil and gas sectors, expressed concerns that these measures could increase the risk of production disruptions arising from labour disputes, which would in turn increase costs and incur revenue and reputational losses. For example, in the palm oil sector, a 1-week disruption in production arising from a workers’ strike could reduce annual revenue by 2%. Similarly, a 10-day disruption in the automotive production line could result in a revenue loss of USD300 million.
In contrast, most key E&E companies in Malaysia indicate that they already conform to international labour rights standards, including the ILO conventions. As such, the impact on labour costs and labour disruptions is expected to be minimal. Instead, E&E companies view Malaysia’s adoption of the ILO rights to be a positive development, as it could improve public perception of Malaysia’s labour standards. In the oil and gas sector, as the share of foreign workers is relatively lower, the risk of labour disruptions is also expected to remain low.
Malaysia maintains flexibility to implement domestic regulations to manage risks
Adoption of the ILO rights under the TPPA would not preclude Malaysia from implementing additional domestic regulations that could help to manage risks of costly labour disruptions. For example, the Government may continue to implement conditions as prerequisites for legal strikes to be carried out, such as achieving a minimum quorum or a simple majority threshold by secret ballot, and providing adequate notice. Such regulatory measures and guidelines would allow the Government and relevant industries to manage the risks of disruptions arising from labour disputes. The implementation of such domestic measures is practiced in the more advanced economies such as the EU, and several regional economies such as Singapore.
Source: PwC analysis
Potential risks and impact prior to domestic regulations
Adoption of rights under ILO Declaration 1998
Higher risk production disruptions
Increased costs to firms
Malaysia is progressing towards adopting the ILO rights irrespective of TPPA membership
TPPA would only serve to accelerate Malaysia’s adoption of the ILO rights
For more information, refer to Chapter 6.4 on “Thematic Issues - Labour” .
Overall Economy
Sectoral Analysis
Thematic Issues
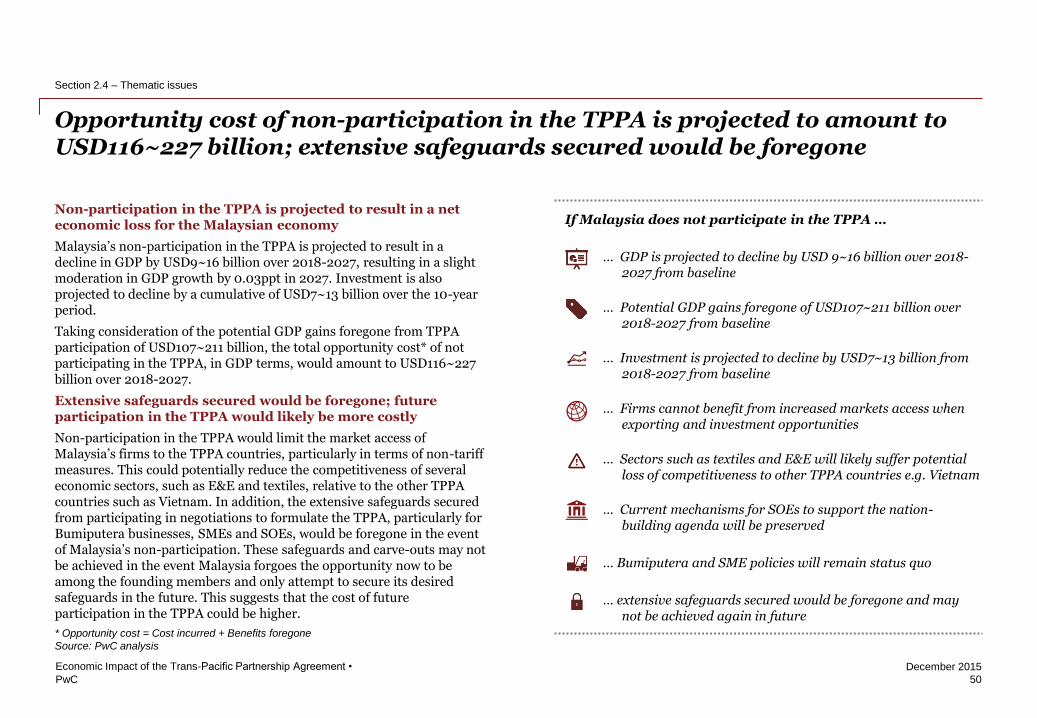
PwC
December 2015
If Malaysia does not participate in the TPPA …
… GDP is projected to decline by USD 9~16 billion over 2018-2027 from baseline
… Potential GDP gains foregone of USD107~211 billion over 2018-2027 from baseline
… Investment is projected to decline by USD7~13 billion from 2018-2027 from baseline
… Firms cannot benefit from increased markets access when exporting and investment opportunities
… Sectors such as textiles and E&E will likely suffer potential loss of competitiveness to other TPPA countries e.g. Vietnam
… Current mechanisms for SOEs to support the nation-building agenda will be preserved
… Bumiputera and SME policies will remain status quo
… extensive safeguards secured would be foregone and may not be achieved again in future
Opportunity cost of non-participation in the TPPA is projected to amount to USD116~227 billion; extensive safeguards secured would be foregone
50
Economic Impact of the Trans-Pacific Partnership Agreement •
Section 2.4 – Thematic issues
* Opportunity cost = Cost incurred + Benefits foregone
Source: PwC analysis
Non-participation in the TPPA is projected to result in a net economic loss for the Malaysian economy
Malaysia’s non-participation in the TPPA is projected to result in a decline in GDP by USD9~16 billion over 2018-2027, resulting in a slight moderation in GDP growth by 0.03ppt in 2027. Investment is also projected to decline by a cumulative of USD7~13 billion over the 10-year period.
Taking consideration of the potential GDP gains foregone from TPPA participation of USD107~211 billion, the total opportunity cost* of not participating in the TPPA, in GDP terms, would amount to USD116~227 billion over 2018-2027.
Extensive safeguards secured would be foregone; future participation in the TPPA would likely be more costly
Non-participation in the TPPA would limit the market access of Malaysia’s firms to the TPPA countries, particularly in terms of non-tariff measures. This could potentially reduce the competitiveness of several economic sectors, such as E&E and textiles, relative to the other TPPA countries such as Vietnam. In addition, the extensive safeguards secured from participating in negotiations to formulate the TPPA, particularly for Bumiputera businesses, SMEs and SOEs, would be foregone in the event of Malaysia’s non-participation. These safeguards and carve-outs may not be achieved in the event Malaysia forgoes the opportunity now to be among the founding members and only attempt to secure its desired safeguards in the future. This suggests that the cost of future participation in the TPPA could be higher.
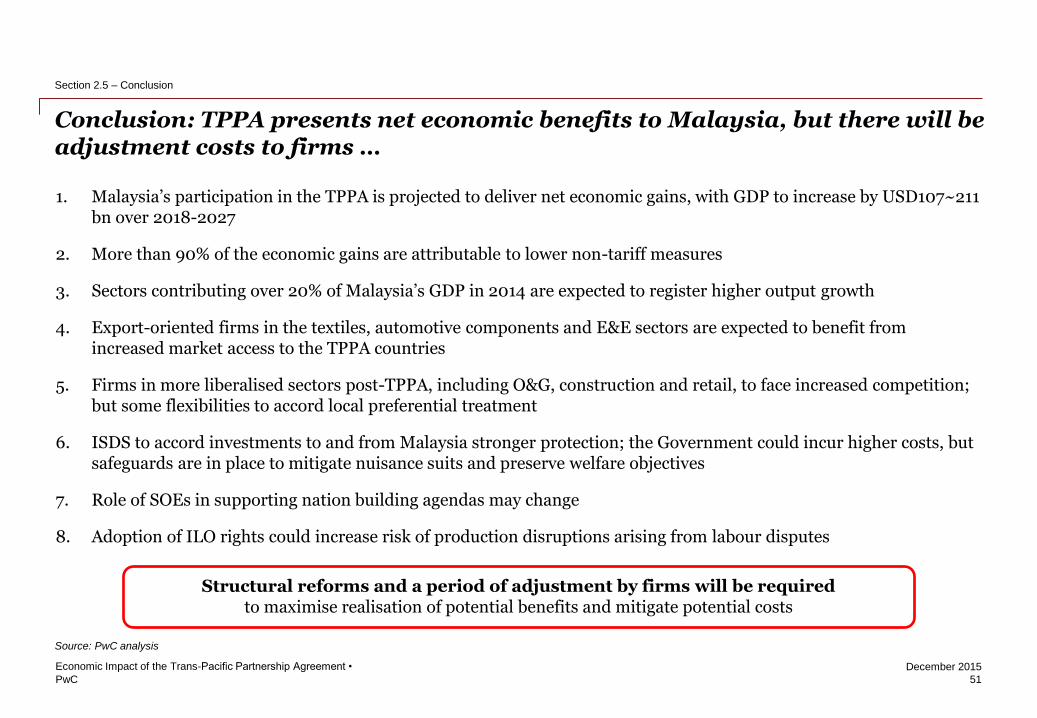
PwC
December 2015
1. Malaysia’s participation in the TPPA is projected to deliver net economic gains, with GDP to increase by USD107~211 bn over 2018-2027
2. More than 90% of the economic gains are attributable to lower non-tariff measures
3. Sectors contributing over 20% of Malaysia’s GDP in 2014 are expected to register higher output growth
4. Export-oriented firms in the textiles, automotive components and E&E sectors are expected to benefit from increased market access to the TPPA countries
5. Firms in more liberalised sectors post-TPPA, including O&G, construction and retail, to face increased competition; but some flexibilities to accord local preferential treatment
6. ISDS to accord investments to and from Malaysia stronger protection; the Government could incur higher costs, but safeguards are in place to mitigate nuisance suits and preserve welfare objectives
7. Role of SOEs in supporting nation building agendas may change
8. Adoption of ILO rights could increase risk of production disruptions arising from labour disputes
Structural reforms and a period of adjustment by firms will be required
to maximise realisation of potential benefits and mitigate potential costs
Conclusion: TPPA presents net economic benefits to Malaysia, but there will be adjustment costs to firms …
51
Economic Impact of the Trans-Pacific Partnership Agreement •
Source: PwC analysis
Section 2.5 – Conclusion
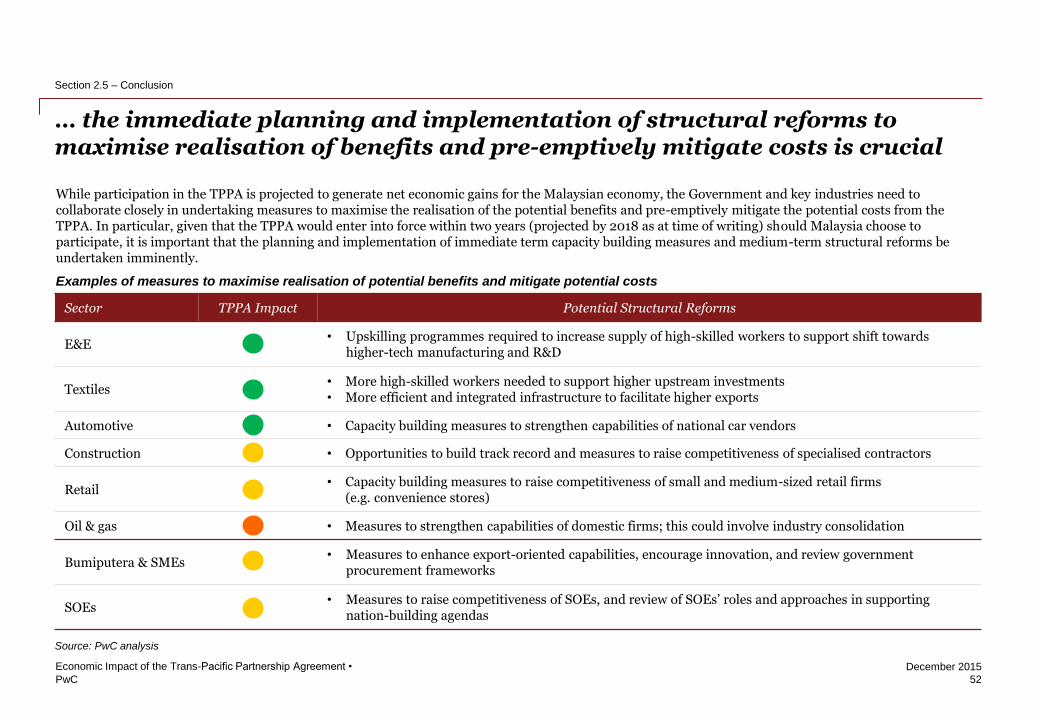
PwC
December 2015
… the immediate planning and implementation of structural reforms to maximise realisation of benefits and pre-emptively mitigate costs is crucial
52
Economic Impact of the Trans-Pacific Partnership Agreement •
Section 2.5 – Conclusion
Source: PwC analysis
Sector TPPA Impact Potential Structural Reforms
E&E • Upskilling programmes required to increase supply of high-skilled workers to support shift towards
higher-tech manufacturing and R&D
Textiles • More high-skilled workers needed to support higher upstream investments • More efficient and integrated infrastructure to facilitate higher exports
Automotive • Capacity building measures to strengthen capabilities of national car vendors
Construction • Opportunities to build track record and measures to raise competitiveness of specialised contractors
Retail • Capacity building measures to raise competitiveness of small and medium-sized retail firms
(e.g. convenience stores)
Oil & gas • Measures to strengthen capabilities of domestic firms; this could involve industry consolidation
Bumiputera & SMEs • Measures to enhance export-oriented capabilities, encourage innovation, and review government
procurement frameworks
SOEs • Measures to raise competitiveness of SOEs, and review of SOEs’ roles and approaches in supporting
nation-building agendas
While participation in the TPPA is projected to generate net economic gains for the Malaysian economy, the Government and key industries need to collaborate closely in undertaking measures to maximise the realisation of the potential benefits and pre-emptively mitigate the potential costs from the TPPA. In particular, given that the TPPA would enter into force within two years (projected by 2018 as at time of writing) should Malaysia choose to participate, it is important that the planning and implementation of immediate term capacity building measures and medium-term structural reforms be undertaken imminently.
Examples of measures to maximise realisation of potential benefits and mitigate potential costs
PwC
December 2015
Section 3 Background on TPPA
53
Economic Impact of the Trans-Pacific Partnership Agreement •

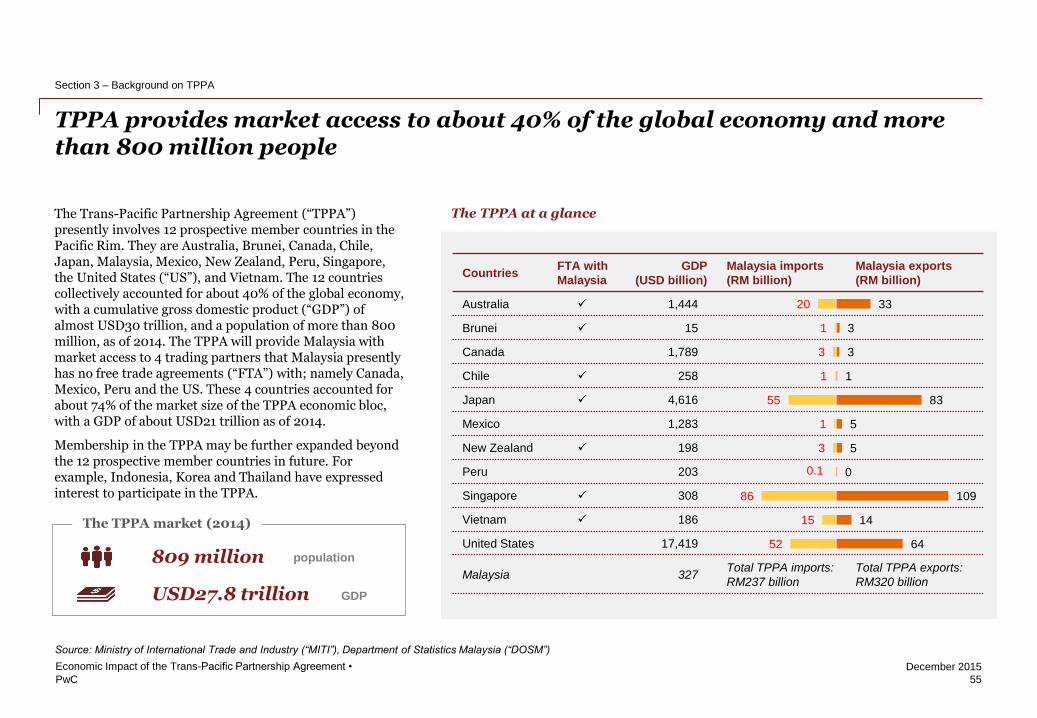
PwC
December 2015
TPPA provides market access to about 40% of the global economy and more than 800 million people
55
Economic Impact of the Trans-Pacific Partnership Agreement •
Source: Ministry of International Trade and Industry (“MITI”), Department of Statistics Malaysia (“DOSM”)
Section 3 – Background on TPPA
Countries FTA with
Malaysia
GDP
(USD billion)
Malaysia imports
(RM billion)
Malaysia exports
(RM billion)
Australia 1,444
Brunei 15
Canada 1,789
Chile 258
Japan 4,616
Mexico 1,283
New Zealand 198
Peru 203
Singapore 308
Vietnam 186
United States 17,419
Malaysia 327 Total TPPA imports:
RM237 billion
Total TPPA exports:
RM320 billion
64
14
109
0
5
5
83
1
3
3
33
52
15
86
3
1
55
1
3
1
20
0.1
The TPPA at a glance
The TPPA market (2014)
809 million population
USD27.8 trillion GDP
The Trans-Pacific Partnership Agreement (“TPPA”) presently involves 12 prospective member countries in the Pacific Rim. They are Australia, Brunei, Canada, Chile, Japan, Malaysia, Mexico, New Zealand, Peru, Singapore, the United States (“US”), and Vietnam. The 12 countries collectively accounted for about 40% of the global economy, with a cumulative gross domestic product (“GDP”) of almost USD30 trillion, and a population of more than 800 million, as of 2014. The TPPA will provide Malaysia with market access to 4 trading partners that Malaysia presently has no free trade agreements (“FTA”) with; namely Canada, Mexico, Peru and the US. These 4 countries accounted for about 74% of the market size of the TPPA economic bloc, with a GDP of about USD21 trillion as of 2014.
Membership in the TPPA may be further expanded beyond the 12 prospective member countries in future. For example, Indonesia, Korea and Thailand have expressed interest to participate in the TPPA.
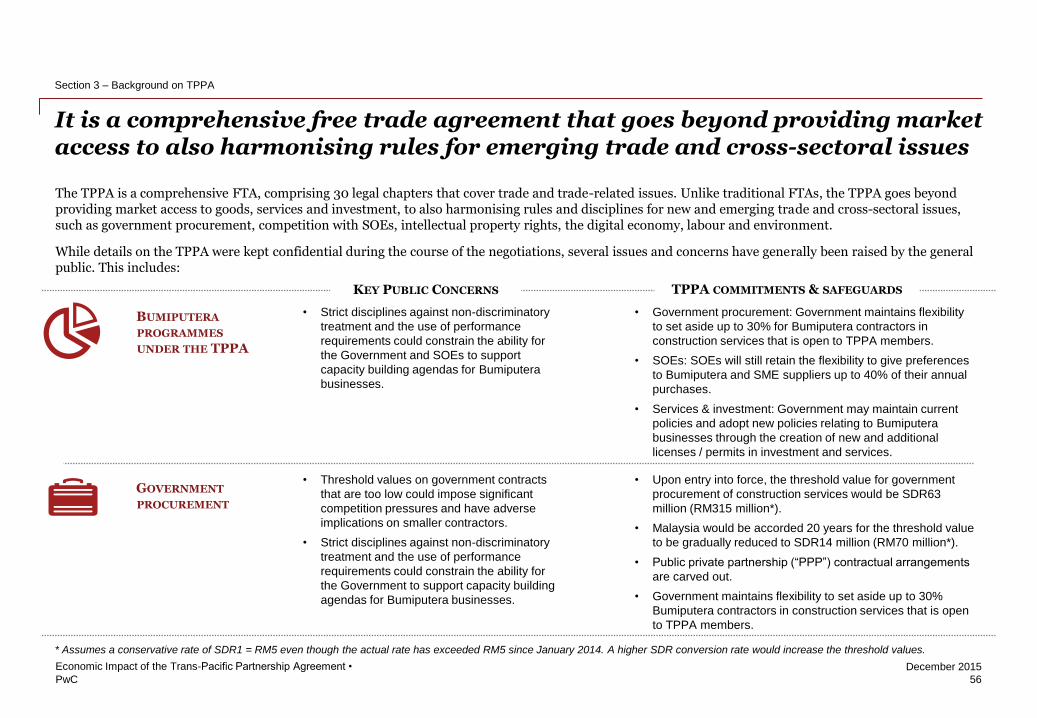
PwC
December 2015
It is a comprehensive free trade agreement that goes beyond providing market access to also harmonising rules for emerging trade and cross-sectoral issues
56
Economic Impact of the Trans-Pacific Partnership Agreement •
Section 3 – Background on TPPA
The TPPA is a comprehensive FTA, comprising 30 legal chapters that cover trade and trade-related issues. Unlike traditional FTAs, the TPPA goes beyond providing market access to goods, services and investment, to also harmonising rules and disciplines for new and emerging trade and cross-sectoral issues, such as government procurement, competition with SOEs, intellectual property rights, the digital economy, labour and environment.
While details on the TPPA were kept confidential during the course of the negotiations, several issues and concerns have generally been raised by the general public. This includes:
BUMIPUTERA PROGRAMMES UNDER THE TPPA
KEY PUBLIC CONCERNS TPPA COMMITMENTS & SAFEGUARDS
• Strict disciplines against non-discriminatory
treatment and the use of performance
requirements could constrain the ability for
the Government and SOEs to support
capacity building agendas for Bumiputera
businesses.
• Government procurement: Government maintains flexibility
to set aside up to 30% for Bumiputera contractors in
construction services that is open to TPPA members.
• SOEs: SOEs will still retain the flexibility to give preferences
to Bumiputera and SME suppliers up to 40% of their annual
purchases.
• Services & investment: Government may maintain current
policies and adopt new policies relating to Bumiputera
businesses through the creation of new and additional
licenses / permits in investment and services.
GOVERNMENT PROCUREMENT
• Threshold values on government contracts
that are too low could impose significant
competition pressures and have adverse
implications on smaller contractors.
• Strict disciplines against non-discriminatory
treatment and the use of performance
requirements could constrain the ability for
the Government to support capacity building
agendas for Bumiputera businesses.
• Upon entry into force, the threshold value for government
procurement of construction services would be SDR63
million (RM315 million*).
• Malaysia would be accorded 20 years for the threshold value
to be gradually reduced to SDR14 million (RM70 million*).
• Public private partnership (“PPP”) contractual arrangements
are carved out.
• Government maintains flexibility to set aside up to 30%
Bumiputera contractors in construction services that is open
to TPPA members.
* Assumes a conservative rate of SDR1 = RM5 even though the actual rate has exceeded RM5 since January 2014. A higher SDR conversion rate would increase the threshold values.
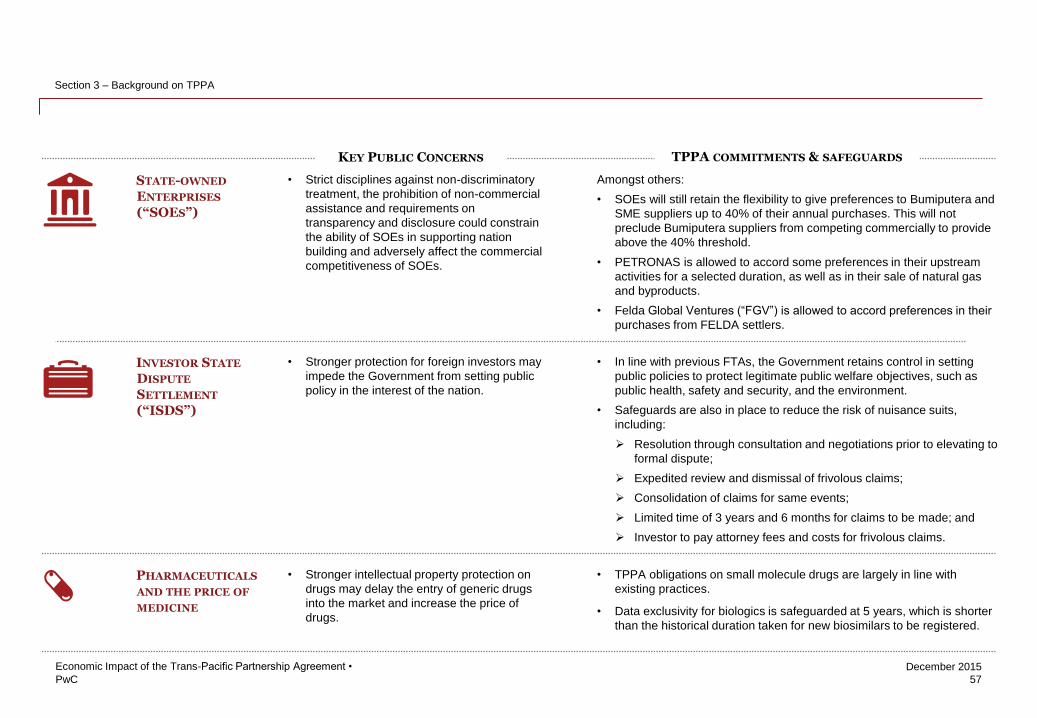
PwC
December 2015
57
Economic Impact of the Trans-Pacific Partnership Agreement •
Section 3 – Background on TPPA
STATE-OWNED ENTERPRISES (“SOES”)
KEY PUBLIC CONCERNS TPPA COMMITMENTS & SAFEGUARDS
• Strict disciplines against non-discriminatory
treatment, the prohibition of non-commercial
assistance and requirements on
transparency and disclosure could constrain
the ability of SOEs in supporting nation
building and adversely affect the commercial
competitiveness of SOEs.
Amongst others:
• SOEs will still retain the flexibility to give preferences to Bumiputera and
SME suppliers up to 40% of their annual purchases. This will not
preclude Bumiputera suppliers from competing commercially to provide
above the 40% threshold.
• PETRONAS is allowed to accord some preferences in their upstream
activities for a selected duration, as well as in their sale of natural gas
and byproducts.
• Felda Global Ventures (“FGV”) is allowed to accord preferences in their
purchases from FELDA settlers.
INVESTOR STATE DISPUTE SETTLEMENT (“ISDS”)
• Stronger protection for foreign investors may
impede the Government from setting public
policy in the interest of the nation.
• In line with previous FTAs, the Government retains control in setting
public policies to protect legitimate public welfare objectives, such as
public health, safety and security, and the environment.
• Safeguards are also in place to reduce the risk of nuisance suits,
including:
Resolution through consultation and negotiations prior to elevating to
formal dispute;
Expedited review and dismissal of frivolous claims;
Consolidation of claims for same events;
Limited time of 3 years and 6 months for claims to be made; and
Investor to pay attorney fees and costs for frivolous claims.
PHARMACEUTICALS AND THE PRICE OF MEDICINE
• Stronger intellectual property protection on
drugs may delay the entry of generic drugs
into the market and increase the price of
drugs.
• TPPA obligations on small molecule drugs are largely in line with
existing practices.
• Data exclusivity for biologics is safeguarded at 5 years, which is shorter
than the historical duration taken for new biosimilars to be registered.

PwC
December 2015
Section 4 Potential impact on Malaysia based on CGE modelling
59
Economic Impact of the Trans-Pacific Partnership Agreement •

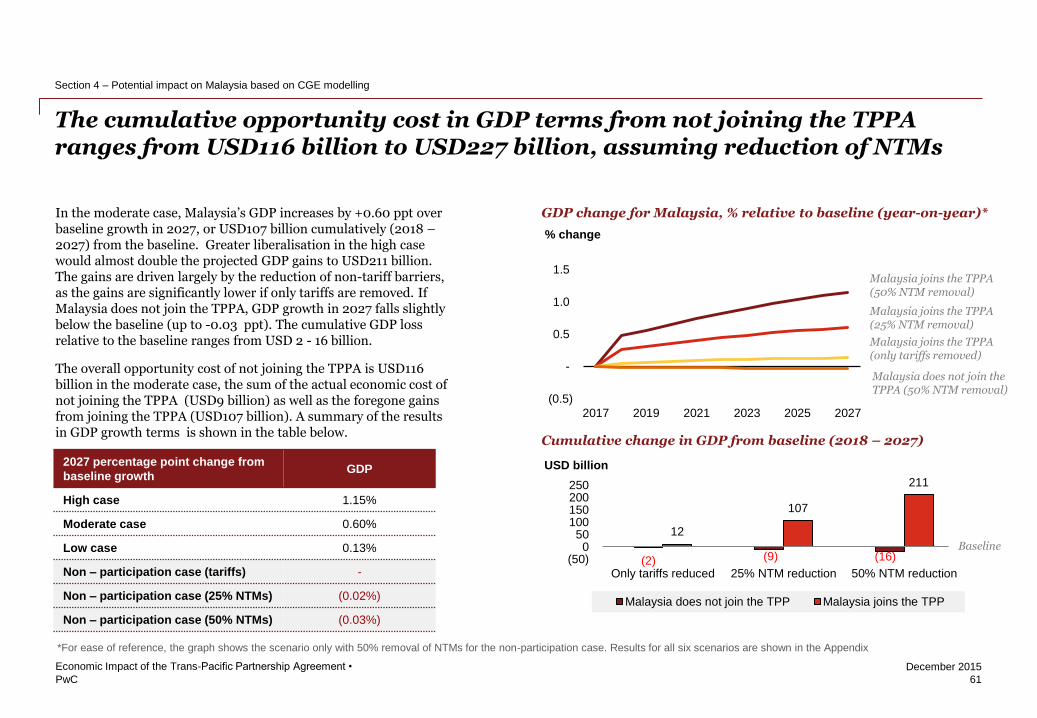
PwC
December 2015
In the moderate case, Malaysia’s GDP increases by +0.60 ppt over baseline growth in 2027, or USD107 billion cumulatively (2018 – 2027) from the baseline. Greater liberalisation in the high case would almost double the projected GDP gains to USD211 billion. The gains are driven largely by the reduction of non-tariff barriers, as the gains are significantly lower if only tariffs are removed. If Malaysia does not join the TPPA, GDP growth in 2027 falls slightly below the baseline (up to -0.03 ppt). The cumulative GDP loss relative to the baseline ranges from USD 2 - 16 billion.
The overall opportunity cost of not joining the TPPA is USD116 billion in the moderate case, the sum of the actual economic cost of not joining the TPPA (USD9 billion) as well as the foregone gains from joining the TPPA (USD107 billion). A summary of the results in GDP growth terms is shown in the table below.
The cumulative opportunity cost in GDP terms from not joining the TPPA ranges from USD116 billion to USD227 billion, assuming reduction of NTMs
61
Economic Impact of the Trans-Pacific Partnership Agreement •
Section 4 – Potential impact on Malaysia based on CGE modelling
GDP change for Malaysia, % relative to baseline (year-on-year)*
2027 percentage point change from
baseline growth GDP
High case 1.15%
Moderate case 0.60%
Low case 0.13%
Non – participation case (tariffs) -
Non – participation case (25% NTMs) (0.02%)
Non – participation case (50% NTMs) (0.03%)
% change
(0.5)
-
0.5
1.0
1.5
2017 2019 2021 2023 2025 2027
Malaysia joins the TPPA (50% NTM removal)
Malaysia does not join the TPPA (50% NTM removal)
Malaysia joins the TPPA (25% NTM removal)
Malaysia joins the TPPA (only tariffs removed)
Cumulative change in GDP from baseline (2018 – 2027)
*For ease of reference, the graph shows the scenario only with 50% removal of NTMs for the non-participation case. Results for all six scenarios are shown in the Appendix
USD billion
(2) (9) (16)
12
107
211
(50)0
50100150200250
Only tariffs reduced 25% NTM reduction 50% NTM reduction
Malaysia does not join the TPP Malaysia joins the TPP
Baseline
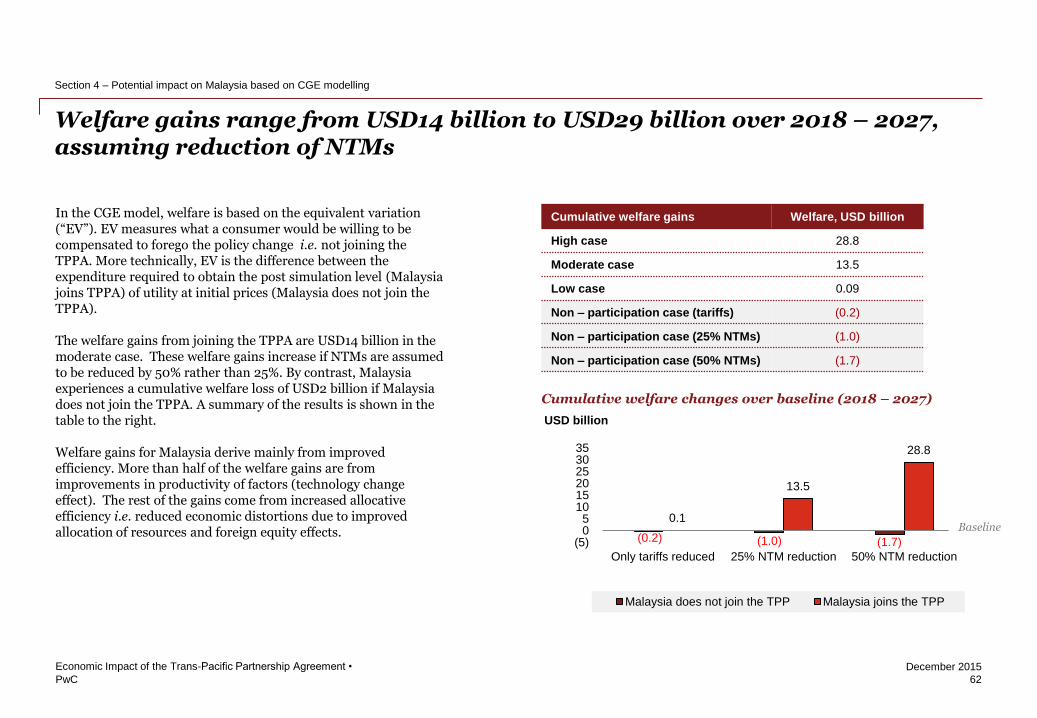
PwC
December 2015
In the CGE model, welfare is based on the equivalent variation (“EV”). EV measures what a consumer would be willing to be compensated to forego the policy change i.e. not joining the TPPA. More technically, EV is the difference between the expenditure required to obtain the post simulation level (Malaysia joins TPPA) of utility at initial prices (Malaysia does not join the TPPA).
The welfare gains from joining the TPPA are USD14 billion in the moderate case. These welfare gains increase if NTMs are assumed to be reduced by 50% rather than 25%. By contrast, Malaysia experiences a cumulative welfare loss of USD2 billion if Malaysia does not join the TPPA. A summary of the results is shown in the table to the right.
Welfare gains for Malaysia derive mainly from improved efficiency. More than half of the welfare gains are from improvements in productivity of factors (technology change effect). The rest of the gains come from increased allocative efficiency i.e. reduced economic distortions due to improved allocation of resources and foreign equity effects.
Welfare gains range from USD14 billion to USD29 billion over 2018 – 2027, assuming reduction of NTMs
62
Economic Impact of the Trans-Pacific Partnership Agreement •
Section 4 – Potential impact on Malaysia based on CGE modelling
Cumulative welfare changes over baseline (2018 – 2027)
Cumulative welfare gains Welfare, USD billion
High case 28.8
Moderate case 13.5
Low case 0.09
Non – participation case (tariffs) (0.2)
Non – participation case (25% NTMs) (1.0)
Non – participation case (50% NTMs) (1.7)
USD billion
(0.2) (1.0) (1.7)
0.1
13.5
28.8
(5)05
101520253035
Only tariffs reduced 25% NTM reduction 50% NTM reduction
Malaysia does not join the TPP Malaysia joins the TPP
Baseline
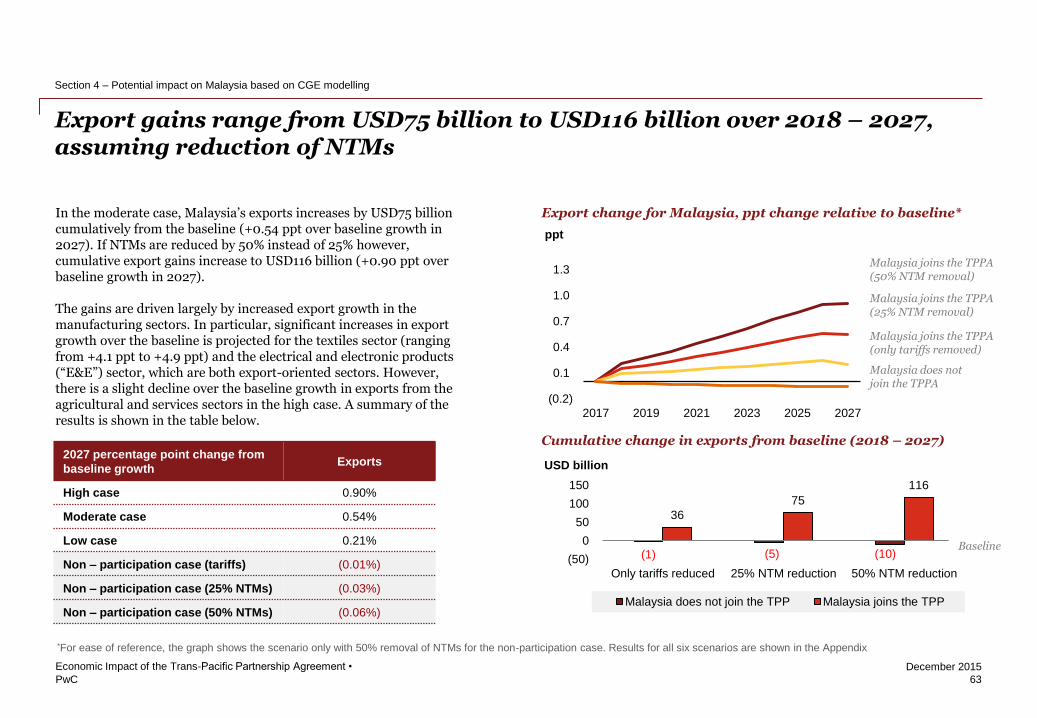
PwC
December 2015
In the moderate case, Malaysia’s exports increases by USD75 billion cumulatively from the baseline (+0.54 ppt over baseline growth in 2027). If NTMs are reduced by 50% instead of 25% however, cumulative export gains increase to USD116 billion (+0.90 ppt over baseline growth in 2027).
The gains are driven largely by increased export growth in the manufacturing sectors. In particular, significant increases in export growth over the baseline is projected for the textiles sector (ranging from +4.1 ppt to +4.9 ppt) and the electrical and electronic products (“E&E”) sector, which are both export-oriented sectors. However, there is a slight decline over the baseline growth in exports from the agricultural and services sectors in the high case. A summary of the results is shown in the table below.
Export gains range from USD75 billion to USD116 billion over 2018 – 2027, assuming reduction of NTMs
63
Economic Impact of the Trans-Pacific Partnership Agreement •
Section 4 – Potential impact on Malaysia based on CGE modelling
Export change for Malaysia, ppt change relative to baseline*
(0.2)
0.1
0.4
0.7
1.0
1.3
2017 2019 2021 2023 2025 2027
ppt
Malaysia joins the TPPA (50% NTM removal)
Malaysia does not join the TPPA
Malaysia joins the TPPA (25% NTM removal)
Malaysia joins the TPPA (only tariffs removed)
2027 percentage point change from
baseline growth Exports
High case 0.90%
Moderate case 0.54%
Low case 0.21%
Non – participation case (tariffs) (0.01%)
Non – participation case (25% NTMs) (0.03%)
Non – participation case (50% NTMs) (0.06%)
*For ease of reference, the graph shows the scenario only with 50% removal of NTMs for the non-participation case. Results for all six scenarios are shown in the Appendix
Cumulative change in exports from baseline (2018 – 2027)
USD billion
(1) (5) (10)
36
75
116
(50)
0
50
100
150
Only tariffs reduced 25% NTM reduction 50% NTM reduction
Malaysia does not join the TPP Malaysia joins the TPP
Baseline
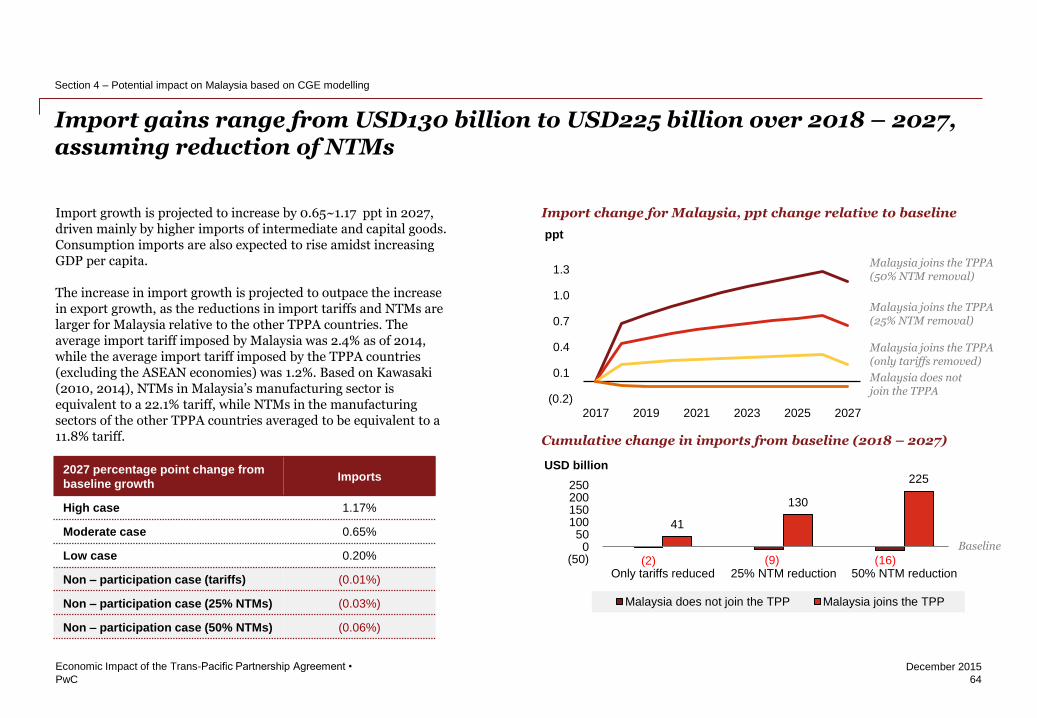
PwC
December 2015
Import growth is projected to increase by 0.65~1.17 ppt in 2027, driven mainly by higher imports of intermediate and capital goods. Consumption imports are also expected to rise amidst increasing GDP per capita.
The increase in import growth is projected to outpace the increase in export growth, as the reductions in import tariffs and NTMs are larger for Malaysia relative to the other TPPA countries. The average import tariff imposed by Malaysia was 2.4% as of 2014, while the average import tariff imposed by the TPPA countries (excluding the ASEAN economies) was 1.2%. Based on Kawasaki (2010, 2014), NTMs in Malaysia’s manufacturing sector is equivalent to a 22.1% tariff, while NTMs in the manufacturing sectors of the other TPPA countries averaged to be equivalent to a 11.8% tariff.
Import gains range from USD130 billion to USD225 billion over 2018 – 2027, assuming reduction of NTMs
64
Economic Impact of the Trans-Pacific Partnership Agreement •
Section 4 – Potential impact on Malaysia based on CGE modelling
Import change for Malaysia, ppt change relative to baseline
(0.2)
0.1
0.4
0.7
1.0
1.3
2017 2019 2021 2023 2025 2027
ppt
Malaysia joins the TPPA (50% NTM removal)
Malaysia does not join the TPPA
Malaysia joins the TPPA (25% NTM removal)
Malaysia joins the TPPA (only tariffs removed)
2027 percentage point change from
baseline growth Imports
High case 1.17%
Moderate case 0.65%
Low case 0.20%
Non – participation case (tariffs) (0.01%)
Non – participation case (25% NTMs) (0.03%)
Non – participation case (50% NTMs) (0.06%)
Cumulative change in imports from baseline (2018 – 2027)
USD billion
(2) (9) (16)
41
130
225
(50)0
50100150200250
Only tariffs reduced 25% NTM reduction 50% NTM reduction
Malaysia does not join the TPP Malaysia joins the TPP
Baseline

PwC
December 2015
The trade surplus will be smaller at USD29.7~35.1 billion than in the baseline scenario (USD41.9 billion), where TPPA does not exist. However, the trade balance is projected to remain in surplus in 2027 following Malaysia’s participation in the TPPA. The 2027 surplus position post-TPPA participation will remain larger than the 2014 surplus position of USD26.1 billion.
In the event Malaysia does not participate in the TPPA, the trade balance is projected to remain largely unchanged from the baseline scenario. In the non-participation case, the slight increase in the trade surplus in 2027 is due to the larger decline in import growth relative to export growth.
The share of trade surplus to GDP is projected to be lower irrespective of participation or non-participation in the TPPA. Trade balance as a share of GDP is projected to be lower at 4.3~5.3% in 2027 post-TPPA participation, compared to the baseline scenario of 6.5%.
The trade balance* is projected to be smaller at USD 35.1 billion in 2027 compared to the baseline, but it will remain in surplus at 4.3~5.2% of GDP
65
Economic Impact of the Trans-Pacific Partnership Agreement •
Section 4 – Potential impact on Malaysia based on CGE modelling
*The GTAP database includes both goods and services; as such this refers to the trade balance of both goods and services. The absolute impact to trade balance was calculated from the
changes in exports and imports for each scenario, then applied to actual trade balance data from Department of Statistics Malaysia (“DOSM”)
Projected trade balance in 2027
Change from baseline trade balance
in 2027 USD billion
High case (12.2)
Moderate case (6.8)
Low case (2.2)
Non – participation case (tariffs) 0.1
Non – participation case (25% NTMs) 0.2
Non – participation case (50% NTMs) 0.3
2014: 26.1
39.7 42.0 41.9
35.1
42.1
29.7
42.3
0
10
20
30
40
50
Baseline Join Don't Join
Tariff cut only 25% NTM cut 50% NTM cut
USD billion
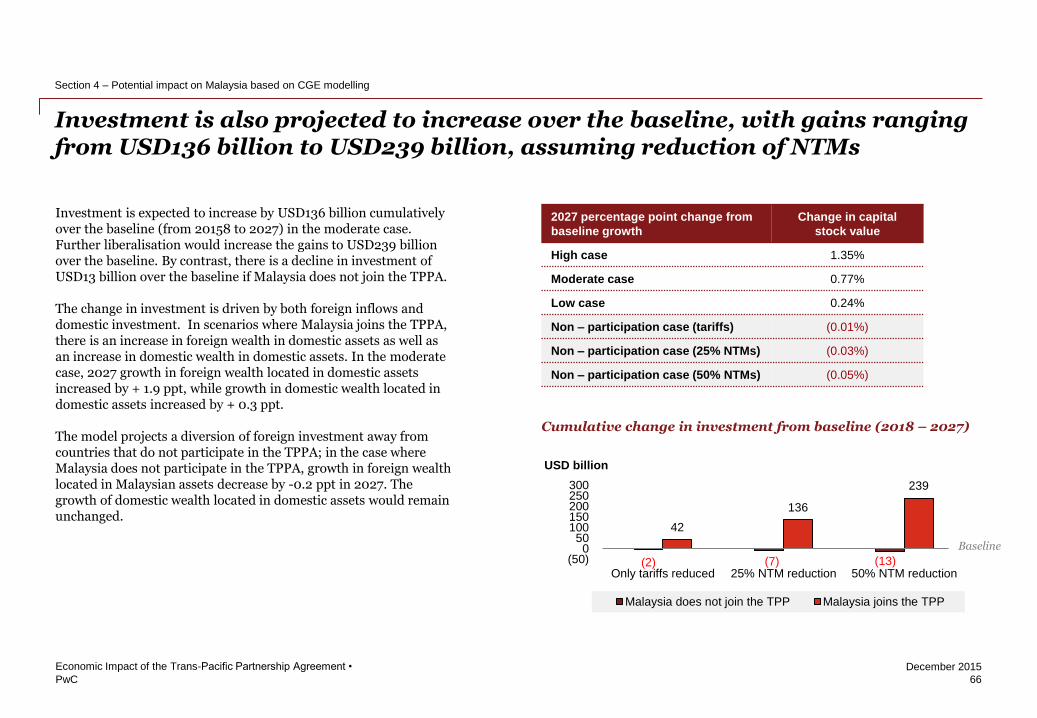
PwC
December 2015
Investment is expected to increase by USD136 billion cumulatively over the baseline (from 20158 to 2027) in the moderate case. Further liberalisation would increase the gains to USD239 billion over the baseline. By contrast, there is a decline in investment of USD13 billion over the baseline if Malaysia does not join the TPPA.
The change in investment is driven by both foreign inflows and domestic investment. In scenarios where Malaysia joins the TPPA, there is an increase in foreign wealth in domestic assets as well as an increase in domestic wealth in domestic assets. In the moderate case, 2027 growth in foreign wealth located in domestic assets increased by + 1.9 ppt, while growth in domestic wealth located in domestic assets increased by + 0.3 ppt.
The model projects a diversion of foreign investment away from countries that do not participate in the TPPA; in the case where Malaysia does not participate in the TPPA, growth in foreign wealth located in Malaysian assets decrease by -0.2 ppt in 2027. The growth of domestic wealth located in domestic assets would remain unchanged.
Investment is also projected to increase over the baseline, with gains ranging from USD136 billion to USD239 billion, assuming reduction of NTMs
66
Economic Impact of the Trans-Pacific Partnership Agreement •
Section 4 – Potential impact on Malaysia based on CGE modelling
2027 percentage point change from
baseline growth
Change in capital
stock value
High case 1.35%
Moderate case 0.77%
Low case 0.24%
Non – participation case (tariffs) (0.01%)
Non – participation case (25% NTMs) (0.03%)
Non – participation case (50% NTMs) (0.05%)
Increase in value of capital stock for Malaysia, ppt change relative to baseline
(0.3)
-
0.3
0.6
0.9
1.2
1.5
2017 2019 2021 2023 2025 2027
ppt
Malaysia joins the TPPA (50% NTM removal)
Malaysia does not join the TPPA
Malaysia joins the TPPA (25% NTM removal)
Malaysia joins the TPPA (only tariffs removed)
Cumulative change in investment from baseline (2018 – 2027)
USD billion
(2) (7) (13)
42
136
239
(50)0
50100150200250300
Only tariffs reduced 25% NTM reduction 50% NTM reduction
Malaysia does not join the TPP Malaysia joins the TPP
Baseline
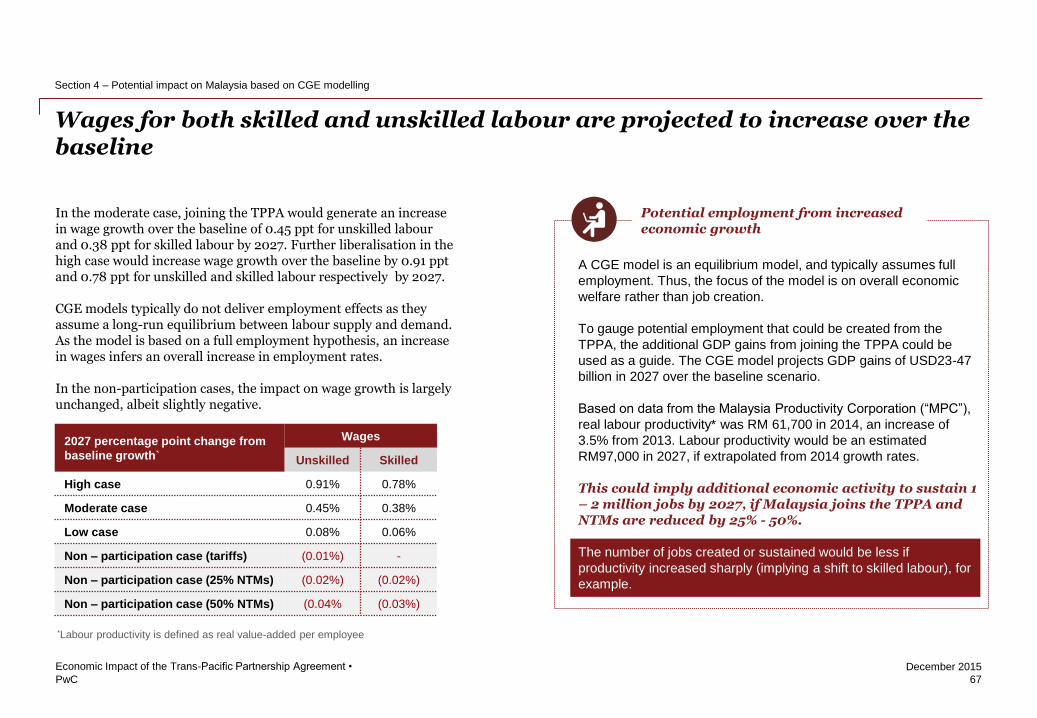
PwC
December 2015
In the moderate case, joining the TPPA would generate an increase in wage growth over the baseline of 0.45 ppt for unskilled labour and 0.38 ppt for skilled labour by 2027. Further liberalisation in the high case would increase wage growth over the baseline by 0.91 ppt and 0.78 ppt for unskilled and skilled labour respectively by 2027.
CGE models typically do not deliver employment effects as they assume a long-run equilibrium between labour supply and demand. As the model is based on a full employment hypothesis, an increase in wages infers an overall increase in employment rates.
In the non-participation cases, the impact on wage growth is largely unchanged, albeit slightly negative.
Wages for both skilled and unskilled labour are projected to increase over the baseline
67
Economic Impact of the Trans-Pacific Partnership Agreement •
Section 4 – Potential impact on Malaysia based on CGE modelling
2027 percentage point change from
baseline growth`
Wages
Unskilled Skilled
High case 0.91% 0.78%
Moderate case 0.45% 0.38%
Low case 0.08% 0.06%
Non – participation case (tariffs) (0.01%) -
Non – participation case (25% NTMs) (0.02%) (0.02%)
Non – participation case (50% NTMs) (0.04% (0.03%)
Potential employment from increased economic growth
A CGE model is an equilibrium model, and typically assumes full
employment. Thus, the focus of the model is on overall economic
welfare rather than job creation.
To gauge potential employment that could be created from the
TPPA, the additional GDP gains from joining the TPPA could be
used as a guide. The CGE model projects GDP gains of USD23-47
billion in 2027 over the baseline scenario.
Based on data from the Malaysia Productivity Corporation (“MPC”),
real labour productivity* was RM 61,700 in 2014, an increase of
3.5% from 2013. Labour productivity would be an estimated
RM97,000 in 2027, if extrapolated from 2014 growth rates.
This could imply additional economic activity to sustain 1 – 2 million jobs by 2027, if Malaysia joins the TPPA and NTMs are reduced by 25% - 50%.
The number of jobs created or sustained would be less if
productivity increased sharply (implying a shift to skilled labour), for
example.
*Labour productivity is defined as real value-added per employee
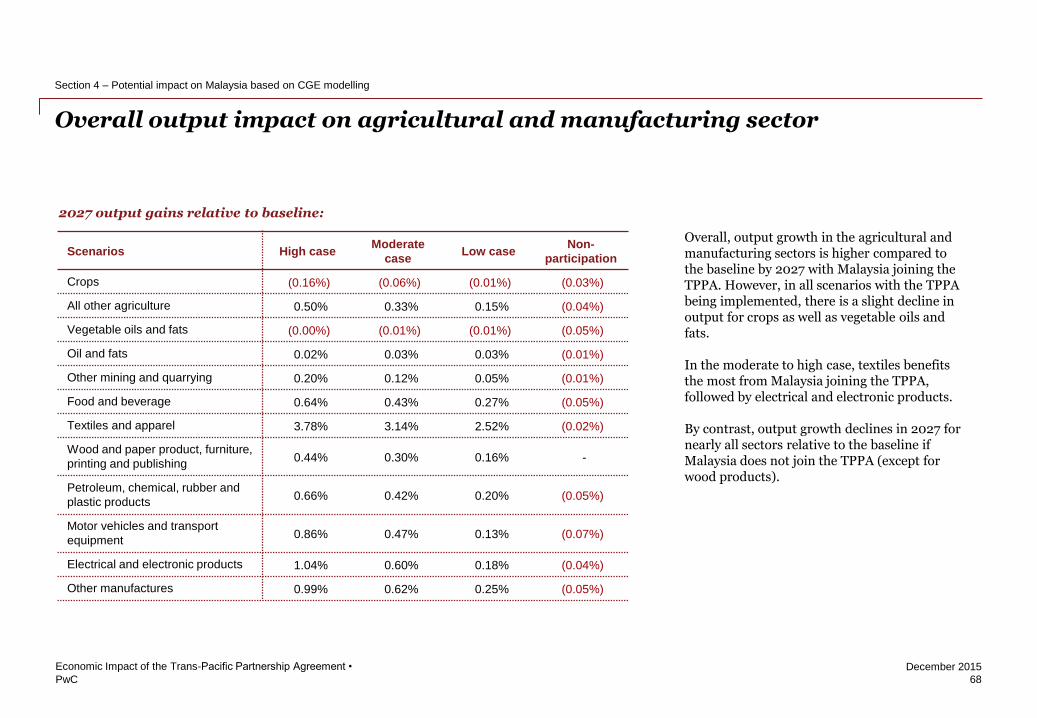
PwC
December 2015
Overall output impact on agricultural and manufacturing sector
68
Economic Impact of the Trans-Pacific Partnership Agreement •
Section 4 – Potential impact on Malaysia based on CGE modelling
Scenarios High case Moderate
case Low case
Non-
participation
Crops (0.16%) (0.06%) (0.01%) (0.03%)
All other agriculture 0.50% 0.33% 0.15% (0.04%)
Vegetable oils and fats (0.00%) (0.01%) (0.01%) (0.05%)
Oil and fats 0.02% 0.03% 0.03% (0.01%)
Other mining and quarrying 0.20% 0.12% 0.05% (0.01%)
Food and beverage 0.64% 0.43% 0.27% (0.05%)
Textiles and apparel 3.78% 3.14% 2.52% (0.02%)
Wood and paper product, furniture,
printing and publishing 0.44% 0.30% 0.16% -
Petroleum, chemical, rubber and
plastic products 0.66% 0.42% 0.20% (0.05%)
Motor vehicles and transport
equipment 0.86% 0.47% 0.13% (0.07%)
Electrical and electronic products 1.04% 0.60% 0.18% (0.04%)
Other manufactures 0.99% 0.62% 0.25% (0.05%)
2027 output gains relative to baseline:
Overall, output growth in the agricultural and manufacturing sectors is higher compared to the baseline by 2027 with Malaysia joining the TPPA. However, in all scenarios with the TPPA being implemented, there is a slight decline in output for crops as well as vegetable oils and fats.
In the moderate to high case, textiles benefits the most from Malaysia joining the TPPA, followed by electrical and electronic products.
By contrast, output growth declines in 2027 for nearly all sectors relative to the baseline if Malaysia does not join the TPPA (except for wood products).
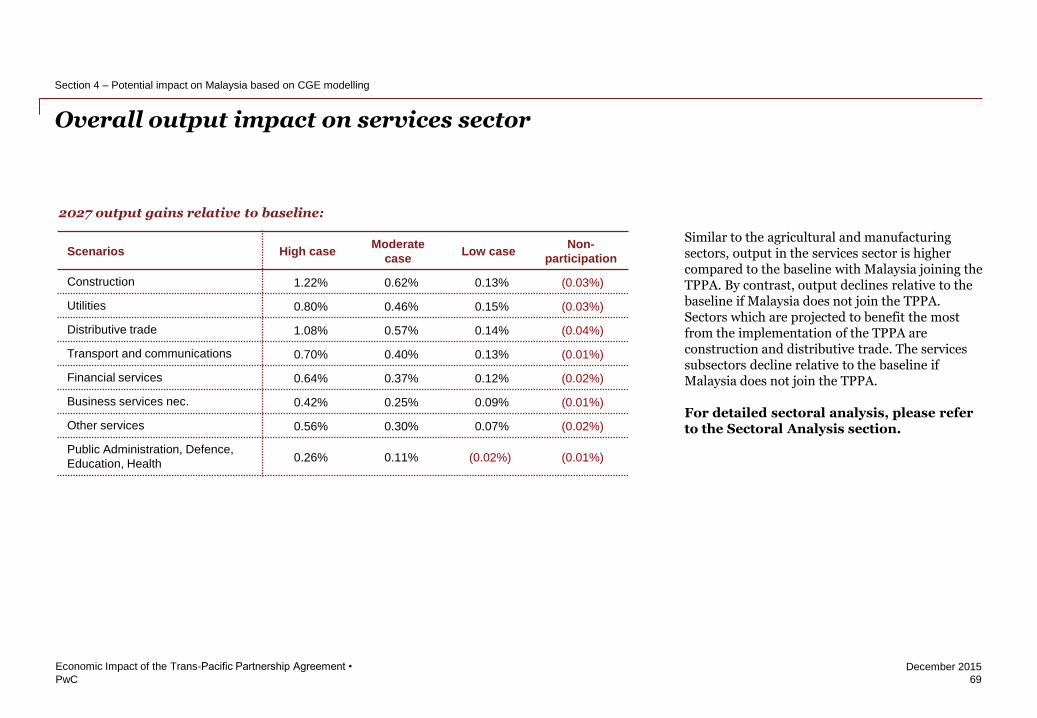
PwC
December 2015
Overall output impact on services sector
69
Economic Impact of the Trans-Pacific Partnership Agreement •
Section 4 – Potential impact on Malaysia based on CGE modelling
Similar to the agricultural and manufacturing sectors, output in the services sector is higher compared to the baseline with Malaysia joining the TPPA. By contrast, output declines relative to the baseline if Malaysia does not join the TPPA. Sectors which are projected to benefit the most from the implementation of the TPPA are construction and distributive trade. The services subsectors decline relative to the baseline if Malaysia does not join the TPPA.
For detailed sectoral analysis, please refer to the Sectoral Analysis section.
Scenarios High case Moderate
case Low case
Non-
participation
Construction 1.22% 0.62% 0.13% (0.03%)
Utilities 0.80% 0.46% 0.15% (0.03%)
Distributive trade 1.08% 0.57% 0.14% (0.04%)
Transport and communications 0.70% 0.40% 0.13% (0.01%)
Financial services 0.64% 0.37% 0.12% (0.02%)
Business services nec. 0.42% 0.25% 0.09% (0.01%)
Other services 0.56% 0.30% 0.07% (0.02%)
Public Administration, Defence,
Education, Health 0.26% 0.11% (0.02%) (0.01%)
2027 output gains relative to baseline:

PwC
December 2015
Section 5 Sectoral analysis
71
Economic Impact of the Trans-Pacific Partnership Agreement •

PwC
December 2015
Introduction
73
Economic Impact of the Trans-Pacific Partnership Agreement •
Section 5 – Sectoral analysis
For sectoral analysis, 10 sectors were analysed, with 5 sectors being dealt more in-depth than the remaining 5 sectors. All 10 sectors are listed below:
5 main sectors
• Electrical and electronics manufacturing
• Palm oil
• Oil and gas
• Construction
• Textile
Other sectors
• Retail
• Plastic and plastic products
• Wood and wood products
• Automotive
• Pharmaceutical
This section aims to quantify potential opportunities and concerns arises from TPPA raised by industry associations representing each sector and key industry players within the selected sectors.

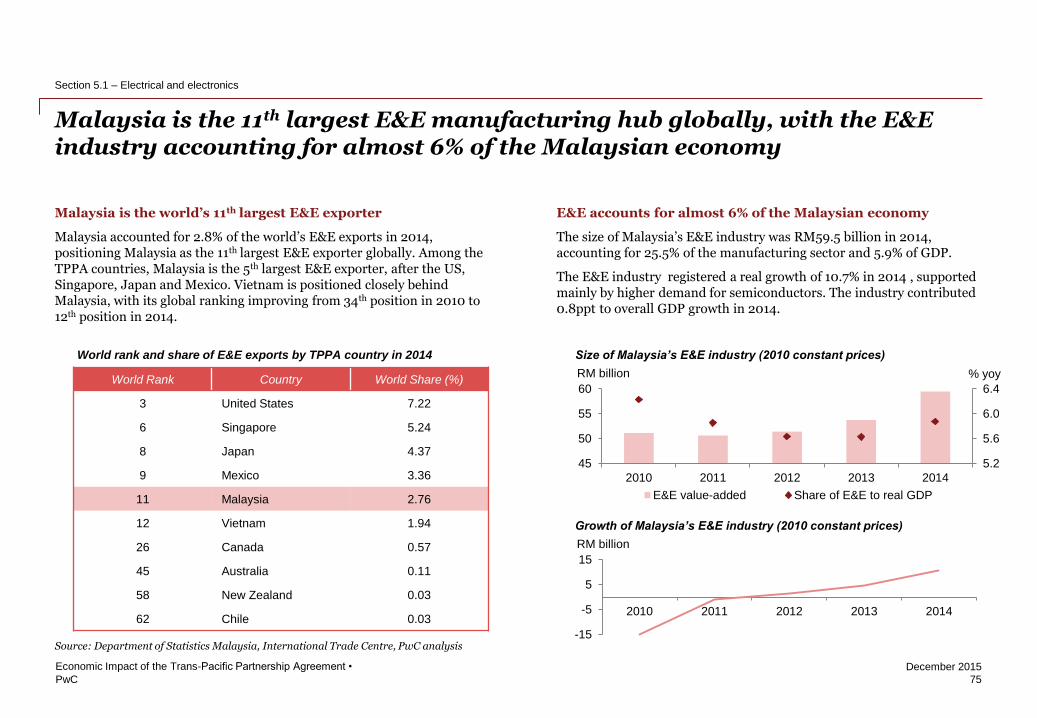
PwC
December 2015
Malaysia is the world’s 11th largest E&E exporter
Malaysia accounted for 2.8% of the world’s E&E exports in 2014, positioning Malaysia as the 11th largest E&E exporter globally. Among the TPPA countries, Malaysia is the 5th largest E&E exporter, after the US, Singapore, Japan and Mexico. Vietnam is positioned closely behind Malaysia, with its global ranking improving from 34th position in 2010 to 12th position in 2014.
Malaysia is the 11th largest E&E manufacturing hub globally, with the E&E industry accounting for almost 6% of the Malaysian economy
75
Economic Impact of the Trans-Pacific Partnership Agreement •
Section 5.1 – Electrical and electronics
Source: Department of Statistics Malaysia, International Trade Centre, PwC analysis
E&E accounts for almost 6% of the Malaysian economy
The size of Malaysia’s E&E industry was RM59.5 billion in 2014, accounting for 25.5% of the manufacturing sector and 5.9% of GDP.
The E&E industry registered a real growth of 10.7% in 2014 , supported mainly by higher demand for semiconductors. The industry contributed 0.8ppt to overall GDP growth in 2014.
RM billion
Size of Malaysia’s E&E industry (2010 constant prices)
5.2
5.6
6.0
6.4
45
50
55
60
2010 2011 2012 2013 2014
E&E value-added Share of E&E to real GDP
% yoy
RM billion
Growth of Malaysia’s E&E industry (2010 constant prices)
-15
-5
5
15
2010 2011 2012 2013 2014
World Rank Country World Share (%)
3 United States 7.22
6 Singapore 5.24
8 Japan 4.37
9 Mexico 3.36
11 Malaysia 2.76
12 Vietnam 1.94
26 Canada 0.57
45 Australia 0.11
58 New Zealand 0.03
62 Chile 0.03
World rank and share of E&E exports by TPPA country in 2014
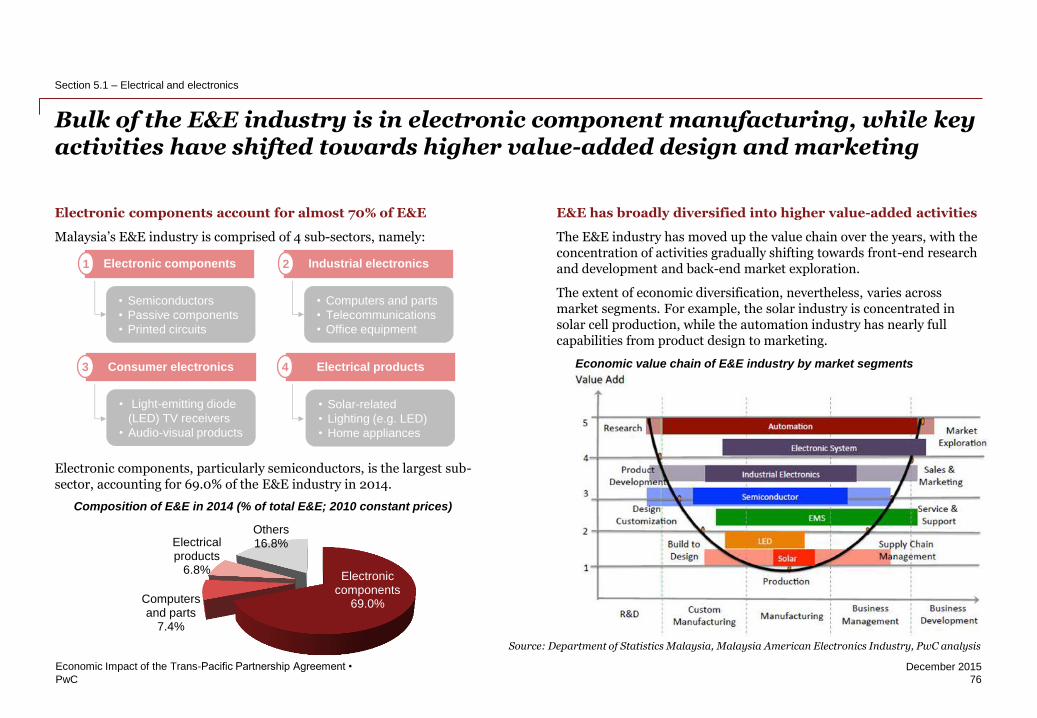
PwC
December 2015
E&E has broadly diversified into higher value-added activities
The E&E industry has moved up the value chain over the years, with the concentration of activities gradually shifting towards front-end research and development and back-end market exploration.
The extent of economic diversification, nevertheless, varies across market segments. For example, the solar industry is concentrated in solar cell production, while the automation industry has nearly full capabilities from product design to marketing.
Bulk of the E&E industry is in electronic component manufacturing, while key activities have shifted towards higher value-added design and marketing
76
Economic Impact of the Trans-Pacific Partnership Agreement •
Section 5.1 – Electrical and electronics
Electronic components account for almost 70% of E&E
Malaysia’s E&E industry is comprised of 4 sub-sectors, namely:
Electronic components, particularly semiconductors, is the largest sub-sector, accounting for 69.0% of the E&E industry in 2014.
Source: Department of Statistics Malaysia, Malaysia American Electronics Industry, PwC analysis
Electronic components
69.0% Computers and parts
7.4%
Electrical products
6.8%
Others 16.8%
Composition of E&E in 2014 (% of total E&E; 2010 constant prices)
• Computers and parts
• Telecommunications
• Office equipment
• Solar-related
• Lighting (e.g. LED)
• Home appliances
Electronic components Industrial electronics
Consumer electronics Electrical products
• Semiconductors
• Passive components
• Printed circuits
• Light-emitting diode
(LED) TV receivers
• Audio-visual products
1
3
2
4 Economic value chain of E&E industry by market segments
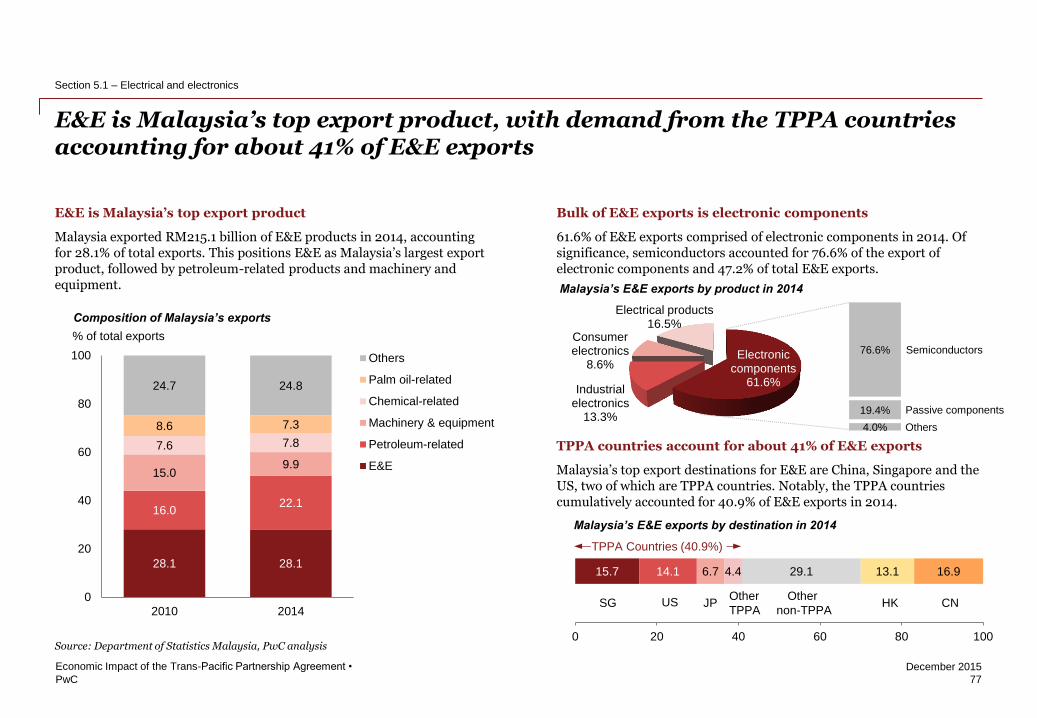
PwC
December 2015
E&E is Malaysia’s top export product, with demand from the TPPA countries accounting for about 41% of E&E exports
Economic Impact of the Trans-Pacific Partnership Agreement •
Section 5.1 – Electrical and electronics
E&E is Malaysia’s top export product
Malaysia exported RM215.1 billion of E&E products in 2014, accounting for 28.1% of total exports. This positions E&E as Malaysia’s largest export product, followed by petroleum-related products and machinery and equipment.
Source: Department of Statistics Malaysia, PwC analysis
28.1 28.1
16.0 22.1
15.0 9.9
7.6 7.8
8.6 7.3
24.7 24.8
0
20
40
60
80
100
2010 2014
Others
Palm oil-related
Chemical-related
Machinery & equipment
Petroleum-related
E&E
% of total exports
Composition of Malaysia’s exports
Bulk of E&E exports is electronic components
61.6% of E&E exports comprised of electronic components in 2014. Of significance, semiconductors accounted for 76.6% of the export of electronic components and 47.2% of total E&E exports.
TPPA countries account for about 41% of E&E exports
Malaysia’s top export destinations for E&E are China, Singapore and the US, two of which are TPPA countries. Notably, the TPPA countries cumulatively accounted for 40.9% of E&E exports in 2014.
Malaysia’s E&E exports by product in 2014
15.7 14.1 6.7 4.4 29.1 13.1 16.9
0 20 40 60 80 100
TPPA Countries (40.9%)
SG US JP CN HK Other
non-TPPA
Other
TPPA
Malaysia’s E&E exports by destination in 2014
Electronic components
61.6% Industrial
electronics 13.3%
Consumer electronics
8.6%
Electrical products 16.5%
76.6%
19.4%
4.0%
Semiconductors
Passive components
Others
77
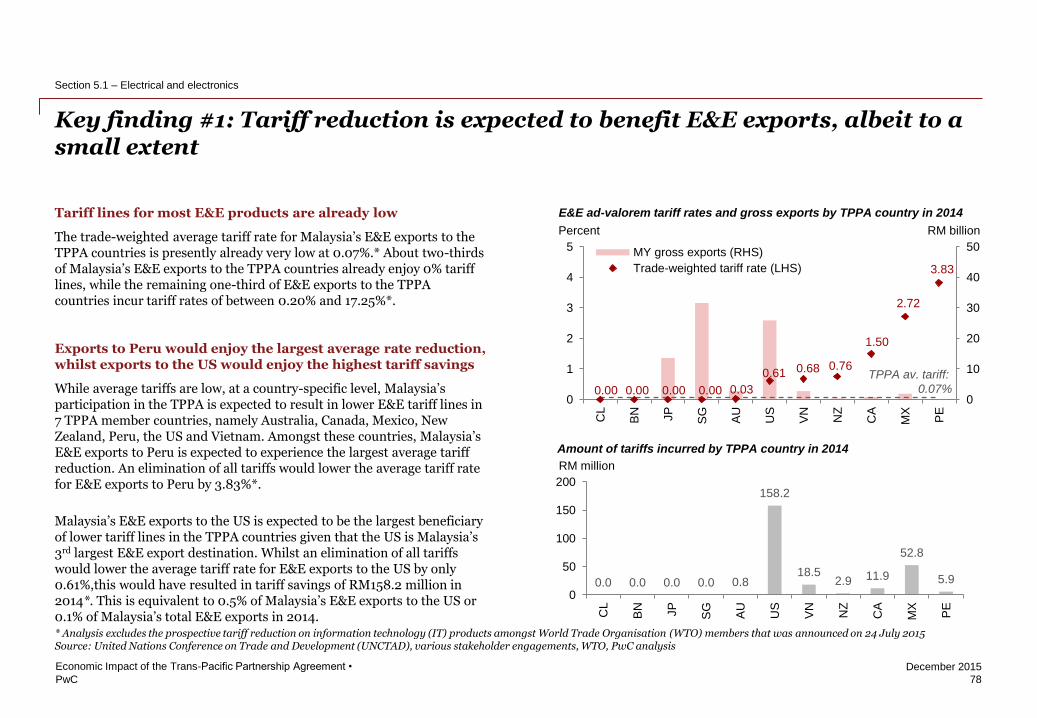
PwC
December 2015
0.00 0.00 0.00 0.00 0.03
0.61 0.68 0.76
1.50
2.72
3.83
0
10
20
30
40
50
0
1
2
3
4
5
CL
BN JP
SG
AU
US
VN
NZ
CA
MX
PE
MY gross exports (RHS)
Trade-weighted tariff rate (LHS)
Key finding #1: Tariff reduction is expected to benefit E&E exports, albeit to a small extent
78
Economic Impact of the Trans-Pacific Partnership Agreement •
Section 5.1 – Electrical and electronics
Tariff lines for most E&E products are already low
The trade-weighted average tariff rate for Malaysia’s E&E exports to the TPPA countries is presently already very low at 0.07%.* About two-thirds of Malaysia’s E&E exports to the TPPA countries already enjoy 0% tariff lines, while the remaining one-third of E&E exports to the TPPA countries incur tariff rates of between 0.20% and 17.25%*.
Exports to Peru would enjoy the largest average rate reduction, whilst exports to the US would enjoy the highest tariff savings
While average tariffs are low, at a country-specific level, Malaysia’s participation in the TPPA is expected to result in lower E&E tariff lines in 7 TPPA member countries, namely Australia, Canada, Mexico, New Zealand, Peru, the US and Vietnam. Amongst these countries, Malaysia’s E&E exports to Peru is expected to experience the largest average tariff reduction. An elimination of all tariffs would lower the average tariff rate for E&E exports to Peru by 3.83%*.
Malaysia’s E&E exports to the US is expected to be the largest beneficiary of lower tariff lines in the TPPA countries given that the US is Malaysia’s 3rd largest E&E export destination. Whilst an elimination of all tariffs would lower the average tariff rate for E&E exports to the US by only 0.61%,this would have resulted in tariff savings of RM158.2 million in 2014*. This is equivalent to 0.5% of Malaysia’s E&E exports to the US or 0.1% of Malaysia’s total E&E exports in 2014. * Analysis excludes the prospective tariff reduction on information technology (IT) products amongst World Trade Organisation (WTO) members that was announced on 24 July 2015 Source: United Nations Conference on Trade and Development (UNCTAD), various stakeholder engagements, WTO, PwC analysis
Percent RM billion
E&E ad-valorem tariff rates and gross exports by TPPA country in 2014
0.0 0.0 0.0 0.0 0.8
158.2
18.5 2.9 11.9
52.8
5.9
0
50
100
150
200
CL
BN JP
SG
AU
US
VN
NZ
CA
MX
PE
RM million
Amount of tariffs incurred by TPPA country in 2014
TPPA av. tariff:
0.07%
TPPA countries as Malaysia's E&E export destination
Rank Value (RM mil) Share (%)
Singapore 2 33,807.6 15.7
US 3 30,321.2 14.1
Japan 5 14,502.7 6.7
Mexico 13 2,955.9 1.4
Australia 14 2,921.3 1.4
Vietnam 15 2,826.5 1.3
Canada 22 773.1 0.4
New Zealand 29 412.8 0.2
Chile 41 149.1 0.1
Peru 46 119.5 0.1
Brunei 58 58.0 0.0
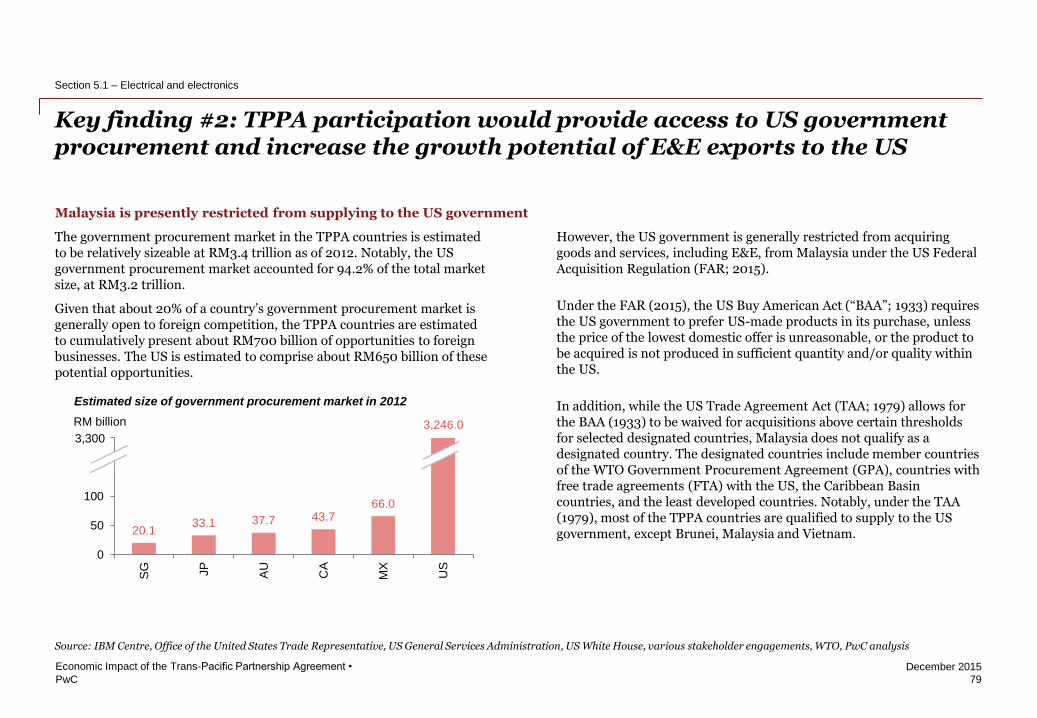
PwC
December 2015
20.1 33.1 37.7 43.7
66.0
0
50
100
150
200
SG JP
AU
CA
MX
US
Key finding #2: TPPA participation would provide access to US government procurement and increase the growth potential of E&E exports to the US
79
Economic Impact of the Trans-Pacific Partnership Agreement •
Section 5.1 – Electrical and electronics
The government procurement market in the TPPA countries is estimated to be relatively sizeable at RM3.4 trillion as of 2012. Notably, the US government procurement market accounted for 94.2% of the total market size, at RM3.2 trillion.
Given that about 20% of a country’s government procurement market is generally open to foreign competition, the TPPA countries are estimated to cumulatively present about RM700 billion of opportunities to foreign businesses. The US is estimated to comprise about RM650 billion of these potential opportunities.
Source: IBM Centre, Office of the United States Trade Representative, US General Services Administration, US White House, various stakeholder engagements, WTO, PwC analysis
However, the US government is generally restricted from acquiring goods and services, including E&E, from Malaysia under the US Federal Acquisition Regulation (FAR; 2015).
Under the FAR (2015), the US Buy American Act (“BAA”; 1933) requires the US government to prefer US-made products in its purchase, unless the price of the lowest domestic offer is unreasonable, or the product to be acquired is not produced in sufficient quantity and/or quality within the US.
In addition, while the US Trade Agreement Act (TAA; 1979) allows for the BAA (1933) to be waived for acquisitions above certain thresholds for selected designated countries, Malaysia does not qualify as a designated country. The designated countries include member countries of the WTO Government Procurement Agreement (GPA), countries with free trade agreements (FTA) with the US, the Caribbean Basin countries, and the least developed countries. Notably, under the TAA (1979), most of the TPPA countries are qualified to supply to the US government, except Brunei, Malaysia and Vietnam.
RM billion
Estimated size of government procurement market in 2012
3,246.0 3,300
Malaysia is presently restricted from supplying to the US government
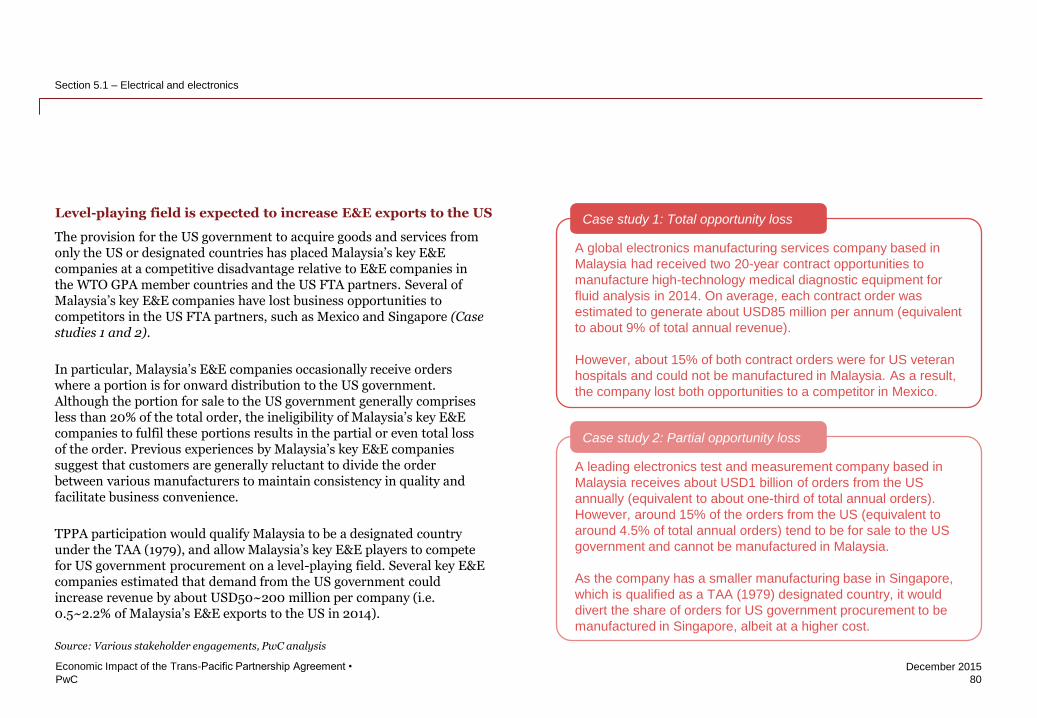
PwC
December 2015
80
Economic Impact of the Trans-Pacific Partnership Agreement •
Section 5.1 – Electrical and electronics
The provision for the US government to acquire goods and services from only the US or designated countries has placed Malaysia’s key E&E companies at a competitive disadvantage relative to E&E companies in the WTO GPA member countries and the US FTA partners. Several of Malaysia’s key E&E companies have lost business opportunities to competitors in the US FTA partners, such as Mexico and Singapore (Case studies 1 and 2).
In particular, Malaysia’s E&E companies occasionally receive orders where a portion is for onward distribution to the US government. Although the portion for sale to the US government generally comprises less than 20% of the total order, the ineligibility of Malaysia’s key E&E companies to fulfil these portions results in the partial or even total loss of the order. Previous experiences by Malaysia’s key E&E companies suggest that customers are generally reluctant to divide the order between various manufacturers to maintain consistency in quality and facilitate business convenience.
TPPA participation would qualify Malaysia to be a designated country under the TAA (1979), and allow Malaysia’s key E&E players to compete for US government procurement on a level-playing field. Several key E&E companies estimated that demand from the US government could increase revenue by about USD50~200 million per company (i.e. 0.5~2.2% of Malaysia’s E&E exports to the US in 2014).
Source: Various stakeholder engagements, PwC analysis
Case study 1: Total opportunity loss
A global electronics manufacturing services company based in
Malaysia had received two 20-year contract opportunities to
manufacture high-technology medical diagnostic equipment for
fluid analysis in 2014. On average, each contract order was
estimated to generate about USD85 million per annum (equivalent
to about 9% of total annual revenue).
However, about 15% of both contract orders were for US veteran
hospitals and could not be manufactured in Malaysia. As a result,
the company lost both opportunities to a competitor in Mexico.
Case study 2: Partial opportunity loss
A leading electronics test and measurement company based in
Malaysia receives about USD1 billion of orders from the US
annually (equivalent to about one-third of total annual orders).
However, around 15% of the orders from the US (equivalent to
around 4.5% of total annual orders) tend to be for sale to the US
government and cannot be manufactured in Malaysia.
As the company has a smaller manufacturing base in Singapore,
which is qualified as a TAA (1979) designated country, it would
divert the share of orders for US government procurement to be
manufactured in Singapore, albeit at a higher cost.
Level-playing field is expected to increase E&E exports to the US
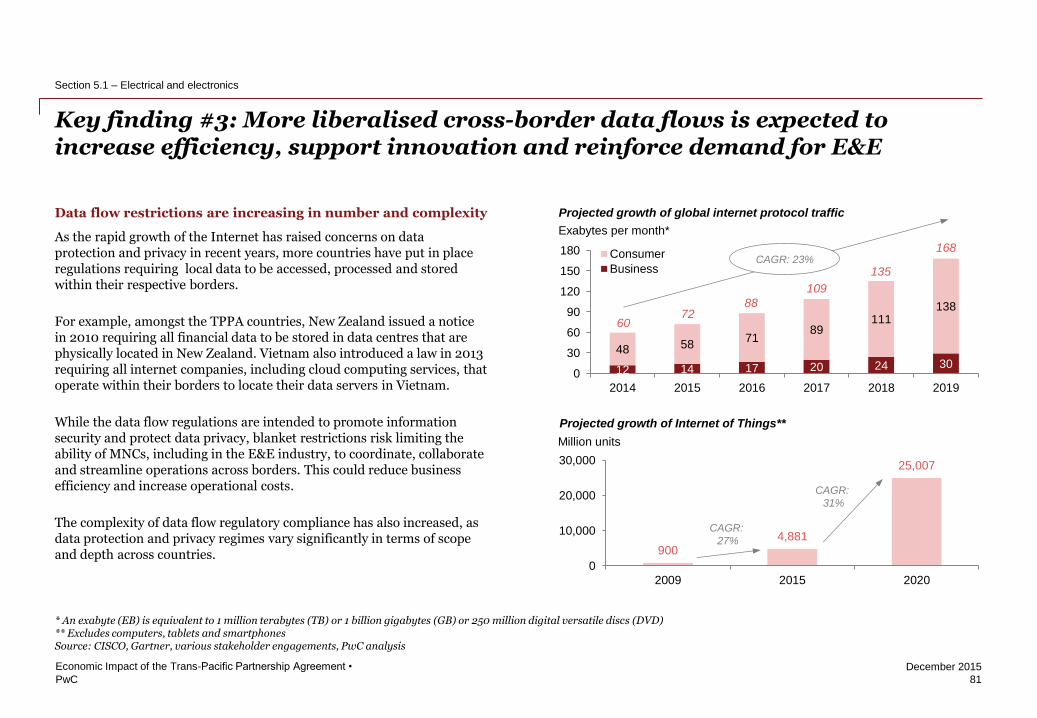
PwC
December 2015
12 14 17 20 24 30
48 58 71
89 111
138
0
30
60
90
120
150
180
2014 2015 2016 2017 2018 2019
Consumer
Business
Key finding #3: More liberalised cross-border data flows is expected to increase efficiency, support innovation and reinforce demand for E&E
81
Economic Impact of the Trans-Pacific Partnership Agreement •
Section 5.1 – Electrical and electronics
Data flow restrictions are increasing in number and complexity
As the rapid growth of the Internet has raised concerns on data protection and privacy in recent years, more countries have put in place regulations requiring local data to be accessed, processed and stored within their respective borders.
For example, amongst the TPPA countries, New Zealand issued a notice in 2010 requiring all financial data to be stored in data centres that are physically located in New Zealand. Vietnam also introduced a law in 2013 requiring all internet companies, including cloud computing services, that operate within their borders to locate their data servers in Vietnam.
While the data flow regulations are intended to promote information security and protect data privacy, blanket restrictions risk limiting the ability of MNCs, including in the E&E industry, to coordinate, collaborate and streamline operations across borders. This could reduce business efficiency and increase operational costs.
The complexity of data flow regulatory compliance has also increased, as data protection and privacy regimes vary significantly in terms of scope and depth across countries.
* An exabyte (EB) is equivalent to 1 million terabytes (TB) or 1 billion gigabytes (GB) or 250 million digital versatile discs (DVD) ** Excludes computers, tablets and smartphones Source: CISCO, Gartner, various stakeholder engagements, PwC analysis
Exabytes per month*
Projected growth of global internet protocol traffic
900 4,881
25,007
0
10,000
20,000
30,000
2009 2015 2020
Million units
Projected growth of Internet of Things**
60 72
88
109
135
168 CAGR: 23%
CAGR:
27%
CAGR:
31%
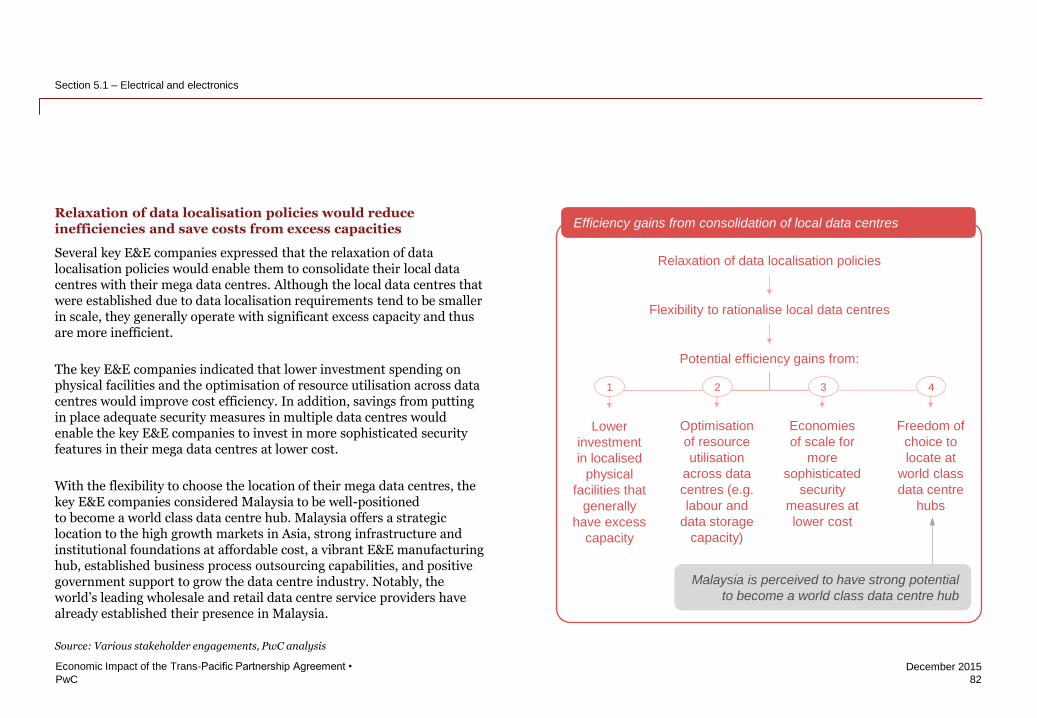
PwC
December 2015
82
Economic Impact of the Trans-Pacific Partnership Agreement •
Section 5.1 – Electrical and electronics
Relaxation of data localisation policies would reduce inefficiencies and save costs from excess capacities
Several key E&E companies expressed that the relaxation of data localisation policies would enable them to consolidate their local data centres with their mega data centres. Although the local data centres that were established due to data localisation requirements tend to be smaller in scale, they generally operate with significant excess capacity and thus are more inefficient.
The key E&E companies indicated that lower investment spending on physical facilities and the optimisation of resource utilisation across data centres would improve cost efficiency. In addition, savings from putting in place adequate security measures in multiple data centres would enable the key E&E companies to invest in more sophisticated security features in their mega data centres at lower cost.
With the flexibility to choose the location of their mega data centres, the key E&E companies considered Malaysia to be well-positioned to become a world class data centre hub. Malaysia offers a strategic location to the high growth markets in Asia, strong infrastructure and institutional foundations at affordable cost, a vibrant E&E manufacturing hub, established business process outsourcing capabilities, and positive government support to grow the data centre industry. Notably, the world’s leading wholesale and retail data centre service providers have already established their presence in Malaysia.
Source: Various stakeholder engagements, PwC analysis
Efficiency gains from consolidation of local data centres
Relaxation of data localisation policies
Flexibility to rationalise local data centres
Potential efficiency gains from:
Lower
investment
in localised
physical
facilities that
generally
have excess
capacity
Optimisation
of resource
utilisation
across data
centres (e.g.
labour and
data storage
capacity)
Freedom of
choice to
locate at
world class
data centre
hubs
Economies
of scale for
more
sophisticated
security
measures at
lower cost
Malaysia is perceived to have strong potential
to become a world class data centre hub
1 2 3 4
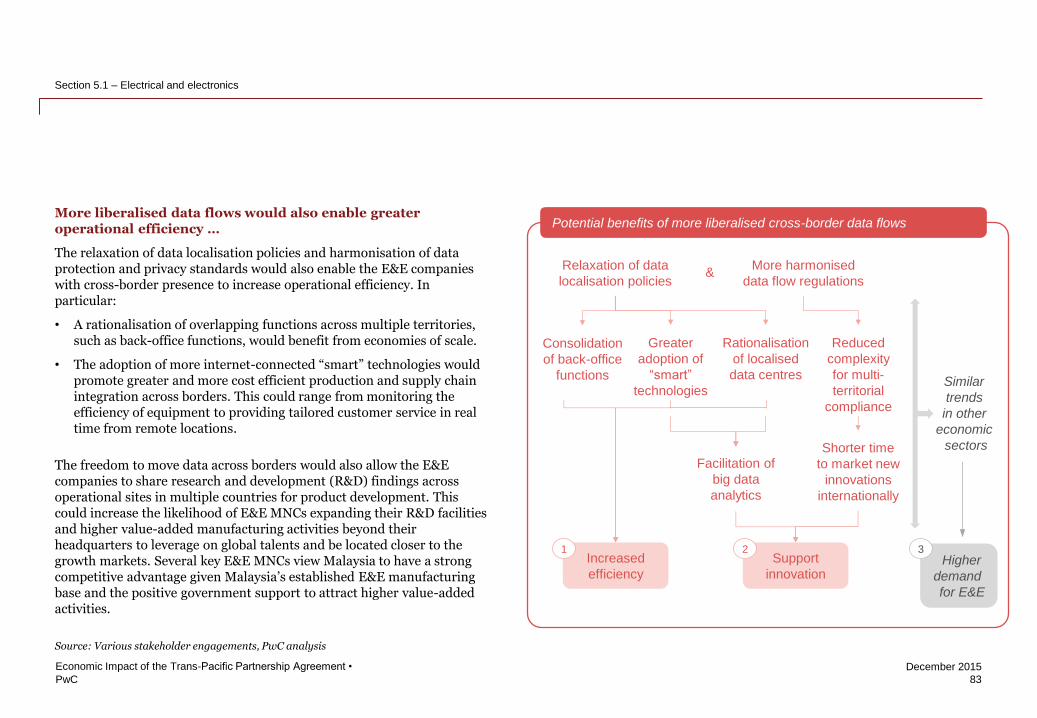
PwC
December 2015
83
Economic Impact of the Trans-Pacific Partnership Agreement •
Section 5.1 – Electrical and electronics
More liberalised data flows would also enable greater operational efficiency …
The relaxation of data localisation policies and harmonisation of data protection and privacy standards would also enable the E&E companies with cross-border presence to increase operational efficiency. In particular:
• A rationalisation of overlapping functions across multiple territories, such as back-office functions, would benefit from economies of scale.
• The adoption of more internet-connected “smart” technologies would promote greater and more cost efficient production and supply chain integration across borders. This could range from monitoring the efficiency of equipment to providing tailored customer service in real time from remote locations.
The freedom to move data across borders would also allow the E&E companies to share research and development (R&D) findings across operational sites in multiple countries for product development. This could increase the likelihood of E&E MNCs expanding their R&D facilities and higher value-added manufacturing activities beyond their headquarters to leverage on global talents and be located closer to the growth markets. Several key E&E MNCs view Malaysia to have a strong competitive advantage given Malaysia’s established E&E manufacturing base and the positive government support to attract higher value-added activities.
Source: Various stakeholder engagements, PwC analysis
Greater
adoption of
“smart”
technologies
Relaxation of data
localisation policies
More harmonised
data flow regulations
Consolidation
of back-office
functions
Reduced
complexity
for multi-
territorial
compliance
Rationalisation
of localised
data centres
&
Facilitation of
big data
analytics
Shorter time
to market new
innovations
internationally
Increased
efficiency
Support
innovation Higher
demand
for E&E
Similar
trends
in other
economic
sectors
1 2 3
Potential benefits of more liberalised cross-border data flows
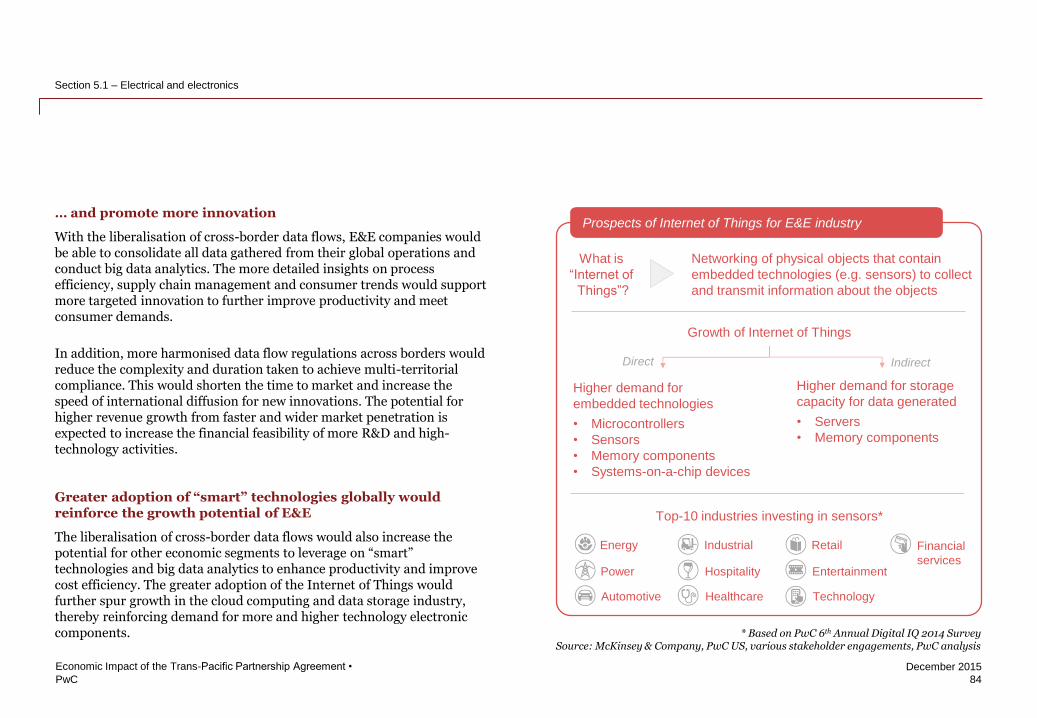
PwC
December 2015
84
Economic Impact of the Trans-Pacific Partnership Agreement •
Section 5.1 – Electrical and electronics
… and promote more innovation
With the liberalisation of cross-border data flows, E&E companies would be able to consolidate all data gathered from their global operations and conduct big data analytics. The more detailed insights on process efficiency, supply chain management and consumer trends would support more targeted innovation to further improve productivity and meet consumer demands.
In addition, more harmonised data flow regulations across borders would reduce the complexity and duration taken to achieve multi-territorial compliance. This would shorten the time to market and increase the speed of international diffusion for new innovations. The potential for higher revenue growth from faster and wider market penetration is expected to increase the financial feasibility of more R&D and high-technology activities.
Greater adoption of “smart” technologies globally would reinforce the growth potential of E&E
The liberalisation of cross-border data flows would also increase the potential for other economic segments to leverage on “smart” technologies and big data analytics to enhance productivity and improve cost efficiency. The greater adoption of the Internet of Things would further spur growth in the cloud computing and data storage industry, thereby reinforcing demand for more and higher technology electronic components. * Based on PwC 6th Annual Digital IQ 2014 Survey
Source: McKinsey & Company, PwC US, various stakeholder engagements, PwC analysis
Prospects of Internet of Things for E&E industry
What is
“Internet of
Things”?
Growth of Internet of Things
Higher demand for
embedded technologies
• Microcontrollers
• Sensors
• Memory components
• Systems-on-a-chip devices
Higher demand for storage
capacity for data generated
• Servers
• Memory components
Networking of physical objects that contain
embedded technologies (e.g. sensors) to collect
and transmit information about the objects
Direct Indirect
Top-10 industries investing in sensors*
Energy
Power
Automotive
Industrial
Hospitality
Healthcare
Retail
Entertainment
Technology
Financial
services
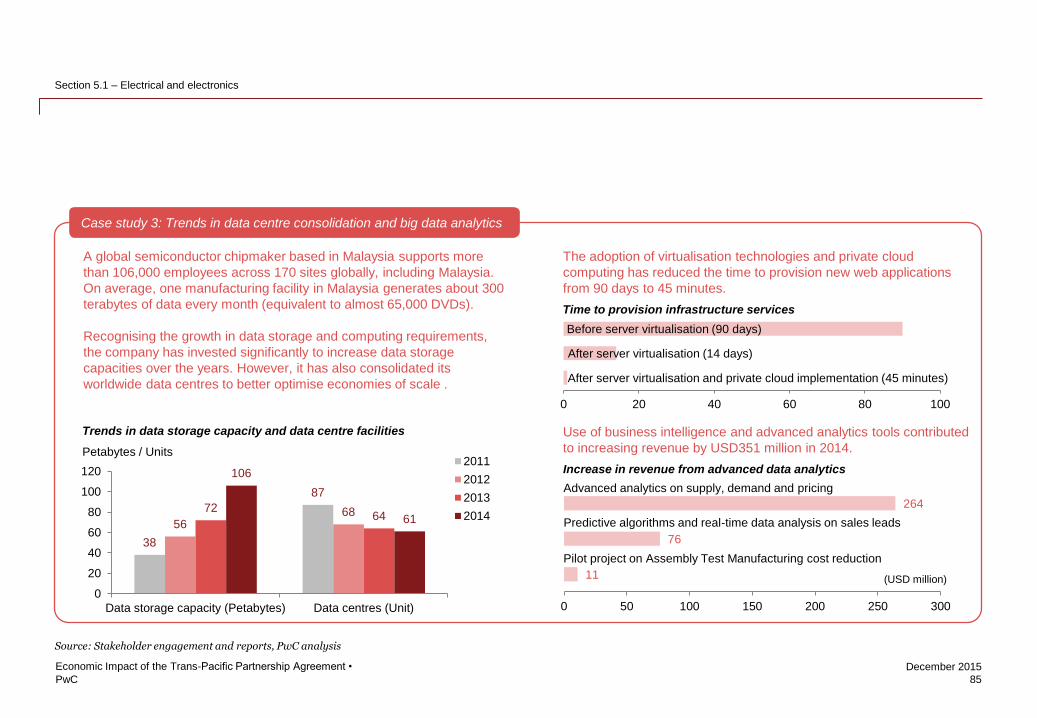
PwC
December 2015
11
76
264
0 50 100 150 200 250 300
0 20 40 60 80 100
The adoption of virtualisation technologies and private cloud
computing has reduced the time to provision new web applications
from 90 days to 45 minutes.
Use of business intelligence and advanced analytics tools contributed
to increasing revenue by USD351 million in 2014.
85
Economic Impact of the Trans-Pacific Partnership Agreement •
Section 5.1 – Electrical and electronics
Source: Stakeholder engagement and reports, PwC analysis
Case study 3: Trends in data centre consolidation and big data analytics
A global semiconductor chipmaker based in Malaysia supports more
than 106,000 employees across 170 sites globally, including Malaysia.
On average, one manufacturing facility in Malaysia generates about 300
terabytes of data every month (equivalent to almost 65,000 DVDs).
Recognising the growth in data storage and computing requirements,
the company has invested significantly to increase data storage
capacities over the years. However, it has also consolidated its
worldwide data centres to better optimise economies of scale .
38
87
56 68 72
64
106
61
0
20
40
60
80
100
120
Data storage capacity (Petabytes) Data centres (Unit)
2011
2012
2013
2014
Petabytes / Units
Trends in data storage capacity and data centre facilities
Advanced analytics on supply, demand and pricing
(USD million)
Increase in revenue from advanced data analytics
Predictive algorithms and real-time data analysis on sales leads
Pilot project on Assembly Test Manufacturing cost reduction
Before server virtualisation (90 days)
Time to provision infrastructure services
After server virtualisation (14 days)
After server virtualisation and private cloud implementation (45 minutes)
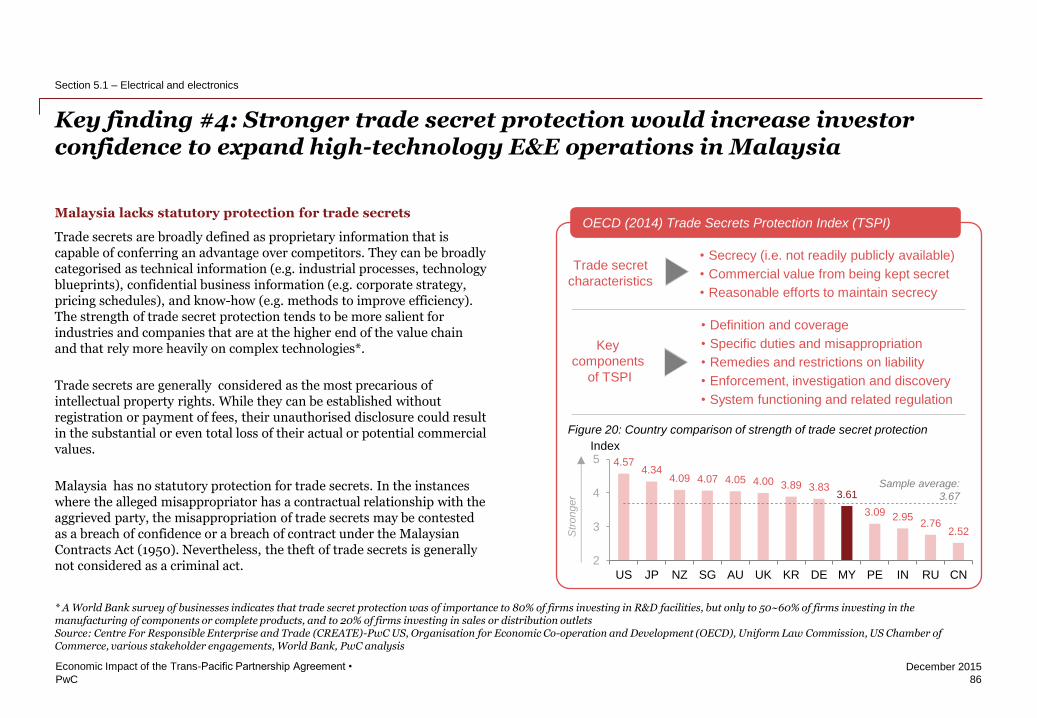
PwC
December 2015
Key finding #4: Stronger trade secret protection would increase investor confidence to expand high-technology E&E operations in Malaysia
86
Economic Impact of the Trans-Pacific Partnership Agreement •
Section 5.1 – Electrical and electronics
Malaysia lacks statutory protection for trade secrets
Trade secrets are broadly defined as proprietary information that is capable of conferring an advantage over competitors. They can be broadly categorised as technical information (e.g. industrial processes, technology blueprints), confidential business information (e.g. corporate strategy, pricing schedules), and know-how (e.g. methods to improve efficiency). The strength of trade secret protection tends to be more salient for industries and companies that are at the higher end of the value chain and that rely more heavily on complex technologies*.
Trade secrets are generally considered as the most precarious of intellectual property rights. While they can be established without registration or payment of fees, their unauthorised disclosure could result in the substantial or even total loss of their actual or potential commercial values.
Malaysia has no statutory protection for trade secrets. In the instances where the alleged misappropriator has a contractual relationship with the aggrieved party, the misappropriation of trade secrets may be contested as a breach of confidence or a breach of contract under the Malaysian Contracts Act (1950). Nevertheless, the theft of trade secrets is generally not considered as a criminal act.
* A World Bank survey of businesses indicates that trade secret protection was of importance to 80% of firms investing in R&D facilities, but only to 50~60% of firms investing in the manufacturing of components or complete products, and to 20% of firms investing in sales or distribution outlets Source: Centre For Responsible Enterprise and Trade (CREATE)-PwC US, Organisation for Economic Co-operation and Development (OECD), Uniform Law Commission, US Chamber of Commerce, various stakeholder engagements, World Bank, PwC analysis
OECD (2014) Trade Secrets Protection Index (TSPI)
4.57 4.34
4.09 4.07 4.05 4.00 3.89 3.83 3.61
3.09 2.95 2.76
2.52
2
3
4
5
US JP NZ SG AU UK KR DE MY PE IN RU CN
Index
Sample average:
3.67
Str
onger
Figure 20: Country comparison of strength of trade secret protection
Trade secret
characteristics
• Secrecy (i.e. not readily publicly available)
• Commercial value from being kept secret
• Reasonable efforts to maintain secrecy
Key
components
of TSPI
• Definition and coverage
• Specific duties and misappropriation
• Remedies and restrictions on liability
• Enforcement, investigation and discovery
• System functioning and related regulation
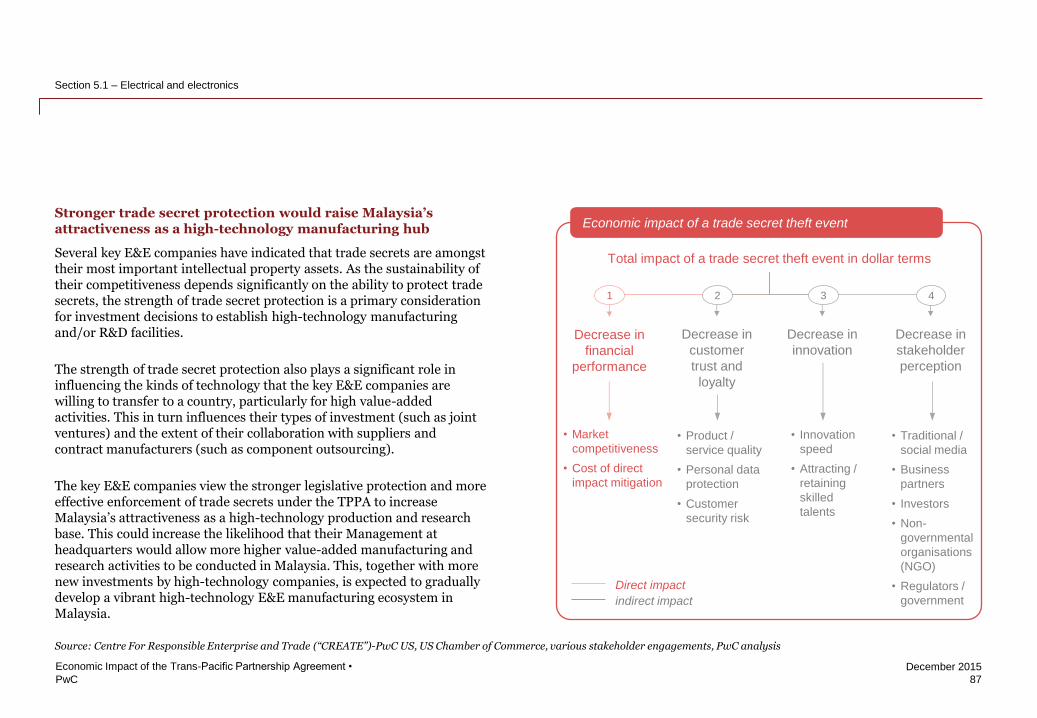
PwC
December 2015
87
Economic Impact of the Trans-Pacific Partnership Agreement •
Section 5.1 – Electrical and electronics
Stronger trade secret protection would raise Malaysia’s attractiveness as a high-technology manufacturing hub
Several key E&E companies have indicated that trade secrets are amongst their most important intellectual property assets. As the sustainability of their competitiveness depends significantly on the ability to protect trade secrets, the strength of trade secret protection is a primary consideration for investment decisions to establish high-technology manufacturing and/or R&D facilities.
The strength of trade secret protection also plays a significant role in influencing the kinds of technology that the key E&E companies are willing to transfer to a country, particularly for high value-added activities. This in turn influences their types of investment (such as joint ventures) and the extent of their collaboration with suppliers and contract manufacturers (such as component outsourcing).
The key E&E companies view the stronger legislative protection and more effective enforcement of trade secrets under the TPPA to increase Malaysia’s attractiveness as a high-technology production and research base. This could increase the likelihood that their Management at headquarters would allow more higher value-added manufacturing and research activities to be conducted in Malaysia. This, together with more new investments by high-technology companies, is expected to gradually develop a vibrant high-technology E&E manufacturing ecosystem in Malaysia.
Source: Centre For Responsible Enterprise and Trade (“CREATE”)-PwC US, US Chamber of Commerce, various stakeholder engagements, PwC analysis
Economic impact of a trade secret theft event
Total impact of a trade secret theft event in dollar terms
Decrease in
financial
performance
Decrease in
customer
trust and
loyalty
Decrease in
stakeholder
perception
Decrease in
innovation
1 2 3 4
• Market
competitiveness
• Cost of direct
impact mitigation
• Product /
service quality
• Personal data
protection
• Customer
security risk
• Traditional /
social media
• Business
partners
• Investors
• Non-
governmental
organisations
(NGO)
• Regulators /
government
• Innovation
speed
• Attracting /
retaining
skilled
talents
Direct impact
indirect impact

PwC
December 2015
Key finding #5: Adoption of ILO rights is expected to improve perception of labour standards and increase labour costs only marginally
88
Economic Impact of the Trans-Pacific Partnership Agreement •
Section 5.1 – Electrical and electronics
Labour practices of most key E&E companies already conform to the principles under the ILO Declaration 1998
Most key E&E companies have adopted labour practices that comply with international human rights standards, such as the United Nations (UN) Universal Declaration of Human Rights (1948), the International Labour Organisation (ILO) Declaration of Fundamental Principles and Rights at Work (1998), and the Organisation for Economic Cooperation and Development (OECD) Guidelines for Multinationals (2011).
In particular, 56 E&E MNCs* based in Malaysia are members of the Electronics Industry Citizenship Coalition (EICC), the world’s largest industry coalition that is dedicated to electronics supply chain responsibility. They are governed by the EICC Code of Conduct, which outlines responsibilities on labour, health and safety, environment, ethics, and management systems that are aligned to leading international standards, including the ILO Declaration 1998.
As the EICC promotes its Code of Conduct as a total supply chain initiative, all suppliers and contractors to companies that endorse the EICC Code of Conduct are also required to adopt the same standards. Notably, surveys by InvestPenang indicate that 4 out of 5 E&E companies in Penang had complied with the EICC Code of Conduct in 2014.
* Out of 104 EICC members globally; equivalent to 53.8% of the EICC membership Source: EICC, ILO, InvestPenang, OECD, UN, various stakeholder engagements, PwC analysis
Comparison of EICC Code of Conduct on Labour to Principles
under the ILO Declaration 1998
EICC Code of Conduct on Labour ILO Principles
1. Freedom of association to organise labour unions
in accordance with local laws
2. Elimination of all forms of forced, bonded,
indentured or involuntary prison labour
3. Elimination of exploitative child labour
4. Elimination of discriminatory practices with
respect to employment
5. Prohibition of harsh or inhumane treatment (e.g.
physical abuse, harassment, or the threat of either)
6. Imposition of limits on working hours (i.e. no more
than 60 hours per week and 1 day off per 7-day week)
7. Compliance to legally required minimum wages
and benefits
Notes:
1. The team met with 4 EICC members:
(1) Intel
(2) Plexus Manufacturing
(3) SMART Technologies
(4) Texas Instruments

PwC
December 2015
89
Economic Impact of the Trans-Pacific Partnership Agreement •
Section 5.1 – Electrical and electronics
Increase in labour cost is likely to be small in the short term
Given that the labour practices of most key E&E companies already conform to international human rights standards, the adoption of the rights under the ILO Declaration 1998 is expected to lead to minimal changes in the labour practices of these companies.
Should the effective enforcement of labour rights standards be more stringent than current practices, most key E&E companies expect labour costs to increase only marginally in the short term. Labour costs generally account for less than 30% of operating costs in these companies, while foreign workers generally comprise less than 50% of their low-skilled workforce.
For some smaller manufacturing companies that are heavily reliant on foreign workers, such as the lower-tiered contract manufacturers, the adoption of the rights under the ILO Declaration 1998 could result in a more significant increase in labour costs. Nevertheless, amidst increasing consumer action against products with poor labour content and tighter procurement requirements by higher-tiered manufacturers, these companies are expected to move towards complying with international human rights standards going forward, irrespective of Malaysia’s participation in the TPPA.
Source: Various stakeholder engagements
Risk of production disruption is expected to remain low
The risk of collective bargaining and production disruption arising from labour disputes is also expected to remain low in the E&E industry following Malaysia’s participation in the TPPA. While most E&E workers presently have the right to freedom of association, the rate of unionisation and the incidence of labour disruption have been low.
Negative perception on labour standards will be reduced
Following increasing consumer awareness on poor labour conditions in the global E&E industry, including Malaysia, in recent years, many of Malaysia’s key E&E companies have been required to explicitly disclose their labour practices by their customers. While Malaysia’s key E&E companies have maintained existing customer relationships, the negative public perception of Malaysia’s labour rights could have resulted in a loss of new business opportunities.
Most key E&E companies expect Malaysia’s adoption of the ILO rights following Malaysia’s participation in the TPPA to improve the public perception of labour rights in Malaysia’s E&E industry. This could in turn attract greater business and investment opportunities for Malaysia’s E&E industry.
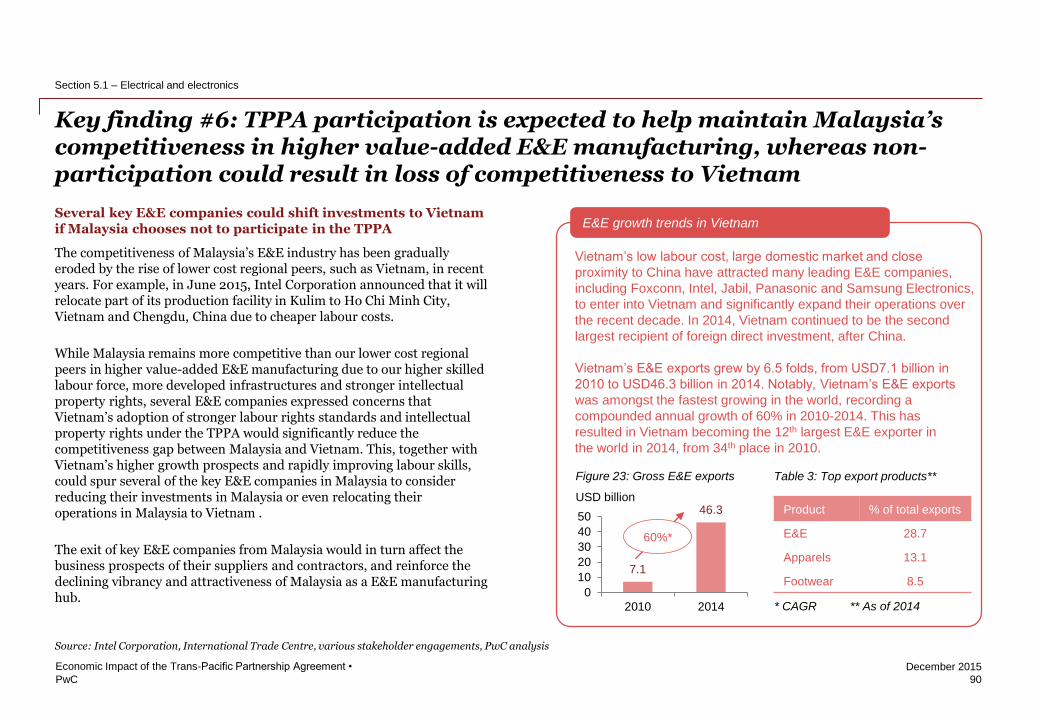
PwC
December 2015
Key finding #6: TPPA participation is expected to help maintain Malaysia’s competitiveness in higher value-added E&E manufacturing, whereas non-participation could result in loss of competitiveness to Vietnam
90
Economic Impact of the Trans-Pacific Partnership Agreement •
Section 5.1 – Electrical and electronics
Several key E&E companies could shift investments to Vietnam if Malaysia chooses not to participate in the TPPA
The competitiveness of Malaysia’s E&E industry has been gradually eroded by the rise of lower cost regional peers, such as Vietnam, in recent years. For example, in June 2015, Intel Corporation announced that it will relocate part of its production facility in Kulim to Ho Chi Minh City, Vietnam and Chengdu, China due to cheaper labour costs.
While Malaysia remains more competitive than our lower cost regional peers in higher value-added E&E manufacturing due to our higher skilled labour force, more developed infrastructures and stronger intellectual property rights, several E&E companies expressed concerns that Vietnam’s adoption of stronger labour rights standards and intellectual property rights under the TPPA would significantly reduce the competitiveness gap between Malaysia and Vietnam. This, together with Vietnam’s higher growth prospects and rapidly improving labour skills, could spur several of the key E&E companies in Malaysia to consider reducing their investments in Malaysia or even relocating their operations in Malaysia to Vietnam .
The exit of key E&E companies from Malaysia would in turn affect the business prospects of their suppliers and contractors, and reinforce the declining vibrancy and attractiveness of Malaysia as a E&E manufacturing hub.
Source: Intel Corporation, International Trade Centre, various stakeholder engagements, PwC analysis
E&E growth trends in Vietnam
Vietnam’s low labour cost, large domestic market and close
proximity to China have attracted many leading E&E companies,
including Foxconn, Intel, Jabil, Panasonic and Samsung Electronics,
to enter into Vietnam and significantly expand their operations over
the recent decade. In 2014, Vietnam continued to be the second
largest recipient of foreign direct investment, after China.
Vietnam’s E&E exports grew by 6.5 folds, from USD7.1 billion in
2010 to USD46.3 billion in 2014. Notably, Vietnam’s E&E exports
was amongst the fastest growing in the world, recording a
compounded annual growth of 60% in 2010-2014. This has
resulted in Vietnam becoming the 12th largest E&E exporter in
the world in 2014, from 34th place in 2010.
7.1
46.3
0
10
20
30
40
50
2010 2014
USD billion
Figure 23: Gross E&E exports
60%*
Table 3: Top export products**
Product % of total exports
E&E 28.7
Apparels 13.1
Footwear 8.5
* CAGR ** As of 2014
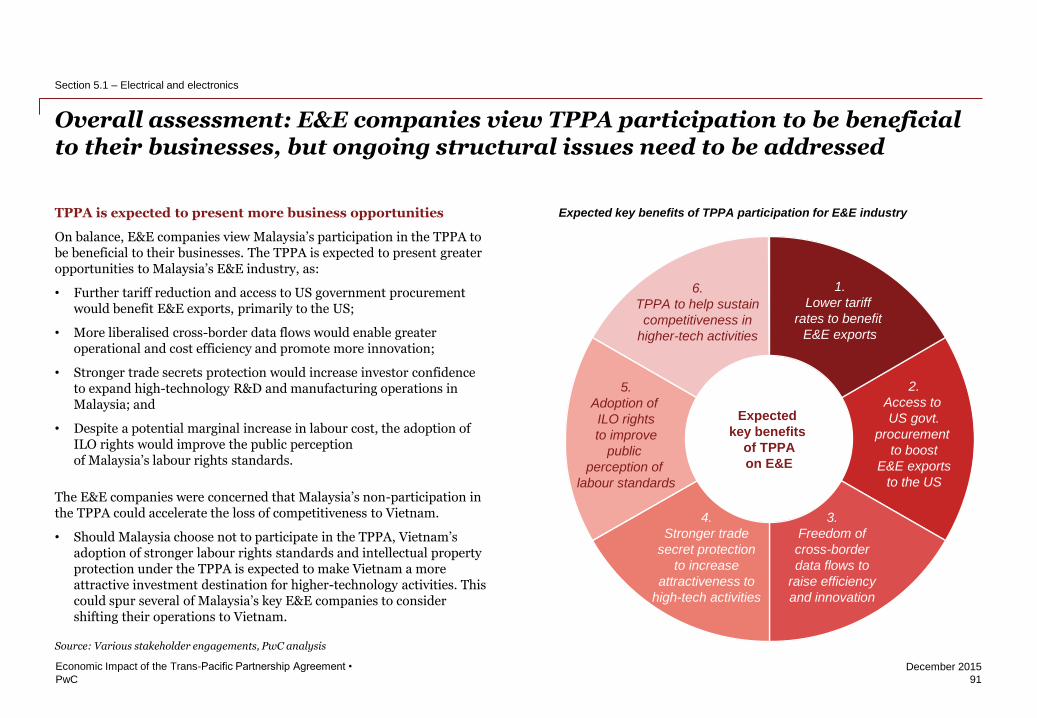
PwC
December 2015
Overall assessment: E&E companies view TPPA participation to be beneficial to their businesses, but ongoing structural issues need to be addressed
91
Economic Impact of the Trans-Pacific Partnership Agreement •
Section 5.1 – Electrical and electronics
TPPA is expected to present more business opportunities
On balance, E&E companies view Malaysia’s participation in the TPPA to be beneficial to their businesses. The TPPA is expected to present greater opportunities to Malaysia’s E&E industry, as:
• Further tariff reduction and access to US government procurement would benefit E&E exports, primarily to the US;
• More liberalised cross-border data flows would enable greater operational and cost efficiency and promote more innovation;
• Stronger trade secrets protection would increase investor confidence to expand high-technology R&D and manufacturing operations in Malaysia; and
• Despite a potential marginal increase in labour cost, the adoption of ILO rights would improve the public perception of Malaysia’s labour rights standards.
The E&E companies were concerned that Malaysia’s non-participation in the TPPA could accelerate the loss of competitiveness to Vietnam.
• Should Malaysia choose not to participate in the TPPA, Vietnam’s adoption of stronger labour rights standards and intellectual property protection under the TPPA is expected to make Vietnam a more attractive investment destination for higher-technology activities. This could spur several of Malaysia’s key E&E companies to consider shifting their operations to Vietnam.
Source: Various stakeholder engagements, PwC analysis
Expected
key benefits
of TPPA
on E&E
6.
TPPA to help sustain
competitiveness in
higher-tech activities
1.
Lower tariff
rates to benefit
E&E exports
2.
Access to
US govt.
procurement
to boost
E&E exports
to the US
5.
Adoption of
ILO rights
to improve
public
perception of
labour standards
4.
Stronger trade
secret protection
to increase
attractiveness to
high-tech activities
3.
Freedom of
cross-border
data flows to
raise efficiency
and innovation
Expected key benefits of TPPA participation for E&E industry
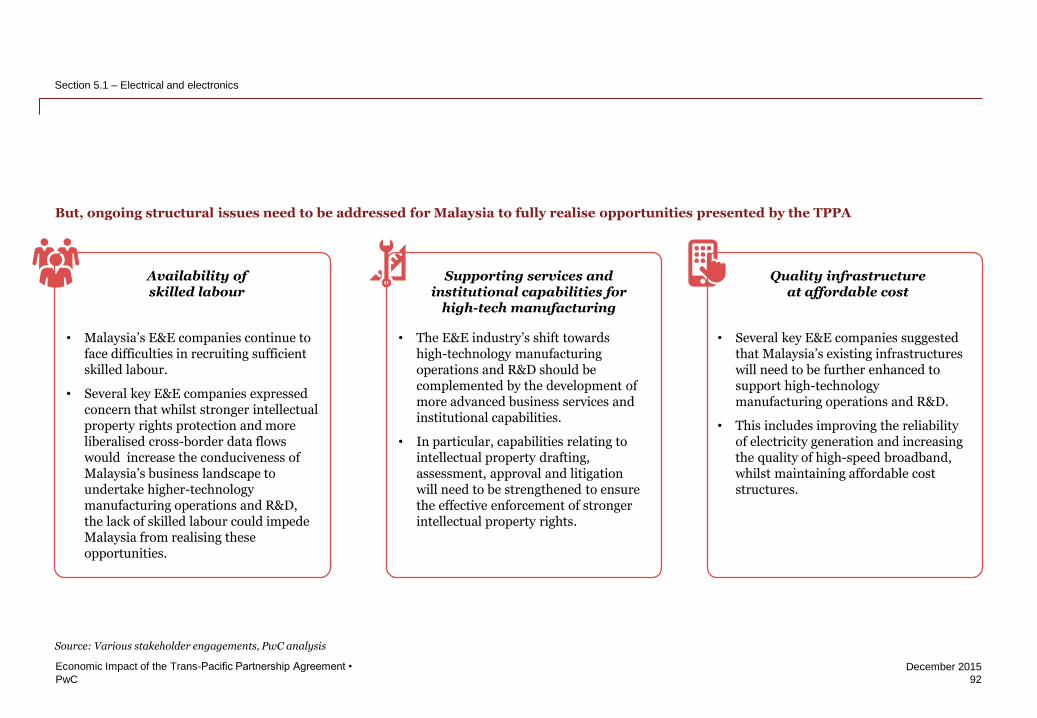
PwC
December 2015
92
Economic Impact of the Trans-Pacific Partnership Agreement •
Section 5.1 – Electrical and electronics
Availability of skilled labour
Source: Various stakeholder engagements, PwC analysis
But, ongoing structural issues need to be addressed for Malaysia to fully realise opportunities presented by the TPPA
Supporting services and institutional capabilities for
high-tech manufacturing
Quality infrastructure at affordable cost
• Malaysia’s E&E companies continue to face difficulties in recruiting sufficient skilled labour.
• Several key E&E companies expressed concern that whilst stronger intellectual property rights protection and more liberalised cross-border data flows would increase the conduciveness of Malaysia’s business landscape to undertake higher-technology manufacturing operations and R&D, the lack of skilled labour could impede Malaysia from realising these opportunities.
• The E&E industry’s shift towards high-technology manufacturing operations and R&D should be complemented by the development of more advanced business services and institutional capabilities.
• In particular, capabilities relating to intellectual property drafting, assessment, approval and litigation will need to be strengthened to ensure the effective enforcement of stronger intellectual property rights.
• Several key E&E companies suggested that Malaysia’s existing infrastructures will need to be further enhanced to support high-technology manufacturing operations and R&D.
• This includes improving the reliability of electricity generation and increasing the quality of high-speed broadband, whilst maintaining affordable cost structures.
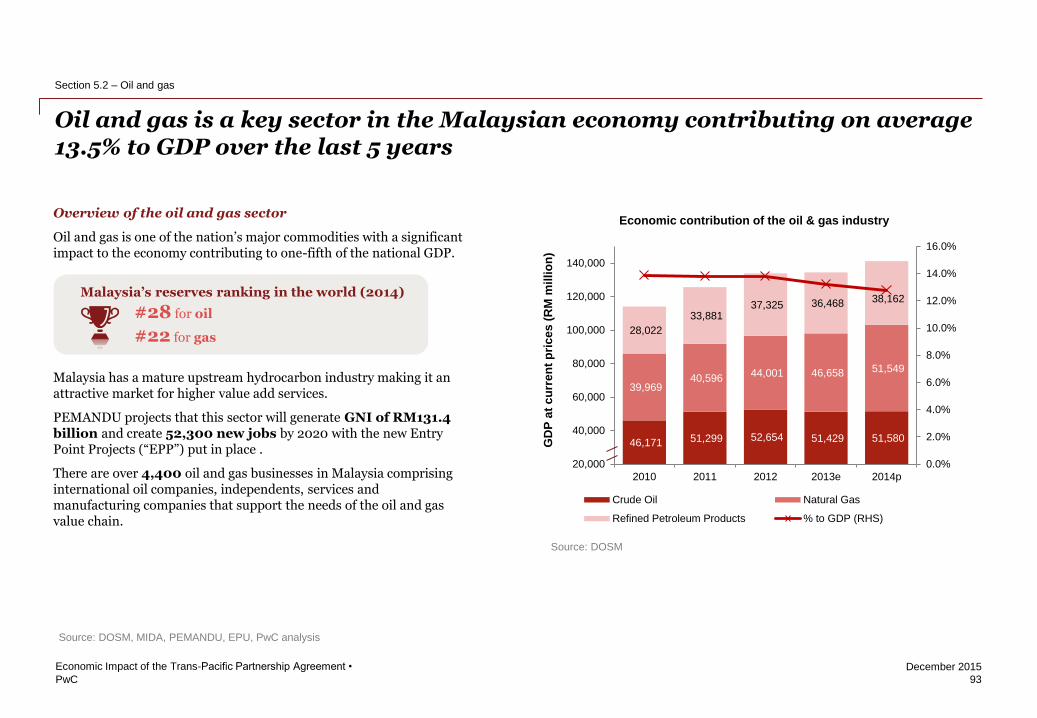
PwC
December 2015
46,171 51,299 52,654 51,429 51,580
39,969 40,596
44,001 46,658 51,549
28,022
33,881 37,325 36,468 38,162
0.0%
2.0%
4.0%
6.0%
8.0%
10.0%
12.0%
14.0%
16.0%
20,000
40,000
60,000
80,000
100,000
120,000
140,000
2010 2011 2012 2013e 2014p
GD
P a
t c
urr
en
t p
ric
es
(R
M m
illi
on
)
Economic contribution of the oil & gas industry
Crude Oil Natural Gas
Refined Petroleum Products % to GDP (RHS)
Overview of the oil and gas sector
Oil and gas is one of the nation’s major commodities with a significant impact to the economy contributing to one-fifth of the national GDP.
Malaysia has a mature upstream hydrocarbon industry making it an attractive market for higher value add services.
PEMANDU projects that this sector will generate GNI of RM131.4 billion and create 52,300 new jobs by 2020 with the new Entry Point Projects (“EPP”) put in place .
There are over 4,400 oil and gas businesses in Malaysia comprising international oil companies, independents, services and manufacturing companies that support the needs of the oil and gas value chain.
Oil and gas is a key sector in the Malaysian economy contributing on average 13.5% to GDP over the last 5 years
Source: DOSM, MIDA, PEMANDU, EPU, PwC analysis
#28 for oil
#22 for gas
Malaysia’s reserves ranking in the world (2014)
93
Economic Impact of the Trans-Pacific Partnership Agreement •
Section 5.2 – Oil and gas
Source: DOSM
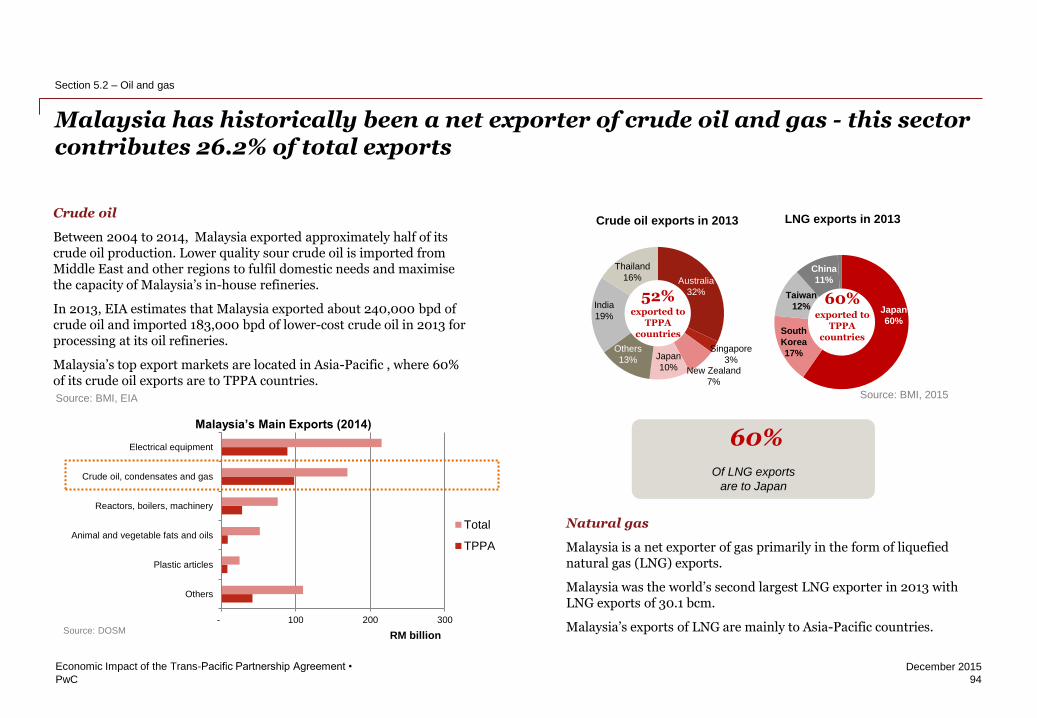
PwC
December 2015
- 100 200 300
Others
Plastic articles
Animal and vegetable fats and oils
Reactors, boilers, machinery
Crude oil, condensates and gas
Electrical equipment
RM billion
Total
TPPA
Malaysia has historically been a net exporter of crude oil and gas - this sector contributes 26.2% of total exports
Crude oil
Between 2004 to 2014, Malaysia exported approximately half of its crude oil production. Lower quality sour crude oil is imported from Middle East and other regions to fulfil domestic needs and maximise the capacity of Malaysia’s in-house refineries.
In 2013, EIA estimates that Malaysia exported about 240,000 bpd of crude oil and imported 183,000 bpd of lower-cost crude oil in 2013 for processing at its oil refineries.
Malaysia’s top export markets are located in Asia-Pacific , where 60% of its crude oil exports are to TPPA countries.
Malaysia’s Main Exports (2014)
94
Economic Impact of the Trans-Pacific Partnership Agreement •
Section 5.2 – Oil and gas
Natural gas
Malaysia is a net exporter of gas primarily in the form of liquefied natural gas (LNG) exports.
Malaysia was the world’s second largest LNG exporter in 2013 with LNG exports of 30.1 bcm.
Malaysia’s exports of LNG are mainly to Asia-Pacific countries.
60%
Of LNG exports
are to Japan
Source: BMI, 2015
Japan
58% Taiwan
16%
60% exported to
TPPA countries
India
19%
Thailand
16%
Singapore
3% New Zealand
7%
Japan
10%
Others
13%
Australia
32% 52% exported to
TPPA countries
Crude oil exports in 2013 LNG exports in 2013
Japan
60% South
Korea
17%
Taiwan
12%
China
11%
Source: DOSM
Source: BMI, EIA
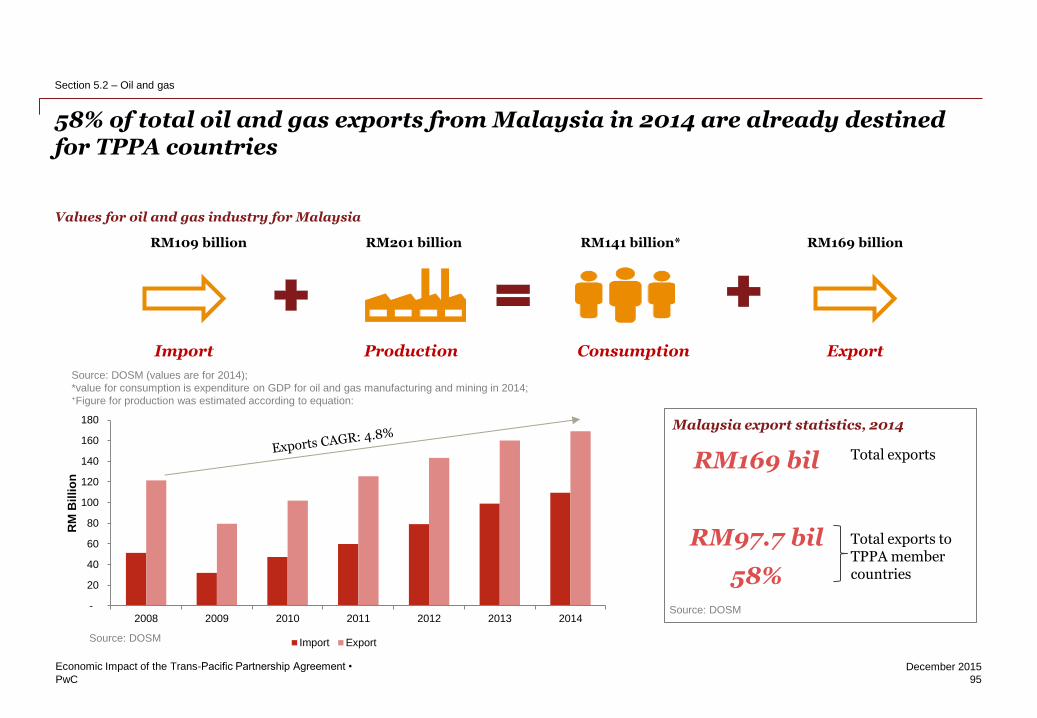
PwC
December 2015
58% of total oil and gas exports from Malaysia in 2014 are already destined for TPPA countries
Values for oil and gas industry for Malaysia
-
20
40
60
80
100
120
140
160
180
2008 2009 2010 2011 2012 2013 2014
RM
Billi
on
Import ExportSource: DOSM
Malaysia export statistics, 2014
Source: DOSM
RM169 bil Total exports
RM97.7 bil Total exports to TPPA member countries 58%
Production Consumption Import Export
RM141 billion* RM169 billion RM201 billion RM109 billion
Source: DOSM (values are for 2014);
*value for consumption is expenditure on GDP for oil and gas manufacturing and mining in 2014; +Figure for production was estimated according to equation:
95
Economic Impact of the Trans-Pacific Partnership Agreement •
Section 5.2 – Oil and gas

PwC
December 2015
Malaysia has historically been a net importer of refined oil products with Singapore providing roughly half of its requirements
Singapore
50%
UAE
9% South
Korea
6%
Kuwait
5%
China
4%
Others
26%
Refined oil imports in 2014
Historically a net importer of refined products
Notwithstanding its current refining capacity, Malaysia is a net importer of refined oil products 132,730 bpd in 2014.
Malaysia’s key refined oil suppliers are located in Asia where they enjoy geographical advantage due to their close proximity to Malaysia. Amongst the TPPA countries, Singapore is Malaysia’s largest source of refined oil imports, accounting for 50% of refined oil products.
Source: BMI (2015)
96
Economic Impact of the Trans-Pacific Partnership Agreement •
Section 5.2 – Oil and gas
Malaysia is growing its refining capacity
Malaysia’s current total refining capacity is 606,300 bpd. A new USD27 billion Refinery and Petrochemical Integrated Development Plant (RAPID) is being developed and once completed is expected to add further refining capacity of approximately 300,000 bpd.
The RAPID development once delivered, will have a crude oil refining capacity similar to the combined capacities of Malacca and Kertih and a petrochemical development capacity larger than the output of Kertih and Gebeng combined. While the expansion in the downstream production capacity of PETRONAS will strengthen and increase the country’s refining capability, historically, Malaysia has imported refined oil products.
Source: PETRONAS, MPRC
Refinery
Location Ownership
Refining
Capacity (bpd) Output Products
Operational
Kertih PETRONAS 123,300
Naphtha
condensates,
LPG, diesel,
kerosene, LSWR
Melaka PETRONAS 270,000 LPG, diesel, jet
fuel, fuel gas
Port
Dickson
Shell 125,000 LPG, diesel, jet
fuel, kerosene Exxon Mobil 88,000
Planned Pengerang
- RAPID PETRONAS 300,000
Naphtha. Diesel,
jetfuel, LPG
Malaysia’s refining capacity
Source: Respective company websites, MPRC
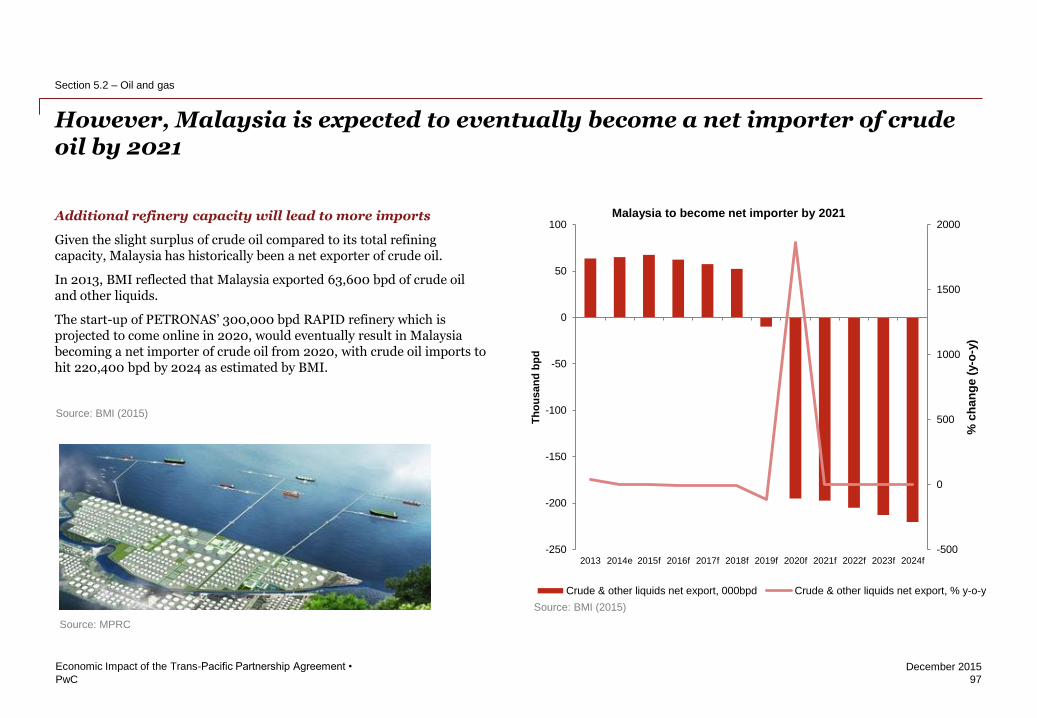
PwC
December 2015
-500
0
500
1000
1500
2000
-250
-200
-150
-100
-50
0
50
100
2013 2014e 2015f 2016f 2017f 2018f 2019f 2020f 2021f 2022f 2023f 2024f
% c
ha
ng
e (
y-o
-y)
Th
ou
san
d b
pd
Crude & other liquids net export, 000bpd Crude & other liquids net export, % y-o-y
However, Malaysia is expected to eventually become a net importer of crude oil by 2021
Additional refinery capacity will lead to more imports
Given the slight surplus of crude oil compared to its total refining capacity, Malaysia has historically been a net exporter of crude oil.
In 2013, BMI reflected that Malaysia exported 63,600 bpd of crude oil and other liquids.
The start-up of PETRONAS’ 300,000 bpd RAPID refinery which is projected to come online in 2020, would eventually result in Malaysia becoming a net importer of crude oil from 2020, with crude oil imports to hit 220,400 bpd by 2024 as estimated by BMI.
Source: BMI (2015)
Malaysia to become net importer by 2021
Source: BMI (2015)
Source: MPRC
97
Economic Impact of the Trans-Pacific Partnership Agreement •
Section 5.2 – Oil and gas
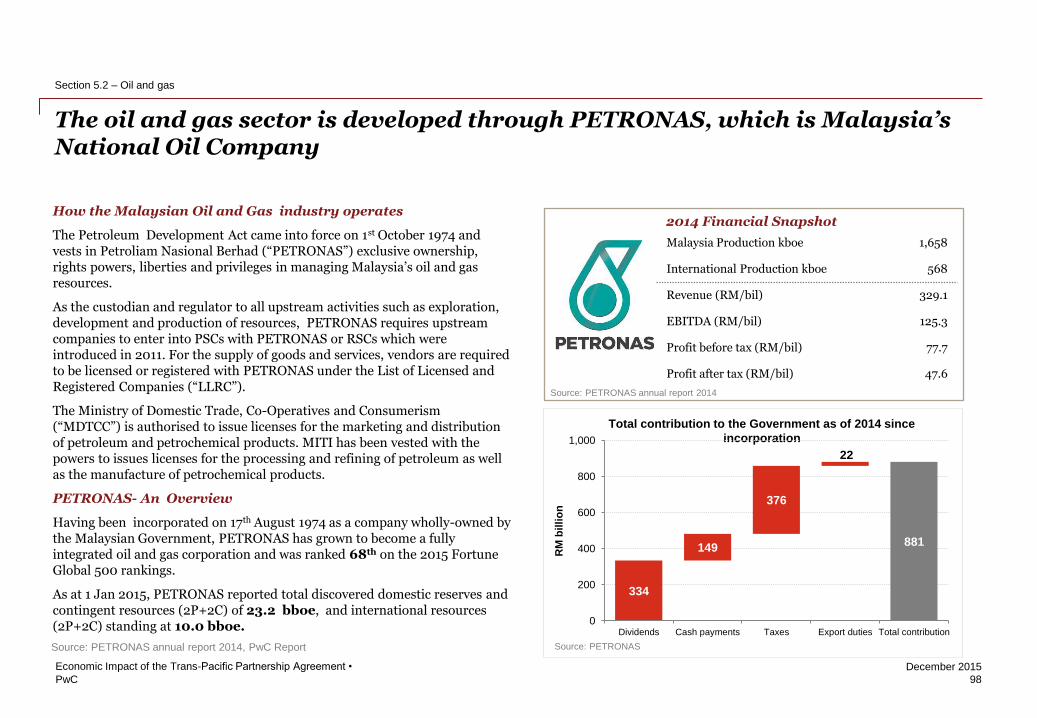
PwC
December 2015
The oil and gas sector is developed through PETRONAS, which is Malaysia’s National Oil Company
98
Economic Impact of the Trans-Pacific Partnership Agreement •
Section 5.2 – Oil and gas
Source: PETRONAS annual report 2014, PwC Report
How the Malaysian Oil and Gas industry operates
The Petroleum Development Act came into force on 1st October 1974 and vests in Petroliam Nasional Berhad (“PETRONAS”) exclusive ownership, rights powers, liberties and privileges in managing Malaysia’s oil and gas resources.
As the custodian and regulator to all upstream activities such as exploration, development and production of resources, PETRONAS requires upstream companies to enter into PSCs with PETRONAS or RSCs which were introduced in 2011. For the supply of goods and services, vendors are required to be licensed or registered with PETRONAS under the List of Licensed and Registered Companies (“LLRC”).
The Ministry of Domestic Trade, Co-Operatives and Consumerism (“MDTCC”) is authorised to issue licenses for the marketing and distribution of petroleum and petrochemical products. MITI has been vested with the powers to issues licenses for the processing and refining of petroleum as well as the manufacture of petrochemical products.
PETRONAS- An Overview
Having been incorporated on 17th August 1974 as a company wholly-owned by the Malaysian Government, PETRONAS has grown to become a fully integrated oil and gas corporation and was ranked 68th on the 2015 Fortune Global 500 rankings.
As at 1 Jan 2015, PETRONAS reported total discovered domestic reserves and contingent resources (2P+2C) of 23.2 bboe, and international resources (2P+2C) standing at 10.0 bboe.
2014 Financial Snapshot
Malaysia Production kboe 1,658
International Production kboe 568
Revenue (RM/bil) 329.1
EBITDA (RM/bil) 125.3
Profit before tax (RM/bil) 77.7
Profit after tax (RM/bil) 47.6
Source: PETRONAS
Total contribution to the Government as of 2014 since
incorporation
334
149
376
22
881
0
200
400
600
800
1,000
Dividends Cash payments Taxes Export duties Total contribution
RM
bil
lio
n
Source: PETRONAS annual report 2014
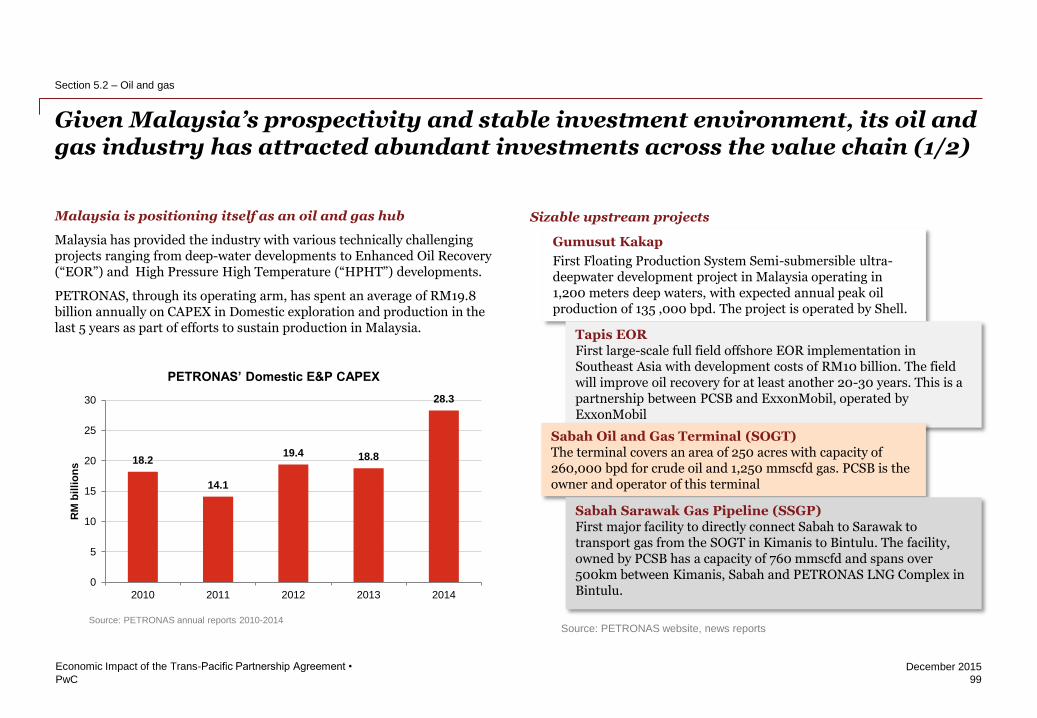
PwC
December 2015
Given Malaysia’s prospectivity and stable investment environment, its oil and gas industry has attracted abundant investments across the value chain (1/2)
Source: MIDA
99
Economic Impact of the Trans-Pacific Partnership Agreement •
Section 5.2 – Oil and gas
Gumusut Kakap
First Floating Production System Semi-submersible ultra-deepwater development project in Malaysia operating in 1,200 meters deep waters, with expected annual peak oil production of 135 ,000 bpd. The project is operated by Shell.
Sizable upstream projects
Tapis EOR First large-scale full field offshore EOR implementation in Southeast Asia with development costs of RM10 billion. The field will improve oil recovery for at least another 20-30 years. This is a partnership between PCSB and ExxonMobil, operated by ExxonMobil
Malaysia is positioning itself as an oil and gas hub
Malaysia has provided the industry with various technically challenging projects ranging from deep-water developments to Enhanced Oil Recovery (“EOR”) and High Pressure High Temperature (“HPHT”) developments.
PETRONAS, through its operating arm, has spent an average of RM19.8 billion annually on CAPEX in Domestic exploration and production in the last 5 years as part of efforts to sustain production in Malaysia.
Source: PETRONAS annual reports 2010-2014
Sabah Oil and Gas Terminal (SOGT) The terminal covers an area of 250 acres with capacity of 260,000 bpd for crude oil and 1,250 mmscfd gas. PCSB is the owner and operator of this terminal
Sabah Sarawak Gas Pipeline (SSGP) First major facility to directly connect Sabah to Sarawak to transport gas from the SOGT in Kimanis to Bintulu. The facility, owned by PCSB has a capacity of 760 mmscfd and spans over 500km between Kimanis, Sabah and PETRONAS LNG Complex in Bintulu.
Source: PETRONAS website, news reports
18.2
14.1
19.4 18.8
28.3
0
5
10
15
20
25
30
2010 2011 2012 2013 2014
RM
bil
lio
ns
PETRONAS’ Domestic E&P CAPEX
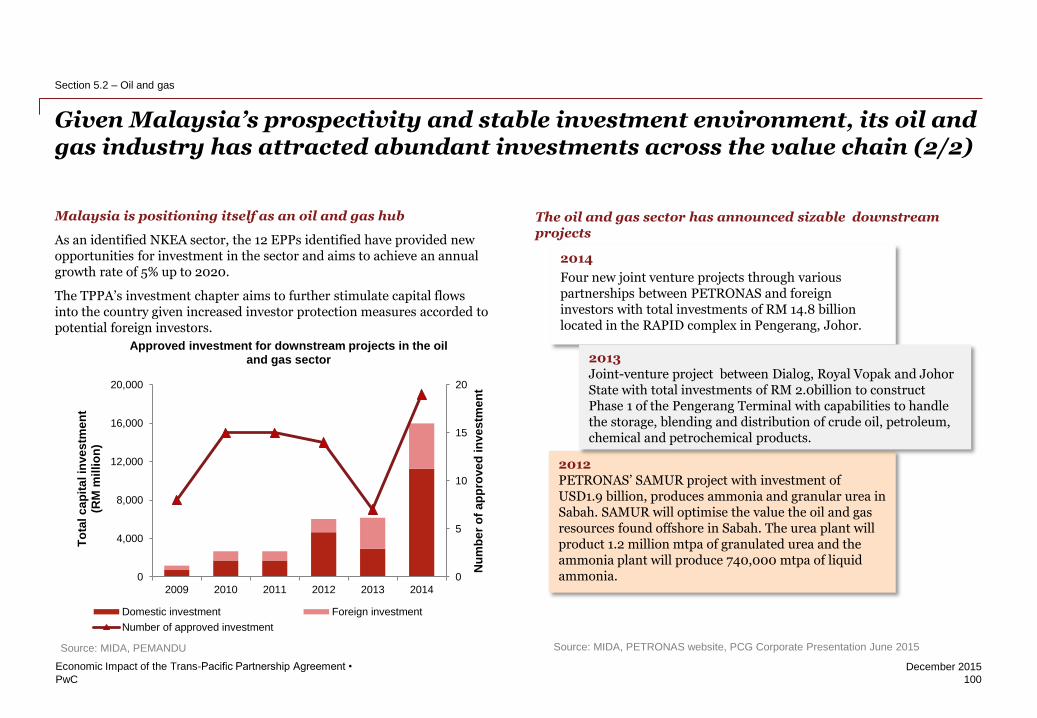
PwC
December 2015
Given Malaysia’s prospectivity and stable investment environment, its oil and gas industry has attracted abundant investments across the value chain (2/2)
Source: MIDA
100
Economic Impact of the Trans-Pacific Partnership Agreement •
Section 5.2 – Oil and gas
0
5
10
15
20
0
4,000
8,000
12,000
16,000
20,000
2009 2010 2011 2012 2013 2014
Nu
mb
er
of
ap
pro
ve
d in
ve
stm
en
t
To
tal c
ap
ita
l in
ve
stm
en
t
(RM
mil
lio
n)
Approved investment for downstream projects in the oil and gas sector
Domestic investment Foreign investment
Number of approved investment
2014
Four new joint venture projects through various partnerships between PETRONAS and foreign investors with total investments of RM 14.8 billion located in the RAPID complex in Pengerang, Johor.
2012 PETRONAS’ SAMUR project with investment of USD1.9 billion, produces ammonia and granular urea in Sabah. SAMUR will optimise the value the oil and gas resources found offshore in Sabah. The urea plant will product 1.2 million mtpa of granulated urea and the ammonia plant will produce 740,000 mtpa of liquid ammonia.
The oil and gas sector has announced sizable downstream projects
2013 Joint-venture project between Dialog, Royal Vopak and Johor State with total investments of RM 2.0billion to construct Phase 1 of the Pengerang Terminal with capabilities to handle the storage, blending and distribution of crude oil, petroleum, chemical and petrochemical products.
Malaysia is positioning itself as an oil and gas hub
As an identified NKEA sector, the 12 EPPs identified have provided new opportunities for investment in the sector and aims to achieve an annual growth rate of 5% up to 2020.
The TPPA’s investment chapter aims to further stimulate capital flows into the country given increased investor protection measures accorded to potential foreign investors.
Source: MIDA, PEMANDU Source: MIDA, PETRONAS website, PCG Corporate Presentation June 2015
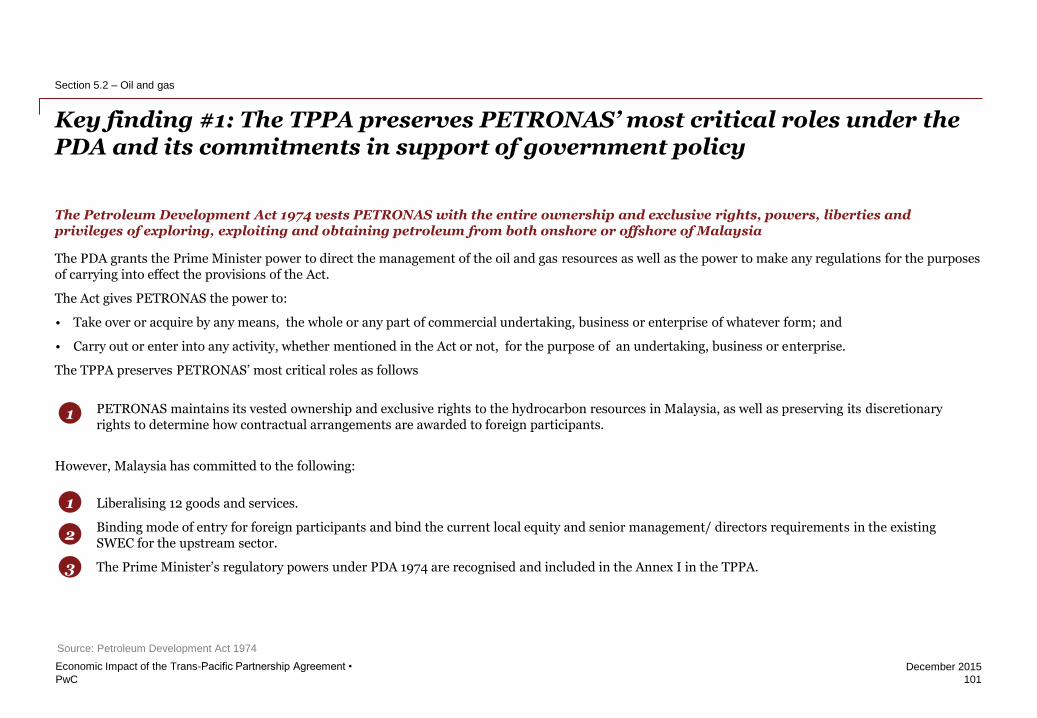
PwC
December 2015
The Petroleum Development Act 1974 vests PETRONAS with the entire ownership and exclusive rights, powers, liberties and privileges of exploring, exploiting and obtaining petroleum from both onshore or offshore of Malaysia
The PDA grants the Prime Minister power to direct the management of the oil and gas resources as well as the power to make any regulations for the purposes of carrying into effect the provisions of the Act.
The Act gives PETRONAS the power to:
• Take over or acquire by any means, the whole or any part of commercial undertaking, business or enterprise of whatever form; and
• Carry out or enter into any activity, whether mentioned in the Act or not, for the purpose of an undertaking, business or enterprise.
The TPPA preserves PETRONAS’ most critical roles as follows
However, Malaysia has committed to the following:
Source: Petroleum Development Act 1974
Key finding #1: The TPPA preserves PETRONAS’ most critical roles under the PDA and its commitments in support of government policy
101
Economic Impact of the Trans-Pacific Partnership Agreement •
Section 5.2 – Oil and gas
PETRONAS maintains its vested ownership and exclusive rights to the hydrocarbon resources in Malaysia, as well as preserving its discretionary rights to determine how contractual arrangements are awarded to foreign participants.
Liberalising 12 goods and services.
Binding mode of entry for foreign participants and bind the current local equity and senior management/ directors requirements in the existing SWEC for the upstream sector.
The Prime Minister’s regulatory powers under PDA 1974 are recognised and included in the Annex I in the TPPA.
1
1
2
3

PwC
December 2015
Key finding #2: The TPPA will liberalise 12 goods and services which are currently dominated by foreign companies
102
Economic Impact of the Trans-Pacific Partnership Agreement •
Section 5.2 – Oil and gas
The TPPA fully liberalises 12 goods and services within the oil and gas sector. Thus, upon entry into force, Malaysia will no longer be able to impose restrictions on entities that wish to participate in supplying these goods and services.
The 12 goods and services are dominated by foreign-linked players
The 12 goods and services made up approximately 10% of total PETRONAS’ and Petroleum Arrangement Contractors’ spend in 2014. About 96% spend on these 12 goods and services was in the upstream sector – mainly for Oil Country Tubular Goods, Gas Turbine and services, Seismic Data Acquisition, drilling and cementing services. These goods and services require suppliers that possess high technological capabilities.
As such, in 2014, approximately 60% of the contract value in these 12 goods and services was awarded to wholly foreign-owned companies. There are currently 389 majority Bumiputera owned licensed vendors under PETRONAS’ Standardised Work and Equipment Categories (“SWEC”). Majority of which are either agents or principal-linked companies to larger foreign multinational companies with developed technological capabilities.
1. Seismic Data Acquisition;
2. Directional Drilling services, Gyro While Drilling services, Measurement While Drilling services, and Logging While Drilling services;
3. Cementing Related Services;
4. Gas Turbines and related maintenance and repair services;
5. Control Valves services;
List of 12 goods and services that will be liberalised in the oil and gas sector for Malaysia, under the TPPA
6. Oil Country Tubular Goods;
7. Induction motor services;
8. Distributed Control System (DCS) services;
9. Transformer services;
10. Structural steel;
11. Linepipes; and
12. Process pipes.
~10%
~90%
Breakdown of PETRONAS’ and Petroleum Agreement Contractors’
spend
12 goods and services Others
2014 ~40%
~60%
Breakdown of spend on 12 goods and services
Companies with local equity participation
Wholly foreign-owned companies
2014
Source: PETRONAS
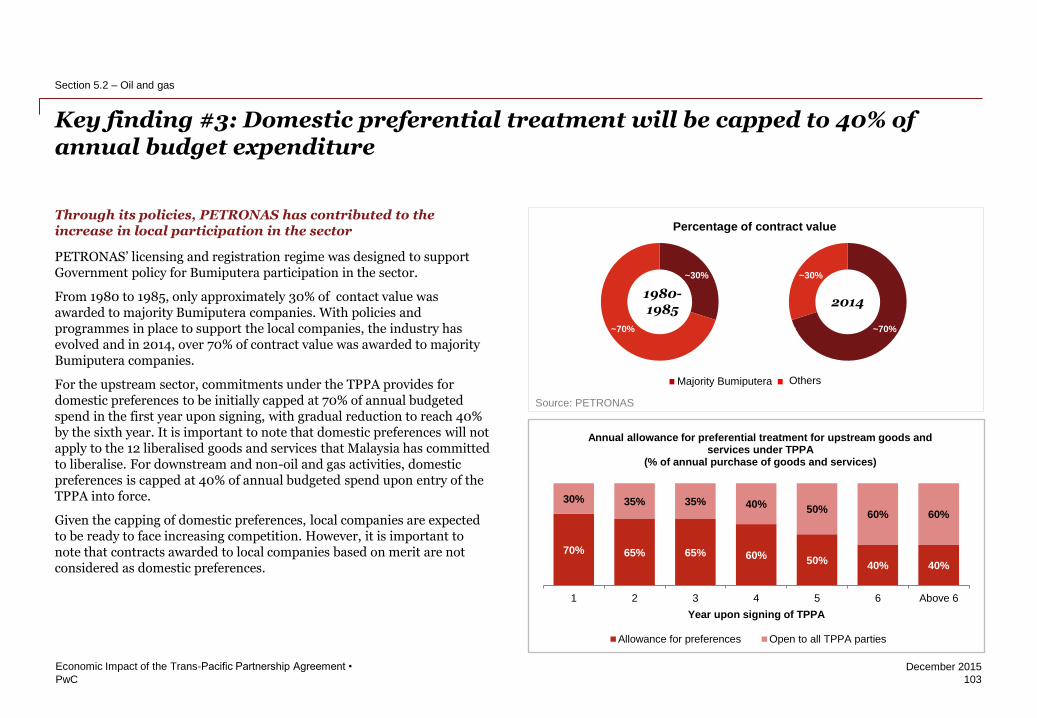
PwC
December 2015
103
Economic Impact of the Trans-Pacific Partnership Agreement •
Section 5.2 – Oil and gas
Through its policies, PETRONAS has contributed to the increase in local participation in the sector
PETRONAS’ licensing and registration regime was designed to support Government policy for Bumiputera participation in the sector.
From 1980 to 1985, only approximately 30% of contact value was awarded to majority Bumiputera companies. With policies and programmes in place to support the local companies, the industry has evolved and in 2014, over 70% of contract value was awarded to majority Bumiputera companies.
For the upstream sector, commitments under the TPPA provides for domestic preferences to be initially capped at 70% of annual budgeted spend in the first year upon signing, with gradual reduction to reach 40% by the sixth year. It is important to note that domestic preferences will not apply to the 12 liberalised goods and services that Malaysia has committed to liberalise. For downstream and non-oil and gas activities, domestic preferences is capped at 40% of annual budgeted spend upon entry of the TPPA into force.
Given the capping of domestic preferences, local companies are expected to be ready to face increasing competition. However, it is important to note that contracts awarded to local companies based on merit are not considered as domestic preferences.
Key finding #3: Domestic preferential treatment will be capped to 40% of annual budget expenditure
70% 65% 65% 60% 50%
40% 40%
30% 35% 35% 40% 50%
60% 60%
1 2 3 4 5 6 Above 6
Year upon signing of TPPA
Annual allowance for preferential treatment for upstream goods and services under TPPA
(% of annual purchase of goods and services)
Allowance for preferences Open to all TPPA parties
Source: PETRONAS
~70%
~30% ~30%
~70%
Percentage of contract value
1980-1985
2014
6%
94%
Majority Bumiputera Others
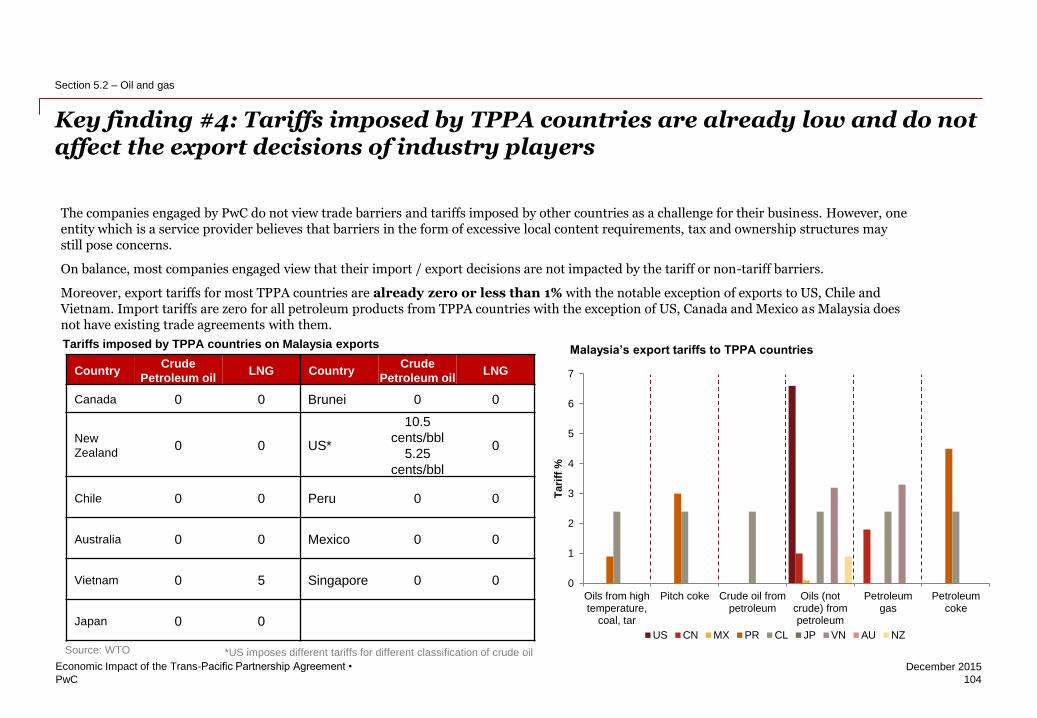
PwC
December 2015
Key finding #4: Tariffs imposed by TPPA countries are already low and do not affect the export decisions of industry players
The companies engaged by PwC do not view trade barriers and tariffs imposed by other countries as a challenge for their business. However, one entity which is a service provider believes that barriers in the form of excessive local content requirements, tax and ownership structures may still pose concerns.
On balance, most companies engaged view that their import / export decisions are not impacted by the tariff or non-tariff barriers.
Moreover, export tariffs for most TPPA countries are already zero or less than 1% with the notable exception of exports to US, Chile and Vietnam. Import tariffs are zero for all petroleum products from TPPA countries with the exception of US, Canada and Mexico as Malaysia does not have existing trade agreements with them.
Source: WTO
Malaysia’s export tariffs to TPPA countries
0
1
2
3
4
5
6
7
Oils from hightemperature,
coal, tar
Pitch coke Crude oil frompetroleum
Oils (notcrude) frompetroleum
Petroleumgas
Petroleumcoke
Tari
ff %
US CN MX PR CL JP VN AU NZ
104
Economic Impact of the Trans-Pacific Partnership Agreement •
Section 5.2 – Oil and gas
Country Crude
Petroleum oil LNG Country
Crude
Petroleum oil LNG
Canada 0 0 Brunei 0 0
New
Zealand 0 0 US*
10.5
cents/bbl
5.25
cents/bbl
0
Chile 0 0 Peru 0 0
Australia 0 0 Mexico 0 0
Vietnam 0 5 Singapore 0 0
Japan 0 0
Tariffs imposed by TPPA countries on Malaysia exports
*US imposes different tariffs for different classification of crude oil
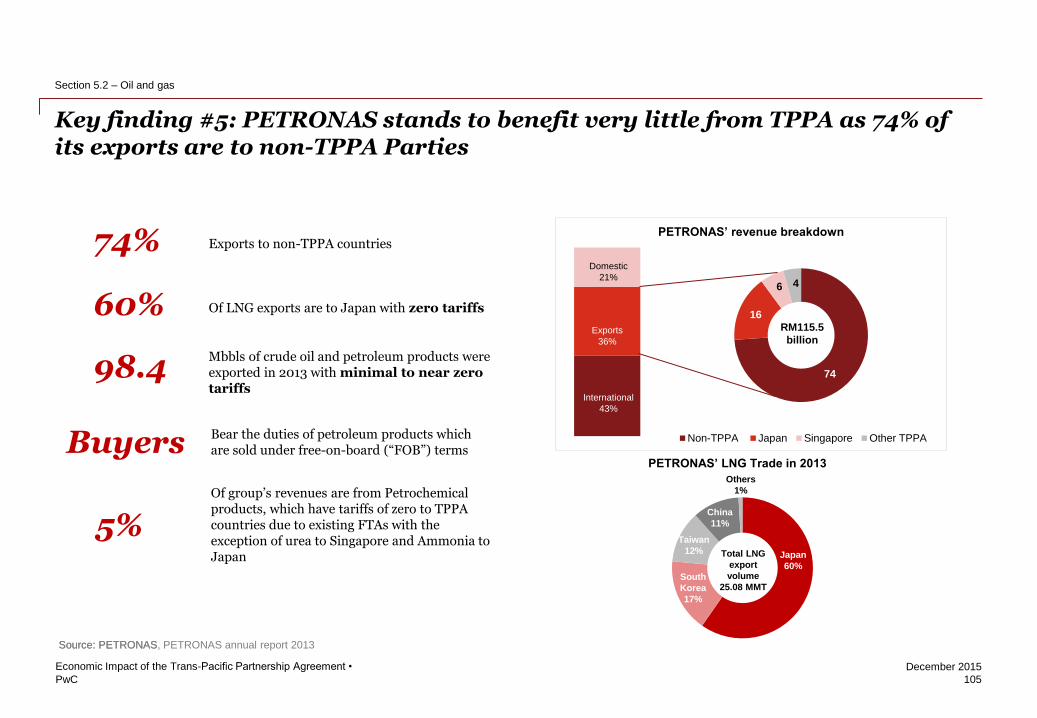
PwC
December 2015
Key finding #5: PETRONAS stands to benefit very little from TPPA as 74% of its exports are to non-TPPA Parties
Source: PETRONAS
105
Economic Impact of the Trans-Pacific Partnership Agreement •
Section 5.2 – Oil and gas
PETRONAS’ LNG Trade in 2013
Japan
60% South
Korea
17%
Taiwan
12%
China
11%
Others
1%
Total LNG
export
volume
25.08 MMT
PETRONAS’ revenue breakdown
74
16
6 4
Non-TPPA Japan Singapore Other TPPA
International
43%
Exports
36%
Domestic
21%
RM115.5
billion
Source: PETRONAS, PETRONAS annual report 2013
74% Exports to non-TPPA countries
60% Of LNG exports are to Japan with zero tariffs
98.4 Mbbls of crude oil and petroleum products were exported in 2013 with minimal to near zero tariffs
Buyers Bear the duties of petroleum products which are sold under free-on-board (“FOB”) terms
5% Of group’s revenues are from Petrochemical products, which have tariffs of zero to TPPA countries due to existing FTAs with the exception of urea to Singapore and Ammonia to Japan
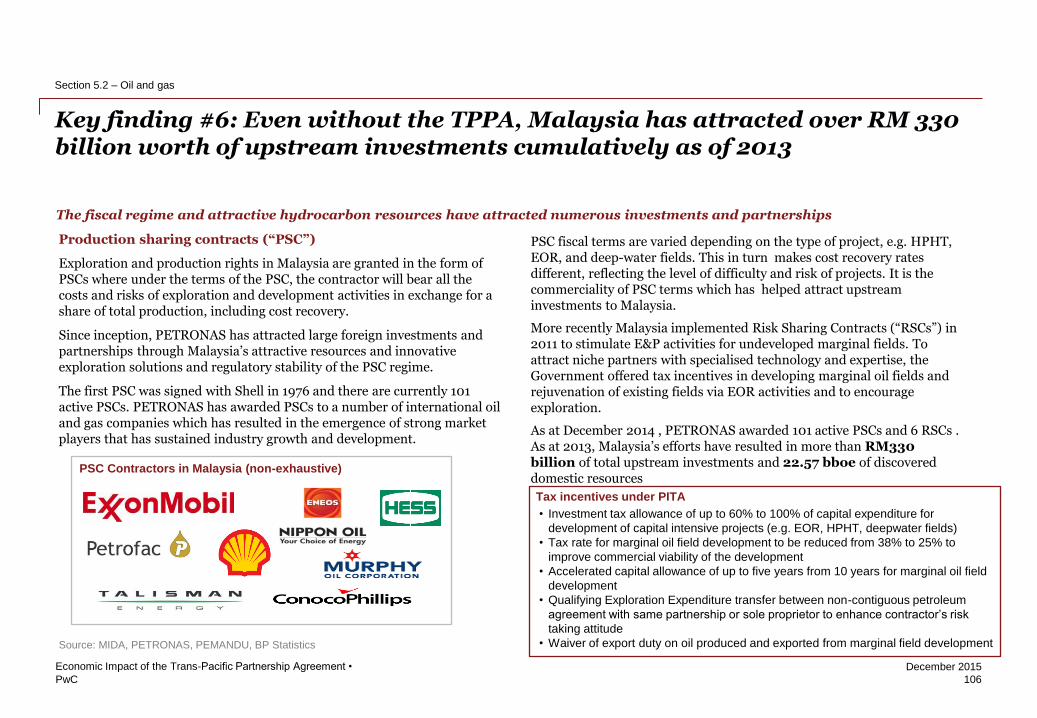
PwC
December 2015
Key finding #6: Even without the TPPA, Malaysia has attracted over RM 330 billion worth of upstream investments cumulatively as of 2013
106
Economic Impact of the Trans-Pacific Partnership Agreement •
Section 5.2 – Oil and gas
Production sharing contracts (“PSC”)
Exploration and production rights in Malaysia are granted in the form of PSCs where under the terms of the PSC, the contractor will bear all the costs and risks of exploration and development activities in exchange for a share of total production, including cost recovery.
Since inception, PETRONAS has attracted large foreign investments and partnerships through Malaysia’s attractive resources and innovative exploration solutions and regulatory stability of the PSC regime.
The first PSC was signed with Shell in 1976 and there are currently 101 active PSCs. PETRONAS has awarded PSCs to a number of international oil and gas companies which has resulted in the emergence of strong market players that has sustained industry growth and development.
The fiscal regime and attractive hydrocarbon resources have attracted numerous investments and partnerships
Source: MIDA, PETRONAS, PEMANDU, BP Statistics
PSC fiscal terms are varied depending on the type of project, e.g. HPHT, EOR, and deep-water fields. This in turn makes cost recovery rates different, reflecting the level of difficulty and risk of projects. It is the commerciality of PSC terms which has helped attract upstream investments to Malaysia.
More recently Malaysia implemented Risk Sharing Contracts (“RSCs”) in 2011 to stimulate E&P activities for undeveloped marginal fields. To attract niche partners with specialised technology and expertise, the Government offered tax incentives in developing marginal oil fields and rejuvenation of existing fields via EOR activities and to encourage exploration.
As at December 2014 , PETRONAS awarded 101 active PSCs and 6 RSCs . As at 2013, Malaysia’s efforts have resulted in more than RM330 billion of total upstream investments and 22.57 bboe of discovered domestic resources
PSC Contractors in Malaysia (non-exhaustive)
Tax incentives under PITA
• Investment tax allowance of up to 60% to 100% of capital expenditure for
development of capital intensive projects (e.g. EOR, HPHT, deepwater fields)
• Tax rate for marginal oil field development to be reduced from 38% to 25% to
improve commercial viability of the development
• Accelerated capital allowance of up to five years from 10 years for marginal oil field
development
• Qualifying Exploration Expenditure transfer between non-contiguous petroleum
agreement with same partnership or sole proprietor to enhance contractor’s risk
taking attitude
• Waiver of export duty on oil produced and exported from marginal field development
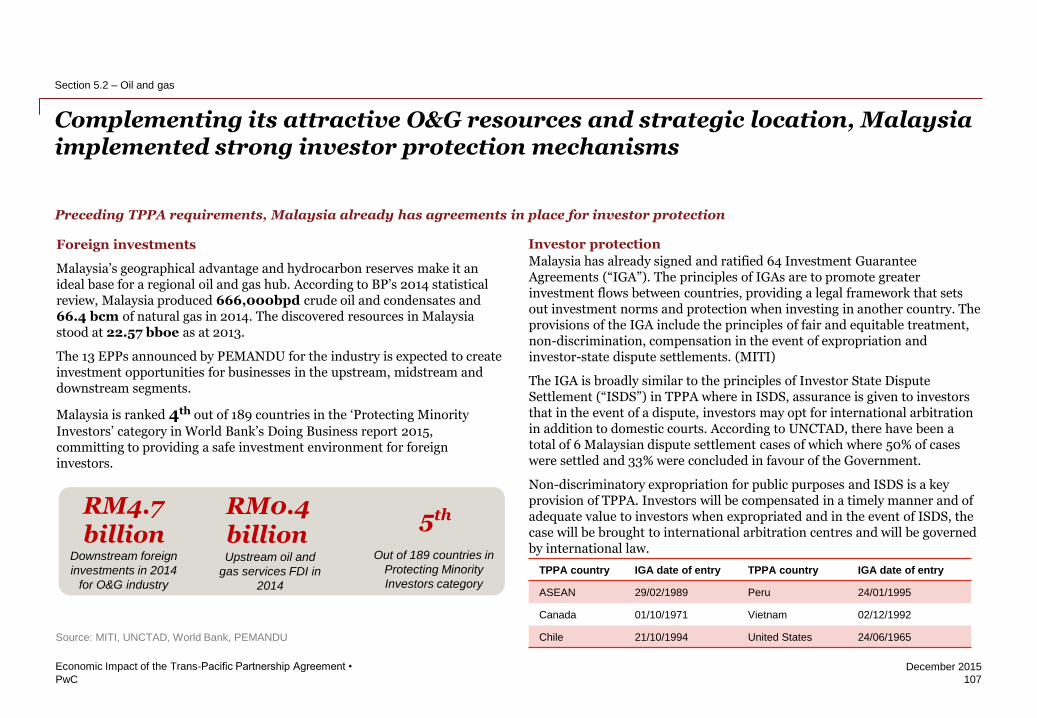
PwC
December 2015
TPPA country IGA date of entry TPPA country IGA date of entry
ASEAN 29/02/1989 Peru 24/01/1995
Canada 01/10/1971 Vietnam 02/12/1992
Chile 21/10/1994 United States 24/06/1965
Complementing its attractive O&G resources and strategic location, Malaysia implemented strong investor protection mechanisms
Malaysia has already signed and ratified 64 Investment Guarantee Agreements (“IGA”). The principles of IGAs are to promote greater investment flows between countries, providing a legal framework that sets out investment norms and protection when investing in another country. The provisions of the IGA include the principles of fair and equitable treatment, non-discrimination, compensation in the event of expropriation and investor-state dispute settlements. (MITI)
The IGA is broadly similar to the principles of Investor State Dispute Settlement (“ISDS”) in TPPA where in ISDS, assurance is given to investors that in the event of a dispute, investors may opt for international arbitration in addition to domestic courts. According to UNCTAD, there have been a total of 6 Malaysian dispute settlement cases of which where 50% of cases were settled and 33% were concluded in favour of the Government.
Non-discriminatory expropriation for public purposes and ISDS is a key provision of TPPA. Investors will be compensated in a timely manner and of adequate value to investors when expropriated and in the event of ISDS, the case will be brought to international arbitration centres and will be governed by international law.
Preceding TPPA requirements, Malaysia already has agreements in place for investor protection
Source: MITI, UNCTAD, World Bank, PEMANDU
Foreign investments
Malaysia’s geographical advantage and hydrocarbon reserves make it an ideal base for a regional oil and gas hub. According to BP’s 2014 statistical review, Malaysia produced 666,000bpd crude oil and condensates and 66.4 bcm of natural gas in 2014. The discovered resources in Malaysia stood at 22.57 bboe as at 2013.
The 13 EPPs announced by PEMANDU for the industry is expected to create investment opportunities for businesses in the upstream, midstream and downstream segments.
Malaysia is ranked 4th out of 189 countries in the ‘Protecting Minority
Investors’ category in World Bank’s Doing Business report 2015, committing to providing a safe investment environment for foreign investors.
Investor protection
107
Economic Impact of the Trans-Pacific Partnership Agreement •
Section 5.2 – Oil and gas
RM4.7billion
Downstream foreign
investments in 2014
for O&G industry
RM0.4 billion Upstream oil and
gas services FDI in
2014
5th
Out of 189 countries in
Protecting Minority
Investors category
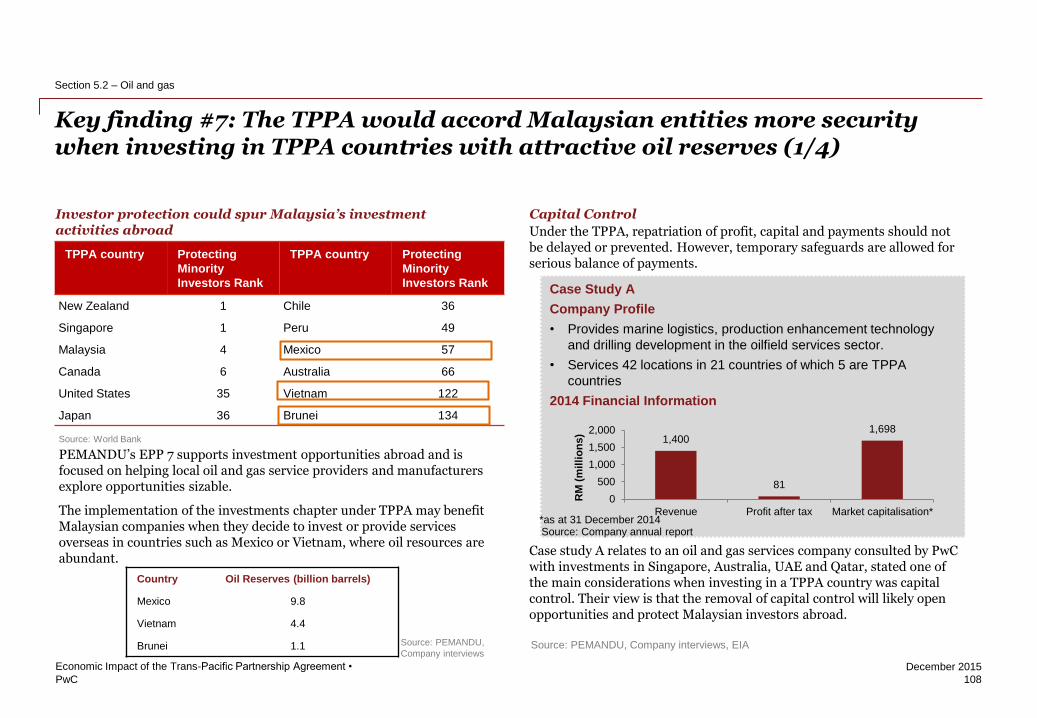
PwC
December 2015
TPPA country Protecting
Minority
Investors Rank
TPPA country Protecting
Minority
Investors Rank
New Zealand 1 Chile 36
Singapore 1 Peru 49
Malaysia 4 Mexico 57
Canada 6 Australia 66
United States 35 Vietnam 122
Japan 36 Brunei 134
Key finding #7: The TPPA would accord Malaysian entities more security when investing in TPPA countries with attractive oil reserves (1/4)
Under the TPPA, repatriation of profit, capital and payments should not be delayed or prevented. However, temporary safeguards are allowed for serious balance of payments.
Case study A relates to an oil and gas services company consulted by PwC with investments in Singapore, Australia, UAE and Qatar, stated one of the main considerations when investing in a TPPA country was capital control. Their view is that the removal of capital control will likely open opportunities and protect Malaysian investors abroad.
Case Study A
Company Profile
• Provides marine logistics, production enhancement technology
and drilling development in the oilfield services sector.
• Services 42 locations in 21 countries of which 5 are TPPA
countries
2014 Financial Information
1,400
81
1,698
0
500
1,000
1,500
2,000
Revenue Profit after tax Market capitalisation*
RM
(m
illi
on
s)
Source: Company annual report
Source: PEMANDU,
Company interviews
Capital Control
108
Economic Impact of the Trans-Pacific Partnership Agreement •
Section 5.2 – Oil and gas
Country Oil Reserves (billion barrels)
Mexico 9.8
Vietnam 4.4
Brunei 1.1
Investor protection could spur Malaysia’s investment activities abroad
Source: World Bank
PEMANDU’s EPP 7 supports investment opportunities abroad and is focused on helping local oil and gas service providers and manufacturers explore opportunities sizable.
The implementation of the investments chapter under TPPA may benefit Malaysian companies when they decide to invest or provide services overseas in countries such as Mexico or Vietnam, where oil resources are abundant.
Source: PEMANDU, Company interviews, EIA
*as at 31 December 2014
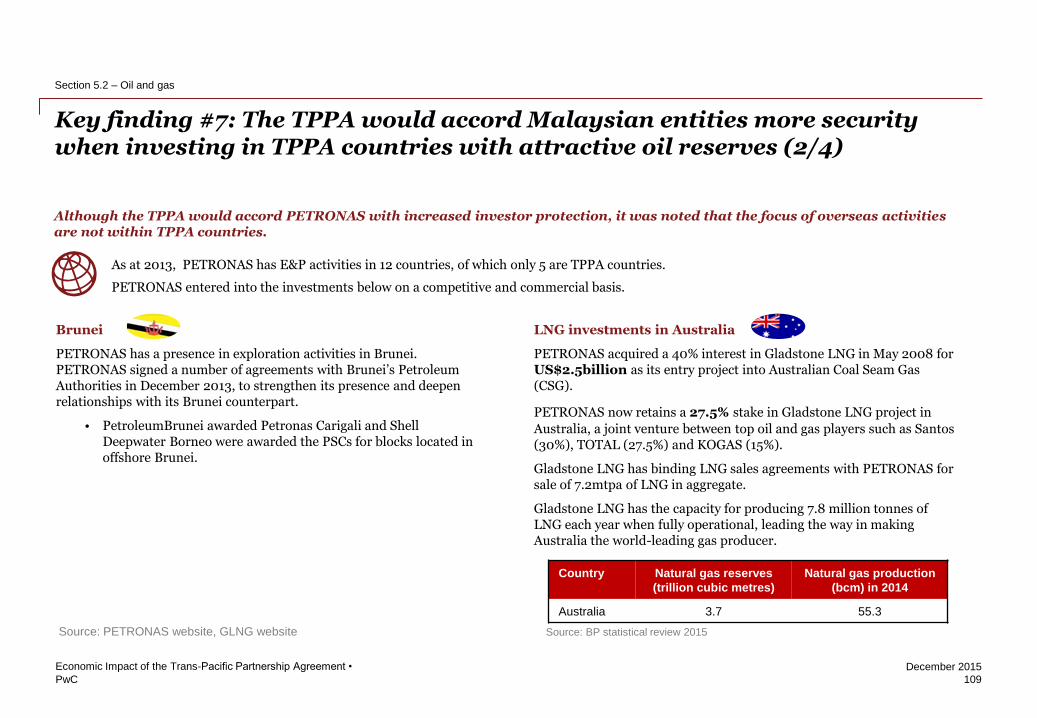
PwC
December 2015
Key finding #7: The TPPA would accord Malaysian entities more security when investing in TPPA countries with attractive oil reserves (2/4)
109
Economic Impact of the Trans-Pacific Partnership Agreement •
Section 5.2 – Oil and gas
Although the TPPA would accord PETRONAS with increased investor protection, it was noted that the focus of overseas activities are not within TPPA countries.
Source: BP statistical review 2015
Brunei
PETRONAS has a presence in exploration activities in Brunei. PETRONAS signed a number of agreements with Brunei’s Petroleum Authorities in December 2013, to strengthen its presence and deepen relationships with its Brunei counterpart.
• PetroleumBrunei awarded Petronas Carigali and Shell Deepwater Borneo were awarded the PSCs for blocks located in offshore Brunei.
Country Natural gas reserves
(trillion cubic metres)
Natural gas production
(bcm) in 2014
Australia 3.7 55.3
Source: PETRONAS website, GLNG website
LNG investments in Australia
PETRONAS acquired a 40% interest in Gladstone LNG in May 2008 for US$2.5billion as its entry project into Australian Coal Seam Gas (CSG).
PETRONAS now retains a 27.5% stake in Gladstone LNG project in
Australia, a joint venture between top oil and gas players such as Santos (30%), TOTAL (27.5%) and KOGAS (15%).
Gladstone LNG has binding LNG sales agreements with PETRONAS for sale of 7.2mtpa of LNG in aggregate.
Gladstone LNG has the capacity for producing 7.8 million tonnes of LNG each year when fully operational, leading the way in making Australia the world-leading gas producer.
As at 2013, PETRONAS has E&P activities in 12 countries, of which only 5 are TPPA countries.
PETRONAS entered into the investments below on a competitive and commercial basis.
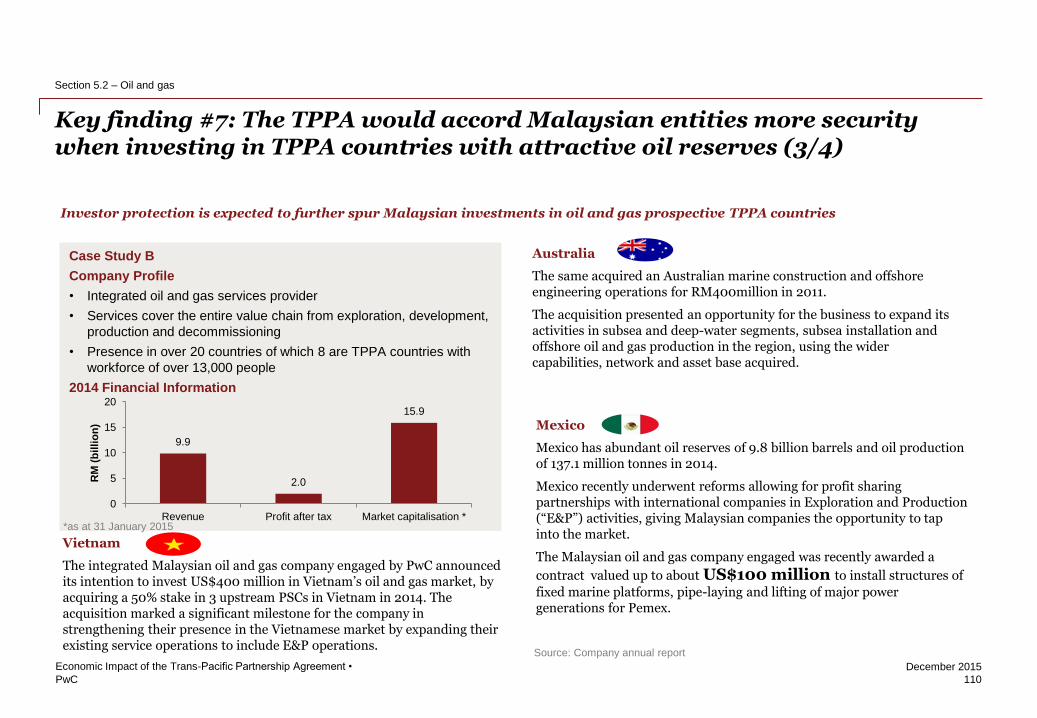
PwC
December 2015
Case Study B
Company Profile
• Integrated oil and gas services provider
• Services cover the entire value chain from exploration, development,
production and decommissioning
• Presence in over 20 countries of which 8 are TPPA countries with
workforce of over 13,000 people
2014 Financial Information
9.9
2.0
15.9
0
5
10
15
20
Revenue Profit after tax Market capitalisation *
RM
(b
illi
on
)
Key finding #7: The TPPA would accord Malaysian entities more security when investing in TPPA countries with attractive oil reserves (3/4)
Investor protection is expected to further spur Malaysian investments in oil and gas prospective TPPA countries
Source: Company annual report
Australia
The same acquired an Australian marine construction and offshore engineering operations for RM400million in 2011.
The acquisition presented an opportunity for the business to expand its activities in subsea and deep-water segments, subsea installation and offshore oil and gas production in the region, using the wider capabilities, network and asset base acquired.
Vietnam
The integrated Malaysian oil and gas company engaged by PwC announced its intention to invest US$400 million in Vietnam’s oil and gas market, by acquiring a 50% stake in 3 upstream PSCs in Vietnam in 2014. The acquisition marked a significant milestone for the company in strengthening their presence in the Vietnamese market by expanding their existing service operations to include E&P operations.
Mexico
Mexico has abundant oil reserves of 9.8 billion barrels and oil production of 137.1 million tonnes in 2014.
Mexico recently underwent reforms allowing for profit sharing partnerships with international companies in Exploration and Production (“E&P”) activities, giving Malaysian companies the opportunity to tap into the market.
The Malaysian oil and gas company engaged was recently awarded a
contract valued up to about US$100 million to install structures of
fixed marine platforms, pipe-laying and lifting of major power generations for Pemex.
110
Economic Impact of the Trans-Pacific Partnership Agreement •
Section 5.2 – Oil and gas
*as at 31 January 2015
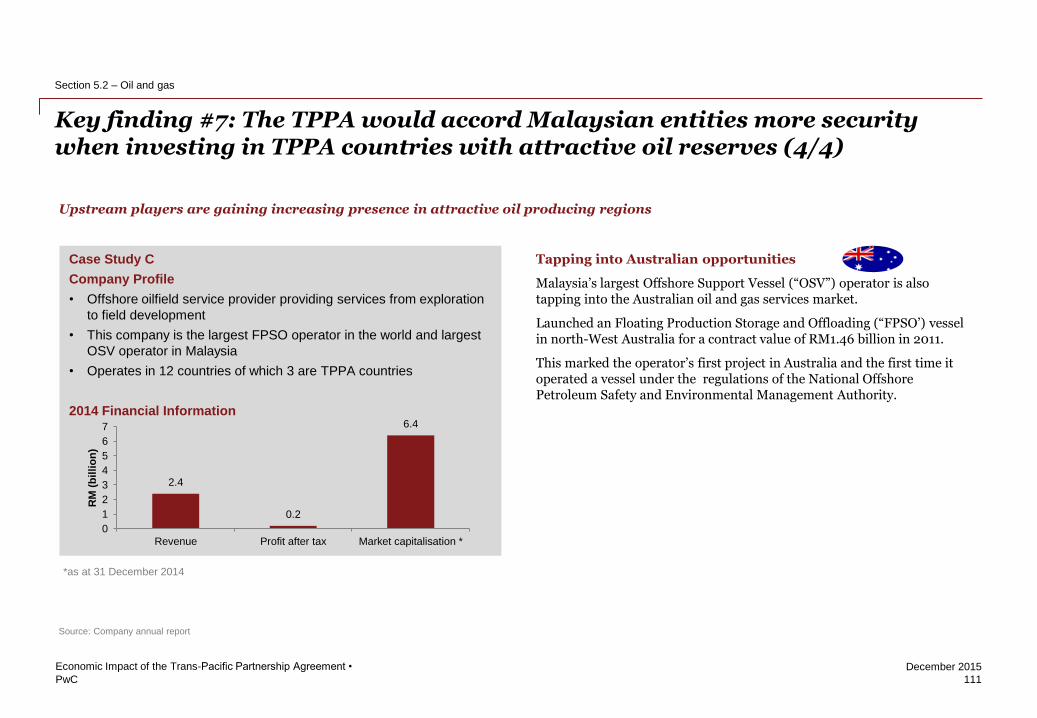
PwC
December 2015
Key finding #7: The TPPA would accord Malaysian entities more security when investing in TPPA countries with attractive oil reserves (4/4)
Upstream players are gaining increasing presence in attractive oil producing regions
Tapping into Australian opportunities
Malaysia’s largest Offshore Support Vessel (“OSV”) operator is also tapping into the Australian oil and gas services market.
Launched an Floating Production Storage and Offloading (“FPSO’) vessel in north-West Australia for a contract value of RM1.46 billion in 2011.
This marked the operator’s first project in Australia and the first time it operated a vessel under the regulations of the National Offshore Petroleum Safety and Environmental Management Authority.
Case Study C
Company Profile
• Offshore oilfield service provider providing services from exploration
to field development
• This company is the largest FPSO operator in the world and largest
OSV operator in Malaysia
• Operates in 12 countries of which 3 are TPPA countries
2014 Financial Information
2.4
0.2
6.4
0
1
2
3
4
5
6
7
Revenue Profit after tax Market capitalisation *
RM
(b
illi
on
)
Source: Company annual report
111
Economic Impact of the Trans-Pacific Partnership Agreement •
Section 5.2 – Oil and gas
*as at 31 December 2014

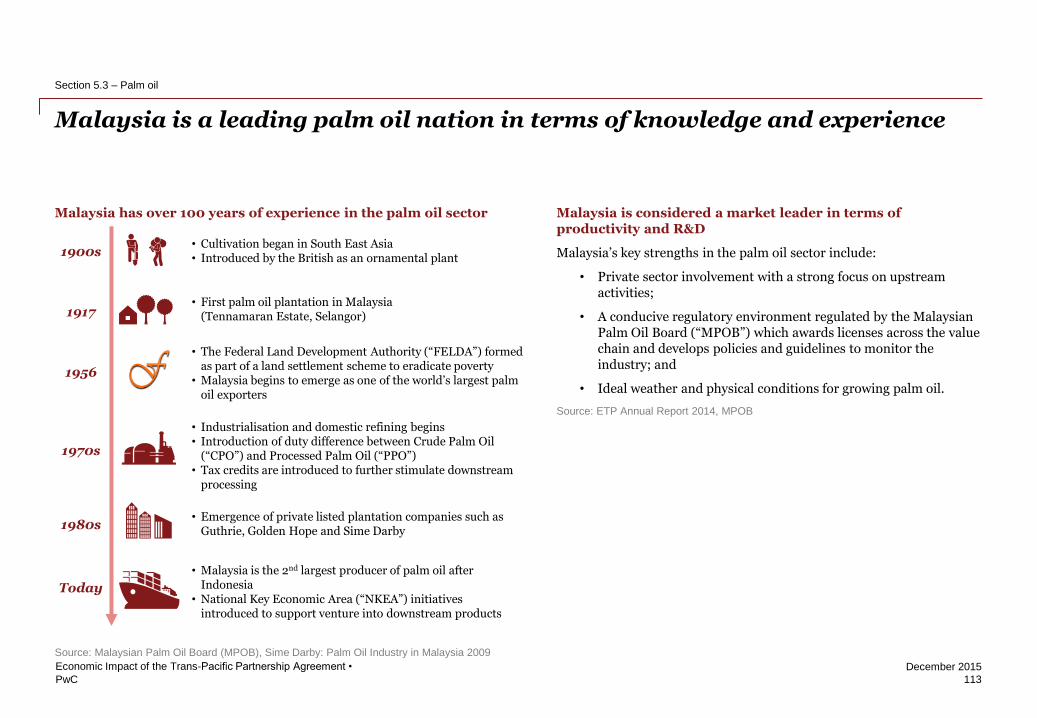
PwC
December 2015
Malaysia is a leading palm oil nation in terms of knowledge and experience
113
Economic Impact of the Trans-Pacific Partnership Agreement •
Section 5.3 – Palm oil
Malaysia has over 100 years of experience in the palm oil sector Malaysia is considered a market leader in terms of productivity and R&D
Malaysia’s key strengths in the palm oil sector include:
• Private sector involvement with a strong focus on upstream activities;
• A conducive regulatory environment regulated by the Malaysian Palm Oil Board (“MPOB”) which awards licenses across the value chain and develops policies and guidelines to monitor the industry; and
• Ideal weather and physical conditions for growing palm oil.
• Cultivation began in South East Asia • Introduced by the British as an ornamental plant
1917
1956
1970s
• First palm oil plantation in Malaysia (Tennamaran Estate, Selangor)
• The Federal Land Development Authority (“FELDA”) formed as part of a land settlement scheme to eradicate poverty
• Malaysia begins to emerge as one of the world’s largest palm oil exporters
• Industrialisation and domestic refining begins • Introduction of duty difference between Crude Palm Oil
(“CPO”) and Processed Palm Oil (“PPO”) • Tax credits are introduced to further stimulate downstream
processing
1980s • Emergence of private listed plantation companies such as
Guthrie, Golden Hope and Sime Darby
Today
• Malaysia is the 2nd largest producer of palm oil after Indonesia
• National Key Economic Area (“NKEA”) initiatives introduced to support venture into downstream products
Source: ETP Annual Report 2014, MPOB
1900s
Source: Malaysian Palm Oil Board (MPOB), Sime Darby: Palm Oil Industry in Malaysia 2009
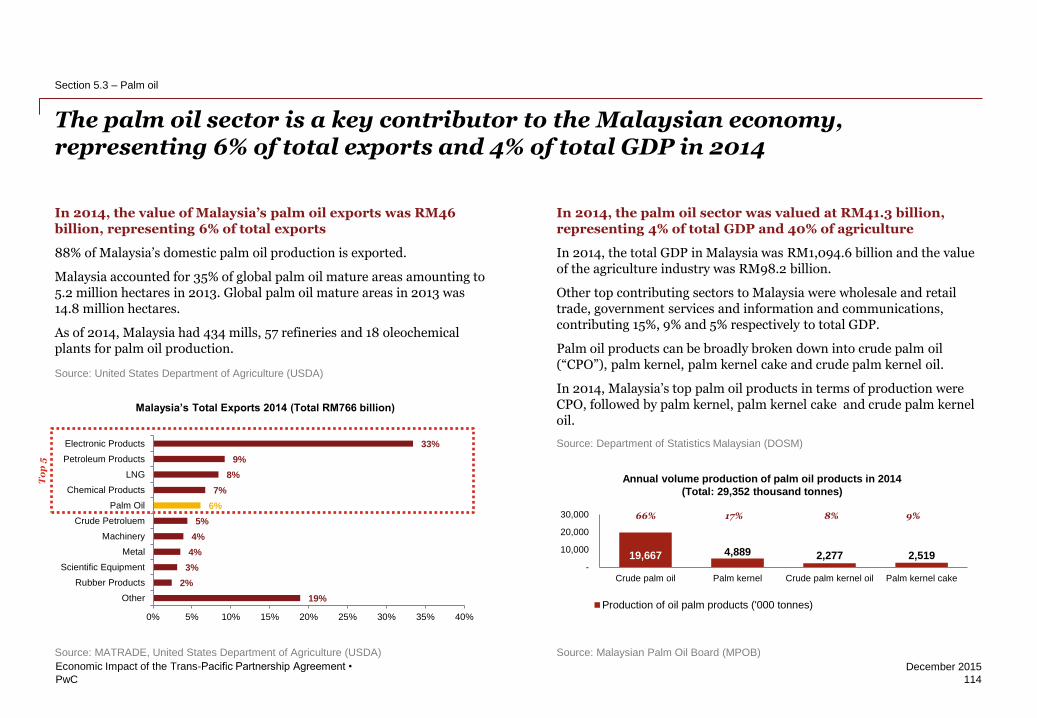
PwC
December 2015
19,667 4,889 2,277 2,519 -
10,000
20,000
30,000
Crude palm oil Palm kernel Crude palm kernel oil Palm kernel cake
Production of oil palm products ('000 tonnes)
Annual volume production of palm oil products in 2014
(Total: 29,352 thousand tonnes)
The palm oil sector is a key contributor to the Malaysian economy, representing 6% of total exports and 4% of total GDP in 2014
114
Economic Impact of the Trans-Pacific Partnership Agreement •
Section 5.3 – Palm oil
In 2014, the value of Malaysia’s palm oil exports was RM46 billion, representing 6% of total exports
88% of Malaysia’s domestic palm oil production is exported.
Malaysia accounted for 35% of global palm oil mature areas amounting to 5.2 million hectares in 2013. Global palm oil mature areas in 2013 was 14.8 million hectares.
As of 2014, Malaysia had 434 mills, 57 refineries and 18 oleochemical plants for palm oil production.
In 2014, the palm oil sector was valued at RM41.3 billion, representing 4% of total GDP and 40% of agriculture
In 2014, the total GDP in Malaysia was RM1,094.6 billion and the value of the agriculture industry was RM98.2 billion.
Other top contributing sectors to Malaysia were wholesale and retail trade, government services and information and communications, contributing 15%, 9% and 5% respectively to total GDP.
Palm oil products can be broadly broken down into crude palm oil (“CPO”), palm kernel, palm kernel cake and crude palm kernel oil.
In 2014, Malaysia’s top palm oil products in terms of production were CPO, followed by palm kernel, palm kernel cake and crude palm kernel oil.
66% 17% 8% 9%
Source: Department of Statistics Malaysian (DOSM)
Source: Malaysian Palm Oil Board (MPOB)
19%
2%
3%
4%
4%
5%
6%
7%
8%
9%
33%
0% 5% 10% 15% 20% 25% 30% 35% 40%
Other
Rubber Products
Scientific Equipment
Metal
Machinery
Crude Petroluem
Palm Oil
Chemical Products
LNG
Petroleum Products
Electronic Products
Malaysia’s Total Exports 2014 (Total RM766 billion)
To
p 5
Source: MATRADE, United States Department of Agriculture (USDA)
Source: United States Department of Agriculture (USDA)
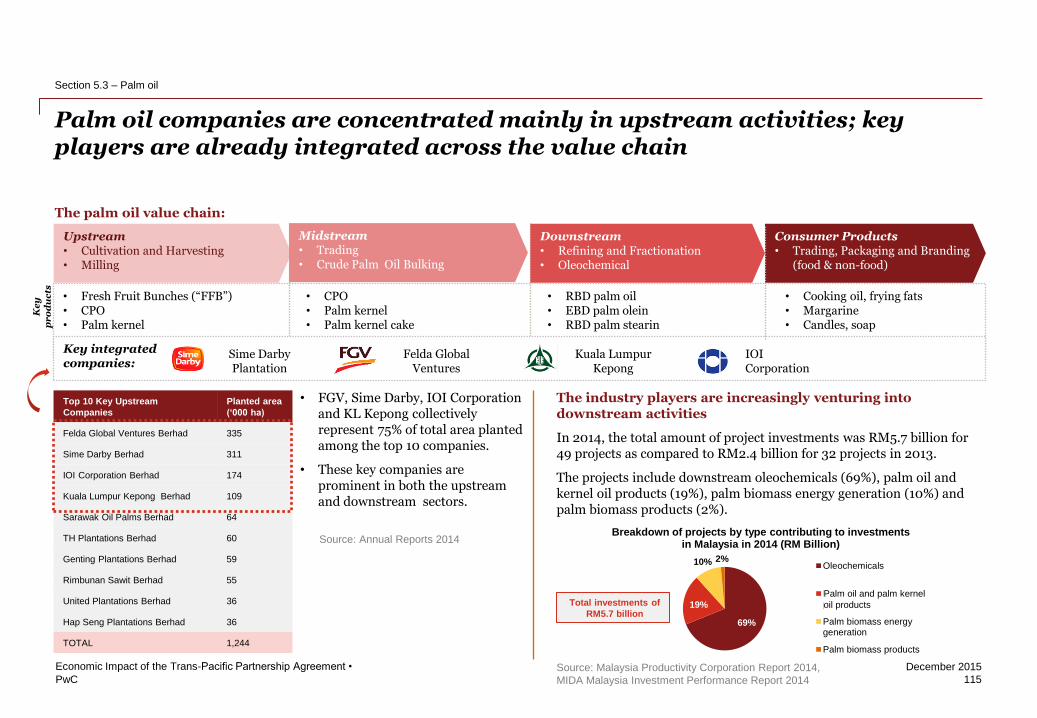
PwC
December 2015
The industry players are increasingly venturing into downstream activities
In 2014, the total amount of project investments was RM5.7 billion for 49 projects as compared to RM2.4 billion for 32 projects in 2013.
The projects include downstream oleochemicals (69%), palm oil and kernel oil products (19%), palm biomass energy generation (10%) and palm biomass products (2%).
The palm oil value chain:
69%
19%
10% 2%
Breakdown of projects by type contributing to investments in Malaysia in 2014 (RM Billion)
Oleochemicals
Palm oil and pal kernel oilproducts
Palm biomass energygeneration
Palm biomass products
Top 10 Key Upstream
Companies
Planted area
(‘000 ha)
Felda Global Ventures Berhad 335
Sime Darby Berhad 311
IOI Corporation Berhad 174
Kuala Lumpur Kepong Berhad 109
Sarawak Oil Palms Berhad 64
TH Plantations Berhad 60
Genting Plantations Berhad 59
Rimbunan Sawit Berhad 55
United Plantations Berhad 36
Hap Seng Plantations Berhad 36
TOTAL 1,244
Source: Malaysia Productivity Corporation Report 2014,
MIDA Malaysia Investment Performance Report 2014
Palm oil companies are concentrated mainly in upstream activities; key players are already integrated across the value chain
115
Economic Impact of the Trans-Pacific Partnership Agreement •
Section 5.3 – Palm oil
Upstream • Cultivation and Harvesting • Milling
Midstream • Trading • Crude Palm Oil Bulking
Downstream • Refining and Fractionation • Oleochemical
Consumer Products • Trading, Packaging and Branding
(food & non-food)
Ke
y
pr
od
uc
ts
• Fresh Fruit Bunches (“FFB”) • CPO • Palm kernel
• CPO • Palm kernel • Palm kernel cake
• RBD palm oil • EBD palm olein • RBD palm stearin
• Cooking oil, frying fats • Margarine • Candles, soap
Key integrated companies:
Sime Darby Plantation
Felda Global Ventures
Kuala Lumpur Kepong
IOI Corporation
• FGV, Sime Darby, IOI Corporation and KL Kepong collectively represent 75% of total area planted among the top 10 companies.
• These key companies are prominent in both the upstream and downstream sectors.
Total investments of
RM5.7 billion
Source: Annual Reports 2014
Palm oil and palm kernel
oil products
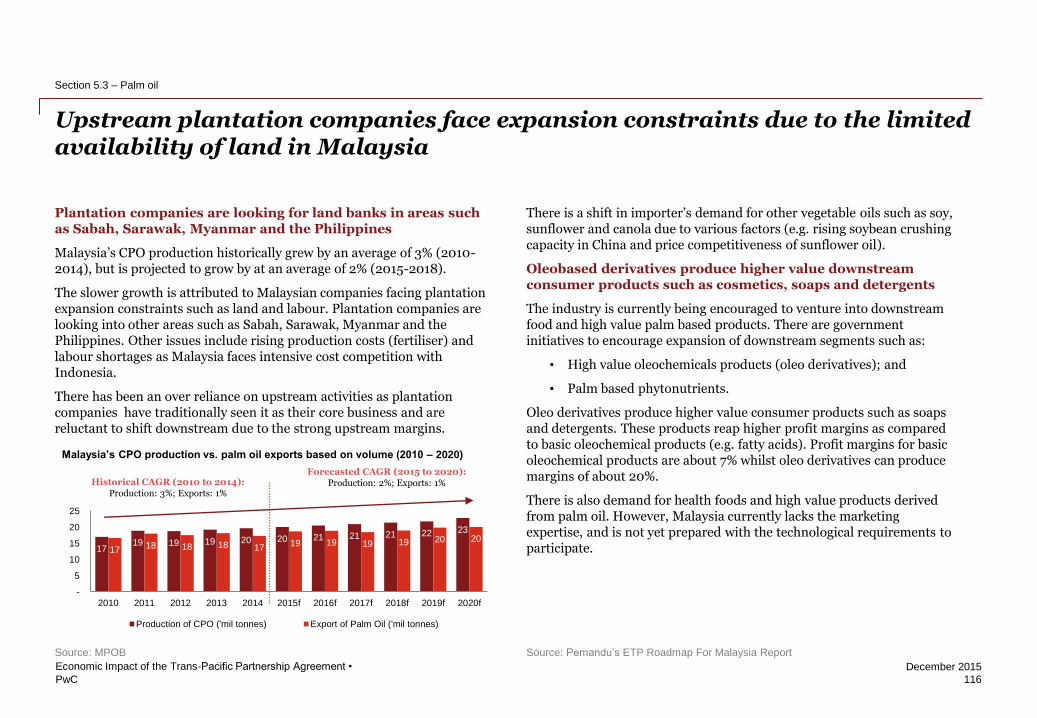
PwC
December 2015
Plantation companies are looking for land banks in areas such as Sabah, Sarawak, Myanmar and the Philippines
Malaysia’s CPO production historically grew by an average of 3% (2010-2014), but is projected to grow by at an average of 2% (2015-2018).
The slower growth is attributed to Malaysian companies facing plantation expansion constraints such as land and labour. Plantation companies are looking into other areas such as Sabah, Sarawak, Myanmar and the Philippines. Other issues include rising production costs (fertiliser) and labour shortages as Malaysia faces intensive cost competition with Indonesia.
There has been an over reliance on upstream activities as plantation companies have traditionally seen it as their core business and are reluctant to shift downstream due to the strong upstream margins.
There is a shift in importer’s demand for other vegetable oils such as soy, sunflower and canola due to various factors (e.g. rising soybean crushing capacity in China and price competitiveness of sunflower oil).
Oleobased derivatives produce higher value downstream consumer products such as cosmetics, soaps and detergents
The industry is currently being encouraged to venture into downstream food and high value palm based products. There are government initiatives to encourage expansion of downstream segments such as:
• High value oleochemicals products (oleo derivatives); and
• Palm based phytonutrients.
Oleo derivatives produce higher value consumer products such as soaps and detergents. These products reap higher profit margins as compared to basic oleochemical products (e.g. fatty acids). Profit margins for basic oleochemical products are about 7% whilst oleo derivatives can produce margins of about 20%.
There is also demand for health foods and high value products derived from palm oil. However, Malaysia currently lacks the marketing expertise, and is not yet prepared with the technological requirements to participate.
Upstream plantation companies face expansion constraints due to the limited availability of land in Malaysia
116
Economic Impact of the Trans-Pacific Partnership Agreement •
Section 5.3 – Palm oil
Source: Pemandu’s ETP Roadmap For Malaysia Report
Forecasted CAGR (2015 to 2020): Production: 2%; Exports: 1% Historical CAGR (2010 to 2014):
Production: 3%; Exports: 1%
Malaysia’s CPO production vs. palm oil exports based on volume (2010 – 2020)
17 19 19 19 20 20 21 21 21 22 23
17 18 18 18 17 19 19 19 19 20 20
-
5
10
15
20
25
2010 2011 2012 2013 2014 2015f 2016f 2017f 2018f 2019f 2020f
Production of CPO ('mil tonnes) Export of Palm Oil ('mil tonnes)
Source: MPOB
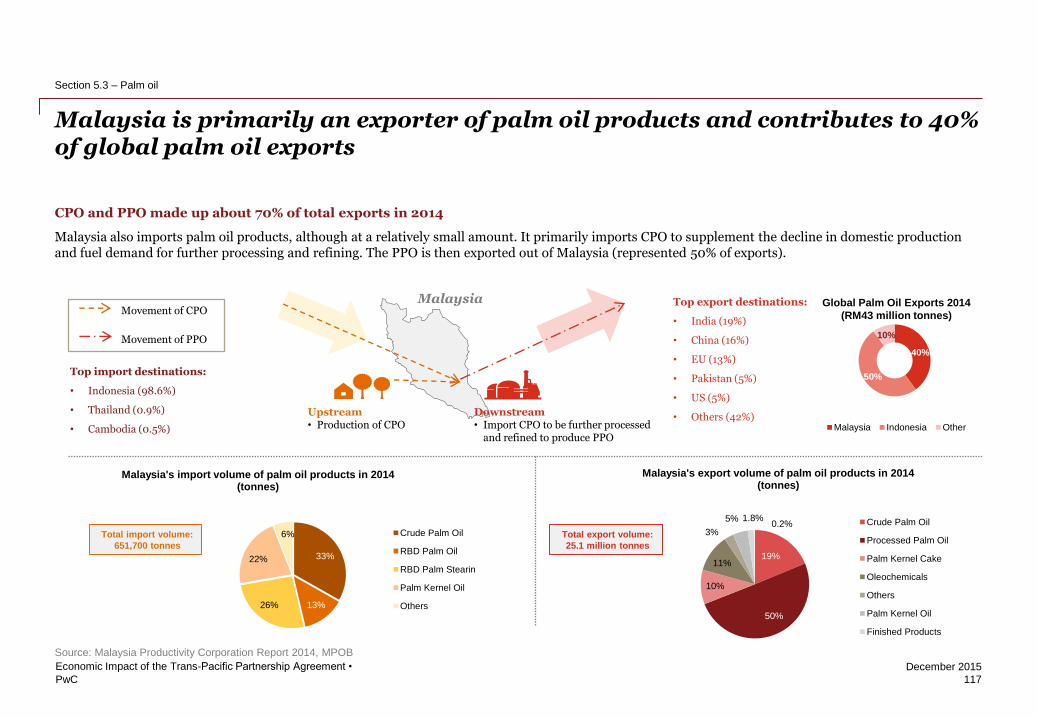
PwC
December 2015
CPO and PPO made up about 70% of total exports in 2014
Malaysia also imports palm oil products, although at a relatively small amount. It primarily imports CPO to supplement the decline in domestic production and fuel demand for further processing and refining. The PPO is then exported out of Malaysia (represented 50% of exports).
Malaysia is primarily an exporter of palm oil products and contributes to 40% of global palm oil exports
117
Economic Impact of the Trans-Pacific Partnership Agreement •
Section 5.3 – Palm oil
19%
50%
10%
11%
3%
5% 1.8% 0.2%
Malaysia's export volume of palm oil products in 2014 (tonnes)
Crude Palm Oil
Processed Palm Oil
Palm Kernel Cake
Oleochemicals
Others
Palm Kernel Oil
Finished Products
33%
13% 26%
22%
6%
Malaysia's import volume of palm oil products in 2014 (tonnes)
Crude Palm Oil
RBD Palm Oil
RBD Palm Stearin
Palm Kernel Oil
Others
Upstream • Production of CPO
Downstream • Import CPO to be further processed
and refined to produce PPO
Malaysia
Top import destinations:
• Indonesia (98.6%)
• Thailand (0.9%)
• Cambodia (0.5%)
Top export destinations:
• India (19%)
• China (16%)
• EU (13%)
• Pakistan (5%)
• US (5%)
• Others (42%)
Movement of CPO
Movement of PPO
Total import volume:
651,700 tonnes
Total export volume:
25.1 million tonnes
Source: Malaysia Productivity Corporation Report 2014, MPOB
40%
50%
10%
Malaysia Indonesia Other
Global Palm Oil Exports 2014
(RM43 million tonnes)

PwC
December 2015
4,800
349
456
483
514
604
783
816
2,411
2,839
3,252
Others
Egypt
Benin
Singapore
Japan
Vietnam
USA
Pakistan
EU
China
India
In 2014, only 14% of palm oil exports were to TPPA countries
The key markets for palm oil exports are non-TPPA countries such as India (19%), China (16%) and the EU (13%).
Countries such as China and India have a high demand for palm oil due to its popularity amongst industrial food manufacturers to create palm based products such as cakes and instant noodles.
Furthermore, it is more economical for these countries to import from Malaysia in terms of logistics and shipment.
TPPA countries such as Mexico and Peru tend to import palm oil from their neighbouring countries in Latin America (e.g. Colombia).
Malaysia’s top export destinations of CPO by volume in 2014 (‘000 tonnes)
Malaysia’s palm oil export volume by products in 2014 (‘000 tonnes)
86% of Malaysia’s palm oil exports are to non-TPPA countries with key target markets being China, India and the EU
118
Economic Impact of the Trans-Pacific Partnership Agreement •
Section 5.3 – Palm oil
Note: Palm oil includes both crude and processed palm oil.
TPPA country Non TPPA country
19%
16%
13%
5%
5%
3%
3%
3%
3%
2%
29%
2,532
1,089 690 510 279 85 5
17,306
2,575 2,828
709 1,117
450 87
-
2,000
4,000
6,000
8,000
10,000
12,000
14,000
16,000
18,000
20,000
TPP Export Volume Total Export Volume
Source: MPOB Source: MPOB
Total CPO export volume:
17.3 million tonnes
Total export volume:
25.1 million tonnes
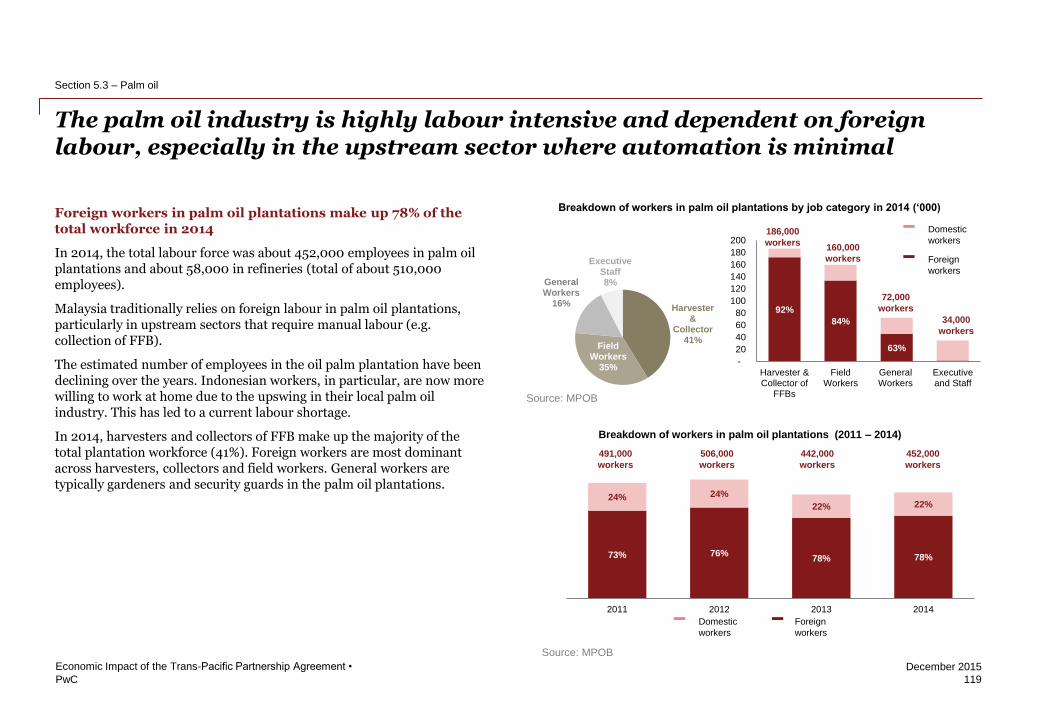
PwC
December 2015
73% 76% 78% 78%
24% 24%
22% 22%
2011 2012 2013 2014
Foreign workers in palm oil plantations make up 78% of the total workforce in 2014
In 2014, the total labour force was about 452,000 employees in palm oil plantations and about 58,000 in refineries (total of about 510,000 employees).
Malaysia traditionally relies on foreign labour in palm oil plantations, particularly in upstream sectors that require manual labour (e.g. collection of FFB).
The estimated number of employees in the oil palm plantation have been declining over the years. Indonesian workers, in particular, are now more willing to work at home due to the upswing in their local palm oil industry. This has led to a current labour shortage.
In 2014, harvesters and collectors of FFB make up the majority of the total plantation workforce (41%). Foreign workers are most dominant across harvesters, collectors and field workers. General workers are typically gardeners and security guards in the palm oil plantations.
The palm oil industry is highly labour intensive and dependent on foreign labour, especially in the upstream sector where automation is minimal
119
Economic Impact of the Trans-Pacific Partnership Agreement •
Section 5.3 – Palm oil
Breakdown of workers in palm oil plantations by job category in 2014 (‘000)
92%
84%
63%
-
20
40
60
80
100
120
140
160
180
200
Harvester &Collector of
FFBs
FieldWorkers
GeneralWorkers
Executiveand Staff
Th
ou
san
ds
Harvester &
Collector 41%
Field Workers
35%
General Workers
16%
Executive Staff 8%
Breakdown of workers in palm oil plantations (2011 – 2014)
491,000
workers
506,000
workers
442,000
workers
452,000
workers
Domestic
workers
Foreign
workers
Source: MPOB
186,000
workers 160,000
workers
72,000
workers
34,000
workers
Source: MPOB
Domestic
workers
Foreign
workers
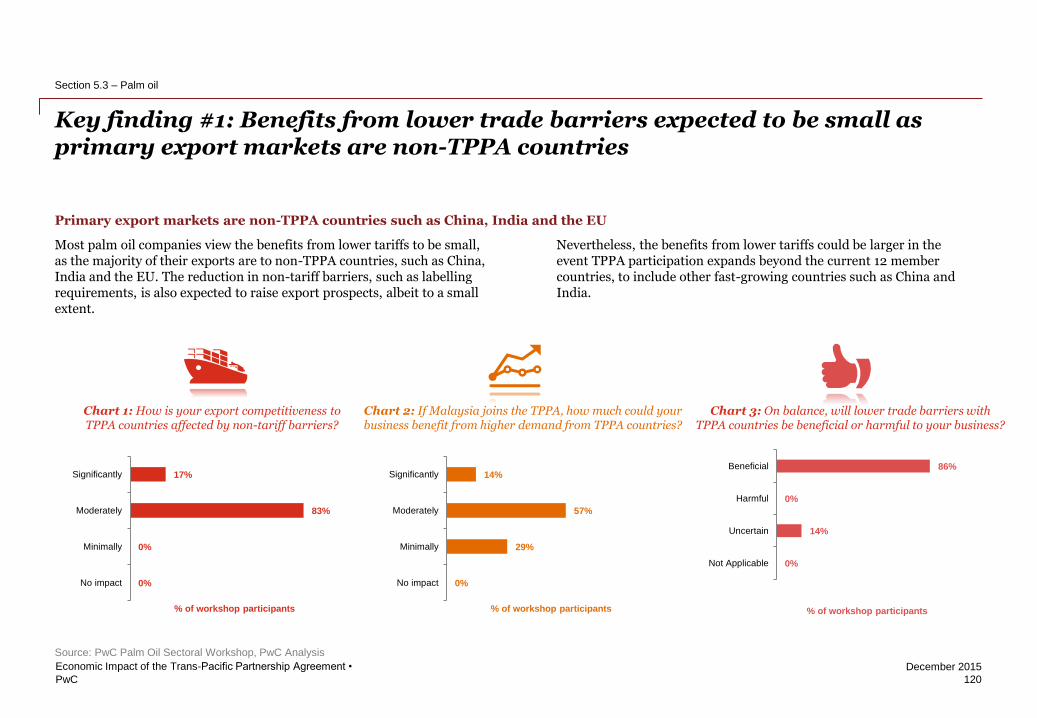
PwC
December 2015
Key finding #1: Benefits from lower trade barriers expected to be small as primary export markets are non-TPPA countries
120
Economic Impact of the Trans-Pacific Partnership Agreement •
Section 5.3 – Palm oil
Most palm oil companies view the benefits from lower tariffs to be small, as the majority of their exports are to non-TPPA countries, such as China, India and the EU. The reduction in non-tariff barriers, such as labelling requirements, is also expected to raise export prospects, albeit to a small extent.
Nevertheless, the benefits from lower tariffs could be larger in the event TPPA participation expands beyond the current 12 member countries, to include other fast-growing countries such as China and India.
Chart 1: How is your export competitiveness to TPPA countries affected by non-tariff barriers?
0%
0%
83%
17%
No impact
Minimally
Moderately
Significantly
% of workshop participants
0%
29%
57%
14%
No impact
Minimally
Moderately
Significantly
% of workshop participants
0%
14%
0%
86%
Not Applicable
Uncertain
Harmful
Beneficial
% of workshop participants
Chart 2: If Malaysia joins the TPPA, how much could your business benefit from higher demand from TPPA countries?
Chart 3: On balance, will lower trade barriers with TPPA countries be beneficial or harmful to your business?
Source: PwC Palm Oil Sectoral Workshop, PwC Analysis
Primary export markets are non-TPPA countries such as China, India and the EU
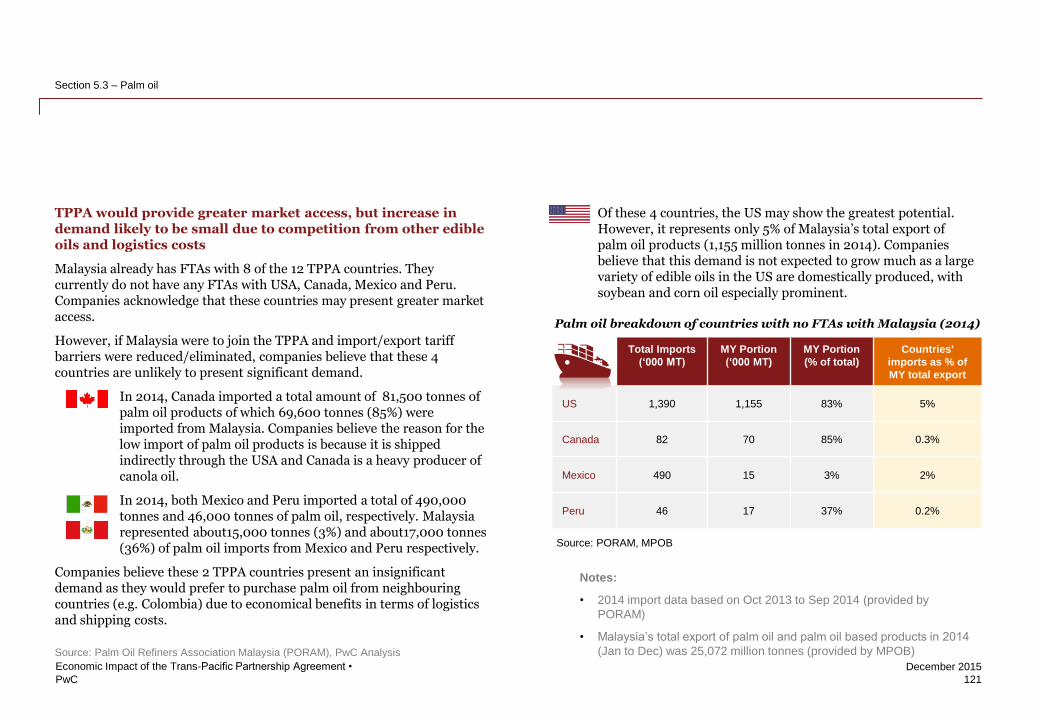
PwC
December 2015
• Of these 4 countries, the US may show the greatest potential. However, it represents only 5% of Malaysia’s total export of palm oil products (1,155 million tonnes in 2014). Companies believe that this demand is not expected to grow much as a large variety of edible oils in the US are domestically produced, with soybean and corn oil especially prominent.
Notes:
• 2014 import data based on Oct 2013 to Sep 2014 (provided by
PORAM)
• Malaysia’s total export of palm oil and palm oil based products in 2014
(Jan to Dec) was 25,072 million tonnes (provided by MPOB)
121
Economic Impact of the Trans-Pacific Partnership Agreement •
Section 5.3 – Palm oil
TPPA would provide greater market access, but increase in demand likely to be small due to competition from other edible oils and logistics costs
Malaysia already has FTAs with 8 of the 12 TPPA countries. They currently do not have any FTAs with USA, Canada, Mexico and Peru. Companies acknowledge that these countries may present greater market access.
However, if Malaysia were to join the TPPA and import/export tariff barriers were reduced/eliminated, companies believe that these 4 countries are unlikely to present significant demand.
• In 2014, Canada imported a total amount of 81,500 tonnes of palm oil products of which 69,600 tonnes (85%) were imported from Malaysia. Companies believe the reason for the low import of palm oil products is because it is shipped indirectly through the USA and Canada is a heavy producer of canola oil.
• In 2014, both Mexico and Peru imported a total of 490,000 tonnes and 46,000 tonnes of palm oil, respectively. Malaysia represented about15,000 tonnes (3%) and about17,000 tonnes (36%) of palm oil imports from Mexico and Peru respectively.
Companies believe these 2 TPPA countries present an insignificant demand as they would prefer to purchase palm oil from neighbouring countries (e.g. Colombia) due to economical benefits in terms of logistics and shipping costs.
Total Imports
(‘000 MT)
MY Portion
(‘000 MT)
MY Portion
(% of total)
Countries'
imports as % of
MY total export
US 1,390 1,155 83% 5%
Canada 82 70 85% 0.3%
Mexico 490 15 3% 2%
Peru 46 17 37% 0.2%
Source: PORAM, MPOB
Palm oil breakdown of countries with no FTAs with Malaysia (2014)
Source: Palm Oil Refiners Association Malaysia (PORAM), PwC Analysis
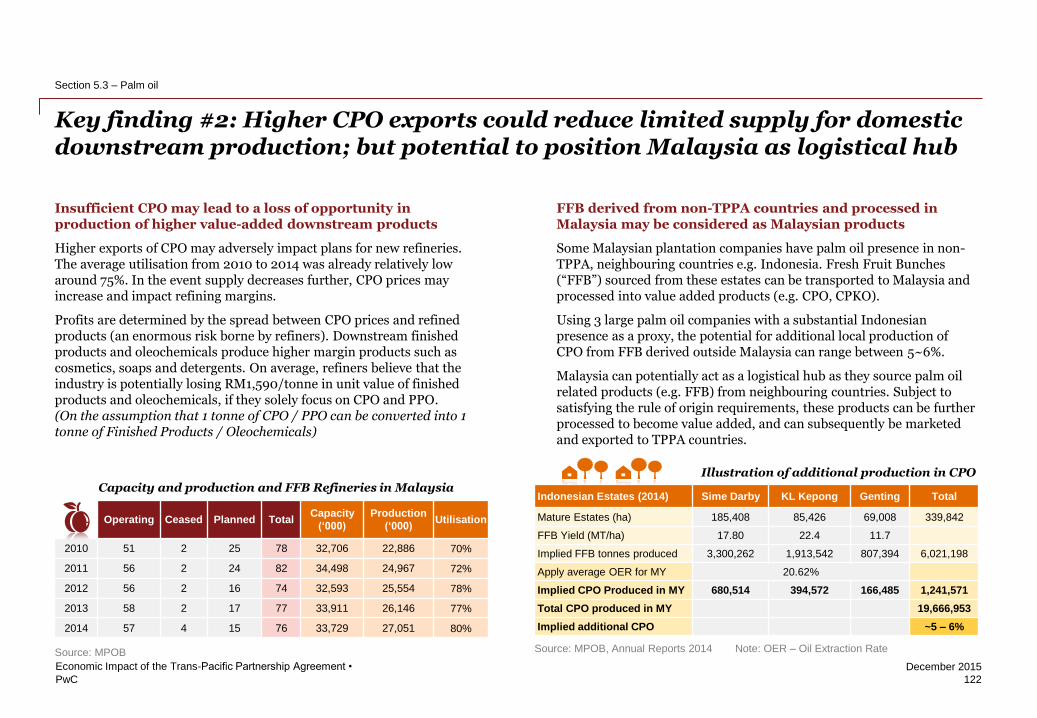
PwC
December 2015
FFB derived from non-TPPA countries and processed in Malaysia may be considered as Malaysian products
Some Malaysian plantation companies have palm oil presence in non-TPPA, neighbouring countries e.g. Indonesia. Fresh Fruit Bunches (“FFB”) sourced from these estates can be transported to Malaysia and processed into value added products (e.g. CPO, CPKO).
Using 3 large palm oil companies with a substantial Indonesian presence as a proxy, the potential for additional local production of CPO from FFB derived outside Malaysia can range between 5~6%.
Malaysia can potentially act as a logistical hub as they source palm oil related products (e.g. FFB) from neighbouring countries. Subject to satisfying the rule of origin requirements, these products can be further processed to become value added, and can subsequently be marketed and exported to TPPA countries.
Insufficient CPO may lead to a loss of opportunity in production of higher value-added downstream products
Higher exports of CPO may adversely impact plans for new refineries. The average utilisation from 2010 to 2014 was already relatively low around 75%. In the event supply decreases further, CPO prices may increase and impact refining margins.
Profits are determined by the spread between CPO prices and refined products (an enormous risk borne by refiners). Downstream finished products and oleochemicals produce higher margin products such as cosmetics, soaps and detergents. On average, refiners believe that the industry is potentially losing RM1,590/tonne in unit value of finished products and oleochemicals, if they solely focus on CPO and PPO. (On the assumption that 1 tonne of CPO / PPO can be converted into 1 tonne of Finished Products / Oleochemicals)
Key finding #2: Higher CPO exports could reduce limited supply for domestic downstream production; but potential to position Malaysia as logistical hub
122
Economic Impact of the Trans-Pacific Partnership Agreement •
Section 5.3 – Palm oil
Operating Ceased Planned Total Capacity
(‘000)
Production
(‘000) Utilisation
2010 51 2 25 78 32,706 22,886 70%
2011 56 2 24 82 34,498 24,967 72%
2012 56 2 16 74 32,593 25,554 78%
2013 58 2 17 77 33,911 26,146 77%
2014 57 4 15 76 33,729 27,051 80%
Capacity and production and FFB Refineries in Malaysia
Source: MPOB
Indonesian Estates (2014) Sime Darby KL Kepong Genting Total
Mature Estates (ha) 185,408 85,426 69,008 339,842
FFB Yield (MT/ha) 17.80 22.4 11.7
Implied FFB tonnes produced 3,300,262 1,913,542 807,394 6,021,198
Apply average OER for MY 20.62%
Implied CPO Produced in MY 680,514 394,572 166,485 1,241,571
Total CPO produced in MY 19,666,953
Implied additional CPO ~5 – 6%
Illustration of additional production in CPO
Source: MPOB, Annual Reports 2014 Note: OER – Oil Extraction Rate
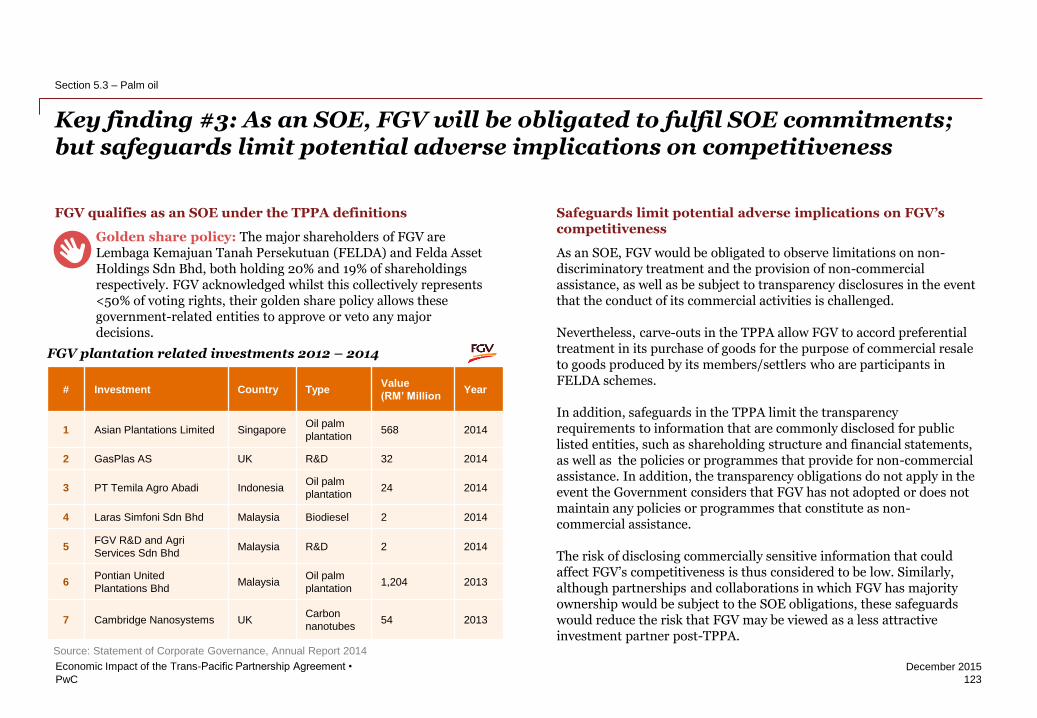
PwC
December 2015
FGV qualifies as an SOE under the TPPA definitions
• Golden share policy: The major shareholders of FGV are Lembaga Kemajuan Tanah Persekutuan (FELDA) and Felda Asset Holdings Sdn Bhd, both holding 20% and 19% of shareholdings respectively. FGV acknowledged whilst this collectively represents <50% of voting rights, their golden share policy allows these government-related entities to approve or veto any major decisions.
Key finding #3: As an SOE, FGV will be obligated to fulfil SOE commitments; but safeguards limit potential adverse implications on competitiveness
123
Economic Impact of the Trans-Pacific Partnership Agreement •
Section 5.3 – Palm oil
Safeguards limit potential adverse implications on FGV’s competitiveness
As an SOE, FGV would be obligated to observe limitations on non-discriminatory treatment and the provision of non-commercial assistance, as well as be subject to transparency disclosures in the event that the conduct of its commercial activities is challenged.
Nevertheless, carve-outs in the TPPA allow FGV to accord preferential treatment in its purchase of goods for the purpose of commercial resale to goods produced by its members/settlers who are participants in FELDA schemes.
In addition, safeguards in the TPPA limit the transparency requirements to information that are commonly disclosed for public listed entities, such as shareholding structure and financial statements, as well as the policies or programmes that provide for non-commercial assistance. In addition, the transparency obligations do not apply in the event the Government considers that FGV has not adopted or does not maintain any policies or programmes that constitute as non-commercial assistance.
The risk of disclosing commercially sensitive information that could affect FGV’s competitiveness is thus considered to be low. Similarly, although partnerships and collaborations in which FGV has majority ownership would be subject to the SOE obligations, these safeguards would reduce the risk that FGV may be viewed as a less attractive investment partner post-TPPA.
Source: Statement of Corporate Governance, Annual Report 2014
# Investment Country Type Value
(RM’ Million Year
1 Asian Plantations Limited Singapore Oil palm
plantation 568 2014
2 GasPlas AS UK R&D 32 2014
3 PT Temila Agro Abadi Indonesia Oil palm
plantation 24 2014
4 Laras Simfoni Sdn Bhd Malaysia Biodiesel 2 2014
5 FGV R&D and Agri
Services Sdn Bhd Malaysia R&D 2 2014
6 Pontian United
Plantations Bhd Malaysia
Oil palm
plantation 1,204 2013
7 Cambridge Nanosystems UK Carbon
nanotubes 54 2013
FGV plantation related investments 2012 – 2014
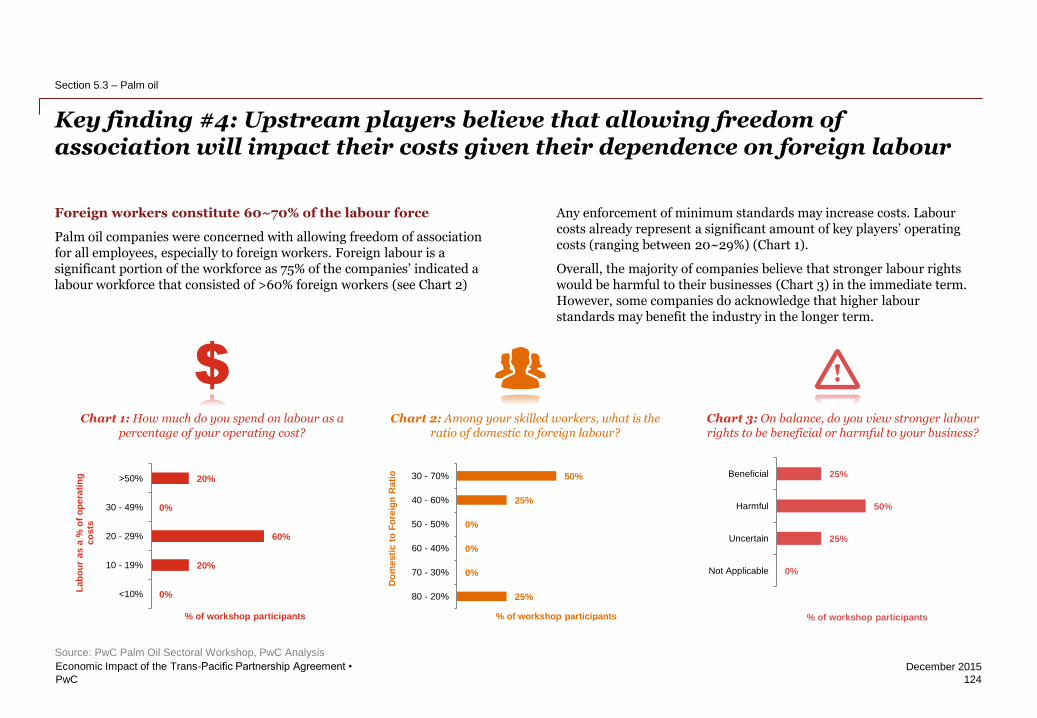
PwC
December 2015
Key finding #4: Upstream players believe that allowing freedom of association will impact their costs given their dependence on foreign labour
124
Economic Impact of the Trans-Pacific Partnership Agreement •
Section 5.3 – Palm oil
Foreign workers constitute 60~70% of the labour force
Palm oil companies were concerned with allowing freedom of association for all employees, especially to foreign workers. Foreign labour is a significant portion of the workforce as 75% of the companies’ indicated a labour workforce that consisted of >60% foreign workers (see Chart 2)
Any enforcement of minimum standards may increase costs. Labour costs already represent a significant amount of key players’ operating costs (ranging between 20~29%) (Chart 1).
Overall, the majority of companies believe that stronger labour rights would be harmful to their businesses (Chart 3) in the immediate term. However, some companies do acknowledge that higher labour standards may benefit the industry in the longer term.
Chart 1: How much do you spend on labour as a percentage of your operating cost?
0%
20%
60%
0%
20%
<10%
10 - 19%
20 - 29%
30 - 49%
>50%
% of workshop participants
Lab
ou
r as a
% o
f o
pera
tin
g
co
sts
25%
0%
0%
0%
25%
50%
80 - 20%
70 - 30%
60 - 40%
50 - 50%
40 - 60%
30 - 70%
% of workshop participants
Do
mesti
c t
o F
ore
ign
Rati
o
0%
25%
50%
25%
Not Applicable
Uncertain
Harmful
Beneficial
% of workshop participants
Chart 2: Among your skilled workers, what is the ratio of domestic to foreign labour?
Chart 3: On balance, do you view stronger labour rights to be beneficial or harmful to your business?
Source: PwC Palm Oil Sectoral Workshop, PwC Analysis
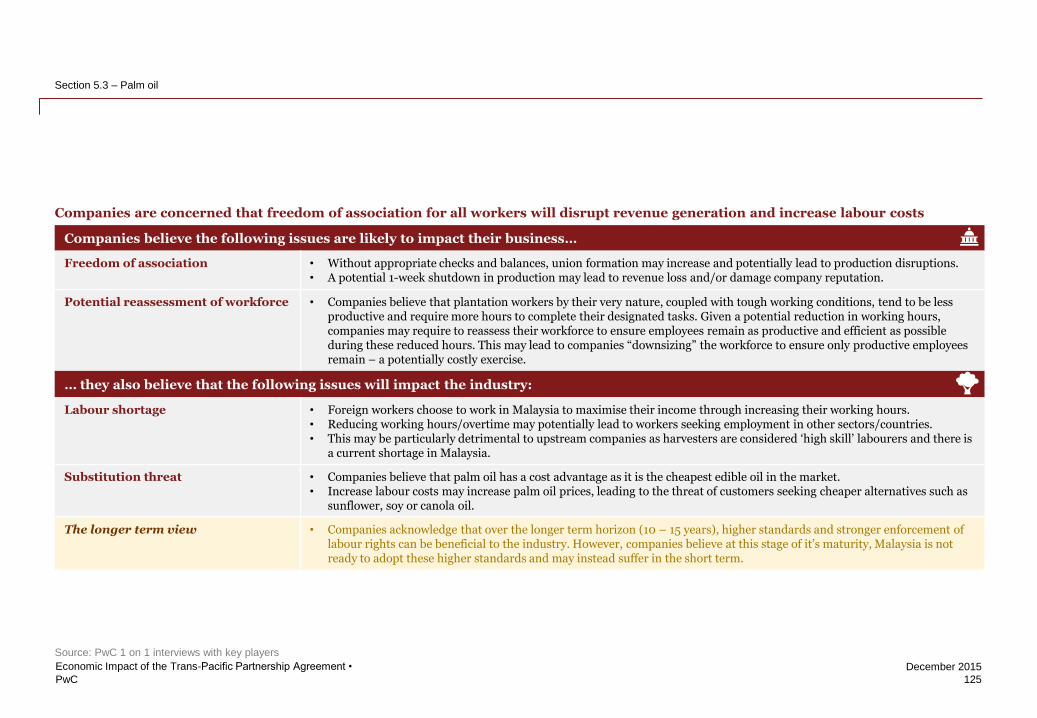
PwC
December 2015
125
Economic Impact of the Trans-Pacific Partnership Agreement •
Section 5.3 – Palm oil
Companies believe the following issues are likely to impact their business…
Freedom of association • Without appropriate checks and balances, union formation may increase and potentially lead to production disruptions. • A potential 1-week shutdown in production may lead to revenue loss and/or damage company reputation.
Potential reassessment of workforce
• Companies believe that plantation workers by their very nature, coupled with tough working conditions, tend to be less productive and require more hours to complete their designated tasks. Given a potential reduction in working hours, companies may require to reassess their workforce to ensure employees remain as productive and efficient as possible during these reduced hours. This may lead to companies “downsizing” the workforce to ensure only productive employees remain – a potentially costly exercise.
… they also believe that the following issues will impact the industry:
Labour shortage • Foreign workers choose to work in Malaysia to maximise their income through increasing their working hours. • Reducing working hours/overtime may potentially lead to workers seeking employment in other sectors/countries. • This may be particularly detrimental to upstream companies as harvesters are considered ‘high skill’ labourers and there is
a current shortage in Malaysia.
Substitution threat • Companies believe that palm oil has a cost advantage as it is the cheapest edible oil in the market. • Increase labour costs may increase palm oil prices, leading to the threat of customers seeking cheaper alternatives such as
sunflower, soy or canola oil.
The longer term view • Companies acknowledge that over the longer term horizon (10 – 15 years), higher standards and stronger enforcement of labour rights can be beneficial to the industry. However, companies believe at this stage of it’s maturity, Malaysia is not ready to adopt these higher standards and may instead suffer in the short term.
Companies are concerned that freedom of association for all workers will disrupt revenue generation and increase labour costs
Source: PwC 1 on 1 interviews with key players
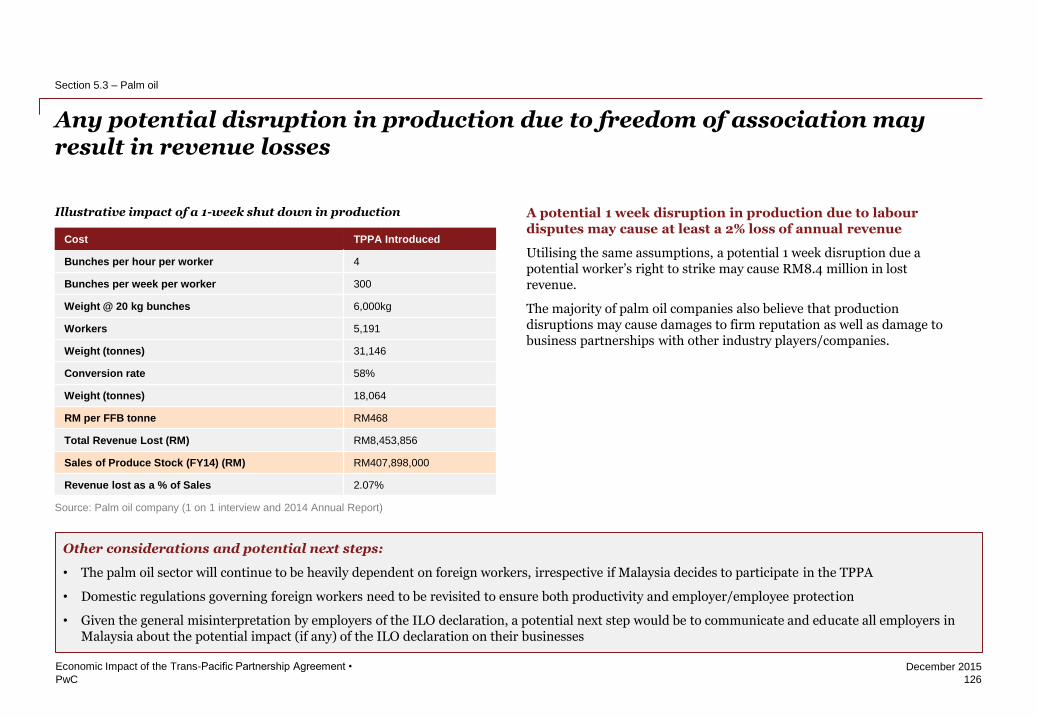
PwC
December 2015
Illustrative impact of a 1-week shut down in production
126
Economic Impact of the Trans-Pacific Partnership Agreement •
Section 5.3 – Palm oil
Cost TPPA Introduced
Bunches per hour per worker 4
Bunches per week per worker 300
Weight @ 20 kg bunches 6,000kg
Workers 5,191
Weight (tonnes) 31,146
Conversion rate 58%
Weight (tonnes) 18,064
RM per FFB tonne RM468
Total Revenue Lost (RM) RM8,453,856
Sales of Produce Stock (FY14) (RM) RM407,898,000
Revenue lost as a % of Sales 2.07%
A potential 1 week disruption in production due to labour disputes may cause at least a 2% loss of annual revenue
Utilising the same assumptions, a potential 1 week disruption due a potential worker’s right to strike may cause RM8.4 million in lost revenue.
The majority of palm oil companies also believe that production disruptions may cause damages to firm reputation as well as damage to business partnerships with other industry players/companies.
Source: Palm oil company (1 on 1 interview and 2014 Annual Report)
Any potential disruption in production due to freedom of association may result in revenue losses
Other considerations and potential next steps:
• The palm oil sector will continue to be heavily dependent on foreign workers, irrespective if Malaysia decides to participate in the TPPA
• Domestic regulations governing foreign workers need to be revisited to ensure both productivity and employer/employee protection
• Given the general misinterpretation by employers of the ILO declaration, a potential next step would be to communicate and educate all employers in Malaysia about the potential impact (if any) of the ILO declaration on their businesses
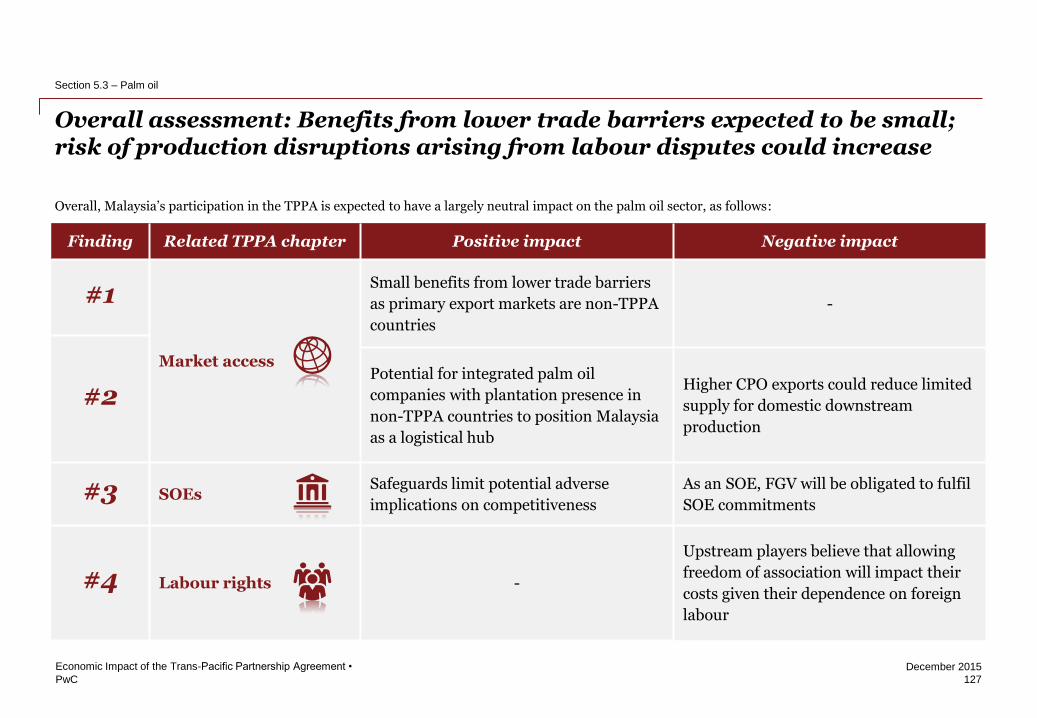
PwC
December 2015
Overall assessment: Benefits from lower trade barriers expected to be small; risk of production disruptions arising from labour disputes could increase
127
Economic Impact of the Trans-Pacific Partnership Agreement •
Section 5.3 – Palm oil
Finding Related TPPA chapter Positive impact Negative impact
#1
Market access
Small benefits from lower trade barriers
as primary export markets are non-TPPA
countries
-
#2 Potential for integrated palm oil
companies with plantation presence in
non-TPPA countries to position Malaysia
as a logistical hub
Higher CPO exports could reduce limited
supply for domestic downstream
production
#3 SOEs Safeguards limit potential adverse
implications on competitiveness
As an SOE, FGV will be obligated to fulfil
SOE commitments
#4 Labour rights -
Upstream players believe that allowing
freedom of association will impact their
costs given their dependence on foreign
labour
Overall, Malaysia’s participation in the TPPA is expected to have a largely neutral impact on the palm oil sector, as follows:

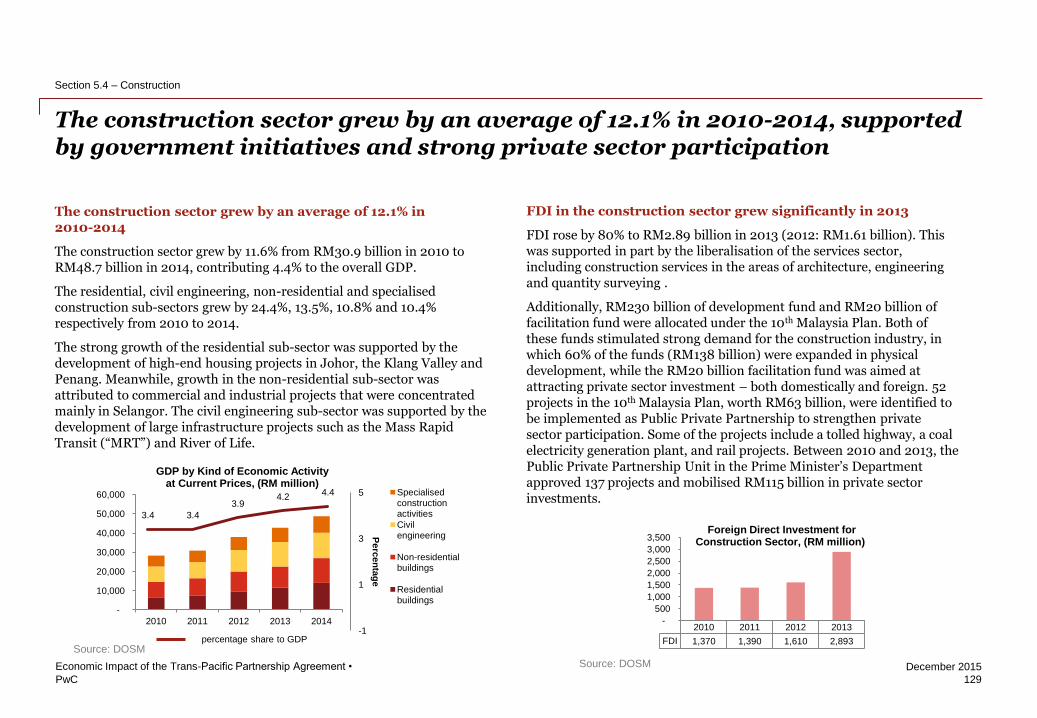
PwC
December 2015
The construction sector grew by an average of 12.1% in 2010-2014
The construction sector grew by 11.6% from RM30.9 billion in 2010 to RM48.7 billion in 2014, contributing 4.4% to the overall GDP.
The residential, civil engineering, non-residential and specialised construction sub-sectors grew by 24.4%, 13.5%, 10.8% and 10.4% respectively from 2010 to 2014.
The strong growth of the residential sub-sector was supported by the development of high-end housing projects in Johor, the Klang Valley and Penang. Meanwhile, growth in the non-residential sub-sector was attributed to commercial and industrial projects that were concentrated mainly in Selangor. The civil engineering sub-sector was supported by the development of large infrastructure projects such as the Mass Rapid Transit (“MRT”) and River of Life.
FDI in the construction sector grew significantly in 2013
FDI rose by 80% to RM2.89 billion in 2013 (2012: RM1.61 billion). This was supported in part by the liberalisation of the services sector, including construction services in the areas of architecture, engineering and quantity surveying .
Additionally, RM230 billion of development fund and RM20 billion of facilitation fund were allocated under the 10th Malaysia Plan. Both of these funds stimulated strong demand for the construction industry, in which 60% of the funds (RM138 billion) were expanded in physical development, while the RM20 billion facilitation fund was aimed at attracting private sector investment – both domestically and foreign. 52 projects in the 10th Malaysia Plan, worth RM63 billion, were identified to be implemented as Public Private Partnership to strengthen private sector participation. Some of the projects include a tolled highway, a coal electricity generation plant, and rail projects. Between 2010 and 2013, the Public Private Partnership Unit in the Prime Minister’s Department approved 137 projects and mobilised RM115 billion in private sector investments.
129
Economic Impact of the Trans-Pacific Partnership Agreement •
Section 5.4 – Construction
2010 2011 2012 2013
FDI 1,370 1,390 1,610 2,893
-
500
1,000
1,500
2,000
2,500
3,000
3,500 Foreign Direct Investment for
Construction Sector, (RM million)
Source: DOSM
The construction sector grew by an average of 12.1% in 2010-2014, supported by government initiatives and strong private sector participation
-
10,000
20,000
30,000
40,000
50,000
60,000
2010 2011 2012 2013 2014
GDP by Kind of Economic Activity at Current Prices, (RM million)
Specialisedconstructionactivities
Civilengineering
Non-residentialbuildings
Residentialbuildings
4.4 4.2
3.9
3.4 3.4
-1
1
3
5
Perc
en
tag
e
Source: DOSM percentage share to GDP
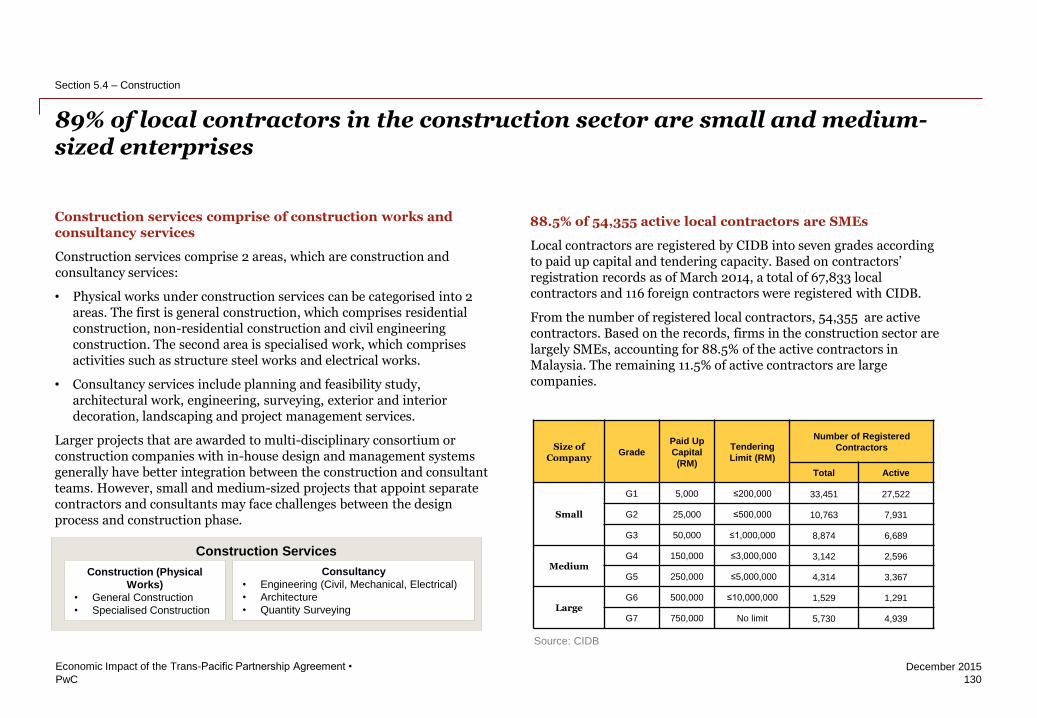
PwC
December 2015
Construction services comprise of construction works and consultancy services
Construction services comprise 2 areas, which are construction and consultancy services:
• Physical works under construction services can be categorised into 2 areas. The first is general construction, which comprises residential construction, non-residential construction and civil engineering construction. The second area is specialised work, which comprises activities such as structure steel works and electrical works.
• Consultancy services include planning and feasibility study, architectural work, engineering, surveying, exterior and interior decoration, landscaping and project management services.
Larger projects that are awarded to multi-disciplinary consortium or construction companies with in-house design and management systems generally have better integration between the construction and consultant teams. However, small and medium-sized projects that appoint separate contractors and consultants may face challenges between the design process and construction phase.
89% of local contractors in the construction sector are small and medium-sized enterprises
130
Economic Impact of the Trans-Pacific Partnership Agreement •
Section 5.4 – Construction
Construction Services
Construction (Physical
Works)
• General Construction
• Specialised Construction
Consultancy
• Engineering (Civil, Mechanical, Electrical)
• Architecture
• Quantity Surveying
Source: CIDB
88.5% of 54,355 active local contractors are SMEs
Local contractors are registered by CIDB into seven grades according to paid up capital and tendering capacity. Based on contractors’ registration records as of March 2014, a total of 67,833 local contractors and 116 foreign contractors were registered with CIDB.
From the number of registered local contractors, 54,355 are active contractors. Based on the records, firms in the construction sector are largely SMEs, accounting for 88.5% of the active contractors in Malaysia. The remaining 11.5% of active contractors are large companies.
Size of Company
Grade Paid Up
Capital
(RM)
Tendering
Limit (RM)
Number of Registered
Contractors
Total Active
Small
G1 5,000 ≤200,000 33,451 27,522
G2 25,000 ≤500,000 10,763 7,931
G3 50,000 ≤1,000,000 8,874 6,689
Medium G4 150,000 ≤3,000,000 3,142 2,596
G5 250,000 ≤5,000,000 4,314 3,367
Large G6 500,000 ≤10,000,000 1,529 1,291
G7 750,000 No limit 5,730 4,939
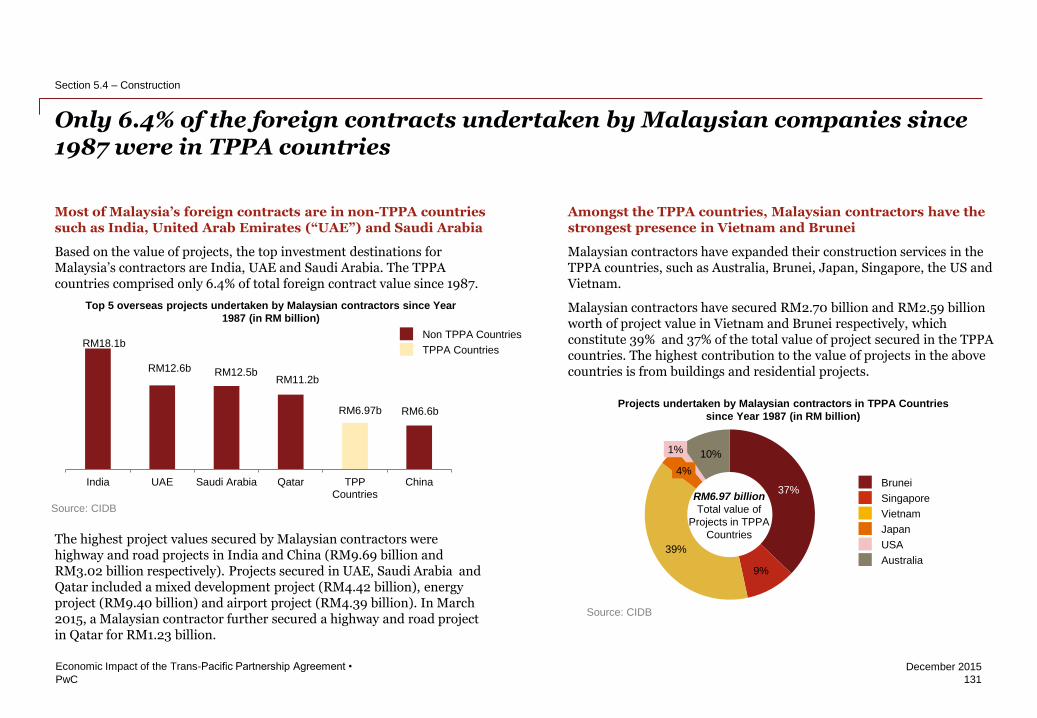
PwC
December 2015
Most of Malaysia’s foreign contracts are in non-TPPA countries such as India, United Arab Emirates (“UAE”) and Saudi Arabia
Based on the value of projects, the top investment destinations for Malaysia’s contractors are India, UAE and Saudi Arabia. The TPPA countries comprised only 6.4% of total foreign contract value since 1987.
The highest project values secured by Malaysian contractors were highway and road projects in India and China (RM9.69 billion and RM3.02 billion respectively). Projects secured in UAE, Saudi Arabia and Qatar included a mixed development project (RM4.42 billion), energy project (RM9.40 billion) and airport project (RM4.39 billion). In March 2015, a Malaysian contractor further secured a highway and road project in Qatar for RM1.23 billion.
India UAE Saudi Arabia Qatar TPPCountries
China
RM12.6b RM12.5b RM11.2b
RM6.97b RM6.6b
Amongst the TPPA countries, Malaysian contractors have the strongest presence in Vietnam and Brunei
Malaysian contractors have expanded their construction services in the TPPA countries, such as Australia, Brunei, Japan, Singapore, the US and Vietnam.
Malaysian contractors have secured RM2.70 billion and RM2.59 billion worth of project value in Vietnam and Brunei respectively, which constitute 39% and 37% of the total value of project secured in the TPPA countries. The highest contribution to the value of projects in the above countries is from buildings and residential projects.
37%
9%
39%
4%
1% 10%
RM6.97 billion
Total value of
Projects in TPPA
Countries
Brunei
Singapore
Vietnam
Japan
USA
Australia
Projects undertaken by Malaysian contractors in TPPA Countries
since Year 1987 (in RM billion)
131
Economic Impact of the Trans-Pacific Partnership Agreement •
Section 5.4 – Construction
Top 5 overseas projects undertaken by Malaysian contractors since Year
1987 (in RM billion)
Source: CIDB
RM18.1b Non TPPA Countries
TPPA Countries
Only 6.4% of the foreign contracts undertaken by Malaysian companies since 1987 were in TPPA countries
Source: CIDB
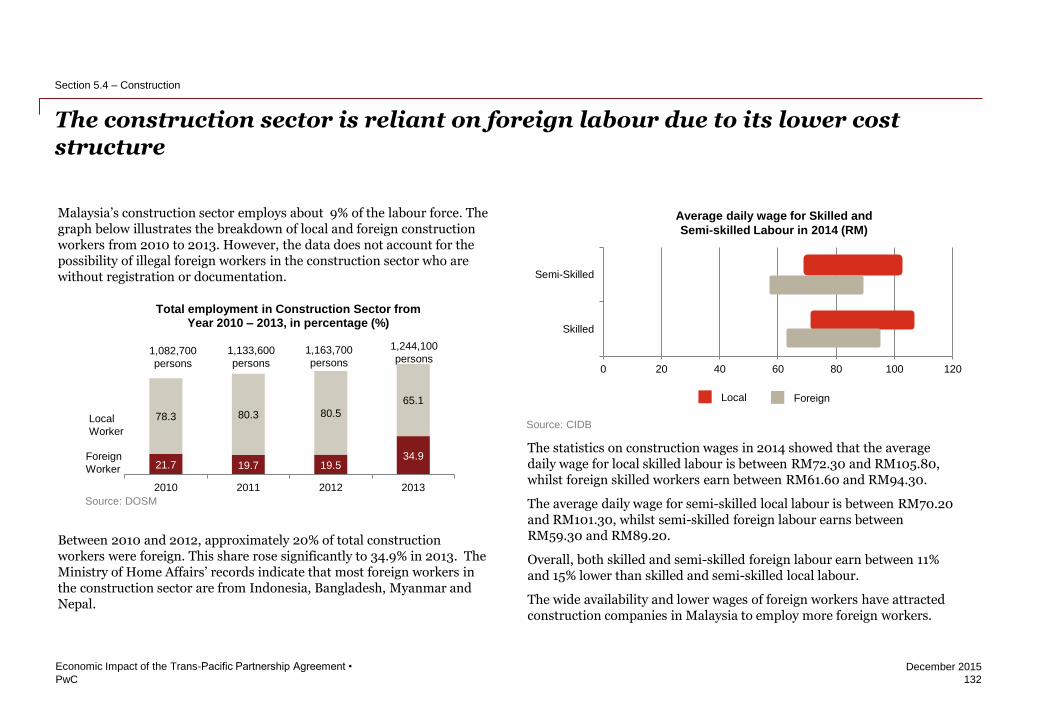
PwC
December 2015
The statistics on construction wages in 2014 showed that the average daily wage for local skilled labour is between RM72.30 and RM105.80, whilst foreign skilled workers earn between RM61.60 and RM94.30.
The average daily wage for semi-skilled local labour is between RM70.20 and RM101.30, whilst semi-skilled foreign labour earns between RM59.30 and RM89.20.
Overall, both skilled and semi-skilled foreign labour earn between 11% and 15% lower than skilled and semi-skilled local labour.
The wide availability and lower wages of foreign workers have attracted construction companies in Malaysia to employ more foreign workers.
0 20 40 60 80 100 120
Skilled
Semi-Skilled
Malaysia’s construction sector employs about 9% of the labour force. The graph below illustrates the breakdown of local and foreign construction workers from 2010 to 2013. However, the data does not account for the possibility of illegal foreign workers in the construction sector who are without registration or documentation.
Between 2010 and 2012, approximately 20% of total construction workers were foreign. This share rose significantly to 34.9% in 2013. The Ministry of Home Affairs’ records indicate that most foreign workers in the construction sector are from Indonesia, Bangladesh, Myanmar and Nepal.
132
Economic Impact of the Trans-Pacific Partnership Agreement •
Section 5.4 – Construction
The construction sector is reliant on foreign labour due to its lower cost structure
Source: DOSM
21.7 19.7 19.5 34.9
78.3 80.3 80.5
65.1
2010 2011 2012 2013
Total employment in Construction Sector from Year 2010 – 2013, in percentage (%)
1,082,700
persons
1,133,600
persons
1,163,700
persons
1,244,100
persons
Foreign
Worker
Local
Worker
Average daily wage for Skilled and
Semi-skilled Labour in 2014 (RM)
Local Foreign
Source: CIDB
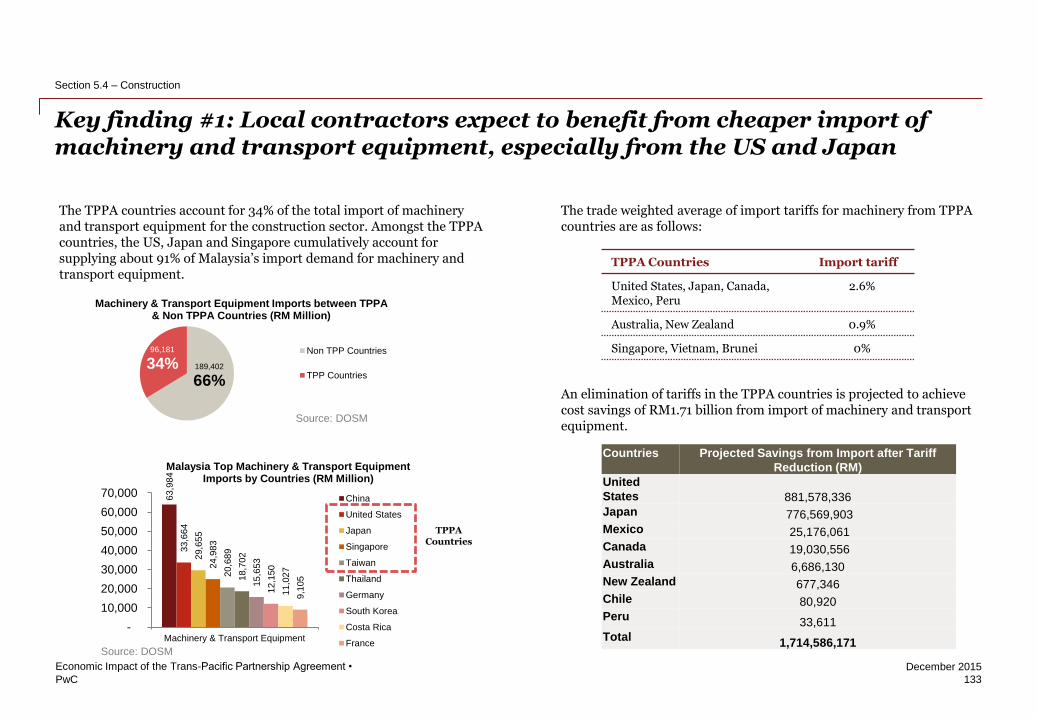
PwC
December 2015
The trade weighted average of import tariffs for machinery from TPPA countries are as follows:
An elimination of tariffs in the TPPA countries is projected to achieve cost savings of RM1.71 billion from import of machinery and transport equipment.
The TPPA countries account for 34% of the total import of machinery and transport equipment for the construction sector. Amongst the TPPA countries, the US, Japan and Singapore cumulatively account for supplying about 91% of Malaysia’s import demand for machinery and transport equipment.
63,9
84
33,6
64
29,6
55
24,9
83
20,6
89
18,7
02
15,6
53
12,1
50
11,0
27
9,1
05
-
10,000
20,000
30,000
40,000
50,000
60,000
70,000
Machinery & Transport Equipment
Malaysia Top Machinery & Transport Equipment Imports by Countries (RM Million)
China
United States
Japan
Singapore
Taiwan
Thailand
Germany
South Korea
Costa Rica
France
133
Economic Impact of the Trans-Pacific Partnership Agreement •
Section 5.4 – Construction
Key finding #1: Local contractors expect to benefit from cheaper import of machinery and transport equipment, especially from the US and Japan
Source: DOSM
TPPA Countries
TPPA Countries Import tariff
United States, Japan, Canada, Mexico, Peru
2.6%
Australia, New Zealand 0.9%
Singapore, Vietnam, Brunei 0% 96,181
34% 189,402
66%
Machinery & Transport Equipment Imports between TPPA & Non TPPA Countries (RM Million)
Non TPP Countries
TPP Countries
Source: DOSM
Countries Projected Savings from Import after Tariff
Reduction (RM)
United
States 881,578,336
Japan 776,569,903
Mexico 25,176,061 Canada 19,030,556
Australia 6,686,130 New Zealand 677,346
Chile 80,920 Peru
33,611
Total 1,714,586,171
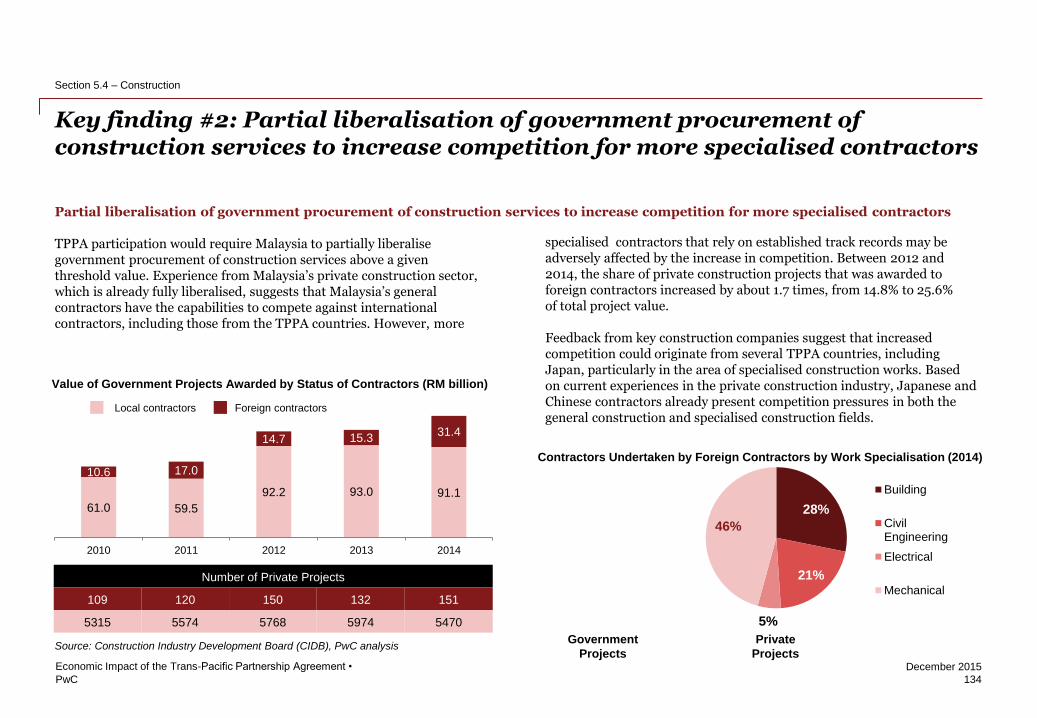
PwC
December 2015
specialised contractors that rely on established track records may be adversely affected by the increase in competition. Between 2012 and 2014, the share of private construction projects that was awarded to foreign contractors increased by about 1.7 times, from 14.8% to 25.6% of total project value.
Feedback from key construction companies suggest that increased competition could originate from several TPPA countries, including Japan, particularly in the area of specialised construction works. Based on current experiences in the private construction industry, Japanese and Chinese contractors already present competition pressures in both the general construction and specialised construction fields.
Key finding #2: Partial liberalisation of government procurement of construction services to increase competition for more specialised contractors
134
Economic Impact of the Trans-Pacific Partnership Agreement •
Section 5.4 – Construction
TPPA participation would require Malaysia to partially liberalise government procurement of construction services above a given threshold value. Experience from Malaysia’s private construction sector, which is already fully liberalised, suggests that Malaysia’s general contractors have the capabilities to compete against international contractors, including those from the TPPA countries. However, more
Contractors Undertaken by Foreign Contractors by Work Specialisation (2014)
28%
21%
5%
46%
Building
CivilEngineering
Electrical
Mechanical
Government
Projects
Private
Projects
Local contractors Foreign contractors
Value of Government Projects Awarded by Status of Contractors (RM billion)
Number of Private Projects
109 120 150 132 151
5315 5574 5768 5974 5470
61.0 59.5
92.2 93.0 91.1
10.6 17.0
14.7 15.3 31.4
2010 2011 2012 2013 2014
Source: Construction Industry Development Board (CIDB), PwC analysis
Partial liberalisation of government procurement of construction services to increase competition for more specialised contractors
PwC
December 2015
135
Economic Impact of the Trans-Pacific Partnership Agreement •
Section 5.4 – Construction
Local general contractors have what it takes to face foreign competition (Company A)
Company A is a public listed company with 38 years of experience in civil and building construction, both locally and internationally. The Group's diverse business activities include investment holdings, civil and building engineering management, property development, highway concessionaire, quarry operations, manufacturing of construction materials, polyurethane system house, utilities and hospitality management.
Company A has successfully completed projects such as roads and highways, bridges and interchanges, waterworks, land reclamation works, residential and commercial buildings, hotels, hospitals, airports and government complexes. Company A began to expand globally in 1995 and currently, the company has international ventures with Thailand, Indonesia, Brunei Darussalam, Pakistan, India, China, UAE, Saudi Arabia, Russia and Nepal.
How Company A maintains its competitiveness in an ever challenging environment
Company A is known to perform works globally, especially in the Middle East and India. They are known to be capable of producing high quality work at a competitive prices relative to the US, Japan and Korea.
Currently, foreign contractors have been awarded high-value projects in Malaysia that comprise more than 20% of the local projects available in 2014. These projects generally require knowledge and capabilities that most Malaysian contractors lack established track records in.
CASE STUDY #1
PwC
December 2015
136
Economic Impact of the Trans-Pacific Partnership Agreement •
Section 5.4 – Construction
A specialised champion internationally but less successful locally (Company B)
Company B is Malaysia’s leading structural steel erection specialist and integrated structural steel contractor, with a strong design and engineering division and modern fabrication facilities. Its presence is strong in UAE and Qatar. Its services includes structural steel process, form design, fabrication through to the erection of the steel structure.
Company B has a background of over 100 projects including many landmark projects in 12 countries such as Malaysia, Singapore, Thailand, Philippines, Indonesia, Hong Kong, Oman, Saudi Arabia, Bahrain, Qatar, UAE and India.
Though being a renowned global player, Company B believes that it has limited opportunities in Malaysia due to an inherent bias against Malaysian firms. Some of the stories shared by Company B are as follows:
CASE STUDY #2
Warisan 118
4 international companies formed a joint venture with local companies as the main contractor for Malaysia’s next landmark building. Due to its competitive pricing, a contractor from China was awarded the steel structure sub-contract. Although Company B believed it had the requisite credentials and capabilities to perform the steel structure work, they were not selected due in part to a slightly higher priced bid offered by them relative to the winning contractor.
Manjung Coal Boiler Unit 5
Company B was the contractor appointed for Manjung Coal Boiler Power Plant Unit 3 and 4. Prior to that they also developed a good track record of building Tanjung Bin and Jimah power plants. However, Daelim Industrial Co. won the Manjung Coal Boiler Unit 5 contract with lower priced bid.
PwC
December 2015
137
Economic Impact of the Trans-Pacific Partnership Agreement •
Section 5.4 – Construction
KL Convention Centre
KL Convention Centre was awarded to Daewoo Engineering & Construction as the main contractor, who then appointed another Korean contractor for the sub-contract of steel work. Company B believes that they were not supported as local players even though they demonstrated the requisite capabilities and had a relevant track record.
Refinery and Petrochemical Integrated Development (RAPID)
The steel structure package for the PETRONAS’ RAPID project was awarded to a Spanish company. Even with the capability to fabricate the steel structure locally, it was sub-contracted to 4 other foreign companies, which included Vietnam, China and UAE. Company B took the initiative to speak to the main contractor in Spain and secured part of the sub-contract of the steel work.
TPPA is perceived to potentially create more harm than benefits to local specialised contractors
Company B raised its opposition against signing the TPPA, even though it is renowned in the international market and potentially has the capabilities to remain competitive following the partial liberalisation of government procurement of construction services.
Company B is also concerned that there are limited opportunities for Malaysian contractors in the TPPA countries due to local cultural differences and preferences, including in terms of language. It views most of the more developed countries to be largely saturated and geographically insignificant for Malaysia contractors to do business (e.g. the Americas).
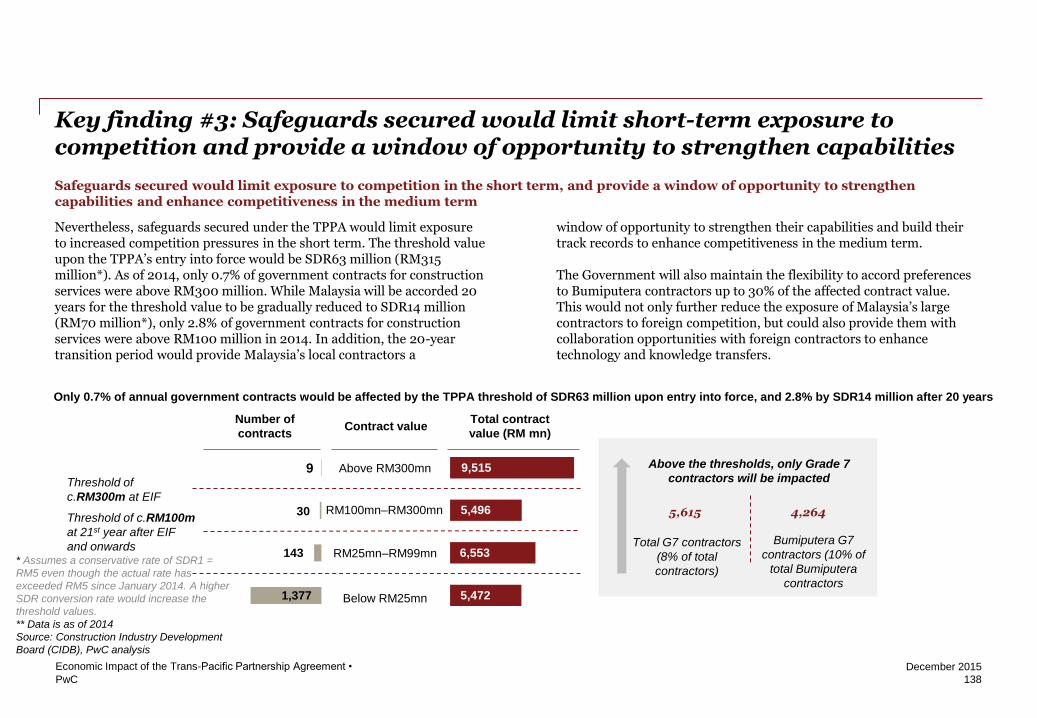
PwC
December 2015
Nevertheless, safeguards secured under the TPPA would limit exposure to increased competition pressures in the short term. The threshold value upon the TPPA’s entry into force would be SDR63 million (RM315 million*). As of 2014, only 0.7% of government contracts for construction services were above RM300 million. While Malaysia will be accorded 20 years for the threshold value to be gradually reduced to SDR14 million (RM70 million*), only 2.8% of government contracts for construction services were above RM100 million in 2014. In addition, the 20-year transition period would provide Malaysia’s local contractors a
138
Economic Impact of the Trans-Pacific Partnership Agreement •
Section 5.4 – Construction
window of opportunity to strengthen their capabilities and build their track records to enhance competitiveness in the medium term.
The Government will also maintain the flexibility to accord preferences to Bumiputera contractors up to 30% of the affected contract value. This would not only further reduce the exposure of Malaysia’s large contractors to foreign competition, but could also provide them with collaboration opportunities with foreign contractors to enhance technology and knowledge transfers.
* Assumes a conservative rate of SDR1 =
RM5 even though the actual rate has
exceeded RM5 since January 2014. A higher
SDR conversion rate would increase the
threshold values.
** Data is as of 2014
Source: Construction Industry Development
Board (CIDB), PwC analysis
Only 0.7% of annual government contracts would be affected by the TPPA threshold of SDR63 million upon entry into force, and 2.8% by SDR14 million after 20 years
Above RM300mn 9
RM100mn–RM300mn
RM25mn–RM99mn
Below RM25mn
Number of
contracts
Total contract
value (RM mn)
143
1,377
30
Contract value
9,515
5,496
6,553
5,472
Threshold of c.RM100m
at 21st year after EIF
and onwards
Threshold of
c.RM300m at EIF
Above the thresholds, only Grade 7
contractors will be impacted
5,615 4,264
Total G7 contractors
(8% of total
contractors)
Bumiputera G7
contractors (10% of
total Bumiputera
contractors
Safeguards secured would limit exposure to competition in the short term, and provide a window of opportunity to strengthen capabilities and enhance competitiveness in the medium term
Key finding #3: Safeguards secured would limit short-term exposure to competition and provide a window of opportunity to strengthen capabilities
Removed footer
referring to sectoral
chapters
PwC
December 2015
139
Economic Impact of the Trans-Pacific Partnership Agreement •
Section 5.4 – Construction
Small support for a bigger cause (Company C)
Company C is a public listed company and the first company in Malaysia to achieve ISO 9002 certification in 1995 in the construction sector. Company C is renowned for being a leader in Marine Construction since its incorporation in 1972. Today, Company C’s business activities include infrastructure and building works, airport and airline support facilities, oil and gas, shipbuilding and other related engineering works, both locally and internationally.
Company C’s global presence is wide, having served a number of clients across all continents. Company C’s global presence include Malaysia, Singapore, Cambodia, the Philippines, China, Qatar, UAE, Denmark, Germany, the United Kingdom, Australia and the US.
CASE STUDY #3
How the government provided support in developing Company C
Part of the success developed by Company C is through the support of government initiatives. The Government created stepping stones for Company C to be able to enhance its credentials to be able to compete internationally . For example:
• In May 1974, the Government approved a joint venture between Company C and Zublin AG of Germany for the construction and completion of the North Port Phase 1. Works include reclamation, marine facilities (wharves) and infrastructure. The Government adopted a policy that encouraged and recommended international contractors to partner with Malaysian companies to provide technology transfers and exposure to local contractors. The support allowed Company C to build up its experience. Today, Company C is recognised internationally as a major port builder.
PwC
December 2015
140
Economic Impact of the Trans-Pacific Partnership Agreement •
Section 5.4 – Construction
• In October 1995, Company C, through its Cambodian subsidiary and a joint venture with Vinci (France), was awarded a Build-Operate-Transfer (“BOT”) contract for Phnom Penh International Airport, Siem Reap International Airport and Sihanouk International Airport. The opportunities had arisen as the Government was encouraging Malaysian contractors to go global, and was proactive in leveraging on Government-to-Government relations to unlock opportunities for local contractors.
• Company C acquired Favelle Favco (“FFC”) in 1995. FFC started manufacturing its own cranes, but faced competition from crane manufacturers overseas. In particular, firms in the oil and gas industry were purchasing cranes from their US suppliers. Nevertheless, the Government encouraged Malaysian firms to purchase locally manufactured cranes for projects in Malaysia, and this eventually helped Company C to become one of the top-3 crane manufacturers in the world under the brand Favelle Favco.
Government support is perceived to be crucial for the development of the Malaysian construction industry
Company C believes that participation in the TPPA could present significant challenges for the development of smaller local contractors. Government support in developing local expertise and knowledge, as well as building established track records, is perceived to remain crucial for smaller Malaysian contractors to become locally and globally competitive.
Company C suggested that a possible measure to continue supporting the participation of local contractors in domestic engineering, procurement, construction and commissioning (“EPCC”) contracts in the oil and gas sector could be to institute local content requirements of no less than 30% of the main tier level of award of projects.
This is comparable to the final TPPA text, which secured the flexibility for PETRONAS to accord preference s to Malaysian enterprises in its purchase of goods and services when engaging in upstream activities in the oil and gas sector in the territory of Malaysia, up to 70% of the total value of the annual budget for the purchase of goods and services for commercial activities upon signing the TPPA. This threshold would gradually decline to 40% by the sixth year of signing the TPPA.
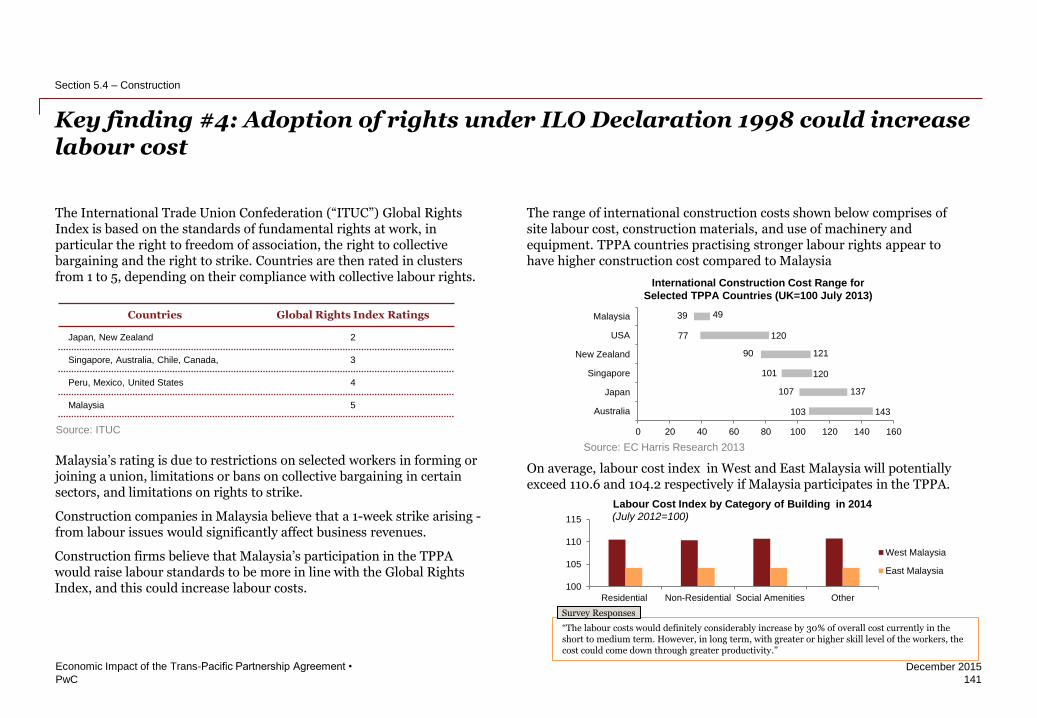
PwC
December 2015
“The labour costs would definitely considerably increase by 30% of overall cost currently in the short to medium term. However, in long term, with greater or higher skill level of the workers, the cost could come down through greater productivity.”
The range of international construction costs shown below comprises of site labour cost, construction materials, and use of machinery and equipment. TPPA countries practising stronger labour rights appear to have higher construction cost compared to Malaysia
On average, labour cost index in West and East Malaysia will potentially exceed 110.6 and 104.2 respectively if Malaysia participates in the TPPA.
Key finding #4: Adoption of rights under ILO Declaration 1998 could increase labour cost
141
Economic Impact of the Trans-Pacific Partnership Agreement •
Section 5.4 – Construction
The International Trade Union Confederation (“ITUC”) Global Rights Index is based on the standards of fundamental rights at work, in particular the right to freedom of association, the right to collective bargaining and the right to strike. Countries are then rated in clusters from 1 to 5, depending on their compliance with collective labour rights.
Malaysia’s rating is due to restrictions on selected workers in forming or joining a union, limitations or bans on collective bargaining in certain sectors, and limitations on rights to strike.
Construction companies in Malaysia believe that a 1-week strike arising -from labour issues would significantly affect business revenues.
Construction firms believe that Malaysia’s participation in the TPPA would raise labour standards to be more in line with the Global Rights Index, and this could increase labour costs.
0 20 40 60 80 100 120 140 160
Australia
Japan
Singapore
New Zealand
USA
Malaysia 49 39
77 120
90 121
120 101
107 137
103 143
International Construction Cost Range for
Selected TPPA Countries (UK=100 July 2013)
Source: EC Harris Research 2013
Countries Global Rights Index Ratings
Japan, New Zealand 2
Singapore, Australia, Chile, Canada, 3
Peru, Mexico, United States 4
Malaysia 5
Source: ITUC
Survey Responses
100
105
110
115
Residential Non-Residential Social Amenities Other
West Malaysia
East Malaysia
Labour Cost Index by Category of Building in 2014 (July 2012=100)
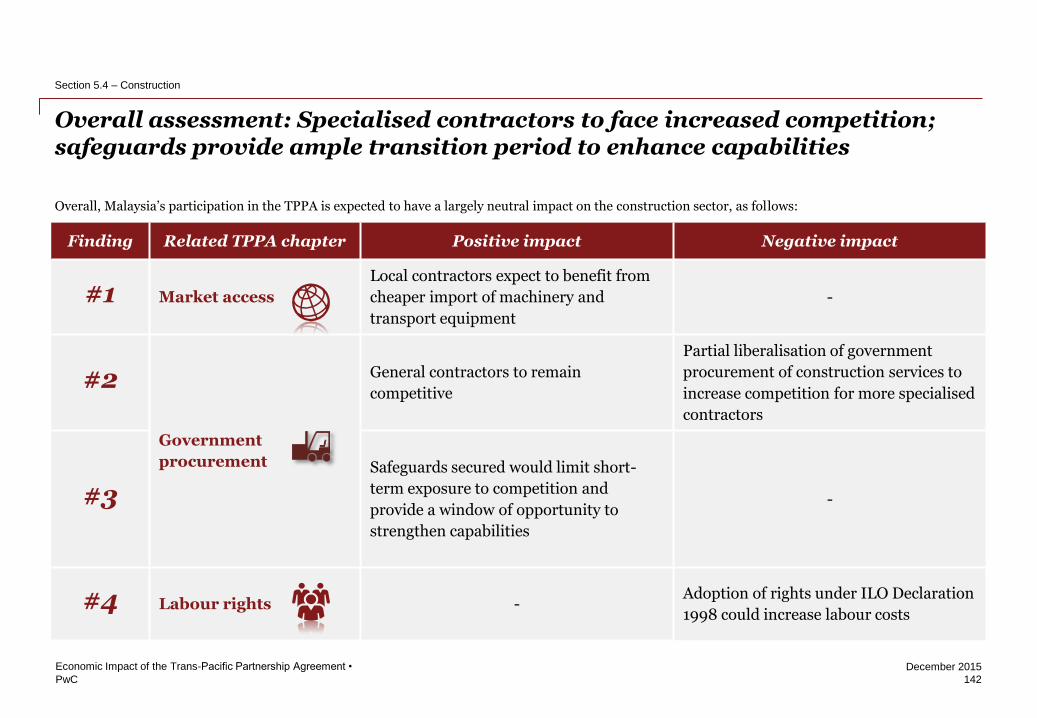
PwC
December 2015
Overall assessment: Specialised contractors to face increased competition; safeguards provide ample transition period to enhance capabilities
142
Economic Impact of the Trans-Pacific Partnership Agreement •
Section 5.4 – Construction
Finding Related TPPA chapter Positive impact Negative impact
#1 Market access
Local contractors expect to benefit from
cheaper import of machinery and
transport equipment
-
#2
Government
procurement
General contractors to remain
competitive
Partial liberalisation of government
procurement of construction services to
increase competition for more specialised
contractors
#3 Safeguards secured would limit short-
term exposure to competition and
provide a window of opportunity to
strengthen capabilities
-
#4 Labour rights - Adoption of rights under ILO Declaration
1998 could increase labour costs
Overall, Malaysia’s participation in the TPPA is expected to have a largely neutral impact on the construction sector, as follows:
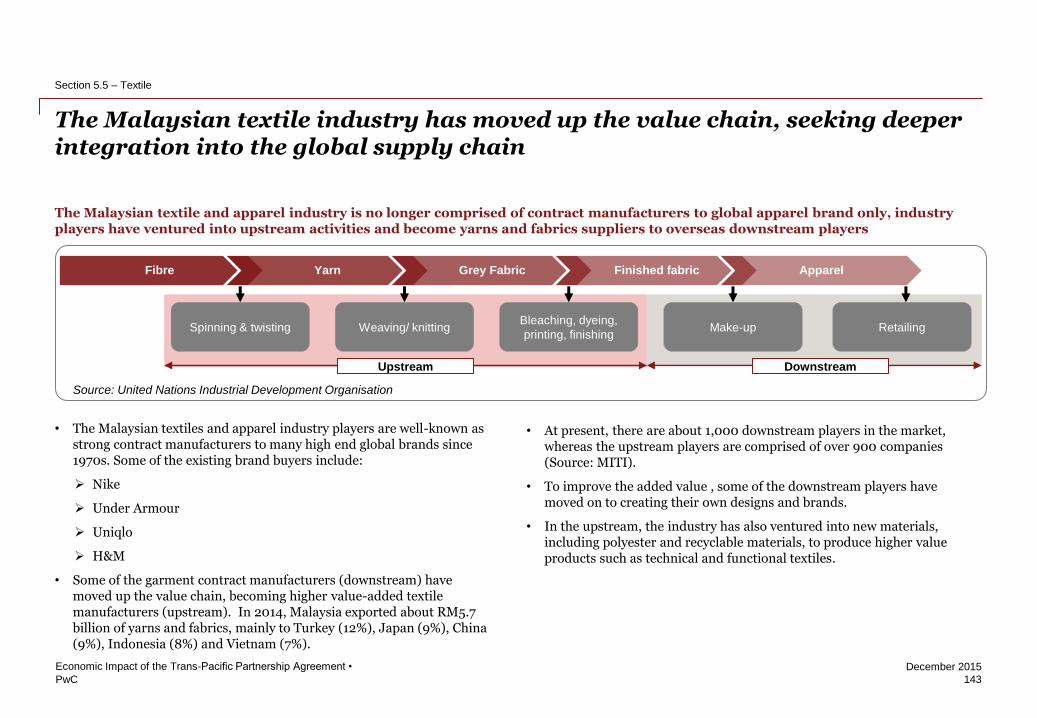
PwC
December 2015
• The Malaysian textiles and apparel industry players are well-known as strong contract manufacturers to many high end global brands since 1970s. Some of the existing brand buyers include:
Nike
Under Armour
Uniqlo
H&M
• Some of the garment contract manufacturers (downstream) have moved up the value chain, becoming higher value-added textile manufacturers (upstream). In 2014, Malaysia exported about RM5.7 billion of yarns and fabrics, mainly to Turkey (12%), Japan (9%), China (9%), Indonesia (8%) and Vietnam (7%).
• At present, there are about 1,000 downstream players in the market, whereas the upstream players are comprised of over 900 companies (Source: MITI).
• To improve the added value , some of the downstream players have moved on to creating their own designs and brands.
• In the upstream, the industry has also ventured into new materials, including polyester and recyclable materials, to produce higher value products such as technical and functional textiles.
The Malaysian textile industry has moved up the value chain, seeking deeper integration into the global supply chain
143
Economic Impact of the Trans-Pacific Partnership Agreement •
Section 5.5 – Textile
Fibre Yarn Grey Fabric Finished fabric Apparel
Spinning & twisting Weaving/ knitting Bleaching, dyeing,
printing, finishing Make-up Retailing
Downstream Upstream
The Malaysian textile and apparel industry is no longer comprised of contract manufacturers to global apparel brand only, industry players have ventured into upstream activities and become yarns and fabrics suppliers to overseas downstream players
Source: United Nations Industrial Development Organisation
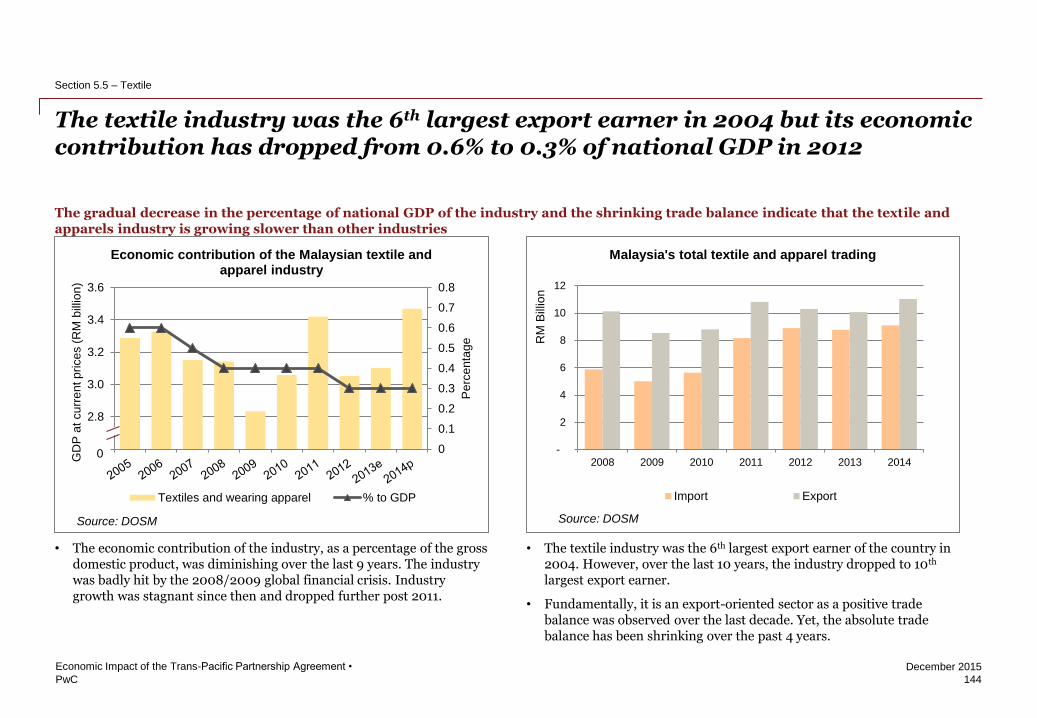
PwC
December 2015
• The economic contribution of the industry, as a percentage of the gross domestic product, was diminishing over the last 9 years. The industry was badly hit by the 2008/2009 global financial crisis. Industry growth was stagnant since then and dropped further post 2011.
144
Economic Impact of the Trans-Pacific Partnership Agreement •
Section 5.5 – Textile
• The textile industry was the 6th largest export earner of the country in 2004. However, over the last 10 years, the industry dropped to 10th largest export earner.
• Fundamentally, it is an export-oriented sector as a positive trade balance was observed over the last decade. Yet, the absolute trade balance has been shrinking over the past 4 years.
0
0.1
0.2
0.3
0.4
0.5
0.6
0.7
0.8
2.6
2.8
3.0
3.2
3.4
3.6
Pe
rce
nta
ge
GD
P a
t cu
rre
nt p
rice
s (
RM
bill
ion
)
Economic contribution of the Malaysian textile and apparel industry
Textiles and wearing apparel % to GDP
Source: DOSM
0
Source: DOSM
-
2
4
6
8
10
12
2008 2009 2010 2011 2012 2013 2014
RM
Bill
ion
Malaysia's total textile and apparel trading
Import Export
The textile industry was the 6th largest export earner in 2004 but its economic contribution has dropped from 0.6% to 0.3% of national GDP in 2012
The gradual decrease in the percentage of national GDP of the industry and the shrinking trade balance indicate that the textile and apparels industry is growing slower than other industries
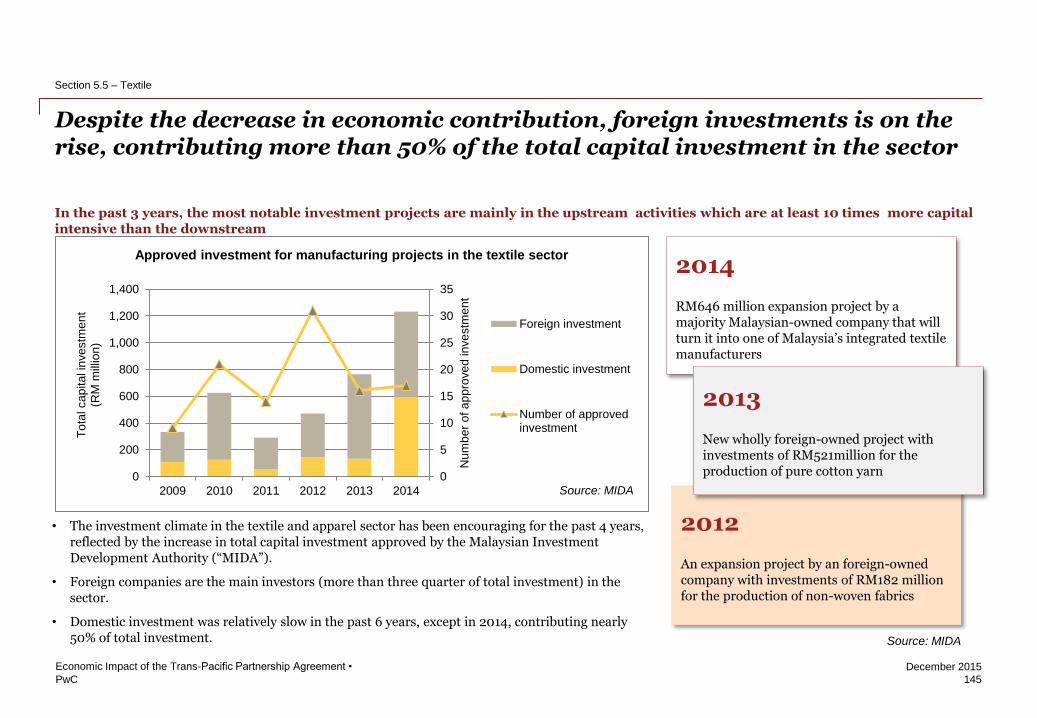
PwC
December 2015
In the past 3 years, the most notable investment projects are mainly in the upstream activities which are at least 10 times more capital intensive than the downstream
145
Economic Impact of the Trans-Pacific Partnership Agreement •
Section 5.5 – Textile
Parameter 2012/13
Country MT (‘000)
Exports US 2,902
India 1,685
Australia 1,345
Brazil 938
Uzbekistan 653
Imports China 4,426
Turkey 804
Indonesia 683
Bangladesh 631
Vietnam 517
2014 RM646 million expansion project by a majority Malaysian-owned company that will turn it into one of Malaysia’s integrated textile manufacturers
2012
An expansion project by an foreign-owned company with investments of RM182 million for the production of non-woven fabrics
Source: MIDA 0
5
10
15
20
25
30
35
0
200
400
600
800
1,000
1,200
1,400
2009 2010 2011 2012 2013 2014
Num
be
r o
f a
pp
rove
d in
ve
stm
en
t
To
tal ca
pita
l in
ve
stm
en
t
(RM
mill
ion
)
Approved investment for manufacturing projects in the textile sector
Foreign investment
Domestic investment
Number of approvedinvestment
2006-2010 2011-2015 2016-2020 2006-2020 2006-2020
(RM billion) Average
annual
growth (%)
Investment 4.0 4.6 5.1 13.7 3.1
Investment/year 0.8 0.9 1.0 0.9 n.a.
Exports
(end period) 13.4 18.2 24.0 24.0 5.8
2013
New wholly foreign-owned project with investments of RM521million for the production of pure cotton yarn
Source: MITI
Projections for the textiles and apparel industry
Source: MIDA
Year Number of approved
investment
Domestic investment
(RM million)
Foreign Investment (RM
million)
Total capital investment
(RM million)
2009 9 108.3 225.3 333.6
2010 21 125.1 500.5 625.6
2011 14 55.0 236.1 291.1
2012 31 143.0 328.0 471.0
2013 16 132.1 632.5 764.6
2014 17 597.5 635.7 1233.2 • The investment climate in the textile and apparel sector has been encouraging for the past 4 years,
reflected by the increase in total capital investment approved by the Malaysian Investment Development Authority (“MIDA”).
• Foreign companies are the main investors (more than three quarter of total investment) in the sector.
• Domestic investment was relatively slow in the past 6 years, except in 2014, contributing nearly 50% of total investment.
Despite the decrease in economic contribution, foreign investments is on the rise, contributing more than 50% of the total capital investment in the sector
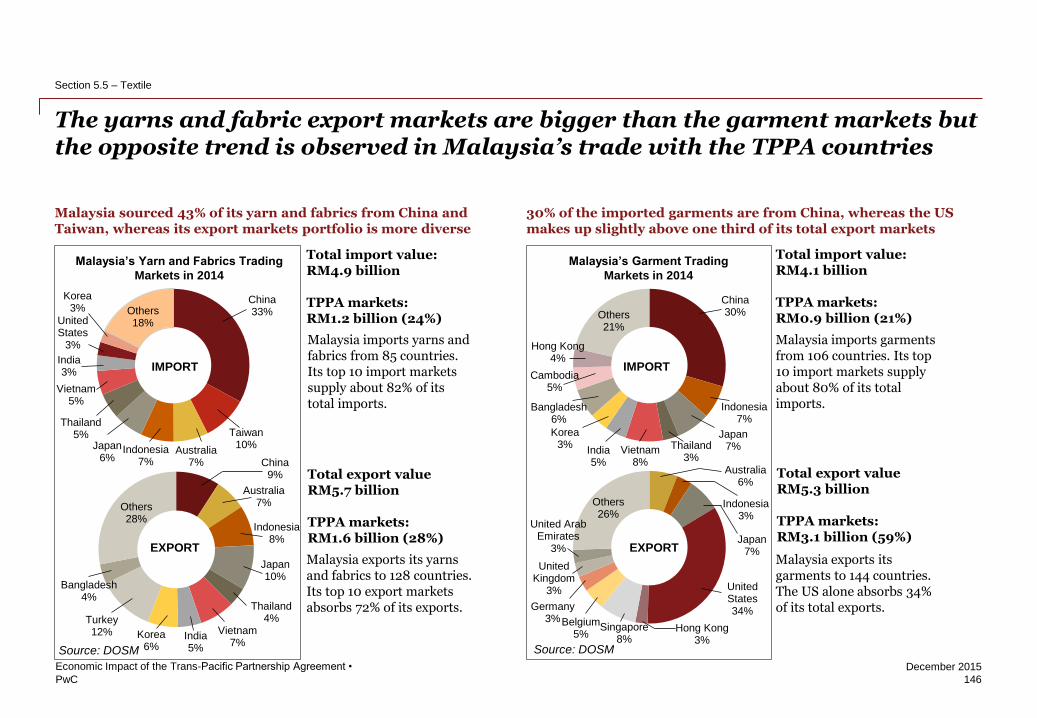
PwC
December 2015
Australia 6%
Indonesia 3%
Japan 7%
United States 34%
Hong Kong 3%
Singapore 8%
Belgium 5%
Germany 3%
United Kingdom
3%
United Arab Emirates
3%
Others 26%
Malaysia sourced 43% of its yarn and fabrics from China and Taiwan, whereas its export markets portfolio is more diverse
30% of the imported garments are from China, whereas the US makes up slightly above one third of its total export markets
The yarns and fabric export markets are bigger than the garment markets but the opposite trend is observed in Malaysia’s trade with the TPPA countries
146
Economic Impact of the Trans-Pacific Partnership Agreement •
Section 5.5 – Textile
Total import value: RM4.9 billion TPPA markets: RM1.2 billion (24%)
Total export value RM5.7 billion TPPA markets: RM1.6 billion (28%)
Malaysia’s Yarn and Fabrics Trading
Markets in 2014
Source: DOSM
IMPORT
EXPORT
Malaysia imports yarns and fabrics from 85 countries. Its top 10 import markets supply about 82% of its total imports.
Malaysia exports its yarns and fabrics to 128 countries. Its top 10 export markets absorbs 72% of its exports.
Malaysia’s Garment Trading
Markets in 2014
China 30%
Indonesia 7%
Japan 7% Thailand
3% Vietnam
8% India 5%
Korea 3%
Bangladesh 6%
Cambodia 5%
Hong Kong 4%
Others 21%
IMPORT
EXPORT
Total import value: RM4.1 billion TPPA markets: RM0.9 billion (21%)
Total export value RM5.3 billion TPPA markets: RM3.1 billion (59%)
Malaysia imports garments from 106 countries. Its top 10 import markets supply about 80% of its total imports.
Malaysia exports its garments to 144 countries. The US alone absorbs 34% of its total exports.
Source: DOSM
China 33%
Taiwan 10%
Australia 7%
Indonesia 7%
Japan 6%
Thailand 5%
Vietnam 5%
India 3%
United States
3%
Korea 3% Others
18%
China 9%
Australia 7%
Indonesia 8%
Japan 10%
Thailand 4%
Vietnam 7%
India 5%
Korea 6%
Turkey 12%
Bangladesh 4%
Others 28%
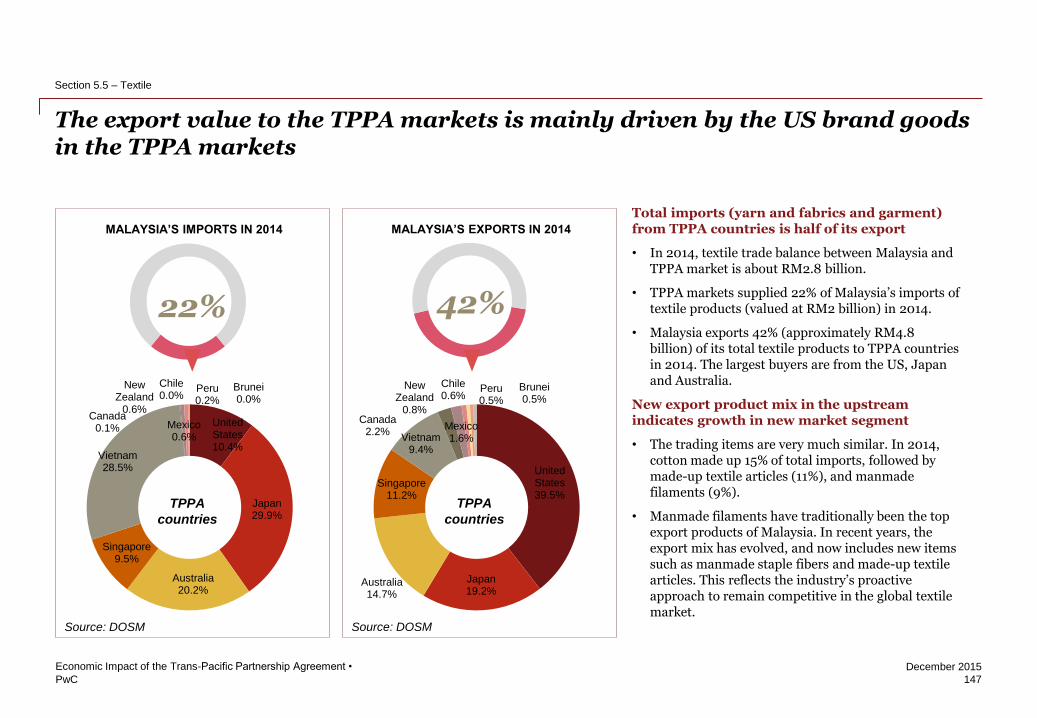
PwC
December 2015
147
Economic Impact of the Trans-Pacific Partnership Agreement •
Section 5.5 – Textile
Total imports (yarn and fabrics and garment) from TPPA countries is half of its export
• In 2014, textile trade balance between Malaysia and TPPA market is about RM2.8 billion.
• TPPA markets supplied 22% of Malaysia’s imports of textile products (valued at RM2 billion) in 2014.
• Malaysia exports 42% (approximately RM4.8 billion) of its total textile products to TPPA countries in 2014. The largest buyers are from the US, Japan and Australia.
New export product mix in the upstream indicates growth in new market segment
• The trading items are very much similar. In 2014, cotton made up 15% of total imports, followed by made-up textile articles (11%), and manmade filaments (9%).
• Manmade filaments have traditionally been the top export products of Malaysia. In recent years, the export mix has evolved, and now includes new items such as manmade staple fibers and made-up textile articles. This reflects the industry’s proactive approach to remain competitive in the global textile market.
United States 39.5%
Japan 19.2%
Australia 14.7%
Singapore 11.2%
Vietnam 9.4%
Canada 2.2%
Mexico 1.6%
New Zealand
0.8%
Chile 0.6%
Peru 0.5%
Brunei 0.5%
Source: DOSM
42%
TPPA
countries
Top 5 export destinations:
18 ~ 20%
6 ~ 7 %
6 ~ 7 %
5 ~ 6 %
~5%
Source: Matrade
TPPA countries
Turkey
Indonesia
China
MALAYSIA’S EXPORTS IN 2014
United States 10.4%
Japan 29.9%
Australia 20.2%
Singapore 9.5%
Vietnam 28.5%
Canada 0.1% Mexico
0.6%
New Zealand
0.6%
Chile 0.0%
Peru 0.2%
Brunei 0.0%
Source: DOSM
TPPA
countries
MALAYSIA’S IMPORTS IN 2014
22%
Textiles 52%
Apparels and clothing 48%
Malaysia’s main textiles and apparels exports in 2004
Source: DOSM
25%
8%
5%
4%
Manmade filaments, including yarns
and woven fabrics thereof
Special woven fabrics; tufted textile
fabrics; lace; tapestries; trimmings;
embroidery
Cotton, including yarns and woven
fabrics thereof
Wadding, felt and nonwovens; special
yarns; twine, cordage, ropes and cables
and articles thereof
30%
18%
Articles of apparel and clothing
accessories, knitted or crocheted
Articles of apparel and clothing
accessories, not knitted or crocheted
4% Knitted or crocheted fabrics Total exports value = RM9.5 billion
6% Others
The export value to the TPPA markets is mainly driven by the US brand goods in the TPPA markets
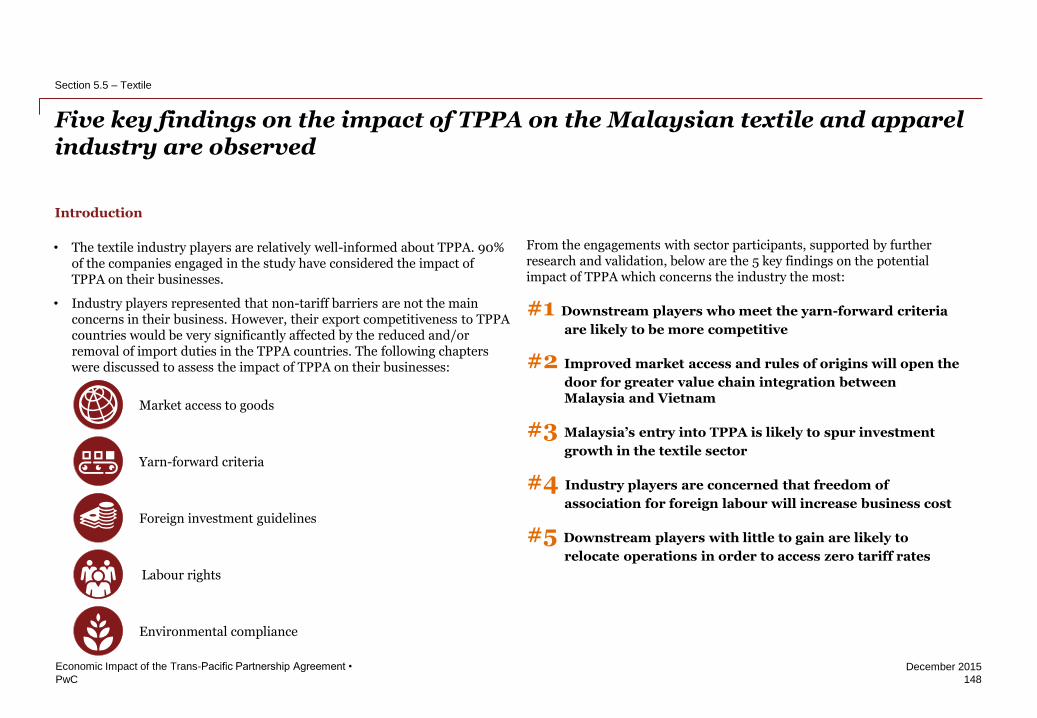
PwC
December 2015
Introduction
Five key findings on the impact of TPPA on the Malaysian textile and apparel industry are observed
148
Economic Impact of the Trans-Pacific Partnership Agreement •
Section 5.5 – Textile
• The textile industry players are relatively well-informed about TPPA. 90% of the companies engaged in the study have considered the impact of TPPA on their businesses.
• Industry players represented that non-tariff barriers are not the main concerns in their business. However, their export competitiveness to TPPA countries would be very significantly affected by the reduced and/or removal of import duties in the TPPA countries. The following chapters were discussed to assess the impact of TPPA on their businesses:
Environmental compliance
Foreign investment guidelines
Labour rights
Market access to goods
Yarn-forward criteria
From the engagements with sector participants, supported by further research and validation, below are the 5 key findings on the potential impact of TPPA which concerns the industry the most:
#1 Downstream players who meet the yarn-forward criteria
are likely to be more competitive
#2 Improved market access and rules of origins will open the
door for greater value chain integration between Malaysia and Vietnam
#3 Malaysia’s entry into TPPA is likely to spur investment
growth in the textile sector
#4 Industry players are concerned that freedom of
association for foreign labour will increase business cost
#5 Downstream players with little to gain are likely to
relocate operations in order to access zero tariff rates
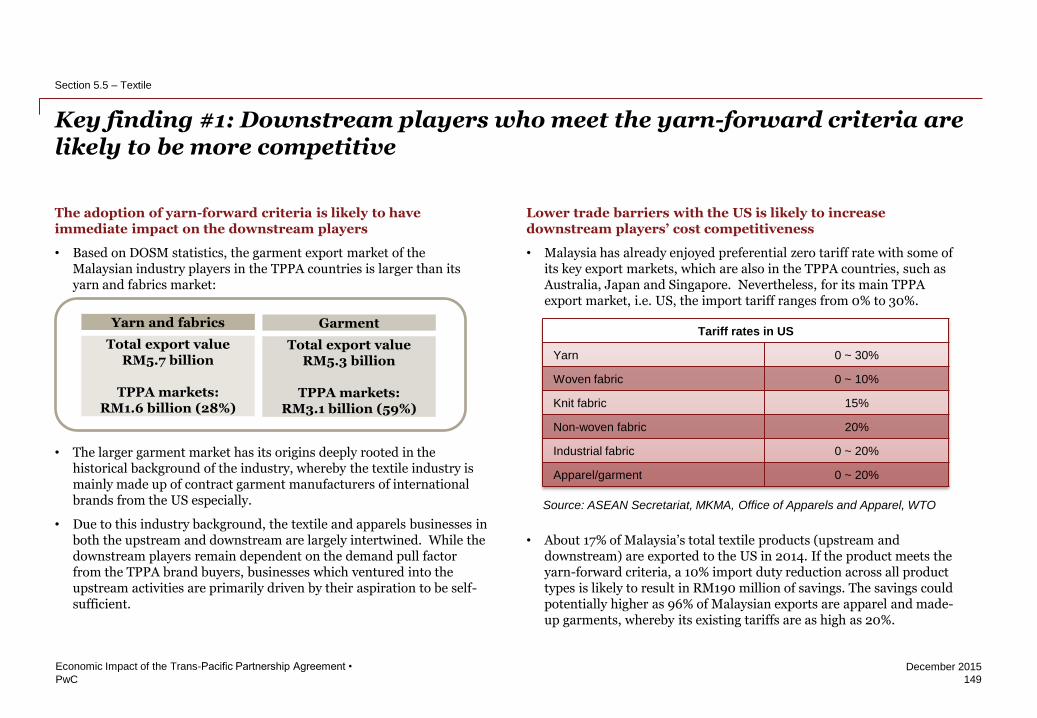
PwC
December 2015
149
Economic Impact of the Trans-Pacific Partnership Agreement •
Section 5.5 – Textile
Key finding #1: Downstream players who meet the yarn-forward criteria are likely to be more competitive
The adoption of yarn-forward criteria is likely to have immediate impact on the downstream players
• Based on DOSM statistics, the garment export market of the Malaysian industry players in the TPPA countries is larger than its yarn and fabrics market:
• The larger garment market has its origins deeply rooted in the historical background of the industry, whereby the textile industry is mainly made up of contract garment manufacturers of international brands from the US especially.
• Due to this industry background, the textile and apparels businesses in both the upstream and downstream are largely intertwined. While the downstream players remain dependent on the demand pull factor from the TPPA brand buyers, businesses which ventured into the upstream activities are primarily driven by their aspiration to be self-sufficient.
Total export value RM5.7 billion
TPPA markets:
RM1.6 billion (28%)
Total export value RM5.3 billion
TPPA markets:
RM3.1 billion (59%)
Yarn and fabrics Garment
Lower trade barriers with the US is likely to increase downstream players’ cost competitiveness
• Malaysia has already enjoyed preferential zero tariff rate with some of its key export markets, which are also in the TPPA countries, such as Australia, Japan and Singapore. Nevertheless, for its main TPPA export market, i.e. US, the import tariff ranges from 0% to 30%.
• About 17% of Malaysia’s total textile products (upstream and downstream) are exported to the US in 2014. If the product meets the yarn-forward criteria, a 10% import duty reduction across all product types is likely to result in RM190 million of savings. The savings could potentially higher as 96% of Malaysian exports are apparel and made-up garments, whereby its existing tariffs are as high as 20%.
Source: ASEAN Secretariat, MKMA, Office of Apparels and Apparel, WTO
Tariff rates in US
Yarn 0 ~ 30%
Woven fabric 0 ~ 10%
Knit fabric 15%
Non-woven fabric 20%
Industrial fabric 0 ~ 20%
Apparel/garment 0 ~ 20%

PwC
December 2015
Removal of trade barriers (tariff and non-tariff) with the key Latin America markets are also likely to assist in market access for Malaysian exports
• At present, a handful of local industry players have attempted to venture into the Latin America (i.e. Mexico and Peru) markets:
150
Economic Impact of the Trans-Pacific Partnership Agreement •
Section 5.5 – Textile
Improved market access for Canada
• Canada is one of the textiles and garment importers to Malaysia. In 2014, total Malaysian export to Canada was RM102.8 million (Source: DOSM).
• According to MITI, Malaysian textile and garment exports to Canada (which total at 1,495 tariff lines) is currently facing a range of duty rate from 4.5% to 18%. At present, only 40% of the products or 12.46% of total export values are duty free.
• Upon TPPA entry into force, about 87% of these items constituting almost 90% of total exports to Canada will see duty elimination.
• With TPPA, there may be further market penetration for Malaysian-made textile and garment, especially women’s jersey and pullover, women’s or girl’s cotton blouses and handkerchief.
40%
87%
Before TPPA After TPPA
Source: MITI
Percentage of zero-tariff export items to Canada
before and after TPPA
Malaysia’s trade with Mexico and Peru in 2014
Description Import Export
Me
xic
o
Total value RM12,706,869 RM78,366,049
Main
Products
Articles of apparel and
clothing accessories, not
knitted or crocheted
(40%)
Manmade filaments,
including yarns and
woven fabrics thereof
(29%)
Articles of apparel and
clothing accessories,
knitted or crocheted
(51%)
Pe
ru
Total value RM4,999,370 RM25,325,395
Main
Products
Articles of apparel and
clothing accessories,
knitted or crocheted
(97%)
Articles of apparel and
clothing accessories,
knitted or crocheted
(78%)
Source: DOSM
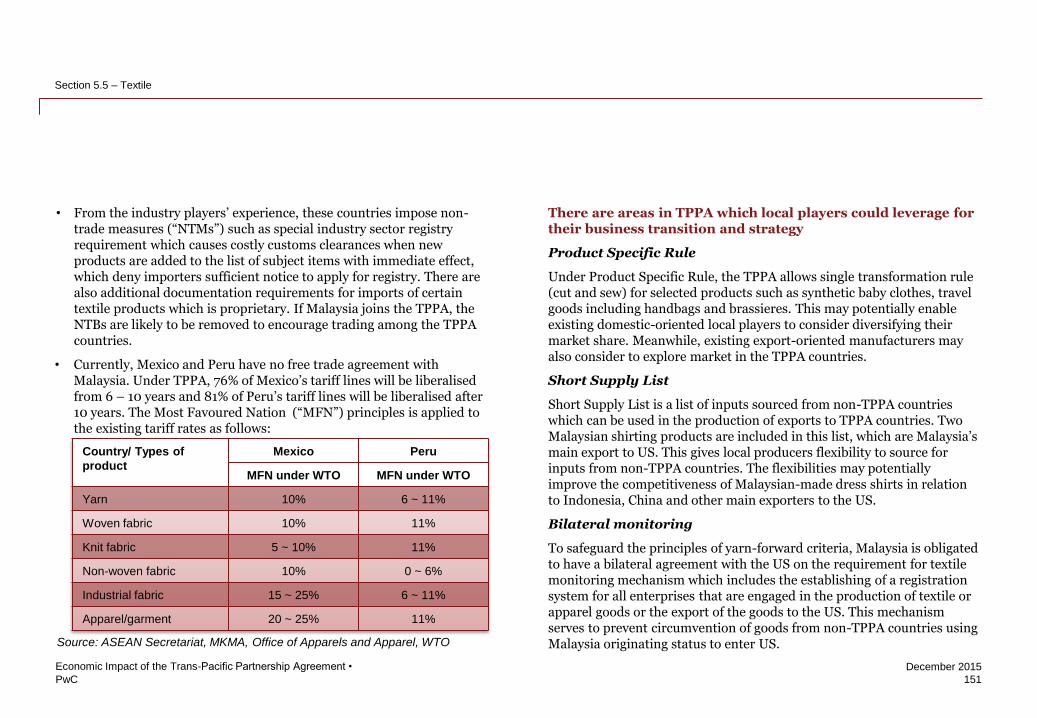
PwC
December 2015
• From the industry players’ experience, these countries impose non-trade measures (“NTMs”) such as special industry sector registry requirement which causes costly customs clearances when new products are added to the list of subject items with immediate effect, which deny importers sufficient notice to apply for registry. There are also additional documentation requirements for imports of certain textile products which is proprietary. If Malaysia joins the TPPA, the NTBs are likely to be removed to encourage trading among the TPPA countries.
• Currently, Mexico and Peru have no free trade agreement with Malaysia. Under TPPA, 76% of Mexico’s tariff lines will be liberalised from 6 – 10 years and 81% of Peru’s tariff lines will be liberalised after 10 years. The Most Favoured Nation (“MFN”) principles is applied to the existing tariff rates as follows:
151
Economic Impact of the Trans-Pacific Partnership Agreement •
Section 5.5 – Textile
Country/ Types of
product
Mexico Peru
MFN under WTO MFN under WTO
Yarn 10% 6 ~ 11%
Woven fabric 10% 11%
Knit fabric 5 ~ 10% 11%
Non-woven fabric 10% 0 ~ 6%
Industrial fabric 15 ~ 25% 6 ~ 11%
Apparel/garment 20 ~ 25% 11%
Source: ASEAN Secretariat, MKMA, Office of Apparels and Apparel, WTO
There are areas in TPPA which local players could leverage for their business transition and strategy
Product Specific Rule
Under Product Specific Rule, the TPPA allows single transformation rule (cut and sew) for selected products such as synthetic baby clothes, travel goods including handbags and brassieres. This may potentially enable existing domestic-oriented local players to consider diversifying their market share. Meanwhile, existing export-oriented manufacturers may also consider to explore market in the TPPA countries.
Short Supply List
Short Supply List is a list of inputs sourced from non-TPPA countries which can be used in the production of exports to TPPA countries. Two Malaysian shirting products are included in this list, which are Malaysia’s main export to US. This gives local producers flexibility to source for inputs from non-TPPA countries. The flexibilities may potentially improve the competitiveness of Malaysian-made dress shirts in relation to Indonesia, China and other main exporters to the US.
Bilateral monitoring
To safeguard the principles of yarn-forward criteria, Malaysia is obligated to have a bilateral agreement with the US on the requirement for textile monitoring mechanism which includes the establishing of a registration system for all enterprises that are engaged in the production of textile or apparel goods or the export of the goods to the US. This mechanism serves to prevent circumvention of goods from non-TPPA countries using Malaysia originating status to enter US.
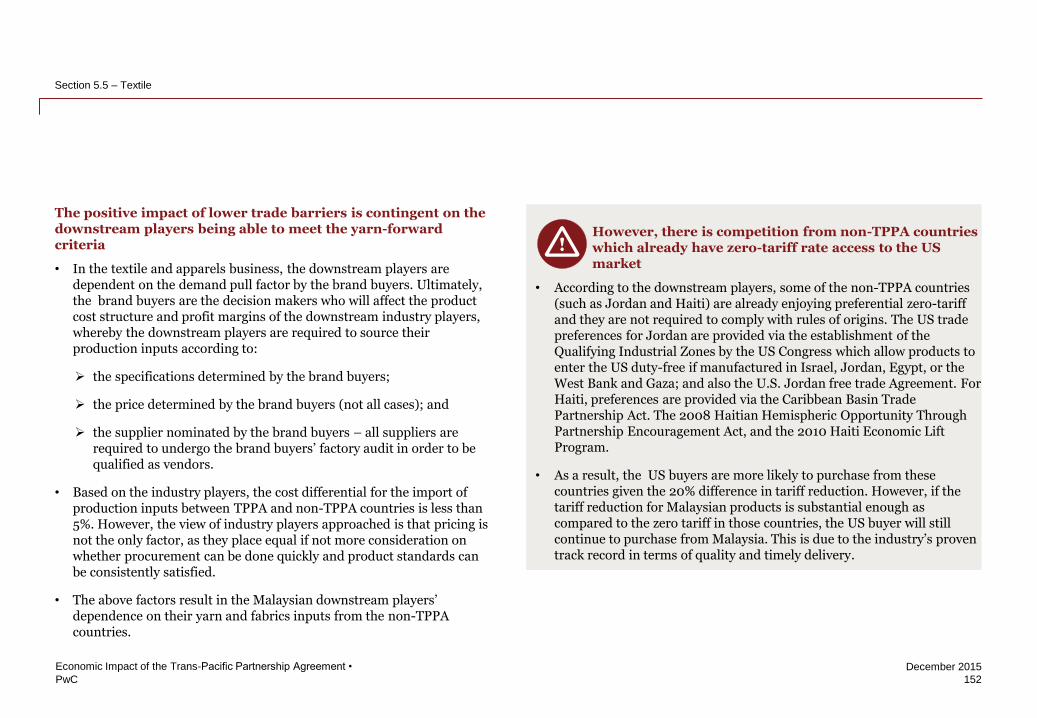
PwC
December 2015
152
Economic Impact of the Trans-Pacific Partnership Agreement •
Section 5.5 – Textile
The positive impact of lower trade barriers is contingent on the downstream players being able to meet the yarn-forward criteria
• In the textile and apparels business, the downstream players are dependent on the demand pull factor by the brand buyers. Ultimately, the brand buyers are the decision makers who will affect the product cost structure and profit margins of the downstream industry players, whereby the downstream players are required to source their production inputs according to:
the specifications determined by the brand buyers;
the price determined by the brand buyers (not all cases); and
the supplier nominated by the brand buyers – all suppliers are required to undergo the brand buyers’ factory audit in order to be qualified as vendors.
• Based on the industry players, the cost differential for the import of production inputs between TPPA and non-TPPA countries is less than 5%. However, the view of industry players approached is that pricing is not the only factor, as they place equal if not more consideration on whether procurement can be done quickly and product standards can be consistently satisfied.
• The above factors result in the Malaysian downstream players’ dependence on their yarn and fabrics inputs from the non-TPPA countries.
However, there is competition from non-TPPA countries which already have zero-tariff rate access to the US market
• According to the downstream players, some of the non-TPPA countries (such as Jordan and Haiti) are already enjoying preferential zero-tariff and they are not required to comply with rules of origins. The US trade preferences for Jordan are provided via the establishment of the Qualifying Industrial Zones by the US Congress which allow products to enter the US duty-free if manufactured in Israel, Jordan, Egypt, or the West Bank and Gaza; and also the U.S. Jordan free trade Agreement. For Haiti, preferences are provided via the Caribbean Basin Trade Partnership Act. The 2008 Haitian Hemispheric Opportunity Through Partnership Encouragement Act, and the 2010 Haiti Economic Lift Program.
• As a result, the US buyers are more likely to purchase from these countries given the 20% difference in tariff reduction. However, if the tariff reduction for Malaysian products is substantial enough as compared to the zero tariff in those countries, the US buyer will still continue to purchase from Malaysia. This is due to the industry’s proven track record in terms of quality and timely delivery.
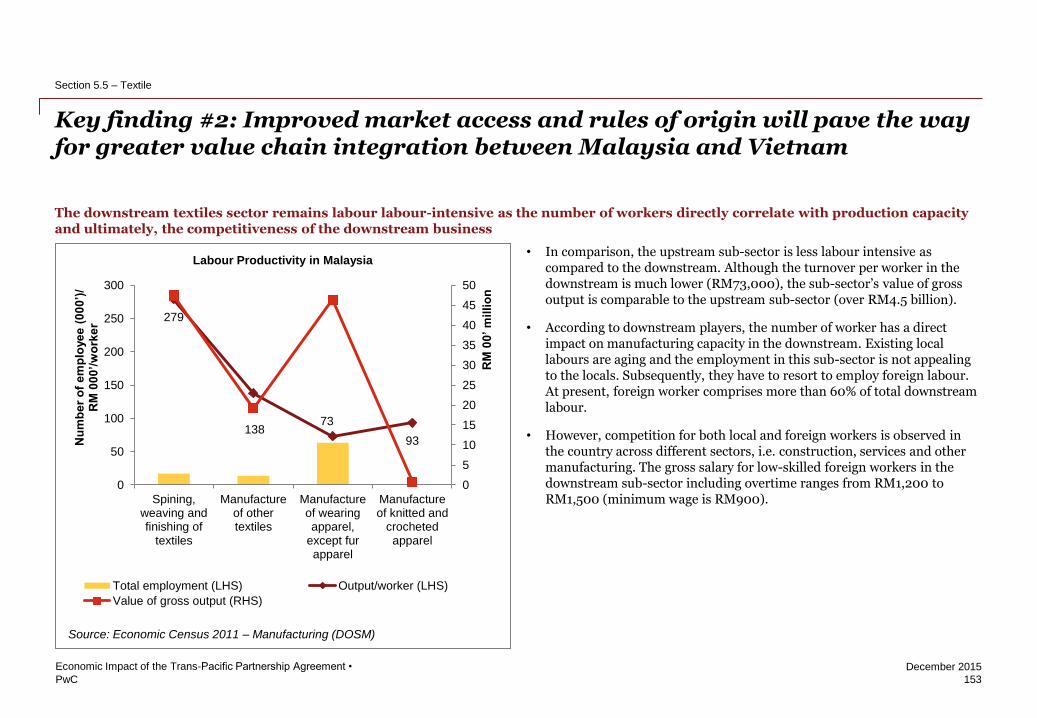
PwC
December 2015
The downstream textiles sector remains labour labour-intensive as the number of workers directly correlate with production capacity and ultimately, the competitiveness of the downstream business
Key finding #2: Improved market access and rules of origin will pave the way for greater value chain integration between Malaysia and Vietnam
153
Economic Impact of the Trans-Pacific Partnership Agreement •
Section 5.5 – Textile
7.9
11.9
16.9
18
46.6
Vietnam
India
China
ASEAN
Malaysia
Labour productivity levels (per-worker GDP at USD ‘000), 2012
Source: APO Productivity Database 2014.01.
As of 2014, the industry employed 2.5 million workers, comprising 25% of the labour force in Vietnam. The average income generated per worker is roughly USD 206 (VND 4.5 million). According to Vietnam Textile and Apparel Association (VITAS), every USD 1 billion of garment export could create jobs for 150-200 thousand employees, of which there are 100 thousand employees in the apparel businesses and 50-100 thousand employees in the other supporting businesses.
Source: Textile and Apparel Industry Report (FPT Securities)
Competitions for labour
Why investors prefer Vietnam – skilled? Cost? Availability?
Competition in local market for
labour? - E&E
Other reasons:
Regulation predictability? How many changes in X years?
- Which sector? Purpose? Source: Economic Census 2011 – Manufacturing (DOSM)
279
138 73
93
0
5
10
15
20
25
30
35
40
45
50
0
50
100
150
200
250
300
Spining,weaving andfinishing of
textiles
Manufactureof othertextiles
Manufactureof wearingapparel,
except furapparel
Manufactureof knitted and
crochetedapparel
RM
00
’ m
illi
on
Nu
mb
er
of
em
plo
ye
e (
00
0’)
/
RM
00
0’/
wo
rke
r
Labour Productivity in Malaysia
Total employment (LHS) Output/worker (LHS)
Value of gross output (RHS)
• In comparison, the upstream sub-sector is less labour intensive as compared to the downstream. Although the turnover per worker in the downstream is much lower (RM73,000), the sub-sector’s value of gross output is comparable to the upstream sub-sector (over RM4.5 billion).
• According to downstream players, the number of worker has a direct impact on manufacturing capacity in the downstream. Existing local labours are aging and the employment in this sub-sector is not appealing to the locals. Subsequently, they have to resort to employ foreign labour. At present, foreign worker comprises more than 60% of total downstream labour.
• However, competition for both local and foreign workers is observed in the country across different sectors, i.e. construction, services and other manufacturing. The gross salary for low-skilled foreign workers in the downstream sub-sector including overtime ranges from RM1,200 to RM1,500 (minimum wage is RM900).

PwC
December 2015
Labour productivity in Malaysia is higher than Vietnam, however, due to the nature of the downstream business activities, improved productivity alone is unable solve the labour shortage issue
• Downstream players, especially, view labour shortage issue as a serious impediment to the industry. The availability of labour will not only concern foreign investors, but also limit the business expansion of local players. Other concerns of the industry include the predictability of regulations on foreign worker employment.
• Theoretically, the labour shortage issue could be mitigated by higher productivity. In fact, labour productivity of Malaysia is higher than countries like China, India and Vietnam.
• Yet, higher labour productivity alone is insufficient to stimulate further growth, particularly for the downstream players. For instance, within the textile industry, labour productivity of Vietnam, a top 10 country in textile and garment export, is much lower than Malaysia. To be able to have an edge over its competitors upon the signing of TPPA, the labour shortage issue must be rectified.
154
Economic Impact of the Trans-Pacific Partnership Agreement •
Section 5.5 – Textile
Country Textiles industry Clothing industry Total
Vietnam 195,551 844,069 1,039,620
Malaysia 29,982 54,512 84,494
Vietnam has 12x more labour in the industry, 2010
Source: Wages and working hours in the textiles, clothing, leather and footwear
industries (ILO)
7.9
11.9
16.9
18
46.6
Vietnam
India
China
ASEAN
Malaysia
Labour productivity levels (per-worker GDP at USD ‘000), 2012
Source: APO Productivity Database 2014.01.
Industry Malaysia Vietnam
Manufacture of textiles 215,515 115,287
Manufacture of wearing
apparel 73,200 29,433
Output (RM) per worker, 2010
Source: Economic Census 2011, General Statistics Office, ILO
As of 2014, the industry employed 2.5 million workers, comprising 25% of the labour force in Vietnam. The average income generated per worker is roughly USD 206 (VND 4.5 million). According to Vietnam Textile and Apparel Association (VITAS), every USD 1 billion of garment export could create jobs for 150-200 thousand employees, of which there are 100 thousand employees in the apparel businesses and 50-100 thousand employees in the other supporting businesses.
Source: Textile and Apparel Industry Report (FPT Securities)
Competitions for labour
Why investors prefer Vietnam – skilled? Cost? Availability?
Competition in local market for
labour? - E&E
Other reasons:
Regulation predictability? How many changes in X years?
- Which sector? Purpose?
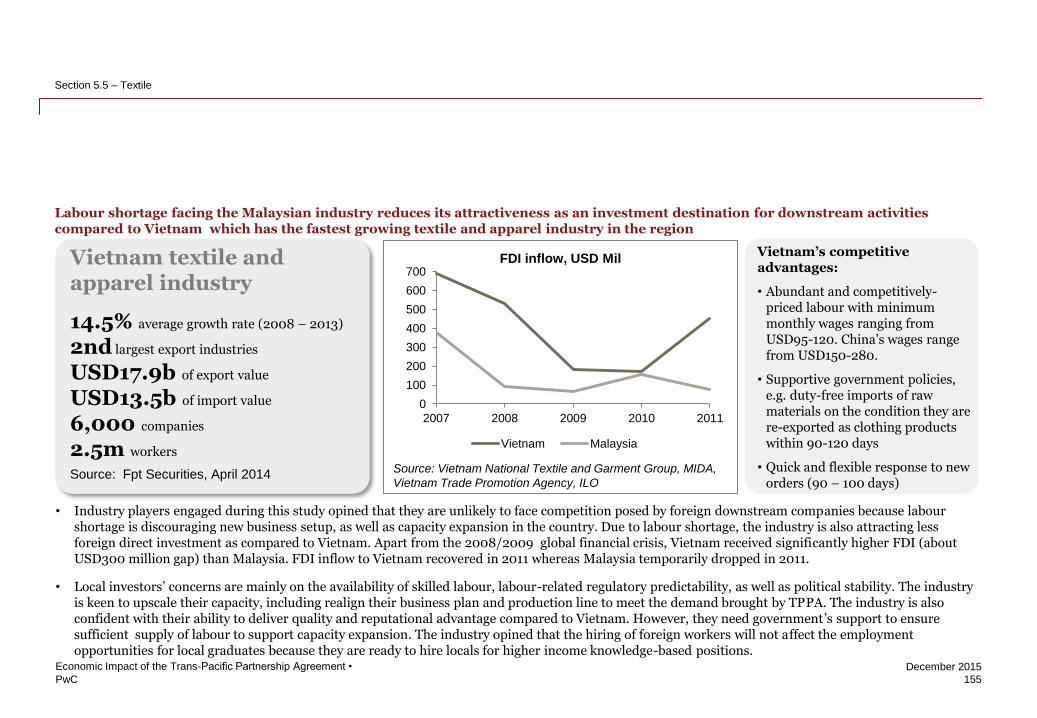
PwC
December 2015
Labour shortage facing the Malaysian industry reduces its attractiveness as an investment destination for downstream activities compared to Vietnam which has the fastest growing textile and apparel industry in the region
155
Economic Impact of the Trans-Pacific Partnership Agreement •
Section 5.5 – Textile
0
100
200
300
400
500
600
700
2007 2008 2009 2010 2011
FDI inflow, USD Mil
Vietnam Malaysia
Source: Vietnam National Textile and Garment Group, MIDA,
Vietnam Trade Promotion Agency, ILO
Vietnam’s competitive advantages:
• Abundant and competitively-priced labour with minimum monthly wages ranging from USD95-120. China’s wages range from USD150-280.
• Supportive government policies, e.g. duty-free imports of raw materials on the condition they are re-exported as clothing products within 90-120 days
• Quick and flexible response to new orders (90 – 100 days)
• Industry players engaged during this study opined that they are unlikely to face competition posed by foreign downstream companies because labour shortage is discouraging new business setup, as well as capacity expansion in the country. Due to labour shortage, the industry is also attracting less foreign direct investment as compared to Vietnam. Apart from the 2008/2009 global financial crisis, Vietnam received significantly higher FDI (about USD300 million gap) than Malaysia. FDI inflow to Vietnam recovered in 2011 whereas Malaysia temporarily dropped in 2011.
• Local investors’ concerns are mainly on the availability of skilled labour, labour-related regulatory predictability, as well as political stability. The industry is keen to upscale their capacity, including realign their business plan and production line to meet the demand brought by TPPA. The industry is also confident with their ability to deliver quality and reputational advantage compared to Vietnam. However, they need government’s support to ensure sufficient supply of labour to support capacity expansion. The industry opined that the hiring of foreign workers will not affect the employment opportunities for local graduates because they are ready to hire locals for higher income knowledge-based positions.
Vietnam textile and apparel industry
14.5% average growth rate (2008 – 2013)
2nd largest export industries
USD17.9b of export value
USD13.5b of import value
6,000 companies
2.5m workers
Source: Fpt Securities, April 2014
Malaysian textile and apparel industry
-0.3% average growth rate (2008 – 2013)
10th largest export industries
RM10.1b of export value
RM8.8b of import value
9,900 companies
68,000 workers
Source: DOSM, 2013
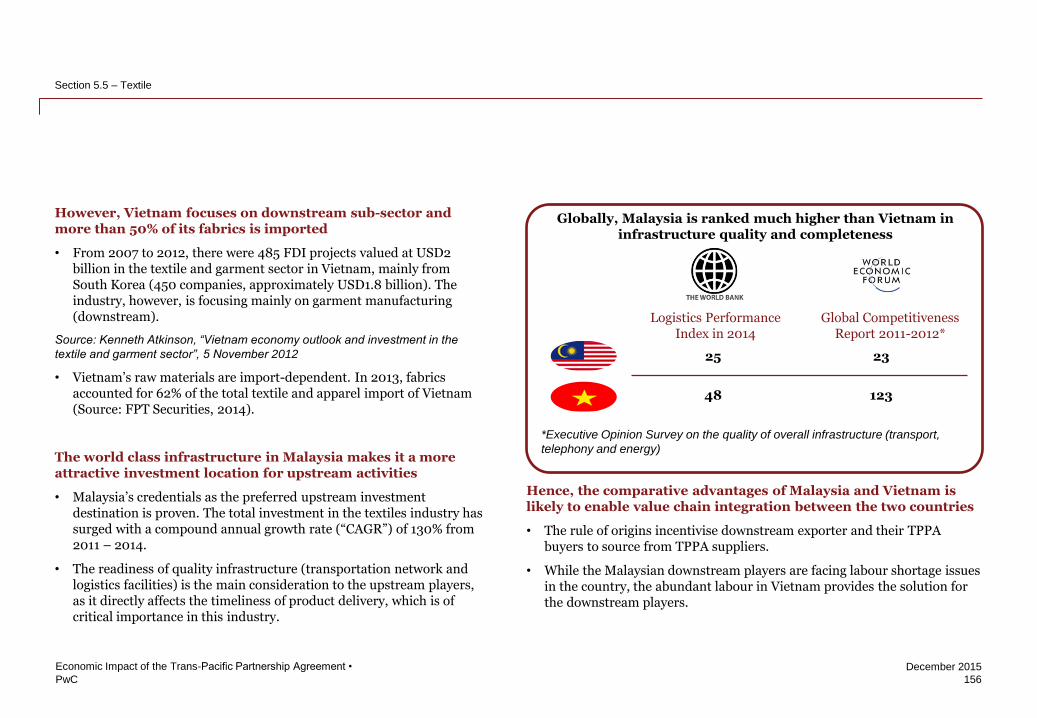
PwC
December 2015
However, Vietnam focuses on downstream sub-sector and more than 50% of its fabrics is imported
• From 2007 to 2012, there were 485 FDI projects valued at USD2 billion in the textile and garment sector in Vietnam, mainly from South Korea (450 companies, approximately USD1.8 billion). The industry, however, is focusing mainly on garment manufacturing (downstream).
Source: Kenneth Atkinson, “Vietnam economy outlook and investment in the
textile and garment sector”, 5 November 2012
• Vietnam’s raw materials are import-dependent. In 2013, fabrics accounted for 62% of the total textile and apparel import of Vietnam (Source: FPT Securities, 2014).
The world class infrastructure in Malaysia makes it a more attractive investment location for upstream activities
• Malaysia’s credentials as the preferred upstream investment destination is proven. The total investment in the textiles industry has surged with a compound annual growth rate (“CAGR”) of 130% from 2011 – 2014.
• The readiness of quality infrastructure (transportation network and logistics facilities) is the main consideration to the upstream players, as it directly affects the timeliness of product delivery, which is of critical importance in this industry.
Hence, the comparative advantages of Malaysia and Vietnam is likely to enable value chain integration between the two countries
• The rule of origins incentivise downstream exporter and their TPPA buyers to source from TPPA suppliers.
• While the Malaysian downstream players are facing labour shortage issues in the country, the abundant labour in Vietnam provides the solution for the downstream players.
156
Economic Impact of the Trans-Pacific Partnership Agreement •
Section 5.5 – Textile
Logistics Performance Index in 2014
Global Competitiveness Report 2011-2012*
25 23
48 123
*Executive Opinion Survey on the quality of overall infrastructure (transport,
telephony and energy)
Globally, Malaysia is ranked much higher than Vietnam in infrastructure quality and completeness
PwC
December 2015
157
Economic Impact of the Trans-Pacific Partnership Agreement •
Section 5.5 – Textile
Nevertheless, solving the labour shortage issues remains critical to downstream players if they are to reap the benefits of TPPA
• The industry players are calling for more consistent government policies and regulations related to skilled foreign labour.
• The industry opines that it is essential to align and coordinate the various efforts among the Ministry of International Trade and Industry (export-driven), Ministry of Home Affairs (security and migration) and Ministry of Human Resources (skilled and unskilled local workforce availability).
• Another suggestion is for the Government to look into policies of bringing in more skilled foreign workers for specific sector such as textile, instead of cutting down the foreign worker permits. This will allow downstream players to expand their production capacity and venture into manufacturing high value-added products.
• The industry also views the ASEAN Economic Community as a game changer, which will potentially promote labour mobility, with a view to subsequently mitigating the labour shortage issue.

PwC
December 2015
Although the sector is export-oriented, it is increasingly dependent on domestic consumption
• Overall, Malaysia’s export growth rate is at least 3 times slower than its import growth. From 2004 to 2014, the compound average growth rate (“CAGR”) of the industry in the key trading items as are follows:
• The export growth rate of cotton products is higher than the synthetic market, which is against the global yarn market.
• The increase in man-made filament imports and reduction in its exports also implied higher local consumption (demand).
Changes in the product mix and weightage reflects changes in the market trends and new opportunities
• In 2004, man-made staple filaments was not among the key export items of Malaysia. The reduction in man-made staple filaments imports and its positive growth in export reflected the improved ability of local industry players to manufacture man-made staple filaments based product for overseas market.
• Nevertheless, a number of industry practice is also observed, which directly affects the trading patterns:
Some of the integrated industry players have their downstream business operation overseas, hence, the export could be for their own consumption; and
Downstream players are required to source their production inputs according to the specification and from the supplier nominated by the brand buyers – this ultimately determines the trading pattern
• The yarn-forward criteria is likely to be an opportunity for upstream players to further grow their businesses. Emerging product mix could be potential opportunities for upstream players to increase domestic investment to enhance their industry capabilities via capacity building and product diversification.
Key finding #3: Malaysia’s entry into TPPA is likely to spur investment growth in the textile sector
158
Economic Impact of the Trans-Pacific Partnership Agreement •
Section 5.5 – Textile
Parameter 2012/13
Country MT (‘000)
Exports US 2,902
India 1,685
Australia 1,345
Brazil 938
Uzbekistan 653
Imports China 4,426
Turkey 804
Indonesia 683
Bangladesh 631
Vietnam 517
Highly demanded items and their volume
Source: Rita/MITI
Local production:
Top items and where are they exported to
Source: Recron/Ramatex/Penfabric
Textiles 59%
Apparels and clothing
41%
Malaysia’s main textiles and apparels exports in 2014
19%
9%
7%
Manmade filaments, including yarns and
woven fabrics thereof
Manmade staple fibers, including yarns and
woven fabrics thereof
Cotton, including yarns and woven fabrics
thereof
6% Wadding, felt and nonwovens; special
yarns; twine, cordage, ropes and cables
and articles thereof
7% Made-up textile articles
Source: DOSM
3% Knitted or crocheted fabrics
Total exports value = RM11.0 billion
8% Others
Textiles 66%
Apparels and clothing 34%
Malaysia’s main textiles and apparels IMPORTS in 2014
Source: DOSM
15%
11%
9%
7%
6%
Cotton, including yarns and woven fabrics thereof
Made-up textile articles
Manmade filaments, including yarns and woven
fabrics thereof
Manmade staple fibers, including yarns and woven
fabrics thereof
Knitted or crocheted fabrics
5% Wadding, felt and nonwovens; special yarns; twine,
cordage, ropes and cables and articles thereof
Total (textiles and apparels)
Man-made filaments*
Man-made staple filaments*
5.1%
1.4%
-1.4%
Cotton*
Knitted or crocheted articles of apparel and clothing
Not knitted or crocheted apparel and clothing
1.2%
15.3%
10.6%
1.4%
-1.1%
3.1%
3.4%
1.1%
-2.23%
IMPORT EXPORT
*including yarns and woven fabrics thereof
Source: DOSM
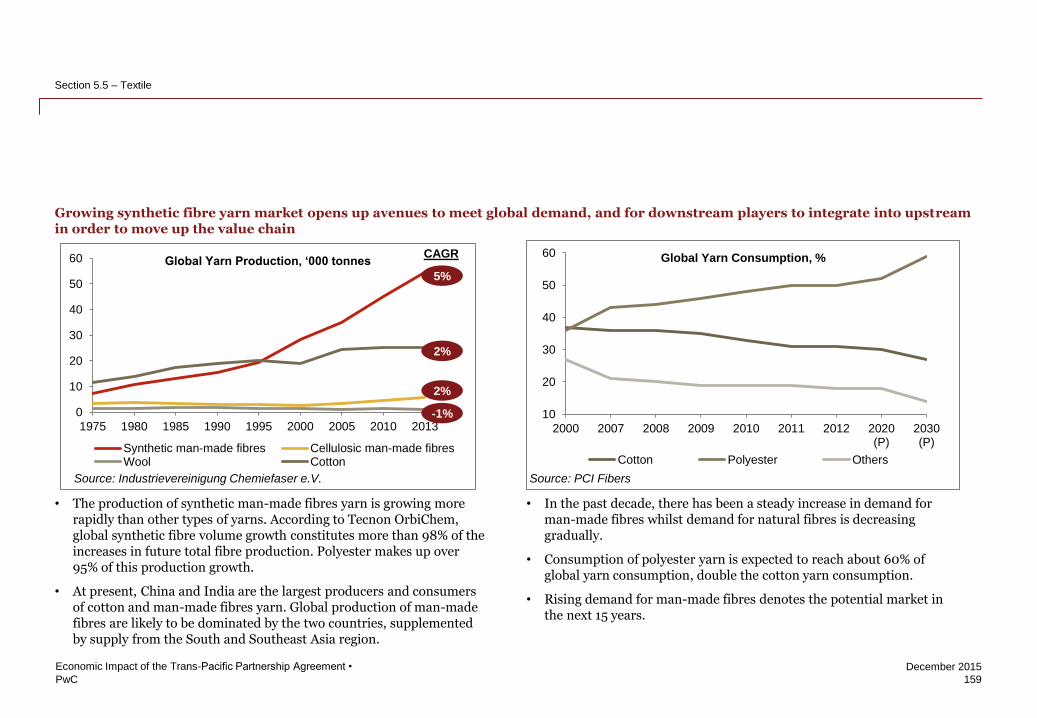
PwC
December 2015
• The production of synthetic man-made fibres yarn is growing more rapidly than other types of yarns. According to Tecnon OrbiChem, global synthetic fibre volume growth constitutes more than 98% of the increases in future total fibre production. Polyester makes up over 95% of this production growth.
• At present, China and India are the largest producers and consumers of cotton and man-made fibres yarn. Global production of man-made fibres are likely to be dominated by the two countries, supplemented by supply from the South and Southeast Asia region.
159
Economic Impact of the Trans-Pacific Partnership Agreement •
Section 5.5 – Textile
• In the past decade, there has been a steady increase in demand for man-made fibres whilst demand for natural fibres is decreasing gradually.
• Consumption of polyester yarn is expected to reach about 60% of global yarn consumption, double the cotton yarn consumption.
• Rising demand for man-made fibres denotes the potential market in the next 15 years.
0
10
20
30
40
50
60
1975 1980 1985 1990 1995 2000 2005 2010 2013
Global Yarn Production, ‘000 tonnes
Synthetic man-made fibres Cellulosic man-made fibresWool Cotton
CAGR
5%
2%
-1%
2%
Source: Industrievereinigung Chemiefaser e.V.
10
20
30
40
50
60
2000 2007 2008 2009 2010 2011 2012 2020(P)
2030(P)
Global Yarn Consumption, %
Cotton Polyester Others
Source: PCI Fibers
Parameter Cotton Man-made fibres
2012/13 2010
Country MT (‘000) Country MT (‘000)
Consumption China 8,290 China
India 4,817 India
Pakistan 2,416 US
Turkey 1,365 Japan
Brazil 890 Russia
Parameter Cotton Man-made fibres
2012/13 2007
Country MT (‘000) Country MT (‘000)
Production China 7,300 China 22,228
India 6,205 India 2,726
US 3,770 Taiwan 2,629
Pakistan 2,002 US 2,126
Brazil 1,310 South Korea 1,489
Source: Industrievereinigung Chemiefaser e.V., World Fibre Report 2008
Source: Industrievereinigung Chemiefaser e.V., World Apparel Fiber
Consumption Survey 2013
Parameter 2012/13
Country MT (‘000)
Exports US 2,902
India 1,685
Australia 1,345
Brazil 938
Uzbekistan 653
Imports China 4,426
Turkey 804
Indonesia 683
Bangladesh 631
Vietnam 517
There has been an increasing trend of demand for man-made fibres whilst demand for natural fibres remains stagnant.
China is the top global producer and consumer of both cotton and man-made fibres.
Growing synthetic fibre yarn market opens up avenues to meet global demand, and for downstream players to integrate into upstream in order to move up the value chain
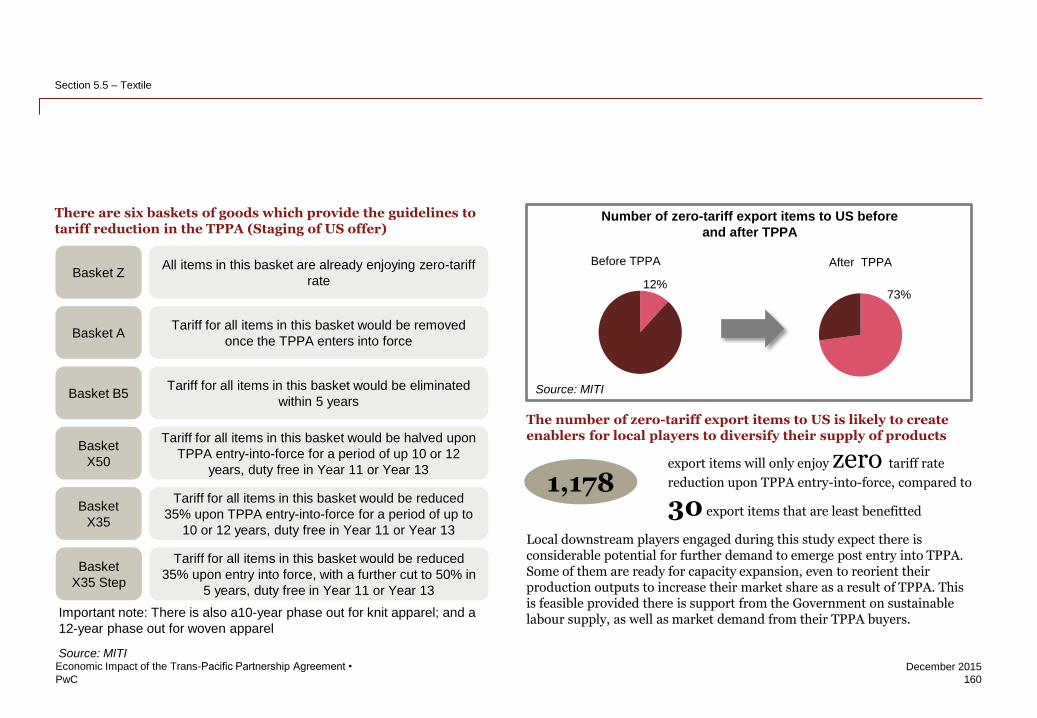
PwC
December 2015
160
Economic Impact of the Trans-Pacific Partnership Agreement •
Section 5.5 – Textile
Parameter Cotton Man-made fibres
2012/13 2010
Country MT (‘000) Country MT (‘000)
Consumption China 8,290 China
India 4,817 India
Pakistan 2,416 US
Turkey 1,365 Japan
Brazil 890 Russia
Parameter Cotton Man-made fibres
2012/13 2007
Country MT (‘000) Country MT (‘000)
Production China 7,300 China 22,228
India 6,205 India 2,726
US 3,770 Taiwan 2,629
Pakistan 2,002 US 2,126
Brazil 1,310 South Korea 1,489
Source: Industrievereinigung Chemiefaser e.V., World Fibre Report 2008
Source: Industrievereinigung Chemiefaser e.V., World Apparel Fiber
Consumption Survey 2013
Parameter 2012/13
Country MT (‘000)
Exports US 2,902
India 1,685
Australia 1,345
Brazil 938
Uzbekistan 653
Imports China 4,426
Turkey 804
Indonesia 683
Bangladesh 631
Vietnam 517
There has been an increasing trend of demand for man-made fibres whilst demand for natural fibres remains stagnant.
China is the top global producer and consumer of both cotton and man-made fibres.
There are six baskets of goods which provide the guidelines to tariff reduction in the TPPA (Staging of US offer)
Basket Z All items in this basket are already enjoying zero-tariff
rate
Basket A Tariff for all items in this basket would be removed
once the TPPA enters into force
Basket B5 Tariff for all items in this basket would be eliminated
within 5 years
Basket
X50
Tariff for all items in this basket would be halved upon
TPPA entry-into-force for a period of up 10 or 12
years, duty free in Year 11 or Year 13
Source: MITI
Basket
X35
Tariff for all items in this basket would be reduced
35% upon TPPA entry-into-force for a period of up to
10 or 12 years, duty free in Year 11 or Year 13
Basket
X35 Step
Tariff for all items in this basket would be reduced
35% upon entry into force, with a further cut to 50% in
5 years, duty free in Year 11 or Year 13
73%12%
The number of zero-tariff export items to US is likely to create enablers for local players to diversify their supply of products
Local downstream players engaged during this study expect there is considerable potential for further demand to emerge post entry into TPPA. Some of them are ready for capacity expansion, even to reorient their production outputs to increase their market share as a result of TPPA. This is feasible provided there is support from the Government on sustainable labour supply, as well as market demand from their TPPA buyers.
1,178 export items will only enjoy zero tariff rate
reduction upon TPPA entry-into-force, compared to
30 export items that are least benefitted
Before TPPA After TPPA
Source: MITI
Number of zero-tariff export items to US before
and after TPPA
73%
1%
99%
12%
Important note: There is also a10-year phase out for knit apparel; and a
12-year phase out for woven apparel
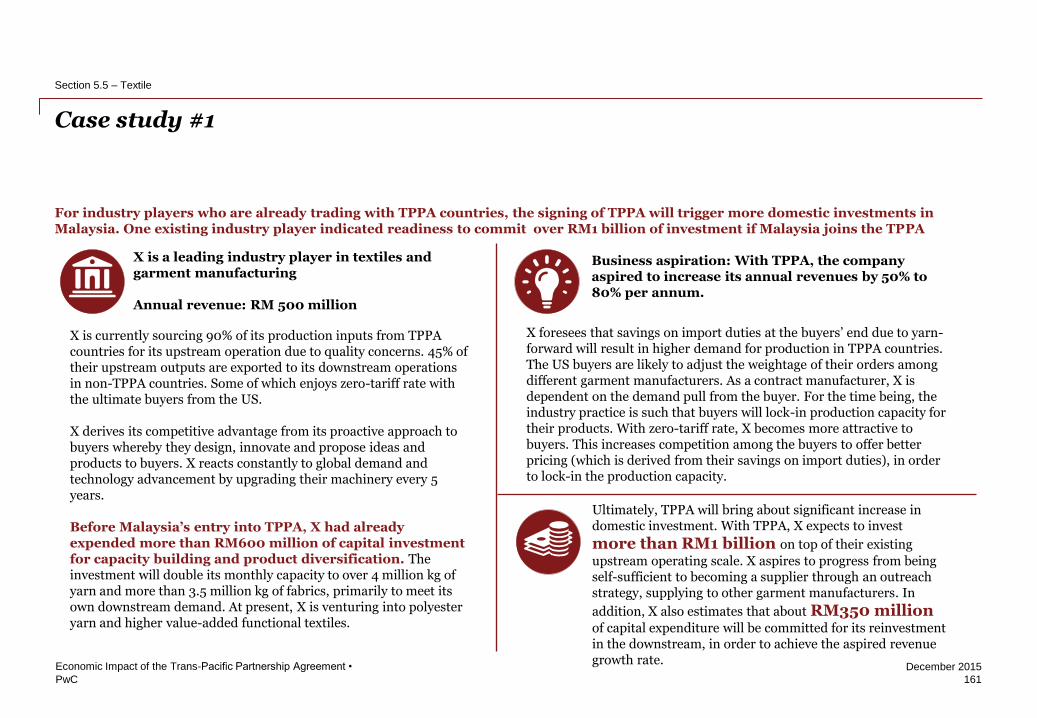
PwC
December 2015
For industry players who are already trading with TPPA countries, the signing of TPPA will trigger more domestic investments in Malaysia. One existing industry player indicated readiness to commit over RM1 billion of investment if Malaysia joins the TPPA
Case study #1
161
Economic Impact of the Trans-Pacific Partnership Agreement •
Section 5.5 – Textile
X foresees that savings on import duties at the buyers’ end due to yarn-forward will result in higher demand for production in TPPA countries. The US buyers are likely to adjust the weightage of their orders among different garment manufacturers. As a contract manufacturer, X is dependent on the demand pull from the buyer. For the time being, the industry practice is such that buyers will lock-in production capacity for their products. With zero-tariff rate, X becomes more attractive to buyers. This increases competition among the buyers to offer better pricing (which is derived from their savings on import duties), in order to lock-in the production capacity.
Ultimately, TPPA will bring about significant increase in domestic investment. With TPPA, X expects to invest
more than RM1 billion on top of their existing
upstream operating scale. X aspires to progress from being self-sufficient to becoming a supplier through an outreach strategy, supplying to other garment manufacturers. In
addition, X also estimates that about RM350 million of capital expenditure will be committed for its reinvestment in the downstream, in order to achieve the aspired revenue growth rate.
X is a leading industry player in textiles and garment manufacturing Annual revenue: RM 500 million
X is currently sourcing 90% of its production inputs from TPPA countries for its upstream operation due to quality concerns. 45% of their upstream outputs are exported to its downstream operations in non-TPPA countries. Some of which enjoys zero-tariff rate with the ultimate buyers from the US. X derives its competitive advantage from its proactive approach to buyers whereby they design, innovate and propose ideas and products to buyers. X reacts constantly to global demand and technology advancement by upgrading their machinery every 5 years. Before Malaysia’s entry into TPPA, X had already expended more than RM600 million of capital investment for capacity building and product diversification. The investment will double its monthly capacity to over 4 million kg of yarn and more than 3.5 million kg of fabrics, primarily to meet its own downstream demand. At present, X is venturing into polyester yarn and higher value-added functional textiles.
Business aspiration: With TPPA, the company aspired to increase its annual revenues by 50% to 80% per annum.
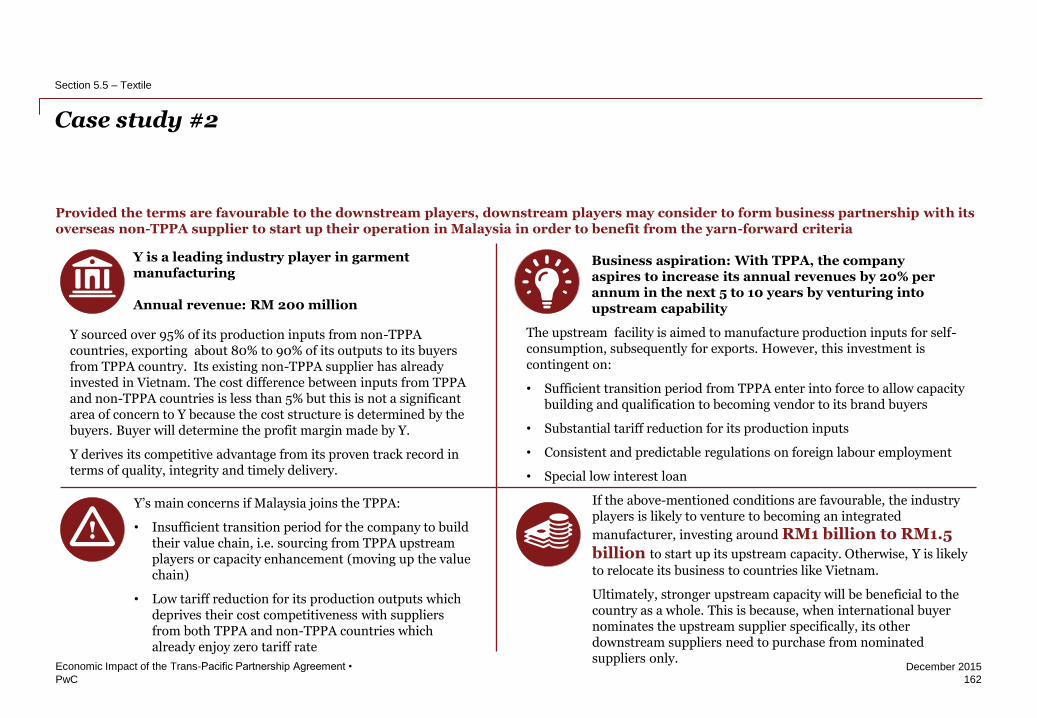
PwC
December 2015
Provided the terms are favourable to the downstream players, downstream players may consider to form business partnership with its overseas non-TPPA supplier to start up their operation in Malaysia in order to benefit from the yarn-forward criteria
Case study #2
162
Economic Impact of the Trans-Pacific Partnership Agreement •
Section 5.5 – Textile
The upstream facility is aimed to manufacture production inputs for self-consumption, subsequently for exports. However, this investment is contingent on:
• Sufficient transition period from TPPA enter into force to allow capacity building and qualification to becoming vendor to its brand buyers
• Substantial tariff reduction for its production inputs
• Consistent and predictable regulations on foreign labour employment
• Special low interest loan
If the above-mentioned conditions are favourable, the industry players is likely to venture to becoming an integrated
manufacturer, investing around RM1 billion to RM1.5 billion to start up its upstream capacity. Otherwise, Y is likely
to relocate its business to countries like Vietnam.
Ultimately, stronger upstream capacity will be beneficial to the country as a whole. This is because, when international buyer nominates the upstream supplier specifically, its other downstream suppliers need to purchase from nominated suppliers only.
Y sourced over 95% of its production inputs from non-TPPA countries, exporting about 80% to 90% of its outputs to its buyers from TPPA country. Its existing non-TPPA supplier has already invested in Vietnam. The cost difference between inputs from TPPA and non-TPPA countries is less than 5% but this is not a significant area of concern to Y because the cost structure is determined by the buyers. Buyer will determine the profit margin made by Y.
Y derives its competitive advantage from its proven track record in terms of quality, integrity and timely delivery.
Y’s main concerns if Malaysia joins the TPPA:
• Insufficient transition period for the company to build their value chain, i.e. sourcing from TPPA upstream players or capacity enhancement (moving up the value chain)
• Low tariff reduction for its production outputs which deprives their cost competitiveness with suppliers from both TPPA and non-TPPA countries which already enjoy zero tariff rate
Business aspiration: With TPPA, the company aspires to increase its annual revenues by 20% per annum in the next 5 to 10 years by venturing into upstream capability
Y is a leading industry player in garment manufacturing Annual revenue: RM 200 million
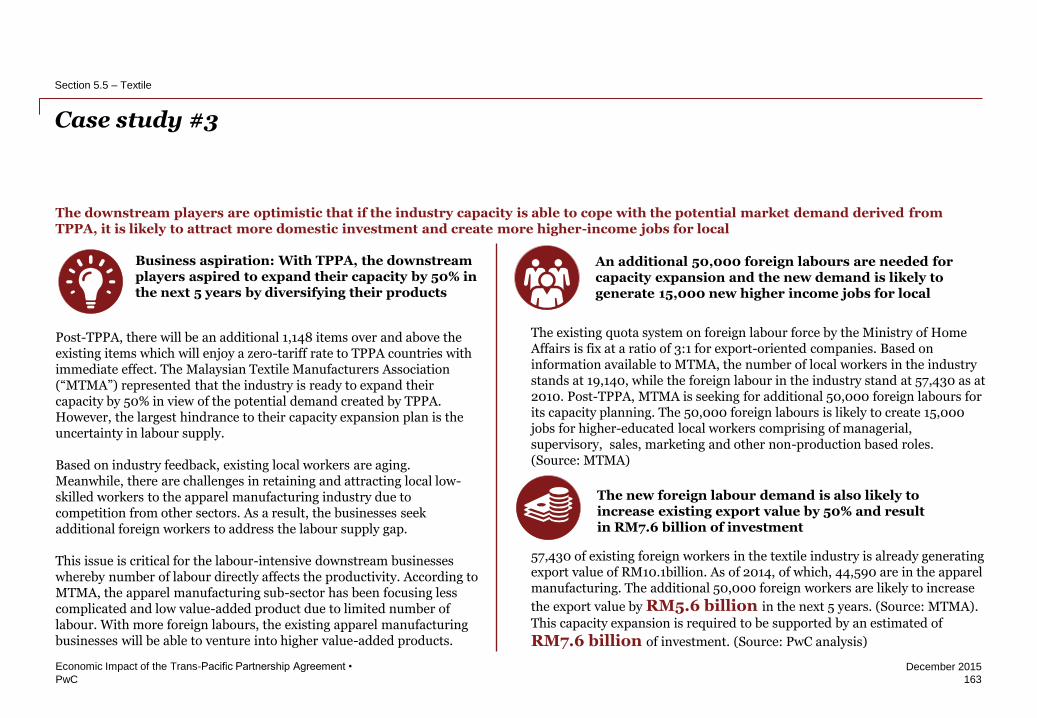
PwC
December 2015
The downstream players are optimistic that if the industry capacity is able to cope with the potential market demand derived from TPPA, it is likely to attract more domestic investment and create more higher-income jobs for local
Case study #3
163
Economic Impact of the Trans-Pacific Partnership Agreement •
Section 5.5 – Textile
The existing quota system on foreign labour force by the Ministry of Home Affairs is fix at a ratio of 3:1 for export-oriented companies. Based on information available to MTMA, the number of local workers in the industry stands at 19,140, while the foreign labour in the industry stand at 57,430 as at 2010. Post-TPPA, MTMA is seeking for additional 50,000 foreign labours for its capacity planning. The 50,000 foreign labours is likely to create 15,000 jobs for higher-educated local workers comprising of managerial, supervisory, sales, marketing and other non-production based roles. (Source: MTMA)
57,430 of existing foreign workers in the textile industry is already generating export value of RM10.1billion. As of 2014, of which, 44,590 are in the apparel manufacturing. The additional 50,000 foreign workers are likely to increase
the export value by RM5.6 billion in the next 5 years. (Source: MTMA).
This capacity expansion is required to be supported by an estimated of
RM7.6 billion of investment. (Source: PwC analysis)
Business aspiration: With TPPA, the downstream players aspired to expand their capacity by 50% in the next 5 years by diversifying their products
The new foreign labour demand is also likely to increase existing export value by 50% and result in RM7.6 billion of investment
Post-TPPA, there will be an additional 1,148 items over and above the existing items which will enjoy a zero-tariff rate to TPPA countries with immediate effect. The Malaysian Textile Manufacturers Association (“MTMA”) represented that the industry is ready to expand their capacity by 50% in view of the potential demand created by TPPA. However, the largest hindrance to their capacity expansion plan is the uncertainty in labour supply. Based on industry feedback, existing local workers are aging. Meanwhile, there are challenges in retaining and attracting local low-skilled workers to the apparel manufacturing industry due to competition from other sectors. As a result, the businesses seek additional foreign workers to address the labour supply gap. This issue is critical for the labour-intensive downstream businesses whereby number of labour directly affects the productivity. According to MTMA, the apparel manufacturing sub-sector has been focusing less complicated and low value-added product due to limited number of labour. With more foreign labours, the existing apparel manufacturing businesses will be able to venture into higher value-added products.
An additional 50,000 foreign labours are needed for capacity expansion and the new demand is likely to generate 15,000 new higher income jobs for local
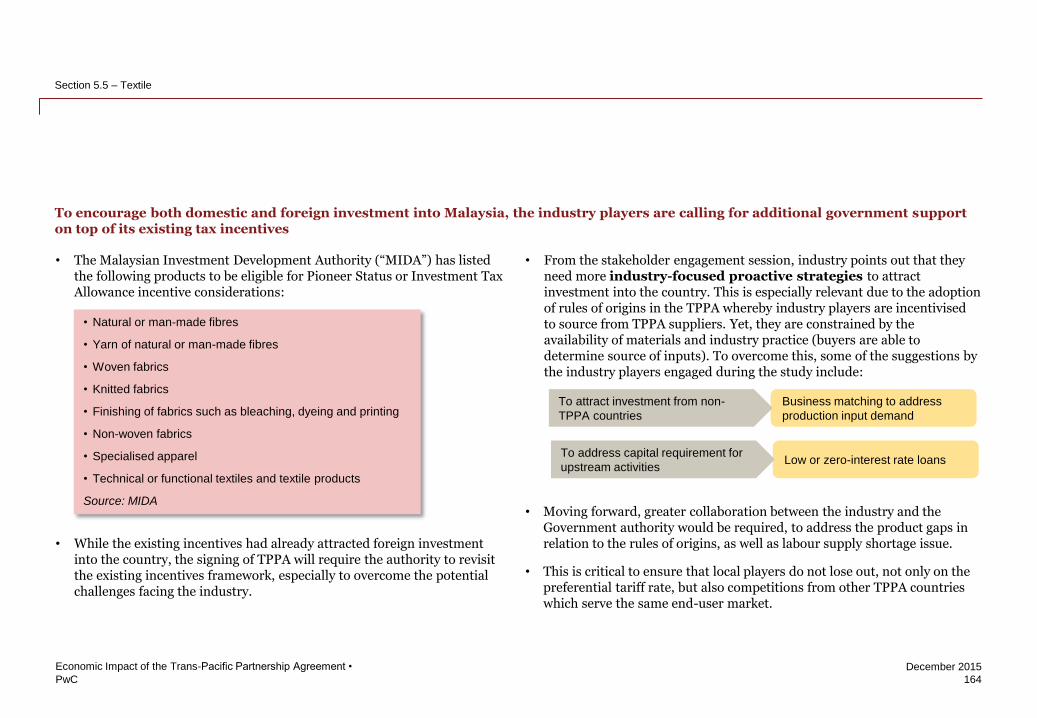
PwC
December 2015
164
Economic Impact of the Trans-Pacific Partnership Agreement •
Section 5.5 – Textile
To encourage both domestic and foreign investment into Malaysia, the industry players are calling for additional government support on top of its existing tax incentives
• From the stakeholder engagement session, industry points out that they need more industry-focused proactive strategies to attract investment into the country. This is especially relevant due to the adoption of rules of origins in the TPPA whereby industry players are incentivised to source from TPPA suppliers. Yet, they are constrained by the availability of materials and industry practice (buyers are able to determine source of inputs). To overcome this, some of the suggestions by the industry players engaged during the study include:
• Moving forward, greater collaboration between the industry and the Government authority would be required, to address the product gaps in relation to the rules of origins, as well as labour supply shortage issue.
• This is critical to ensure that local players do not lose out, not only on the preferential tariff rate, but also competitions from other TPPA countries which serve the same end-user market.
• The Malaysian Investment Development Authority (“MIDA”) has listed the following products to be eligible for Pioneer Status or Investment Tax Allowance incentive considerations:
• While the existing incentives had already attracted foreign investment into the country, the signing of TPPA will require the authority to revisit the existing incentives framework, especially to overcome the potential challenges facing the industry.
• Natural or man-made fibres
• Yarn of natural or man-made fibres
• Woven fabrics
• Knitted fabrics
• Finishing of fabrics such as bleaching, dyeing and printing
• Non-woven fabrics
• Specialised apparel
• Technical or functional textiles and textile products
Source: MIDA
Business matching to address
production input demand
Low or zero-interest rate loans
To attract investment from non-
TPPA countries
To address capital requirement for
upstream activities
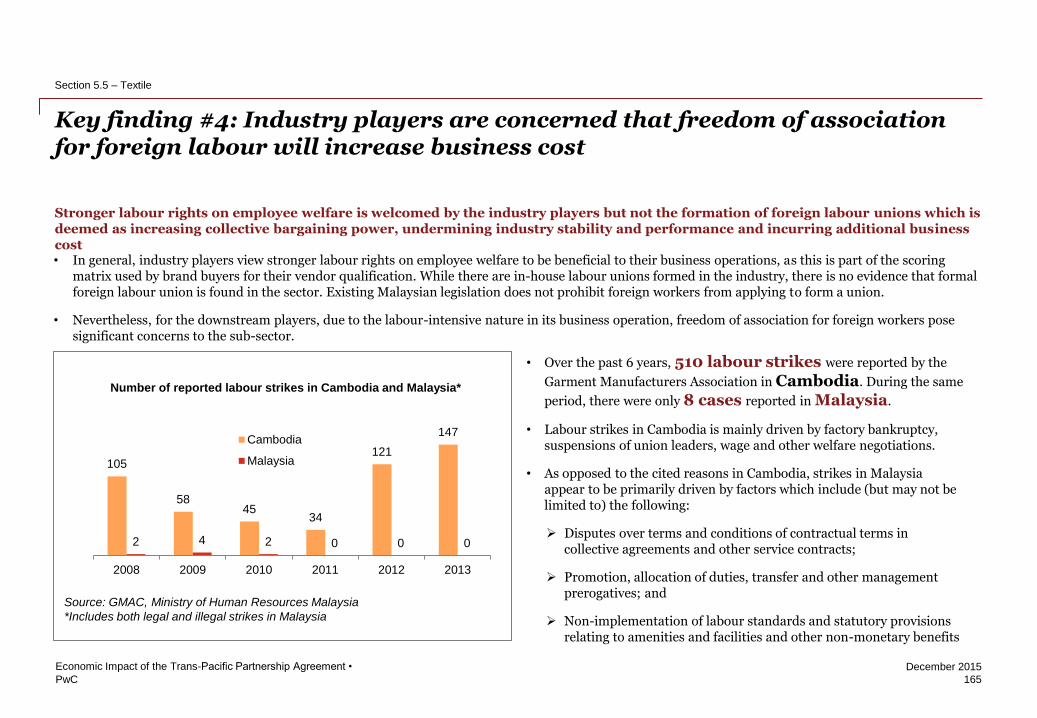
PwC
December 2015
Stronger labour rights on employee welfare is welcomed by the industry players but not the formation of foreign labour unions which is deemed as increasing collective bargaining power, undermining industry stability and performance and incurring additional business cost • In general, industry players view stronger labour rights on employee welfare to be beneficial to their business operations, as this is part of the scoring
matrix used by brand buyers for their vendor qualification. While there are in-house labour unions formed in the industry, there is no evidence that formal foreign labour union is found in the sector. Existing Malaysian legislation does not prohibit foreign workers from applying to form a union.
• Nevertheless, for the downstream players, due to the labour-intensive nature in its business operation, freedom of association for foreign workers pose significant concerns to the sub-sector.
Key finding #4: Industry players are concerned that freedom of association for foreign labour will increase business cost
165
Economic Impact of the Trans-Pacific Partnership Agreement •
Section 5.5 – Textile
105
58 45
34
121
147
2 4 2 0 0 0
2008 2009 2010 2011 2012 2013
Number of reported labour strikes in Cambodia and Malaysia*
Cambodia
Malaysia
Source: GMAC, Ministry of Human Resources Malaysia
*Includes both legal and illegal strikes in Malaysia
• Over the past 6 years, 510 labour strikes were reported by the
Garment Manufacturers Association in Cambodia. During the same
period, there were only 8 cases reported in Malaysia.
• Labour strikes in Cambodia is mainly driven by factory bankruptcy, suspensions of union leaders, wage and other welfare negotiations.
• As opposed to the cited reasons in Cambodia, strikes in Malaysia appear to be primarily driven by factors which include (but may not be limited to) the following:
Disputes over terms and conditions of contractual terms in collective agreements and other service contracts;
Promotion, allocation of duties, transfer and other management prerogatives; and
Non-implementation of labour standards and statutory provisions relating to amenities and facilities and other non-monetary benefits
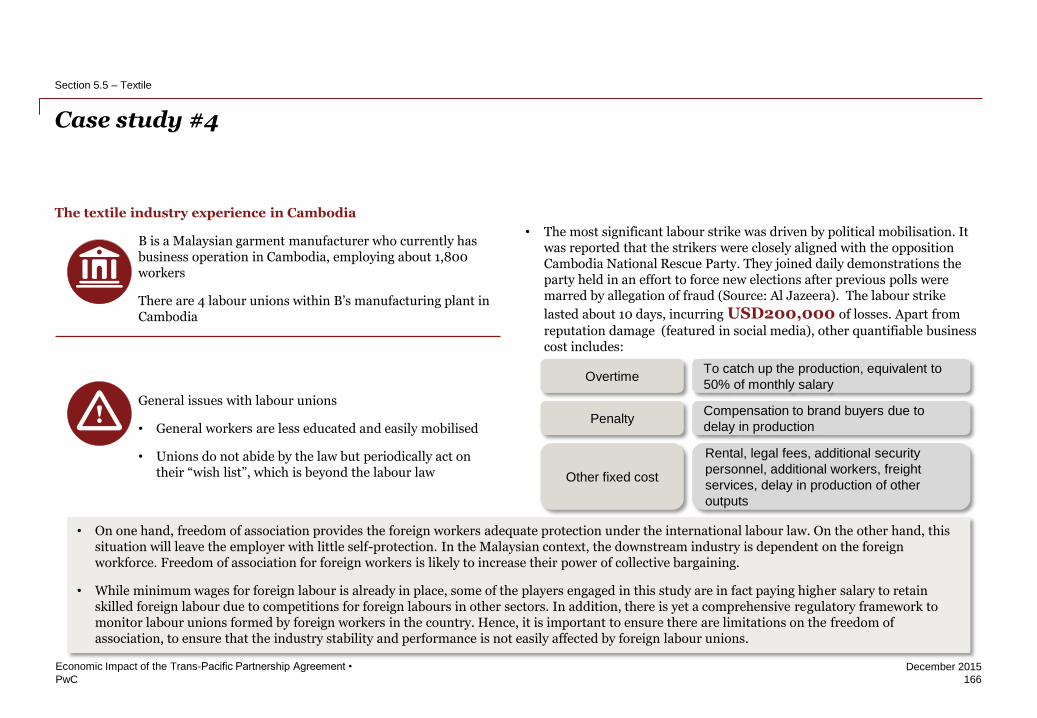
PwC
December 2015
The textile industry experience in Cambodia
B is a Malaysian garment manufacturer who currently has business operation in Cambodia, employing about 1,800 workers
There are 4 labour unions within B’s manufacturing plant in Cambodia
General issues with labour unions
• General workers are less educated and easily mobilised
• Unions do not abide by the law but periodically act on their “wish list”, which is beyond the labour law
166
Economic Impact of the Trans-Pacific Partnership Agreement •
Section 5.5 – Textile
Overtime
Other fixed cost
Penalty
To catch up the production, equivalent to
50% of monthly salary
Rental, legal fees, additional security
personnel, additional workers, freight
services, delay in production of other
outputs
Compensation to brand buyers due to
delay in production
Case study #4
• The most significant labour strike was driven by political mobilisation. It was reported that the strikers were closely aligned with the opposition Cambodia National Rescue Party. They joined daily demonstrations the party held in an effort to force new elections after previous polls were marred by allegation of fraud (Source: Al Jazeera). The labour strike
lasted about 10 days, incurring USD200,000 of losses. Apart from
reputation damage (featured in social media), other quantifiable business cost includes:
• On one hand, freedom of association provides the foreign workers adequate protection under the international labour law. On the other hand, this situation will leave the employer with little self-protection. In the Malaysian context, the downstream industry is dependent on the foreign workforce. Freedom of association for foreign workers is likely to increase their power of collective bargaining.
• While minimum wages for foreign labour is already in place, some of the players engaged in this study are in fact paying higher salary to retain skilled foreign labour due to competitions for foreign labours in other sectors. In addition, there is yet a comprehensive regulatory framework to monitor labour unions formed by foreign workers in the country. Hence, it is important to ensure there are limitations on the freedom of association, to ensure that the industry stability and performance is not easily affected by foreign labour unions.
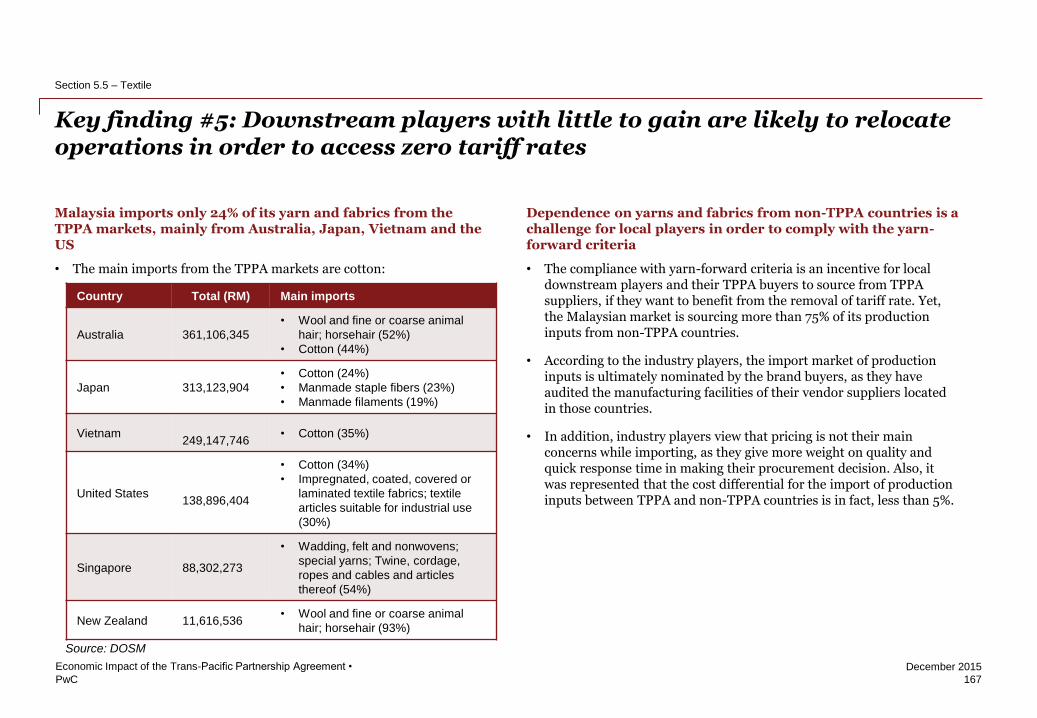
PwC
December 2015
Key finding #5: Downstream players with little to gain are likely to relocate operations in order to access zero tariff rates
167
Economic Impact of the Trans-Pacific Partnership Agreement •
Section 5.5 – Textile
Malaysia imports only 24% of its yarn and fabrics from the TPPA markets, mainly from Australia, Japan, Vietnam and the US
• The main imports from the TPPA markets are cotton:
Country Total (RM) Main imports
Australia 361,106,345
• Wool and fine or coarse animal
hair; horsehair (52%)
• Cotton (44%)
Japan 313,123,904
• Cotton (24%)
• Manmade staple fibers (23%)
• Manmade filaments (19%)
Vietnam
249,147,746 • Cotton (35%)
United States
138,896,404
• Cotton (34%)
• Impregnated, coated, covered or
laminated textile fabrics; textile
articles suitable for industrial use
(30%)
Singapore 88,302,273
• Wadding, felt and nonwovens;
special yarns; Twine, cordage,
ropes and cables and articles
thereof (54%)
New Zealand 11,616,536 • Wool and fine or coarse animal
hair; horsehair (93%)
Source: DOSM
Dependence on yarns and fabrics from non-TPPA countries is a challenge for local players in order to comply with the yarn-forward criteria
• The compliance with yarn-forward criteria is an incentive for local downstream players and their TPPA buyers to source from TPPA suppliers, if they want to benefit from the removal of tariff rate. Yet, the Malaysian market is sourcing more than 75% of its production inputs from non-TPPA countries.
• According to the industry players, the import market of production inputs is ultimately nominated by the brand buyers, as they have audited the manufacturing facilities of their vendor suppliers located in those countries.
• In addition, industry players view that pricing is not their main concerns while importing, as they give more weight on quality and quick response time in making their procurement decision. Also, it was represented that the cost differential for the import of production inputs between TPPA and non-TPPA countries is in fact, less than 5%.
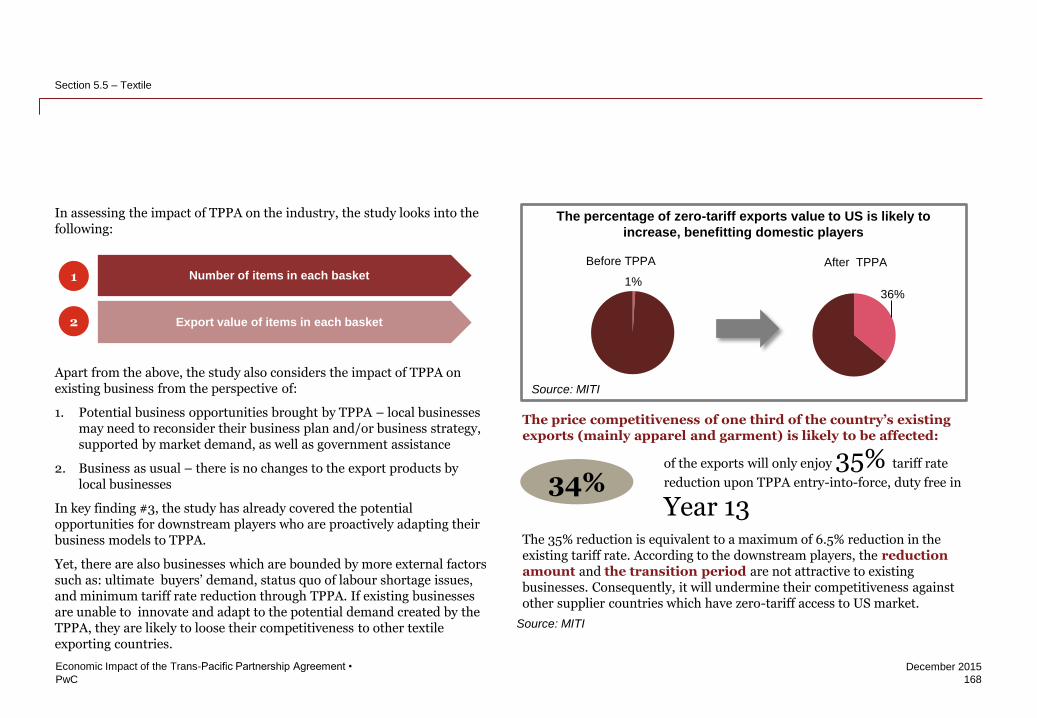
PwC
December 2015
168
Economic Impact of the Trans-Pacific Partnership Agreement •
Section 5.5 – Textile
36%
1%
99%
1%
Number of items in each basket
Export value of items in each basket
1
2
In assessing the impact of TPPA on the industry, the study looks into the following:
Apart from the above, the study also considers the impact of TPPA on existing business from the perspective of:
1. Potential business opportunities brought by TPPA – local businesses may need to reconsider their business plan and/or business strategy, supported by market demand, as well as government assistance
2. Business as usual – there is no changes to the export products by local businesses
In key finding #3, the study has already covered the potential opportunities for downstream players who are proactively adapting their business models to TPPA.
Yet, there are also businesses which are bounded by more external factors such as: ultimate buyers’ demand, status quo of labour shortage issues, and minimum tariff rate reduction through TPPA. If existing businesses are unable to innovate and adapt to the potential demand created by the TPPA, they are likely to loose their competitiveness to other textile exporting countries.
The price competitiveness of one third of the country’s existing exports (mainly apparel and garment) is likely to be affected:
The 35% reduction is equivalent to a maximum of 6.5% reduction in the existing tariff rate. According to the downstream players, the reduction amount and the transition period are not attractive to existing businesses. Consequently, it will undermine their competitiveness against other supplier countries which have zero-tariff access to US market.
34% of the exports will only enjoy 35% tariff rate
reduction upon TPPA entry-into-force, duty free in
Year 13
Source: MITI
Source: MITI
36%
Before TPPA
1%
After TPPA
The percentage of zero-tariff exports value to US is likely to
increase, benefitting domestic players
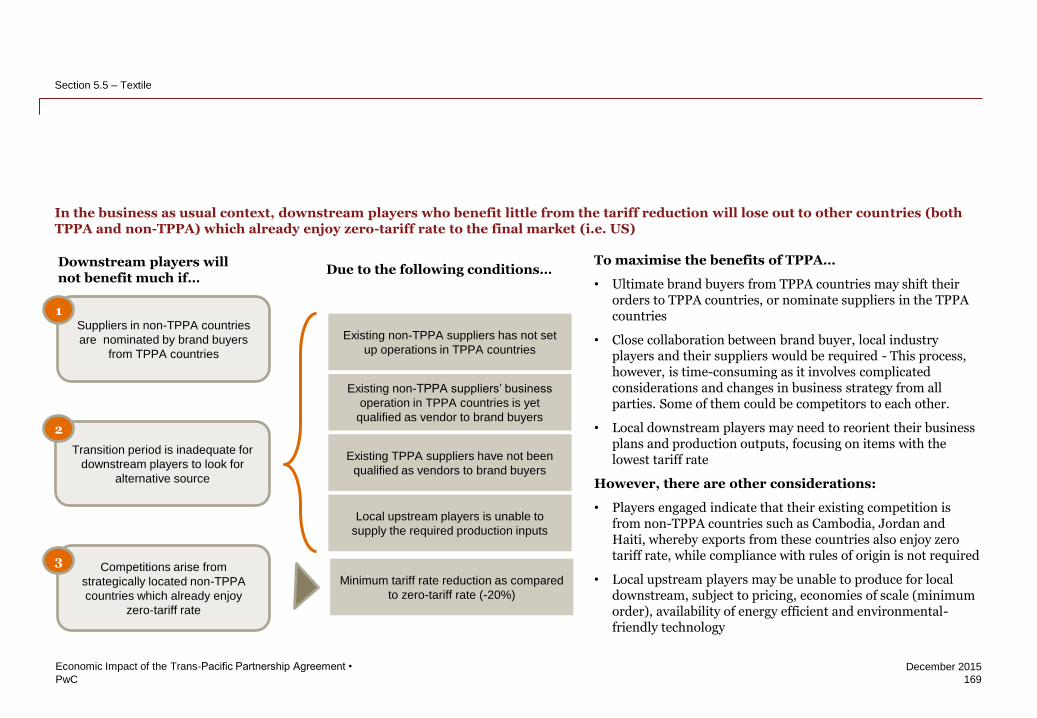
PwC
December 2015
In the business as usual context, downstream players who benefit little from the tariff reduction will lose out to other countries (both TPPA and non-TPPA) which already enjoy zero-tariff rate to the final market (i.e. US)
To maximise the benefits of TPPA…
• Ultimate brand buyers from TPPA countries may shift their orders to TPPA countries, or nominate suppliers in the TPPA countries
• Close collaboration between brand buyer, local industry players and their suppliers would be required - This process, however, is time-consuming as it involves complicated considerations and changes in business strategy from all parties. Some of them could be competitors to each other.
• Local downstream players may need to reorient their business plans and production outputs, focusing on items with the lowest tariff rate
However, there are other considerations:
• Players engaged indicate that their existing competition is from non-TPPA countries such as Cambodia, Jordan and Haiti, whereby exports from these countries also enjoy zero tariff rate, while compliance with rules of origin is not required
• Local upstream players may be unable to produce for local downstream, subject to pricing, economies of scale (minimum order), availability of energy efficient and environmental-friendly technology
169
Economic Impact of the Trans-Pacific Partnership Agreement •
Section 5.5 – Textile
Suppliers in non-TPPA countries
are nominated by brand buyers
from TPPA countries
Competitions arise from
strategically located non-TPPA
countries which already enjoy
zero-tariff rate
Transition period is inadequate for
downstream players to look for
alternative source
Existing non-TPPA suppliers has not set
up operations in TPPA countries
Existing non-TPPA suppliers’ business
operation in TPPA countries is yet
qualified as vendor to brand buyers
Existing TPPA suppliers have not been
qualified as vendors to brand buyers
Local upstream players is unable to
supply the required production inputs
Due to the following conditions… Downstream players will not benefit much if…
1
2
3
Minimum tariff rate reduction as compared
to zero-tariff rate (-20%)
Least benefitted downstream players are likely to relocate their business operation to other countries which grant them access to zero-tariff rate (cont’d)
PwC
December 2015
Seamless cooperation between the Government and the industry is required in order to retain and help the business to survive the challenges posed by TPPA
170
Economic Impact of the Trans-Pacific Partnership Agreement •
Section 5.5 – Textile
• In the condition whereby the downstream outputs are not eligible to substantial tariff rate reduction to enhance its competitiveness, the industry will require the following supports for change management:
Timely information sharing from the Government to assist them in strategizing their next step to address the challenges posed by TPPA
Creation of market demand from TPPA buyers on zero-tariff rate items to enable downstream players to reorient their production
Adequate transition period for them to:
Look for alternative sourcing; and
Develop capacity to produce upstream products for own consumption, whether through joint venture and self-reinvestment to move up the value chain
In the worst case scenario, whereby:
Downstream industry players are likely to relocate their business to countries operating in the following conditions:
Tariff reduction is insignificant (<10%)
Transition period for zero-tariff rate access is >10 years
TPPA countries in which suppliers from non-TPPA countries have already set up
their business operation such as Vietnam
non-TPPA countries like Jordan or Haiti which already enjoy zero tariff rate
without compliance requirement on rules of origins
Suppliers are still from non-TPPA countries
PwC
December 2015
Summary
• The local downstream industry is facing fierce competition from the downstream activities in countries like Vietnam for foreign investment due to labour shortage issue, as well as zero-tariff rate in other non-TPPA countries. An impetus is required to push the industry towards higher level of sustainability and higher value-added. Otherwise, the downstream players are likely to lose out to regional competitions.
• Such changes, however, requires seamless cooperation between the Government and the industry. This is critical to ensure that local downstream players, especially, to have adequate time to enhance their capability and capacity to compete in the global market.
If Malaysia does not sign the TPPA, the textile industry is likely to shrink further
171
Economic Impact of the Trans-Pacific Partnership Agreement •
Section 5.5 – Textile
Ideally, the players would benefit very significantly from the higher demand from the TPPA countries. TPPA creates opportunities for local players to diversify their exports, both upstream and downstream. The main concern of the downstream players is mainly on sustainability of labour supply, and potentially adjustment required, in order for them to comply with the rules of origins. Otherwise, business will be at standstill, or reduced, since they have existing regular customers.
Yarn-forward criteria is beneficial to the upstream players as they are not confined to source fibers from selected countries. Integrated manufacturers who already source from TPPA countries will benefit even more than others. However, downstream players view yarn-forward criteria to be harmful, but they are willing to address the challenges provided there are sufficient support from the Government to attract foreign investments. In this case, there will be a bilateral monitoring system in place to prevent circumvention of goods from non-TPPA countries using Malaysia originating status to enter US.
Stronger labour rights will assist in corporate image and increases business opportunities with brand buyers. However, stronger labours rights, especially on freedom of forming labour unions for foreign workers, is perceived to be harmful to the business.
TPPA is likely to stimulate investment in the country, as well as drawing in foreign investment from non-TPPA countries. This is however, subject to other factors such as labour availability, matching production inputs supply and demand as well as sufficient transition period for industry transformation.
PwC
December 2015
Key takeaways:
• Existing industry players who source from TPPA countries and sell to buyers in the TPPA markets are likely to benefit the most, if Malaysia joins the TPPA. Improved market access and rules of origins may open the door for deeper value chain integration between countries with comparative advantage which complements each other’s development.
• For downstream industry players who source their production inputs from non-TPPA countries, they may lose out in cost competitiveness (if their product is not eligible to zero tariff rate). Greater efforts would be required to reorient their business strategy and production output if they were to reap the business opportunities brought by TPPA (increase in number of zero-rated export items). This effort needs to be supported by government’s assistance in ensuring sustainable labour supply for the sector.
• Sufficient transition time for local businesses is critical in the business as usual context (no new demand from TPPA buyers for zero-rated export items) as industry players will strive to maximise the benefits brought by the TPPA, i.e. moving up the value chain, transforming into integrated manufacturer, expanding their business venture in TPPA countries; Otherwise, industry may relocate their business in Vietnam for business survival and to reap the benefits of TPPA despite the fact that business relocation would mean economic loss to the country.
• To facilitate successful industry transformation, proactive strategy would be essential to attract investment and retain businesses in Malaysia. This includes various initiatives and collaboration among brand buyers from TPPA countries, its vendors (upstream and downstream suppliers), as well as government authority who is directly involved in the negotiation.
• Stronger labour rights is a double-edged sword. It may enhance the industry players profiles, increase its attractiveness to brand buyers. On the other hand, freedom of forming labour union by foreign workers may potentially increase business cost, affecting industry stability and performance.
On balance, the industry views that TPPA is beneficial to their business, contingent on favourable conditions
172
Economic Impact of the Trans-Pacific Partnership Agreement •
Section 5.5 – Textile
Existing industry players views environmental compliance critical to qualify them in the vendor assessment matrix of the ultimate buyers. Hence, it is already in the interest of the industry players to ensure environmental compliance, not only to increase buyers’ confidence, but also to enhance buyers’ brand image.
Summary (cont’d)
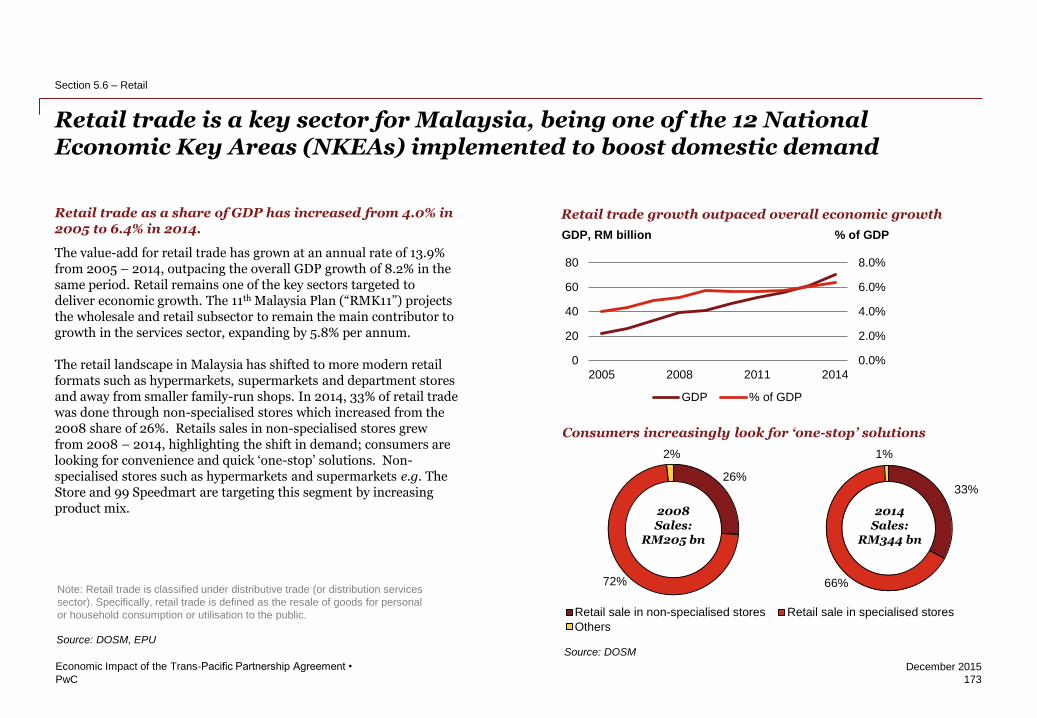
PwC
December 2015
Retail trade growth outpaced overall economic growth
Retail trade as a share of GDP has increased from 4.0% in 2005 to 6.4% in 2014.
The value-add for retail trade has grown at an annual rate of 13.9% from 2005 – 2014, outpacing the overall GDP growth of 8.2% in the same period. Retail remains one of the key sectors targeted to deliver economic growth. The 11th Malaysia Plan (“RMK11”) projects the wholesale and retail subsector to remain the main contributor to growth in the services sector, expanding by 5.8% per annum.
The retail landscape in Malaysia has shifted to more modern retail formats such as hypermarkets, supermarkets and department stores and away from smaller family-run shops. In 2014, 33% of retail trade was done through non-specialised stores which increased from the 2008 share of 26%. Retails sales in non-specialised stores grew from 2008 – 2014, highlighting the shift in demand; consumers are looking for convenience and quick ‘one-stop’ solutions. Non-specialised stores such as hypermarkets and supermarkets e.g. The Store and 99 Speedmart are targeting this segment by increasing product mix.
Retail trade is a key sector for Malaysia, being one of the 12 National Economic Key Areas (NKEAs) implemented to boost domestic demand
173
Economic Impact of the Trans-Pacific Partnership Agreement •
Section 5.6 – Retail
Retail sale in non-specialised stores Retail sale in specialised stores
Others
26%
72%
2%
33%
66%
1%
2008 Sales:
RM205 bn
2014 Sales:
RM344 bn
Note: Retail trade is classified under distributive trade (or distribution services
sector). Specifically, retail trade is defined as the resale of goods for personal
or household consumption or utilisation to the public.
Footnote
0.0%
2.0%
4.0%
6.0%
8.0%
0
20
40
60
80
2005 2008 2011 2014
GDP % of GDP
% of GDP GDP, RM billion
Consumers increasingly look for ‘one-stop’ solutions
Source: DOSM, EPU Source: DOSM
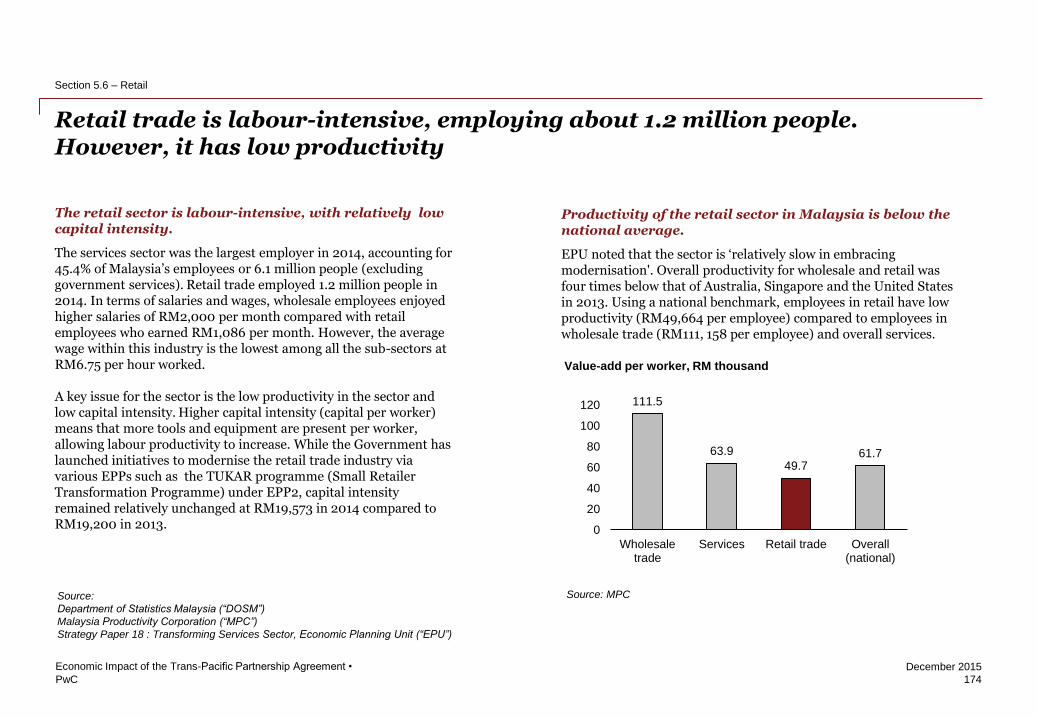
PwC
December 2015
The retail sector is labour-intensive, with relatively low capital intensity.
The services sector was the largest employer in 2014, accounting for 45.4% of Malaysia’s employees or 6.1 million people (excluding government services). Retail trade employed 1.2 million people in 2014. In terms of salaries and wages, wholesale employees enjoyed higher salaries of RM2,000 per month compared with retail employees who earned RM1,086 per month. However, the average wage within this industry is the lowest among all the sub-sectors at RM6.75 per hour worked.
A key issue for the sector is the low productivity in the sector and low capital intensity. Higher capital intensity (capital per worker) means that more tools and equipment are present per worker, allowing labour productivity to increase. While the Government has launched initiatives to modernise the retail trade industry via various EPPs such as the TUKAR programme (Small Retailer Transformation Programme) under EPP2, capital intensity remained relatively unchanged at RM19,573 in 2014 compared to RM19,200 in 2013.
Retail trade is labour-intensive, employing about 1.2 million people. However, it has low productivity
174
Economic Impact of the Trans-Pacific Partnership Agreement •
Section 5.6 – Retail
In 2013, the productivity level of wholesale
and retail trade at RM51,103 was below that
of services sector, and four times below that
of Australia, Singapore and the United States.
Given that 79% of retail trade establishments
comprised micro enterprises, they are
relatively slow in embracing modernisation
due to high investment cost and lack of
interest among traditional retailers and
cooperatives. Malaysian retailers, particularly
SMEs tend to be inward looking since
domestic market is deemed to offer sufficient
opportunities and lack capacity to venture
abroad.
Productivity of the retail sector in Malaysia is below the national average.
EPU noted that the sector is ‘relatively slow in embracing modernisation'. Overall productivity for wholesale and retail was four times below that of Australia, Singapore and the United States in 2013. Using a national benchmark, employees in retail have low productivity (RM49,664 per employee) compared to employees in wholesale trade (RM111, 158 per employee) and overall services.
111.5
63.9
49.7 61.7
0
20
40
60
80
100
120
Wholesaletrade
Services Retail trade Overall(national)
Value-add per worker, RM thousand
Source: MPC Source:
Department of Statistics Malaysia (“DOSM”)
Malaysia Productivity Corporation (“MPC”)
Strategy Paper 18 : Transforming Services Sector, Economic Planning Unit (“EPU”)
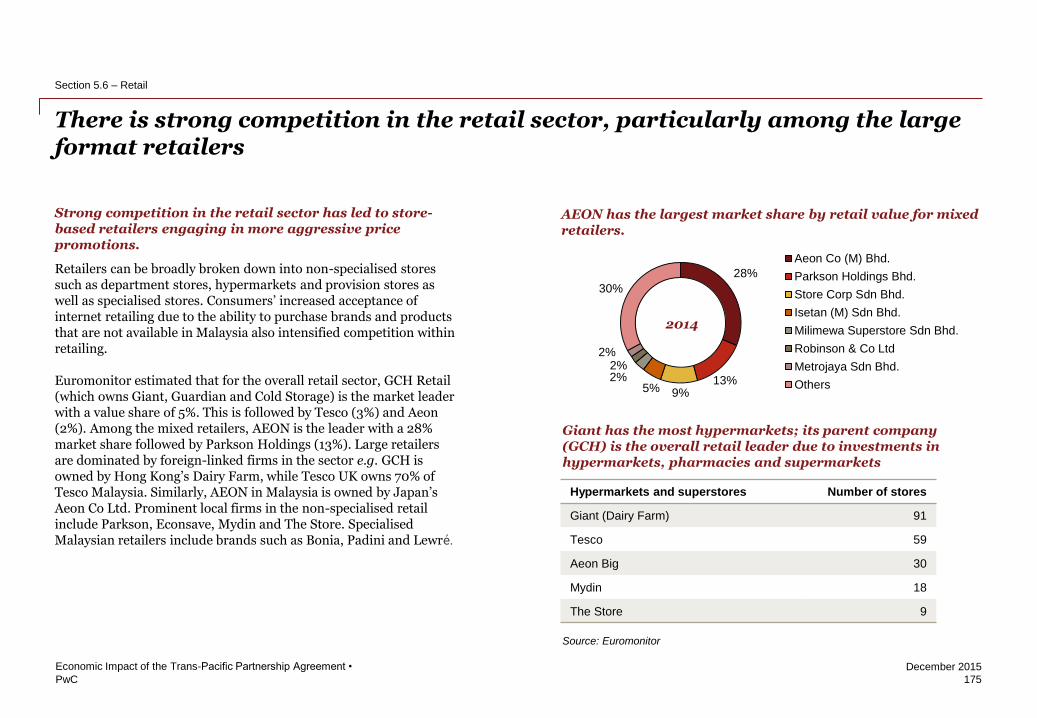
PwC
December 2015
Strong competition in the retail sector has led to store-based retailers engaging in more aggressive price promotions.
Retailers can be broadly broken down into non-specialised stores such as department stores, hypermarkets and provision stores as well as specialised stores. Consumers’ increased acceptance of internet retailing due to the ability to purchase brands and products that are not available in Malaysia also intensified competition within retailing.
Euromonitor estimated that for the overall retail sector, GCH Retail (which owns Giant, Guardian and Cold Storage) is the market leader with a value share of 5%. This is followed by Tesco (3%) and Aeon (2%). Among the mixed retailers, AEON is the leader with a 28% market share followed by Parkson Holdings (13%). Large retailers are dominated by foreign-linked firms in the sector e.g. GCH is owned by Hong Kong’s Dairy Farm, while Tesco UK owns 70% of Tesco Malaysia. Similarly, AEON in Malaysia is owned by Japan’s Aeon Co Ltd. Prominent local firms in the non-specialised retail include Parkson, Econsave, Mydin and The Store. Specialised Malaysian retailers include brands such as Bonia, Padini and Lewré.
There is strong competition in the retail sector, particularly among the large format retailers
175
Hypermarkets and superstores Number of stores
Giant (Dairy Farm) 91
Tesco 59
Aeon Big 30
Mydin 18
The Store 9
Economic Impact of the Trans-Pacific Partnership Agreement •
Section 5.6 – Retail
28%
13% 9% 5%
2% 2%
2%
30%
Aeon Co (M) Bhd.
Parkson Holdings Bhd.
Store Corp Sdn Bhd.
Isetan (M) Sdn Bhd.
Milimewa Superstore Sdn Bhd.
Robinson & Co Ltd
Metrojaya Sdn Bhd.
Others
2014
AEON has the largest market share by retail value for mixed retailers.
Giant has the most hypermarkets; its parent company (GCH) is the overall retail leader due to investments in hypermarkets, pharmacies and supermarkets
Source: Euromonitor
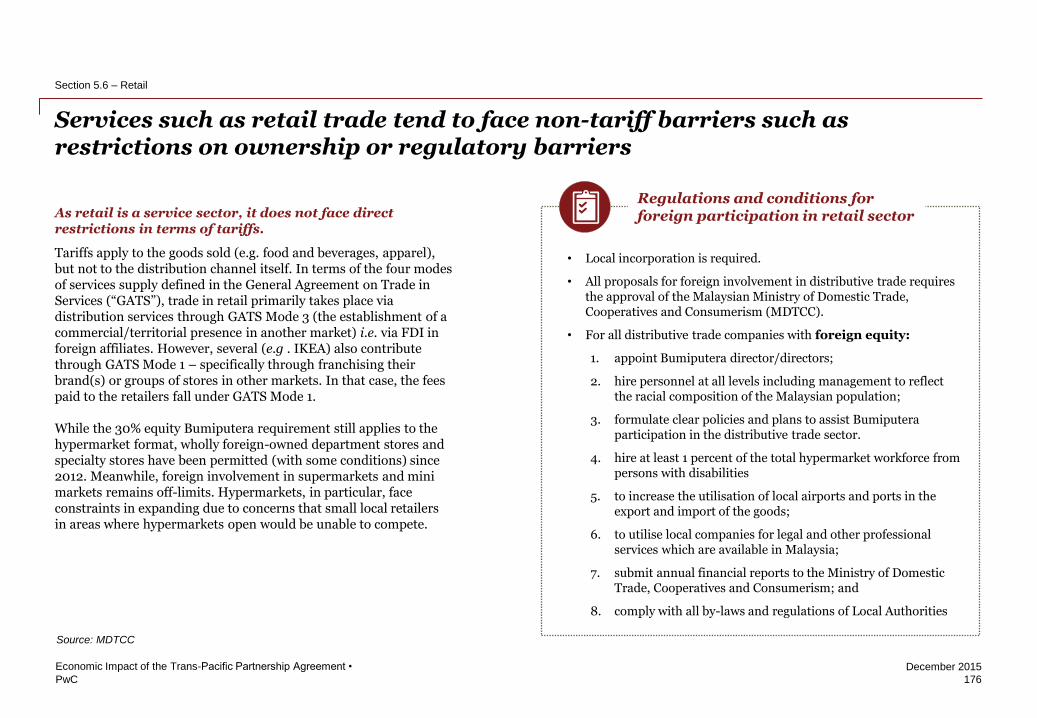
PwC
December 2015
As retail is a service sector, it does not face direct restrictions in terms of tariffs.
Tariffs apply to the goods sold (e.g. food and beverages, apparel), but not to the distribution channel itself. In terms of the four modes of services supply defined in the General Agreement on Trade in Services (“GATS”), trade in retail primarily takes place via distribution services through GATS Mode 3 (the establishment of a commercial/territorial presence in another market) i.e. via FDI in foreign affiliates. However, several (e.g . IKEA) also contribute through GATS Mode 1 – specifically through franchising their brand(s) or groups of stores in other markets. In that case, the fees paid to the retailers fall under GATS Mode 1.
While the 30% equity Bumiputera requirement still applies to the hypermarket format, wholly foreign-owned department stores and specialty stores have been permitted (with some conditions) since 2012. Meanwhile, foreign involvement in supermarkets and mini markets remains off-limits. Hypermarkets, in particular, face constraints in expanding due to concerns that small local retailers in areas where hypermarkets open would be unable to compete.
Services such as retail trade tend to face non-tariff barriers such as restrictions on ownership or regulatory barriers
176
Economic Impact of the Trans-Pacific Partnership Agreement •
Section 5.6 – Retail
Regulations and conditions for foreign participation in retail sector
• Local incorporation is required.
• All proposals for foreign involvement in distributive trade requires the approval of the Malaysian Ministry of Domestic Trade, Cooperatives and Consumerism (MDTCC).
• For all distributive trade companies with foreign equity:
1. appoint Bumiputera director/directors;
2. hire personnel at all levels including management to reflect the racial composition of the Malaysian population;
3. formulate clear policies and plans to assist Bumiputera participation in the distributive trade sector.
4. hire at least 1 percent of the total hypermarket workforce from persons with disabilities
5. to increase the utilisation of local airports and ports in the export and import of the goods;
6. to utilise local companies for legal and other professional services which are available in Malaysia;
7. submit annual financial reports to the Ministry of Domestic Trade, Cooperatives and Consumerism; and
8. comply with all by-laws and regulations of Local Authorities
Source: MDTCC
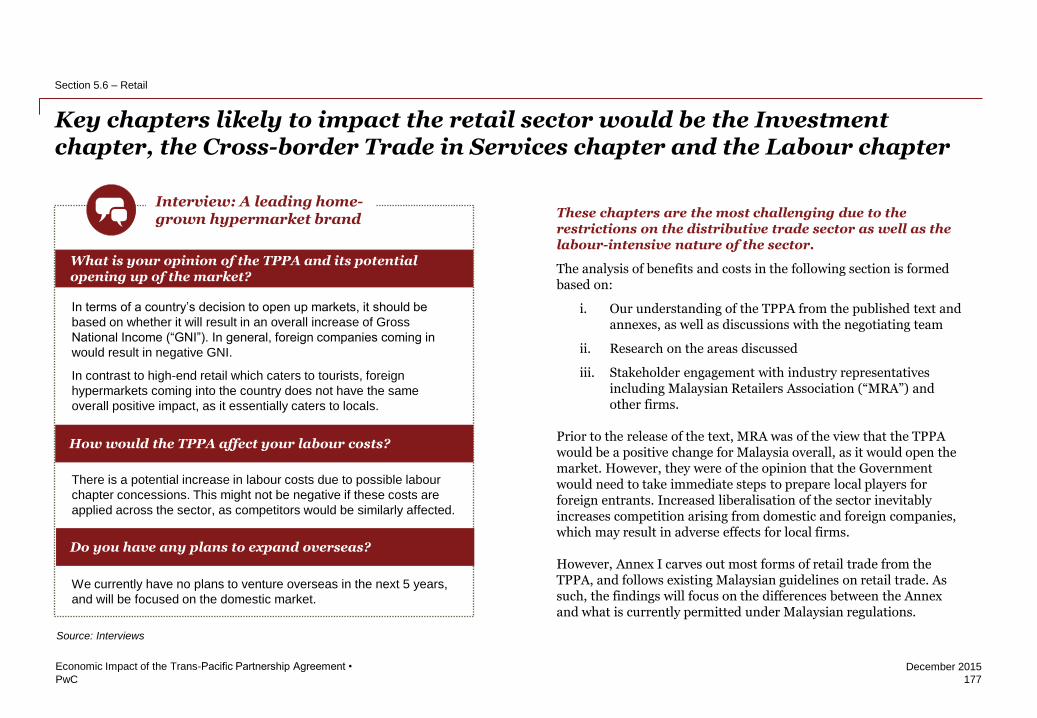
PwC
December 2015
These chapters are the most challenging due to the restrictions on the distributive trade sector as well as the labour-intensive nature of the sector.
The analysis of benefits and costs in the following section is formed based on:
i. Our understanding of the TPPA from the published text and annexes, as well as discussions with the negotiating team
ii. Research on the areas discussed
iii. Stakeholder engagement with industry representatives including Malaysian Retailers Association (“MRA”) and other firms.
Prior to the release of the text, MRA was of the view that the TPPA would be a positive change for Malaysia overall, as it would open the market. However, they were of the opinion that the Government would need to take immediate steps to prepare local players for foreign entrants. Increased liberalisation of the sector inevitably increases competition arising from domestic and foreign companies, which may result in adverse effects for local firms.
However, Annex I carves out most forms of retail trade from the TPPA, and follows existing Malaysian guidelines on retail trade. As such, the findings will focus on the differences between the Annex and what is currently permitted under Malaysian regulations.
Key chapters likely to impact the retail sector would be the Investment chapter, the Cross-border Trade in Services chapter and the Labour chapter
177
Economic Impact of the Trans-Pacific Partnership Agreement •
Section 5.6 – Retail
We currently have no plans to venture overseas in the next 5 years,
and will be focused on the domestic market.
Interview: A leading home-grown hypermarket brand
What is your opinion of the TPPA and its potential opening up of the market?
In terms of a country’s decision to open up markets, it should be
based on whether it will result in an overall increase of Gross
National Income (“GNI”). In general, foreign companies coming in
would result in negative GNI.
In contrast to high-end retail which caters to tourists, foreign
hypermarkets coming into the country does not have the same
overall positive impact, as it essentially caters to locals.
How would the TPPA affect your labour costs?
There is a potential increase in labour costs due to possible labour
chapter concessions. This might not be negative if these costs are
applied across the sector, as competitors would be similarly affected.
Do you have any plans to expand overseas?
Source: Interviews
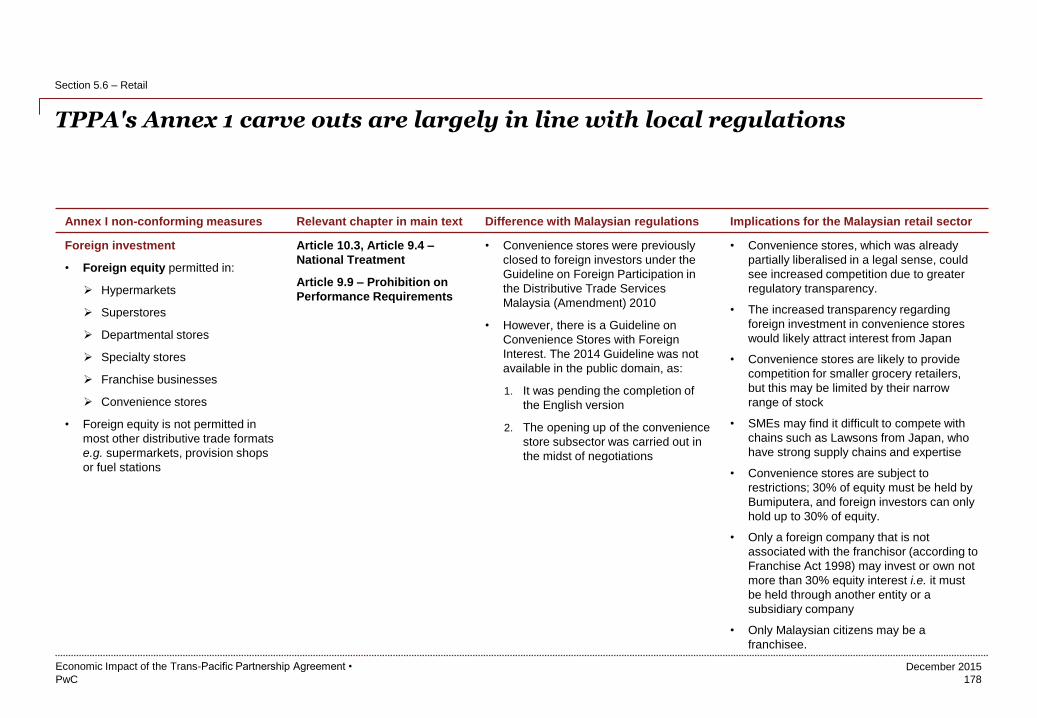
PwC
December 2015
TPPA's Annex 1 carve outs are largely in line with local regulations
178
Economic Impact of the Trans-Pacific Partnership Agreement •
Section 5.6 – Retail
Annex I non-conforming measures Relevant chapter in main text Difference with Malaysian regulations Implications for the Malaysian retail sector
Foreign investment
• Foreign equity permitted in:
Hypermarkets
Superstores
Departmental stores
Specialty stores
Franchise businesses
Convenience stores
• Foreign equity is not permitted in
most other distributive trade formats
e.g. supermarkets, provision shops
or fuel stations
Article 10.3, Article 9.4 –
National Treatment
Article 9.9 – Prohibition on
Performance Requirements
• Convenience stores were previously
closed to foreign investors under the
Guideline on Foreign Participation in
the Distributive Trade Services
Malaysia (Amendment) 2010
• However, there is a Guideline on
Convenience Stores with Foreign
Interest. The 2014 Guideline was not
available in the public domain, as:
1. It was pending the completion of
the English version
2. The opening up of the convenience
store subsector was carried out in
the midst of negotiations
• Convenience stores, which was already
partially liberalised in a legal sense, could
see increased competition due to greater
regulatory transparency.
• The increased transparency regarding
foreign investment in convenience stores
would likely attract interest from Japan
• Convenience stores are likely to provide
competition for smaller grocery retailers,
but this may be limited by their narrow
range of stock
• SMEs may find it difficult to compete with
chains such as Lawsons from Japan, who
have strong supply chains and expertise
• Convenience stores are subject to
restrictions; 30% of equity must be held by
Bumiputera, and foreign investors can only
hold up to 30% of equity.
• Only a foreign company that is not
associated with the franchisor (according to
Franchise Act 1998) may invest or own not
more than 30% equity interest i.e. it must
be held through another entity or a
subsidiary company
• Only Malaysian citizens may be a
franchisee.

PwC
December 2015
179
Economic Impact of the Trans-Pacific Partnership Agreement •
Section 5.6 – Retail
Annex I non-conforming measures Relevant chapter in main text Difference with Malaysian regulations Implications for the Malaysian retail sector
Other requirements for firms with
foreign equity
• Firms with foreign equity must fulfil
other conditions such as appointing
Bumiputera directors or hiring
practices that reflect racial
composition
Article 9.9 – Prohibition on
Performance Requirements
Article 9.10 – Senior
Management and Boards of
Directors
• This requirement is already included in
the Guideline on Foreign Participation
in the Distributive Trade Services
Malaysia (Amendment) 2010
• However, the annex excludes 4
requirements in the Guideline:
(e) to increase the utilisation of
local airports and ports in the
export and import of the goods;
(f) to utilise local companies for
legal and other professional
services which are available in
Malaysia;
(g) submit annual financial reports
to the Ministry of Domestic Trade,
Cooperatives and Consumerism
(h) comply with all by-laws and
regulations of Local Authorities
• There is no impact on the Bumiputera
requirements, or on hiring practices.
• There is a slight difference in the annex,
where firms with foreign equity must
endeavour to “hire at least 1 per cent of the
total workforce from persons with
disabilities.” This drops the specification of
hypermarket in the workforce, broadening
the scope.
• In practice, the removal of conditions (e) to
(g) does not decrease the barriers to entry.
These items apply irrespective to both
firms owned by Malaysians or foreign
investors.
• These are all subject to domestic
regulations which does not necessarily
breach the national treatment obligation
• These requirements apply for any
distributive trade firm with foreign equity.
Local incorporation
• Firms with foreign equity must be
incorporated locally under the
Companies Act 1965
Article 10.6 – Local Presence • This requirement is already included in
the Guideline on Foreign Participation
in the Distributive Trade Services
Malaysia (Amendment) 2010 and the
Guideline on Convenience Stores with
Foreign Interest 2014
• No impact
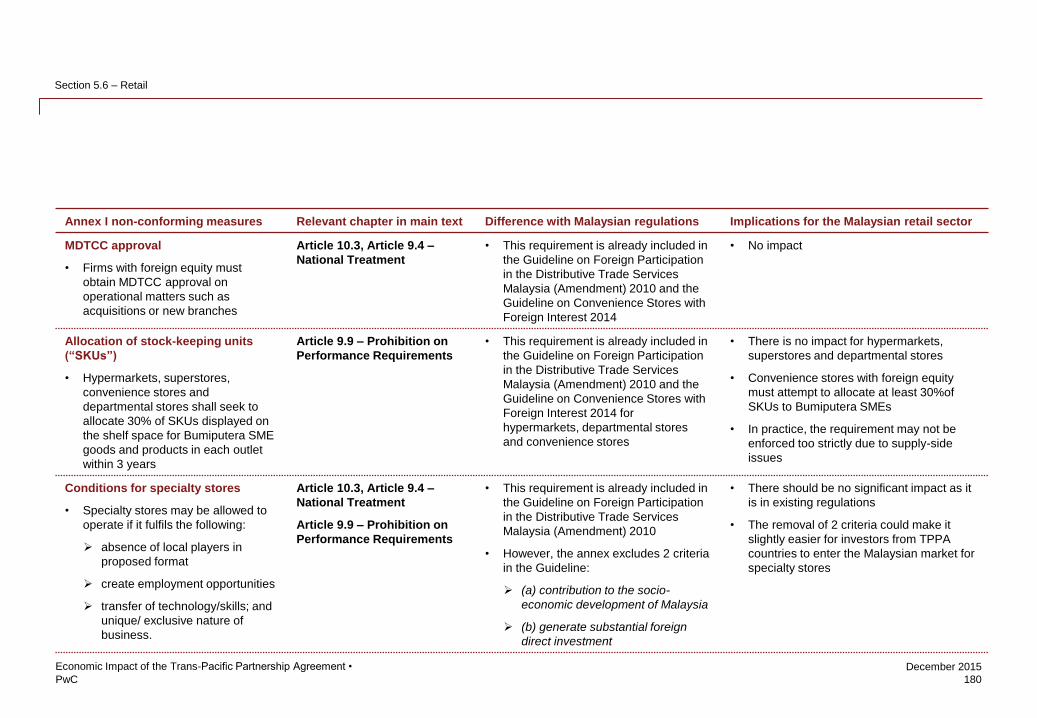
PwC
December 2015
180
Economic Impact of the Trans-Pacific Partnership Agreement •
Section 5.6 – Retail
Annex I non-conforming measures Relevant chapter in main text Difference with Malaysian regulations Implications for the Malaysian retail sector
MDTCC approval
• Firms with foreign equity must
obtain MDTCC approval on
operational matters such as
acquisitions or new branches
Article 10.3, Article 9.4 –
National Treatment
• This requirement is already included in
the Guideline on Foreign Participation
in the Distributive Trade Services
Malaysia (Amendment) 2010 and the
Guideline on Convenience Stores with
Foreign Interest 2014
• No impact
Allocation of stock-keeping units
(“SKUs”)
• Hypermarkets, superstores,
convenience stores and
departmental stores shall seek to
allocate 30% of SKUs displayed on
the shelf space for Bumiputera SME
goods and products in each outlet
within 3 years
Article 9.9 – Prohibition on
Performance Requirements
• This requirement is already included in
the Guideline on Foreign Participation
in the Distributive Trade Services
Malaysia (Amendment) 2010 and the
Guideline on Convenience Stores with
Foreign Interest 2014 for
hypermarkets, departmental stores
and convenience stores
• There is no impact for hypermarkets,
superstores and departmental stores
• Convenience stores with foreign equity
must attempt to allocate at least 30%of
SKUs to Bumiputera SMEs
• In practice, the requirement may not be
enforced too strictly due to supply-side
issues
Conditions for specialty stores
• Specialty stores may be allowed to
operate if it fulfils the following:
absence of local players in
proposed format
create employment opportunities
transfer of technology/skills; and
unique/ exclusive nature of
business.
Article 10.3, Article 9.4 –
National Treatment
Article 9.9 – Prohibition on
Performance Requirements
• This requirement is already included in
the Guideline on Foreign Participation
in the Distributive Trade Services
Malaysia (Amendment) 2010
• However, the annex excludes 2 criteria
in the Guideline:
(a) contribution to the socio-
economic development of Malaysia
(b) generate substantial foreign
direct investment
• There should be no significant impact as it
is in existing regulations
• The removal of 2 criteria could make it
slightly easier for investors from TPPA
countries to enter the Malaysian market for
specialty stores
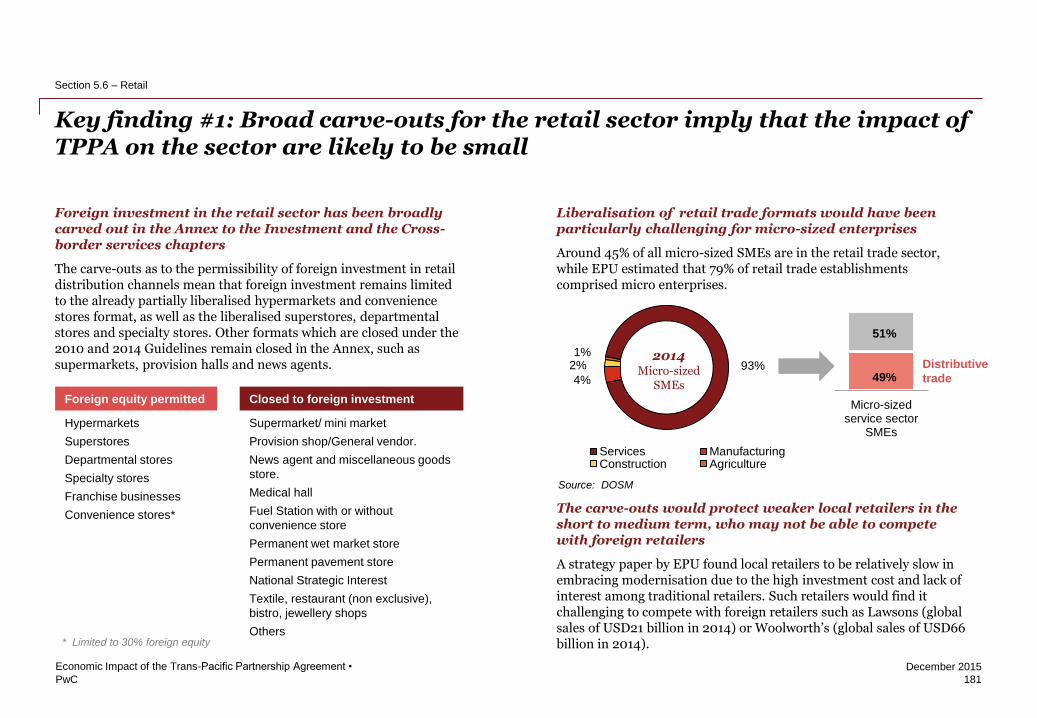
PwC
December 2015
Foreign investment in the retail sector has been broadly carved out in the Annex to the Investment and the Cross-border services chapters
The carve-outs as to the permissibility of foreign investment in retail distribution channels mean that foreign investment remains limited to the already partially liberalised hypermarkets and convenience stores format, as well as the liberalised superstores, departmental stores and specialty stores. Other formats which are closed under the 2010 and 2014 Guidelines remain closed in the Annex, such as supermarkets, provision halls and news agents.
Liberalisation of retail trade formats would have been particularly challenging for micro-sized enterprises
Around 45% of all micro-sized SMEs are in the retail trade sector, while EPU estimated that 79% of retail trade establishments comprised micro enterprises.
The carve-outs would protect weaker local retailers in the short to medium term, who may not be able to compete with foreign retailers
A strategy paper by EPU found local retailers to be relatively slow in embracing modernisation due to the high investment cost and lack of interest among traditional retailers. Such retailers would find it challenging to compete with foreign retailers such as Lawsons (global sales of USD21 billion in 2014) or Woolworth’s (global sales of USD66 billion in 2014).
Key finding #1: Broad carve-outs for the retail sector imply that the impact of TPPA on the sector are likely to be small
181
Economic Impact of the Trans-Pacific Partnership Agreement •
Section 5.6 – Retail
In 2013, the productivity level of
wholesale and retail trade at
RM51,103 was below that of
services sector, and four times
below that of Australia, Singapore
and the United States.
Given that 79% of retail trade
establishments comprised micro
enterprises, they are relatively slow
in embracing modernisation due to
high investment cost and lack of
interest among traditional retailers
and cooperatives. Malaysian
retailers, particularly SMEs tend to
be inward looking since domestic
market is deemed to offer sufficient
opportunities and lack capacity to
venture abroad.
93%
4%
2% 1%
Services ManufacturingConstruction Agriculture
2014 Micro-sized
SMEs
Distributive
trade
Micro-sizedservice sector
SMEs
51%
49%
Foreign equity permitted Closed to foreign investment
Hypermarkets
Superstores
Departmental stores
Specialty stores
Franchise businesses
Convenience stores*
Supermarket/ mini market
Provision shop/General vendor.
News agent and miscellaneous goods
store.
Medical hall
Fuel Station with or without
convenience store
Permanent wet market store
Permanent pavement store
National Strategic Interest
Textile, restaurant (non exclusive),
bistro, jewellery shops
Others * Limited to 30% foreign equity
Source: DOSM
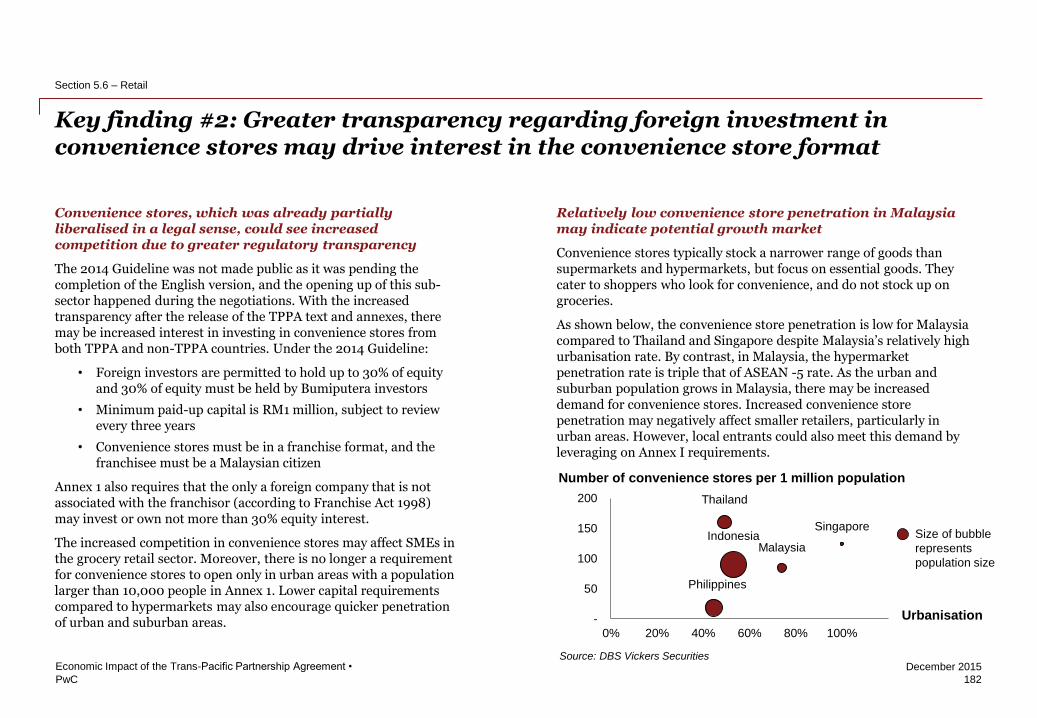
PwC
December 2015
Convenience stores, which was already partially liberalised in a legal sense, could see increased competition due to greater regulatory transparency
The 2014 Guideline was not made public as it was pending the completion of the English version, and the opening up of this sub-sector happened during the negotiations. With the increased transparency after the release of the TPPA text and annexes, there may be increased interest in investing in convenience stores from both TPPA and non-TPPA countries. Under the 2014 Guideline:
• Foreign investors are permitted to hold up to 30% of equity and 30% of equity must be held by Bumiputera investors
• Minimum paid-up capital is RM1 million, subject to review every three years
• Convenience stores must be in a franchise format, and the franchisee must be a Malaysian citizen
Annex 1 also requires that the only a foreign company that is not associated with the franchisor (according to Franchise Act 1998) may invest or own not more than 30% equity interest.
The increased competition in convenience stores may affect SMEs in the grocery retail sector. Moreover, there is no longer a requirement for convenience stores to open only in urban areas with a population larger than 10,000 people in Annex 1. Lower capital requirements compared to hypermarkets may also encourage quicker penetration of urban and suburban areas.
Relatively low convenience store penetration in Malaysia may indicate potential growth market
Convenience stores typically stock a narrower range of goods than supermarkets and hypermarkets, but focus on essential goods. They cater to shoppers who look for convenience, and do not stock up on groceries.
As shown below, the convenience store penetration is low for Malaysia compared to Thailand and Singapore despite Malaysia’s relatively high urbanisation rate. By contrast, in Malaysia, the hypermarket penetration rate is triple that of ASEAN -5 rate. As the urban and suburban population grows in Malaysia, there may be increased demand for convenience stores. Increased convenience store penetration may negatively affect smaller retailers, particularly in urban areas. However, local entrants could also meet this demand by leveraging on Annex I requirements.
Key finding #2: Greater transparency regarding foreign investment in convenience stores may drive interest in the convenience store format
182
Economic Impact of the Trans-Pacific Partnership Agreement •
Section 5.6 – Retail
In 2013, the productivity level of
wholesale and retail trade at
RM51,103 was below that of
services sector, and four times
below that of Australia, Singapore
and the United States.
Given that 79% of retail trade
establishments comprised micro
enterprises, they are relatively slow
in embracing modernisation due to
high investment cost and lack of
interest among traditional retailers
and cooperatives. Malaysian
retailers, particularly SMEs tend to
be inward looking since domestic
market is deemed to offer sufficient
opportunities and lack capacity to
venture abroad.
• Franchisee issue
• Limit on foreign
• Insistence on bumiputera
Liberalisation of convenience stores will be particularly challenging for micro-
sized enterprises (turnover less thanRM300,000 or less than 5 workers).
EPU estimated that 79% of retail trade establishments comprised micro enterprises.
Micro-sized establishments in Malaysia are typically dominated by Bumiputera
entrepreneurs. The majority of Bumiputera SMEs are micro-sized, representing 44%
of all micro-sized SMEs. Bumiputera SMEs make up only 20% of small and medium-
sized SMEs.
• Show low prevalence of
convenience stores
• DBS reports on
convenience store growth
• Lawson
Singapore
Malaysia
Thailand
Indonesia
Philippines
-
50
100
150
200
0% 20% 40% 60% 80% 100% 120%
Number of convenience stores per 1 million population
Urbanisation
Size of bubble
represents
population size
Source: DBS Vickers Securities
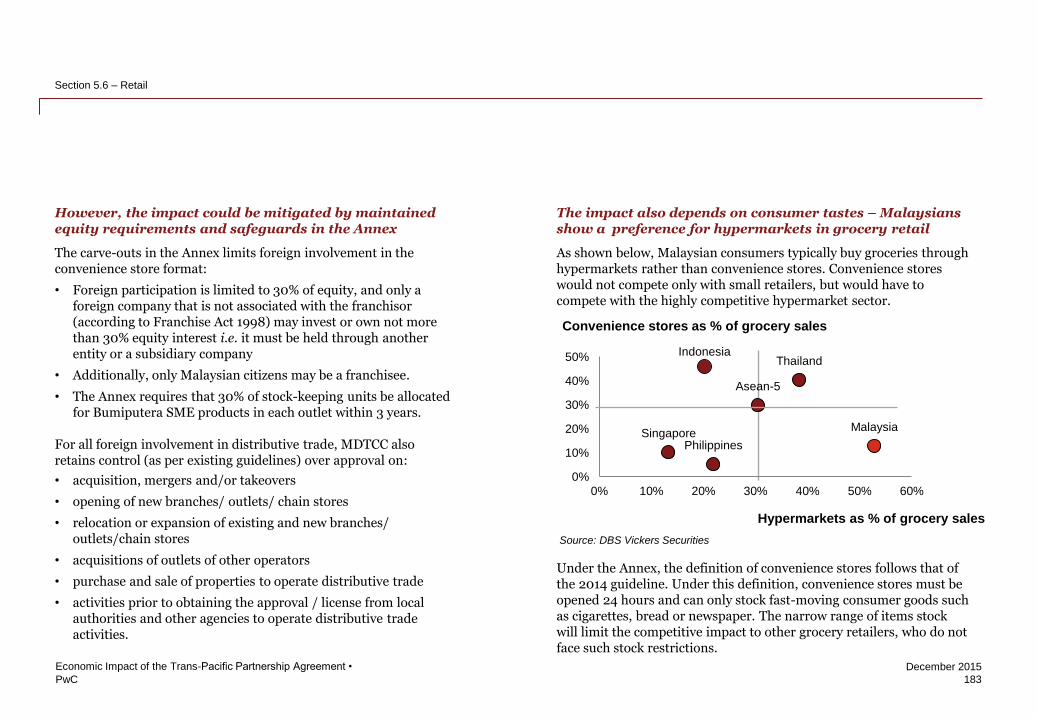
PwC
December 2015
However, the impact could be mitigated by maintained equity requirements and safeguards in the Annex
The carve-outs in the Annex limits foreign involvement in the convenience store format:
• Foreign participation is limited to 30% of equity, and only a foreign company that is not associated with the franchisor (according to Franchise Act 1998) may invest or own not more than 30% equity interest i.e. it must be held through another entity or a subsidiary company
• Additionally, only Malaysian citizens may be a franchisee.
• The Annex requires that 30% of stock-keeping units be allocated for Bumiputera SME products in each outlet within 3 years.
For all foreign involvement in distributive trade, MDTCC also retains control (as per existing guidelines) over approval on:
• acquisition, mergers and/or takeovers
• opening of new branches/ outlets/ chain stores
• relocation or expansion of existing and new branches/ outlets/chain stores
• acquisitions of outlets of other operators
• purchase and sale of properties to operate distributive trade
• activities prior to obtaining the approval / license from local authorities and other agencies to operate distributive trade activities.
The impact also depends on consumer tastes – Malaysians show a preference for hypermarkets in grocery retail
As shown below, Malaysian consumers typically buy groceries through hypermarkets rather than convenience stores. Convenience stores would not compete only with small retailers, but would have to compete with the highly competitive hypermarket sector.
Under the Annex, the definition of convenience stores follows that of the 2014 guideline. Under this definition, convenience stores must be opened 24 hours and can only stock fast-moving consumer goods such as cigarettes, bread or newspaper. The narrow range of items stock will limit the competitive impact to other grocery retailers, who do not face such stock restrictions.
183
Economic Impact of the Trans-Pacific Partnership Agreement •
Section 5.6 – Retail
In 2013, the productivity level of
wholesale and retail trade at
RM51,103 was below that of
services sector, and four times
below that of Australia, Singapore
and the United States.
Given that 79% of retail trade
establishments comprised micro
enterprises, they are relatively slow
in embracing modernisation due to
high investment cost and lack of
interest among traditional retailers
and cooperatives. Malaysian
retailers, particularly SMEs tend to
be inward looking since domestic
market is deemed to offer sufficient
opportunities and lack capacity to
venture abroad.
• Franchisee issue
• Limit on foreign
• Insistence on bumiputera
Liberalisation of convenience stores will be particularly challenging for micro-
sized enterprises (turnover less thanRM300,000 or less than 5 workers).
EPU estimated that 79% of retail trade establishments comprised micro enterprises.
Micro-sized establishments in Malaysia are typically dominated by Bumiputera
entrepreneurs. The majority of Bumiputera SMEs are micro-sized, representing 44%
of all micro-sized SMEs. Bumiputera SMEs make up only 20% of small and medium-
sized SMEs.
• Show low prevalence of
convenience stores
• DBS reports on
convenience store growth
• Lawson
Indonesia
Malaysia
Philippines Singapore
Thailand
Asean-5
0%
10%
20%
30%
40%
50%
0% 10% 20% 30% 40% 50% 60%
Convenience stores as % of grocery sales
Hypermarkets as % of grocery sales
Source: DBS Vickers Securities
PwC
December 2015
The minimum 30% Bumiputera equity requirement for hypermarkets and convenience stores is retained
This would be line with the current national agenda to increase Bumiputera equity in the Malaysian economy. Wholesale and retail trade is also one of the ten sectors that the Government (through TERAJU) is focusing on to boost Bumiputera corporate equity. Currently, Bumiputera equity (including GLCs) in the overall distributive trade sector is 31.3%.
Annex I maintains a minimum capital investment of RM50 million for hypermarkets. In practice, the scale of capital investment required in hypermarkets means that finding a local partner could be challenging. GCH (owner of Giant) did not have a local partner from 2001 until recently due to limited local funding. AEON BiG obtained a one-year extension in September 2015 to find a local partner.
The 30% Bumiputera equity requirements in convenience stores would be more easily enforced, given the lower minimum capital requirements of RM1 million - under the 2014 guidelines, convenience stores must be less than 140 m2.
Nationality and ethnicity requirements for firms with foreign equity remain
The following requirements from the 2010 Guideline for firms in distributive trade with foreign equity remain in the Annex:
• appoint Bumiputera director/directors
• hire personnel at all levels including management to reflect the racial composition of the Malaysian population
• formulate clear policies and plans to assist Bumiputera participation in the distributive trade sector
These requirements apply for distributive trade firms with any foreign equity.
Key finding #3: Policies that encourage Bumiputera participation in retail trade are broadly maintained
184
Economic Impact of the Trans-Pacific Partnership Agreement •
Section 5.6 – Retail
Source: MDTCC
Foreign Local
Syarikat Pesaka Antah
Sdn Bhd GCH Sdn Bhd
Sime Darby Berhad Tesco PLC
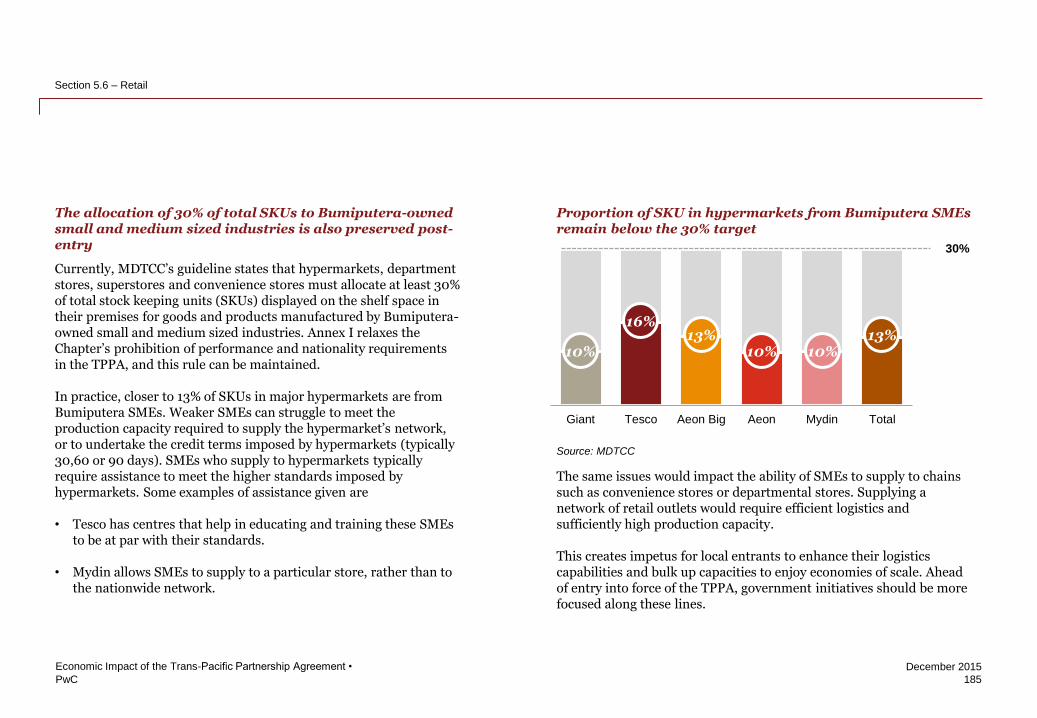
PwC
December 2015
The allocation of 30% of total SKUs to Bumiputera-owned small and medium sized industries is also preserved post-entry
Currently, MDTCC’s guideline states that hypermarkets, department stores, superstores and convenience stores must allocate at least 30% of total stock keeping units (SKUs) displayed on the shelf space in their premises for goods and products manufactured by Bumiputera-owned small and medium sized industries. Annex I relaxes the Chapter’s prohibition of performance and nationality requirements in the TPPA, and this rule can be maintained.
In practice, closer to 13% of SKUs in major hypermarkets are from Bumiputera SMEs. Weaker SMEs can struggle to meet the production capacity required to supply the hypermarket’s network, or to undertake the credit terms imposed by hypermarkets (typically 30,60 or 90 days). SMEs who supply to hypermarkets typically require assistance to meet the higher standards imposed by hypermarkets. Some examples of assistance given are
• Tesco has centres that help in educating and training these SMEs to be at par with their standards.
• Mydin allows SMEs to supply to a particular store, rather than to the nationwide network.
Proportion of SKU in hypermarkets from Bumiputera SMEs remain below the 30% target
The same issues would impact the ability of SMEs to supply to chains such as convenience stores or departmental stores. Supplying a network of retail outlets would require efficient logistics and sufficiently high production capacity.
This creates impetus for local entrants to enhance their logistics capabilities and bulk up capacities to enjoy economies of scale. Ahead of entry into force of the TPPA, government initiatives should be more focused along these lines.
185
Economic Impact of the Trans-Pacific Partnership Agreement •
Section 5.6 – Retail
Source: MDTCC
Giant Tesco Aeon Big Aeon Mydin Total
10%
16% 13%
10% 10% 13%
30%
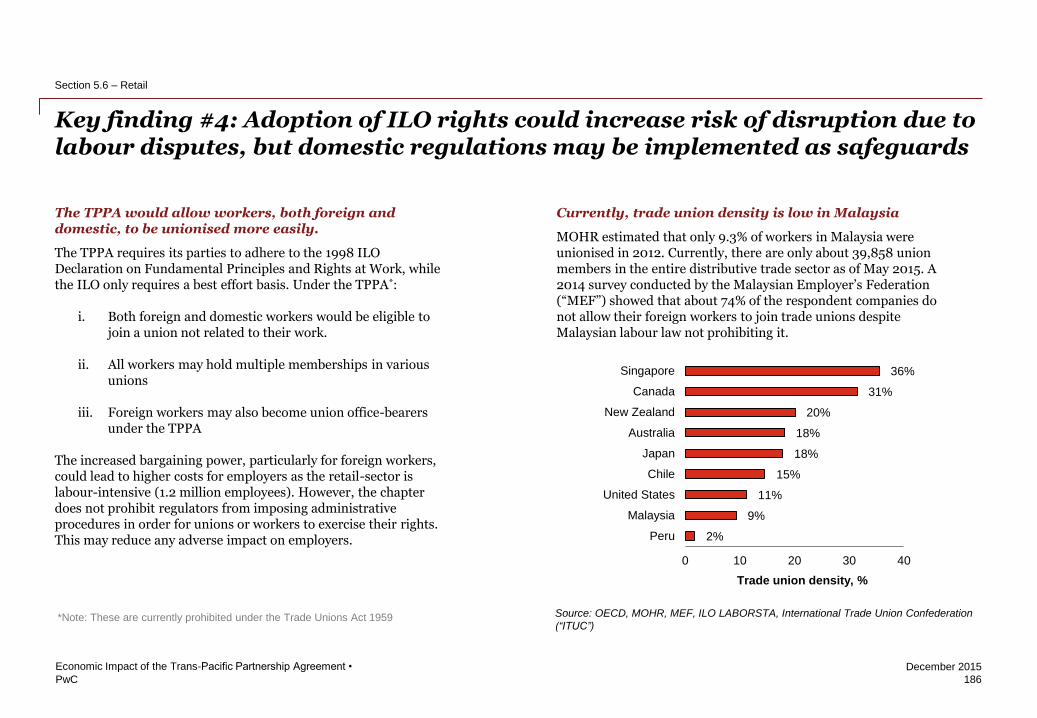
PwC
December 2015
The TPPA would allow workers, both foreign and domestic, to be unionised more easily.
The TPPA requires its parties to adhere to the 1998 ILO Declaration on Fundamental Principles and Rights at Work, while the ILO only requires a best effort basis. Under the TPPA*:
i. Both foreign and domestic workers would be eligible to join a union not related to their work.
ii. All workers may hold multiple memberships in various unions
iii. Foreign workers may also become union office-bearers under the TPPA
The increased bargaining power, particularly for foreign workers, could lead to higher costs for employers as the retail-sector is labour-intensive (1.2 million employees). However, the chapter does not prohibit regulators from imposing administrative procedures in order for unions or workers to exercise their rights. This may reduce any adverse impact on employers.
Currently, trade union density is low in Malaysia
MOHR estimated that only 9.3% of workers in Malaysia were unionised in 2012. Currently, there are only about 39,858 union members in the entire distributive trade sector as of May 2015. A 2014 survey conducted by the Malaysian Employer’s Federation (“MEF”) showed that about 74% of the respondent companies do not allow their foreign workers to join trade unions despite Malaysian labour law not prohibiting it.
Key finding #4: Adoption of ILO rights could increase risk of disruption due to labour disputes, but domestic regulations may be implemented as safeguards
186
Economic Impact of the Trans-Pacific Partnership Agreement •
Section 5.6 – Retail
*Note: These are currently prohibited under the Trade Unions Act 1959
2%
9%
11%
15%
18%
18%
20%
31%
36%
0 10 20 30 40
Peru
Malaysia
United States
Chile
Japan
Australia
New Zealand
Canada
Singapore
Trade union density, %
ITUC 2014 ranking
Repeated
violation of rights
Regular violation
of rights
Systematic
violation of rights
No guarantee of
rights
Source: OECD, MOHR, MEF, ILO LABORSTA, International Trade Union Confederation
(“ITUC”)
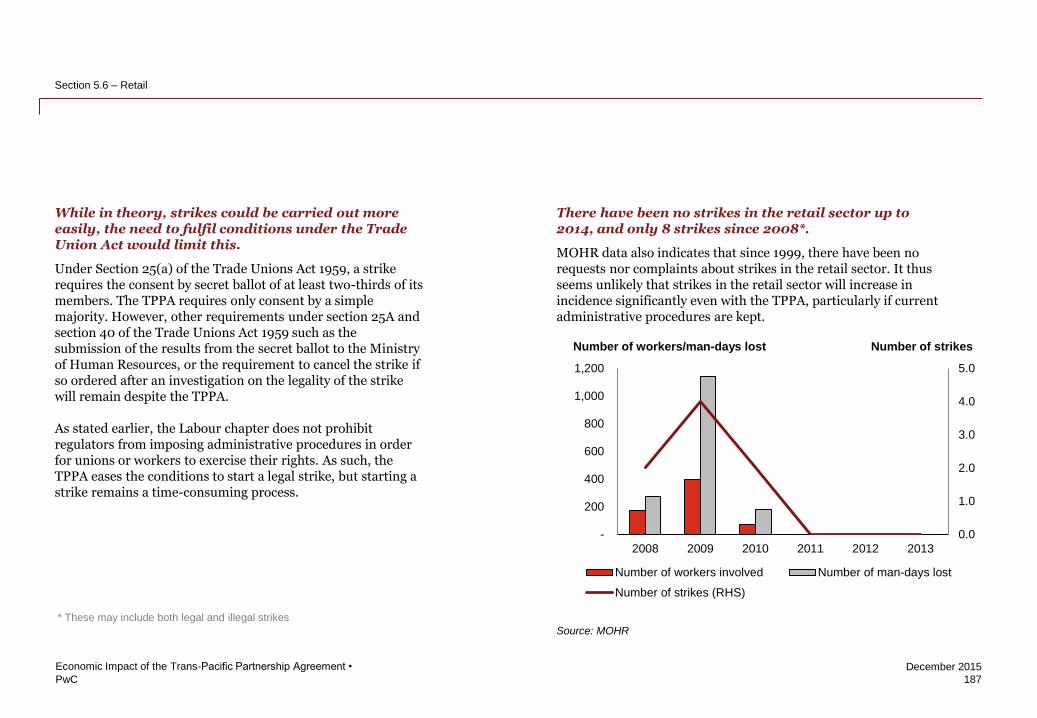
PwC
December 2015
There have been no strikes in the retail sector up to 2014, and only 8 strikes since 2008*.
MOHR data also indicates that since 1999, there have been no requests nor complaints about strikes in the retail sector. It thus seems unlikely that strikes in the retail sector will increase in incidence significantly even with the TPPA, particularly if current administrative procedures are kept.
187
Economic Impact of the Trans-Pacific Partnership Agreement •
Section 5.6 – Retail
Source: MOHR
While in theory, strikes could be carried out more easily, the need to fulfil conditions under the Trade Union Act would limit this.
Under Section 25(a) of the Trade Unions Act 1959, a strike requires the consent by secret ballot of at least two-thirds of its members. The TPPA requires only consent by a simple majority. However, other requirements under section 25A and section 40 of the Trade Unions Act 1959 such as the submission of the results from the secret ballot to the Ministry of Human Resources, or the requirement to cancel the strike if so ordered after an investigation on the legality of the strike will remain despite the TPPA.
As stated earlier, the Labour chapter does not prohibit regulators from imposing administrative procedures in order for unions or workers to exercise their rights. As such, the TPPA eases the conditions to start a legal strike, but starting a strike remains a time-consuming process.
0.0
1.0
2.0
3.0
4.0
5.0
-
200
400
600
800
1,000
1,200
2008 2009 2010 2011 2012 2013
Number of workers involved Number of man-days lost
Number of strikes (RHS)
Number of strikes Number of workers/man-days lost
* These may include both legal and illegal strikes

PwC
December 2015
Key finding #5: The retail sector would have increased access to consumers in the TPPA region, which has a combined GDP of USD28 trillion
188
Economic Impact of the Trans-Pacific Partnership Agreement •
Section 5.6 – Retail
Saturated domestic market signals room for expansion overseas.
Malaysia’s scores in the 2014 Global Retail Development Index by A.T. Kearney indicate high levels for both market attractiveness and saturation. This indicates strong competition domestically, and a need for local players to venture abroad for further growth. The potential consumer base for the TPPA is significant, with a population of 809 million people. Retail sale for the TPPA in 2014 was approximately USD6.6 trillion; by comparison, the domestic market in Malaysia in 2014 was USD0.1 trillion. Oxford Economics project retail sales to increase by almost 50% to USD10 trillion by 2024 (around 4.2% per year). Vietnam was projected to have the highest average growth rate in retail sales at 9.5% per annum.
The TPPA reduces regulations for foreign investment in the retail sector in other TPPA countries
Pre-TPPA, foreigners were allowed on a case-by-case basis for the retail sector in Brunei where the level of foreign equity may vary according to the type of activities. There are no carve-outs in Annex I or Annex II for retail (except for tobacco products), indicating liberalisation of the retail trade sector. Australia also removed limitations for retail trade, but reserved the right to adopt measures for tobacco, alcohol and firearms in Annex 2. However, given geographical proximity as well as growth opportunities, Vietnam is likely to be of most interest to Malaysian retailers.
Source: Oxford Economics, World Bank
Retail sales in selected TPPA countries, USD billion
107 94
3,789
257
Malaysia Vietnam US Australia
249 232
5,734
433
2014 retail sales 2024 retail sales
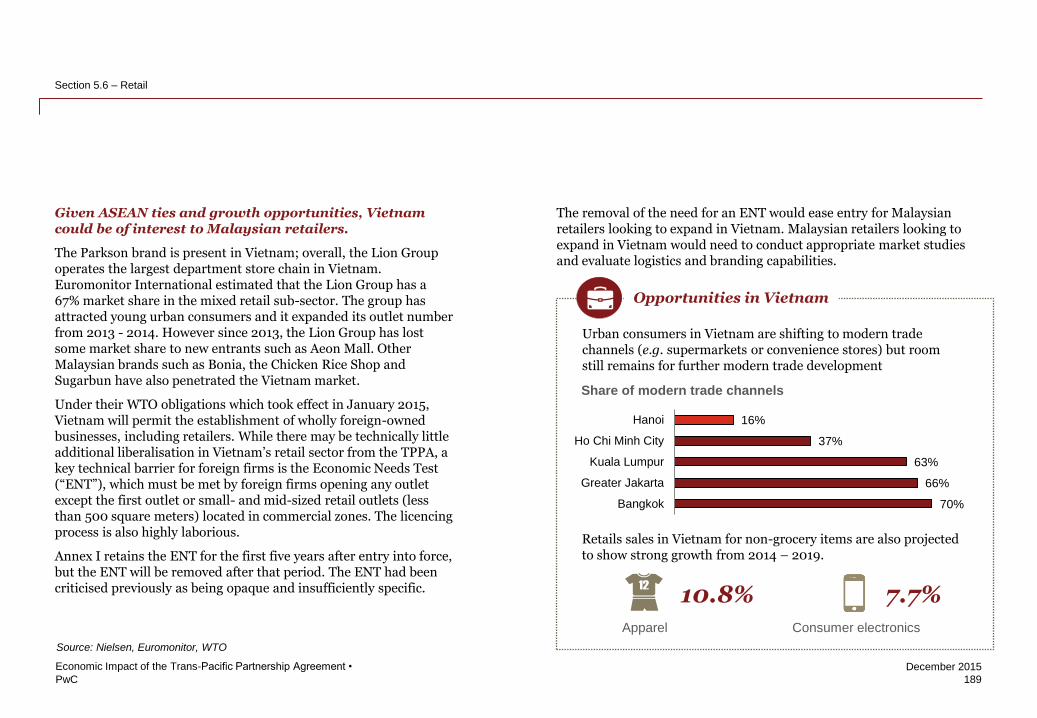
PwC
December 2015
189
Economic Impact of the Trans-Pacific Partnership Agreement •
Section 5.6 – Retail
Given ASEAN ties and growth opportunities, Vietnam could be of interest to Malaysian retailers.
The Parkson brand is present in Vietnam; overall, the Lion Group operates the largest department store chain in Vietnam. Euromonitor International estimated that the Lion Group has a 67% market share in the mixed retail sub-sector. The group has attracted young urban consumers and it expanded its outlet number from 2013 - 2014. However since 2013, the Lion Group has lost some market share to new entrants such as Aeon Mall. Other Malaysian brands such as Bonia, the Chicken Rice Shop and Sugarbun have also penetrated the Vietnam market.
Under their WTO obligations which took effect in January 2015, Vietnam will permit the establishment of wholly foreign-owned businesses, including retailers. While there may be technically little additional liberalisation in Vietnam’s retail sector from the TPPA, a key technical barrier for foreign firms is the Economic Needs Test (“ENT”), which must be met by foreign firms opening any outlet except the first outlet or small- and mid-sized retail outlets (less than 500 square meters) located in commercial zones. The licencing process is also highly laborious.
Annex I retains the ENT for the first five years after entry into force, but the ENT will be removed after that period. The ENT had been criticised previously as being opaque and insufficiently specific.
Source: Nielsen, Euromonitor, WTO
Modern retail in Vietnam (as
opposed to traditional markets)
attracts about 20 to 25% of
consumer spending, compared
with 46% in Thailand and 53% in
Malaysia according to the Vietnam
Retailers Association. This has
attracted strong interest from
global retailers, such as Lotte and
Aeon.
Opportunities in Vietnam
Urban consumers in Vietnam are shifting to modern trade channels (e.g. supermarkets or convenience stores) but room still remains for further modern trade development
70%
66%
63%
37%
16%
Bangkok
Greater Jakarta
Kuala Lumpur
Ho Chi Minh City
Hanoi
Share of modern trade channels
Retails sales in Vietnam for non-grocery items are also projected to show strong growth from 2014 – 2019.
10.8%
Apparel
7.7%
Consumer electronics
In Vietnam, Malaysia could
have an additional advantage
over both non-TPPA ASEAN
members and non-ASEAN
TPPA members, as Malaysia
would enjoy the benefits of
both the AEC and the TPPA.
The removal of the need for an ENT would ease entry for Malaysian retailers looking to expand in Vietnam. Malaysian retailers looking to expand in Vietnam would need to conduct appropriate market studies and evaluate logistics and branding capabilities.
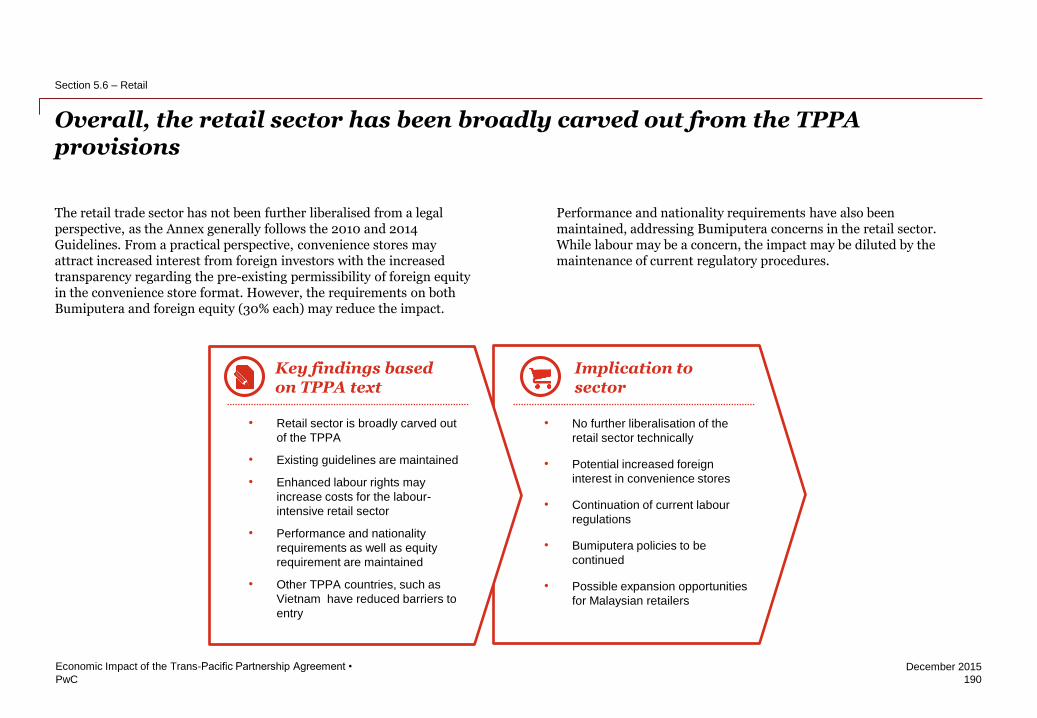
PwC
December 2015
Performance and nationality requirements have also been maintained, addressing Bumiputera concerns in the retail sector. While labour may be a concern, the impact may be diluted by the maintenance of current regulatory procedures.
The retail trade sector has not been further liberalised from a legal perspective, as the Annex generally follows the 2010 and 2014 Guidelines. From a practical perspective, convenience stores may attract increased interest from foreign investors with the increased transparency regarding the pre-existing permissibility of foreign equity in the convenience store format. However, the requirements on both Bumiputera and foreign equity (30% each) may reduce the impact.
Overall, the retail sector has been broadly carved out from the TPPA provisions
190
Economic Impact of the Trans-Pacific Partnership Agreement •
Section 5.6 – Retail
Key findings based on TPPA text
Implication to sector
• Retail sector is broadly carved out
of the TPPA
• Existing guidelines are maintained
• Enhanced labour rights may
increase costs for the labour-
intensive retail sector
• Performance and nationality
requirements as well as equity
requirement are maintained
• Other TPPA countries, such as
Vietnam have reduced barriers to
entry
• No further liberalisation of the
retail sector technically
• Potential increased foreign
interest in convenience stores
• Continuation of current labour
regulations
• Bumiputera policies to be
continued
• Possible expansion opportunities
for Malaysian retailers

PwC
December 2015
There are 690 component manufacturers producing wide range of components, such as body panels, brake parts, engine parts, transmission and steering parts, rubber parts, and electrical and electronic parts. Malaysia is currently the third largest automotive market in ASEAN, positioned behind Thailand and Indonesia.
The National Automotive Policy (“NAP”) has been introduced with the ambition to transform and integrate the local industry to regional and global industry networks. The NAP has partially liberalised the automotive sector by allowing foreign investors to hold the Manufacturing License for certain vehicle categories such as luxury vehicles and Energy Efficient Vehicles (“EEV”).
The automotive industry contributes 4% to GDP on average from 2005 to 2014. In 2014, sales volume of Passenger Vehicles contributed 88% of Total Industry Volume, which mainly constitutes passenger cars. Sales of these vehicles are primarily driven by local market consumption.
There are currently 28 manufacturing and assembly plants with a total installed capacity of 963,000 passenger and commercial vehicles and 1 million motorcycles per year – covering both local makes (i.e. PROTON and Perodua) and international makes (i.e. Toyota, Honda, Nissan, etc.).
Automotive sector contributes an average of 4% to GDP, mainly driven by the production of passenger vehicles
191
Economic Impact of the Trans-Pacific Partnership Agreement •
Section 5.7 – Automotive
0.0%
2.0%
4.0%
6.0%
8.0%
10.0%
-
10
20
30
40
50
2005 2008 2011 2014
Motor vehicles Motor vehicles as % of GDP
% of GDP GDP, RM billion
Automotive sector contribution to GDP
Source: DOSM
12% 69%
14% 4%
1%
Passenger vehicles,
88%
Commercial vehicles Passenger cars MPVs SUVs Window vans
Total Industry Volume of 666,465 units in 2014
Source: MAA
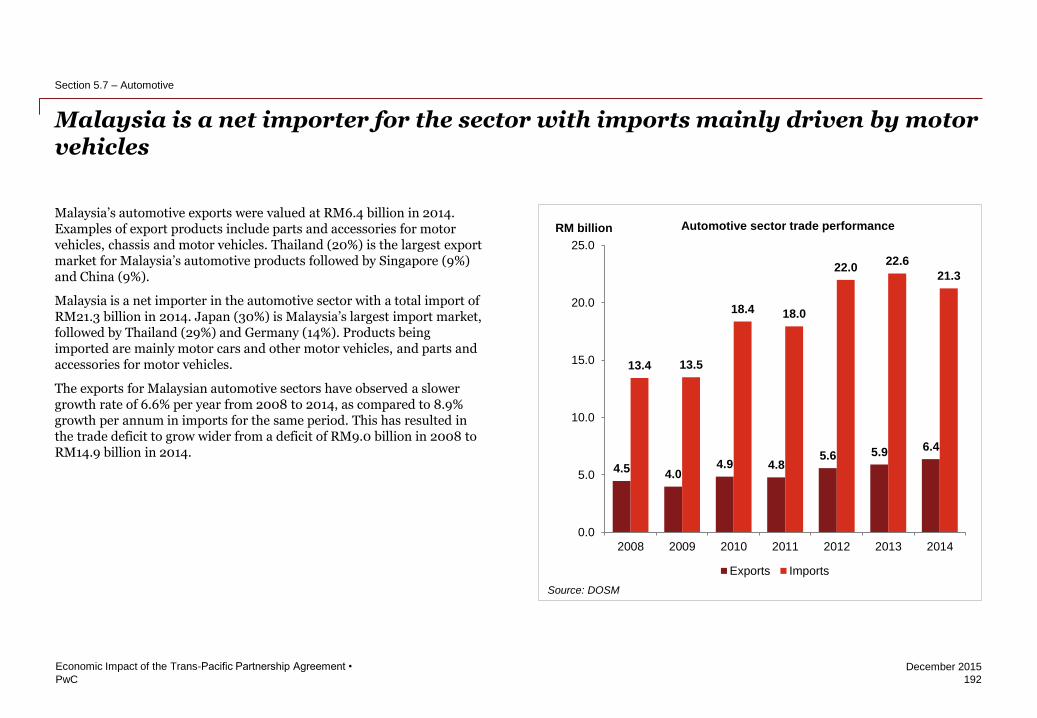
PwC
December 2015
Malaysia is a net importer for the sector with imports mainly driven by motor vehicles
192
Economic Impact of the Trans-Pacific Partnership Agreement •
Section 5.7 – Automotive
Malaysia’s automotive exports were valued at RM6.4 billion in 2014. Examples of export products include parts and accessories for motor vehicles, chassis and motor vehicles. Thailand (20%) is the largest export market for Malaysia’s automotive products followed by Singapore (9%) and China (9%).
Malaysia is a net importer in the automotive sector with a total import of RM21.3 billion in 2014. Japan (30%) is Malaysia’s largest import market, followed by Thailand (29%) and Germany (14%). Products being imported are mainly motor cars and other motor vehicles, and parts and accessories for motor vehicles.
The exports for Malaysian automotive sectors have observed a slower growth rate of 6.6% per year from 2008 to 2014, as compared to 8.9% growth per annum in imports for the same period. This has resulted in the trade deficit to grow wider from a deficit of RM9.0 billion in 2008 to RM14.9 billion in 2014.
4.5 4.0
4.9 4.8 5.6 5.9 6.4
13.4 13.5
18.4 18.0
22.0 22.6
21.3
0.0
5.0
10.0
15.0
20.0
25.0
2008 2009 2010 2011 2012 2013 2014
Exports Imports
RM billion Automotive sector trade performance
Source: DOSM
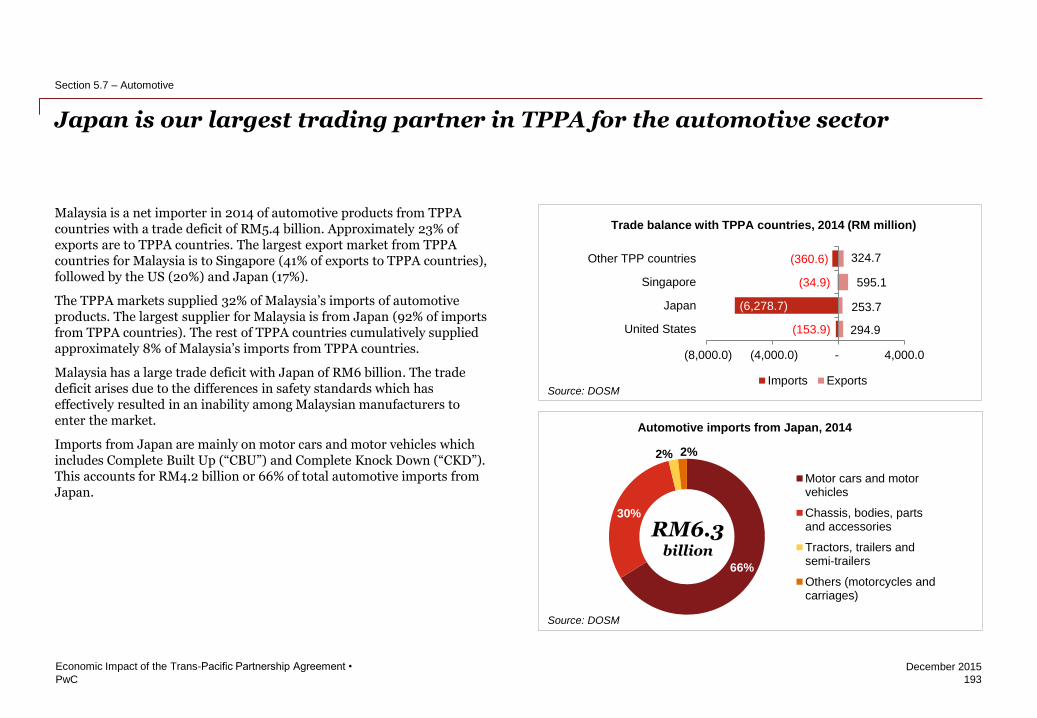
PwC
December 2015
Japan is our largest trading partner in TPPA for the automotive sector
193
Economic Impact of the Trans-Pacific Partnership Agreement •
Section 5.7 – Automotive
Malaysia is a net importer in 2014 of automotive products from TPPA countries with a trade deficit of RM5.4 billion. Approximately 23% of exports are to TPPA countries. The largest export market from TPPA countries for Malaysia is to Singapore (41% of exports to TPPA countries), followed by the US (20%) and Japan (17%).
The TPPA markets supplied 32% of Malaysia’s imports of automotive products. The largest supplier for Malaysia is from Japan (92% of imports from TPPA countries). The rest of TPPA countries cumulatively supplied approximately 8% of Malaysia’s imports from TPPA countries.
Malaysia has a large trade deficit with Japan of RM6 billion. The trade deficit arises due to the differences in safety standards which has effectively resulted in an inability among Malaysian manufacturers to enter the market.
Imports from Japan are mainly on motor cars and motor vehicles which includes Complete Built Up (“CBU”) and Complete Knock Down (“CKD”). This accounts for RM4.2 billion or 66% of total automotive imports from Japan.
Trade balance with TPPA countries, 2014 (RM million)
(153.9)
(6,278.7)
(34.9)
(360.6)
294.9
253.7
595.1
324.7
(8,000.0) (4,000.0) - 4,000.0
United States
Japan
Singapore
Other TPP countries
Imports Exports
66%
30%
2% 2%
Motor cars and motorvehicles
Chassis, bodies, partsand accessories
Tractors, trailers andsemi-trailers
Others (motorcycles andcarriages)
Automotive imports from Japan, 2014
RM6.3 billion
Source: DOSM
Source: DOSM
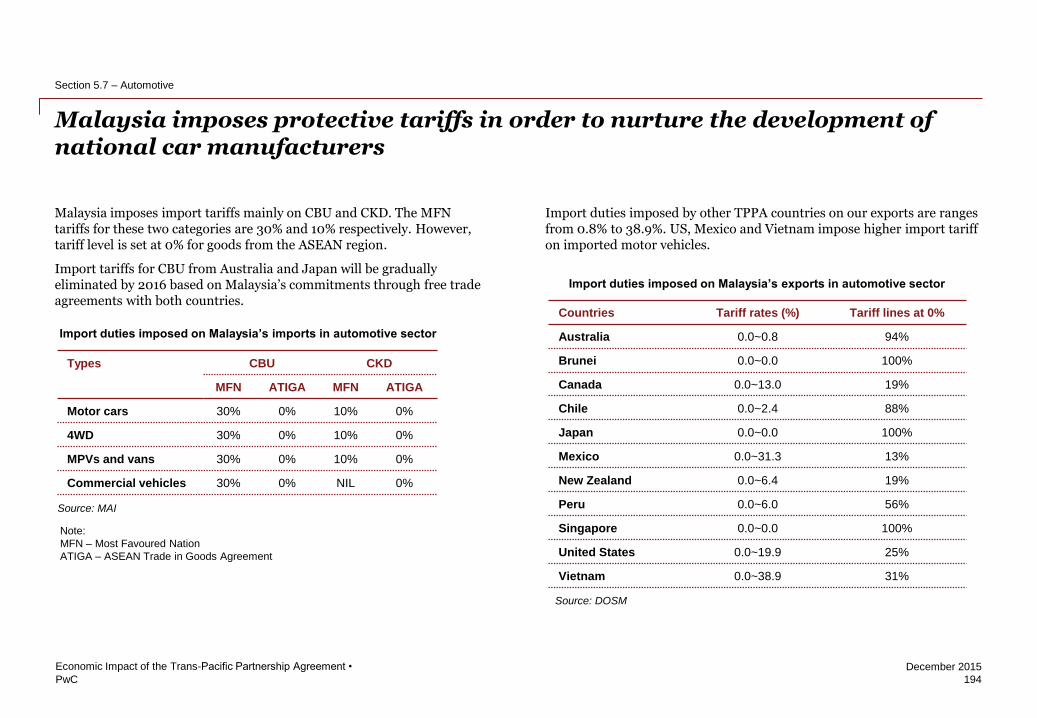
PwC
December 2015
Malaysia imposes protective tariffs in order to nurture the development of national car manufacturers
194
Economic Impact of the Trans-Pacific Partnership Agreement •
Section 5.7 – Automotive
Malaysia imposes import tariffs mainly on CBU and CKD. The MFN tariffs for these two categories are 30% and 10% respectively. However, tariff level is set at 0% for goods from the ASEAN region.
Import tariffs for CBU from Australia and Japan will be gradually eliminated by 2016 based on Malaysia’s commitments through free trade agreements with both countries.
Types CBU CKD
MFN ATIGA MFN ATIGA
Motor cars 30% 0% 10% 0%
4WD 30% 0% 10% 0%
MPVs and vans 30% 0% 10% 0%
Commercial vehicles 30% 0% NIL 0%
Import duties imposed on Malaysia’s imports in automotive sector
Countries Tariff rates (%) Tariff lines at 0%
Australia 0.0~0.8 94%
Brunei 0.0~0.0 100%
Canada 0.0~13.0 19%
Chile 0.0~2.4 88%
Japan 0.0~0.0 100%
Mexico 0.0~31.3 13%
New Zealand 0.0~6.4 19%
Peru 0.0~6.0 56%
Singapore 0.0~0.0 100%
United States 0.0~19.9 25%
Vietnam 0.0~38.9 31%
Import duties imposed by other TPPA countries on our exports are ranges from 0.8% to 38.9%. US, Mexico and Vietnam impose higher import tariff on imported motor vehicles.
Import duties imposed on Malaysia’s exports in automotive sector
Note:
MFN – Most Favoured Nation
ATIGA – ASEAN Trade in Goods Agreement
Source: MAI
Source: DOSM
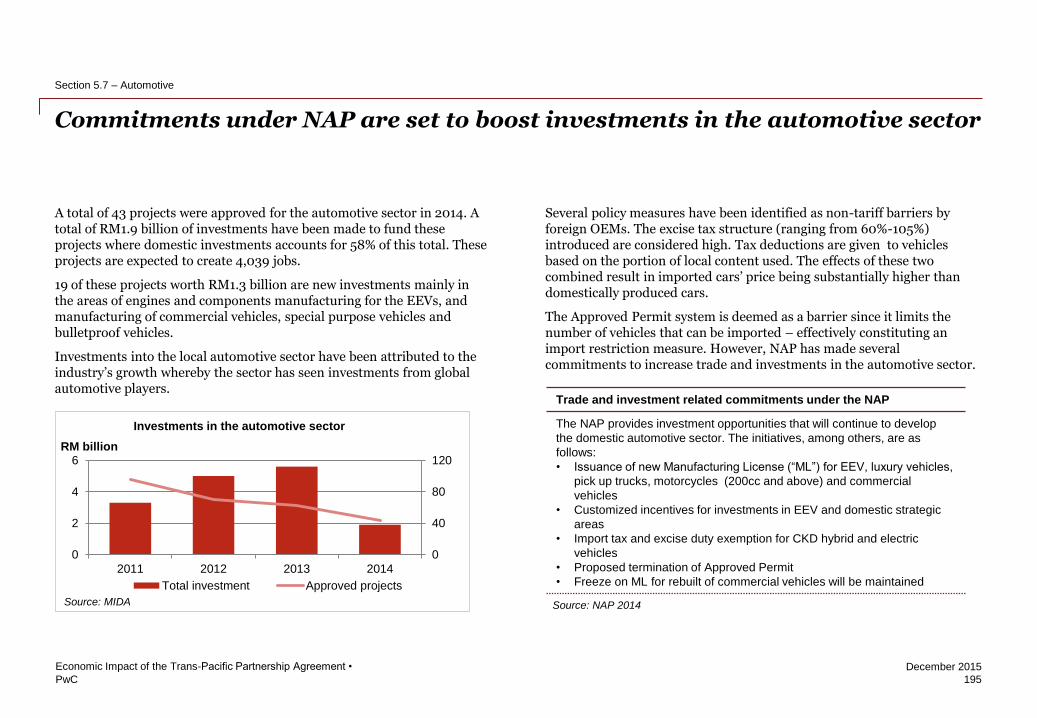
PwC
December 2015
A total of 43 projects were approved for the automotive sector in 2014. A total of RM1.9 billion of investments have been made to fund these projects where domestic investments accounts for 58% of this total. These projects are expected to create 4,039 jobs.
19 of these projects worth RM1.3 billion are new investments mainly in the areas of engines and components manufacturing for the EEVs, and manufacturing of commercial vehicles, special purpose vehicles and bulletproof vehicles.
Investments into the local automotive sector have been attributed to the industry’s growth whereby the sector has seen investments from global automotive players.
Commitments under NAP are set to boost investments in the automotive sector
195
Economic Impact of the Trans-Pacific Partnership Agreement •
Section 5.7 – Automotive
Several policy measures have been identified as non-tariff barriers by foreign OEMs. The excise tax structure (ranging from 60%-105%) introduced are considered high. Tax deductions are given to vehicles based on the portion of local content used. The effects of these two combined result in imported cars’ price being substantially higher than domestically produced cars.
The Approved Permit system is deemed as a barrier since it limits the number of vehicles that can be imported – effectively constituting an import restriction measure. However, NAP has made several commitments to increase trade and investments in the automotive sector.
Trade and investment related commitments under the NAP
The NAP provides investment opportunities that will continue to develop
the domestic automotive sector. The initiatives, among others, are as
follows:
• Issuance of new Manufacturing License (“ML”) for EEV, luxury vehicles,
pick up trucks, motorcycles (200cc and above) and commercial
vehicles
• Customized incentives for investments in EEV and domestic strategic
areas
• Import tax and excise duty exemption for CKD hybrid and electric
vehicles
• Proposed termination of Approved Permit
• Freeze on ML for rebuilt of commercial vehicles will be maintained
0
40
80
120
0
2
4
6
2011 2012 2013 2014
Total investment Approved projects
Investments in the automotive sector
RM billion
Source: MIDA Source: NAP 2014
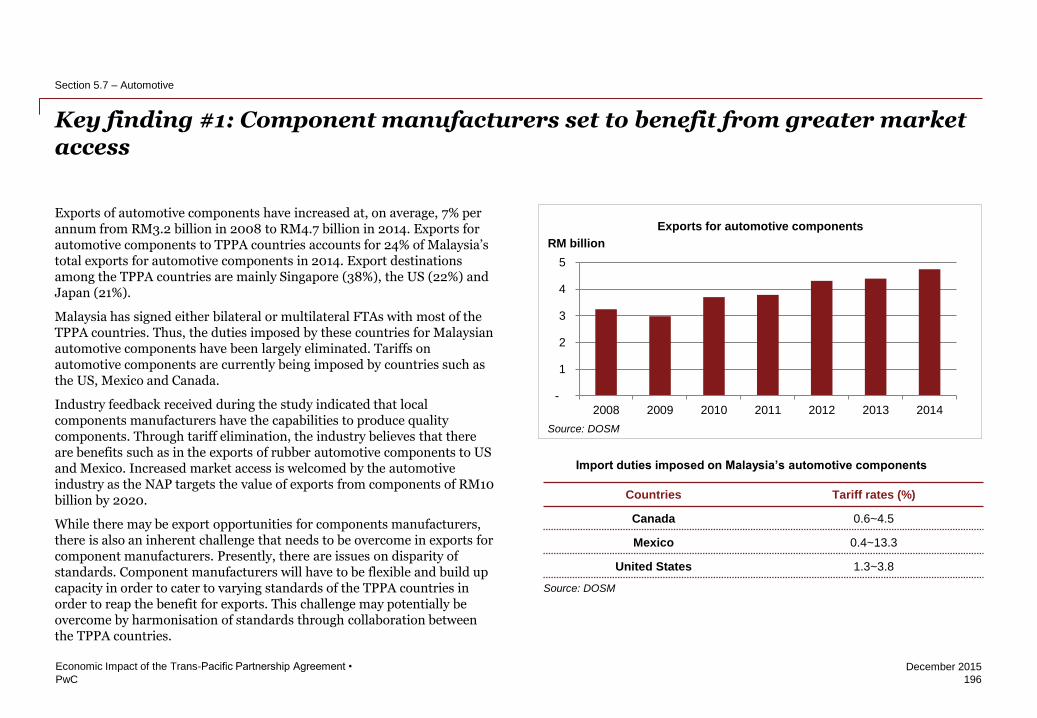
PwC
December 2015
Key finding #1: Component manufacturers set to benefit from greater market access
196
Economic Impact of the Trans-Pacific Partnership Agreement •
Section 5.7 – Automotive
Exports of automotive components have increased at, on average, 7% per annum from RM3.2 billion in 2008 to RM4.7 billion in 2014. Exports for automotive components to TPPA countries accounts for 24% of Malaysia’s total exports for automotive components in 2014. Export destinations among the TPPA countries are mainly Singapore (38%), the US (22%) and Japan (21%).
Malaysia has signed either bilateral or multilateral FTAs with most of the TPPA countries. Thus, the duties imposed by these countries for Malaysian automotive components have been largely eliminated. Tariffs on automotive components are currently being imposed by countries such as the US, Mexico and Canada.
Industry feedback received during the study indicated that local components manufacturers have the capabilities to produce quality components. Through tariff elimination, the industry believes that there are benefits such as in the exports of rubber automotive components to US and Mexico. Increased market access is welcomed by the automotive industry as the NAP targets the value of exports from components of RM10 billion by 2020.
While there may be export opportunities for components manufacturers, there is also an inherent challenge that needs to be overcome in exports for component manufacturers. Presently, there are issues on disparity of standards. Component manufacturers will have to be flexible and build up capacity in order to cater to varying standards of the TPPA countries in order to reap the benefit for exports. This challenge may potentially be overcome by harmonisation of standards through collaboration between the TPPA countries.
Countries Tariff rates (%)
Canada 0.6~4.5
Mexico 0.4~13.3
United States 1.3~3.8
Import duties imposed on Malaysia’s automotive components
-
1
2
3
4
5
2008 2009 2010 2011 2012 2013 2014
Exports for automotive components
Source: DOSM
RM billion
Source: DOSM
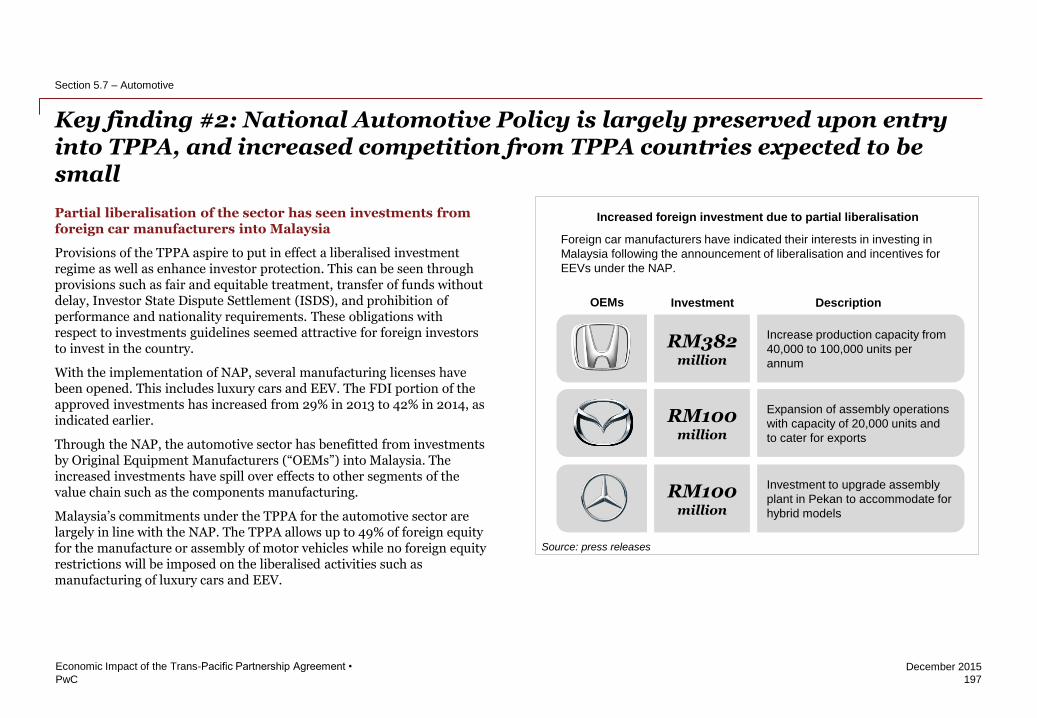
PwC
December 2015
Key finding #2: National Automotive Policy is largely preserved upon entry into TPPA, and increased competition from TPPA countries expected to be small
197
Economic Impact of the Trans-Pacific Partnership Agreement •
Section 5.7 – Automotive
Partial liberalisation of the sector has seen investments from foreign car manufacturers into Malaysia
Provisions of the TPPA aspire to put in effect a liberalised investment regime as well as enhance investor protection. This can be seen through provisions such as fair and equitable treatment, transfer of funds without delay, Investor State Dispute Settlement (ISDS), and prohibition of performance and nationality requirements. These obligations with respect to investments guidelines seemed attractive for foreign investors to invest in the country.
With the implementation of NAP, several manufacturing licenses have been opened. This includes luxury cars and EEV. The FDI portion of the approved investments has increased from 29% in 2013 to 42% in 2014, as indicated earlier.
Through the NAP, the automotive sector has benefitted from investments by Original Equipment Manufacturers (“OEMs”) into Malaysia. The increased investments have spill over effects to other segments of the value chain such as the components manufacturing.
Malaysia’s commitments under the TPPA for the automotive sector are largely in line with the NAP. The TPPA allows up to 49% of foreign equity for the manufacture or assembly of motor vehicles while no foreign equity restrictions will be imposed on the liberalised activities such as manufacturing of luxury cars and EEV.
Increased foreign investment due to partial liberalisation
Foreign car manufacturers have indicated their interests in investing in
Malaysia following the announcement of liberalisation and incentives for
EEVs under the NAP.
Source: press releases
Increase production capacity from
40,000 to 100,000 units per
annum
RM382 million
Expansion of assembly operations
with capacity of 20,000 units and
to cater for exports
RM100
million
Investment to upgrade assembly
plant in Pekan to accommodate for
hybrid models
RM100 million
OEMs Investment Description
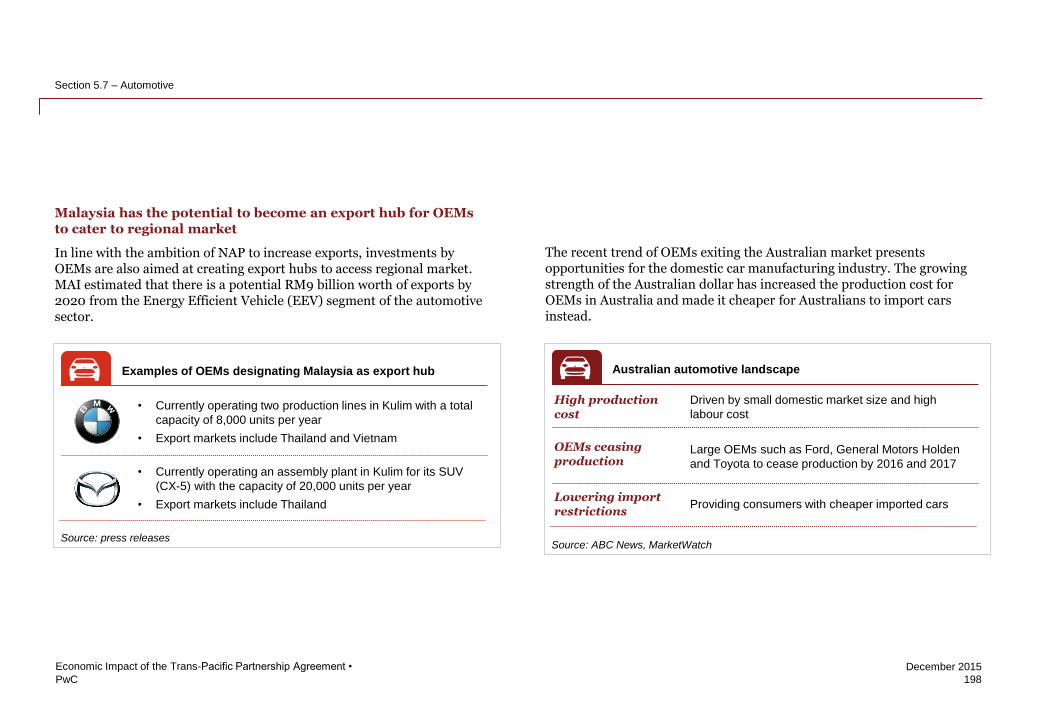
PwC
December 2015
198
Economic Impact of the Trans-Pacific Partnership Agreement •
Section 5.7 – Automotive
Malaysia has the potential to become an export hub for OEMs to cater to regional market
In line with the ambition of NAP to increase exports, investments by OEMs are also aimed at creating export hubs to access regional market. MAI estimated that there is a potential RM9 billion worth of exports by 2020 from the Energy Efficient Vehicle (EEV) segment of the automotive sector.
Source: press releases
Examples of OEMs designating Malaysia as export hub
• Currently operating two production lines in Kulim with a total
capacity of 8,000 units per year
• Export markets include Thailand and Vietnam
• Currently operating an assembly plant in Kulim for its SUV
(CX-5) with the capacity of 20,000 units per year
• Export markets include Thailand
Source: ABC News, MarketWatch
Australian automotive landscape
High production cost
OEMs ceasing production
Lowering import restrictions
Driven by small domestic market size and high
labour cost
Large OEMs such as Ford, General Motors Holden
and Toyota to cease production by 2016 and 2017
Providing consumers with cheaper imported cars
The recent trend of OEMs exiting the Australian market presents opportunities for the domestic car manufacturing industry. The growing strength of the Australian dollar has increased the production cost for OEMs in Australia and made it cheaper for Australians to import cars instead.
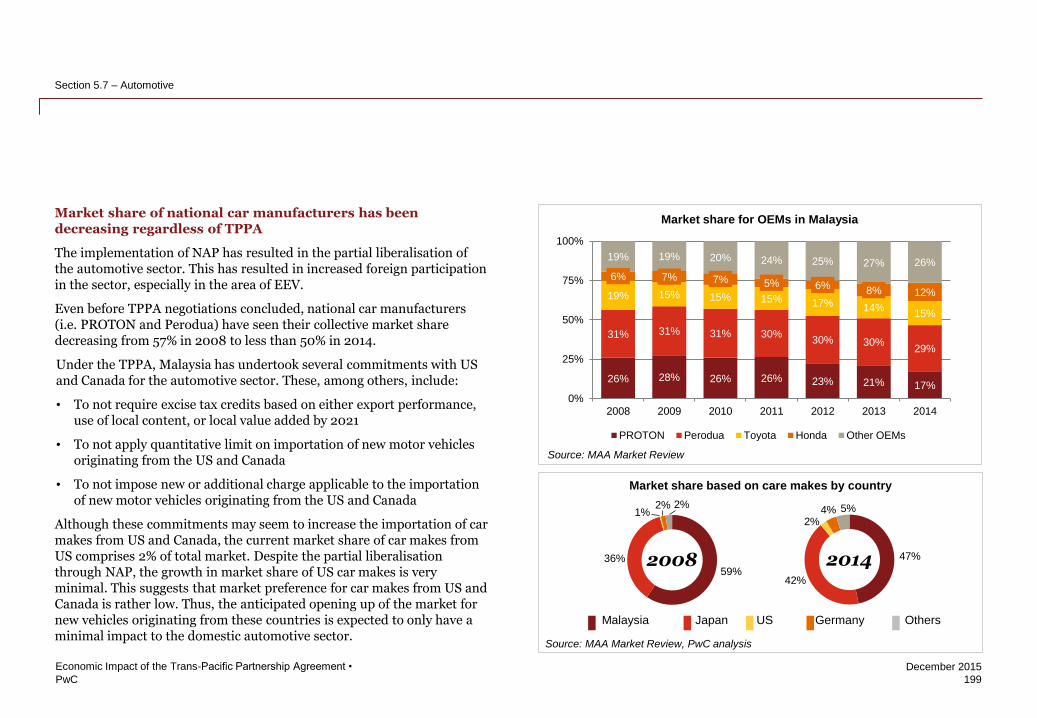
PwC
December 2015
47%
42%
2% 4% 5%
199
Economic Impact of the Trans-Pacific Partnership Agreement •
Section 5.7 – Automotive
Market share of national car manufacturers has been decreasing regardless of TPPA
The implementation of NAP has resulted in the partial liberalisation of the automotive sector. This has resulted in increased foreign participation in the sector, especially in the area of EEV.
Even before TPPA negotiations concluded, national car manufacturers (i.e. PROTON and Perodua) have seen their collective market share decreasing from 57% in 2008 to less than 50% in 2014.
Under the TPPA, Malaysia has undertook several commitments with US and Canada for the automotive sector. These, among others, include:
• To not require excise tax credits based on either export performance, use of local content, or local value added by 2021
• To not apply quantitative limit on importation of new motor vehicles originating from the US and Canada
• To not impose new or additional charge applicable to the importation of new motor vehicles originating from the US and Canada
Although these commitments may seem to increase the importation of car makes from US and Canada, the current market share of car makes from US comprises 2% of total market. Despite the partial liberalisation through NAP, the growth in market share of US car makes is very minimal. This suggests that market preference for car makes from US and Canada is rather low. Thus, the anticipated opening up of the market for new vehicles originating from these countries is expected to only have a minimal impact to the domestic automotive sector.
26% 28% 26% 26% 23% 21% 17%
31% 31% 31% 30% 30% 30%
29%
19% 15% 15% 15% 17% 14% 15%
6% 7% 7% 5% 6% 8% 12%
19% 19% 20% 24% 25% 27% 26%
0%
25%
50%
75%
100%
2008 2009 2010 2011 2012 2013 2014
PROTON Perodua Toyota Honda Other OEMs
Market share for OEMs in Malaysia
Source: MAA Market Review
Source: MAA Market Review, PwC analysis
2014
Market share based on care makes by country
Malaysia Japan US Germany Others
59%
36%
1% 2% 2%
2008
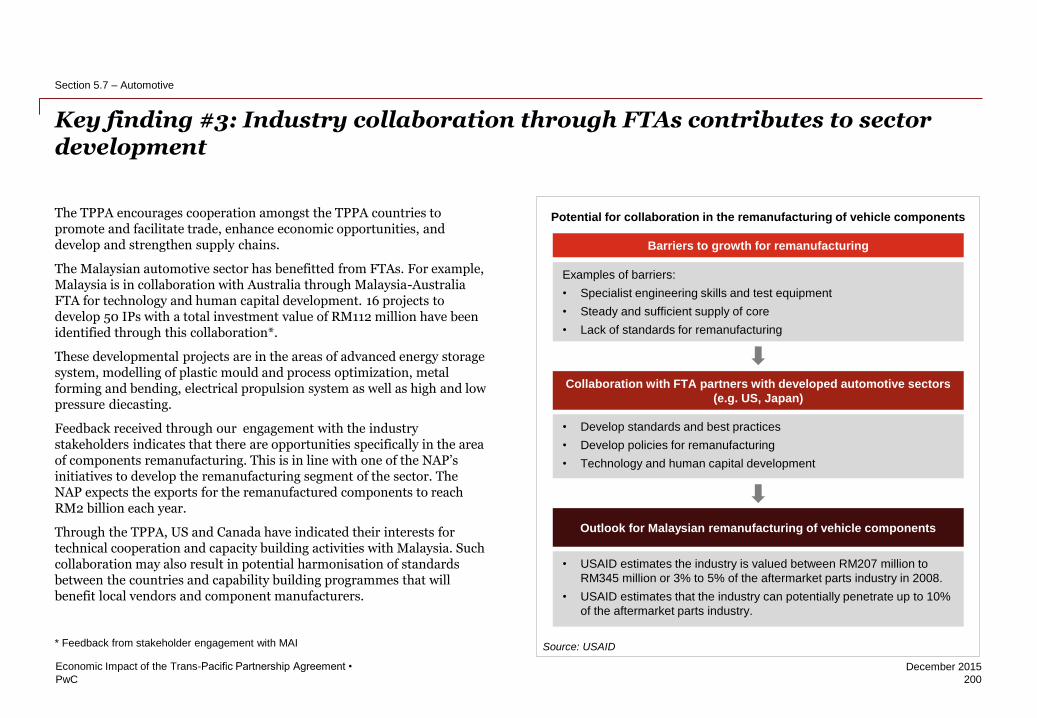
PwC
December 2015
Key finding #3: Industry collaboration through FTAs contributes to sector development
200
Economic Impact of the Trans-Pacific Partnership Agreement •
Section 5.7 – Automotive
The TPPA encourages cooperation amongst the TPPA countries to promote and facilitate trade, enhance economic opportunities, and develop and strengthen supply chains.
The Malaysian automotive sector has benefitted from FTAs. For example, Malaysia is in collaboration with Australia through Malaysia-Australia FTA for technology and human capital development. 16 projects to develop 50 IPs with a total investment value of RM112 million have been identified through this collaboration*.
These developmental projects are in the areas of advanced energy storage system, modelling of plastic mould and process optimization, metal forming and bending, electrical propulsion system as well as high and low pressure diecasting.
Feedback received through our engagement with the industry stakeholders indicates that there are opportunities specifically in the area of components remanufacturing. This is in line with one of the NAP’s initiatives to develop the remanufacturing segment of the sector. The NAP expects the exports for the remanufactured components to reach RM2 billion each year.
Through the TPPA, US and Canada have indicated their interests for technical cooperation and capacity building activities with Malaysia. Such collaboration may also result in potential harmonisation of standards between the countries and capability building programmes that will benefit local vendors and component manufacturers.
Potential for collaboration in the remanufacturing of vehicle components
Barriers to growth for remanufacturing
Examples of barriers:
• Specialist engineering skills and test equipment
• Steady and sufficient supply of core
• Lack of standards for remanufacturing
Collaboration with FTA partners with developed automotive sectors
(e.g. US, Japan)
• Develop standards and best practices
• Develop policies for remanufacturing
• Technology and human capital development
Outlook for Malaysian remanufacturing of vehicle components
• USAID estimates the industry is valued between RM207 million to
RM345 million or 3% to 5% of the aftermarket parts industry in 2008.
• USAID estimates that the industry can potentially penetrate up to 10%
of the aftermarket parts industry.
Source: USAID * Feedback from stakeholder engagement with MAI
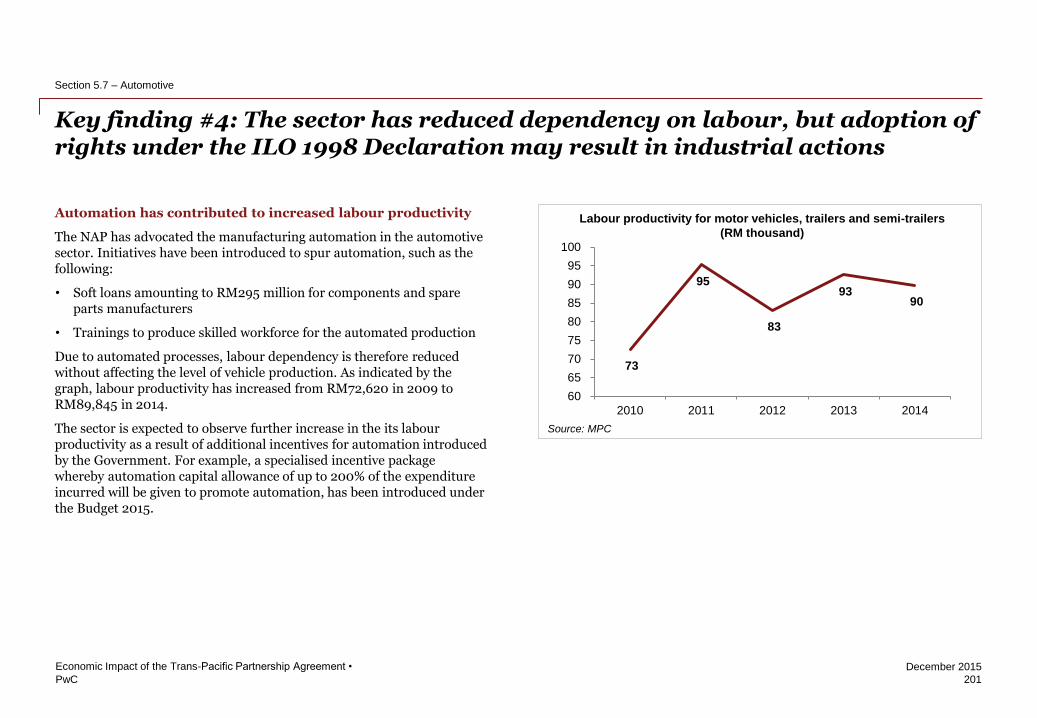
PwC
December 2015
Key finding #4: The sector has reduced dependency on labour, but adoption of rights under the ILO 1998 Declaration may result in industrial actions
201
Economic Impact of the Trans-Pacific Partnership Agreement •
Section 5.7 – Automotive
Automation has contributed to increased labour productivity
The NAP has advocated the manufacturing automation in the automotive sector. Initiatives have been introduced to spur automation, such as the following:
• Soft loans amounting to RM295 million for components and spare parts manufacturers
• Trainings to produce skilled workforce for the automated production
Due to automated processes, labour dependency is therefore reduced without affecting the level of vehicle production. As indicated by the graph, labour productivity has increased from RM72,620 in 2009 to RM89,845 in 2014.
The sector is expected to observe further increase in the its labour productivity as a result of additional incentives for automation introduced by the Government. For example, a specialised incentive package whereby automation capital allowance of up to 200% of the expenditure incurred will be given to promote automation, has been introduced under the Budget 2015.
73
95
83
93 90
60
65
70
75
80
85
90
95
100
2010 2011 2012 2013 2014
Labour productivity for motor vehicles, trailers and semi-trailers
(RM thousand)
Source: MPC
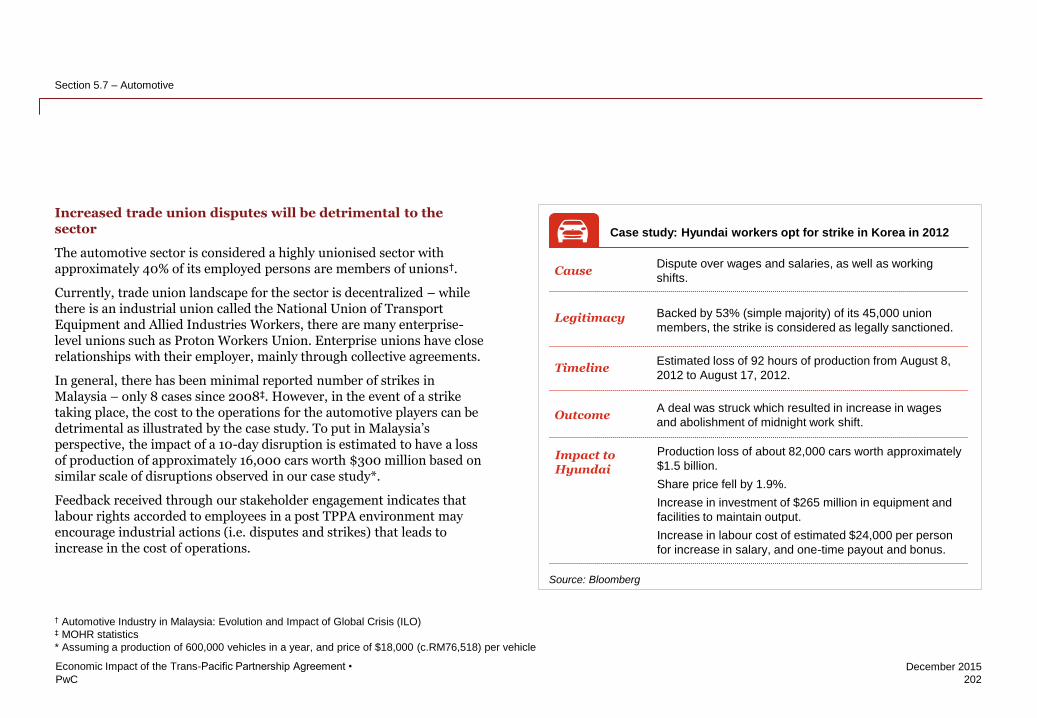
PwC
December 2015
202
Economic Impact of the Trans-Pacific Partnership Agreement •
Section 5.7 – Automotive
Increased trade union disputes will be detrimental to the sector
The automotive sector is considered a highly unionised sector with approximately 40% of its employed persons are members of unions†.
Currently, trade union landscape for the sector is decentralized – while there is an industrial union called the National Union of Transport Equipment and Allied Industries Workers, there are many enterprise-level unions such as Proton Workers Union. Enterprise unions have close relationships with their employer, mainly through collective agreements.
In general, there has been minimal reported number of strikes in Malaysia – only 8 cases since 2008‡. However, in the event of a strike taking place, the cost to the operations for the automotive players can be detrimental as illustrated by the case study. To put in Malaysia’s perspective, the impact of a 10-day disruption is estimated to have a loss of production of approximately 16,000 cars worth $300 million based on similar scale of disruptions observed in our case study*.
Feedback received through our stakeholder engagement indicates that labour rights accorded to employees in a post TPPA environment may encourage industrial actions (i.e. disputes and strikes) that leads to increase in the cost of operations.
Case study: Hyundai workers opt for strike in Korea in 2012
Cause
Legitimacy
Timeline
Dispute over wages and salaries, as well as working
shifts.
Backed by 53% (simple majority) of its 45,000 union
members, the strike is considered as legally sanctioned.
Estimated loss of 92 hours of production from August 8,
2012 to August 17, 2012.
Impact to Hyundai
Production loss of about 82,000 cars worth approximately
$1.5 billion.
Share price fell by 1.9%.
Increase in investment of $265 million in equipment and
facilities to maintain output.
Increase in labour cost of estimated $24,000 per person
for increase in salary, and one-time payout and bonus.
Outcome A deal was struck which resulted in increase in wages
and abolishment of midnight work shift.
Source: Bloomberg
† Automotive Industry in Malaysia: Evolution and Impact of Global Crisis (ILO) ‡ MOHR statistics
* Assuming a production of 600,000 vehicles in a year, and price of $18,000 (c.RM76,518) per vehicle
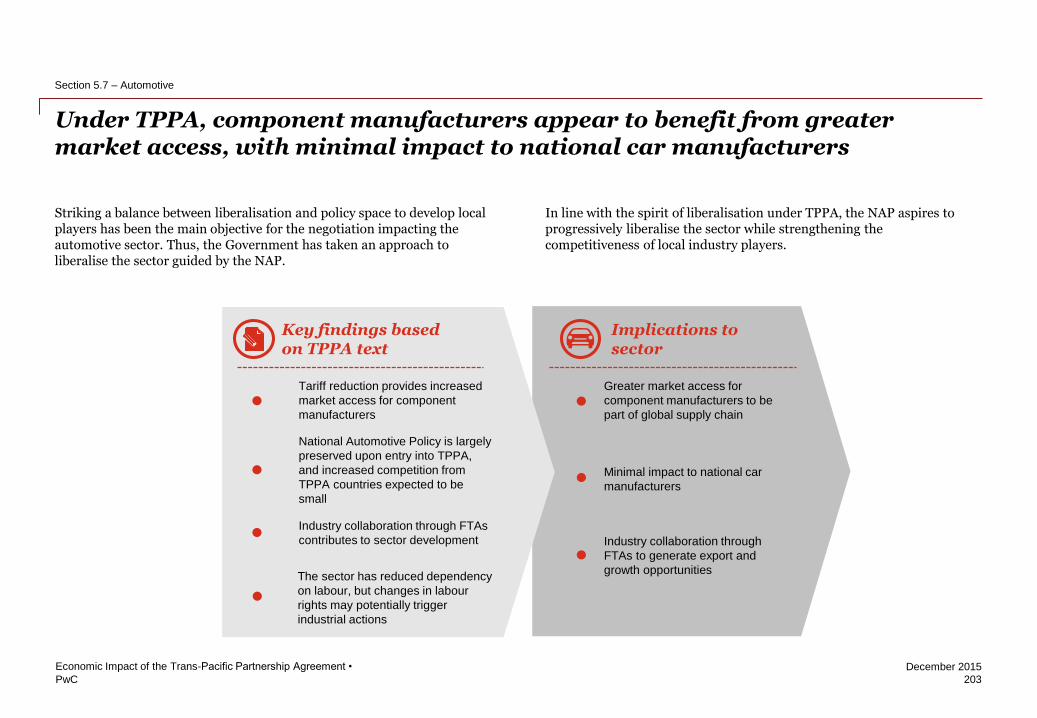
PwC
December 2015
Key findings based on TPPA text
Implications to sector
.
.
.
.
.
.
Under TPPA, component manufacturers appear to benefit from greater market access, with minimal impact to national car manufacturers
203
Economic Impact of the Trans-Pacific Partnership Agreement •
Section 5.7 – Automotive
Striking a balance between liberalisation and policy space to develop local players has been the main objective for the negotiation impacting the automotive sector. Thus, the Government has taken an approach to liberalise the sector guided by the NAP.
In line with the spirit of liberalisation under TPPA, the NAP aspires to progressively liberalise the sector while strengthening the competitiveness of local industry players.
Tariff reduction provides increased
market access for component
manufacturers
National Automotive Policy is largely
preserved upon entry into TPPA,
and increased competition from
TPPA countries expected to be
small
Industry collaboration through FTAs
contributes to sector development
Greater market access for
component manufacturers to be
part of global supply chain
Minimal impact to national car
manufacturers
Industry collaboration through
FTAs to generate export and
growth opportunities The sector has reduced dependency
on labour, but changes in labour
rights may potentially trigger
industrial actions
.

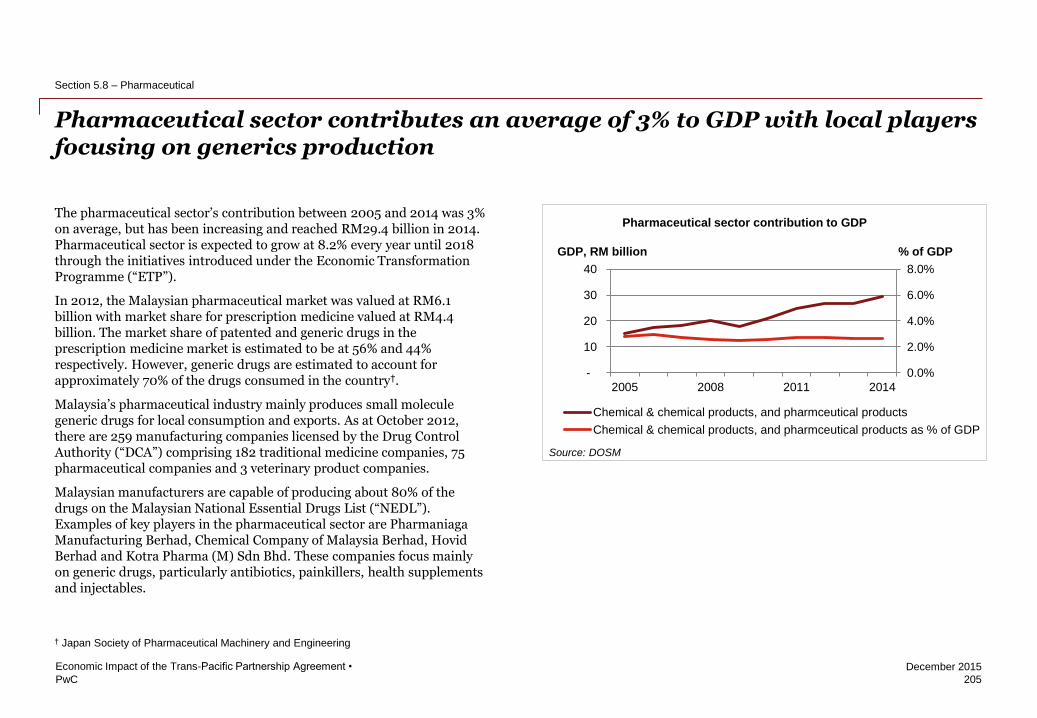
PwC
December 2015
The pharmaceutical sector’s contribution between 2005 and 2014 was 3% on average, but has been increasing and reached RM29.4 billion in 2014. Pharmaceutical sector is expected to grow at 8.2% every year until 2018 through the initiatives introduced under the Economic Transformation Programme (“ETP”).
In 2012, the Malaysian pharmaceutical market was valued at RM6.1 billion with market share for prescription medicine valued at RM4.4 billion. The market share of patented and generic drugs in the prescription medicine market is estimated to be at 56% and 44% respectively. However, generic drugs are estimated to account for approximately 70% of the drugs consumed in the country†.
Malaysia’s pharmaceutical industry mainly produces small molecule generic drugs for local consumption and exports. As at October 2012, there are 259 manufacturing companies licensed by the Drug Control Authority (“DCA”) comprising 182 traditional medicine companies, 75 pharmaceutical companies and 3 veterinary product companies.
Malaysian manufacturers are capable of producing about 80% of the drugs on the Malaysian National Essential Drugs List (“NEDL”). Examples of key players in the pharmaceutical sector are Pharmaniaga Manufacturing Berhad, Chemical Company of Malaysia Berhad, Hovid Berhad and Kotra Pharma (M) Sdn Bhd. These companies focus mainly on generic drugs, particularly antibiotics, painkillers, health supplements and injectables.
Pharmaceutical sector contributes an average of 3% to GDP with local players focusing on generics production
205
Economic Impact of the Trans-Pacific Partnership Agreement •
Section 5.8 – Pharmaceutical
0.0%
2.0%
4.0%
6.0%
8.0%
-
10
20
30
40
2005 2008 2011 2014
Chemical & chemical products, and pharmceutical products
Chemical & chemical products, and pharmceutical products as % of GDP
% of GDP GDP, RM billion
Pharmaceutical sector contribution to GDP
Source: DOSM
† Japan Society of Pharmaceutical Machinery and Engineering
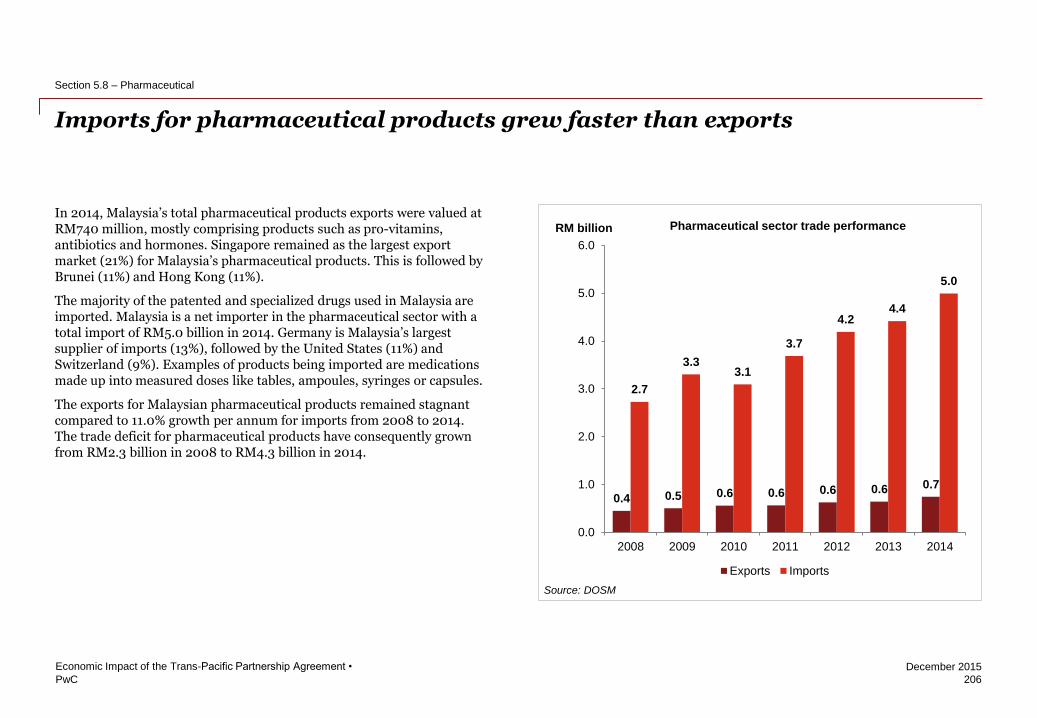
PwC
December 2015
In 2014, Malaysia’s total pharmaceutical products exports were valued at RM740 million, mostly comprising products such as pro-vitamins, antibiotics and hormones. Singapore remained as the largest export market (21%) for Malaysia’s pharmaceutical products. This is followed by Brunei (11%) and Hong Kong (11%).
The majority of the patented and specialized drugs used in Malaysia are imported. Malaysia is a net importer in the pharmaceutical sector with a total import of RM5.0 billion in 2014. Germany is Malaysia’s largest supplier of imports (13%), followed by the United States (11%) and Switzerland (9%). Examples of products being imported are medications made up into measured doses like tables, ampoules, syringes or capsules.
The exports for Malaysian pharmaceutical products remained stagnant compared to 11.0% growth per annum for imports from 2008 to 2014. The trade deficit for pharmaceutical products have consequently grown from RM2.3 billion in 2008 to RM4.3 billion in 2014.
Imports for pharmaceutical products grew faster than exports
206
Economic Impact of the Trans-Pacific Partnership Agreement •
Section 5.8 – Pharmaceutical
0.4 0.5 0.6 0.6 0.6 0.6 0.7
2.7
3.3 3.1
3.7
4.2 4.4
5.0
0.0
1.0
2.0
3.0
4.0
5.0
6.0
2008 2009 2010 2011 2012 2013 2014
Exports Imports
RM billion Pharmaceutical sector trade performance
Source: DOSM
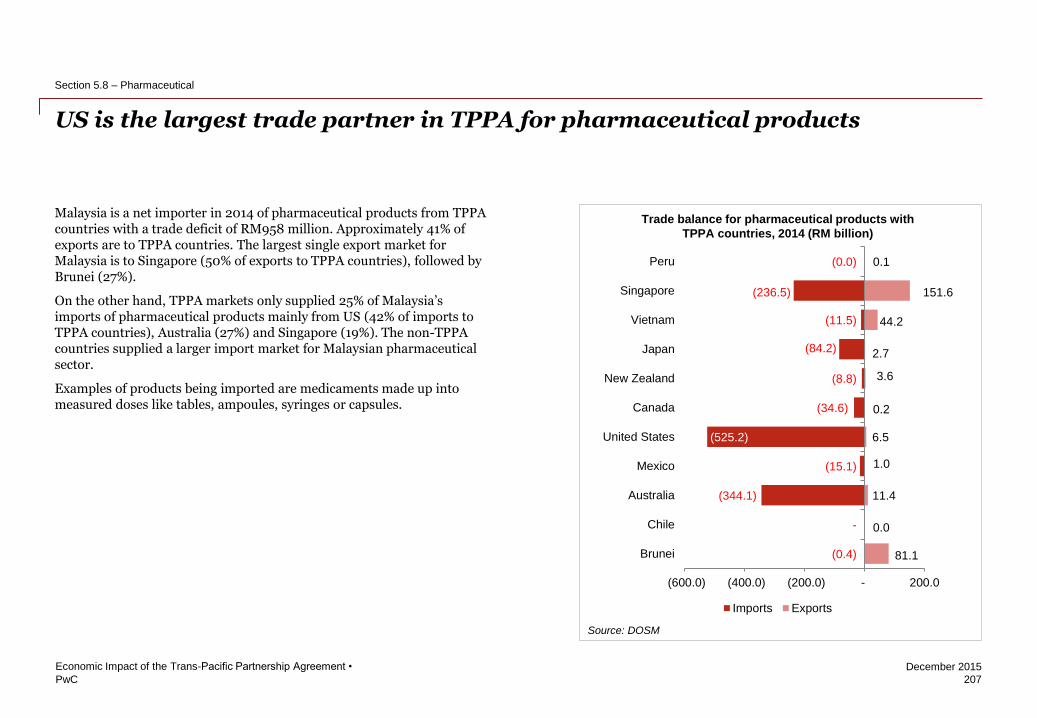
PwC
December 2015
Malaysia is a net importer in 2014 of pharmaceutical products from TPPA countries with a trade deficit of RM958 million. Approximately 41% of exports are to TPPA countries. The largest single export market for Malaysia is to Singapore (50% of exports to TPPA countries), followed by Brunei (27%).
On the other hand, TPPA markets only supplied 25% of Malaysia’s imports of pharmaceutical products mainly from US (42% of imports to TPPA countries), Australia (27%) and Singapore (19%). The non-TPPA countries supplied a larger import market for Malaysian pharmaceutical sector.
Examples of products being imported are medicaments made up into measured doses like tables, ampoules, syringes or capsules.
US is the largest trade partner in TPPA for pharmaceutical products
207
Economic Impact of the Trans-Pacific Partnership Agreement •
Section 5.8 – Pharmaceutical
Trade balance for pharmaceutical products with
TPPA countries, 2014 (RM billion)
(0.4)
-
(344.1)
(15.1)
(525.2)
(34.6)
(8.8)
(84.2)
(11.5)
(236.5)
(0.0)
81.1
0.0
11.4
1.0
6.5
0.2
3.6
2.7
44.2
151.6
0.1
(600.0) (400.0) (200.0) - 200.0
Brunei
Chile
Australia
Mexico
United States
Canada
New Zealand
Japan
Vietnam
Singapore
Peru
Imports Exports
Source: DOSM
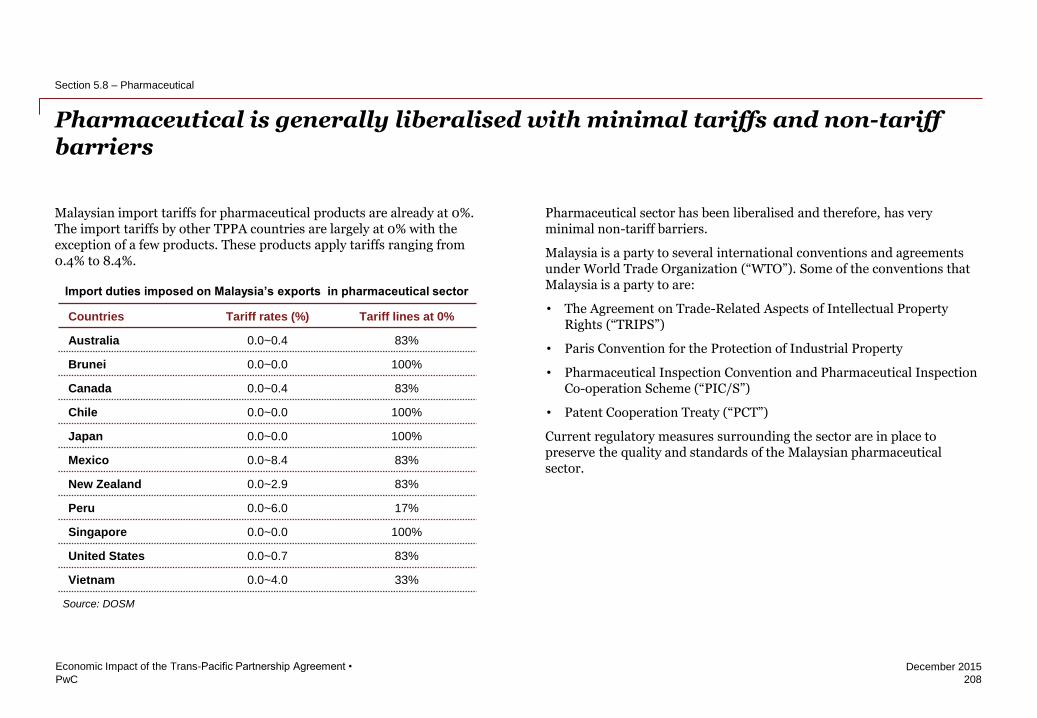
PwC
December 2015
Malaysian import tariffs for pharmaceutical products are already at 0%. The import tariffs by other TPPA countries are largely at 0% with the exception of a few products. These products apply tariffs ranging from 0.4% to 8.4%.
Pharmaceutical is generally liberalised with minimal tariffs and non-tariff barriers
208
Economic Impact of the Trans-Pacific Partnership Agreement •
Section 5.8 – Pharmaceutical
Countries Tariff rates (%) Tariff lines at 0%
Australia 0.0~0.4 83%
Brunei 0.0~0.0 100%
Canada 0.0~0.4 83%
Chile 0.0~0.0 100%
Japan 0.0~0.0 100%
Mexico 0.0~8.4 83%
New Zealand 0.0~2.9 83%
Peru 0.0~6.0 17%
Singapore 0.0~0.0 100%
United States 0.0~0.7 83%
Vietnam 0.0~4.0 33%
Import duties imposed on Malaysia’s exports in pharmaceutical sector
Pharmaceutical sector has been liberalised and therefore, has very minimal non-tariff barriers.
Malaysia is a party to several international conventions and agreements under World Trade Organization (“WTO”). Some of the conventions that Malaysia is a party to are:
• The Agreement on Trade-Related Aspects of Intellectual Property Rights (“TRIPS”)
• Paris Convention for the Protection of Industrial Property
• Pharmaceutical Inspection Convention and Pharmaceutical Inspection Co-operation Scheme (“PIC/S”)
• Patent Cooperation Treaty (“PCT”)
Current regulatory measures surrounding the sector are in place to preserve the quality and standards of the Malaysian pharmaceutical sector.
Source: DOSM
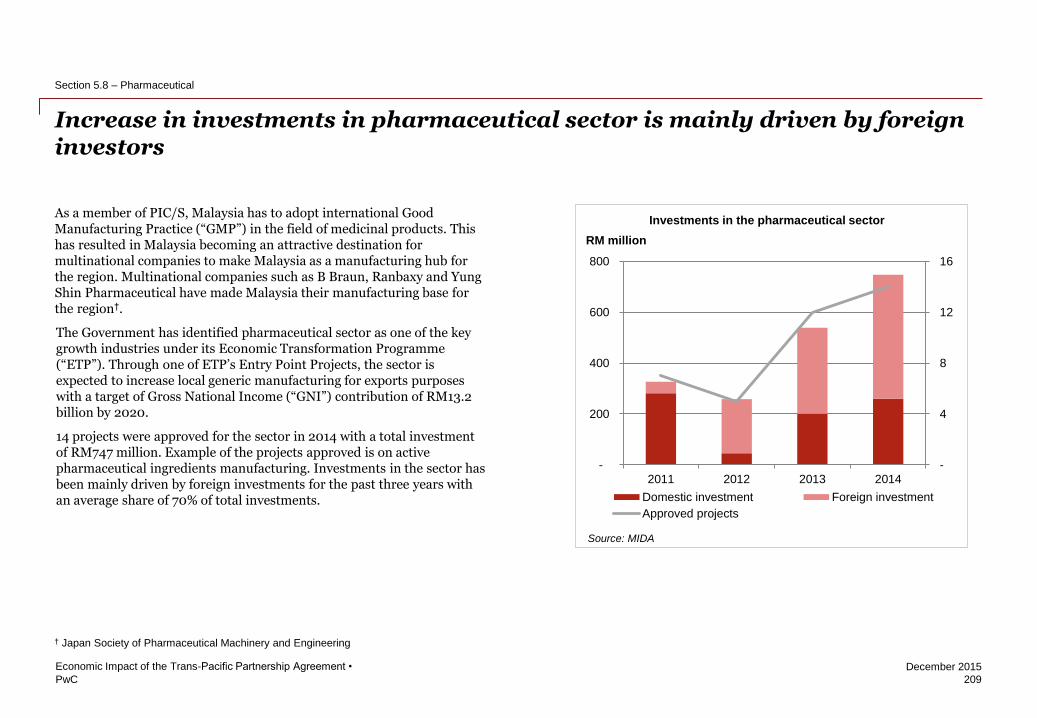
PwC
December 2015
As a member of PIC/S, Malaysia has to adopt international Good Manufacturing Practice (“GMP”) in the field of medicinal products. This has resulted in Malaysia becoming an attractive destination for multinational companies to make Malaysia as a manufacturing hub for the region. Multinational companies such as B Braun, Ranbaxy and Yung Shin Pharmaceutical have made Malaysia their manufacturing base for the region†.
The Government has identified pharmaceutical sector as one of the key growth industries under its Economic Transformation Programme (“ETP”). Through one of ETP’s Entry Point Projects, the sector is expected to increase local generic manufacturing for exports purposes with a target of Gross National Income (“GNI”) contribution of RM13.2 billion by 2020.
14 projects were approved for the sector in 2014 with a total investment of RM747 million. Example of the projects approved is on active pharmaceutical ingredients manufacturing. Investments in the sector has been mainly driven by foreign investments for the past three years with an average share of 70% of total investments.
Increase in investments in pharmaceutical sector is mainly driven by foreign investors
209
Economic Impact of the Trans-Pacific Partnership Agreement •
Section 5.8 – Pharmaceutical
-
4
8
12
16
-
200
400
600
800
2011 2012 2013 2014
Domestic investment Foreign investment
Approved projects
Investments in the pharmaceutical sector
RM million
Source: MIDA
† Japan Society of Pharmaceutical Machinery and Engineering
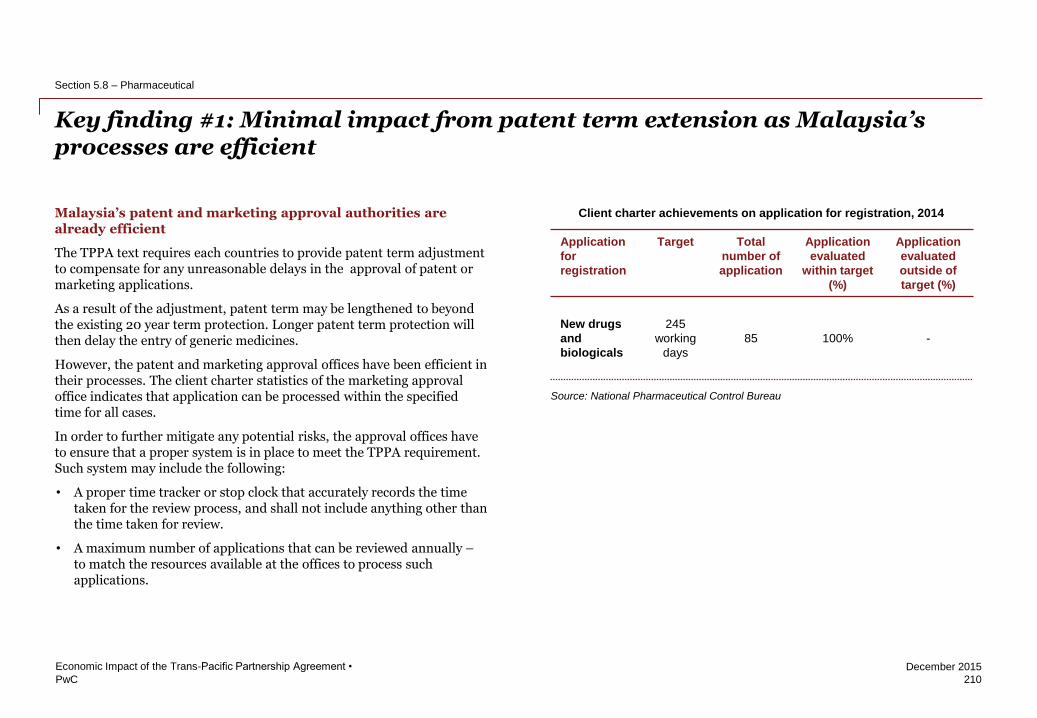
PwC
December 2015
Key finding #1: Minimal impact from patent term extension as Malaysia’s processes are efficient
210
Economic Impact of the Trans-Pacific Partnership Agreement •
Section 5.8 – Pharmaceutical
Malaysia’s patent and marketing approval authorities are already efficient
The TPPA text requires each countries to provide patent term adjustment to compensate for any unreasonable delays in the approval of patent or marketing applications.
As a result of the adjustment, patent term may be lengthened to beyond the existing 20 year term protection. Longer patent term protection will then delay the entry of generic medicines.
However, the patent and marketing approval offices have been efficient in their processes. The client charter statistics of the marketing approval office indicates that application can be processed within the specified time for all cases.
In order to further mitigate any potential risks, the approval offices have to ensure that a proper system is in place to meet the TPPA requirement. Such system may include the following:
• A proper time tracker or stop clock that accurately records the time taken for the review process, and shall not include anything other than the time taken for review.
• A maximum number of applications that can be reviewed annually – to match the resources available at the offices to process such applications.
Source: National Pharmaceutical Control Bureau
Client charter achievements on application for registration, 2014
Application
for
registration
Target Total
number of
application
Application
evaluated
within target
(%)
Application
evaluated
outside of
target (%)
New drugs
and
biologicals
245
working
days
85 100% -
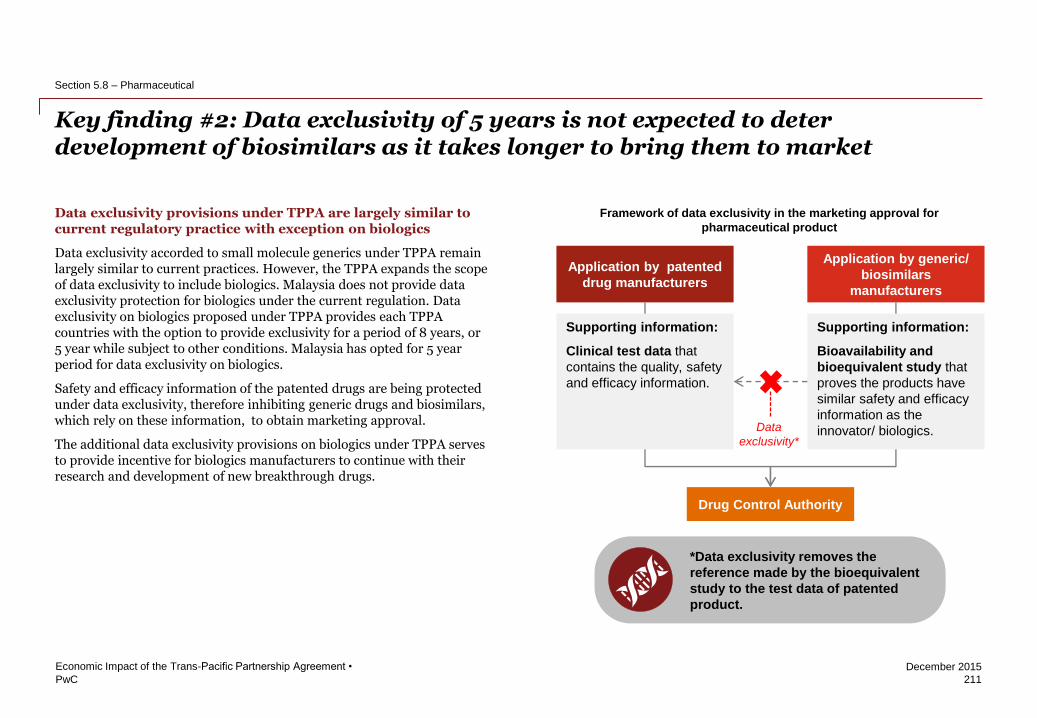
PwC
December 2015
*Data exclusivity removes the
reference made by the bioequivalent
study to the test data of patented
product.
Key finding #2: Data exclusivity of 5 years is not expected to deter development of biosimilars as it takes longer to bring them to market
211
Economic Impact of the Trans-Pacific Partnership Agreement •
Section 5.8 – Pharmaceutical
Data exclusivity provisions under TPPA are largely similar to current regulatory practice with exception on biologics
Data exclusivity accorded to small molecule generics under TPPA remain largely similar to current practices. However, the TPPA expands the scope of data exclusivity to include biologics. Malaysia does not provide data exclusivity protection for biologics under the current regulation. Data exclusivity on biologics proposed under TPPA provides each TPPA countries with the option to provide exclusivity for a period of 8 years, or 5 year while subject to other conditions. Malaysia has opted for 5 year period for data exclusivity on biologics.
Safety and efficacy information of the patented drugs are being protected under data exclusivity, therefore inhibiting generic drugs and biosimilars, which rely on these information, to obtain marketing approval.
The additional data exclusivity provisions on biologics under TPPA serves to provide incentive for biologics manufacturers to continue with their research and development of new breakthrough drugs.
Application by generic/
biosimilars
manufacturers
Application by patented
drug manufacturers
Drug Control Authority
Supporting information:
Clinical test data that
contains the quality, safety
and efficacy information.
Supporting information:
Bioavailability and
bioequivalent study that
proves the products have
similar safety and efficacy
information as the
innovator/ biologics.
Framework of data exclusivity in the marketing approval for
pharmaceutical product
Data
exclusivity*
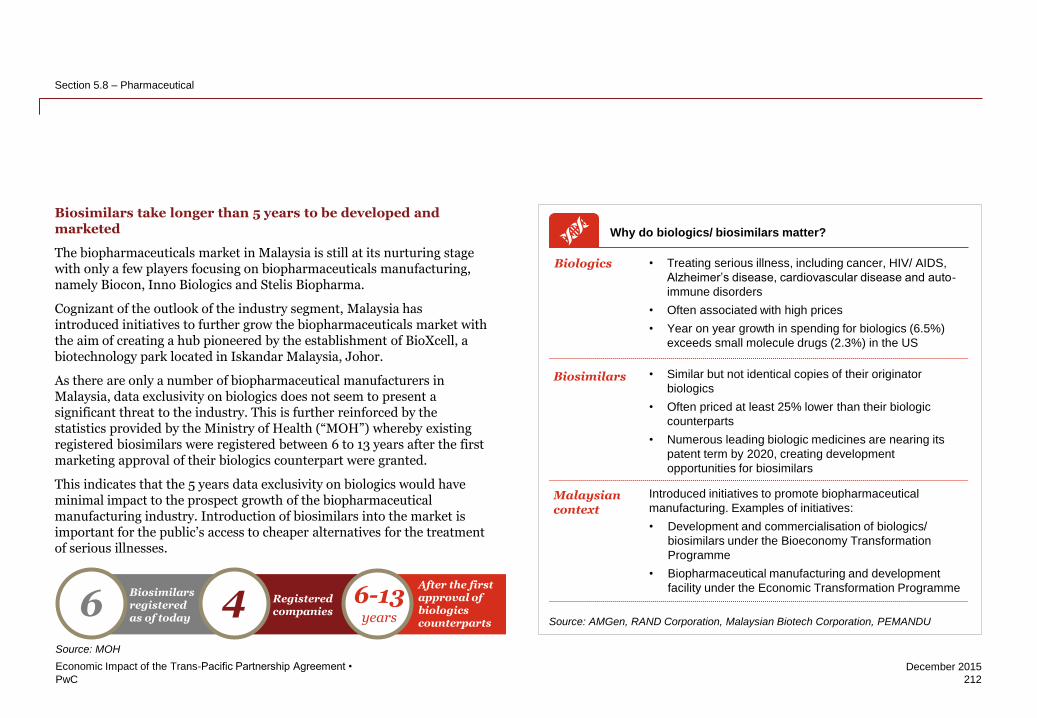
PwC
December 2015
212
Economic Impact of the Trans-Pacific Partnership Agreement •
Section 5.8 – Pharmaceutical
Biosimilars take longer than 5 years to be developed and marketed
The biopharmaceuticals market in Malaysia is still at its nurturing stage with only a few players focusing on biopharmaceuticals manufacturing, namely Biocon, Inno Biologics and Stelis Biopharma.
Cognizant of the outlook of the industry segment, Malaysia has introduced initiatives to further grow the biopharmaceuticals market with the aim of creating a hub pioneered by the establishment of BioXcell, a biotechnology park located in Iskandar Malaysia, Johor.
As there are only a number of biopharmaceutical manufacturers in Malaysia, data exclusivity on biologics does not seem to present a significant threat to the industry. This is further reinforced by the statistics provided by the Ministry of Health (“MOH”) whereby existing registered biosimilars were registered between 6 to 13 years after the first marketing approval of their biologics counterpart were granted.
This indicates that the 5 years data exclusivity on biologics would have minimal impact to the prospect growth of the biopharmaceutical manufacturing industry. Introduction of biosimilars into the market is important for the public’s access to cheaper alternatives for the treatment of serious illnesses.
Why do biologics/ biosimilars matter?
• Treating serious illness, including cancer, HIV/ AIDS,
Alzheimer’s disease, cardiovascular disease and auto-
immune disorders
• Often associated with high prices
• Year on year growth in spending for biologics (6.5%)
exceeds small molecule drugs (2.3%) in the US
Biosimilars
Source: AMGen, RAND Corporation, Malaysian Biotech Corporation, PEMANDU
• Similar but not identical copies of their originator
biologics
• Often priced at least 25% lower than their biologic
counterparts
• Numerous leading biologic medicines are nearing its
patent term by 2020, creating development
opportunities for biosimilars
Biologics
Malaysian context
Introduced initiatives to promote biopharmaceutical
manufacturing. Examples of initiatives:
• Development and commercialisation of biologics/
biosimilars under the Bioeconomy Transformation
Programme
• Biopharmaceutical manufacturing and development
facility under the Economic Transformation Programme
6 Biosimilars registered as of today
4 Registered companies
6-13 years
After the first approval of biologics counterparts
Source: MOH
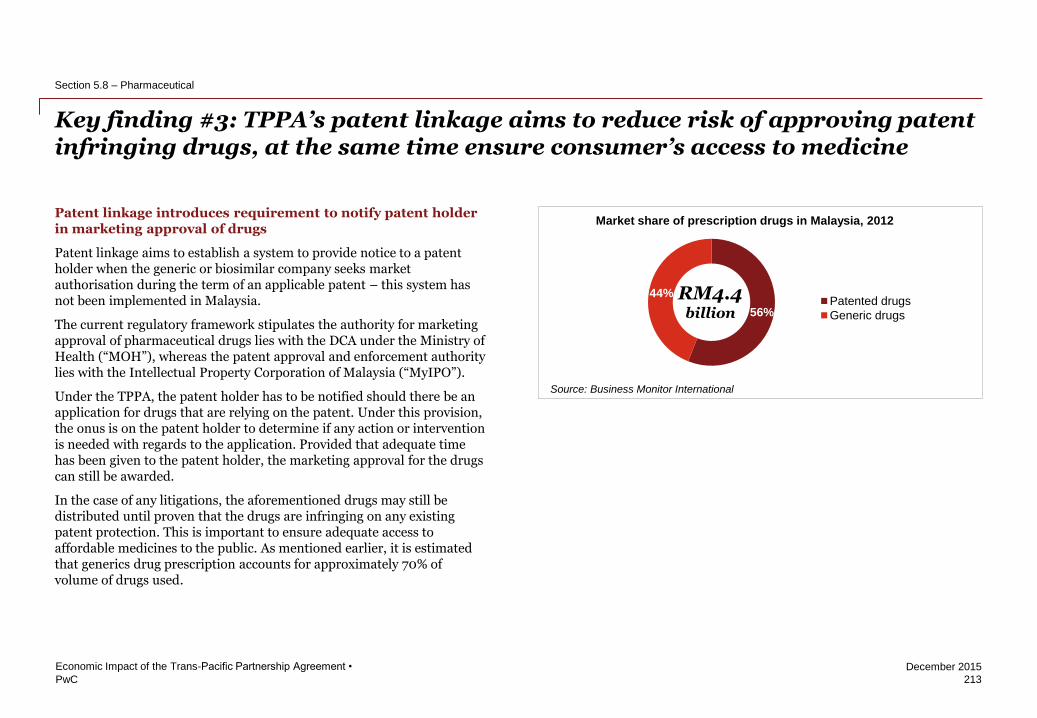
PwC
December 2015
Key finding #3: TPPA’s patent linkage aims to reduce risk of approving patent infringing drugs, at the same time ensure consumer’s access to medicine
213
Economic Impact of the Trans-Pacific Partnership Agreement •
Section 5.8 – Pharmaceutical
Patent linkage introduces requirement to notify patent holder in marketing approval of drugs
Patent linkage aims to establish a system to provide notice to a patent holder when the generic or biosimilar company seeks market authorisation during the term of an applicable patent – this system has not been implemented in Malaysia.
The current regulatory framework stipulates the authority for marketing approval of pharmaceutical drugs lies with the DCA under the Ministry of Health (“MOH”), whereas the patent approval and enforcement authority lies with the Intellectual Property Corporation of Malaysia (“MyIPO”).
Under the TPPA, the patent holder has to be notified should there be an application for drugs that are relying on the patent. Under this provision, the onus is on the patent holder to determine if any action or intervention is needed with regards to the application. Provided that adequate time has been given to the patent holder, the marketing approval for the drugs can still be awarded.
In the case of any litigations, the aforementioned drugs may still be distributed until proven that the drugs are infringing on any existing patent protection. This is important to ensure adequate access to affordable medicines to the public. As mentioned earlier, it is estimated that generics drug prescription accounts for approximately 70% of volume of drugs used.
56%
44% Patented drugs
Generic drugs
Market share of prescription drugs in Malaysia, 2012
RM4.4 billion
Source: Business Monitor International

PwC
December 2015
The TPPA’s IP provisions are expected to have minimal impact on existing firms and the biopharmaceutical industry
214
Economic Impact of the Trans-Pacific Partnership Agreement •
Section 5.8 – Pharmaceutical
In conclusion, the key findings indicate that the TPPA obligations do not pose detrimental risks to the future growth of biopharmaceutical manufacturing industry. While the obligations are largely similar to the current practice in Malaysia with regards to small molecule drugs, the TPPA impose additional obligations to biologics i.e. on data exclusivity.
However, data exclusivity for biologics does not seem to pose challenges as it will take longer than 5 years for biosimilars to be developed. In addition, patent linkage’s aim to curb production of patent infringing drugs will not have a severe impact to the outlook and attractiveness of the sector.
Impact to generics/ biosimilars manufacturers
• No patent term extension that could
delay their production
• No obligations that further restricts
ability to obtain marketing approval
for their products (i.e. generics of
biosimilars
Impact to consumers
• Access to affordable generics or
biosimilars is in tact
• Risk of delaying the entry of drugs
into the market is unlikely

PwC
December 2015
The wood-based industry has progressed to a more advanced downstream processing industry; however, GDP contribution is declining
215
Economic Impact of the Trans-Pacific Partnership Agreement •
Section 5.9 – Wood and wood products
Over the past two decades, Malaysia’s wood-based industry has transformed from being a primary processing industry into a more advanced and technology-driven industry that produces a significant number of downstream value-added products. Exports of value-added products (i.e. furniture, moulding, builders carpentry and joinery, wood-based panels) have increased significantly from 1990 – 2010, relative to that of lower-value commodities such as logs and plywood.*
There is a total of 984 sawmills and 172 plywood/veneer mills, mostly located in Sabah and Sarawak. The 1,994 other factories, of which 1,707 are export-oriented wooden furniture factories, are mainly located in Peninsular Malaysia. Malaysia’s wood and wood products sector has fluctuated over the years, but is on an overall upward trend. However, its share of GDP has declined from 1.5% in 2005 to 0.8% in 2014.
The industry is predominantly owned by Malaysians and it is estimated that 80 - 90 per cent of the companies comprise small and medium-size (SME) establishments. Furniture manufacturers are located mainly in Johor, Selangor, Sarawak, Perak and Melaka.
The bulk of wood products (61%) manufactured in Malaysia are in secondary form, as shown in the figure below:
Contribution of the wood-based industry to GDP at current prices
% of GDP GDP, RM billion
0.6%
0.8%
1.0%
1.2%
1.4%
1.6%
7.0
8.0
9.0
10.0
2005 2006 2007 2008 2009 2010 2011 2012 2013 2014
Forestry & lumber Forestry & lumber as % of GDP
Source: DOSM, Ministry of Plantation Industries and Commodities (MPIC) Source: DOSM
*Ratnasingam J (2012), Innovation in the Malaysian Wood Industry – Current Status, Challenges and Future Potential, FRG Report No. 23, Singapore, 61p; Ratnasingam J. et al., Innovations
in the Forest Products Industry: The Malaysian Experience, Not Bot Horti Agrobo, 2013, 41(2):601-607
2014 Sales value of own manufactured products (RM22.4 billion)
Veneer sheets and plywood,
30%
Particle board and fibreboard,
8%
4%
10%
16%
1% 8%
4%
19%
Builders' carpentryPulp, paper and paperboardContainers and corrugated paper and paperboardEnvelopes and letter-cardHousehold and personal hygiene paperGummed or adhesive paper in strips or rolls and labels and wall paperWooden and cane furniture
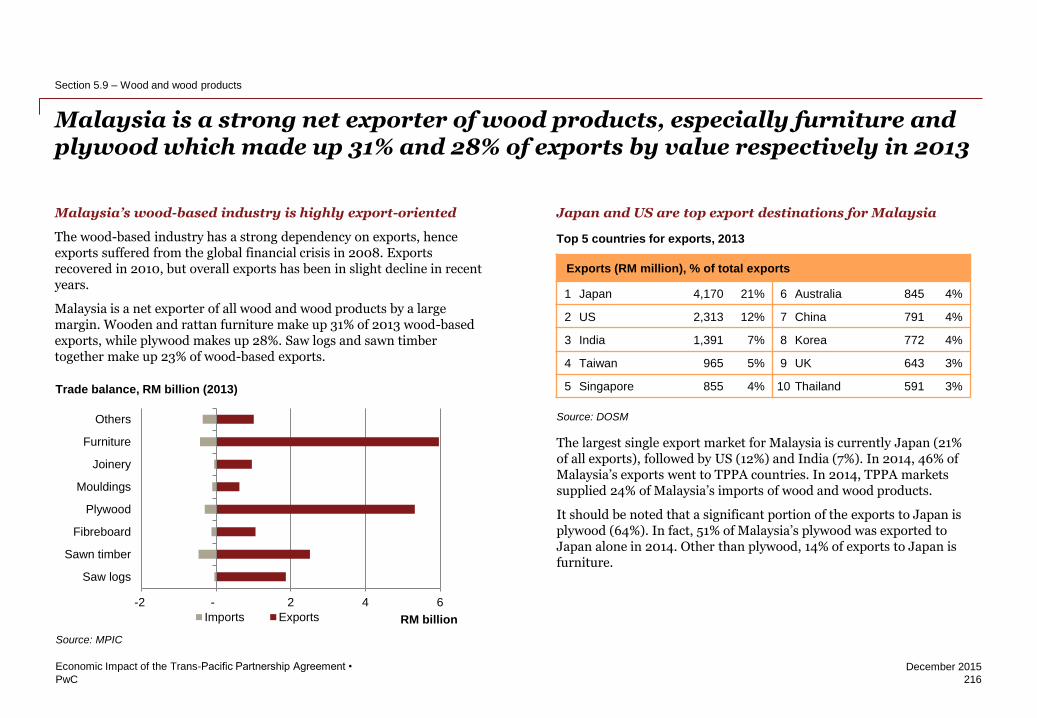
PwC
December 2015
Malaysia is a strong net exporter of wood products, especially furniture and plywood which made up 31% and 28% of exports by value respectively in 2013
216
Economic Impact of the Trans-Pacific Partnership Agreement •
Section 5.9 – Wood and wood products
Malaysia’s wood-based industry is highly export-oriented
The wood-based industry has a strong dependency on exports, hence exports suffered from the global financial crisis in 2008. Exports recovered in 2010, but overall exports has been in slight decline in recent years.
Malaysia is a net exporter of all wood and wood products by a large margin. Wooden and rattan furniture make up 31% of 2013 wood-based exports, while plywood makes up 28%. Saw logs and sawn timber together make up 23% of wood-based exports.
Japan and US are top export destinations for Malaysia
The largest single export market for Malaysia is currently Japan (21% of all exports), followed by US (12%) and India (7%). In 2014, 46% of Malaysia’s exports went to TPPA countries. In 2014, TPPA markets supplied 24% of Malaysia’s imports of wood and wood products.
It should be noted that a significant portion of the exports to Japan is plywood (64%). In fact, 51% of Malaysia’s plywood was exported to Japan alone in 2014. Other than plywood, 14% of exports to Japan is furniture.
Source: MPIC
Trade balance, RM billion (2013)
-2 - 2 4 6
Saw logs
Sawn timber
Fibreboard
Plywood
Mouldings
Joinery
Furniture
Others
RM billion Imports Exports
Exports (RM million), % of total exports
1 Japan 4,170 21% 6 Australia 845 4%
2 US 2,313 12% 7 China 791 4%
3 India 1,391 7% 8 Korea 772 4%
4 Taiwan 965 5% 9 UK 643 3%
5 Singapore 855 4% 10 Thailand 591 3%
Source: DOSM
Top 5 countries for exports, 2013
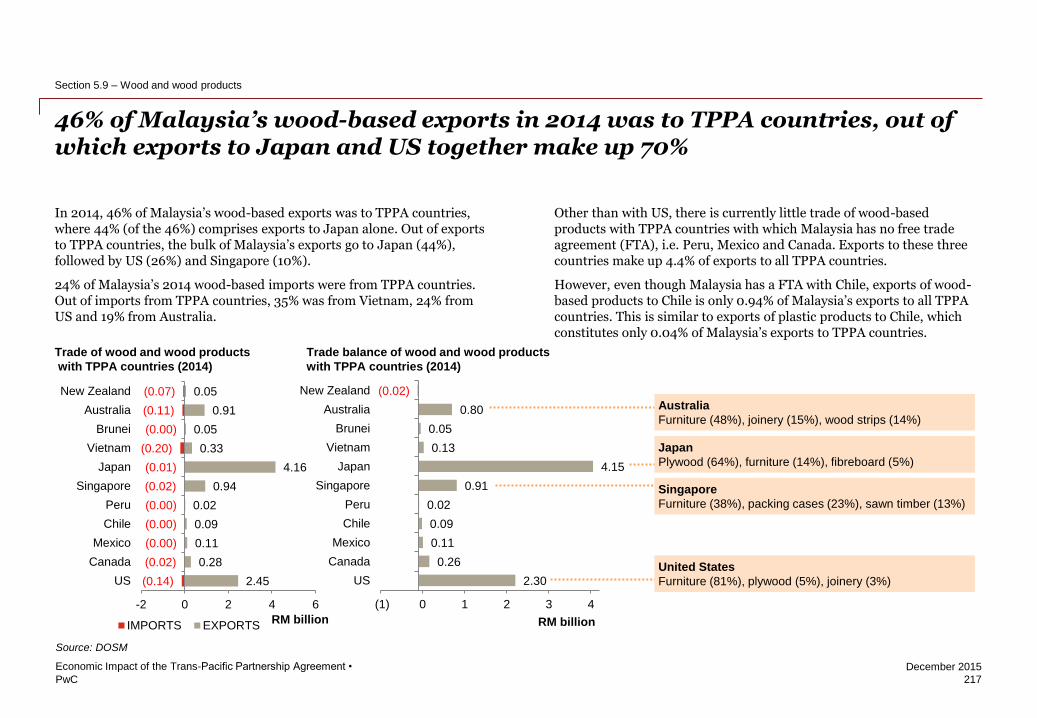
PwC
December 2015
217
Economic Impact of the Trans-Pacific Partnership Agreement •
Section 5.9 – Wood and wood products
46% of Malaysia’s wood-based exports in 2014 was to TPPA countries, out of which exports to Japan and US together make up 70%
In 2014, 46% of Malaysia’s wood-based exports was to TPPA countries, where 44% (of the 46%) comprises exports to Japan alone. Out of exports to TPPA countries, the bulk of Malaysia’s exports go to Japan (44%), followed by US (26%) and Singapore (10%).
24% of Malaysia’s 2014 wood-based imports were from TPPA countries. Out of imports from TPPA countries, 35% was from Vietnam, 24% from US and 19% from Australia.
Other than with US, there is currently little trade of wood-based products with TPPA countries with which Malaysia has no free trade agreement (FTA), i.e. Peru, Mexico and Canada. Exports to these three countries make up 4.4% of exports to all TPPA countries.
However, even though Malaysia has a FTA with Chile, exports of wood-based products to Chile is only 0.94% of Malaysia’s exports to all TPPA countries. This is similar to exports of plastic products to Chile, which constitutes only 0.04% of Malaysia’s exports to TPPA countries.
Trade of wood and wood products
with TPPA countries (2014)
Source: DOSM
Australia
Furniture (48%), joinery (15%), wood strips (14%)
Japan
Plywood (64%), furniture (14%), fibreboard (5%)
Singapore
Furniture (38%), packing cases (23%), sawn timber (13%)
United States
Furniture (81%), plywood (5%), joinery (3%) 2.45
0.28
0.11
0.09
0.02
0.94
4.16
0.33
0.05
0.91
0.05
(0.14)
(0.02)
(0.00)
(0.00)
(0.00)
(0.02)
(0.01)
(0.20)
(0.00)
(0.11)
(0.07)
-2 0 2 4 6
US
Canada
Mexico
Chile
Peru
Singapore
Japan
Vietnam
Brunei
Australia
New Zealand
RM billion IMPORTS EXPORTS
2.30
0.26
0.11
0.09
0.02
0.91
4.15
0.13
0.05
0.80
(0.02)
(1) 0 1 2 3 4
US
Canada
Mexico
Chile
Peru
Singapore
Japan
Vietnam
Brunei
Australia
New Zealand
RM billion
Trade balance of wood and wood products
with TPPA countries (2014)

PwC
December 2015
218
Economic Impact of the Trans-Pacific Partnership Agreement •
Section 5.9 – Wood and wood products
Overall exports by value has been steady, with a slight decline over the past five years
Of the major subsectors in wood and wood products, Malaysia is a major exporter of wooden furniture and plywood, followed by sawn timber and saw logs. Exports recovered after the dip due to the global financial crisis, but has been declining overall in the past 5 years.
Employment in the wood-based sector has been declining
Employment in forestry and timber has been declining at an average of 5.6% per year over the past 5 years. It represented 6.2% of total employment in the manufacturing sector.
TPPA countries are a key demand market for wood products, particularly furniture
Exports of furniture made up approximately 31% of total exports of wood and wood products in 2014, where 61% of these furniture exports were to TPPA countries. In particular, the US and Japan combined contributed nearly 40% of 2014 exports of wood furniture.
Main exports of wood and wood products, RM billion
Source: MPIC
-
5
10
15
20
2009 2010 2011 2012 2013
Others
Furniture
Joinery
Mouldings
Plywood
Fibreboard
Sawn timber
Saw logs
0
200
400
600
2005 2007 2009 2011 2013
Oil Palm
Rubber
Forestry and Timber
Source: DOSM
Employment in main commodities, thousands
Main export destinations for wood and wood products (2014)
Source: COMTRADE
Japan 29%
USA 17%
India 11%
Rep. of Korea
7%
Singapore 7%
Australia 6%
China 6%
United Kingdom
5%
Thailand 4%
United Arab Emirates
4% Philippines
4%
Japan
USA
India
Rep. of Korea
Singapore
Australia
China
United Kingdom
Thailand
United Arab Emirates
Philippines
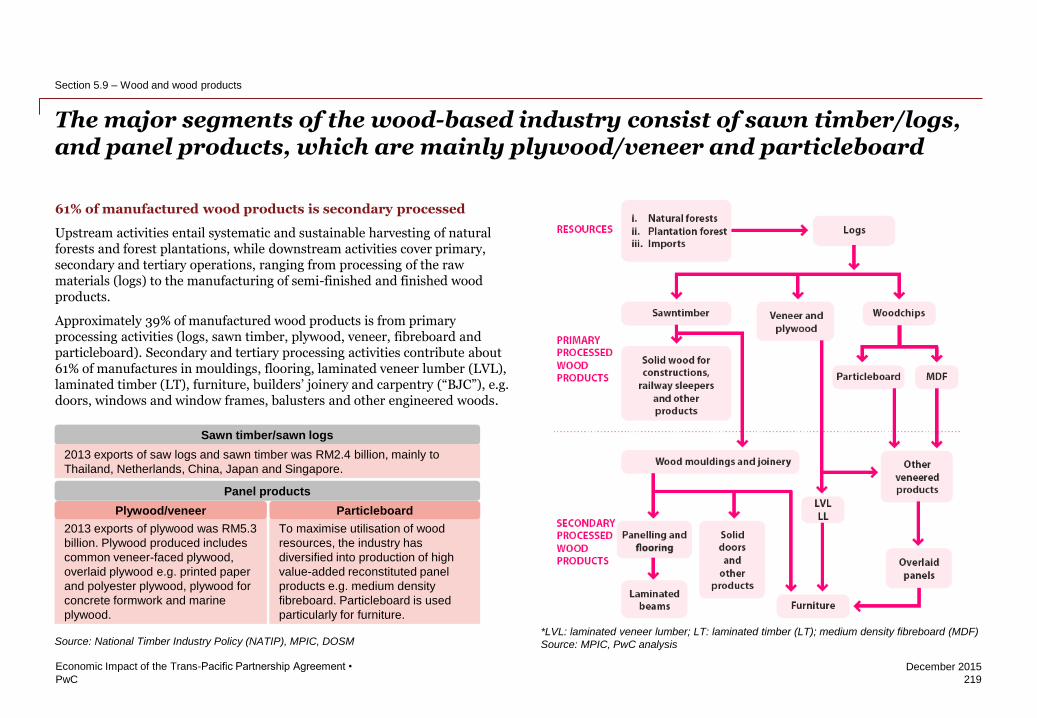
PwC
December 2015
The major segments of the wood-based industry consist of sawn timber/logs, and panel products, which are mainly plywood/veneer and particleboard
219
Economic Impact of the Trans-Pacific Partnership Agreement •
Section 5.9 – Wood and wood products
61% of manufactured wood products is secondary processed
Upstream activities entail systematic and sustainable harvesting of natural forests and forest plantations, while downstream activities cover primary, secondary and tertiary operations, ranging from processing of the raw materials (logs) to the manufacturing of semi-finished and finished wood products.
Approximately 39% of manufactured wood products is from primary processing activities (logs, sawn timber, plywood, veneer, fibreboard and particleboard). Secondary and tertiary processing activities contribute about 61% of manufactures in mouldings, flooring, laminated veneer lumber (LVL), laminated timber (LT), furniture, builders’ joinery and carpentry (“BJC”), e.g. doors, windows and window frames, balusters and other engineered woods.
Source: National Timber Industry Policy (NATIP), MPIC, DOSM *LVL: laminated veneer lumber; LT: laminated timber (LT); medium density fibreboard (MDF)
Source: MPIC, PwC analysis
Sawn timber/sawn logs
Panel products
2013 exports of saw logs and sawn timber was RM2.4 billion, mainly to
Thailand, Netherlands, China, Japan and Singapore.
2013 exports of plywood was RM5.3
billion. Plywood produced includes
common veneer-faced plywood,
overlaid plywood e.g. printed paper
and polyester plywood, plywood for
concrete formwork and marine
plywood.
To maximise utilisation of wood
resources, the industry has
diversified into production of high
value-added reconstituted panel
products e.g. medium density
fibreboard. Particleboard is used
particularly for furniture.
Plywood/veneer Particleboard
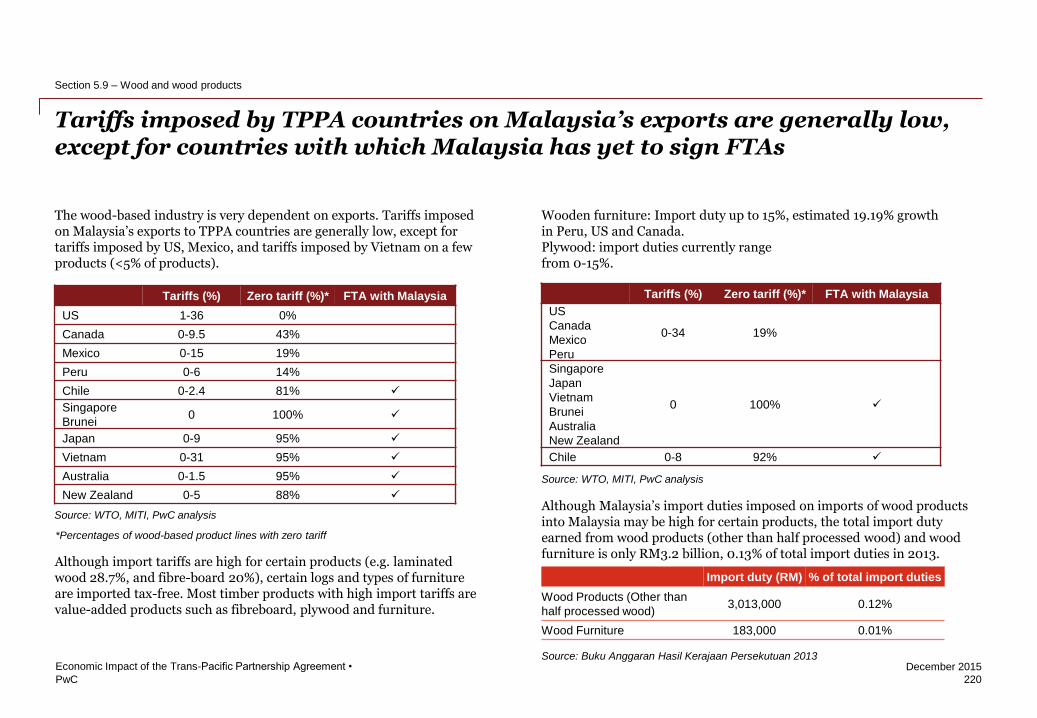
PwC
December 2015
Tariffs imposed by TPPA countries on Malaysia’s exports are generally low, except for countries with which Malaysia has yet to sign FTAs
220
Economic Impact of the Trans-Pacific Partnership Agreement •
Section 5.9 – Wood and wood products
The wood-based industry is very dependent on exports. Tariffs imposed on Malaysia’s exports to TPPA countries are generally low, except for tariffs imposed by US, Mexico, and tariffs imposed by Vietnam on a few products (<5% of products).
Although import tariffs are high for certain products (e.g. laminated wood 28.7%, and fibre-board 20%), certain logs and types of furniture are imported tax-free. Most timber products with high import tariffs are value-added products such as fibreboard, plywood and furniture.
Wooden furniture: Import duty up to 15%, estimated 19.19% growth in Peru, US and Canada. Plywood: import duties currently range from 0-15%.
Although Malaysia’s import duties imposed on imports of wood products into Malaysia may be high for certain products, the total import duty earned from wood products (other than half processed wood) and wood furniture is only RM3.2 billion, 0.13% of total import duties in 2013.
Import duty (RM) % of total import duties
Wood Products (Other than
half processed wood) 3,013,000 0.12%
Wood Furniture 183,000 0.01%
Tariffs (%) Zero tariff (%)* FTA with Malaysia
US
Canada
Mexico
Peru
0-34 19%
Singapore
Japan
Vietnam
Brunei
Australia
New Zealand
0 100%
Chile 0-8 92%
Tariffs (%) Zero tariff (%)* FTA with Malaysia
US 1-36 0%
Canada 0-9.5 43%
Mexico 0-15 19%
Peru 0-6 14%
Chile 0-2.4 81%
Singapore
Brunei 0 100%
Japan 0-9 95%
Vietnam 0-31 95%
Australia 0-1.5 95%
New Zealand 0-5 88%
*Percentages of wood-based product lines with zero tariff
Source: WTO, MITI, PwC analysis
Source: WTO, MITI, PwC analysis
Source: Buku Anggaran Hasil Kerajaan Persekutuan 2013
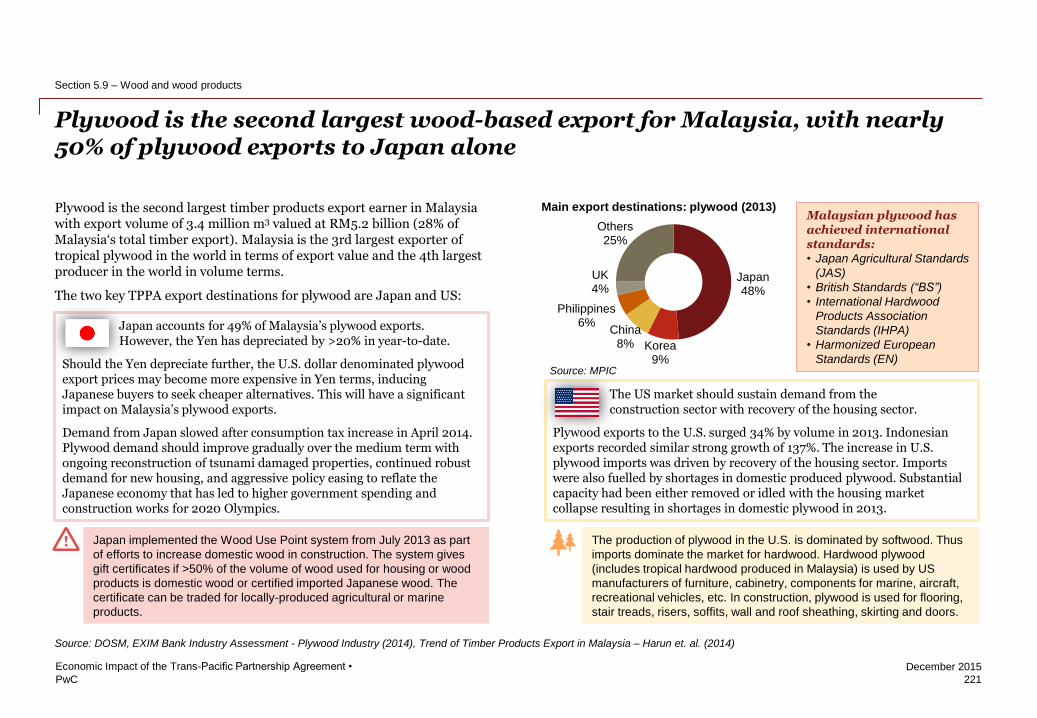
PwC
December 2015
Japan accounts for 49% of Malaysia’s plywood exports. However, the Yen has depreciated by >20% in year-to-date.
Should the Yen depreciate further, the U.S. dollar denominated plywood export prices may become more expensive in Yen terms, inducing Japanese buyers to seek cheaper alternatives. This will have a significant impact on Malaysia’s plywood exports.
Demand from Japan slowed after consumption tax increase in April 2014. Plywood demand should improve gradually over the medium term with ongoing reconstruction of tsunami damaged properties, continued robust demand for new housing, and aggressive policy easing to reflate the Japanese economy that has led to higher government spending and construction works for 2020 Olympics.
The US market should sustain demand from the construction sector with recovery of the housing sector.
Plywood exports to the U.S. surged 34% by volume in 2013. Indonesian exports recorded similar strong growth of 137%. The increase in U.S. plywood imports was driven by recovery of the housing sector. Imports were also fuelled by shortages in domestic produced plywood. Substantial capacity had been either removed or idled with the housing market collapse resulting in shortages in domestic plywood in 2013.
Plywood is the second largest wood-based export for Malaysia, with nearly 50% of plywood exports to Japan alone
221
Economic Impact of the Trans-Pacific Partnership Agreement •
Section 5.9 – Wood and wood products
Plywood is the second largest timber products export earner in Malaysia with export volume of 3.4 million m3 valued at RM5.2 billion (28% of Malaysia‘s total timber export). Malaysia is the 3rd largest exporter of tropical plywood in the world in terms of export value and the 4th largest producer in the world in volume terms.
The two key TPPA export destinations for plywood are Japan and US:
Japan implemented the Wood Use Point system from July 2013 as part
of efforts to increase domestic wood in construction. The system gives
gift certificates if >50% of the volume of wood used for housing or wood
products is domestic wood or certified imported Japanese wood. The
certificate can be traded for locally-produced agricultural or marine
products.
Japan 48%
Korea 9%
China 8%
Philippines 6%
UK 4%
Others 25%
Main export destinations: plywood (2013)
Source: DOSM, EXIM Bank Industry Assessment - Plywood Industry (2014), Trend of Timber Products Export in Malaysia – Harun et. al. (2014)
The production of plywood in the U.S. is dominated by softwood. Thus
imports dominate the market for hardwood. Hardwood plywood
(includes tropical hardwood produced in Malaysia) is used by US
manufacturers of furniture, cabinetry, components for marine, aircraft,
recreational vehicles, etc. In construction, plywood is used for flooring,
stair treads, risers, soffits, wall and roof sheathing, skirting and doors.
Malaysian plywood has achieved international standards: • Japan Agricultural Standards
(JAS)
• British Standards (“BS”)
• International Hardwood
Products Association
Standards (IHPA)
• Harmonized European
Standards (EN) Source: MPIC
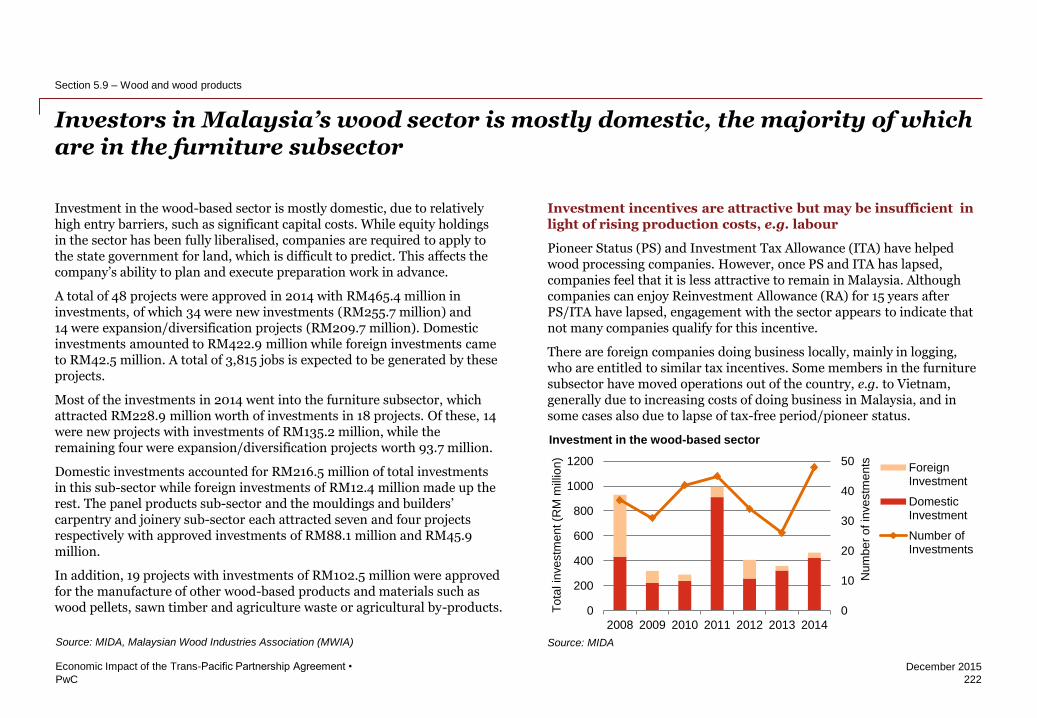
PwC
December 2015
Investors in Malaysia’s wood sector is mostly domestic, the majority of which are in the furniture subsector
222
Economic Impact of the Trans-Pacific Partnership Agreement •
Section 5.9 – Wood and wood products
Investment in the wood-based sector is mostly domestic, due to relatively high entry barriers, such as significant capital costs. While equity holdings in the sector has been fully liberalised, companies are required to apply to the state government for land, which is difficult to predict. This affects the company’s ability to plan and execute preparation work in advance.
A total of 48 projects were approved in 2014 with RM465.4 million in investments, of which 34 were new investments (RM255.7 million) and 14 were expansion/diversification projects (RM209.7 million). Domestic investments amounted to RM422.9 million while foreign investments came to RM42.5 million. A total of 3,815 jobs is expected to be generated by these projects.
Most of the investments in 2014 went into the furniture subsector, which attracted RM228.9 million worth of investments in 18 projects. Of these, 14 were new projects with investments of RM135.2 million, while the remaining four were expansion/diversification projects worth 93.7 million.
Domestic investments accounted for RM216.5 million of total investments in this sub-sector while foreign investments of RM12.4 million made up the rest. The panel products sub-sector and the mouldings and builders’ carpentry and joinery sub-sector each attracted seven and four projects respectively with approved investments of RM88.1 million and RM45.9 million.
In addition, 19 projects with investments of RM102.5 million were approved for the manufacture of other wood-based products and materials such as wood pellets, sawn timber and agriculture waste or agricultural by-products.
Source: MIDA
0
10
20
30
40
50
0
200
400
600
800
1000
1200
2008 2009 2010 2011 2012 2013 2014
ForeignInvestment
DomesticInvestment
Number ofInvestments
To
tal in
ve
stm
en
t (R
M m
illio
n)
Num
be
r o
f in
ve
stm
en
ts
Investment incentives are attractive but may be insufficient in light of rising production costs, e.g. labour
Pioneer Status (PS) and Investment Tax Allowance (ITA) have helped wood processing companies. However, once PS and ITA has lapsed, companies feel that it is less attractive to remain in Malaysia. Although companies can enjoy Reinvestment Allowance (RA) for 15 years after PS/ITA have lapsed, engagement with the sector appears to indicate that not many companies qualify for this incentive.
There are foreign companies doing business locally, mainly in logging, who are entitled to similar tax incentives. Some members in the furniture subsector have moved operations out of the country, e.g. to Vietnam, generally due to increasing costs of doing business in Malaysia, and in some cases also due to lapse of tax-free period/pioneer status.
Investment in the wood-based sector
Source: MIDA, Malaysian Wood Industries Association (MWIA)
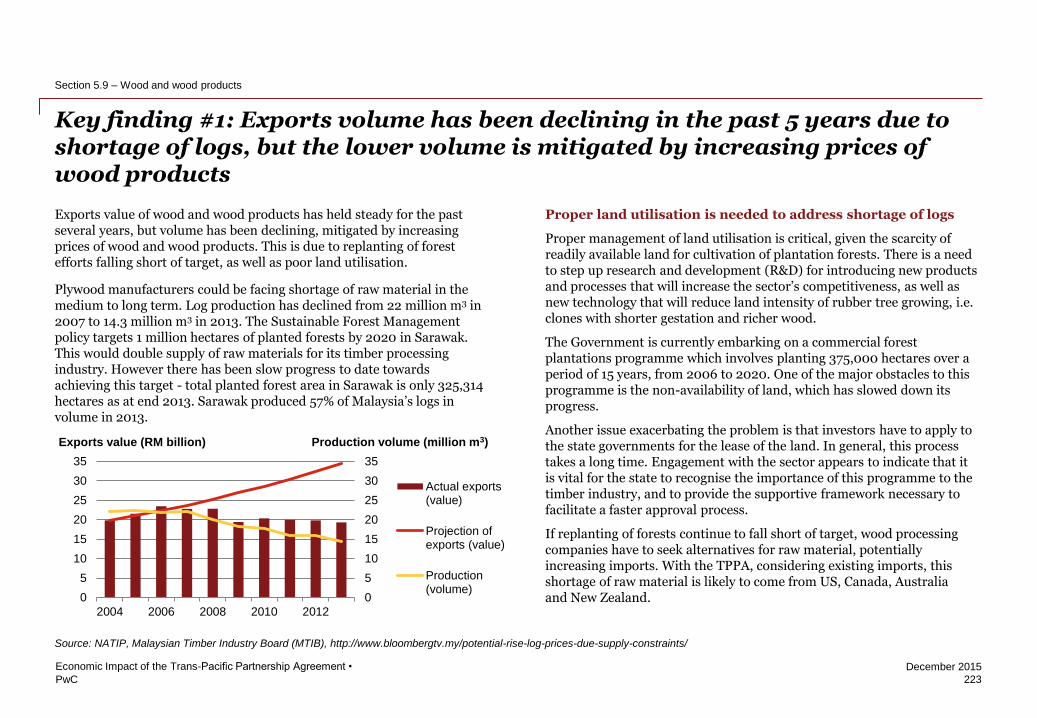
PwC
December 2015
Proper land utilisation is needed to address shortage of logs
Proper management of land utilisation is critical, given the scarcity of readily available land for cultivation of plantation forests. There is a need to step up research and development (R&D) for introducing new products and processes that will increase the sector’s competitiveness, as well as new technology that will reduce land intensity of rubber tree growing, i.e. clones with shorter gestation and richer wood.
The Government is currently embarking on a commercial forest plantations programme which involves planting 375,000 hectares over a period of 15 years, from 2006 to 2020. One of the major obstacles to this programme is the non-availability of land, which has slowed down its progress.
Another issue exacerbating the problem is that investors have to apply to the state governments for the lease of the land. In general, this process takes a long time. Engagement with the sector appears to indicate that it is vital for the state to recognise the importance of this programme to the timber industry, and to provide the supportive framework necessary to facilitate a faster approval process.
If replanting of forests continue to fall short of target, wood processing companies have to seek alternatives for raw material, potentially increasing imports. With the TPPA, considering existing imports, this shortage of raw material is likely to come from US, Canada, Australia and New Zealand.
Key finding #1: Exports volume has been declining in the past 5 years due to shortage of logs, but the lower volume is mitigated by increasing prices of wood products
223
Economic Impact of the Trans-Pacific Partnership Agreement •
Section 5.9 – Wood and wood products
Source: NATIP, Malaysian Timber Industry Board (MTIB), http://www.bloombergtv.my/potential-rise-log-prices-due-supply-constraints/
Exports value of wood and wood products has held steady for the past several years, but volume has been declining, mitigated by increasing prices of wood and wood products. This is due to replanting of forest efforts falling short of target, as well as poor land utilisation.
Plywood manufacturers could be facing shortage of raw material in the medium to long term. Log production has declined from 22 million m3 in 2007 to 14.3 million m3 in 2013. The Sustainable Forest Management policy targets 1 million hectares of planted forests by 2020 in Sarawak. This would double supply of raw materials for its timber processing industry. However there has been slow progress to date towards achieving this target - total planted forest area in Sarawak is only 325,314 hectares as at end 2013. Sarawak produced 57% of Malaysia’s logs in volume in 2013.
0
5
10
15
20
25
30
35
0
5
10
15
20
25
30
35
2004 2006 2008 2010 2012
Actual exports(value)
Projection ofexports (value)
Production(volume)
Exports value (RM billion) Production volume (million m3)
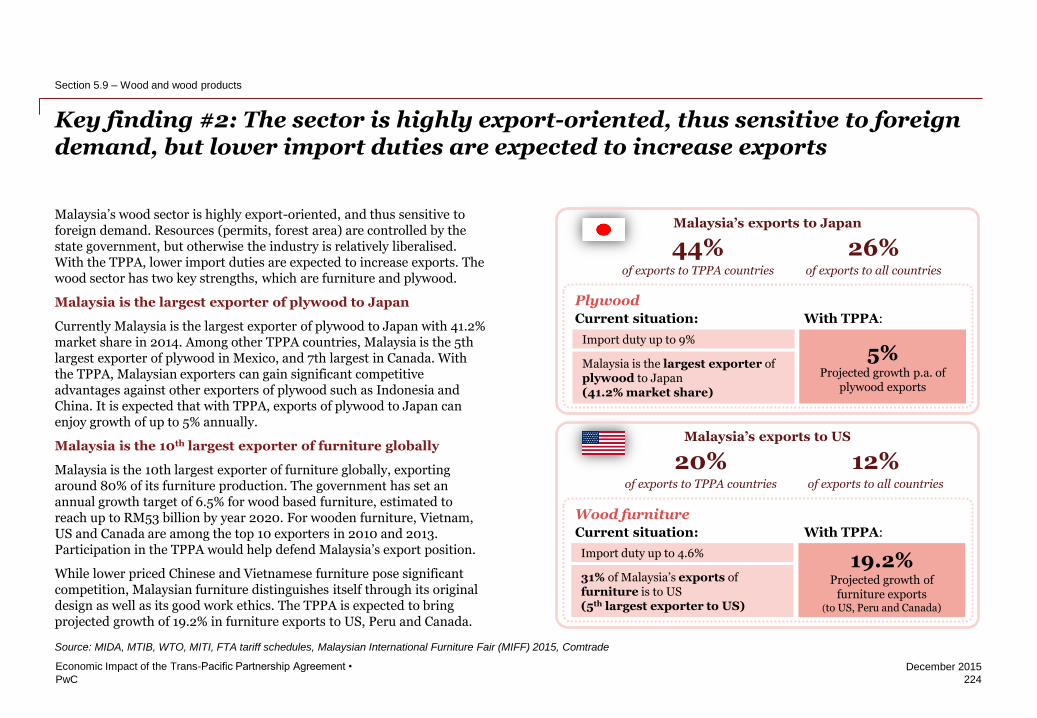
PwC
December 2015
Key finding #2: The sector is highly export-oriented, thus sensitive to foreign demand, but lower import duties are expected to increase exports
224
Economic Impact of the Trans-Pacific Partnership Agreement •
Section 5.9 – Wood and wood products
Import duty up to 9%
Malaysia is the largest exporter of plywood to Japan (41.2% market share)
Plywood
Current situation: With TPPA:
5% Projected growth p.a. of
plywood exports
Malaysia’s exports to Japan
44%
of exports to TPPA countries
26%
of exports to all countries
12%
of exports to all countries
20%
of exports to TPPA countries
Malaysia’s exports to US
Wood furniture
Current situation: With TPPA:
Import duty up to 4.6%
31% of Malaysia’s exports of furniture is to US (5th largest exporter to US)
19.2% Projected growth of
furniture exports (to US, Peru and Canada)
Source: MIDA, MTIB, WTO, MITI, FTA tariff schedules, Malaysian International Furniture Fair (MIFF) 2015, Comtrade
Malaysia’s wood sector is highly export-oriented, and thus sensitive to foreign demand. Resources (permits, forest area) are controlled by the state government, but otherwise the industry is relatively liberalised. With the TPPA, lower import duties are expected to increase exports. The wood sector has two key strengths, which are furniture and plywood.
Malaysia is the largest exporter of plywood to Japan
Currently Malaysia is the largest exporter of plywood to Japan with 41.2% market share in 2014. Among other TPPA countries, Malaysia is the 5th largest exporter of plywood in Mexico, and 7th largest in Canada. With the TPPA, Malaysian exporters can gain significant competitive advantages against other exporters of plywood such as Indonesia and China. It is expected that with TPPA, exports of plywood to Japan can enjoy growth of up to 5% annually.
Malaysia is the 10th largest exporter of furniture globally
Malaysia is the 10th largest exporter of furniture globally, exporting around 80% of its furniture production. The government has set an annual growth target of 6.5% for wood based furniture, estimated to reach up to RM53 billion by year 2020. For wooden furniture, Vietnam, US and Canada are among the top 10 exporters in 2010 and 2013. Participation in the TPPA would help defend Malaysia’s export position.
While lower priced Chinese and Vietnamese furniture pose significant competition, Malaysian furniture distinguishes itself through its original design as well as its good work ethics. The TPPA is expected to bring projected growth of 19.2% in furniture exports to US, Peru and Canada.
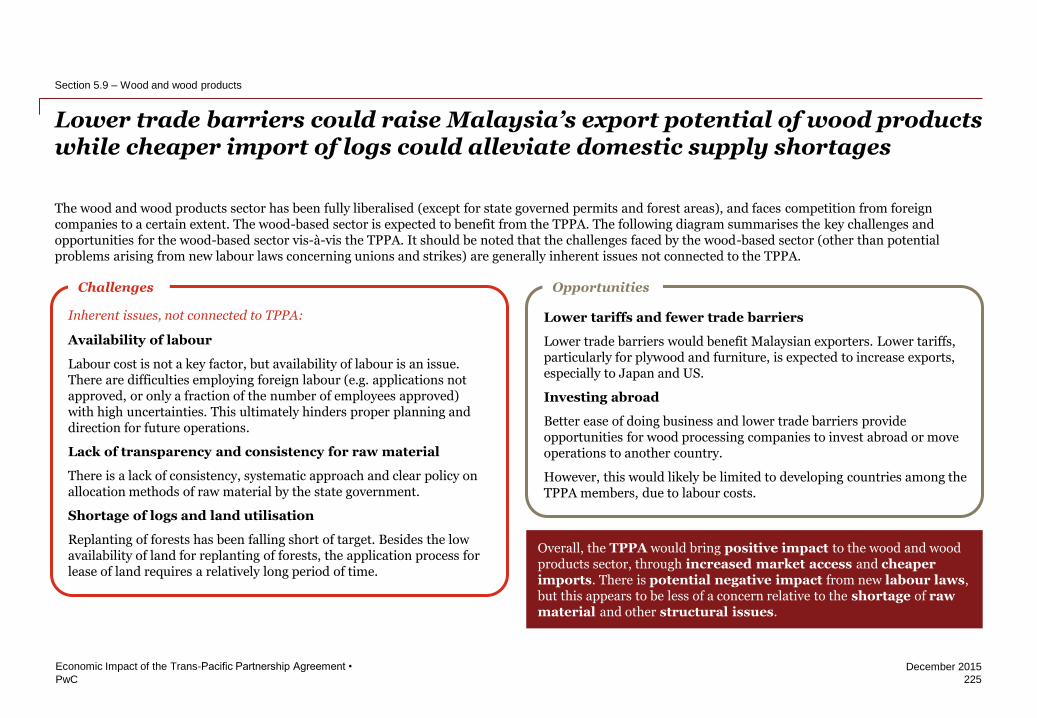
PwC
December 2015
Lower trade barriers could raise Malaysia’s export potential of wood products while cheaper import of logs could alleviate domestic supply shortages
225
Economic Impact of the Trans-Pacific Partnership Agreement •
Section 5.9 – Wood and wood products
The wood and wood products sector has been fully liberalised (except for state governed permits and forest areas), and faces competition from foreign companies to a certain extent. The wood-based sector is expected to benefit from the TPPA. The following diagram summarises the key challenges and opportunities for the wood-based sector vis-à-vis the TPPA. It should be noted that the challenges faced by the wood-based sector (other than potential problems arising from new labour laws concerning unions and strikes) are generally inherent issues not connected to the TPPA.
Lower tariffs and fewer trade barriers
Lower trade barriers would benefit Malaysian exporters. Lower tariffs, particularly for plywood and furniture, is expected to increase exports, especially to Japan and US.
Investing abroad
Better ease of doing business and lower trade barriers provide opportunities for wood processing companies to invest abroad or move operations to another country.
However, this would likely be limited to developing countries among the TPPA members, due to labour costs.
Challenges Opportunities
Availability of labour
Labour cost is not a key factor, but availability of labour is an issue. There are difficulties employing foreign labour (e.g. applications not approved, or only a fraction of the number of employees approved) with high uncertainties. This ultimately hinders proper planning and direction for future operations.
Lack of transparency and consistency for raw material
There is a lack of consistency, systematic approach and clear policy on allocation methods of raw material by the state government.
Shortage of logs and land utilisation
Replanting of forests has been falling short of target. Besides the low availability of land for replanting of forests, the application process for lease of land requires a relatively long period of time.
Inherent issues, not connected to TPPA:
Overall, the TPPA would bring positive impact to the wood and wood products sector, through increased market access and cheaper imports. There is potential negative impact from new labour laws, but this appears to be less of a concern relative to the shortage of raw material and other structural issues.

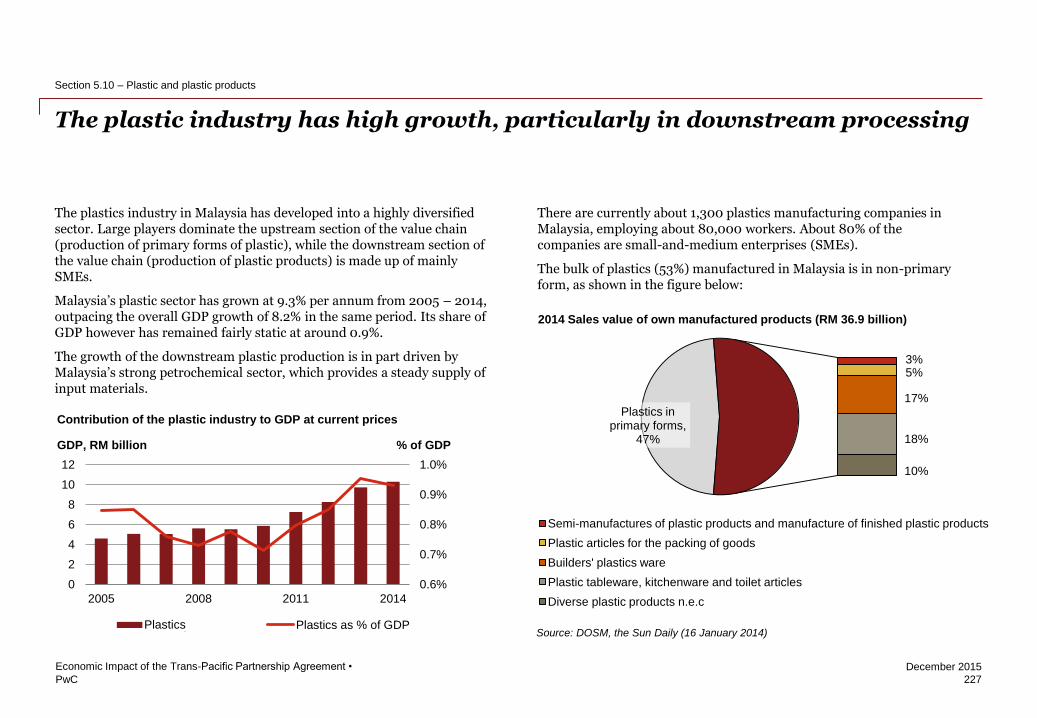
PwC
December 2015
The plastic industry has high growth, particularly in downstream processing
227
Economic Impact of the Trans-Pacific Partnership Agreement •
Section 5.10 – Plastic and plastic products
The plastics industry in Malaysia has developed into a highly diversified sector. Large players dominate the upstream section of the value chain (production of primary forms of plastic), while the downstream section of the value chain (production of plastic products) is made up of mainly SMEs.
Malaysia’s plastic sector has grown at 9.3% per annum from 2005 – 2014, outpacing the overall GDP growth of 8.2% in the same period. Its share of GDP however has remained fairly static at around 0.9%.
The growth of the downstream plastic production is in part driven by Malaysia’s strong petrochemical sector, which provides a steady supply of input materials.
There are currently about 1,300 plastics manufacturing companies in Malaysia, employing about 80,000 workers. About 80% of the companies are small-and-medium enterprises (SMEs).
The bulk of plastics (53%) manufactured in Malaysia is in non-primary form, as shown in the figure below:
Plastics in primary forms,
47%
3% 5%
17%
18%
10%
Semi-manufactures of plastic products and manufacture of finished plastic products
Plastic articles for the packing of goods
Builders' plastics ware
Plastic tableware, kitchenware and toilet articles
Diverse plastic products n.e.c
2014 Sales value of own manufactured products (RM 36.9 billion)
Source: DOSM, the Sun Daily (16 January 2014)
0.6%
0.7%
0.8%
0.9%
1.0%
0
2
4
6
8
10
12
2005 2008 2011 2014
Plastic products Plastics as % of GDP
% of GDP GDP, RM billion
Contribution of the plastic industry to GDP at current prices
Plastics
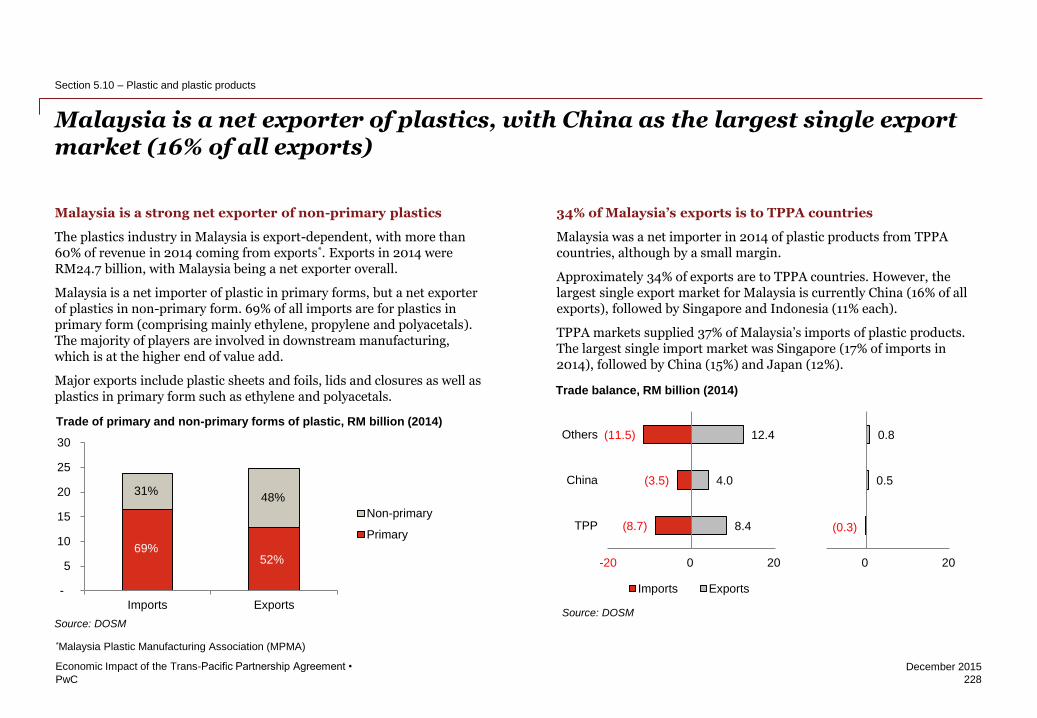
PwC
December 2015
Malaysia is a net exporter of plastics, with China as the largest single export market (16% of all exports)
228
Economic Impact of the Trans-Pacific Partnership Agreement •
Section 5.10 – Plastic and plastic products
34% of Malaysia’s exports is to TPPA countries
Malaysia was a net importer in 2014 of plastic products from TPPA countries, although by a small margin.
Approximately 34% of exports are to TPPA countries. However, the largest single export market for Malaysia is currently China (16% of all exports), followed by Singapore and Indonesia (11% each).
TPPA markets supplied 37% of Malaysia’s imports of plastic products. The largest single import market was Singapore (17% of imports in 2014), followed by China (15%) and Japan (12%).
Source: DOSM
(0.3)
0.5
0.8
-20 0 20
TPP
China
Others
8.4
4.0
12.4
(8.7)
(3.5)
(11.5)
-20 0 20
TPP
China
Others
Imports Exports
Trade balance, RM billion (2014)
Malaysia is a strong net exporter of non-primary plastics
The plastics industry in Malaysia is export-dependent, with more than 60% of revenue in 2014 coming from exports*. Exports in 2014 were RM24.7 billion, with Malaysia being a net exporter overall.
Malaysia is a net importer of plastic in primary forms, but a net exporter of plastics in non-primary form. 69% of all imports are for plastics in primary form (comprising mainly ethylene, propylene and polyacetals). The majority of players are involved in downstream manufacturing, which is at the higher end of value add.
Major exports include plastic sheets and foils, lids and closures as well as plastics in primary form such as ethylene and polyacetals.
*Malaysia Plastic Manufacturing Association (MPMA)
Trade of primary and non-primary forms of plastic, RM billion (2014)
Source: DOSM
-
5
10
15
20
25
30
Imports Exports
Non-primary
Primary69%
31%
52%
48%
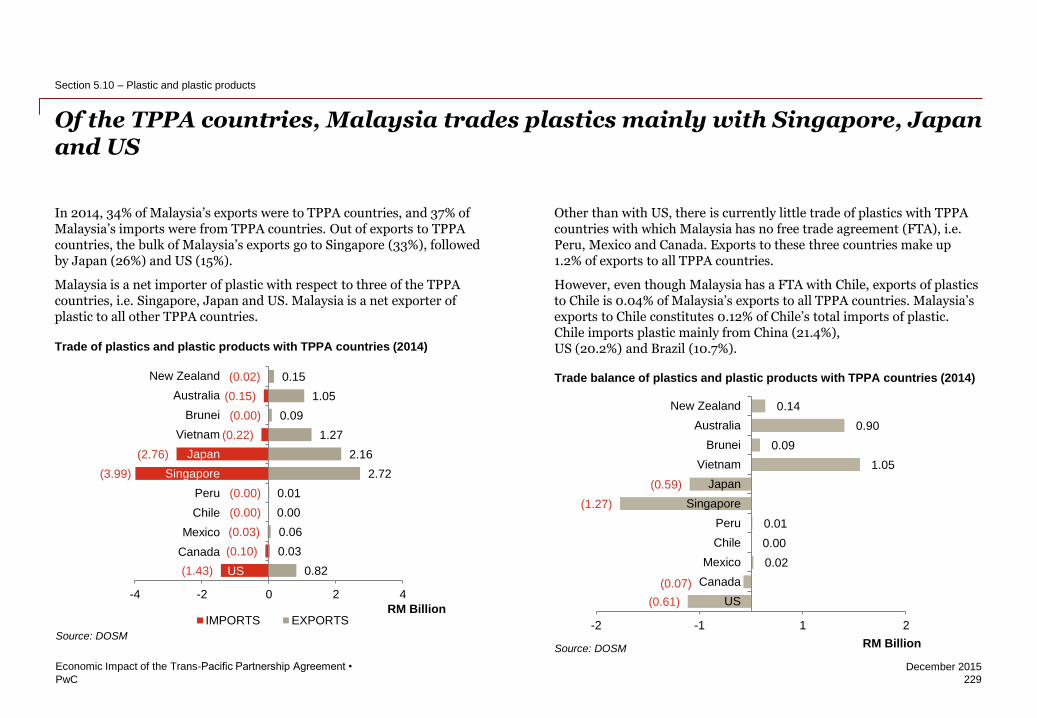
PwC
December 2015
229
Economic Impact of the Trans-Pacific Partnership Agreement •
Section 5.10 – Plastic and plastic products
(0.61)
(0.07)
0.02
0.00
0.01
(1.27)
(0.59)
1.05
0.09
0.90
0.14
-2 -1 1 2
US
Canada
Mexico
Chile
Peru
Singapore
Japan
Vietnam
Brunei
Australia
New Zealand
RM Billion
Of the TPPA countries, Malaysia trades plastics mainly with Singapore, Japan and US
In 2014, 34% of Malaysia’s exports were to TPPA countries, and 37% of Malaysia’s imports were from TPPA countries. Out of exports to TPPA countries, the bulk of Malaysia’s exports go to Singapore (33%), followed by Japan (26%) and US (15%).
Malaysia is a net importer of plastic with respect to three of the TPPA countries, i.e. Singapore, Japan and US. Malaysia is a net exporter of plastic to all other TPPA countries.
Other than with US, there is currently little trade of plastics with TPPA countries with which Malaysia has no free trade agreement (FTA), i.e. Peru, Mexico and Canada. Exports to these three countries make up 1.2% of exports to all TPPA countries.
However, even though Malaysia has a FTA with Chile, exports of plastics to Chile is 0.04% of Malaysia’s exports to all TPPA countries. Malaysia’s exports to Chile constitutes 0.12% of Chile’s total imports of plastic. Chile imports plastic mainly from China (21.4%), US (20.2%) and Brazil (10.7%).
0.82
0.03
0.06
0.00
0.01
2.72
2.16
1.27
0.09
1.05
0.15
(1.43)
(0.10)
(0.03)
(0.00)
(0.00)
(3.99)
(2.76)
(0.22)
(0.00)
(0.15)
(0.02)
-4 -2 0 2 4
RM Billion IMPORTS EXPORTS
New Zealand
Australia
Brunei
Vietnam
Japan
Singapore
Peru
Chile
Mexico
Canada
US
Trade of plastics and plastic products with TPPA countries (2014)
Trade balance of plastics and plastic products with TPPA countries (2014)
Source: DOSM
Source: DOSM
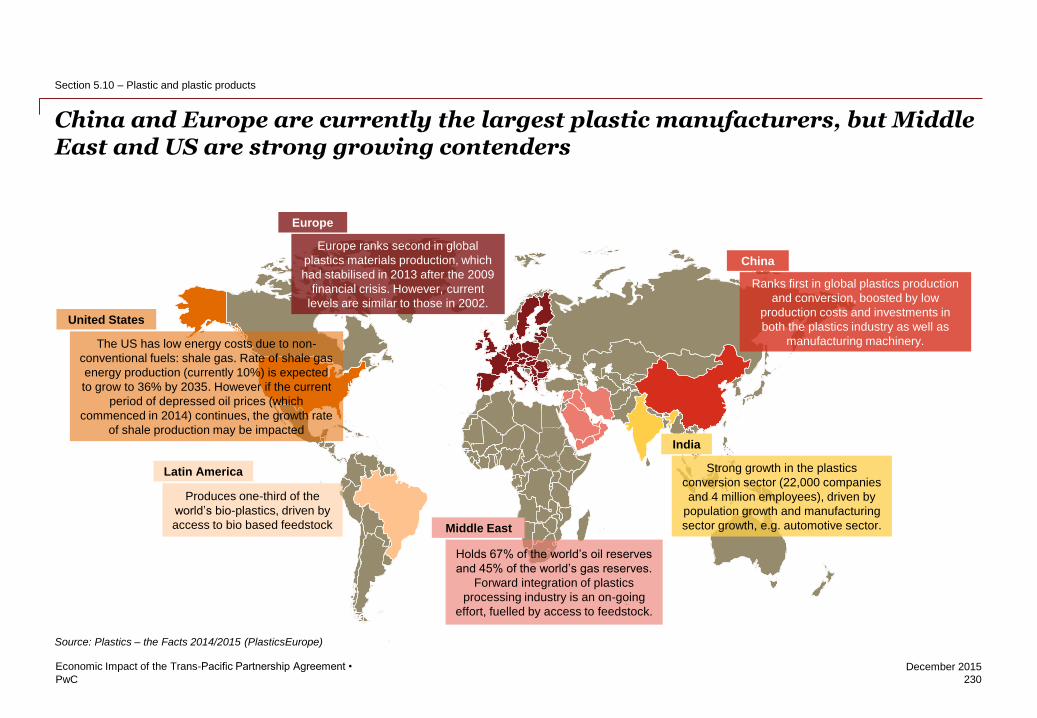
PwC
December 2015
230
Economic Impact of the Trans-Pacific Partnership Agreement •
Section 5.10 – Plastic and plastic products
Source: Plastics – the Facts 2014/2015 (PlasticsEurope)
China and Europe are currently the largest plastic manufacturers, but Middle East and US are strong growing contenders
The US has low energy costs due to non-
conventional fuels: shale gas. Rate of shale gas
energy production (currently 10%) is expected
to grow to 36% by 2035. However if the current
period of depressed oil prices (which
commenced in 2014) continues, the growth rate
of shale production may be impacted
Produces one-third of the
world’s bio-plastics, driven by
access to bio based feedstock
Holds 67% of the world’s oil reserves
and 45% of the world’s gas reserves.
Forward integration of plastics
processing industry is an on-going
effort, fuelled by access to feedstock.
Strong growth in the plastics
conversion sector (22,000 companies
and 4 million employees), driven by
population growth and manufacturing
sector growth, e.g. automotive sector.
Ranks first in global plastics production
and conversion, boosted by low
production costs and investments in
both the plastics industry as well as
manufacturing machinery.
Europe ranks second in global
plastics materials production, which
had stabilised in 2013 after the 2009
financial crisis. However, current
levels are similar to those in 2002.
Latin America
United States
Europe
China
Middle East
India
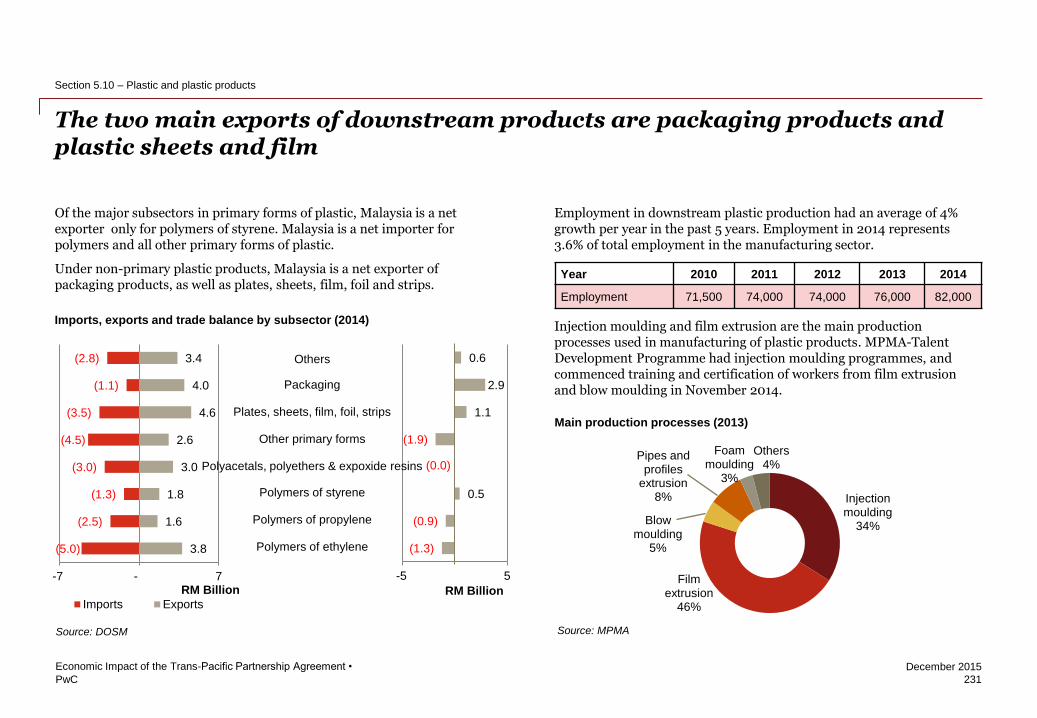
PwC
December 2015
231
Economic Impact of the Trans-Pacific Partnership Agreement •
Section 5.10 – Plastic and plastic products
The two main exports of downstream products are packaging products and plastic sheets and film
Of the major subsectors in primary forms of plastic, Malaysia is a net exporter only for polymers of styrene. Malaysia is a net importer for polymers and all other primary forms of plastic.
Under non-primary plastic products, Malaysia is a net exporter of packaging products, as well as plates, sheets, film, foil and strips.
Employment in downstream plastic production had an average of 4% growth per year in the past 5 years. Employment in 2014 represents 3.6% of total employment in the manufacturing sector.
Injection moulding and film extrusion are the main production processes used in manufacturing of plastic products. MPMA-Talent Development Programme had injection moulding programmes, and commenced training and certification of workers from film extrusion and blow moulding in November 2014.
Source: DOSM Source: MPMA
Imports, exports and trade balance by subsector (2014)
Year 2010 2011 2012 2013 2014
Employment 71,500 74,000 74,000 76,000 82,000
Main production processes (2013)
Injection moulding
34%
Film extrusion
46%
Blow moulding
5%
Pipes and profiles
extrusion 8%
Foam moulding
3%
Others 4%
3.8
1.6
1.8
3.0
2.6
4.6
4.0
3.4
(5.0)
(2.5)
(1.3)
(3.0)
(4.5)
(3.5)
(1.1)
(2.8)
-7 - 7RM Billion
Imports Exports
(1.3)
(0.9)
0.5
(0.0)
(1.9)
1.1
2.9
0.6
-5 5
RM Billion
Others
Packaging
Plates, sheets, film, foil, strips
Other primary forms
Polyacetals, polyethers & expoxide resins
Polymers of styrene
Polymers of propylene
Polymers of ethylene
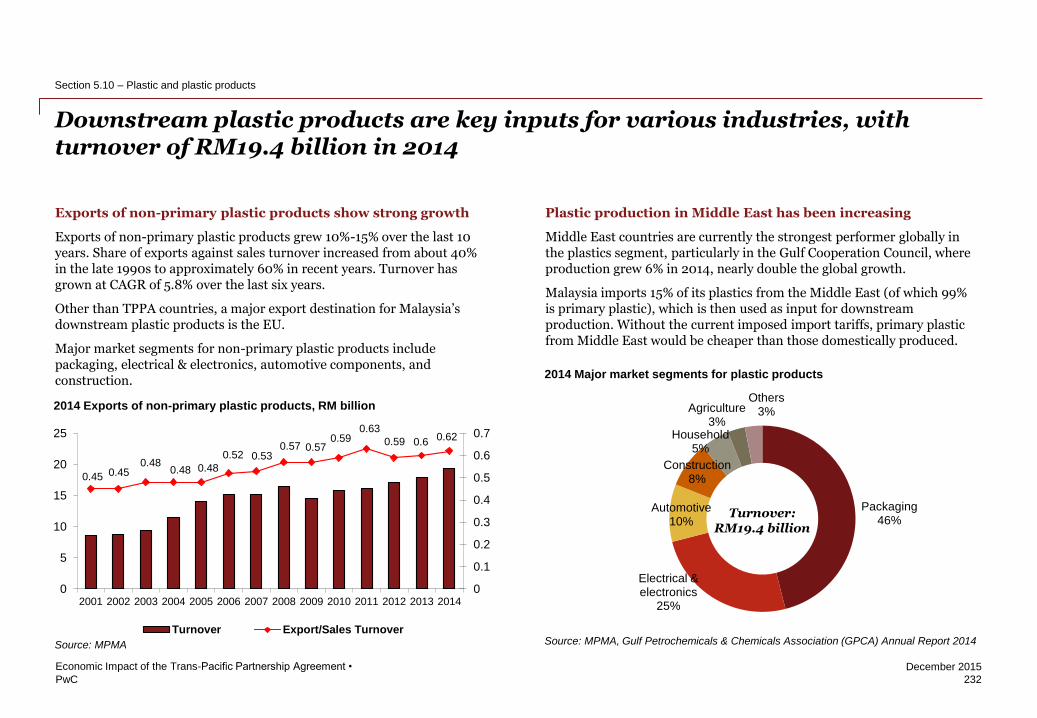
PwC
December 2015
232
Economic Impact of the Trans-Pacific Partnership Agreement •
Section 5.10 – Plastic and plastic products
Downstream plastic products are key inputs for various industries, with turnover of RM19.4 billion in 2014
Plastic production in Middle East has been increasing
Middle East countries are currently the strongest performer globally in the plastics segment, particularly in the Gulf Cooperation Council, where production grew 6% in 2014, nearly double the global growth.
Malaysia imports 15% of its plastics from the Middle East (of which 99% is primary plastic), which is then used as input for downstream production. Without the current imposed import tariffs, primary plastic from Middle East would be cheaper than those domestically produced.
Packaging 46%
Electrical & electronics
25%
Automotive 10%
Construction 8%
Household 5%
Agriculture 3%
Others 3%
2014 Major market segments for plastic products
Source: MPMA, Gulf Petrochemicals & Chemicals Association (GPCA) Annual Report 2014
0.45 0.45 0.48
0.48 0.48
0.52 0.53 0.57 0.57
0.59 0.63
0.59 0.6 0.62
0
0.1
0.2
0.3
0.4
0.5
0.6
0.7
0
5
10
15
20
25
2001 2002 2003 2004 2005 2006 2007 2008 2009 2010 2011 2012 2013 2014
Turnover Export/Sales Turnover
Turnover: RM19.4 billion
Source: MPMA
2014 Exports of non-primary plastic products, RM billion
Exports of non-primary plastic products show strong growth
Exports of non-primary plastic products grew 10%-15% over the last 10 years. Share of exports against sales turnover increased from about 40% in the late 1990s to approximately 60% in recent years. Turnover has grown at CAGR of 5.8% over the last six years.
Other than TPPA countries, a major export destination for Malaysia’s downstream plastic products is the EU.
Major market segments for non-primary plastic products include packaging, electrical & electronics, automotive components, and construction.
1) Added CAGR
2) Without the current imposed import tariffs, primary
plastic from Middle East would be cheaper than those
domestically produced
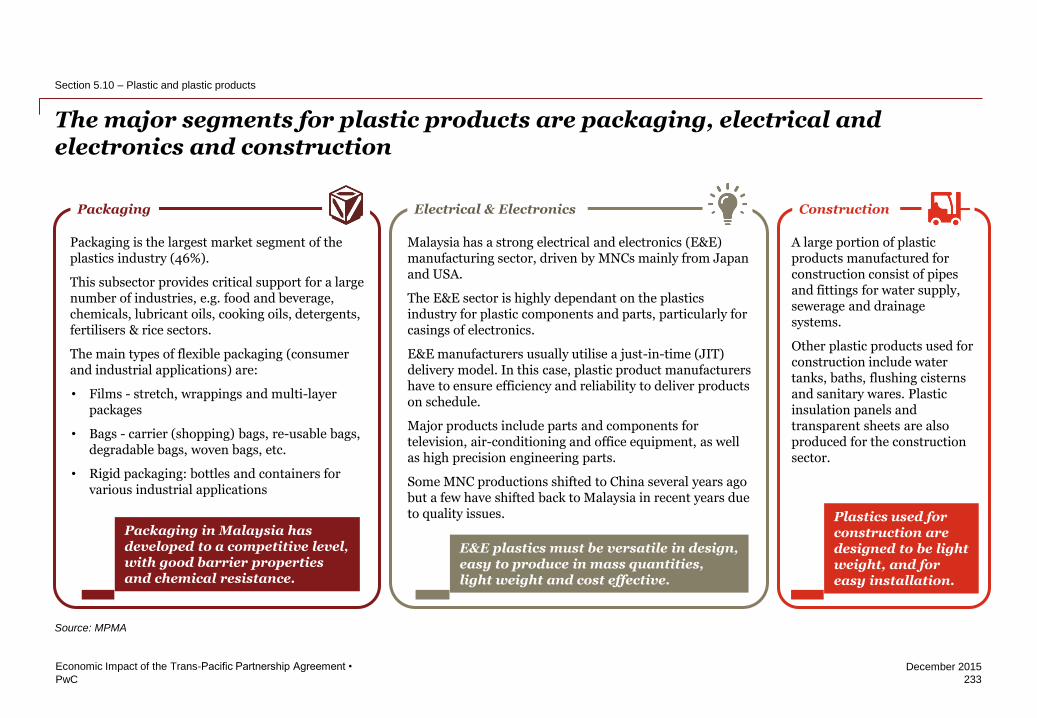
PwC
December 2015
The major segments for plastic products are packaging, electrical and electronics and construction
233
Economic Impact of the Trans-Pacific Partnership Agreement •
Section 5.10 – Plastic and plastic products
A large portion of plastic products manufactured for construction consist of pipes and fittings for water supply, sewerage and drainage systems.
Other plastic products used for construction include water tanks, baths, flushing cisterns and sanitary wares. Plastic insulation panels and transparent sheets are also produced for the construction sector.
Packaging Electrical & Electronics Construction
Packaging is the largest market segment of the plastics industry (46%).
This subsector provides critical support for a large number of industries, e.g. food and beverage, chemicals, lubricant oils, cooking oils, detergents, fertilisers & rice sectors.
The main types of flexible packaging (consumer and industrial applications) are:
• Films - stretch, wrappings and multi-layer packages
• Bags - carrier (shopping) bags, re-usable bags, degradable bags, woven bags, etc.
• Rigid packaging: bottles and containers for various industrial applications
Malaysia has a strong electrical and electronics (E&E) manufacturing sector, driven by MNCs mainly from Japan and USA.
The E&E sector is highly dependant on the plastics industry for plastic components and parts, particularly for casings of electronics.
E&E manufacturers usually utilise a just-in-time (JIT) delivery model. In this case, plastic product manufacturers have to ensure efficiency and reliability to deliver products on schedule.
Major products include parts and components for television, air-conditioning and office equipment, as well as high precision engineering parts.
Some MNC productions shifted to China several years ago but a few have shifted back to Malaysia in recent years due to quality issues.
Packaging in Malaysia has developed to a competitive level, with good barrier properties and chemical resistance.
E&E plastics must be versatile in design, easy to produce in mass quantities, light weight and cost effective.
Plastics used for construction are designed to be light weight, and for easy installation.
Source: MPMA
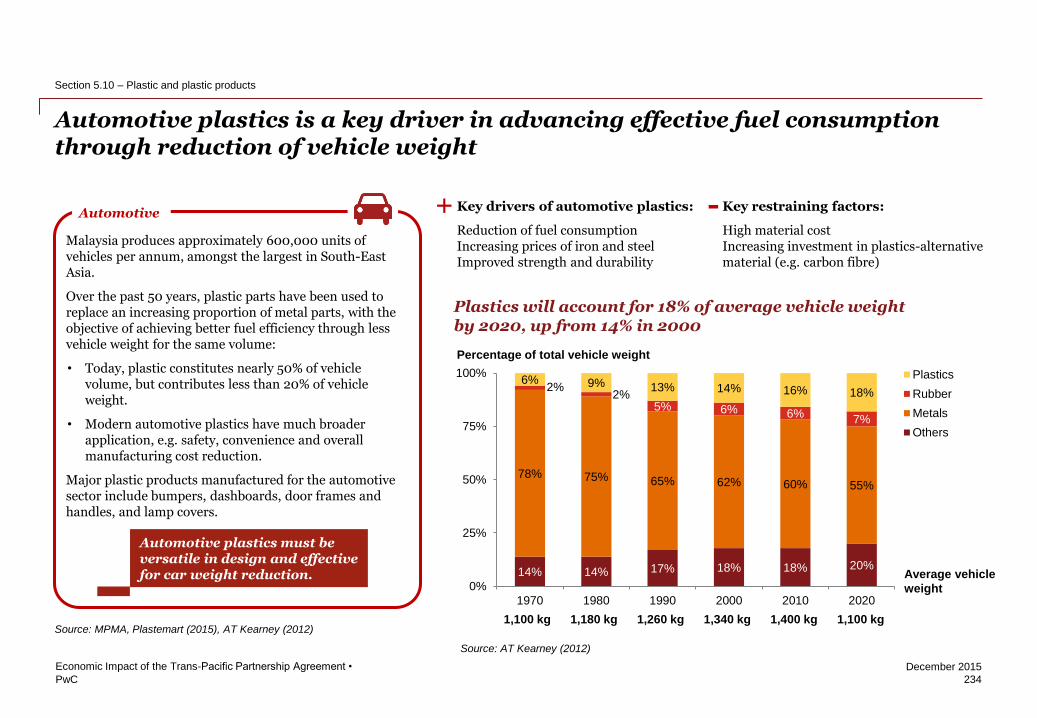
PwC
December 2015
Automotive plastics is a key driver in advancing effective fuel consumption through reduction of vehicle weight
234
Economic Impact of the Trans-Pacific Partnership Agreement •
Section 5.10 – Plastic and plastic products
Source: MPMA, Plastemart (2015), AT Kearney (2012)
Automotive
Malaysia produces approximately 600,000 units of vehicles per annum, amongst the largest in South-East Asia.
Over the past 50 years, plastic parts have been used to replace an increasing proportion of metal parts, with the objective of achieving better fuel efficiency through less vehicle weight for the same volume:
• Today, plastic constitutes nearly 50% of vehicle volume, but contributes less than 20% of vehicle weight.
• Modern automotive plastics have much broader application, e.g. safety, convenience and overall manufacturing cost reduction.
Major plastic products manufactured for the automotive sector include bumpers, dashboards, door frames and handles, and lamp covers.
Automotive plastics must be versatile in design and effective for car weight reduction.
Key drivers of automotive plastics:
Reduction of fuel consumption Increasing prices of iron and steel Improved strength and durability
Key restraining factors:
High material cost Increasing investment in plastics-alternative material (e.g. carbon fibre)
+ -
14% 14% 17% 18% 18% 20%
78% 75% 65% 62% 60% 55%
2% 2%
5% 6% 6% 7%
6% 9% 13% 14% 16% 18%
0%
25%
50%
75%
100%
1970 1980 1990 2000 2010 2020
Plastics
Rubber
Metals
Others
Percentage of total vehicle weight
1,100 kg 1,180 kg 1,260 kg 1,340 kg 1,400 kg 1,100 kg
Average vehicle
weight
Source: AT Kearney (2012)
Plastics will account for 18% of average vehicle weight by 2020, up from 14% in 2000
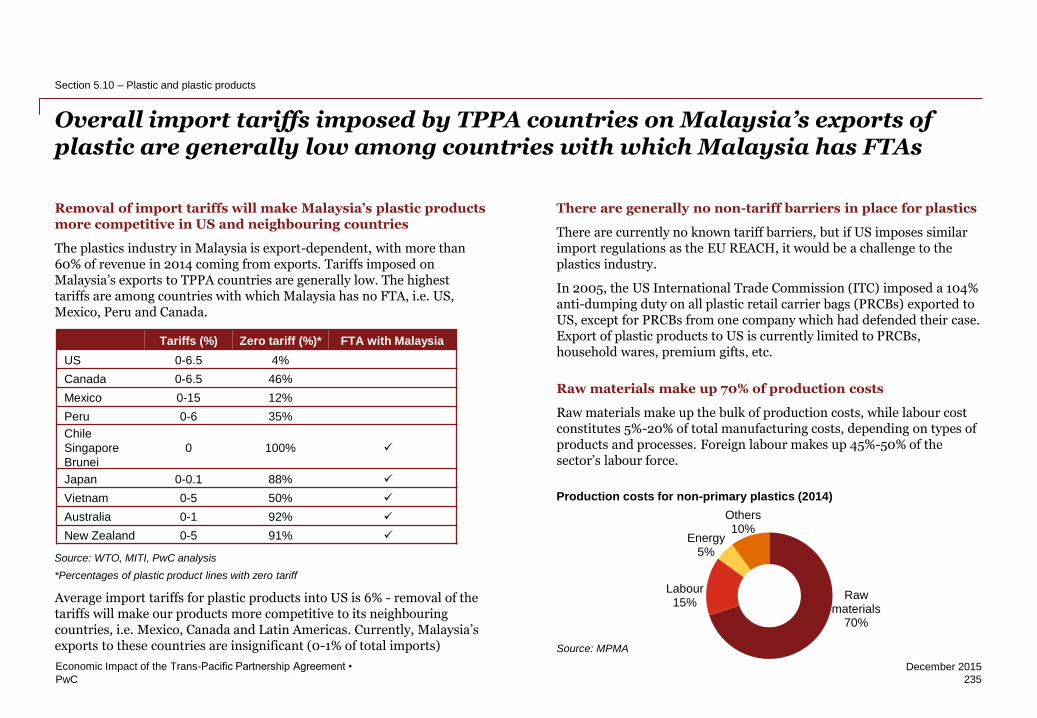
PwC
December 2015
Overall import tariffs imposed by TPPA countries on Malaysia’s exports of plastic are generally low among countries with which Malaysia has FTAs
235
Economic Impact of the Trans-Pacific Partnership Agreement •
Section 5.10 – Plastic and plastic products
Removal of import tariffs will make Malaysia’s plastic products more competitive in US and neighbouring countries
The plastics industry in Malaysia is export-dependent, with more than 60% of revenue in 2014 coming from exports. Tariffs imposed on Malaysia’s exports to TPPA countries are generally low. The highest tariffs are among countries with which Malaysia has no FTA, i.e. US, Mexico, Peru and Canada.
Average import tariffs for plastic products into US is 6% - removal of the tariffs will make our products more competitive to its neighbouring countries, i.e. Mexico, Canada and Latin Americas. Currently, Malaysia’s exports to these countries are insignificant (0-1% of total imports)
There are generally no non-tariff barriers in place for plastics
There are currently no known tariff barriers, but if US imposes similar import regulations as the EU REACH, it would be a challenge to the plastics industry.
In 2005, the US International Trade Commission (ITC) imposed a 104% anti-dumping duty on all plastic retail carrier bags (PRCBs) exported to US, except for PRCBs from one company which had defended their case. Export of plastic products to US is currently limited to PRCBs, household wares, premium gifts, etc.
Raw materials make up 70% of production costs
Raw materials make up the bulk of production costs, while labour cost constitutes 5%-20% of total manufacturing costs, depending on types of products and processes. Foreign labour makes up 45%-50% of the sector’s labour force.
Source: MPMA
Tariffs (%) Zero tariff (%)* FTA with Malaysia
US 0-6.5 4%
Canada 0-6.5 46%
Mexico 0-15 12%
Peru 0-6 35%
Chile
Singapore
Brunei
0 100%
Japan 0-0.1 88%
Vietnam 0-5 50%
Australia 0-1 92%
New Zealand 0-5 91%
Source: WTO, MITI, PwC analysis
Raw materials
70%
Labour 15%
Energy 5%
Others 10%
Production costs for non-primary plastics (2014)
*Percentages of plastic product lines with zero tariff
Clarify pls- are we competing with mex/can/Lat am?
This was based on discussion with MPMA. Based on
COMTRADE data, our current exports to these countries
are insignificant, 0-1%.
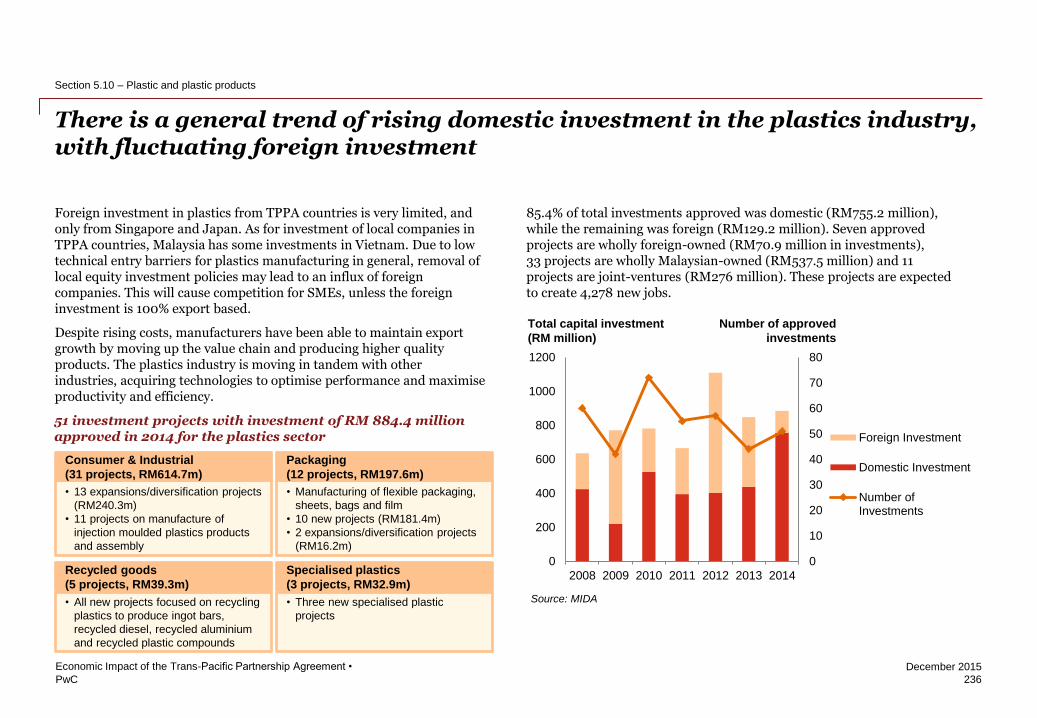
PwC
December 2015
Foreign investment in plastics from TPPA countries is very limited, and only from Singapore and Japan. As for investment of local companies in TPPA countries, Malaysia has some investments in Vietnam. Due to low technical entry barriers for plastics manufacturing in general, removal of local equity investment policies may lead to an influx of foreign companies. This will cause competition for SMEs, unless the foreign investment is 100% export based.
Despite rising costs, manufacturers have been able to maintain export growth by moving up the value chain and producing higher quality products. The plastics industry is moving in tandem with other industries, acquiring technologies to optimise performance and maximise productivity and efficiency.
85.4% of total investments approved was domestic (RM755.2 million), while the remaining was foreign (RM129.2 million). Seven approved projects are wholly foreign-owned (RM70.9 million in investments), 33 projects are wholly Malaysian-owned (RM537.5 million) and 11 projects are joint-ventures (RM276 million). These projects are expected to create 4,278 new jobs.
There is a general trend of rising domestic investment in the plastics industry, with fluctuating foreign investment
236
Economic Impact of the Trans-Pacific Partnership Agreement •
Section 5.10 – Plastic and plastic products
0
10
20
30
40
50
60
70
80
0
200
400
600
800
1000
1200
2008 2009 2010 2011 2012 2013 2014
Foreign Investment
Domestic Investment
Number ofInvestments
Total capital investment
(RM million)
Number of approved
investments
• 13 expansions/diversification projects
(RM240.3m)
• 11 projects on manufacture of
injection moulded plastics products
and assembly
• Manufacturing of flexible packaging,
sheets, bags and film
• 10 new projects (RM181.4m)
• 2 expansions/diversification projects
(RM16.2m)
Consumer & Industrial
(31 projects, RM614.7m)
Packaging
(12 projects, RM197.6m)
• All new projects focused on recycling
plastics to produce ingot bars,
recycled diesel, recycled aluminium
and recycled plastic compounds
• Three new specialised plastic
projects
Recycled goods
(5 projects, RM39.3m)
Specialised plastics
(3 projects, RM32.9m) Source: MIDA
51 investment projects with investment of RM 884.4 million approved in 2014 for the plastics sector
Minor formatting amendment
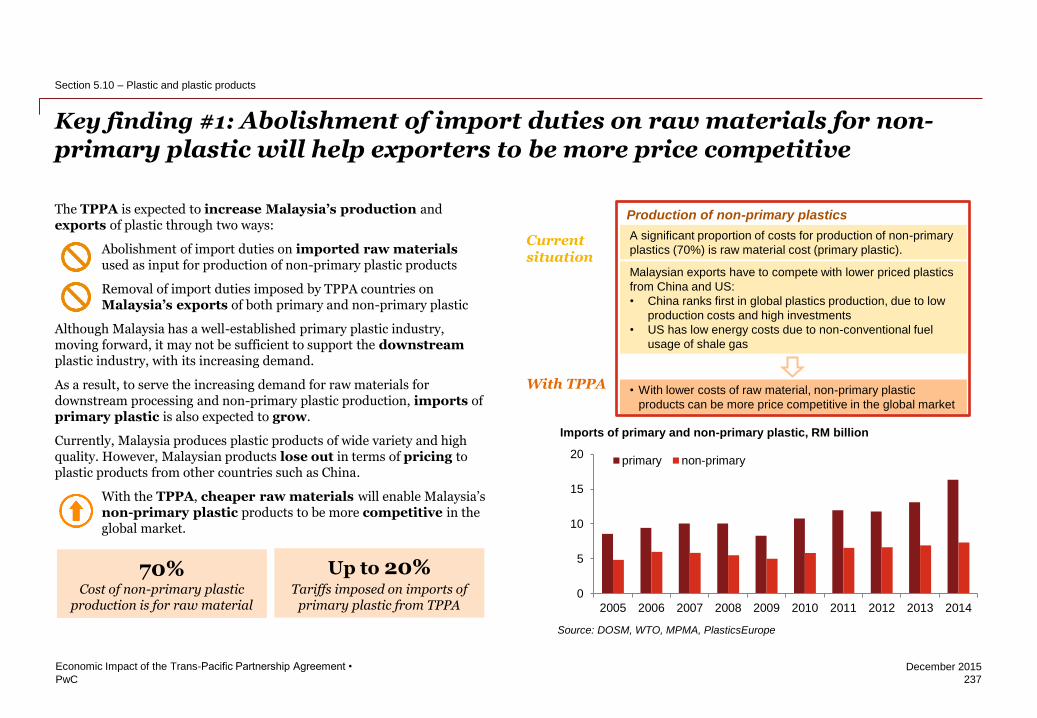
PwC
December 2015
237
Economic Impact of the Trans-Pacific Partnership Agreement •
Section 5.10 – Plastic and plastic products
The TPPA is expected to increase Malaysia’s production and exports of plastic through two ways:
Abolishment of import duties on imported raw materials used as input for production of non-primary plastic products
Removal of import duties imposed by TPPA countries on Malaysia’s exports of both primary and non-primary plastic
Although Malaysia has a well-established primary plastic industry, moving forward, it may not be sufficient to support the downstream plastic industry, with its increasing demand.
As a result, to serve the increasing demand for raw materials for downstream processing and non-primary plastic production, imports of primary plastic is also expected to grow.
Currently, Malaysia produces plastic products of wide variety and high quality. However, Malaysian products lose out in terms of pricing to plastic products from other countries such as China.
With the TPPA, cheaper raw materials will enable Malaysia’s non-primary plastic products to be more competitive in the global market.
Key finding #1: Abolishment of import duties on raw materials for non-primary plastic will help exporters to be more price competitive
Current situation
With TPPA
A significant proportion of costs for production of non-primary
plastics (70%) is raw material cost (primary plastic).
• With lower costs of raw material, non-primary plastic
products can be more price competitive in the global market
Production of non-primary plastics
Malaysian exports have to compete with lower priced plastics
from China and US:
• China ranks first in global plastics production, due to low
production costs and high investments
• US has low energy costs due to non-conventional fuel
usage of shale gas
70% Cost of non-primary plastic
production is for raw material
Up to 20%
Tariffs imposed on imports of primary plastic from TPPA
0
5
10
15
20
2005 2006 2007 2008 2009 2010 2011 2012 2013 2014
primary non-primary
Imports of primary and non-primary plastic, RM billion
Source: DOSM, WTO, MPMA, PlasticsEurope
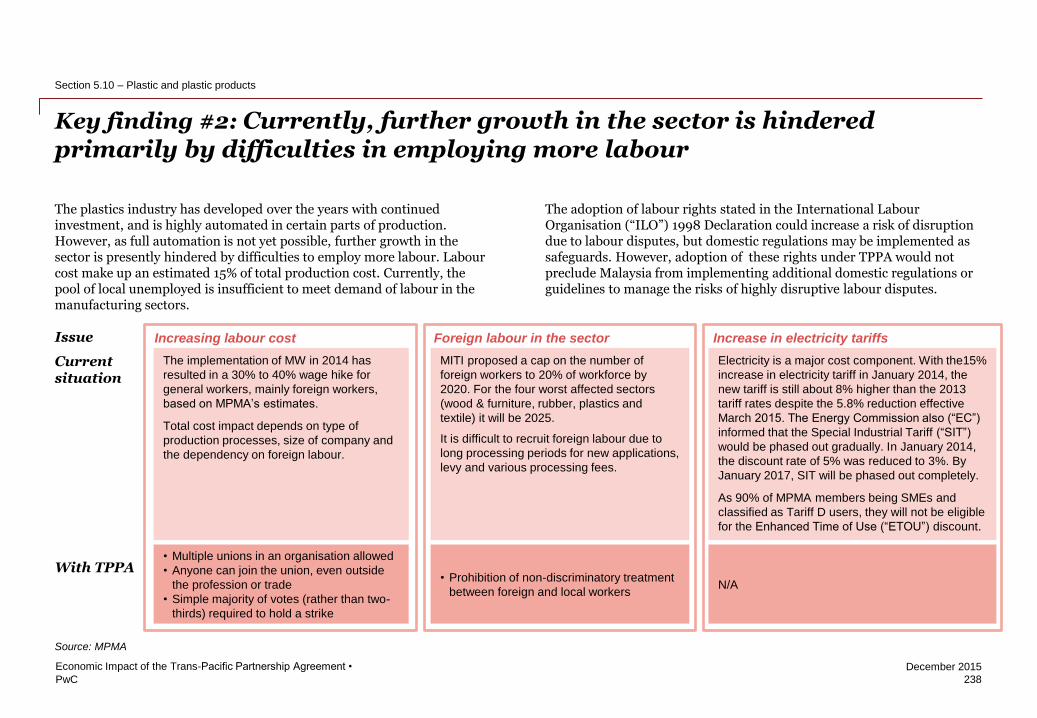
PwC
December 2015
Key finding #2: Currently, further growth in the sector is hindered primarily by difficulties in employing more labour
238
Economic Impact of the Trans-Pacific Partnership Agreement •
Section 5.10 – Plastic and plastic products
The implementation of MW in 2014 has
resulted in a 30% to 40% wage hike for
general workers, mainly foreign workers,
based on MPMA’s estimates.
Total cost impact depends on type of
production processes, size of company and
the dependency on foreign labour.
• Multiple unions in an organisation allowed
• Anyone can join the union, even outside
the profession or trade
• Simple majority of votes (rather than two-
thirds) required to hold a strike
Increasing labour cost
MITI proposed a cap on the number of
foreign workers to 20% of workforce by
2020. For the four worst affected sectors
(wood & furniture, rubber, plastics and
textile) it will be 2025.
It is difficult to recruit foreign labour due to
long processing periods for new applications,
levy and various processing fees.
• Prohibition of non-discriminatory treatment
between foreign and local workers
Foreign labour in the sector
Electricity is a major cost component. With the15%
increase in electricity tariff in January 2014, the
new tariff is still about 8% higher than the 2013
tariff rates despite the 5.8% reduction effective
March 2015. The Energy Commission also (“EC”)
informed that the Special Industrial Tariff (“SIT”)
would be phased out gradually. In January 2014,
the discount rate of 5% was reduced to 3%. By
January 2017, SIT will be phased out completely.
As 90% of MPMA members being SMEs and
classified as Tariff D users, they will not be eligible
for the Enhanced Time of Use (“ETOU”) discount.
N/A
Increase in electricity tariffs
The plastics industry has developed over the years with continued investment, and is highly automated in certain parts of production. However, as full automation is not yet possible, further growth in the sector is presently hindered by difficulties to employ more labour. Labour cost make up an estimated 15% of total production cost. Currently, the pool of local unemployed is insufficient to meet demand of labour in the manufacturing sectors.
Issue
Current situation
With TPPA
Source: MPMA
The adoption of labour rights stated in the International Labour Organisation (“ILO”) 1998 Declaration could increase a risk of disruption due to labour disputes, but domestic regulations may be implemented as safeguards. However, adoption of these rights under TPPA would not preclude Malaysia from implementing additional domestic regulations or guidelines to manage the risks of highly disruptive labour disputes.
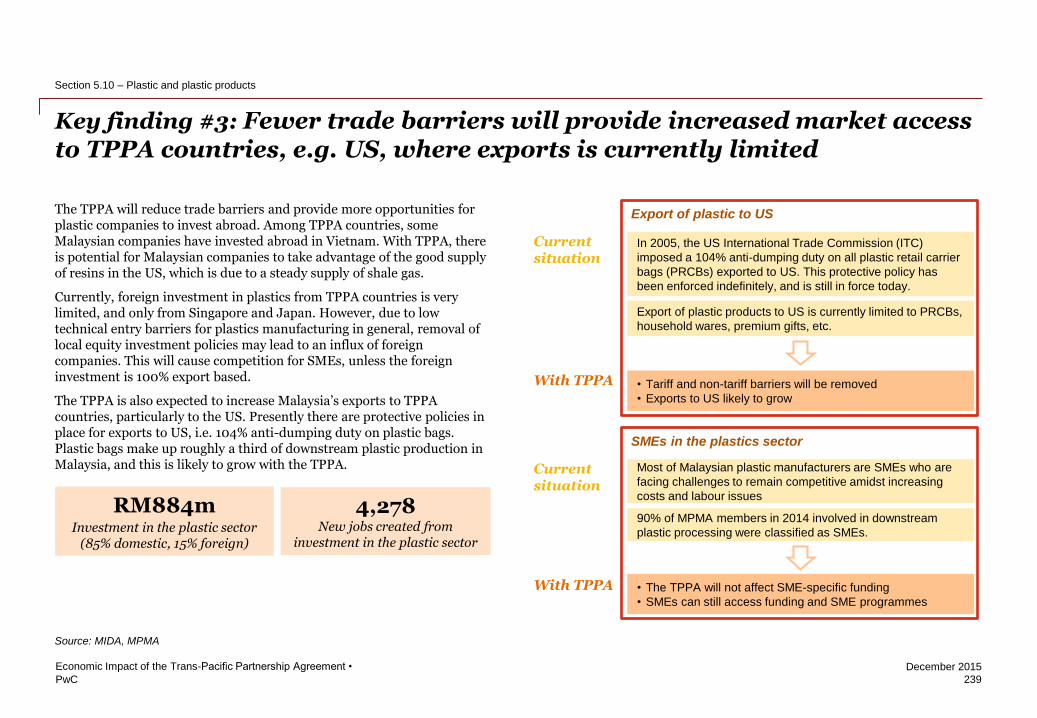
PwC
December 2015
Key finding #3: Fewer trade barriers will provide increased market access to TPPA countries, e.g. US, where exports is currently limited
239
Economic Impact of the Trans-Pacific Partnership Agreement •
Section 5.10 – Plastic and plastic products
Current situation
With TPPA
In 2005, the US International Trade Commission (ITC)
imposed a 104% anti-dumping duty on all plastic retail carrier
bags (PRCBs) exported to US. This protective policy has
been enforced indefinitely, and is still in force today.
• Tariff and non-tariff barriers will be removed
• Exports to US likely to grow
Export of plastic to US
Export of plastic products to US is currently limited to PRCBs,
household wares, premium gifts, etc.
The TPPA will reduce trade barriers and provide more opportunities for plastic companies to invest abroad. Among TPPA countries, some Malaysian companies have invested abroad in Vietnam. With TPPA, there is potential for Malaysian companies to take advantage of the good supply of resins in the US, which is due to a steady supply of shale gas.
Currently, foreign investment in plastics from TPPA countries is very limited, and only from Singapore and Japan. However, due to low technical entry barriers for plastics manufacturing in general, removal of local equity investment policies may lead to an influx of foreign companies. This will cause competition for SMEs, unless the foreign investment is 100% export based.
The TPPA is also expected to increase Malaysia’s exports to TPPA countries, particularly to the US. Presently there are protective policies in place for exports to US, i.e. 104% anti-dumping duty on plastic bags. Plastic bags make up roughly a third of downstream plastic production in Malaysia, and this is likely to grow with the TPPA. Current
situation
With TPPA
Most of Malaysian plastic manufacturers are SMEs who are
facing challenges to remain competitive amidst increasing
costs and labour issues
• The TPPA will not affect SME-specific funding
• SMEs can still access funding and SME programmes
SMEs in the plastics sector
90% of MPMA members in 2014 involved in downstream
plastic processing were classified as SMEs.
Source: MIDA, MPMA
RM884m
Investment in the plastic sector (85% domestic, 15% foreign)
4,278 New jobs created from
investment in the plastic sector
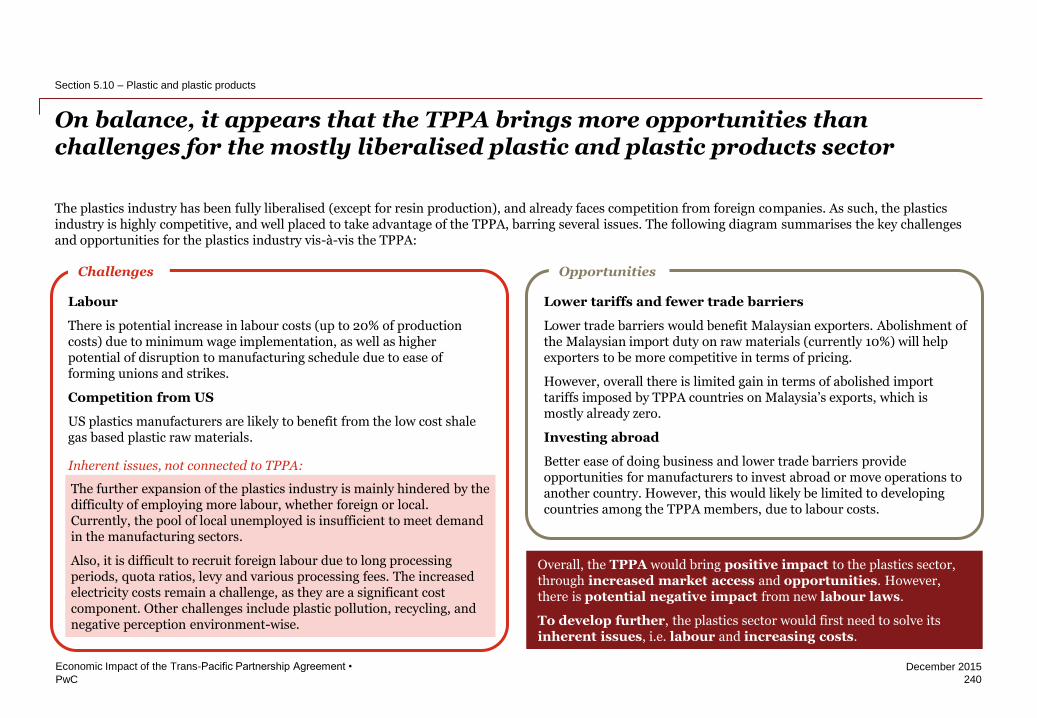
PwC
December 2015
On balance, it appears that the TPPA brings more opportunities than challenges for the mostly liberalised plastic and plastic products sector
240
Economic Impact of the Trans-Pacific Partnership Agreement •
Section 5.10 – Plastic and plastic products
The plastics industry has been fully liberalised (except for resin production), and already faces competition from foreign companies. As such, the plastics industry is highly competitive, and well placed to take advantage of the TPPA, barring several issues. The following diagram summarises the key challenges and opportunities for the plastics industry vis-à-vis the TPPA:
Lower tariffs and fewer trade barriers
Lower trade barriers would benefit Malaysian exporters. Abolishment of the Malaysian import duty on raw materials (currently 10%) will help exporters to be more competitive in terms of pricing.
However, overall there is limited gain in terms of abolished import tariffs imposed by TPPA countries on Malaysia’s exports, which is mostly already zero.
Investing abroad
Better ease of doing business and lower trade barriers provide opportunities for manufacturers to invest abroad or move operations to another country. However, this would likely be limited to developing countries among the TPPA members, due to labour costs.
Challenges Opportunities
Labour
There is potential increase in labour costs (up to 20% of production costs) due to minimum wage implementation, as well as higher potential of disruption to manufacturing schedule due to ease of forming unions and strikes.
Competition from US
US plastics manufacturers are likely to benefit from the low cost shale gas based plastic raw materials.
The further expansion of the plastics industry is mainly hindered by the difficulty of employing more labour, whether foreign or local. Currently, the pool of local unemployed is insufficient to meet demand in the manufacturing sectors.
Also, it is difficult to recruit foreign labour due to long processing periods, quota ratios, levy and various processing fees. The increased electricity costs remain a challenge, as they are a significant cost component. Other challenges include plastic pollution, recycling, and negative perception environment-wise.
Inherent issues, not connected to TPPA:
Overall, the TPPA would bring positive impact to the plastics sector, through increased market access and opportunities. However, there is potential negative impact from new labour laws.
To develop further, the plastics sector would first need to solve its inherent issues, i.e. labour and increasing costs.
PwC
December 2015
Section 6 Thematic Issues
241
Economic Impact of the Trans-Pacific Partnership Agreement •

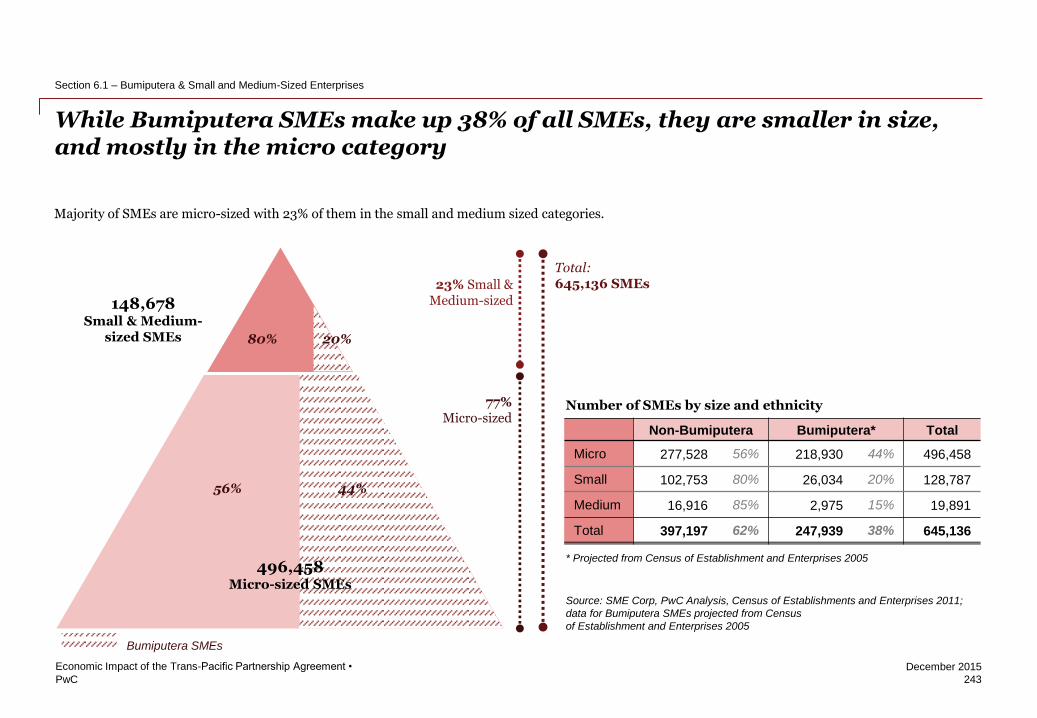
PwC
December 2015
243
Economic Impact of the Trans-Pacific Partnership Agreement •
Section 6.1 – Bumiputera & Small and Medium-Sized Enterprises
While Bumiputera SMEs make up 38% of all SMEs, they are smaller in size, and mostly in the micro category
Source: SME Corp, PwC Analysis, Census of Establishments and Enterprises 2011;
data for Bumiputera SMEs projected from Census
of Establishment and Enterprises 2005
* Projected from Census of Establishment and Enterprises 2005
Non-Bumiputera Bumiputera* Total
Micro 277,528 56% 218,930 44% 496,458
Small 102,753 80% 26,034 20% 128,787
Medium 16,916 85% 2,975 15% 19,891
Total 397,197 62% 247,939 38% 645,136
Number of SMEs by size and ethnicity
Total: 645,136 SMEs 23% Small &
Medium-sized 148,678 Small & Medium-
sized SMEs
77% Micro-sized
496,458 Micro-sized SMEs
Bumiputera SMEs
44% 56%
20% 80%
Majority of SMEs are micro-sized with 23% of them in the small and medium sized categories.
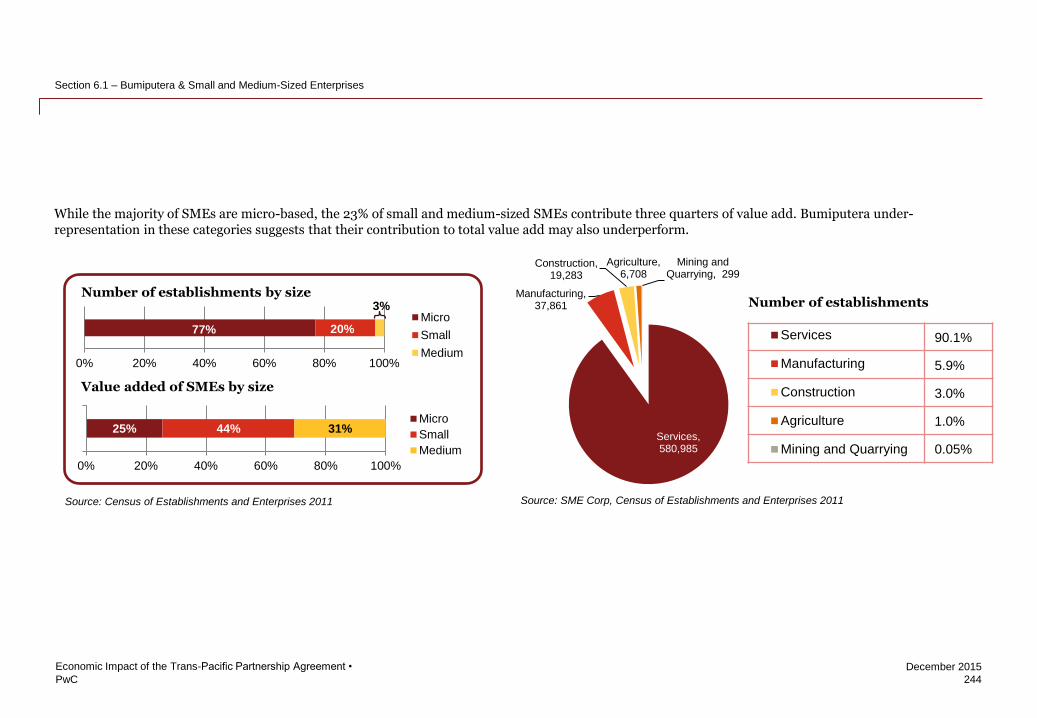
PwC
December 2015
244
Economic Impact of the Trans-Pacific Partnership Agreement •
Section 6.1 – Bumiputera & Small and Medium-Sized Enterprises
While the majority of SMEs are micro-based, the 23% of small and medium-sized SMEs contribute three quarters of value add. Bumiputera under-representation in these categories suggests that their contribution to total value add may also underperform.
0% 20% 40% 60% 80% 100%
Micro
Small
Medium
77%
3%
20%
Number of establishments by size
25% 44% 31%
0% 20% 40% 60% 80% 100%
Micro
Small
Medium
Value added of SMEs by size
Source: Census of Establishments and Enterprises 2011
Number of establishments
90.1%
5.9%
3.0%
1.0%
0.05%
Source: SME Corp, Census of Establishments and Enterprises 2011
Services, 580,985
Manufacturing, 37,861
Construction, 19,283
Agriculture, 6,708
Mining and Quarrying, 299
Services
Manufacturing
Construction
Agriculture
Mining and Quarrying
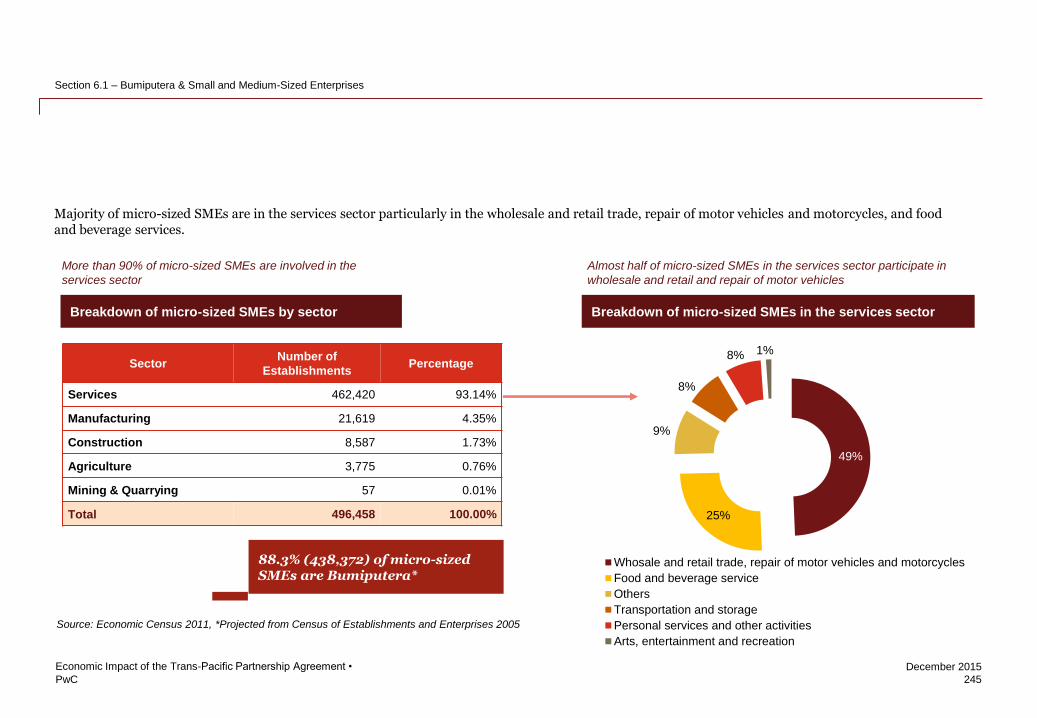
PwC
December 2015
245
Economic Impact of the Trans-Pacific Partnership Agreement •
Section 6.1 – Bumiputera & Small and Medium-Sized Enterprises
Majority of micro-sized SMEs are in the services sector particularly in the wholesale and retail trade, repair of motor vehicles and motorcycles, and food and beverage services.
More than 90% of micro-sized SMEs are involved in the
services sector
Almost half of micro-sized SMEs in the services sector participate in
wholesale and retail and repair of motor vehicles
Breakdown of micro-sized SMEs by sector Breakdown of micro-sized SMEs in the services sector
Source: Economic Census 2011, *Projected from Census of Establishments and Enterprises 2005
Sector Number of
Establishments Percentage
Services 462,420 93.14%
Manufacturing 21,619 4.35%
Construction 8,587 1.73%
Agriculture 3,775 0.76%
Mining & Quarrying 57 0.01%
Total 496,458 100.00%
49%
25%
9%
8%
8% 1%
Whosale and retail trade, repair of motor vehicles and motorcycles
Food and beverage service
Others
Transportation and storage
Personal services and other activities
Arts, entertainment and recreation
88.3% (438,372) of micro-sized SMEs are Bumiputera*
PwC
December 2015
246
Economic Impact of the Trans-Pacific Partnership Agreement •
Section 6.1 – Bumiputera & Small and Medium-Sized Enterprises
TPPA largely preserves Bumiputera and SMEs policy space while concessions that we have given should hasten improvements in competitiveness for Bumiputera and SMEs over time
Cognisant of Malaysia’s need for developmental policies in the area of Bumiputera and SME development, Malaysia has secured concessions from having to fulfil certain obligations in order for it to implement such policies. These concessions include, but are not limited to:
• Longer period for tariff removal on sensitive goods
• Higher threshold1 under the Government procurement for the provision of supplies and services, and construction works
• Longer transition period2 for the opening of Government procurement
• Exclusion of Public-Private Partnership (“PPP”) and 30% carve-out for Bumiputera in Government procurement
• Maintaining performance and national requirements as well as foreign equity limits for certain sectors e.g. retail, automotive, etc.
• Allowance for preferences up to 40% of SOE’s annual budgeted purchases
• Preserving PETRONAS’ exclusive rights to petroleum in Malaysia and the rights to decide on the form and contractual arrangements for foreign participation, and selection of contract parties.
• Exclusion of specific entities such as Unit Peneraju Agenda Bumiputera (TERAJU), Ekuiti Nasional Berhad (EKUINAS), and Majlis Amanah Rakyat (MARA)
These concessions suggest that Bumiputera and SME developmental policies can still be undertaken albeit bound by the obligations of TPPA. The implications of these concessions are illustrated through the following sectoral examples.
Oil and gas sector
PETRONAS, the national oil and gas company, largely preserves its rights under the PDA 1974. Preservation of such rights allow PETRONAS to continue its role to develop domestic oil and gas sector including Bumiputera businesses and SMEs in the sector.
The concessions for PETRONAS also includes the ability to accord preferences to a certain proportion of its annual budgeted purchases for upstream and downstream activities in the territory of Malaysia as described in the Oil and Gas section of this report. The ability to accord preferences preserves PETRONAS’ ability to continue with vendor development programmes for Bumiputera businesses and SMEs.
However, it is important to note that the preferences are not allowed with respect to the supply of 12 goods and services that Malaysia has committed under the TPPA.
Construction sector
Excluding PPP and carve-outs for Bumiputera in Government procurement from the obligations of TPPA maintains the practice of Government procurement as a tool for Bumiputera and SME development. For example, PPP projects such as Mass Rapid Transit (MRT) includes carve-outs for Bumiputera businesses.
1 SDR 63 million for construction services, SDR 1.5 million for goods, and SDR 2 million for services
2 7 years for goods, 9 years for services, and 20 years for construction services
PwC
December 2015
247
Economic Impact of the Trans-Pacific Partnership Agreement •
Section 6.1 – Bumiputera & Small and Medium-Sized Enterprises
For other types of construction works tendered by the Malaysian Government, only those with contract value above the threshold will be opened up to foreign competition, as described in the Construction section of this report.
The total contract value awarded to Bumiputera for contracts exceeding the common threshold of SDR14 million is estimated to be RM7.5 billion, on average from 2009 to 2013. This represents 67% of the total contract value which amounted to RM11.2 billion for contracts above the threshold.
The threshold of SDR14 million is equivalent to approximately RM70 million. Based on this contract value, only Grade 7 contractors will be affected by the opening up of Government procurement to foreign companies. Out of 44,276 registered Bumiputera contractors, 4,264 or less than 10% of Bumiputera contractors are Grade 7 contractors.
However, it is important to note that there are competitive Bumiputera contractors and SMEs that would still be able to compete despite the opening of Government procurement to foreign companies. On top of that, the Government still retains the right to impose 30% carve-out for Bumiputera for contracts above the threshold.
Automotive sector
Concessions secured by Malaysia with regards to automotive sector are largely similar to the commitments under the NAP. Although the impact of TPPA on national car manufacturers is deemed minimal, there is still a need to address the issue of decreasing market share of national car manufacturers.
The national car manufacturers play a role in developing capabilities of local vendors and component manufacturers. To illustrate, approximately 38% of the spend by a national car manufacturer in 2014 is to at least 49 Bumiputera vendors supporting the car manufacturer.
For local component manufacturers, the TPPA offers greater market access either through tariff reduction or through industry collaboration with other TPPA countries. To illustrate, US and Canada has committed their intention to facilitate technical cooperation and capacity building activities with Malaysia.
Retail sector
Concessions under TPPA for the retail sector largely follows the guideline that Malaysia has already employed. Therefore, the TPPA poses minimal impact to the sector.
This would allow the continuation of efforts to develop businesses in this sector. At present, there are as many as 342,191 micro-sized establishments in the wholesale and retail trade, food and beverage services, and repair of motor vehicles and motorcycles. It is estimated that 88% of these establishments are Bumiputera owned businesses.
PwC
December 2015
248
Economic Impact of the Trans-Pacific Partnership Agreement •
Section 6.1 – Bumiputera & Small and Medium-Sized Enterprises
Negative impact of TPPA on Bumiputera businesses and SMEs appear to be largely limited
After examining the Bumiputera landscape, and obligations and concessions secured in the full and final text of the TPPA, there is potential for negative impacts on Bumiputera businesses and SMEs but these impacts appear to be largely mitigated based on the concessions secured by Malaysia. The potential negative impacts are mainly due to Bumiputera businesses being domestic oriented, and dependent on Government contracts and vendor programmes. However, there is a need to transform Bumiputera businesses and SMEs to reap the full benefit of the TPPA.
Bumiputera businesses are domestically driven, showing high dependency on Government contracts and vendor programmes
Bumiputera presence is strongest in domestic focused sectors, highly regulated industries, and areas with strong national interests, e.g. construction, business services and oil and gas. In these industries, the companies are driven primarily by Government contracts and vendor development programmes.
A significant portion of GLCs, Public Listed Companies (PLC) and other large Bumiputera companies are profitable and involved in exporting goods or services out of Malaysia. However, the majority of Bumiputera businesses do not depend much on export markets. In particular, non-PLCs, SMEs and Co-operatives are domestic-oriented. The survey that was conducted showed that less than 10% of firms’ revenue is generated from export markets. In addition, Bumiputera companies derive two-thirds of their revenues from both government contracts and vendor programmes.
Government policies and initiatives on Bumiputera would be minimally impacted by the TPPA
As discussed earlier, concessions given by the TPPA would largely preserve the policy space supporting Bumiputera and SME development policies. These include concessions awarded by the Government Procurement and SOE chapters.
Despite the concessions, there is a need for programmes to increase the competitiveness of Bumiputera businesses and SMEs, especially in the areas that will be open to foreign competition.
Majority of challenges faced by SMEs are not FTA related
Issues faced are caused mainly by increased competition through autonomous liberalisation, rising labour costs for labour intensive industries, as well as introduction of new policies such as goods and services tax.
In recent years, SMEs in the services sector, which make up the majority of all SMEs, have been affected by autonomous liberalisation. The autonomous liberalisation has resulted in increased international competition. This is a major concern for SMEs who have not been able to develop capabilities or grow when the sub-sectors were liberalised.
PwC
December 2015
249
Economic Impact of the Trans-Pacific Partnership Agreement •
Section 6.1 – Bumiputera & Small and Medium-Sized Enterprises
Overall impact of TPPA on SMEs is mainly positive
The TPPA will bring opportunities for export-oriented SMEs through increased market access in government procurement, reduced trade barriers, better IP protection, as well as increased opportunities to participate in the global supply chain.
A significant number of SMEs are in sectors that are completely liberalised, while a large portion of the remaining SMEs are in partially liberalised sectors, most of which allows foreign equity of up to 70%. Thus, there will be minimal impact on these SMEs. SMEs in domestic-oriented industries are also unlikely to be impacted by the TPPA.
However, there is potential negative impact for SMEs in certain sectors. SMEs in construction and oil and gas are likely to be negatively impacted by the TPPA, if they are involved in government procurement work and vendor development programmes. Nevertheless, the number of SMEs in these sub-sectors is small. With the concessions secured, this impact is largely mitigated. Thus, the impact on the wider context of SMEs is not substantial.
MNCs and large companies stand to gain comparatively more from the TPPA than SMEs
In essence, MNCs and large companies would benefit more from the TPPA as compared to SMEs, mainly due to scale, wealth of resources and knowledge, and international relations. The study by ADBI found that SMEs may be disproportionately affected by the fixed costs of FTAs1, while the HSBC-EIU study results showed that larger firms are more likely to report significant export increases with FTAs2.
This is supported by a survey by Japan External Trade Organisation (JETRO) on Japanese affiliated companies, which shows higher usage of FTAs by large corporations, with more to gain as compared to SMEs.
It should be noted that based on GDP per capita, Malaysia is in the bottom half of the 12 TPPA countries. As it is challenging for local SMEs to venture into countries with higher income (with the exception of trading), opportunities for SMEs to venture abroad may be limited unless they build up capacity and capabilities to compete effectively.
1Asian FTAs: Trends and Challenges, Asian Development Bank Institute (ADBI), 2009 2FTAs: fantastic, fine or futile? Business views on trade agreements in Asia, HSBC and Economist Intelligence Unit (EIU), 2014
PwC
December 2015
Although the negative impact to Bumiputera businesses and SMEs appear to be largely limited, there is still a need to upscale and increase their competitiveness in order to reap the full benefit of TPPA.
These initiatives can organized into the following key themes based on the earlier findings:
Theme 1: Renew emphasis on producing competitive export- oriented Bumiputera businesses and SMEs
Theme 2: Encourage more Bumiputera businesses and SMEs to adopt new ideas, processes and practices
Theme 3: Modify GP process to enhance the competitiveness of Bumiputera businesses
These key themes have the following recommendations.
Develop trade adjustment assistance
The majority of SMEs are not export ready. New entrants due to TPPA may pose stiffer competition to domestic-oriented services. Hence, trade adjustment assistance should be provided to SMEs to mitigate the adverse effects of competition.
This practice draws upon the experience of the United States to reduce the negative impact of imports due to free trade agreements.
The programme will provide assistance such as:
• Support in developing a business recovery plan;
250
Economic Impact of the Trans-Pacific Partnership Agreement •
Section 6.1 – Bumiputera & Small and Medium-Sized Enterprises
To reap the full benefit of TPPA the focus on any assistance should be to increase competitiveness of Bumiputera business and SMEs
• Funding in implementing the projects under the business plan on a cost-sharing basis; and
• Connecting the companies to third-party consultants with specific area of expertise to ensure effectiveness of implementation.
Enhance end-to-end export promotion and outward investment services
MATRADE offers a wide range of services for exporters. As the TPPA opens up foreign procurement markets, MATRADE will play a more crucial role in facilitating SMEs to venture into these markets. The study, through its benchmarking practices, draws on the following recommendations to enhance the current exporting strategies in place:
• Business plan development and review services to ensure feasible exporting and outward investment strategies
• International advocacy centre to create exporting opportunities in foreign procurement markets
Facilitate scaling up of SMEs
SMEs may not have the scale necessary to export goods or services and lack the resources and financing required to venture into new markets and take on bigger projects. Companies facing these issues should either merge or form cooperative alliances to replicate the scale required.
In order to facilitate these efforts, the following should be undertaken:
• Enhancing business networking and awareness of incentives and programmes for SMEs by leveraging on alliance marketing and the creation of an information portal
PwC
December 2015
• Introducing financial incentives to subsidise cost of mergers and acquisitions
This recommendation requires the active involvement of industry associations who play an important role in facilitating networking amongst their members and coordinating the resources required to execute the efforts above.
Increase foreign presence of SMEs through GLCs and large companies
SMEs may not have the resources or know-how to penetrate foreign markets. Beyond resources and financing, experience or expertise is required to overcome legal, cultural and other non-tariff barriers. GLCs and large companies who are already venturing into foreign markets can play a role in assisting the development of SMEs in this area.
Increasing the foreign presence of local SMEs can be made by:
• Leveraging upon existing relationship between anchor companies and SMEs in the supply chain
• Introducing tax incentives for private sector MNCs and large companies
Similar to the Bumiputera Vendor Development Programme (BDVP) that is practiced, MITI will play a role in coordinating and facilitating partnerships between anchor companies and selected SMEs.
251
Economic Impact of the Trans-Pacific Partnership Agreement •
Section 6.1 – Bumiputera & Small and Medium-Sized Enterprises
Integrate innovation voucher programme with High Impact Programmes 2 and 6 under the SME Masterplan
There is a weak innovation culture amongst SMEs and research and development is not a priority, primarily due to resource constraints. The TPPA brings stronger protection for intellectual properties in terms of patents and copyrights. Thus, SMEs should leverage upon this opportunity.
Based on stakeholder engagement with SME Corp, integrating the innovation voucher programme with High Impact Programmes 2 and 6 (HIP) under the SME Masterplan is recommended. This is to align initiatives with the same objectives and avoid duplication of efforts.
The HIP2 and HIP6 provide end-to-end facilitation linking SMEs to R&D labs, incubators, innovators, financiers all the way to the market by helping them to understand the market so that their products have a high chance of succeeding. Overall, this recommendation aims not only to provide funding, but also to create awareness and educate entrepreneurs on the process of innovation. Other benefits include:
• Enable companies to work with local universities to generate knowledge
• Encourage companies to explore bringing in new knowledge into the business
• Enhance the ability of companies to develop innovative products, processes and services
• Invigorate companies to explore new markets
PwC
December 2015
Develop transitional framework for GP
In order to prepare Bumiputera companies for TPPA, incentives should be given to companies that are able to match the cost of their competitors in the tender process without compromising the quality of products and services.
The following steps are recommended:
• TERAJU, with the assistance of MOF, to assess the costs differential between the two tender awards (higher cost by the Bumiputera vendor compared to non-Bumiputera vendor), and notify the Bumiputera vendors on the cost differential
• Gradually reduce the margin of price preference for Bumiputera companies, as the yardstick to measure the competitiveness of Bumiputera companies participating in Government tender
• Provide assistance for qualified Bumiputera companies to reduce their cost to match the competitive price offered by non-Bumiputera companies
Improve development of vendors in BVDP
Similar to Government procurement, the BVDP has provided many opportunities for Bumiputera companies, but has not been effective in creating more competitive companies on a global or domestic level.
252
Economic Impact of the Trans-Pacific Partnership Agreement •
Section 6.1 – Bumiputera & Small and Medium-Sized Enterprises
It is pertinent to develop a clear and implementable graduation mechanism to address current weaknesses:
• Fix and commit to an exact timeframe to ensure consistent opportunities to all vendors under the BVDP anchor companies
• Impose the integration of vendor’s business plan with anchor’s business strategy as the requirement for BVDP framework
• Coordination of available assistance of other agencies through MITI
There is a need to set clear objectives for vendors that are under the BVDP based on a set timeframe. Vendors may not have the capability and expertise in industry intelligence and market trends to develop their own business plan due to their small capacity. Thus, vendors’ business plan can be jointly developed with the assistance of anchor companies, and to be in line with anchor companies’ business strategy.
With the implementation of this proposed framework, vendors under the BVDP have to graduate from the programme. These vendors will then have to compete on an open tender basis.
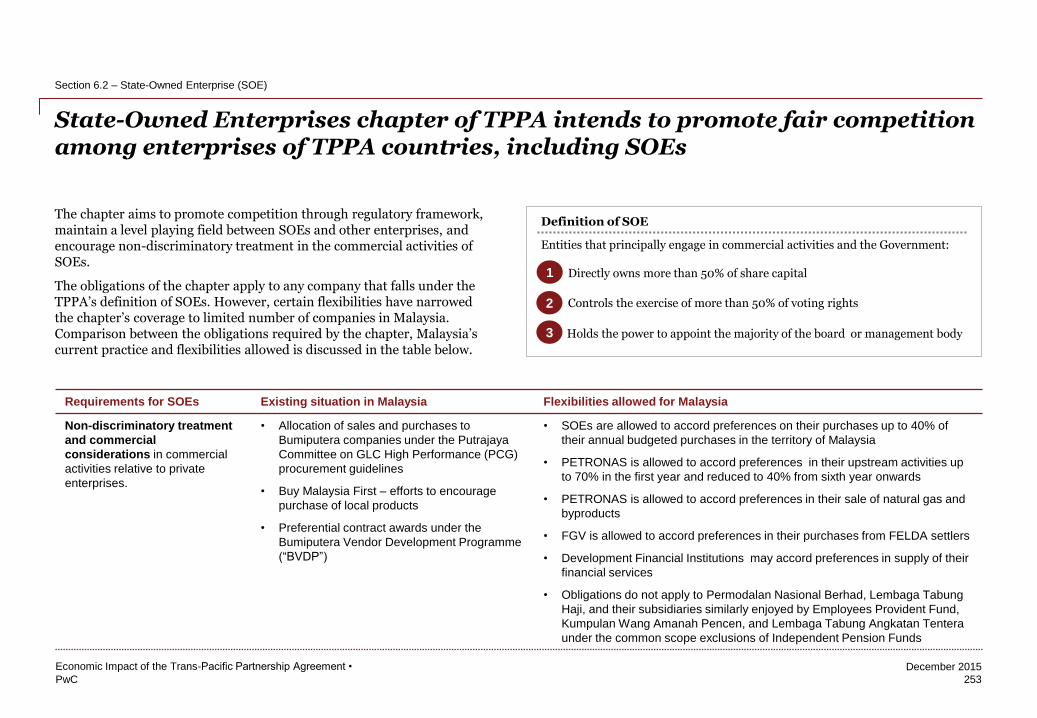
PwC
December 2015
253
Economic Impact of the Trans-Pacific Partnership Agreement •
Section 6.2 – State-Owned Enterprise (SOE)
State-Owned Enterprises chapter of TPPA intends to promote fair competition among enterprises of TPPA countries, including SOEs
The chapter aims to promote competition through regulatory framework, maintain a level playing field between SOEs and other enterprises, and encourage non-discriminatory treatment in the commercial activities of SOEs.
The obligations of the chapter apply to any company that falls under the TPPA’s definition of SOEs. However, certain flexibilities have narrowed the chapter’s coverage to limited number of companies in Malaysia. Comparison between the obligations required by the chapter, Malaysia’s current practice and flexibilities allowed is discussed in the table below.
Entities that principally engage in commercial activities and the Government:
Directly owns more than 50% of share capital
Controls the exercise of more than 50% of voting rights
Holds the power to appoint the majority of the board or management body
1
2
3
Definition of SOE
Requirements for SOEs Existing situation in Malaysia Flexibilities allowed for Malaysia
Non-discriminatory treatment
and commercial
considerations in commercial
activities relative to private
enterprises.
• Allocation of sales and purchases to
Bumiputera companies under the Putrajaya
Committee on GLC High Performance (PCG)
procurement guidelines
• Buy Malaysia First – efforts to encourage
purchase of local products
• Preferential contract awards under the
Bumiputera Vendor Development Programme
(“BVDP”)
• SOEs are allowed to accord preferences on their purchases up to 40% of
their annual budgeted purchases in the territory of Malaysia
• PETRONAS is allowed to accord preferences in their upstream activities up
to 70% in the first year and reduced to 40% from sixth year onwards
• PETRONAS is allowed to accord preferences in their sale of natural gas and
byproducts
• FGV is allowed to accord preferences in their purchases from FELDA settlers
• Development Financial Institutions may accord preferences in supply of their
financial services
• Obligations do not apply to Permodalan Nasional Berhad, Lembaga Tabung
Haji, and their subsidiaries similarly enjoyed by Employees Provident Fund,
Kumpulan Wang Amanah Pencen, and Lembaga Tabung Angkatan Tentera
under the common scope exclusions of Independent Pension Funds
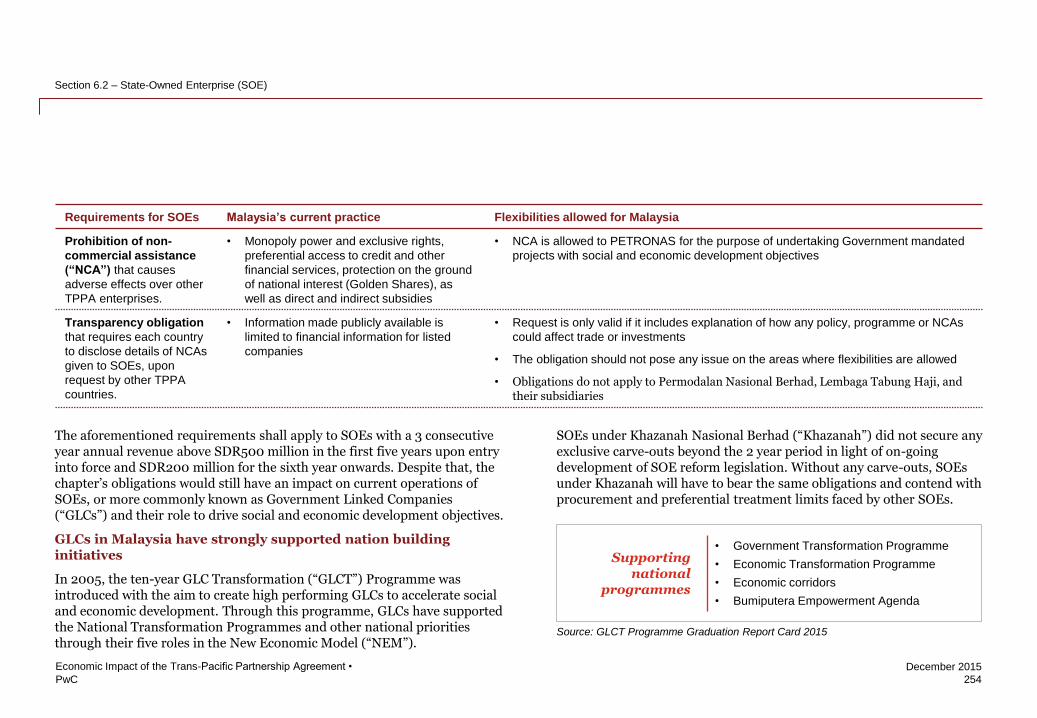
PwC
December 2015
254
Economic Impact of the Trans-Pacific Partnership Agreement •
Section 6.2 – State-Owned Enterprise (SOE)
Requirements for SOEs Malaysia’s current practice Flexibilities allowed for Malaysia
Prohibition of non-
commercial assistance
(“NCA”) that causes
adverse effects over other
TPPA enterprises.
• Monopoly power and exclusive rights,
preferential access to credit and other
financial services, protection on the ground
of national interest (Golden Shares), as
well as direct and indirect subsidies
• NCA is allowed to PETRONAS for the purpose of undertaking Government mandated
projects with social and economic development objectives
Transparency obligation
that requires each country
to disclose details of NCAs
given to SOEs, upon
request by other TPPA
countries.
• Information made publicly available is
limited to financial information for listed
companies
• Request is only valid if it includes explanation of how any policy, programme or NCAs
could affect trade or investments
• The obligation should not pose any issue on the areas where flexibilities are allowed
• Obligations do not apply to Permodalan Nasional Berhad, Lembaga Tabung Haji, and their subsidiaries
The aforementioned requirements shall apply to SOEs with a 3 consecutive year annual revenue above SDR500 million in the first five years upon entry into force and SDR200 million for the sixth year onwards. Despite that, the chapter’s obligations would still have an impact on current operations of SOEs, or more commonly known as Government Linked Companies (“GLCs”) and their role to drive social and economic development objectives.
GLCs in Malaysia have strongly supported nation building initiatives
In 2005, the ten-year GLC Transformation (“GLCT”) Programme was introduced with the aim to create high performing GLCs to accelerate social and economic development. Through this programme, GLCs have supported the National Transformation Programmes and other national priorities through their five roles in the New Economic Model (“NEM”).
• Government Transformation Programme
• Economic Transformation Programme
• Economic corridors
• Bumiputera Empowerment Agenda
Supporting national
programmes
SOEs under Khazanah Nasional Berhad (“Khazanah”) did not secure any exclusive carve-outs beyond the 2 year period in light of on-going development of SOE reform legislation. Without any carve-outs, SOEs under Khazanah will have to bear the same obligations and contend with procurement and preferential treatment limits faced by other SOEs.
Source: GLCT Programme Graduation Report Card 2015
PwC
December 2015
255
Economic Impact of the Trans-Pacific Partnership Agreement •
Section 6.2 – State-Owned Enterprise (SOE)
Mechanisms for SOEs in supporting nation building agenda may change
Currently, PETRONAS has been providing subsidies to the national utility company for the supply of gas to ensure adequate power supply and affordable prices for the general public. Flexibility has been secured whereby PETRONAS may sell natural gas and its byproducts to power and non-power sectors at below market rates.
Transparency requirements are only limited to key financial information, and NCA programmes and policies
The TPPA commitments also obligate the Government to disclose information on SOEs that may have adverse effects on competition, when legitimately challenged by a competitor. This obligation is limited to the following information:
• List of companies that falls under the definition of SOEs under the chapter
• Ownership and voting rights, board of directors, annual revenue and total assets, audited financial reports
• Details of NCA policy or programme including form of assistance, name of agency providing the NCA, legal basis of NCA, total amount, duration and data for assessment of the effects of NCA
This obligation should not include commercially sensitive information that would jeopardise SOE’s competitive position relative to their private sector competitors.
Non-commercial assistances that are extended cannot cause adverse effects to the interest of other TPPA countries when SOEs produce and supply goods and services
The prohibition of non-commercial assistance1 (“NCA”) that provide SOEs valued above SDR200 million with competitive advantages could also potentially limit the commercial viability of some SOEs in driving national development agendas, such as pioneering new growth areas and advancing Bumiputera and SME capabilities.
In particular, SOEs are prohibited from receiving NCAs that give rise to adverse competition effects, such as significantly undercutting the price or impeding/displacing the production/sale/import of a like good produced by another TPPA country. However, NCAs for SOEs that provide services domestically shall not be deemed to cause adverse effects, thus should not breach the obligations of SOE chapter. Nevertheless, SOEs that are commercially competitive in spite of the receipt of NCAs will likely be minimally affected by the commitments in the TPPA.
As small SOEs grow to exceed the SDR200 million threshold, the removal of NCAs could result in significantly more challenging growth trajectories for some of these SOEs. This could potentially impede the pace and extent of these SOEs’ in advancing regionalisation.
1 NCAs refer to direct transfers of funds or potential direct transfers of funds or liabilities, such as: grants or debt forgiveness; loans, loan guarantees or other types of financing on terms more
favourable than those commercially available to the SOE; equity capital inconsistent with the usual investment practice (including for the provision of risk capital) of private investors; or goods
or services other than general infrastructure on terms more favourable than those commercially available to the SOE.
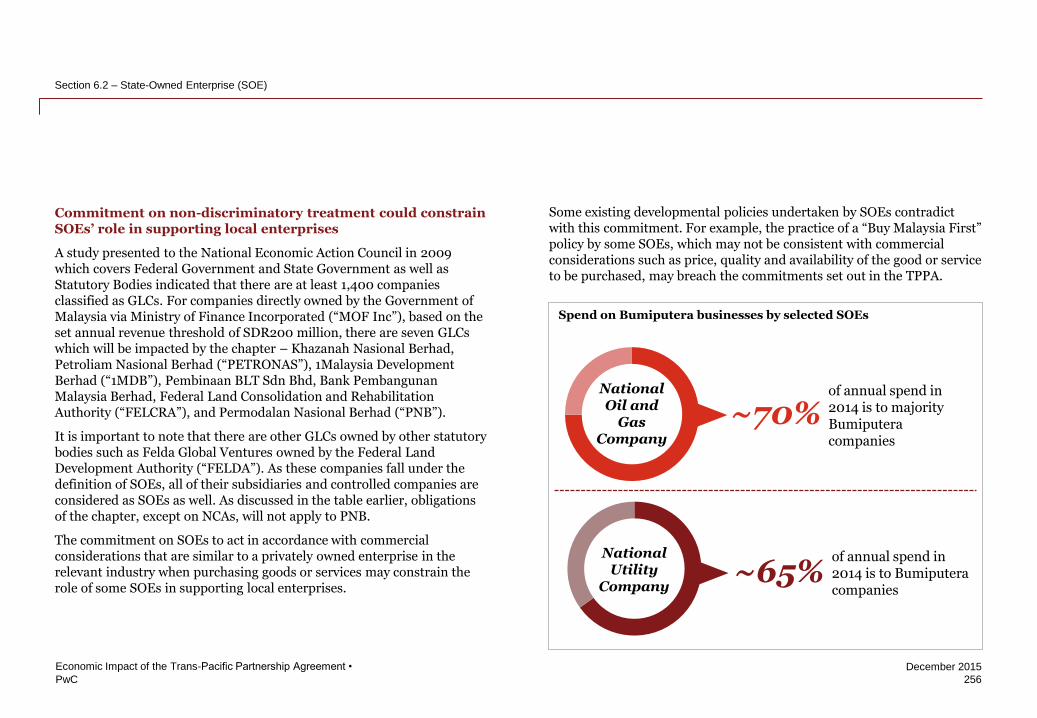
PwC
December 2015
256
Economic Impact of the Trans-Pacific Partnership Agreement •
Section 6.2 – State-Owned Enterprise (SOE)
Commitment on non-discriminatory treatment could constrain SOEs’ role in supporting local enterprises
A study presented to the National Economic Action Council in 2009 which covers Federal Government and State Government as well as Statutory Bodies indicated that there are at least 1,400 companies classified as GLCs. For companies directly owned by the Government of Malaysia via Ministry of Finance Incorporated (“MOF Inc”), based on the set annual revenue threshold of SDR200 million, there are seven GLCs which will be impacted by the chapter – Khazanah Nasional Berhad, Petroliam Nasional Berhad (“PETRONAS”), 1Malaysia Development Berhad (“1MDB”), Pembinaan BLT Sdn Bhd, Bank Pembangunan Malaysia Berhad, Federal Land Consolidation and Rehabilitation Authority (“FELCRA”), and Permodalan Nasional Berhad (“PNB”).
It is important to note that there are other GLCs owned by other statutory bodies such as Felda Global Ventures owned by the Federal Land Development Authority (“FELDA”). As these companies fall under the definition of SOEs, all of their subsidiaries and controlled companies are considered as SOEs as well. As discussed in the table earlier, obligations of the chapter, except on NCAs, will not apply to PNB.
The commitment on SOEs to act in accordance with commercial considerations that are similar to a privately owned enterprise in the relevant industry when purchasing goods or services may constrain the role of some SOEs in supporting local enterprises.
Spend on Bumiputera businesses by selected SOEs
~70% of annual spend in 2014 is to majority Bumiputera companies
~65% of annual spend in 2014 is to Bumiputera companies
National Oil and
Gas Company
National Utility
Company
Some existing developmental policies undertaken by SOEs contradict with this commitment. For example, the practice of a “Buy Malaysia First” policy by some SOEs, which may not be consistent with commercial considerations such as price, quality and availability of the good or service to be purchased, may breach the commitments set out in the TPPA.
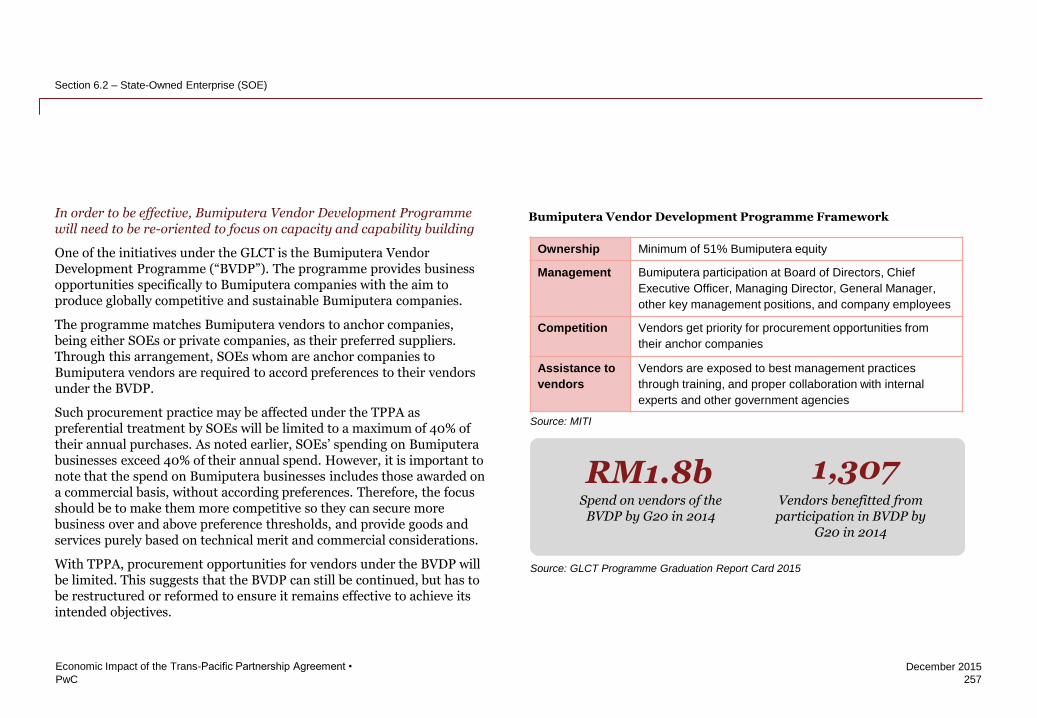
PwC
December 2015
Bumiputera Vendor Development Programme Framework
257
Economic Impact of the Trans-Pacific Partnership Agreement •
Section 6.2 – State-Owned Enterprise (SOE)
In order to be effective, Bumiputera Vendor Development Programme will need to be re-oriented to focus on capacity and capability building
One of the initiatives under the GLCT is the Bumiputera Vendor Development Programme (“BVDP”). The programme provides business opportunities specifically to Bumiputera companies with the aim to produce globally competitive and sustainable Bumiputera companies.
The programme matches Bumiputera vendors to anchor companies, being either SOEs or private companies, as their preferred suppliers. Through this arrangement, SOEs whom are anchor companies to Bumiputera vendors are required to accord preferences to their vendors under the BVDP.
Such procurement practice may be affected under the TPPA as preferential treatment by SOEs will be limited to a maximum of 40% of their annual purchases. As noted earlier, SOEs’ spending on Bumiputera businesses exceed 40% of their annual spend. However, it is important to note that the spend on Bumiputera businesses includes those awarded on a commercial basis, without according preferences. Therefore, the focus should be to make them more competitive so they can secure more business over and above preference thresholds, and provide goods and services purely based on technical merit and commercial considerations.
With TPPA, procurement opportunities for vendors under the BVDP will be limited. This suggests that the BVDP can still be continued, but has to be restructured or reformed to ensure it remains effective to achieve its intended objectives.
Ownership Minimum of 51% Bumiputera equity
Management Bumiputera participation at Board of Directors, Chief
Executive Officer, Managing Director, General Manager,
other key management positions, and company employees
Competition Vendors get priority for procurement opportunities from
their anchor companies
Assistance to
vendors
Vendors are exposed to best management practices
through training, and proper collaboration with internal
experts and other government agencies
Source: MITI
RM1.8b 1,307 Spend on vendors of the
BVDP by G20 in 2014 Vendors benefitted from participation in BVDP by
G20 in 2014
Source: GLCT Programme Graduation Report Card 2015

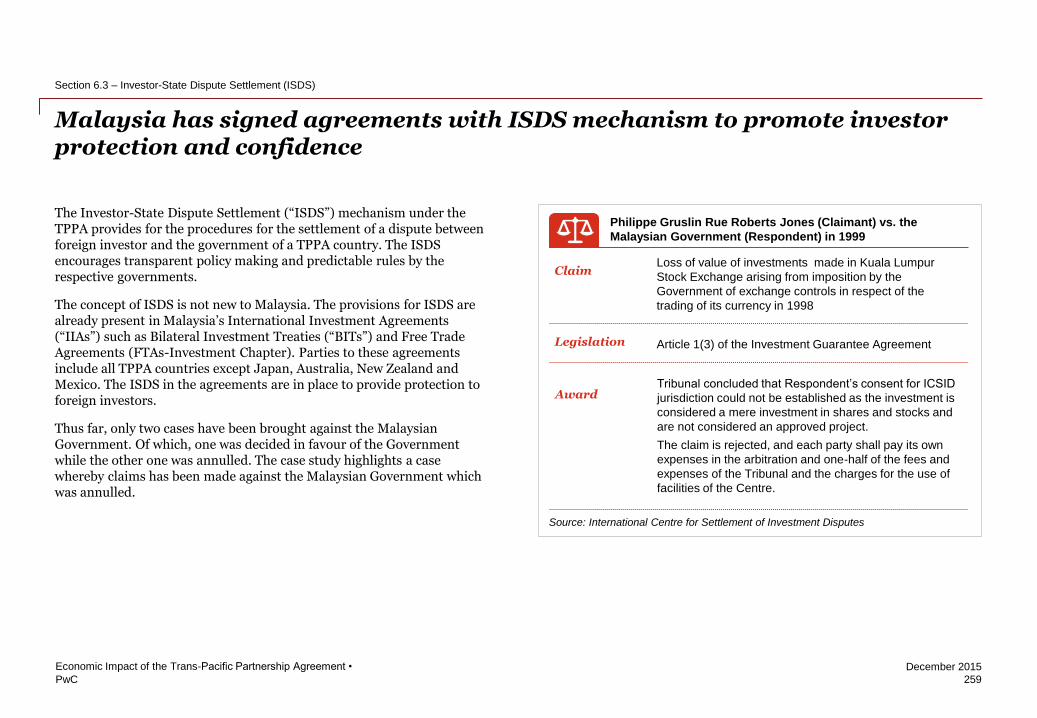
PwC
December 2015
259
Economic Impact of the Trans-Pacific Partnership Agreement •
Section 6.3 – Investor-State Dispute Settlement (ISDS)
Malaysia has signed agreements with ISDS mechanism to promote investor protection and confidence
The Investor-State Dispute Settlement (“ISDS”) mechanism under the TPPA provides for the procedures for the settlement of a dispute between foreign investor and the government of a TPPA country. The ISDS encourages transparent policy making and predictable rules by the respective governments.
The concept of ISDS is not new to Malaysia. The provisions for ISDS are already present in Malaysia’s International Investment Agreements (“IIAs”) such as Bilateral Investment Treaties (“BITs”) and Free Trade Agreements (FTAs-Investment Chapter). Parties to these agreements include all TPPA countries except Japan, Australia, New Zealand and Mexico. The ISDS in the agreements are in place to provide protection to foreign investors.
Thus far, only two cases have been brought against the Malaysian Government. Of which, one was decided in favour of the Government while the other one was annulled. The case study highlights a case whereby claims has been made against the Malaysian Government which was annulled.
Philippe Gruslin Rue Roberts Jones (Claimant) vs. the
Malaysian Government (Respondent) in 1999
Claim
Legislation
Loss of value of investments made in Kuala Lumpur
Stock Exchange arising from imposition by the
Government of exchange controls in respect of the
trading of its currency in 1998
Article 1(3) of the Investment Guarantee Agreement
Award Tribunal concluded that Respondent’s consent for ICSID
jurisdiction could not be established as the investment is
considered a mere investment in shares and stocks and
are not considered an approved project.
The claim is rejected, and each party shall pay its own
expenses in the arbitration and one-half of the fees and
expenses of the Tribunal and the charges for the use of
facilities of the Centre.
Source: International Centre for Settlement of Investment Disputes
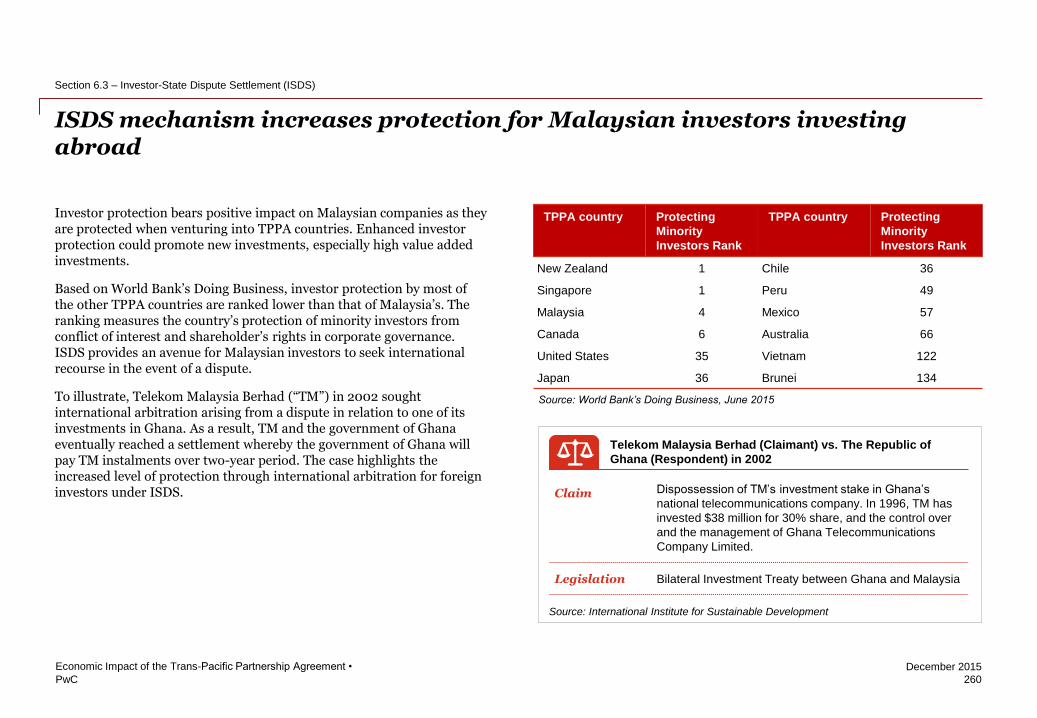
PwC
December 2015
Investor protection bears positive impact on Malaysian companies as they are protected when venturing into TPPA countries. Enhanced investor protection could promote new investments, especially high value added investments.
Based on World Bank’s Doing Business, investor protection by most of the other TPPA countries are ranked lower than that of Malaysia’s. The ranking measures the country’s protection of minority investors from conflict of interest and shareholder’s rights in corporate governance. ISDS provides an avenue for Malaysian investors to seek international recourse in the event of a dispute.
To illustrate, Telekom Malaysia Berhad (“TM”) in 2002 sought international arbitration arising from a dispute in relation to one of its investments in Ghana. As a result, TM and the government of Ghana eventually reached a settlement whereby the government of Ghana will pay TM instalments over two-year period. The case highlights the increased level of protection through international arbitration for foreign investors under ISDS.
260
Economic Impact of the Trans-Pacific Partnership Agreement •
Section 6.3 – Investor-State Dispute Settlement (ISDS)
ISDS mechanism increases protection for Malaysian investors investing abroad
TPPA country Protecting
Minority
Investors Rank
TPPA country Protecting
Minority
Investors Rank
New Zealand 1 Chile 36
Singapore 1 Peru 49
Malaysia 4 Mexico 57
Canada 6 Australia 66
United States 35 Vietnam 122
Japan 36 Brunei 134
Source: World Bank’s Doing Business, June 2015
Telekom Malaysia Berhad (Claimant) vs. The Republic of
Ghana (Respondent) in 2002
Claim
Legislation
Dispossession of TM’s investment stake in Ghana’s
national telecommunications company. In 1996, TM has
invested $38 million for 30% share, and the control over
and the management of Ghana Telecommunications
Company Limited.
Bilateral Investment Treaty between Ghana and Malaysia
Source: International Institute for Sustainable Development
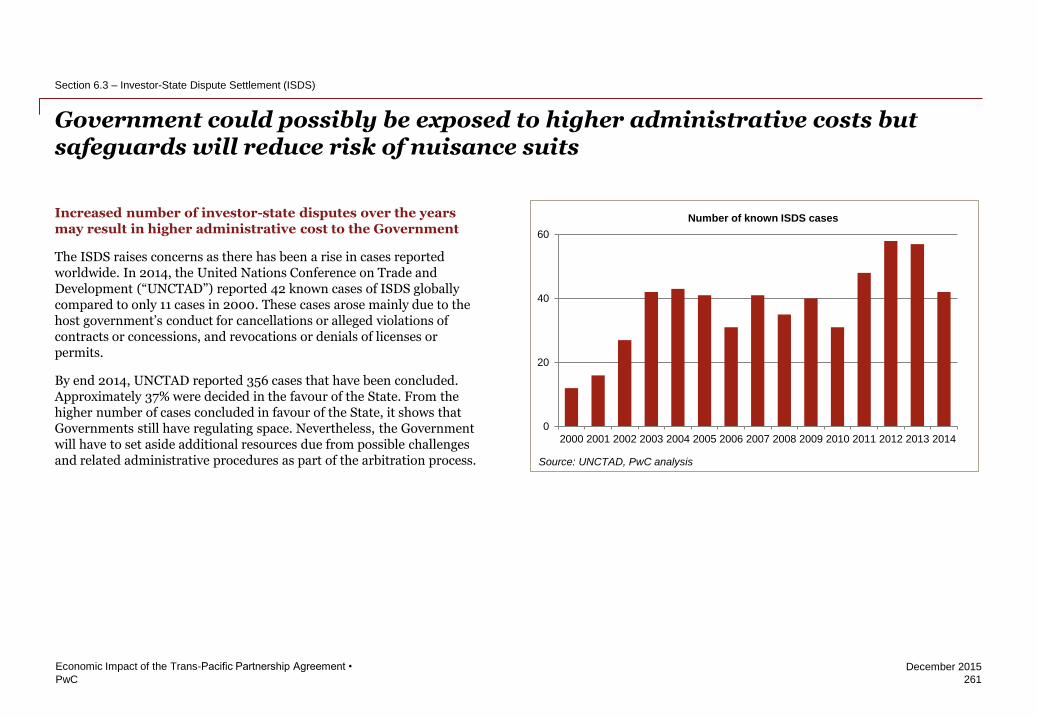
PwC
December 2015
261
Economic Impact of the Trans-Pacific Partnership Agreement •
Section 6.3 – Investor-State Dispute Settlement (ISDS)
Government could possibly be exposed to higher administrative costs but safeguards will reduce risk of nuisance suits
Increased number of investor-state disputes over the years may result in higher administrative cost to the Government
The ISDS raises concerns as there has been a rise in cases reported worldwide. In 2014, the United Nations Conference on Trade and Development (“UNCTAD”) reported 42 known cases of ISDS globally compared to only 11 cases in 2000. These cases arose mainly due to the host government’s conduct for cancellations or alleged violations of contracts or concessions, and revocations or denials of licenses or permits.
By end 2014, UNCTAD reported 356 cases that have been concluded. Approximately 37% were decided in the favour of the State. From the higher number of cases concluded in favour of the State, it shows that Governments still have regulating space. Nevertheless, the Government will have to set aside additional resources due from possible challenges and related administrative procedures as part of the arbitration process.
0
20
40
60
2000 2001 2002 2003 2004 2005 2006 2007 2008 2009 2010 2011 2012 2013 2014
Number of known ISDS cases
Source: UNCTAD, PwC analysis
PwC
December 2015
Investors to pay attorney fees and costs for frivolous claims
The tribunal may award to the prevailing disputing party reasonable cost and attorney’s fees incurred in the cases of frivolous claims.
Consolidation of claims for same events
Any disputing party may seek consolidation of two or more claims arising out of the same events or circumstances in the interest of fair and efficient resolution of claims.
Claims cannot be made if more than 3 years and 6 months have elapsed
No claim shall be submitted if more than three years and six months have elapsed from the date on which the claimant first acquired, or should have first acquired, knowledge of the breach alleged.
Decision to renew or maintain subsidy is not an expropriation
Decision to renew, maintain, modify or reduce subsidy or grant by the Government does not constitute a breach of the minimum standard of treatment even if there is loss or damage to the covered investment as a result.
262
Economic Impact of the Trans-Pacific Partnership Agreement •
Section 6.3 – Investor-State Dispute Settlement (ISDS)
Safeguards under TPPA will reduce the risk of nuisance suits
Despite having the right to seek international arbitration, the TPPA has put in place several safeguards before a tribunal can take place. This will balance the benefit of increased investor protection as well as mitigate the risk of nuisance suits by private investors.
Resolve through consultation and negotiation prior to elevating to formal dispute
In the event of a dispute, the claimant and respondent should initially seek to resolve the dispute through consultation and negotiation, which may include use of non-binding, third party procedures, such as good offices, conciliation or mediation.
Expedited review and dismissal of frivolous claims
When requested by the respondent, the tribunal shall decide on an expedited basis any objection that the dispute is not within the tribunal’s competence or jurisdiction.
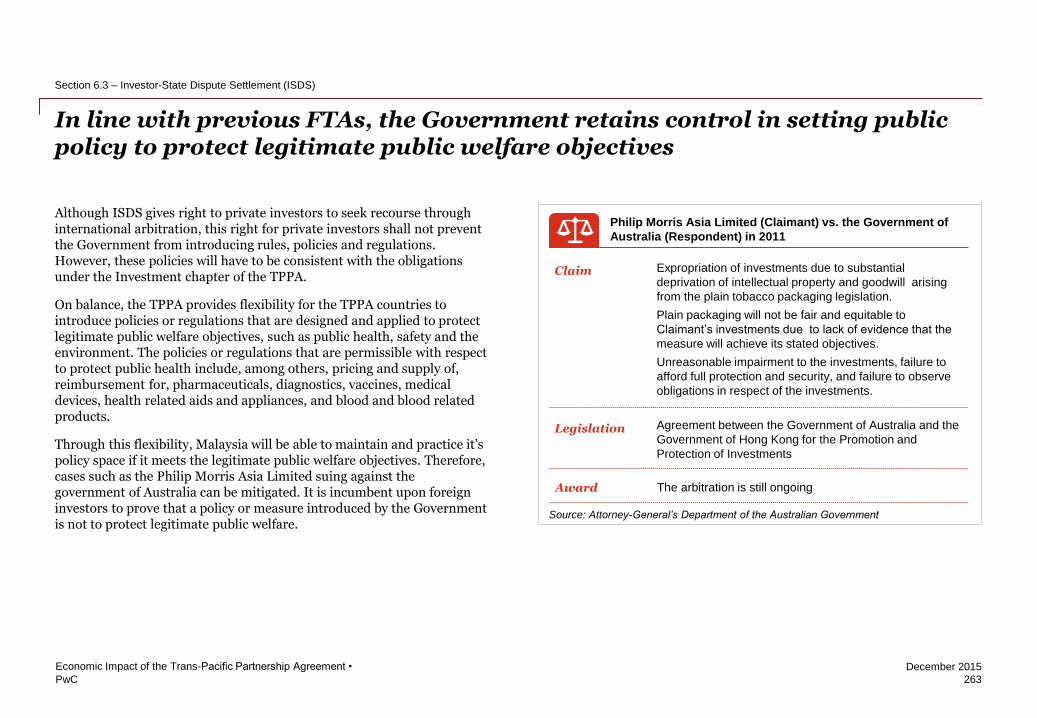
PwC
December 2015
263
Economic Impact of the Trans-Pacific Partnership Agreement •
Section 6.3 – Investor-State Dispute Settlement (ISDS)
In line with previous FTAs, the Government retains control in setting public policy to protect legitimate public welfare objectives
Although ISDS gives right to private investors to seek recourse through international arbitration, this right for private investors shall not prevent the Government from introducing rules, policies and regulations. However, these policies will have to be consistent with the obligations under the Investment chapter of the TPPA.
On balance, the TPPA provides flexibility for the TPPA countries to introduce policies or regulations that are designed and applied to protect legitimate public welfare objectives, such as public health, safety and the environment. The policies or regulations that are permissible with respect to protect public health include, among others, pricing and supply of, reimbursement for, pharmaceuticals, diagnostics, vaccines, medical devices, health related aids and appliances, and blood and blood related products.
Through this flexibility, Malaysia will be able to maintain and practice it’s policy space if it meets the legitimate public welfare objectives. Therefore, cases such as the Philip Morris Asia Limited suing against the government of Australia can be mitigated. It is incumbent upon foreign investors to prove that a policy or measure introduced by the Government is not to protect legitimate public welfare.
Philip Morris Asia Limited (Claimant) vs. the Government of
Australia (Respondent) in 2011
Claim
Legislation
Expropriation of investments due to substantial
deprivation of intellectual property and goodwill arising
from the plain tobacco packaging legislation.
Plain packaging will not be fair and equitable to
Claimant’s investments due to lack of evidence that the
measure will achieve its stated objectives.
Unreasonable impairment to the investments, failure to
afford full protection and security, and failure to observe
obligations in respect of the investments.
Agreement between the Government of Australia and the
Government of Hong Kong for the Promotion and
Protection of Investments
Award The arbitration is still ongoing
Source: Attorney-General’s Department of the Australian Government

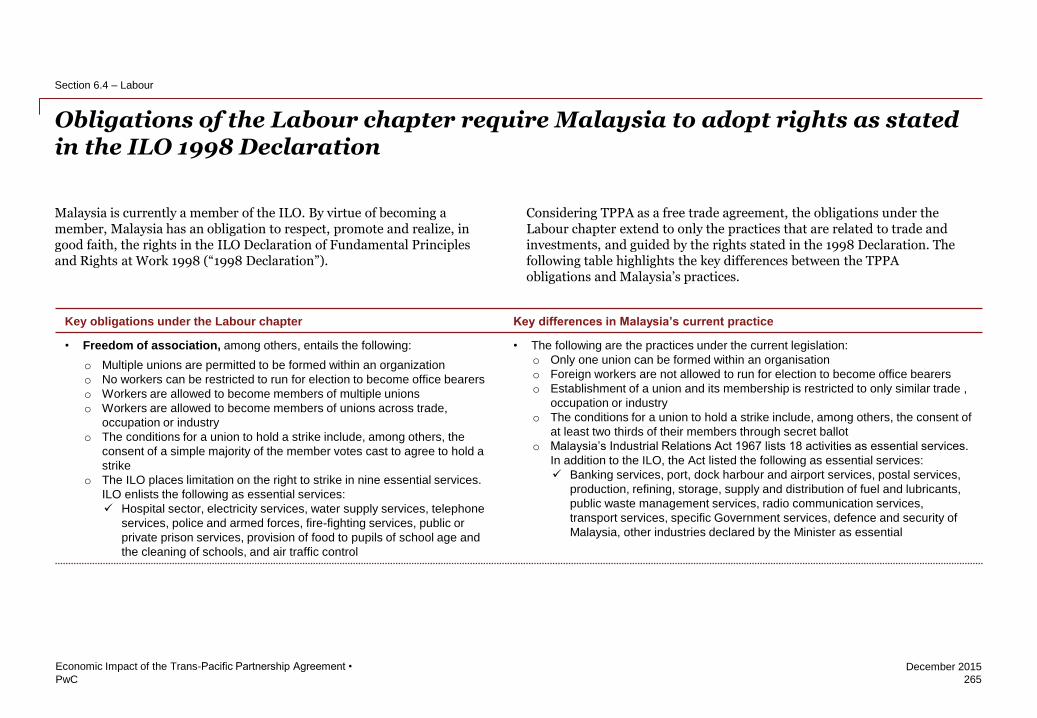
PwC
December 2015
Obligations of the Labour chapter require Malaysia to adopt rights as stated in the ILO 1998 Declaration
265
Economic Impact of the Trans-Pacific Partnership Agreement •
Section 6.4 – Labour
Malaysia is currently a member of the ILO. By virtue of becoming a member, Malaysia has an obligation to respect, promote and realize, in good faith, the rights in the ILO Declaration of Fundamental Principles and Rights at Work 1998 (“1998 Declaration”).
Considering TPPA as a free trade agreement, the obligations under the Labour chapter extend to only the practices that are related to trade and investments, and guided by the rights stated in the 1998 Declaration. The following table highlights the key differences between the TPPA obligations and Malaysia’s practices.
Key obligations under the Labour chapter Key differences in Malaysia’s current practice
• Freedom of association, among others, entails the following:
o Multiple unions are permitted to be formed within an organization
o No workers can be restricted to run for election to become office bearers
o Workers are allowed to become members of multiple unions
o Workers are allowed to become members of unions across trade,
occupation or industry
o The conditions for a union to hold a strike include, among others, the
consent of a simple majority of the member votes cast to agree to hold a
strike
o The ILO places limitation on the right to strike in nine essential services.
ILO enlists the following as essential services:
Hospital sector, electricity services, water supply services, telephone
services, police and armed forces, fire-fighting services, public or
private prison services, provision of food to pupils of school age and
the cleaning of schools, and air traffic control
• The following are the practices under the current legislation:
o Only one union can be formed within an organisation
o Foreign workers are not allowed to run for election to become office bearers
o Establishment of a union and its membership is restricted to only similar trade ,
occupation or industry
o The conditions for a union to hold a strike include, among others, the consent of
at least two thirds of their members through secret ballot
o Malaysia’s Industrial Relations Act 1967 lists 18 activities as essential services.
In addition to the ILO, the Act listed the following as essential services:
Banking services, port, dock harbour and airport services, postal services,
production, refining, storage, supply and distribution of fuel and lubricants,
public waste management services, radio communication services,
transport services, specific Government services, defence and security of
Malaysia, other industries declared by the Minister as essential
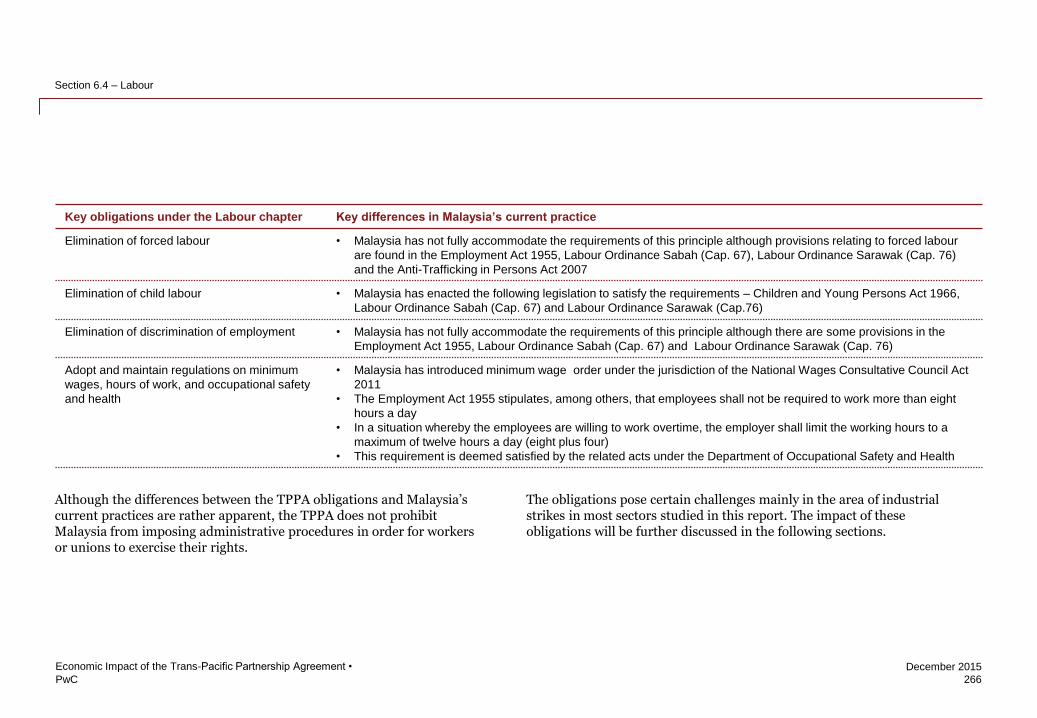
PwC
December 2015
266
Economic Impact of the Trans-Pacific Partnership Agreement •
Section 6.4 – Labour
Key obligations under the Labour chapter Key differences in Malaysia’s current practice
Elimination of forced labour • Malaysia has not fully accommodate the requirements of this principle although provisions relating to forced labour
are found in the Employment Act 1955, Labour Ordinance Sabah (Cap. 67), Labour Ordinance Sarawak (Cap. 76)
and the Anti-Trafficking in Persons Act 2007
Elimination of child labour • Malaysia has enacted the following legislation to satisfy the requirements – Children and Young Persons Act 1966,
Labour Ordinance Sabah (Cap. 67) and Labour Ordinance Sarawak (Cap.76)
Elimination of discrimination of employment • Malaysia has not fully accommodate the requirements of this principle although there are some provisions in the
Employment Act 1955, Labour Ordinance Sabah (Cap. 67) and Labour Ordinance Sarawak (Cap. 76)
Adopt and maintain regulations on minimum
wages, hours of work, and occupational safety
and health
• Malaysia has introduced minimum wage order under the jurisdiction of the National Wages Consultative Council Act
2011
• The Employment Act 1955 stipulates, among others, that employees shall not be required to work more than eight
hours a day
• In a situation whereby the employees are willing to work overtime, the employer shall limit the working hours to a
maximum of twelve hours a day (eight plus four)
• This requirement is deemed satisfied by the related acts under the Department of Occupational Safety and Health
Although the differences between the TPPA obligations and Malaysia’s current practices are rather apparent, the TPPA does not prohibit Malaysia from imposing administrative procedures in order for workers or unions to exercise their rights.
The obligations pose certain challenges mainly in the area of industrial strikes in most sectors studied in this report. The impact of these obligations will be further discussed in the following sections.
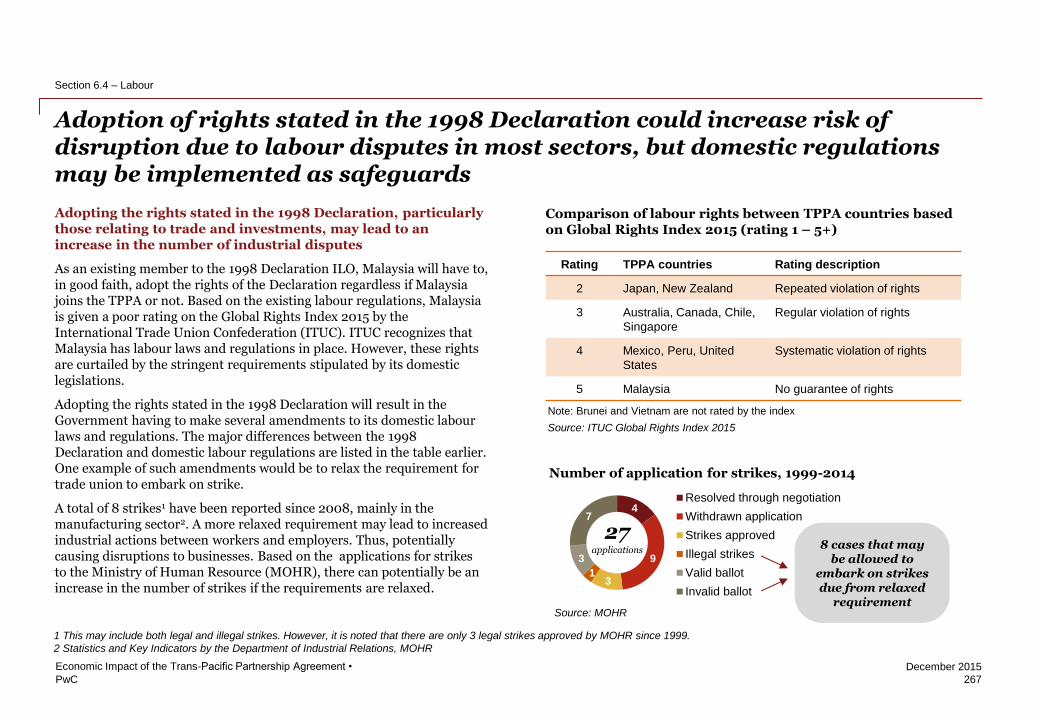
PwC
December 2015
267
Economic Impact of the Trans-Pacific Partnership Agreement •
Section 6.4 – Labour
Adoption of rights stated in the 1998 Declaration could increase risk of disruption due to labour disputes in most sectors, but domestic regulations may be implemented as safeguards
Adopting the rights stated in the 1998 Declaration, particularly those relating to trade and investments, may lead to an increase in the number of industrial disputes
As an existing member to the 1998 Declaration ILO, Malaysia will have to, in good faith, adopt the rights of the Declaration regardless if Malaysia joins the TPPA or not. Based on the existing labour regulations, Malaysia is given a poor rating on the Global Rights Index 2015 by the International Trade Union Confederation (ITUC). ITUC recognizes that Malaysia has labour laws and regulations in place. However, these rights are curtailed by the stringent requirements stipulated by its domestic legislations.
Adopting the rights stated in the 1998 Declaration will result in the Government having to make several amendments to its domestic labour laws and regulations. The major differences between the 1998 Declaration and domestic labour regulations are listed in the table earlier. One example of such amendments would be to relax the requirement for trade union to embark on strike.
A total of 8 strikes1 have been reported since 2008, mainly in the manufacturing sector2. A more relaxed requirement may lead to increased industrial actions between workers and employers. Thus, potentially causing disruptions to businesses. Based on the applications for strikes to the Ministry of Human Resource (MOHR), there can potentially be an increase in the number of strikes if the requirements are relaxed.
Rating TPPA countries Rating description
2 Japan, New Zealand Repeated violation of rights
3 Australia, Canada, Chile,
Singapore
Regular violation of rights
4 Mexico, Peru, United
States
Systematic violation of rights
5 Malaysia No guarantee of rights
Comparison of labour rights between TPPA countries based on Global Rights Index 2015 (rating 1 – 5+)
Note: Brunei and Vietnam are not rated by the index
Source: ITUC Global Rights Index 2015
4
9
3 1
3
7
Resolved through negotiation
Withdrawn application
Strikes approved
Illegal strikes
Valid ballot
Invalid ballot
Number of application for strikes, 1999-2014
27 applications
Source: MOHR
8 cases that may be allowed to
embark on strikes due from relaxed
requirement
1 This may include both legal and illegal strikes. However, it is noted that there are only 3 legal strikes approved by MOHR since 1999.
2 Statistics and Key Indicators by the Department of Industrial Relations, MOHR
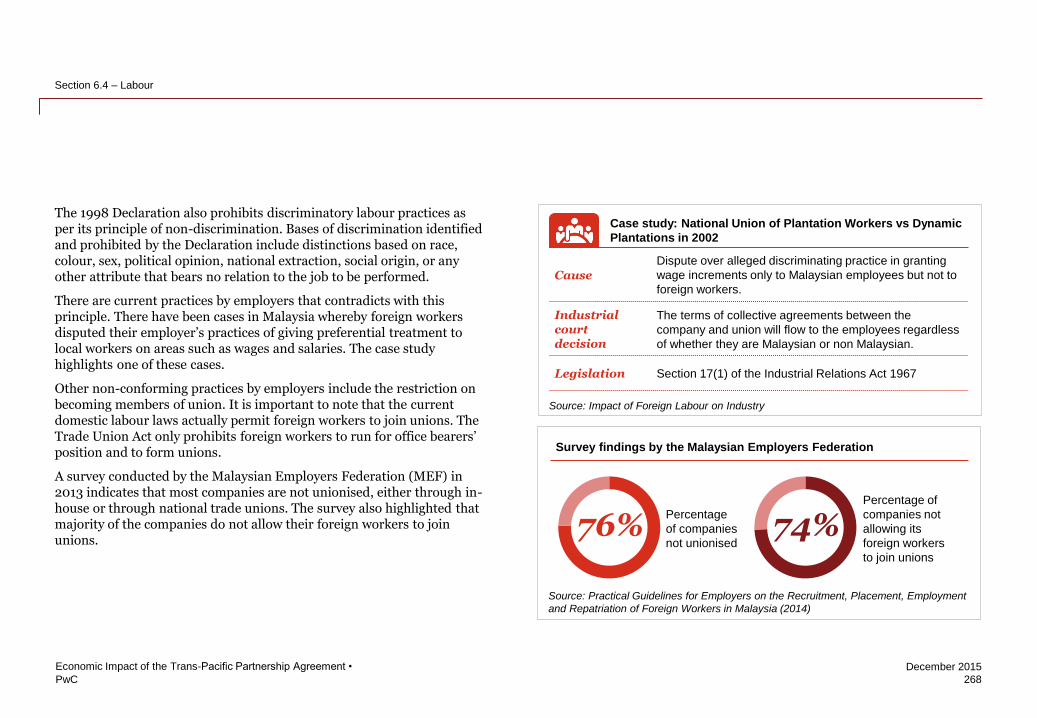
PwC
December 2015
268
Economic Impact of the Trans-Pacific Partnership Agreement •
Section 6.4 – Labour
The 1998 Declaration also prohibits discriminatory labour practices as per its principle of non-discrimination. Bases of discrimination identified and prohibited by the Declaration include distinctions based on race, colour, sex, political opinion, national extraction, social origin, or any other attribute that bears no relation to the job to be performed.
There are current practices by employers that contradicts with this principle. There have been cases in Malaysia whereby foreign workers disputed their employer’s practices of giving preferential treatment to local workers on areas such as wages and salaries. The case study highlights one of these cases.
Other non-conforming practices by employers include the restriction on becoming members of union. It is important to note that the current domestic labour laws actually permit foreign workers to join unions. The Trade Union Act only prohibits foreign workers to run for office bearers’ position and to form unions.
A survey conducted by the Malaysian Employers Federation (MEF) in 2013 indicates that most companies are not unionised, either through in-house or through national trade unions. The survey also highlighted that majority of the companies do not allow their foreign workers to join unions.
Case study: National Union of Plantation Workers vs Dynamic
Plantations in 2002
Cause
Industrial court decision
Legislation
Dispute over alleged discriminating practice in granting
wage increments only to Malaysian employees but not to
foreign workers.
The terms of collective agreements between the
company and union will flow to the employees regardless
of whether they are Malaysian or non Malaysian.
Section 17(1) of the Industrial Relations Act 1967
Source: Impact of Foreign Labour on Industry
Survey findings by the Malaysian Employers Federation
76% 74% Percentage
of companies
not unionised
Percentage of
companies not
allowing its
foreign workers
to join unions
Source: Practical Guidelines for Employers on the Recruitment, Placement, Employment
and Repatriation of Foreign Workers in Malaysia (2014)
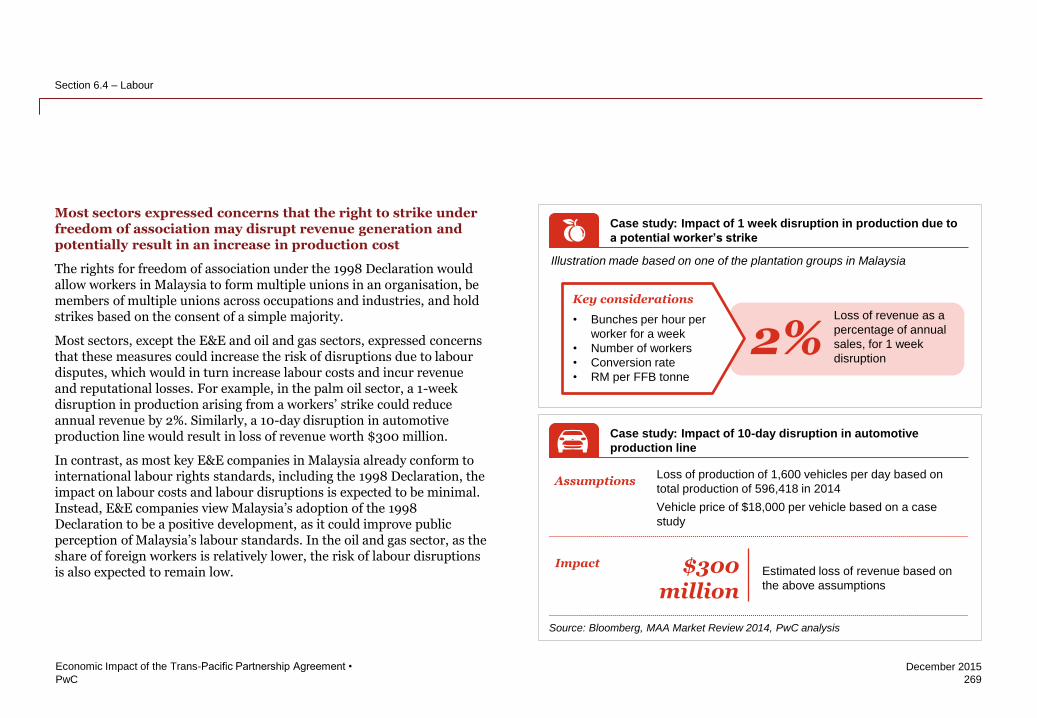
PwC
December 2015
269
Economic Impact of the Trans-Pacific Partnership Agreement •
Section 6.4 – Labour
Most sectors expressed concerns that the right to strike under freedom of association may disrupt revenue generation and potentially result in an increase in production cost
The rights for freedom of association under the 1998 Declaration would allow workers in Malaysia to form multiple unions in an organisation, be members of multiple unions across occupations and industries, and hold strikes based on the consent of a simple majority.
Most sectors, except the E&E and oil and gas sectors, expressed concerns that these measures could increase the risk of disruptions due to labour disputes, which would in turn increase labour costs and incur revenue and reputational losses. For example, in the palm oil sector, a 1-week disruption in production arising from a workers’ strike could reduce annual revenue by 2%. Similarly, a 10-day disruption in automotive production line would result in loss of revenue worth $300 million.
In contrast, as most key E&E companies in Malaysia already conform to international labour rights standards, including the 1998 Declaration, the impact on labour costs and labour disruptions is expected to be minimal. Instead, E&E companies view Malaysia’s adoption of the 1998 Declaration to be a positive development, as it could improve public perception of Malaysia’s labour standards. In the oil and gas sector, as the share of foreign workers is relatively lower, the risk of labour disruptions is also expected to remain low.
Case study: Impact of 1 week disruption in production due to
a potential worker’s strike
Key considerations
• Bunches per hour per
worker for a week
• Number of workers
• Conversion rate
• RM per FFB tonne
Case study: Impact of 10-day disruption in automotive
production line
Assumptions Loss of production of 1,600 vehicles per day based on
total production of 596,418 in 2014
Vehicle price of $18,000 per vehicle based on a case
study
Impact
Source: Bloomberg, MAA Market Review 2014, PwC analysis
Illustration made based on one of the plantation groups in Malaysia
2% Loss of revenue as a
percentage of annual
sales, for 1 week
disruption
$300 million
Estimated loss of revenue based on
the above assumptions
PwC
December 2015
270
Economic Impact of the Trans-Pacific Partnership Agreement •
Section 6.4 – Labour
Malaysia maintains flexibility to implement domestic regulations to manage risks
Adoption of the rights stated in the 1998 Declaration under TPPA would not preclude Malaysia from implementing additional domestic regulations or guidelines that could help to manage risks of highly disruptive labour disputes. For example, the Government may continue to put conditions as prerequisites before any legal strikes can be carried out including achieving quorum requirement and simple majority threshold in the secret ballot, providing adequate notice, protecting anonymity of ballot, and in full compliance with the rules of the trade union.
Placing these regulatory measures and guidelines provides the Government and industry companies with advance notice to manage the risks of disruptions arising from labour disputes. The imposition of such domestic measures is practiced in the more advanced economies, such as the European Union, and several regional economies, such as Singapore.
While enforcing the labour rights under the 1998 Declaration may seem to increase the cost of business, a joint study by the ILO and the World Trade Organisation (WTO) has found that there is little concrete evidence to support this view. Trade union density and collective bargaining are only one factor amongst many that can have influence on the economic performance.
PwC
December 2015
Section 7 Conclusion
271
Economic Impact of the Trans-Pacific Partnership Agreement •

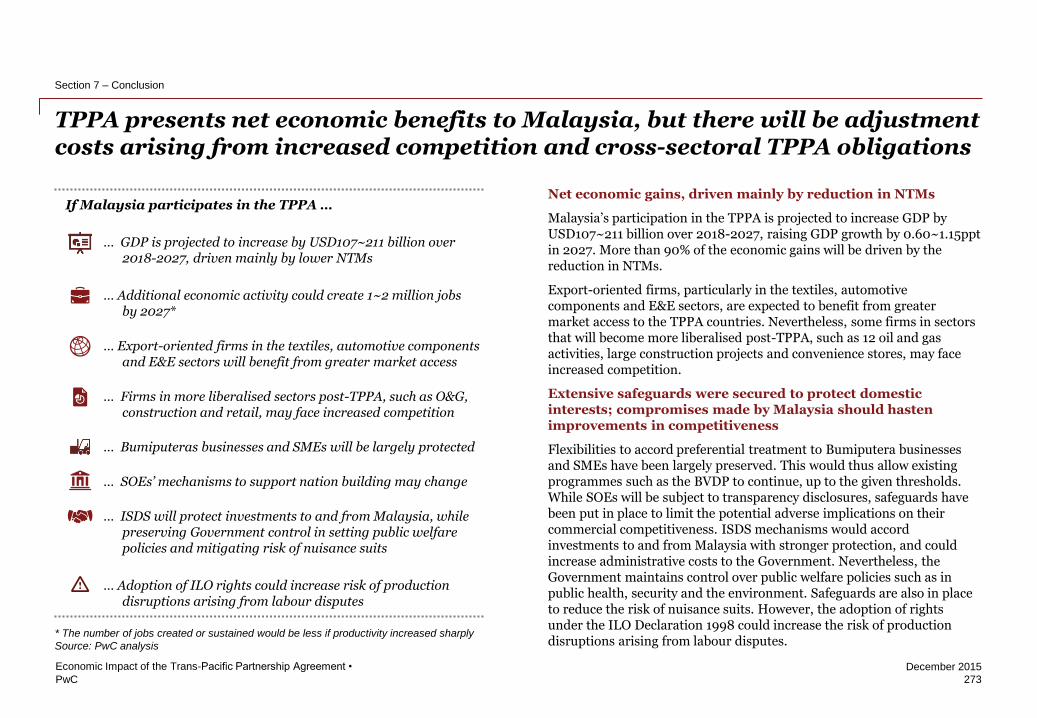
PwC
December 2015
If Malaysia participates in the TPPA …
… GDP is projected to increase by USD107~211 billion over 2018-2027, driven mainly by lower NTMs
… Additional economic activity could create 1~2 million jobs by 2027*
… Export-oriented firms in the textiles, automotive components and E&E sectors will benefit from greater market access
… Firms in more liberalised sectors post-TPPA, such as O&G, construction and retail, may face increased competition
… Bumiputeras businesses and SMEs will be largely protected
… SOEs’ mechanisms to support nation building may change
… ISDS will protect investments to and from Malaysia, while preserving Government control in setting public welfare policies and mitigating risk of nuisance suits
… Adoption of ILO rights could increase risk of production disruptions arising from labour disputes
TPPA presents net economic benefits to Malaysia, but there will be adjustment costs arising from increased competition and cross-sectoral TPPA obligations
273
Economic Impact of the Trans-Pacific Partnership Agreement •
Section 7 – Conclusion
* The number of jobs created or sustained would be less if productivity increased sharply
Source: PwC analysis
Net economic gains, driven mainly by reduction in NTMs
Malaysia’s participation in the TPPA is projected to increase GDP by USD107~211 billion over 2018-2027, raising GDP growth by 0.60~1.15ppt in 2027. More than 90% of the economic gains will be driven by the reduction in NTMs.
Export-oriented firms, particularly in the textiles, automotive components and E&E sectors, are expected to benefit from greater market access to the TPPA countries. Nevertheless, some firms in sectors that will become more liberalised post-TPPA, such as 12 oil and gas activities, large construction projects and convenience stores, may face increased competition.
Extensive safeguards were secured to protect domestic interests; compromises made by Malaysia should hasten improvements in competitiveness
Flexibilities to accord preferential treatment to Bumiputera businesses and SMEs have been largely preserved. This would thus allow existing programmes such as the BVDP to continue, up to the given thresholds. While SOEs will be subject to transparency disclosures, safeguards have been put in place to limit the potential adverse implications on their commercial competitiveness. ISDS mechanisms would accord investments to and from Malaysia with stronger protection, and could increase administrative costs to the Government. Nevertheless, the Government maintains control over public welfare policies such as in public health, security and the environment. Safeguards are also in place to reduce the risk of nuisance suits. However, the adoption of rights under the ILO Declaration 1998 could increase the risk of production disruptions arising from labour disputes.
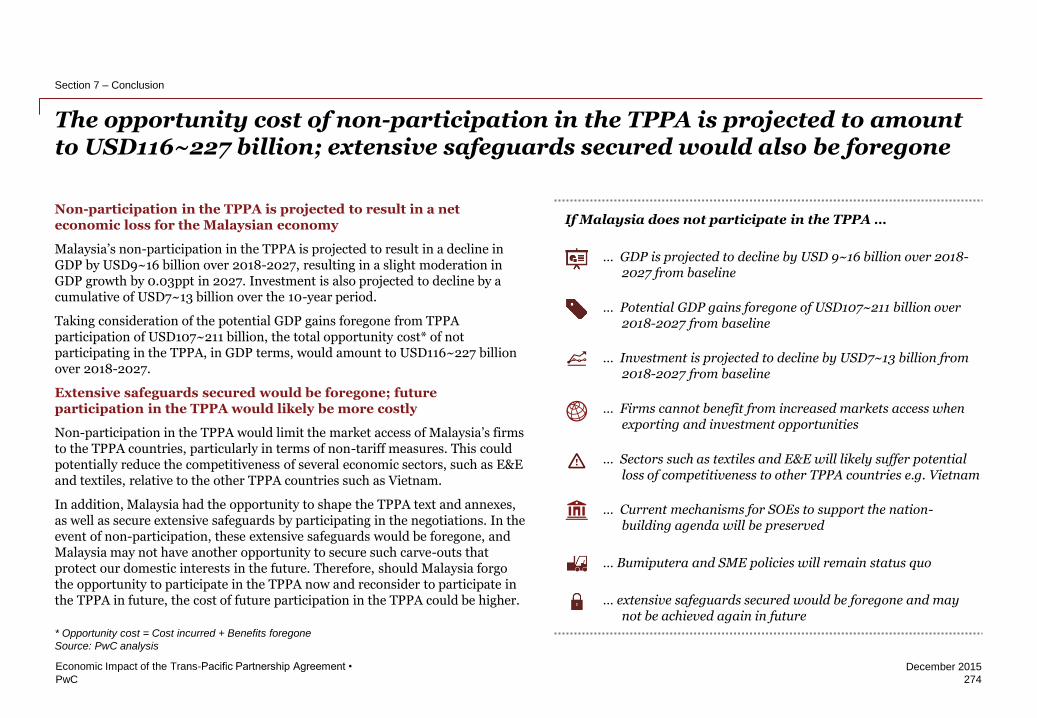
PwC
December 2015
The opportunity cost of non-participation in the TPPA is projected to amount to USD116~227 billion; extensive safeguards secured would also be foregone
274
Economic Impact of the Trans-Pacific Partnership Agreement •
Section 7 – Conclusion
* Opportunity cost = Cost incurred + Benefits foregone
Source: PwC analysis
Non-participation in the TPPA is projected to result in a net economic loss for the Malaysian economy
Malaysia’s non-participation in the TPPA is projected to result in a decline in GDP by USD9~16 billion over 2018-2027, resulting in a slight moderation in GDP growth by 0.03ppt in 2027. Investment is also projected to decline by a cumulative of USD7~13 billion over the 10-year period.
Taking consideration of the potential GDP gains foregone from TPPA participation of USD107~211 billion, the total opportunity cost* of not participating in the TPPA, in GDP terms, would amount to USD116~227 billion over 2018-2027.
Extensive safeguards secured would be foregone; future participation in the TPPA would likely be more costly
Non-participation in the TPPA would limit the market access of Malaysia’s firms to the TPPA countries, particularly in terms of non-tariff measures. This could potentially reduce the competitiveness of several economic sectors, such as E&E and textiles, relative to the other TPPA countries such as Vietnam.
In addition, Malaysia had the opportunity to shape the TPPA text and annexes, as well as secure extensive safeguards by participating in the negotiations. In the event of non-participation, these extensive safeguards would be foregone, and Malaysia may not have another opportunity to secure such carve-outs that protect our domestic interests in the future. Therefore, should Malaysia forgo the opportunity to participate in the TPPA now and reconsider to participate in the TPPA in future, the cost of future participation in the TPPA could be higher.
If Malaysia does not participate in the TPPA …
… GDP is projected to decline by USD 9~16 billion over 2018-2027 from baseline
… Potential GDP gains foregone of USD107~211 billion over 2018-2027 from baseline
… Investment is projected to decline by USD7~13 billion from 2018-2027 from baseline
… Firms cannot benefit from increased markets access when exporting and investment opportunities
… Sectors such as textiles and E&E will likely suffer potential loss of competitiveness to other TPPA countries e.g. Vietnam
… Current mechanisms for SOEs to support the nation-building agenda will be preserved
… Bumiputera and SME policies will remain status quo
… extensive safeguards secured would be foregone and may not be achieved again in future
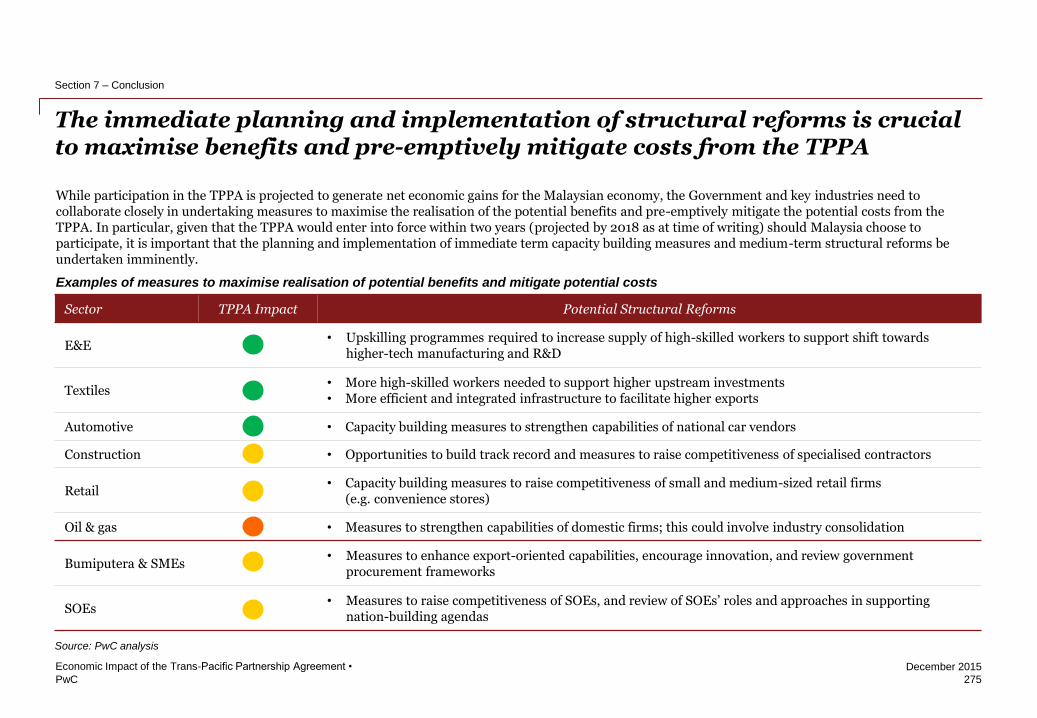
PwC
December 2015
The immediate planning and implementation of structural reforms is crucial to maximise benefits and pre-emptively mitigate costs from the TPPA
275
Economic Impact of the Trans-Pacific Partnership Agreement •
Section 7 – Conclusion
Source: PwC analysis
Sector TPPA Impact Potential Structural Reforms
E&E • Upskilling programmes required to increase supply of high-skilled workers to support shift towards
higher-tech manufacturing and R&D
Textiles • More high-skilled workers needed to support higher upstream investments • More efficient and integrated infrastructure to facilitate higher exports
Automotive • Capacity building measures to strengthen capabilities of national car vendors
Construction • Opportunities to build track record and measures to raise competitiveness of specialised contractors
Retail • Capacity building measures to raise competitiveness of small and medium-sized retail firms
(e.g. convenience stores)
Oil & gas • Measures to strengthen capabilities of domestic firms; this could involve industry consolidation
Bumiputera & SMEs • Measures to enhance export-oriented capabilities, encourage innovation, and review government
procurement frameworks
SOEs • Measures to raise competitiveness of SOEs, and review of SOEs’ roles and approaches in supporting
nation-building agendas
While participation in the TPPA is projected to generate net economic gains for the Malaysian economy, the Government and key industries need to collaborate closely in undertaking measures to maximise the realisation of the potential benefits and pre-emptively mitigate the potential costs from the TPPA. In particular, given that the TPPA would enter into force within two years (projected by 2018 as at time of writing) should Malaysia choose to participate, it is important that the planning and implementation of immediate term capacity building measures and medium-term structural reforms be undertaken imminently.
Examples of measures to maximise realisation of potential benefits and mitigate potential costs


Appendix


PwC
December 2015
Appendix 1 About the model
279
Economic Impact of the Trans-Pacific Partnership Agreement •


PwC
December 2015
About CGE modelling
CGE modelling is an approach that numerically simulates key macro and microeconomic interactions within an economy. It looks at the interactions and economic feedbacks between government, firms (sectors) and households. It is a common tool used by international organisations, such as the IMF and World Bank, to estimate the empirical effects of policy scenarios.
CGE models provide an empirical foundation for policy analysis that can quantify the magnitudes of theoretical effects, and estimate the probable impact of a trade agreement. In the model, equations to model the economic interactions are calibrated to country economic data to create a baseline view of the economy.
The CGE model output measures the difference between the scenarios (where policy changes are modelled) and the baseline. Key economic metrics include:
• GDP
• Welfare
• Exports and imports
The modelling exercise in this study was conducted by Dr Jamal bin Othman from Universiti Kebangsaan Malaysia.
Modelling the impact of joining or not joining the TPPA to Malaysia
281
Economic Impact of the Trans-Pacific Partnership Agreement •
Appendix 1 – About the model
Govt
Household Businesses
Foreign Sector
Financial Sector
Government
savings
Consumption
Factor
Payments
CGE models show the interactions between different markets, encompassing an economy
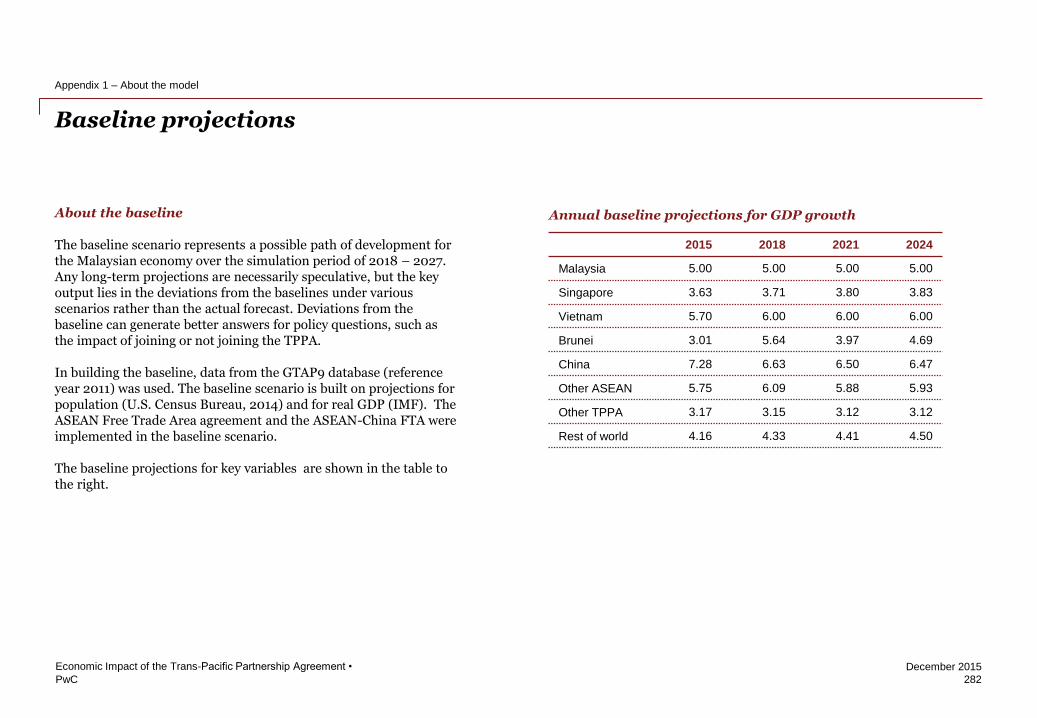
PwC
December 2015
Baseline projections
282
Economic Impact of the Trans-Pacific Partnership Agreement •
Appendix 1 – About the model
About the baseline
The baseline scenario represents a possible path of development for the Malaysian economy over the simulation period of 2018 – 2027. Any long-term projections are necessarily speculative, but the key output lies in the deviations from the baselines under various scenarios rather than the actual forecast. Deviations from the baseline can generate better answers for policy questions, such as the impact of joining or not joining the TPPA.
In building the baseline, data from the GTAP9 database (reference year 2011) was used. The baseline scenario is built on projections for population (U.S. Census Bureau, 2014) and for real GDP (IMF). The ASEAN Free Trade Area agreement and the ASEAN-China FTA were implemented in the baseline scenario.
The baseline projections for key variables are shown in the table to the right.
2015 2018 2021 2024
Malaysia 5.00 5.00 5.00 5.00
Singapore 3.63 3.71 3.80 3.83
Vietnam 5.70 6.00 6.00 6.00
Brunei 3.01 5.64 3.97 4.69
China 7.28 6.63 6.50 6.47
Other ASEAN 5.75 6.09 5.88 5.93
Other TPPA 3.17 3.15 3.12 3.12
Rest of world 4.16 4.33 4.41 4.50
Annual baseline projections for GDP growth
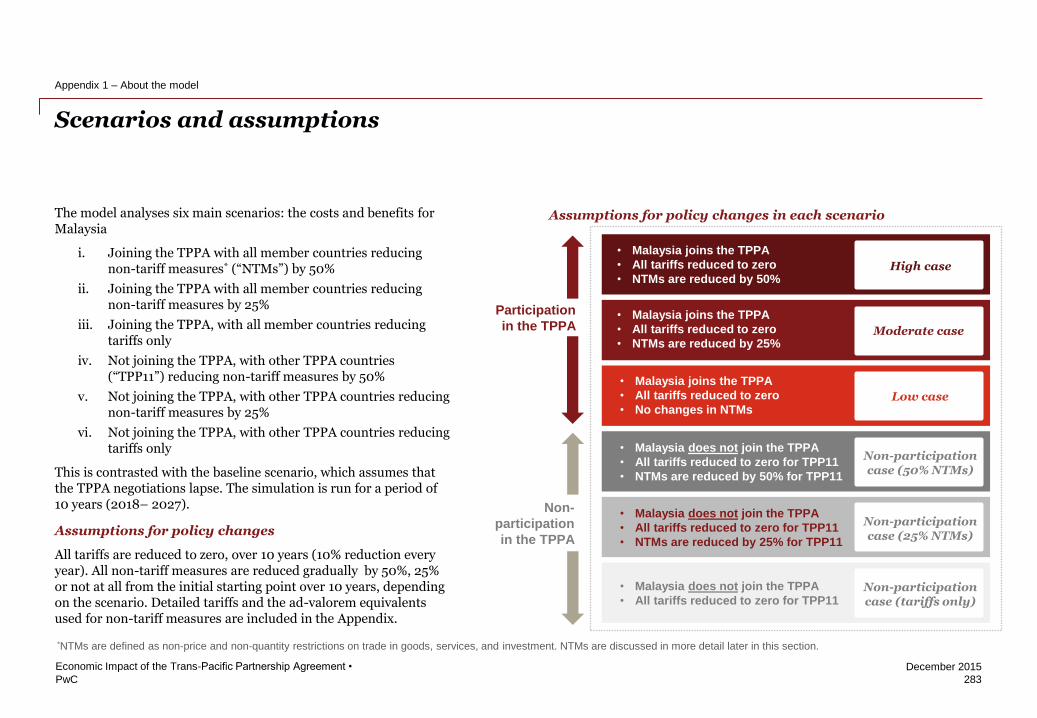
PwC
December 2015
Scenarios and assumptions
283
Economic Impact of the Trans-Pacific Partnership Agreement •
Appendix 1 – About the model
The model analyses six main scenarios: the costs and benefits for Malaysia
i. Joining the TPPA with all member countries reducing non-tariff measures* (“NTMs”) by 50%
ii. Joining the TPPA with all member countries reducing non-tariff measures by 25%
iii. Joining the TPPA, with all member countries reducing tariffs only
iv. Not joining the TPPA, with other TPPA countries (“TPP11”) reducing non-tariff measures by 50%
v. Not joining the TPPA, with other TPPA countries reducing non-tariff measures by 25%
vi. Not joining the TPPA, with other TPPA countries reducing tariffs only
This is contrasted with the baseline scenario, which assumes that the TPPA negotiations lapse. The simulation is run for a period of 10 years (2018– 2027).
Assumptions for policy changes
All tariffs are reduced to zero, over 10 years (10% reduction every year). All non-tariff measures are reduced gradually by 50%, 25% or not at all from the initial starting point over 10 years, depending on the scenario. Detailed tariffs and the ad-valorem equivalents used for non-tariff measures are included in the Appendix.
High case
• Malaysia joins the TPPA
• All tariffs reduced to zero
• NTMs are reduced by 50%
Moderate case
• Malaysia joins the TPPA
• All tariffs reduced to zero
• NTMs are reduced by 25%
Low case
• Malaysia joins the TPPA
• All tariffs reduced to zero
• No changes in NTMs
Non-participation case (50% NTMs)
• Malaysia does not join the TPPA
• All tariffs reduced to zero for TPP11
• NTMs are reduced by 50% for TPP11
Non-participation case (25% NTMs)
• Malaysia does not join the TPPA
• All tariffs reduced to zero for TPP11
• NTMs are reduced by 25% for TPP11
Non-participation case (tariffs only)
• Malaysia does not join the TPPA
• All tariffs reduced to zero for TPP11
Participation
in the TPPA
Non-
participation
in the TPPA
Assumptions for policy changes in each scenario
*NTMs are defined as non-price and non-quantity restrictions on trade in goods, services, and investment. NTMs are discussed in more detail later in this section.
PwC
December 2015
Limitations of the CGE model
284
Economic Impact of the Trans-Pacific Partnership Agreement •
Appendix 1 – About the model
By definition, a model is a simplified approach to describing an economy. As such, the CGE model has limitations*, some which include:
• CGE models are not unconditional predictions
CGE simulations project what the world would be like if certain policy changes have been implemented. Like any model, there will be changes in circumstances in the real world which cannot be predicted by the model.
• CGE models are essentially theoretical models of the economy
While CGE models are quantitative, they are not empirical in the sense of econometric modelling. They are theoretical models, with limited possibilities for testing against experience.
• The model is built more for analysis of trade in merchandise rather than investment or services
There is no explicit treatment of barrier to services trade, as well as non tariff measures (“NTMs”) and technical barriers to trade (“TBTs”).
• Assumptions required about non-tariff measures
NTMs are defined as all non-price and non-quantity restrictions on trade in goods, services, and investment. By definition, NTMs are difficult to quantify; typically, they are estimated in AVE terms. This study follows Kawasaki** for data on the AVEs of NTMs.
• Model sensitivity
Conclusions about trade policy are very sensitive to the levels assumed for trade restrictions. As such, 3 scenarios for Malaysia joining the TPPA were shown (50% and 25% reduction in NTMs as well as only tariff removal).
• Assumptions about market structure
The GTAP model assumes constant returns to scale and competitive markets for all sectors.
• Model does not account for location decisions
The model does not take into account the possible relocation of firms across countries, as the Armington assumption models imperfect substitution between varieties of different origin rather than location decisions.
*Hertel, T., Keeney, R., Ivanic M. and Alan Winters, L. Distributional effects of WTO agricultural reforms in rich and poor countries. Economic Policy, April 2007
**Kawasaki, The Relative Significance of EPAs in Asia-Pacific*. RIETI Discussion Paper Series 14-E-009, January 2014
PwC
December 2015
Assumptions about NTMs
285
Economic Impact of the Trans-Pacific Partnership Agreement •
Appendix 1 – About the model
About non-tariff measures
NTMs are defined as “all non-price and non-quantity restrictions on trade in goods, services, and investment at the federal and state levels.” They refer to obstacles to trade except for price/quantity restrictions such as tariffs.
NTMs include direct import obstructions at the border to measures that have a less direct link to trade such as non-conformation to international standards. Such measures induce additional costs for foreign producers, increasing the cost of trade.
Modelling NTMs is a challenging exercise due to their diverse and complex nature, as well as the lack of quantification. CGE modelling is traditionally more comfortable with policies whose impact can be interpreted into direct effects on prices.
Modelling non-tariff measures as ad-valorem equivalents
Given their inherent complexity, NTMs are modelled here as ad-valorem equivalents, based on Kawasaki (2010, 2014)* and Kee, Nicita and Olarreaga (2008, 2009) **. The estimation of these tariff equivalents was based on regression for 4,575 tariff lines in 78 countries, and were last updated in 2012. These calculations were based on UNCTAD’s TRAINS database as well as WTO’s Integrated Database. Core NTMs include price control measures, quantity restrictions, monopolistic measures and regulations.
Tariffs were reduced to zero over 10 years (10% reduction every year), while non-tariff measures were reduced by 50%, 25% or not at all over 10 years, depending on the scenario. The reduction of these trade barriers was done progressively to take into account the transition periods for sensitive products such as rice and motor vehicles, as well as to account for the complexity in removing non-trade barriers (e.g. the liberalisation of previously protected sectors tends to be carried progressively). NTMs generally can be removed only partially, hence, assumptions on the degree of removal (‘actionability’) are required. The reduction of NTMs by 25% and 50% are thus quantitative proxies for the reduction of qualitative trade barriers such as licencing or regulations. These assumptions were developed after discussions and consultations with MITI and other stakeholders in April and June 2015. A 25~50% reduction in NTMs is considered to be relatively reasonable in view of the final provisions and concessions of the TPPA.
*Kawasaki, The Relative Significance of EPAs in Asia-Pacific*. RIETI Discussion Paper Series 14-E-009, January 2014 **Kee, Hiau Looi and Nicita, Alessandro and Olarreaga, Marcelo, Estimating Trade Restrictiveness Indices. Economic Journal, Vol. 119, No. 534, pp. 172-199, January 2009
PwC
December 2015
About the GDyn model
• The study uses a multi-region general equilibrium model developed by Ianchovichina and McDougall* and based on the GTAP model , called GDyn.
• It is an extension of the widely-used GTAP model that incorporates dynamic behaviour. The GDyn model incorporates most features of the GTAP model, including bilateral trade flows, a sophisticated consumer demand function and inter-sectoral factor mobility.
• In addition, GDyn tracks foreign ownership of capital and investment behaviour. This allows the inclusion of the impacts of endogenous capital accumulation and the movement of investment between countries in response to differing expected rates of return.
• The model in this study is built on the latest GTAP 9 database released in May 2015, which features 2004, 2007 and 2011 reference years as well as 140 regions for all 57 GTAP commodities.
Dynamics
• It is ‘dynamic’ in the sense that in static models, consumers and producers made ‘optimal’ decisions within a single period, with no thought given to the future.
• As the model is recursive, the model solves a sequence of static equilibria in which the end of period capital stock in one year is the beginning of period capital stock in the next year.
• The equilibrium is a set of prices that clear markets at every point in time.
Demand side
• The representative consumer allocates income between private consumption, public consumption and savings in a Cobb-Douglas function.
• Demand for private consumption follows the Constant Difference of Elasticities (“CDE”) function that implies a non-homothetic character of the private consumption bundle.
• Consumers are assumed to have a ‘love of variety’ that generates demand for both domestic and foreign produced products within a product category (the ‘Armington assumption’, which allows for bilateral trade).
Framework of analysis
286
Economic Impact of the Trans-Pacific Partnership Agreement •
Appendix 1 – About the model
*Ianchovichina and R. McDougall, Theoretical Structure of Dynamic GTAP. GTAP Technical Paper No. 17, 2000
PwC
December 2015
Production side
• Production makes use of five factors: labour (skilled and unskilled), natural resources, land and capital.
• The production side is described by Leontief technology with fixed production coefficients between primary and intermediate inputs.
• Primary factors are defined to be mobile across sectors, their degree of mobility being described by the Constant Elasticity of Transformation function.
• Constant returns to scale and perfect competition is assumed to hold.
• Labour is assumed to be mobile across sectors but not across countries. However, capital is mobile across both sectors and countries.
Investment
• The treatment of financial assets in the GDyn model captures endogenously the economy-wide effects of capital and wealth accumulation, and the income effects of foreign property ownership. It is a stylised approach, and is not a full finance-theoretic treatment of financial assets. The approach is meant to represent international capital mobility rather than represent the financial sector realistically.
• The approach focuses on equity as the financial asset and long-term convergence of rates of return towards a stable equilibrium.
• In the dynamic GTAP Model, perfect capital mobility occurs only in the very long run. Investment is determined by the gradual movement of rates of return to equality across regions.
• The model also incorporates errors in expectations about the actual rate of return. Regional capital is owned by both domestic households and by foreign households via a global trust. Savings and capital are determined endogenously through the global trust, which allocates investment across regions such that it equates the changes in the expected returns across countries.
• The saving of each regional household is then allocated either to domestic investment or to foreign investment. This allocation assumes that the shares of domestic and foreign investments are held constant, subject to the adding-up constraints required to ensure regional saving and investment constraints. This is consistent with empirical evidence that investors tend to invest first in their home economies and then abroad
Framework of analysis
287
Economic Impact of the Trans-Pacific Partnership Agreement •
Appendix 1 – About the model
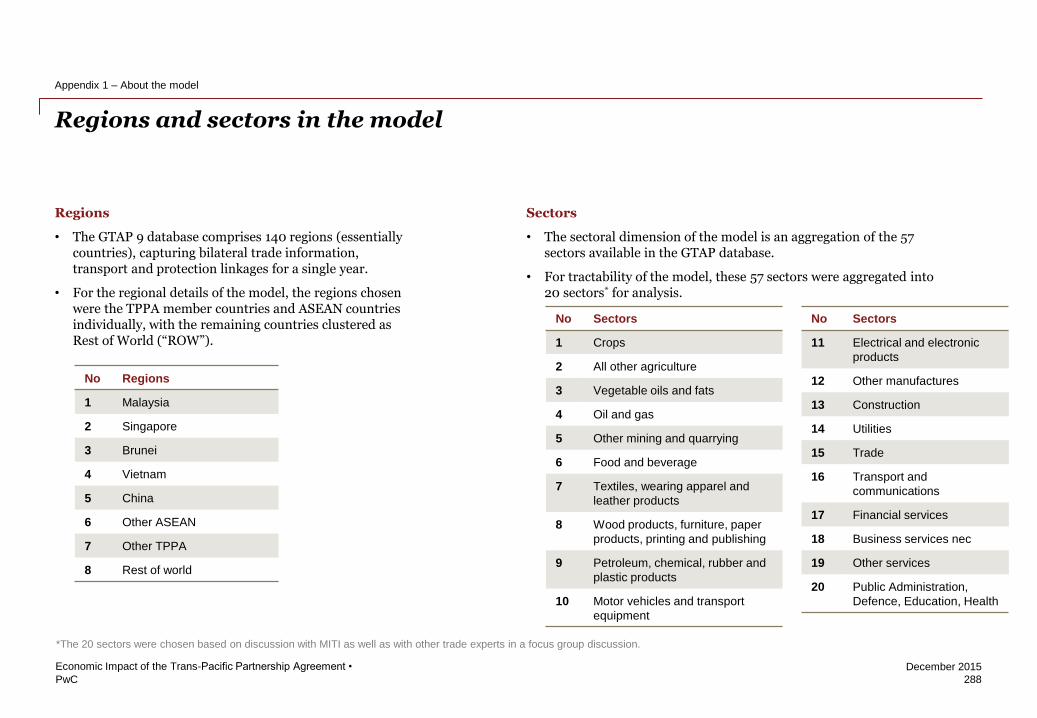
PwC
December 2015
Regions
• The GTAP 9 database comprises 140 regions (essentially countries), capturing bilateral trade information, transport and protection linkages for a single year.
• For the regional details of the model, the regions chosen were the TPPA member countries and ASEAN countries individually, with the remaining countries clustered as Rest of World (“ROW”).
Sectors
• The sectoral dimension of the model is an aggregation of the 57 sectors available in the GTAP database.
• For tractability of the model, these 57 sectors were aggregated into 20 sectors* for analysis.
Regions and sectors in the model
288
Economic Impact of the Trans-Pacific Partnership Agreement •
Appendix 1 – About the model
No Sectors
1 Crops
2 All other agriculture
3 Vegetable oils and fats
4 Oil and gas
5 Other mining and quarrying
6 Food and beverage
7 Textiles, wearing apparel and
leather products
8 Wood products, furniture, paper
products, printing and publishing
9 Petroleum, chemical, rubber and
plastic products
10 Motor vehicles and transport
equipment
No Sectors
11 Electrical and electronic
products
12 Other manufactures
13 Construction
14 Utilities
15 Trade
16 Transport and
communications
17 Financial services
18 Business services nec
19 Other services
20 Public Administration,
Defence, Education, Health
No Regions
1 Malaysia
2 Singapore
3 Brunei
4 Vietnam
5 China
6 Other ASEAN
7 Other TPPA
8 Rest of world
*The 20 sectors were chosen based on discussion with MITI as well as with other trade experts in a focus group discussion.
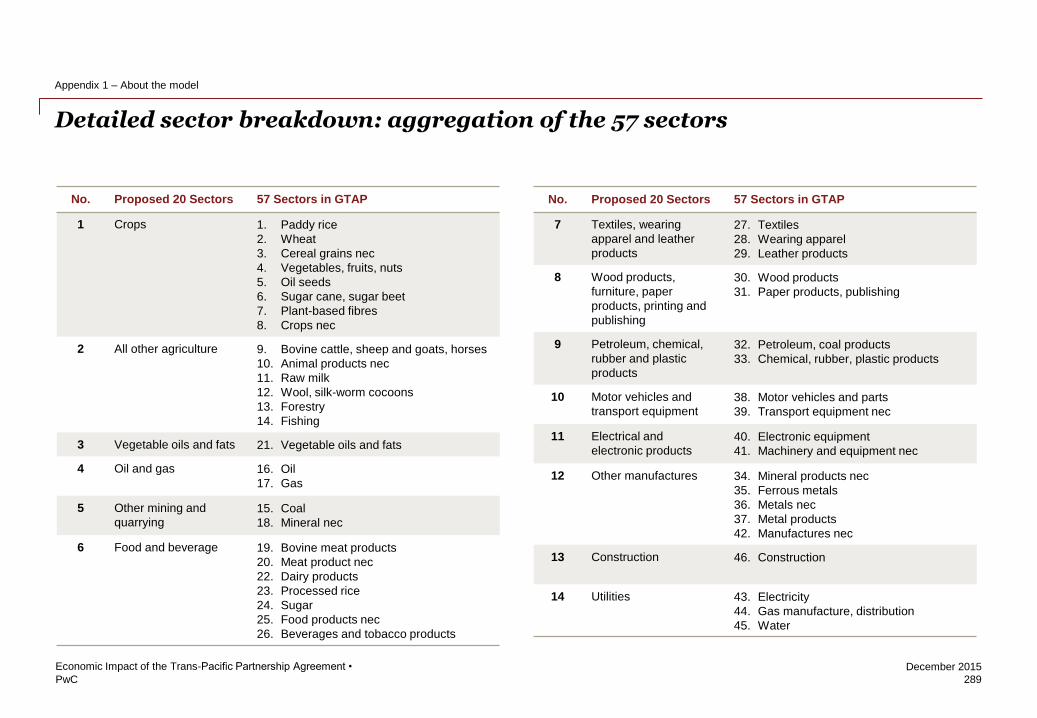
PwC
December 2015
Detailed sector breakdown: aggregation of the 57 sectors
289
Economic Impact of the Trans-Pacific Partnership Agreement •
Appendix 1 – About the model
No. Proposed 20 Sectors 57 Sectors in GTAP
1 Crops 1. Paddy rice
2. Wheat
3. Cereal grains nec
4. Vegetables, fruits, nuts
5. Oil seeds
6. Sugar cane, sugar beet
7. Plant-based fibres
8. Crops nec
2 All other agriculture 9. Bovine cattle, sheep and goats, horses
10. Animal products nec
11. Raw milk
12. Wool, silk-worm cocoons
13. Forestry
14. Fishing
3 Vegetable oils and fats 21. Vegetable oils and fats
4 Oil and gas 16. Oil
17. Gas
5 Other mining and
quarrying
15. Coal
18. Mineral nec
6 Food and beverage 19. Bovine meat products
20. Meat product nec
22. Dairy products
23. Processed rice
24. Sugar
25. Food products nec
26. Beverages and tobacco products
No. Proposed 20 Sectors 57 Sectors in GTAP
7 Textiles, wearing
apparel and leather
products
27. Textiles
28. Wearing apparel
29. Leather products
8 Wood products,
furniture, paper
products, printing and
publishing
30. Wood products
31. Paper products, publishing
9 Petroleum, chemical,
rubber and plastic
products
32. Petroleum, coal products
33. Chemical, rubber, plastic products
10 Motor vehicles and
transport equipment
38. Motor vehicles and parts
39. Transport equipment nec
11 Electrical and
electronic products
40. Electronic equipment
41. Machinery and equipment nec
12 Other manufactures 34. Mineral products nec
35. Ferrous metals
36. Metals nec
37. Metal products
42. Manufactures nec
13 Construction 46. Construction
14 Utilities 43. Electricity
44. Gas manufacture, distribution
45. Water
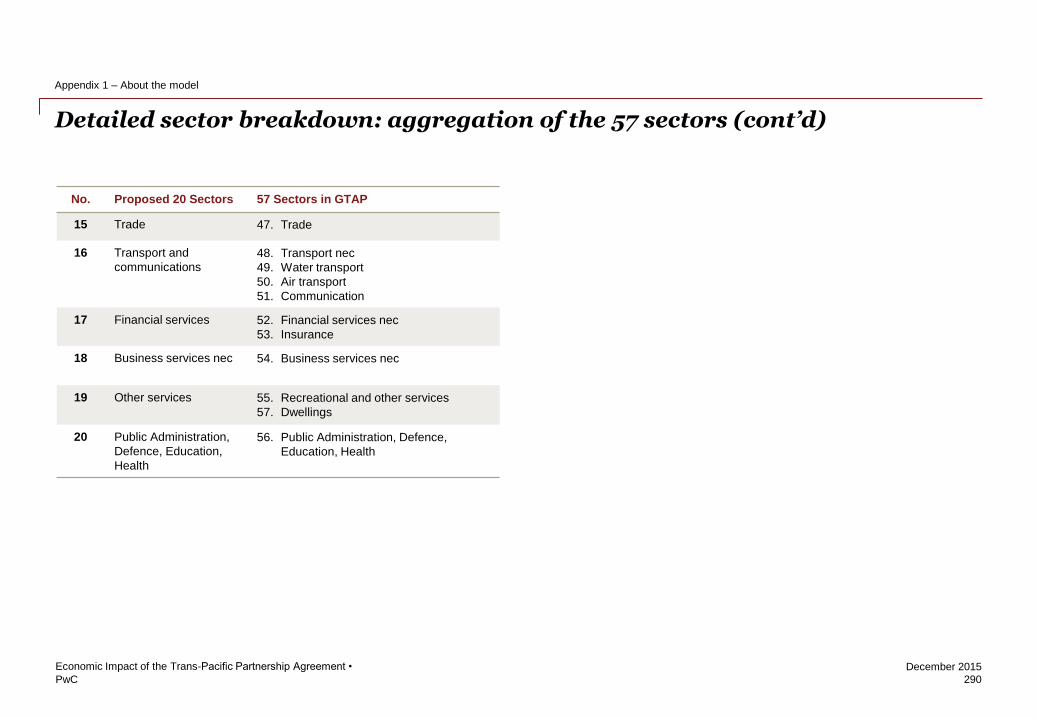
PwC
December 2015
Detailed sector breakdown: aggregation of the 57 sectors (cont’d)
290
Economic Impact of the Trans-Pacific Partnership Agreement •
Appendix 1 – About the model
No. Proposed 20 Sectors 57 Sectors in GTAP
15 Trade 47. Trade
16 Transport and
communications
48. Transport nec
49. Water transport
50. Air transport
51. Communication
17 Financial services 52. Financial services nec
53. Insurance
18 Business services nec 54. Business services nec
19 Other services 55. Recreational and other services
57. Dwellings
20 Public Administration,
Defence, Education,
Health
56. Public Administration, Defence,
Education, Health
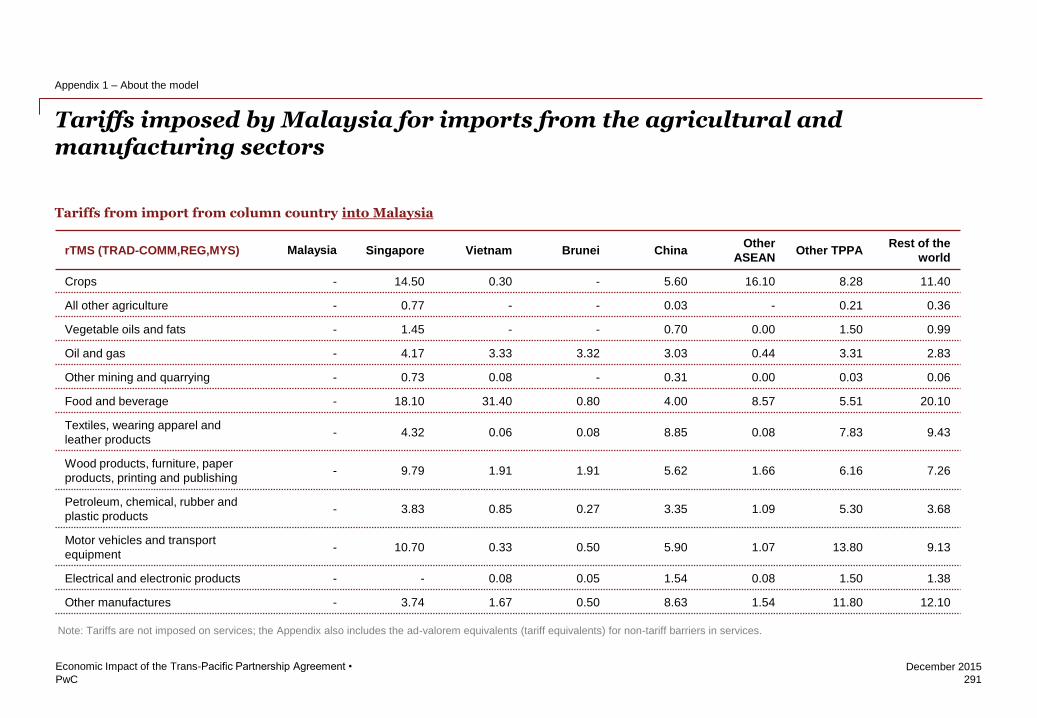
PwC
December 2015
Tariffs imposed by Malaysia for imports from the agricultural and manufacturing sectors
291
Economic Impact of the Trans-Pacific Partnership Agreement •
Appendix 1 – About the model
Tariffs from import from column country into Malaysia
rTMS (TRAD-COMM,REG,MYS) Malaysia Singapore Vietnam Brunei China Other
ASEAN Other TPPA
Rest of the
world
Crops - 14.50 0.30 - 5.60 16.10 8.28 11.40
All other agriculture - 0.77 - - 0.03 - 0.21 0.36
Vegetable oils and fats - 1.45 - - 0.70 0.00 1.50 0.99
Oil and gas - 4.17 3.33 3.32 3.03 0.44 3.31 2.83
Other mining and quarrying - 0.73 0.08 - 0.31 0.00 0.03 0.06
Food and beverage - 18.10 31.40 0.80 4.00 8.57 5.51 20.10
Textiles, wearing apparel and
leather products - 4.32 0.06 0.08 8.85 0.08 7.83 9.43
Wood products, furniture, paper
products, printing and publishing - 9.79 1.91 1.91 5.62 1.66 6.16 7.26
Petroleum, chemical, rubber and
plastic products - 3.83 0.85 0.27 3.35 1.09 5.30 3.68
Motor vehicles and transport
equipment - 10.70 0.33 0.50 5.90 1.07 13.80 9.13
Electrical and electronic products - - 0.08 0.05 1.54 0.08 1.50 1.38
Other manufactures - 3.74 1.67 0.50 8.63 1.54 11.80 12.10
Note: Tariffs are not imposed on services; the Appendix also includes the ad-valorem equivalents (tariff equivalents) for non-tariff barriers in services.
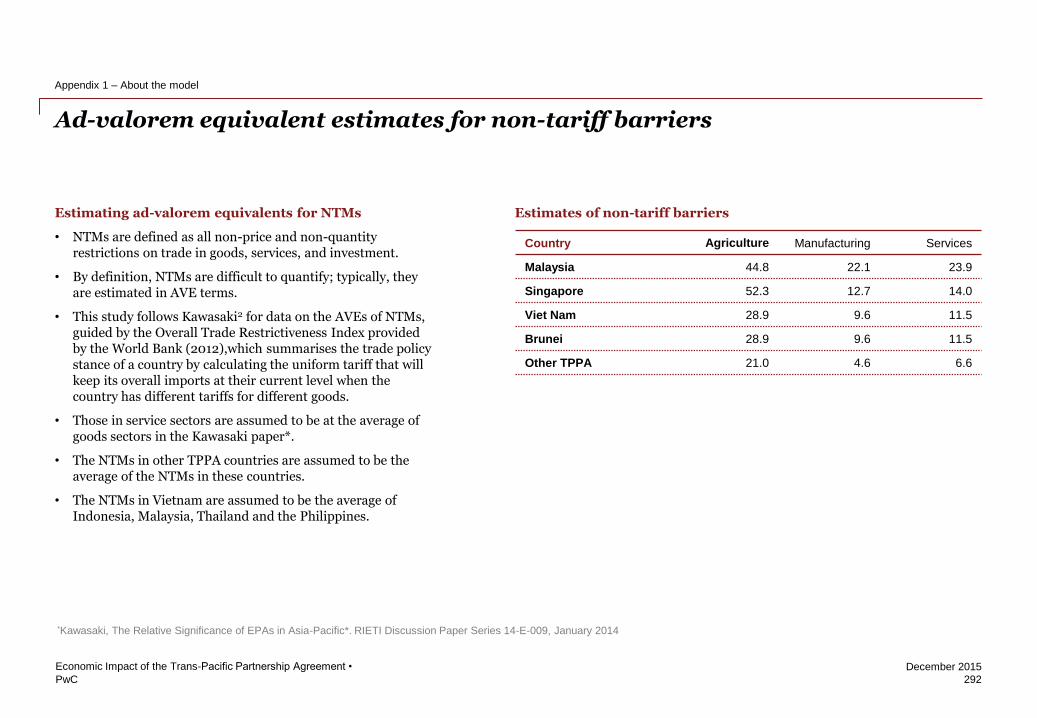
PwC
December 2015
Ad-valorem equivalent estimates for non-tariff barriers
292
Economic Impact of the Trans-Pacific Partnership Agreement •
Appendix 1 – About the model
Country Agriculture Manufacturing Services
Malaysia 44.8 22.1 23.9
Singapore 52.3 12.7 14.0
Viet Nam 28.9 9.6 11.5
Brunei 28.9 9.6 11.5
Other TPPA 21.0 4.6 6.6
Estimates of non-tariff barriers
Estimating ad-valorem equivalents for NTMs
• NTMs are defined as all non-price and non-quantity restrictions on trade in goods, services, and investment.
• By definition, NTMs are difficult to quantify; typically, they are estimated in AVE terms.
• This study follows Kawasaki2 for data on the AVEs of NTMs, guided by the Overall Trade Restrictiveness Index provided by the World Bank (2012),which summarises the trade policy stance of a country by calculating the uniform tariff that will keep its overall imports at their current level when the country has different tariffs for different goods.
• Those in service sectors are assumed to be at the average of goods sectors in the Kawasaki paper*.
• The NTMs in other TPPA countries are assumed to be the average of the NTMs in these countries.
• The NTMs in Vietnam are assumed to be the average of Indonesia, Malaysia, Thailand and the Philippines.
*Kawasaki, The Relative Significance of EPAs in Asia-Pacific*. RIETI Discussion Paper Series 14-E-009, January 2014
PwC
December 2015
Appendix 2 Detailed CGE results
293
Economic Impact of the Trans-Pacific Partnership Agreement •

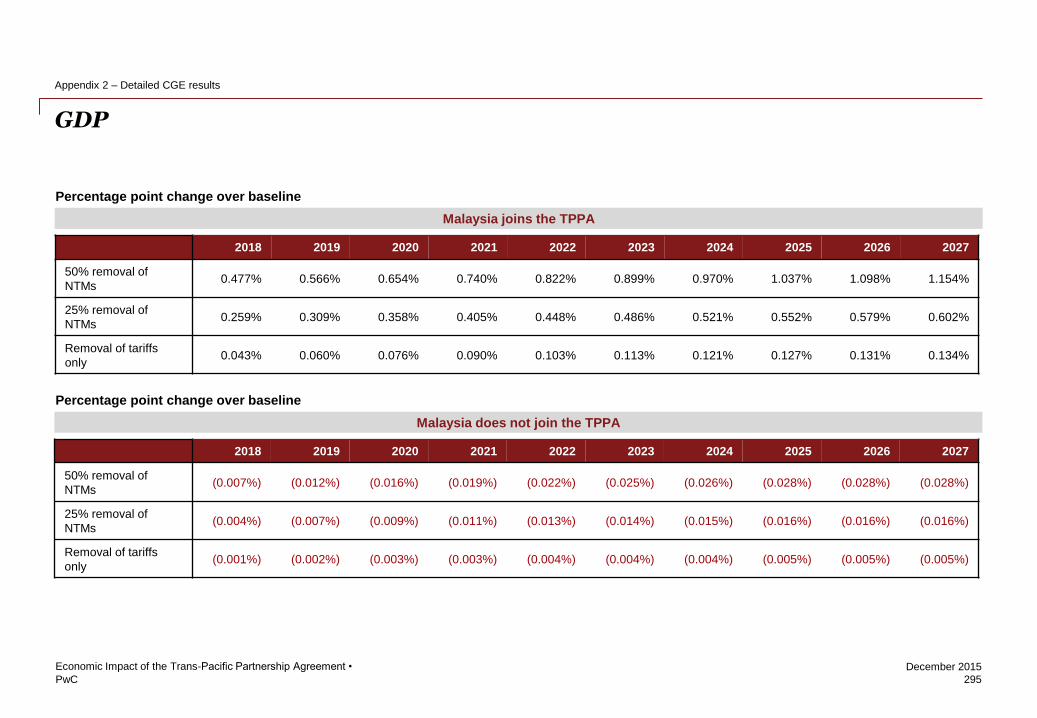
PwC
December 2015
GDP
295
Economic Impact of the Trans-Pacific Partnership Agreement •
Appendix 2 – Detailed CGE results
2018 2019 2020 2021 2022 2023 2024 2025 2026 2027
50% removal of
NTMs 0.477% 0.566% 0.654% 0.740% 0.822% 0.899% 0.970% 1.037% 1.098% 1.154%
25% removal of
NTMs 0.259% 0.309% 0.358% 0.405% 0.448% 0.486% 0.521% 0.552% 0.579% 0.602%
Removal of tariffs
only 0.043% 0.060% 0.076% 0.090% 0.103% 0.113% 0.121% 0.127% 0.131% 0.134%
Malaysia joins the TPPA
2018 2019 2020 2021 2022 2023 2024 2025 2026 2027
50% removal of
NTMs (0.007%) (0.012%) (0.016%) (0.019%) (0.022%) (0.025%) (0.026%) (0.028%) (0.028%) (0.028%)
25% removal of
NTMs (0.004%) (0.007%) (0.009%) (0.011%) (0.013%) (0.014%) (0.015%) (0.016%) (0.016%) (0.016%)
Removal of tariffs
only (0.001%) (0.002%) (0.003%) (0.003%) (0.004%) (0.004%) (0.004%) (0.005%) (0.005%) (0.005%)
Malaysia does not join the TPPA
Percentage point change over baseline
Percentage point change over baseline
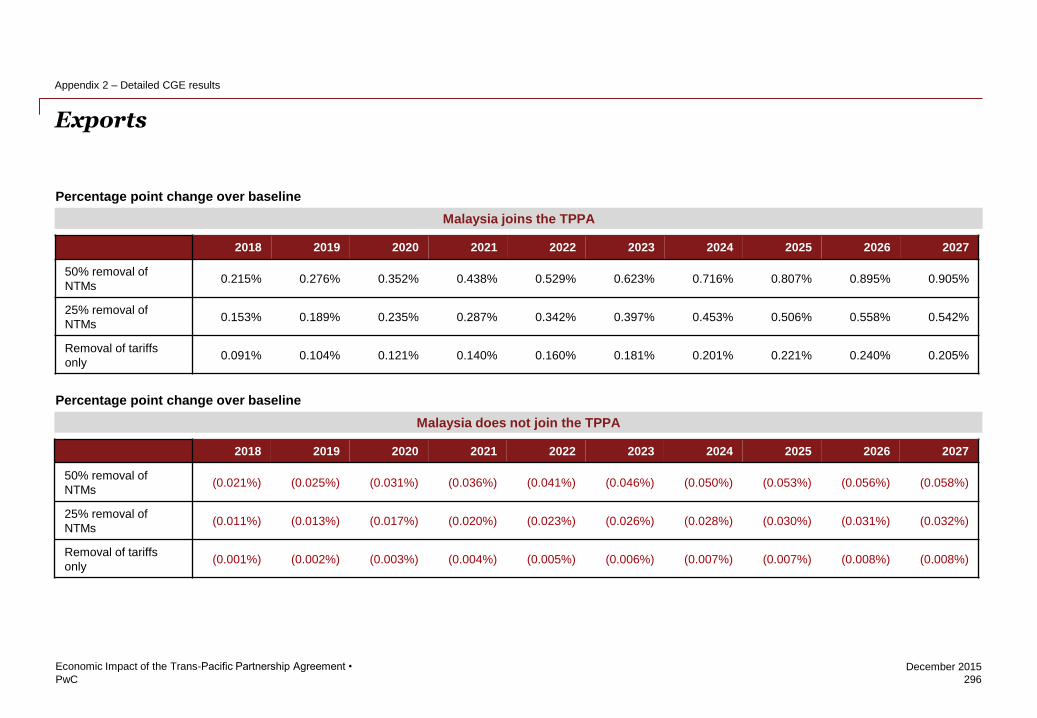
PwC
December 2015
Exports
296
Economic Impact of the Trans-Pacific Partnership Agreement •
Appendix 2 – Detailed CGE results
2018 2019 2020 2021 2022 2023 2024 2025 2026 2027
50% removal of
NTMs 0.215% 0.276% 0.352% 0.438% 0.529% 0.623% 0.716% 0.807% 0.895% 0.905%
25% removal of
NTMs 0.153% 0.189% 0.235% 0.287% 0.342% 0.397% 0.453% 0.506% 0.558% 0.542%
Removal of tariffs
only 0.091% 0.104% 0.121% 0.140% 0.160% 0.181% 0.201% 0.221% 0.240% 0.205%
Malaysia joins the TPPA
2018 2019 2020 2021 2022 2023 2024 2025 2026 2027
50% removal of
NTMs (0.021%) (0.025%) (0.031%) (0.036%) (0.041%) (0.046%) (0.050%) (0.053%) (0.056%) (0.058%)
25% removal of
NTMs (0.011%) (0.013%) (0.017%) (0.020%) (0.023%) (0.026%) (0.028%) (0.030%) (0.031%) (0.032%)
Removal of tariffs
only (0.001%) (0.002%) (0.003%) (0.004%) (0.005%) (0.006%) (0.007%) (0.007%) (0.008%) (0.008%)
Malaysia does not join the TPPA
Percentage point change over baseline
Percentage point change over baseline
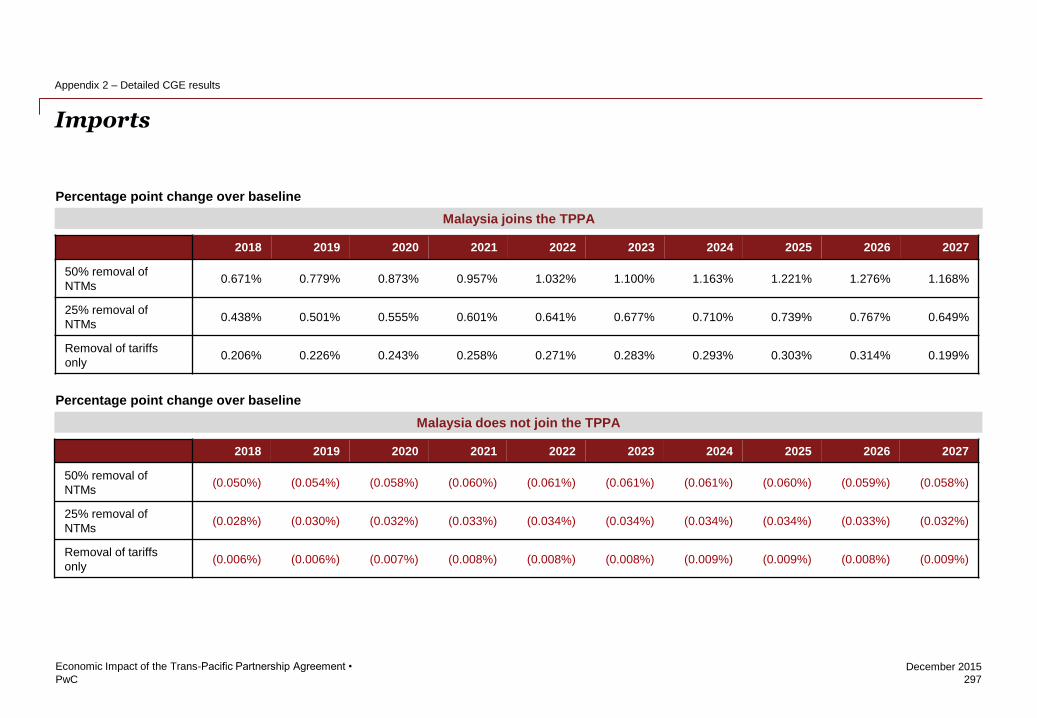
PwC
December 2015
Imports
297
Economic Impact of the Trans-Pacific Partnership Agreement •
Appendix 2 – Detailed CGE results
2018 2019 2020 2021 2022 2023 2024 2025 2026 2027
50% removal of
NTMs 0.671% 0.779% 0.873% 0.957% 1.032% 1.100% 1.163% 1.221% 1.276% 1.168%
25% removal of
NTMs 0.438% 0.501% 0.555% 0.601% 0.641% 0.677% 0.710% 0.739% 0.767% 0.649%
Removal of tariffs
only 0.206% 0.226% 0.243% 0.258% 0.271% 0.283% 0.293% 0.303% 0.314% 0.199%
Malaysia joins the TPPA
Malaysia does not join the TPPA
Percentage point change over baseline
Percentage point change over baseline
2018 2019 2020 2021 2022 2023 2024 2025 2026 2027
50% removal of
NTMs (0.050%) (0.054%) (0.058%) (0.060%) (0.061%) (0.061%) (0.061%) (0.060%) (0.059%) (0.058%)
25% removal of
NTMs (0.028%) (0.030%) (0.032%) (0.033%) (0.034%) (0.034%) (0.034%) (0.034%) (0.033%) (0.032%)
Removal of tariffs
only (0.006%) (0.006%) (0.007%) (0.008%) (0.008%) (0.008%) (0.009%) (0.009%) (0.008%) (0.009%)
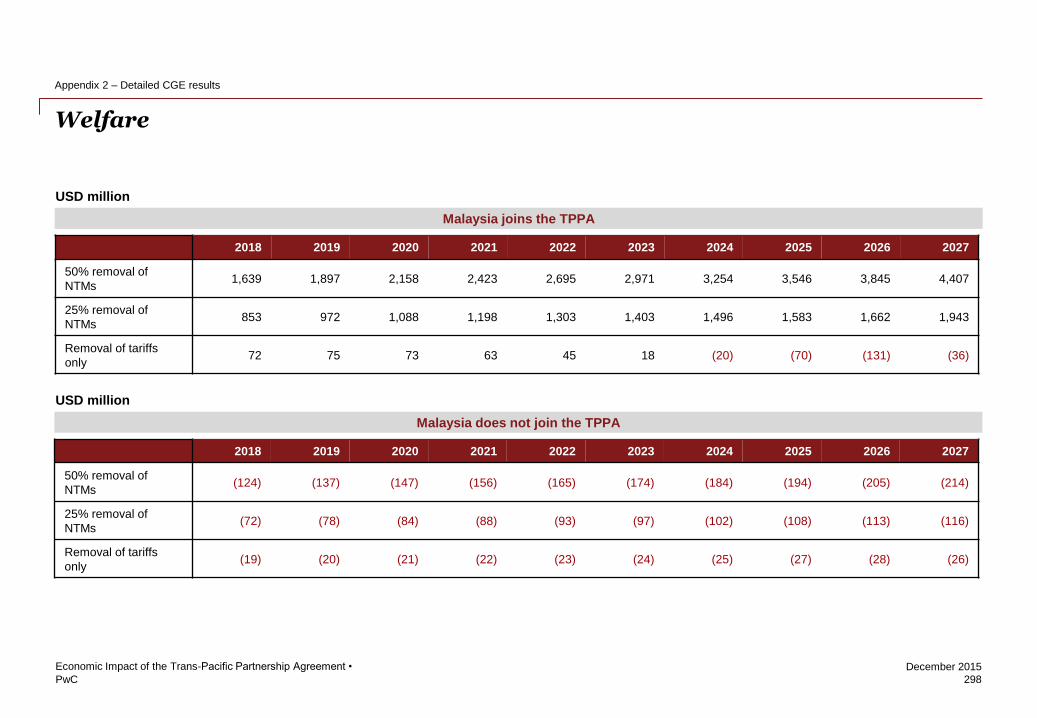
PwC
December 2015
Welfare
298
Economic Impact of the Trans-Pacific Partnership Agreement •
Appendix 2 – Detailed CGE results
2018 2019 2020 2021 2022 2023 2024 2025 2026 2027
50% removal of
NTMs 1,639 1,897 2,158 2,423 2,695 2,971 3,254 3,546 3,845 4,407
25% removal of
NTMs 853 972 1,088 1,198 1,303 1,403 1,496 1,583 1,662 1,943
Removal of tariffs
only 72 75 73 63 45 18 (20) (70) (131) (36)
Malaysia joins the TPPA
2018 2019 2020 2021 2022 2023 2024 2025 2026 2027
50% removal of
NTMs (124) (137) (147) (156) (165) (174) (184) (194) (205) (214)
25% removal of
NTMs (72) (78) (84) (88) (93) (97) (102) (108) (113) (116)
Removal of tariffs
only (19) (20) (21) (22) (23) (24) (25) (27) (28) (26)
Malaysia does not join the TPPA
USD million
USD million
PwC
December 2015
Appendix 3 Sectoral approach and methodology
299
Economic Impact of the Trans-Pacific Partnership Agreement •

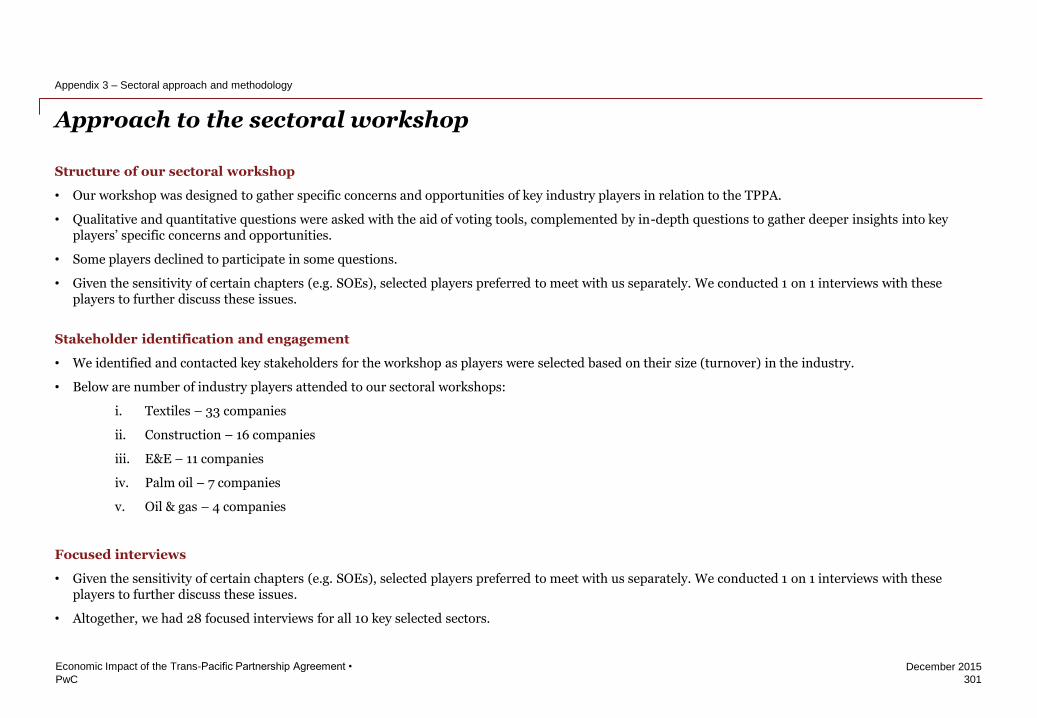
PwC
December 2015
Structure of our sectoral workshop
• Our workshop was designed to gather specific concerns and opportunities of key industry players in relation to the TPPA.
• Qualitative and quantitative questions were asked with the aid of voting tools, complemented by in-depth questions to gather deeper insights into key players’ specific concerns and opportunities.
• Some players declined to participate in some questions.
• Given the sensitivity of certain chapters (e.g. SOEs), selected players preferred to meet with us separately. We conducted 1 on 1 interviews with these players to further discuss these issues.
Stakeholder identification and engagement
• We identified and contacted key stakeholders for the workshop as players were selected based on their size (turnover) in the industry.
• Below are number of industry players attended to our sectoral workshops:
i. Textiles – 33 companies
ii. Construction – 16 companies
iii. E&E – 11 companies
iv. Palm oil – 7 companies
v. Oil & gas – 4 companies
Focused interviews
• Given the sensitivity of certain chapters (e.g. SOEs), selected players preferred to meet with us separately. We conducted 1 on 1 interviews with these players to further discuss these issues.
• Altogether, we had 28 focused interviews for all 10 key selected sectors.
Approach to the sectoral workshop
301
Economic Impact of the Trans-Pacific Partnership Agreement •
Appendix 3 – Sectoral approach and methodology


PwC
December 2015
Appendix 4 References/Bibliography
303
Economic Impact of the Trans-Pacific Partnership Agreement •

PwC
December 2015
References/Bibliography
305
Economic Impact of the Trans-Pacific Partnership Agreement •
Appendix 4 – References/Bibliography
• ABC News
• Amgen
• APO Productivity Database, 2014
• ASEAN Secretariat
• AT Kearney
• Attorney-General’s Department of the Australian Government
• Bloomberg
• Buku Anggaran Hasil Kerajaan Persekutuan, 2013
• Business Monitor International (BMI)
• Centre For Responsible Enterprise and Trade (CREATE)-PwC US
• CISCO
• DBS Vickers Securities
• Department of Statistic, Malaysia
o Malaysia's E&E Exports, 2014
o Composition of Malaysia's Exports, 2010 and 2014
o Economic contribution of the Malaysian textile and apparel industry
o Malaysia's total textile and apparel trading
o Malaysia’s Yarn and Fabrics Trading Markets in 2014
o Malaysia’s Garment Trading Markets in 2014
o Malaysia’s Imports Yarn And Fabrics And Garment In 2014
PwC
December 2015
References/Bibliography
306
Economic Impact of the Trans-Pacific Partnership Agreement •
Appendix 4 – References/Bibliography
• Department of Statistic, Malaysia
o Retail Trade Growth
o 2014 Sales value of own manufactured products
o Imports, exports and trade balance by subsector, 2014
o Trade balance of plastics and plastic products with TPPA countries, 2014
o Imports of primary and non-primary plastic
o GDP at current prices, 2005 – 2014
o Top 5 countries for exports, 2013
o Trade of wood and wood products with TPPA countries, 2014
o Malaysia’s trade with Mexico and Peru in 2014
o Economic Census 2011 – Manufacturing
o Automotive sector contribution to GDP
o Malaysia’s automotive sector export and import, 2008 – 2014
o Automotive imports from Japan, 2014
o Import duties imposed on Malaysia’s exports in automotive sector
o Pharmaceutical sector contribution to GDP, 2005 – 2014
o Malaysia’s pharmaceutical sector export and import, 2008 – 2014
o Malaysia’s trade balance on pharmaceutical products with TPPA countries, 2014
o Import duties imposed on Malaysia’s exports in pharmaceutical sector
o Trade balance of wood and wood products with TPPA countries, 2014
o Employment in main commodities, 2005 - 2013

PwC
December 2015
References/Bibliography
307
Economic Impact of the Trans-Pacific Partnership Agreement •
Appendix 4 – References/Bibliography
• Limitation of CGE Model, Distributional effects of WTO agricultural reforms in rich and poor countries, Economic Policy, April 2007.
• Economic Planning Unit (EPU)
• EICC
• Estimating Trade Restrictiveness Indices. Economic Journal, Vol. 119, No. 534, pp. 172-199, January 2009
• Euromonitor
• EXIM Bank Industry Assessment - Plywood Industry (2014)
• Gartner
• GLCT Programme Graduation Report Card 2015
• Gulf Petrochemicals & Chemicals Association (GPCA) Annual Report 2014
• IBM Centre
• ILO LABORSTA
• Impact of Foreign Labour on Industry
• Industrievereinigung Chemiefaser e.V.
• Intel Corporation
• International Centre for Settlement of Investment Disputes
• International Institute for Sustainable Development
• International Labour Organisation (ILO)
• InvestPenang
• ITUC Global Rights Index 2015
• Japan Society of Pharmaceutical Machinery and Engineering
PwC
December 2015
References/Bibliography
308
Economic Impact of the Trans-Pacific Partnership Agreement •
Appendix 4 – References/Bibliography
• Khazanah Nasional Berhad (KNB)
• Malaysia Automotive Association (MAA)
• Malaysia Investment Development Authority (MIDA)
• Malaysia Plastic Manufacturing Association (MPMA)
• Malaysia Productivity Corporation (MPC)
• Malaysian Biotech Corporation
• Malaysian International Furniture Fair (MIFF) 2015
• Malaysian Timber Industry Board (MTIB)
• Malaysian Wood Industries Association (MWIA)
• MarketWatch
• McKinsey & Company
• Ministry of Domestic Trade, Co-operatives and Consumerism (MDTCC)
• Malaysian Employer's Federation (MEF)
• Ministry of Finance (MOF)
• Ministry of Human Resources Malaysia (MOHR)
• Ministry of International Trade and Industry (MITI)
• Ministry of Health (MOH)
• Malaysia Productivity Corporation (MPC)
• Ministry of Plantation Industries and Commodities (MPIC)
• Malaysia Plastic Manufacturing Association (MPMA)
• National Automotive Policy, 2014
• National Pharmaceutical Control Bureau (NPCB)
• National Timber Industry Policy (NATIP)
• Nielsen
PwC
December 2015
References/Bibliography
309
Economic Impact of the Trans-Pacific Partnership Agreement •
Appendix 4 – References/Bibliography
• Office of the United States Trade Representative
• Organisation for Economic Co-operation and Development (OECD)
• Oxford Economics
• PCI Fibers
• Petroliam Nasional Berhad (PETRONAS)
• Performance Management and Delivery Unit (PEMANDU)
• Plastemart, 2015
• PlasticEurope
• Plastics – the Facts 2014/2015 (PlasticsEurope)
• Practical Guidelines for Employers on the Recruitment, Placement, Employment and Repatriation of Foreign Workers in Malaysia (2014)
• PwC 6th Annual Digital IQ 2014 Survey
• RAND Corporation
• Tenaga Nasional Berhad
• The Relative Significance of EPAs in Asia-Pacific*. RIETI Discussion Paper Series 14-E-009, January 2014
• Theoretical Structure of Dynamic GTAP. GTAP Technical Paper No. 17, 2000
• Trend of Timber Products Export in Malaysia – Harun et. al. (2014)
• Uniform Law Commission
• United Nations
• United Nations Conference on Trade and Development (UNCTAD)
PwC
December 2015
References/Bibliography
310
Economic Impact of the Trans-Pacific Partnership Agreement •
Appendix 4 – References/Bibliography
• United Nations Industrial Development Organisation
• US Chamber of Commerce
• US General Services Administration
• US White House
• United States Agency of International Development (USAID)
• Vietnam National Textile and Garment Group
• Vietnam Trade Promotion Agency
• World Bank (WB)
• World Trade Organisation (WTO)


www.pwc.com/my