study of natural and synthetic polymer systems by advanced ... · nanocelulose cristalina foi...
TRANSCRIPT
ARENBERG DOCTORAL SCHOOL
FACULTY OF SCIENCE
Study of natural and synthetic polymer
systems by advanced microscopy
techniques
Tiago Andrade Chimenez
Thesis presented in partial
fulfilment of the requirements for the
degree of PhD in Science
2016
Supervisors:
Prof. Marcelo H. Gehlen
Prof. Johan Hofkens
Tiago Andrade Chimenez
Estudos de sistemas poliméricos naturais e sintéticos utilizando técnicas
avançadas de microscopia
Tese apresentada ao Instituto de Química de São Carlos da
Universidade de São Paulo e à Faculdade de Ciências da
Katholieke Universiteit Leuven como parte dos requisitos para a
obtenção do título de doutor em ciências
Área de concentração: Físico-Química
Orientadores: Prof. Dr. Marcelo Henrique Gehlen e Prof. Dr.
Johan Hofkens
São Carlos
2016

“Over a long period of time, the main force in favor of greater equality has been the diffusion
of knowledge and skills.” Thomas Piketty
i
ACKNOWLEDGMENTS
I would like to use this space to express my gratitude to some people. First of all, I would
like to thank my promoters, Prof. Marcelo H. Gehlen and Prof. Johan Hofkens. Thanks to
them, I had the opportunity to perform my research in laboratories equipped with state-of-
the art microscopes. I would also like to thank Prof. Frans De Schryver and Prof. Hiroshi
Uji-I for accepting to be my assessors at KU Leuven.
My thanks to the CAPES and CNPq for the scholarship granted during my Ph.D.
I would also like to thank Prof. Antonio Aprigio da Silva Curvelo for have given the
sugarcane bagasse samples used in some studies and for all support and discussion about
topics related to sugarcane bagasse.
I would like to thank Magda and Karel for all support they gave me when I started to work
with polymerization of styrene in KU Leuven. I would also like to thank Daniel Jänsch
from Max Planck Institute for providing the NMP initiator samples.
I have a lot to thank to Leen Cuypers and Alexandre Mazzola, who helped in the
establishment of the dual joint doctorate by USP and KU Leuven. Many thanks to Diego
Lencione for all support related to the optical instrumentation.
I would also like to give my gratitude to those who have been working around the lab
during the last years. I would like to mention some people that in some way have
contributed to my PhD: Irlon, Isac, Vagner, Carlão, Adriel, Mafrinha, Camilo, Ronaldo,
Carol, Anderson, Aline, Rafael, Renato, Paulo, Papako, Edson, Patricia, Stoyan, Kris,
Eduardo, Ann Petré, Carine, Marino, Karolien, Wouter B, Elke, Bart, Stijn, Wouter S.
I would also like to take this opportunity to express my gratitude to my whole family.
Special thanks to my mother Cida, my sister Talita, and my cousin Bruno. Without their
support, I would never get up here.
The last but not least acknowledgement is going to Milena. The person who has been at my
side since my first day in the lab. Thank you so much for everything, I have no words to
describe how important you are in my life.
ii
PREFACE
This PhD thesis was initiated in the first half of 2011 in the Laboratory of Molecular
Fluorescence (LFM/IQSC), under supervision of Prof. Marcelo H. Gehlen. The two first
chapters are related to the study of sugarcane bagasse by autofluorescence confocal
microscopy and to the optical microscopy characterization of nanocrystalline cellulose.
From July 2013 to July 2014, a sandwich doctorate was performed in the Laboratory for
Photochemistry and Spectroscopy from KU Leuven/Belgium, under supervision of Prof.
Johan Hofkens. During this period, a study related to the nitroxide-based polymerization
of styrene was performed, in which single-molecule spectroscopy and microscopy such
as FCS and WFM were used. This stage of the research is described in Chapter 4.
On the way back to LFM, in Brazil, a FCS setup was implemented and a study of
diffusion properties of nanocrystalline cellulose fluorescently labelled was performed,
which is described in Chapter 3.
Therefore, this thesis is divided in four chapters. Each chapter contains, respectively,
abstract, introduction, experimental part, results and discussion and, conclusion.
iii
ABSTRACT
In the first chapter, he spatial distribution of fluorescent compounds in the sugarcane
bagasse matrix is investigated by confocal fluorescence microscopy and spectroscopy
with one and two-photon excitation. Autofluorescence images, emission spectra and
fluorescence lifetime measurements provided a tool for the characterization of natural
bagasse samples. Moreover, the technique allows the following of processes related to
the lignin removal.
Nanocrystalline cellulose (NCC) is a rod-shape nanofibre with 1–100 nm in diameter,
and tens to hundreds of nanometres in length. In Chapter 2, NCC was obtained via
sulphuric acid hydrolysis from Avicel®. Afterwards, the material was characterized by
classic electronic microscopy SEM and TEM, confirming the rod-shaped morphology
and the nano-sized structure. Conventional wide field microscopy was used as
fluorescence microscopy tool in the characterization of NCC, when dispersed in
polymeric solutions of PVA and PVP. The last part of Chapter 2 describes the
characterization of NCC structures by using the super-resolution fluorescence
microscopy STED (Stimulated Emission Depletion). The STED images showed a
resolution down to 50 nm, allowing the comparison with TEM and AFM microscopy
results.
In Chapter 3, the NCC was covalently labelled, by a click-chemistry reaction, with the
ATTO-532 dye. Properties related to diffusion coefficient of NCC were determined by
Fluorescence Correlation Spectroscopy (FCS). The diffusion of NCC dispersed in
solution of PEG, containing different amounts polymer, was also studied by FCS and
WFM methods. The use of spectroscopy and microscopy imaging techniques revealed
iv
heterogeneity details of NCC dispersions, which are related to the hydrophilic and
hydrophobic properties of the polymer solution.
In Chapter 4, it is presented a study of controlled radical polymerization by fluorescence
correlation spectroscopy (FCS) and wide-field fluorescence microscopy (WFM). These
techniques were used to determine the diffusion coefficients of growing polymer chains,
during the controlled radical polymerization process. Linear and star-shaped polystyrene
were grown via nitroxide-mediated polymerization (NMP) from alkoxyamine-based
initiators containing a highly fluorescent perylene diimide moiety. We demonstrate that
direct investigation of heterogeneity emerging during a controlled radical
polymerization process by means of fluorescence of single-molecule chain initiator
allows to obtain unravelling information related to the diffusion processes of the
growing polymer chain.
v
RESUMO
O bagaço de cana-de-açúcar é um abundante coproduto obtido a partir da produção
convencional de etanol. No entanto, o bagaço vem se mostrando como uma importante
fonte para a produção de etanol de segunda geração. No primeiro capítulo da tese é
apresentado um estudo referente à distribuição espacial dos compostos na matriz de
bagaço de cana-de-açúcar. A investigação foi realizada utilizando microscopia de
fluorescência confocal e espectroscopia por excitação com um e dois fótons. Imagens de
autofluorescência em combinação com as medidas de fluorescência e tempos de vida
forneceram uma gama de informações necessárias para a caracterização de amostras de
bagaço. Além disso, a técnica permite o acompanhamento de processos relacionados
com a remoção de lignina.
A nanocelulose cristalina (NCC) é um material promissor devido as suas propriedades
intrínsecas, tais como seu formato alongado, medindo de 1 a 100 nm de diâmetro e seu
comprimento variando de algumas dezenas a centenas de nanômetros. No capítulo 2, a
nanocelulose cristalina foi obtida através da hidrólise da celulose cristalina (de
Avicel®) com ácido sulfúrico. Em seguida, o material foi caracterizado por técnicas de
microscopia SEM e TEM, confirmando a morfologia em forma de haste e a estrutura de
tamanho nanométrico. A microscopia de campo largo convencional foi utilizada como
ferramenta na caracterização da NCC dispersa em soluções poliméricas de PVA e PVP.
A última parte do capítulo 2 descreve a caracterização de estruturas de NCC usando a
microscopia de super-resolução de fluorescência STED (depleção de emissão
estimulada). As imagens mostraram uma resolução de até 50 nm, permitindo a
comparação com resultados de TEM e AFM.
vi
No capítulo 3, a nanocelulose cristalina foi covalentemente marcada com o corante
ATTO-532, através da chamada reação “click”. As propriedades relacionadas com o
coeficiente de difusão da NCC foram determinadas por espectroscopia de correlação de
fluorescência (FCS). Em uma etapa posterior, a NCC foi colocada em diferentes
soluções do polímero PEG, contendo quantidades diferentes. As propriedades dinâmicas
foram analisadas por métodos de FCS e WFM. O uso de técnicas de espectroscopia e
microscopia revelou detalhes relacionados à heterogeneidade das dispersões de NCC, as
quais estão relacionadas com as propriedades hidrofílicas e hidrofóbicas das soluções
poliméricas.
vii
LIST OF ABBREVIATIONS
AAc – Acid ascorbic
AFM - Atomic force microscopy
APD - Avalanche photodiode detector
ATRP - Atom transfer radical polymerization
BF - Bleached fibre
BP - Bleached pith
BS - Beam splitter
BWB - Bleached whole bagasse
CAA - Camera assembly attached
CAQUI - Central Analítica de Química
CCD - Charge coupled device
CRP - Controlled radical polymerization
CU - Control unit
CW - Continuous wave
DCTP - Degenerative chain transfer polymerization
DF - Dichroic filter
DMSO - Dimethyl sulfoxide
EDTA - Ethylenediamine tetraacetic acid
EM-CCD - Electron-multiplying charge coupled device
EXP – Beam expander
FCS - Fluorescence correlation spectroscopy
FLIM - Fluorescence lifetime microscopy
viii
GC-MS - Gas chromatography mass spectrometry
GPC - Gel permeation chromatography
HMF - Hydroxymethylfurfural
CI - Crystallinity index
IQSC - Instituto de Química de São Carlos
IR - Infrared
IR - Iris
KULeuven - Katholieke Universiteit Leuven
L - Lens
LPF - Low-pass filter
M - Mirror
MM - Mobile mirror
MSD - Mean square displacement
MW - Molecular weight
NA - Numeric aperture
NADH - Nicotinamide adenine dinucleotide - hydrogen
NCC - Nanocrystalline cellulose
NF - Notch filter
NLC - Non-linear crystal
NMP - Nitroxide-mediated polymerization
NMR - Nuclear magnetic resonance
OB - Objective
OF - Optical fibre
OMRP - Organometallic-mediated radical polymerization
ix
P - Prism
PA - Piezoelectric
PBS - Prism beam splitter
PDI - Polydispersity index
PDI* - Perylene diimide
PEG - Polyethylene glycol
PFD - Pre-focus system
PH - Pinhole
PP - Pulse picker
PRE - Persistent Radical Effect
PVA - Polyvinyl Alcohol
PVP - Polyvinylpyrrolidone
S - Sample
SD - Silicon detector
SEM - Scanning electron microscopy
SPT - Single-particle tracking
STED - Stimulated emission depletion
STEM - Scanning transmission electron microscopy
TEM - Transmission electron microscopy
THF - Tetrahydrofuran
TIRF - Total internal reflection fluorescence
TTL - Transistor-transistor logic
USP - Universidade de São Paulo
UV–Vis - Ultraviolet–visible spectroscopy

x
WP - Wave plate
WFM - Wide field microscopy
XRD - X-ray diffraction
xi
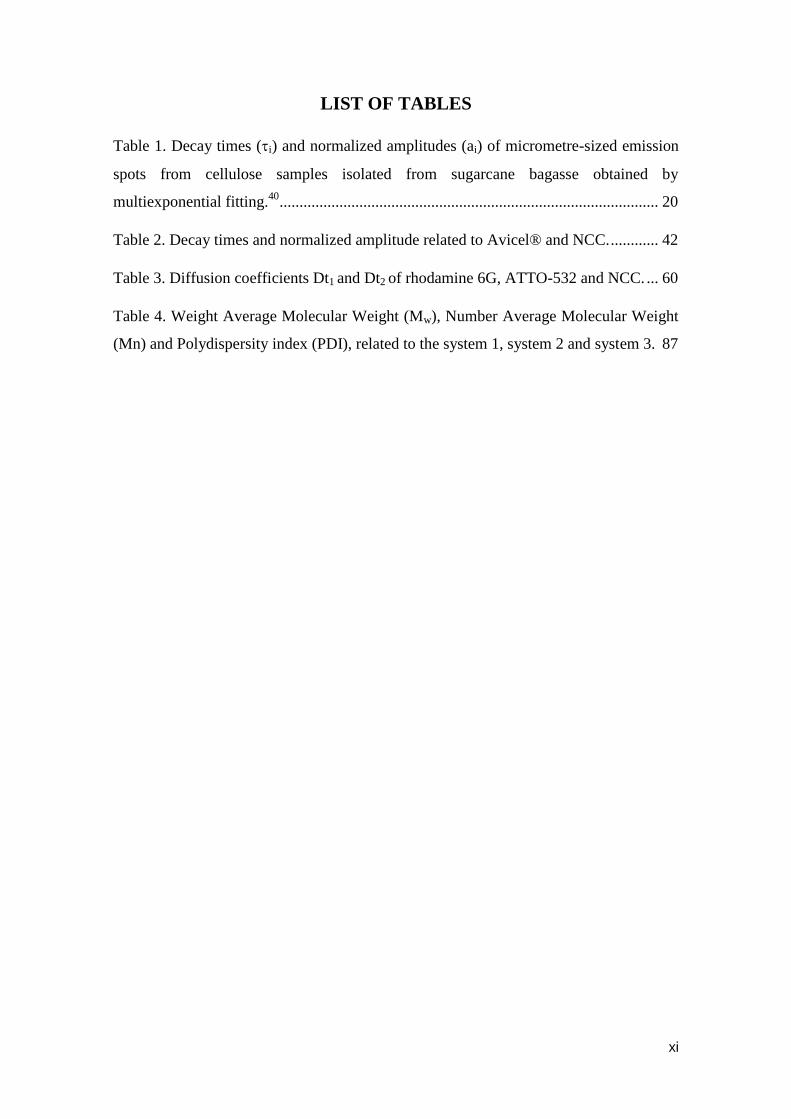
LIST OF TABLES
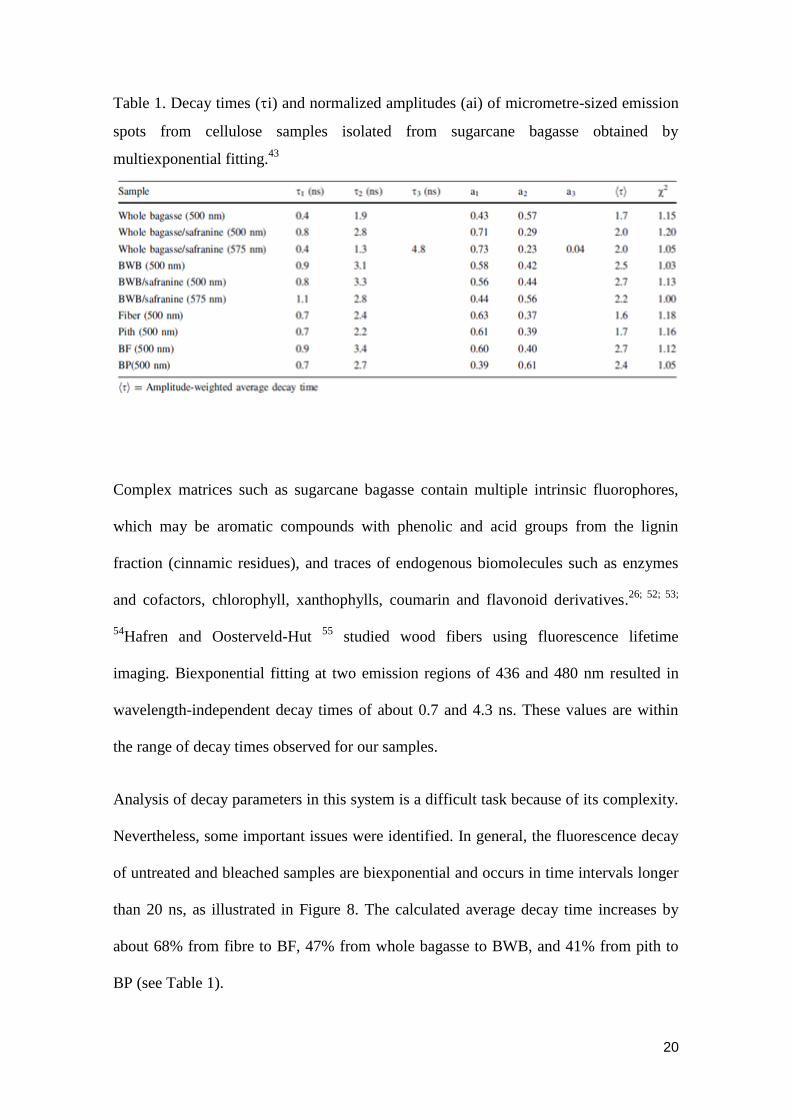
Table 1. Decay times (i) and normalized amplitudes (ai) of micrometre-sized emission
spots from cellulose samples isolated from sugarcane bagasse obtained by
multiexponential fitting.40
............................................................................................... 20
Table 2. Decay times and normalized amplitude related to Avicel® and NCC. ............ 42
Table 3. Diffusion coefficients Dt1 and Dt2 of rhodamine 6G, ATTO-532 and NCC. ... 60
Table 4. Weight Average Molecular Weight (Mw), Number Average Molecular Weight
(Mn) and Polydispersity index (PDI), related to the system 1, system 2 and system 3. 87
xii
LIST OF FIGURES
Figure 1. Molecular structure of cellulose.7 ..................................................................... 3
Figure 2. Structural composition of lignocellulosic biomass based on sugarcane.
Adapted from.10
................................................................................................................ 4
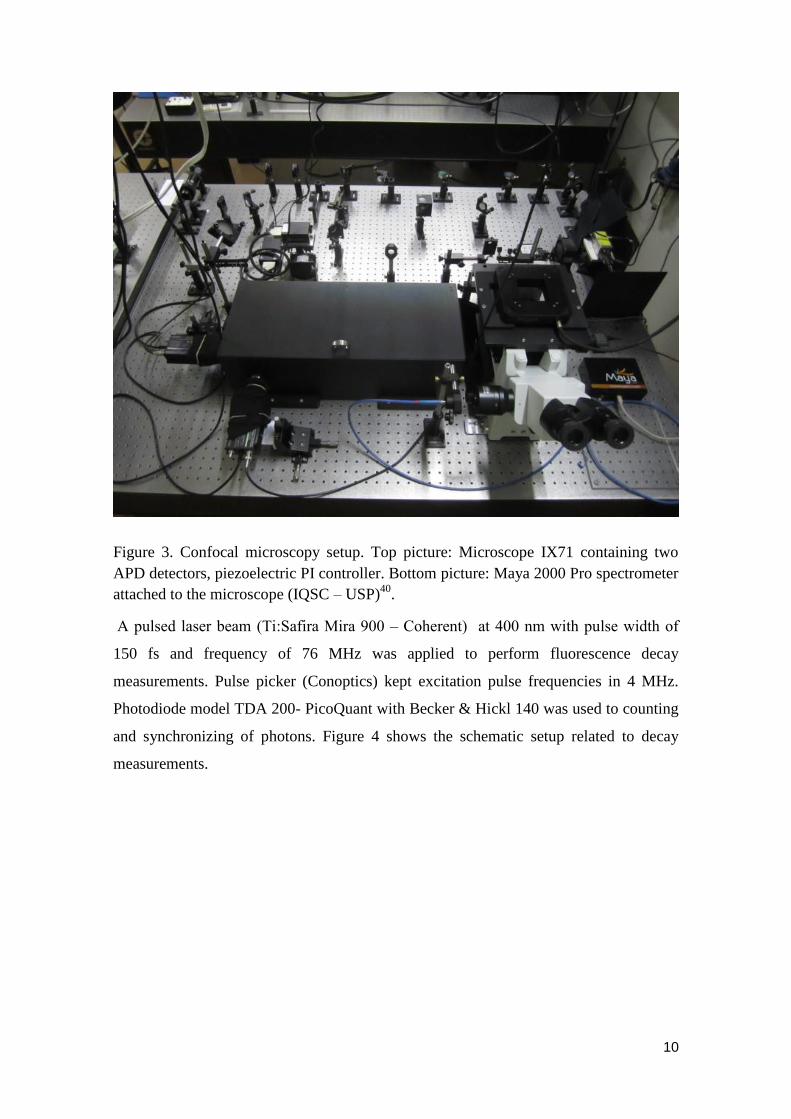
Figure 3. Confocal microscopy setup. Top picture: Microscope IX71 containing two
APD detectors, piezoelectric PI controller. Bottom picture: Maya 2000 Pro spectrometer
attached to the microscope (IQSC – USP)40
. .................................................................. 10
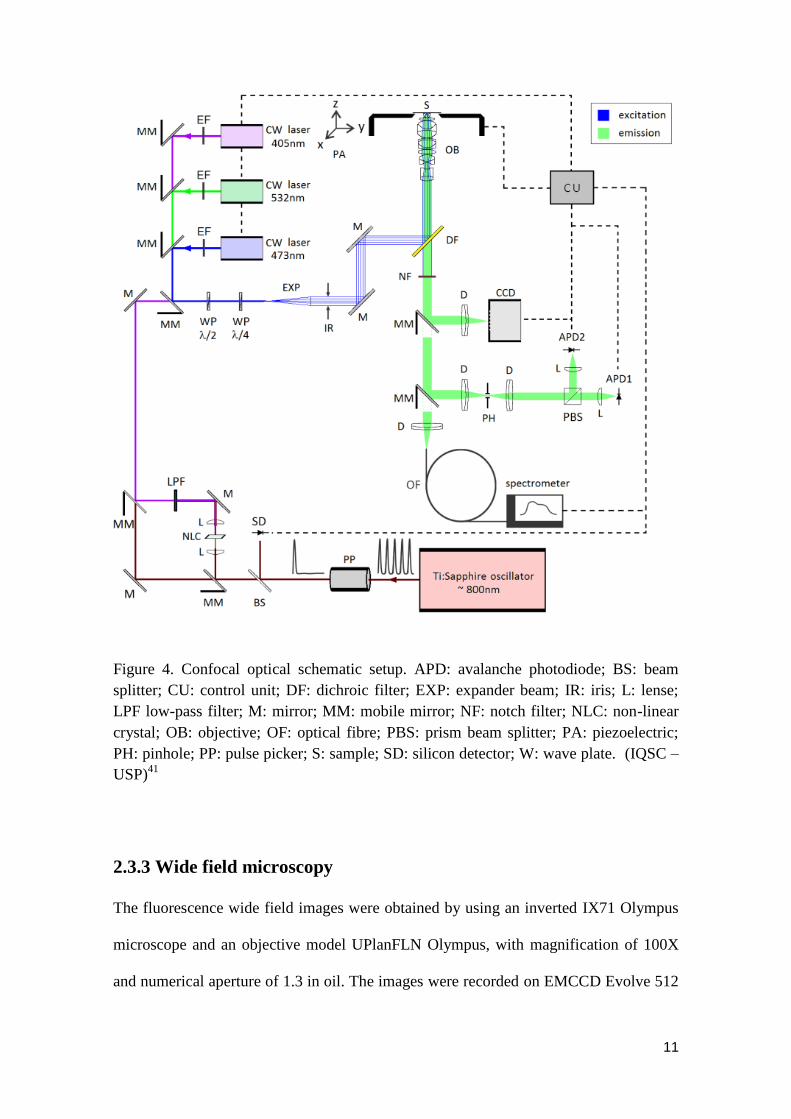
Figure 4. Confocal optical schematic setup. APD: avalanche photodiode; BS: beam
splitter; CU: control unit; DF: dichroic filter; EXP: expander beam; IR: iris; L: lense;
LPF low-pass filter; M: mirror; MM: mobile mirror; NF: notch filter; NLC: non-linear
crystal; OB: objective; OF: optical fibre; PBS: prism beam splitter; PA: piezoelectric;
PH: pinhole; PP: pulse picker; S: sample; SD: silicon detector; W: wave plate. (IQSC –
USP)41
............................................................................................................................. 11
Figure 5. Wide field optical schematic. CAA: camera assembly attached; CU: control
unit; DF: dichroic filter; EXP: expander beam; IR: iris; M: mirror; MM: mobile mirror;
NF: notch filter; OB: objective; P: prism; PFD: pre-focus system; S: sample; W: wave
plate (IQSC – USP )41
. .................................................................................................... 12
Figure 6. SEM images of bagasse samples: a whole bagasse, b fibre, c pith, d BWB, e
BF and f BP. Micro sized splinters are indicated by arrows in samples after bleaching
process.43
........................................................................................................................ 14
Figure 7. Fluorescence microscopy images of a whole bagasse, b fiber, c pith, d BWB, e
BF and f BP. Samples were excited at 405 nm. The lateral colour scale bars are related
to the fluorescence intensity.43
........................................................................................ 15
Figure 8. Fluorescence intensity image and decay traces of indicated emission spots
obtained by two-photon excitation at 800 nm of a) whole bagasse, b) fibre, c) pith, and
corresponding bleached samples, d) BWB, e) BF and f) BP. Scale bar 10 nm.43
.......... 17
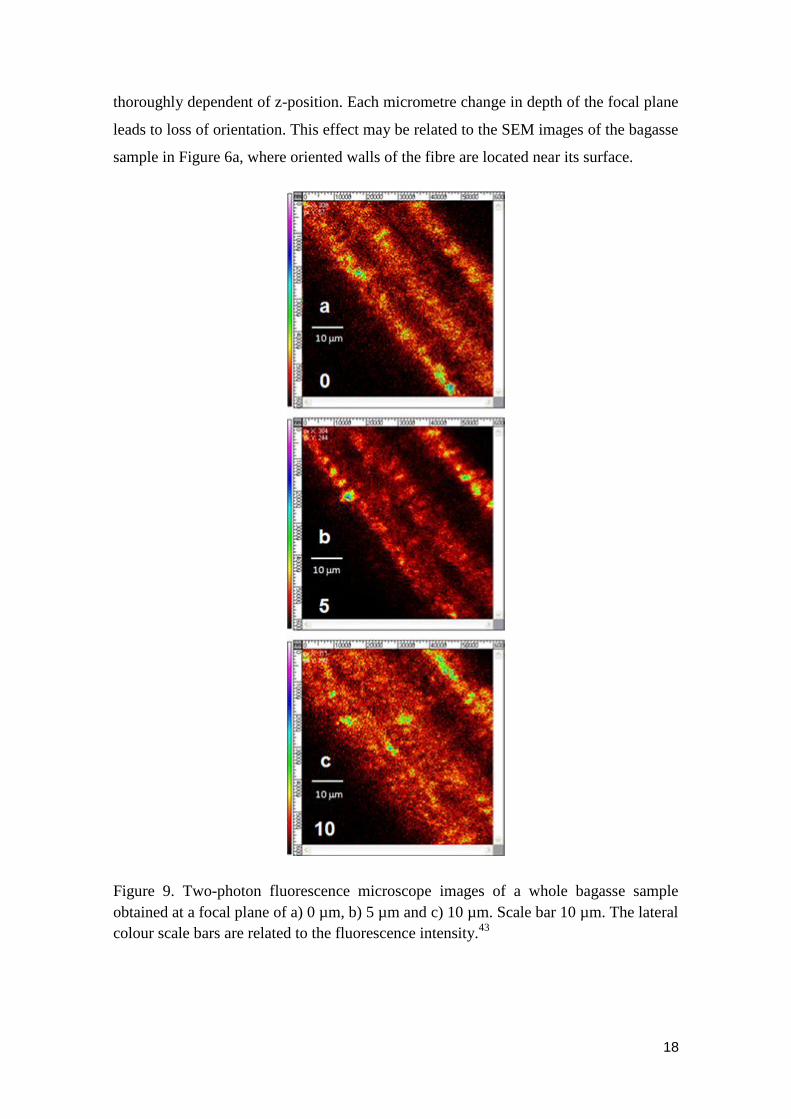
Figure 9. Two-photon fluorescence microscope images of a whole bagasse sample
obtained at a focal plane of a) 0 µm, b) 5 µm and c) 10 µm. Scale bar 10 µm. The lateral
colour scale bars are related to the fluorescence intensity.43
.......................................... 18
xiii
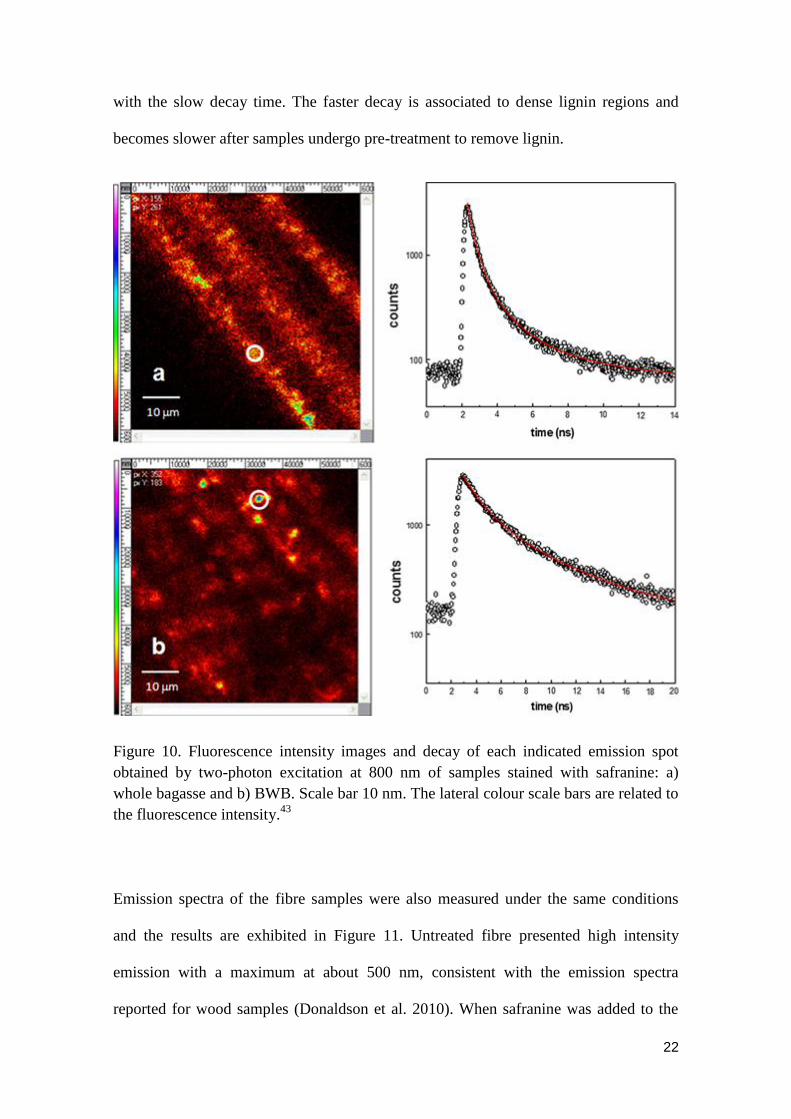
Figure 10. Fluorescence intensity images and decay of each indicated emission spot
obtained by two-photon excitation at 800 nm of samples stained with safranine: a)
whole bagasse and b) BWB. Scale bar 10 nm. The lateral colour scale bars are related to
the fluorescence intensity.43
............................................................................................ 22
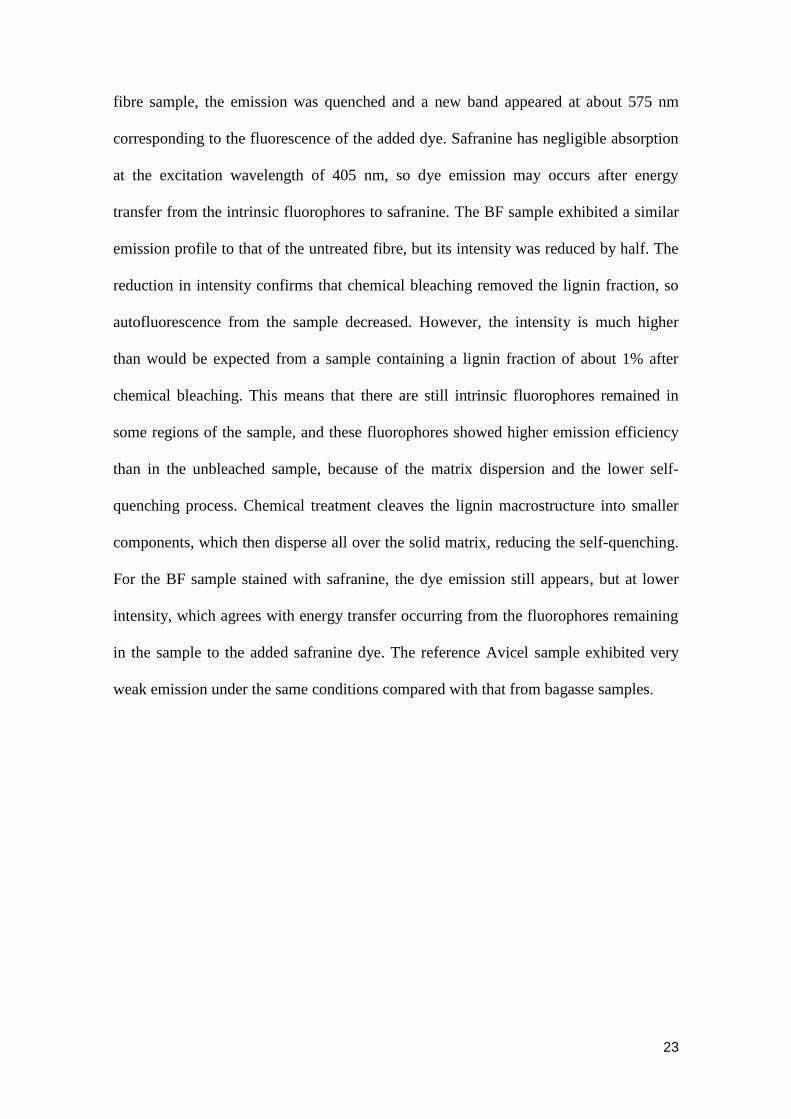
Figure 11. Fluorescence spectra from (solid curve) fibre, (long dashed curve)
fibre/safranine, (two dotted dashed curve) BF, single dotted dashed curve) BF/safranine
and (shorted dashed curve) Avicel. Samples were excited at 405 nm and spectral
intensity was recorded using a linear CCD spectrometer fibre coupled to the binocular
side port of the microscope.43
......................................................................................... 24
Figure 12. From the cellulose sources to the cellulose molecules: Details of the
cellulosic fiber structure with emphasis on the cellulose micro fibrils.65
....................... 29
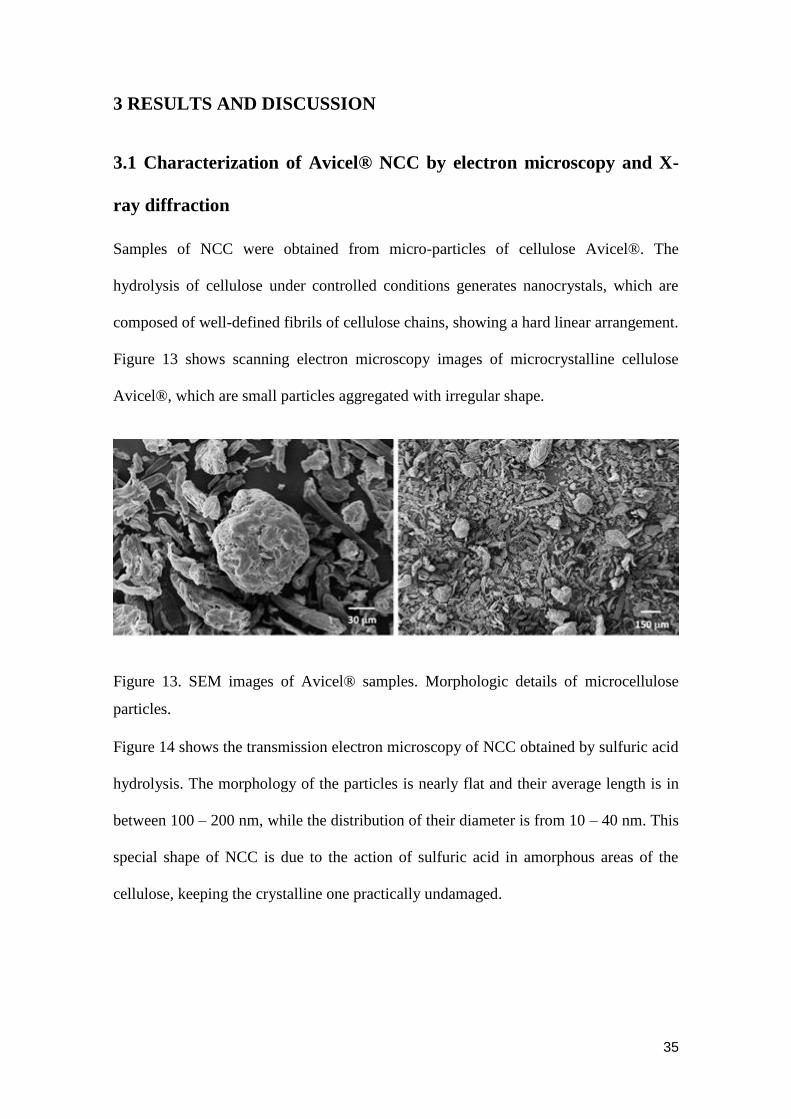
Figure 13. SEM images of Avicel® samples. Morphologic details of microcellulose
particles. .......................................................................................................................... 35
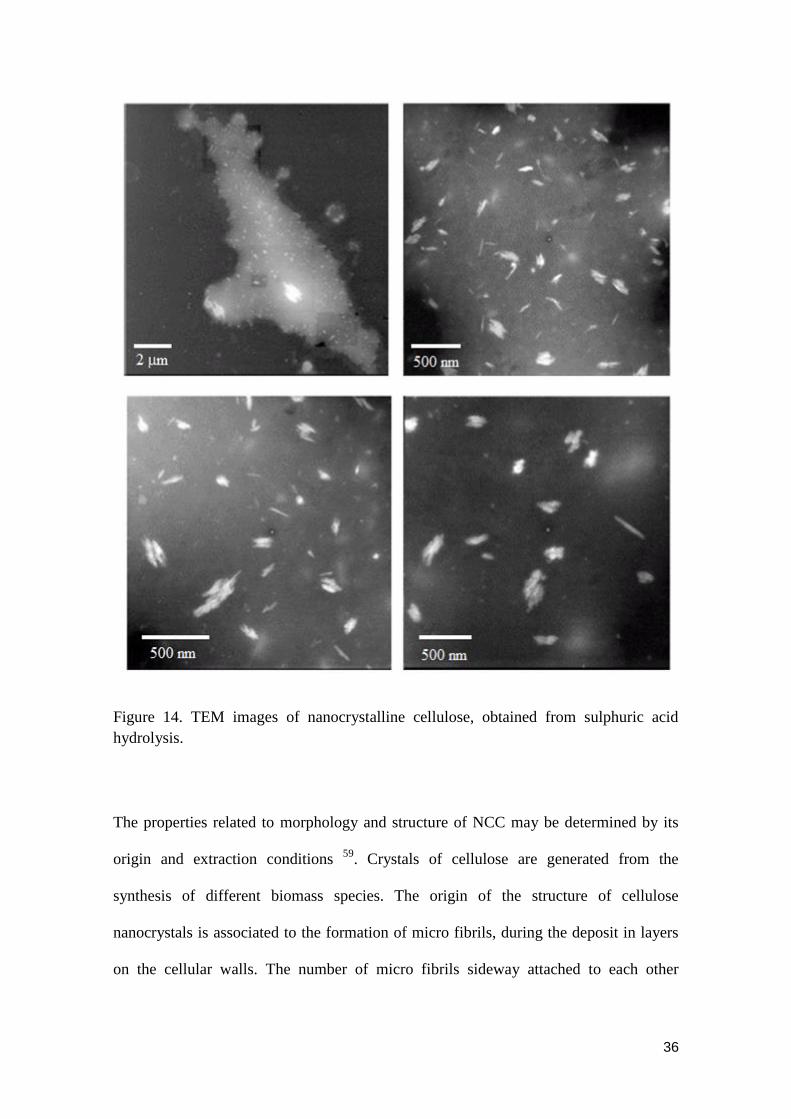
Figure 14. TEM images of nanocrystalline cellulose, obtained from sulphuric acid
hydrolysis. ...................................................................................................................... 36
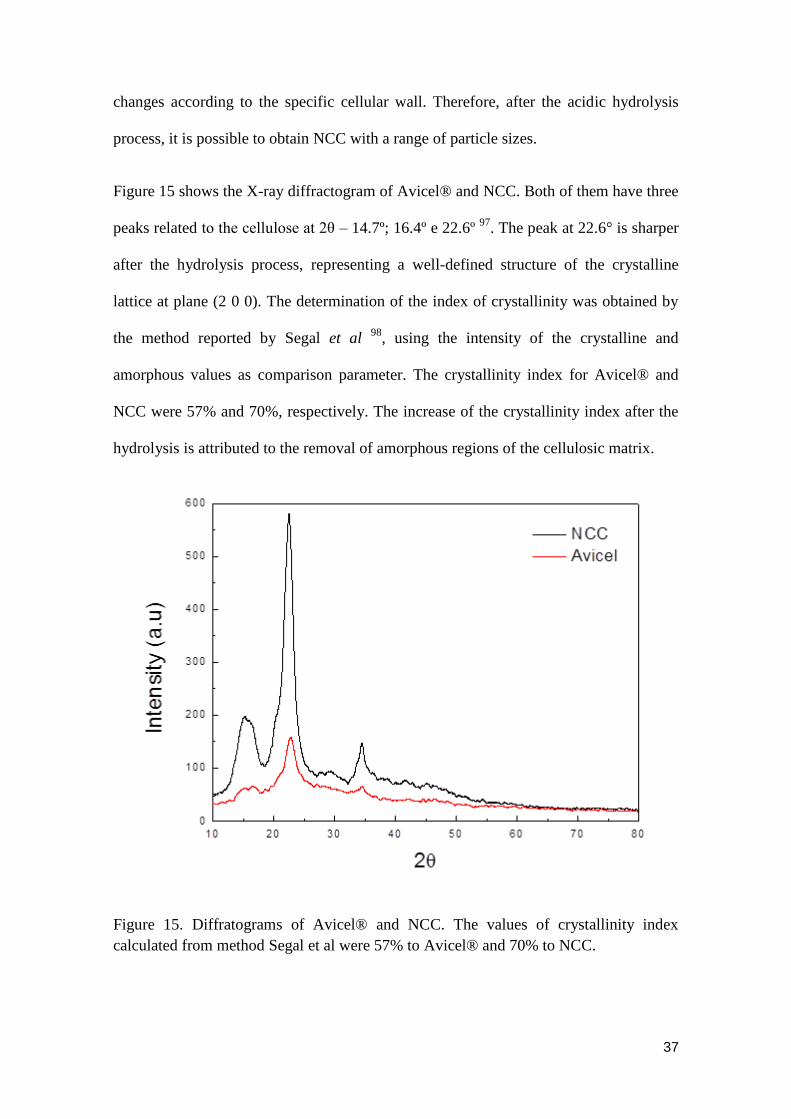
Figure 15. Diffratograms of Avicel® and NCC. The values of crystallinity index
calculated from method Segal et al were 57% to Avicel® and 70% to NCC. ............... 37
Figure 16. WFM images of Avicel® (a and b) and NCC (c and d). .............................. 39
Figure 17. Fluorescence spectra of a) Avicel® and b) NCC obtained by excitation at
405 nm. ........................................................................................................................... 40
Figure 18. Fluorescence decays of a) Avicel® and b) NCC obtained by two-photon
excitation at 800 nm. ...................................................................................................... 41
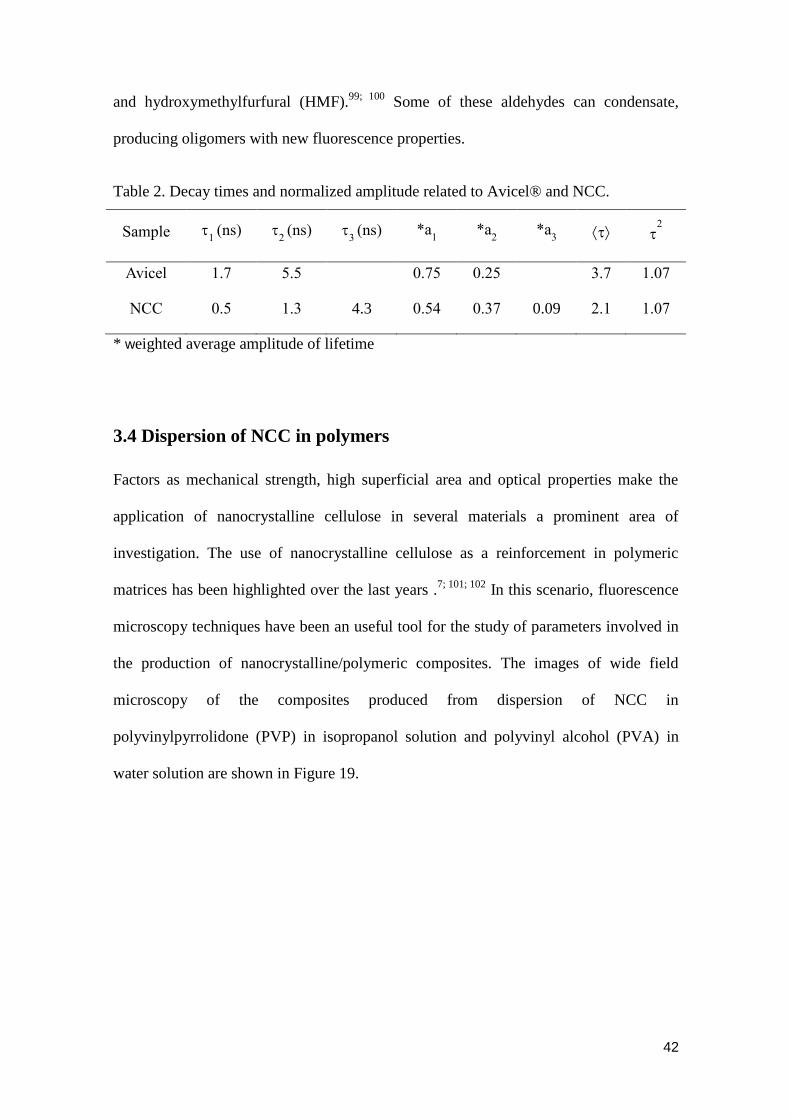
Figure 19. Wide field fluorescence images of a) solution of PVA-water/NCC and b)
PVP-isopropanol/NCC. .................................................................................................. 43
635 nm, power = 28.5 mW, size = 400x400p (10x10mm), dwell time = 0.4 ms and b)
m, power = 4.4 mW (20mW), size = 400x400p (10x10mm), dwell
time = 0.4 ms. ................................................................................................................. 44
xiv
Figure 21. a) Confocal and b) STED microscopy images and the respective profile of
the spot pointed from the yellow arrow. ......................................................................... 45
Figure 22. Schematic diagram illustrating the various types of chemical modifications
on NCC surface.35
........................................................................................................... 50
Figure 23. Autocorrelation curves of rhodamine 6G, ATTO-532 and NCC/ATTO-532.
........................................................................................................................................ 59
Figure 24. Prolate particle shape, in which b is the semi-minor axis of the structural unit
and a is the semi-major axis of the structural unit. ......................................................... 60
Figure 25. Autocorrelation curves of a) NCC/PEG/water, b) NCC/PEG/methanol and c)
NCC/PEG/acetonitrile at the PEG concentration of 2%, 5%, 10% and 20%. ................ 63
Figure 26. a) NCC fraction and diffusion coefficient (Dt) in function of PEG content. b)
ATTO-532 fraction and diffusion coefficient (Dt) in function of PEG content. ............ 65
Figure 27. Step-length distribution for a) NCC/PEG (50%)/water; b) NCC/PEG
(70%)/water; c) NCC/PEG (50%)/methanol; d) NCC/PEG (70%)/methanol; e)
NCC/PEG (50%)/acetonitrile and f) NCC/PEG (70%)/acetonitrile. Single particle
trajectories in a representative area are shown in the insets. .......................................... 66
Figure 28. Mean square displacement (MSD) for a) NCC/PEG/water; b)
NCC/PEG/methanol and c) NCC/PEG/acetonitrile. ...................................................... 68
Figure 29. Diffusion coefficient of NCC as a function of PEG content (%). ................. 70
Figure 30. General concept of controlled/living radical polymerization (CRP).162
....... 75
Figure 32. Activation–deactivation equilibrium in nitroxide-mediated polymerization.
Bicomponent initiating system (a) and monocomponent initiating system (b). 162
........ 76
Figure 32. Structures of styrene (1) and of the alkoxyamine-based NMP initiators used
in this work (2 and 5: non-fluorescent initiators; 3 and 4: fluorescent initiators). ......... 77
Figure 33. Sample holder device. ................................................................................... 79
Figure 34. Schematic setup of the FCS and WFM (KU Leuven). ................................. 82
Figure 35. Raman spectra for the polymerization of styrene, mediated by a) System 1, b)
System 2 and c) System 3. .............................................................................................. 85
xv
Figure 36. GPC traces of the polystyrene obtained via NMP for the a) System 1, b)
System 2 and c) System 3. .............................................................................................. 86
Figure 37. Normalized FCS autocorrelation curves for the polymerization of styrene,
mediated by a) System 1, b) System 2 and c) System 3 at different reaction time. ....... 88
Figure 38. a) Monomer conversion in function of polymerization time. B) Diffusion
coefficients plotted versus styrene conversion. Square symbols represent diffusion
coefficients related to polymerization mediated by linear initiator (system 1), round
symbols represent diffusion coefficients related to polymerization mediated by linear
initiator, containing fluorescent star-shaped initiator (system 3), and triangle symbols
represent diffusion coefficients related to polymerization mediated by star-shaped
initiator system 2). .......................................................................................................... 90
Figure 39. Step-length distribution for a) system 1, b) system 2 and c) system 3. The
distributions exhibited are related to polymeric systems after 180 minutes of reaction.
Single molecule trajectories in a representative area are shown in the insets. ............... 92
Figure 40. Mean square displacement (MSD) for system 1 (a), system 2 (b) and for
system 3 (c). Below of MSD graphs is shown the schematic representation of labelled
chain in their surroundings of respective system. Yellow circles shown in some chains
represent th the labelling by perylene diimide (PDI*). .................................................. 94
xvi
SUMMARY
ACKNOWLEDGMENTS ............................................................................................... i
PREFACE ....................................................................................................................... ii
ABSTRACT ................................................................................................................... iii
RESUMO ......................................................................................................................... v
LIST OF ABBREVIATIONS ...................................................................................... vii
LIST OF TABLES ......................................................................................................... xi
LIST OF FIGURES ...................................................................................................... xii
CHAPTER 1: OPTICAL MICROSCOPY STUDY OF SUGARCANE
BAGASSE
ABSTRACT .................................................................................................................... 2
1 INTRODUCTION ....................................................................................................... 3
2 EXPERIMENTAL ...................................................................................................... 7
2.1 Preparation of sugarcane bagasse samples ............................................................. 7
2.2 Labelling of sugarcane bagasse by safranine .......................................................... 7
2.3 Techniques .............................................................................................................. 8
2.3.1 Scanning electron microscopy ......................................................................... 8
2.3.2 Fluorescence confocal microscopy .................................................................. 8
2.3.3 Wide field microscopy ................................................................................... 11
3 RESULTS AND DISCUSSION ................................................................................ 13
3.1 Characterization of sugarcane bagasse by autofluorescence microscopy............. 13
4 CONCLUSIONS ........................................................................................................ 25
xvii
CHAPTER 2: PRODUCTION AND OPTICAL MICROSCOPY
CHARACTERIZATION OF NANOCRYSTALLINE CELLULOSE
ABSTRACT .................................................................................................................. 27
1 INTRODUCTION ..................................................................................................... 28
2 EXPERIMENTAL .................................................................................................... 32
2.1 Production of nanocrystalline cellulose by acid hydrolysis .................................. 32
2.2 Preparation of nanocrystalline/polymer composites ............................................. 32
2.3 Techniques ............................................................................................................ 32
2.3.1 X-ray diffraction ............................................................................................. 32
2.3.2 Transmission electron microscopy ................................................................. 33
2.3.3 Scanning electron microscopy ....................................................................... 33
2.3.4 Confocal fluorescence microscopy ................................................................ 33
2.3.5 Wide field microscopy ................................................................................... 34
2.3.6 Super-resolution microscopy by Stimulated emission depletion (STED) ..... 34
3.1 Characterization of Avicel® NCC by electron microscopy and X-ray diffraction
.................................................................................................................................... 35
3.2 Characterization of Avicel® NCC by wide field microscopy .............................. 38
3.3 Characterization of Avicel® NCC by steady and time-resolved fluorescence
spectroscopy ................................................................................................................ 39
3.4 Dispersion of NCC in polymers ............................................................................ 42
3.5 Super-resolution optical microscopy of Avicel® and NCC ................................. 43
4 CONCLUSIONS ........................................................................................................ 46
CHAPTER 3: FLUORESCENT LABELLING OF
NANOCRYSTALLINE CELLULOSE
ABSTRACT .................................................................................................................. 48
xviii
1 INTRODUCTION ..................................................................................................... 49
2 EXPERIMENTAL .................................................................................................... 52
2.1 Obtaining NCC ..................................................................................................... 52
2.2 Preparation of 1-azide-2,3-epoxypropane ............................................................. 52
2.3 Introducing azide groups to the surface of NCC .................................................. 53
2.4 Labeling of azide functionalized NCC with ATTO-532 dye................................ 53
2.5 FCS measurements ............................................................................................... 53
2.6 Wide Field Measurements .................................................................................... 56
3 RESULTS AND DISCUSSION ................................................................................ 58
3.1 Determination of diffusion coefficient of NCC dispersions ................................. 58
3.2 Study of dynamic properties of different composites based on the interaction of
NCC/polymer .............................................................................................................. 60
4 CONCLUSIONS ........................................................................................................ 70
CHAPTER 4: POLYMERIZATION OF STYRENE
ABSTRACT .................................................................................................................. 73
1 INTRODUCTION ..................................................................................................... 74
2 EXPERIMENTAL .................................................................................................... 77
2.1 Polymerization of styrene ..................................................................................... 77
2.2 Polymerization process ......................................................................................... 78
2.3 Measurements ....................................................................................................... 80
2.3.1 GPC .................................................................................................................... 80
2.3.2 Raman ................................................................................................................ 80
2.3.3 FCS .................................................................................................................... 81
2.3.4 WFM .................................................................................................................. 81

xix
3 RESULTS AND DISCUSSION ............................................................ 83
3.1 Styrene nitroxide mediated polymerization .......................................................... 83
4 CONCLUSIONS ........................................................................................................ 95
REFERENCES ............................................................................................................. 96
1
CHAPTER 1
OPTICAL MICROSCOPY STUDY OF
SUGARCANE BAGASSE
2
ABSTRACT
The spatial distribution of the components in the sugarcane bagasse is a very important
issue related to its industrial application, including the production of second generation
ethanol. In addition, several cellulosic materials have been used to produce diverse
polymeric composites. Sugarcane bagasse samples including whole bagasse, fibre, pith,
and respective samples obtained after chemical bleaching were investigated using
confocal fluorescence microscopy and spectroscopy with one and two-photon
excitation. Images from unbleached samples showed longitudinally oriented emission
patterns in fibre walls containing lignin fraction. After bleaching treatment, the oriented
emission was partially disrupted. Autofluorescence from bleached samples, with a
residual lignin content of about 1%, was attributed to the presence of fluorophores
dispersed throughout the matrix, which induced the concomitant reduction of
fluorescence self-quenching. The combination of autofluorescence images with spectral
emission and lifetime measurements provides a tool for microscopic characterization of
natural bagasse samples. Moreover, the technique allows the monitoring of bleaching
processes related to the lignin removal.
3
1 INTRODUCTION
Lignocellulosic compounds are widely used as source of different fermentable sugars,
showing a great potential in production of ethanol of second generation and production
of biomaterials 1; 2; 3
. Lignocellulose may be found in plant tissues, wherein the major
composites are cellulose, polyoses and lignin. Polyoses are branched polysaccharides,
consisting of pentose, hexose and uric acid4. Lignin is an aromatic biopolymer, which is
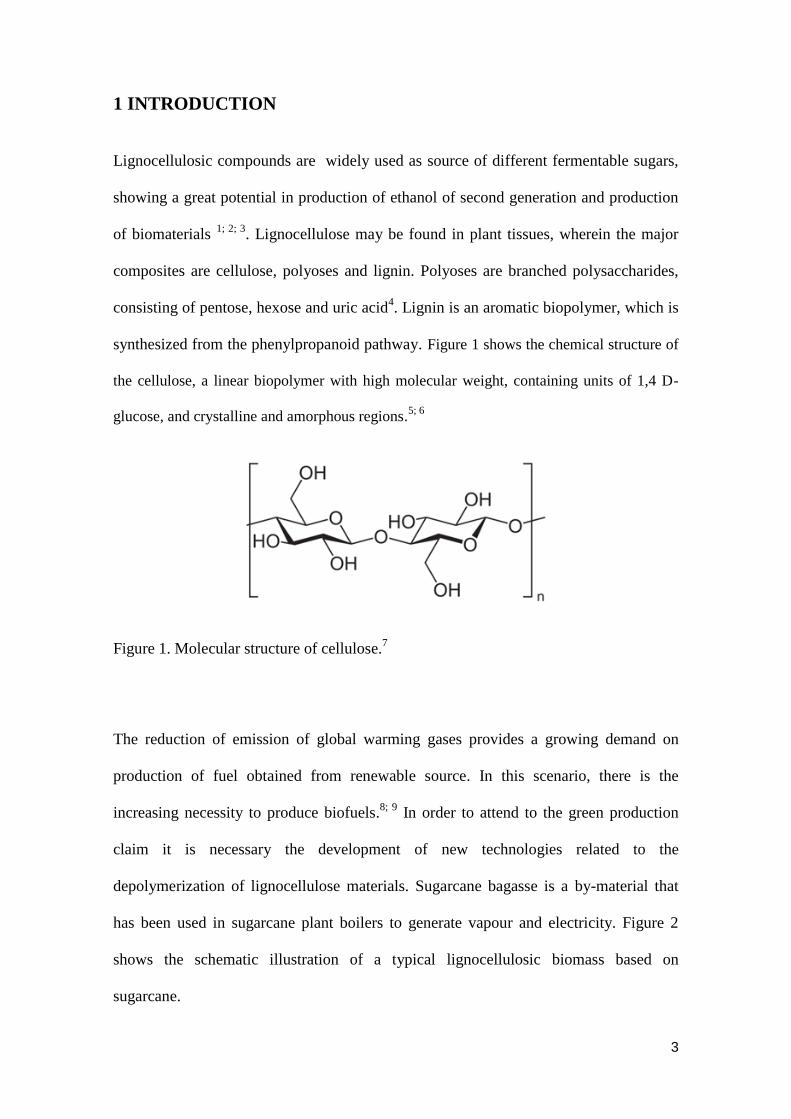
synthesized from the phenylpropanoid pathway. Figure 1 shows the chemical structure of
the cellulose, a linear biopolymer with high molecular weight, containing units of 1,4 D-
glucose, and crystalline and amorphous regions.5; 6
Figure 1. Molecular structure of cellulose.7
The reduction of emission of global warming gases provides a growing demand on
production of fuel obtained from renewable source. In this scenario, there is the
increasing necessity to produce biofuels.8; 9
In order to attend to the green production
claim it is necessary the development of new technologies related to the
depolymerization of lignocellulose materials. Sugarcane bagasse is a by-material that
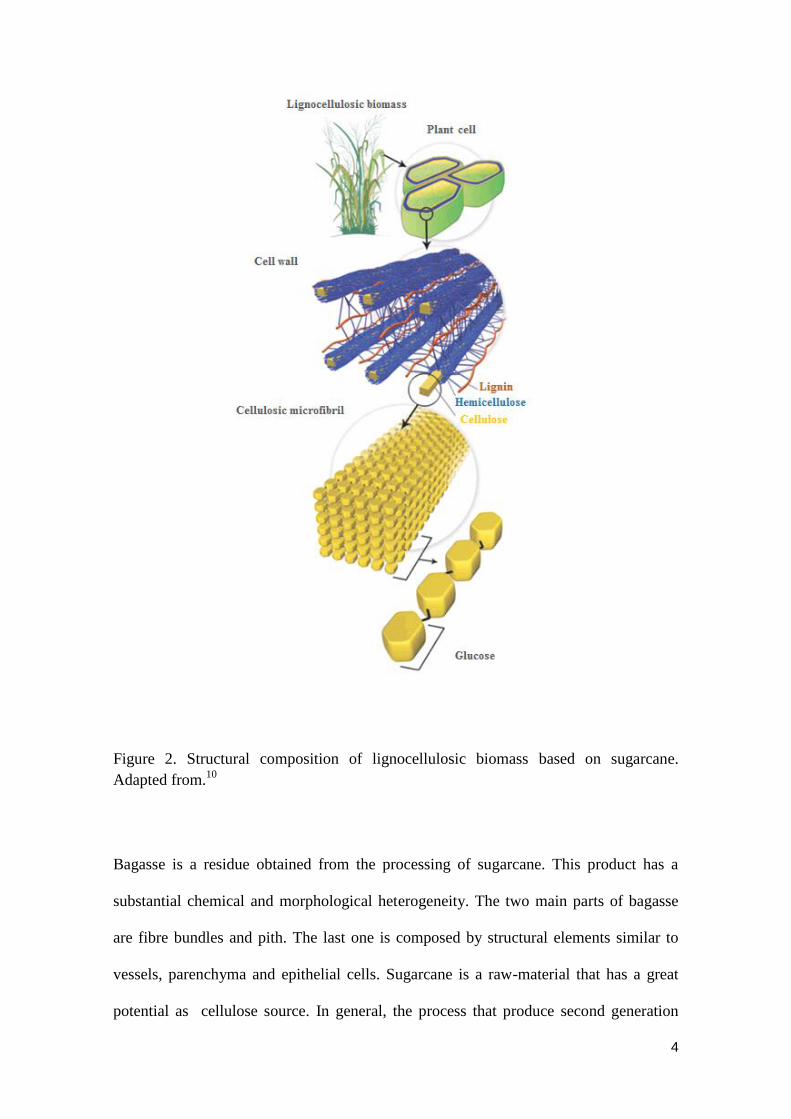
has been used in sugarcane plant boilers to generate vapour and electricity. Figure 2
shows the schematic illustration of a typical lignocellulosic biomass based on
sugarcane.
4
Figure 2. Structural composition of lignocellulosic biomass based on sugarcane.
Adapted from.10
Bagasse is a residue obtained from the processing of sugarcane. This product has a
substantial chemical and morphological heterogeneity. The two main parts of bagasse
are fibre bundles and pith. The last one is composed by structural elements similar to
vessels, parenchyma and epithelial cells. Sugarcane is a raw-material that has a great
potential as cellulose source. In general, the process that produce second generation
5
ethanol is initiated by hydrolysis of the cellulose forming glucose.11
Several
methodologies, including fluorescence based methods, may be used in characterization
of compounds in plant cell walls.12; 13; 14; 15
Optical microscopy represents an important
technique to identify and localize the presence of lignocellulosic compounds, besides, it
has the advantage of being a non-invasive and non-destructive method. In this scenario,
two-photon microscopy has been used successfully to study lignocellulosic materials,
because of its high spatial resolution and improved signal collection efficiency that
gives images with higher contrast and better quality. Due to its larger penetration depth,
it is possible to obtain images from thick sections. Images can be recorded several times
deeper than by single-photon microscopy. Fluorophore compounds that are active at
single-photon excitation can often be excited by two photons of twice the wavelength
(2). However, one must recognize that single-photon and two-photon excitation show
different quantum-mechanical processes and have very different selection rules.16; 17; 18;
19; 20
Plant tissues are complex biomaterials with intrinsic fluorescence properties. The
distribution of lignin in cellulosic matrices is an important parameter to evaluate the
quality of cellulosic material for ethanol production. Safranine has been used as a probe
in studies of plant tissues and cellulosic fibres13; 21; 22; 23
because of the preferential
interaction of the dye with the region containing lignin. Fluorescence lifetime
microscopy (FLIM) is a technique that has been used by some authors to identify and
quantify lignin in sugarcane bagasse. 15
In the investigation of the autofluorescence
from plant biomaterials, some authors have attributed the observed emission to the
presence of lignin fractions and aromatic compounds as lignans, flavonoids and
tannins.24; 25; 26
On the other hand, the autofluorescence has also been ascribed to the
presence of flavins and flavoproteins.27
Until the present time, there is still no consensus
6
about the presence of autofluorescence signal after chemical bleaching processes, which
should eliminate almost all primary compounds responsible by the natural emission of
lignocellulose materials.
Different studies have shown the capacity of fluorescence microscopy techniques to
reveal information about the spatial distribution and concentrations of components in
lignocellulosic matrices.28; 29; 30
Confocal and wide field fluorescence microscopy in
combination with spectroscopy techniques are useful tools in the study of structure and
composition of plant materials.
The hydrolysis of micro cellulose that uses concentrated inorganic acids as sulphuric
and hydrochloric is a well-established methodology used to convert cellulose into
sugars and to generate nanocrystalline cellulose. The structural properties combined
with chemical and physical composition represent the most important features of fibres
in application as, for example, reinforcement additives to the production of polymeric
composites.1; 31
The use of nanocrystalline cellulose to reinforce composites require
strong adherence between the fibre and the polymeric solution. Moreover, it is
necessary a high degree of dispersion of fibre into that material.32
The structure of the
fibre may be modified by different treatments, depending on the required aim and
application. Samir et al showed that the presence of nanocrystalline cellulose in
polymeric composites inducts the phenomenon of percolation, which contributes to the
improvement of thermal, mechanical, and barrier properties.33; 34; 35
One of the major
difficulties related to the use of nanocrystalline cellulose in composites is associated to
its dispersion into the polymeric solution without degradation or formation of self-
aggregated phases. To overcome such obstacles, several studies have been developed
aiming at the increase of compatibility between the polymeric matrix with the
nanocrystalline cellulose.36; 37; 38
7
2 EXPERIMENTAL
2.1 Preparation of sugarcane bagasse samples
The process of preparation of different sugarcane bagasse samples were performed by
Karen Marabezi from the laboratory of Organic Physical-Chemistry (University of São
Paulo – São Carlos/SP), coordinated by the Professor Antonio Aprigio da Silva
Curvelo. All the samples were washed with water aiming to eliminate interstitial
impurities. The process of separation of bagasse fractions were carried out by the use of
sieves with diameter mesh of 16‒60. The remain compounds were removed by
extraction using the solvent mixture cyclohexane/ethanol (1:1, v/v) and water.
The methodology of removal of lignin was performed according to known
delignification oxidative process.39
Before the process, the sugarcane sample was
separated into three groups: integral bagasse, fiber and pith. The crystallinity of
sugarcane bagasse was determined by X-ray diffraction and showed the value of 0.55
g/g.
2.2 Labelling of sugarcane bagasse by safranine
The samples of integral bagasse and bleaching integral bagasse (5g) were labelled by
the use of aqueous solution of safranine (3.10-5
mol.L-1
). The bagasse remained immerse
in solution under stirring for 5 minutes. Afterwards the sample was washed 3 times for
10 minutes using distilled water in temperature of 40ºC.
8
2.3 Techniques
2.3.1 Scanning electron microscopy
The samples were deposited in specific aluminium supports. The measurements were
performed in the Instrumental Analysis Centre of the Institute of Chemistry of São
Carlos (CAQUI/IQSC/USP) using a Zeiss Leo 440 scanning microscopy with Oxford
detector, operating with an electron beam of 20 kV. The sample were covered by 10 nm
of gold in a metallizer device BAL‒TEC (model MED 020) and kept in desiccator.
2.3.2 Fluorescence confocal microscopy
All the samples used were suspended in water and spin-coated (~3000 rpm, 30 s) on
cover glasses (0.13 mm, 22 x 22 mm, VWR International). The cover glasses were
cleaned by rinsing Milli-Q water, drying with argon gas and overnighting in a muffle at
450 °C.
The confocal microscopy setup was “lab built” in Molecular Fluorescence Laboratory at
IQSC - USP, containing an inverted microscope IX71‒Olympus, with a nanometric
scanning controlled by piezoelectric device (E-710.3CD – PI). The system was used to
achieve data related to confocal fluorescence images, steady-state emission and
fluorescence decays.
The confocal microscopy and steady-state emission measurements of sugarcane bagasse
and Avicel® samples were performed by using a CW laser excitation at 405 nm using a
Cube Coherent diode laser operating with adjustable output power from 1 40 mW.
The measurements of safranine labelled lignocellulosic material were carried out by
excitation with a Verdi-Coherent laser at 532 nm, operating at low intensity (20 mW).
In both setup features were applied circularly polarized light, generated from ¼ wave
9
plates of zero order (Del Mar Photonics). Two Olympus objectives lenses were used,
40X, NA = 0.75 model UPLFLN 40XPH and 60X, NA = 1.35 model UPLSAPO 60XO.
The detection system used a photon counting detector APD type, Perkin Elmer, model
SPCM-AQRH.
Confocal images were obtained due to the controlling and synchronizing of the
piezoelectric scanning system and two plates of National Instruments (PCI-GPIB NI-
488.2 e PCI-6601) applied to acquisition of TTL signal. Communication and interfacing
of the instruments were achieved by two programs developed in our laboratory, written
in LabView 8.5, and in the Laboratory for Photochemistry and Spectroscopy from KU
Leuven, written in C#.
Steady-state emission fluorescence spectra were obtained by the spectrometer Maya
2000 Pro ‒ (Ocean Optics), fibre optical attached to IX71 microscope through a side
port, which is showed in Figure 3.
10
Figure 3. Confocal microscopy setup. Top picture: Microscope IX71 containing two
APD detectors, piezoelectric PI controller. Bottom picture: Maya 2000 Pro spectrometer
attached to the microscope (IQSC – USP)40
.
A pulsed laser beam (Ti:Safira Mira 900 ‒ Coherent) at 400 nm with pulse width of
150 fs and frequency of 76 MHz was applied to perform fluorescence decay
measurements. Pulse picker (Conoptics) kept excitation pulse frequencies in 4 MHz.
Photodiode model TDA 200- PicoQuant with Becker & Hickl 140 was used to counting
and synchronizing of photons. Figure 4 shows the schematic setup related to decay
measurements.
11
Figure 4. Confocal optical schematic setup. APD: avalanche photodiode; BS: beam
splitter; CU: control unit; DF: dichroic filter; EXP: expander beam; IR: iris; L: lense;
LPF low-pass filter; M: mirror; MM: mobile mirror; NF: notch filter; NLC: non-linear
crystal; OB: objective; OF: optical fibre; PBS: prism beam splitter; PA: piezoelectric;
PH: pinhole; PP: pulse picker; S: sample; SD: silicon detector; W: wave plate. (IQSC –
USP)41
2.3.3 Wide field microscopy
The fluorescence wide field images were obtained by using an inverted IX71 Olympus
microscope and an objective model UPlanFLN Olympus, with magnification of 100X
and numerical aperture of 1.3 in oil. The images were recorded on EMCCD Evolve 512
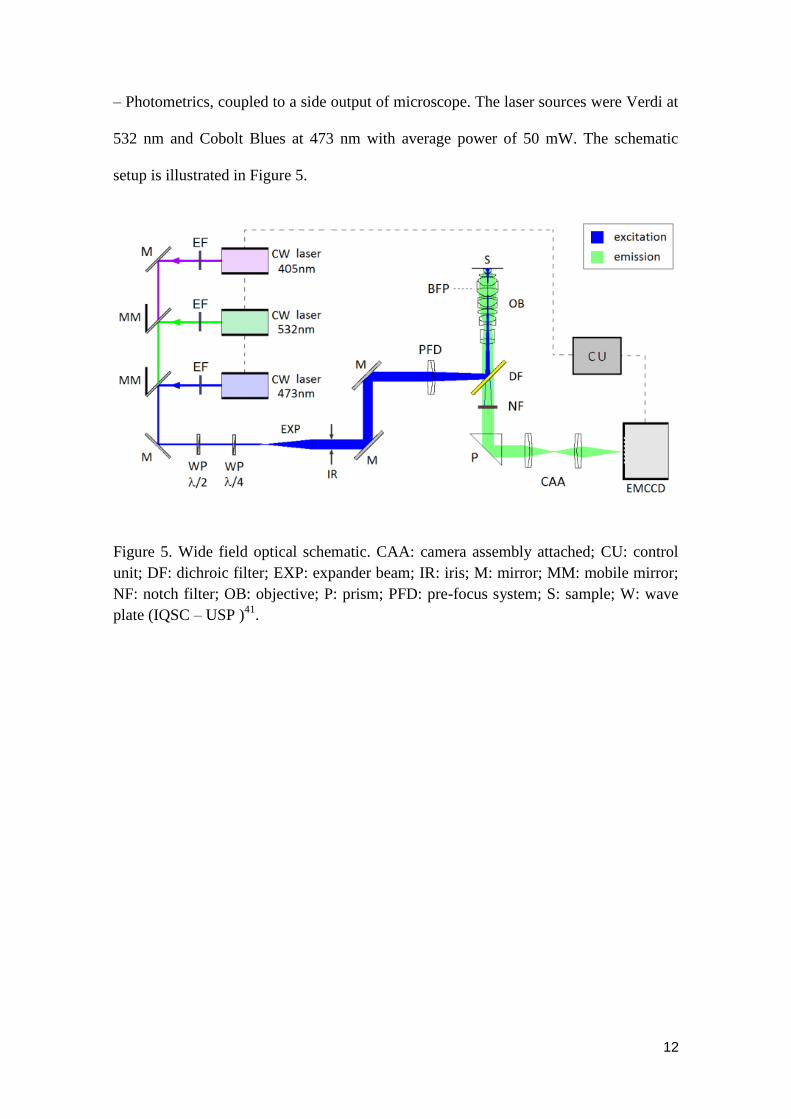
12
‒ Photometrics, coupled to a side output of microscope. The laser sources were Verdi at
532 nm and Cobolt Blues at 473 nm with average power of 50 mW. The schematic
setup is illustrated in Figure 5.
Figure 5. Wide field optical schematic. CAA: camera assembly attached; CU: control
unit; DF: dichroic filter; EXP: expander beam; IR: iris; M: mirror; MM: mobile mirror;
NF: notch filter; OB: objective; P: prism; PFD: pre-focus system; S: sample; W: wave
plate (IQSC – USP )41
.
13
3 RESULTS AND DISCUSSION
3.1 Characterization of sugarcane bagasse by autofluorescence
microscopy
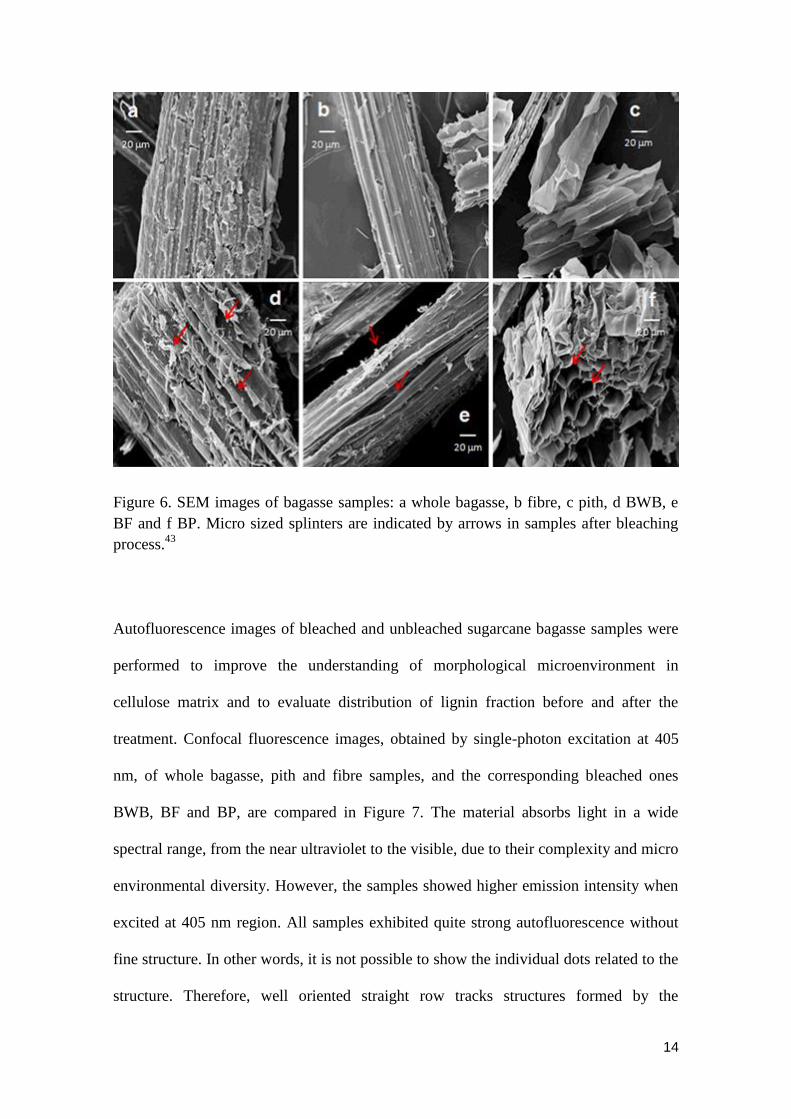
SEM analysis of sugarcane bagasse samples (whole bagasse, fibre and pith), and the
corresponding bleached samples (bleached whole bagasse (BWB), bleached fibre (BF)
and bleached pith (BP)) were used to determine the effect of chemical bleaching. These
regions were analysed because they present unique characteristics with respect to their
recalcitrance and morphology. Integral bagasse basically consists of fibre and pith. The
fibre surface is formed by parallel stripes and has a high length/diameter ratio. In
contrast, pith has a fragile and fragmented structure associated to parenchyma cells
designed to store sucrose. These features are very important to the understanding of
hydrolysis and bleaching processes. In Figure 6 SEM micrographs of unbleached and
bleached samples are compared. Unbleached samples (Fig. 6 a, b, c) present a rigid and
compact morphology. After chemical bleaching, fibre and pith exhibited disorganized
morphology. The roughness and some micro sized splinters were observed on the
surfaces (Fig. 6 d, e, f). Therefore, after bleaching, samples showed most exposed
structure, which allows more accessibility hydrolysis reaction of lignocellulosic
biomass.42
14
Figure 6. SEM images of bagasse samples: a whole bagasse, b fibre, c pith, d BWB, e
BF and f BP. Micro sized splinters are indicated by arrows in samples after bleaching
process.43
Autofluorescence images of bleached and unbleached sugarcane bagasse samples were
performed to improve the understanding of morphological microenvironment in
cellulose matrix and to evaluate distribution of lignin fraction before and after the
treatment. Confocal fluorescence images, obtained by single-photon excitation at 405
nm, of whole bagasse, pith and fibre samples, and the corresponding bleached ones
BWB, BF and BP, are compared in Figure 7. The material absorbs light in a wide
spectral range, from the near ultraviolet to the visible, due to their complexity and micro
environmental diversity. However, the samples showed higher emission intensity when
excited at 405 nm region. All samples exhibited quite strong autofluorescence without
fine structure. In other words, it is not possible to show the individual dots related to the
structure. Therefore, well oriented straight row tracks structures formed by the
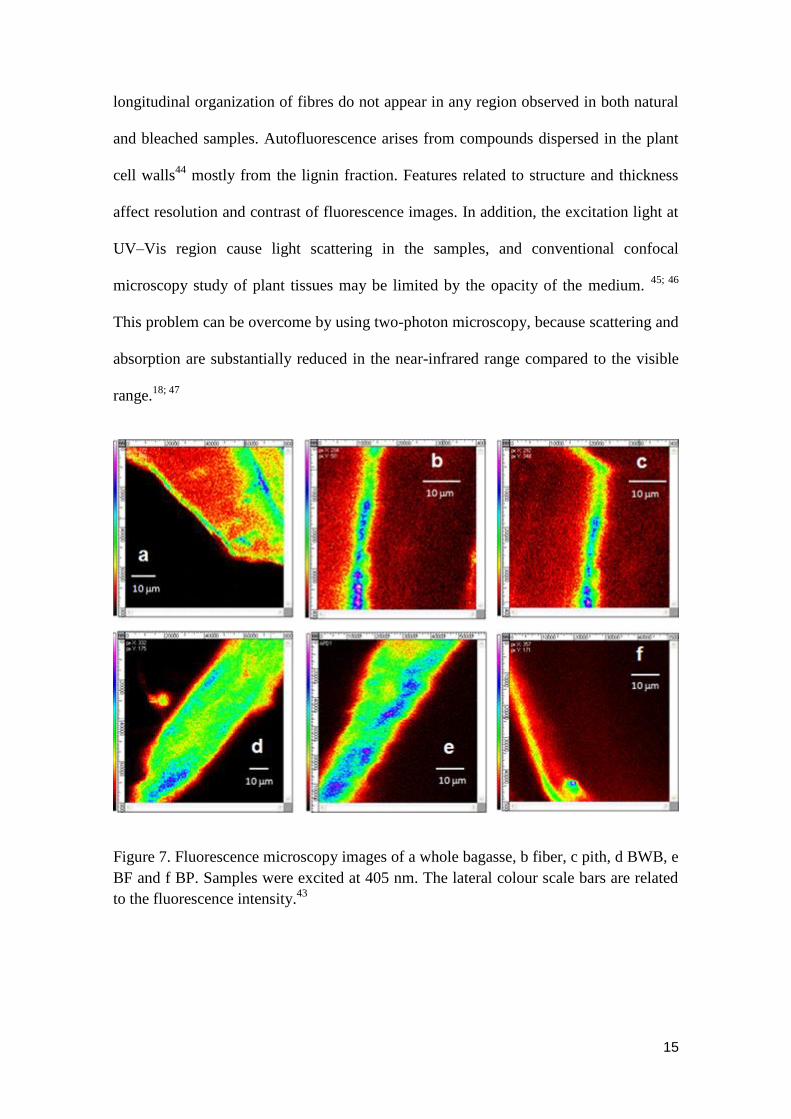
15
longitudinal organization of fibres do not appear in any region observed in both natural
and bleached samples. Autofluorescence arises from compounds dispersed in the plant
cell walls44
mostly from the lignin fraction. Features related to structure and thickness
affect resolution and contrast of fluorescence images. In addition, the excitation light at
UV–Vis region cause light scattering in the samples, and conventional confocal
microscopy study of plant tissues may be limited by the opacity of the medium. 45; 46
This problem can be overcome by using two-photon microscopy, because scattering and
absorption are substantially reduced in the near-infrared range compared to the visible
range.18; 47
Figure 7. Fluorescence microscopy images of a whole bagasse, b fiber, c pith, d BWB, e
BF and f BP. Samples were excited at 405 nm. The lateral colour scale bars are related
to the fluorescence intensity.43
16
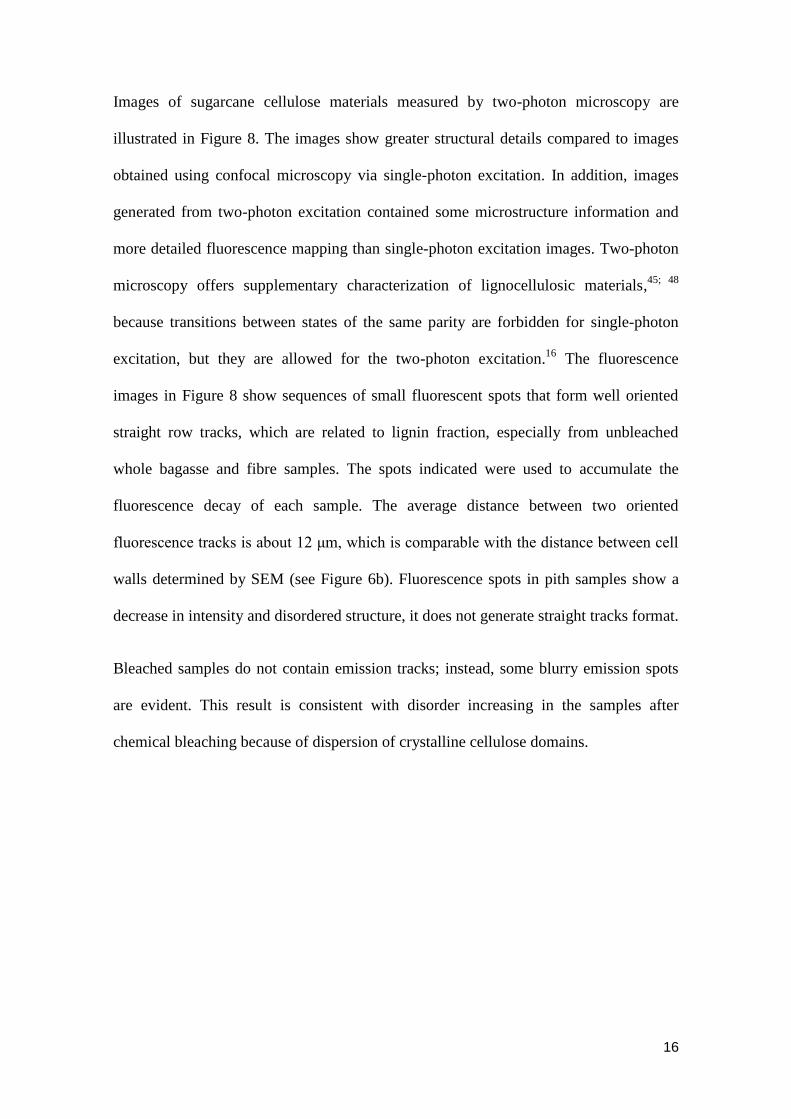
Images of sugarcane cellulose materials measured by two-photon microscopy are
illustrated in Figure 8. The images show greater structural details compared to images
obtained using confocal microscopy via single-photon excitation. In addition, images
generated from two-photon excitation contained some microstructure information and
more detailed fluorescence mapping than single-photon excitation images. Two-photon
microscopy offers supplementary characterization of lignocellulosic materials,45; 48
because transitions between states of the same parity are forbidden for single-photon
excitation, but they are allowed for the two-photon excitation.16
The fluorescence
images in Figure 8 show sequences of small fluorescent spots that form well oriented
straight row tracks, which are related to lignin fraction, especially from unbleached
whole bagasse and fibre samples. The spots indicated were used to accumulate the
fluorescence decay of each sample. The average distance between two oriented
fluorescence tracks is about 12 μm, which is comparable with the distance between cell
walls determined by SEM (see Figure 6b). Fluorescence spots in pith samples show a
decrease in intensity and disordered structure, it does not generate straight tracks format.
Bleached samples do not contain emission tracks; instead, some blurry emission spots
are evident. This result is consistent with disorder increasing in the samples after
chemical bleaching because of dispersion of crystalline cellulose domains.
17
Figure 8. Fluorescence intensity image and decay traces of indicated emission spots
obtained by two-photon excitation at 800 nm of a) whole bagasse, b) fibre, c) pith, and
corresponding bleached samples, d) BWB, e) BF and f) BP. Scale bar 10 nm.43
Scanning the z-position of the focal plane using two-photon fluorescence microscopy
allowed us to visualize the architecture, fibril patterns, and other details of the
microstructure of cellulosic materials. 2D images at various depths of z-axis from 0 to
10 μm are shown in Figure 9. Orientation of micrometre-sized emission tracks is
18
thoroughly dependent of z-position. Each micrometre change in depth of the focal plane
leads to loss of orientation. This effect may be related to the SEM images of the bagasse
sample in Figure 6a, where oriented walls of the fibre are located near its surface.
Figure 9. Two-photon fluorescence microscope images of a whole bagasse sample
obtained at a focal plane of a) 0 µm, b) 5 µm and c) 10 µm. Scale bar 10 µm. The lateral
colour scale bars are related to the fluorescence intensity.43
19
Lifetime measurements in combination with microscopy techniques can be used to
study biological materials.49; 50
Samples were investigated by fluorescence decay
measurements aiming at the investigation of lignin-rich regions. Fluorescence decay
traces were recorded at wavelength of 500 nm, as well as at 575 nm for samples labelled
with safranine, which corresponds to emission maximum of the dye. Decay analyses
were performed by FAST software (Edinburgh Instruments), fitted by multiexponential
function without deconvolution. The fitting range was chosen by considering the decay
part of the time dependent data according to optimal parameters. Typical decay profiles
of untreated and bleached samples are illustrated in Figure 8. The fluorescence
relaxation was fitted with a biexponential decay function. The decay components,
normalized amplitudes and average values are presented in Table 1. A fast decay
component occurs in the range of 0.4–1.4 ns, and a long-lived component takes more
than 2.0 ns to decay. Such biexponential decay behaviour with a short decay component
of about 0.4 ns was first observed in the fluorescence emission of Abies wood.51
20
Table 1. Decay times (i) and normalized amplitudes (ai) of micrometre-sized emission
spots from cellulose samples isolated from sugarcane bagasse obtained by
multiexponential fitting.43
Complex matrices such as sugarcane bagasse contain multiple intrinsic fluorophores,
which may be aromatic compounds with phenolic and acid groups from the lignin
fraction (cinnamic residues), and traces of endogenous biomolecules such as enzymes
and cofactors, chlorophyll, xanthophylls, coumarin and flavonoid derivatives.26; 52; 53;
54Hafren and Oosterveld-Hut
55 studied wood fibers using fluorescence lifetime
imaging. Biexponential fitting at two emission regions of 436 and 480 nm resulted in
wavelength-independent decay times of about 0.7 and 4.3 ns. These values are within
the range of decay times observed for our samples.
Analysis of decay parameters in this system is a difficult task because of its complexity.
Nevertheless, some important issues were identified. In general, the fluorescence decay
of untreated and bleached samples are biexponential and occurs in time intervals longer
than 20 ns, as illustrated in Figure 8. The calculated average decay time increases by
about 68% from fibre to BF, 47% from whole bagasse to BWB, and 41% from pith to
BP (see Table 1).
21
Samples stained with safranine show slightly different decay behaviour, as illustrated in
Figure 10. First, unbleached samples like whole bagasse show a third decay component
with a lifetime of 4.8 ns. This component is ascribed to the decay of the singlet-excited
state of safranine formed mainly through energy transfer from the natural compounds to
the added dye. In addition, the fluorescence lifetime of safranine in other solvents was
also measured. In a polyvinylpyrrolidone film, a single component with a lifetime of
about 4 ns was recorded, while the fluorescence lifetime of safranine in propanol was 3
ns. Therefore, the observed increase of safranine fluorescence lifetime in bagasse
samples is a result of absorption of the dye in lignin-rich regions. The second difference
is the moderate quenching of the second decay component of the whole bagasse sample,
which is reduced from 1.9 to 1.3 ns. This result is consistent to fluorescence quenching
of excited chromophores of the lignin fraction by energy transfer to the adsorbed
safranine. Fluorescence behaviour is thoroughly linked to the chemical environment of
the cellulosic matrix 56
. Chemical bleaching of lignin fraction causes decomposition and
dispersion of the components generated. The bleaching reaction also decreases the
amount of organic materials and intrinsic fluorophores in the sample. Therefore,
bleaching reduces energy migration and fluorescence self-quenching in the samples.
Self-quenching is mainly observed when the lignin matrix is intact and its intrinsic
fluorophores are closely confined. The emission intensity of the bleached samples is
still strong because most of the remaining chromophores are partially isolated or
dispersed in the cellulosic matrix, reducing excited state deactivation by self-quenching.
These results are in agreement with those obtained by 15
using fluorescence lifetime
imaging (FLIM) to map the distribution of lignin in sugarcane bagasse. They also
obtained two components related to fluorescence decay, one with the fast and another
22
with the slow decay time. The faster decay is associated to dense lignin regions and
becomes slower after samples undergo pre-treatment to remove lignin.
Figure 10. Fluorescence intensity images and decay of each indicated emission spot
obtained by two-photon excitation at 800 nm of samples stained with safranine: a)
whole bagasse and b) BWB. Scale bar 10 nm. The lateral colour scale bars are related to
the fluorescence intensity.43
Emission spectra of the fibre samples were also measured under the same conditions
and the results are exhibited in Figure 11. Untreated fibre presented high intensity
emission with a maximum at about 500 nm, consistent with the emission spectra
reported for wood samples (Donaldson et al. 2010). When safranine was added to the
23
fibre sample, the emission was quenched and a new band appeared at about 575 nm
corresponding to the fluorescence of the added dye. Safranine has negligible absorption
at the excitation wavelength of 405 nm, so dye emission may occurs after energy
transfer from the intrinsic fluorophores to safranine. The BF sample exhibited a similar
emission profile to that of the untreated fibre, but its intensity was reduced by half. The
reduction in intensity confirms that chemical bleaching removed the lignin fraction, so
autofluorescence from the sample decreased. However, the intensity is much higher
than would be expected from a sample containing a lignin fraction of about 1% after
chemical bleaching. This means that there are still intrinsic fluorophores remained in
some regions of the sample, and these fluorophores showed higher emission efficiency
than in the unbleached sample, because of the matrix dispersion and the lower self-
quenching process. Chemical treatment cleaves the lignin macrostructure into smaller
components, which then disperse all over the solid matrix, reducing the self-quenching.
For the BF sample stained with safranine, the dye emission still appears, but at lower
intensity, which agrees with energy transfer occurring from the fluorophores remaining
in the sample to the added safranine dye. The reference Avicel sample exhibited very
weak emission under the same conditions compared with that from bagasse samples.
24
Figure 11. Fluorescence spectra from (solid curve) fibre, (long dashed curve)
fibre/safranine, (two dotted dashed curve) BF, single dotted dashed curve) BF/safranine
and (shorted dashed curve) Avicel. Samples were excited at 405 nm and spectral
intensity was recorded using a linear CCD spectrometer fibre coupled to the binocular
side port of the microscope.43
25
4 CONCLUSIONS
It was used single and two-photon fluorescence microscopy to characterize the
autofluorescence from micro-regions of sugarcane bagasse samples. Fluorescence
images show that fibril packages of bagasse samples partially lose their longitudinal
orientation after chemical bleaching. Extraction of lignin allows the dispersion of the
remaining natural fluorophores in the sample, which reduces self-quenching process.
The presence of high intensity spots after chemical bleaching indicates that fluorescent
lignin derivatives remain in some regions of the lignocellulosic matrix. Our results were
able to provide information related to the morphological properties and lignin
distribution in sugarcane bagasse samples. In addition, it is possible to understand how
the bleaching process affects these parameters. Therefore, this study provides support
for future site-specific morphological analyses of the effects of different pre-treatments
usage on cellulose hydrolysis, which is an important issue in second-generation
bioethanol production.
26
CHAPTER 2
PRODUCTION AND OPTICAL
MICROSCOPY CHARACTERIZATION
OF NANOCRYSTALLINE CELLULOSE
27
ABSTRACT
Nanocrystalline cellulose (NCC) is a rigid rod-shaped fibre with one to one hundred
nanometres in diameter and tens to hundreds of nanometres in length, always with a
large length / diameter ratio. Due to its properties, NCC can be used for different
applications such as in regenerative medicine, in optical materials, and in composites
used in automotive industry. The characterization of NCC has been performed by XRD,
IR spectroscopy and TEM. However, a thorough understanding about its morphology
and composition is still being uncovered. Different techniques of fluorescence
microscopy in combination with steady-state and time-resolved fluorescence
spectroscopy represent potential tools to study NCC. In this chapter, the whole
procedure of NCC obtaining via an adapted acid hydrolysis of Avicel® is described.
Afterwards the material was characterized by classic electron microscopy SEM and
TEM, confirming the rod-shaped morphology and the nano-sized structure. Wide field
microscopy was applied as fluorescence microscopy tool to characterize the NCC when
dispersed in two distinct polymeric solutions of PVA and PVP. Because of the
hydrophilicity of NCC, the wide field images showed the well-dispersed NCC in the
solution of PVA/water, while the solution of PVP/isopropanol showed the formation of
NCC self-aggregates into the polymeric matrix. The last step of this chapter describes
the characterization of NCC structures by using the super-resolution fluorescence
microscopy STED (Stimulated Emission Depletion). The images obtained by STED
showed NCC morphology with resolution down to 50 nm, allowing the comparison
with TEM and AFM microscopy results.
28
1 INTRODUCTION
Nanocrystalline cellulose (NCC) is cellulosic materials with dimension in nanometre
range. Those materials show distinct behaviour and different physicochemical
properties when compared to larger cellulosic fibres. NCC may be obtained from two
different types of sources. Plant materials are the most common ones used in the NCC
obtaining. There are other cellulosic sources from which NCC has been isolated,
including tunicates, bacteria and algae.57
NCC is described as a rigid rod-like particle with widths and lengths of 5 70 nm and
100 2000 nm respectively. The particles are highly crystalline, with crystalline index
between 54 and 88%.58
The variety of thickness, lengths, morphologies and degree of
crystallinity depends on the source of cellulosic material and conditions under which
production is carried out as well as on the experimental technique used.34
NCC isolated
from tunicate has been reported to have dimension of 8 – 20 nm in thickness and
lengths about 1m.59; 60; 61
There are some reports related to NCC obtaining via sulfuric
acid from cotton-Avicel® with thickness about 10 – 100 nm and lengths from 1 m to 2
m.62; 63; 64
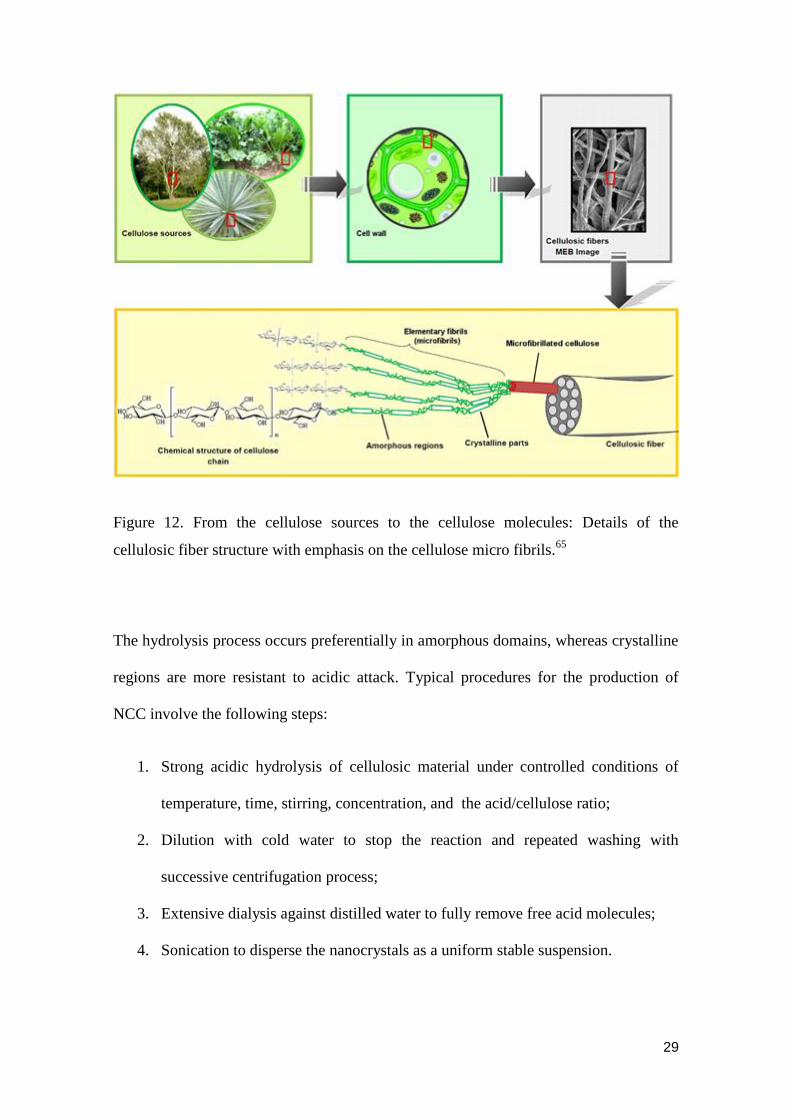
The Figure 12 shows how cellulose may be found in nature, and gives details of the
cellulosic fibre organization and the basic chemical structure of cellulose.
29
Figure 12. From the cellulose sources to the cellulose molecules: Details of the
cellulosic fiber structure with emphasis on the cellulose micro fibrils.65
The hydrolysis process occurs preferentially in amorphous domains, whereas crystalline
regions are more resistant to acidic attack. Typical procedures for the production of
NCC involve the following steps:
1. Strong acidic hydrolysis of cellulosic material under controlled conditions of
temperature, time, stirring, concentration, and the acid/cellulose ratio;
2. Dilution with cold water to stop the reaction and repeated washing with
successive centrifugation process;
3. Extensive dialysis against distilled water to fully remove free acid molecules;
4. Sonication to disperse the nanocrystals as a uniform stable suspension.
30
Several studies have been performed over the last decades, and they are related to the
application of NCC as filler in nanocomposites for improving mechanical and barrier
properties.7; 34; 66; 67; 68; 69; 70; 71; 72; 73; 74
In the last years, attention has been devoted to
studies involving the application of NCC in different materials, such as foams,
aerogels,69
building block for selective membranes,75
adhesive materials,69,
76
lithium
battery, and in mechanical reinforcement agent for low thickness polymer electrolytes.
The intermolecular hydrogen bonds of the cellulose molecules result in strong
interactions between the fillers and the polymeric matrix, showing better composite
properties compared to the pure polymer matrix. Another important effect of NCC is the
high flexibility of the cellulose polymer that provides an entanglement effect with the
polymer matrix that contributes to improve mechanical and thermal properties.77; 78; 79; 80
Different techniques have been employed to perform the characterization of
nanocrystalline materials. The crystallinity index, in general, is determined by X–ray
diffraction (XRD) technique.81; 82
The chemical composition may be determined by
Raman and infrared spectroscopy.14; 69
Aspects related to the morphology are generally
investigated by microscopy techniques, such as, transmission electron microscopy
(TEM), scanning electron microscopy (SEM), and atomic force microscopy (AFM). 83;
84; 85; 86 Light microscopy has been a useful technique in investigation of different
lignocellulosic materials, 15; 87; 88
and possesses the advantage of being non-invasive and
non-destructive method. In that context, NCC could be characterized by light
microscopy technique, such as, confocal and wide field microscopy (WFM), providing
morphologic information that is not available by other techniques.
Advances in optical microscopy have been established in the last decade, generating a
great impact in areas of chemistry and biology.89; 90
Recent progresses in optics allowed
breaking the diffraction limit by the developing of the so called super resolved
31
microscopy techniques as, for example, the STED method.91; 92; 93
Methods with super-
resolution assure high space sensitivity, allowing the investigation of unknown details
in natural and artificial systems, up to the single molecule level.94; 95
The NCC has great potential generating highly functionalised nanomaterials to different
areas, such as, intelligent recovering, pharmaceutical applications, nanocomposites and
electronic materials. The effectiveness of the use of nanocrystalline cellulose is related
to the structural knowledge of the system. From this point of view, the application of
super-resolution technique STED represents a very useful tool to investigate NCC
single fibres.
32
2 EXPERIMENTAL
2.1 Production of nanocrystalline cellulose by acid hydrolysis
The commercial microcellulose Avicel® was purchased from Sigma-Aldrich. The
methodology used to obtain nanocrystalline cellulose was adapted from Mandal and
Debabrata.85
The hydrolysis of Avicel® was carried out by the use of sulphuric acid.
For each 1g of Avicel® was used 6 mL of sulphuric acid 54% (v/v). The hydrolysis was
performed under stirring during 60 minutes at 50 ºC. At the end of the reaction, the
mixture showed a lightly brownish colour. Subsequently, the suspension was cooled
down by the addition of cold distilled water. Afterwards, the washing process with
Milli-Q water and centrifugation at 14,000 rpm was performed several times until the
supernatant shows pH around 7. Then, the suspension was filtered using a membrane
with the diameter mesh at 200 nm.
2.2 Preparation of nanocrystalline/polymer composites
Solutions of polyvinyl alcohol (PVA, MW) and polyvinylpyrrolidone
(PVP, MW~55,000) were prepared by their dissolution in water and isopropanol (2%
w/w). The polymeric solution was kept under stirring during 20 minutes at 40 ºC.
Hereafter, the NCC suspension was added to the polymeric matrix (10% w/w) and kept
under stirring during 30 minutes. Finally, the samples were deposited on cover slides
and stored in a desiccator.
2.3 Techniques
2.3.1 X-ray diffraction
The diffractograms were obtained from diffractometer Rigaku, operating at 50 kV and
100 mA by irradiation of CuKα (λ = 1.5406 Å). The measurements were carried out at
33
room temperature (25 ºC) and at angle 2 θ from 5 to 40º (2º.min-1
). The crystallinity
index was calculated from the diffractogram peaks, taking into account the Gaussian
distribution function related to the amorphous and crystalline areas 96
. The equation 1
was applied to obtain the crystallinity index:
𝐼𝑐(%) = (1 −𝐴𝑎
𝐴𝑡) 𝑋100
Equation 1
Where Aa is the corresponding area under the amorphous curve and At is the total area
of all peaks, including the amorphous curve.
2.3.2 Transmission electron microscopy
NCC was measured in a Tecnai™ G2 F20 microscope, operating in STEM mode, in
bright field and dark field. Before measuring, the samples were sonicated for 10 minutes
and the suspension was dropped on a grid and stored in a desiccator for 24 h.
2.3.3 Scanning electron microscopy
The methodology used to obtain scanning electron microscopy images of NCC was
previously described in section 2.3.1 of Chapter 1.
2.3.4 Confocal fluorescence microscopy
The confocal microscopy and steady-state emission measurements of NCC were
implemented by using a Cube Coherent diode laser line at 405 nm operating with
adjustable output power from 1 to 40 mW. Details of methodology and instrumentation
used were described in section 2.3.2 of Chapter 1.
34
2.3.5 Wide field microscopy
The wide field fluorescence images were obtained by using an inverted IX71
microscope and an objective model UPlanFLN Olympus, with magnifying of 100X and
numerical aperture of 1.3 in oil. The laser Cobolt Blue operating at 473 nm with average
power of 50 mW was used as the light source. Details of methodology and
instrumentation were described in section 2.3.3 of Chapter 1.
2.3.6 Super-resolution microscopy by stimulated emission depletion
(STED)
The samples used in STED microscopy were prepared in aqueous solution and labelled
by the dye ATTO-647N-COOH (ATTO-TEC) at concentration of 1.10-5
mol.L-1
, under
stirring for 24 h. Subsequently, they were washed 5 times for 10 minutes with distilled
water at the temperature of 40 ºC and finally spin-coated (1500 rpm, 90 s) onto the
surface of cover slide of 22 x 22 mm.
STED super-resolution images were obtained in an inverted IX71‒Olympus
microscope, using a piezoelectric controller, E‒710.3CD‒PI, to perform the nanometric
scanning. A mode-locked Picoquant laser operating at 635 nm and 80 MHz of pulsed
frequency was used for sample excitation while depletion was provided by a laser line at
750 nm. The excitation and depletion beams were collimated by dichroic mirror before
focused by an immersed oil 100x objective of numerical aperture of 1.3 (UPLSAPO
100XO/PSF, Olympus). The fluorescence emission signal from the sample was
collected by the objective and separated from the laser line by using dichroic lenses
(FF01 -740- DI01 and FF662-FDi01, Semrock). Communication and interfacing
between the instruments were made by a software programming in C# developed in the
Laboratory for Photochemistry and Spectroscopy of KU Leuven.
35
3 RESULTS AND DISCUSSION
3.1 Characterization of Avicel® NCC by electron microscopy and X-
ray diffraction
Samples of NCC were obtained from micro-particles of cellulose Avicel®. The
hydrolysis of cellulose under controlled conditions generates nanocrystals, which are
composed of well-defined fibrils of cellulose chains, showing a hard linear arrangement.
Figure 13 shows scanning electron microscopy images of microcrystalline cellulose
Avicel®, which are small particles aggregated with irregular shape.
Figure 13. SEM images of Avicel® samples. Morphologic details of microcellulose
particles.
Figure 14 shows the transmission electron microscopy of NCC obtained by sulfuric acid
hydrolysis. The morphology of the particles is nearly flat and their average length is in
between 100 – 200 nm, while the distribution of their diameter is from 10 – 40 nm. This
special shape of NCC is due to the action of sulfuric acid in amorphous areas of the
cellulose, keeping the crystalline one practically undamaged.
36
Figure 14. TEM images of nanocrystalline cellulose, obtained from sulphuric acid
hydrolysis.
The properties related to morphology and structure of NCC may be determined by its
origin and extraction conditions 59
. Crystals of cellulose are generated from the
synthesis of different biomass species. The origin of the structure of cellulose
nanocrystals is associated to the formation of micro fibrils, during the deposit in layers
on the cellular walls. The number of micro fibrils sideway attached to each other
37
changes according to the specific cellular wall. Therefore, after the acidic hydrolysis
process, it is possible to obtain NCC with a range of particle sizes.
Figure 15 shows the X-ray diffractogram of Avicel® and NCC. Both of them have three
peaks related to the cellulose at 2θ – 14.7º; 16.4º e 22.6º 97
. The peak at 22.6° is sharper
after the hydrolysis process, representing a well-defined structure of the crystalline
lattice at plane (2 0 0). The determination of the index of crystallinity was obtained by
the method reported by Segal et al 98
, using the intensity of the crystalline and
amorphous values as comparison parameter. The crystallinity index for Avicel® and
NCC were 57% and 70%, respectively. The increase of the crystallinity index after the
hydrolysis is attributed to the removal of amorphous regions of the cellulosic matrix.
Figure 15. Diffratograms of Avicel® and NCC. The values of crystallinity index
calculated from method Segal et al were 57% to Avicel® and 70% to NCC.
38
3.2 Characterization of Avicel® NCC by wide field microscopy
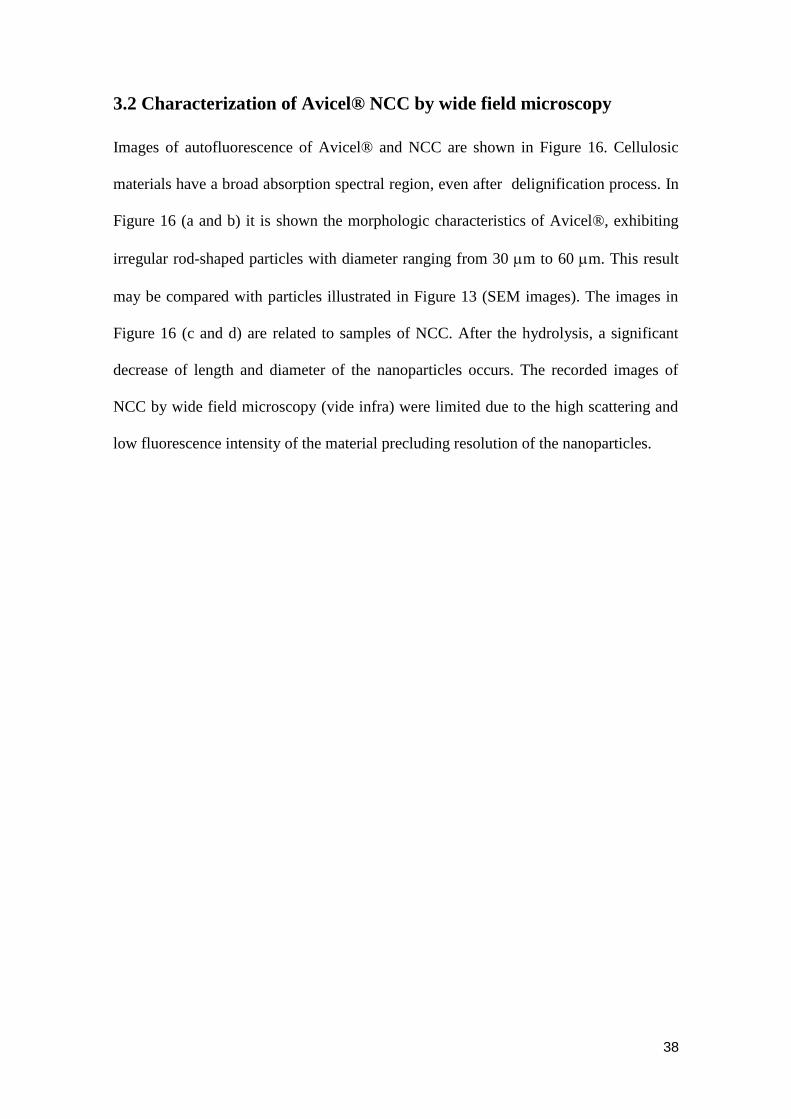
Images of autofluorescence of Avicel® and NCC are shown in Figure 16. Cellulosic
materials have a broad absorption spectral region, even after delignification process. In
Figure 16 (a and b) it is shown the morphologic characteristics of Avicel®, exhibiting
irregular rod-shaped particles with diameter ranging from 30 m to 60 m. This result
may be compared with particles illustrated in Figure 13 (SEM images). The images in
Figure 16 (c and d) are related to samples of NCC. After the hydrolysis, a significant
decrease of length and diameter of the nanoparticles occurs. The recorded images of
NCC by wide field microscopy (vide infra) were limited due to the high scattering and
low fluorescence intensity of the material precluding resolution of the nanoparticles.
39
Figure 16. WFM images of Avicel® (a and b) and NCC (c and d).
3.3 Characterization of Avicel® NCC by steady-state and time-
resolved fluorescence spectroscopy
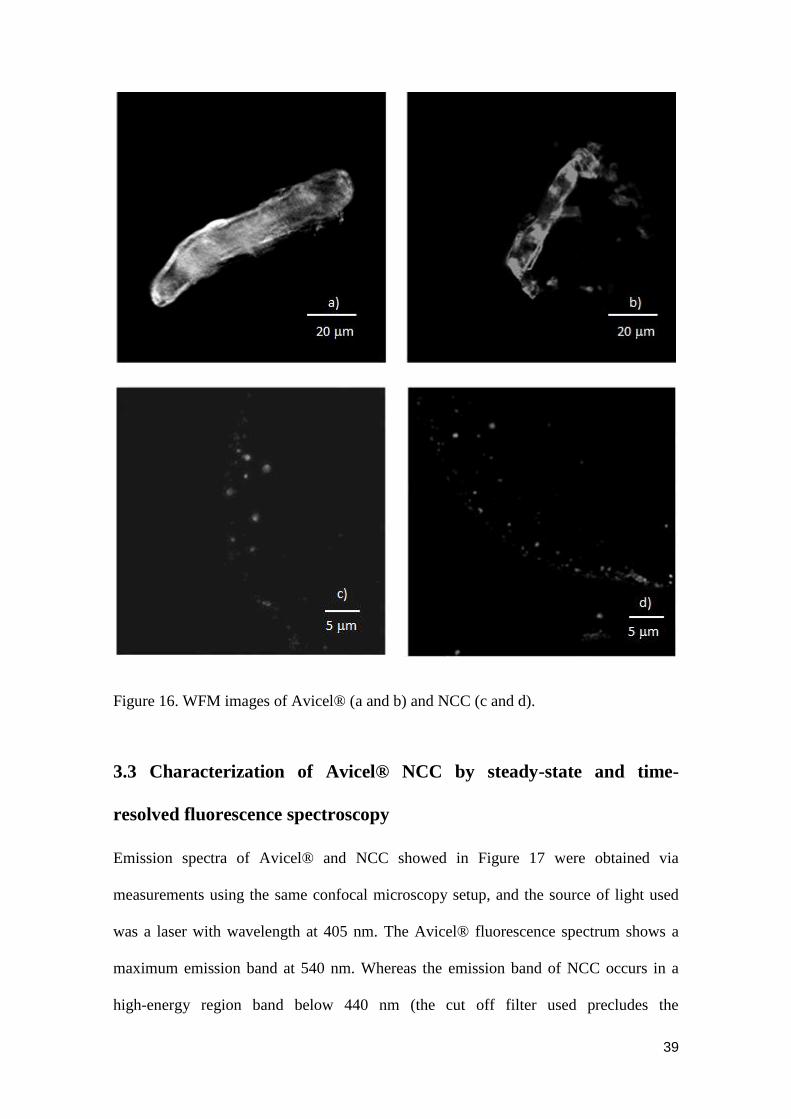
Emission spectra of Avicel® and NCC showed in Figure 17 were obtained via
measurements using the same confocal microscopy setup, and the source of light used
was a laser with wavelength at 405 nm. The Avicel® fluorescence spectrum shows a
maximum emission band at 540 nm. Whereas the emission band of NCC occurs in a
high-energy region band below 440 nm (the cut off filter used precludes the
40
determination of the emission maximum). Nevertheless, an emission blue shift after
hydrolysis process is achieved.
Figure 17. Fluorescence spectra of a) Avicel® and b) NCC obtained by excitation at
405 nm.
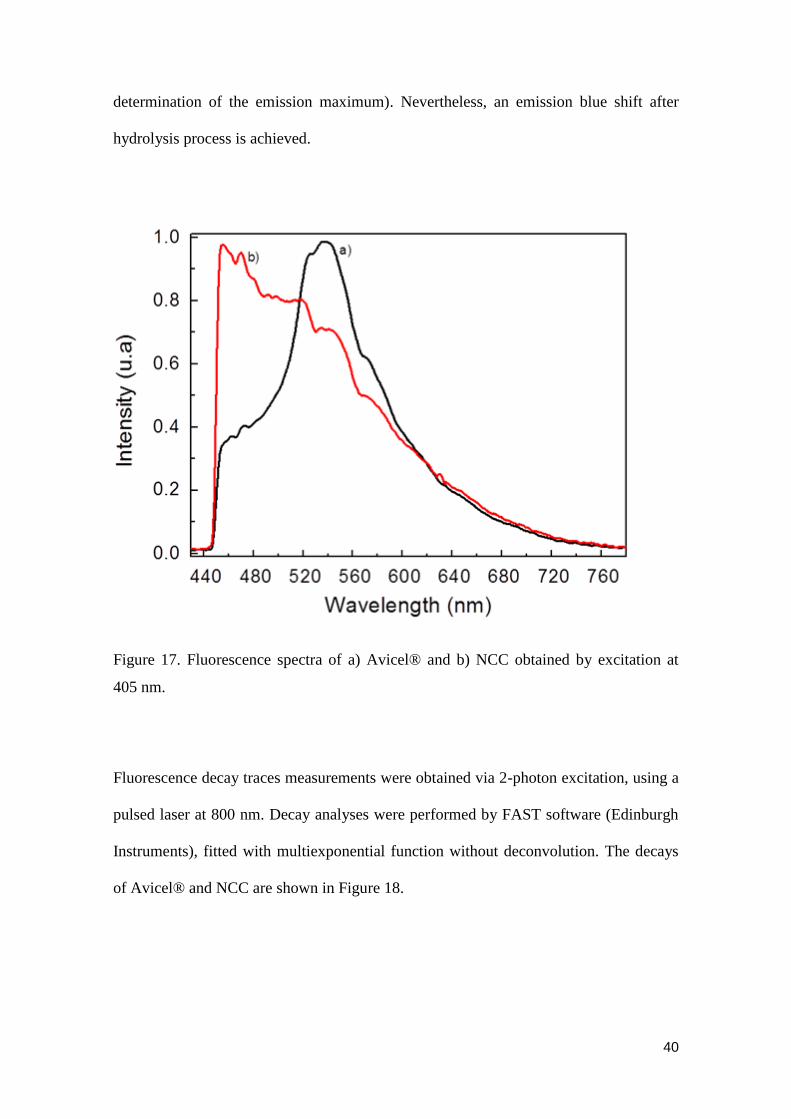
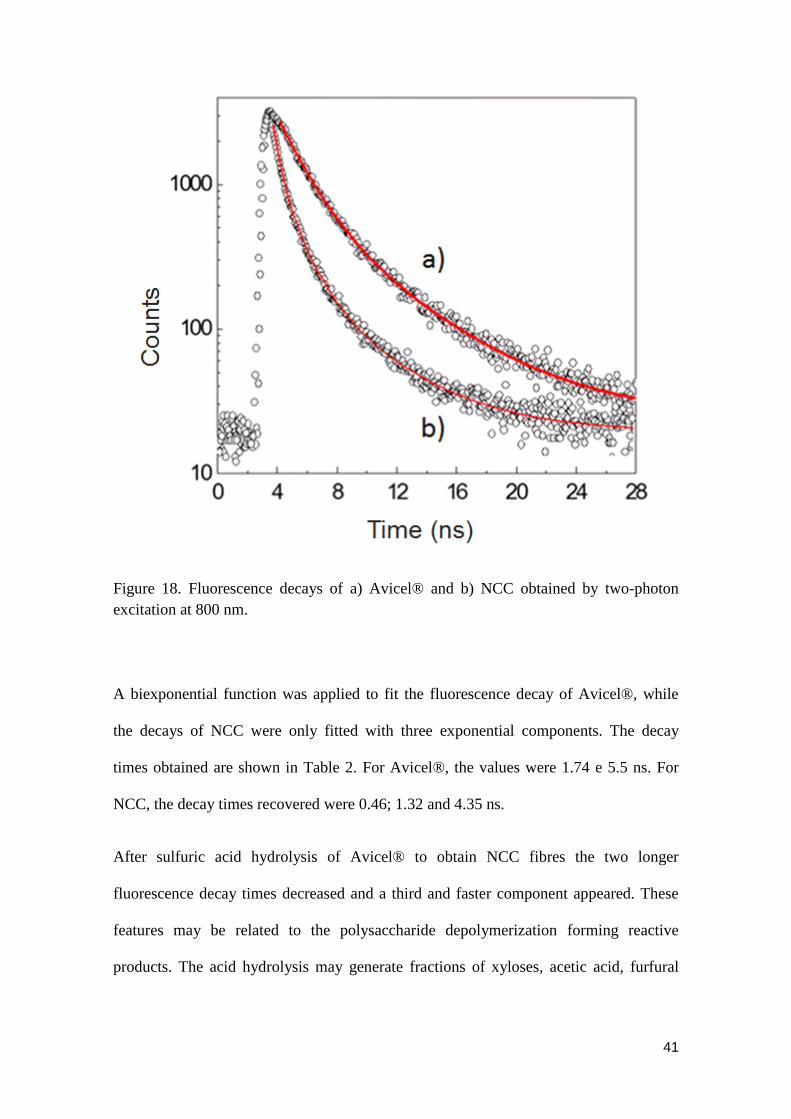
Fluorescence decay traces measurements were obtained via 2-photon excitation, using a
pulsed laser at 800 nm. Decay analyses were performed by FAST software (Edinburgh
Instruments), fitted with multiexponential function without deconvolution. The decays
of Avicel® and NCC are shown in Figure 18.
41
Figure 18. Fluorescence decays of a) Avicel® and b) NCC obtained by two-photon
excitation at 800 nm.
A biexponential function was applied to fit the fluorescence decay of Avicel®, while
the decays of NCC were only fitted with three exponential components. The decay
times obtained are shown in Table 2. For Avicel®, the values were 1.74 e 5.5 ns. For
NCC, the decay times recovered were 0.46; 1.32 and 4.35 ns.
After sulfuric acid hydrolysis of Avicel® to obtain NCC fibres the two longer
fluorescence decay times decreased and a third and faster component appeared. These
features may be related to the polysaccharide depolymerization forming reactive
products. The acid hydrolysis may generate fractions of xyloses, acetic acid, furfural
42
and hydroxymethylfurfural (HMF).99; 100
Some of these aldehydes can condensate,
producing oligomers with new fluorescence properties.
Table 2. Decay times and normalized amplitude related to Avicel® and NCC.
Sample 1
(ns) 2
(ns) 3
(ns) *a1 *a
2 *a
3
2
Avicel 1.7 5.5
0.75 0.25
3.7 1.07
NCC 0.5 1.3 4.3 0.54 0.37 0.09 2.1 1.07
* weighted average amplitude of lifetime
3.4 Dispersion of NCC in polymers
Factors as mechanical strength, high superficial area and optical properties make the
application of nanocrystalline cellulose in several materials a prominent area of
investigation. The use of nanocrystalline cellulose as a reinforcement in polymeric
matrices has been highlighted over the last years .7; 101; 102
In this scenario, fluorescence
microscopy techniques have been an useful tool for the study of parameters involved in
the production of nanocrystalline/polymeric composites. The images of wide field
microscopy of the composites produced from dispersion of NCC in
polyvinylpyrrolidone (PVP) in isopropanol solution and polyvinyl alcohol (PVA) in
water solution are shown in Figure 19.
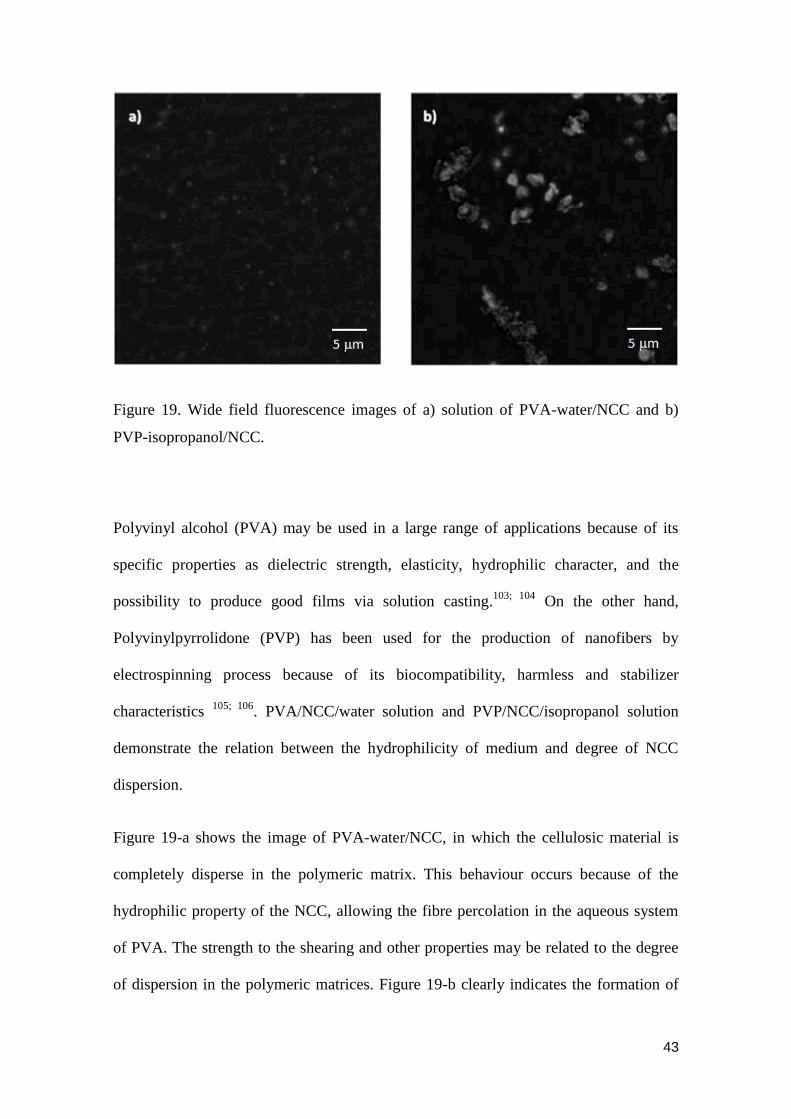
43
Figure 19. Wide field fluorescence images of a) solution of PVA-water/NCC and b)
PVP-isopropanol/NCC.
Polyvinyl alcohol (PVA) may be used in a large range of applications because of its
specific properties as dielectric strength, elasticity, hydrophilic character, and the
possibility to produce good films via solution casting.103; 104
On the other hand,
Polyvinylpyrrolidone (PVP) has been used for the production of nanofibers by
electrospinning process because of its biocompatibility, harmless and stabilizer
characteristics 105; 106
. PVA/NCC/water solution and PVP/NCC/isopropanol solution
demonstrate the relation between the hydrophilicity of medium and degree of NCC
dispersion.
Figure 19-a shows the image of PVA-water/NCC, in which the cellulosic material is
completely disperse in the polymeric matrix. This behaviour occurs because of the
hydrophilic property of the NCC, allowing the fibre percolation in the aqueous system
of PVA. The strength to the shearing and other properties may be related to the degree
of dispersion in the polymeric matrices. Figure 19-b clearly indicates the formation of
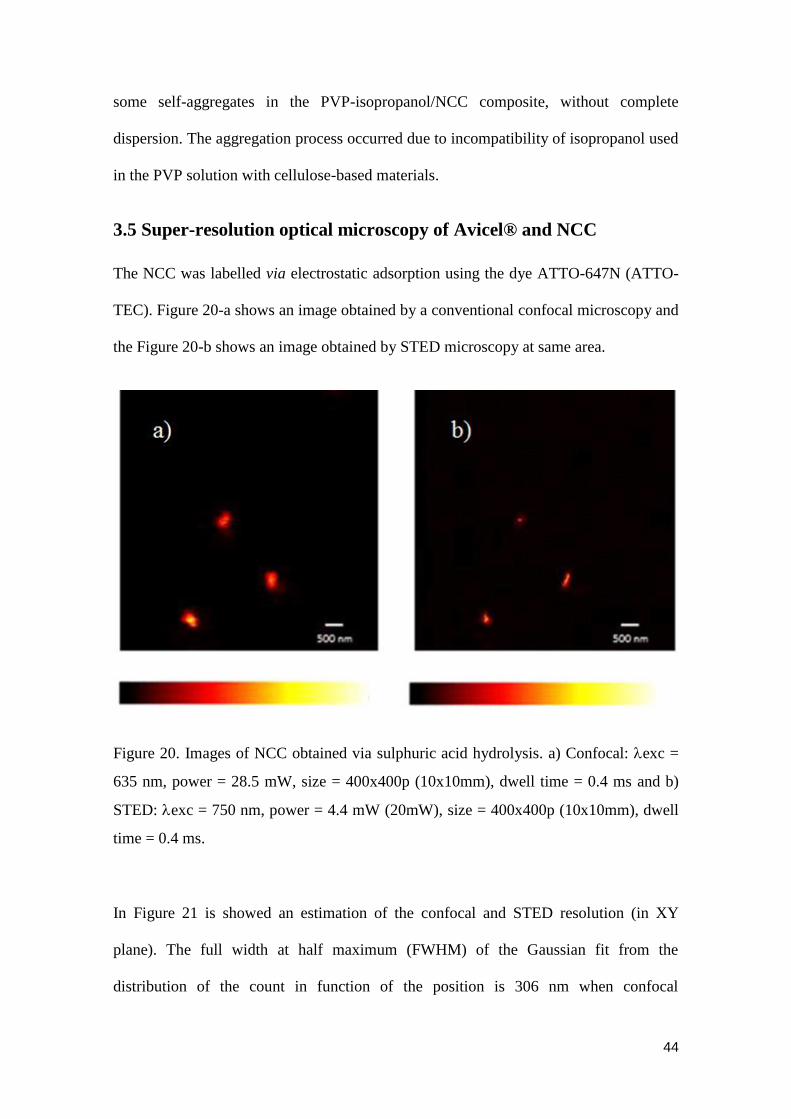
44
some self-aggregates in the PVP-isopropanol/NCC composite, without complete
dispersion. The aggregation process occurred due to incompatibility of isopropanol used
in the PVP solution with cellulose-based materials.
3.5 Super-resolution optical microscopy of Avicel® and NCC
The NCC was labelled via electrostatic adsorption using the dye ATTO-647N (ATTO-
TEC). Figure 20-a shows an image obtained by a conventional confocal microscopy and
the Figure 20-b shows an image obtained by STED microscopy at same area.
Figure 20. Images of NCC obtained via sulphuric acid hydrolysis. a) Confocal: exc =
635 nm, power = 28.5 mW, size = 400x400p (10x10mm), dwell time = 0.4 ms and b)
STED: exc = 750 nm, power = 4.4 mW (20mW), size = 400x400p (10x10mm), dwell
time = 0.4 ms.
In Figure 21 is showed an estimation of the confocal and STED resolution (in XY
plane). The full width at half maximum (FWHM) of the Gaussian fit from the
distribution of the count in function of the position is 306 nm when confocal
45
microscopy is used. The corresponding value determined by STED microscopy fitted by
Lorentzian distribution is 50 nm, 6 times smaller than confocal microscopy result.
Figure 21. a) Confocal and b) STED microscopy images and the respective profile of
the spot pointed from the yellow arrow.
The knowledge about morphological, structural and chemical composition through
fluorescence images with resolution below the diffraction limit represents a major step
in understanding how different processes relate to cellulose processing. Different
publications have reached STED images with resolution in the range of 30–80 nm.93; 107;
108 The images acquired in our work, by STED microscopy show that the super-
resolution microscopy provides images with more details, overcoming the diffraction
limit, with resolution of about 50 nm.
46
4 CONCLUSIONS
Regarding the study of samples of nanocrystalline cellulose, using conventional
techniques, such as, electron microscopy (SEM and TEM), fluorescence microscopy
(wide field and confocal), and stationary fluorescence spectroscopy were carried out and
allowed the obtaining of important information about the NCC. The material maintained
its fluorescent properties after the hydrolysis process. Due to acid attack, new
fluorophores were generated and adsorbed onto the NCC surface, therefore, generating
a third decay component. Fluorescence microscopy techniques also have shown to be
useful for the evaluation of nanocrystalline cellulose dispersion in polymeric matrices.
Hydrophilicity of the polymer solution, in which the NCC is immersed, influences its
degree of dispersion and can be detected by wide field microscopy.
47
CHAPTER 3
FLUORESCENT LABELLING OF
NANOCRYSTALLINE CELLULOSE
48
ABSTRACT
The use of NCC as a reinforcement agent in polymer composites has been successfully
applied in the improving of resilience and toughness. Thus, the obtained material offers
a distinctive combination of desirable physical properties with environmental benefits.
The attaching of fluorescent molecules to the cellulose backbone is one of the most
useful ways to study properties of NCC. Several studies have been performed to
chemically modify the surface of nanocrystalline cellulose. In that context, click
chemistry reactions have been applied to the fluorophore coupling at the functionalized
surface. However, further studies to characterize dynamic properties of NCC in
polymeric solutions are necessary. In this chapter, the results about NCC covalently
labelled by click chemistry reaction using the dye ATTO-532-alkyne are discussed. The
diffusion coefficient of NCC in water was determined at single molecule level by
fluorescence correlation spectroscopy (FCS) method. Additionally, NCC was also
placed into different concentrations of polyethyleneglycol (PEG) solutions, containing
varied polymer amounts. The properties of the aqueous suspension of NCC and the
polymeric solutions based on NCC/PEG/water, NCC/PEG/methanol and
NCC/PEG/acetonitrile were evaluated using FCS and WFM techniques. Because of H-
bonding interaction between PEG and OH groups on the NCC surface, the diffusion of
NCC fibre in polymeric solution became slower upon addition of PEG, independently
of the solvent used, obstructing the free diffusion of the particle.
49
1 INTRODUCTION
Nanocrystalline cellulose shows properties related to non-toxicity, biocompatibility,
biodegradability and robust physical properties, such as, large surface area and
mechanical strength. The possibility of surface modification expands even more the
usefulness of NCC in many products.109; 110
Due to a large quantity of hydroxyl groups on the surface of NCC, different chemical
modifications have been attempted, including esterification, etherification, oxidation,
silylation, polymer grafting, etc.111; 112; 113
All functionalization methodologies have
been mainly conducted aiming at introducing negative or positive charges on the surface
of NCC. The main challenge for the chemical functionalization of NCC is performing
the modification only onto the surface, so that the original morphology is preserved, any
polymorphic conversion is avoided, and the integrity of the crystal is mantained.112; 114
The chemical modification of NCC has been extensively studied pointing toward the
improviment of the compatibility with hydrophobic polymer matrices to afford
nanocomposites with unique mechanical properties.1; 115; 116
Figure 22 shows different
chemical processes that can be used to modify the NCC surface.
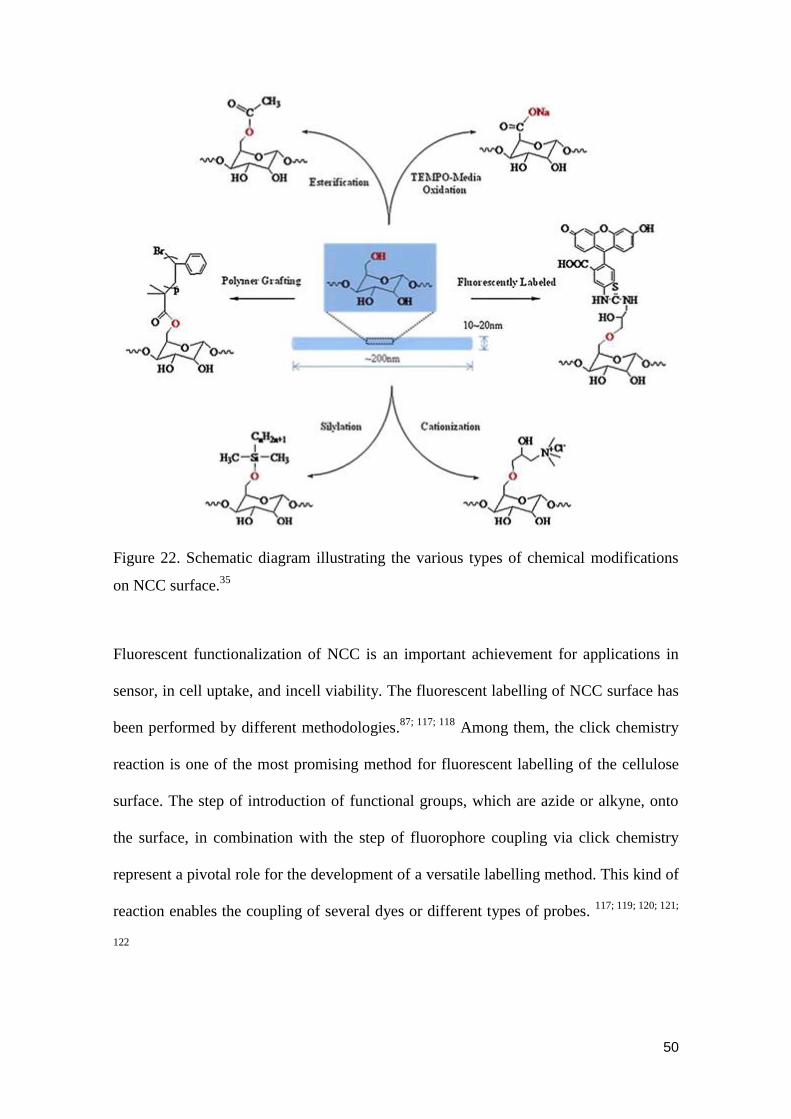
50
Figure 22. Schematic diagram illustrating the various types of chemical modifications
on NCC surface.35
Fluorescent functionalization of NCC is an important achievement for applications in
sensor, in cell uptake, and incell viability. The fluorescent labelling of NCC surface has
been performed by different methodologies.87; 117; 118
Among them, the click chemistry
reaction is one of the most promising method for fluorescent labelling of the cellulose
surface. The step of introduction of functional groups, which are azide or alkyne, onto
the surface, in combination with the step of fluorophore coupling via click chemistry
represent a pivotal role for the development of a versatile labelling method. This kind of
reaction enables the coupling of several dyes or different types of probes. 117; 119; 120; 121;
122
51
By definition, click chemistry reactions are characterized by high yield, fast reaction,
selectivity, and inoffensive by-products.123; 124
The azide alkyne cycloaddition using a
copper catalyst at room temperature is a typical example of click chemistry reaction.123
Labelling polymer with different classes of dyes, which are related to specific functions
or diverse colours, is of great interest for biological application, for instance,
multimodality molecular imaging 125; 126
or for studies of electronic energy transfer 127
.
The objective of the research described in this chapter was the fluorescent labelling of
NCC and the investigation of diffusion properties. For the labelling process, firstly,
azide groups were attached onto the backbone of nanocrystalline cellulose, acting in
aqueous reaction media, by the subsequent coupling of ATTO-532-alkyne by copper-
catalysed azyde-alkyne cycloaddition (CuAAC).
Fluorescence correlation spectroscopy (FCS) is a single-molecule technique applied to
determine local concentrations, mobility coefficients or characteristic rate constants of
inter or intramolecular reactions of fluorescently labeled biomolecules in nanomolar
concentrations.128; 129
FCS measures and correlates fluctuations in fluorescence intensity
within a very small detection volume. These fluctuations are obtained from diffusion of
fluorescent molecules into or out of a confocal volume defined by a focused laser.
These signal fluctuations may be analysed by correlation functions.128; 130; 131; 132; 133
The diffusion properties were determined from autocorrelation curves obtained via FCS
measurements. The nanocrystalline cellulose was dispersed in different concentrations
of polyethylene glycol (PEG) in water, methanol and acetonitrile. All those systems
were investigated by single molecule techniques FCS and WFM/TIRF measurements.
52
2 EXPERIMENTAL
2.1 Obtaining NCC
NCC was obtained from sulfuric acid hydrolysis of Avicel® according to the process
described in Section 2.1 of Chapter 2.
2.2 Preparation of 1-azide-2,3-epoxypropane
Epichlorohydrin was the compound responsible to start the synthesis of 1-azido-2,3-
epoxypropane. The ring-opening reaction of the epoxide with azide-ion was performed
according to a modified method of Fringuelli 134
and Pahimanolis 135
. The first step was
the mix of isopropanol (10.9 mL) and acetic acid (0.72 mL, 12.58 mmol) with a solution
of NaN3 (0.8177 g, 12.58 mmol) in 7.40 mL of water. Epichlorohydrin (0.66 mL, 8.42
mmol) was then added under stirring and the reaction was continued at 30 ºC for 24 h,
under light protection. Subsequently, a water solution of NaNO2 (11.5 mL, 41.6 mmol)
was added, followed by the dropwise addition of HNO3 (0.576 mL, 8.38 mmol) for the
elimination of any excess of azide-ions. The obtained solution of 1-azide-3-
chloropropanol was stored in dark at room temperature and used without further
purification.
The conversion of 1-azide-3-chloropropanol to 1-azido-2,3-epoxypropane was possible
due to the addition of 26.3 mL of 5 M NaOH to the pre-prepared solution of 1-azido-3-
chloropropane. The reaction was kept under stirring for 30 min. The obtained solution
was immediately used for the azide-functionalization of NCC.
53
2.3 Introducing azide groups to the surface of NCC
The azide functionalization of NCC was performed following a slightly modified
method reported by Pahimanolis and co-authors 135
. 11.0 mL of 5 M NaOH solution
was added to a water suspension of never dried nanocrystalline cellulose (1,000 g, 16.6
g of solid content) and the mixture was stirred for 60 min at 30 ºC. The fresh prepared
solution of 1-azido-2,3-epoxypropane (197 mL, 84.2 mmol) was then added and the
reaction was continued for 24 h at 30 ºC (pH = 12). The suspension was then purified
with deionized water by several centrifugation (16.000 rpm for 20 min, at 10 ºC) and re-
dispersion steps until the pH of the suspension became neutral. The azide functionalized
NCC was stored under light protection at 4ºC temperature for further use.
2.4 Fluorescent labelling of azide functionalized NCC with ATTO-532-
alkyne dye
1 mg of ATTO-532-alkyne was dissolved in DMSO at a final concentration of 20 mM.
For the fluorescent labelling of azido-NCC, 10 L of 20 mM ATTO-532-alkyne were
added to the suspension containing the azido-NCC. Afterwards, a freshly prepared
aqueous solution of CuSO4.5H2O (0.017 g, 0.068 mmol) and of ascorbic acid (AAc)
(0.030 g, 0.17 mmol) were added. The system was incubated at room temperature for 1
h in dark. Subsequently, an EDTA solution at a concentration 10 fold higher than the
CuSO4 concentration was added to the complexation of the copper ions in excess.
2.5 FCS measurements
The fluorescence correlation spectroscopy (FCS) measurements were carried out in a
classical confocal microscope Olympus IX71 setup (Figure 3, Chapter 1). A laser beam
(Verdi ‒ 10 mW) was employed as excitation source at 532 nm. A beam expander was
placed to overfill the back aperture of the microscope. An oil immersion objective
54
(100x), with numerical aperture of 1.3 was used to focus the laser beam into the sample.
The emission from the fluorophores was collected by the same objective, and passed by
a dichroic mirror, pinhole (50 m) and notch filter before reach onto the single photon
counting avalanche photodiode (Perkin Elmer, SPCM-AQR-14). The correlator Flex99-
12C was used to generate a real time autocorrelation data from the fluorescence signal.
The calibration of the confocal volume were determined using rhodamine 6G as
standard.136
All the measurements were performed at room temperature.
The spontaneous fluctuations in the fluorescence intensity during the measuring time
F(t) of three minutes were detected. The fluctuations are caused by different
mechanisms, occurring at single molecule level. From autocorrelation curve is possible
to obtain information about fluorophore concentration, translational motion, properties
about dark time of the triplet state and its respective population. The autocorrelation
function G(t) represents the probability to register later fluorescence signals from the
first emitted signal.
𝐺(𝜏) =⟨𝛿𝐹(𝑡) · 𝛿𝐹(𝑡 + 𝜏)⟩
⟨𝐹(𝑡)⟩2
Equation 2
Where δF(t) = F(t) ‒ ⟨F(t)⟩ and ⟨ ⟩ indicates the time average.
For the determination of diffusion coefficient from autocorrelation curve, it is necessary
to define the mean residence time of a fluorophore in the confocal volume. By using a
standard fluorophore, with a well-known diffusion coefficient, it is possible to
determine the confocal volume size. Knowing the shape of the confocal volume, the
diffusion coefficients of different species may be determined. The main responsible by
the fluorescence fluctuations during a measuring time is the translational motion of
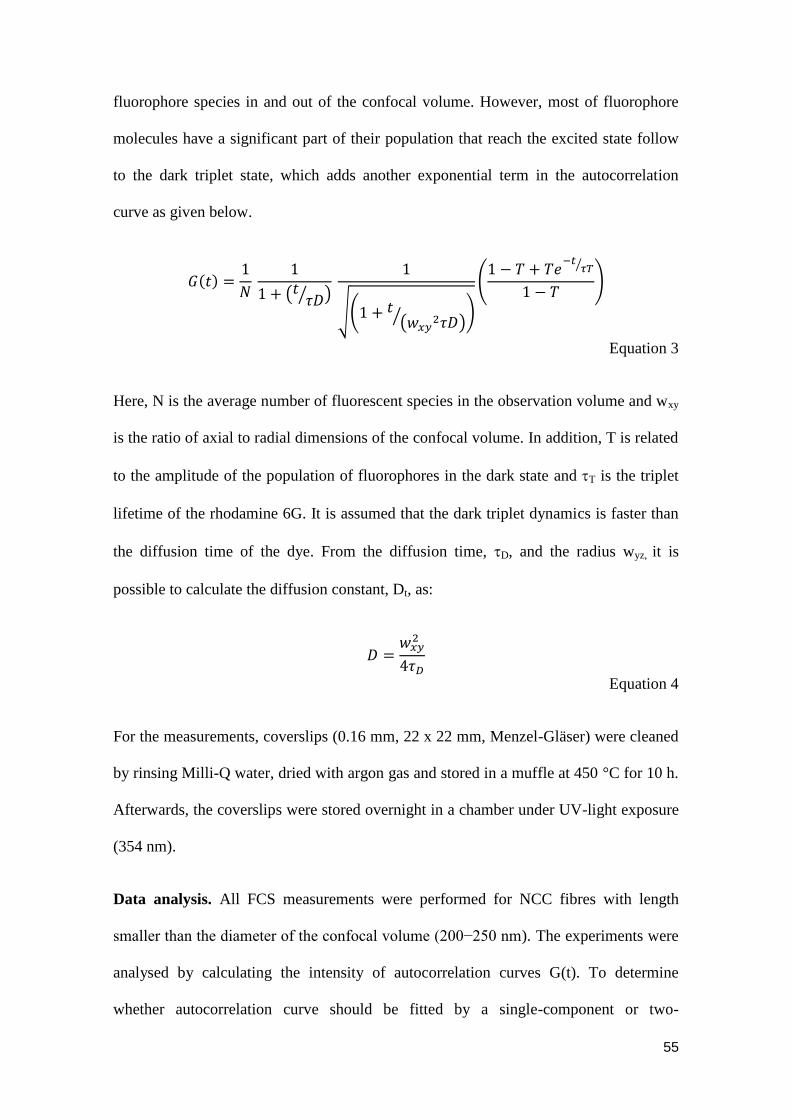
55
fluorophore species in and out of the confocal volume. However, most of fluorophore
molecules have a significant part of their population that reach the excited state follow
to the dark triplet state, which adds another exponential term in the autocorrelation
curve as given below.
𝐺(𝑡) =1
𝑁
1
1 + (𝑡𝜏𝐷⁄ )
1
√(1 + 𝑡(𝑤𝑥𝑦
2𝜏𝐷)⁄ )
(1 − 𝑇 + 𝑇𝑒
−𝑡𝜏𝑇⁄
1 − 𝑇)
Equation 3
Here, N is the average number of fluorescent species in the observation volume and wxy
is the ratio of axial to radial dimensions of the confocal volume. In addition, T is related
to the amplitude of the population of fluorophores in the dark state and T is the triplet
lifetime of the rhodamine 6G. It is assumed that the dark triplet dynamics is faster than
the diffusion time of the dye. From the diffusion time, D, and the radius wyz, it is
possible to calculate the diffusion constant, Dt, as:
𝐷 =𝑤𝑥𝑦
2
4𝜏𝐷
Equation 4
For the measurements, coverslips (0.16 mm, 22 x 22 mm, Menzel-Gläser) were cleaned
by rinsing Milli-Q water, dried with argon gas and stored in a muffle at 450 °C for 10 h.
Afterwards, the coverslips were stored overnight in a chamber under UV-light exposure
(354 nm).
Data analysis. All FCS measurements were performed for NCC fibres with length
smaller than the diameter of the confocal volume (200−250 nm). The experiments were
analysed by calculating the intensity of autocorrelation curves G(t). To determine
whether autocorrelation curve should be fitted by a single-component or two-
56
component, a statistical F-test was performed.132
The diffusion coefficients were
evaluated from the average value of three or four measurements. Standard deviations
were used as indicator of the data error.
2.6 Wide Field Measurements
The fluorescence wide field images were obtained by using an inverted IX71
microscope and an objective model UPlanFLN Olympus, with magnifying of 100X and
numerical aperture of 1.3 in oil. The laser Cobolt Blues at 473 nm with average power
of 50 mW was used as the light source. Details of methodology and instrumentation
were already described in section 2.3.3 of Chapter 1.
Data analysis. Wide field single particle tracking was performed on wide field images
using a home-written routine in IGOR®. The position of the molecules was determined
with 2D Gaussian fitting of the fluorescence spots. An integration time of 38 ms per
frame, (26 Hz) was used for all reported WFM experiments. Each movie used a total
number of 1000 frames. The step length distributions for different time lags were
obtained by calculating the step length distribution for each single-molecule, summation
of all these normalized single-molecule distributions and its division by the number of
observed spots. This procedure evenly weighted small and long tracks. The step length
distributions were fitted by the equation 5:
𝑃(𝑟, 𝑡𝑙𝑎𝑔) = ∑2
4𝐷𝑖𝑡𝑙𝑎𝑔· 𝑟
𝑖
· 𝑒𝑥𝑝 (−𝑟2
4𝐷𝑖𝑡𝑙𝑎𝑔)
Equation 5
57
According to literature, from the analysis of these distributions it is possible to plot the
mean square displacement (MSD) versus different time lags tlag.137; 138
The MSD was
obtained by using the equation 6.
𝑀𝑆𝐷(∆𝑡) = ⟨(𝑥𝑖+𝑛 − 𝑥𝑖)2 + (𝑦𝑖+𝑛)2⟩ Equation 6
Where xi and yi are the positions of the molecule in the image frame i (i = 1, 2, 3…)
determined by the 2D Gaussian fitting, and n denotes the frame number with time lapse
Δt from frame i. For calculation of the diffusion coefficient D for a 2D trajectory, the
MSD was calculated by averaging over independent pairs. Then, MSD(Δt) = 4DΔt. The
diffusion coefficient D was determined by the first set of data point in the MSD plot
(i.e. initial slope only).
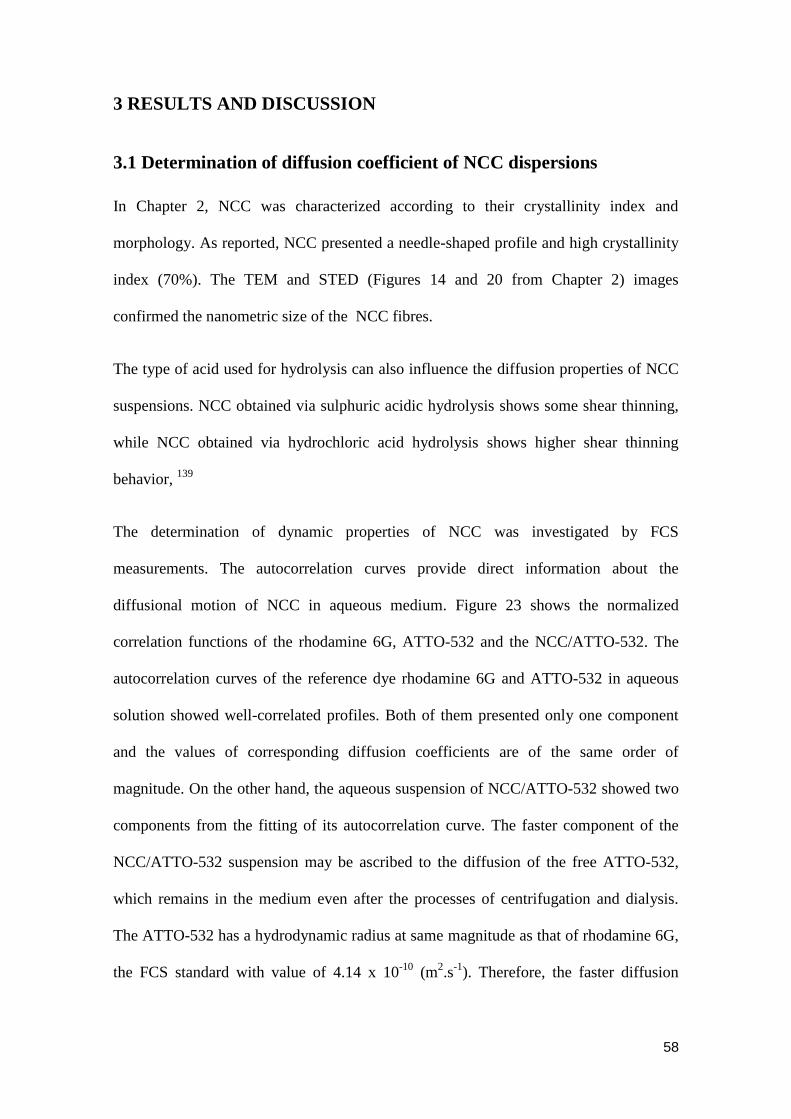
58
3 RESULTS AND DISCUSSION
3.1 Determination of diffusion coefficient of NCC dispersions
In Chapter 2, NCC was characterized according to their crystallinity index and
morphology. As reported, NCC presented a needle-shaped profile and high crystallinity
index (70%). The TEM and STED (Figures 14 and 20 from Chapter 2) images
confirmed the nanometric size of the NCC fibres.
The type of acid used for hydrolysis can also influence the diffusion properties of NCC
suspensions. NCC obtained via sulphuric acidic hydrolysis shows some shear thinning,
while NCC obtained via hydrochloric acid hydrolysis shows higher shear thinning
behavior, 139
The determination of dynamic properties of NCC was investigated by FCS
measurements. The autocorrelation curves provide direct information about the
diffusional motion of NCC in aqueous medium. Figure 23 shows the normalized
correlation functions of the rhodamine 6G, ATTO-532 and the NCC/ATTO-532. The
autocorrelation curves of the reference dye rhodamine 6G and ATTO-532 in aqueous
solution showed well-correlated profiles. Both of them presented only one component
and the values of corresponding diffusion coefficients are of the same order of
magnitude. On the other hand, the aqueous suspension of NCC/ATTO-532 showed two
components from the fitting of its autocorrelation curve. The faster component of the
NCC/ATTO-532 suspension may be ascribed to the diffusion of the free ATTO-532,
which remains in the medium even after the processes of centrifugation and dialysis.
The ATTO-532 has a hydrodynamic radius at same magnitude as that of rhodamine 6G,
the FCS standard with value of 4.14 x 10⁻¹⁰
(m2.s
-1). Therefore, the faster diffusion
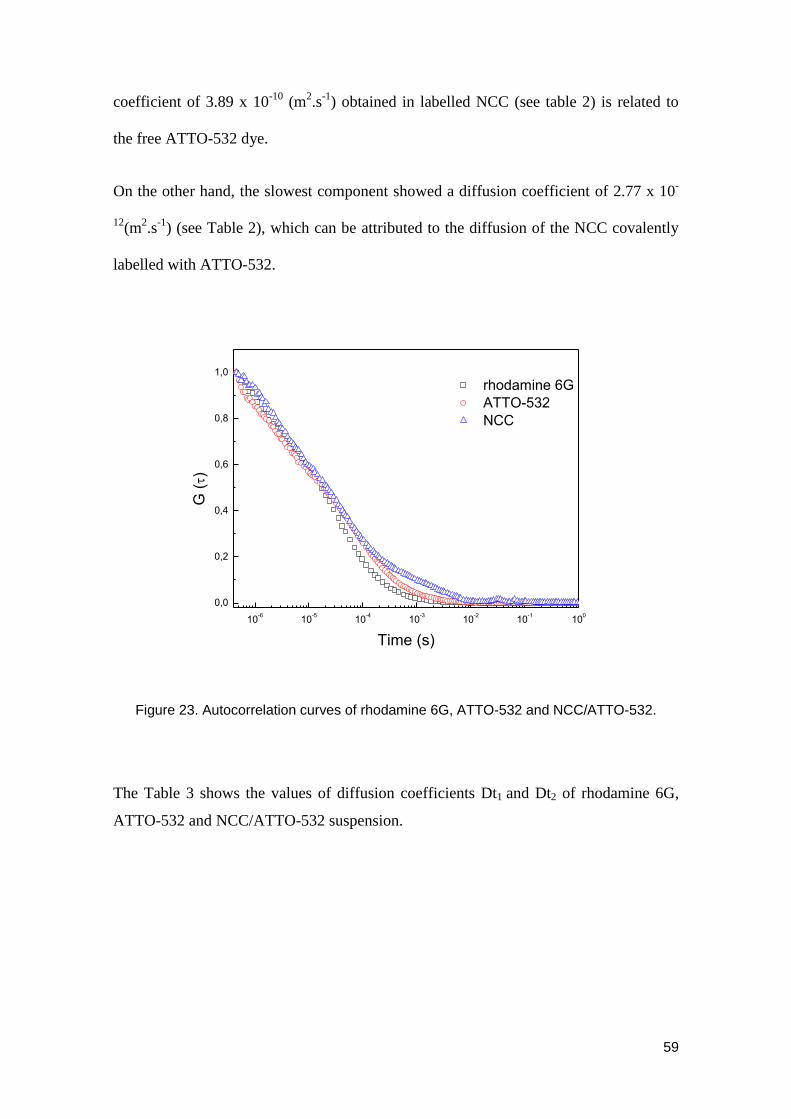
59
coefficient of 3.89 x 10⁻¹⁰
(m2.s
-1) obtained in labelled NCC (see table 2) is related to
the free ATTO-532 dye.
On the other hand, the slowest component showed a diffusion coefficient of 2.77 x 10-
12(m
2.s
-1) (see Table 2), which can be attributed to the diffusion of the NCC covalently
labelled with ATTO-532.
10-6
10-5
10-4
10-3
10-2
10-1
100
0,0
0,2
0,4
0,6
0,8
1,0
rhodamine 6G
ATTO-532
NCC
G ()
Time (s)
Figure 23. Autocorrelation curves of rhodamine 6G, ATTO-532 and NCC/ATTO-532.
The Table 3 shows the values of diffusion coefficients Dt1 and Dt2 of rhodamine 6G,
ATTO-532 and NCC/ATTO-532 suspension.
60
Table 3. Diffusion coefficients Dt1 and Dt2 of rhodamine 6G, ATTO-532 and NCC.
Sample Dt1 x 10-10
(m2.s
-1) Dt2 x 10
-12 (m
2.s
-1)
rhodamine 6G 4.14
ATTO-532 3.89
NCC suspension 3.40 2.77
It is possible to determine the diffusion coefficient from the translational motion of a
particle in a given solution. The Stokes-Einstein equation is used when the particle is
spherical.140; 141
𝐷 =𝑘𝐵𝑇
6𝜋𝜂𝑟ℎ
Equation 7
Where η is the viscosity of the solvent, kB is the Boltzmann constant, T the temperature
in Kelvin and rh is the hydrodynamic radius.
However, the shape of nanocrystalline cellulose (NCC) is considered a prolate. Figure
24 illustrates a prolate particle shape.142
Figure 24. Prolate particle shape, in which b is the semi-minor axis of the structural unit
and a is the semi-major axis of the structural unit.
In this case, the Stokes-Einstein equation is modified with the inclusion of the
parameter fs, which is related to the shape of the structural unit. Moreover, the
61
hydrodynamic radius rh is replaced by the semi-minor axis of the prolate structure, b.143;
144
𝐷 =𝑘𝐵𝑇𝑓𝑠
6𝜋𝜂𝑏
Equation 8
The shape factor related to the prolate structure is expressed by the following
equation.145
𝑓𝑠 = ln(𝜌 + √𝜌2 − 1)
𝜌2 − 1
Equation 9
From eqs. 7 and 8, the ratio of the diffusion coeficients of the dye Atto 532 and NCC
particle can be expressed as:
𝐷𝐴𝑇𝑇𝑂532
𝐷𝑁𝐶𝐶=
𝑘𝐵𝑇
6𝜋𝜂𝑟𝐴𝑇𝑇𝑂532.
6𝜋𝜂𝑏
𝑘𝐵𝑇𝑓𝑠
𝐷𝐴𝑇𝑇𝑂532
𝐷𝑁𝐶𝐶=
𝑏
𝑓𝑠𝑟𝐴𝑇𝑇𝑂532
Equation 10
The values of DATTO532 and DNCC, previously evaluated by FCS, were 3.40 x10⁻¹⁰
(m2.s
-
1) and 2.77 x 10
-12 (m
2.s
-1), respectively. The hydrodynamic radius of the dye
ATTO532obtained from the autocorrelation curve was 4.9 x10⁻¹⁰
m. Assuming the eq.
9, the value of the parameter fs corresponds to 0.46 when ρ2
>> 1, a condition
appropriate for NCC particles. When these values are replaced into the eq. 10, we
obtain the value of b, which represents the semi-minor axis of a typical NCC fibre.
3.40 × 10⁻¹⁰
2.77 × 10−12=
𝑏
0.46 × 4.9 × 10−10
𝑏 = 28 × 10−9 𝑚 = 28 𝑛𝑚 Equation 11
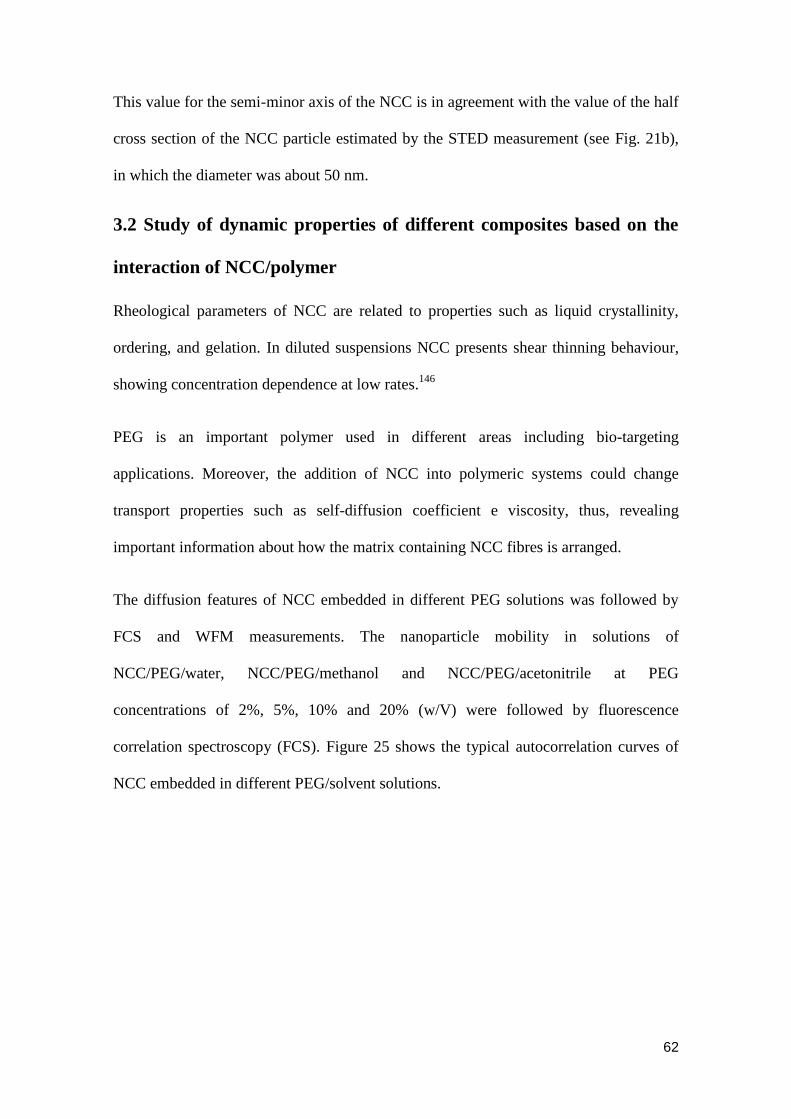
62
This value for the semi-minor axis of the NCC is in agreement with the value of the half
cross section of the NCC particle estimated by the STED measurement (see Fig. 21b),
in which the diameter was about 50 nm.
3.2 Study of dynamic properties of different composites based on the
interaction of NCC/polymer
Rheological parameters of NCC are related to properties such as liquid crystallinity,
ordering, and gelation. In diluted suspensions NCC presents shear thinning behaviour,
showing concentration dependence at low rates.146
PEG is an important polymer used in different areas including bio-targeting
applications. Moreover, the addition of NCC into polymeric systems could change
transport properties such as self-diffusion coefficient e viscosity, thus, revealing
important information about how the matrix containing NCC fibres is arranged.
The diffusion features of NCC embedded in different PEG solutions was followed by
FCS and WFM measurements. The nanoparticle mobility in solutions of
NCC/PEG/water, NCC/PEG/methanol and NCC/PEG/acetonitrile at PEG
concentrations of 2%, 5%, 10% and 20% (w/V) were followed by fluorescence
correlation spectroscopy (FCS). Figure 25 shows the typical autocorrelation curves of
NCC embedded in different PEG/solvent solutions.
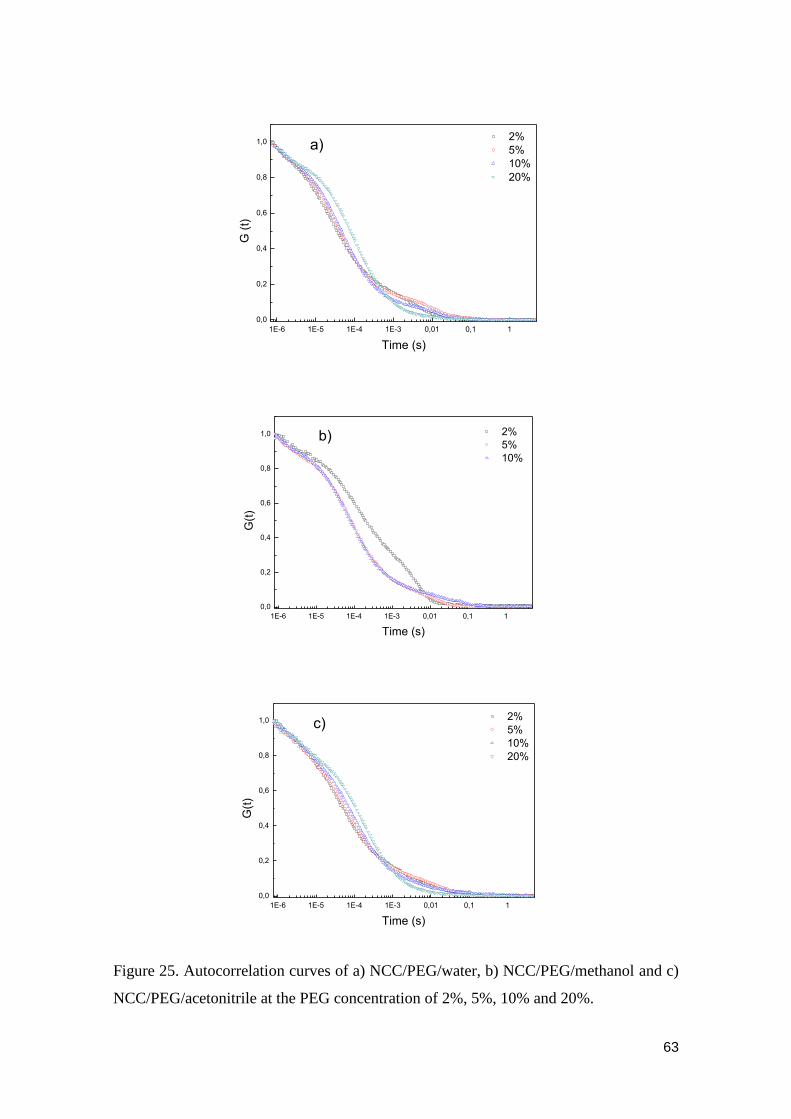
63
1E-6 1E-5 1E-4 1E-3 0,01 0,1 1
0,0
0,2
0,4
0,6
0,8
1,0
2%
5%
10%
20%
G (
t)
Time (s)
a)
1E-6 1E-5 1E-4 1E-3 0,01 0,1 1
0,0
0,2
0,4
0,6
0,8
1,0 b)
2%
5%
10%
G(t
)
Time (s)
1E-6 1E-5 1E-4 1E-3 0,01 0,1 1
0,0
0,2
0,4
0,6
0,8
1,0 c)
2%
5%
10%
20%
G(t
)
Time (s)
Figure 25. Autocorrelation curves of a) NCC/PEG/water, b) NCC/PEG/methanol and c)
NCC/PEG/acetonitrile at the PEG concentration of 2%, 5%, 10% and 20%.
64
All polymer solutions showed a shift in autocorrelation curves upon increasing the
amount of PEG, which represents a decrease of the diffusion of NCC/ATTO-532 and
free ATTO-532, regardless of the solvent used. From the autocorrelation curves is also
possible to extract the contribution of each diffusion component. Figure 26 shows the
changes of the fraction and diffusion coefficient of the NCC/ ATTO-532 and free
ATTO-532 in function of PEG content. The fraction of the NCC and ATTO-532
components are respectively 0.517 and 0.483. The increase of PEG concentration
reduces the contribution attributed to NCC diffusion and, consequently, amplifies the
fraction of ATTO-532 in the diffusion. This behaviour may be ascribed to the decrease
in Dt of NCC to slower values, indicating that mobility of the fibre is hinder by the PEG
long-range interactions.
65
0 5 10 15 20
0,0
0,1
0,2
0,3
0,4
0,5
0,6
PEG (%)
Fra
ctio
n
0
1
2
3
4
5
6
Fraction
Diffusion coefficiente (Dt)
Dt x
10
-12 (m
2.s-1)
a)
0 5 10 15 20
0,4
0,5
0,6
0,7
0,8
0,9
1,0
Fraction
Diffusion coefficiente (Dt)
PEG (%)
Fra
ctio
n
0,5
1,0
1,5
2,0
2,5
3,0
3,5
4,0b)
Dt x
10
-10 (m
2.s-1)
Figure 26. a) NCC fraction and diffusion coefficient (Dt) in function of PEG content. b)
ATTO-532 fraction and diffusion coefficient (Dt) in function of PEG content.
The monitoring of dynamic properties of NCC/PEG/water, NCC/PEG/methanol and
NCC/PEG/acetonitrile at the PEG concentration of 50% and 70% was performed by
WFM measurements. Diffusion coefficients of single particle were determined by step
length analysis, and the distributions plotted and fitted by log-Gaussian functions with
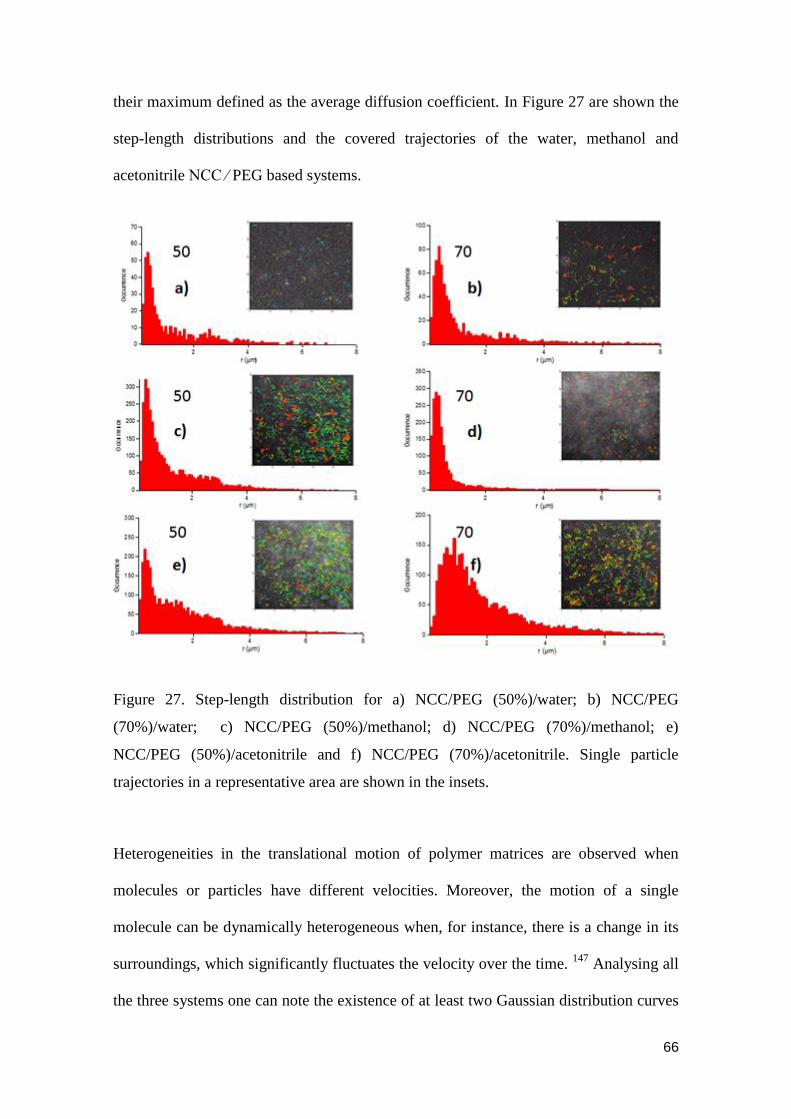
66
their maximum defined as the average diffusion coefficient. In Figure 27 are shown the
step-length distributions and the covered trajectories of the water, methanol and
acetonitrile NCC ⁄ PEG based systems.
Figure 27. Step-length distribution for a) NCC/PEG (50%)/water; b) NCC/PEG
(70%)/water; c) NCC/PEG (50%)/methanol; d) NCC/PEG (70%)/methanol; e)
NCC/PEG (50%)/acetonitrile and f) NCC/PEG (70%)/acetonitrile. Single particle
trajectories in a representative area are shown in the insets.
Heterogeneities in the translational motion of polymer matrices are observed when
molecules or particles have different velocities. Moreover, the motion of a single
molecule can be dynamically heterogeneous when, for instance, there is a change in its
surroundings, which significantly fluctuates the velocity over the time. 147
Analysing all
the three systems one can note the existence of at least two Gaussian distribution curves
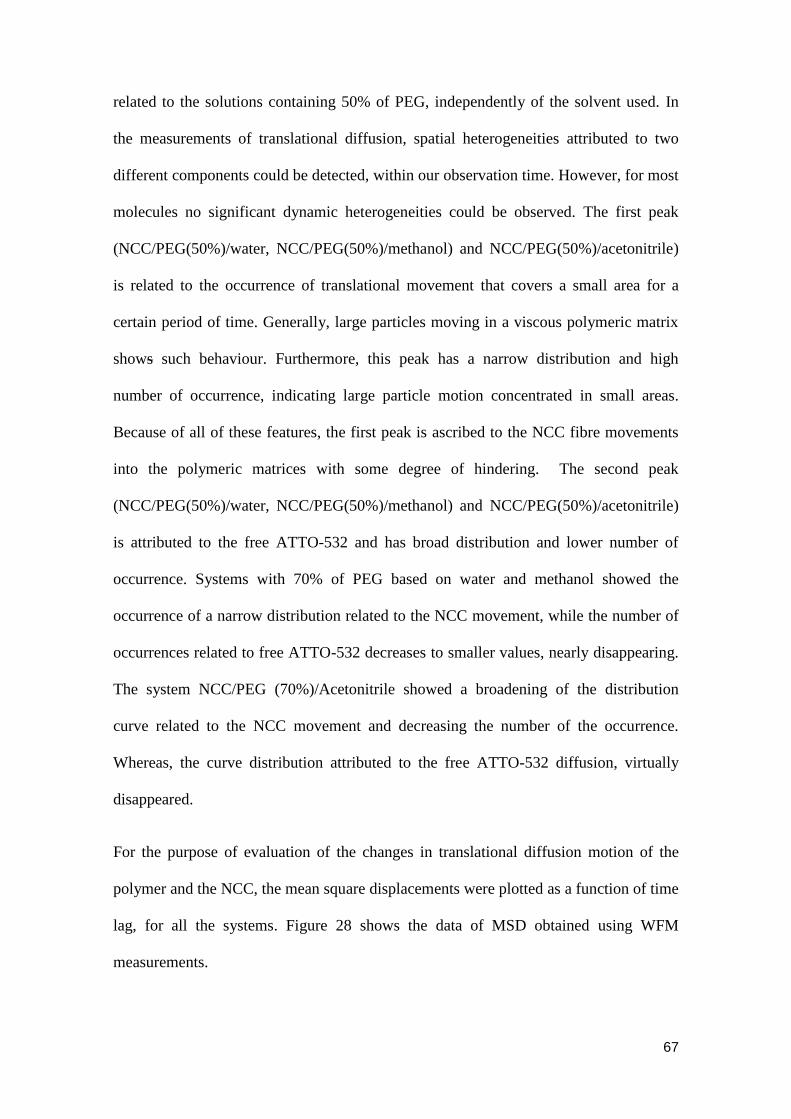
67
related to the solutions containing 50% of PEG, independently of the solvent used. In
the measurements of translational diffusion, spatial heterogeneities attributed to two
different components could be detected, within our observation time. However, for most
molecules no significant dynamic heterogeneities could be observed. The first peak
(NCC/PEG(50%)/water, NCC/PEG(50%)/methanol) and NCC/PEG(50%)/acetonitrile)
is related to the occurrence of translational movement that covers a small area for a
certain period of time. Generally, large particles moving in a viscous polymeric matrix
shows such behaviour. Furthermore, this peak has a narrow distribution and high
number of occurrence, indicating large particle motion concentrated in small areas.
Because of all of these features, the first peak is ascribed to the NCC fibre movements
into the polymeric matrices with some degree of hindering. The second peak
(NCC/PEG(50%)/water, NCC/PEG(50%)/methanol) and NCC/PEG(50%)/acetonitrile)
is attributed to the free ATTO-532 and has broad distribution and lower number of
occurrence. Systems with 70% of PEG based on water and methanol showed the
occurrence of a narrow distribution related to the NCC movement, while the number of
occurrences related to free ATTO-532 decreases to smaller values, nearly disappearing.
The system NCC/PEG (70%)/Acetonitrile showed a broadening of the distribution
curve related to the NCC movement and decreasing the number of the occurrence.
Whereas, the curve distribution attributed to the free ATTO-532 diffusion, virtually
disappeared.
For the purpose of evaluation of the changes in translational diffusion motion of the
polymer and the NCC, the mean square displacements were plotted as a function of time
lag, for all the systems. Figure 28 shows the data of MSD obtained using WFM
measurements.
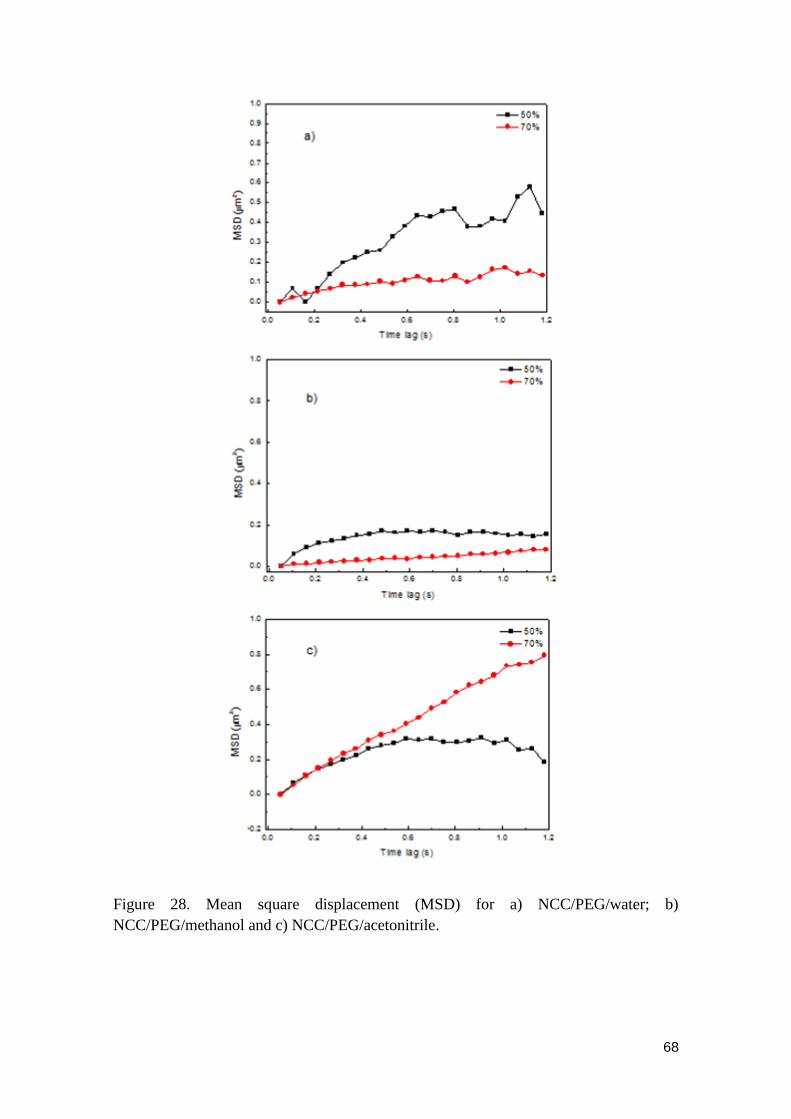
68
Figure 28. Mean square displacement (MSD) for a) NCC/PEG/water; b)
NCC/PEG/methanol and c) NCC/PEG/acetonitrile.
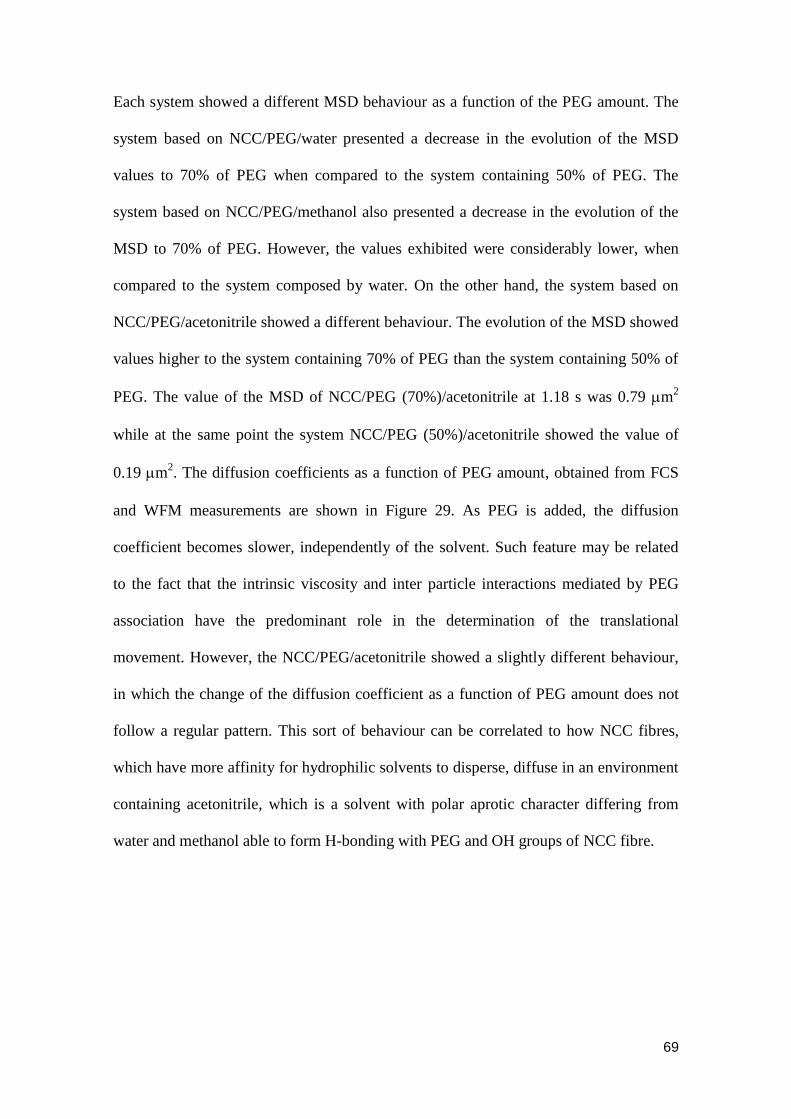
69
Each system showed a different MSD behaviour as a function of the PEG amount. The
system based on NCC/PEG/water presented a decrease in the evolution of the MSD
values to 70% of PEG when compared to the system containing 50% of PEG. The
system based on NCC/PEG/methanol also presented a decrease in the evolution of the
MSD to 70% of PEG. However, the values exhibited were considerably lower, when
compared to the system composed by water. On the other hand, the system based on
NCC/PEG/acetonitrile showed a different behaviour. The evolution of the MSD showed
values higher to the system containing 70% of PEG than the system containing 50% of
PEG. The value of the MSD of NCC/PEG (70%)/acetonitrile at 1.18 s was 0.79 m2
while at the same point the system NCC/PEG (50%)/acetonitrile showed the value of
0.19 m2. The diffusion coefficients as a function of PEG amount, obtained from FCS
and WFM measurements are shown in Figure 29. As PEG is added, the diffusion
coefficient becomes slower, independently of the solvent. Such feature may be related
to the fact that the intrinsic viscosity and inter particle interactions mediated by PEG
association have the predominant role in the determination of the translational
movement. However, the NCC/PEG/acetonitrile showed a slightly different behaviour,
in which the change of the diffusion coefficient as a function of PEG amount does not
follow a regular pattern. This sort of behaviour can be correlated to how NCC fibres,
which have more affinity for hydrophilic solvents to disperse, diffuse in an environment
containing acetonitrile, which is a solvent with polar aprotic character differing from
water and methanol able to form H-bonding with PEG and OH groups of NCC fibre.
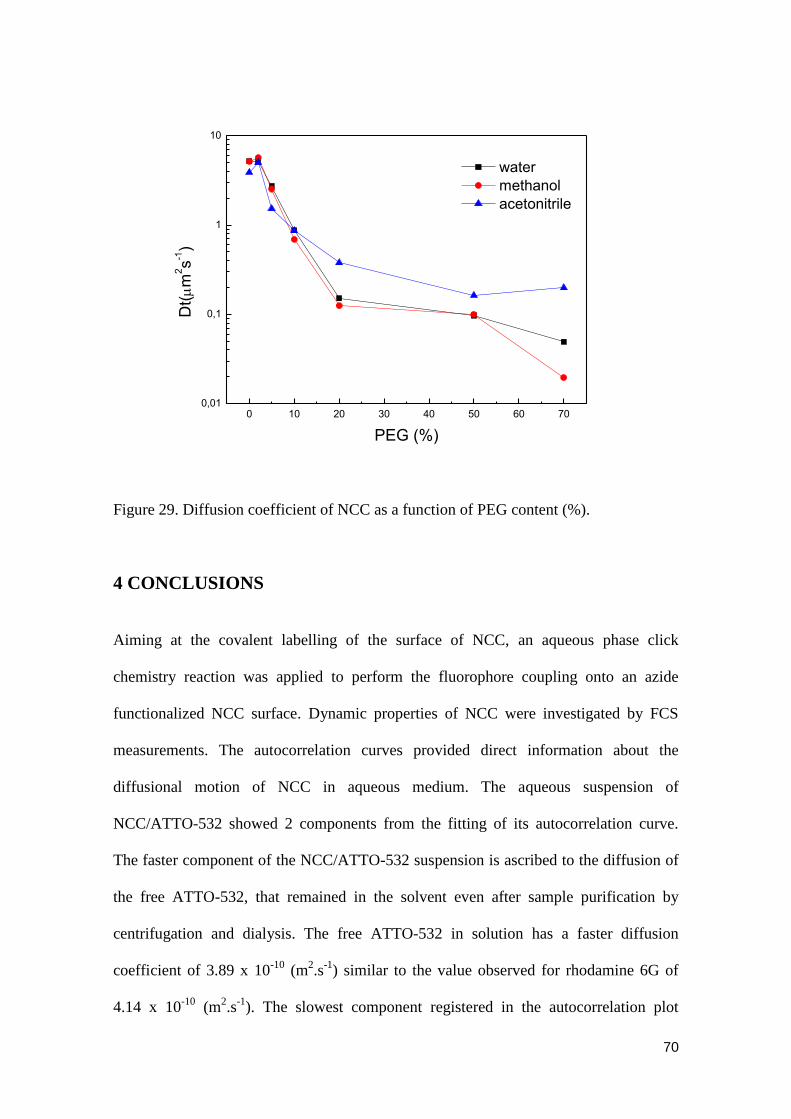
70
0 10 20 30 40 50 60 700,01
0,1
1
10
Dt(m
2s
-1)
PEG (%)
water
methanol
acetonitrile
Figure 29. Diffusion coefficient of NCC as a function of PEG content (%).
4 CONCLUSIONS
Aiming at the covalent labelling of the surface of NCC, an aqueous phase click
chemistry reaction was applied to perform the fluorophore coupling onto an azide
functionalized NCC surface. Dynamic properties of NCC were investigated by FCS
measurements. The autocorrelation curves provided direct information about the
diffusional motion of NCC in aqueous medium. The aqueous suspension of
NCC/ATTO-532 showed 2 components from the fitting of its autocorrelation curve.
The faster component of the NCC/ATTO-532 suspension is ascribed to the diffusion of
the free ATTO-532, that remained in the solvent even after sample purification by
centrifugation and dialysis. The free ATTO-532 in solution has a faster diffusion
coefficient of 3.89 x 10⁻¹⁰
(m2.s
-1) similar to the value observed for rhodamine 6G of
4.14 x 10⁻¹⁰
(m2.s
-1). The slowest component registered in the autocorrelation plot
71
indicated a diffusion coefficient of 2.77 x 10⁻¹²
(m2.s
-1) that is attributed to the diffusion
of the NCC labelled with ATTO-532. The properties related to dynamic properties of
NCC/PEG/water, NCC/PEG/methanol and NCC/PEG/acetonitrile were evaluated by
FCS and WFM. The diffusion of NCC fibre in solution becomes slower upon addition
of PEG, independently of the solvent used. This fact may be related to H-bonding
interaction mediated by PEG and the OH groups in the NCC surface obstructing
somewhat the free diffusion of the particle.
72
CHAPTER 4
POLYMERIZATION OF
STYRENE
73
ABSTRACT
Investigation of diffusion properties of polymer systems plays a crucial role in the
understanding of rheological parameters, and consequently in polymer processing and
assembly of plastics, films, and fibres. In recent years, several groups have studied
polymerization processes at the single molecule level using fluorescent molecules as
probes. However, this method is an indirect way to monitor diffusion during polymeric
formation. Here we used fluorescence correlation spectroscopy (FCS) and wide-field
fluorescence microscopy (WFM) to follow changes in the diffusion coefficients of
growing polymer chains during a controlled radical polymerization process. Linear and
star-shaped polystyrene were grown via nitroxide-mediated polymerization (NMP) from
alkoxyamine-based initiators already containing a highly fluorescent perylene diimide
moiety covalently attached, which was the key improvement of this work. FCS and
WFM methods enabled us to demonstrate the development of heterogeneities in the
chain movement. The polymerization mediated by monofunctional initiator showed
slower monomer conversion as compared to the formation of star-shaped polymers from
a tetrafunctional initiator. Whereas the formation of star-shaped polystyrene shows a
narrow step-length distribution and low mean square displacement (MSD) values (0.055
m2 at 0.8 s) after 180 minutes of reaction, contrasting with linear polystyrene where a
broad step-length distribution, similar monomer conversion and MSD values were
observed. Therefore, variation of viscosity during the polymerization represents the
major effect for the evaluation of diffusion parameters. This study demonstrates that
direct investigation of heterogeneity emerging during a controlled radical
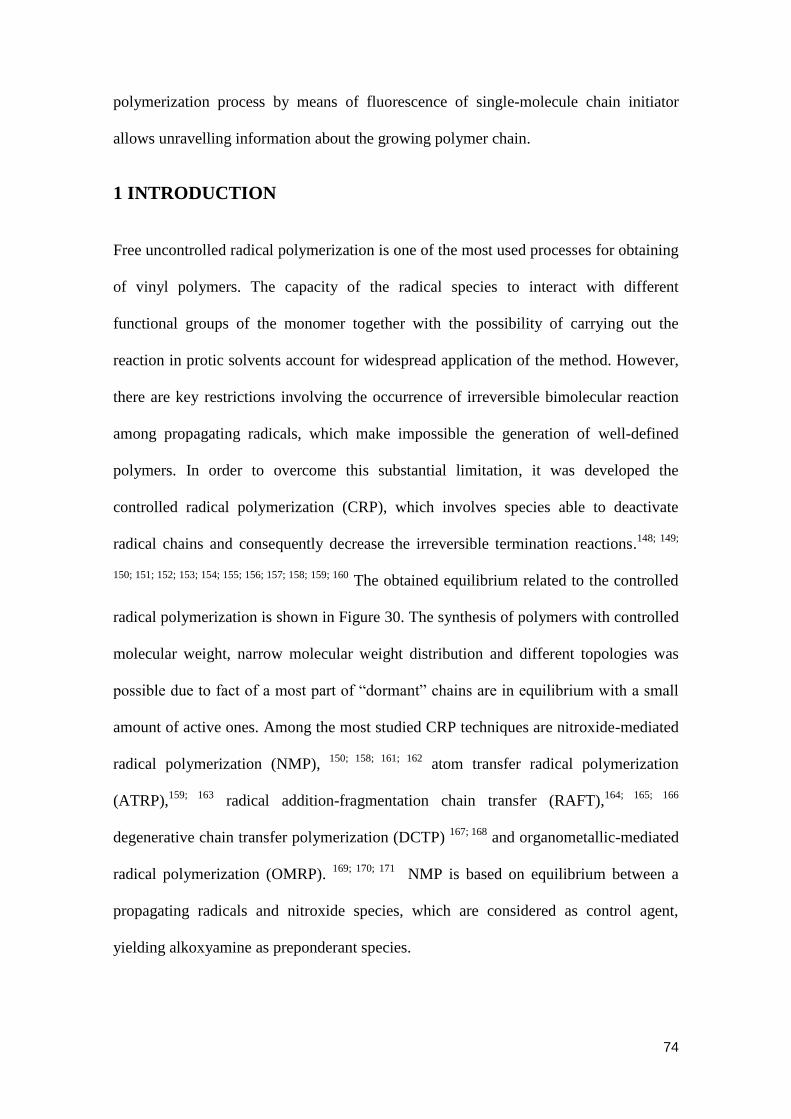
74
polymerization process by means of fluorescence of single-molecule chain initiator
allows unravelling information about the growing polymer chain.
1 INTRODUCTION
Free uncontrolled radical polymerization is one of the most used processes for obtaining
of vinyl polymers. The capacity of the radical species to interact with different
functional groups of the monomer together with the possibility of carrying out the
reaction in protic solvents account for widespread application of the method. However,
there are key restrictions involving the occurrence of irreversible bimolecular reaction
among propagating radicals, which make impossible the generation of well-defined
polymers. In order to overcome this substantial limitation, it was developed the
controlled radical polymerization (CRP), which involves species able to deactivate
radical chains and consequently decrease the irreversible termination reactions.148; 149;
150; 151; 152; 153; 154; 155; 156; 157; 158; 159; 160 The obtained equilibrium related to the controlled
radical polymerization is shown in Figure 30. The synthesis of polymers with controlled
molecular weight, narrow molecular weight distribution and different topologies was
possible due to fact of a most part of “dormant” chains are in equilibrium with a small
amount of active ones. Among the most studied CRP techniques are nitroxide-mediated
radical polymerization (NMP), 150; 158; 161; 162
atom transfer radical polymerization
(ATRP),159; 163
radical addition-fragmentation chain transfer (RAFT),164; 165; 166
degenerative chain transfer polymerization (DCTP) 167; 168
and organometallic-mediated
radical polymerization (OMRP). 169; 170; 171
NMP is based on equilibrium between a
propagating radicals and nitroxide species, which are considered as control agent,
yielding alkoxyamine as preponderant species.
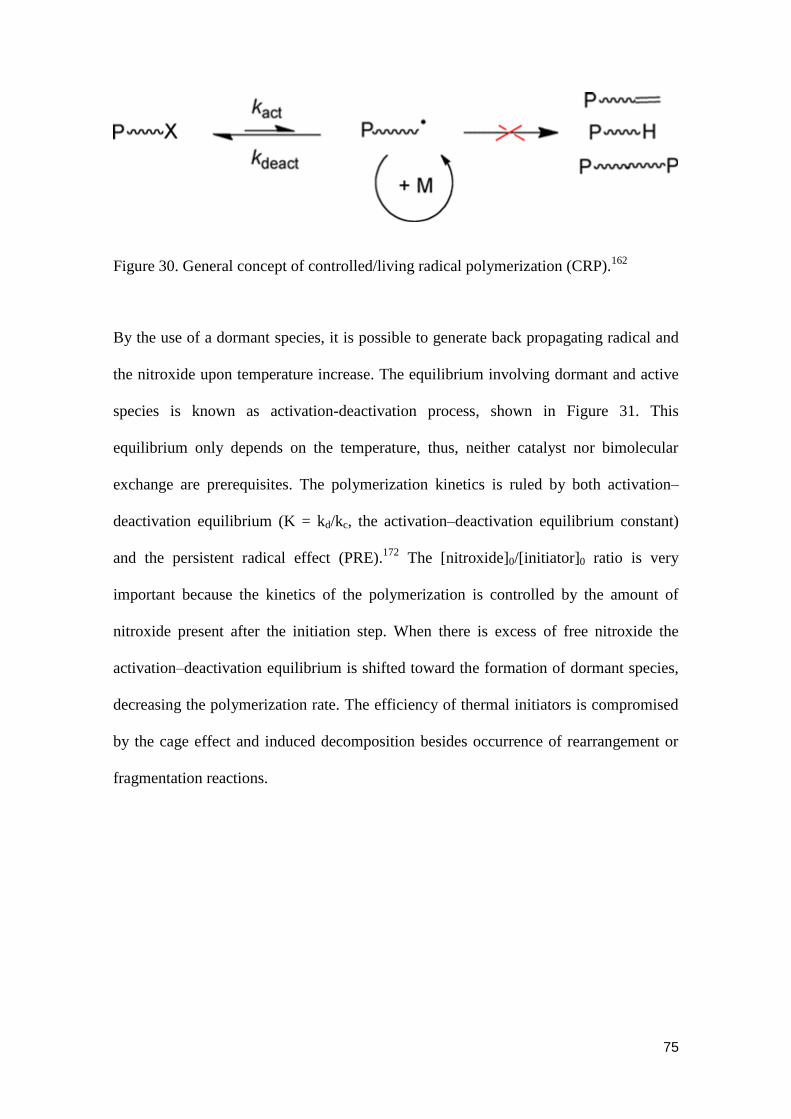
75
Figure 30. General concept of controlled/living radical polymerization (CRP).162
By the use of a dormant species, it is possible to generate back propagating radical and
the nitroxide upon temperature increase. The equilibrium involving dormant and active
species is known as activation-deactivation process, shown in Figure 31. This
equilibrium only depends on the temperature, thus, neither catalyst nor bimolecular
exchange are prerequisites. The polymerization kinetics is ruled by both activation–
deactivation equilibrium (K = kd/kc, the activation–deactivation equilibrium constant)
and the persistent radical effect (PRE).172
The [nitroxide]0/[initiator]0 ratio is very
important because the kinetics of the polymerization is controlled by the amount of
nitroxide present after the initiation step. When there is excess of free nitroxide the
activation–deactivation equilibrium is shifted toward the formation of dormant species,
decreasing the polymerization rate. The efficiency of thermal initiators is compromised
by the cage effect and induced decomposition besides occurrence of rearrangement or
fragmentation reactions.
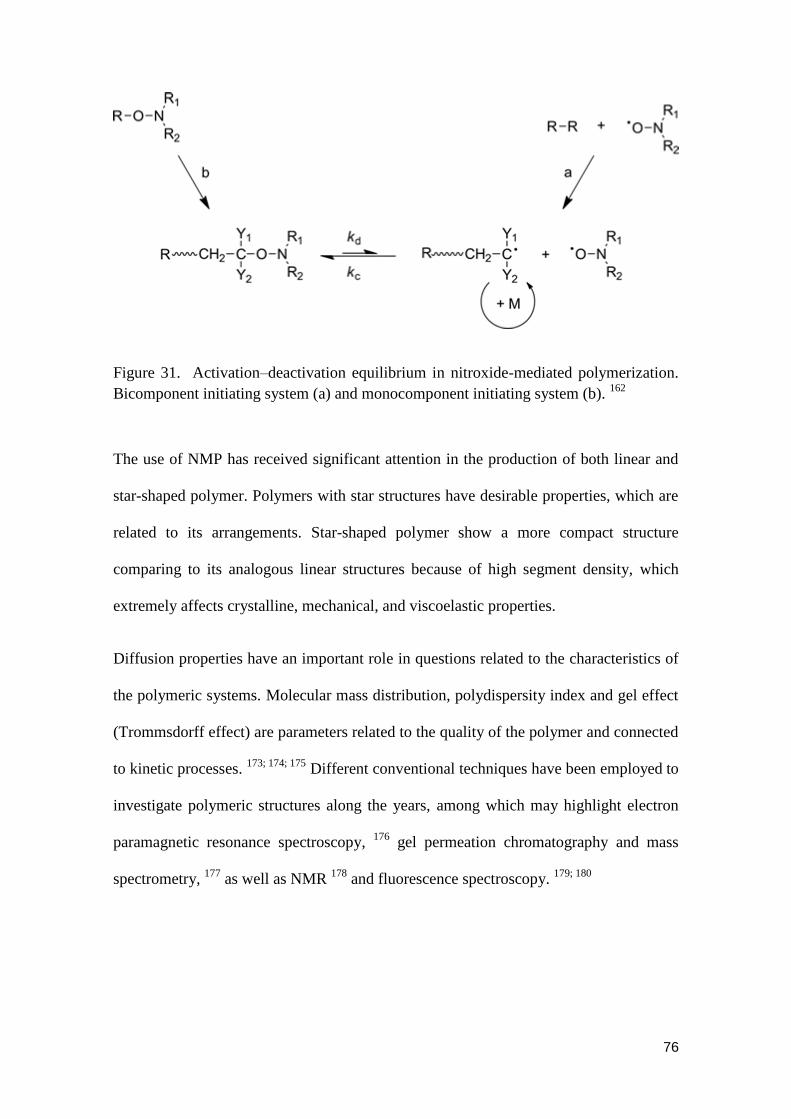
76
Figure 31. Activation–deactivation equilibrium in nitroxide-mediated polymerization.
Bicomponent initiating system (a) and monocomponent initiating system (b). 162
The use of NMP has received significant attention in the production of both linear and
star-shaped polymer. Polymers with star structures have desirable properties, which are
related to its arrangements. Star-shaped polymer show a more compact structure
comparing to its analogous linear structures because of high segment density, which
extremely affects crystalline, mechanical, and viscoelastic properties.
Diffusion properties have an important role in questions related to the characteristics of
the polymeric systems. Molecular mass distribution, polydispersity index and gel effect
(Trommsdorff effect) are parameters related to the quality of the polymer and connected
to kinetic processes. 173; 174; 175
Different conventional techniques have been employed to
investigate polymeric structures along the years, among which may highlight electron
paramagnetic resonance spectroscopy, 176
gel permeation chromatography and mass
spectrometry, 177
as well as NMR 178
and fluorescence spectroscopy. 179; 180
77
2 EXPERIMENTAL
2.1 Polymerization of styrene
Styrene (1) and the monofunctional, non-fluorescent initiator N-tert-butyl-N-(2-methyl-
1-phenylpropyl)-O-(1-phenylethyl) hydroxylamine (2) were purchased from Sigma-
Aldrich. Styrene was distilled under reduced pressure before use, and its purity was
checked by H-NMR. The synthesis of monofunctional fluorescent initiator (3),
tetrafunctional fluorescent initiator (4) and the tetrafunctional non-fluorescent initiator
(5) (Figure 27) were performed by Daniel Jänsch from Max Planck Institute for
Polymer Research – Germany. The structures are shown in Figure 32.
Figure 32. Structures of styrene (1) and of the alkoxyamine-based NMP initiators used
in this work (2 and 5: non-fluorescent initiators; 3 and 4: fluorescent initiators).
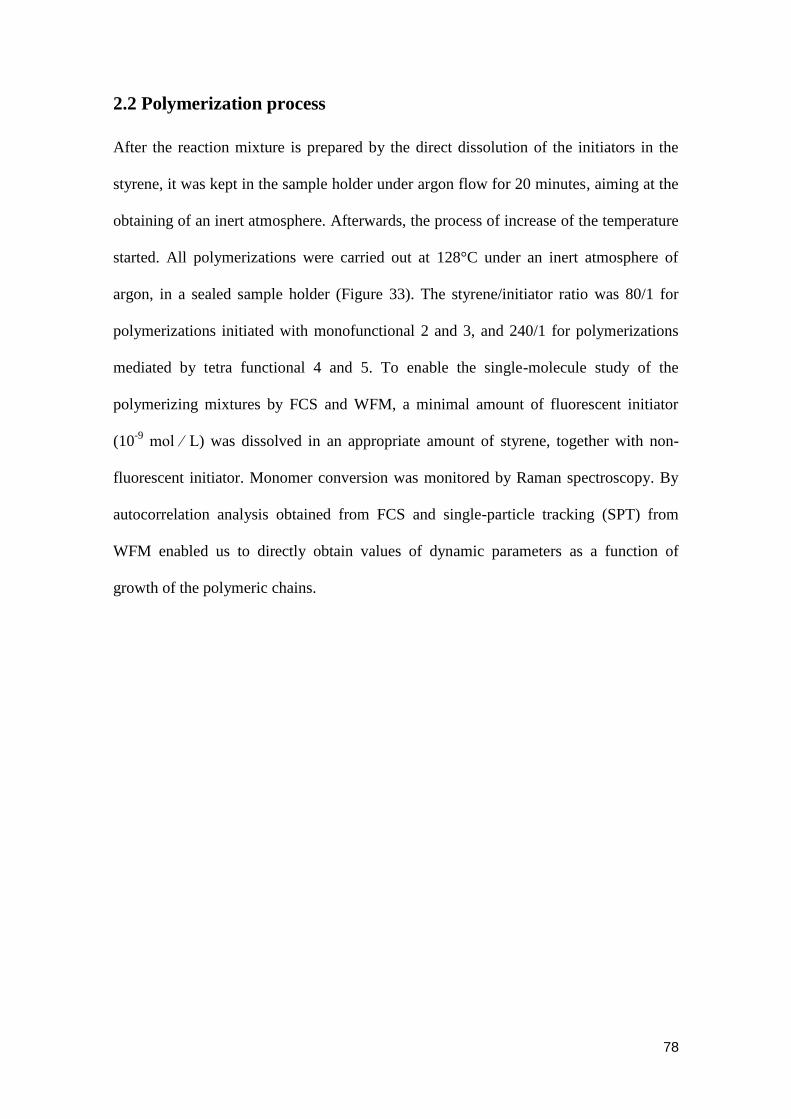
78
2.2 Polymerization process
After the reaction mixture is prepared by the direct dissolution of the initiators in the
styrene, it was kept in the sample holder under argon flow for 20 minutes, aiming at the
obtaining of an inert atmosphere. Afterwards, the process of increase of the temperature
started. All polymerizations were carried out at 128°C under an inert atmosphere of
argon, in a sealed sample holder (Figure 33). The styrene/initiator ratio was 80/1 for
polymerizations initiated with monofunctional 2 and 3, and 240/1 for polymerizations
mediated by tetra functional 4 and 5. To enable the single-molecule study of the
polymerizing mixtures by FCS and WFM, a minimal amount of fluorescent initiator
(10-9
mol ⁄ L) was dissolved in an appropriate amount of styrene, together with non-
fluorescent initiator. Monomer conversion was monitored by Raman spectroscopy. By
autocorrelation analysis obtained from FCS and single-particle tracking (SPT) from
WFM enabled us to directly obtain values of dynamic parameters as a function of
growth of the polymeric chains.
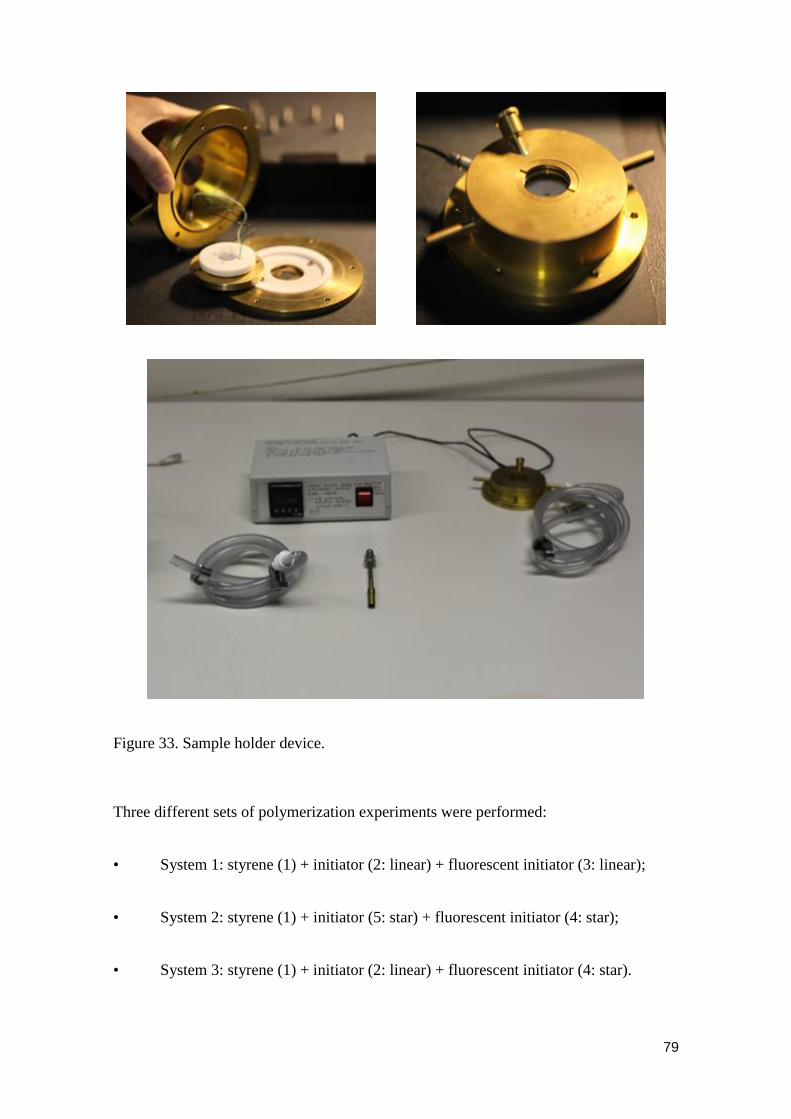
79
Figure 33. Sample holder device.
Three different sets of polymerization experiments were performed:
• System 1: styrene (1) + initiator (2: linear) + fluorescent initiator (3: linear);
• System 2: styrene (1) + initiator (5: star) + fluorescent initiator (4: star);
• System 3: styrene (1) + initiator (2: linear) + fluorescent initiator (4: star).
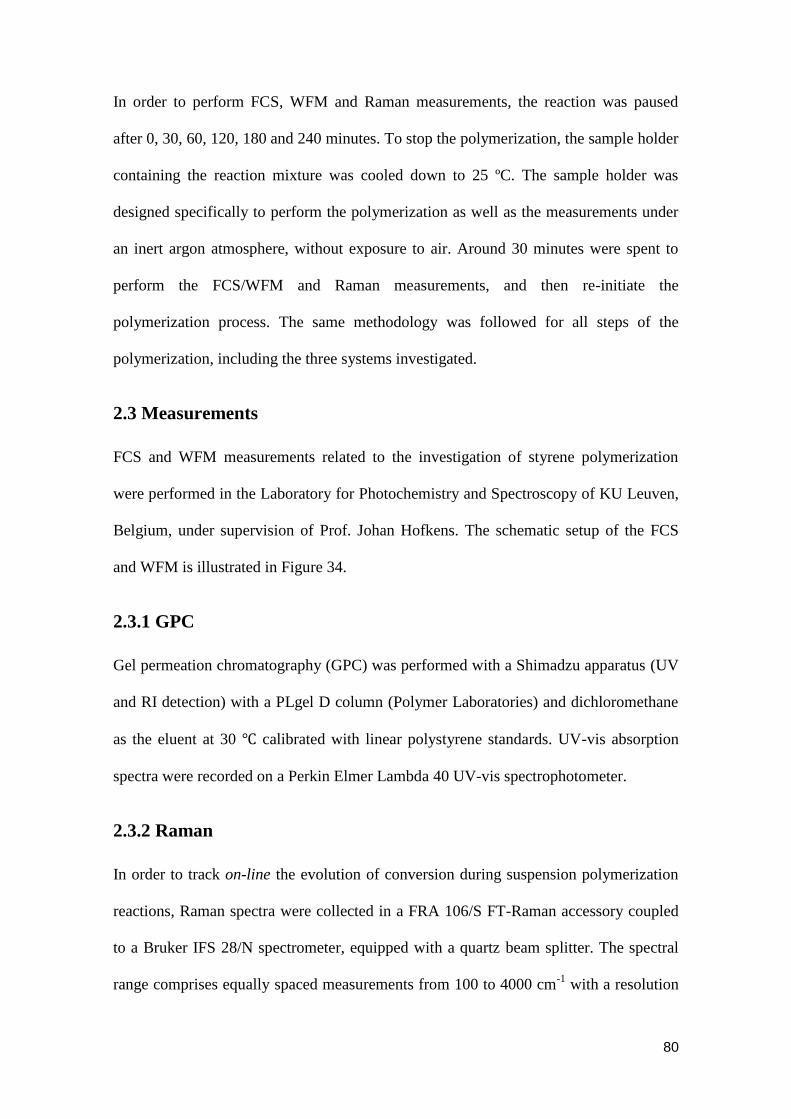
80
In order to perform FCS, WFM and Raman measurements, the reaction was paused
after 0, 30, 60, 120, 180 and 240 minutes. To stop the polymerization, the sample holder
containing the reaction mixture was cooled down to 25 ºC. The sample holder was
designed specifically to perform the polymerization as well as the measurements under
an inert argon atmosphere, without exposure to air. Around 30 minutes were spent to
perform the FCS/WFM and Raman measurements, and then re-initiate the
polymerization process. The same methodology was followed for all steps of the
polymerization, including the three systems investigated.
2.3 Measurements
FCS and WFM measurements related to the investigation of styrene polymerization
were performed in the Laboratory for Photochemistry and Spectroscopy of KU Leuven,
Belgium, under supervision of Prof. Johan Hofkens. The schematic setup of the FCS
and WFM is illustrated in Figure 34.
2.3.1 GPC
Gel permeation chromatography (GPC) was performed with a Shimadzu apparatus (UV
and RI detection) with a PLgel D column (Polymer Laboratories) and dichloromethane
as the eluent at 30 ℃ calibrated with linear polystyrene standards. UV-vis absorption
spectra were recorded on a Perkin Elmer Lambda 40 UV-vis spectrophotometer.
2.3.2 Raman
In order to track on-line the evolution of conversion during suspension polymerization
reactions, Raman spectra were collected in a FRA 106/S FT-Raman accessory coupled
to a Bruker IFS 28/N spectrometer, equipped with a quartz beam splitter. The spectral
range comprises equally spaced measurements from 100 to 4000 cm-1
with a resolution
81
of 8 cm-1
and the laser wavelength and power were 1064 nm and 450 mW, respectively.
During styrene suspension polymerization reactions, spectra were collected with 32
scans
2.3.3 FCS
A Spectra-Physics CW Excelsior 532 nm laser (with an output power of 500 mW) was
used to generate a laser beam with an approximately Gaussian shape. The source light
passed through a sequence of lenses and filters, attenuating its power to 150 s.
Afterwards the laser beam passed into an optical microscope (Olympus IX71) equipped
with a 100 oil-immersion objective (N.A. 1.30). The laser light was focused 7 m
above surface of the glass slide that made up the bottom part of the sample holder. The
fluorescence signal was collected by the same objective and passed through a 50 µm
pinhole. The scattered excitation light was removed by a dichroic mirror (z532rdc,
Chroma) localized in front of the pinhole. An avalanche photodiode detector (APD –
PicoQuant τ-SPAD) was used to collect the fluorescence signal. For each measurement,
photons were collected for about 3 minutes. Each photon event was recorded using a
time stamp with picosecond precision using a HydraHarp 400 (PicoQuant, Berlin) in T2
mode. Autocorrelation events were calculated by the SymPhoTime software
(PicoQuant). The shape and size of the confocal volume was estimated using an
aqueous solution of Rhodamine 6G, which has a known diffusion coefficient of 4.14
10-10
m2 s
-1 in water at 25 ºC.
2.3.4 WFM
For the WFM measurements the same Spectra-Physics CW Excelsior 532 nm laser was
used as for the FCS measurements. The light was passed through λ/2 and λ/4 wave
plates to obtain a circularly polarized beam. Afterwards, it was expanded and passed
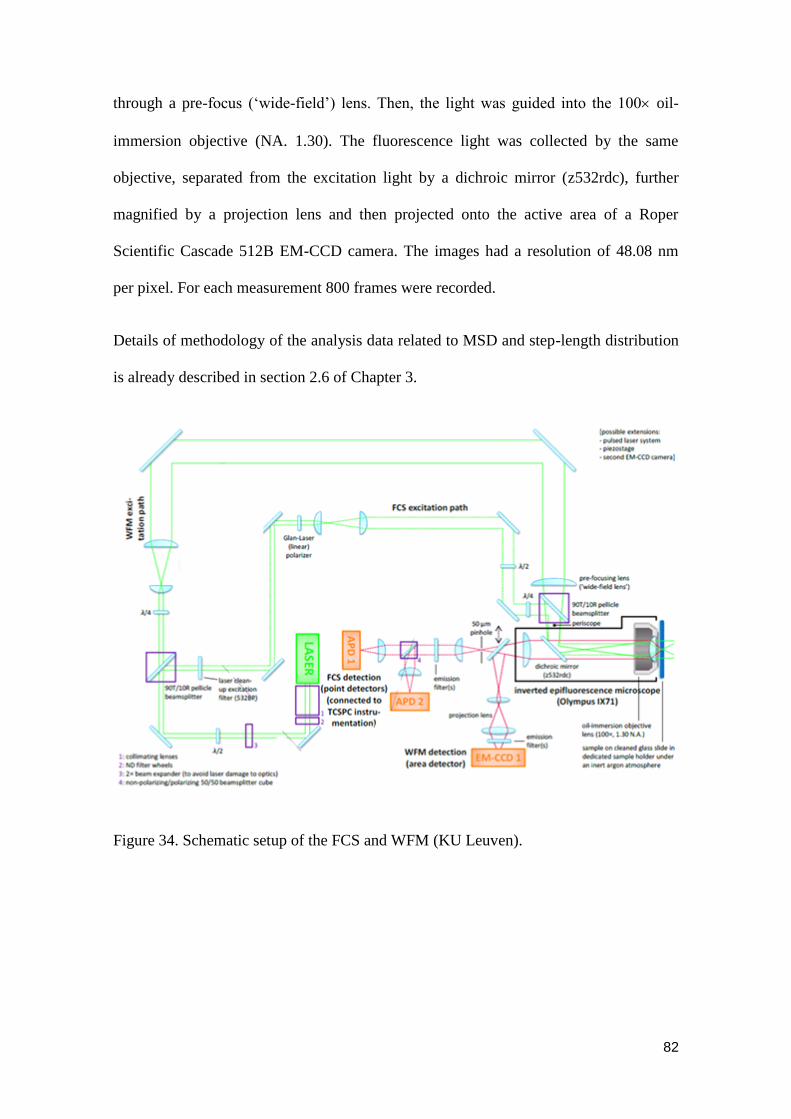
82
through a pre-focus (‘wide-field’) lens. Then, the light was guided into the 100 oil-
immersion objective (NA. 1.30). The fluorescence light was collected by the same
objective, separated from the excitation light by a dichroic mirror (z532rdc), further
magnified by a projection lens and then projected onto the active area of a Roper
Scientific Cascade 512B EM-CCD camera. The images had a resolution of 48.08 nm
per pixel. For each measurement 800 frames were recorded.
Details of methodology of the analysis data related to MSD and step-length distribution
is already described in section 2.6 of Chapter 3.
Figure 34. Schematic setup of the FCS and WFM (KU Leuven).
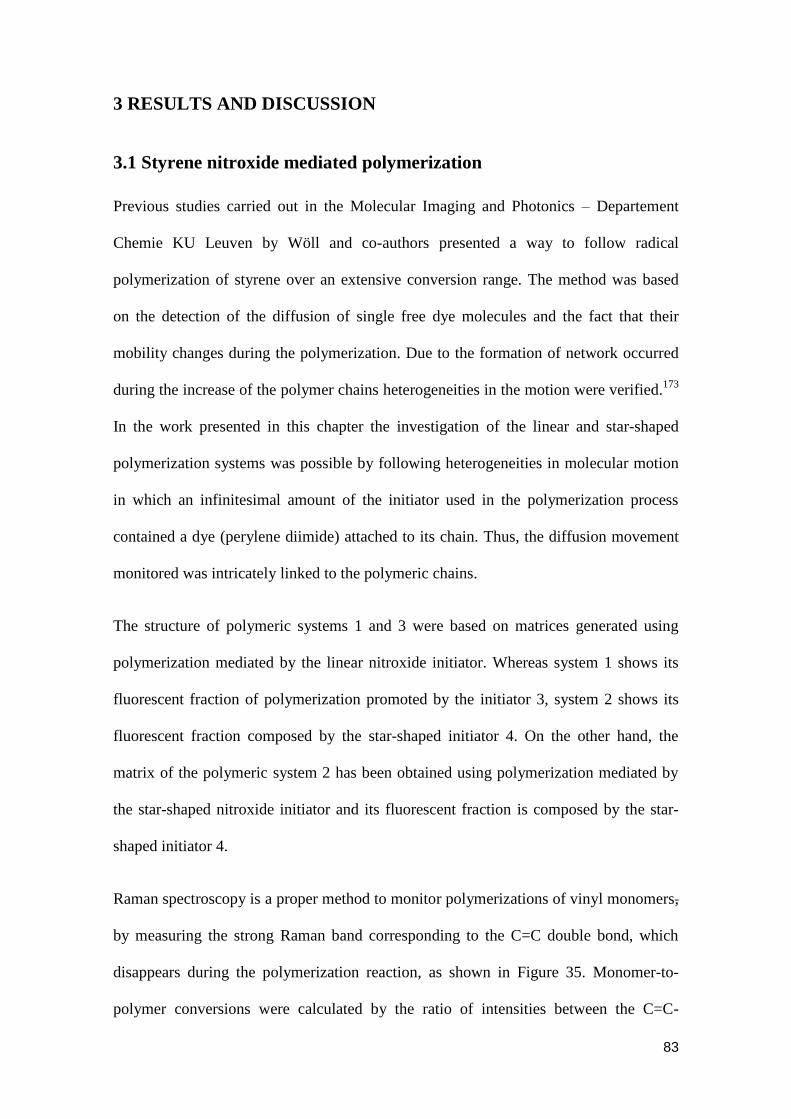
83
3 RESULTS AND DISCUSSION
3.1 Styrene nitroxide mediated polymerization
Previous studies carried out in the Molecular Imaging and Photonics – Departement
Chemie KU Leuven by Wöll and co-authors presented a way to follow radical
polymerization of styrene over an extensive conversion range. The method was based
on the detection of the diffusion of single free dye molecules and the fact that their
mobility changes during the polymerization. Due to the formation of network occurred
during the increase of the polymer chains heterogeneities in the motion were verified.173
In the work presented in this chapter the investigation of the linear and star-shaped
polymerization systems was possible by following heterogeneities in molecular motion
in which an infinitesimal amount of the initiator used in the polymerization process
contained a dye (perylene diimide) attached to its chain. Thus, the diffusion movement
monitored was intricately linked to the polymeric chains.
The structure of polymeric systems 1 and 3 were based on matrices generated using
polymerization mediated by the linear nitroxide initiator. Whereas system 1 shows its
fluorescent fraction of polymerization promoted by the initiator 3, system 2 shows its
fluorescent fraction composed by the star-shaped initiator 4. On the other hand, the
matrix of the polymeric system 2 has been obtained using polymerization mediated by
the star-shaped nitroxide initiator and its fluorescent fraction is composed by the star-
shaped initiator 4.
Raman spectroscopy is a proper method to monitor polymerizations of vinyl monomers,
by measuring the strong Raman band corresponding to the C=C double bond, which
disappears during the polymerization reaction, as shown in Figure 35. Monomer-to-
polymer conversions were calculated by the ratio of intensities between the C=C-
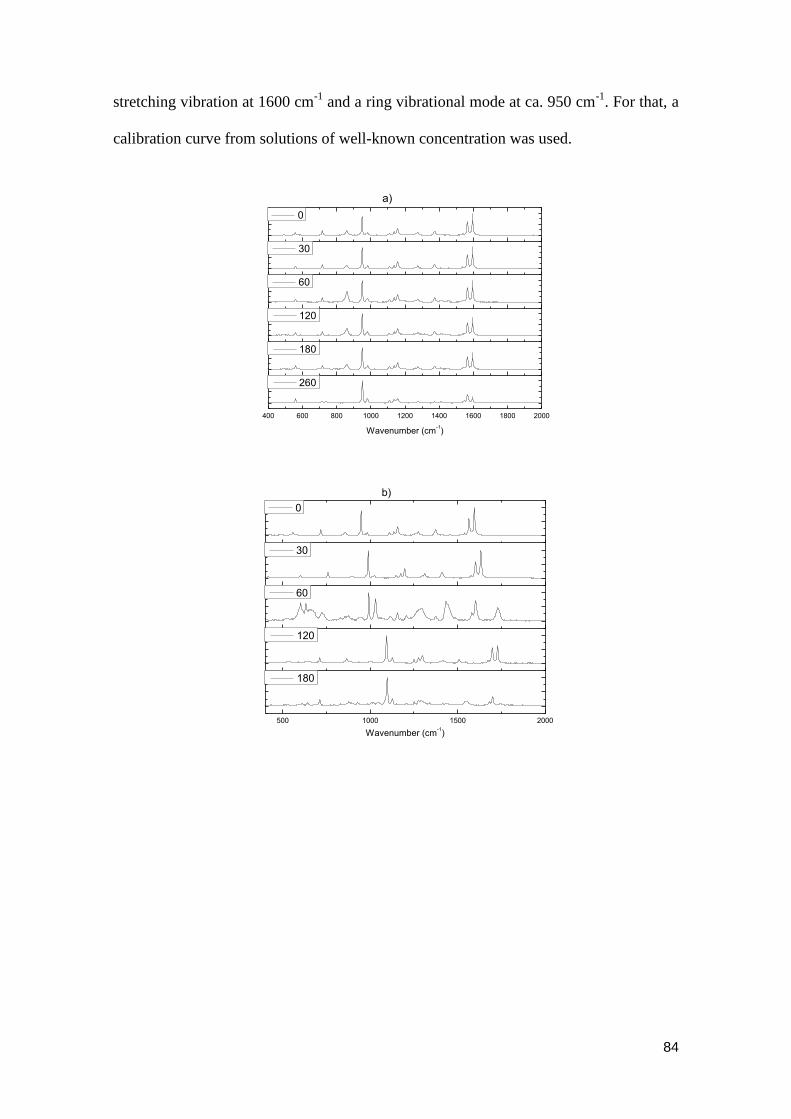
84
stretching vibration at 1600 cm-1
and a ring vibrational mode at ca. 950 cm-1
. For that, a
calibration curve from solutions of well-known concentration was used.
400 600 800 1000 1200 1400 1600 1800 2000
0
30
60
120
180
Wavenumber (cm-1)
260
a)
500 1000 1500 2000
0
30
60
120
Wavenumber (cm-1)
180
b)
85
500 1000 1500 2000
0
30
60
120
180
Wavenumber (cm-1)
260
c)
Figure 35. Raman spectra for the polymerization of styrene, mediated by a) System 1, b)
System 2 and c) System 3.
Due to the high viscosity of the polymeric reaction medium and therefore the
impossibility of continuing the polymerization process, the sample holder containing
polystyrene was opened and an aliquot was taken and immediately placed in THF.
Then, measurements in GPC were conducted to determine the polydispersity index
(PDI) of the samples. Figure 36 shows the GPC trace for the systems 1, 2 and 3,The
PDI values for the resulting polymer at each configuration were 1.180; 1.141 and 1.055,
respectively.
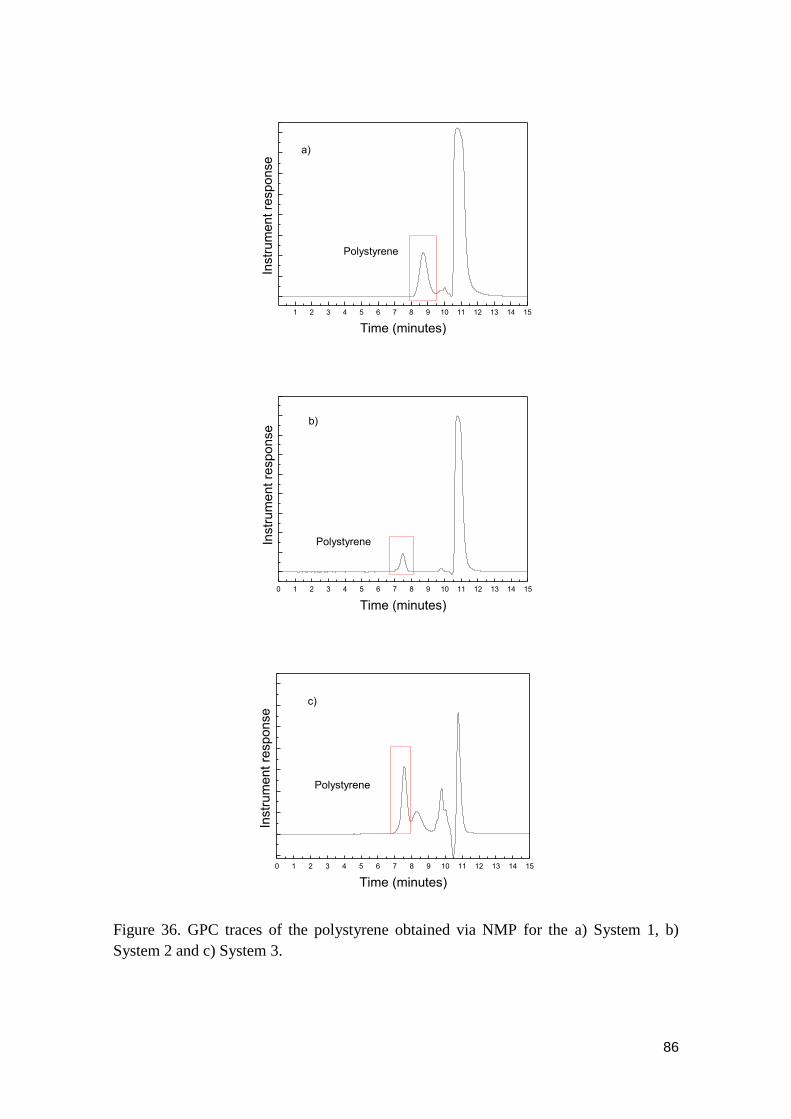
86
1 2 3 4 5 6 7 8 9 10 11 12 13 14 15
Polystyrene
a)
Instr
um
ent
respo
nse
Time (minutes)
0 1 2 3 4 5 6 7 8 9 10 11 12 13 14 15
b)
Instr
um
en
t re
sp
on
se
Time (minutes)
Polystyrene
0 1 2 3 4 5 6 7 8 9 10 11 12 13 14 15
Polystyrene
Instr
um
en
t re
sp
on
se
Time (minutes)
c)
Figure 36. GPC traces of the polystyrene obtained via NMP for the a) System 1, b)
System 2 and c) System 3.
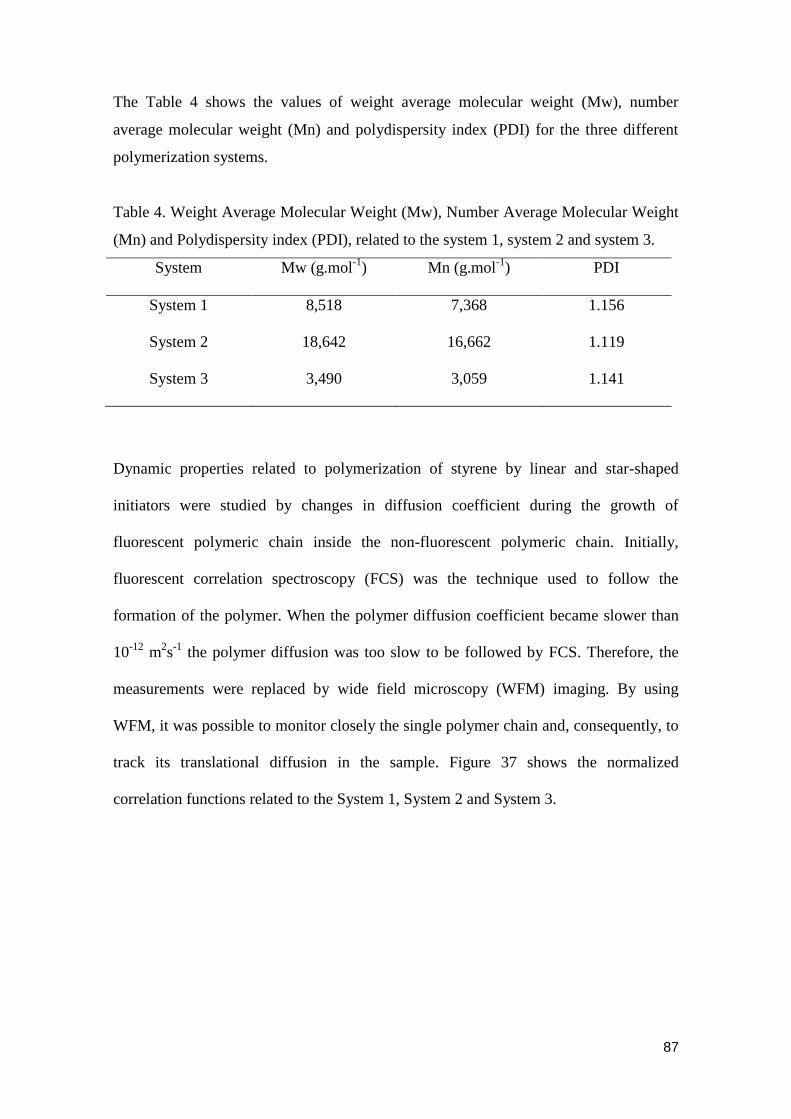
87
The Table 4 shows the values of weight average molecular weight (Mw), number
average molecular weight (Mn) and polydispersity index (PDI) for the three different
polymerization systems.
Table 4. Weight Average Molecular Weight (Mw), Number Average Molecular Weight
(Mn) and Polydispersity index (PDI), related to the system 1, system 2 and system 3.
System Mw (g.mol-1
) Mn (g.mol-1
) PDI
System 1 8,518 7,368 1.156
System 2 18,642 16,662 1.119
System 3 3,490 3,059 1.141
Dynamic properties related to polymerization of styrene by linear and star-shaped
initiators were studied by changes in diffusion coefficient during the growth of
fluorescent polymeric chain inside the non-fluorescent polymeric chain. Initially,
fluorescent correlation spectroscopy (FCS) was the technique used to follow the
formation of the polymer. When the polymer diffusion coefficient became slower than
10-12
m2s
-1 the polymer diffusion was too slow to be followed by FCS. Therefore, the
measurements were replaced by wide field microscopy (WFM) imaging. By using
WFM, it was possible to monitor closely the single polymer chain and, consequently, to
track its translational diffusion in the sample. Figure 37 shows the normalized
correlation functions related to the System 1, System 2 and System 3.
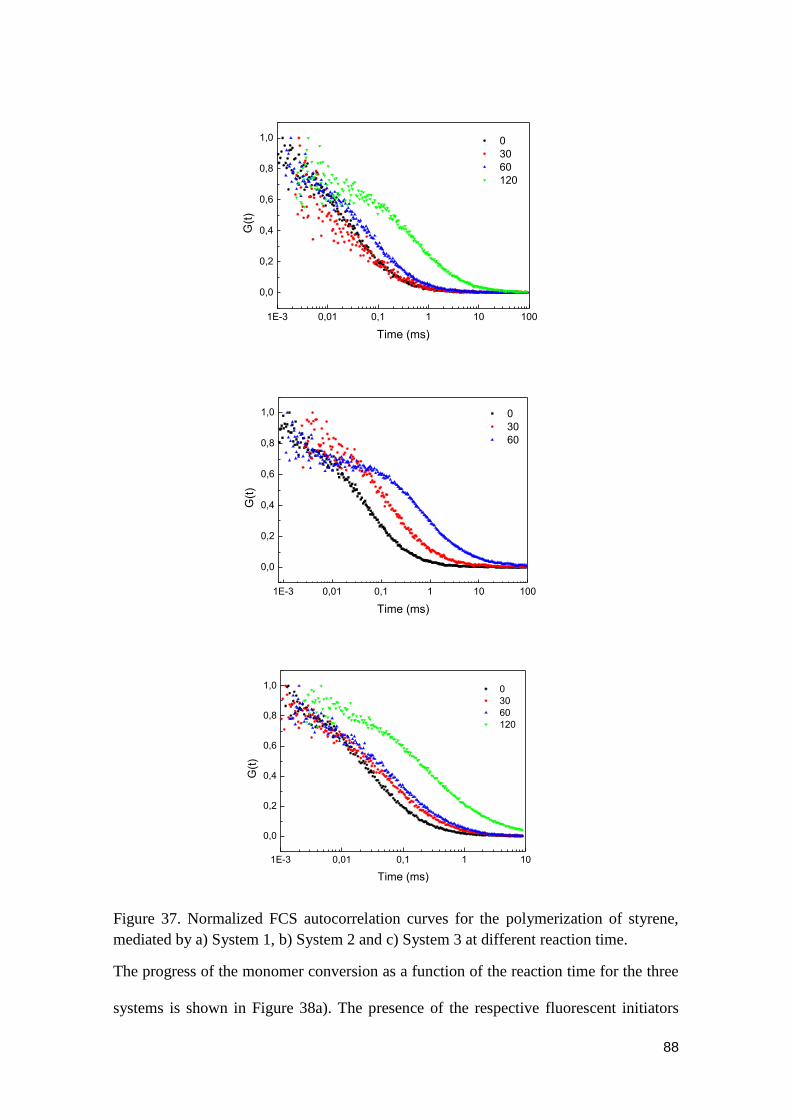
88
1E-3 0,01 0,1 1 10 100
0,0
0,2
0,4
0,6
0,8
1,0
0
30
60
120
G(t
)
Time (ms)
1E-3 0,01 0,1 1 10 100
0,0
0,2
0,4
0,6
0,8
1,0
0
30
60
G(t
)
Time (ms)
1E-3 0,01 0,1 1 10
0,0
0,2
0,4
0,6
0,8
1,0
0
30
60
120
G(t
)
Time (ms)
Figure 37. Normalized FCS autocorrelation curves for the polymerization of styrene,
mediated by a) System 1, b) System 2 and c) System 3 at different reaction time.
The progress of the monomer conversion as a function of the reaction time for the three
systems is shown in Figure 38a). The presence of the respective fluorescent initiators
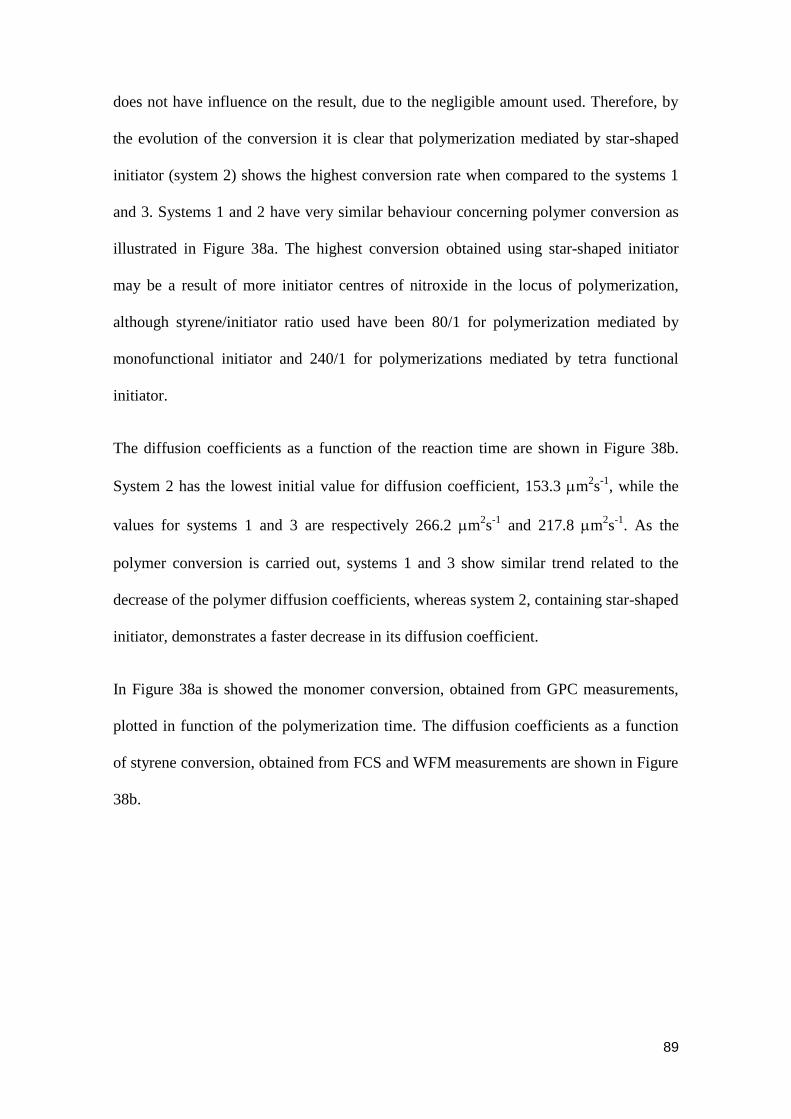
89
does not have influence on the result, due to the negligible amount used. Therefore, by
the evolution of the conversion it is clear that polymerization mediated by star-shaped
initiator (system 2) shows the highest conversion rate when compared to the systems 1
and 3. Systems 1 and 2 have very similar behaviour concerning polymer conversion as
illustrated in Figure 38a. The highest conversion obtained using star-shaped initiator
may be a result of more initiator centres of nitroxide in the locus of polymerization,
although styrene/initiator ratio used have been 80/1 for polymerization mediated by
monofunctional initiator and 240/1 for polymerizations mediated by tetra functional
initiator.
The diffusion coefficients as a function of the reaction time are shown in Figure 38b.
System 2 has the lowest initial value for diffusion coefficient, 153.3 m2s
-1, while the
values for systems 1 and 3 are respectively 266.2 m2s
-1 and 217.8 m
2s
-1. As the
polymer conversion is carried out, systems 1 and 3 show similar trend related to the
decrease of the polymer diffusion coefficients, whereas system 2, containing star-shaped
initiator, demonstrates a faster decrease in its diffusion coefficient.
In Figure 38a is showed the monomer conversion, obtained from GPC measurements,
plotted in function of the polymerization time. The diffusion coefficients as a function
of styrene conversion, obtained from FCS and WFM measurements are shown in Figure
38b.
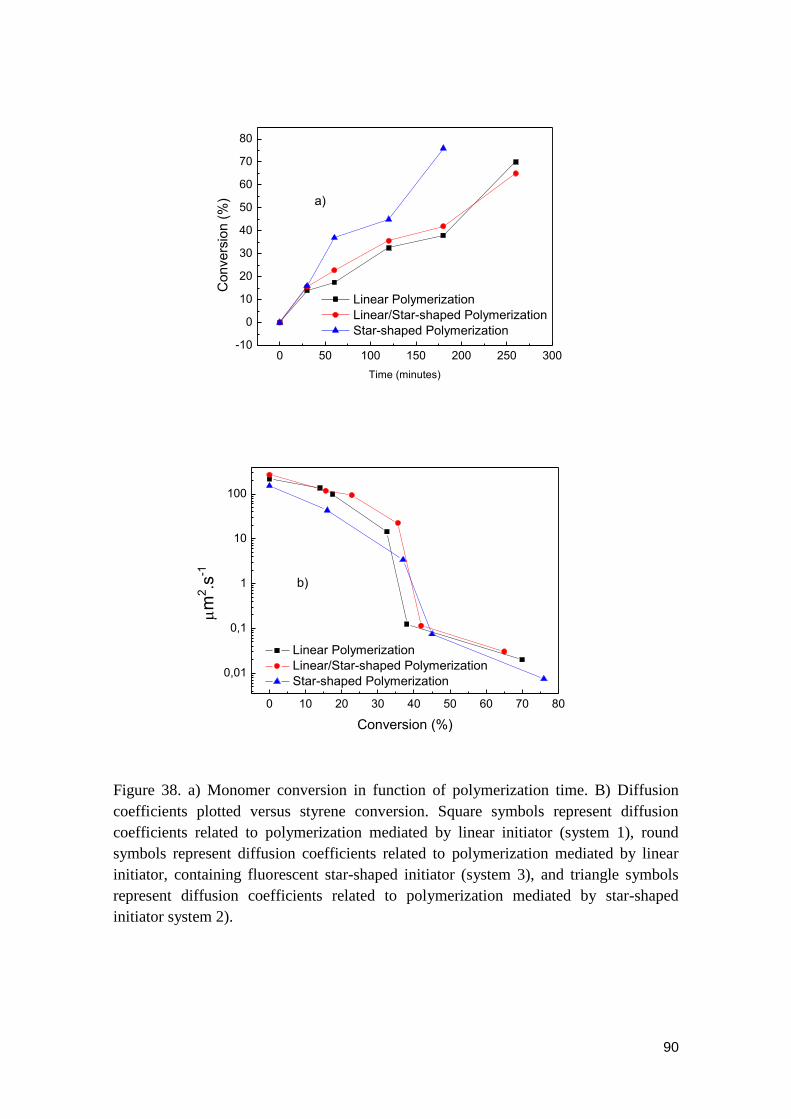
90
0 50 100 150 200 250 300-10
0
10
20
30
40
50
60
70
80
Convers
ion (
%)
Time (minutes)
Linear Polymerization
Linear/Star-shaped Polymerization
Star-shaped Polymerization
a)
0 10 20 30 40 50 60 70 80
0,01
0,1
1
10
100
Linear Polymerization
Linear/Star-shaped Polymerization
Star-shaped Polymerization
m
2.s
-1
Conversion (%)
b)
Figure 38. a) Monomer conversion in function of polymerization time. B) Diffusion
coefficients plotted versus styrene conversion. Square symbols represent diffusion
coefficients related to polymerization mediated by linear initiator (system 1), round
symbols represent diffusion coefficients related to polymerization mediated by linear
initiator, containing fluorescent star-shaped initiator (system 3), and triangle symbols
represent diffusion coefficients related to polymerization mediated by star-shaped
initiator system 2).
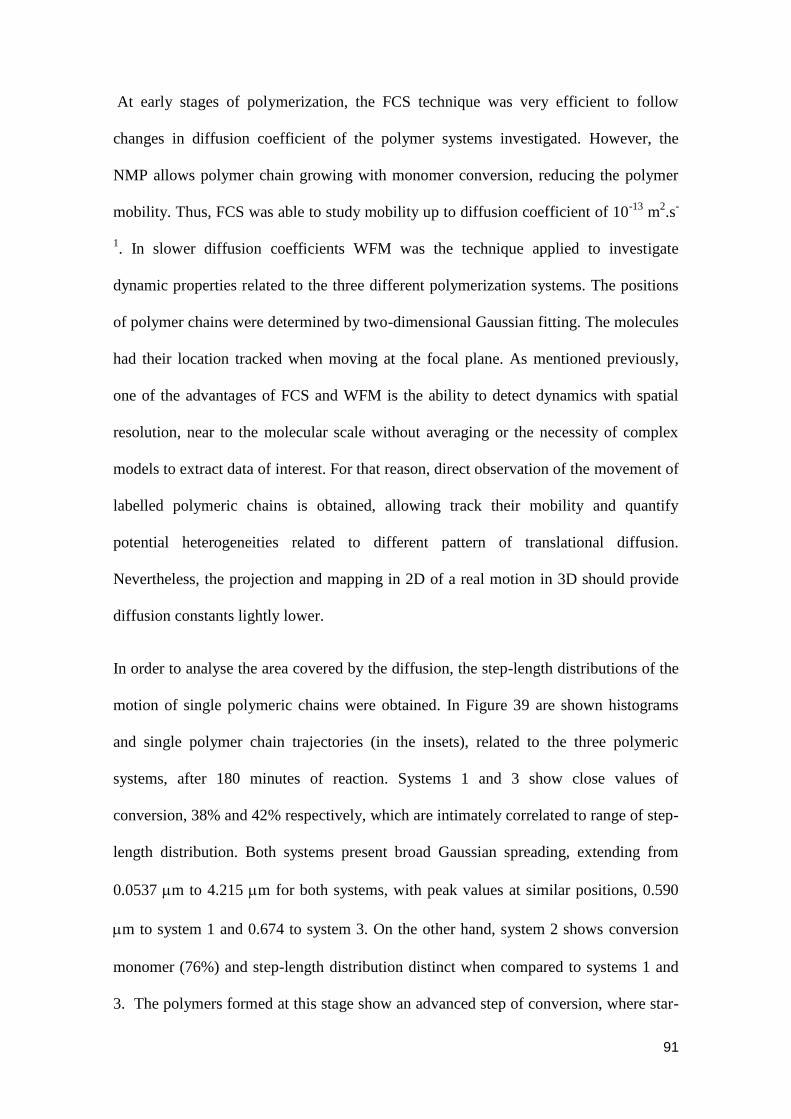
91
At early stages of polymerization, the FCS technique was very efficient to follow
changes in diffusion coefficient of the polymer systems investigated. However, the
NMP allows polymer chain growing with monomer conversion, reducing the polymer
mobility. Thus, FCS was able to study mobility up to diffusion coefficient of 10-13
m2.s
-
1. In slower diffusion coefficients WFM was the technique applied to investigate
dynamic properties related to the three different polymerization systems. The positions
of polymer chains were determined by two-dimensional Gaussian fitting. The molecules
had their location tracked when moving at the focal plane. As mentioned previously,
one of the advantages of FCS and WFM is the ability to detect dynamics with spatial
resolution, near to the molecular scale without averaging or the necessity of complex
models to extract data of interest. For that reason, direct observation of the movement of
labelled polymeric chains is obtained, allowing track their mobility and quantify
potential heterogeneities related to different pattern of translational diffusion.
Nevertheless, the projection and mapping in 2D of a real motion in 3D should provide
diffusion constants lightly lower.
In order to analyse the area covered by the diffusion, the step-length distributions of the
motion of single polymeric chains were obtained. In Figure 39 are shown histograms
and single polymer chain trajectories (in the insets), related to the three polymeric
systems, after 180 minutes of reaction. Systems 1 and 3 show close values of
conversion, 38% and 42% respectively, which are intimately correlated to range of step-
length distribution. Both systems present broad Gaussian spreading, extending from
0.0537 m to 4.215 m for both systems, with peak values at similar positions, 0.590
m to system 1 and 0.674 to system 3. On the other hand, system 2 shows conversion
monomer (76%) and step-length distribution distinct when compared to systems 1 and
3. The polymers formed at this stage show an advanced step of conversion, where star-
92
shaped chain entanglement is almost immobilized, slowing down translation
movements of the labelled polymers. The occurrence number has its Gaussian
distribution limited to the narrow range of 3 m, with the peak located at 0.337 m.
Figure 39. Step-length distribution for a) system 1, b) system 2 and c) system 3. The
distributions exhibited are related to polymeric systems after 180 minutes of reaction.
Single molecule trajectories in a representative area are shown in the insets.
93
In order to show the influence of growing network in translational diffusion, the mean
square displacements (MSD) were plotted as a function of or against time lag, for all
the systems. Figure 40 shows the data of MSD related to the two last steps of
polymerization, measured by WFM. The results confirm features previously discussed.
Systems 1 and 3 present equivalent evolution of the MSD values, for both steps, 180
and 260 min. While the evolution of the MSD for the System 2 presents low values
even at 120 min. For the measurement performed at 180 min, the last one before total
immobilization of the polymeric chains shows values close to zero, during all the time
lag, wherein after 0.8 s is only 0.055 m2.
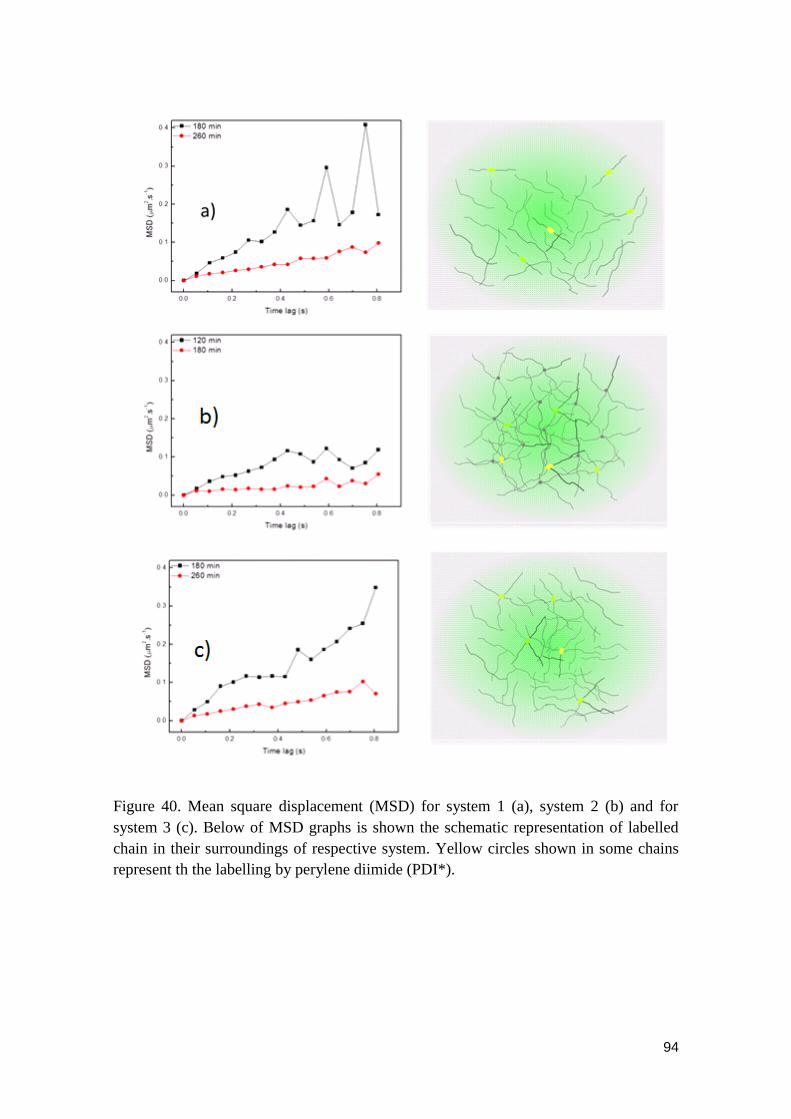
94
Figure 40. Mean square displacement (MSD) for system 1 (a), system 2 (b) and for
system 3 (c). Below of MSD graphs is shown the schematic representation of labelled
chain in their surroundings of respective system. Yellow circles shown in some chains
represent th the labelling by perylene diimide (PDI*).
95
4 CONCLUSIONS
In this study, we present a direct method to investigate diffusion parameters of
polymerization of styrene mediated by linear and star-shaped nitroxide-based initiators.
Our methodology is based on the use of labelled initiators, which produce fluorescent
polymers. The growth of probed polymer chains occurs with polymerization at bulk
level. The results presented here provide direct measurements of molecular diffusion
within a polymeric matrix during their polymerization processes. Systems 1 and 3 show
similar development of the diffusion properties. Whereas system 2 shows narrow step-
length distribution and low values of MSD (0.055 m2 after 0.8 s) after 180 min,
systems 1 and 3 present close values for all parameters investigated, including broad
range of step-length distribution, similar values for conversion evolution and MSD.
Systems 1 and 3 were based in bulk polymerization mediated by linear initiator.
Whereas System 1 was probed by fluorescent linear initiator 3, System 3 was probed by
fluorescent star-shaped initiator 4. On the other hand, the bulk polymerization of
System 2 was obtained by star-shaped initiator and probed by star-shaped initiators.
Therefore, during the polymerization progress, viscosity seems to have the predominant
role in the determination of the translational diffusion of polymer chains, which
explains the similarities of dynamic properties of Systems 1 and 2, while System 3
proceeds in a different way.
96
REFERENCES
1 SIRO, I.; PLACKETT, D. Microfibrillated cellulose and new nanocomposite materials: a review. Cellulose, v. 17, n. 3, p. 459-494, Jun 2010. ISSN 0969-0239. Disponível em: < <Go to ISI>://WOS:000277637100001 >.
2
WU, C.-N. et al. Ultrastrong and High Gas-Barrier Nanocellulose/Clay-Layered Composites. Biomacromolecules, v. 13, n. 6, p. 1927-1932, Jun 2012. ISSN 1525-7797. Disponível em: < <Go to ISI>://WOS:000304978900025 >.
3
XIE, K.; YU, Y.; SHI, Y. Synthesis and characterization of cellulose/silica hybrid materials with chemical crosslinking. Carbohydrate Polymers, v. 78, n. 4, p. 799-805, Nov 17 2009. ISSN 0144-8617. Disponível em: < <Go to ISI>://WOS:000270624200023 >.
4
SAKA, S.; GORING, D. A. I. THE DISTRIBUTION OF LIGNIN IN WHITE BIRCH WOOD AS DETERMINED BY BROMINATION WITH TEM-EDXA. Holzforschung, v. 42, n. 3, p. 149-153, Jun 1988. ISSN 0018-3830. Disponível em: < <Go to ISI>://WOS:A1988N819300002 >.
5
SUN, Y.; CHENG, J. Y. Hydrolysis of lignocellulosic materials for ethanol production: a review. Bioresource Technology, v. 83, n. 1, p. 1-11, May 2002. ISSN 0960-8524. Disponível em: < <Go to ISI>://WOS:000175355300001 >.
6
MOSIER, N. et al. Features of promising technologies for pretreatment of lignocellulosic biomass. Bioresource Technology, v. 96, n. 6, p. 673-686, Apr 2005. ISSN 0960-8524. Disponível em: < <Go to ISI>://WOS:000226450700004 >.
7
KLEMM, D. et al. Cellulose: Fascinating biopolymer and sustainable raw material. Angewandte Chemie-International Edition, v. 44, n. 22, p. 3358-3393, 2005 2005. ISSN 1433-7851. Disponível em: < <Go to ISI>://WOS:000229549100003 >.
8
DEMIRBAS, A. Biodiesel production from vegetable oils via catalytic and non-catalytic supercritical methanol transesterification methods. Progress in Energy and Combustion Science, v. 31, n. 5-6, p. 466-487, 2005 2005. ISSN 0360-1285. Disponível em: < <Go to ISI>://WOS:000234163800003 >.
9
______. Progress and recent trends in biofuels. Progress in Energy and Combustion Science, v. 33, n. 1, p. 1-18, Feb 2007. ISSN 0360-1285. Disponível em: < <Go to ISI>://WOS:000244093600001 >.
10
SANTOS, F. A. et al. POTENTIAL OF SUGARCANE STRAW FOR ETHANOL PRODUCTION. Quimica Nova, v. 35, n. 5, p. 1004-1010, 2012 2012. ISSN 0100-4042. Disponível em: < <Go to ISI>://WOS:000306136000025 >.
11
OLSSON, L.; HAHNHAGERDAL, B. Fermentation of lignocellulosic hydrolysates for ethanol production. Enzyme and Microbial Technology, v. 18, n. 5, p. 312-331, Apr 1996. ISSN 0141-0229. Disponível em: < <Go to ISI>://WOS:A1996UC09600001 >.
12
LI, H.-Y. et al. Structural and dynamic changes of lignin in Eucalyptus cell walls during successive alkaline ethanol treatments. Industrial Crops and Products, v. 74, p. 200-
97
208, Nov 15 2015. ISSN 0926-6690. Disponível em: < <Go to ISI>://WOS:000360948900027 >.
13
KANBAYASHI, T.; MIYAFUJI, H. Topochemical and morphological characterization of wood cell wall treated with the ionic liquid, 1-ethylpyridinium bromide. Planta, v. 242, n. 3, p. 509-518, Sep 2015. ISSN 0032-0935. Disponível em: < <Go to ISI>://WOS:000359831900002 >.
14
LI, H.-Y. et al. Structural characterization of hemicelluloses and topochemical changes in Eucalyptus cell wall during alkali ethanol treatment. Carbohydrate Polymers, v. 123, p. 17-26, Jun 5 2015. ISSN 0144-8617. Disponível em: < <Go to ISI>://WOS:000353754000003 >.
15
COLETTA, V. C. et al. Mapping the lignin distribution in pretreated sugarcane bagasse by confocal and fluorescence lifetime imaging microscopy. Biotechnology for Biofuels, v. 6, Apr 1 2013. ISSN 1754-6834. Disponível em: < <Go to ISI>://WOS:000317667800001 >.
16
CALLIS, P. R. ON THE THEORY OF 2-PHOTON INDUCED FLUORESCENCE ANISOTROPY WITH APPLICATION TO INDOLES. Journal of Chemical Physics, v. 99, n. 1, p. 27-37, Jul 1 1993. ISSN 0021-9606. Disponível em: < <Go to ISI>://WOS:A1993LJ30800005 >.
17
CLAPP, A. R. et al. Two-photon excitation of quantum-dot-based fluorescence resonance energy transfer and its applications. Advanced Materials, v. 19, n. 15, p. 1921-+, Aug 3 2007. ISSN 0935-9648. Disponível em: < <Go to ISI>://WOS:000248706900003 >.
18
DENK, W.; STRICKLER, J. H.; WEBB, W. W. 2-PHOTON LASER SCANNING FLUORESCENCE MICROSCOPY. Science, v. 248, n. 4951, p. 73-76, Apr 6 1990. ISSN 0036-8075. Disponível em: < <Go to ISI>://WOS:A1990CX64600035 >.
19
HELMCHEN, F.; DENK, W. Deep tissue two-photon microscopy. Nature Methods, v. 2, n. 12, p. 932-940, Dec 2005. ISSN 1548-7091. Disponível em: < <Go to ISI>://WOS:000233767700015 >.
20
KONIG, K. Multiphoton microscopy in life sciences. Journal of Microscopy-Oxford, v. 200, p. 83-104, Nov 2000. ISSN 0022-2720. Disponível em: < <Go to ISI>://WOS:000165557000001 >.
21
VAZQUEZ-COOZ, I.; MEYER, R. W. A differential staining method to identify lignified and unlignified tissues. Biotechnic & Histochemistry, v. 77, n. 5-6, p. 277-282, Sep-Nov 2002. ISSN 1052-0295. Disponível em: < <Go to ISI>://WOS:000180013200002 >.
22
HOROBIN, R. Conn’s Biological Stains: A Handbook of Dyes, Stains and Fluorochromes for Use in Biology andMedicine. 1st ed. Oxford: Taylor and Francis, 2002. 502
23
BOND, J. et al. Safranine fluorescent staining of wood cell walls. Biotechnic & Histochemistry, v. 83, n. 3-4, p. 161-171, 2008 2008. ISSN 1052-0295. Disponível em: < <Go to ISI>://WOS:000260259500005 >.
98
24 GRAY, K. A. Cellulosic ethanol - state of the technology. International Sugar Journal, v. 109, n. 1299, p. 145-+, Mar 2007. ISSN 0020-8841. Disponível em: < <Go to ISI>://WOS:000244980600008 >.
25
OLMSTEAD, J. A.; GRAY, D. G. FLUORESCENCE EMISSION FROM MECHANICAL PULP SHEETS. Journal of Photochemistry and Photobiology a-Chemistry, v. 73, n. 1, p. 59-65, Jun 15 1993. ISSN 1010-6030. Disponível em: < <Go to ISI>://WOS:A1993LM42600008 >.
26
______. Fluorescence spectroscopy of cellulose, lignin and mechanical pulps: A review. Journal of Pulp and Paper Science, v. 23, n. 12, p. J571-J581, Dec 1997. ISSN 0826-6220. Disponível em: < <Go to ISI>://WOS:000071166900005 >.
27
HAUSTEIN, E.; SCHWILLE, P. Fluorescence correlation spectroscopy: Novel variations of an established technique. Annual Review of Biophysics and Biomolecular Structure, v. 36, p. 151-169, 2007 2007. ISSN 1056-8700. Disponível em: < <Go to ISI>://WOS:000247773000008 >.
28
SINGH, A. P. et al. Ray tracheids in Pinus radiata are more highly resistant to soft rot as compared to axial tracheids: relationship to lignin concentration. Wood Science and Technology, v. 40, n. 1, p. 16-25, Jan 2006. ISSN 0043-7719. Disponível em: < <Go to ISI>://WOS:000235451300004 >.
29
SPERANZA, M. et al. Sterols and lignin in Eucalyptus globulus Labill. wood: Spatial distribution and fungal removal as revealed by microscopy and chemical analyses. Holzforschung, v. 63, n. 3, p. 362-370, May 2009. ISSN 0018-3830. Disponível em: < <Go to ISI>://WOS:000266016900017 >.
30
CHUNDAWAT, S. P. S. et al. Multi-scale visualization and characterization of lignocellulosic plant cell wall deconstruction during thermochemical pretreatment. Energy & Environmental Science, v. 4, n. 3, p. 973-984, Mar 2011. ISSN 1754-5692. Disponível em: < <Go to ISI>://WOS:000287924700044 >.
31
LU, P.; HSIEH, Y.-L. Preparation and properties of cellulose nanocrystals: Rods, spheres, and network. Carbohydrate Polymers, v. 82, n. 2, p. 329-336, Sep 5 2010. ISSN 0144-8617. Disponível em: < <Go to ISI>://WOS:000280574600016 >.
32
CHARREAU, H.; FORESTI, M. L.; VAZQUEZ, A. Nanocellulose Patents Trends: A Comprehensive Review on Patents on Cellulose Nanocrystals, Microfibrillated and Bacterial Cellulose. Recent Patents on Nanotechnology, v. 7, n. 1, p. 56-80, Jan 2013. ISSN 1872-2105. Disponível em: < <Go to ISI>://WOS:000311935600006 >.
33
SAMIR, M.; ALLOIN, F.; DUFRESNE, A. Review of recent research into cellulosic whiskers, their properties and their application in nanocomposite field. Biomacromolecules, v. 6, n. 2, p. 612-626, Mar-Apr 2005. ISSN 1525-7797. Disponível em: < <Go to ISI>://WOS:000227687800014 >.
34
HABIBI, Y.; LUCIA, L. A.; ROJAS, O. J. Cellulose Nanocrystals: Chemistry, Self-Assembly, and Applications. Chemical Reviews, v. 110, n. 6, p. 3479-3500, Jun 2010. ISSN 0009-2665. Disponível em: < <Go to ISI>://WOS:000278719900006 >.
35
PENG, B. L. et al. CHEMISTRY AND APPLICATIONS OF NANOCRYSTALLINE CELLULOSE AND ITS DERIVATIVES: A NANOTECHNOLOGY PERSPECTIVE.
99
Canadian Journal of Chemical Engineering, v. 89, n. 5, p. 1191-1206, Oct 2011. ISSN 0008-4034. Disponível em: < <Go to ISI>://WOS:000295223800023 >.
36
YE, D. Preparation of nanocellulose. Progress in Chemistry, v. 19, n. 10, p. 1568-1575, Oct 2007. ISSN 1005-281X. Disponível em: < <Go to ISI>://WOS:000250283200015 >.
37
GARDNER, D. J. et al. Adhesion and surface issues in cellulose and nanocellulose. Journal of Adhesion Science and Technology, v. 22, n. 5-6, p. 545-567, 2008 2008. ISSN 0169-4243. Disponível em: < <Go to ISI>://WOS:000258034000009 >.
38
SANDQUIST, D. New horizons for microfibrillated cellulose. Appita Journal, v. 66, n. 2, p. 156-162, Apr-Jun 2013. ISSN 1038-6807. Disponível em: < <Go to ISI>://WOS:000316926600022 >.
39
BL, B. Methods on wood chemistry. New York: Interscience Publishers, 1967.
40
LENCIONE, D.; GEHLEN, M. H. Grupo de Fluorescência Molecular. 2016. Disponível em: < http://gfm.iqsc.usp.br/pesquisa/equipamentos/ >. Acesso em: 05/2016.
41
LENCIONE, D. et al. The spatial distribution of the photostability of thionine in zeolite L nanochannels investigated by Photobleaching Lifetime Imaging Microscopy. Photochemical & Photobiological Sciences, v. 15, n. 3, p. 398-404, 2016 2016. ISSN 1474-905X. Disponível em: < <Go to ISI>://WOS:000372249700011 >.
42
NOVAES REIS CORRALES, R. C. et al. Structural evaluation of sugar cane bagasse steam pretreated in the presence of CO2 and SO2. Biotechnology for Biofuels, v. 5, May 22 2012. ISSN 1754-6834. Disponível em: < <Go to ISI>://WOS:000308310600001 >.
43
CHIMENEZ, T. A. et al. Characterization of sugarcane bagasse by autofluorescence microscopy. Cellulose, v. 21, n. 1, p. 653-664, Feb 2014. ISSN 0969-0239. Disponível em: < <Go to ISI>://WOS:000330807000052 >.
44
HARTER, K.; MEIXNER, A. J.; SCHLEIFENBAUM, F. Spectro-Microscopy of Living Plant Cells. Molecular Plant, v. 5, n. 1, p. 14-26, Jan 2012. ISSN 1674-2052. Disponível em: < <Go to ISI>://CCC:000299347400002 >.
45
CHENG, P. C. et al. Multiphoton excited fluorescence spectra of common bio-probes. Scanning, v. 22, n. 3, p. 187-188, 2000.
46
BENEDIKTYOVA, Z.; NEDBAL, L. Imaging of multi-color fluorescence emission from leaf tissues. Photosynthesis Research, v. 102, n. 2-3, p. 169-175, Dec 2009. ISSN 0166-8595. Disponível em: < <Go to ISI>://WOS:000271795400006 >.
47
CHENG, P. C. et al. Highly efficient upconverters for multiphoton fluorescence microscopy. Journal of Microscopy-Oxford, v. 189, p. 199-212, Mar 1998. ISSN 0022-2720. Disponível em: < <Go to ISI>://WOS:000073131900004 >.
100
48 ______. Multi-photon fluorescence spectroscopy of fluorescent bio-probes and bio-molecules. Conference on Optical Sensing, Imaging, and Manipulation for Biological and Biomedical Applications. Taipei, Taiwan. Jul 26-28, 2000. 87-91 p.
49
ULRICH, V. et al. Compact multiphoton/single photon laser scanning microscope for spectral imaging and fluorescence lifetime imaging. Scanning, v. 26, n. 5, p. 217-225, Sep-Oct 2004. ISSN 0161-0457. Disponível em: < <Go to ISI>://WOS:000224520900002 >.
50
HESKES, A. M. et al. Multiphoton fluorescence lifetime imaging shows spatial segregation of secondary metabolites in Eucalyptus secretory cavities. Journal of Microscopy, v. 247, n. 1, p. 33-42, Jul 2012. ISSN 0022-2720. Disponível em: < <Go to ISI>://WOS:000305062700005 >.
51
CASTELLAN, A.; DAVIDSON, R. S. STEADY-STATE AND DYNAMIC FLUORESCENCE EMISSION FROM ABIES WOOD. Journal of Photochemistry and Photobiology a-Chemistry, v. 78, n. 3, Mar 29 1994. ISSN 1010-6030. Disponível em: < <Go to ISI>://WOS:A1994NB57000014 >.
52
SCHWILLE, P. et al. Molecular dynamics in living cells observed by fluorescence correlation spectroscopy with one- and two-photon excitation. Biophysical Journal, v. 77, n. 4, p. 2251-2265, Oct 1999. ISSN 0006-3495. Disponível em: < <Go to ISI>://WOS:000083059800044 >.
53
ALBINSSON, B. et al. The origin of lignin fluorescence. Journal of Molecular Structure, v. 508, n. 1-3, p. 19-27, Sep 14 1999. ISSN 0022-2860. Disponível em: < <Go to ISI>://WOS:000082701800003 >.
54
BILLINTON, N.; KNIGHT, A. W. Seeing the wood through the trees: A review of techniques for distinguishing green fluorescent protein from endogenous autofluorescence. Analytical Biochemistry, v. 291, n. 2, p. 175-197, Apr 15 2001. ISSN 0003-2697. Disponível em: < <Go to ISI>://WOS:000168255800001 >.
55
HAFREN, J.; OOSTERVELD-HUT, H. M. J. Fluorescence lifetime imaging microscopy study of wood fibers. Journal of Wood Science, v. 55, n. 3, Jun 2009. ISSN 1435-0211. Disponível em: < <Go to ISI>://WOS:000266912000013 >.
56
CASTELLAN, A. et al. Studies on fluorescence of cellulosics. Holzforschung, v. 61, n. 5, p. 504-508, 2007 2007. ISSN 0018-3830. Disponível em: < <Go to ISI>://WOS:000249326500007 >.
57
JONOOBI, M. et al. Different preparation methods and properties of nanostructured cellulose from various natural resources and residues: a review. Cellulose, v. 22, n. 2, p. 935-969, Apr 2015. ISSN 0969-0239. Disponível em: < <Go to ISI>://WOS:000350876300002 >.
58
MOON, S.-J. et al. Characterization of lignin-rich residues remaining after continuous super-critical water hydrolysis of poplar wood (Populus albaglandulosa) for conversion to fermentable sugars. Bioresource Technology, v. 102, n. 10, p. 5912-5916, May 2011. ISSN 0960-8524. Disponível em: < <Go to ISI>://WOS:000291125800050 >.
59
ELAZZOUZI-HAFRAOUI, S. et al. The shape and size distribution of crystalline nanoparticles prepared by acid hydrolysis of native cellulose. Biomacromolecules, v.
101
9, n. 1, p. 57-65, Jan 2008. ISSN 1525-7797. Disponível em: < <Go to ISI>://WOS:000252415600010 >.
60
WANG, N.; DING, E.; CHENG, R. Preparation and 'liquid crystalline properties of spherical cellulose nanocrystals. Langmuir, v. 24, n. 1, p. 5-8, Jan 1 2008. ISSN 0743-7463. Disponível em: < <Go to ISI>://WOS:000251916100002 >.
61
GOELZER, F. D. E. et al. Production and characterization of nanospheres of bacterial cellulose from Acetobacter xylinum from processed rice bark. Materials Science & Engineering C-Biomimetic and Supramolecular Systems, v. 29, n. 2, p. 546-551, Mar 1 2009. ISSN 0928-4931. Disponível em: < <Go to ISI>://WOS:000264694600036 >.
62
FILSON, P. B.; DAWSON-ANDOH, B. E. Characterization of sugars from model and enzyme-mediated pulp hydrolyzates using high-performance liquid chromatography coupled to evaporative light scattering detection. Bioresource Technology, v. 100, n. 24, p. 6661-6664, Dec 2009. ISSN 0960-8524. Disponível em: < <Go to ISI>://WOS:000270147700075 >.
63
______. Sono-chemical preparation of cellulose nanocrystals from lignocellulose derived materials. Bioresource Technology, v. 100, n. 7, p. 2259-2264, Apr 2009. ISSN 0960-8524. Disponível em: < <Go to ISI>://WOS:000263018300025 >.
64
PANDEY, J. K. et al. Evaluation of morphological architecture of cellulose chains in grass during conversion from macro to nano dimensions. E-Polymers, Aug 12 2009. ISSN 1618-7229. Disponível em: < <Go to ISI>://WOS:000268991200002 >.
65
LAVOINE, N. et al. Microfibrillated cellulose - Its barrier properties and applications in cellulosic materials: A review. Carbohydrate Polymers, v. 90, n. 2, p. 735-764, Oct 1 2012. ISSN 0144-8617. Disponível em: < <Go to ISI>://WOS:000307616500001 >.
66
DUFRESNE, A. CELL 62-Cellulose whiskers reinforced polyvinyl alcohol copolymers nanocomposites. Abstracts of Papers of the American Chemical Society, v. 235, Apr 6 2008. ISSN 0065-7727. Disponível em: < <Go to ISI>://WOS:000271775101186 >.
67
______. Processing of Polymer Nanocomposites Reinforced with Polysaccharide Nanocrystals. Molecules, v. 15, n. 6, p. 4111-4128, Jun 2010. ISSN 1420-3049. Disponível em: < <Go to ISI>://WOS:000279207300023 >.
68
DURAN, N.; LEMES, A. P.; SEABRA, A. B. Review of Cellulose Nanocrystals Patents: Preparation, Composites and General Applications. Recent Patents on Nanotechnology, v. 6, n. 1, p. 16-28, Jan 2012. ISSN 1872-2105. Disponível em: < <Go to ISI>://WOS:000304443400004 >.
69
EICHHORN, S. J. et al. Review: current international research into cellulose nanofibres and nanocomposites. Journal of Materials Science, v. 45, n. 1, p. 1-33, Jan 2010. ISSN 0022-2461. Disponível em: < <Go to ISI>://WOS:000272904700001 >.
70
HUBBE, M. A.; ROJAS, O. J. COLLOIDAL STABILITY AND AGGREGATION OF LIGNOCELLULOSIC MATERIALS IN AQUEOUS SUSPENSION: A REVIEW. Bioresources, v. 3, n. 4, p. 1419-1491, Nov 2008. ISSN 1930-2126. Disponível em: < <Go to ISI>://WOS:000263690200035 >.
102
71
KLEMM, D. et al. Nanocelluloses: A New Family of Nature-Based Materials. Angewandte Chemie-International Edition, v. 50, n. 24, p. 5438-5466, 2011 2011. ISSN 1433-7851. Disponível em: < <Go to ISI>://WOS:000291997000004 >.
72
SAIN, M.; OKSMAN, K. Introduction to cellulose nanocomposites. Cellulose Nanocomposites: Processing, Characterization, and Properties, v. 938, p. 2-8, 2006 2006. ISSN 0097-6156. Disponível em: < <Go to ISI>://WOS:000239747600001 >.
73
SIQUEIRA, G.; BRAS, J.; DUFRESNE, A. Cellulosic Bionanocomposites: A Review of Preparation, Properties and Applications. Polymers, v. 2, n. 4, p. 728-765, Dec 2010. ISSN 2073-4360. Disponível em: < <Go to ISI>://WOS:000208601200022 >.
74
VISAKH, P. M.; THOMAS, S. Preparation of Bionanomaterials and their Polymer Nanocomposites from Waste and Biomass. Waste and Biomass Valorization, v. 1, n. 1, p. 121-134, Mar 2010. ISSN 1877-2641. Disponível em: < <Go to ISI>://WOS:000209196100011 >.
75
THIELEMANS, W.; WARBEY, C. R.; WALSH, D. A. Permselective nanostructured membranes based on cellulose nanowhiskers. Green Chemistry, v. 11, n. 4, p. 531-537, 2009 2009. ISSN 1463-9262. Disponível em: < <Go to ISI>://WOS:000264978500015 >.
76
JIANG, Z. et al. Method of bonding comprises applying a nanocrystalline cellulose suspension between first and second surfaces, bringing the surfaces into contact with the suspension between them, and drying the suspension: Fpinnovations.
77
SAMIR, M. et al. Cellulose nanocrystals reinforced poly(oxyethylene). Polymer, v. 45, n. 12, p. 4149-4157, May 20 2004. ISSN 0032-3861. Disponível em: < <Go to ISI>://WOS:000221779000019 >.
78
SAMIR, M. A. S. A.; ALLOIN, F.; DUFRESNE, A. High performance nanocomposite polymer electrolytes. Composite Interfaces, v. 13, n. 4-6, p. 545-559, 2006 2006. ISSN 0927-6440. Disponível em: < <Go to ISI>://WOS:000239540100019 >.
79
SCHROERS, M.; KOKIL, A.; WEDER, C. Solid polymer electrolytes based on nanocomposites of ethylene oxide-epichlorohydrin copolymers and cellulose whiskers. Journal of Applied Polymer Science, v. 93, n. 6, p. 2883-2888, Sep 15 2004. ISSN 0021-8995. Disponível em: < <Go to ISI>://WOS:000223068300043 >.
80
FLEMING, K. et al. Cellulose crystallites: A new and robust liquid crystalline medium for the measurement of residual dipolar couplings. Journal of the American Chemical Society, v. 122, n. 21, p. 5224-5225, May 31 2000. ISSN 0002-7863. Disponível em: < <Go to ISI>://WOS:000087559700029 >.
81
BEN DOUISSA, N. et al. Macroscopic and microscopic studies of methylene blue sorption onto extracted celluloses from Posidonia oceanica. Industrial Crops and Products, v. 45, p. 106-113, Feb 2013. ISSN 0926-6690. Disponível em: < <Go to ISI>://WOS:000316832000016 >.
103
82 CARREIRA, P. et al. Utilization of residues from agro-forest industries in the production of high value bacterial cellulose. Bioresource Technology, v. 102, n. 15, p. 7354-7360, Aug 2011. ISSN 0960-8524. Disponível em: < <Go to ISI>://WOS:000292668000018 >.
83
MORAN, J. I. et al. Extraction of cellulose and preparation of nanocellulose from sisal fibers. Cellulose, v. 15, n. 1, p. 149-159, Feb 2008. ISSN 0969-0239. Disponível em: < <Go to ISI>://WOS:000252156600016 >.
84
CHERIAN, B. M. et al. Isolation of nanocellulose from pineapple leaf fibres by steam explosion. Carbohydrate Polymers, v. 81, n. 3, p. 720-725, Jul 7 2010. ISSN 0144-8617. Disponível em: < <Go to ISI>://WOS:000278720200032 >.
85
MANDAL, A.; CHAKRABARTY, D. Isolation of nanocellulose from waste sugarcane bagasse (SCB) and its characterization. Carbohydrate Polymers, v. 86, n. 3, p. 1291-1299, Aug 30 2011. ISSN 0144-8617; 1879-1344. Disponível em: < <Go to ISI>://WOS:000295308500027 >.
86
KAUSHIK, A.; SINGH, M. Isolation and characterization of cellulose nanofibrils from wheat straw using steam explosion coupled with high shear homogenization. Carbohydrate Research, v. 346, n. 1, p. 76-85, Jan 3 2011. ISSN 0008-6215. Disponível em: < <Go to ISI>://WOS:000286715700010 >.
87
ABITBOL, T. et al. Fluorescent Labeling and Characterization of Cellulose Nanocrystals with Varying Charge Contents. Biomacromolecules, v. 14, n. 9, p. 3278-3284, Sep 2013. ISSN 1525-7797. Disponível em: < <Go to ISI>://WOS:000330095500036 >.
88
GIERLINGER, N.; SCHWANNINGER, M. The potential of Raman microscopy and Raman imaging in plant research. Spectroscopy-an International Journal, v. 21, n. 2, p. 69-89, 2007 2007. ISSN 0712-4813. Disponível em: < <Go to ISI>://WOS:000248374300001 >.
89
HERMAN, B. Applications of fluorescence microscopy. Microscopy Handbooks; Fluorescence microscopy, Second edition, v. 40, p. 47-68, 1998 1998. ISSN 0957-0365. Disponível em: < <Go to ISI>://BCI:BCI199800373357 >.
90
VAN MUNSTER, E. B.; GADELLA, T. W. J. Fluorescence Lifetime Imaging Microscopy (FLIM). 95: 143-175 p. 2005.
91
HARKE, B. et al. Resolution scaling in STED microscopy. Optics Express, v. 16, n. 6, p. 4154-4162, Mar 17 2008. ISSN 1094-4087. Disponível em: < <Go to ISI>://WOS:000254121400072 >.
92
HOTTA, J.-I. et al. Spectroscopic Rationale for Efficient Stimulated-Emission Depletion Microscopy Fluorophores. Journal of the American Chemical Society, v. 132, n. 14, p. 5021-+, Apr 14 2010. ISSN 0002-7863. Disponível em: < <Go to ISI>://WOS:000276553700023 >.
93
WILLIG, K. I. et al. STED microscopy with continuous wave beams. Nature Methods, v. 4, n. 11, p. 915-918, Nov 2007. ISSN 1548-7091. Disponível em: < <Go to ISI>://WOS:000250575700014 >.
104
94
MIN, W. et al. Fluctuating enzymes: Lessons from single-molecule studies. Accounts of Chemical Research, v. 38, n. 12, p. 923-931, Dec 2005. ISSN 0001-4842. Disponível em: < <Go to ISI>://WOS:000234178100004 >.
95
MIZUNO, H. et al. Fluorescent probes for superresolution imaging of lipid domains on the plasma membrane. Chemical Science, v. 2, n. 8, p. 1548-1553, 2011 2011. ISSN 2041-6520. Disponível em: < <Go to ISI>://WOS:000292964700019 >.
96
CHEN, H. Z. et al. 1999. (7). Journal of Cellulose Science and Technology,
97
WADA, M.; HEUX, L.; SUGIYAMA, J. Polymorphism of cellulose I family: Reinvestigation of cellulose IV. Biomacromolecules, v. 5, n. 4, p. 1385-1391, Jul-Aug 2004. ISSN 1525-7797. Disponível em: < <Go to ISI>://WOS:000222668500032 >.
98
SEGAL, L. et al. An empirical method for estimating the degree of crystallinity of native cellulose using the X-ray diffractometer. Textile Research Journal, v. 29, n. (10), p. 786-794, 1959.
99
PALMQVIST, E.; HAHN-HAGERDAL, B. Fermentation of lignocellulosic hydrolysates. II: inhibitors and mechanisms of inhibition. Bioresource Technology, v. 74, n. 1, p. 25-33, Aug 2000. ISSN 0960-8524. Disponível em: < <Go to ISI>://WOS:000086842700004 >.
100
GOUVEIA, E. R.; NASCIMENTO, R. T.; SOUTO-MAIOR, A. M. VALIDAÇÃO DE METODOLOGIA PARA A CARACTERIZAÇÃO QUÍMICA DE BAGAÇO DE CANA-DE-AÇÚCAR. Química Nova. Brazil. 32: 1500-1503 p. 2009.
101
PEPONI, L. et al. Processing of nanostructured polymers and advanced polymeric based nanocomposites. Materials Science & Engineering R-Reports, v. 85, p. 1-46, Nov 2014. ISSN 0927-796X. Disponível em: < <Go to ISI>://WOS:000343628500001 >.
102
OJIJO, V.; RAY, S. S. Processing strategies in bionanocomposites. Progress in Polymer Science, v. 38, n. 10-11, p. 1543-1589, Oct-Nov 2013. ISSN 0079-6700. Disponível em: < <Go to ISI>://WOS:000325953700008 >.
103
LI, W. et al. Enhanced thermal and mechanical properties of PVA composites formed with filamentous nanocellulose fibrils. Carbohydrate Polymers, v. 113, p. 403-410, Nov 26 2014. ISSN 0144-8617. Disponível em: < <Go to ISI>://WOS:000343613000051 >.
104
PARALIKARA, S. A.; SIMONSEN, J.; LOMBARDI, J. Poly(vinyl alcohol)/cellulose nanocrystal barrier membranes. Journal of Membrane Science, v. 320, n. 1-2, p. 248-258, Jul 15 2008. ISSN 0376-7388. Disponível em: < <Go to ISI>://WOS:000257834700029 >.
105
MONTAZER, M.; SHAMEI, A.; ALIMOHAMMADI, F. Synthesizing and stabilizing silver nanoparticles on polyamide fabric using silver-ammonia/PVP/UVC. Progress in Organic Coatings, v. 75, n. 4, p. 379-385, Dec 2012. ISSN 0300-9440. Disponível em: < <Go to ISI>://WOS:000309695700014 >.
105
106 XU, S.; SHI, Y. Low temperature high sensor response nano gas sensor using ITO nanofibers. Sensors and Actuators B-Chemical, v. 143, n. 1, p. 71-75, Dec 4 2009. ISSN 0925-4005. Disponível em: < <Go to ISI>://WOS:000272376800012 >.
107
SCHERMELLEH, L.; HEINTZMANN, R.; LEONHARDT, H. A guide to super-resolution fluorescence microscopy. Journal of Cell Biology, v. 190, n. 2, p. 165-175, Jul 26 2010. ISSN 0021-9525. Disponível em: < <Go to ISI>://WOS:000280593300003 >.
108
NAEGERL, U. V. et al. Live-cell imaging of dendritic spines by STED microscopy. Proceedings of the National Academy of Sciences of the United States of America, v. 105, n. 48, p. 18982-18987, Dec 2 2008. ISSN 0027-8424. Disponível em: < <Go to ISI>://WOS:000261489100067 >.
109
AKHLAGHI, S. P. et al. Synthesis of amine functionalized cellulose nanocrystals: optimization and characterization. Carbohydrate Research, v. 409, p. 48-55, May 29 2015. ISSN 0008-6215. Disponível em: < <Go to ISI>://WOS:000354570100008 >.
110
LIMA, M. M. D.; BORSALI, R. Rodlike cellulose microcrystals: Structure, properties, and applications. Macromolecular Rapid Communications, v. 25, n. 7, p. 771-787, Apr 6 2004. ISSN 1022-1336. Disponível em: < <Go to ISI>://WOS:000220774400001 >.
111
ROSILO, H. et al. Cationic polymer brush-modified cellulose nanocrystals for high-affinity virus binding. Nanoscale, v. 6, n. 20, p. 11871-11881, 2014 2014. ISSN 2040-3364. Disponível em: < <Go to ISI>://WOS:000343000800036 >.
112
HABIBI, Y.; CHANZY, H.; VIGNON, M. R. TEMPO-mediated surface oxidation of cellulose whiskers. Cellulose, v. 13, n. 6, p. 679-687, Dec 2006. ISSN 0969-0239. Disponível em: < <Go to ISI>://WOS:000240897400008 >.
113
GOUSSE, C. et al. Stable suspensions of partially silylated cellulose whiskers dispersed in organic solvents. Polymer, v. 43, n. 9, p. 2645-2651, Apr 2002. ISSN 0032-3861. Disponível em: < <Go to ISI>://WOS:000174631600008 >.
114
ELBIALY, N.; ABDELHAMID, M.; YOUSSEF, T. Low Power Argon Laser-Induced Thermal Therapy for Subcutaneous Ehrlich Carcinoma in Mice Using Spherical Gold Nanoparticles. Journal of Biomedical Nanotechnology, v. 6, n. 6, p. 687-693, Dec 2010. ISSN 1550-7033. Disponível em: < <Go to ISI>://WOS:000287337500009 >.
115
LU, J.; ASKELAND, P.; DRZAL, L. T. Surface modification of microfibrillated cellulose for epoxy composite applications. Polymer, v. 49, n. 5, p. 1285-1296, Mar 3 2008. ISSN 0032-3861. Disponível em: < <Go to ISI>://WOS:000254356400020 >.
116
WANG, W.-J.; WANG, W.-W.; SHAO, Z.-Q. Surface modification of cellulose nanowhiskers for application in thermosetting epoxy polymers. Cellulose, v. 21, n. 4, p. 2529-2538, Aug 2014. ISSN 0969-0239. Disponível em: < <Go to ISI>://WOS:000341490200030 >.
117
DONG, S.; ROMAN, M. Fluorescently labeled cellulose nanocrystals for bioimaging applications. Journal of the American Chemical Society, v. 129, n. 45, p. 13810-+, Nov 14 2007. ISSN 0002-7863. Disponível em: < <Go to ISI>://WOS:000250819300020 >.
106
118 GORGIEVA, S.; VOGRINCIC, R.; KOKOL, V. Polydispersity and assembling phenomena of native and reactive dye-labelled nanocellulose. Cellulose, v. 22, n. 6, p. 3541-3558, Dec 2015. ISSN 0969-0239. Disponível em: < <Go to ISI>://WOS:000364513800004 >.
119
NAVARRO, J. R. G. et al. Multicolor Fluorescent Labeling of Cellulose Nanofibrils by Click Chemistry. Biomacromolecules, v. 16, n. 4, p. 1293-1300, Apr 2015. ISSN 1525-7797. Disponível em: < <Go to ISI>://WOS:000353006000024 >.
120
EDWARDS, J. V. et al. Peptide conjugated cellulose nanocrystals with sensitive human neutrophil elastase sensor activity. Cellulose, v. 20, n. 3, p. 1223-1235, Jun 2013. ISSN 0969-0239. Disponível em: < <Go to ISI>://WOS:000318870500023 >.
121
SCHYRR, B. et al. Biosensors Based on Porous Cellulose Nanocrystal-Poly(vinyl Alcohol) Scaffolds. Acs Applied Materials & Interfaces, v. 6, n. 15, p. 12674-12683, Aug 13 2014. ISSN 1944-8244. Disponível em: < <Go to ISI>://WOS:000340446300102 >.
122
NAVARRO, J. R. G.; BERGSTROM, L. Labelling of N-hydroxysuccinimide-modified rhodamine B on cellulose nanofibrils by the amidation reaction. Rsc Advances, v. 4, n. 105, p. 60757-60761, 2014 2014. ISSN 2046-2069. Disponível em: < <Go to ISI>://WOS:000345655600041 >.
123
KOLB, H. C.; FINN, M. G.; SHARPLESS, K. B. Click chemistry: Diverse chemical function from a few good reactions. Angewandte Chemie-International Edition, v. 40, n. 11, p. 2004-+, 2001 2001. ISSN 1433-7851. Disponível em: < <Go to ISI>://WOS:000169168100001 >.
124
NEBHANI, L.; BARNER-KOWOLLIK, C. Orthogonal Transformations on Solid Substrates: Efficient Avenues to Surface Modification. Advanced Materials, v. 21, n. 34, p. 3442-3468, Sep 11 2009. ISSN 0935-9648. Disponível em: < <Go to ISI>://WOS:000270380100001 >.
125
JENNINGS, L. E.; LONG, N. J. 'Two is better than one'-probes for dual-modality molecular imaging. Chemical Communications, n. 24, p. 3511-3524, 2009 2009. ISSN 1359-7345. Disponível em: < <Go to ISI>://WOS:000266913400002 >.
126
HUBER, M. M. et al. Fluorescently detectable magnetic resonance imaging agents. Bioconjugate Chemistry, v. 9, n. 2, p. 242-249, Mar-Apr 1998. ISSN 1043-1802. Disponível em: < <Go to ISI>://WOS:000072654400013 >.
127
BODUNOV, E. N.; BERBERAN-SANTOS, M. N.; MARTINHO, J. M. G. Electronic energy transfer in linear polymers randomly labelled with chromophores. Chemical Physics, v. 274, n. 2-3, p. 243-253, Dec 15 2001. ISSN 0301-0104. Disponível em: < <Go to ISI>://WOS:000173015700014 >.
128
KRICHEVSKY, O.; BONNET, G. Fluorescence correlation spectroscopy: the technique and its applications. Reports on Progress in Physics, v. 65, n. 2, p. 251-297, Feb 2002. ISSN 0034-4885. Disponível em: < <Go to ISI>://WOS:000174236700003 >.
129
SCHWILLE, P. Fluorescence correlation spectroscopy and its potential for intracellular applications. Cell Biochemistry and Biophysics, v. 34, n. 3, p. 383-408, 2001 2001. ISSN 1085-9195. Disponível em: < <Go to ISI>://WOS:000170359500005 >.
107
130
LUSCHTINETZ, F.; DOSCHE, C. Determination of micelle diffusion coefficients with fluorescence correlation spectroscopy (FCS). Journal of Colloid and Interface Science, v. 338, n. 1, p. 312-315, Oct 1 2009. ISSN 0021-9797. Disponível em: < <Go to ISI>://WOS:000269401200045 >.
131
MAGDE, D.; WEBB, W. W.; ELSON, E. THERMODYNAMIC FLUCTUATIONS IN A REACTING SYSTEM - MEASUREMENT BY FLUORESCENCE CORRELATION SPECTROSCOPY. Physical Review Letters, v. 29, n. 11, p. 705-&, 1972 1972. ISSN 0031-9007. Disponível em: < <Go to ISI>://WOS:A1972N373500006 >.
132
MESETH, U. et al. Resolution of fluorescence correlation measurements. Biophysical Journal, v. 76, n. 3, p. 1619-1631, Mar 1999. ISSN 0006-3495. Disponível em: < <Go to ISI>://WOS:000078972300042 >.
133
SAFFARIAN, S.; ELSON, E. L. Statistical analysis of fluorescence correlation spectroscopy: The standard deviation and bias. Biophysical Journal, v. 84, n. 3, p. 2030-2042, Mar 2003. ISSN 0006-3495. Disponível em: < <Go to ISI>://WOS:000183123000056 >.
134
FRINGUELLI, F. et al. Ring opening of epoxides with sodium azide in water. A regioselective pH-controlled reaction. Journal of Organic Chemistry, v. 64, n. 16, p. 6094-6096, Aug 6 1999. ISSN 0022-3263. Disponível em: < <Go to ISI>://WOS:000081997500056 >.
135
PAHIMANOLIS, N. et al. Modification of dextran using click-chemistry approach in aqueous media. Carbohydrate Polymers, v. 82, n. 1, p. 78-82, Aug 2 2010. ISSN 0144-8617. Disponível em: < <Go to ISI>://WOS:000280574400012 >.
136
MUELLER, C. B. et al. Precise measurement of diffusion by multi-color dual-focus fluorescence correlation spectroscopy. Epl, v. 83, n. 4, 2008 2008. ISSN 0295-5075. Disponível em: < <Go to ISI>://WOS:000259025900017 >.
137
ANDERSON, C. M. et al. TRACKING OF CELL-SURFACE RECEPTORS BY FLUORESCENCE DIGITAL IMAGING MICROSCOPY USING A CHARGE-COUPLED DEVICE CAMERA - LOW-DENSITY-LIPOPROTEIN AND INFLUENZA-VIRUS RECEPTOR MOBILITY AT 4-DEGREES-C. Journal of Cell Science, v. 101, p. 415-425, Feb 1992. ISSN 0021-9533. Disponível em: < <Go to ISI>://WOS:A1992HJ06900015 >.
138
GRUNWALD, D. et al. Diffusion and binding properties investigated by Fluorescence Correlation Spectroscopy (FCS). Current Pharmaceutical Biotechnology, v. 6, n. 5, p. 381-386, Oct 2005. ISSN 1389-2010. Disponível em: < <Go to ISI>://WOS:000232871100003 >.
139
SAMIR, M. et al. Preparation of cellulose whiskers reinforced nanocomposites from an organic medium suspension. Macromolecules, v. 37, n. 4, p. 1386-1393, Feb 24 2004. ISSN 0024-9297. Disponível em: < <Go to ISI>://WOS:000189091800030 >.
140
MASON, T. G. Estimating the viscoelastic moduli of complex fluids using the generalized Stokes-Einstein equation. Rheologica Acta, v. 39, n. 4, p. 371-378, Aug 2000. ISSN 0035-4511. Disponível em: < <Go to ISI>://WOS:000088854900006 >.
108
141 YAMAMOTO, R.; ONUKI, A. Dynamics of highly supercooled liquids: Heterogeneity, rheology, and diffusion. Physical Review E, v. 58, n. 3, p. 3515-3529, Sep 1998. ISSN 1063-651X. Disponível em: < <Go to ISI>://WOS:000076007400034 >.
142
VAN LOKEREN, L. et al. Phosphoesterase activity of polyoxomolybdates: diffusion ordered NMR spectroscopy as a tool for obtaining insights into the reactivity of polyoxometalate clusters. Chemical Communications, n. 24, p. 2774-2776, 2008 2008. ISSN 1359-7345. Disponível em: < <Go to ISI>://WOS:000256653000014 >.
143
CANET, D. et al. The solution dynamics of amyloidogenic Asp67His variant of human lysozyme: Insights from hydrogen exchange. Biophysical Journal, v. 78, n. 1, p. 4A-4A, Jan 2000. ISSN 0006-3495. Disponível em: < <Go to ISI>://WOS:000084779300020 >.
144
ROPARS, V. et al. Unraveling protein dynamics through fast spectral density mapping. Journal of Biomolecular Nmr, v. 37, n. 3, p. 159-177, Mar 2007. ISSN 0925-2738. Disponível em: < <Go to ISI>://WOS:000244028700001 >.
145
BALINOV, B.; OLSSON, U.; SODERMAN, O. STRUCTURAL SIMILARITIES BETWEEN THE L3 AND BICONTINUOUS CUBIC PHASES IN THE AOT-BRINE SYSTEM. Journal of Physical Chemistry, v. 95, n. 15, p. 5931-5936, Jul 25 1991. ISSN 0022-3654. Disponível em: < <Go to ISI>://WOS:A1991FY38800041 >.
146
ARAKI, J. et al. Influence of surface charge on viscosity behavior of cellulose microcrystal suspension. Journal of Wood Science, v. 45, n. 3, p. 258-261, 1999 1999. ISSN 1435-0211. Disponível em: < <Go to ISI>://WOS:000081098000014 >.
147
FLIER, B. M. I. et al. Single molecule fluorescence microscopy investigations on heterogeneity of translational diffusion in thin polymer films. Physical Chemistry Chemical Physics, v. 13, n. 5, p. 1770-1775, 2011 2011. ISSN 1463-9076. Disponível em: < <Go to ISI>://WOS:000286388800007 >.
148
DEBUIGNE, A. et al. Interpolymer radical coupling: A toolbox complementary to controlled radical polymerization. Progress in Polymer Science, v. 37, n. 7, p. 1004-1030, Jul 2012. ISSN 0079-6700. Disponível em: < <Go to ISI>://WOS:000306625000005 >.
149
GEORGES, M. K. et al. NARROW MOLECULAR-WEIGHT RESINS BY A FREE-RADICAL POLYMERIZATION PROCESS. Macromolecules, v. 26, n. 11, p. 2987-2988, May 24 1993. ISSN 0024-9297. Disponível em: < <Go to ISI>://WOS:A1993LD86000054 >.
150
SCIANNAMEA, V.; JEROME, R.; DETREMBLEUR, C. In-situ nitroxide-mediated radical polymerization (NMP) processes: Their understanding and optimization. Chemical Reviews, v. 108, n. 3, p. 1104-1126, Mar 2008. ISSN 0009-2665; 1520-6890. Disponível em: < <Go to ISI>://WOS:000253947800005 >.
151
BRAUNECKER, W. A.; MATYJASZEWSKI, K. Controlled/living radical polymerization: Features, developments, and perspectives. Progress in Polymer Science, v. 32, n. 1, p. 93-146, Jan 2007. ISSN 0079-6700. Disponível em: < <Go to ISI>://WOS:000244408900003 >.
109
152 OUCHI, M.; TERASHIMA, T.; SAWAMOTO, M. Transition Metal-Catalyzed Living Radical Polymerization: Toward Perfection in Catalysis and Precision Polymer Synthesis. Chemical Reviews, v. 109, n. 11, p. 4963-5050, Nov 2009. ISSN 0009-2665. Disponível em: < <Go to ISI>://WOS:000271856900002 >.
153
DI LENA, F.; MATYJASZEWSKI, K. Transition metal catalysts for controlled radical polymerization. Progress in Polymer Science, v. 35, n. 8, p. 959-1021, Aug 2010. ISSN 0079-6700. Disponível em: < <Go to ISI>://WOS:000280614500001 >.
154
MOAD, G.; RIZZARDO, E.; THANG, S. H. Toward living radical polymerization. Accounts of Chemical Research, v. 41, n. 9, p. 1133-1142, Sep 2008. ISSN 0001-4842. Disponível em: < <Go to ISI>://WOS:000259265700006 >.
155
DAVID, G. et al. Use of iodocompounds in radical polymerization. Chemical Reviews, v. 106, n. 9, p. 3936-3962, Sep 13 2006. ISSN 0009-2665. Disponível em: < <Go to ISI>://WOS:000240463400012 >.
156
POLI, R.; ALLAN, L. E. N.; SHAVER, M. P. Iron-mediated reversible deactivation controlled radical polymerization. Progress in Polymer Science, v. 39, n. 10, p. 1827-1845, Oct 2014. ISSN 0079-6700. Disponível em: < <Go to ISI>://WOS:000343345800004 >.
157
HURTGEN, M. et al. Insight into Organometallic-Mediated Radical Polymerization. Polymer Reviews, v. 51, n. 2, p. 188-213, 2011 2011. ISSN 1558-3724. Disponível em: < <Go to ISI>://WOS:000290047300005 >.
158
DELPLACE, V. et al. A ring to rule them all: a cyclic ketene acetal comonomer controls the nitroxide-mediated polymerization of methacrylates and confers tunable degradability. Chemical Communications, v. 51, n. 64, p. 12847-12850, 2015 2015. ISSN 1359-7345. Disponível em: < <Go to ISI>://WOS:000358609100035 >.
159
MATYJASZEWSKI, K.; TSAREVSKY, N. V. Macromolecular Engineering by Atom Transfer Radical Polymerization. Journal of the American Chemical Society, v. 136, n. 18, p. 6513-6533, May 7 2014. ISSN 0002-7863. Disponível em: < <Go to ISI>://WOS:000335720200001 >.
160
MCKENZIE, T. G. et al. Visible Light Mediated Controlled Radical Polymerization in the Absence of Exogenous Radical Sources or Catalysts. Macromolecules, v. 48, n. 12, p. 3864-3872, Jun 23 2015. ISSN 0024-9297. Disponível em: < <Go to ISI>://WOS:000356988700008 >.
161
PASQUALE, A. J.; LONG, T. E. Synthesis of star-shaped polystyrenes via nitroxide-mediated stable free-radical polymerization. Journal of Polymer Science Part a-Polymer Chemistry, v. 39, n. 1, p. 216-223, Jan 1 2001. ISSN 0887-624X. Disponível em: < <Go to ISI>://WOS:000165868900024 >.
162
NICOLAS, J. et al. Nitroxide-mediated polymerization. Progress in Polymer Science, v. 38, n. 1, p. 63-235, Jan 2013. ISSN 0079-6700. Disponível em: < <Go to ISI>://WOS:000314740300003 >.
163
MIN, K.; GAO, H. F.; MATYJASZEWSKI, K. Preparation of homopolymers and block copolymers in miniemulsion by ATRP using activators generated by electron transfer
110
(AGET). Journal of the American Chemical Society, v. 127, n. 11, p. 3825-3830, Mar 23 2005. ISSN 0002-7863. Disponível em: < <Go to ISI>://WOS:000227738700049 >.
164
CHIEFARI, J. et al. Living free-radical polymerization by reversible addition-fragmentation chain transfer: The RAFT process. Macromolecules, v. 31, n. 16, p. 5559-5562, Aug 11 1998. ISSN 0024-9297. Disponível em: < <Go to ISI>://WOS:000075347600049 >.
165
HILL, M. R.; CARMEAN, R. N.; SUMERLIN, B. S. Expanding the Scope of RAFT Polymerization: Recent Advances and New Horizons. Macromolecules, v. 48, n. 16, p. 5459-5469, Aug 25 2015. ISSN 0024-9297. Disponível em: < <Go to ISI>://WOS:000360324400001 >.
166
SUGIHARA, S.; KONEGAWA, N.; MAEDA, Y. HCl.Et2O-Catalyzed Metal-Free RAFT Cationic Polymerization: One-Pot Transformation from Metal-Free Living Cationic Polymerization to RAFT Radical Polymerization. Macromolecules, v. 48, n. 15, p. 5120-5131, Aug 11 2015. ISSN 0024-9297. Disponível em: < <Go to ISI>://WOS:000359500100007 >.
167
YAMAGO, S. Precision Polymer Synthesis by Degenerative Transfer Controlled/Living Radical Polymerization Using Organotellurium, Organostibine, and Organobismuthine Chain-Transfer Agents. Chemical Reviews, v. 109, n. 11, p. 5051-5068, Nov 2009. ISSN 0009-2665. Disponível em: < <Go to ISI>://WOS:000271856900003 >.
168
ROSEN, B. M.; PERCEC, V. Single-Electron Transfer and Single-Electron Transfer Degenerative Chain Transfer Living Radical Polymerization. Chemical Reviews, v. 109, n. 11, p. 5069-5119, Nov 2009. ISSN 0009-2665. Disponível em: < <Go to ISI>://WOS:000271856900004 >.
169
CHAMPOURET, Y. et al. Controlled Radical Polymerization of Vinyl Acetate with Cyclopentadienyl Chromium,beta-Diketiminate Complexes: ATRP vs OMRP. Organometallics, v. 29, n. 14, p. 3125-3132, Jul 26 2010. ISSN 0276-7333. Disponível em: < <Go to ISI>://WOS:000279928400008 >.
170
POLI, R.; SHAVER, M. P. Atom Transfer Radical Polymerization (ATRP) and Organometallic Mediated Radical Polymerization (OMRP) of Styrene Mediated by Diaminobis(phenolato)iron(II) Complexes: A DFT Study. Inorganic Chemistry, v. 53, n. 14, p. 7580-7590, Jul 21 2014. ISSN 0020-1669. Disponível em: < <Go to ISI>://WOS:000339472000058 >.
171
POLI, R. New Phenomena in Organometallic-Mediated Radical Polymerization (OMRP) and Perspectives for Control of Less Active Monomers. Chemistry-a European Journal, v. 21, n. 19, p. 6988-7001, May 4 2015. ISSN 0947-6539. Disponível em: < <Go to ISI>://WOS:000353348100002 >.
172
FISCHER, H. The persistent radical effect: A principle for selective radical reactions and living radical polymerizations. Chemical Reviews, v. 101, n. 12, p. 3581-3610, Dec 2001. ISSN 0009-2665. Disponível em: < <Go to ISI>://WOS:000172874900002 >.
173
WOLL, D. et al. Radical polymerization tracked by single molecule spectroscopy. Angewandte Chemie International Edition, v. 47, n. 4, p. 783-7, 11 Jan. 2008. ISSN 1433-7851. Disponível em: < <Go to ISI>://INSPEC:9955752 >.
111
174 STEMPFLE, B. et al. Single molecule diffusion and its heterogeneity during the bulk radical polymerization of styrene and methyl methacrylate. Polymer Chemistry, v. 3, n. 9, p. 2456-2463, 2012 2012. ISSN 1759-9954. Disponível em: < <Go to ISI>://WOS:000306967600018 >.
175
WOLL, D. et al. Polymers and single molecule fluorescence spectroscopy, what can we learn? Chemical Society Reviews, v. 38, n. 2, p. 313-328, 2009 2009. ISSN 0306-0012. Disponível em: < <Go to ISI>://WOS:000264374600001 >.
176
YAMADA, B. et al. ESR spectroscopic studies of radical polymerization. Progress in Polymer Science, v. 24, n. 4, p. 565-630, 1999 1999. ISSN 0079-6700. Disponível em: < <Go to ISI>://WOS:000081657400004 >.
177
SCHWEER, J. et al. Pulsed-laser polymerization/matrix-assisted laser desorption/ionization mass spectrometry: An approach toward free-radical propagation rate coefficients of ultimate accuracy? Macromolecules, v. 29, n. 13, p. 4536-4543, Jun 17 1996. ISSN 0024-9297. Disponível em: < <Go to ISI>://WOS:A1996UT13500012 >.
178
HEATLEY, F.; LOVELL, P. A.; MCDONALD, J. NMR-STUDIES OF FREE-RADICAL POLYMERIZATION AND COPOLYMERIZATION OF MONOMERS AND POLYMERS CONTAINING ALLYL GROUPS. European Polymer Journal, v. 29, n. 2-3, p. 255-268, Feb-Mar 1993. ISSN 0014-3057. Disponível em: < <Go to ISI>://WOS:A1993KH92000024 >.
179
BOSCH, P. et al. Fluorescent probes for sensing processes in polymers. Chemistry-a European Journal, v. 11, n. 15, p. 4314-4325, Jul 18 2005. ISSN 0947-6539. Disponível em: < <Go to ISI>://WOS:000230761400002 >.
180
LOUTFY, R. O. FLUORESCENCE PROBES FOR POLYMER FREE-VOLUME. Pure and Applied Chemistry, v. 58, n. 9, p. 1239-1248, Sep 1986. ISSN 0033-4545. Disponível em: < <Go to ISI>://WOS:A1986D345800011 >.