study of induced emotion by color ... - saman-parvaneh.com filestudy of induced emotion by color...
TRANSCRIPT

Study of Induced Emotion by Color Stimuli: Power Spectrum Analysis of Heart Rate Variability
Sadaf Moharreri1, Shahab Rezaei2, Nader Jafarnia Dabanloo3, Saman Parvaneh4
1 Islamic Azad University, Khomeini Shahr Branch, Isfahan, Iran 2 Sharif University of Technology, International Campus, Kish Island, Iran
3 Islamic Azad University, Science and Research Branch, Department of Biomedical Engineering, Tehran, Iran 4 University of Arizona, College of Medicine, Department of Surgery, Tucson, AZ, USA
Abstract
The current study analyzed heart rate variability in the frequency domain to study the effect of different colors on the autonomic nervous system and emotions induced by different colors. Sixteen female volunteers were presented with four different colors on a digital screen as a visual stimulus while the lead II of ECG was recorded. For assessment of induced emotion by colors, validated Self-Assessment Manikin Test were used. Effects of colors on power spectrum of HRV were reported. The results showed that red and yellow increased power in high frequency (p<1E-4). Also, the value of low frequency power in response to yellow and green were less than control state.
1. Introduction
The Autonomic Nerve System (ANS) is responsible for short-term regulation of the heart rate and heart rate variability (HRV) [1]. The ANS is a part of the Central Nervous System (CNS) which uses two subsystems, the sympathetic and parasympathetic systems [2]. The sympathetic system is active during stressful situations, in order to provide a higher heart rate [1]. Increased activity of the sympathetic nerves increases heart rate (HR) and reduces heart rate variability (HRV). In contrast, the parasympathetic system is active during rest and can reduce the HR [3]. Sympathetic and parasympathetic systems typically function in opposition to each other [11].
Physiological response to emotional changes could be captured by biosensors [11]. One benefit of using physiological reactions is that they may be more robust against possible artifacts of human social masking since they are directly controlled by the human autonomous nervous system.
Emotion is the psychophysiological experience of an individual's state of mind from interacting with
environmental influences [4]. People often behave in certain ways as a direct result of their emotional state, such as crying, fighting or feeling.
The relationship between emotions and different colors have also been reported [10]. It appears that some colors may be associated with different emotions and some emotions are associated with more than one color [3]. Since every visual stimulus processed by the human perceptual system contains color information, it seems that color would have a strong influence on inducing emotions.
A few studies have explored the effect of environmental light/color on HRV [10, 12]. For example, Laufer et al. [10] and Litscher et al. [12] analyzed the effects of colored environmental lighting on ANS.
In current paper, the effect of color stimuli shown on the monitor on mood and ANS as a method for management of emotion and ANS is studied. In this paper, with the use of colors as stimulation, the relation between colors and emotions as well as effects of color on ANS is explored by analysis of HRV in the frequency domain (power spectrum analysis). For relating colors and emotions, we used self-assessment Manikin Test and 2D model of emotions.
2. Measurements of emotion
Judgment about human emotions is not easy because each person expresses his/her emotions differently [5]. A more comprehensive way to describe and recognize a subjects’ emotions would be to have multiple dimensions or scales to categorize emotions [5]. Instead of choosing discrete labels or words, observers can indicate their impression of each stimulus on several continuous scales, for example, pleasant-unpleasant, attention-rejection, simple-complicated, etc. [7].
Two common scales are valence and arousal [7]. Valence represents the pleasantness of stimuli, with positive (or pleasant) at one end and negative (or unpleasant) at the other [8]. Another dimension is arousal
ISSN 2325-8861 Computing in Cardiology 2014; 41:977-980.977

Figure 1. 2D model of emotions.
(activation level). Studies in this research field have shown that some emotions can be distinguished based on their arousal and valence levels [5].
In this paper, for evaluating the induced emotions, we used Self-Assessment Manikin Test for quantification of valence and arousal level and for classification of emotions upon their valence and arousal value [3], we used two dimensional model of emotions, which are explained in the following.
2.1. Self-assessment manikin (SAM) test
The SAM rating scale is comprised of three sets of graphical figures, representing the three dimensions that are used to indicate emotional reactions [3]. The SAM figures range from frowning, unhappy to smiling all the way to happy, on the valence dimension [3]. For the arousal dimension, the figures range from relaxed, sleepy to excited and wide-eyed [3]. For the dominance dimension, the figures range from small or dominated to large and controlling [3]. The subject can select any of the five figures comprising each scale (-2, -1, 0, +1, +2).
The arousal and valence dimension of SAM quantifies the emotions which are induced by color stimuli using 2D model of emotions.
2.2. 2D model of emotions
Once the accordant data is gathered, emotions are classified in the 2D valence-arousal space [9]. These facile ways of modeling emotions in two dimensions can be mapped to the dimensions of user experience as shown in Figure 1 and thus provide a method for recognizing emotions. The different emotional labels can be plotted at various positions on a 2D plane spanned by the two axes to construct a 2D emotion model. This model provides a simplified representation of human emotions in two dimensions: arousal and valence [9].
3. Power spectrum analysis of HRV
Power spectrum analysis of heart rate variability is a useful non-invasive technique to investigate the neural mechanisms underlying cardiovascular regulation in the frequency domain [6]. The main features in this domain are as follows [6]: Very Low Frequency (VLF) power: VLF is a band of
power spectrum that ranges between 0.003 and 0.04 Hz indicating overall activity of various slow mechanisms of sympathetic function.
Low Frequency (LF) power: LF is a band of power spectrum that ranges between 0.04 and 0.15 Hz measuring reflects from both sympathetic and para-sympathetic activity. Generally, a strong indicator of sympathetic activity.
High Frequency (HF) power: HF ranging between 0.15 and 0.4 Hz measures reflects parasympathetic (vagal) activity.
LF/HF Ratio: This ratio measure indicates overall balance between sympathetic and parasympathetic systems. Higher values reflects domination of the sympathetic system, while lower ones shows domination of the parasympathetic system. This ratio can be used to help quantify the overall balance between the sympathetic and parasympathetic systems.
4. Color stimulation
Sixteen female students (24.75±1.43) naive to the experiment participated in the study. ECG (lead II) was recorded while participants were seated on a chair.
First, ECG was recorded for 5 minutes while the subjects’ eyes were closed, control state. Then for color stimuli, computer screen was placed one meter away from the subject. Different colors including red, yellow, green and blue were presented for five minutes each. Between each color stimuli a resting time of 10 minutes was given to cancel the effects of previous stimulation. After each stimulus, the subjects answered the SAM test. This test was used to compare the results of HRV analysis with the feeling that each subject sense.
5. Results
The results were divided into two categories: emotion responses and heart responses to color stimuli. For defining emotion responses, we used the results obtained from SAM Test and 2D model of emotions. For describing heart responses, the features extracted by power spectrum analysis of HRV were used and compared to emotion responses in order to quantify emotions and evaluate the relationship between colors, emotions and heart response.
5.1. Emotional response to color stimuli
978

Table 1 Results of statistical test for power spectrum analysis of HRV in response to color stimuli (Power_prc is percentage of power and power_nu is power in normalized unit).
Groups
VL
F P
ower
LF
Pow
er
HF
Pow
er
LF
/HF
Pow
er
VL
F P
ower
_prc
LF
Pow
er_p
rc
HF
Pow
er_p
rc
LF
Pow
er_n
u
HF
Pow
er_n
u
Joy & Anger 0.0336 0.7373 0.6547 0.7373 0.2636 0.3711 0.1797 0.3143 0.3143
Joy & Pleasure 0.4227 0.0824 0.5930 0.0824 0.4624 0.8937 0.1244 0.0824 0.0824
Joy & Sadness 0.0139 0.2188 0.0073 0.4338 0.5762 0.2636 0.5023 0.0736 0.0736
Joy & Happy 0.7301 0.9450 0.2272 0.4076 0.1898 0.7825 0.0845 0.2408 0.2408
Joy & Anxious 0.1606 0.8411 0.3851 1 0.3496 0.0134 0.6885 0.3851 0.3851
Joy & Calm 0.7681 0.8250 0.5070 0.2688 0.7681 0.9412 0.2101 0.2101 0.2101
Joy & Energetic 0.1859 0.1306 0.5083 0.4497 0.1306 0.1306 0.2986 0.3447 0.3447
Anger & Pleasure 0.1385 0.4250 0.5688 0.4250 0.4250 0.3051 0.7324 0.9093 0.9093
Anger & Sadness 0.2752 0.5127 0.0495 0.2752 0.5127 0.8273 0.0495 0.0495 0.0495
Anger & Happy 0.0348 0.5465 0.3149 0.3657 0.0704 0.5465 0.0208 0.0875 0.0875
Anger & Anxious 0.2100 0.7324 0.4250 0.7324 0.4250 0.5688 0.3051 0.2100 0.2100
Anger & Calm 0.1213 0.7963 0.6056 0.1967 0.3017 0.3017 0.6056 0.7963 0.7963
Anger & Energetic 1 0.4795 1 0.4795 0.4795 0.4795 0.7237 0.2888 0.2888
Pleasure & Sadness 0.0167 0.9093 0.0167 0.0167 0.5688 0.2100 0.0527 0.0167 0.0167
Pleasure & Happy 0.3035 0.1463 0.1830 0.0065 0.0341 0.6718 0.0077 0.0110 0.0110
Pleasure & Anxious 0.4822 0.2774 0.3379 0.1797 0.5653 0.0127 0.2774 0.1102 0.1102
Pleasure & Calm 0.6682 0.2531 0.6682 0.7751 0.7751 0.7751 1 0.8864 0.8864
Pleasure & Energetic 0.4497 0.0588 0.5708 0.1306 0.2568 0.1306 0.7055 0.1859 0.1859
Sadness & Happy 0.0159 0.3149 0.1317 0.8407 0.1914 0.2689 0.7630 0.3149 0.3149
Sadness & Anxious 0.0304 0.3051 0.2100 0.5688 0.9093 0.7324 0.9093 0.5688 0.5688
Sadness & Calm 0.0201 0.4386 0.0201 0.1967 1 0.3017 0.0389 0.0201 0.0201
Sadness & Energetic 0.4795 0.0771 0.0339 1 0.4795 0.4795 0.2889 0.7237 0.7237
Happy & Anxious 0.0901 0.9517 0.9037 0.4677 0.1156 0.1156 0.5056 1 1
Happy & Calm 0.5938 0.8415 0.1824 0.0532 0.1252 0.8939 0.0113 0.0278 0.0278
Happy & Energetic 0.1479 0.1255 0.1255 0.7984 0.0215 0.1732 0.1479 0.7335 0.7335
Anxious & Calm 0.3173 0.6682 0.3173 0.2531 0.7751 0.1161 0.3914 0.1985 0.1985
Anxious & Energetic 0.5708 0.2568 0.3447 0.2568 0.3447 0.3447 0.4497 0.8501 0.8501
Calm & Energetic 0.2008 0.3938 0.6698 0.2008 0.2864 0.2008 0.5224 0.3938 0.3938
The analysis of SAM test revealed that all the subjects determined that green and red made the arousal level high while blue and yellow made it low. Moreover, green and
blue caused the valence level to be high while red and yellow made it low. These results are shown in Figure 2.
Comparing the results of SAM Test to 2D model of
emotions (Figure 2 and Figure 3), we can find out the similarity between colors and emotions responses. So we can conclude that colors green, red, blue and yellow are respectively associated with emotions joy, anger, pleasure and sadness (Figure 3).
5.2. Heart responses to color Stimuli
In this study, Kruskal-Wallis test was used which is a non-parametric version of the classical one-way ANOVA to define the level of significance of our measured features.
The p-values obtained from Kruskal-Wallis analysis
Figure 2. Mean values of arousal and valence for color stimuli.
‐2
0
2
Green Red Blue Yellow
Arousal Valence
979
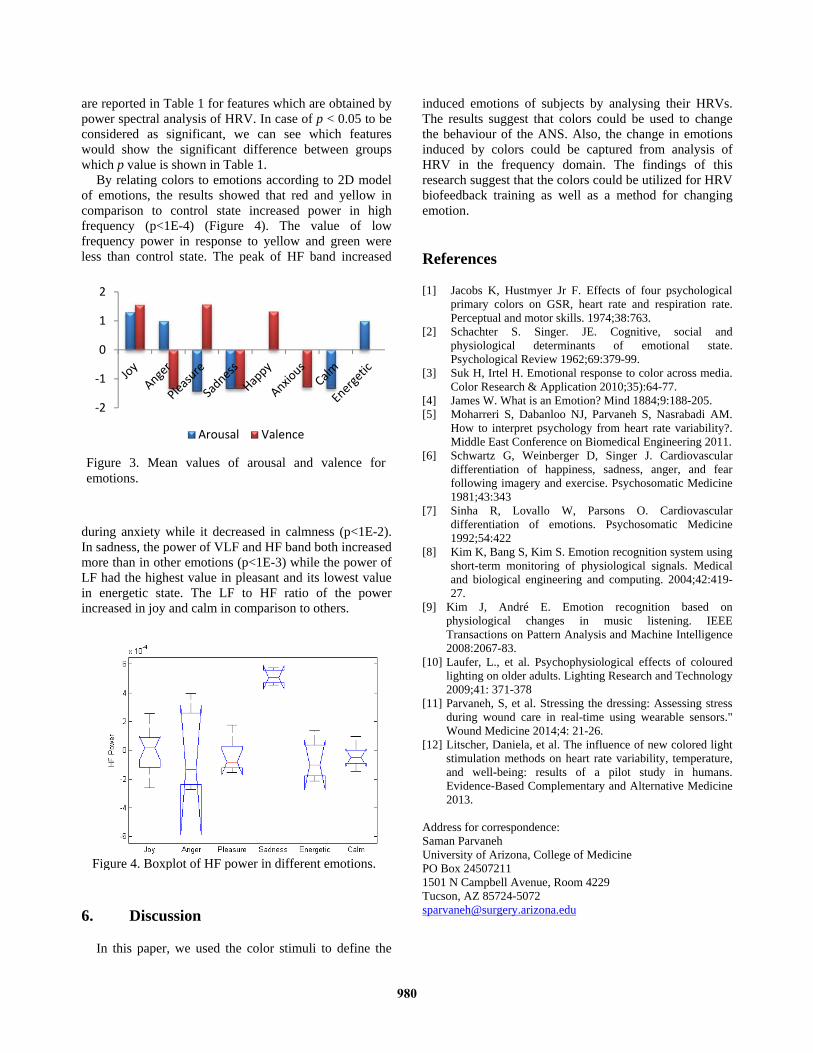
Figure 3. Mean values of arousal and valence for emotions.
‐2
‐1
0
1
2
Arousal Valence
are reported in Table 1 for features which are obtained by power spectral analysis of HRV. In case of p < 0.05 to be considered as significant, we can see which features would show the significant difference between groups which p value is shown in Table 1.
By relating colors to emotions according to 2D model of emotions, the results showed that red and yellow in comparison to control state increased power in high frequency (p<1E-4) (Figure 4). The value of low frequency power in response to yellow and green were less than control state. The peak of HF band increased
during anxiety while it decreased in calmness (p<1E-2). In sadness, the power of VLF and HF band both increased more than in other emotions (p<1E-3) while the power of LF had the highest value in pleasant and its lowest value in energetic state. The LF to HF ratio of the power increased in joy and calm in comparison to others.
6. Discussion
In this paper, we used the color stimuli to define the
induced emotions of subjects by analysing their HRVs. The results suggest that colors could be used to change the behaviour of the ANS. Also, the change in emotions induced by colors could be captured from analysis of HRV in the frequency domain. The findings of this research suggest that the colors could be utilized for HRV biofeedback training as well as a method for changing emotion.
References
[1] Jacobs K, Hustmyer Jr F. Effects of four psychological primary colors on GSR, heart rate and respiration rate. Perceptual and motor skills. 1974;38:763.
[2] Schachter S. Singer. JE. Cognitive, social and physiological determinants of emotional state. Psychological Review 1962;69:379-99.
[3] Suk H, Irtel H. Emotional response to color across media. Color Research & Application 2010;35):64-77.
[4] James W. What is an Emotion? Mind 1884;9:188-205. [5] Moharreri S, Dabanloo NJ, Parvaneh S, Nasrabadi AM.
How to interpret psychology from heart rate variability?. Middle East Conference on Biomedical Engineering 2011.
[6] Schwartz G, Weinberger D, Singer J. Cardiovascular differentiation of happiness, sadness, anger, and fear following imagery and exercise. Psychosomatic Medicine 1981;43:343
[7] Sinha R, Lovallo W, Parsons O. Cardiovascular differentiation of emotions. Psychosomatic Medicine 1992;54:422
[8] Kim K, Bang S, Kim S. Emotion recognition system using short-term monitoring of physiological signals. Medical and biological engineering and computing. 2004;42:419-27.
[9] Kim J, André E. Emotion recognition based on physiological changes in music listening. IEEE Transactions on Pattern Analysis and Machine Intelligence 2008:2067-83.
[10] Laufer, L., et al. Psychophysiological effects of coloured lighting on older adults. Lighting Research and Technology 2009;41: 371-378
[11] Parvaneh, S, et al. Stressing the dressing: Assessing stress during wound care in real-time using wearable sensors." Wound Medicine 2014;4: 21-26.
[12] Litscher, Daniela, et al. The influence of new colored light stimulation methods on heart rate variability, temperature, and well-being: results of a pilot study in humans. Evidence-Based Complementary and Alternative Medicine 2013.
Address for correspondence: Saman Parvaneh University of Arizona, College of Medicine PO Box 24507211 1501 N Campbell Avenue, Room 4229 Tucson, AZ 85724-5072 [email protected]
Figure 4. Boxplot of HF power in different emotions.
980