students' perception of the quality of teaching and learning in
TRANSCRIPT

Pertanika J. Soc. Sci. & Hum. 12(1): 71-86 (2004) ISSN: 0128-7702© Universiti Putra Malaysia Press
Students' Perception of the Quality of Teaching andLearning in Business Studies Programs
JAMALIAH ABDUL HAMID 8c ZAIDATOL AKMALIAH LOPE PIHIEFaculty of Educational Studies, Universiti Putra Malaysia,
43400 UPM, Serdang, Selangor, MalaysiaE-mail: [email protected]
Keywords: Students' perception, quality of teaching and learning, business studies programs,lecturers' factor, teaching methodology, course relevance
ABSTRAK
Satu kajian telah dijalankan untuk meneliti persepsi pelajar tentang keberkesanan pengajarandan pembelajaran dalam program pengajian perniagaan di Universiti mereka. Seramai 1552pelajar mendaftar secara sepenuh masa di tiga universiti awam tempatan di Malaysia terlibatdalam kajian ini. Tiga faktor digunakan untuk mengukur persepsi pelajar tentang pengajaran danpembelajaran yang efektif. Faktor tersebut ialah Faktor Pensyarah, Metodologi Pengajaran danKerelevanan Kursus. Dapatan kajian menunjukkan sejumlah besar responden sederhana setujubahawa pensyarah mereka memiliki dan mempamerkan kualiti seperti yang dijelaskan dalamkonstruk. Penjelasan item terpilih yang menggambarkan trend berkaitan telah dibincangkandalam kertas ini. Ujian t dan ANOVA menunjukkan wujud perbezaan yang signifikan tentangpersepsi pelajar dalam ketiga-tiga faktor megikut jantina, latar belakang etnik, kelayakan akademiktertinggi dan skor CGPA terkini. Juga terdapat perbezaan yang signifikan dalam persepsi pelajartentang faktor pensyarah keseluruhan berdasarkan pengalaman bekerja lepas belajar, dan persepsitentang metodologi pengajaran dan kerelevanan kursus berdasarkan tahap penguasaan bahasaInggeris.
ABSTRACT
A study was conducted to examine students' perceptions of the effectiveness of teaching andlearning in business studies programs in their universities. About 1552 students enrolled as fulltime students in three public universities in Malaysia participated in the study. Three factors wereemployed to measure students* perceptions of effective teaching and learning. The factors wereLecturers' Factor, Teaching Methodology, and Course Relevance. Findings showed that a majorityof respondents moderately agreed that their lecturers possessed and exhibited qualities describedin all three constructs. Individual item description highlighted some interesting trends discussedin this paper. T tests and ANOVA showed significant differences in students' perceptions of allthree factors based on their gender, ethnic background, highest academic qualification, andcurrent CGPA scores. There were significant differences in the perceptions of Overall LecturerFactor based on students' previous work experience, and in the perceptions of TeachingMethodology and Relevance of Courses based on their level of English Language proficiency.
INTRODUCTION
This research aimed to examine the quality ofteaching and learning factors in businessprograms in public universities in Malaysia. Asthe Malaysian Education Act for HigherInstitutions of Learning of 1996 devolvedauthority for the control of institutionaldevelopment, performance standards, and
financial accountability to the institutions, it istherefore incumbent upon universities to evaluatetheir own effectiveness in delivering educationalservices, in particular, teaching and learning totheir clients. This report however, was part of awider study on the level of service quality offeredin business programs in public universities inMalaysia.

Jamaliah Abdul Hamid & Zaidatol Akmaliah Lope Pihie
LITERATURE REVIEW
The conceptual framework of quality teaching isdrawn from the larger discipline of ServiceQuality. Service quality is defined as the gapbetween expectations and perceptions of a service(Boulding et al 1993), in this case, the teachingservice in higher education. Service qualityresearch often encompasses overallorganizational factors. Parasumaran, Zeitmal, andBerry (1985) identified 10 determinants of servicequality which are Reliability, Responsiveness,Competence, Access, Courtesy, Communication,Credibility, Security, Understanding and knowingthe customer, and Tangibles such as facilitiesand equipment. Wright's (1996) researchidentified 8 major service quality factors forhigher education: diversity of educationalexperience (diversity of coursework and studentbody), access and use of facilities (location,atmosphere and hours of university facilities),personalized interaction (interaction betweenstudent and faculty), student quality (quality ofstudents at the university), educational process(requirements and ability to fulfil requirements),faculty quality (academic and professionalbackground of faculty), and professor's years ofteaching experience.
However, the measure of quality teachingand learning needs to focus on the dimensionalfactors that directly influence the process deliveryof instructional design and the course outcomes.Quality teaching in university can be defined asone that engages the student in an in-depthand comprehensive approach to the subjectmatter, that is, in an active, durable, and criticalconstruction of knowledge integrated with hisor her previous knowledge and put to action(Entwistle and Ramsden 1983). Pennington andO'Neil (1994) proposed eight principles thatunderscore effective teaching. These are: (1)enhancing students' general capabilities andwork-related skills (2) using student experienceas a learning resource (3) encouraging activeand co-operative learning (4) promotingresponsibility in learning (5) engaging withfeelings, values and motives (the affectivedomain) as well as with intellectual development(6) fostering open, flexible, reflexive andoutcome - based assessment (7)evaluatingteaching and learning to encourage reflectiveteaching, and (8) developing organization-widestrategies to establish congruence of policies toenhance physical and material learning
environment. Hill, Lomas, and MacGregor(2003) reported in their study that students1
perceptions of quality learning includedexperiences that helped them to link theorywith the real world, assignments relevant to realwork place, discussions leading to newperspectives of thinking, and curriculum thattook account of the students' group experiencesand imparted added value to students. Hill alsoreported the emergence of three major teachingstrategies which were highly rated by students inhigher education: delivery strategy andtechniques in the classroom; feedback to studentsin the classroom and in assignments; andrelationship with students in the classroom.
In higher education, customer satisfactionbegins with the expectations created upon theservice by various parties to be delivered to orexperienced by the customer. One of theexpectations is the quality of the teaching staff.Lammers and Murphy (2002) in their researchof quality teaching in US universities concludedfrom their study that lecturers' enthusiasm,knowledge ability in the subject, and effectiveclassroom management are highly valued skillswhich interact with other physical factors suchas course design to produce effective teachingand learning. Morton-Cooper (1993) in aresearch on lecturer traits valued by studentscited responsiveness and trustworthiness as themajor traits. Trustworthiness included theelement of reliability and consistency. Lecturerenthusiasm was also a vital trait that encouragedlearning (Hill et al 2003; O'Neil 1995, Ramsden1988).
On curriculum content, qualitative researchby Hill et al (2003) on students' perceptions ofquality in higher education showed that studentsvalued a curriculum that was flexible, tookaccount of the student group experiences, madelinks between theory and the real world, and wasup to date. The effectiveness in the teachingcurriculum needs to be understood in thecontext of their contribution to the developmentof the students' character and competence withinthe respective disciplines. Indeed, customersatisfaction in higher education involves howclosely the delivered service has added value tothe skills and competence of customers to gainbetter job market or career advantage (Rowley1997). Thus, course outcomes drive the policiesand motivation in university teaching. Theyrightfully ought to form the basis of the
72 PertanikaJ. Soc. Sci. 8c Hum. Vol. 12 No. 1 2004
Students' Perception of the Quality of Teaching and Learning in Business Studies Programs
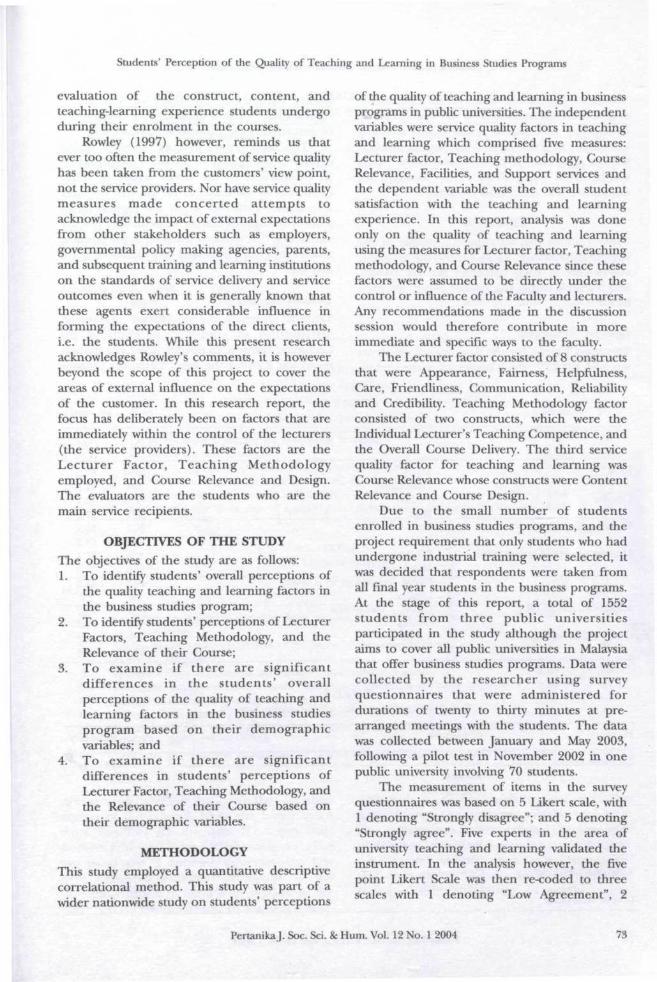
evaluation of the construct, content, andteaching-learning experience students undergoduring their enrolment in the courses.
Rowley (1997) however, reminds us thatever too often the measurement of service qualityhas been taken from the customers' view point,not the service providers. Nor have service qualitymeasures made concerted attempts toacknowledge the impact of external expectationsfrom other stakeholders such as employers,governmental policy making agencies, parents,and subsequent training and learning institutionson the standards of service delivery and serviceoutcomes even when it is generally known thatthese agents exert considerable influence informing the expectations of the direct clients,i.e. the students. While this present researchacknowledges Rowley's comments, it is howeverbeyond the scope of this project to cover theareas of external influence on the expectationsof the customer. In this research report, thefocus has deliberately been on factors that areimmediately within the control of the lecturers(the service providers). These factors are theLecturer Factor, Teaching Methodologyemployed, and Course Relevance and Design.The evaluators are the students who are themain service recipients.
OBJECTIVES OF THE STUDYThe objectives of the study are as follows:1. To identify students' overall perceptions of
the quality teaching and learning factors inthe business studies program;
2. To identify students* perceptions of LecturerFactors, Teaching Methodology, and theRelevance of their Course;
3. To examine if there are significantdifferences in the students ' overallperceptions of the quality of teaching andlearning factors in the business studiesprogram based on their demographicvariables; and
4. To examine if there are significantdifferences in students' perceptions ofLecturer Factor, Teaching Methodology, andthe Relevance of their Course based ontheir demographic variables.
METHODOLOGYThis study employed a quantitative descriptivecorrelational method. This study was part of awider nationwide study on students' perceptions
of the quality of teaching and learning in businessprograms in public universities. The independentvariables were service quality factors in teachingand learning which comprised five measures:Lecturer factor, Teaching methodology, CourseRelevance, Facilities, and Support services andthe dependent variable was the overall studentsatisfaction with the teaching and learningexperience. In this report, analysis was doneonly on the quality of teaching and learningusing the measures for Lecturer factor, Teachingmethodology, and Course Relevance since thesefactors were assumed to be directly under thecontrol or influence of the Faculty and lecturers.Any recommendations made in the discussionsession would therefore contribute in moreimmediate and specific ways to the faculty.
The Lecturer factor consisted of 8 constructsthat were Appearance, Fairness, Helpfulness,Care, Friendliness, Communication, Reliabilityand Credibility. Teaching Methodology factorconsisted of two constructs, which were theIndividual Lecturer's Teaching Competence, andthe Overall Course Delivery. The third servicequality factor for teaching and learning wasCourse Relevance whose constructs were ContentRelevance and Course Design.
Due to the small number of studentsenrolled in business studies programs, and theproject requirement that only students who hadundergone industrial training were selected, itwas decided that respondents were taken fromall final year students in the business programs.At the stage of this report, a total of 1552students from three public universitiesparticipated in the study although the projectaims to cover all public universities in Malaysiathat offer business studies programs. Data werecollected by the researcher using surveyquestionnaires that were administered fordurations of twenty to thirty minutes at pre-arranged meetings with the students. The datawas collected between January and May 2003,following a pilot test in November 2002 in onepublic university involving 70 students.
The measurement of items in the surveyquestionnaires was based on 5 Likert scale, with1 denoting "Strongly disagree"; and 5 denoting"Strongly agree". Five experts in the area ofuniversity teaching and learning validated theinstrument. In the analysis however, the fivepoint Likert Scale was then re-coded to threescales with 1 denoting "Low Agreement", 2
PertanikaJ. Soc. Sci. & Hum. Vol. 12 No. 1 2004 73
Jamaliah Abdul Hamid & Zaidatol Akmaliah Lope Pihie
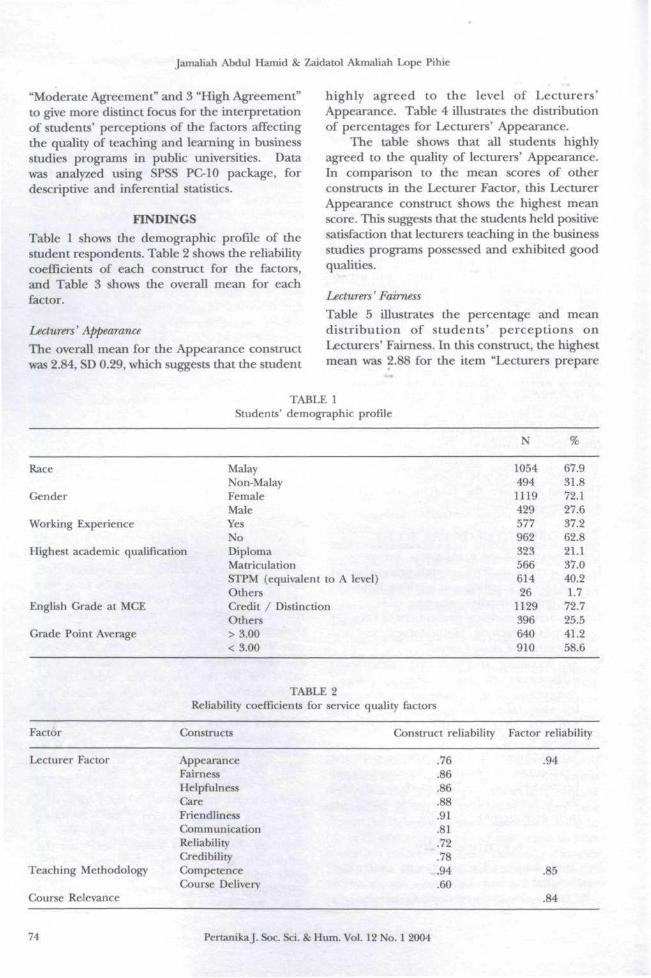
"Moderate Agreement" and 3 "High Agreement"to give more distinct focus for the interpretationof students' perceptions of the factors affectingthe quality of teaching and learning in businessstudies programs in public universities. Datawas analyzed using SPSS PC-10 package, fordescriptive and inferential statistics.
FINDINGSTable 1 shows the demographic profile of thestudent respondents. Table 2 shows the reliabilitycoefficients of each construct for the factors,and Table 3 shows the overall mean for eachfactor.
Lecturers' Appearance
The overall mean for the Appearance constructwas 2.84, SD 0.29, which suggests that the student
highly agreed to the level of Lecturers'Appearance. Table 4 illustrates the distributionof percentages for Lecturers' Appearance.
The table shows that all students highlyagreed to the quality of lecturers' Appearance.In comparison to the mean scores of otherconstructs in the Lecturer Factor, this LecturerAppearance construct shows the highest meanscore. This suggests that the students held positivesatisfaction that lecturers teaching in the businessstudies programs possessed and exhibited goodqualities.
Lecturers' Fairness
Table 5 illustrates the percentage and meandistribution of students ' perceptions onLecturers' Fairness. In this construct, the highestmean was 2.88 for the item "Lecturers prepare
TABLE 1Students' demographic profile
N
Race
Gender
Working Experience
Highest academic qualification
English Grade at MCE
Grade Point Average
MalayNon-MalayFemaleMaleYesNoDiplomaMatriculationSTPM (equivalent to A level)OthersCredit / DistinctionOthers> 3.00< 3.00
1054494111942957796232356661426
1129396640910
67.931.872.127.637.262.821.137.040.21.7
72.725.541.258.6
TABLE 2Reliability coefficients for service quality factors
Factor Constructs Construct reliability Factor reliability
Lecturer Factor
Teaching Methodology
Course ReJevance
AppearanceFairnessHelpfulnessCareFriendlinessCommunicationReliabilityCredibilityCompetenceCourse Delivery
.76
.86
.86
.88
.91
.81
.72
.78
.94
.60
.94
.85
.84
71 PertanikaJ. Soc. Sci. 8c Hum. Vol. 12 No. 1 2004

Students' Perception of the Quality of Teaching and Learning in Business Studies Programs
TABLE 3Mean and standard deviation for service quality factors in teaching
Construct 'Mean S.D. Overall
Lecturer factor
Teaching Methodology
Course Relevance
Appearance
FairnessHelpfulnessCaringFriendlinessCommunicationReliabilityCredibilityCompetenceCourse Delivery
2.84
2.742.762.632.572.732.482.642.772.59
.29
.33
.37
.40
.41
.33
.31
.34
.30
.31
MeanS.D.
MeanS.D.
-2.67= .28
- 2.68• .26
2.81 .29
TABLE 4Lecturer appearance
Item No. Item Mean SD
1. Lecturers show a positive attitude when teaching2. Lecturers are well groomed3. Lecturers are courteous when interacting with students4. Lecturers come across as a person as well as a teacher5. Lecturers respect students as individuals6. Lecturers' voice level, rate of speaking and behavior are conducive to learning 2.75
2.872.942.842.812.842.75
.36
.26
.40
.44
.42
.49
TABLE 5Lecturer fairness
Item No. Item Mean
2.66
SD
7. Lecturers set standards and due dates for assignments that are clear, fairand reasonable
8. Lecturers use oral, written and other forms of assignments to assessstudents' progress
9. Lecturers treat all students fairly and in an equitable manner10. Lecturers' evaluation method and examination questions are clear and fair11. Lecturers are fair in grading students12. Lecturers' method of giving grades is consistent and clearly understood13. Lecturers prepare examination questions that cover the important aspects
of the course14. Lecturers give freedom to students to choose their own group members
2.82
2.77
2.642.812.672.702.88
.43
.48
.60
.44
.57
.55
.37
.58
examination questions that cover the importantaspects of the course", while the lowest meanscore was 2.64 for the item "Lecturers treatstudents fairly and in an equitable manner". Thetwo items are of opposite polarities: the firstitem measured students' perception of the'structural' aspect of fairness as opposed to the'soft' perception of fairness in the latter item.
Although students highly agreed that thelecturers were fair, there were obvious variationsin response to specific dimensional characteristicsof fairness. This finding suggests that fairnesswas perceived on two levels: technical (structural)and discretionary and the results showed thatlecturers were perceived to exhibit more
PertanikaJ. Soc. Sci. 8c Hum. Vol. 12 No. 1 2004 75
Jamaliah Abdul Hamid & Zaidatol Akmaliah Lope Pihie
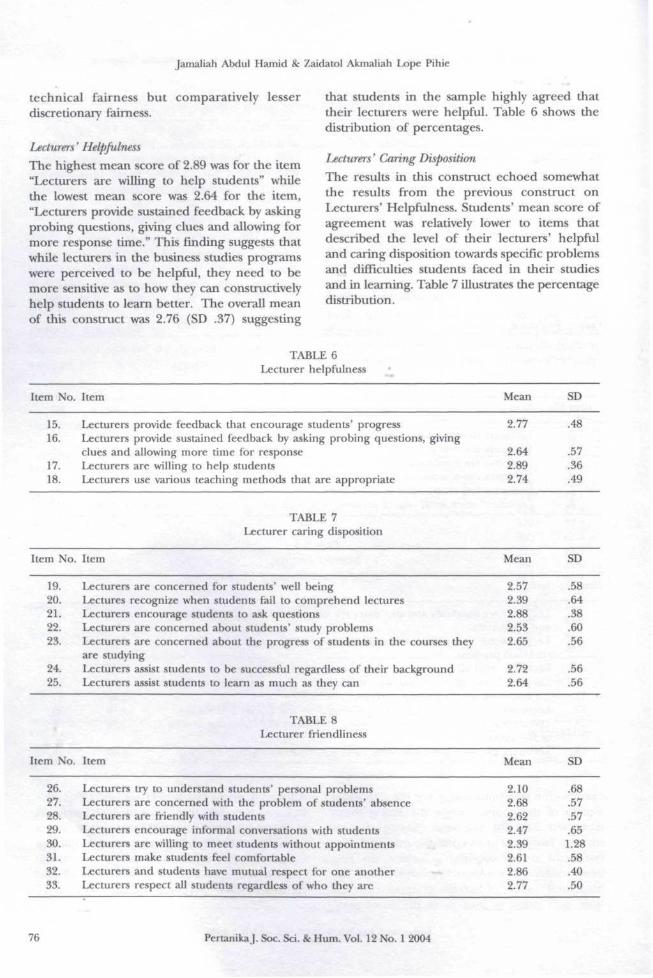
technical fairness but comparatively lesserdiscretionary fairness.
Lecturers' Helpfulness
The highest mean score of 2.89 was for the item"Lecturers are willing to help students" whilethe lowest mean score was 2.64 for the item,"Lecturers provide sustained feedback by askingprobing questions, giving clues and allowing formore response time." This finding suggests thatwhile lecturers in the business studies programswere perceived to be helpful, they need to bemore sensitive as to how they can constructivelyhelp students to learn better. The overall meanof this construct was 2.76 (SD .37) suggesting
that students in the sample highly agreed thattheir lecturers were helpful. Table 6 shows thedistribution of percentages.
Lecturers' Caring Disposition
The results in this construct echoed somewhatthe results from the previous construct onLecturers' Helpfulness. Students' mean score ofagreement was relatively lower to items thatdescribed the level of their lecturers' helpfuland caring disposition towards specific problemsand difficulties students faced in their studiesand in learning. Table 7 illustrates the percentagedistribution.
TABLE 6Lecturer helpfulness
Item No. Item Mean SD
15. Lecturers provide feedback that encourage students' progress16. Lecturers provide sustained feedback by asking probing questions, giving
clues and allowing more time for response17. Lecturers are willing to help students18. Lecturers use various teaching methods that are appropriate
2.77 .48
2.642.892.74
.57
.36
.49
TABLE 7Lecturer caring disposition
Item No. Item Mean SD
19. Lecturers are concerned for students' well being20. Lectures recognize when students fail to comprehend lectures21. Lecturers encourage students to ask questions22. Lecturers are concerned about students' study problems23. Lecturers are concerned about the progress of students in the courses they
are studying24. Lecturers assist students to be successful regardless of their background25. Lecturers assist students to learn as much as they can
2.572.392.882.532.65
2.722.64
.58
.64
.38
.60
.56
.56
.56
TABLE 8Lecturer friendliness
Item No. Item Mean SD
26.27.28.29.30.31.32.33.
LecturersLecturersLecturersLecturersLecturersLecturersLecturersLecturers
try to understand students' personal problemsare concerned with the problem of students' absenceare friendly with studentsencourage informal conversations with studentsare willing to meet students without appointmentsmake students feel comfortableand students have mutual respect for one anotherrespect all students regardless of who they are
2.102.682.622.472.392.612.862.77
.68
.57
.57
.651.28.58.40.50
76 PertanikaJ. Soc. Sci. 8c Hum. Vol. 12 No. 1 2004
Students' Perception of the Quality of Teaching and Learning in Business Studies Programs
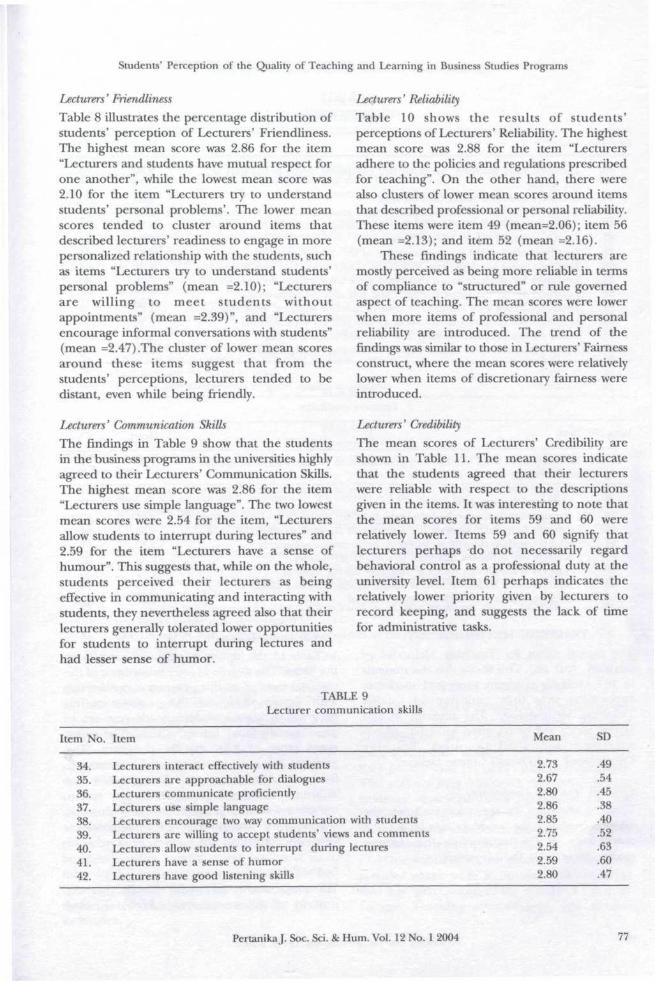
Lecturers' Friendliness
Table 8 illustrates the percentage distribution ofstudents' perception of Lecturers' Friendliness.The highest mean score was 2.86 for the item"Lecturers and students have mutual respect forone another", while the lowest mean score was2.10 for the item "Lecturers try to understandstudents' personal problems'. The lower meanscores tended to cluster around items thatdescribed lecturers' readiness to engage in morepersonalized relationship with the students, suchas items "Lecturers try to understand students'personal problems" (mean =2.10); "Lecturersare willing to meet students withoutappointments" (mean =2.39)", and "Lecturersencourage informal conversations with students"(mean =2.47) .The cluster of lower mean scoresaround these items suggest that from thestudents' perceptions, lecturers tended to bedistant, even while being friendly.
Lecturers' Communication SkillsThe findings in Table 9 show that the studentsin the business programs in the universities highlyagreed to their Lecturers' Communication Skills.The highest mean score was 2.86 for the item"Lecturers use simple language". The two lowestmean scores were 2.54 for the item, "Lecturersallow students to interrupt during lectures" and2.59 for the item "Lecturers have a sense ofhumour". This suggests that, while on the whole,students perceived their lecturers as beingeffective in communicating and interacting withstudents, they nevertheless agreed also that theirlecturers generally tolerated lower opportunitiesfor students to interrupt during lectures andhad lesser sense of humor.
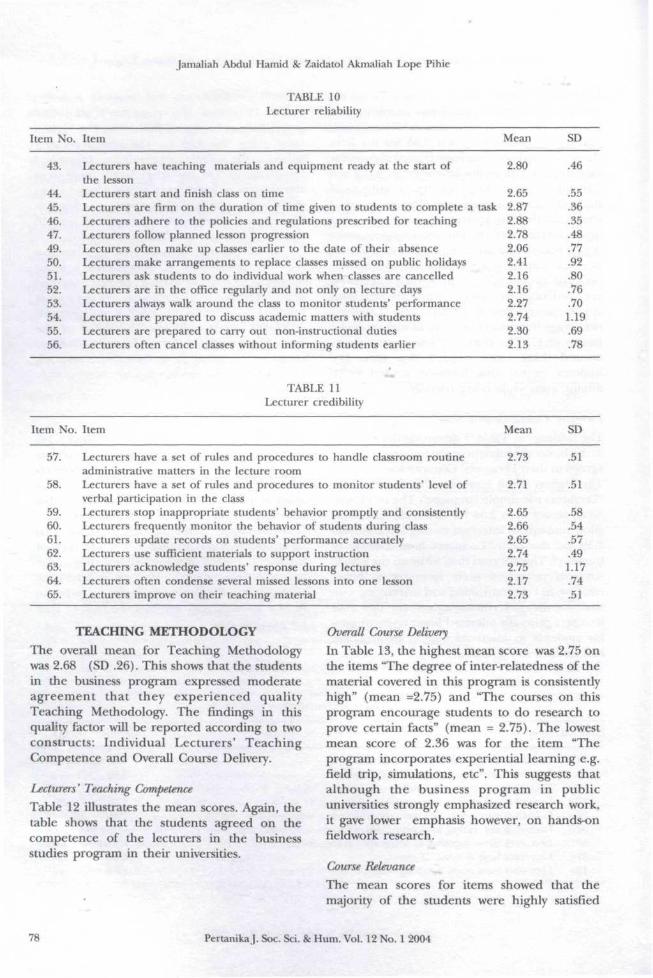
Lecturers' Reliability
Table 10 shows the results of students'perceptions of Lecturers' Reliability. The highestmean score was 2.88 for the item "Lecturersadhere to the policies and regulations prescribedfor teaching". On the other hand, there werealso clusters of lower mean scores around itemsthat described professional or personal reliability.These items were item 49 (mean=2.06); item 56(mean =2.13); and item 52 (mean =2.16).
These findings indicate that lecturers aremostly perceived as being more reliable in termsof compliance to "structured" or rule governedaspect of teaching. The mean scores were lowerwhen more items of professional and personalreliability are introduced. The trend of thefindings was similar to those in Lecturers' Fairnessconstruct, where the mean scores were relativelylower when items of discretionary fairness wereintroduced.
Lecturers' Credibility
The mean scores of Lecturers' Credibility areshown in Table 11. The mean scores indicatethat the students agreed that their lecturerswere reliable with respect to the descriptionsgiven in the items. It was interesting to note thatthe mean scores for items 59 and 60 wererelatively lower. Items 59 and 60 signify thatlecturers perhaps do not necessarily regardbehavioral control as a professional duty at theuniversity level. Item 61 perhaps indicates therelatively lower priority given by lecturers torecord keeping, and suggests the lack of timefor administrative tasks.
TABLE 9Lecturer communication skills
Item No. Item Mean SD
34.35.36.37.38.39.40.41.42.
LecturersLecturersLecturersLecturersLecturersLecturersLecturersLecturersLecturers
interact effectively with studentsare approachable for dialoguescommunicate proficientlyuse simple languageencourage two way communication with studentsare willing to accept students' views and commentsallow students to interrupt during lectureshave a sense of humorhave good listening skills
2.732.672.802.862.852.752.542.592.80
.49
.54
.45
.38
.40
.52
.63
.60
.47
PertanikaJ. Soc. Sci. 8c Hum. Vol. 12 No. 1 2004 77
Jamaliah Abdul Hamid & Zaidatol Akmaliah Lope Pihie
TABLE 10Lecturer reliability
Item No. Item Mean SD
43. Lecturers have teaching materials and equipment ready at the start ofthe lesson
44. Lecturers start and finish class on time45. Lecturers are firm on the duration of time given to students to complete a task46. Lecturers adhere to the policies and regulations prescribed for teaching47. Lecturers follow planned lesson progression49. Lecturers often make up classes earlier to the date of their absence50. Lecturers make arrangements to replace classes missed on public holidays51. Lecturers ask students to do individual work when classes are cancelled52. Lecturers are in the office regularly and not only on lecture days53. Lecturers always walk around the class to monitor students1 performance54. Lecturers are prepared to discuss academic matters with students55. Lecturers are prepared to carry out non-instructional duties56. Lecturers often cancel classes without informing students earlier
2.80 .46
2.652.872.882.782.062.412.162.162.272.742.302.13
.55
.36
.35
.48
.77
.92
.80
.76
.701.19.69.78
TABLE 11Lecturer credibility
Item No. Item Mean SD
57. Lecturers have a set of rules and procedures to handle classroom routineadministrative matters in the lecture room
58. Lecturers have a set of rules and procedures to monitor students' level ofverbal participation in the class
59. Lecturers stop inappropriate students' behavior promptly and consistently60. Lecturers frequently monitor the behavior of students during class61. Lecturers update records on students' performance accurately62. Lecturers use sufficient materials to support instruction63. Lecturers acknowledge students' response during lectures64. Lecturers often condense several missed lessons into one lesson65. Lecturers improve on their teaching material
2.73
2.71
.51
.51
2.652.662.652.742.752.172.73
.58
.54
.57
.491.17.74.51
TEACHING METHODOLOGY
The overall mean for Teaching Methodologywas 2.68 (SD .26). This shows that the studentsin the business program expressed moderateagreement that they experienced qualityTeaching Methodology. The findings in thisquality factor will be reported according to twoconstructs: Individual Lecturers' TeachingCompetence and Overall Course Delivery.
Lecturers' Teaching Competence
Table 12 illustrates the mean scores. Again, thetable shows that the students agreed on thecompetence of the lecturers in the businessstudies program in their universities.
Overall Course Delivery
In Table 13, the highest mean score was 2.75 onthe items "The degree of inter-relatedness of thematerial covered in this program is consistentlyhigh" (mean =2.75) and "The courses on thisprogram encourage students to do research toprove certain facts" (mean • 2.75). The lowestmean score of 2.36 was for the item "Theprogram incorporates experiential learning e.g.field trip, simulations, etc". This suggests thatalthough the business program in publicuniversities strongly emphasized research work,it gave lower emphasis however, on hands-onfieldwork research.
Course Relevance
The mean scores for items showed that themajority of the students were highly satisfied
78 PertanikaJ. Soc. Sci. & Hum. Vol. 12 No. 1 2004

Students' Perception of the Quality of Teaching and Learning in Business Studies Programs
TABLE 12Lecturer competence
Item No. Item Mean SD
66. Lecturers begin lessons with a review of previous lessons67. Lecturers specify the learning objectives for every lesson68. Lecturers provide suitable examples, demonstration and illustrations of
concepts and skills69 Lecturers assign task which students can complete with a high rate of success70. Lecturers ask questions that are appropriate to the students' level of ability71. Lecturers vary the pace of instructional activities72. Lecturers make transitions between lessons and instructional activities73. Lecturers make sure that instructions for assignments are clear74. Lecturers summarize the main points at the end of each lesson75. Lecturers are knowledgeable on the subject matter76. Lecturers are skillful in presenting their lessons77. Lecturers stimulate students* thinking through problem solving techniques
and asking challenging questions78. Lecturers are competent in handling students' questions79. Lecturers are prepared to teach80. Lectures give assignments of good quality to students
2.612.752.82
2.732.772.662.712.852.702.852.792.78
2.802.892.85
.62
.52
.44
.53
.49
.55
.51
.90
.53
.41
.45
.47
.46
.34
.41
TABLE 13Overall course delivery
Item No. Item Mean SD
17. Most of the examination questions in the courses test on what I had 2.58 .60memorized rather than what I had understood
19. The degree of inter relatedness of the material covered in this program is 2.75 .48consistently high
20. This program incorporates experiential learning e.g. field trip, simulations etc.21. The content of the courses in this program is too heavy22. The difficulty level of the content of the courses in this program is suitable
to my level of ability29. The courses in this program often require students to solve problems in 2.43 .64
text books rather than do research30. The courses in this program encourage students to do research to prove 2.75 .50
certain facts
2.362.572.70
.71
.59
.52
that the course content and design were relevantto their needs in the business program. Thelowest mean score was for the item "Theindustrial training in the program was wellplanned and beneficial" (mean = 2.76). Thissuggests that although the students believed diatthe quality of the practical content in theircourses was good, they nevertheless perceivedthat their industrial training experience was incomparison, insufficiently organized. This raisesthe issue as to whether the practical content inbusiness courses ought to be instituted as amore formal requirement in universities so thatbetter coordination for industry training can bedone. Table 14 shows the results for CourseRelevance.
T-TESTS AND ANOVA
The t-test showed a significant difference in theperception on Lecturers' Factors, TeachingMethodology, and Course Relevance betweenmale and female students (t= 5.41 p <.O5); (t=2.94 p<.05); and (t- -2.72 p<.05) respectively.The mean scores indicated that more femalestudents expressed more agreement for thequality of Lecturer Factors, TeachingMethodology, and Relevance of the Course. Thet-test results are in Tables 15-17.
One-way ANOVA test shown in Tables 18-20revealed there were significant differences instudents' perceptions of the quality of LecturerFactors, Teaching Methodology, and Course
PertanikaJ. Soc. Sci. & Hum. Vol. 12 No. 1 2004 79

Jamaliah Abdul Hamid & Zaidatol Akmaliah Lope Pihie
TABLE 14Course relevance
Item No Item Mean SD
18. The industrial training in this program is well planned and beneficial23. The content of the courses in this program is relevant to my future
employment24. The actual content of the courses correspond to their descriptions in
the synopsis25. The content of the courses in this program is current26. The quality of practical content in the program is good27. The core courses in this program are important to me28. I like my chosen field of specialization
2.762.79
2.85
.50
.48
.39
2.802.812.812.88
.46
.45
.46
.37
TABLE 15t-test between gender and lecturers' factor
Race
Gender
Gender
Gender
Item
MaleFemale
t-test between
Item
MaleFemale
t-test between j
Item
MaleFemale
N
4291119
TABLE 16gender and teaching methodology
Lecturers' Factor
'Mean
2.612.70
t value
t =-5.41
Sig.
.000
Teaching Methodology
N
4281116
TABLE 17gender and relevance of the courses
'Mean
2.652.69
t value
t =-2.94
Sig.
.003
Relevance of the Courses
N
4271110
TABLE 18ANOVA between ethnic group and lecturers' factor
Item
N
'Mean
2.782.83
t value
t =-2.72
Lecturers' Factor
'Mean F value
Sig.
.007
Sig.
MalaysChineseIndiansBumiputera Sabah & SarawakOthers
1058369591111
2.732.502.662.752.59
58.31 .0001
80 PertanikaJ. Soc. Sci. 8c Hum. Vol. 12 No. 1 2004

Students* Perception of the Quality of Teaching and Learning in Business Studies Programs
ANOVA between
Item
N
TABLEethnic group
19and teaching methodology
Teaching Methodology
'Mean F value Sig.
Race MalaysChineseIndianBumiputera Sabah & SarawakOthers
1055369585011
2.732.522.712.762.59
53.51 0.001
ANOVA between
ITEM
TABLE 20ethnic group and course relevance
N
Course
'Mean
Relevance
F value Sig.
Race MalaysChineseIndianBumiputera Sabah & SarawakOthers
1049 2.86368 2.6558 2.8850 2.8611 2.86
39.31 .0001
Relevance amongst students of different ethnicgroups.
Post hoc Tukey test revealed that the Malay,Indian, and Bumiputera Sabah and Sarawakstudents tended to have a higher agreement ofthe quality of Lecturer Factor, TeachingMethodology, and Course Relevance than theChinese students. The positive orientationamongst the Malays, Indians and the BumiputeraSabah and Sarawak students towards Lecturer,Teaching Methodology, and Course Relevancefactors in the business program could be due tothe awareness campaign driven by governmentpolicies to develop more numbers ofentrepreneurs and businessmen amongst the
these ethnic groups by 2020. Table 21 shows theTukey test results.
Tables 22-24 display the ANOVA results forsignificant differences in the perception of qualityfactors amongst students with different academicqualifications.
Posthoc Tukey tests showed that the Diplomaand the Matriculation groups of students tendedto express more agreement on the quality ofLecturers, Teaching Methodology and CourseRelevance than the STPM students and studentswith other types of qualifications. Thesedifferences could perhaps be attributed to thefact that the Matriculation and Diploma studentshave undergone pre-university programs in otherinstitutions, and their experience could have
TABLE 21Posthoc Tukey test of ethnic and quality factors
Ethnic
Ethnic
MalayIndianBumiputera Sabah & Sarawak
Lecturer Factor
Mean difference
.23
.16
.25
Sig
.00
.00
.00
Chinese
Teaching Methodology
Mean difference
.21
.19
.23
Sig
.00
.03
.00
Course Relevance
Mean difference Sig
.21
.22
.20
.00
.00
.00
PertanikaJ. Soc. Sci. & Hum. Vol. 12 No. 1 2004 81

Jamaliah Abdul Hamid & Zaidatol Akmaliah Lope Pi hie
TABLE 22ANOVA between academic qualification and lecturers' factor
Item Lecturers' Factor
N 'Mean F value Sig.
Academic Qualification DiplomaMatriculationSTPM (equivalent to A Level)Others
32757061626
2.712.732.612.71
22.57 .000
TABLE 23ANOVA between academic qualification and teaching methodology
Item Teaching Methodology
N
32557061526
'Mean
2.712.722.622.75
F value
18.68
Sig.
.000Academic Qualification DiplomaMatriculationSTPM (equivalent to A level)Others
TABLE 24ANOVA between academic qualification and course relevance
Item Course Relevance
N 'Mean F value Sig.
Academic Qualification Diploma 323 2.84Matriculation 566 2.86STPM (equivalent to A level) 614 2.76Others 26 2.87
11.61 .000
TABLE 25Tukey test on students academic qualifications and quality factors
STPM/HSC
Lecturer Factor Teaching Methodology Course Relevance
Mean difference Sig Mean difference Sig Mean difference Sig
DiplomaMatriculation
.10
.12.00.00
.09
.10.00.03
. 08.09
.00
.00
influenced their orientation towards LecturerFactors, Teaching Methodology and CourseRelevance. Table 25 shows the results.
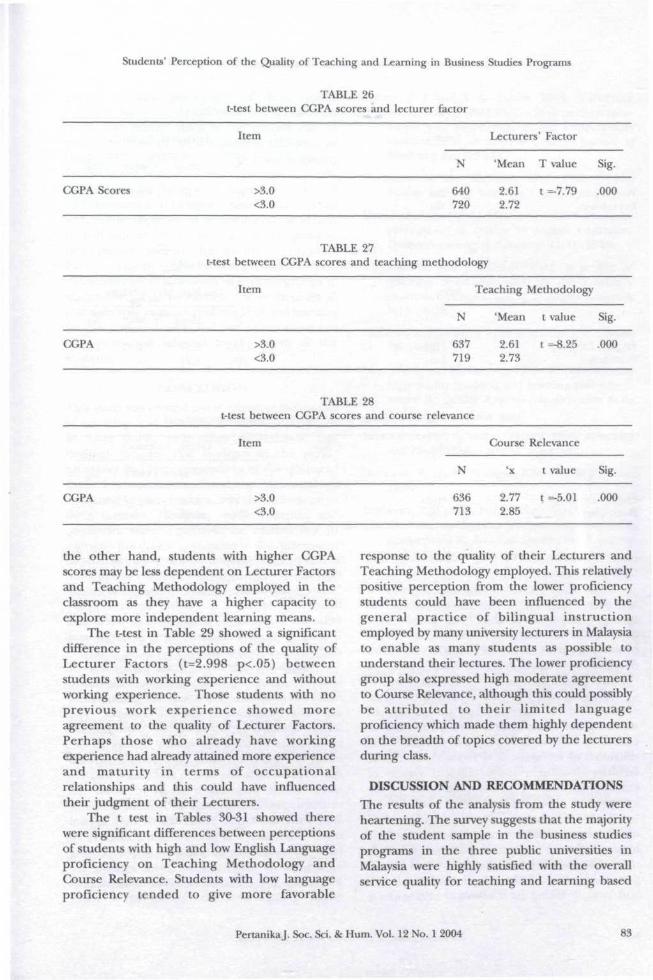
In Tables 26-28, t-tests showed a significantdifference in the perceptions of students whoscored CGPA of >3.0 and those who scored <3.0in Lecturer Factors (t= 7.79 p<.05), TeachingMethodology (t=8.25 p<.05)and Course
Relevance (t=5.01 p<.05). This means thatstudents who scored less than CGPA 3.0 tendedto agree with the quality of their Lecturers,Teaching Methodology and Course Relevancein their business courses.
The results indicate that the lesser the CGPAscores, the more dependent the students are onthe conditions prevailing in their courses. On
82 PertanikaJ. Soc. Sci. & Hum. Vol. 12 No. 1 2004
Students' Perception of the Quality of Teaching and Learning in Business Studies Programs
TABLE 26t-test between CGPA scores and lecturer factor
CGPA Scores
CGPA
CGPA
Item
>3.0<3.0
N
640720
Lecturers' Factor
'Mean
2.612.72
TABLE 27t-test between CGPA scores and teaching methodology
Item
>3.0<3.0
t-test between <
Item
>3.0<3.0
Teaching
N
637719
TABLE 283GPA scores and course relevance
N
636713
'Mean
2.612.73
Course
'x
2.772.85
T value
t -7.79
Methodology
t value
t =-8.25
Relevance
t value
t =-5.01
Sig.
.000
Sig.
.000
Sig.
.000
the other hand, students with higher CGPAscores may be less dependent on Lecturer Factorsand Teaching Methodology employed in theclassroom as they have a higher capacity toexplore more independent learning means.
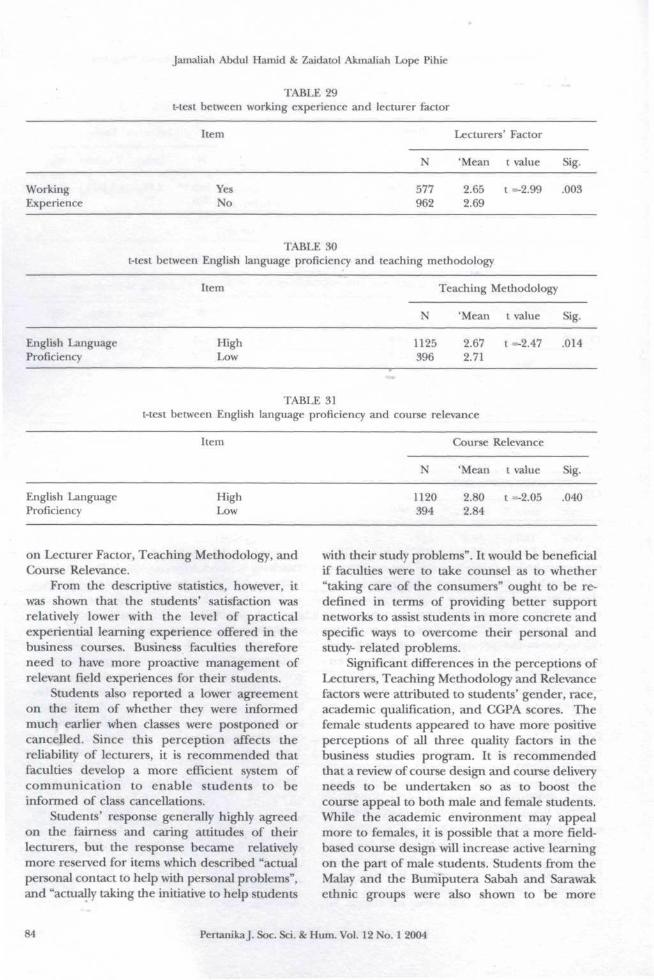
The t-test in Table 29 showed a significantdifference in the perceptions of the quality ofLecturer Factors (t=2.998 p<.05) betweenstudents with working experience and withoutworking experience. Those students with noprevious work experience showed moreagreement to the quality of Lecturer Factors.Perhaps those who already have workingexperience had already attained more experienceand maturity in terms of occupationalrelationships and this could have influencedtheir judgment of their Lecturers.
The t test in Tables 30-31 showed therewere significant differences between perceptionsof students with high and low English Languageproficiency on Teaching Methodology andCourse Relevance. Students with low languageproficiency tended to give more favorable
response to the quality of their Lecturers andTeaching Methodology employed. This relativelypositive perception from the lower proficiencystudents could have been influenced by thegeneral practice of bilingual instructionemployed by many university lecturers in Malaysiato enable as many students as possible tounderstand their lectures. The lower proficiencygroup also expressed high moderate agreementto Course Relevance, although this could possiblybe attributed to their limited languageproficiency which made them highly dependenton the breadth of topics covered by the lecturersduring class.
DISCUSSION AND RECOMMENDATIONSThe results of the analysis from the study wereheartening. The survey suggests that the majorityof the student sample in the business studiesprograms in the three public universities inMalaysia were highly satisfied with the overallservice quality for teaching and learning based
PertanikaJ. Soc. Sci. & Hum. Vol. 12 No. 1 2004
Jamaliah Abdul Hamid 8c Zaidatol Akmaliah Lope Pi hie
TABLE 29t-test between working experience and lecturer factor
WorkingExperience
English LanguageProficiency
English LanguageProficiency
Item
YesNo
TABLE 30t-test between English language proficiency and
Item
HighLow
N
577962
Lecturers' Factor
'Mean
2.652.69
t value
t -2.99
teaching methodology
Teaching
N
1125396
'Mean
2.672.71
TABLE 31t-test between English language proficiency and course relevance
Item
HighLow
N
1120394
Course
'Mean
2.802.84
Methodology
t value
t =-2.47
Relevance
t value
t -2.05
Sig.
.003
Sig.
.014
Sig.
.040
on Lecturer Factor, Teaching Methodology, andCourse Relevance.
From the descriptive statistics, however, itwas shown that the students' satisfaction wasrelatively lower with the level of practicalexperiential learning experience offered in thebusiness courses. Business faculties thereforeneed to have more proactive management ofrelevant field experiences for their students.
Students also reported a lower agreementon the item of whether they were informedmuch earlier when classes were postponed orcancelled. Since this perception affects thereliability of lecturers, it is recommended thatfaculties develop a more efficient system ofcommunication to enable students to beinformed of class cancellations.
Students' response generally highly agreedon the fairness and caring attitudes of theirlecturers, but the response became relativelymore reserved for items which described "actualpersonal contact to help with personal problems",and "actually taking the initiative to help students
with their study problems". It would be beneficialif faculties were to take counsel as to whether"taking care of the consumers" ought to be re-defined in terms of providing better supportnetworks to assist students in more concrete andspecific ways to overcome their personal andstudy- related problems.
Significant differences in the perceptions ofLecturers, Teaching Methodology and Relevancefactors were attributed to students' gender, race,academic qualification, and CGPA scores. Thefemale students appeared to have more positiveperceptions of all three quality factors in thebusiness studies program. It is recommendedthat a review of course design and course deliveryneeds to be undertaken so as to boost thecourse appeal to both male and female students.While the academic environment may appealmore to females, it is possible that a more field-based course design will increase active learningon the part of male students. Students from theMalay and the Bumiputera Sabah and Sarawakethnic groups were also shown to be more
84 PertanikaJ. Soc. Sci. 8c Hum. Vol. 12 No. 1 2004

Students' Perception of the Quality of Teaching and Learning in Business Studies Programs
positive in their perceptions of these qualityfactors. More in-depth studies, preferablyqualitative studies need to be carried out toprobe the reasons for the positive affiliation ofthese gender and ethnic groups towards qualityfactors in the business studies program in publicuniversities. Students who scored a CGPA of<3.0, students with work experience, and studentswith either Diploma or Matriculation academicqualifications also showed more positiveperceptions towards the quality of LecturerFactor, Teaching Methodology, and CourseRelevance. More dialogues with these groups ofstudents need to be carried out by faculties sothat a sharper evaluation of teaching and learningfactors, course design, and course relevance canbe constructed relevant to the needs of thestudents.
CONCLUSION
This study was carried out to examine the qualityof teaching and learning in business programsin three public universities in Malaysia. Thefindings indicate that students in the publicuniversity had high perceptions of the quality oftheir Lecturers, the Teaching Methodologyemployed in the program, and the Relevance oftheir Courses. However, more in-depth, andqualitative studies need to be carried out toexamine the details pertaining to the differencesof perceptions on all three quality factors basedon gender, ethnic background, academicqualification, and academic achievement.
REFERENCESATHANASSOPOULOS, A. D. 1997. Another look into
the agenda of customer satisfaction focusingon service providers' own and perceivedviewpoints. International Journal of BankMarketing 15(7): 264-278.
BOULDING W., A. KARIA, R. STAELIN and V. ZEITHMAL.1993. A dynamic process model of servicequality: from expectations to behavioralintentions. Journal of Marketting Research 30: 7-27.
CARMAN, J. M. 1995. Consumer perceptions of servicequality: an assessment of the SERVQUALdimensions. Journal of Retailing 66(1): 33-55.
CASEY, R, P. GENTILE and S. BIGGER. 1997. Teachingappraisal in higher education: an Australianperspective. Higher Education 34(4): 459-482.
CRONIN, J. J. and S. A. TAYLOR. 1994. SERVPERFversus SERVQUAL: Reconciling performance-based and perceptions-minus expectationsmeasurement of service quality. Journal ofMarketing 51: 125-131.
ENTWISTLE, N. and RAMSDEN. 1987. UnderstandingStudent Learning London: CroonHelm.
HILL, Y., L. LOMAS andj. MACGRE(X>R. 2003. Students*perceptions of quality in higher education.Quality Assurance in Education 11(1): 15-20.
LAMMERS, W. and J. MURPHY. 2002. A profile ofteaching techniques used in the universityclassroom. Active Learning in Higher Education3(1): 54-67.
MACHINA, K. Evaluating student evaluations. Academe73: 19-22.
MARTENS, E. and M, PROSSER. 1998. What constituteshigh quality teaching and learning and how toassure it. Quality Assurance in Education 6(1):28-36.
MORTON-COOPER, A. and A. PALMER. 1993. Mentoringand Perceptorship. Oxford: Blackwell.
NEUMANN, R. Studies in Higher Education 26(2) June:135-47.
O.STAVSKY, R W. 1985. Perceived quality in consumerdecision making: an integrated theoreticalperspective. In Perceived Quality, ed. J. Jacobyandj. Olson. Massachusets: Lexington Books.
O'NEIL, M. J. 1995. Towards a model of the learnerin higher education and some implications forteachers in fostering a high quality learningenvironment. In Research, Teaching and Learningin Higher Education, ed. B. Smith and S. Brown.London: Kogan Page.
PARASUMARAN A, V. ZEITHMAL and B. LEONARD. 1985.A conceptual model of service quality and itsimplications for future research. Journal ofMarketing 49 Fall: 41-50.
PARASUMARAN, A, V. A ZEITHMAL and L. L. BERRY.1994. Reassessment of expectations as acomparison standard in measuring servicequality: implications for further research.Journal of Marketting 58 January: 111-124.
PHILIP, G. and S. A. HAZLETT. 1997. Themeasurement if service quality: a new P-C-Pattributes model. International Journal of Qualityand Reliability Management 14(3): 260-286.
Pertanika J. Soc. Sci. & Hum. Vol. 12 No. 1 2004 85

Jamaliah Abdul Hamid & Zaidatol Akmaliah Lope Pihie
PENNINGTON, G. and M. O'NKIL. 1994. Enhancingthe quality of teaching and learning in highereducation. Quality Assurance in Education 2(3):13-18.
RAMSDEN, P. 1988. Improving Learning: New Perspectives.London: Kogan Page.
ROMAINVILLH, M. 1999. Quality evaluation of teachingin higher education. Higher Education in EuropeXXIV(3).
ROWLEY, J. 1997. Beyond service quality dimensionsin higher education and towards a servicecontract. Quality Assurance in Education 5(1): 7-14.
TEAS, K. 1994. Expectations as a comparisonstandard in measuring service quality: anassessment of a re-assessment. Journal ofMarketing 58: 132-139.
SAMUELOWICZ, K. andj. D. BAIN. 1992. Conceptionsof teaching held by academic teachers. HigherEducation 24: 93-111.
SHELTON, K 1996. In Search of Quality. Kuala Lumpur:Golden Books Centre.
WRIGHT, R. E. 1996. Quality Factors in highereducation: the students' viewpoint. CollegeStudent Journal 30 June: 269-271.
ZEITHMAL, V. 1987. Defining and relating price,perceived quality and perceived value:marketting. Science Institute, Cambridge,Massachussets. Request No, p. 87-10L
(Received: 14 October 2003)
86 PertanikaJ. Soc. Sci. & Hum. Vol. 12 No. 1 2004