student perceptions of engagement, challenge, scaffolding … · student perceptions of engagement,...
TRANSCRIPT
STUDENT PERCEPTIONS OF ENGAGEMENT, CHALLENGE, SCAFFOLDING,
AND CONFIDENCE WHEN COMPLETING HIGH SCHOOL ALGEBRA TASKS
by
Christopher S. Hlas
A thesis submitted in partial fulfillment of the requirements for the Doctor of
Philosophy degree in Education (Mathematics Education) in the Graduate College of
The University of Iowa
July 2005
Thesis Supervisor: Professor Emeritus Harold L. Schoen

Copyright by CHRISTOPHER S. HLAS
2005 All Rights Reserved
Graduate College The University of Iowa
Iowa City, Iowa
CERTIFICATE OF APPROVAL
_______________________
PH.D. THESIS
_______________
This is to certify that the Ph.D. thesis of
Christopher S. Hlas
has been approved by the Examining Committee for the thesis requirement for the Doctor of Philosophy degree in Education (Mathematics Education) at the July 2005 graduation.
Thesis Committee: ___________________________________ Harold L. Schoen, Thesis Supervisor
___________________________________ Timothy Ansley
___________________________________ Joyce Moore
___________________________________ Paul S. Muhly
___________________________________ William Nibbelink
___________________________________ Thomas Rocklin

For Yoda.
ii

Your problem may be modest; but if it challenges your curiosity and brings into play your inventive facilities, and if you solve it by your own means,
you may experience the tension and enjoy the triumph of discovery.Pólya, How to Solve it
iii
ACKNOWLEDGEMENTS
First of all, I would like to thank my committee members. Everyone worked
together to ensure that I would have the best possible dissertation. I would like to
especially thank professors Muhly and Zbiek. Without them I never would have gone into
education.
Of course I thank my family and friends. My family has supported me throughout
my entire college career, almost a decade in the making. My parents were there when I
needed them (especially when I needed to move). As for my brother, when I began
college he was barely passing high school, now he is a father. So much has changed, and
so little at the same time.
I also thank my friends. Specifically I thank Kris and Cos, who's dissertations
helped guide me on my way; Christine and Jared, who share the same love for a good
restaurant; Teresa, who always had an open door; John (JW), who loves to discuss
education more than any one else I know; Kathy, who ties for the happiest person I know;
Allison, who I feel obligated to put in because we work together; and Catherine, our
biggest supporter and nag.
Anne. It is difficult for me to express how much you have helped me. Thanks for
all the support I know about, and more so, for all the support I don't know. Life has
thrown us together and not even dissertations could tear us apart. It means a lot knowing
you will always be there … my love … my Anne.
Lastly, I would like to thank Hal Schoen, my advisor. I have worked with many
professors and advisors in my time as a student. It strikes me that Hal is a good professor,
iv

a good advisor, and most importantly, a good person. His retirement this past year is a
great loss to the university and to the mathematics education community. Thank you for
staying for one last graduate student. --Chris
v

ABSTRACT
The study investigates student perceptions of high school algebra tasks. Students
completed a short survey after each of 38 pre-selected tasks. These tasks focused on
algebra content and were from the curriculum Contemporary Mathematics in Context.
The survey asked students to rate their levels of interest, concentration, enjoyment,
challenge, amount of help required (scaffolding), and confidence in their solutions. The
average of the first three variables provides a measure of student engagement. Student
scores on two unit examinations provide an achievement measure.
Data for 38 students was collected from three classes in two schools over a 14-
week period. Most of the students were in the ninth grade. Data were analyzed by school
because of statistical differences between schools on engagement variables and
achievement. One school reported moderate engagement, while the other reported lower
engagement. Concentration was rated almost two points higher than both interest and
enjoyment.
For both schools, challenge and help required were both below the midpoint of
the scale. Confidence was high, regardless of perceived challenge of the task. Correlation
coefficients indicate school differences regarding the effects of challenge and scaffolding
on affective variables (interest and enjoyment). There were no statistically significant
correlations between survey variables and achievement.
Current ITBS Mathematics scores were used to create low, middle and high
groups of entering mathematics ability. There were no significant differences between
vi

groups. This is likely due to school differences. There were also no significant
differences by gender.
Mathematics tasks were investigated in three ways. First, there were no
significant differences between tasks from the first half of an investigation versus the last
half. Second, there were no significant differences between results for the two units.
Finally, a post hoc analysis was done by task. There was variation between tasks, but no
clear pattern in the results.
The overall results suggest that student engagement is a complex structure and is
influenced by school and teacher factors. It is hypothesized that teacher's knowledge of
the curriculum and quality of scaffolding are partially responsible for school differences.
vii

TABLE OF CONTENTS
LIST OF TABLES............................................................................................................. xi
LIST OF FIGURES ......................................................................................................... xiii
CHAPTER
ONE INTRODCUTION ............................................................................................1 Research Questions...........................................................................................5 Mathematics Content Description ....................................................................6
Unit 2: Pattern of Change ..........................................................................7 Unit 3: Linear Models ..............................................................................8
Definitions ........................................................................................................8
TWO REVIEW OF RESEARCH.............................................................................10 Flow Theory....................................................................................................10
Experience-Sampling Method .................................................................13 Theoretical Model ...................................................................................14 Research in Classrooms...........................................................................17
Student Engagement and Flow Theory...........................................................19 Interest .....................................................................................................20 Concentration ..........................................................................................21 Enjoyment................................................................................................22 Student Engagement ................................................................................22
Non-engagement Variables ............................................................................24 Challenge.................................................................................................24 Scaffolding / Help Required....................................................................25 Confidence...............................................................................................25
Summary.........................................................................................................26
THREE METHODOLOGY .........................................................................................28 Participants .....................................................................................................28
Tanner High School.................................................................................30 Baker High School ..................................................................................31 Summary..................................................................................................33
Design .............................................................................................................34 Experience-Sampling Method .................................................................34 Repeated Survey......................................................................................36 Unit Examinations ...................................................................................39
Analysis ..........................................................................................................40 Research Questions .................................................................................40 Independent Variables .............................................................................42
Classroom and school differences....................................................42 Gender ..............................................................................................43 Mathematics ability ..........................................................................43 Task location ....................................................................................43
viii
FOUR DATA ANALYSIS ........................................................................................44 Dependent Variables.......................................................................................47
Description of Student Reports of Engagement ......................................47 Interest ..............................................................................................47 Concentration ...................................................................................47 Enjoyment ........................................................................................48 Student engagement .........................................................................49 Summary ..........................................................................................50
Description of Students Reports of Non-engagement Variables.............51 Challenge..........................................................................................51 Scaffolding .......................................................................................52 Confidence .......................................................................................52 Summary ..........................................................................................54
Description of Achievement....................................................................54 Unit 2................................................................................................55 Unit 3................................................................................................56 Exam Total .......................................................................................56 Summary ..........................................................................................56
Relationships among Dependent Variables.............................................57 Tanner...............................................................................................58 Baker ................................................................................................60 Summary ..........................................................................................62
Independent Variables ....................................................................................62 School Differences ..................................................................................62
Differences between school means ..................................................62 Differences between correlation coefficients ...................................63 Summary ..........................................................................................68
Gender Differences..................................................................................69 Task Location ..........................................................................................69 Unit Differences ......................................................................................70 Mathematics Ability ................................................................................71
Post Hoc Analysis...........................................................................................74 Summary..................................................................................................80
FIVE DISCUSSION.................................................................................................82 Research Questions.........................................................................................82 Interpretations and Implications .....................................................................86 Limitations......................................................................................................89 Future Research ..............................................................................................91
APPENDIX
A SURVEY INSTRUMENT..............................................................................94
B INFORMED CONSENT DOCUMENT ........................................................95
C CLASSROOM OBSERVATION NOTES.....................................................99
D CLASSIFICATION OF MATHEMATICS TASKS....................................101
ix
E OVERVIEW OF MATHEMATICS CURRICULUM.................................103 Unit 2: Pattern of Change .............................................................................103 Unit 3: Linear Models...................................................................................104
F DESCRIPTION OF STUDENTS WITH LESS THAN 50% SURVEY COMPLETION.............................................................................................108
G TABLE AND FIGURES FOR THE POST HOC ANALYSIS....................110
H STUDENT COMMENTS ............................................................................119
REFERENCES ................................................................................................................123
x

LIST OF TABLES
Table
4.1 Independent t-tests of survey variables by classrooms at Baker High School (2-tailed)....................................................................................................................46
4.2 Description of interest by school ..............................................................................48
4.3 Description of concentration by school. ...................................................................48
4.4 Description of enjoyment by school .........................................................................49
4.5 Description of student engagement by school ..........................................................50
4.6 Description of challenge by classroom.....................................................................52
4.7 Description of help required by classroom...............................................................53
4.8 Description of confidence by classroom...................................................................53
4.9 Description of achievement by school and examination ..........................................55
4.10 Description of standardized exam total scores by school .........................................57
4.11 Correlations among dependent variables for Tanner (N=21) and Baker (N=17).......................................................................................................................59
4.12 Independent t-tests of dependent variables by school (2-tailed)...............................64
4.13 Differences between correlation coefficients at Tanner and Baker..........................65
4.14 Student means (and standard deviations) on dependent variables by school and gender.................................................................................................................69
4.15 Student means (and standard deviations) for survey variables by school and task location ..............................................................................................................70
4.16 Unit means (and standard deviations) for survey variables by school and curricular unit............................................................................................................71
4.17 Differences between ITBS correlation coefficients at Tanner (N=20) and Baker (N=13) ............................................................................................................72
4.18 Number of students per national student percentile rankings by school ..................74
4.19 Mean z-scores across students for selected tasks......................................................76
D.1 Classification of mathematics tasks........................................................................101
xi
F.1 Number of surveys completed by student...............................................................108
F.2 Description of students with fewer than 50% completion by school .....................109
G.1 Tasks with means over 0.25 SD (+) and below 0.25 SD (–) ..................................117
xii

LIST OF FIGURES
Figure
2.1 Theoretical model of flow.........................................................................................16
4.1 Box plots of survey items and engagement grouped by school................................51
4.2 School means for non-engagement variables ...........................................................54
4.3 Box plots of achievement scores by unit and school. ...............................................57
4.4 Scatter plots of challenge and engagement by school ..............................................66
4.5 Scatter plots of help required and interest by school ...............................................67
4.6 Scatter plots of help required and confidence by school ..........................................68
4.7 Scatter plots of engagement and prior mathematics ability by school .....................73
4.8 Scatter plots of confidence and prior mathematics ability by school .......................73
4.9 Task 2.13...................................................................................................................77
4.10 Task 2.14...................................................................................................................77
4.11 Task 2.03...................................................................................................................78
4.12 Task 3.22...................................................................................................................79
4.13 Task 2.02...................................................................................................................80
G.1 Mean z-scores for interest by task ..........................................................................110
G.2 Mean z-scores for concentration by task ................................................................111
G.3 Mean z-scores for enjoyment by task .....................................................................112
G.4 Mean z-scores for engagement by task...................................................................113
G.5 Mean z-scores for challenge by task.......................................................................114
G.6 Mean z-scores for help required by task.................................................................115
G.7 Mean z-scores for confidence by task.....................................................................116
xiii
1
CHAPTER ONE
INTRODUCTION
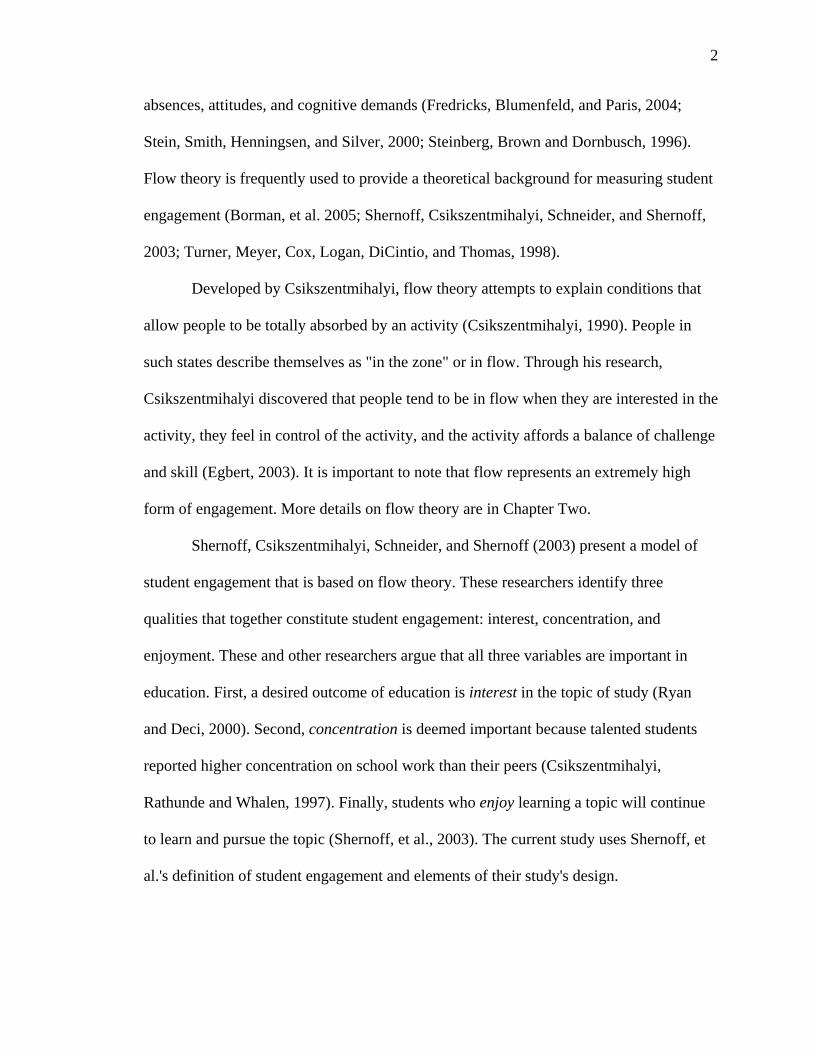
Fewer and fewer students take mathematics as they continue through their
academic lives. In fact, once mathematics ceases to be a requirement, students drop out at
a rate of 50% per year (Steen, 1989). More recently, secondary students report they want
less mathematics and they enjoy it less than other classes (Shernoff, Knauth, and Markis,
2001). It is difficult to imagine that such students enjoy being in class or are putting forth
much effort to learn. Instead, it is more likely that these students are bored and feel that
mathematics is a task to be suffered. One hypothesis to explain these behaviours is that
students are not engaged during mathematics classes.
Student engagement refers to the psychological connection between students and
classroom activities (Steinberg, Brown and Dornbusch, 1996). This broad definition
allows for various interpretations of what constitutes engagement. In a meta-analysis of
the subject, Fredricks, Blumenfeld, and Paris (2004) identify three general areas of
engagement: behavioral, emotional, and cognitive. Behavioral engagement focuses on
conduct, effort and participation. Emotional engagement involves affective variables such
as boredom or happiness. Cognitive engagement includes attributes such as
metacognition and a preference for challenges. Research in these areas tend to overlap
because there are not precise definitions or standard measures for types of engagement
(Fredrick, Blumenfeld, and Paris, 2004).
Measures of student engagement are more various than its interpretations. A few
examples of measures include the following: time on task, disruptive behaviour,
2
absences, attitudes, and cognitive demands (Fredricks, Blumenfeld, and Paris, 2004;
Stein, Smith, Henningsen, and Silver, 2000; Steinberg, Brown and Dornbusch, 1996).
Flow theory is frequently used to provide a theoretical background for measuring student
engagement (Borman, et al. 2005; Shernoff, Csikszentmihalyi, Schneider, and Shernoff,
2003; Turner, Meyer, Cox, Logan, DiCintio, and Thomas, 1998).
Developed by Csikszentmihalyi, flow theory attempts to explain conditions that
allow people to be totally absorbed by an activity (Csikszentmihalyi, 1990). People in
such states describe themselves as "in the zone" or in flow. Through his research,
Csikszentmihalyi discovered that people tend to be in flow when they are interested in the
activity, they feel in control of the activity, and the activity affords a balance of challenge
and skill (Egbert, 2003). It is important to note that flow represents an extremely high
form of engagement. More details on flow theory are in Chapter Two.
Shernoff, Csikszentmihalyi, Schneider, and Shernoff (2003) present a model of
student engagement that is based on flow theory. These researchers identify three
qualities that together constitute student engagement: interest, concentration, and
enjoyment. These and other researchers argue that all three variables are important in
education. First, a desired outcome of education is interest in the topic of study (Ryan
and Deci, 2000). Second, concentration is deemed important because talented students
reported higher concentration on school work than their peers (Csikszentmihalyi,
Rathunde and Whalen, 1997). Finally, students who enjoy learning a topic will continue
to learn and pursue the topic (Shernoff, et al., 2003). The current study uses Shernoff, et
al.'s definition of student engagement and elements of their study's design.

3
This model of student engagement was used to answer two questions in a
longitudinal study of 526 high school students (Shernoff, et al., 2003). The first question
was, "how do high school students spend their time in school?" (p. 162). The researchers
found that students spent most of their time during a school day doing individual work
(23%) and in lectures (21%). Further, small amounts of time were spent in interactive
environments. For example, students were in class discussions or group work nine
percent and six percent of the time, respectively.
The second question was, "what conditions promote engagement of secondary
students?" (p. 158). Students reported high levels of both challenge and skills when
engaged in an activity. Engaging activities included individual work and group work, as
opposed to exams and passive activities such as listening to lectures or watching
educational videos. Further, students were more engaged in non-academic courses such
as art and computer science. Mathematics classes resulted in the lowest engagement,
though results were not significantly different from other academic courses like history or
science.
When considering these results with respect to mathematics, it is important to
consider certain limitations. Although the study stated that students in mathematics
classes reported the lowest level of engagement, it was not explicitly stated what kinds of
tasks students worked on (Shernoff, et al., 2003). Recent research in mathematics
education provides recommendations for improving engagement in mathematics tasks
such as basing tasks on real-world contexts and using group work to promote student
discussion and understanding (NCTM, 1989, 2000). Each of these recommendations runs
counter to the mathematics class environments described above.
4
A second limitation is that specific attributes of activities are not considered.
Rather, Shernoff, et al. (2003) used general instruments to account for the variety of
activities that subjects participated in. The researchers themselves suggest that further
research is needed to investigate the relationships between task-specific variables and
student engagement.
Finally, learning mathematics is the most important goal in any mathematics
classroom. Yet Steinberg, Brown, and Dornbush (1996) have noted that, "surprisingly
little research has examined the role of engagement in student achievement" (p. 64). The
study by Shernoff, et al. (2003), for example, does not include a measure of achievement.
These three limitations have helped to shape the current study. The first limitation
involved the types of tasks that students were working on in mathematics class. The
present study will address this limitation by focusing on mathematics tasks based on the
NCTM recommendations mentioned above. Such tasks were developed for the
curriculum Contemporary Mathematics in Context (Coxford, Fey, Hirsch, Schoen,
Burrill, Hart, et al., 2003), which will be discussed in more detail in the section
Mathematics Content Focus.
The second limitation had to do with the exclusive use of general measures. In the
current study, engagement is investigated along with non-engagement variables that are
specific to mathematics tasks. Three such non-engagement variables that relate to
mathematics instruction are: perceived challenge of the task, amount of scaffolding
received, and student confidence in their own solutions. Perceived challenge is a measure
of how difficult a task is from the viewpoint of a student. Perceived challenge has been
studied by researchers of both student engagement (Shernoff et al., 2003) and

5
mathematical problem solving (Hiebert et al., 1996; Schoenfeld, 1982, 1985). Scaffolding
refers to reducing the complexity of problems in various ways to make them more
accessible to students (Kilpatrick, Swafford, and Findell, 2001). In moderation,
scaffolding is a useful aid to learning, but such aid has come under some scrutiny. One
finding is that too much scaffolding does not allow students to struggle enough with the
content (Hiebert, et al., 1996; Stein, et al., 2000). Lastly, confidence refers to students'
perception of skills in comparison to a task's challenge (Csikszentmihalyi, 1990;
McLeod, 1992; Middleton & Spanias, 1999). When confidence is high, students believe
they are able to meet the challenge. When confidence is low, students perceive that their
skills might not be sufficient to meet the challenge of the task.
The final limitation was an absence of an achievement measure. To account for
this, the current study will include mathematical achievement in the form of unit
examinations. This will allow for the investigation of relationships among engagement,
non-engagement, and achievement variables.
Research Questions
1. During class time, how do secondary students rate their engagement of
mathematics tasks? Each factor of student engagement will be assessed through
the following questions:
a. How interesting are mathematics tasks?
b. How well do students concentrate on mathematics tasks?
c. How enjoyable are mathematics tasks?
2. During class time, how do secondary students rate non-engagement variables for
mathematics tasks? Specifically,
6
a. How do students rate the challenge of mathematics tasks?
b. How much help do students report they receive on mathematics tasks?
c. How confident are students in their solutions to mathematics tasks?
3. What are the relationships among engagement variables (interest, concentration,
and enjoyment) and non-engagement variables (challenge, help required, and
confidence)?
4. What is the relationship between engagement variables (interest, concentration,
and enjoyment) and short-term achievement?
5. What is the relationship between non-engagement variables (challenge, help
required, and confidence) and short-term achievement?
Mathematics Content Description
The curriculum Contemporary Mathematics in Context (CMIC) provide the tasks
used in this study (Coxford, Fey, Hirsch, Schoen, Burrill, Hart, et al., 2003). The
following description draws heavily on the CMIC Teachers Guide. This curriculum is
based on NCTM (1989) recommendations and is designed around multi-day lessons
centered on big mathematical ideas. Active learning and teaching are encouraged through
the use of a four-phase cycle for each lesson: launch, investigate, share and summarize,
and on your own.
The launch begins each lesson with a full class discussion. This discussion sets
the context for the students and helps to generate student interest. It also provides an
opportunity for the teacher to assess prior student knowledge.
The lesson continues by having students investigate and make sense of problem
situations. This is done through investigations, sequences of focused problems and

7
questions that extend the launch. During investigations, students often work in
collaborative groups to gather data, look for patterns, construct models, and make and
verify conjectures.
Following each investigation, a checkpoint allows students to share and
summarize the mathematical ideas they encountered. This is usually done as a whole
class discussion. Salient points, key concepts and methods that emerge during the
investigation are explicitly summarized.
Finally, an on your own exercise is provided for students to complete
individually. This exercise is directly related to the lesson objectives. Further, it provides
an opportunity for individual students to show what they have learned and allows the
teacher to assess each student's understanding of the lesson.
The four-phase cycle provides opportunities to learn various mathematics content.
For this study, two units were selected that focus on algebra content. A description of
these units follow.
Unit 2: Pattern of Change
The goals of Unit 2 are to develop students’ abilities to recognize important
patterns of change among variables and to represent those patterns using tables of
numerical data, coordinate graphs, verbal descriptions, and symbolic rules. Mathematics
topics in this unit include: coordinate graphs, tables, algebraic formulas (rules),
relationships between variables, linear functions, nonlinear functions, and NOW-NEXT
recurrence relations. Two tasks from each investigation are selected for this study. See
Appendix E for an outline of objectives and lesson structure. Sample tasks can be found
in Chapter Four.
8
Unit 3: Linear Models
The goals of Unit 3 are to develop student confidence and skill in using linear
functions to model and solve problems in situations which exhibit constant (or nearly
constant) rate of change or slope. Mathematics topics in this unit include: linear
functions, slope of a line, rate of change, intercepts, distributive property, linear equations
(including y = a + bx and NOW-NEXT forms), solving linear equations and inequalities,
using linear equations to model given data, and determining best-fit lines for scatter plot
data. Two tasks from each investigation are selected for this study. See Appendix E for
an outline of objectives and lesson structure. Sample tasks can be found in Chapter Four.
Definitions
Closing task
Indicates a task from the last half of the investigation, including the middle when
the investigation has an odd number of tasks.
Introductory task
Indicates a task from the first half of investigation.
Investigation
A sequence of tasks consistent with the CMIC curriculum as described in the
section Mathematics Content Focus.
Mathematics task
Used interchangeably with mathematical problem and mathematical exercise and
usually refers to one item in an investigation.
Scaffolding

9
Refers to the help students receive in order to solve a mathematics task
(Kilpatrick, Swafford, and Findell, 2001). For this study, scaffolding will be used
interchangeably with "help required" as identified by research question #2b and
question #5 of the survey instrument (see Appendix A).
Student engagement
A composite variable that is the average of the following three student perception
variables: interest in the task, concentration on the task, and enjoyment of the task
(Shernoff, et al., 2003).

10
CHAPTER TWO
REVIEW OF RESEARCH
Besides achievement, the dependent variables in this study fall into two general
categories, engagement and non-engagement. Engagement variables include interest,
concentration, and enjoyment. The average of these three variables provides the measure
of student engagement for this study. This model for understanding and measuring
student engagement is based on flow theory. The non-engagement variables in this study,
as the name suggests, are not directly related to engagement. These variables are
challenge, help required, and confidence.
Relevant research for both engagement and non-engagement variables is reviewed
in this chapter to show how the current study investigates these variables in a unique way.
First, flow theory is discussed by focusing on the theoretical background, how flow is
studied, and previous studies of flow in mathematics classrooms. It is necessary to
describe this framework because the theoretical background for student engagement and
the design of this study both draw on flow theory. Second, a model of student
engagement is discussed that is based on flow theory. Again, the focus is on results that
are specific to mathematics classrooms. Third, relevant research on the three non-
engagement variables is summarized. Fourth, a summary is provided that contains salient
details of the current study and discusses how it extends previous research.
Flow Theory
Developed by Csikszentmihalyi (pronounced CHIK-SENT-ME-HI-LEE), flow
theory provides a framework for understanding periods of optimal experience and high

11
engagement of activities. In his doctoral research, Csikszentmihalyi investigated the
activities of older, male artists (Csikszentmihalyi and Csikszentmihalyi, 1988). He
observed that these artists were in a state of deep concentration and enjoyment while
painting. Once the painting was completed, however, the artist would lose interest in it
and move on to another project. This observation was puzzling. Why would artists spend
so much time and energy to create a painting only to discard it?
Furthermore, Csikszentmihalyi noticed that there were few extrinsic rewards to
painting. "Few artists expected any of their paintings to make them rich or famous …
money and recognition appeared to play a minimal part [in painting]" (Csikszentmihalyi
and Csikszentmihalyi, 1988, p. 4). The absence of extrinsic rewards and interest in the
completed product led Csikszentmihalyi to conclude that the act of painting was
motivation in itself.
This phenomenon is an excellent example of intrinsic motivation. Intrinsic
motivation "refers to doing something because it is inherently interesting or enjoyable"
(Ryan and Deci, 2000, p. 55). Currently, attributes of an activity such as challenge,
curiosity, control and context are known to affect a person's intrinsic motivation (Lepper
and Henderlong, 2000). Further, fostering intrinsic motivation has become an important
goal in education because intrinsic motivation is superior to providing external
motivators (Middleton and Spanias, 1999). During the time of Csikszentmihalyi's
dissertation work, however, research on intrinsic motivation was a relatively new field
with few researchers. Despite this, there were two results from this era that would have a
large impact on Csikszentmihalyi's theory.
12
First, early research on intrinsic motivation had differentiated between the product
and the process (Csikszentmihalyi and Csikszentmihalyi, 1988). Specifically, Maslow
(1968) concluded that some people work hard because the work itself is enjoyable. This
idea is similar to Csikszentmihalyi's finding that the act of painting was more rewarding
to the artist than the finished painting itself. To explain this and similar phenomena,
Maslow coined the term "self-actualization," the need to discover one's potential and
limitations through strenuous activity (Csikszentmihalyi and Csikszentmihalyi, 1988).
Second, other research showed the important role of control in intrinsic
motivation (Csikszentmihalyi and Csikszentmihalyi, 1988). In their research on
schoolchildren, deCharms and Muir (1978) noticed that some students felt more control
over their lives than other students. The students who perceived they had more control
were deemed to be intrinsically motivated whereas the others were not. Other researchers
also investigated control by studying how extrinsic contingencies influence intrinsic
motivation (Amabile, DeJong, and Lepper, 1976; Deci, Koestner, and Ryan, 1999). These
studies found that extrinsic rewards and other external controls can diminish a person's
intrinsic motivation to engage in a task (Deci and Ryan, 1985; Ryan and Deci, 2000).
Work by Maslow, deCharms, Muir and other researchers cited in the previous
paragraph appear to partially explain Csikszentmihalyi's findings concerning the
influence of control on intrinsic motivation. However, the research does not explain why
some activities are intrinsically motivating and others are not. In other words, what are
the defining traits of an intrinsically motivating task?
To answer this question, Csikszentmihalyi continued his research by analyzing
people who pursue strenuous activities. His early research methods were limited to

13
controlled, laboratory settings. To continue his studies, he needed to develop an
instrument to gather data from subjects in their natural environments with minimal
intrusion. This need gave rise to the experience-sampling method.
Experience-Sampling Method
To continue research on intrinsically motivating tasks, the experience-sampling
method (ESM) was developed (Csikszentmihalyi, 1990, 1997; Larson and Csikszent-
mihalyi, 1987). Participants in studies involving ESM are usually required to carry a
device that is programmed to give a random signal. When a signal is received,
participants record information regarding their current activity by completing an
experience-sampling survey. The survey consists of Likert-scale and short-answer
questions covering the descriptive and affective variables of interest in the study. Notice
that these surveys measure a person's subjective perceptions of their experience, an
important point to understand about flow research (Moneta and Csikszentmihalyi, 1996).
Besides the signal-contingent variety of ESM described above, there are two other
variations: interval-contingent and event-contingent (Scollon, Kim-Prieto, and Diener,
2003). The difference between these types of ESM is in how subjects know when to
complete a survey. Interval-contingent ESM asks participants to complete surveys in
predetermined increments of time, whereas the subjects in the event-contingent model
complete a survey after certain events occur. The latter model is a popular method for
collecting data that focuses on specific academic courses. For example, researchers have
required students to complete experience-sampling surveys at the end of courses such as
college statistics and middle school mathematics (Collins, 1995; Turner, et al., 1998).

14
In any version, ESM is usually used for two purposes. The first use is to construct
a "time budget" regarding the activities that participants undertake. Of specific interest
are the types of activities and how much time is spent on these activities (Larson &
Csikszentmihalyi, 1987). Random-signaling and interval-contingent varieties of ESM are
used more for this purpose.
The second use of ESM is to "research psychological reactions to everyday
activities and experiences" (Larson & Csikszentmihalyi, 1987, p. 526). To assess
psychological reactions, the experiences-sampling survey asks subjects what they think
and feel about their current activity. However, it is not expected that subjects are
consistent. "Contrary to a one-time measure, ESM is not based on the assumption that
people are going to be entirely consistent in their responses … In general, however, it
was expected that relative differences between respondents would tend to persist over
time" (Csikszentmihalyi & Larson, 1987, pp. 530-531). Thus, averages of subject
responses are used to identify stable psychological reactions. More discussion of ESM is
in Chapter Three.
Possibly the most important contribution of ESM is that it has allowed researchers
to gather data on subjects in their natural environments with minimal interference. As a
result, researchers of flow are able to investigate a wide variety of activities. Such
research has given rise to a model of flow experiences.
Theoretical model
Using ESM, Csikszentmihalyi continued his research by analyzing people who
pursue strenuous activities, such as rock climbing, playing chess, composing music, and
performing surgeries. Although the activities differ widely, there is an important

15
commonality across these types of subjects. Csikszentmihalyi (1975) identifies this
commonality when he states that, "some people climb mountains whereas others make up
tunes at a piano or push chess pieces across a board is in a sense incidental to the fact that
they are all exploring the limits of their abilities and trying to expand on them" (p. 30). In
order to explain how and why people engage in such activities, Csikszentmihalyi
developed a theory based on periods of optimal experience.
"Flow" is the common term for a state of mind of a person who is totally absorbed
in an activity (Csikszentmihalyi, 1990). In general, there are common traits for situations
in which people experience flow. These traits include: (i) a task that affords a feeling of
balance between challenge and skill, (ii) an intense focus on the task so that time appears
to "fly by", (iii) a task that is interesting or that invokes curiosity, and (iv) a sense of
control regarding the activity (Egbert, 2003). Of these traits, the balance between
challenge and skill is the most widely identified attribute across independent groups in
studies of flow (Turner, et al., 1998). Therefore, flow researchers selected a balance of
high challenge and high skill as the best indicator of flow as seen in Figure 2.1.
"The problem is that a state of flow does not depend entirely on the objective
nature of the challenge present or on the objective level of skills; in fact, whether one is
in flow or not depends entirely on one's perception of what the challenge and skills are"
(Csikszentmihalyi, 1975, p. 50). Thus, the balance of challenge and skill is subjective,
dependent on a person's own point of view.
Furthermore, this subjective balance of challenge and skills is dynamic. That is, a
person is able to move between different states. For example, if a person is relaxed when
doing an activity (see Figure 2.1), then she can increase the level of challenge to move

16
toward a flow state. If a person is anxious when doing an activity, then she can improve
her skills to move toward flow.
Figure 2.1 – Theoretical model of flow
Source: Csikszentmihalyi, M. (1997). Finding flow: The psychology of engagement with everyday life. New York: Basic Books. (p. 31)
This framework for flow theory has paved the way for research in several areas,
including education, sports, gang behaviour, and differences between work and recreation
(Csikszentmihalyi and Csikszentmihalyi, 1988; Csikszentmihalyi, 1990). In the present
study, particular attention is paid to applications of flow theory and ESM within
mathematics classrooms.
17
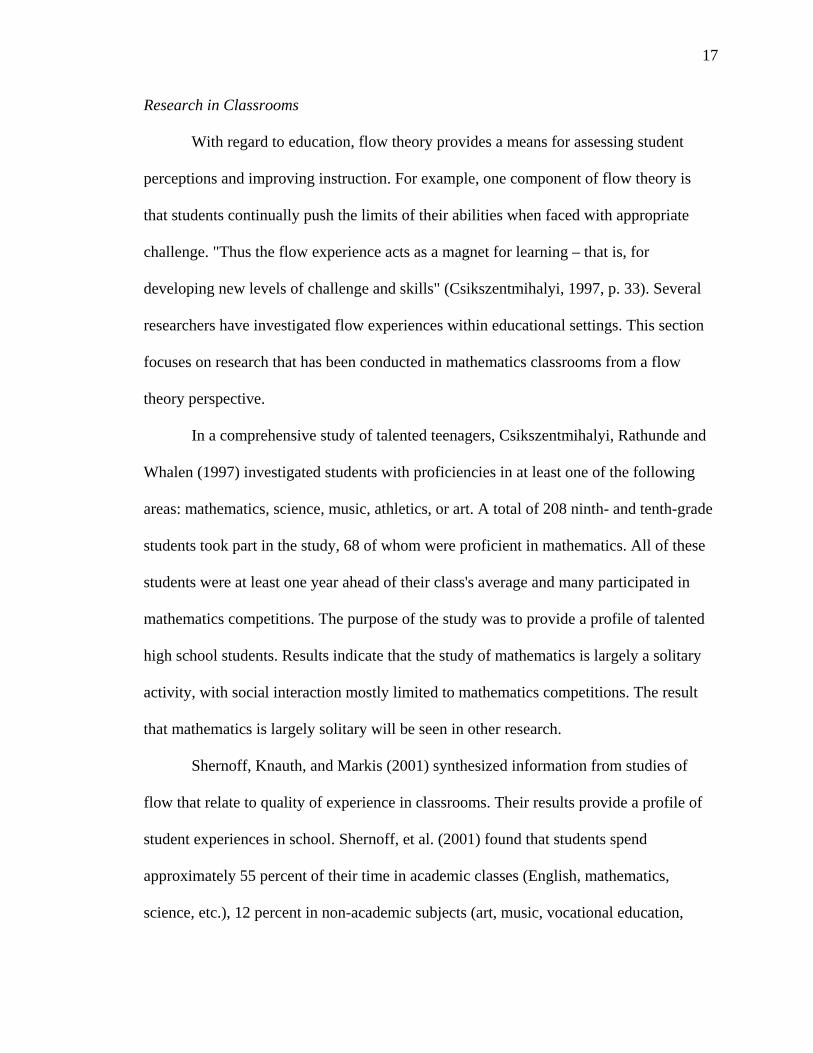
Research in Classrooms
With regard to education, flow theory provides a means for assessing student
perceptions and improving instruction. For example, one component of flow theory is
that students continually push the limits of their abilities when faced with appropriate
challenge. "Thus the flow experience acts as a magnet for learning – that is, for
developing new levels of challenge and skills" (Csikszentmihalyi, 1997, p. 33). Several
researchers have investigated flow experiences within educational settings. This section
focuses on research that has been conducted in mathematics classrooms from a flow
theory perspective.
In a comprehensive study of talented teenagers, Csikszentmihalyi, Rathunde and
Whalen (1997) investigated students with proficiencies in at least one of the following
areas: mathematics, science, music, athletics, or art. A total of 208 ninth- and tenth-grade
students took part in the study, 68 of whom were proficient in mathematics. All of these
students were at least one year ahead of their class's average and many participated in
mathematics competitions. The purpose of the study was to provide a profile of talented
high school students. Results indicate that the study of mathematics is largely a solitary
activity, with social interaction mostly limited to mathematics competitions. The result
that mathematics is largely solitary will be seen in other research.
Shernoff, Knauth, and Markis (2001) synthesized information from studies of
flow that relate to quality of experience in classrooms. Their results provide a profile of
student experiences in school. Shernoff, et al. (2001) found that students spend
approximately 55 percent of their time in academic classes (English, mathematics,
science, etc.), 12 percent in non-academic subjects (art, music, vocational education,
18
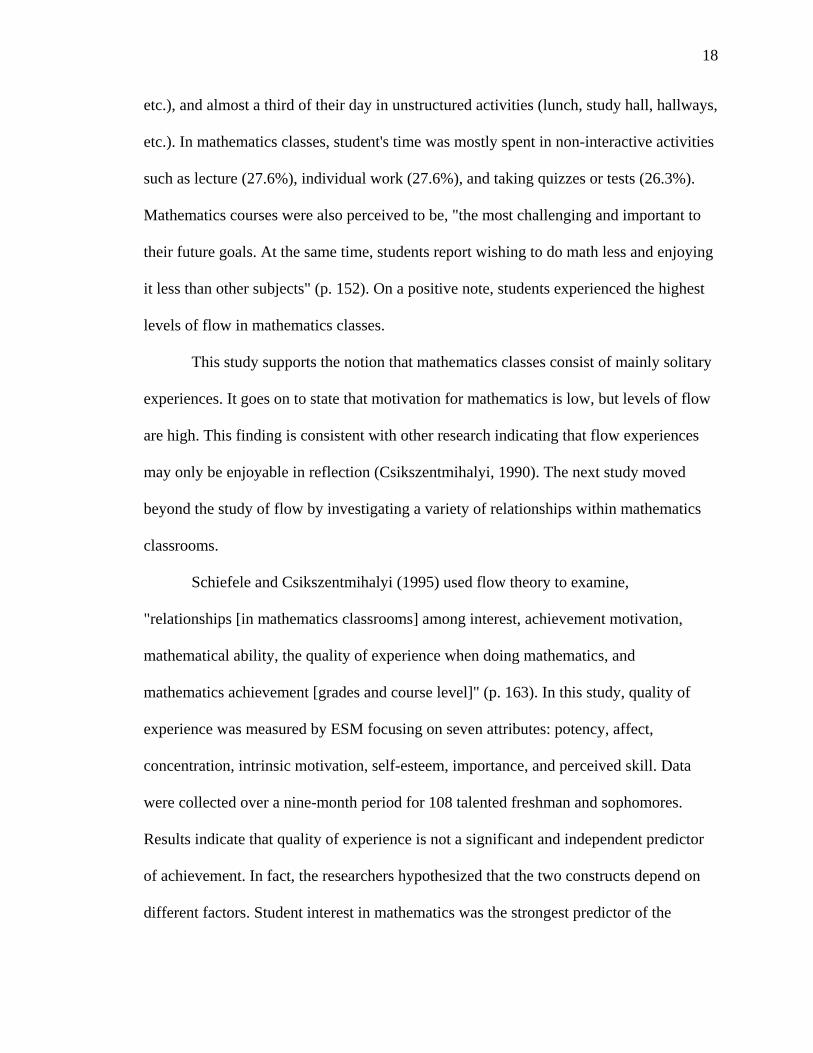
etc.), and almost a third of their day in unstructured activities (lunch, study hall, hallways,
etc.). In mathematics classes, student's time was mostly spent in non-interactive activities
such as lecture (27.6%), individual work (27.6%), and taking quizzes or tests (26.3%).
Mathematics courses were also perceived to be, "the most challenging and important to
their future goals. At the same time, students report wishing to do math less and enjoying
it less than other subjects" (p. 152). On a positive note, students experienced the highest
levels of flow in mathematics classes.
This study supports the notion that mathematics classes consist of mainly solitary
experiences. It goes on to state that motivation for mathematics is low, but levels of flow
are high. This finding is consistent with other research indicating that flow experiences
may only be enjoyable in reflection (Csikszentmihalyi, 1990). The next study moved
beyond the study of flow by investigating a variety of relationships within mathematics
classrooms.
Schiefele and Csikszentmihalyi (1995) used flow theory to examine,
"relationships [in mathematics classrooms] among interest, achievement motivation,
mathematical ability, the quality of experience when doing mathematics, and
mathematics achievement [grades and course level]" (p. 163). In this study, quality of
experience was measured by ESM focusing on seven attributes: potency, affect,
concentration, intrinsic motivation, self-esteem, importance, and perceived skill. Data
were collected over a nine-month period for 108 talented freshman and sophomores.
Results indicate that quality of experience is not a significant and independent predictor
of achievement. In fact, the researchers hypothesized that the two constructs depend on
different factors. Student interest in mathematics was the strongest predictor of the

19
quality of experience in mathematics class. Achievement was most closely linked to
mathematical ability.
The key results of these studies indicate that mathematics is mostly done alone,
and students do not enjoy class despite a relatively large number of flow experiences.
Also, interest is a strong predictor of quality of experience. Achievement, on the other
hand, is not related to quality of experience and is instead strongly linked to mathematical
ability. Besides studying quality of experience, flow theory has also been used to study
student engagement of classroom activities.
Student Engagement and Flow Theory
Student engagement is a construct that is similar to motivation. Research on
motivation investigates the reasons why people are moved to do an activity (Ryan and
Deci, 2000). Such research analyzes causes of people's actions including beliefs
(Middleton, 1995), deadlines (Amabile, DeJong, and Lepper, 1976), or extrinsic rewards
(Deci, Koestner, and Ryan, 1999). Student engagement, however, is not a theory of
motivation (Middleton and Spanias, 1999) and instead relies upon motivational theories
such as flow theory.
Broadly defined, student engagement is based on the idea that students should be
"psychologically 'connected' to what is going on in their classes" (Steinberg, Brown and
Dornbusch, 1996, p. 15). Although this description is vague, it suggests how flow theory
relates to student engagement, namely, a flow experience represents the highest level of
engagement.
Shernoff (2001) developed an explicit definition of student engagement based on
flow theory. His definition incorporated three phenomenological variables that are
20
important to both flow theory and education. These three variables are interest,
concentration, and enjoyment, and each is discussed in more detail below.
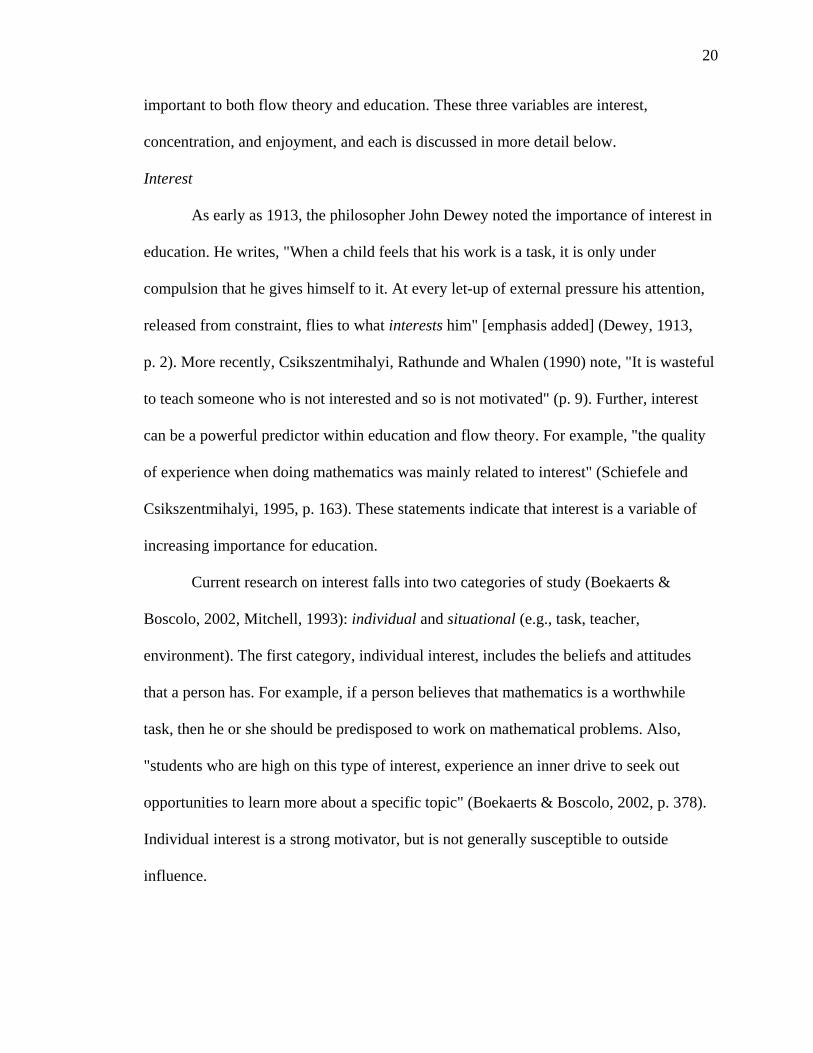
Interest
As early as 1913, the philosopher John Dewey noted the importance of interest in
education. He writes, "When a child feels that his work is a task, it is only under
compulsion that he gives himself to it. At every let-up of external pressure his attention,
released from constraint, flies to what interests him" [emphasis added] (Dewey, 1913,
p. 2). More recently, Csikszentmihalyi, Rathunde and Whalen (1990) note, "It is wasteful
to teach someone who is not interested and so is not motivated" (p. 9). Further, interest
can be a powerful predictor within education and flow theory. For example, "the quality
of experience when doing mathematics was mainly related to interest" (Schiefele and
Csikszentmihalyi, 1995, p. 163). These statements indicate that interest is a variable of
increasing importance for education.
Current research on interest falls into two categories of study (Boekaerts &
Boscolo, 2002, Mitchell, 1993): individual and situational (e.g., task, teacher,
environment). The first category, individual interest, includes the beliefs and attitudes
that a person has. For example, if a person believes that mathematics is a worthwhile
task, then he or she should be predisposed to work on mathematical problems. Also,
"students who are high on this type of interest, experience an inner drive to seek out
opportunities to learn more about a specific topic" (Boekaerts & Boscolo, 2002, p. 378).
Individual interest is a strong motivator, but is not generally susceptible to outside
influence.

21
Situational interest, on the other hand, "is the real topic of concern as teachers
have no influence over students' incoming personal interests" (Mitchell, 1993, p. 425).
Situational interest is shaped by environmental and external factors interacting with a
person's interest. Such factors may include teachers, parents, friends, and tasks
(mathematics tasks are the focus of the present study). One way to understand the
difference between the two types of interest is the following. Individual interest is the
interest level that a person has for a topic or task, whereas situational interest is how the
task promotes interest across many people. Situational and individual interest interact in
education as Steinberg, Brown and Dornbusch (1996) note, "engagement in school is a
two-way street - schools need to be interesting, but students need to be willing and able to
be interested" (p. 63). Both the individual and situational perspectives on interest are
important for understanding how interest influences engagement.
Concentration
Intense concentration is a central component of flow theory (Csikszentmihalyi,
1990). A person who is in flow is so absorbed in a task that he or she usually loses track
of time. Concentration is also an important variable in education studies. For example,
talented secondary students, "reported relatively higher levels of concentration than their
peers when involved in class work" (Csikszentmihalyi, Rathunde, and Whalen, 1997, p.
97). The researchers conclude that the level of concentration attained by students is an
important factor in the development of their talents.
Fredricks, Blumenfeld, and Paris (2004) distinguish between concentration in
behavioral and cognitive areas of engagement. Behavioral engagement refers to the
amount of effort expended, whereas cognitive engagement refers to cognitive processes
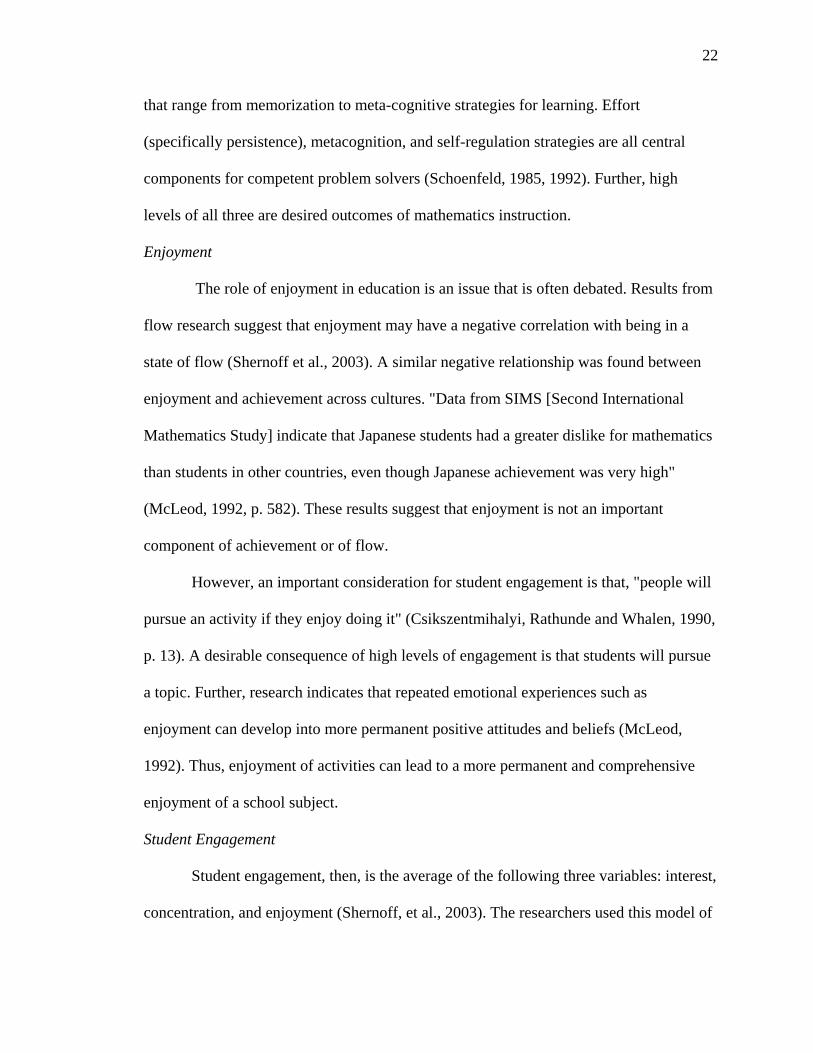
22
that range from memorization to meta-cognitive strategies for learning. Effort
(specifically persistence), metacognition, and self-regulation strategies are all central
components for competent problem solvers (Schoenfeld, 1985, 1992). Further, high
levels of all three are desired outcomes of mathematics instruction.
Enjoyment
The role of enjoyment in education is an issue that is often debated. Results from
flow research suggest that enjoyment may have a negative correlation with being in a
state of flow (Shernoff et al., 2003). A similar negative relationship was found between
enjoyment and achievement across cultures. "Data from SIMS [Second International
Mathematics Study] indicate that Japanese students had a greater dislike for mathematics
than students in other countries, even though Japanese achievement was very high"
(McLeod, 1992, p. 582). These results suggest that enjoyment is not an important
component of achievement or of flow.
However, an important consideration for student engagement is that, "people will
pursue an activity if they enjoy doing it" (Csikszentmihalyi, Rathunde and Whalen, 1990,
p. 13). A desirable consequence of high levels of engagement is that students will pursue
a topic. Further, research indicates that repeated emotional experiences such as
enjoyment can develop into more permanent positive attitudes and beliefs (McLeod,
1992). Thus, enjoyment of activities can lead to a more permanent and comprehensive
enjoyment of a school subject.
Student Engagement
Student engagement, then, is the average of the following three variables: interest,
concentration, and enjoyment (Shernoff, et al., 2003). The researchers used this model of
23
student engagement to assess conditions for engagement within secondary classrooms.
Their results indicate that increased engagement occurs when skills and challenge are
high and balanced, instruction is relevant to students' goals, and students perceive the
environment to be under their control. Besides these general results, the researchers also
compared engagement across classroom activities and courses.
In order to compare classroom activities, Shernoff, et al. (2003) classified student
activities into categories such as lecture or group work, regardless of content of the
course. Results indicate that engagement levels for group work and individual work were
significantly higher than lecture, exams, and watching TV or videos. On a 0-9 scale,
students reported averages of 6.18 and 5.98 for group and individual work, respectively.
Further, results for group work were 5.46 for interest, 7.34 for concentration, and 5.84 for
enjoyment. On these engagement variables, there were no significant differences between
individual and group work.
Engagement was also compared between courses. Results indicate that electives
had higher student engagement than academic courses. The classes with the highest
engagement were computer science and art with engagement scores of 6.05 and 6.35,
respectively. Mathematics had the lowest engagement of all courses at 5.35, though not
significantly different from most other academic courses. Further results for mathematics
class were 4.43 for interest, 6.65 for concentration, and 4.92 for enjoyment. There were
no significant differences between any pair of courses on concentration, although
differences by course were found for both interest and enjoyment.
These results provide few findings that are specific to mathematics classes. This
lack of information is one motivation for the current study. In order to better understand

24
engagement within mathematics classes, this study will focus only on mathematics tasks.
The summary at the end of this chapter provides more information regarding how the
current study extends the study by Shernoff, et al. (2003).
Non-engagement Variables
Besides engagement, the current study will measure the following variables:
challenge, scaffolding, and confidence. These variables are referred to as non-
engagement variables, because they are outside the definition of engagement. Each of the
variables is important in mathematics education research and is discussed in more detail
below.
Challenge
As noted earlier, the perception of high challenge is a necessary component of
being in flow (see Figure 2.1). In fact, a delicate balance of high challenge and high skills
are required for achieving flow. Challenge is also an important variable in constructs
based on flow theory. For example, high challenge may be related to higher involvement
(Turner, Meyer, Cox, Logan, DiCintio, and Thomas, 1998) and higher engagement
(Shernoff, et al., 2003).
The perceived challenge of an activity is also an important variable in research on
mathematical problem solving. For example, Hiebert et al. (1996) discuss the notion that
students should be allowed to work on problems, that is, tasks that students find
challenging and want to find a solution for. Further, Schoenfeld (1982, 1985) compared
traits of novice and expert mathematical problem solvers. He found that more
experienced problem solvers found a wider range of problems "easier" than their novice

25
counterparts (Schoenfeld, 1982). These studies are just a few examples of a large body of
research in which challenge has been studied in mathematics problem solving.
Scaffolding / Help Required
"The use of scaffolding is another factor that helps to maintain student
engagement at a high level" (Kilpatrick, Swafford, and Findell, 2001, p. 336). The goal of
scaffolding is to make tasks more accessible to a wider range of students. This is done by
reducing the complexity of the task, without losing its integrity. Scaffolding, however,
has come under scrutiny, because too much scaffolding may not allow students to
struggle enough with the content (Hiebert et al., 1996).
For example, Stein, Smith, Henningsen, and Silver (2000) analyzed mathematics
tasks of varying cognitive demands. These researchers found that highly demanding
mathematics tasks are difficult to implement and are frequently transformed to less
demanding tasks by the teacher. Further, the greatest gains in performance are in
classrooms that encourage higher-order thinking and reasoning. Thus, keeping
mathematics tasks at a high level is difficult for teachers, but beneficial for students.
Confidence
Student confidence is usually conceptualized as a belief about one's mathematical
competence (McLeod, 1992). According to McLeod, achievement and confidence tend to
be positively correlated. Further, confidence is a topic of many gender studies that show
women tend to be less confident and take fewer advanced mathematics courses than men
at college and secondary levels.
Also, it is important to note that the perception of confidence may be important
for flow theory (see Figure 2.1). It is hypothesized that when confidence is high, students

26
tend to have the skills to meet the given challenge. Further, when confidence is low,
student skills are likely to be below those required for the task.
Summary
Flow theory provides a viable means to measure student engagement. However, a
focus on mathematics tasks is missing from the literature. The current study will help fill
the gap by applying Shernoff, et al.'s model of student engagement to mathematics tasks.
The mathematics tasks are selected from a curriculum that is based on recommendations
by the National Council of Teachers of Mathematics (1989). The curriculum is intended
to be engaging for students.
Two studies showed that mathematics is largely a solitary activity
(Csikszentmihalyi, Rathunde and Whalen, 1997; Shernoff, Knauth, and Markis, 2001).
These studies state that mathematics classes consist of mostly lecture, individual work,
and exams. The current study moves beyond these findings by focusing on tasks that are
designed for collaborative group work.
Another study of flow examines relationships between quality of experience,
motivation, achievement, and ability (Schiefele and Csikszentmihalyi, 1995). The
researchers found that quality of experience is desirable, but different from achievement.
Quality of experience is largely related to interest in mathematics, whereas achievement
is more related to ability. Although quality of experience is not closely related to
achievement, little is known about relationships between engagement and achievement.
Steinberg, Brown, and Dornbush (1996) point out a lack of research comparing student
engagement and achievement. The current study investigates how achievement relates to
student engagement and other non-engagement variables.
27
Shernoff, Knauth, and Markis (2001) found that students in mathematics classes
reported high levels of flow, low motivation, and high challenge. A similar result was
reported by Shernoff, et al. (2003) who found that mathematics had the lowest
engagement of all the classes, yet mathematics was seen as challenging and important for
future goals. The current study further examines these variables using mathematics tasks
from a curriculum that is designed to be more engaging for students.
Finally, Shernoff, et al. (2003) recommended the investigation of relationships
between engagement and other variables. Three non-engagement variables were chosen
for the present study based on their importance to student engagement and mathematics
education research. Perceived challenge is an important indicator of engagement and a
topic of study within mathematics problem solving research (Schoenfeld, 1985; Shernoff,
et al., 2003). Scaffolding is important because it can promote engagement in mathematics
tasks by making them more accessible (Kilpatrick, Swafford and Findell, 2001).
Confidence has been shown to relate to mathematics achievement and is a self measure of
a person's ability (McLeod, 1992). The current study includes these three variables to
further examine relationships among engagement, non-engagement, and achievement
variables.

28
CHAPTER THREE
METHODOLOGY
The purpose of this study is to assess student perceptions of high school algebra
tasks. Of specific importance are the variables interest, concentration, and enjoyment, as
they relate to student engagement. Further, student perceptions of challenge, help
received, and confidence are studied. To investigate these topics, a survey was adapted
from a previous study on student engagement (Shernoff, et al., 2003). Students had 38
opportunities to complete this instrument during two units of instruction, which lasted
about 14 weeks. Details regarding the participants and the design of the study follow.
Participants
Informal contact was made with three teachers who use the curriculum
Contemporary Mathematics in Context (CMIC) (Coxford, Fey, Hirsch, Schoen, Burrill,
Hart, et al., 2001, 2003). This curriculum was developed under the Core-Plus
Mathematics Project funded by the National Science Foundation. It is a four-year high
school curriculum based on the curriculum standards developed by the National Council
of Teachers of Mathematics (1989).
The curriculum uses an integrated approach for mathematics content. Each course
contains interwoven strands of the following four content areas: algebra and functions,
statistics and probability, geometry and trigonometry, and discrete mathematics. The
units selected for this study both focus on the algebra and functions strand. The purpose
of this strand is for students to develop the ability to "recognize, represent and solve
problems involving relations among quantitative variables" (Coxford, et al., 2001, p. 7).
29
This goal is achieved through various methods including the use of functions as
mathematical models, multiple representations, and symbolic reasoning and
manipulations. Patterns of Change (pp. 98-156) and Linear Models (pp. 158-248) are the
titles of the two units selected for this study, both units focus on algebra concepts and
skills.
Three teachers who use this curriculum were contacted and given a brief overview
of the study by e-mail or in person. Communications with these teachers indicated that
the study involved student engagement when solving mathematics tasks and expectations
of the teacher including the survey instrument (see Appendix A). Two teachers at
different schools expressed interest in participating in the study. Following their
expression of interest, an official request to do research in these classrooms was made
though the Cooperating School Program at the University of Iowa. This program
coordinates all University of Iowa research in K-12 classrooms.
To limit contact between the researcher and the students, the teachers were
enlisted to provide their classes with an overview of the study (see Appendix B). After
the overview, students were given consent forms. Teachers went through the consent
form and survey, answering any questions that arose. Questions that the teacher could not
answer were directed to the researcher. Students who agreed to participate in the study
returned the consent forms during the following class.
To protect the identities of those involved, the schools in this study will be
referred to as Tanner High School and Baker High School. Both are public schools that
used CMIC curriculum with some students. Teachers in this study taught the only
sections of CMIC Course 1 for their schools.
30
Besides gathering demographic data, the researcher conducted an observation of
each classroom. The goal of the observations was not to judge the quality of instruction
but to better understand the atmosphere and structure that was established during class
work time (Rasmussen, Yackel, & King, 2003). Specifically the observations were
conducted to answer the question: how do students spend their time in class? The results
of these observations will be discussed in the descriptions of each school below.
Tanner High School
Data from the National Center for Educational Statistics (NCES) indicates that
Tanner is in or near a mid-sized city. The population of the school is 1,721 students.
Approximately 13.1 percent of these students qualify for free or reduced priced lunch.
Upon entering Tanner High School, students choose which mathematics course
they will take. During the 2004-05 school year, one class of CMIC Course 1 was offered
and it met the first period of the day. A total of 24 students were enrolled in the course
and all agreed to be in the study. Of these, 21 students (11 male and 10 female)
completed enough surveys to be included in the study. These minimum survey
requirements will be discussed in Chapter 4.
The teacher of this class has 22 years experience teaching. She is active in
professional development activities including mentoring other teachers, participating as a
teacher leader for the University of Iowa's LEADERS workshops, and directing student
teachers. In fact, a student teacher was in her classroom during the first half of this study.
This teacher has taught the Contemporary Mathematics in Context curriculum for six
years.

31
During the classroom observation, the teacher and students conducted class in a
manner that appeared to be consistent with the goals of the curriculum. The teacher began
and ended with a few administrative items, however, the bulk of class was focused on
groups working through the investigations in the curriculum. During this time, most
students were on task, actively discussing the problems and working towards
understanding the investigations. Only a couple of students seemed off-task. During work
time, the teacher walked around and responded to group questions. It is important to note
that the teacher would only come over to a group if the entire group had a question. This
was one of the many strategies the teacher use to make students responsible for their own
learning. A detailed outline of the class is available in Appendix C.
Baker High School
Data from NCES indicates that Baker is in a rural community. The population of
the school is 1,052 students. Approximately 15.1 percent of these students qualify for free
or reduced priced lunch.
Students at Baker High School who enrolled in CMIC Course 1 comprise two
classrooms of 30 total students, 24 of which agreed to be in the study. Of these students,
17 completed enough surveys to be included in the study (8 male, 8 female, and 1 gender
unspecified). Gender information was missing for one student. Both sections of the class
met before lunch. In eighth grade, parents of these students choose which mathematics
curriculum their children will take based on recommendations from middle school
teachers and high school counselors. Students who begin the algebra track in eighth grade
continue with geometry and advanced algebra once in high school, so they did not take
CMIC courses.

32
The teacher at Baker High School has been teaching mathematics for four years.
Prior to her present position, she taught and worked with adult students in an alternative
high school program for 11 years. Her highest degree is a Master of Arts in Mathematics
Education. This is her first year with the Contemporary Mathematics in Context
curriculum.
Two sections were observed at Baker High School, both on block day. Baker uses
an modified block schedule during the school week. On Monday, Tuesday, and Friday all
classes meet for a short period of time, about 40 minutes. On Wednesday, half the classes
meet for an extended period of time, about 90 minutes with the other half of classes
meeting for the extended time period on Thursday. The two sections that were observed
will be referred to as Baker #1 and Baker #2.
The observed session of Baker #1 began in disarray. About half of the class was
told to finish an exam while the other half was supposed to sit quietly and wait. During
this time students were noisy and did not stay in their seats. After everyone completed the
exam, the next unit began with the teacher assigning new groups. Next, the class began
the investigation by having students volunteer to read from the textbook. Small group
work began on the investigation problems. This investigation required data to be
collected by the students, which was collected as a whole class. One group collected the
data while other groups socialized. Small group work continued until the end of class.
Students did not complete the investigation.
The observed session of Baker #2 went more smoothly. In fact, students
completed the investigation and began working on homework exercises before class was
over. As in Baker #1, class began with the assigning of new groups. The investigation
33
proceeded in a similar way as well. Students read the introduction to the unit, small
groups began working on problems, and data was collected by the whole class. During
the data collection activity, students were more on task than in the earlier class. The
investigation was completed with about 25 minutes left in class. During the remaining
time students could work on homework for any of their classes, however, most students
engaged in quiet conversation.
Summary
In all, the three classrooms had very different environments. The classroom at Tanner
was well-organized, with almost every student on task and discussing the investigation.
At Baker, the two sections behaved very differently. It is difficult, however, to isolate
why the sections are so different. The earlier section, Baker #1, was generally off-task
and noisy. Baker #2 was more on-task, though not as well organized as the Tanner
classroom. There was evidence that the teacher at Baker made adjustments to the lesson
from section 1 to section 2. The teacher's adjustments to the lesson plan may account
from some of these differences, but there is too little information to be definite. The other
substantial difference between the classrooms was the large amount of unstructured time
given to students at Baker.
Regardless of classroom differences, it is important to notice that both teachers
used similar lesson structure when implementing the curriculum. Students worked in
small groups through the investigations. During group work, the teachers moved between
groups, partially as a task master, but mostly to answer or redirect student questions. See
Appendix C for a more detailed accounting of the classroom observations.

34
Design
At the beginning of each week, teachers handed out packets of surveys to all
students in the study. These surveys were preprinted with the selected tasks for the week
and the teacher’s name. The purpose of the survey was to gather data regarding students'
perceptions of the mathematical tasks they work on during class. Sixteen tasks were
selected from Unit 2 and twenty-two tasks from Unit 3. In all, students were given 38
opportunities to complete surveys for the study. See Appendix D for more information.
Upon completion of a selected task, students filled out the survey regarding their
experience with that task. See Appendix A. The first three survey questions ask about the
students' perceptions regarding their engagement. The final three questions ask about
non-engagement variables that relate to mathematics tasks. The survey also included an
optional question requesting more information about the task. Students completed this
survey twice for each investigation during two consecutive units of instruction, a period
of about 14 weeks.
In addition to the survey instrument, students' scores on unit examinations were
collected to provide achievement data for the participants. More details on these
measures are provided after describing the design upon which this study is based – the
experience-sampling method.
Experience-sampling Method
The definition of student engagement and design of the study are based on
research on flow theory. To study instances of flow, the experience-sampling method
(ESM) was developed (Csikszentmihalyi, 1990, 1997; Larson & Csikszentmihalyi,
1987). The key characteristics of experience-sampling revolve around two purposes. The
35
first use of ESM is to understand about activities that participants undertake, specifically
to identify these activities and gather how much time is spent on them (Larson &
Csikszentmihalyi, 1987). For the current study, the activities in question are the same for
all participants, namely tasks completed during mathematics class.
The second purpose of ESM is to "research psychological reactions to everyday
activities and experiences" (Larson & Csikszentmihalyi, 1987, p. 526). To collect data on
everyday situations, ESM usually uses a method of random signaling to alert participants
to complete a survey (Csikszentmihalyi, 1990). However, other signaling methods such
as event-contingent and interval-contingent models have been used (Scollon, Kim-Prieto,
and Diener, 2003). Fluctuating school schedules and the relatively small window of time
that students spend in mathematics classes necessitated the use of an event-contingent
form of ESM (Collins, 1995; Scollon, Kim-Prieto, and Diener, 2003). For this study, the
event in question is the completion of a pre-selected mathematics task, after which
students completed a survey.
To select mathematics tasks for the study, stratified random sampling was used.
Two mathematical tasks were chosen from each investigation by dividing the
investigation in half, then randomly selecting a problem from each half (see Appendix
D). The first half of the investigation is denoted as introductory tasks, whereas the second
half is called closing tasks. If an investigation had an odd number of tasks, the middle
task was included as a closing task. This sampling method uses random selection of
mathematical tasks while guaranteeing balance of tasks from the beginning and end of
investigations. This is important because the complexity of mathematics tasks tend to
increase throughout a given investigation.
36
The reliability of ESM data is discussed in detail by Csikszentmihalyi and Larson
(1987). These authors cite studies of reliability that analyzed subject responses over time
and found significant correlations between student responses during the first half of the
week and the second half. Further, in a study of mathematics classrooms, Schiefele and
Csikszentmihalyi (1995) again tested the reliability of ESM data. Correlations between
two time intervals, Time 1 and Time 2, were all statistically significant and ranged from
.44 to .64 with a mean correlation of .52.
Validity of ESM data is also discussed by Csikszentmihalyi and Larson (1987).
These authors cite five studies that investigate how individual differences using ESM
correlate to independent measures of similar constructs. For example, one of these studies
found significant correlations between independent measures of intrinsic motivation and
several ESM variables (Csikszentmihalyi and Larson, 1987; Hamilton, Haier, and
Buchsbaum, 1984). Other studies investigated relationships between ESM data and
alienation, need for intimacy, self-esteem, and multiple personality disorders
(Csikszentmihalyi and Larson, 1987). In all, ESM data have been used to investigate a
variety of psychological properties, depending on the survey questions that subjects
respond to.
Repeated Survey
The current study builds on traditions already set forth in the field of academic
motivation. Specifically, "studies of the antecedents of educational outcomes have used
questionnaires to assess children's perceptions of the context, their intrinsic motivation
for learning, and their self-perceptions" (Deci, 1992, p. 64). For the present study, a
37
survey was adapted from an instrument developed by Shernoff et al. (2003). This earlier
instrument used the ESM to assess student perceptions regarding student engagement.
Each survey was preprinted with the teacher's name and the mathematics task that
would prompt completion of the survey. Students were required to enter the current date
and to initial each survey for identification purposes. The instructions for the survey were
as follows: "Compare the current task to other mathematics tasks. Then indicate your
responses to the following questions. Please place an 'X' through the appropriate value on
the scale to the right of each question." See Appendix A for a copy of the survey.
The current study bases student engagement on optimal experience or flow theory
(Shernoff et al., 2003). Typically, all survey items in such studies measure students'
subjective experiences (Moneta & Csikszentmihalyi, 1996). Thus, the survey for the
current study consists of six Likert-scale questions and one optional open-ended item. For
the Likert-scale items, three involve student engagement and three involve the non-
engagement variables that relate to solving mathematics tasks.
The student engagement questions are the following:
Item 1: How interesting was the task? This item is an adaptation of a more
general item, "Did you find the activity interesting?" from Shernoff (2001) and Shernoff
et al. (2003).
Item 2: How well were you concentrating on the task? Intense concentration is a
key characteristic of being in flow. This item is an adaptation of a more general item,
"How well were you concentrating?" from Shernoff (2001) and Shernoff et al. (2003).
38
Item 3: Did you enjoy the task? Enjoyment of learning is seen as a desired result
from education (Shernoff, et al., 2003). This item is an adaptation of a more general item,
"Did you enjoy what you were doing?" from Shernoff (2001) and Shernoff et al. (2003).
In addition to questions regarding engagement variables, the second-half of the
survey included non-engagement variables that were based on research on flow theory,
mathematical problem solving, and affective variables within mathematics education.
The items are the following:
Item 4: Rate the challenges of the task. Perceived challenge is a variable that
appears in research on student engagement (Shernoff, 2001; Shernoff et al., 2003), flow
theory (Csikszentmihalyi, 1990, 1997), and problem solving (Hiebert et al., 1996;
Schoenfeld, 1982, 1985). The specific item used in the instrument for this study is
adapted from Shernoff et al. (2003), who administered a 9-point Likert scale (1=Low,
9=High) for the follow statement, "Rate the challenges of the activity" (Shernoff, 2001, p.
225; Shernoff, et al., 2003). To be more consistent with the other survey items in the
present study, the Likert scale was extended to 10 points where 0=Low and 9=High.
Item 5: How much help did you need to solve the task? This measure of
scaffolding was prompted by current research that indicates the richness of mathematics
problems can be reduced during instruction by too much scaffolding (Heibert et al., 1996;
Henningsen and Stein, 1997; Stein, Smith, Henningsen, and Silver, 2000).
Item 6: How confident are you that the solution(s) is correct? A measure of
student confidence is included in this study because research on problem solving and
motivation both indicate that confidence is an important variable of study (McLeod,
1992; Middleton & Spanias, 1999).

39
Optional open-ended item: Is there anything else about the task that you wish to
include? Upon seeing the survey instrument, both teachers in the study requested a free-
response item. This item is intended to shed light on student responses, but is not a
central component of the study.
The coding of the surveys was straight-forward. Student responses were entered
into the software program Statistical Package for Social Sciences (SPSS). In the rare
occasion that an item was left blank, no score was entered into SPSS. If a student was
careless and marked two adjacent survey items, then the average of the two scores was
inputted into SPSS. One hundred sixty-six of 6,767 survey responses fit this category. If a
student marked two non-adjacent scores for a survey item, then no score was entered into
SPSS because there was not a clear response. Only two survey responses were not
included because of this criterion.
Unit Examinations
The tests given at the end of each curricular unit provide measures of student
achievement. Based on the design of the study, the selection of testing materials was at
the discretion of the teachers. Both teachers in the study used unit examinations provided
by the CMIC curriculum. There are two forms for each, A and B, that teachers can
choose between. The teacher at Tanner High School chose Form B for both unit
examinations, whereas the teacher at Baker used Forms B and A for Units 2 and 3,
respectively. Exam scores are standardized and summed to provide an overall
achievement measure for the students.
40
Analysis
The research questions are focused on student perceptions of engagement and
non-engagement variables that are related to specific mathematics tasks. Of further
interest are the relationships between these variables and achievement. Student means on
each item across the 38 tasks are the unit of analysis as recommended by Larson and
Delespau (1992). Thus, each student has a mean response for each variable in the study:
interest, concentration, enjoyment, engagement, challenge, scaffolding, and confidence.
In order to have valid student means, Larson and Delespau (1992) discuss
requirements for a minimum number of completed surveys by each student. “Contrary to
a one-time measure, the ESM is not based on the assumption that people are going to be
entirely consistent in their responses … In general, however, it was expected that relative
differences between respondents would tend to persist over time” (Csikszentmihalyi &
Larson, 1987, pp. 530-531). Because of the variability, one or two scores may not
accurately reflect a subject's view. For this study, each student needed to complete at
least 50 percent of the available surveys in order to be included in the analysis.
The remainder of this section gives each research question and describes the
statistical methods used to analyze the data for that question. Data analysis was
conducted using the Statistical Package for Social Sciences (SPSS).
Research Questions
During class time, how do secondary students rate their levels of engagement for
mathematics tasks?
This research question asks for a description of student reports of engagement.
Thus, the mean, standard deviation, minimum and maximum values are reported for each

41
engagement variable of the survey. The engagement variables are: interest, concentration,
and enjoyment. Student engagement is a composite variable defined as the average of
those three variables (Shernoff et al., 2003).
During class time, how do secondary students rate non-engagement variables
(challenge, help required, and confidence) for mathematics tasks?
This research question asks for a description of student reports for non-
engagement variables. Thus, the mean, standard deviation, minimum and maximum
values are reported for each non-engagement variable of the study. These variables are:
challenge, help received, and confidence.
What are the relationships among engagement variables (interest, concentration,
and enjoyment) and non-engagement variables (challenge, help required, and
confidence)?
This research question requires analysis of relationships between engagement
variables and other non-engagement variables. Correlation coefficients are computed and
scatter plots are examined for each pairwise combination of these variables. For student
engagement, there are four variables: interest, concentration, enjoyment, and the
composite variable student engagement. There were also three non-engagement variables:
challenge, help received, and confidence. In all, 12 correlation coefficients are computed
for this research question.
What is the relationship between engagement variables (interest, concentration,
and enjoyment) and short-term achievement?
This research question requires analysis of relationships between student
engagement and achievement. Correlation coefficients are computed and scatter plots are
42
examined for the variables of achievement and student engagement. The achievement
score is the sum of standardized student scores for two unit examinations. Thus, there is a
single achievement score for each student. For student engagement, there are four
variables: interest, concentration, enjoyment, and the composite variable student
engagement. In total, there are four correlation coefficients computed for this research
question.
What is the relationship between non-engagement variables (challenge, help
required, and confidence) and short-term achievement?
This research question requires analysis of relationships between non-engagement
variables and achievement. Correlation coefficients are computed and scatter plots are
examined for the variables of achievement and non-engagement variables. The
achievement score is the sum of standardized student scores for two unit examinations.
Thus, there is a single achievement score for each student. Also, there are three non-
engagement variables: challenge, help received, and confidence. In total, there are three
correlation coefficients computed for this research question.
Independent Variables
The data can be categorized into various independent groups that may suggest
avenues for further study. These independent groups are: classrooms, gender, task
location, and prior knowledge. Each of these groupings is next discussed briefly.
Classroom and school differences. Three classrooms from two different schools
participated in this study. Are there differences in student responses between the
classrooms? Are there differences in student responses between the two schools?

43
Gender. There is a large body of research that investigates differences between
mathematics abilities of male and female students (e.g., Hyde, Fennema, Lamon, 1990;
Tobias, 1995). For the current study, each of the schools has a fairly even split of male
and female students. Are there differences in student responses between males and
females?
Mathematics ability. Researchers have noted that mathematics ability is a good
predictor of achievement (Schiefele and Csikszentmihalyi, 1995). Using the Iowa Tests
of Basic Skills (ITBS) as a measure of ability, are there differences in student responses
among high, middle, and low ability students?
Task location. Recall that a stratified random-sampling was used to select
mathematics tasks for this study. A task from the first half of a problem set was called an
introductory task and a task from the second half was called a closing task. Are there
differences in student responses for introductory tasks and closing tasks?
Finally, it may prove useful to compare student responses by mathematics task in
a post hoc analysis. Such results might identify tasks with particularly high or low levels
of interest, concentration, enjoyment, engagement, challenge, scaffolding, or confidence.
The procedure for this is discussed at length in Chapter Four.
44
CHAPTER FOUR
DATA ANALYSIS
Beginning in late October and continuing through mid-February, data on ninth-
grade students were collected during the 2004-05 school year. In all, data were collected
over approximately 14 weeks after removing holidays and snow days. Three classrooms
from two different schools participated in this study. There were a total of 54 students in
these classrooms, 48 of whom elected to participate.
Students in the study completed surveys regarding their perceptions of
mathematics tasks. In total, there were 38 tasks selected for the study, 16 from Unit 2 and
22 from Unit 3 of Course 1 of the CMIC curriculum. Therefore, students were expected
to complete an average of 2.8 surveys per week.
For each survey item, a student's mean across tasks was used as the unit of
analysis based on recommendations by Larson and Delespau (1992). They state,
"Subject-level significance tests are conservative tests and tread on fewer statistical
assumptions … we should try whenever possible to aggregate the situational information
to one score per subject datum" (p. 67). Thus, each subject has seven scores, a mean
across tasks for each of the six survey variables and one score for the composite variable
engagement.
Further, Larson and Delespau (1992) warn that caution should be exercised when
using student means for analysis. They state, "a mean based on one or two self-reports is
not a very reliable estimate of that person's true value" (Larson and Delespaul, 1992, p.
67). In fact, internal inconsistencies are expected in research using the experience-
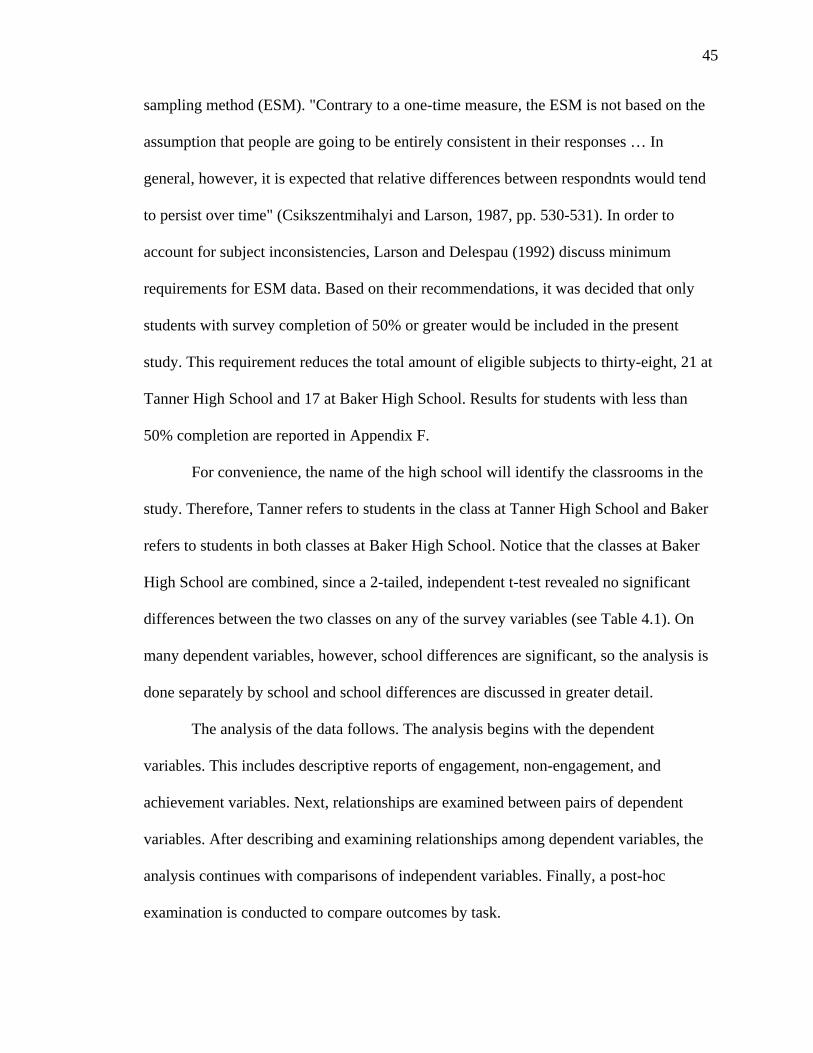
45
sampling method (ESM). "Contrary to a one-time measure, the ESM is not based on the
assumption that people are going to be entirely consistent in their responses … In
general, however, it is expected that relative differences between respondnts would tend
to persist over time" (Csikszentmihalyi and Larson, 1987, pp. 530-531). In order to
account for subject inconsistencies, Larson and Delespau (1992) discuss minimum
requirements for ESM data. Based on their recommendations, it was decided that only
students with survey completion of 50% or greater would be included in the present
study. This requirement reduces the total amount of eligible subjects to thirty-eight, 21 at
Tanner High School and 17 at Baker High School. Results for students with less than
50% completion are reported in Appendix F.
For convenience, the name of the high school will identify the classrooms in the
study. Therefore, Tanner refers to students in the class at Tanner High School and Baker
refers to students in both classes at Baker High School. Notice that the classes at Baker
High School are combined, since a 2-tailed, independent t-test revealed no significant
differences between the two classes on any of the survey variables (see Table 4.1). On
many dependent variables, however, school differences are significant, so the analysis is
done separately by school and school differences are discussed in greater detail.
The analysis of the data follows. The analysis begins with the dependent
variables. This includes descriptive reports of engagement, non-engagement, and
achievement variables. Next, relationships are examined between pairs of dependent
variables. After describing and examining relationships among dependent variables, the
analysis continues with comparisons of independent variables. Finally, a post-hoc
examination is conducted to compare outcomes by task.
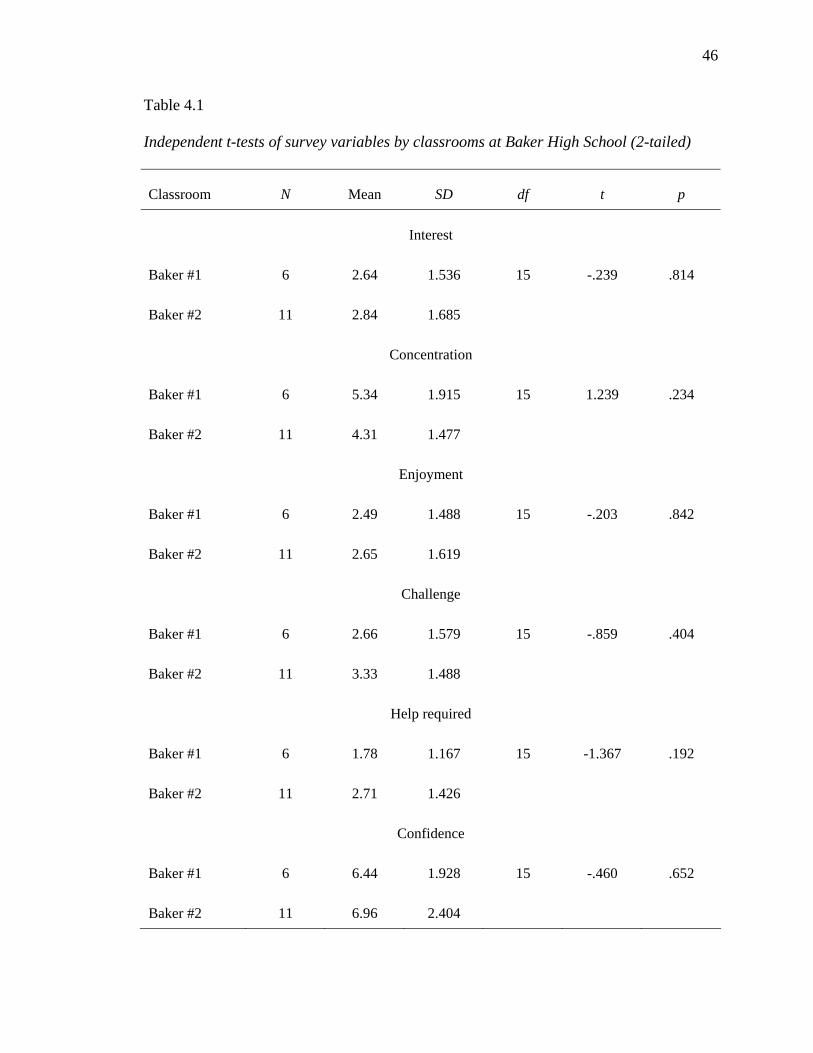
46
Table 4.1
Independent t-tests of survey variables by classrooms at Baker High School (2-tailed)
Classroom N Mean SD df t p
Interest
Baker #1 6 2.64 1.536 15 -.239 .814
Baker #2 11 2.84 1.685
Concentration
Baker #1 6 5.34 1.915 15 1.239 .234
Baker #2 11 4.31 1.477
Enjoyment
Baker #1 6 2.49 1.488 15 -.203 .842
Baker #2 11 2.65 1.619
Challenge
Baker #1 6 2.66 1.579 15 -.859 .404
Baker #2 11 3.33 1.488
Help required
Baker #1 6 1.78 1.167 15 -1.367 .192
Baker #2 11 2.71 1.426
Confidence
Baker #1 6 6.44 1.928 15 -.460 .652
Baker #2 11 6.96 2.404

47
Dependent Variables
Description of Student Reports of Engagement
The model of student engagement used in this study relies on the following three
components: interest, concentration, and enjoyment. Before analyzing student
engagement, data from each of these components are presented separately. A brief
summary of important points follows the presentation of results. Findings are discussed
fully in Chapter Five.
Interest. After completing each of the selected tasks, students rated their interest
by responding to the following survey item, "How interesting is the task?" Students
respond to this item by marking their level of interest on a 10-point Likert scale, where 0
is low and 9 is high.
Interest levels at Tanner (4.98) are higher than at Baker (2.77). The maximum
student mean at Baker is a little over a point above the midpoint (4.50) of the scale,
whereas, the maximum mean at Tanner is more than two points above the midpoint. The
minimum mean at both schools is near zero. See Table 4.2 for more information. Using
the standard deviation for the entire sample, the effect size is (4.98-2.77)/2.292 = 0.964
SD, favoring Tanner.
Concentration. After completing each of the selected tasks, students rated their
concentration by responding to the following survey item, "How well were you
concentrating on the task?" Students respond to this item by marking their level of
concentration on a 10-point Likert scale, where 0 is low and 9 is high.
The range of student means is similar in both schools, although the standard
deviation is larger at Tanner. School means indicate that students at Tanner have higher
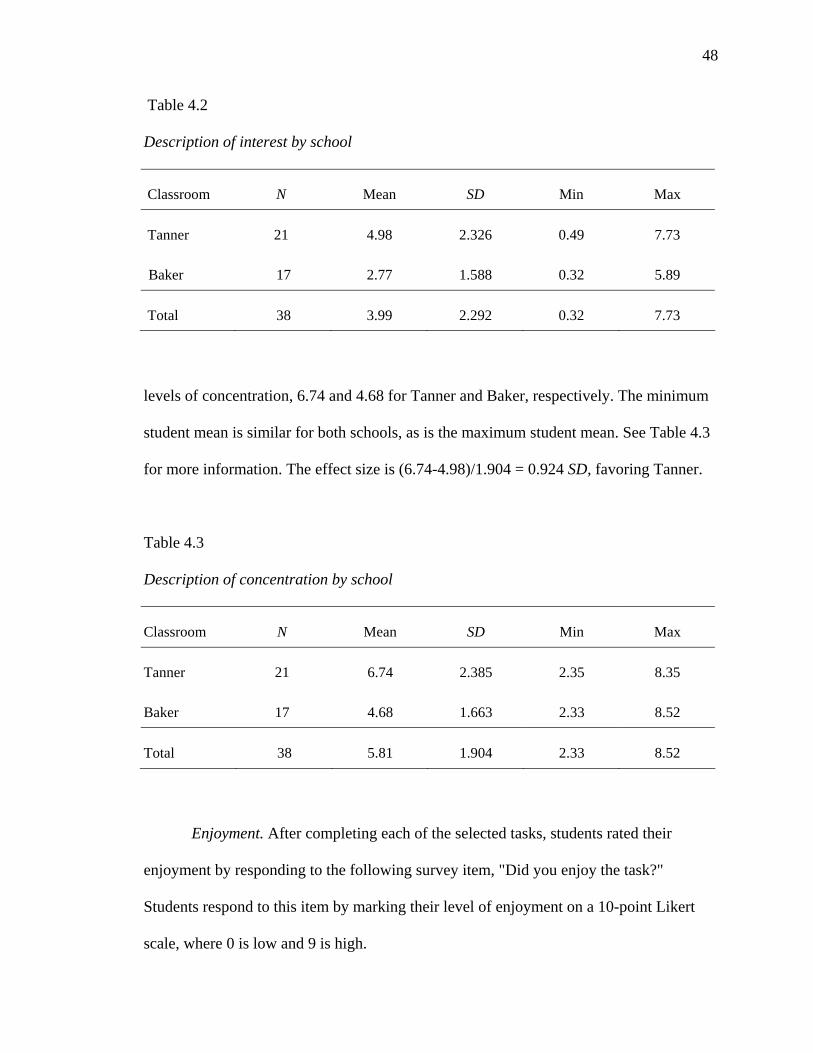
48
Table 4.2
Description of interest by school
Classroom N Mean SD Min Max
Tanner 21 4.98 2.326 0.49 7.73
Baker 17 2.77 1.588 0.32 5.89
Total 38 3.99 2.292 0.32 7.73
levels of concentration, 6.74 and 4.68 for Tanner and Baker, respectively. The minimum
student mean is similar for both schools, as is the maximum student mean. See Table 4.3
for more information. The effect size is (6.74-4.98)/1.904 = 0.924 SD, favoring Tanner.
Table 4.3
Description of concentration by school
Classroom N Mean SD Min Max
Tanner 21 6.74 2.385 2.35 8.35
Baker 17 4.68 1.663 2.33 8.52
Total 38 5.81 1.904 2.33 8.52
Enjoyment. After completing each of the selected tasks, students rated their
enjoyment by responding to the following survey item, "Did you enjoy the task?"
Students respond to this item by marking their level of enjoyment on a 10-point Likert
scale, where 0 is low and 9 is high.
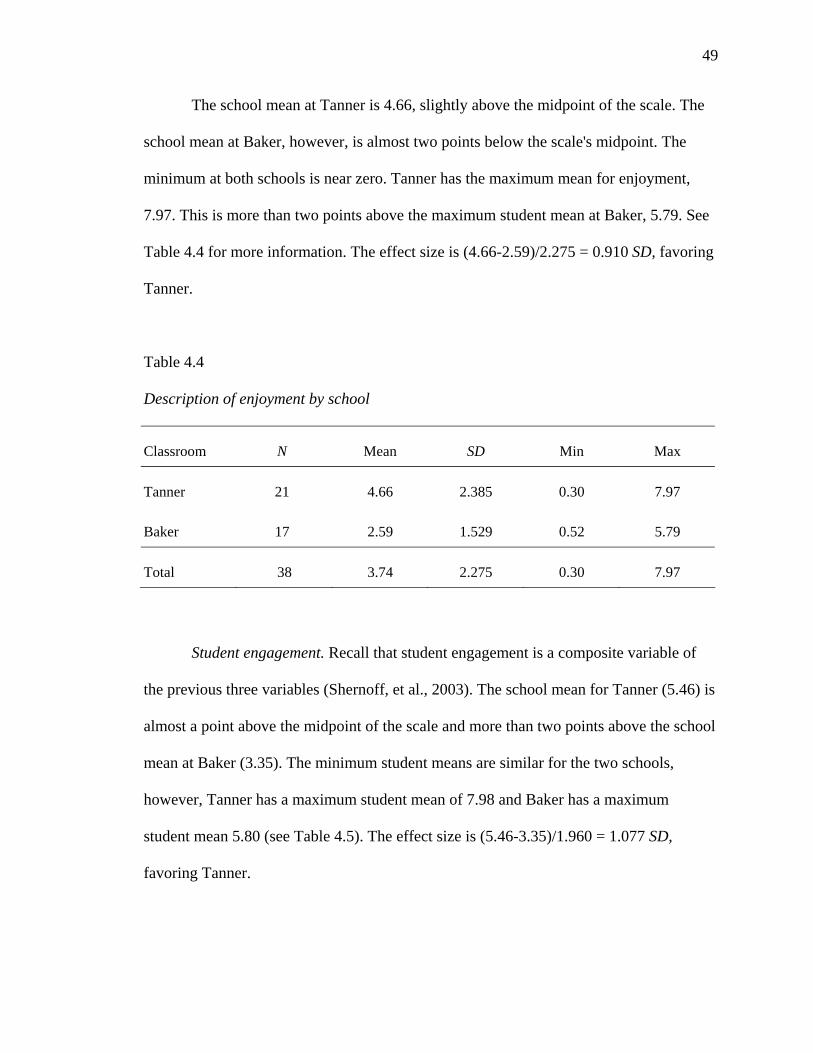
49
The school mean at Tanner is 4.66, slightly above the midpoint of the scale. The
school mean at Baker, however, is almost two points below the scale's midpoint. The
minimum at both schools is near zero. Tanner has the maximum mean for enjoyment,
7.97. This is more than two points above the maximum student mean at Baker, 5.79. See
Table 4.4 for more information. The effect size is (4.66-2.59)/2.275 = 0.910 SD, favoring
Tanner.
Table 4.4
Description of enjoyment by school
Classroom N Mean SD Min Max
Tanner 21 4.66 2.385 0.30 7.97
Baker 17 2.59 1.529 0.52 5.79
Total 38 3.74 2.275 0.30 7.97
Student engagement. Recall that student engagement is a composite variable of
the previous three variables (Shernoff, et al., 2003). The school mean for Tanner (5.46) is
almost a point above the midpoint of the scale and more than two points above the school
mean at Baker (3.35). The minimum student means are similar for the two schools,
however, Tanner has a maximum student mean of 7.98 and Baker has a maximum
student mean 5.80 (see Table 4.5). The effect size is (5.46-3.35)/1.960 = 1.077 SD,
favoring Tanner.
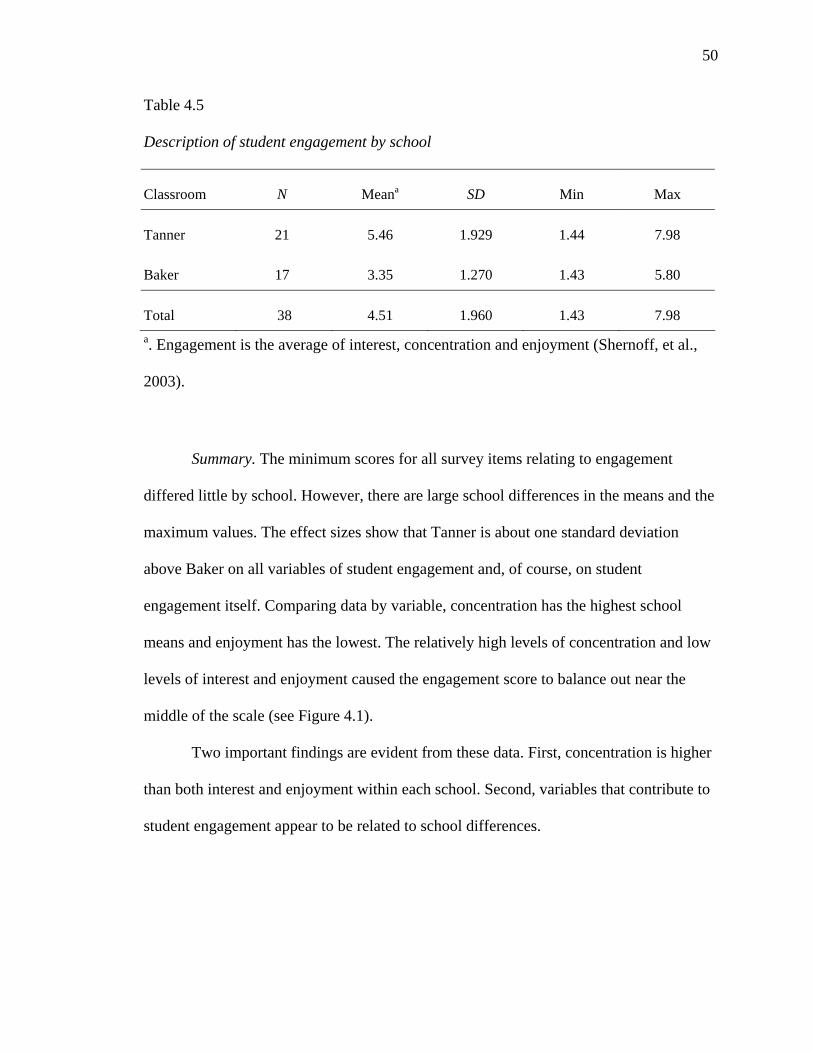
50
Table 4.5
Description of student engagement by school
Classroom N Meana SD Min Max
Tanner 21 5.46 1.929 1.44 7.98
Baker 17 3.35 1.270 1.43 5.80
Total 38 4.51 1.960 1.43 7.98 a. Engagement is the average of interest, concentration and enjoyment (Shernoff, et al.,
2003).
Summary. The minimum scores for all survey items relating to engagement
differed little by school. However, there are large school differences in the means and the
maximum values. The effect sizes show that Tanner is about one standard deviation
above Baker on all variables of student engagement and, of course, on student
engagement itself. Comparing data by variable, concentration has the highest school
means and enjoyment has the lowest. The relatively high levels of concentration and low
levels of interest and enjoyment caused the engagement score to balance out near the
middle of the scale (see Figure 4.1).
Two important findings are evident from these data. First, concentration is higher
than both interest and enjoyment within each school. Second, variables that contribute to
student engagement appear to be related to school differences.
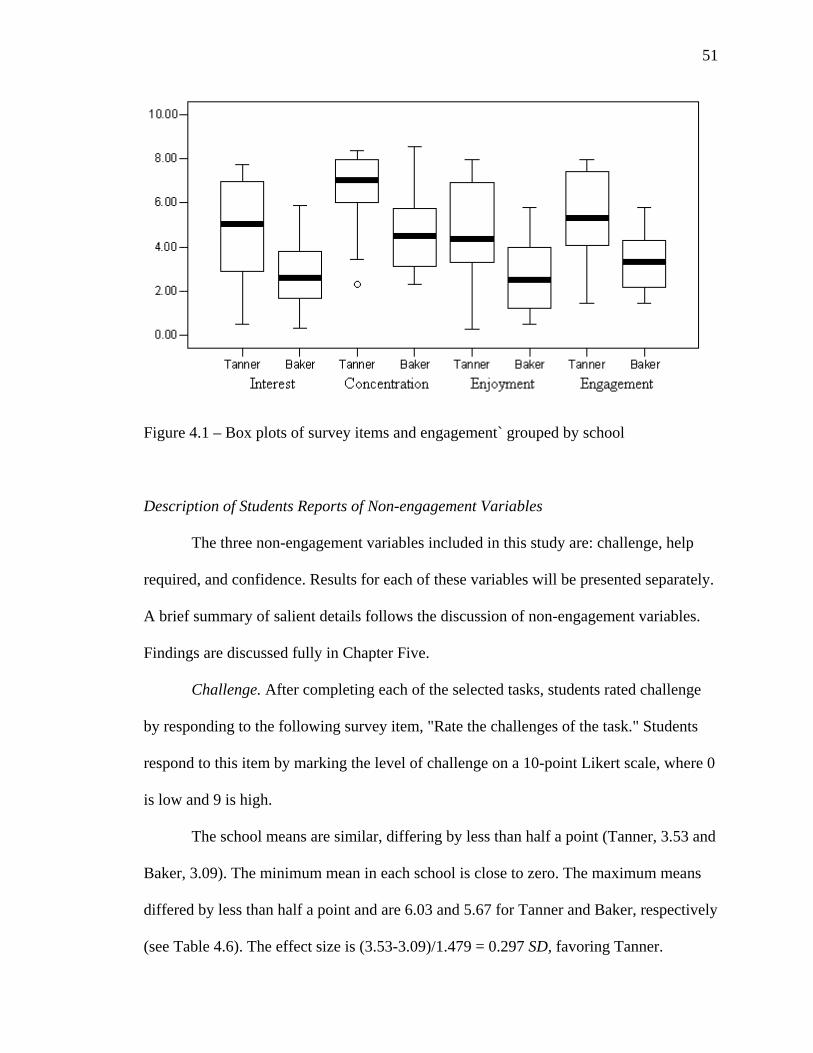
51
Figure 4.1 – Box plots of survey items and engagement` grouped by school
Description of Students Reports of Non-engagement Variables
The three non-engagement variables included in this study are: challenge, help
required, and confidence. Results for each of these variables will be presented separately.
A brief summary of salient details follows the discussion of non-engagement variables.
Findings are discussed fully in Chapter Five.
Challenge. After completing each of the selected tasks, students rated challenge
by responding to the following survey item, "Rate the challenges of the task." Students
respond to this item by marking the level of challenge on a 10-point Likert scale, where 0
is low and 9 is high.
The school means are similar, differing by less than half a point (Tanner, 3.53 and
Baker, 3.09). The minimum mean in each school is close to zero. The maximum means
differed by less than half a point and are 6.03 and 5.67 for Tanner and Baker, respectively
(see Table 4.6). The effect size is (3.53-3.09)/1.479 = 0.297 SD, favoring Tanner.

52
Table 4.6
Description of challenge by classroom
Classroom N Mean SD Min Max
Tanner 21 3.53 1.463 0.64 6.03
Baker 17 3.09 1.506 0.09 5.67
Total 38 3.33 1.479 0.09 6.03
Scaffolding. After completing each of the selected tasks, students rated how much
help they required by responding to the following survey item, "How much help did you
need to solve the task?" Students respond to this item by marking how much help they
needed on a 10-point Likert scale, where 0 is low and 9 is high.
Both school means are more than two points below the midpoint of the scale.
Tanner's mean is 1.99 and Baker's mean is 2.38. Minimum student means are near zero at
both schools. The maximum student means at both schools are near 4.8, which is near the
midpoint of the scale (see Table 4.7). The effect size is (2.38-1.99)/1.297 = 0.301 SD in
favor of Baker.
Confidence. After completing each of the selected tasks, students rated their
confidence in their solutions by responding to the following survey item, "How confident
are you that the solution(s) is correct?" Students respond to this item by marking their
level of confidence on a 10-point Likert scale, where 0 is low and 9 is high.
School means are both more than two points above the midpoint of the scale.
Tanner has the higher school mean at 7.61, and the school mean at Baker is 6.78. The
minimum scores and standard deviations for the schools indicate that Baker may have

53
Table 4.7
Description of help required by classroom
Classroom N Mean SD Min Max
Tanner 21 1.99 1.232 0.14 4.84
Baker 17 2.38 1.381 0.00 4.80
Total 38 2.16 1.297 0.00 4.84
outliers in the data. Tanner's standard deviation is below one, with a minimum student
mean of 5.95. Baker, however, has a larger standard deviation at 2.2 and a minimum
student mean near 0. Looking more closely at the data, three student means at Baker are
below five on the confidence scale, 0.93, 3.00, and 4.46 (see Table 4.8). The effect size is
(7.61-6.78)/1.628 = 0.510 SD, favoring Tanner.
Table 4.8
Description of confidence by classroom
Classroom N Mean SD Min Max
Tanner 21 7.61 0.839 5.95 9.00
Baker 17 6.78 2.200 0.93 8.91
Total 38 7.24 1.628 0.93 9.00
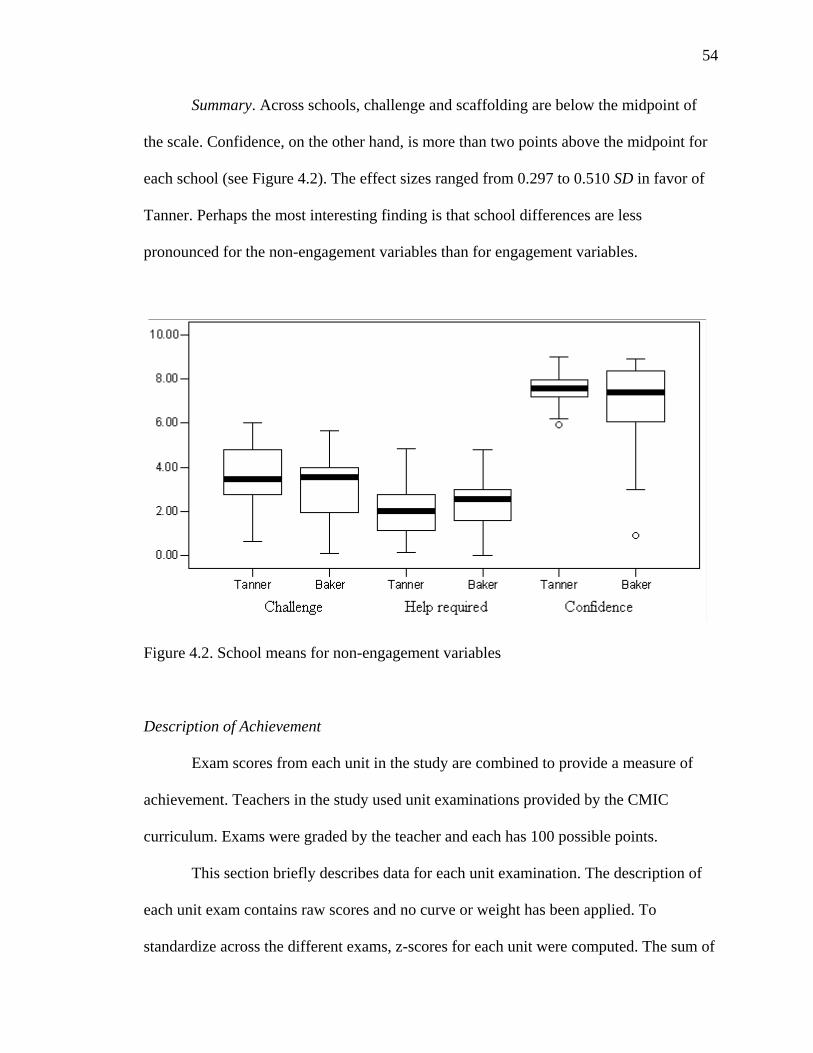
54
Summary. Across schools, challenge and scaffolding are below the midpoint of
the scale. Confidence, on the other hand, is more than two points above the midpoint for
each school (see Figure 4.2). The effect sizes ranged from 0.297 to 0.510 SD in favor of
Tanner. Perhaps the most interesting finding is that school differences are less
pronounced for the non-engagement variables than for engagement variables.
Figure 4.2. School means for non-engagement variables
Description of Achievement
Exam scores from each unit in the study are combined to provide a measure of
achievement. Teachers in the study used unit examinations provided by the CMIC
curriculum. Exams were graded by the teacher and each has 100 possible points.
This section briefly describes data for each unit examination. The description of
each unit exam contains raw scores and no curve or weight has been applied. To
standardize across the different exams, z-scores for each unit were computed. The sum of

55
these z-scores from each unit provides a single achievement measure for each student
called the exam total score. This score will be the focus of further discussions regarding
achievement. The section ends with a brief summary of important details. Findings are
discussed fully in Chapter Five.
Unit 2. Both schools used Form B of the unit examination provided by the CMIC
curricular materials. Achievement data are not available for one student at Baker. This
student also does not have an exam score for Unit 3, nor are her ITBS data available.
Tanner has the higher exam mean at 94.10. Baker's mean is 80.42. Tanner has
four and Baker has one student who received the maximum score of 100. The minimum
scores, however, are very different between the schools. The minimum exam score at
Tanner is 85.00, which is above the school mean at Baker. The minimum exam score at
Baker is 33.33 (see Table 4.9).
Table 4.9
Description of achievement by school and examination
School N Mean SD Min. Max.
Unit 2 examination
Tanner 21 94.10 4.721 85.00 100.00
Baker 16 80.42 15.148 33.33 100.00
Unit 3 examination
Tanner 21 85.67 12.611 60.00 100.00
Baker 13 67.44 8.623 46.67 76.67
56
Unit 3. The schools used different forms of the unit examination provided by the
CMIC curricular materials. Tanner used Form B and Baker used Form A. At Baker,
achievement data are not available for four students. ITBS standard mathematics scores
are available for two of these students, who scored 249 and 267, 34th and 72nd
percentiles, respecitvely. The mean for ITBS math scores at Baker is 271.69.
Again, Tanner has the higher exam mean at 85.67. Baker's mean is 67.44. Three
students at Tanner received a perfect score of 100. Baker's maximum score is 76.67. The
minimum score at Tanner is 60, whereas the minimum score at Baker is lower at 46.67
(see Table 4.9).
Exam total. The sum of standardized examination scores from Unit 2 and Unit 3
are used to provide an overall achievement score for each student. This score will be
called the "exam total" and will be the achievement measure used in further analyses. An
examination score is missing for at least one of the units for four students, so they are
omitted from this analysis.
The mean of standardized exam totals is higher at Tanner at .96. Baker's mean z-
score is -1.07. One student at Tanner has perfect scores on both exams, with a maximum
z-score of 2.44. The maximum exam total is .81 at Baker. The minimum score at Tanner
is -1.08, slightly below Baker's school mean. The minimum score at Baker is -2.53 (see
Table 4.10).
Summary. Tanner's school means are higher than Baker's on both unit exams,
which contributes to the higher exam total score. The means at Baker may have been
influenced by outliers in the data, as indicated in Figure 4.3. However, the medians are
less susceptible to outliers and are still higher at Tanner as seen in Figure 4.3.

57
Table 4.10
Description of standardized exam total scores by school
School N Mean SD Min Max
Tanner 21 .96 1.086 -1.08 2.44
Baker 13 -1.07 .997 -2.53 .81
Figure 4.3 – Box plots of achievement scores by unit and school
Relationships among Dependent Variables
This section focuses on relationships between pairs of dependent variables in this
study. In total, there are eight dependent variables for consideration: interest,
concentration, enjoyment, engagement, challenge, help required, confidence, and exam
total. In order to investigate relationships, a Pearson's correlation is computed for

58
pairwise combinations of these variables. Results are discussed by school to be consistent
with earlier reports.
The discussion for each school begins by examining relationships between
dependent variables. Next, the school discussion focuses on relationships between
engagement variables and then between non-engagement variables. A brief summary
follows the discussions of the schools. Findings are discussed fully in Chapter Five.
Tanner. There are no significant correlations between engagement and non-
engagement variables at the 0.05 level (see Table 4.11). However, there are moderate
correlations (above 0.30) between challenge and other engagement variables. Challenge
and interest are negatively correlated at -0.36, challenge and enjoyment are negatively
correlated at -0.34, and challenge and engagement are negatively correlated at -0.30.
All correlations between pairs of engagement variables are significant.
Engagement is positively correlated with the other engagement variables, which is, of
course, expected because engagement is defined as the average of these variables.
Further, interest, concentration and enjoyment are all positively correlated with one
another above 0.60.
Two correlations among non-engagement variables are significant. First, there is a
positive correlation of 0.70 between challenge and help required. This is expected
because students require more help when challenge is high, and less help when challenge
is low. Second, there is a negative correlation of -0.62 between confidence and help
required. Again this is expected because students require more help if they are not
confident in their solutions and less help if they are confident.
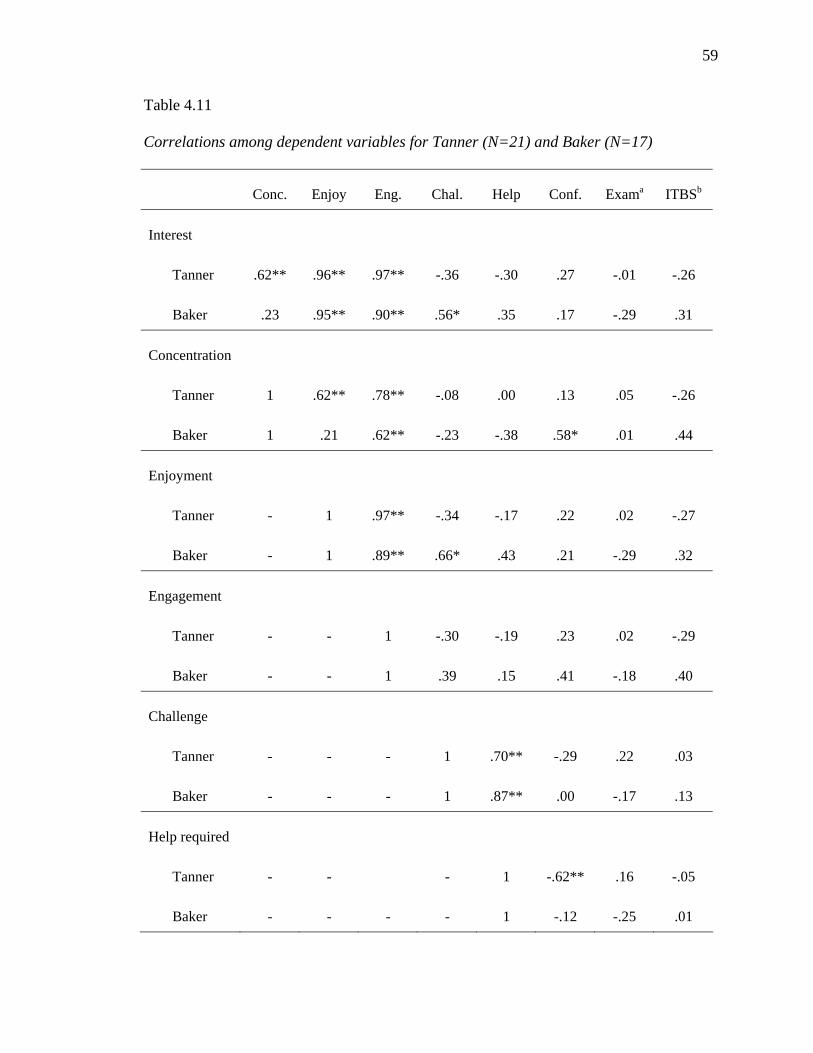
59
Table 4.11
Correlations among dependent variables for Tanner (N=21) and Baker (N=17)
Conc. Enjoy Eng. Chal. Help Conf. Exama ITBSb
Interest
Tanner .62** .96** .97** -.36 -.30 .27 -.01 -.26
Baker .23 .95** .90** .56* .35 .17 -.29 .31
Concentration
Tanner 1 .62** .78** -.08 .00 .13 .05 -.26
Baker 1 .21 .62** -.23 -.38 .58* .01 .44
Enjoyment
Tanner - 1 .97** -.34 -.17 .22 .02 -.27
Baker - 1 .89** .66* .43 .21 -.29 .32
Engagement
Tanner - - 1 -.30 -.19 .23 .02 -.29
Baker - - 1 .39 .15 .41 -.18 .40
Challenge
Tanner - - - 1 .70** -.29 .22 .03
Baker - - - 1 .87** .00 -.17 .13
Help required
Tanner - - - 1 -.62** .16 -.05
Baker - - - - 1 -.12 -.25 .01

60
Table 4.11-continued
Conc. Enjoy Eng. Chal. Help Conf. Exama ITBSb
Confidence
Tanner - - - - - 1 -.31 -.37
Baker - - - - - 1 -.46 .65*
Exam total
Tanner - - - - - - 1 .43
Baker - - - - - - 1 .03
**. Correlation is significant at the 0.01 level (2-tailed).
*. Correlation is significant at the 0.05 level (2-tailed).
a. N=13 for Baker.
b. N=13 for Baker, N=20 for Tanner.
Finally, there are no significant correlations between survey variables and the
exam total score. There is, however, a moderate negative correlation between help
required and exam total (-0.31). This is not expected because other research has shown
that confidence tends to positively correlate with achievement (McLeod, 1992). Further,
there were no significant correlations between dependent variables and ITBS scores.
ITBS scores will be discussed in the section Mathematics Ability.
Baker. Unlike Tanner, three correlations are significant between engagement and
non-engagement variables at the 0.05 level. Challenge and interest are positively

61
correlated at 0.56. Challenge and enjoyment are positively correlated at 0.66. Confidence
and concentration are positively correlated at 0.58.
There are five other moderate correlations (above 0.3) that are not significant, but
worth mentioning because of the small sample size. Help required is positively correlated
with interest (0.35) and enjoyment (0.43). Further, help required is negatively correlated
with concentration (-0.38). Engagement is positively correlated with challenge (0.40),
possibly due to the significant correlations between engagement and the variables interest
and enjoyment. Engagement is also positively correlated with confidence (0.41).
Only one correlation among engagement variables is significant, compared to all
three at Tanner. Interest and enjoyment are positively correlated are 0.96. Engagement is
positively correlated with the variables interest, concentration, and enjoyment, which is
expected because engagement is the average of these three variables. It is curious that
concentration did not have a high correlation with interest or enjoyment given the high
correlations at Tanner.
Only one correlation among non-engagement variables is significant. Challenge
and help required are positively correlated at 0.84. This is expected because students who
find a task challenging, also seek help. Further, students are not likely to require as much
help for tasks they do not find challenging.
Finally, there are no significant correlations between survey variables and the
exam total score. As at Tanner, there is also a moderate negative correlation between
confidence and exam total (-.46). This is not expected because other research has shown
that confidence tends to positively correlate with achievement (McLeod, 1992). Further,
62
there were no significant correlations between dependent variables and ITBS scores.
ITBS scores will be discussed in the section Mathematics Ability.
Summary. The significant correlations between engagement and non-engagement
variables at Baker are not expected given the results at Tanner. Specifically, Tanner has
moderate negative correlations between challenge and interest, and challenge and
engagement. Baker has significant positive correlations between these two sets of
variables. Differences between school correlations will be explored in the section on
school differences.
Independent Variables
Besides the dependent variables, there are various independent variables that may
provide insight into the data. Thus far, the data analysis indicates differences between
schools. These differences are now explored in more detail. Also, there are other
independent variables such as gender, task location, unit scores, and prior knowledge,
which may provide useful ways of examining the data.
School Differences
In the introduction to this chapter, it was stated that significant statistical
differences exist between the two schools in this study. This section explores these
differences by comparing means and correlation coefficients by school.
Differences between school means. This study was conducted at three classrooms
in two schools. Independent t-tests of the survey variables indicates no significant
differences on any survey variables between the two Baker classrooms at the 0.05 level
(see Table 4.1). There is a statistical difference between the Baker classrooms for the
exam total score. This will be discussed as a limitation for this study in Chapter Five.

63
Also, an independent t-test was done to examine school differences. Significant
differences exist at the 0.05 level for all component engagement variables and
achievement. Tanner has a significantly higher mean for interest, concentration,
enjoyment and the exam total (see Table 4.12). These differences suggest that
engagement and achievement are more susceptible to school or classroom differences
than the non-engagement variables.
Differences between correlation coefficients. The Pearson correlation coefficients
for each school are given in Table 4.11. The magnitudes of these correlations suggest that
some may differ by school. In this section, these differences between correlations are
tested for statistical significance.
Given two independent samples, correlation coefficients can be compared using
Fisher's z . First, it is necessary to convert Pearson correlation coefficients to Fisher's z
coefficients. The standard error for Fisher's z is given by the formula,
31
31
21 −+
− NN.
From the data for this study, N1 = 21 and N2 = 17, so the standard error is approximately
0.3564. The formula for z is,
errorstandard21 zz −
.
This distribution is approximately normal. Table 4.13 identifies significant differences
between correlation coefficients at the .10 and .05 levels (two-tailed).

64
Table 4.12
Independent t-tests of dependent variables by school (2-tailed)
Classroom N Mean SD df t p
Interest
Tanner 21 4.98 2.326 36 3.331 .002
Baker 17 2.77 1.588
Concentration
Tanner 21 6.74 1.579 36 3.907 .000
Baker 17 4.68 1.663
Enjoyment
Tanner 21 4.66 2.385 36 3.240a .003
Baker 17 2.59 1.529
Challenge
Tanner 21 3.53 1.463 36 .913 .367
Baker 17 3.09 1.506
Help required
Tanner 21 1.99 1.232 36 -.914 .367
Baker 17 2.38 1.381
Confidence
Tanner 21 7.61 .839 36 1.480a .117
Baker 17 6.78 2.200

65
Table 4.12-continuted
Exam total
Tanner 21 .96 1.086 32 5.477 .000
Baker 13 -1.07 .997 a. Equal variances not assumed.
Table 4.13
Differences between correlation coefficients at Tanner and Baker
Comparison Tanner r Baker r z
Interest - Challenge -.36 .56 -2.834**
Enjoyment - Challenge -.34 .66 -2.834**
Engagement - Challenge -.30 .39 -2.020**
Interest - Help -.30 .35 -1.908*
Enjoyment - Help -.17 .43 -1.768*
Confidence - Help -.62 -.12 -1.712*
**. p < 0.05
*. p < 0.10
To further examine these differences, scatter plots are given for both schools for
each pair of variables with a significant difference. The first comparisons that are
discussed involve challenge. There are three significant comparisons that include
challenge, interest-challenge, enjoyment-challenge, and engagement-challenge. Interest

66
and enjoyment are both components of engagement, so the discussion will focus on the
larger issue of engagement.
The scatter plot for engagement-challenge reveals that the data for Tanner clearly
does not fall into a linear pattern (see Figure 4.4). For Baker, however, the data are
mostly centered on a line, with one outlier who rated challenges as moderate, but
engagement low. When this outlier is removed, the correlation is 0.58, which is
significant at the 0.05 level. Removing this outlier increases the correlation difference
between schools.
Figure 4.4 – Scatter plots of challenge and engagement by school
There are three significant differences between correlations that involve help
required. Two comparisons involved the engagement variables interest and enjoyment.
Interest and enjoyment are highly correlated so their results are discussed together. The
last comparison is for correlations between confidence and help received.

67
The scatter plots of help received-interest and help received-enjoyment are very
similar, so the former is given in Figure 4.5. The data for Tanner does not fall into a
linear pattern. At Tanner, there is an outlier who has required moderate help, but has low
interest. When this outlier is removed, the correlation is -.09, suggesting less of an
association than the coefficient for all data (-.30).
Figure 4.5 – Scatter plots of help required and interest by school
At Baker, the data more closely fit a line. There is one outlier who reported a
moderate amount of help required and low interest. When this outlier is removed, the
correlation is 0.65, which is significant at the 0.01 level. Notice that removing one outlier
at each school makes the differences in correlations coefficients even more pronounced
than those for the entire set of students.
In addition to engagement variables, there were also differences between
correlation coefficients for help required and confidence. Scatter plots show that most of
the data for both schools are in the area of high confidence and low help required (see

68
Figure 4.6). There are two outliers at Baker that do not fit this pattern. If the most
extreme outlier is removed, the correlation at Baker is -.22, and the Fisher z it -1.401
(SE = .3640), which is not significant at the 0.10 level. Thus, this school difference in
correlation coefficients may be of little practical significance.
Figure 4.6 – Scatter plots of help required and confidence by school
Summary. This section indicates that there are differences between the two
schools. An independent t-test showed that the differences between dependent variables
are limited to engagement and achievement. Non-engagement variables appear to be less
susceptible to school and classroom factors.
Differences between correlation coefficients are less clear. There is evidence that
some correlations are influenced by one or two outliers, mostly due to the small N of the
sample. However, only one comparison with an outlier reduced the difference between
the two schools when the outlier was removed. Once removed, there was no longer a
significant difference between schools for the correlation between help required and
confidence. The other differences between correlation coefficients remained.
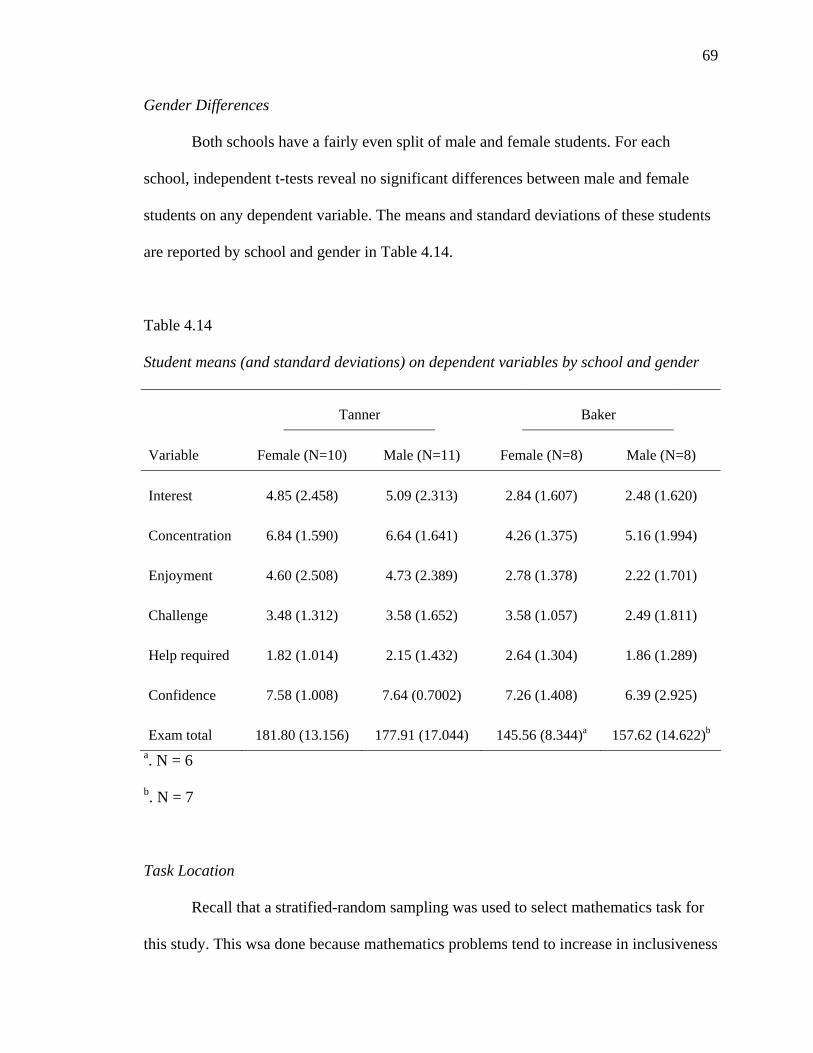
69
Gender Differences
Both schools have a fairly even split of male and female students. For each
school, independent t-tests reveal no significant differences between male and female
students on any dependent variable. The means and standard deviations of these students
are reported by school and gender in Table 4.14.
Table 4.14
Student means (and standard deviations) on dependent variables by school and gender
Tanner Baker
Variable Female (N=10) Male (N=11) Female (N=8) Male (N=8)
Interest 4.85 (2.458) 5.09 (2.313) 2.84 (1.607) 2.48 (1.620)
Concentration 6.84 (1.590) 6.64 (1.641) 4.26 (1.375) 5.16 (1.994)
Enjoyment 4.60 (2.508) 4.73 (2.389) 2.78 (1.378) 2.22 (1.701)
Challenge 3.48 (1.312) 3.58 (1.652) 3.58 (1.057) 2.49 (1.811)
Help required 1.82 (1.014) 2.15 (1.432) 2.64 (1.304) 1.86 (1.289)
Confidence 7.58 (1.008) 7.64 (0.7002) 7.26 (1.408) 6.39 (2.925)
Exam total 181.80 (13.156) 177.91 (17.044) 145.56 (8.344)a 157.62 (14.622)b
a. N = 6
b. N = 7
Task Location
Recall that a stratified-random sampling was used to select mathematics task for
this study. This wsa done because mathematics problems tend to increase in inclusiveness

70
and perhaps in difficultly throughout an investigation. A dependent t-test is used to
compare student means across the 19 introductory tasks and the 19 closing tasks within
each school. There are no significant differences between introductory and closing tasks
on any of the survey variables at the 0.05 level (see Table 4.15).
Table 4.15
Student means (and standard deviations) for survey variables by school and task location
Tanner (N=21) Baker (N=17)
Variable Introductory Closing Introductory Closing
Interest 4.90 (2.238) 5.07 (2.448) 2.79 (1.519) 2.75 (1.747)
Concentration 6.76 (1.536) 6.71 (1.654) 4.58 (1.689) 4.80 (1.750)
Enjoyment 4.67 (2.343) 4.65 (2.452) 2.64 (1.461) 2.53 (1.681)
Challenge 3.61 (1.382) 3.45 (1.612) 3.09 (1.582) 3.07 (1.479)
Help received 1.89 (1.084) 2.10 (1.436) 2.43 (1.411) 2.31 (1.379)
Confidence 7.54 (0.861) 7.70 (0.881) 6.89 (2.145) 6.64 (2.321)
Unit Differences
Recall that student participated in two units of instruction during the study, units 2
and 3. A dependent t-test is used to compare student means over Unit 2 and Unit 3 within
each school. There are no significant differences between units 2 and 3 on any of the
survey variables at the 0.05 level (see Table 4.16).

71
Table 4.16
Unit means (and standard deviations) for survey variables by school and curricular unit
Tanner (N=21) Baker (N=17)
Variable Unit 2 Unit 3 Unit 2 Unit 3
Interest 4.98 (2.140) 4.89 (2.700) 3.04 (1.817) 2.66 (1.760)
Concentration 6.78 (1.511) 6.65 (1.748) 5.26 (1.674) 4.26 (2.100)
Enjoyment 4.87 (2.261) 4.42 (2.577) 2.81 (1.761) 2.60 (1.784)
Challenge 3.72 (1.554) 3.31 (1.599) 3.16 (1.444) 3.09 (1.803)
Help received 1.94 (1.270) 1.98 (1.435) 2.16 (1.632) 2.54 (1.514)
Confidence 7.67 (0.704) 7.58 (1.037) 6.72 (2.033) 6.84 (2.313)
Mathematics Ability
ITBS mathematics data were collected as a measure of prior mathematics ability.
These data were available for 33 of the 38 students. The scores that are reported are
national standard scores. The range of scores is from 195 to 320.
At Tanner, the mean and standard deviation are 278.55 and 20.049. The mean
corresponds to a national student percentile rank of 88. At Baker the mean is 271.6,
which corresponds to the 79th national student percentile, and standard deviation is
27.127. Notice that the mean is lower at Baker but the standard deviation is higher. This
higher standard deviation is due to one low outlier. If this outlier is removed, the mean
for Baker is 278.55 and the standard deviation is 14.951, which are more similar to
Tanner's scores.

72
Table 4.11 reveals one statistically significant correlation between survey
variables and ITBS standard scores. At Baker, there is an expected positive correlation
(0.65) between confidence and prior mathematics ability, but this correlation is negative
at Tanner. In fact, Table 4.17 indicates three significant differences between correlation
coefficients at the schools including the coefficient for ITBS-confidence. The standard
error for Fisher's z is 0.3985 for this table.
Table 4.17
Differences between ITBS correlation coefficients at Tanner (N=20) and Baker (N=13)
Variable Tanner r Baker r z
ITBS - Concentration -.26 .44 -1.857*
ITBS - Engagement -.29 .40 -1.807*
ITBS - Confidence -.37 .65* -2.936**
**. p < 0.05
*. p < 0.10
Concentration is a component of engagement, so this discussion will focus on the
larger issue of engagement. At both schools, most students have a standard mathematics
score of 240 or above. In fact, there is only one student with a score below 240. If this
outlier is removed, the correlation at Baker is 0.34, indicating that outlier had some effect
on the correlation coefficient (see Figure 4.7). Scatter plots further indicate a wider range
of engagement scores at Tanner compared to Baker, which may have contributed to the
correlation difference between schools.
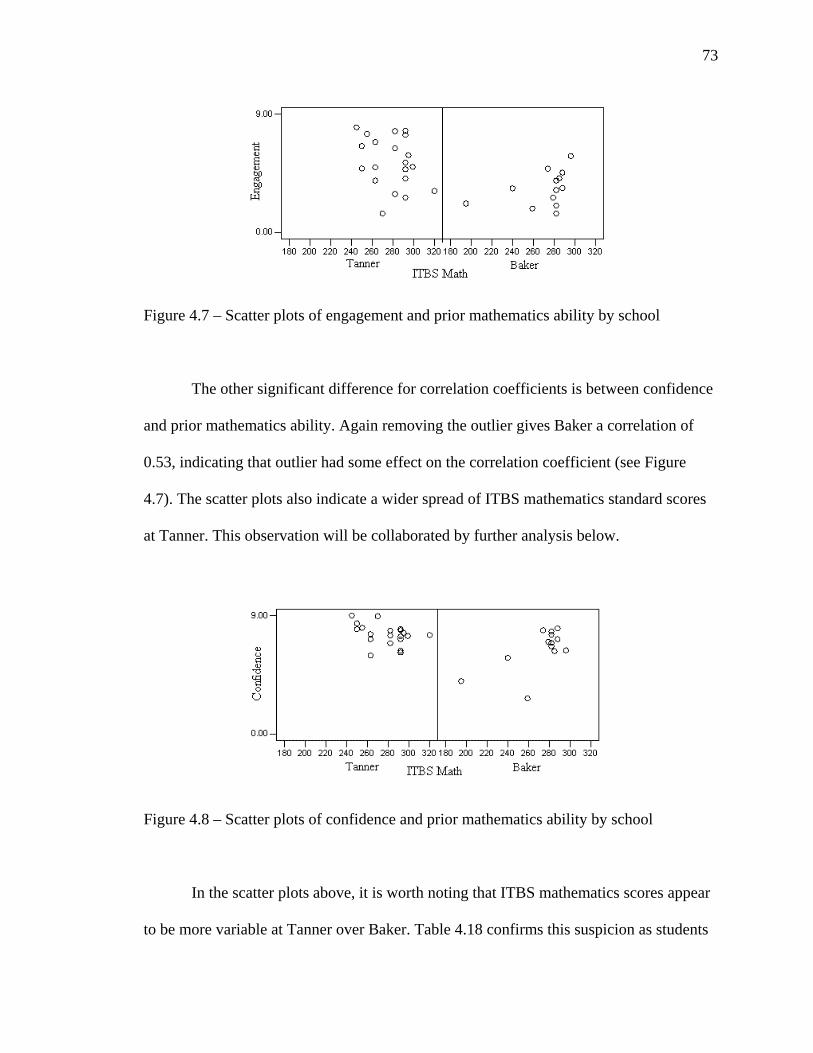
73
Figure 4.7 – Scatter plots of engagement and prior mathematics ability by school
The other significant difference for correlation coefficients is between confidence
and prior mathematics ability. Again removing the outlier gives Baker a correlation of
0.53, indicating that outlier had some effect on the correlation coefficient (see Figure
4.7). The scatter plots also indicate a wider spread of ITBS mathematics standard scores
at Tanner. This observation will be collaborated by further analysis below.
Figure 4.8 – Scatter plots of confidence and prior mathematics ability by school
In the scatter plots above, it is worth noting that ITBS mathematics scores appear
to be more variable at Tanner over Baker. Table 4.18 confirms this suspicion as students
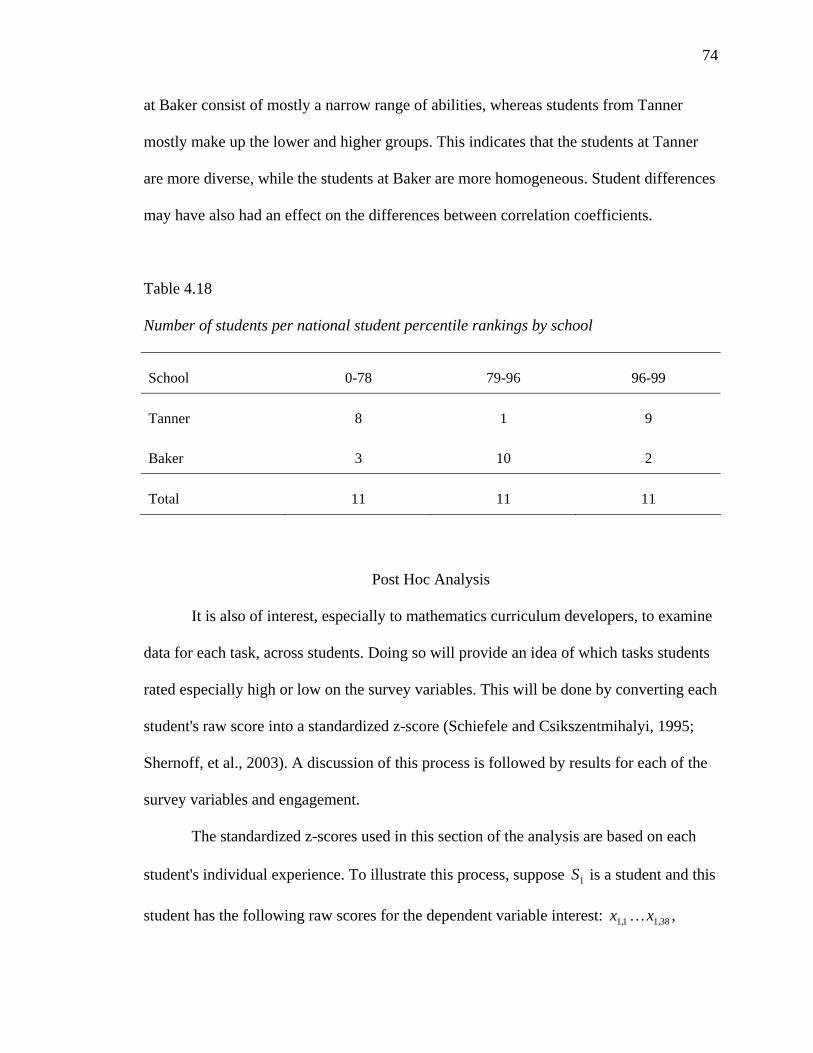
74
at Baker consist of mostly a narrow range of abilities, whereas students from Tanner
mostly make up the lower and higher groups. This indicates that the students at Tanner
are more diverse, while the students at Baker are more homogeneous. Student differences
may have also had an effect on the differences between correlation coefficients.
Table 4.18
Number of students per national student percentile rankings by school
School 0-78 79-96 96-99
Tanner 8 1 9
Baker 3 10 2
Total 11 11 11
Post Hoc Analysis
It is also of interest, especially to mathematics curriculum developers, to examine
data for each task, across students. Doing so will provide an idea of which tasks students
rated especially high or low on the survey variables. This will be done by converting each
student's raw score into a standardized z-score (Schiefele and Csikszentmihalyi, 1995;
Shernoff, et al., 2003). A discussion of this process is followed by results for each of the
survey variables and engagement.
The standardized z-scores used in this section of the analysis are based on each
student's individual experience. To illustrate this process, suppose is a student and this
student has the following raw scores for the dependent variable interest: ,
1S
38111 ,, xx K
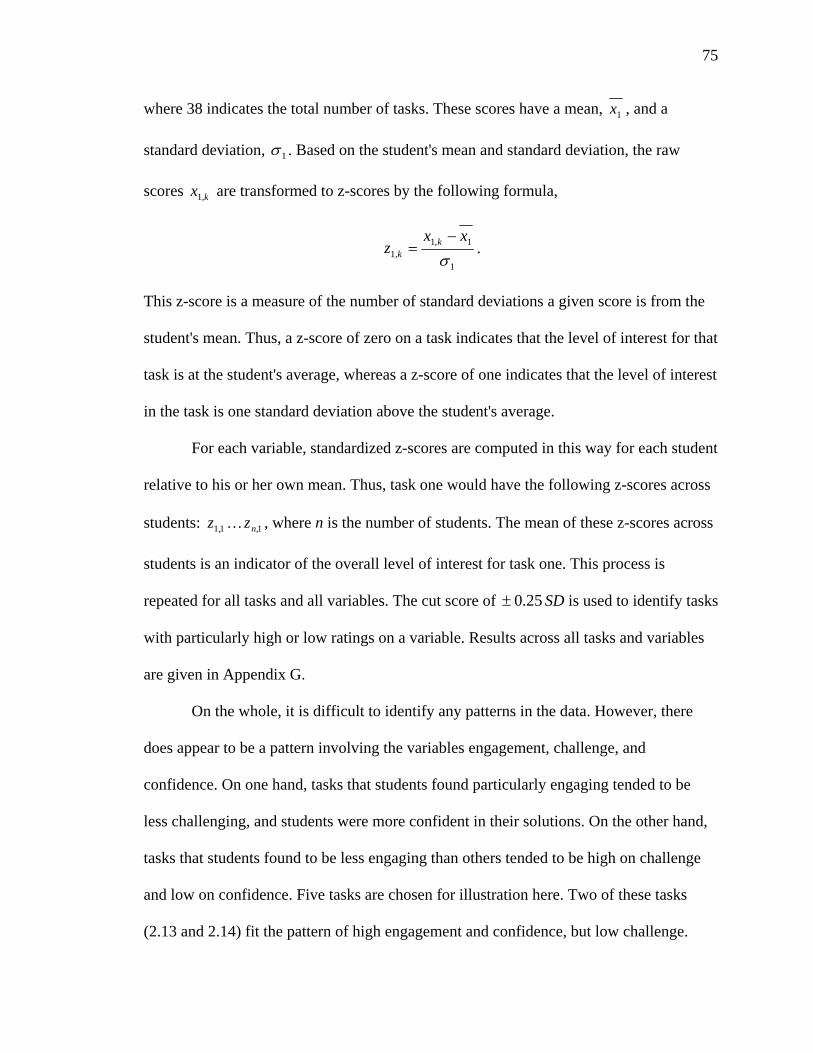
75
where 38 indicates the total number of tasks. These scores have a mean, 1x , and a
standard deviation, 1σ . Based on the student's mean and standard deviation, the raw
scores are transformed to z-scores by the following formula, ,kx1
1
1,11 σ
xxz k
,k
−= .
This z-score is a measure of the number of standard deviations a given score is from the
student's mean. Thus, a z-score of zero on a task indicates that the level of interest for that
task is at the student's average, whereas a z-score of one indicates that the level of interest
in the task is one standard deviation above the student's average.
For each variable, standardized z-scores are computed in this way for each student
relative to his or her own mean. Thus, task one would have the following z-scores across
students: , where n is the number of students. The mean of these z-scores across
students is an indicator of the overall level of interest for task one. This process is
repeated for all tasks and all variables. The cut score of
111 n,, zz K
25.0± SD is used to identify tasks
with particularly high or low ratings on a variable. Results across all tasks and variables
are given in Appendix G.
On the whole, it is difficult to identify any patterns in the data. However, there
does appear to be a pattern involving the variables engagement, challenge, and
confidence. On one hand, tasks that students found particularly engaging tended to be
less challenging, and students were more confident in their solutions. On the other hand,
tasks that students found to be less engaging than others tended to be high on challenge
and low on confidence. Five tasks are chosen for illustration here. Two of these tasks
(2.13 and 2.14) fit the pattern of high engagement and confidence, but low challenge.

76
Two other tasks (2.03 and 3.22) fit the pattern of low engagement and confidence, but
high challenge. The fifth task (2.03) is an exception to these patterns and is particularly
low on these variables (see Table 4.19).
Table 4.19
Mean z-scores across students for selected tasks
Task Engagement Challenge Confidence
2.02 -.25 -.35 -1.07
2.03 -.26 .43 -.55
2.13 .75 -.34 .55
2.14 .79 -.35 .46
3.22 -.51 .20 -.30
The two tasks with relatively high engagement and confidence, but low challenge
(2.13 and 2.14) come from the same lesson. This lesson is divided into four experiments,
each involving a different type of function. The lesson is very interactive as each group
member is given a task, then the group comes together to identify patterns and make
conjectures regarding the functions. Further, it may be important that neither task is set in
real-world context (see Figures 4.9 and 4.10).
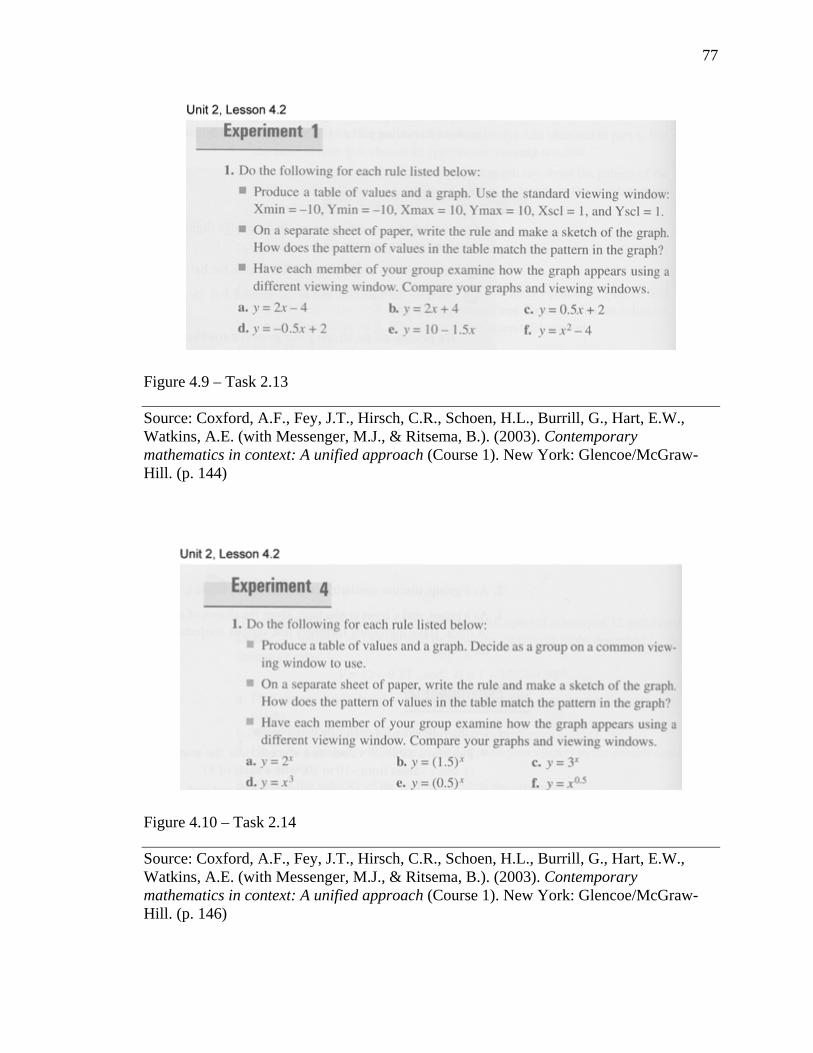
77
Figure 4.9 – Task 2.13
Source: Coxford, A.F., Fey, J.T., Hirsch, C.R., Schoen, H.L., Burrill, G., Hart, E.W., Watkins, A.E. (with Messenger, M.J., & Ritsema, B.). (2003). Contemporary mathematics in context: A unified approach (Course 1). New York: Glencoe/McGraw-Hill. (p. 144)
Figure 4.10 – Task 2.14
Source: Coxford, A.F., Fey, J.T., Hirsch, C.R., Schoen, H.L., Burrill, G., Hart, E.W., Watkins, A.E. (with Messenger, M.J., & Ritsema, B.). (2003). Contemporary mathematics in context: A unified approach (Course 1). New York: Glencoe/McGraw-Hill. (p. 146)
78
The two tasks that have relatively low engagement and confidence, but high
challenge (2.03 and 3.22) appear to have very little in common. Task 2.03 is a contextual
task asking students to interpret information about population change. The high challenge
involved in this task may be due to the complexity or unfamiliarity of the context. Task
3.22, however, is not set in a context. It asks students to solve a system of equations with
two variables. The high challenge in this task may be due to its abstract nature or the fact
that this is the last task in the review section of Unit 3. Its content has not been a major
emphasis of this unit (see Figures 4.11 and 4.12).
Figure 4.11 – Task 2.03
Source: Coxford, A.F., Fey, J.T., Hirsch, C.R., Schoen, H.L., Burrill, G., Hart, E.W., Watkins, A.E. (with Messenger, M.J., & Ritsema, B.). (2003). Contemporary mathematics in context: A unified approach (Course 1). New York: Glencoe/McGraw-Hill. (p. 111)

79
Figure 4.12 – Task 3.22
Source: Coxford, A.F., Fey, J.T., Hirsch, C.R., Schoen, H.L., Burrill, G., Hart, E.W., Watkins, A.E. (with Messenger, M.J., & Ritsema, B.). (2003). Contemporary mathematics in context: A unified approach (Course 1). New York: Glencoe/McGraw-Hill. (p. 248)
An exception to these patterns is task 2.02, which has relatively low engagement,
challenge, and confidence. This task asks students to compare data with other groups and
look for patterns. Tasks 2.13 and 2.14 also ask students to find patterns, but in a more
structured way that gives each group member a share of the responsibilities. The lack of
structure on Task 2.02 may have left students not knowing what was expected of them.
This uncertainty may account for the task's low ratings. Clear goals are one of the
attributes of flow identified in previous research (Csikszenthimalyi, 1990) (see Figure
4.13).

80
Figure 4.13 – Task 2.02
Source: Coxford, A.F., Fey, J.T., Hirsch, C.R., Schoen, H.L., Burrill, G., Hart, E.W., Watkins, A.E. (with Messenger, M.J., & Ritsema, B.). (2003). Contemporary mathematics in context: A unified approach (Course 1). New York: Glencoe/McGraw-Hill. (p. 100)
Summary
The first two tasks discussed resulted in high engagement and confidence, but low
challenge. The interactive nature of these tasks may account for these findings. The
second two tasks discussed had little in common, but resulted in low engagement and
confidence, and high challenge. The unfamiliarity and complexity of the population
growth context and the abstract nature of the systems of equations may explain the high
challenge involved with these tasks. The last task was the only one of 38 tasks that
resulted in low engagement, challenge, and confidence. This task was part of an
investigation that was intended to be very interactive (collecting bungee jump data), but
the goals of the tasks did not appear to be clear as the first two reported tasks. The lack of

81
clear goals may explain the low student ratings on engagement, confidence, and
challenge. Student comments available in Appendix H do not provide much insight for
explaining these patterns.

82
CHAPTER FIVE
DISCUSSION
The research questions from Chapter One are answered in the following section.
Next, further interpretation and implications are drawn from the results. Limitations of
the study are then discussed, followed by suggestions for future research.
Research Questions
Research Question 1: During class time, how do secondary students rate their
levels of engagement for mathematics tasks?
Each school's mean for engagement was close to the midpoint of the scale, 4.5.
The school mean at Tanner was almost one point above the midpoint and the school
mean at Baker was a little more than a point below the midpoint.
These engagement means are mainly the result of relatively high concentration,
but lower enjoyment and interest at both schools. At Tanner, interest and enjoyment were
close to the midpoint, whereas concentration was high at 6.74. At Baker, concentration
was close to the midpoint, but interest and enjoyment were low, 2.77 and 2.59,
respectively. Students at each school tended to rate levels of concentration two points
above levels of interest and enjoyment. This suggests that students felt they were
concentrating hard, but they generally did not find the tasks very interesting or enjoyable.
The current study focuses on mathematics tasks done mainly as group work. The
findings can be compared to earlier results from Shernoff, et al. (2003). Before making
such comparison, it is important to note that results from the two studies are not strictly
comparable. Students in the Shernoff, et al. study were responding to the instructional
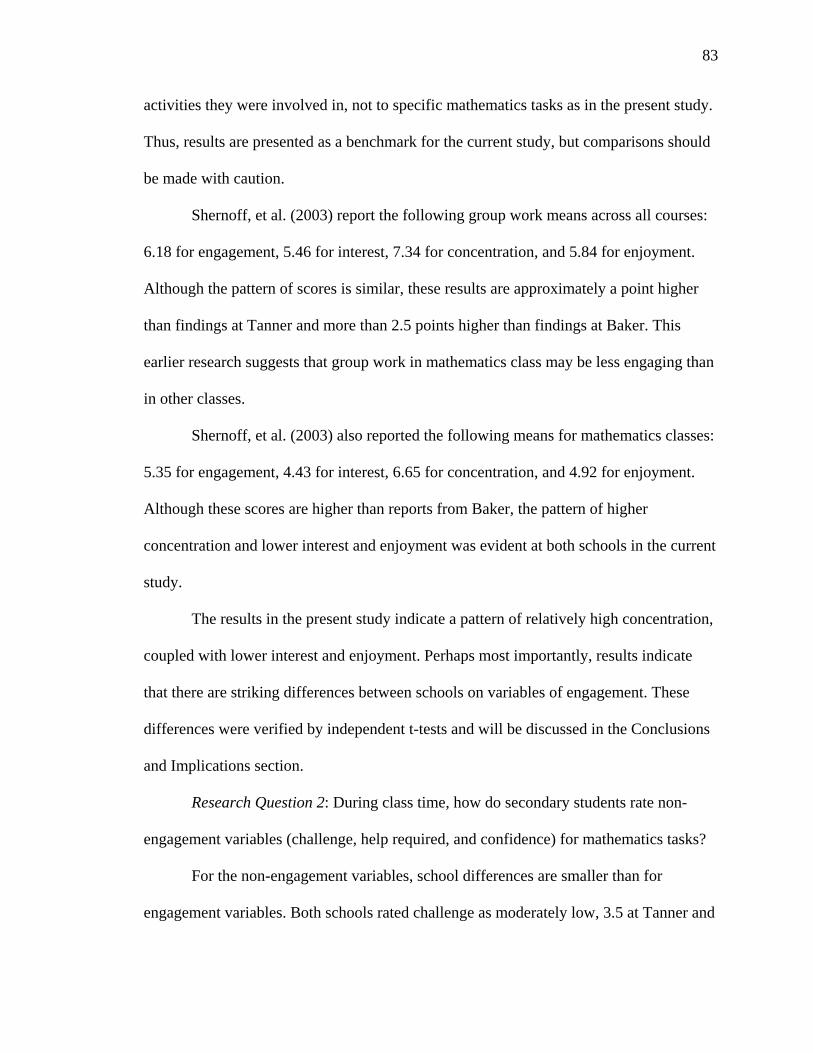
83
activities they were involved in, not to specific mathematics tasks as in the present study.
Thus, results are presented as a benchmark for the current study, but comparisons should
be made with caution.
Shernoff, et al. (2003) report the following group work means across all courses:
6.18 for engagement, 5.46 for interest, 7.34 for concentration, and 5.84 for enjoyment.
Although the pattern of scores is similar, these results are approximately a point higher
than findings at Tanner and more than 2.5 points higher than findings at Baker. This
earlier research suggests that group work in mathematics class may be less engaging than
in other classes.
Shernoff, et al. (2003) also reported the following means for mathematics classes:
5.35 for engagement, 4.43 for interest, 6.65 for concentration, and 4.92 for enjoyment.
Although these scores are higher than reports from Baker, the pattern of higher
concentration and lower interest and enjoyment was evident at both schools in the current
study.
The results in the present study indicate a pattern of relatively high concentration,
coupled with lower interest and enjoyment. Perhaps most importantly, results indicate
that there are striking differences between schools on variables of engagement. These
differences were verified by independent t-tests and will be discussed in the Conclusions
and Implications section.
Research Question 2: During class time, how do secondary students rate non-
engagement variables (challenge, help required, and confidence) for mathematics tasks?
For the non-engagement variables, school differences are smaller than for
engagement variables. Both schools rated challenge as moderately low, 3.5 at Tanner and
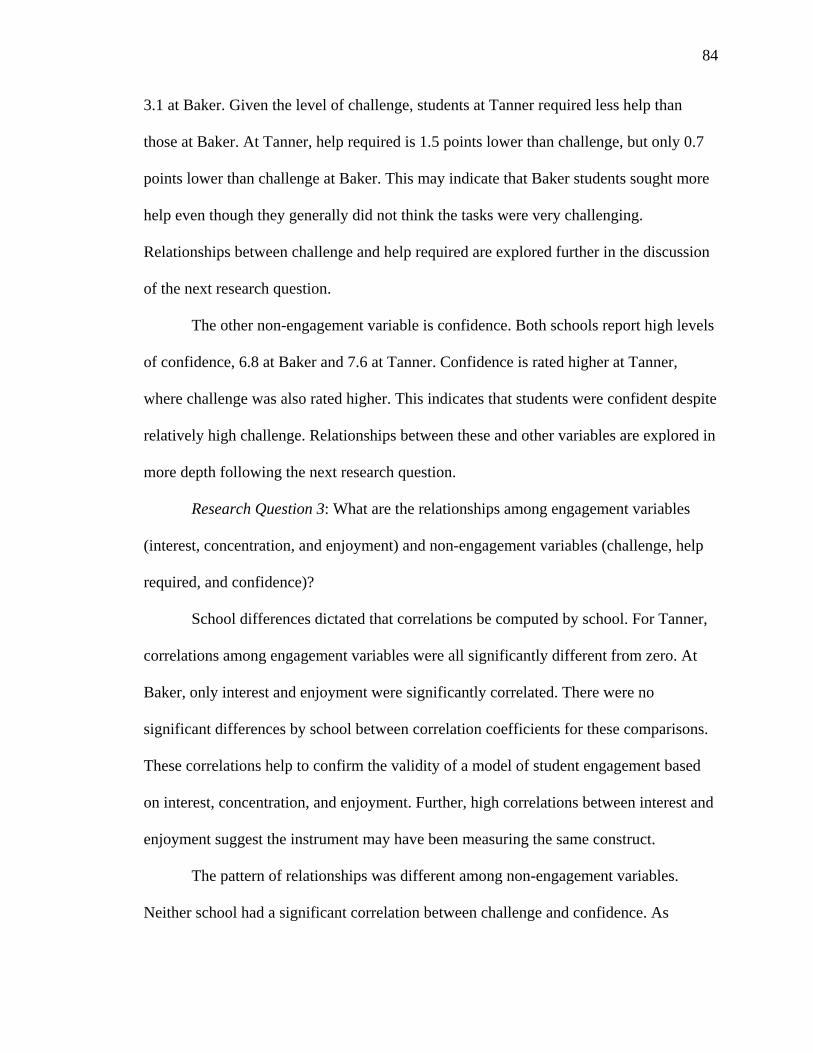
84
3.1 at Baker. Given the level of challenge, students at Tanner required less help than
those at Baker. At Tanner, help required is 1.5 points lower than challenge, but only 0.7
points lower than challenge at Baker. This may indicate that Baker students sought more
help even though they generally did not think the tasks were very challenging.
Relationships between challenge and help required are explored further in the discussion
of the next research question.
The other non-engagement variable is confidence. Both schools report high levels
of confidence, 6.8 at Baker and 7.6 at Tanner. Confidence is rated higher at Tanner,
where challenge was also rated higher. This indicates that students were confident despite
relatively high challenge. Relationships between these and other variables are explored in
more depth following the next research question.
Research Question 3: What are the relationships among engagement variables
(interest, concentration, and enjoyment) and non-engagement variables (challenge, help
required, and confidence)?
School differences dictated that correlations be computed by school. For Tanner,
correlations among engagement variables were all significantly different from zero. At
Baker, only interest and enjoyment were significantly correlated. There were no
significant differences by school between correlation coefficients for these comparisons.
These correlations help to confirm the validity of a model of student engagement based
on interest, concentration, and enjoyment. Further, high correlations between interest and
enjoyment suggest the instrument may have been measuring the same construct.
The pattern of relationships was different among non-engagement variables.
Neither school had a significant correlation between challenge and confidence. As
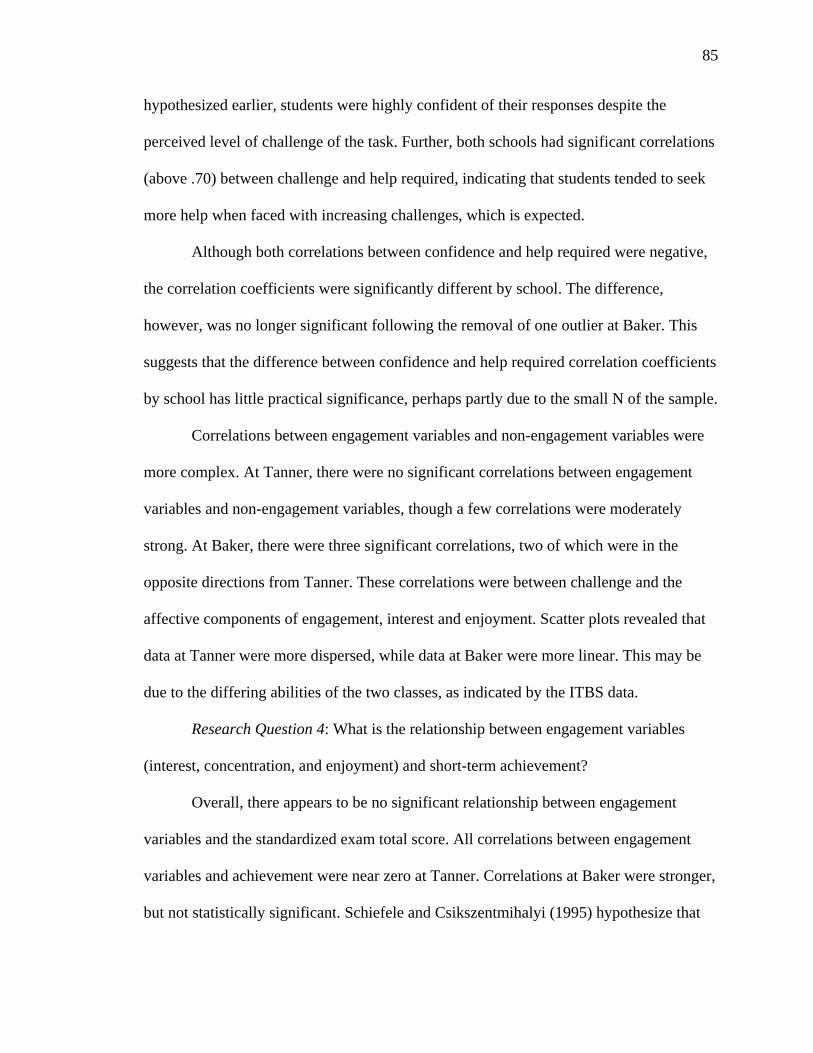
85
hypothesized earlier, students were highly confident of their responses despite the
perceived level of challenge of the task. Further, both schools had significant correlations
(above .70) between challenge and help required, indicating that students tended to seek
more help when faced with increasing challenges, which is expected.
Although both correlations between confidence and help required were negative,
the correlation coefficients were significantly different by school. The difference,
however, was no longer significant following the removal of one outlier at Baker. This
suggests that the difference between confidence and help required correlation coefficients
by school has little practical significance, perhaps partly due to the small N of the sample.
Correlations between engagement variables and non-engagement variables were
more complex. At Tanner, there were no significant correlations between engagement
variables and non-engagement variables, though a few correlations were moderately
strong. At Baker, there were three significant correlations, two of which were in the
opposite directions from Tanner. These correlations were between challenge and the
affective components of engagement, interest and enjoyment. Scatter plots revealed that
data at Tanner were more dispersed, while data at Baker were more linear. This may be
due to the differing abilities of the two classes, as indicated by the ITBS data.
Research Question 4: What is the relationship between engagement variables
(interest, concentration, and enjoyment) and short-term achievement?
Overall, there appears to be no significant relationship between engagement
variables and the standardized exam total score. All correlations between engagement
variables and achievement were near zero at Tanner. Correlations at Baker were stronger,
but not statistically significant. Schiefele and Csikszentmihalyi (1995) hypothesize that
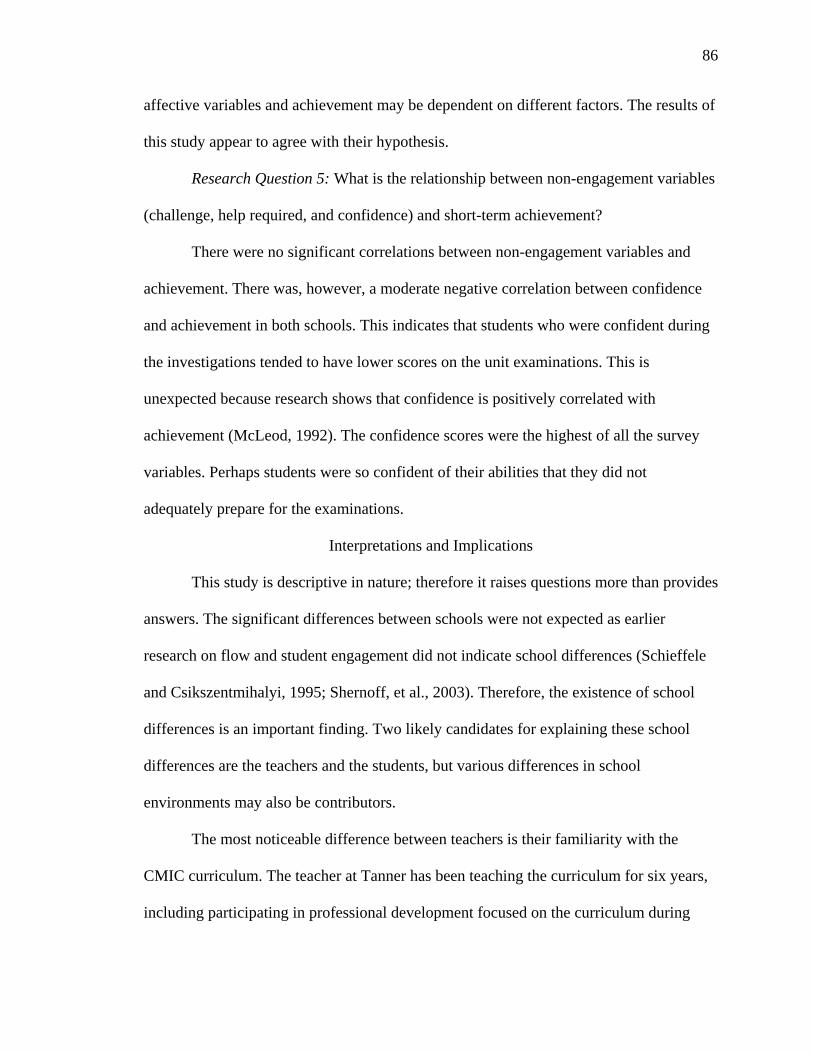
86
affective variables and achievement may be dependent on different factors. The results of
this study appear to agree with their hypothesis.
Research Question 5: What is the relationship between non-engagement variables
(challenge, help required, and confidence) and short-term achievement?
There were no significant correlations between non-engagement variables and
achievement. There was, however, a moderate negative correlation between confidence
and achievement in both schools. This indicates that students who were confident during
the investigations tended to have lower scores on the unit examinations. This is
unexpected because research shows that confidence is positively correlated with
achievement (McLeod, 1992). The confidence scores were the highest of all the survey
variables. Perhaps students were so confident of their abilities that they did not
adequately prepare for the examinations.
Interpretations and Implications
This study is descriptive in nature; therefore it raises questions more than provides
answers. The significant differences between schools were not expected as earlier
research on flow and student engagement did not indicate school differences (Schieffele
and Csikszentmihalyi, 1995; Shernoff, et al., 2003). Therefore, the existence of school
differences is an important finding. Two likely candidates for explaining these school
differences are the teachers and the students, but various differences in school
environments may also be contributors.
The most noticeable difference between teachers is their familiarity with the
CMIC curriculum. The teacher at Tanner has been teaching the curriculum for six years,
including participating in professional development focused on the curriculum during

87
these years. The teacher at Baker is in her first year teaching the CMIC curriculum.
Earlier CMIC research showed the importance of teacher professional development
focused on the curriculum (Schoen, Cebulla, Finn, and Fi, 2003), a finding supported by
the present study.
Another difference between the two teachers in this study may be their use of
scaffolding. Previous research indicates that appropriate scaffolding can increase student
learning (Stein, Smith, Henningsen and Silver, 2000; Turner, Meyer, Cox, Logan,
DiCintio and Thomas, 1998). The current study did not assess the quality of teacher
scaffolding, rather it assessed students' perceptions of how much help they required on
specific tasks. Teacher differences were found between correlation coefficients involving
help required and the two affective components of engagement, interest and enjoyment.
Perhaps the quality of scaffolding was different at the two schools in ways that affected
student engagement. This suggests that further research on teacher scaffolding is needed.
Yet another difference between the two teachers was their use of time during the
class period. At Tanner, nearly all students were observed to be engagement for virtually
the entire class period. At Baker, both observed classes included a substantial amount of
unstructured time for the students. In the first class, students were supposed to sit quietly
as others finished an exam. In the other class, the investigation ended with over 20
minutes of class time remaining where students were in conversation or doing homework
for other classes. This suggests that a more effective use of the class time may be related
to engagement, and teachers should work to keep students engaged throughout class
periods.

88
Besides teacher differences, there are indications of initial student differences by
school. ITBS data suggest that students at Baker generally fall into a narrow range of
ability, whereas students at Tanner are more heterogeneous. ITBS data also indicates that
three students at Baker were not in ninth grade. This was confirmed through discussions
with the teacher who stated that some of the students had failed algebra one or CMIC
Course 1 in previous years. Further research is needed to determine what effects these
student differences may have on the results. Possible explanations for the school
differences are mainly speculation, but these results suggest that engagement variables
are particularly affected by differences in classroom or school environments.
Other student differences include gender and entering mathematical ability (ITBS
Mathematics), neither of which indicate any significant differences on any dependent
variable. Both these results are somewhat unusual as gender and entering ability are often
found to be related to measures such as confidence and challenge (McLeod, 1992).
Perhaps the design and small sample in this study made it difficult to detect differences of
this type, or there was something about the teaching or tasks that reduced the differences
that are often found. There were many post hoc differences by task, but these differences
are not easily explained by the examination of the tasks.
Regarding the CMIC curriculum, there are no significant differences between
introductory and closing tasks. This is surprising because the early tasks in an
investigation tend to introduce a topic, while closing tasks require more summary skills
from the student. The school means indicated a low level of perceived challenge by the
students, so one interpretation is that all tasks were perceived as relatively easy and that
limited potential differences by task on all survey variables. However, the report of

89
challenge in Appendix G indicates variability in the perception of challenge between
tasks. Perhaps the investigations are perceived by students as one unit rather than as
separate tasks, but further research is needed to better understand the role of specific
tasks within a mathematics curriculum.
Further, there were no significant differences on survey variables between units.
As discussed in the previous paragraph, this is surprising because mathematical ideas
build on themselves to form new ideas. As such, mathematics content tends to become
more abstract and complex. Appendix G gives the variability by task for each survey
variable, but there are no discernable differences in variability patterns between Units 2
and 3.
These results together indicate that student engagement is a complex construct.
Steinberg, Brown, & Dornbusch, (1996) stated that some students tune out because they
cannot keep up. For others, disengagement is a response to having too few demands. The
low challenge in the present study indicates that the latter may have been true. However,
neither school had a significant positive correlation between challenge and engagement.
Therefore, the results of this study suggest that increasing engagement is more complex
than increasing the challenges students face. In fact, the school differences are evidence
that there are many factors that affect engagement in the mathematics classroom.
Limitations
This study was not designed to compare schools, yet school differences made it
necessary to do the analysis by school. This reduces the size of the sample and limits the
generaliziability of the results. Further, moderate correlations were discussed because of
90
the small sample size. Another limitation on generalizability is that the teachers in this
study were volunteers, so the classrooms were not randomly selected.
The present study relies on self-reported data. Nisbett and Wilson (1977) showed
that subjects' reports of their own behavior are subject to outside influences and beliefs.
The current study attempts to compensate for this limitation by relying on student means
over time instead of a single measure. Further, only students who completed a minimum
of 50% of the surveys were included in the analysis. This requirement ensures that
student means are based on a minimum of 19 responses, which is designed to prevent a
few abnormal surveys from effecting the data.
There is no independent scoring of the achievement measure. Instead, teachers
scored the exams for their own students. This is a common practice, but the potential for
unreliability and inconsistency in scoring is a limitation of the study. There were also
significant differences on the exam total score by classroom, further indicating that the
achievement measure is a limitation of the study.
Student group work may have affected results on survey variables. For example,
the scaffolding measure is limited because it is not known who provided help for the
students. Recall that the item states, "How much help did you need to solve the task?"
This item does not distinguish between help from the teacher and help from fellow
students. This issue arises because the investigations were done as group work and
students are encouraged to help one another. Further, the confidence variable may have
been reporting group confidence. The confidence scores were report high by both
schools, which may indicate that at least one member of the group was confident in the
solution.

91
Finally, the current study lacks qualitative measures for survey variables. This
limits the research's ability to provide reasons for the quantitative outcomes. For
example, it is not possible to assess the quality of scaffolding or why one task is more
interesting than another. Discussion of possible reasons is based on the researcher's
interpretations of the data and of the tasks themselves.
Future research
The present study suggests that there are teacher differences regarding student
engagement. The following variables may have substantial influences on engagement: a
teacher's familiarity with and professional development on the curriculum, the quality of
scaffolding, and the teacher's use of class time. Further research should test for
relationships between these variables and engagement.
In the present study, there were differences between how the teachers used class
time. One teacher had activities planned for the entire class period, but the other teacher
allowed students to have unstructured time. These differences may have been partly the
result of block scheduling, but research is needed that examines the use of class time and
its relationship to student engagement.
There were also differences between students at the two schools in this study.
Using ITBS mathematics standard scores as a measure of entering ability, the students at
Baker were a more homogenous group than students at Tanner. Various studies have
researched differences between homogenous and heterogeneous groupings with mixed
results (Kilpatrick, Swafford, and Findell, 2001). The results of the current study indicate
that the heterogeneous class had higher engagement, but controls were not in place to
eliminate other school differences. Future studies should put such controls into place.

92
Wilson (1983) also found that student differences relate to affect and
achievement. The researcher found that affect for young students is determined by
achievement. However, as students increase in age the relationship between affect on
achievement reverses. The present study involved only ninth-grade students, but it may
prove useful to study engagement of students in mathematics classes at different age
levels.
Other student differences also require more research. The present study did not
find any statistical differences on dependent variables for gender or prior mathematics
ability. This is surprising given that previous research has found such differences
(McLeod, 1992). Future research needs to continue to include such variables to verify
results of the current study.
Besides student differences, this study suggests that there are differences between
the mathematics classes in the two schools. Shernoff, et al. (2003) compare instructional
activities across the school day regardless of the content. Thus individual work in
mathematics and in history class are considered equivalent. The results for group work in
the present study are lower than results in Shernoff, et al. (2003). For mathematics
classes, results for one school, but not the other, are lower than in Shernoff, et al.'s
mathematics classes. This may be due to the small N of the present study, but further
research is needed to isolate course variables that affect engagement.
Course differences can also be extended to different curricula. The current study
investigated engagement in mathematics tasks that were from a curriculum based on
recommendations by NCTM (1989). Future research could compare tasks based on these
recommendations and tasks that are more traditional.

93
Another potentially important difference between mathematics classes is the use
of and quality of scaffolding. Turner, Meyer, Cox, Logan, DiCintio and Thomas (1998)
indicate that high-involvement classrooms contain more challenges, which were adjusted
by appropriate teacher scaffolding. Further, Stein, Smith, Henningsen and Silver, (2000)
found that mathematics tasks may begin at a high level, but are frequently transformed to
less demanding tasks. More research is needed to determine the effects of different types
of scaffolding.
Research on interest identifies two categories: situational and individual interest.
Deci (1992) argues for the importance of both types of interest:
Beginning with the definition of interest as an affect that occurs in the interaction
between a person and an activity, one can then move to a focus either on the
activity or the person. For example, one can explore the characteristics of
activities that tend, on average, to make them interesting to a group of people …
By knowing what characteristics of tasks tend to be interesting to children one can
design educational materials that, on average, will be more interesting (and thus
more intrinsically motivating) for the children. (p. 46)
The methodology of the present study may provide a way to measure both types of
interest. Situational interest was examined in the post hoc analysis. This analysis
examined interest for each task across students by standardizing student data across their
own means. Individual interest, on the other hand, was measured by the student means
themselves. More research is needed to test whether this methodology provides valid and
reliable measures of situational and individual interest.

94
APPENDIX A
SURVEY INSTRUMENT

95
APPENDIX B
INFORMED CONSENT DOCUMENT

96

97

98
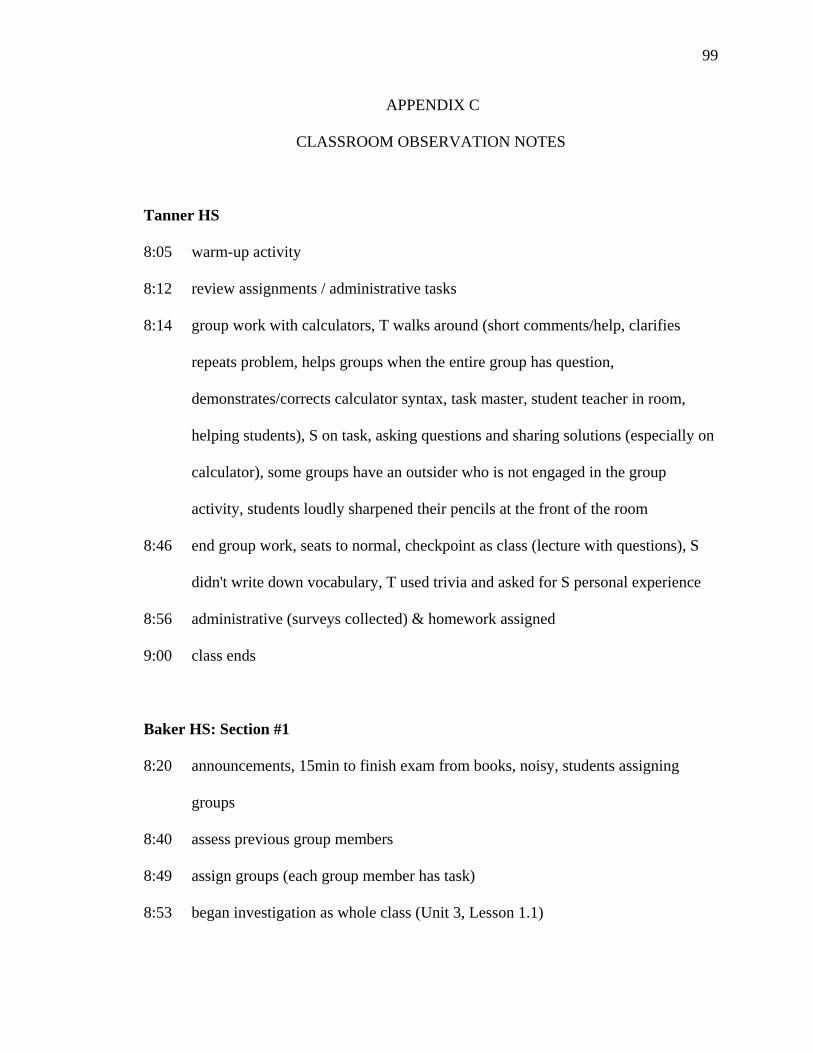
99
APPENDIX C
CLASSROOM OBSERVATION NOTES
Tanner HS
8:05 warm-up activity
8:12 review assignments / administrative tasks
8:14 group work with calculators, T walks around (short comments/help, clarifies
repeats problem, helps groups when the entire group has question,
demonstrates/corrects calculator syntax, task master, student teacher in room,
helping students), S on task, asking questions and sharing solutions (especially on
calculator), some groups have an outsider who is not engaged in the group
activity, students loudly sharpened their pencils at the front of the room
8:46 end group work, seats to normal, checkpoint as class (lecture with questions), S
didn't write down vocabulary, T used trivia and asked for S personal experience
8:56 administrative (surveys collected) & homework assigned
9:00 class ends
Baker HS: Section #1
8:20 announcements, 15min to finish exam from books, noisy, students assigning
groups
8:40 assess previous group members
8:49 assign groups (each group member has task)
8:53 began investigation as whole class (Unit 3, Lesson 1.1)
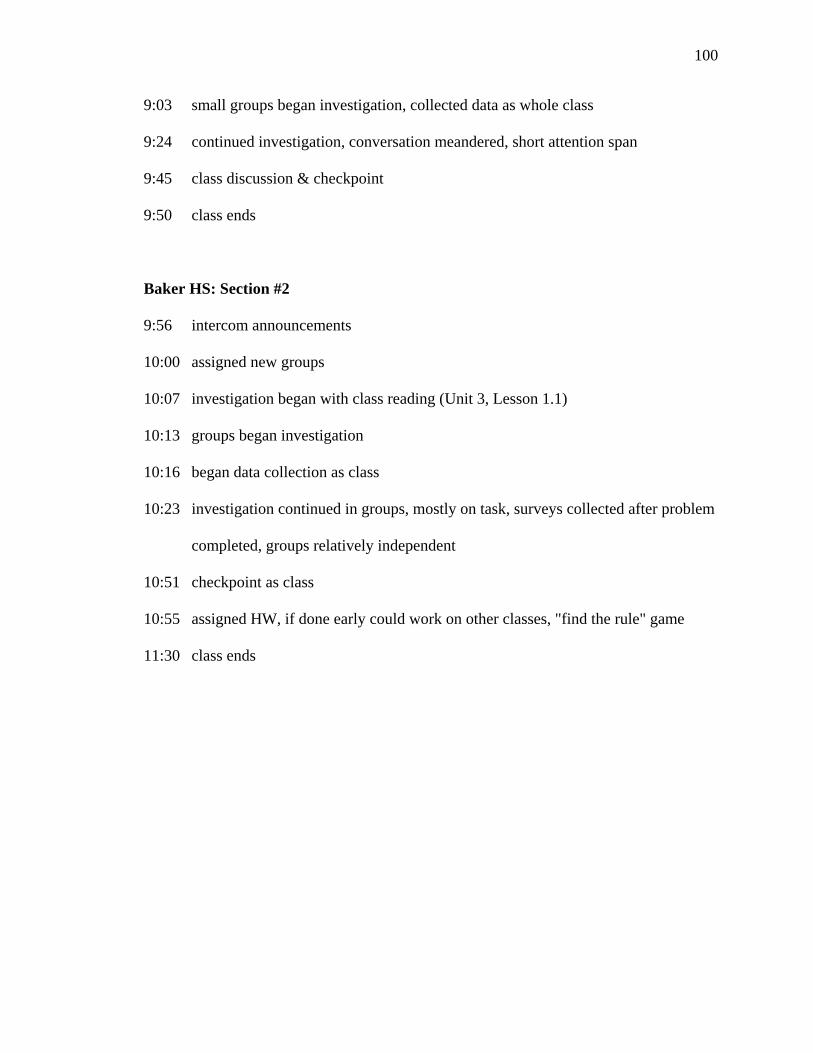
100
9:03 small groups began investigation, collected data as whole class
9:24 continued investigation, conversation meandered, short attention span
9:45 class discussion & checkpoint
9:50 class ends
Baker HS: Section #2
9:56 intercom announcements
10:00 assigned new groups
10:07 investigation began with class reading (Unit 3, Lesson 1.1)
10:13 groups began investigation
10:16 began data collection as class
10:23 investigation continued in groups, mostly on task, surveys collected after problem
completed, groups relatively independent
10:51 checkpoint as class
10:55 assigned HW, if done early could work on other classes, "find the rule" game
11:30 class ends
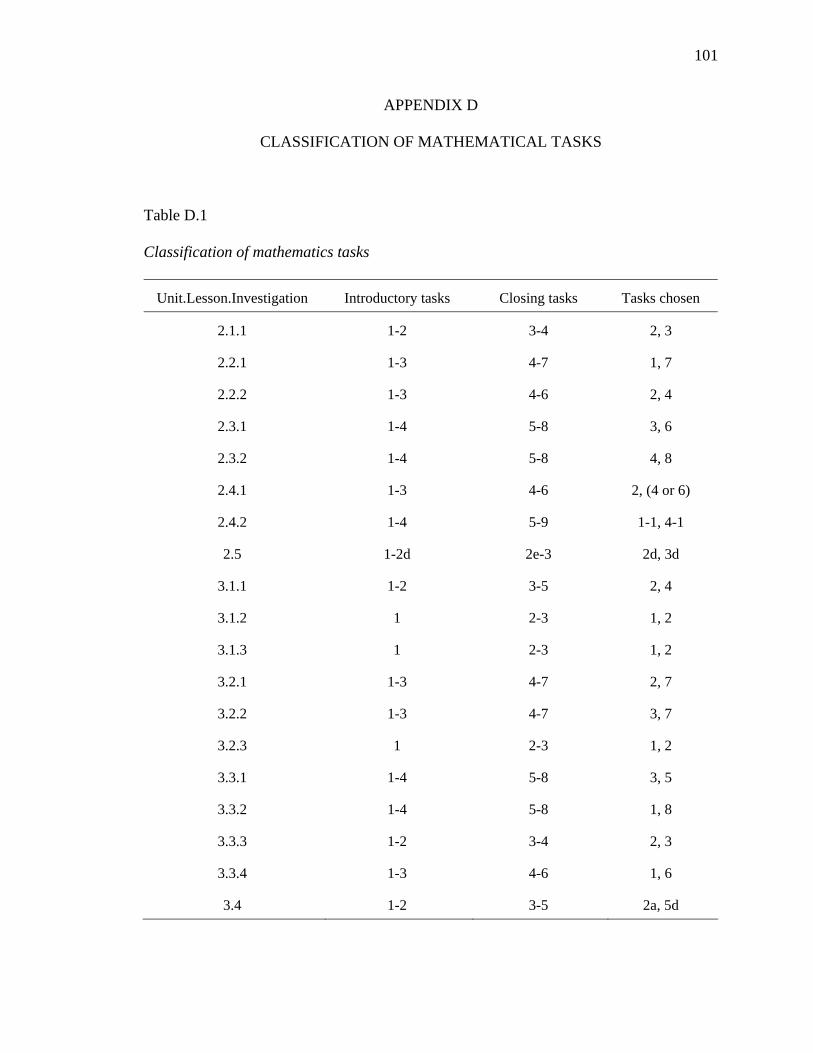
101
APPENDIX D
CLASSIFICATION OF MATHEMATICAL TASKS
Table D.1
Classification of mathematics tasks
Unit.Lesson.Investigation Introductory tasks Closing tasks Tasks chosen
2.1.1 1-2 3-4 2, 3
2.2.1 1-3 4-7 1, 7
2.2.2 1-3 4-6 2, 4
2.3.1 1-4 5-8 3, 6
2.3.2 1-4 5-8 4, 8
2.4.1 1-3 4-6 2, (4 or 6)
2.4.2 1-4 5-9 1-1, 4-1
2.5 1-2d 2e-3 2d, 3d
3.1.1 1-2 3-5 2, 4
3.1.2 1 2-3 1, 2
3.1.3 1 2-3 1, 2
3.2.1 1-3 4-7 2, 7
3.2.2 1-3 4-7 3, 7
3.2.3 1 2-3 1, 2
3.3.1 1-4 5-8 3, 5
3.3.2 1-4 5-8 1, 8
3.3.3 1-2 3-4 2, 3
3.3.4 1-3 4-6 1, 6
3.4 1-2 3-5 2a, 5d

102
The "task chosen" column includes one randomly-chosen introductory task and
one randomly-chosen closing task from each investigation. For Investigation 2.4.1, a
typographical error caused Tanner to do item #6 and Baker to do item #4.
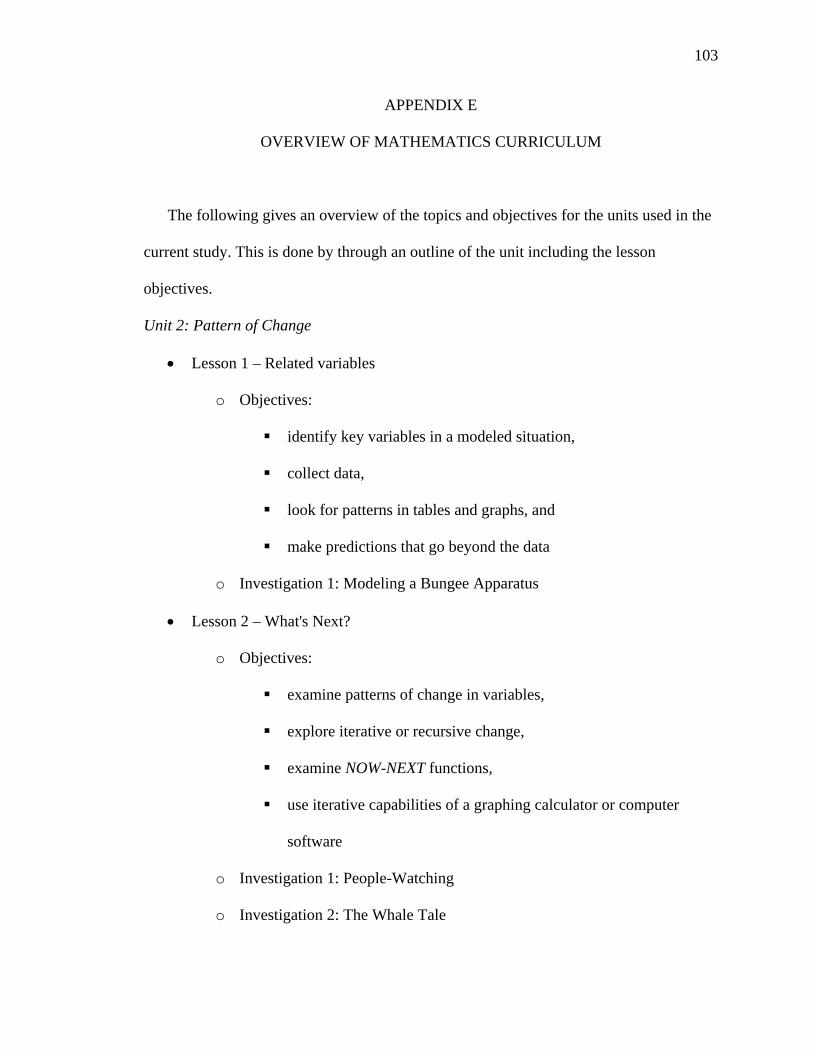
103
APPENDIX E
OVERVIEW OF MATHEMATICS CURRICULUM
The following gives an overview of the topics and objectives for the units used in the
current study. This is done by through an outline of the unit including the lesson
objectives.
Unit 2: Pattern of Change
• Lesson 1 – Related variables
o Objectives:
identify key variables in a modeled situation,
collect data,
look for patterns in tables and graphs, and
make predictions that go beyond the data
o Investigation 1: Modeling a Bungee Apparatus
• Lesson 2 – What's Next?
o Objectives:
examine patterns of change in variables,
explore iterative or recursive change,
examine NOW-NEXT functions,
use iterative capabilities of a graphing calculator or computer
software
o Investigation 1: People-Watching
o Investigation 2: The Whale Tale
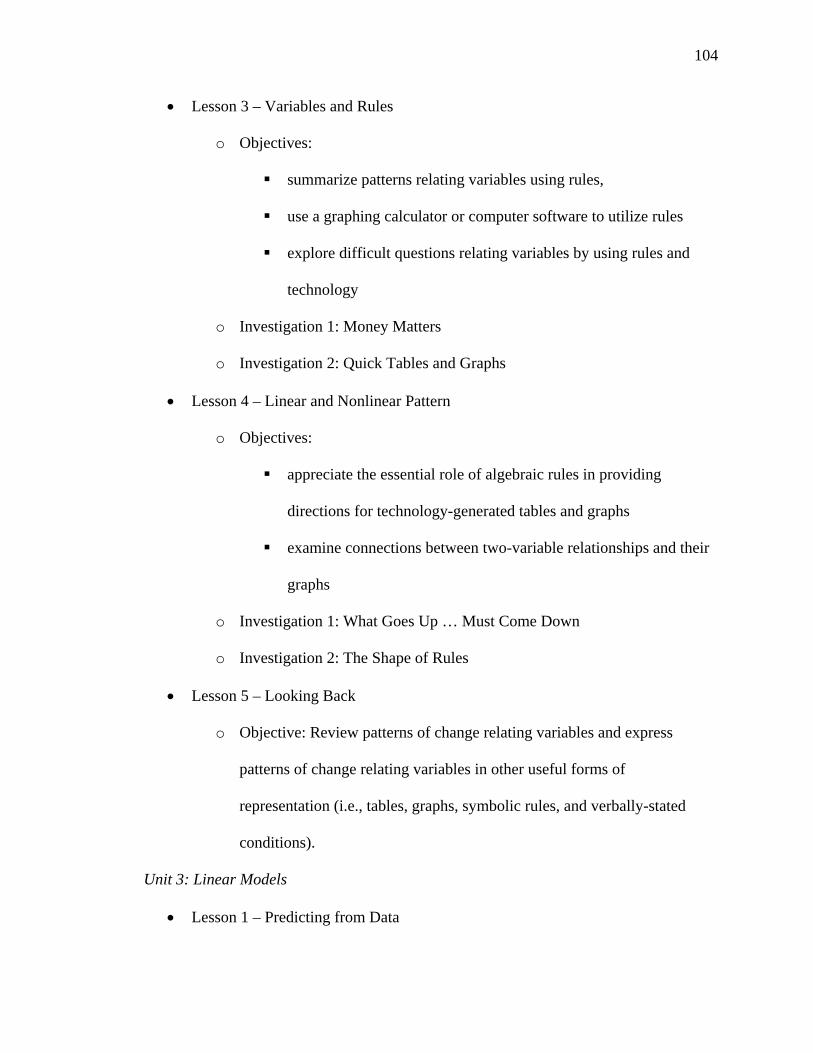
104
• Lesson 3 – Variables and Rules
o Objectives:
summarize patterns relating variables using rules,
use a graphing calculator or computer software to utilize rules
explore difficult questions relating variables by using rules and
technology
o Investigation 1: Money Matters
o Investigation 2: Quick Tables and Graphs
• Lesson 4 – Linear and Nonlinear Pattern
o Objectives:
appreciate the essential role of algebraic rules in providing
directions for technology-generated tables and graphs
examine connections between two-variable relationships and their
graphs
o Investigation 1: What Goes Up … Must Come Down
o Investigation 2: The Shape of Rules
• Lesson 5 – Looking Back
o Objective: Review patterns of change relating variables and express
patterns of change relating variables in other useful forms of
representation (i.e., tables, graphs, symbolic rules, and verbally-stated
conditions).
Unit 3: Linear Models
• Lesson 1 – Predicting from Data
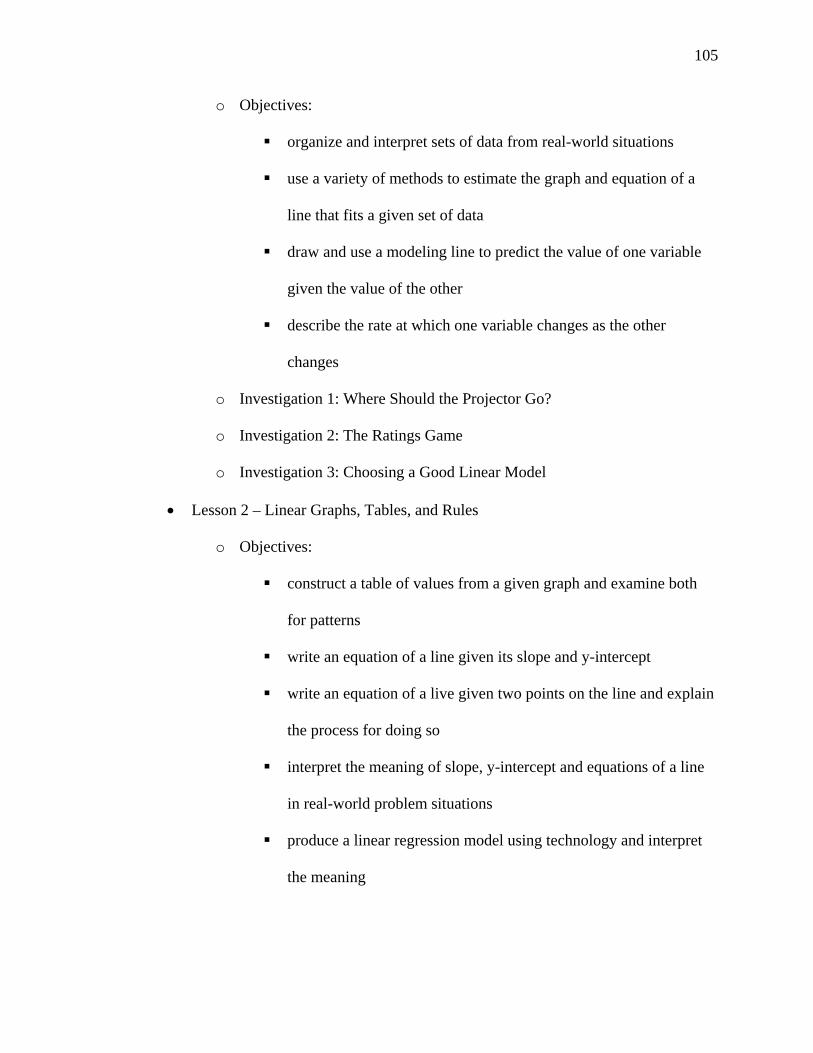
105
o Objectives:
organize and interpret sets of data from real-world situations
use a variety of methods to estimate the graph and equation of a
line that fits a given set of data
draw and use a modeling line to predict the value of one variable
given the value of the other
describe the rate at which one variable changes as the other
changes
o Investigation 1: Where Should the Projector Go?
o Investigation 2: The Ratings Game
o Investigation 3: Choosing a Good Linear Model
• Lesson 2 – Linear Graphs, Tables, and Rules
o Objectives:
construct a table of values from a given graph and examine both
for patterns
write an equation of a line given its slope and y-intercept
write an equation of a live given two points on the line and explain
the process for doing so
interpret the meaning of slope, y-intercept and equations of a line
in real-world problem situations
produce a linear regression model using technology and interpret
the meaning
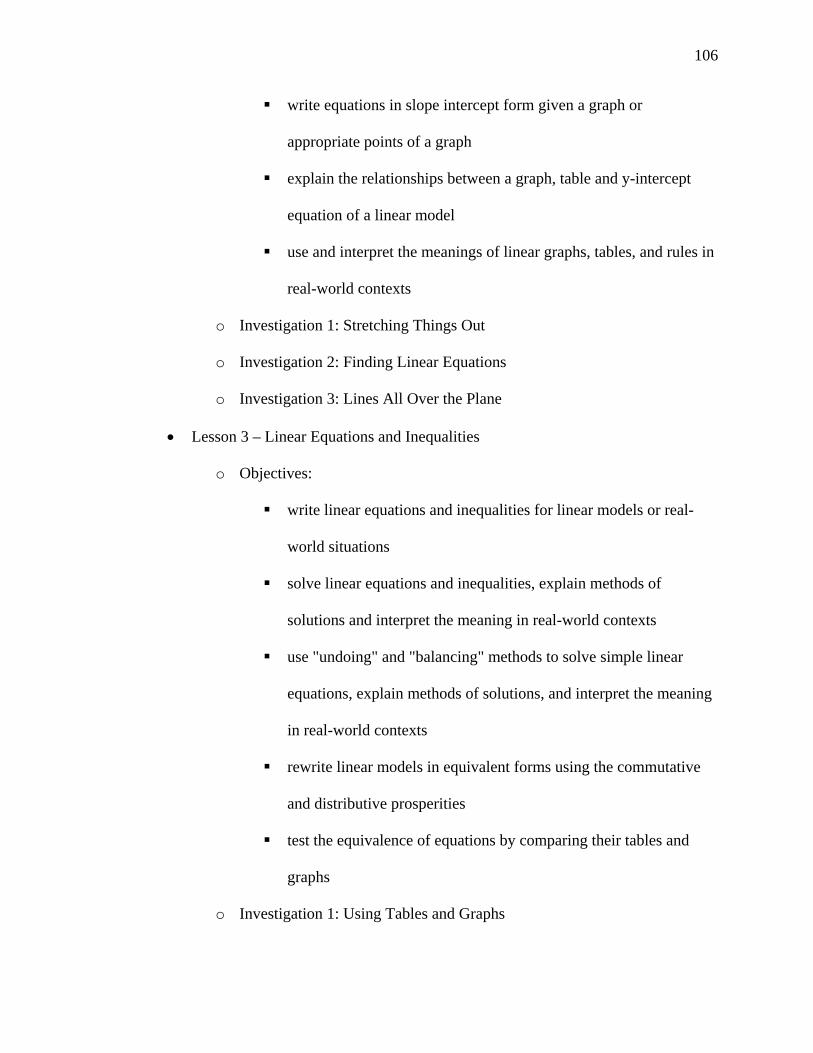
106
write equations in slope intercept form given a graph or
appropriate points of a graph
explain the relationships between a graph, table and y-intercept
equation of a linear model
use and interpret the meanings of linear graphs, tables, and rules in
real-world contexts
o Investigation 1: Stretching Things Out
o Investigation 2: Finding Linear Equations
o Investigation 3: Lines All Over the Plane
• Lesson 3 – Linear Equations and Inequalities
o Objectives:
write linear equations and inequalities for linear models or real-
world situations
solve linear equations and inequalities, explain methods of
solutions and interpret the meaning in real-world contexts
use "undoing" and "balancing" methods to solve simple linear
equations, explain methods of solutions, and interpret the meaning
in real-world contexts
rewrite linear models in equivalent forms using the commutative
and distributive prosperities
test the equivalence of equations by comparing their tables and
graphs
o Investigation 1: Using Tables and Graphs

107
o Investigation 2: Quick Solutions
o Investigation 3: Making Comparisons
o Investigation 4: Equivalent Rules and Equations
• Lesson 4 – Looking Back
o Objective: The lesson includes major explorations of modeling situations
requiring collection and analysis of data, and extensive use of calculators
to find linear models.
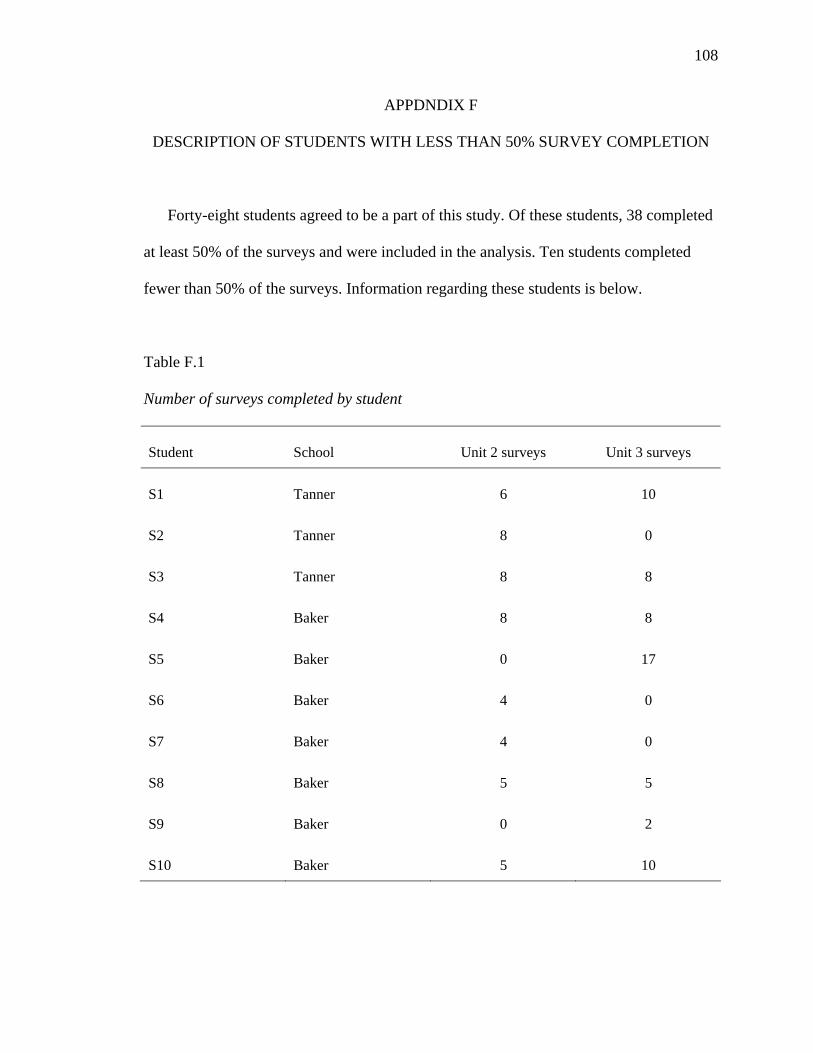
108
APPDNDIX F
DESCRIPTION OF STUDENTS WITH LESS THAN 50% SURVEY COMPLETION
Forty-eight students agreed to be a part of this study. Of these students, 38 completed
at least 50% of the surveys and were included in the analysis. Ten students completed
fewer than 50% of the surveys. Information regarding these students is below.
Table F.1
Number of surveys completed by student
Student School Unit 2 surveys Unit 3 surveys
S1 Tanner 6 10
S2 Tanner 8 0
S3 Tanner 8 8
S4 Baker 8 8
S5 Baker 0 17
S6 Baker 4 0
S7 Baker 4 0
S8 Baker 5 5
S9 Baker 0 2
S10 Baker 5 10
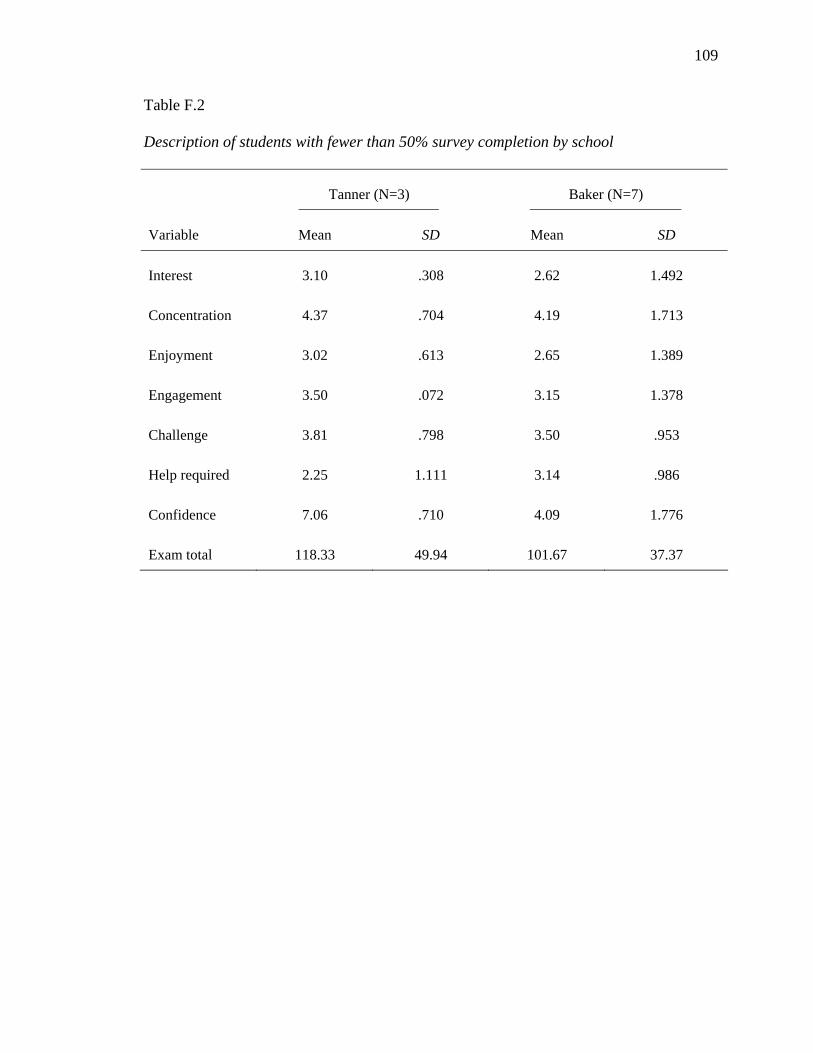
109
Table F.2
Description of students with fewer than 50% survey completion by school
Tanner (N=3) Baker (N=7)
Variable Mean SD Mean SD
Interest 3.10 .308 2.62 1.492
Concentration 4.37 .704 4.19 1.713
Enjoyment 3.02 .613 2.65 1.389
Engagement 3.50 .072 3.15 1.378
Challenge 3.81 .798 3.50 .953
Help required 2.25 1.111 3.14 .986
Confidence 7.06 .710 4.09 1.776
Exam total 118.33 49.94 101.67 37.37

110
APPENDIX G
TABLE AND FIGURES FOR THE POST HOC ANALYSIS
Figure G.1 – Mean z-scores for interest by task

111
Figure G.2 – Mean z-scores for concentration by task

112
Figure G.3 – Mean z-scores for enjoyment by task

113
Figure G.4 – Mean z-scores for engagement by task

114
Figure G.5 – Mean z-scores for challenge by task

115
Figure G.6 – Mean z-scores for help required by task

116
Figure G.7 – Mean z-scores for confidence by task
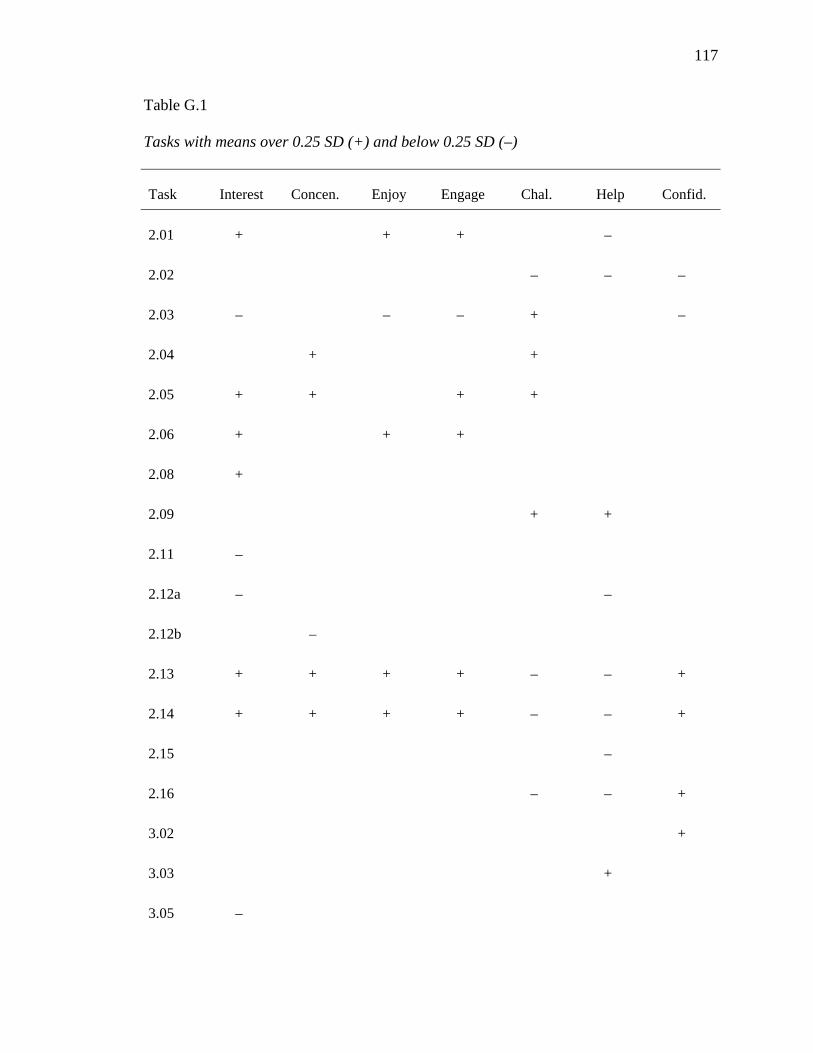
117
Table G.1
Tasks with means over 0.25 SD (+) and below 0.25 SD (–)
Task Interest Concen. Enjoy Engage Chal. Help Confid.
2.01 + + + –
2.02 – – –
2.03 – – – + –
2.04 + +
2.05 + + + +
2.06 + + +
2.08 +
2.09 + +
2.11 –
2.12a – –
2.12b –
2.13 + + + + – – +
2.14 + + + + – – +
2.15 –
2.16 – – +
3.02 +
3.03 +
3.05 –

118
Table G.1-continued
Task Interest Concen. Enjoy Engage Chal. Help Confid.
3.08 +
3.09 + +
3.12 – –
3.13 – – –
3.16 + – – +
3.17 – –
3.19 – –
3.20 – – – – –
3.21 – –
3.22 – – – + –

119
APPENDIX H
STUDENT COMMENTS
Task 2.01
Tanner:
The experiment was a lot of fun to do. #2 might not have been much fun.
I though this activity was very hands on and enjoyable.
It was pretty fun!
No.
I think that the task was easy only because the data was a very easily recognizable
pattern.
It was difficult to compare everyone's results because we had different coins.
The question seemed vague to me.
No.
Doing hands on activities are more fun than just looking at a table.
Baker:
None in my group doesn't listen and its annoying me.
Find a way that will make me want to learn!
None.
The a and b questions are the same.
More hands on experiments.
Task 2.02
Baker:
Make it more interesting to people, like me and my math group.
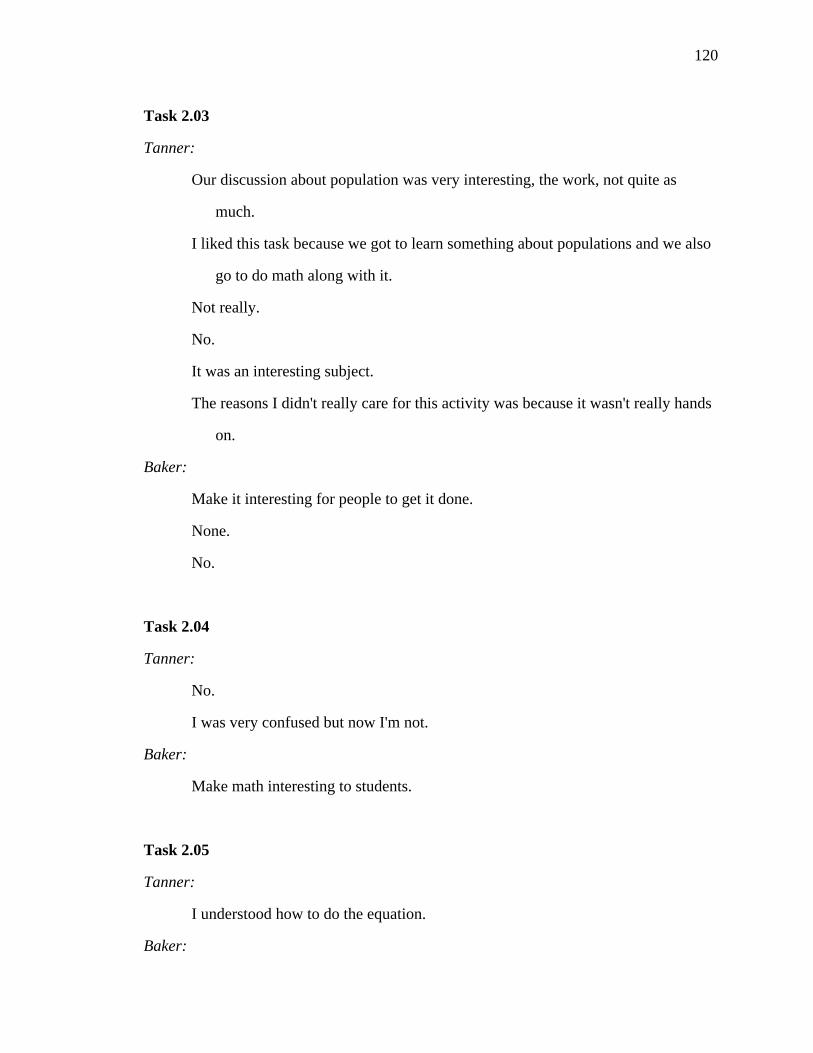
120
Task 2.03
Tanner:
Our discussion about population was very interesting, the work, not quite as
much.
I liked this task because we got to learn something about populations and we also
go to do math along with it.
Not really.
No.
It was an interesting subject.
The reasons I didn't really care for this activity was because it wasn't really hands
on.
Baker:
Make it interesting for people to get it done.
None.
No.
Task 2.04
Tanner:
No.
I was very confused but now I'm not.
Baker:
Make math interesting to students.
Task 2.05
Tanner:
I understood how to do the equation.
Baker:

121
Make it fun to do!
Task 2.06
Tanner:
I think this was pretty fun.
Baker:
Make it kind of fun!
Try to make it fun.
Task 2.07
Baker:
Make work seem more worthwhile.
Can you make in enjoyable?
Pretty easy.
Task 2.08
Tanner:
None.
The solutions are easy once you understand how to do them…
Baker:
This was very not worthwhile.
Can you try to make this class a little enjoyable for people to do it.
Task 2.09
Baker:
Did not have calculator. Did it by hand.

122
Task 2.10
Tanner:
I feel like this investigation was unnecessary. I think we've spent enough time on
this material.
Task 2.11
Baker:
Boring!
Task 3.12
Tanner:
It was very long – took over an hour to do.

123
REFERENCES
Amabile, T. M., DeJong, W., & Lepper, M. (1976). Effects of externally imposed deadlines on subsequent intrinsic motivation. Journal of Personality and Social Psychology, 34, 92-98.
Boekaerts, M., & Boscolo, P. (2002). Interest in learning, and learning to be interested. Learning and Instruction, 12, 375-382.
Borman, K.M., Kersaint, G. Cotner, B., Lee, R. Boydston, T, Uekawa, K., et al. (2005). Meaningful urban education reform: Confronting the learning crisis in mathematics and science. New York: SUNY Press.
Collins, M.A. (1995). Implications of students' beliefs about the nature of ability for classroom experiences and learning. Unpublished doctoral dissertation, Brandeis Univeristy.
Coxford, A.F., Fey, J.T., Hirsch, C.R., Schoen, H.L., Burrill, G., Hart, E.W., Watkins, A.E. (with Messenger, M.J., & Ritsema, B.). (2001). Core-plus mathematics project: Scope and sequence. New York: Glencoe/McGraw-Hill.
Coxford, A.F., Fey, J.T., Hirsch, C.R., Schoen, H.L., Burrill, G., Hart, E.W., Watkins, A.E. (with Messenger, M.J., & Ritsema, B.). (2003). Contemporary mathematics in context: A unified approach (Course 1). New York: Glencoe/McGraw-Hill.
Csikszentmihalyi, M. (1975). Beyond boredom and anxiety: The experience of play in work and games. San Francisco: Jossey-Bass.
Csikszentmihalyi, M. (1990). Flow: The psychology of optimal experience. New York: Harper & Row.
Csikszentmihalyi, M. (1997). Finding flow: The psychology of engagement with everyday life. New York: Basic Books.
Csikszentmihalyi, M. & Csikszentmihalyi, I.S. (1988). Optimal experience: Psychological studies of flow in consciousness. Cambridge: Cambridge University.
Csikszentmihalyi, M. & Larson, R. (1987). Validity and reliability of the Experience-Sampling Method. Journal of Nervous and Mental Disease, 175, 526-536.
Csikszentmihalyi, M., Rathunde, K., & Whalen, S. (1990). Talented teenagers: The roots of success and failure. Cambridge: Cambridge University.
deCharmes, R., & Muir, M.S. (1978). Motivation: Social approaches. Annual Review of Psychology, 29, 91-113.
Deci, E.L. (1992). The relation of interest to the motivation of behavior: A self-determination theory perspective. In K.A. Renninger, S. Hidi & A. Krapp. (Eds.), The role of interest in learning and development (pp. 43-70). Hillsdale, NJ: Lawrence Erlbaum.

124
Deci, E.L., Koestner, R., & Ryan, R.M. (1999). A meta-analytic review of experiments examining the effects of extrinsic rewards on intrinsic motivation. Psychological Bulletin, 125, 627-668.
Deci, E.L. & Ryan, R.M. (1985). Intrinsic motivation and self-determination in human behavior. New York: Plenum.
Dewey, J . (1913). Interest and effort in education. Carbondale and Edwardsville: Southern Illinois University.
Egbert, J. (2003). A study of flow theory in the foreign language classroom. The Modern Language Journal, 87, 499-518.
Fredricks, J.A., Blumenfeld, P.C., & Paris, A.H. (2004). School engagement: potential of the concept, state of the evidence. Review of Educational Research, 74, 59-109.
Hamilton, J.A., Haier, R.J., & Buchsbaum, M.S. (1984). Intrinsic enjoyment and boredom coping scales: Validation with personality, evoked potential and attention measures. Personality and Individual Differences, 5, 183-193.
Henningsen, M., & Stein, M.K. (1997). Mathematical tasks and students cognition: Classroom-based factors that support and inhibit high-level mathematical thinking and reasoning. Journal for Research in Mathematics Education, 28, 524-549.
Hiebert, J., Carpenter, T. P., Fennema, E., Fuson, K., Human, P. et al. (1996). Problem solving as a basis for reform in curriculum and instruction: The case of mathematics. Educational Researcher, 25 (4), 12-21.
Hyde, J.S., Fennema, E., & Lamon, S.J. (1990). Gender differences in mathematics performance: A meta-analysis. Psychological Bulletin, 107, 139-155.
Kilpatrick, J., Swafford, J., & Findell, B. (2001). Adding it Up: Helping children learn mathematics. Washington, D.C.: National Academy Press.
Larson, R., & Csikszentmihalyi, M. (1983). The experience sampling method. In H.T. Reis (Ed.), Naturalistic approaches to studying social interaction, (pp. 41-56). San Francisco: Jossey-Bass.
Larson, R., & Delespau, P.A.E.G. (1992). Analyzing experience sampling data: A guidebook for the perplexed. In M.W. deVires (Ed.), The experience of psycopathology: Investigating mental disorders in their natural settings (pp. 58-78). Cambridge: Cambridge University Press.
Lepper, M.R., & Henderlong, J. (2000). Turning "play" into "work" and "work" into "play": 25 years of research on intrinsic versus extrinsic motivation. In C. Sansone & J.M. Harackiewicz (Eds.), Intrinsic and extrinsic motivation: The search for optimal motivation and performance (pp. 257-307). San Diego, CA: Academic Press.
Maslow, A. (1968). Towards a psychology of being. New York: Von Nostrand.
McLeod, D.B. (1992). Research on affect in mathematics education: A reconceptualization. In D.A. Grouws (Ed.) Handbook for Research in Mathematics Teaching and Learning (pp. 575-596). New York: Macmillan.

125
Middleton, J.A. (1995). A study of intrinsic motivation in the mathematics classroom: A personal constructs approach. Journal for Research in Mathematics Education, 26, 254-279.
Middleton, J.A., & Spanias, PA. (1999). Motivation for achievement in mathematics: Findings, generalizations, and criticisms of the research. Journal for Research in Mathematics Education, 30, 65-88.
Mitchell, M. (1993). Situational interest: Its multifaceted structure in the secondary school mathematics classroom. Journal of Educational Psychology, 85, 424-436.
Moneta, G.B., & Csikszentmihalyi, M. (1996). The effect of perceived challenges and skills on the quality of subjective experience. Journal of Personality, 64, 275-310.
National Council of Teachers of Mathematics (1989). Curriculum and evaluation standards for school mathematics. Reston, VA: Author.
National Council of Teachers of Mathematics (2000). Principles and standards for school mathematics. Reston, VA: Author.
Nisbett, R.E., & Wilson, T.D. (1977). Telling more than we can know: Verbal reports on mental processes. Psychological Reports, 84, 231-259.
Rasmussen, C., Yackel, E., & King, K. (2003). Social and sociomathematical norms in the mathematics classroom. In H.L. Schoen & R.I. Charles (Eds.), Teaching mathematics through problem solving: Grades 6-12, (pp. 143-154). Reston, VA: National Council of Teachers of Mathematics.
Ryan, R.M., & Deci, E.L. (2000). Intrinsic and extrinsic motivations: Classic definitions and new directions. Contemporary Educational Psychology, 25, 54-67.
Schiefele, U., & Csikszentmihalyi, M. (1995). Motivation and ability as factors in mathematics experience and achievement. Journal for Research in Mathematics Education, 26, 163-181.
Schoen, H.L., Cebulla, K.J., Finn, K.F., & Fi, C. (2003). Teacher variables that relate to student achievement when using a standards-based curriculum. Journal for Research in Mathematics Education, 34, 228-259.
Schoenfeld, A.H. (1982). Measures of problem-solving performance and of problem-solving instruction. Journal for Research in Mathematics Education, 13, 31-49.
Schoenfeld, A.H. (1985). Mathematical problem solving. New York: Academic Press.
Schoenfeld, A.H. (1992). Learning to think mathematically: problem solving, metacognition, and sense making in mathematics. In D. A. Grouws (Ed.), Handbook of Research on Mathematics Teaching and Learning (pp. 334-370), New York: Macmillan.
Scollon, C.N., Kim-Prieto, C., & Diener, E. (2003). Experience sampling: Promises and pitfalls, strengths and weaknesses. Journal of Happiness Studies, 4, 5-34.
126
Shernoff, D.J. (2001). The experience of student engagement in high school classrooms: A phenomenological perspective. Unpublished doctoral dissertation, University of Chicago.
Shernoff, D.J., Csikszentmihalyi, M., Schneider, B., & Shernoff, E.S. (2003). Student engagement in high school classrooms from the perspective of flow theory. School Psychology Quarterly, 18, 158-176.
Shernoff, D., Knauth, S., & Makris, E. (2001). The quality of classroom experiences. In M. Csikszentmihalyi & B. Schneider (Eds.), Becoming adult: How teenagers prepare for the world of work, (pp. 141-164). New York: Basic Books
Steen, L.A. (1989). Teaching mathematics for tomorrow's world. Educational Leadership, 47, 18-22.
Stein, M.K., Smith, M.S., Henningsen, M.A., & Silver, E.A. (2000). Implementing standards-based mathematics instruction: A casebook for professional development. New York: Teachers College Press.
Steinberg, L.D., Brown, B.B., & Dornbusch, S.M. (1996). Beyond the classroom: Why school reform as failed and what parents need to do. New York: Simon & Schuster.
Turner, J.C., Meyer, D.K., Cox, K.E., Logan, C., DiCintio, M., & Thomas, C.T. (1998). Creating contexts for involvement in mathematics. Journal of Educational Psychology, 90, 730-745.
Wilson, V.L. (1983). A meta-analysis of the relationship between science achievement and science attitude: Kindergarten through college. Journal of Research in Science Teaching, 20, 839-850.