structuralchangesandinterregionalincomeinequal- ity in the...
TRANSCRIPT
Economics & Management Series EMS-2013-14
Structural Changes and Interregional Income Inequal-ity in the Philippines, 1975-2009
Takahiro AkitaInternational University of Japan
Mark Saliganan PagulayanAlumnus 2013, International University of Japan
September 2013
IUJ Research InstituteInternational University of Japan
These working papers are preliminary research documents published by the IUJ research institute. To facilitate prompt distribution, they havenot been formally reviewed and edited. They are circulated in order to stimulate discussion and critical comment and may be revised. The viewsand interpretations expressed in these papers are those of the author(s). It is expected that the working papers will be published in some otherform.
Structural Changes and Interregional Income Inequality in the
Philippines, 1975-2009
Takahiro Akita
International University of Japan
E-mail: [email protected]
and
Mark Saliganan Pagulayan
The National Economic and Development Authority (NEDA), Philippines
Abstract
The Philippines has undergone gradual but substantial changes in industrial
structure over the past few decades, and these have been associated with the
changes in the geographical distribution of economic activity. This study
analyzes changes in the determinants of regional income inequality in the
Philippines associated with these structural changes from 1975 to 2009. This
is accomplished by using the bi-dimensional decomposition method. The
reduction of the disparity between the National Capital Region (NCR) and the
rest of Luzon is essential to decreasing Luzon’s high within-region inequality
and overall interregional inequality. But this is not easy to accomplish, since
services sectors have enjoyed agglomeration economies that NCR has
nurtured under economic liberalization and globalization. Decentralization
has been one way to ameliorate the disparity, but its effects are ambiguous.
Another option would be to relocate some manufacturing activities to areas
outside NCR where they could enjoy localization economies.
Keywords: structural change, regional income inequality, the Philippines,
bi-dimensional decomposition, weighted coefficient of variation
JEL classification: O18, R11, R12
An earlier version of the paper was presented at the 23
rd Pacific Conference of the Regional Science
Association International in Bandung, Indonesia in July 2013. The authors would like to thank
participants of the special session on the Spatial Dimension of Growth, Inequality and Poverty in Asia for
their useful comments and suggestions. Takahiro Akita is grateful to the Japan Society for the Promotion
of Science for its financial support (Grant-in-Aid for Scientific Research No. 24530274).

1
1. Introduction
The Philippines, the second largest archipelagic country in the world with 7,100
islands, has grown at an average GDP growth rate of 3.4% over the last three decades
and a half, during which it has undergone gradual but substantial changes in its
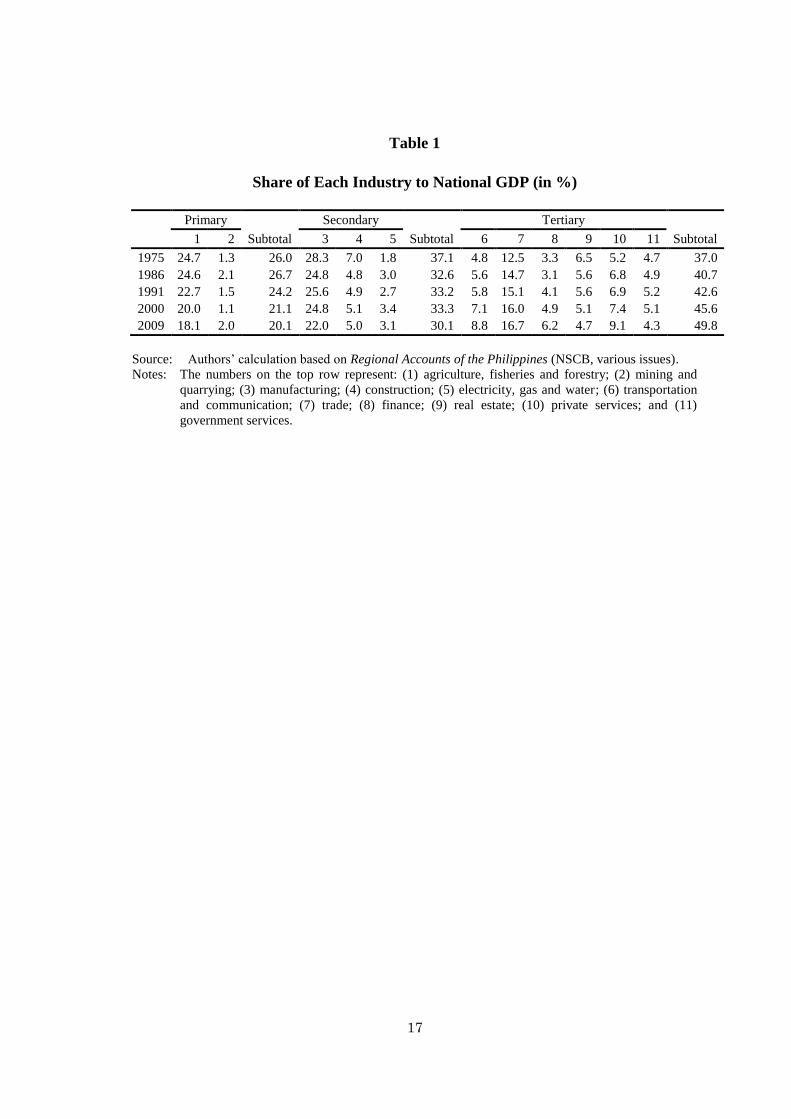
industrial structure. In 1975, the GDP share of the primary sector was 26%, but has
declined steadily to 20% in 2009 (Table 1). Unlike many other Asian countries,
however, this has been accompanied by a fall in the share of the secondary sector, from
37% to 30%. Particularly within the secondary sector, the share of manufacturing has
declined significantly from 28% to 22%. On the other hand, due to a rise in the shares of
transportation, trade, finance and private services, the tertiary sector has raised its GDP
share prominently from 37% to 50%.
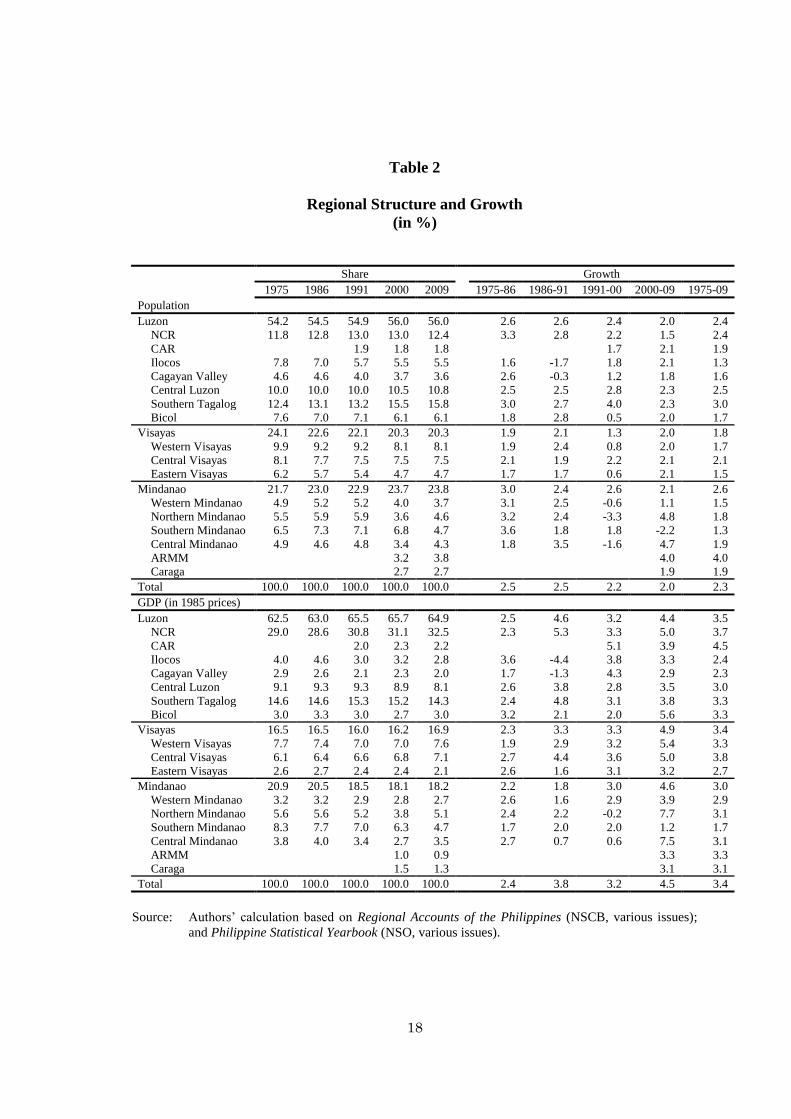
These structural changes were associated with the changes in the geographical
distribution of economic activity (Table 2). Luzon, which includes the National Capital
Region of Metropolitan Manila (NCR), dominates the country; in 1975, its GRDP share
was 62%, but has increased gradually to 65% in 2009 due solely to a rise in the share of
NCR from 29% to 33%. Meanwhile, Mindanao, which encompasses the two poorest
administrative regions, i.e., the Autonomous Region in Muslim Mindanao (ARMM) and
Caraga, has lowered its GRDP share from 21% to 18%, while the GRDP share of
Visayas has remained almost constant at around 16-17%.
The Philippines has been known for its high level of income and expenditure
inequality among Asian countries and around 15% of inequality in per capita
expenditure is attributable to spatial inequality (Shorrocks and Wan, 2005). Thus, the
Philippine government has been pursuing balanced regional development as a means to
promote the overall development of the economy. However, large disparities still exist
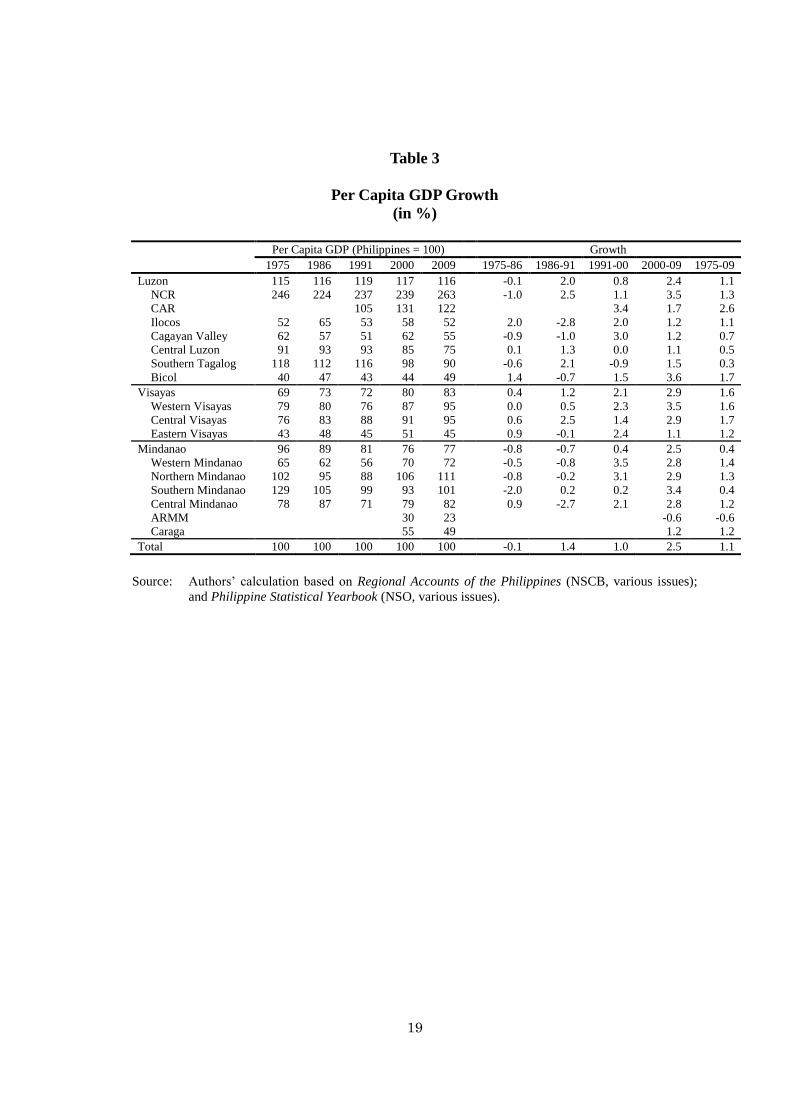
among regions and provinces in the Philippines. Table 3 exhibits that in 2009, only four
out of 16 administrative regions, i.e., NCR, the Cordillera Administrative Region
(CAR) and Northern and Southern Mindanao, have their per capita GRDP above the
national average. NCR is by far the richest region with a per capita GRDP about 2.6
times the national average. This is more than double that of the next richest region
2
(CAR) and 11 times that of the poorest (ARMM). Meanwhile, four poor administrative
regions have their per capita GRDP less than a half of the national average in 2009.
What are the determinants of interregional income inequality in the Philippines?
The present study is an exploratory research and attempts to investigate changes in the
determinants of interregional income inequality over the period from 1975-2009 in the
Philippines associated with the structural changes described above. Built on the earlier
works of Akita and Miyata (2010) and Akita et al. (2011) for Indonesia, this is
accomplished by the bi-dimensional decomposition method. The method decomposes
interregional inequality in per capita GRDP simultaneously by regional groups and by
GDP components (represented by industrial sectors) using the squared
population-weighted coefficient of variation (squared WCV) introduced by Williamson
(1965).
This study divides the period into four sub-periods (1975-1986; 1986-1991;
1991-2000; 2000-2009) to highlight several distinct episodes of development that the
Philippines has experienced between 1975 and 2009. These include the fall of the
Marcos regime in 1986, the start of decentralization in 1991 when the Local
Government Code was introduced, the establishment of ARMM in Mindanao under the
Ramos presidency in the middle of 1990s,1 the Asian financial crisis of 1997-98, the
introduction of major trade liberalization policies in the 1990s2 and intensifying
globalization in the 2000s. These four sub-periods are termed, respectively, the period
of Marcos’ authoritarian rule, the post-Marcos/pre-decentralization period, the
decentralization/Asian financial crisis period, and the post-Asian financial crisis period.
To allow further dissection of interregional income inequality in the Philippines, the
analysis is also performed with and without NCR due to its sizable share as indicated
above.
There have been numerous studies on the distribution of economic well-being in
the Philippines, reflecting continued interest in how development benefits are
1 ARMM was established in 1996 based on the Jakarta Accord between the Philippine government and
the Moro National Liberation Front (MNLF) (Hill, Balisacan and Piza, 2007). ARMM, which has been
plagued with a number of internal problems, is the poorest administrative region with its per capita GDP
about a quarter of the national average. 2 During the 1990s, nominal tariff rates on imports have been reduced substantially; the average nominal
tariff rate has declined from 28% to 8% in this period (Tecson, 2007).
3
distributed among different population subgroups and regions.3 Among them, the
following studies analyzed interregional inequality in the Philippines: Manasan and
Mercado (1999), Manasan and Chatterjee (2003), Balisacan and Fuwa (2003, 2004b),
Mapa, Balisacan and Briones (2006), Balisacan (2007), Manasan (2007), and Mapa,
Balisacan, Briones and Albis (2009). Manasan and Mercado (1999) adopted the
neoclassical growth method advanced by Barro and Sala-i-Martin (1992, 1995) to
investigate - and-convergence in per capita GRDP among 14 administrative regions
for the period from 1975-1997 and found evidence for - and -convergence in the
whole period. Manasan and Chatterjee (2003) extended the period to 2000 and obtained
similar results for the period from 1975-2000. They found that the speed of
-convergence is faster in the sub-period from 1975-1986 than in the sub-period from
1986-2000, though the estimated -coefficient for the latter sub-period is not
statistically significant.
Balisacan and Fuwa (2003, 2004b) also conducted a convergence analysis using the
same neoclassical growth framework as in Manasan and Mercado (1999) and Manasan
and Chatterjee (2003); but their studies were for the period from 1988-1997 and based
on per capita expenditure data for 70 provinces from the Family Income and
Expenditure Survey (FIES) rather than per capita GRDP data for administrative regions.
Their studies found a high rate of absolute -convergence for the study period and that
provincial growth is positively associated with the initial land inequality and the
implementation of the Comprehensive Agrarian Reform Program (CARP), while
negatively associated with mortality rate and a proxy variable for political
competitiveness. Balisacan and Fuwa (2004b) also estimated the contribution of spatial
inequality to overall inequality in per capita expenditure based on FIES data for 1985,
1988, 1991, 1994, 1997 and 2000 and found that inequality among regions accounts for
around 12-15% of overall inequality as measured by the Theil T index.
Built on the Balisacan studies, Mapa, Balisacan, Briones and Albis (2009)
investigated the determinants of provincial income growth for the period from
3 See, for example, Estudillo (1997), Manasan and Mercado (1999), Mercado (2002), Manasan and
Chatterjee (2003), Balisacan and Fuwa (2003, 2004a, 2004b), Mapa, Balisacan and Briones (2006),
Balisacan (2007), Hill, Balisacan and Piza (2007), Manasan (2007), Tecson (2007), Balisacan, Hill and
Piza (2008), Mapa, Balisacan, Briones and Albis (2009), Clausen (2010) and Capuno (2011, 2012).
4
1985-2003. With the addition of the three new explanatory variables (proportion of
young dependents, net in-country migration and spatial neighborhood effects), they
found evidence for conditional -convergence for the study period and that the
proportion of young dependents, net migration, neighborhood effects and a locational
dummy for ARMM provinces have a negative and significant effect on provincial
growth, while expenditure inequality has a positive and significant effect on provincial
growth, though up to a certain level of inequality.
This present study differs from these previous studies on interregional inequality in
the following respects. First, it uses GRDP data for administrative regions over a long
period of time, from 1975 to 2009. Second, it employs the bi-dimensional inequality
decomposition method to analyze changes in the determinants of interregional income
inequality associated with structural changes.
2. Data and Method
2.1. The data
This study measures inequality among administrative regions in the Philippines
from 1975 to 2009 using GRDP by industrial origin at 1985 constant prices taken from
the Regional Accounts of the Philippines compiled by the National Statistical
Coordination Board (NSCB, various issues). In addition, population data from 1975 to
2009 are culled from various issues of the Philippine Statistical Yearbook (NSO,
various issues).
To conduct a decomposition analysis by regional groups, this study divides all
administrative regions into three island regions: Luzon, Visayas, and Mindanao. Luzon
includes NCR, CAR, Ilocos, Cagayan Valley, Central Luzon, Southern Tagalog, and
Bicol; Visayas comprises Western Visayas, Central Visayas, and Eastern Visayas; and
Mindanao consists of Western Mindanao, Northern Mindanao, Southern Mindanao,
Central Mindanao, ARMM, and Caraga.4
On the other hand, to perform a
decomposition analysis by GDP components, this study uses 11 sectors. This is because
the GRDP dataset provides information for 11 industrial sectors: 1) agriculture, fisheries
4 In the dataset, CAR was created in 1987 in Luzon, while ARMM and Caraga were created, respectively,
in 1995 and 1996 in Mindanao. Thus, in Luzon, there were 6 administrative regions before 1987, while in
Mindanao, there were 4 and 5 administrative regions, respectively, before 1995 and before 1996.
5
and forestry, 2) mining and quarrying, 3) manufacturing, 4) construction, 5) electricity,
gas and water, 6) transportation and communication, 7) trade, 8) finance, 9) real estate,
10) private services, and 11) government services.
2.2. Methodology
In order to analyze structural changes and interregional inequality in the Philippines,
this study employs the bi-dimensional decomposition method of the squared
population-weighted coefficient of variation (squared WCV), which was developed by
Akita and Miyata (2010). Its detailed derivation is relegated to the Appendix. Based on
equation (A7) in the Appendix, the bi-dimensional decomposition method is
summarized as:
K
k
k
m
i
K
k
ik CBCW11 1
1 . (1)
where m is the number of island regions and K is the number of industrial sectors.
ikCW is the contribution of the within-region inequality of GRDP component k in
island region i to overall inequality, while kCB is the contribution of the
between-region inequality of GRDP component k to overall inequality.5 Since the
economy consists of 3 island regions (Luzon, Visayas, and Mindanao) and 11 industrial
sectors, there are 33 inequality components in the first term in equation (1) (3 island
regions times 11 industrial sectors), while 11 inequality components in the second term
(11 industrial sectors).
3. Empirical Results
3.1.Trends in Interregional Income Inequality
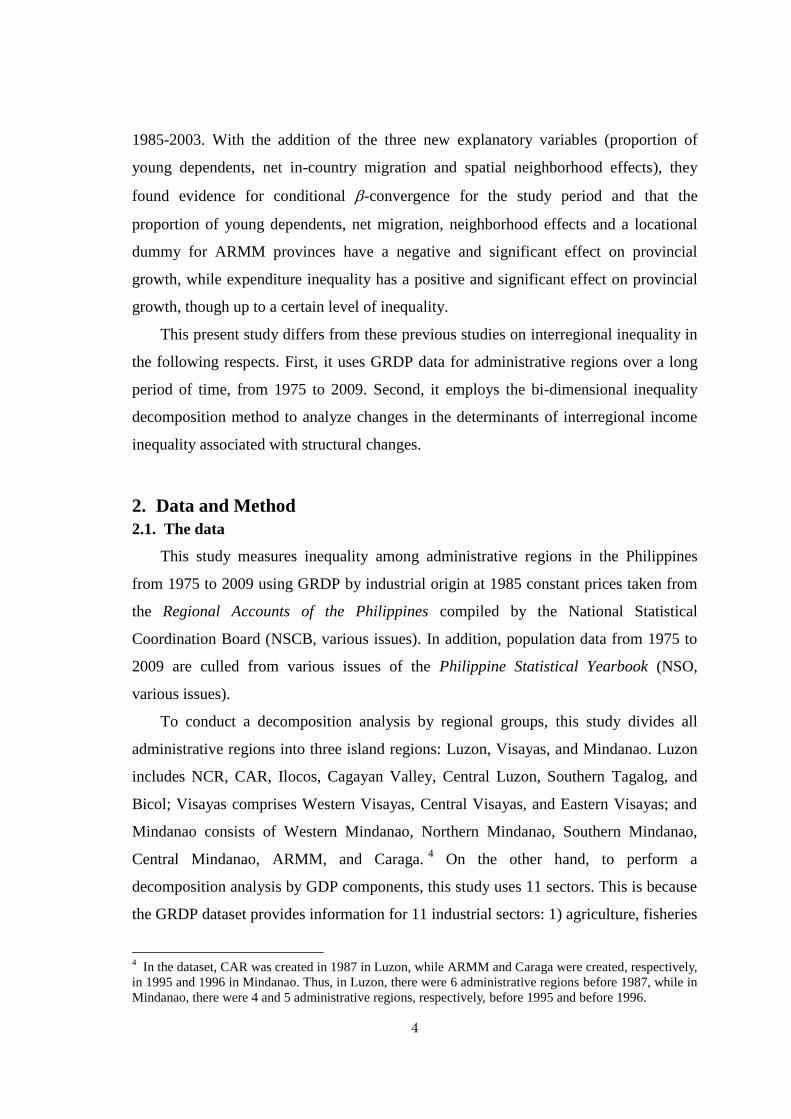
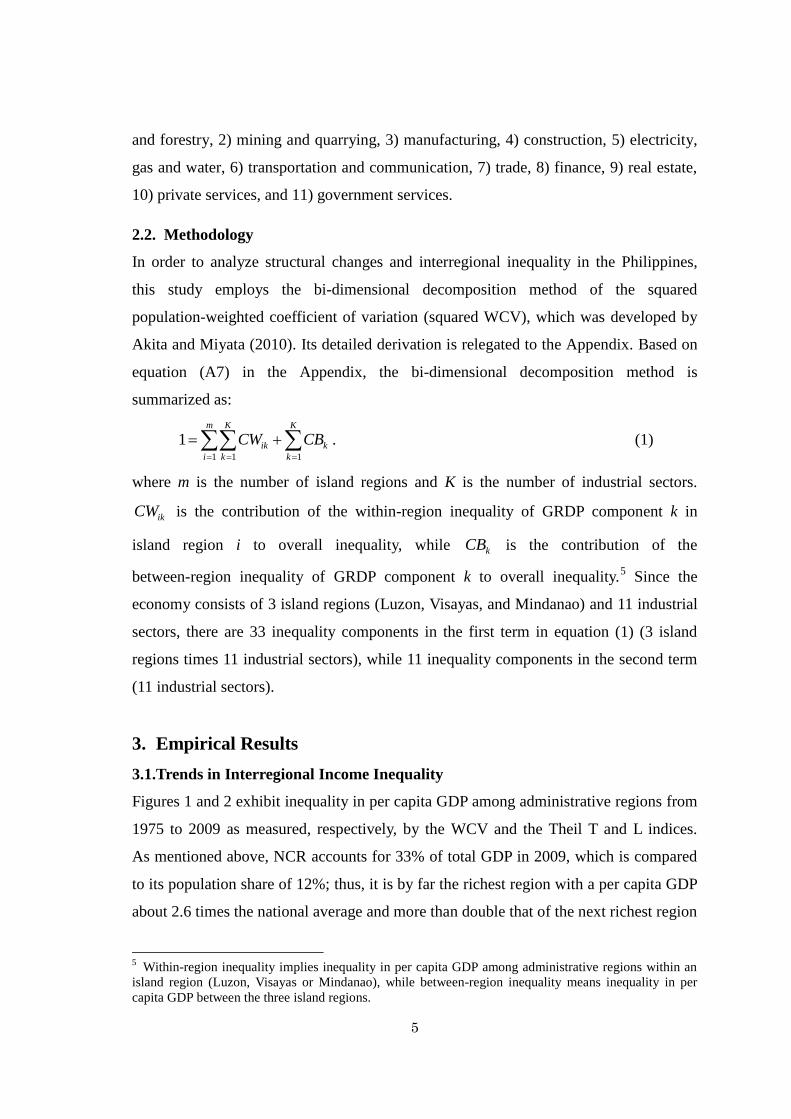
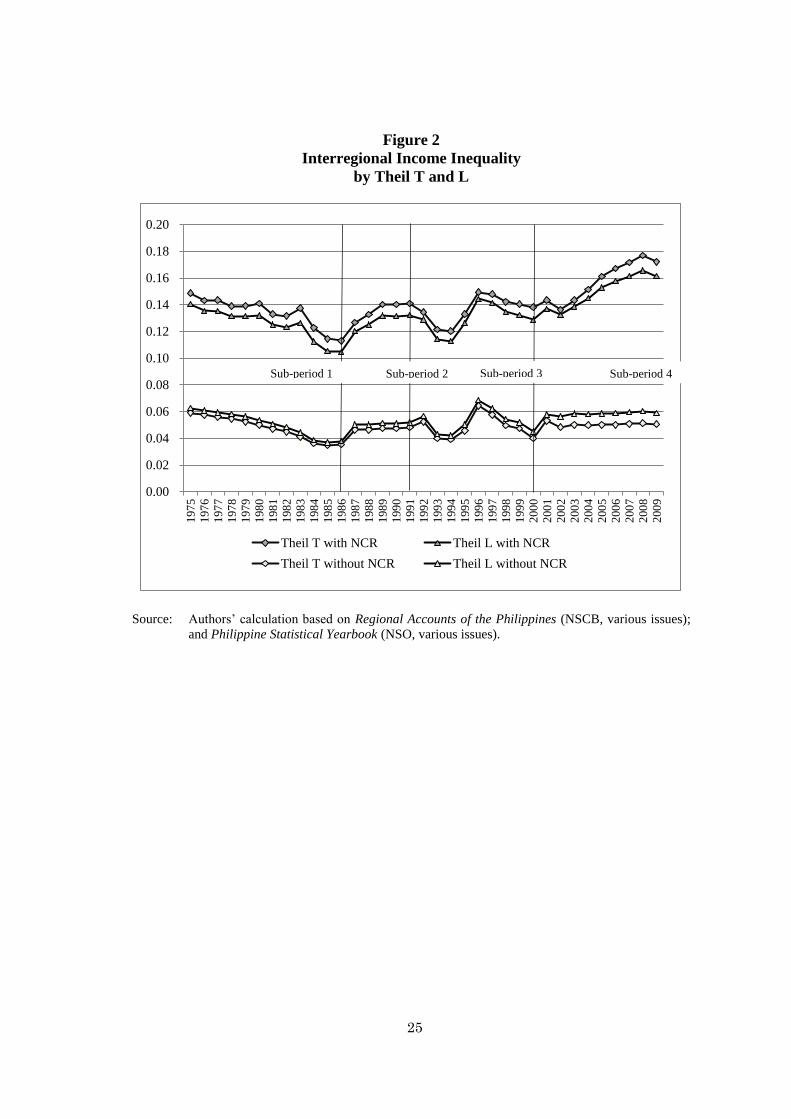
Figures 1 and 2 exhibit inequality in per capita GDP among administrative regions from
1975 to 2009 as measured, respectively, by the WCV and the Theil T and L indices.
As mentioned above, NCR accounts for 33% of total GDP in 2009, which is compared
to its population share of 12%; thus, it is by far the richest region with a per capita GDP
about 2.6 times the national average and more than double that of the next richest region
5 Within-region inequality implies inequality in per capita GDP among administrative regions within an
island region (Luzon, Visayas or Mindanao), while between-region inequality means inequality in per
capita GDP between the three island regions.
6
(CAR). Due to NCR’s huge contribution to the economy, there is a large difference in
inequality between the inclusion and exclusion of NCR. If NCR is excluded from the
data set, the levels of interregional inequality drop substantially.
Recognizing the need for a balanced regional development in the first sub-period
from 1975-1986, the Marcos government had deliberately attempted to address disparity
across regions through agriculture support, land tenancy, institution building,
infrastructure development and industrial dispersal (Mercado, 2002). As a result,
interregional inequality has declined gradually in the first sub-period with or without
NCR, though there are some fluctuations when NCR is included. This sub-period,
however, registered a relatively slow growth at an average annual growth rate of 2.4%
(Table 2). In the second sub-period from 1986-1991, the country has moved away
from dictatorial rule to democracy, paving the way for an improved economic
performance. NCR accelerated its growth at an average rate of 5.3%, which was much
higher than the national average growth rate of 3.8%. In spite of an effort to increase
rural productivity, however, most southern regions have stagnated in comparison with
their northern counterparts. With NCR included, interregional inequality has increased
gradually in the second sub-period.
The third sub-period from 1991-2000 could be further subdivided into two
sub-periods: early stages of decentralization (1991-1996) and the Asian financial crisis
(1997–2000). Enacted in 1991, the Local Government Code (LGC) of the Philippines
placed local governments at the forefront of administrative power. While the first three
years of decentralization experienced a decrease in interregional inequality with or
without NCR, the two succeeding years saw an increase, peaking in 1996 before the
Asian financial crisis struck in 1997. In the crisis period from 1997 to 2000,
interregional inequality dropped slightly with NCR, while substantially without NCR.
Though the impact of the Asian financial crisis in the Philippines was not as severe as in
some of its Asian neighbors, this decrease in inequality is similar to the case of
Indonesia where the crisis sent the economy into contraction as a result of substantial
capital flight and currency devaluation
The economy experienced a relatively high growth at an average annual growth rate
of 4.5% in the fourth sub-period from 2000-2009, which is the highest among the four
sub-periods. Particularly, NCR grew rapidly at 5.0%. With its relatively slow population

7
growth, this made its per capita GDP 2.6 times as large as the national average in 2009,
up from 2.4 in 2000. When NCR is included, this sub-period experienced a significant
increase in interregional inequality; interregional inequality attained the highest in 2008
whether it is measured by the WCV or the Theil indices. However, due in part to
policies of economic integration through increasing regional interconnectivity, the rest
of the country realized relatively balanced regional development; thus, when NCR is
excluded, interregional inequality has been quite stable. Interestingly, a slight decline in
inequality is observed from 2008 to 2009. This occurred at the time of the Global
financial crisis in 2008, which affected the country similar to the Asian financial crisis
of 1997-1999. It should be noted that the difference between the levels of overall
interregional inequality calculated based on GRDP including and excluding NCR has
expanded in the study period. But the expansion occurred mostly in the fourth
sub-period, particularly in the period between 2001 and 2008, during which NCR’s per
capita GDP grew at an average annual rate of 4.7%, which is compared to the national
average growth rate of 3.1%. This shows further spatial agglomeration of economic
activities in NCR under intensifying globalization.
3.2. Bi-dimensional Decomposition of Interregional Inequality by Regional
Groups and GRDP Components
Based on equations (A3), (A9) and (A10) in the Appendix, we first decompose
interregional income inequality into within-region and between-region inequality
components. The results are presented in Tables 4 and 5, which are based on GRDP
including and excluding NCR, respectively. As the results do not qualitatively differ
much whether the Theil indices or the squared WCV is used, we explain the results
based on the squared WCV, hereafter.
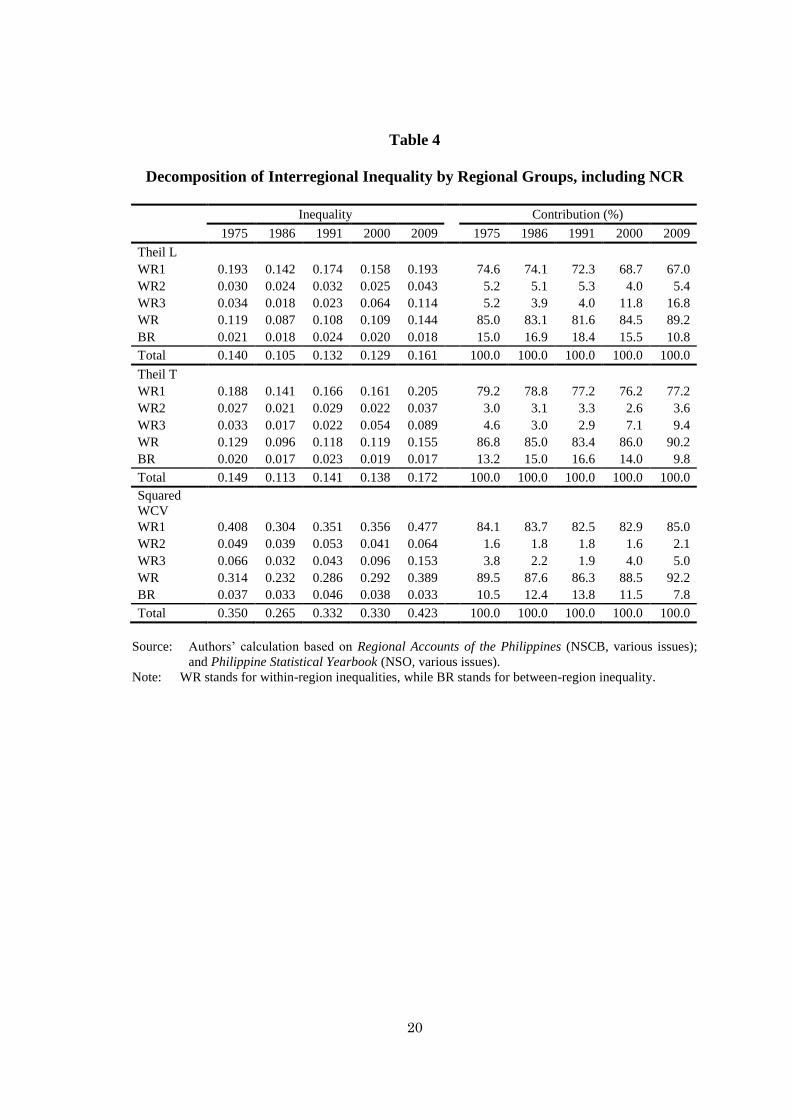
When NCR is included, inequality within Luzon (Island Region 1) accounts for
more than 80% of overall interregional inequality as measured by the squared WCV;
thus, the trend pattern of overall inequality corresponds very closely to that of inequality
within Luzon. Due in part to an increase in inequality within Mindanao (Island Region
3), the contribution of the within-region inequality component (first term in equation
(1)) has risen since the middle of the 1990s when ARMM and Caraga were created.
Conversely, the contribution of the between-region inequality (second term in equation
(1)) has declined. In 2009, the within-region inequality component accounts for 92% of
8
overall interregional inequality. It should be noted that inequality within Visayas (Island
Region 2) has been very low and quite stable in the study period reflecting Visayas’
relatively homogeneous development compared to Luzon and Mindanao; thus its
contribution to overall inequality has been around 1-2% when NCR is included.
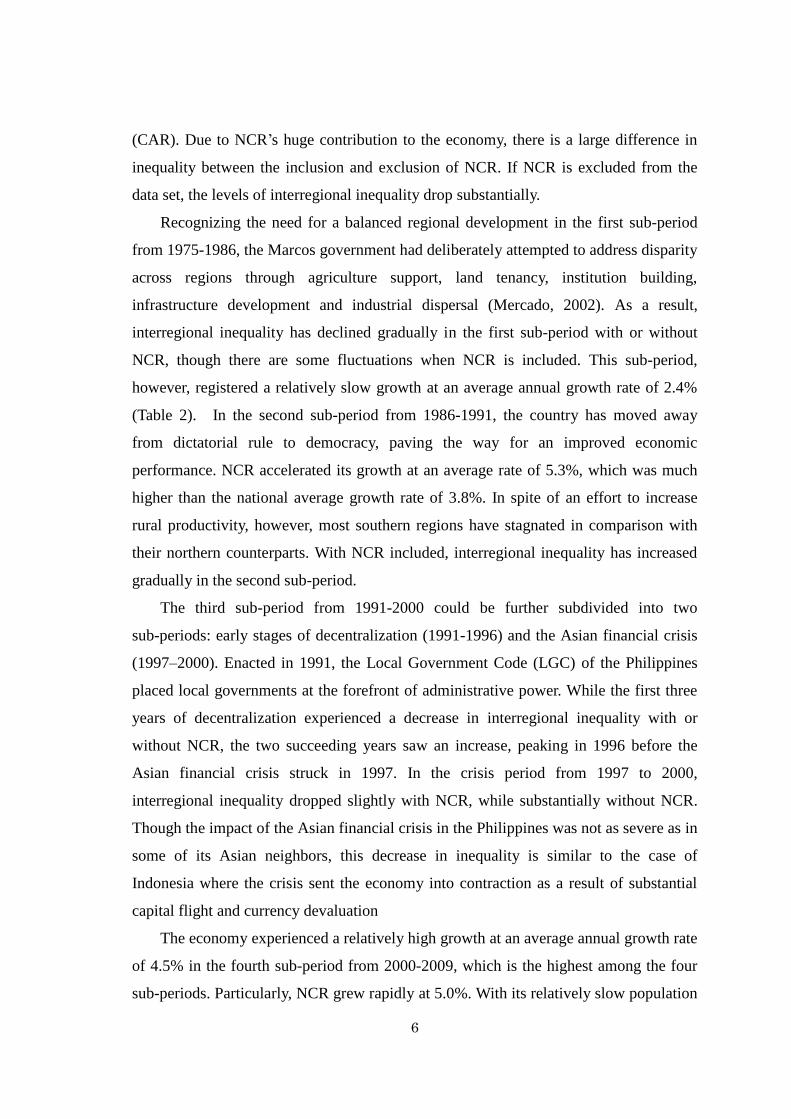
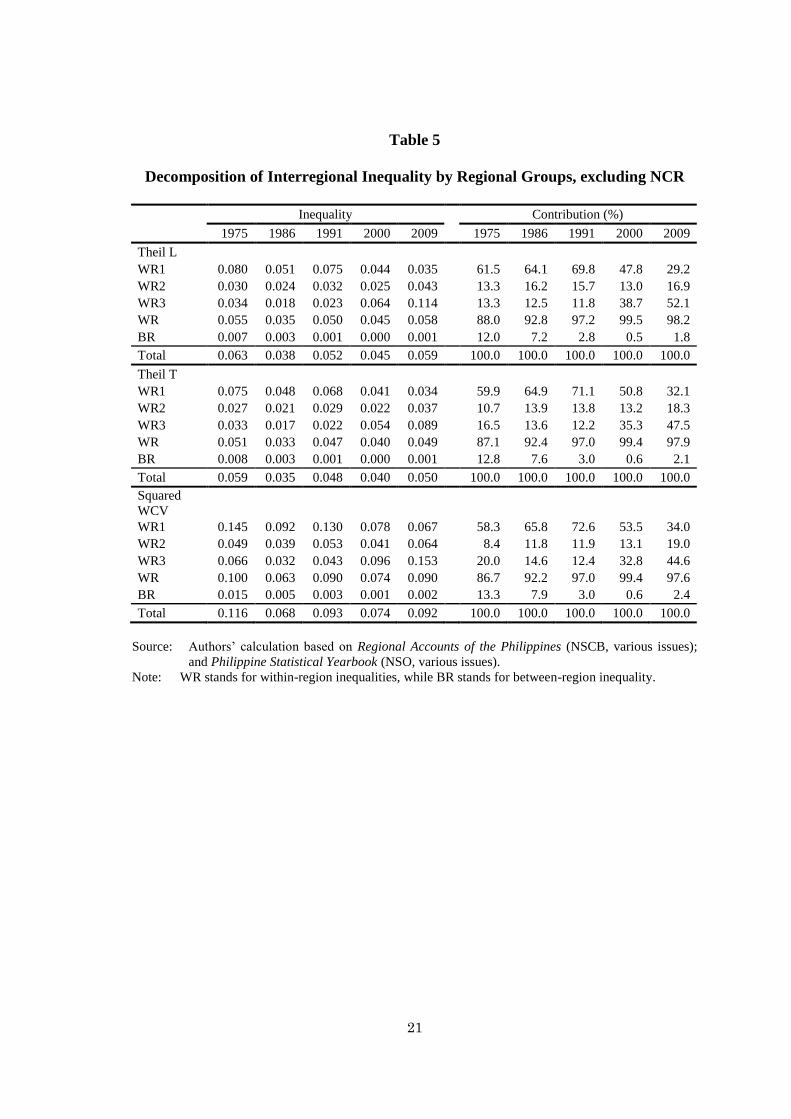
When NCR is excluded, the levels of inequality within Luzon drop substantially.
Since the 1990s, inequality within Luzon has declined gradually; its contribution to
overall inequality has decreased to 34% in 2009 from 73% in 1991. It seems that
without NCR, relatively balanced regional development has been achieved within
Luzon since the Local Government Code was introduced in 1991, at least among
administrative regions (Figure 3). Meanwhile, inequality within Mindanao has increased
and its contribution has risen to 45% in 2009 from merely 12% in 1991. But this is due
in part to the establishment of two poor regions within Mindanao (ARMM and Caraga)
in the middle of 1990s (Figure 3). It should be noted that between-region inequality has
been declining gradually and its contribution to overall inequality amounted to merely
2% in 2009. This indicates that inequality between three island regions is attributable
mostly to the disparity between NCR and other administrative regions.
The results of a bi-dimensional decomposition analysis are presented in Tables 6
and 7, which are based on GRDP including and excluding NCR, respectively. With
NCR included, the contribution of the secondary sector to overall interregional
inequality amounted to 63% in 1975.6 But since then, it has decreased prominently to
35% in 2009, due mainly to a fall in the contribution of manufacturing and construction
in Luzon (Island Region 1), particularly before the Asian financial crisis. Meanwhile,
the tertiary sector has raised its contribution from 46% in 1975 to 75% in 2009, owing
to an increase in the contribution of transportation/communication, finance and private
services in Luzon, particularly after the Asian financial crisis, offsetting a decrease in
the contribution of manufacturing and construction in Luzon. This makes Luzon’s
contribution to overall inequality almost constant at around 83-85% in the study period.
The contribution of between-region inequality has declined to 8% in 2009 from
14% in 1991; this is attributable mainly to a decrease in the contribution of
manufacturing and construction. It should be noted that the primary sector in Luzon
6 The contribution of a sector means the contribution of inequality in the spatial distribution of the
sector’s activities to overall interregional inequality.
9
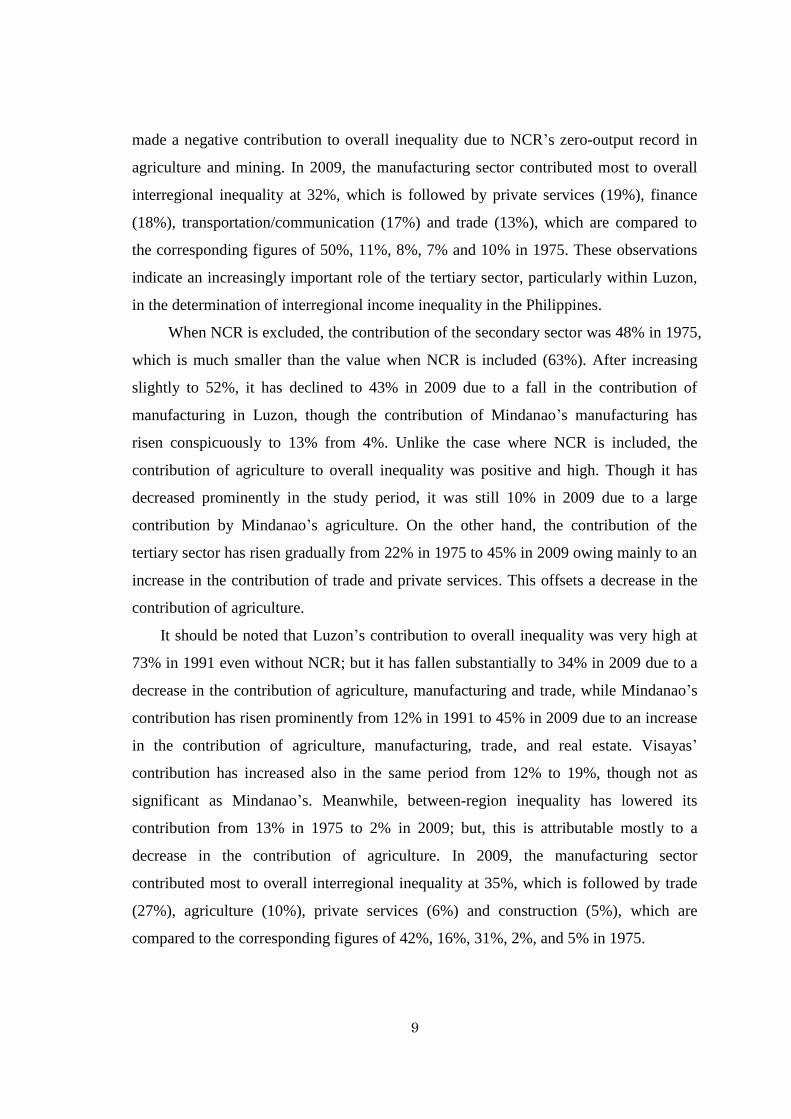
made a negative contribution to overall inequality due to NCR’s zero-output record in
agriculture and mining. In 2009, the manufacturing sector contributed most to overall
interregional inequality at 32%, which is followed by private services (19%), finance
(18%), transportation/communication (17%) and trade (13%), which are compared to
the corresponding figures of 50%, 11%, 8%, 7% and 10% in 1975. These observations
indicate an increasingly important role of the tertiary sector, particularly within Luzon,
in the determination of interregional income inequality in the Philippines.
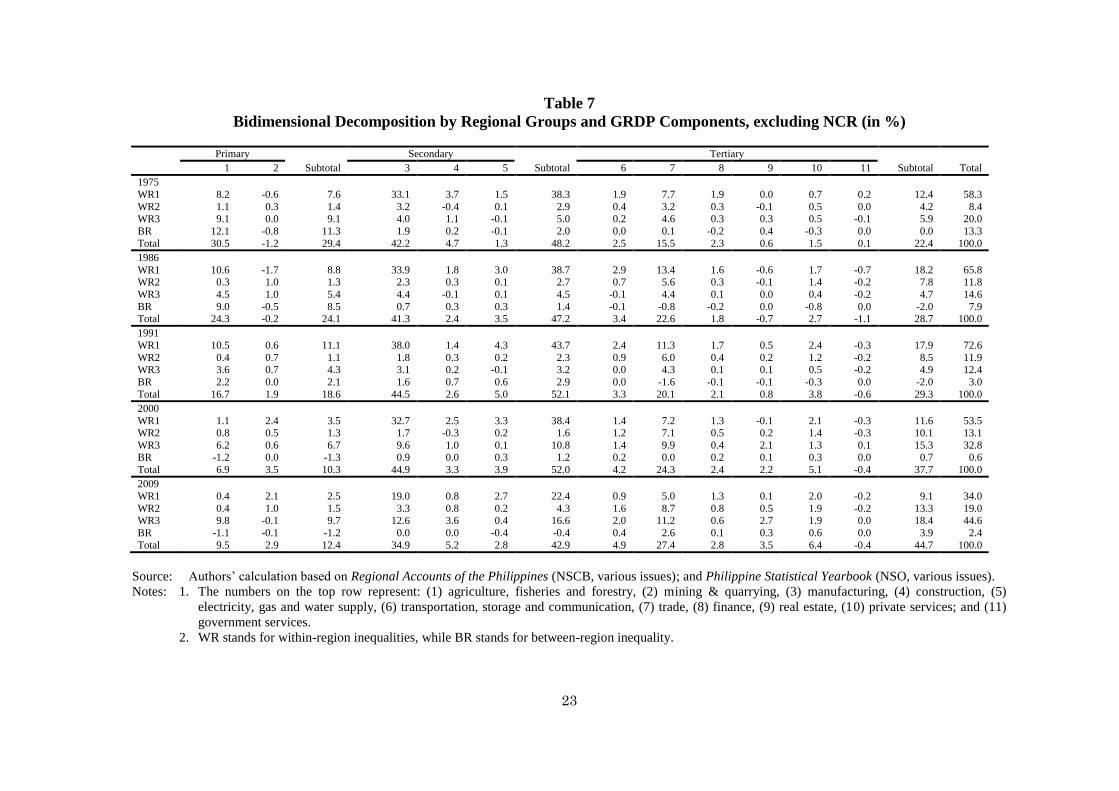
When NCR is excluded, the contribution of the secondary sector was 48% in 1975,
which is much smaller than the value when NCR is included (63%). After increasing
slightly to 52%, it has declined to 43% in 2009 due to a fall in the contribution of
manufacturing in Luzon, though the contribution of Mindanao’s manufacturing has
risen conspicuously to 13% from 4%. Unlike the case where NCR is included, the
contribution of agriculture to overall inequality was positive and high. Though it has
decreased prominently in the study period, it was still 10% in 2009 due to a large
contribution by Mindanao’s agriculture. On the other hand, the contribution of the
tertiary sector has risen gradually from 22% in 1975 to 45% in 2009 owing mainly to an
increase in the contribution of trade and private services. This offsets a decrease in the
contribution of agriculture.
It should be noted that Luzon’s contribution to overall inequality was very high at
73% in 1991 even without NCR; but it has fallen substantially to 34% in 2009 due to a
decrease in the contribution of agriculture, manufacturing and trade, while Mindanao’s
contribution has risen prominently from 12% in 1991 to 45% in 2009 due to an increase
in the contribution of agriculture, manufacturing, trade, and real estate. Visayas’
contribution has increased also in the same period from 12% to 19%, though not as
significant as Mindanao’s. Meanwhile, between-region inequality has lowered its
contribution from 13% in 1975 to 2% in 2009; but, this is attributable mostly to a
decrease in the contribution of agriculture. In 2009, the manufacturing sector
contributed most to overall interregional inequality at 35%, which is followed by trade
(27%), agriculture (10%), private services (6%) and construction (5%), which are
compared to the corresponding figures of 42%, 16%, 31%, 2%, and 5% in 1975.
10
4. Conclusions
This paper has analyzed changes in the determinants of interregional income inequality
associated with changes in the structure of industry and the geographical distribution of
economic activities in the Philippines over the period from 1975-2009. This was
accomplished by using the bi-dimensional decomposition method of the squared
weighted coefficient of variation.
Major findings are summarized as follows. First, when the National Capital Region
of Metropolitan Manila (NCR) is included, inequality within Luzon (Island Region 1)
has been the dominant contributor to overall interregional income inequality. Thus, the
trend pattern of overall inequality corresponds very closely to that of inequality within
Luzon. In the slow growth period from 1975-1986 (the period of Marcos’ authoritarian
rule), overall inequality has declined, while in the high growth period from 2000-2009
(post-Asian financial crisis period), it has increased prominently. These falling and
rising inequalities coincide with Luzon’s inequality trends. When NCR is excluded,
however, Luzon realized relatively balanced regional development, particularly after the
Local Government Code was introduced in 1991.
Second, inequality within Visayas (Island Region 2) has been very low and stable,
reflecting Visayas’ relatively homogeneous development; thus its contribution to overall
inequality has been very small at around 1-2% when NCR is included. Third, since the
establishment of the Autonomous Region in Muslim Mindanao (ARMM) and Caraga in
the middle of the 1990s, inequality within Mindanao (Island Region 3) has risen
prominently. When NCR is excluded, it has overtaken Luzon’s within-region inequality
in around 2000, and its contribution to overall inequality has increased conspicuously.
Fourth, when NCR is included, the tertiary sector has raised its contribution from
46% to 75%, due to an increase in the contribution of Luzon’s
transportation/communication, finance and private services. This offsets a decrease in
the contribution of the secondary sector in Luzon, making Luzon’s contribution to
overall inequality almost constant at around 83-85%. The manufacturing sector has
lowered its contribution; but it was still the largest contributor in 2009 at 32%.
Meanwhile, private services, finance and transportation/communication have emerged
as prominent contributors to overall inequality. Fifth, even if NCR is excluded, the
tertiary sector has raised its contribution, owing mainly to an increase in the
11
contribution of trade and private services. This offsets a decrease in the contribution of
agriculture, though agriculture has maintained a positive and large contribution to
overall inequality. Even if NCR is excluded, the contribution of manufacturing was the
largest at 35% in 2009. Within the tertiary sector, only trade has emerged as a
prominent contributor to overall inequality. As described above, Mindanao’s
contribution has increased conspicuously when NCR is excluded. This is attributable
primarily to an increase in the contribution of agriculture, manufacturing, trade, and real
estate.
As indicated by a huge difference between the levels of overall interregional
inequality calculated based on GRDP including and excluding NCR, one major
determinant of interregional income inequality is the primacy of NCR as the center of
economic activities. With strong urbanization economies under economic liberalization
and globalization, NCR has grown relatively rapidly since the 1990s, with the exception
of the periods of energy crisis and natural disasters of 1991-1992 and the Asian
financial crisis of 1997-1998; and the difference has widened, in which the tertiary
sector, particularly transportation/communication, finance, and private services, has
played an increasingly important role.
The reduction of the disparity between NCR and the rest of Luzon is thus essential
to decreasing Luzon’s high within-region inequality and overall inequality. But this is
not easy to accomplish, since services sectors have enjoyed agglomeration economies
that NCR has nurtured under economic liberalization and globalization.
Decentralization, which started in the early 1990s, has been one way to ameliorate the
disparity, but its effects are ambiguous. Another option would be to relocate some
manufacturing activities to areas outside NCR where they could enjoy localization
economies. Government policies should be designed to provide an environment that is
conducive to such relocation.
ARMM in Mindanao is the poorest in the Philippines and its per capita GRDP is
merely 23% of the national average in 2009, which is less than a half of the per capita
GRDP of the next poorest in Mindanao, i.e., Caraga. Agriculture dominates its economy
by accounting for about 60% of its total GRDP, while the GRDP share of
manufacturing amounts to only 5%. To reduce inequality within Mindanao, another
major determinant of interregional inequality in the Philippines, it is thus imperative to
12
raise the productivity of ARMM’s agriculture and fishery and promote labor-intensive
food processing manufacturing activities.
References
Akita, T. and Miyata, S. 2010. The Bi-dimensional Decomposition of Regional
Inequality based on The Weighted Coefficient of Variation. Letters on Spatial
Resource Science 3(3), 91-100.
Akita, T., Kurniawan, P.A. and Miyata, S. 2011. Structural Changes and Regional
Incime Inequality in Indonesia: A Bi-dimensional Decomposition Analysis. Asian
Economic Journal 25(1), 55-77.
Anand, S. 1983. Inequality and Poverty in Malaysia: Measurement and Decomposition.
World Bank Research Publication, Oxford University Press, New York.
Balisacan, A. M. 2007. Local Growth and Poverty Reduction. In Balisacan, A. M. and
Hill, H. (eds), The Dynamics of Regional Development: The Philippines in East
Asia. Edward Elgar Publishing, Inc, Cheltenham, UK.
Balisacan, A. M. and Fuwa, N. 2003. Growth, Inequality and Politics Revisited: A
Developing-country Case. Economics Letters 79(1), 53–58.
Balisacan, A. M. and Fuwa, N. 2004a. Going beyond Crosscountry Averages: Growth,
Inequality and Poverty Reduction in the Philippines. World Development 32(11),
1891-1907.
Balisacan, A. M. and Fuwa, N. 2004b. Changes in Spatial Income Inequality in the
Philippines: An Exploratory Analysis. Research Paper 2004/34, WIDER, United
Nations University, .
Balisacan, A. M., Hill, H. and Piza, S. F. A. 2008. Regional Development Dynamics
and Decentralization in the Philippines. ASEAN Economic Bulletin 25(3), 293-315.
Barro, R. J. and Sala-i-Martin, X. 1992. Convergence. Journal of Political Economy
100(2), 223-251.
Barro, R. J. and Sala-i-Martin, X. 1995. Economic Growth. McGraw Hill, New York.
Capuno, J. J. 2011. Incumbents and Innovations under Decentralization: An Empirical
Exploration of Selected Local Governments in the Philippines. Asian Journal of
Political Science 19(1), 48-73.
Capuno, J. J. 2012. Agglomeration and Sub-regional Disparities under Decentralization:
Evidence of Spatial Clustering of Land Values in the Philippines. Review of Urban
and Regional Development Studies 24(3) 106-120.
Clausen, A. 2010. Economic Globalization and Regional Disparities in the Philippines.
Singapore Journal of Tropical Geography 31, 299–316.
13
Estudillo, J. P. 1997. Income Inequality in the Philippines, 1961–91. Developing
Economies 35(1), 68–95.
Fields, G. S. 2001. Distribution and Development. MIT Press, Cambridge, MA.
Hill, H., Balisacan, A. M., and Piza, S. F. A. 2007. The Philippines and Regional
Development. In Balisacan, A. M. and Hill, H. (eds), The Dynamics of Regional
Development: The Philippines in East Asia. Edward Elgar Publishing, Inc,
Cheltenham, UK.
Manasan, R. G. 2007. Decentralization and the Financing of Regional Development. In
Balisacan, A. M. and Hill, H. (eds), The Dynamics of Regional Development: The
Philippines in East Asia. Edward Elgar Publishing, Inc, Cheltenham, UK.
Manasan, R.G. and Chatterjee, S. 2003. Regional Development. In Balisacan, A., and
Hill, H. (eds.), The Philippine Economy: Development, Policies and Challenges.
Ateneo de Manila University Press, Quezon City, Philippines.
Manasan, R. G. and Mercado, R. 1999. Regional Economic Growth and Convergence in
the Philippines: 1975-1997. Discussion Paper Series 1999-13, Philippine Institute
of Development Studies, Manila.
Mapa, D. S., Balisacan, A.M. and Briones, K. J. S. 2006. Robust Determinants of
Income Growth in the Philippines. Philippine Journal of Development 33(1/2),
1-32.
Mapa, D. S., Balisacan, A. M., Briones, K. J. S. and Albis, M. L. F. 2009. What Really
Matters for Income Growth in the Philippines: Empirical Evidence from Provincial
Data. UPSS Working Paper Series 2009-01, School of Statistics, University of the
Philippines, Diliman.
Mercado, R. 2002. Regional Development in the Philippines: A Review of Experience,
State of the Art and Agenda for Research and Action. Discussion Paper Series No.
2002-03, Philippine Institute of Development Studies, Manila.
NSCB (National Statistical Coordination Board). various issues. Regional Accounts of
the Philippines. National Statistical Coordination Board, Manila.
NSO (National Statistics Office). various issues. Philippine Statistical Yearbook.
National Statistics Office, Manila.
Shorrocks, A. and Wan, G. 2005. Spatial Decomposition of Inequality. Journal of
Economic Geography 5(1), 59–81.
Tecson, G. R. 2007. Regional Response to Trade Liberalization and Economic
Decentralization. In Balisacan, A. M. and Hill, H. (eds), The Dynamics of Regional
Development: The Philippines in East Asia. Edward Elgar Publishing, Inc,
Cheltenham, UK.
Williamson, J. G. 1965. Regional Inequality and the Process of National Development:
A Description of the Patterns. Economic Development and Cultural Change 13(4),
3–45.
14
Appendix: Bi-dimensional Decomposition Method of the Squared
WCV
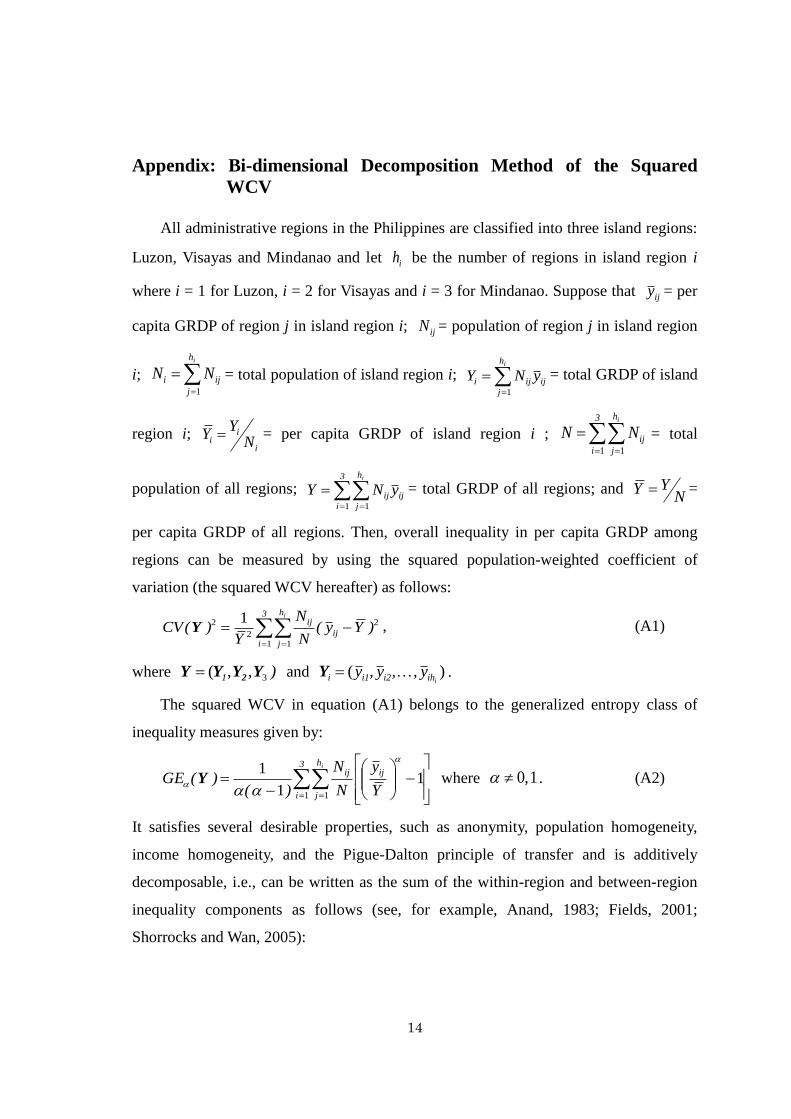
All administrative regions in the Philippines are classified into three island regions:
Luzon, Visayas and Mindanao and let ih be the number of regions in island region i
where i = 1 for Luzon, i = 2 for Visayas and i = 3 for Mindanao. Suppose that ijy = per
capita GRDP of region j in island region i; ijN = population of region j in island region
i;
ih
j
iji NN1
= total population of island region i;
ih
j
ijiji yNY1
= total GRDP of island
region i; i
ii N
YY = per capita GRDP of island region i ;
3
i
h
j
ij
i
NN1 1
= total
population of all regions;
3
i
h
j
ijij
i
yNY1 1
= total GRDP of all regions; and N
YY =
per capita GRDP of all regions. Then, overall inequality in per capita GRDP among
regions can be measured by using the squared population-weighted coefficient of
variation (the squared WCV hereafter) as follows:
3
i
h
j
ij
iji
)Yy(N
N
Y)(CV
1 1
2
2
2 1Y , (A1)
where )1 3,,( YYYY 2 and ) (iihi2i1i y,,y,y Y .
The squared WCV in equation (A1) belongs to the generalized entropy class of
inequality measures given by:
3
i
h
j
ijiji
Y
y
N
N
)()(GE
1 1
11
1
Y where 1 ,0 . (A2)
It satisfies several desirable properties, such as anonymity, population homogeneity,
income homogeneity, and the Pigue-Dalton principle of transfer and is additively
decomposable, i.e., can be written as the sum of the within-region and between-region
inequality components as follows (see, for example, Anand, 1983; Fields, 2001;
Shorrocks and Wan, 2005):
15
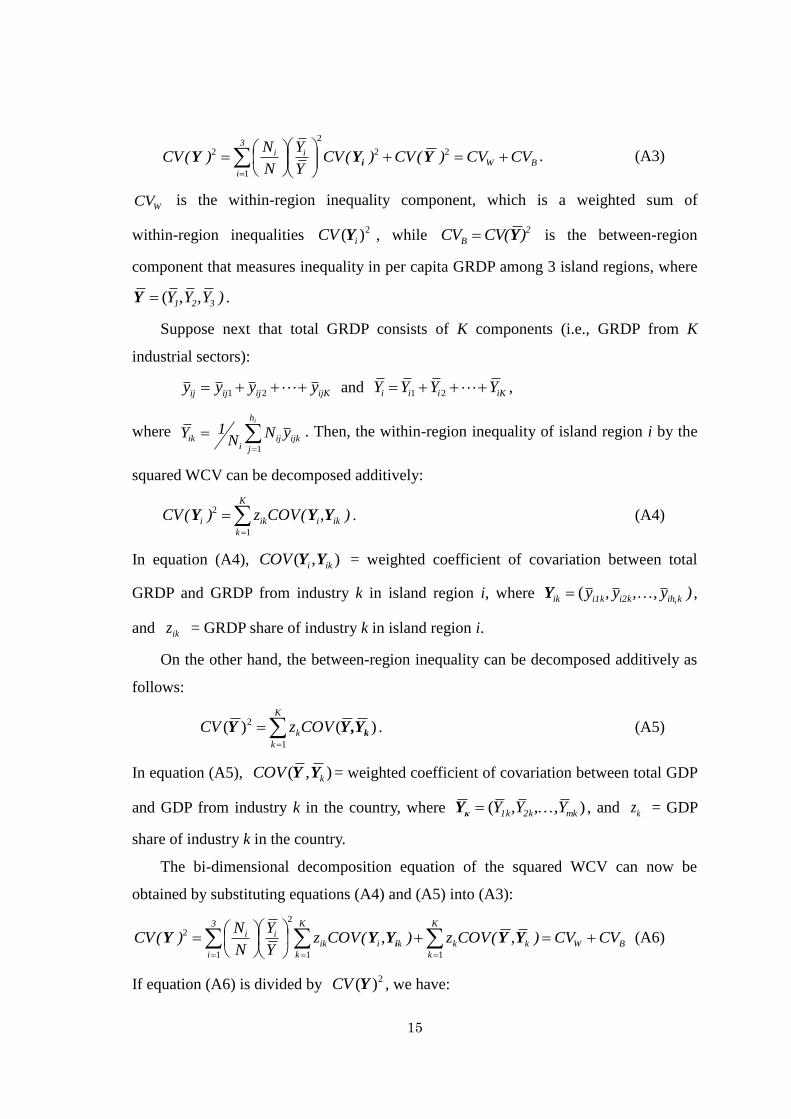
BWi
3
i
i CVCV)(CV)(CVY
Y
N
N)(CV
22
2
1
2YYY i
. (A3)
WCV is the within-region inequality component, which is a weighted sum of
within-region inequalities 2)( iCV Y , while
2
B )CV(CV Y is the between-region
component that measures inequality in per capita GRDP among 3 island regions, where
)Y,Y,Y 321 (Y .
Suppose next that total GRDP consists of K components (i.e., GRDP from K
industrial sectors):
ijKijijij yyyy 21 and iKiii YYYY 21 ,
where
ih
j
ijkiji
ik yNN
1Y1
. Then, the within-region inequality of island region i by the
squared WCV can be decomposed additively:
K
k
ikiiki ),(COVz)(CV1
2YYY . (A4)
In equation (A4), ),( ikiCOV YY = weighted coefficient of covariation between total
GRDP and GRDP from industry k in island region i, where )y,,y,y kihi2ki1kik i ( Y ,
and ikz = GRDP share of industry k in island region i.
On the other hand, the between-region inequality can be decomposed additively as
follows:
K
k
kCOVzCV1
2 )()( kY,YY . (A5)
In equation (A5), ),( kCOV YY = weighted coefficient of covariation between total GDP
and GDP from industry k in the country, where )( mk2k1k Y,,Y,Y κY , and kz = GDP
share of industry k in the country.
The bi-dimensional decomposition equation of the squared WCV can now be
obtained by substituting equations (A4) and (A5) into (A3):
BW
K
k
kk
K
k
kiiki
3
i
i CVCV)(COVz)(COVzY
Y
N
N)(CV
11
2
1
2 ,, YYYYY i (A6)
If equation (A6) is divided by 2)(YCV , we have:
16
K
k
kk
K
k
ikiki
3
i
i szszY
Y
N
N
11
2
1
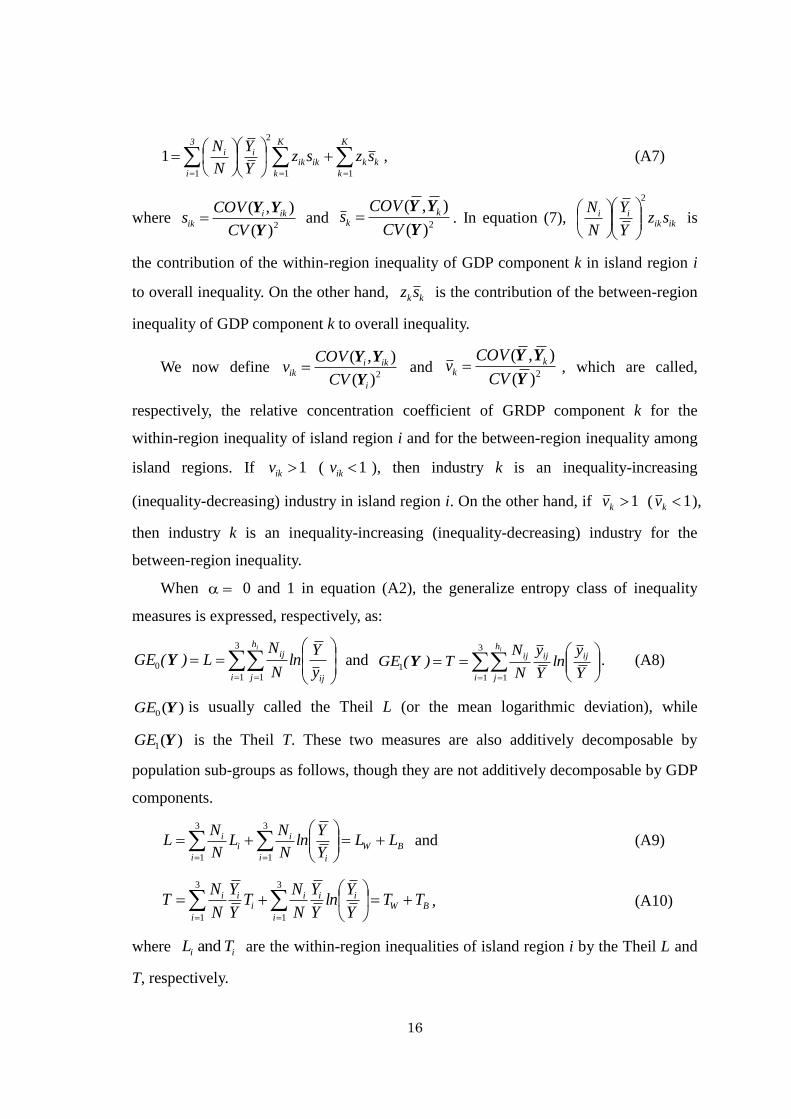
1 , (A7)
where 2)(
),(
Y
YY
CV
COVs iki
ik and 2)(
),(
Y
YY
CV
COVs k
k . In equation (7), ikikii sz
Y
Y
N
N2
is
the contribution of the within-region inequality of GDP component k in island region i
to overall inequality. On the other hand, kksz is the contribution of the between-region
inequality of GDP component k to overall inequality.
We now define 2)(
),(
i
ikiik
CV
COVv
Y
YY and
2)(
),(
Y
YY
CV
COVv k
k , which are called,
respectively, the relative concentration coefficient of GRDP component k for the
within-region inequality of island region i and for the between-region inequality among
island regions. If 1ikv ( 1ikv ), then industry k is an inequality-increasing
(inequality-decreasing) industry in island region i. On the other hand, if 1kv ( 1kv ),
then industry k is an inequality-increasing (inequality-decreasing) industry for the
between-region inequality.
When 0 and 1 in equation (A2), the generalize entropy class of inequality
measures is expressed, respectively, as:
3
1 1
0
i
h
j ij
iji
y
Yln
N
NL)(GE Y and
3
1 1
1
i
h
j
ijijiji
Y
yln
Y
y
N
NT)(GE Y . (A8)
)(0 YGE is usually called the Theil L (or the mean logarithmic deviation), while
)(1 YGE is the Theil T. These two measures are also additively decomposable by
population sub-groups as follows, though they are not additively decomposable by GDP
components.
BW
i i
i
i
ii LL
Y
Yln
N
NL
N
NL
3
1
3
1
and (A9)
BW
i
iii
i
iii TT
Y
Yln
Y
Y
N
NT
Y
Y
N
NT
3
1
3
1
, (A10)
where ii TL and are the within-region inequalities of island region i by the Theil L and
T, respectively.
17
Table 1
Share of Each Industry to National GDP (in %)
Primary Secondary Tertiary
1 2 Subtotal 3 4 5 Subtotal 6 7 8 9 10 11 Subtotal
1975 24.7 1.3 26.0 28.3 7.0 1.8 37.1 4.8 12.5 3.3 6.5 5.2 4.7 37.0
1986 24.6 2.1 26.7 24.8 4.8 3.0 32.6 5.6 14.7 3.1 5.6 6.8 4.9 40.7
1991 22.7 1.5 24.2 25.6 4.9 2.7 33.2 5.8 15.1 4.1 5.6 6.9 5.2 42.6
2000 20.0 1.1 21.1 24.8 5.1 3.4 33.3 7.1 16.0 4.9 5.1 7.4 5.1 45.6
2009 18.1 2.0 20.1 22.0 5.0 3.1 30.1 8.8 16.7 6.2 4.7 9.1 4.3 49.8
Source: Authors’ calculation based on Regional Accounts of the Philippines (NSCB, various issues).
Notes: The numbers on the top row represent: (1) agriculture, fisheries and forestry; (2) mining and
quarrying; (3) manufacturing; (4) construction; (5) electricity, gas and water; (6) transportation
and communication; (7) trade; (8) finance; (9) real estate; (10) private services; and (11)
government services.
18
Table 2
Regional Structure and Growth
(in %)
Share Growth
1975 1986 1991 2000 2009
1975-86 1986-91 1991-00 2000-09 1975-09
Population
Luzon 54.2 54.5 54.9 56.0 56.0
2.6 2.6 2.4 2.0 2.4
NCR 11.8 12.8 13.0 13.0 12.4
3.3 2.8 2.2 1.5 2.4
CAR
1.9 1.8 1.8
1.7 2.1 1.9
Ilocos 7.8 7.0 5.7 5.5 5.5
1.6 -1.7 1.8 2.1 1.3
Cagayan Valley 4.6 4.6 4.0 3.7 3.6
2.6 -0.3 1.2 1.8 1.6
Central Luzon 10.0 10.0 10.0 10.5 10.8
2.5 2.5 2.8 2.3 2.5
Southern Tagalog 12.4 13.1 13.2 15.5 15.8
3.0 2.7 4.0 2.3 3.0
Bicol 7.6 7.0 7.1 6.1 6.1
1.8 2.8 0.5 2.0 1.7
Visayas 24.1 22.6 22.1 20.3 20.3
1.9 2.1 1.3 2.0 1.8
Western Visayas 9.9 9.2 9.2 8.1 8.1
1.9 2.4 0.8 2.0 1.7
Central Visayas 8.1 7.7 7.5 7.5 7.5
2.1 1.9 2.2 2.1 2.1
Eastern Visayas 6.2 5.7 5.4 4.7 4.7
1.7 1.7 0.6 2.1 1.5
Mindanao 21.7 23.0 22.9 23.7 23.8
3.0 2.4 2.6 2.1 2.6
Western Mindanao 4.9 5.2 5.2 4.0 3.7
3.1 2.5 -0.6 1.1 1.5
Northern Mindanao 5.5 5.9 5.9 3.6 4.6
3.2 2.4 -3.3 4.8 1.8
Southern Mindanao 6.5 7.3 7.1 6.8 4.7
3.6 1.8 1.8 -2.2 1.3
Central Mindanao 4.9 4.6 4.8 3.4 4.3
1.8 3.5 -1.6 4.7 1.9
ARMM
3.2 3.8
4.0 4.0
Caraga
2.7 2.7
1.9 1.9
Total 100.0 100.0 100.0 100.0 100.0
2.5 2.5 2.2 2.0 2.3
GDP (in 1985 prices)
Luzon 62.5 63.0 65.5 65.7 64.9
2.5 4.6 3.2 4.4 3.5
NCR 29.0 28.6 30.8 31.1 32.5
2.3 5.3 3.3 5.0 3.7
CAR
2.0 2.3 2.2
5.1 3.9 4.5
Ilocos 4.0 4.6 3.0 3.2 2.8
3.6 -4.4 3.8 3.3 2.4
Cagayan Valley 2.9 2.6 2.1 2.3 2.0
1.7 -1.3 4.3 2.9 2.3
Central Luzon 9.1 9.3 9.3 8.9 8.1
2.6 3.8 2.8 3.5 3.0
Southern Tagalog 14.6 14.6 15.3 15.2 14.3
2.4 4.8 3.1 3.8 3.3
Bicol 3.0 3.3 3.0 2.7 3.0
3.2 2.1 2.0 5.6 3.3
Visayas 16.5 16.5 16.0 16.2 16.9
2.3 3.3 3.3 4.9 3.4
Western Visayas 7.7 7.4 7.0 7.0 7.6
1.9 2.9 3.2 5.4 3.3
Central Visayas 6.1 6.4 6.6 6.8 7.1
2.7 4.4 3.6 5.0 3.8
Eastern Visayas 2.6 2.7 2.4 2.4 2.1
2.6 1.6 3.1 3.2 2.7
Mindanao 20.9 20.5 18.5 18.1 18.2
2.2 1.8 3.0 4.6 3.0
Western Mindanao 3.2 3.2 2.9 2.8 2.7
2.6 1.6 2.9 3.9 2.9
Northern Mindanao 5.6 5.6 5.2 3.8 5.1
2.4 2.2 -0.2 7.7 3.1
Southern Mindanao 8.3 7.7 7.0 6.3 4.7
1.7 2.0 2.0 1.2 1.7
Central Mindanao 3.8 4.0 3.4 2.7 3.5
2.7 0.7 0.6 7.5 3.1
ARMM
1.0 0.9
3.3 3.3
Caraga
1.5 1.3
3.1 3.1
Total 100.0 100.0 100.0 100.0 100.0
2.4 3.8 3.2 4.5 3.4
Source: Authors’ calculation based on Regional Accounts of the Philippines (NSCB, various issues);
and Philippine Statistical Yearbook (NSO, various issues).
19
Table 3
Per Capita GDP Growth
(in %)
Per Capita GDP (Philippines = 100) Growth
1975 1986 1991 2000 2009
1975-86 1986-91 1991-00 2000-09 1975-09
Luzon 115 116 119 117 116
-0.1 2.0 0.8 2.4 1.1
NCR 246 224 237 239 263
-1.0 2.5 1.1 3.5 1.3
CAR
105 131 122
3.4 1.7 2.6
Ilocos 52 65 53 58 52
2.0 -2.8 2.0 1.2 1.1
Cagayan Valley 62 57 51 62 55
-0.9 -1.0 3.0 1.2 0.7
Central Luzon 91 93 93 85 75
0.1 1.3 0.0 1.1 0.5
Southern Tagalog 118 112 116 98 90
-0.6 2.1 -0.9 1.5 0.3
Bicol 40 47 43 44 49
1.4 -0.7 1.5 3.6 1.7
Visayas 69 73 72 80 83
0.4 1.2 2.1 2.9 1.6
Western Visayas 79 80 76 87 95
0.0 0.5 2.3 3.5 1.6
Central Visayas 76 83 88 91 95
0.6 2.5 1.4 2.9 1.7
Eastern Visayas 43 48 45 51 45
0.9 -0.1 2.4 1.1 1.2
Mindanao 96 89 81 76 77
-0.8 -0.7 0.4 2.5 0.4
Western Mindanao 65 62 56 70 72
-0.5 -0.8 3.5 2.8 1.4
Northern Mindanao 102 95 88 106 111
-0.8 -0.2 3.1 2.9 1.3
Southern Mindanao 129 105 99 93 101
-2.0 0.2 0.2 3.4 0.4
Central Mindanao 78 87 71 79 82
0.9 -2.7 2.1 2.8 1.2
ARMM
30 23
-0.6 -0.6
Caraga
55 49
1.2 1.2
Total 100 100 100 100 100
-0.1 1.4 1.0 2.5 1.1
Source: Authors’ calculation based on Regional Accounts of the Philippines (NSCB, various issues);
and Philippine Statistical Yearbook (NSO, various issues).
20
Table 4
Decomposition of Interregional Inequality by Regional Groups, including NCR
Inequality Contribution (%)
1975 1986 1991 2000 2009
1975 1986 1991 2000 2009
Theil L
WR1 0.193 0.142 0.174 0.158 0.193
74.6 74.1 72.3 68.7 67.0
WR2 0.030 0.024 0.032 0.025 0.043
5.2 5.1 5.3 4.0 5.4
WR3 0.034 0.018 0.023 0.064 0.114
5.2 3.9 4.0 11.8 16.8
WR 0.119 0.087 0.108 0.109 0.144
85.0 83.1 81.6 84.5 89.2
BR 0.021 0.018 0.024 0.020 0.018
15.0 16.9 18.4 15.5 10.8
Total 0.140 0.105 0.132 0.129 0.161
100.0 100.0 100.0 100.0 100.0
Theil T
WR1 0.188 0.141 0.166 0.161 0.205
79.2 78.8 77.2 76.2 77.2
WR2 0.027 0.021 0.029 0.022 0.037
3.0 3.1 3.3 2.6 3.6
WR3 0.033 0.017 0.022 0.054 0.089
4.6 3.0 2.9 7.1 9.4
WR 0.129 0.096 0.118 0.119 0.155
86.8 85.0 83.4 86.0 90.2
BR 0.020 0.017 0.023 0.019 0.017
13.2 15.0 16.6 14.0 9.8
Total 0.149 0.113 0.141 0.138 0.172
100.0 100.0 100.0 100.0 100.0
Squared
WCV
WR1 0.408 0.304 0.351 0.356 0.477
84.1 83.7 82.5 82.9 85.0
WR2 0.049 0.039 0.053 0.041 0.064
1.6 1.8 1.8 1.6 2.1
WR3 0.066 0.032 0.043 0.096 0.153
3.8 2.2 1.9 4.0 5.0
WR 0.314 0.232 0.286 0.292 0.389
89.5 87.6 86.3 88.5 92.2
BR 0.037 0.033 0.046 0.038 0.033
10.5 12.4 13.8 11.5 7.8
Total 0.350 0.265 0.332 0.330 0.423
100.0 100.0 100.0 100.0 100.0
Source: Authors’ calculation based on Regional Accounts of the Philippines (NSCB, various issues);
and Philippine Statistical Yearbook (NSO, various issues).
Note: WR stands for within-region inequalities, while BR stands for between-region inequality.
21
Table 5
Decomposition of Interregional Inequality by Regional Groups, excluding NCR
Inequality Contribution (%)
1975 1986 1991 2000 2009
1975 1986 1991 2000 2009
Theil L
WR1 0.080 0.051 0.075 0.044 0.035
61.5 64.1 69.8 47.8 29.2
WR2 0.030 0.024 0.032 0.025 0.043
13.3 16.2 15.7 13.0 16.9
WR3 0.034 0.018 0.023 0.064 0.114
13.3 12.5 11.8 38.7 52.1
WR 0.055 0.035 0.050 0.045 0.058
88.0 92.8 97.2 99.5 98.2
BR 0.007 0.003 0.001 0.000 0.001
12.0 7.2 2.8 0.5 1.8
Total 0.063 0.038 0.052 0.045 0.059
100.0 100.0 100.0 100.0 100.0
Theil T
WR1 0.075 0.048 0.068 0.041 0.034
59.9 64.9 71.1 50.8 32.1
WR2 0.027 0.021 0.029 0.022 0.037
10.7 13.9 13.8 13.2 18.3
WR3 0.033 0.017 0.022 0.054 0.089
16.5 13.6 12.2 35.3 47.5
WR 0.051 0.033 0.047 0.040 0.049
87.1 92.4 97.0 99.4 97.9
BR 0.008 0.003 0.001 0.000 0.001
12.8 7.6 3.0 0.6 2.1
Total 0.059 0.035 0.048 0.040 0.050
100.0 100.0 100.0 100.0 100.0
Squared
WCV
WR1 0.145 0.092 0.130 0.078 0.067
58.3 65.8 72.6 53.5 34.0
WR2 0.049 0.039 0.053 0.041 0.064
8.4 11.8 11.9 13.1 19.0
WR3 0.066 0.032 0.043 0.096 0.153
20.0 14.6 12.4 32.8 44.6
WR 0.100 0.063 0.090 0.074 0.090
86.7 92.2 97.0 99.4 97.6
BR 0.015 0.005 0.003 0.001 0.002
13.3 7.9 3.0 0.6 2.4
Total 0.116 0.068 0.093 0.074 0.092
100.0 100.0 100.0 100.0 100.0
Source: Authors’ calculation based on Regional Accounts of the Philippines (NSCB, various issues);
and Philippine Statistical Yearbook (NSO, various issues).
Note: WR stands for within-region inequalities, while BR stands for between-region inequality.

Table 6
Bidimensional Decomposition by Regional Groups and GRDP Components, including NCR (in%)
Primary
Secondary
Tertiary
1 2 Subtotal 3 4 5 Subtotal 6 7 8 9 10 11 Subtotal Total
1975
WR1 -9.1 -0.9 -10.0 43.2 8.5 2.0 53.8 6.5 8.5 7.0 0.2 9.7 8.5% 40.3 84.1
WR2 0.2 0.1 0.3 0.6 -0.1 0.0 0.5 0.1 0.6 0.1 0.0 0.1 0.0% 0.8 1.6
WR3 1.7 0.0 1.7 0.8 0.2 0.0 1.0 0.0 0.9 0.1 0.1 0.1 0.0% 1.1 3.8 BR -0.8 -0.1 -0.9 5.5 1.4 0.6 7.5 0.8 0.0 0.9 0.0 1.1 1.1% 3.9 10.5
Total -8.0 -0.9 -8.9 50.1 10.1 2.6 62.8 7.3 10.0 8.0 0.3 11.0 9.5% 46.1 100.0
1986
WR1 -11.9 -1.8 -13.6 37.9 5.6 1.3 44.7 9.5 12.1 8.5 0.8 13.2 8.5% 52.6 83.7 WR2 0.1 0.2 0.2 0.3 0.0 0.0 0.4 0.1 0.8 0.1 0.0 0.2 0.0% 1.2 1.8
WR3 0.7 0.1 0.8 0.7 0.0 0.0 0.7 0.0 0.7 0.0 0.0 0.1 0.0% 0.7 2.2
BR -2.1 0.0 -2.1 5.7 1.4 0.9 8.0 1.5 0.6 1.3 0.1 1.8 1.3% 6.5 12.4 Total -13.3 -1.5 -14.7 44.6 7.0 2.2 53.8 11.1 14.2 9.8 0.9 15.2 9.7% 61.0 100.0
1991
WR1 -9.9 -0.8 -10.7 33.9 4.7 1.9 40.5 9.3 11.1 10.4 1.3 11.7 8.9% 52.7 82.5
WR2 0.1 0.1 0.2 0.3 0.1 0.0 0.4 0.1 0.9 0.1 0.0 0.2 0.0% 1.3 1.8
WR3 0.6 0.1 0.7 0.5 0.0 0.0 0.5 0.0 0.7 0.0 0.0 0.1 0.0% 0.8 1.9 BR -2.2 -0.1 -2.3 6.5 1.6 0.9 8.9 1.6 0.3 1.8 0.2 1.9 1.5% 7.1 13.8
Total -11.5 -0.6 -12.1 41.1 6.4 2.8 50.3 11.0 13.0 12.2 1.5 13.8 10.3% 61.9 100.0
2000
WR1 -10.4 -0.2 -10.6 30.6 3.0 2.0 35.6 12.4 11.0 13.2 1.4 13.0 6.9% 57.9 82.9 WR2 0.1 0.1 0.2 0.2 0.0 0.0 0.2 0.2 0.9 0.1 0.0 0.2 0.0% 1.3 1.6
WR3 0.8 0.1 0.8 1.2 0.1 0.0 1.3 0.2 1.2 0.1 0.3 0.2 0.0% 1.9 4.0
BR -2.2 -0.2 -2.4 5.5 0.4 0.9 6.8 1.9 0.3 2.0 0.2 1.9 0.9% 7.1 11.5 Total -11.7 -0.3 -12.0 37.5 3.5 2.9 44.0 14.6 13.3 15.3 1.9 15.2 7.8% 68.1 100.0
2009
WR1 -8.3 -0.9 -9.2 27.0 0.4 1.7 29.1 15.3 10.3 15.7 1.6 16.8 5.2% 65.1 85.0
WR2 0.1 0.1 0.2 0.4 0.1 0.0 0.5 0.2 1.0 0.1 0.1 0.2 0.0% 1.5 2.1 WR3 1.1 0.0 1.1 1.4 0.4 0.0 1.9 0.2 1.3 0.1 0.3 0.2 0.0% 2.1 5.0
BR -1.7 0.0 -1.7 2.8 0.0 0.6 3.4 1.7 0.1 1.8 0.1 1.8 0.5% 6.1 7.8
Total -8.8 -0.8 -9.6 31.6 0.9 2.4 34.8 17.4 12.7 17.7 2.1 19.1 5.7% 74.7 100.0
Source: Authors’ calculation based on Regional Accounts of the Philippines (NSCB, various issues); and Philippine Statistical Yearbook (NSO, various issues).
Notes: 1. The numbers on the top row represent: (1) agriculture, fisheries and forestry, (2) mining & quarrying, (3) manufacturing, (4) construction, (5)
electricity, gas and water supply, (6) transportation, storage and communication, (7) trade, (8) finance, (9) real estate, (10) private services; and (11)
government services.
2. WR stands for within-region inequalities, while BR stands for between-region inequality.
23
Table 7
Bidimensional Decomposition by Regional Groups and GRDP Components, excluding NCR (in %)
Primary
Secondary
Tertiary
1 2 Subtotal 3 4 5 Subtotal 6 7 8 9 10 11 Subtotal Total
1975
WR1 8.2 -0.6 7.6 33.1 3.7 1.5 38.3 1.9 7.7 1.9 0.0 0.7 0.2 12.4 58.3
WR2 1.1 0.3 1.4 3.2 -0.4 0.1 2.9 0.4 3.2 0.3 -0.1 0.5 0.0 4.2 8.4 WR3 9.1 0.0 9.1 4.0 1.1 -0.1 5.0 0.2 4.6 0.3 0.3 0.5 -0.1 5.9 20.0
BR 12.1 -0.8 11.3 1.9 0.2 -0.1 2.0 0.0 0.1 -0.2 0.4 -0.3 0.0 0.0 13.3
Total 30.5 -1.2 29.4 42.2 4.7 1.3 48.2 2.5 15.5 2.3 0.6 1.5 0.1 22.4 100.0
1986
WR1 10.6 -1.7 8.8 33.9 1.8 3.0 38.7 2.9 13.4 1.6 -0.6 1.7 -0.7 18.2 65.8 WR2 0.3 1.0 1.3 2.3 0.3 0.1 2.7 0.7 5.6 0.3 -0.1 1.4 -0.2 7.8 11.8
WR3 4.5 1.0 5.4 4.4 -0.1 0.1 4.5 -0.1 4.4 0.1 0.0 0.4 -0.2 4.7 14.6
BR 9.0 -0.5 8.5 0.7 0.3 0.3 1.4 -0.1 -0.8 -0.2 0.0 -0.8 0.0 -2.0 7.9 Total 24.3 -0.2 24.1 41.3 2.4 3.5 47.2 3.4 22.6 1.8 -0.7 2.7 -1.1 28.7 100.0
1991
WR1 10.5 0.6 11.1 38.0 1.4 4.3 43.7 2.4 11.3 1.7 0.5 2.4 -0.3 17.9 72.6
WR2 0.4 0.7 1.1 1.8 0.3 0.2 2.3 0.9 6.0 0.4 0.2 1.2 -0.2 8.5 11.9 WR3 3.6 0.7 4.3 3.1 0.2 -0.1 3.2 0.0 4.3 0.1 0.1 0.5 -0.2 4.9 12.4
BR 2.2 0.0 2.1 1.6 0.7 0.6 2.9 0.0 -1.6 -0.1 -0.1 -0.3 0.0 -2.0 3.0
Total 16.7 1.9 18.6 44.5 2.6 5.0 52.1 3.3 20.1 2.1 0.8 3.8 -0.6 29.3 100.0
2000
WR1 1.1 2.4 3.5 32.7 2.5 3.3 38.4 1.4 7.2 1.3 -0.1 2.1 -0.3 11.6 53.5 WR2 0.8 0.5 1.3 1.7 -0.3 0.2 1.6 1.2 7.1 0.5 0.2 1.4 -0.3 10.1 13.1
WR3 6.2 0.6 6.7 9.6 1.0 0.1 10.8 1.4 9.9 0.4 2.1 1.3 0.1 15.3 32.8 BR -1.2 0.0 -1.3 0.9 0.0 0.3 1.2 0.2 0.0 0.2 0.1 0.3 0.0 0.7 0.6
Total 6.9 3.5 10.3 44.9 3.3 3.9 52.0 4.2 24.3 2.4 2.2 5.1 -0.4 37.7 100.0
2009
WR1 0.4 2.1 2.5 19.0 0.8 2.7 22.4 0.9 5.0 1.3 0.1 2.0 -0.2 9.1 34.0
WR2 0.4 1.0 1.5 3.3 0.8 0.2 4.3 1.6 8.7 0.8 0.5 1.9 -0.2 13.3 19.0 WR3 9.8 -0.1 9.7 12.6 3.6 0.4 16.6 2.0 11.2 0.6 2.7 1.9 0.0 18.4 44.6
BR -1.1 -0.1 -1.2 0.0 0.0 -0.4 -0.4 0.4 2.6 0.1 0.3 0.6 0.0 3.9 2.4
Total 9.5 2.9 12.4 34.9 5.2 2.8 42.9 4.9 27.4 2.8 3.5 6.4 -0.4 44.7 100.0
Source: Authors’ calculation based on Regional Accounts of the Philippines (NSCB, various issues); and Philippine Statistical Yearbook (NSO, various issues).
Notes: 1. The numbers on the top row represent: (1) agriculture, fisheries and forestry, (2) mining & quarrying, (3) manufacturing, (4) construction, (5)
electricity, gas and water supply, (6) transportation, storage and communication, (7) trade, (8) finance, (9) real estate, (10) private services; and (11)
government services.
2. WR stands for within-region inequalities, while BR stands for between-region inequality.
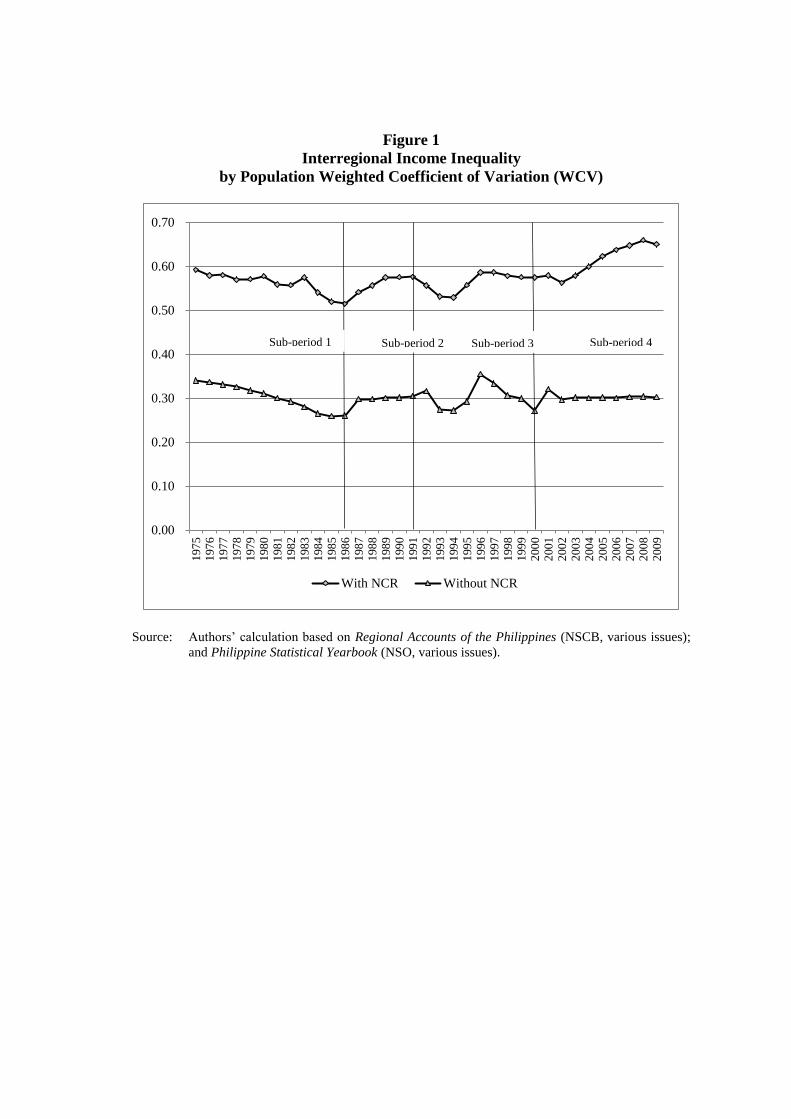
Figure 1
Interregional Income Inequality
by Population Weighted Coefficient of Variation (WCV)
Source: Authors’ calculation based on Regional Accounts of the Philippines (NSCB, various issues);
and Philippine Statistical Yearbook (NSO, various issues).
0.00
0.10
0.20
0.30
0.40
0.50
0.60
0.70
197
51
97
61
97
71
97
81
97
91
98
01
98
11
98
21
98
31
98
41
98
51
98
61
98
71
98
81
98
91
99
01
99
11
99
21
99
31
99
41
99
51
99
61
99
71
99
81
99
92
00
02
00
12
00
22
00
32
00
42
00
52
00
62
00
72
00
82
00
9
With NCR Without NCR
Sub-period 1 Sub-period 2 Sub-period 3 Sub-period 4
25
Figure 2
Interregional Income Inequality
by Theil T and L
Source: Authors’ calculation based on Regional Accounts of the Philippines (NSCB, various issues);
and Philippine Statistical Yearbook (NSO, various issues).
0.00
0.02
0.04
0.06
0.08
0.10
0.12
0.14
0.16
0.18
0.20
197
5
197
6
197
7
197
8
197
9
198
0
198
1
198
2
198
3
198
4
198
5
198
6
198
7
198
8
198
9
199
0
199
1
199
2
199
3
199
4
199
5
199
6
199
7
199
8
199
9
200
0
200
1
200
2
200
3
200
4
200
5
200
6
200
7
200
8
200
9
Theil T with NCR Theil L with NCR
Theil T without NCR Theil L without NCR
Sub-period 1 Sub-period 2 Sub-period 3 Sub-period 4

26
Figure 3
Interregional Income Inequality by Island Region excluding NCR
by Theil T
0.00
0.01
0.02
0.03
0.04
0.05
0.06
0.07
0.08
0.09
0.10
197
5
197
6
197
7
197
8
197
9
198
0
198
1
198
2
198
3
198
4
198
5
198
6
198
7
198
8
198
9
199
0
199
1
199
2
199
3
199
4
199
5
199
6
199
7
199
8
199
9
200
0
200
1
200
2
200
3
200
4
200
5
200
6
200
7
200
8
200
9
Region 1 Region 2 Region 3 Total