structural risk models
DESCRIPTION
Structural Risk Models. Elementary Risk Models. Single Factor Model Market Model Plus assumption residuals are uncorrelated Constant Correlation Model Assume all asset returns have same pair-wise correlation Cov(R i , R j ) = i j. Elementary Models. Full-Covariance Model - PowerPoint PPT PresentationTRANSCRIPT
Structural Risk Models
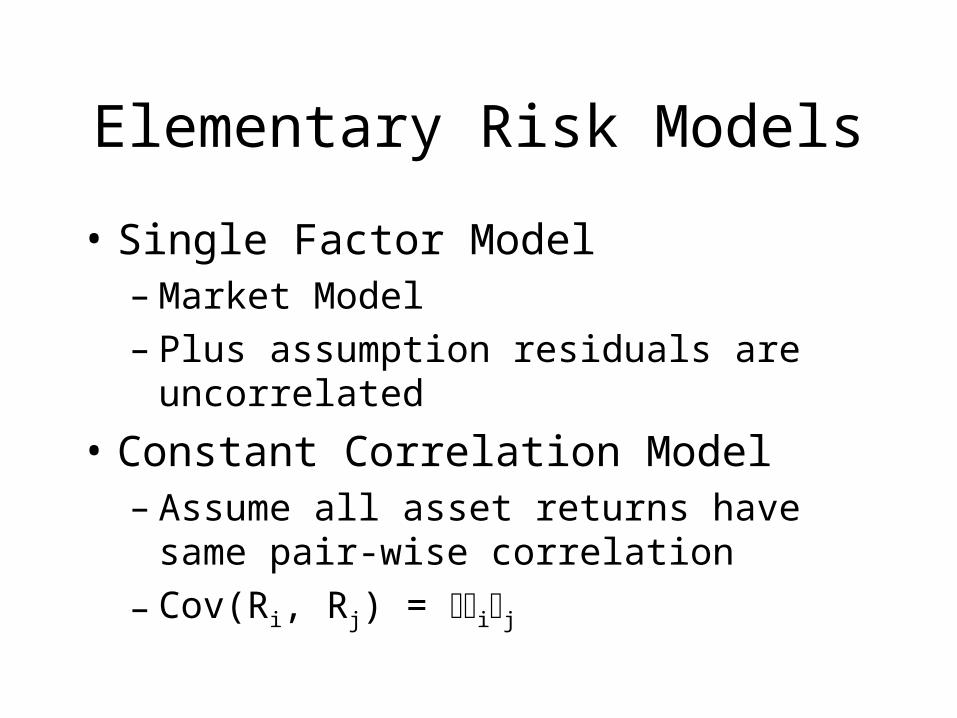
Elementary Risk Models
• Single Factor Model– Market Model– Plus assumption residuals are uncorrelated
• Constant Correlation Model– Assume all asset returns have same pair-wise
correlation
– Cov(Ri, Rj) = ij
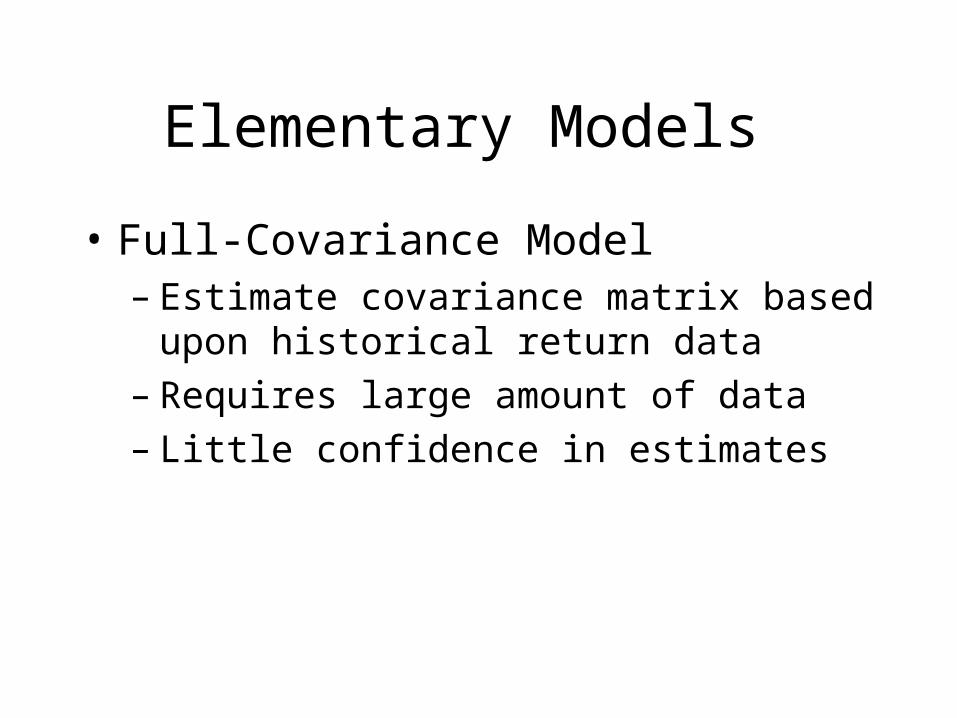
Elementary Models
• Full-Covariance Model– Estimate covariance matrix based upon
historical return data– Requires large amount of data– Little confidence in estimates
Structural Risk Models
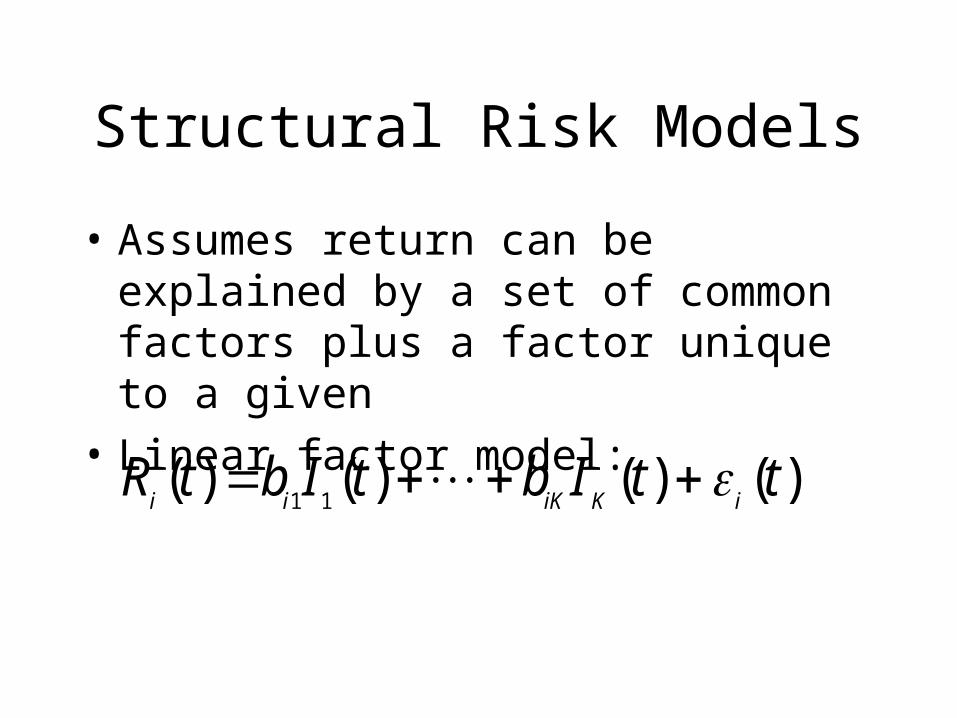
• Assumes return can be explained by a set of common factors plus a factor unique to a given
• Linear factor model:
)()()()(11
ttIbtIbtRiKiKii
Choosing Factors
• External Influences– Outside Economic factors– Examples
• Changes in inflation
• Changes Exchange rates
• Changes in industrial production
Choosing Factors
• Statistical Factors – Statistical procedure for determining factors– Principal Components Analysis– Factor Analysis

BARRA Method
• Based on cross-sectional comparison determine exposures
• Cross-Sectional Comparisons– Comparisons between attributes of stocks– Classified as Fundamental and Market
• Determine factors based on exposures that best explain the covariance matrix
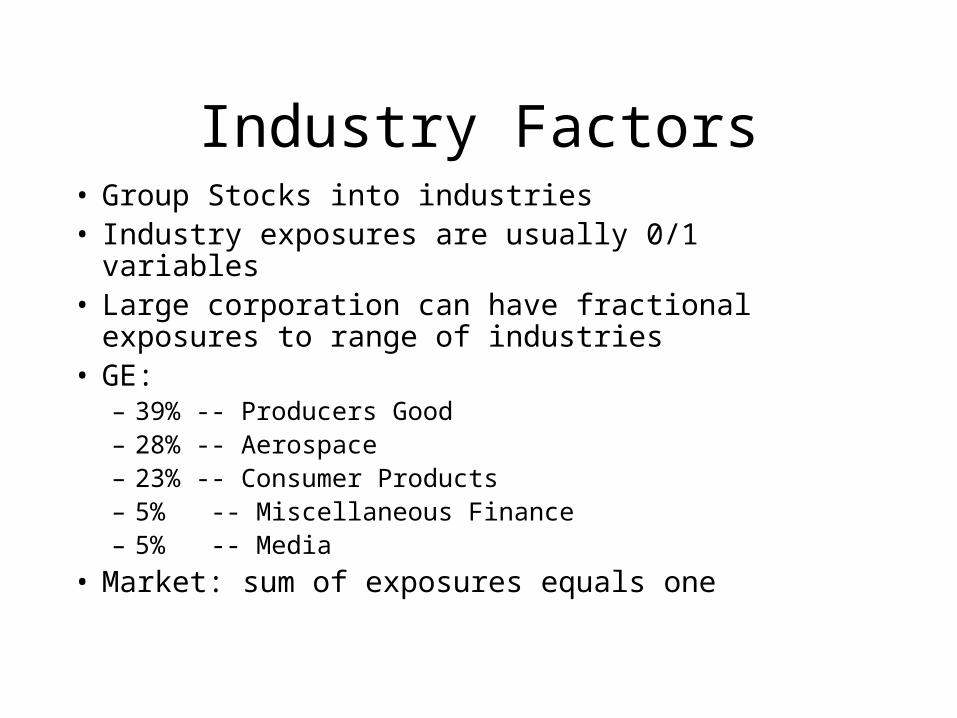
Industry Factors• Group Stocks into industries• Industry exposures are usually 0/1 variables• Large corporation can have fractional exposures to range
of industries• GE:
– 39% -- Producers Good– 28% -- Aerospace– 23% -- Consumer Products– 5% -- Miscellaneous Finance– 5% -- Media
• Market: sum of exposures equals one
Risk Indexes
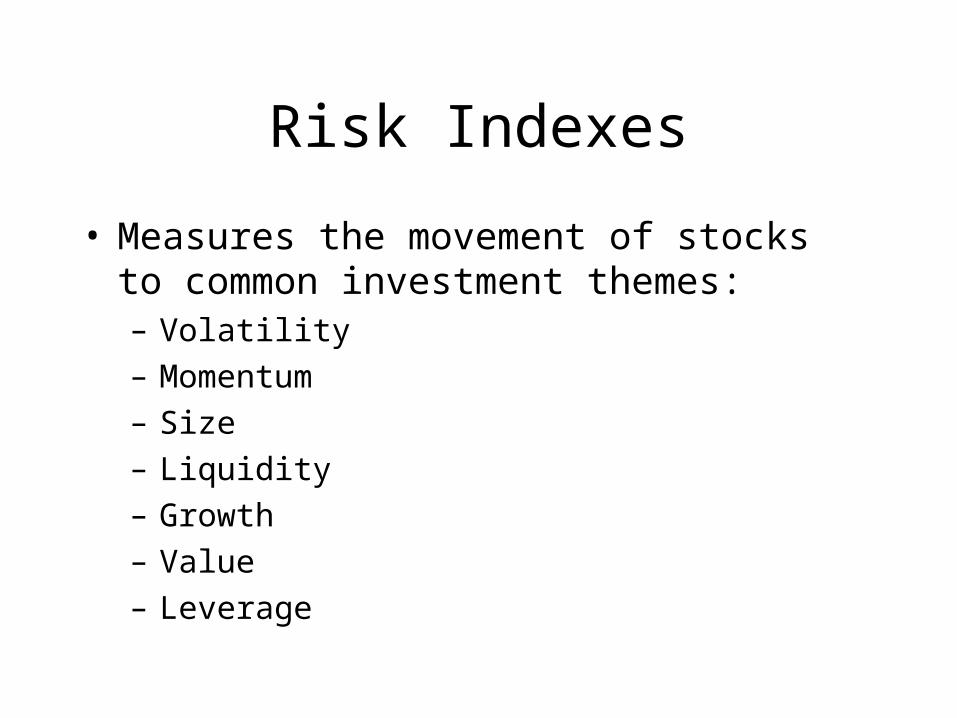
• Measures the movement of stocks to common investment themes:– Volatility
– Momentum
– Size
– Liquidity
– Growth
– Value
– Leverage
Risk Indexes
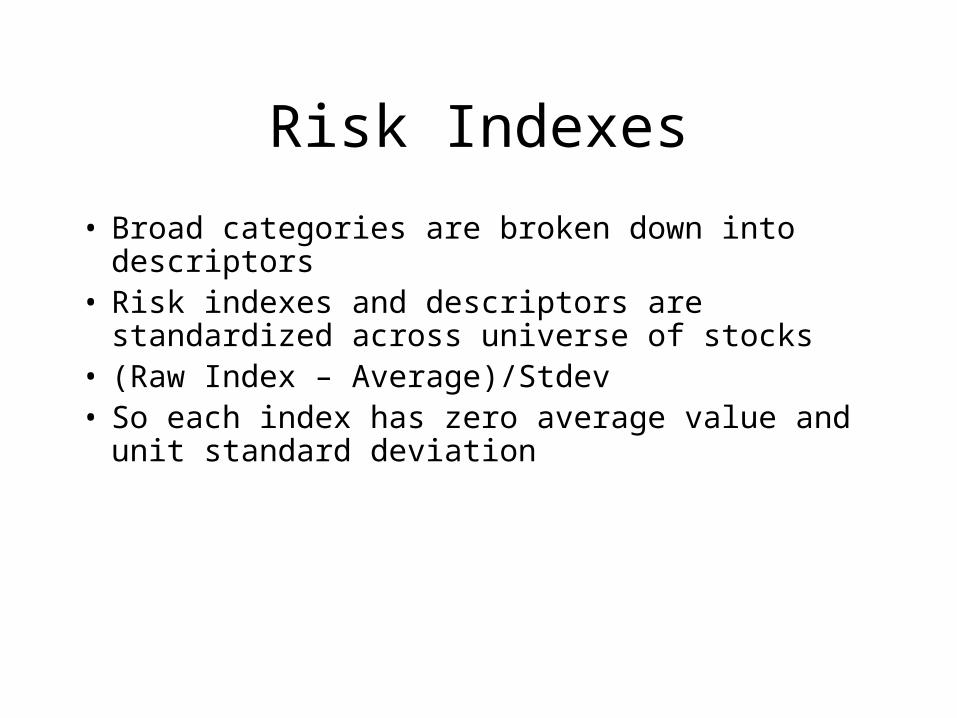
• Broad categories are broken down into descriptors• Risk indexes and descriptors are standardized across
universe of stocks• (Raw Index – Average)/Stdev• So each index has zero average value and unit standard
deviation
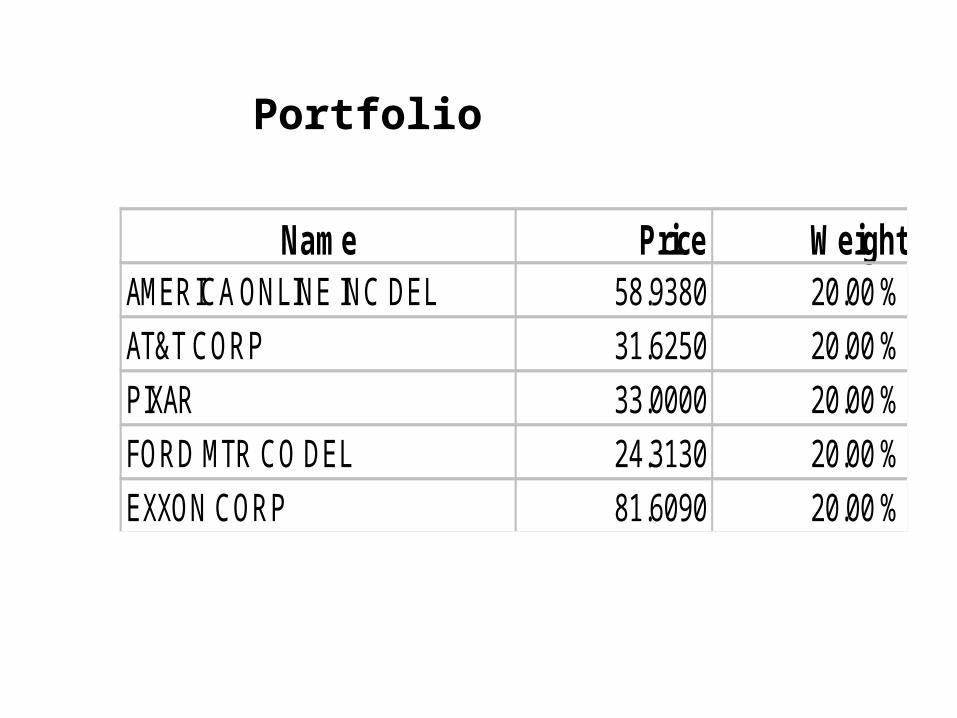
Name Price WeightAMERICA ONLINE INC DEL 58.9380 20.00 %
AT&T CORP 31.6250 20.00 %
PIXAR 33.0000 20.00 %
FORD MTR CO DEL 24.3130 20.00 %
EXXON CORP 81.6090 20.00 %
Portfolio
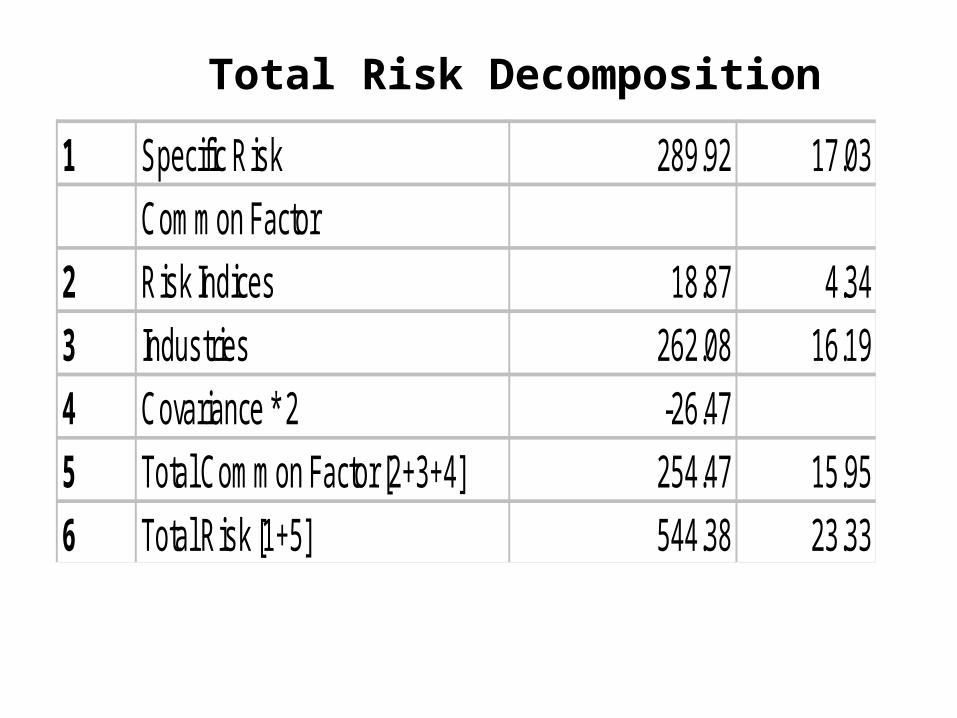
1 Specific Risk 289.92 17.03
Common Factor
2 Risk Indices 18.87 4.34
3 Industries 262.08 16.19
4 Covariance * 2 -26.47
5 Total Common Factor [2+3+4] 254.47 15.95
6 Total Risk [1+5] 544.38 23.33
Total Risk Decomposition
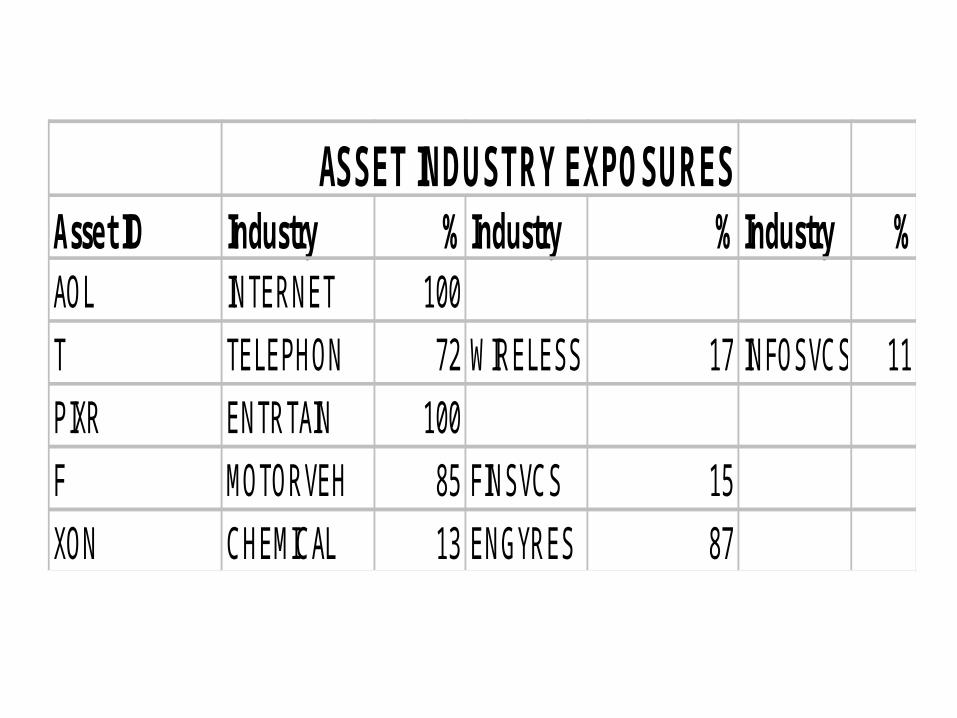
ASSET INDUSTRY EXPOSURESAsset ID Industry % Industry % Industry %AOL INTERNET 100
T TELEPHON 72 WIRELESS 17 INFOSVCS 11
PIXR ENTRTAIN 100
F MOTORVEH 85 FINSVCS 15
XON CHEMICAL 13 ENGYRES 87
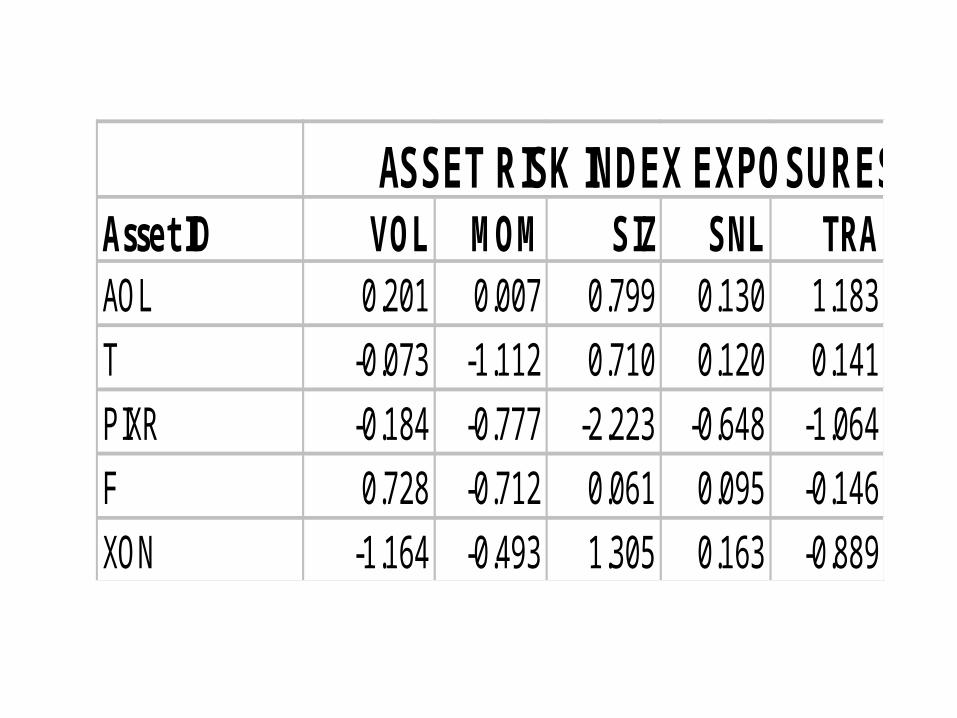
ASSET RISK INDEX EXPOSURES (Std Dev)Asset ID VOL MOM SIZ SNL TRAAOL 0.201 0.007 0.799 0.130 1.183
T -0.073 -1.112 0.710 0.120 0.141
PIXR -0.184 -0.777 -2.223 -0.648 -1.064
F 0.728 -0.712 0.061 0.095 -0.146
XON -1.164 -0.493 1.305 0.163 -0.889
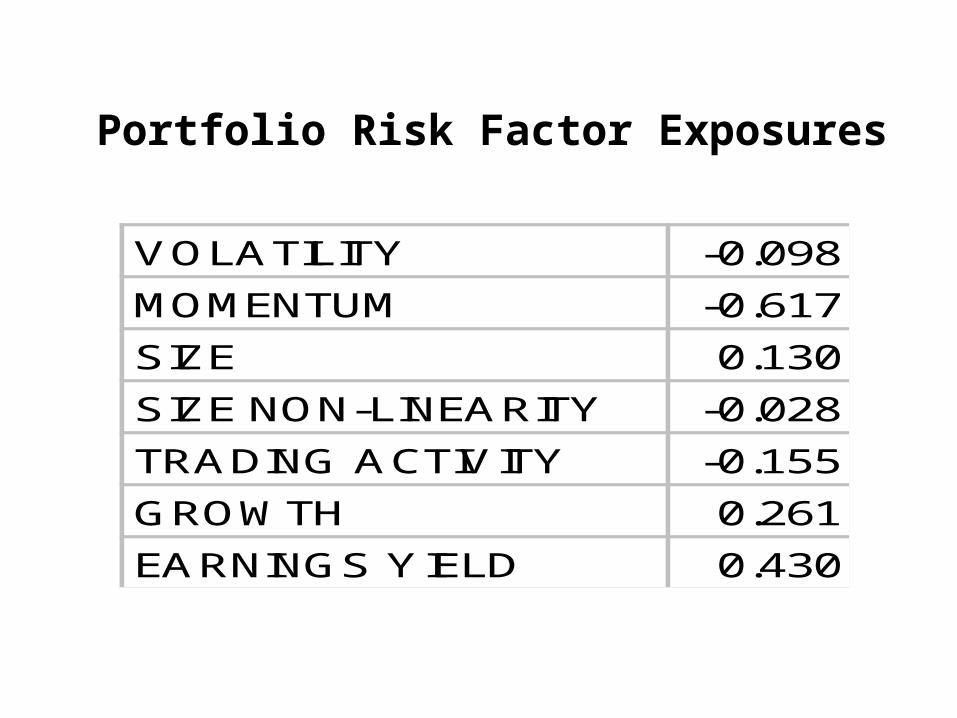
VOLATILITY -0.098
MOMENTUM -0.617
SIZE 0.130
SIZE NON-LINEARITY -0.028
TRADING ACTIVITY -0.155
GROWTH 0.261
EARNINGS YIELD 0.430
Portfolio Risk Factor Exposures
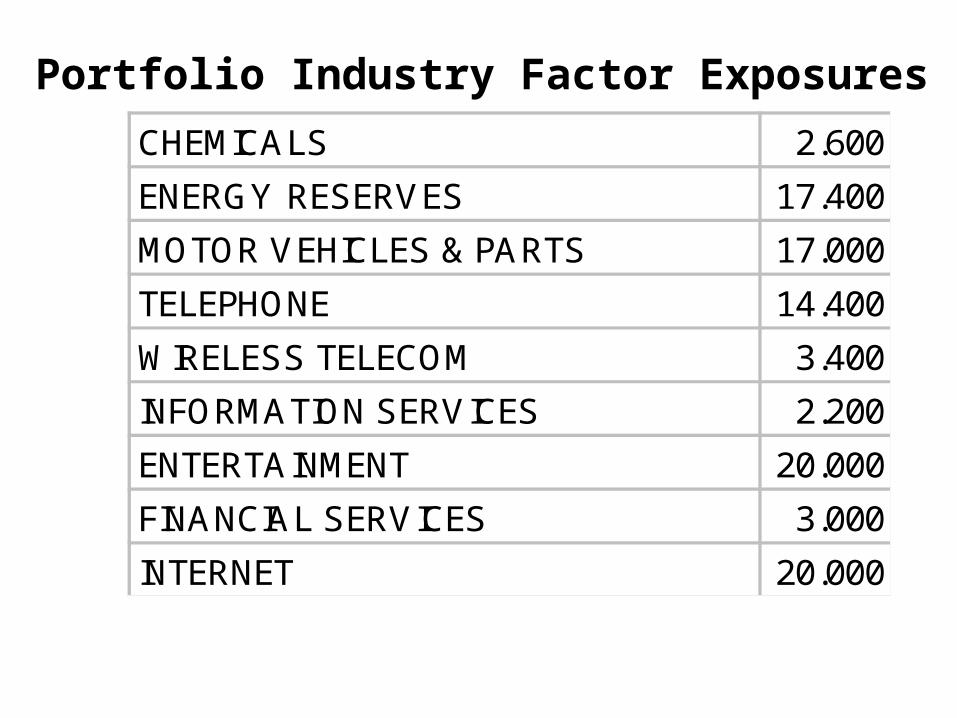
CHEMICALS 2.600
ENERGY RESERVES 17.400
MOTOR VEHICLES & PARTS 17.000
TELEPHONE 14.400
WIRELESS TELECOM 3.400
INFORMATION SERVICES 2.200
ENTERTAINMENT 20.000
FINANCIAL SERVICES 3.000
INTERNET 20.000
Portfolio Industry Factor Exposures
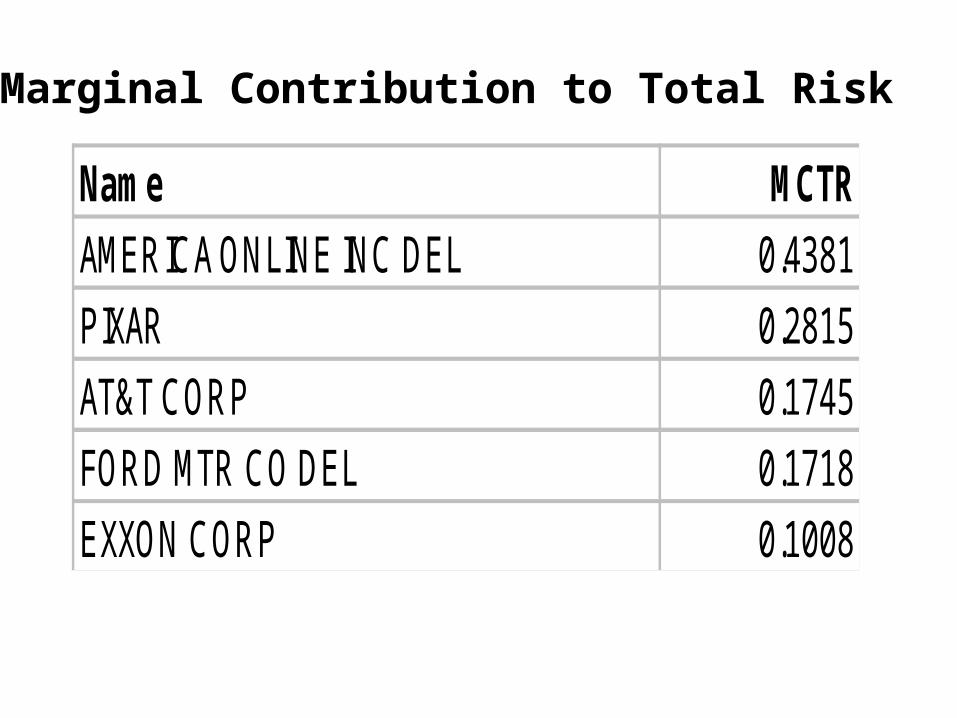
Name MCTR
AMERICA ONLINE INC DEL 0.4381
PIXAR 0.2815
AT&T CORP 0.1745
FORD MTR CO DEL 0.1718
EXXON CORP 0.1008
Marginal Contribution to Total Risk
BARRA Risk Decomposition
• Total risk– Common Factor: common to all assets– Specific risk factor: uncorrelated with specific
risk of other assets
• Default decomposition
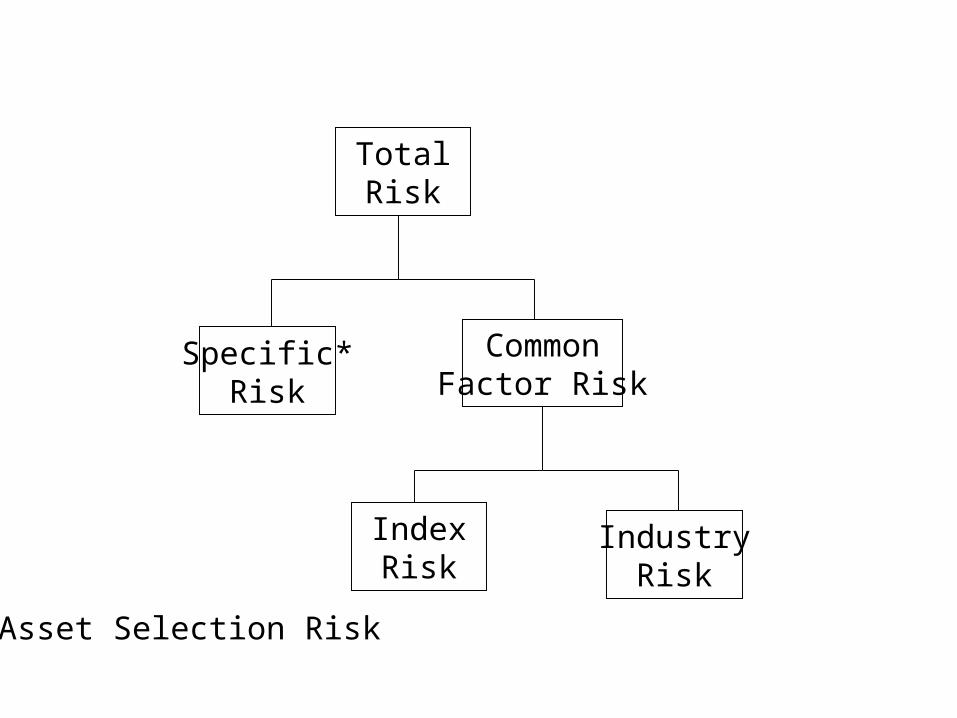
TotalRisk
Specific*Risk
CommonFactor Risk
IndexRisk
IndustryRisk
*Asset Selection Risk
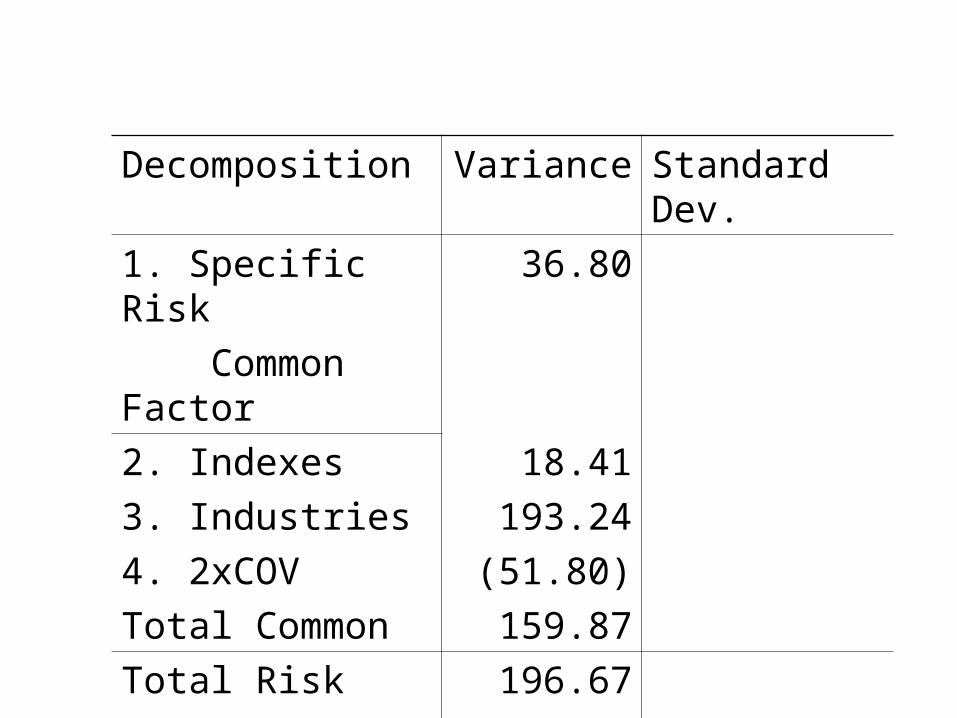
Decomposition Variance Standard Dev.
1. Specific Risk 36.80
Common Factor
2. Indexes 18.41
3. Industries 193.24
4. 2xCOV (51.80)
Total Common 159.87
Total Risk 196.67
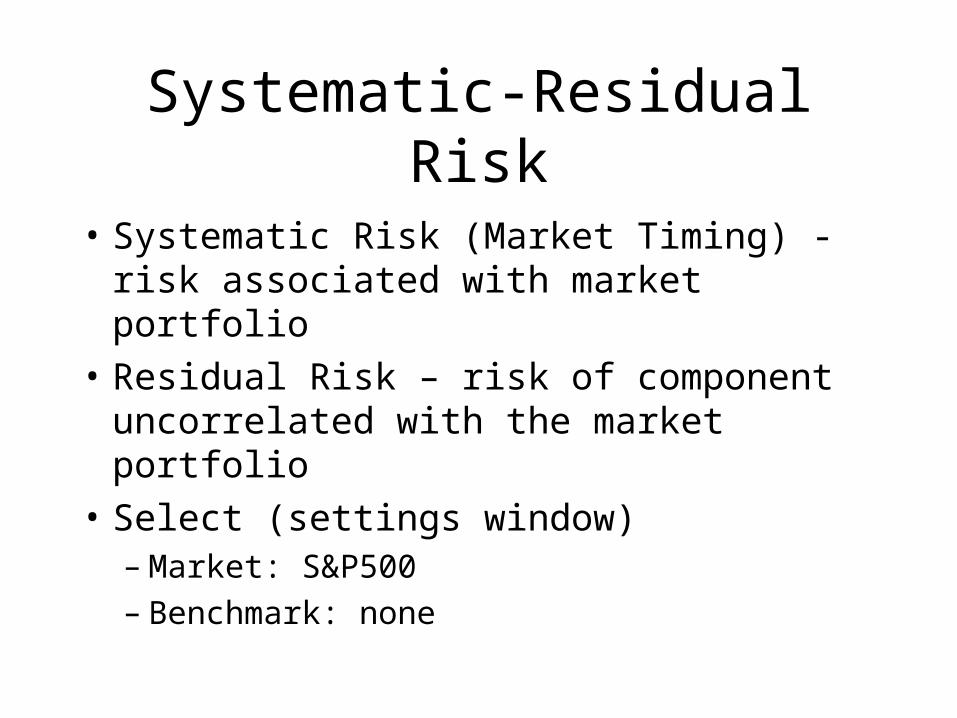
Systematic-Residual Risk
• Systematic Risk (Market Timing) - risk associated with market portfolio
• Residual Risk – risk of component uncorrelated with the market portfolio
• Select (settings window)– Market: S&P500– Benchmark: none
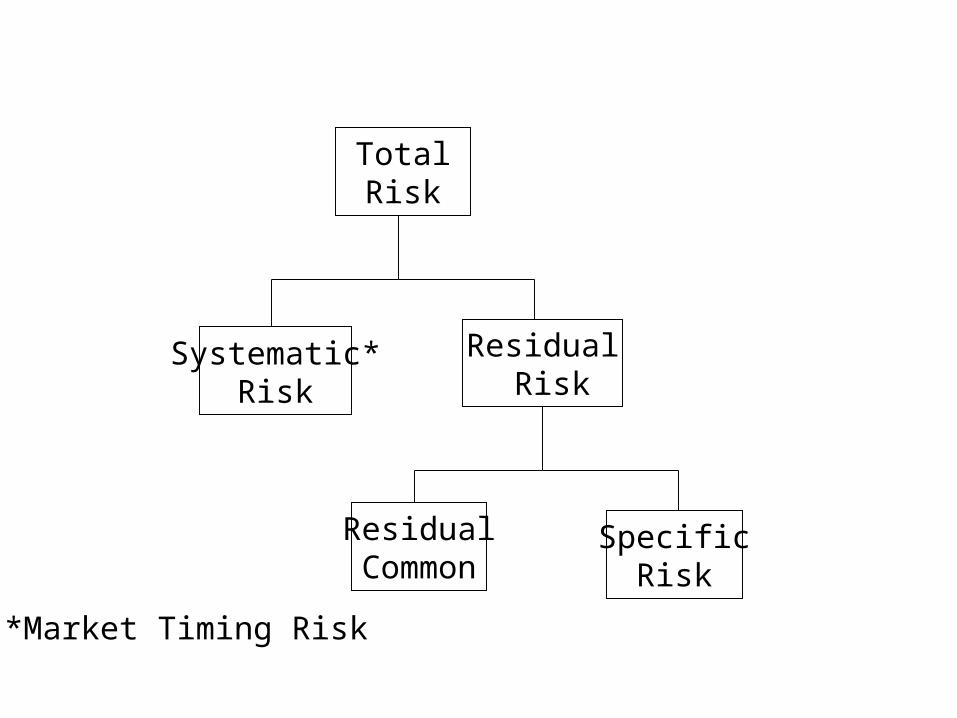
TotalRisk
Systematic*Risk
Residual Risk
ResidualCommon
SpecificRisk
*Market Timing Risk
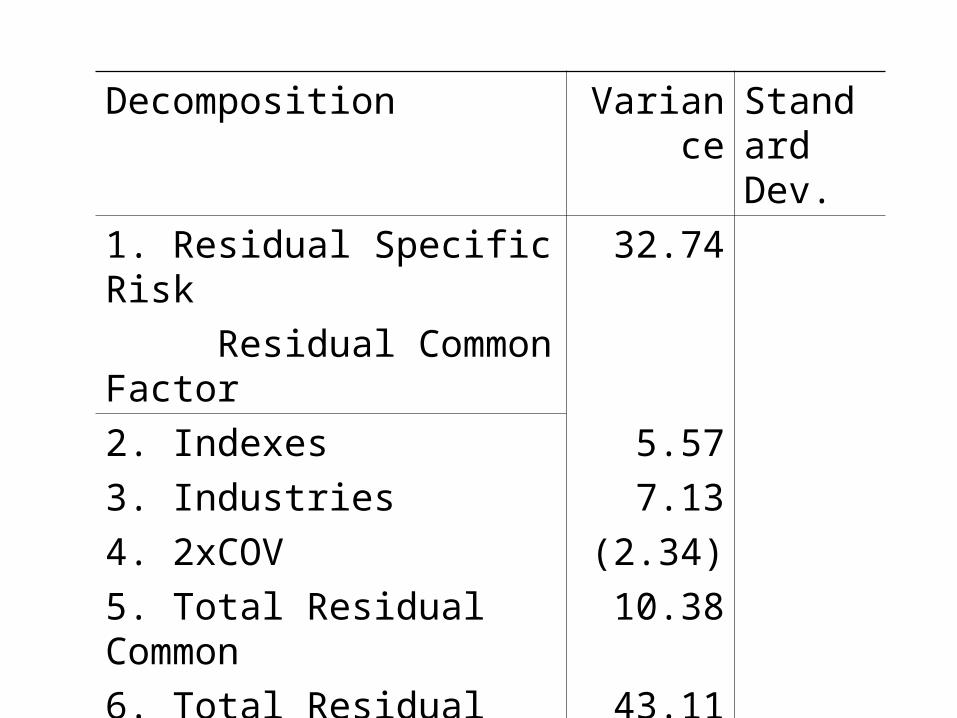
Decomposition Variance Standard Dev.
1. Residual Specific Risk 32.74
Residual Common Factor
2. Indexes 5.57
3. Industries 7.13
4. 2xCOV (2.34)
5. Total Residual Common 10.38
6. Total Residual 43.11
7. Systematic
8. Total Risk
153.56
196.67
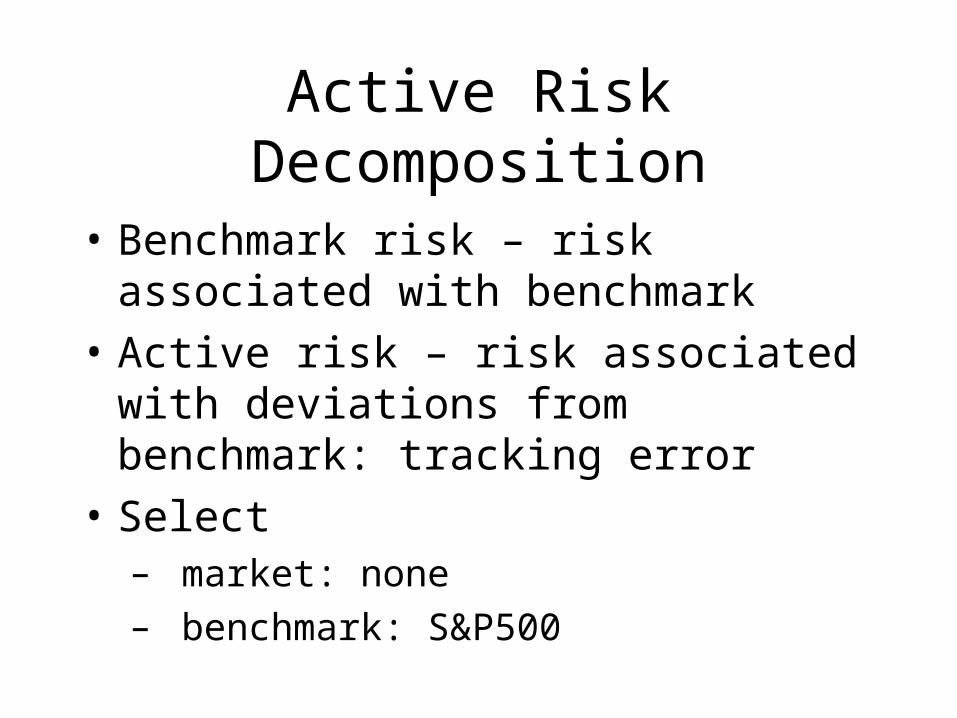
Active Risk Decomposition
• Benchmark risk – risk associated with benchmark
• Active risk – risk associated with deviations from benchmark: tracking error
• Select – market: none– benchmark: S&P500
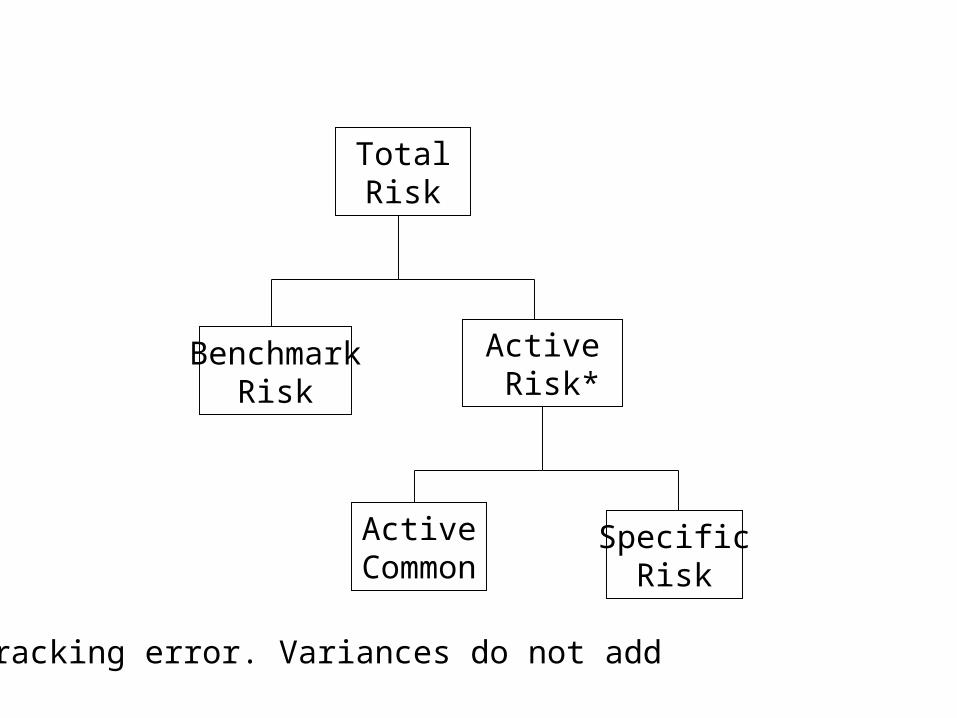
TotalRisk
BenchmarkRisk
Active Risk*
ActiveCommon
SpecificRisk
*Tracking error. Variances do not add