structural deviations in poly(amidoamine) dendrimers: a maldi-tof ms analysis
TRANSCRIPT

Structural deviations in poly(amidoamine) dendrimers:a MALDI-TOF MS analysis
J. Peterson a, V. Allikmaa a, J. Subbi b, T. Pehk b, M. Lopp c,*
a Institute of Chemistry at Tallinn Technical University, Akadeemia tee 15, 12618 Tallinn, Estoniab National Institute of Chemical and Biological Physics, Akadeemia tee 23, 12618 Tallinn, Estonia
c Tallinn Technical University, Faculty of Chemistry, Ehitajate tee 5, 19086 Tallinn, Estonia
Received 17 April 2002; received in revised form 10 June 2002; accepted 24 June 2002
Abstract
A step-by-step synthesis/purification (CC, HILIC, HPLC) of poly(amidoamine) PAMAM dendrimers was per-
formed. MALDI-TOF MS in the linear and reflectron mode was used to analyze the purified samples and byproduct
samples of G0–G5 generations of the dendrimers up to the mass of 35 000 Da. DHB/fucose was found to give the best
resolution, causing the least fragmentation of the samples. The precise mass number for the ideally branched dendri-
mers and their ‘‘structural errors’’ was obtained. The profile of the structural errors was established.
� 2002 Elsevier Science Ltd. All rights reserved.
Keywords: PAMAM dendrimers; MALDI-TOF MS; Structure deviations of PAMAM dendrimers
1. Introduction
Poly(amidoamine) (PAMAM) dendrimers are syn-
thetic polymers with unique structural and physical
characteristics. These dendrimers consist of an ethylene-
diamine (EDA) or ammonia initiator core, a repeating
monomer unit of polyamidoamine (–CH2CH2CONH-
CH2CH2N<) and a terminal amino group, which can besubsequently used in the synthesis of further generations
of the dendrimer (Fig. 1).
Recent years have seen increased interest in charac-
terizing the structure of PAMAM dendrimers. Several
analytical techniques, including size exclusion chroma-
tography (SEC) [1,2], low angle laser light scattering
(LALLS) [2,3], infrared (IR) spectroscopy [4], capillary
electrophoresis (CE) [5–7], MS (chemical ionization and
fast-atom bombardment [8], laser desorption and elec-
trospray ionization [9] and MALDI-TOF [10]) and 1H,
2H, 13C NMR [1,4,8,11], were applied in these descrip-
tions. Unfortunately, the performance of all these tech-
niques declines with an increasing molecular weight.
This study focuses on the structural deviations in
PAMAM dendrimers by stepwise synthesis of the EDA
initiator-core PAMAM dendrimer with an amidoamine-
repeating unit up to generation 5, using different
chromatographic purification techniques, followed by
simultaneous investigation of the MALDI-TOF MS
spectra of the obtained fractions.
2. Experimental
2.1. Materials
The used matrixes 2,5-dihydroxybenzoic acid (DHB),
4-hydroxy-3-methoxycinnamic (ferulic acid), a-cyano-4-hydroxycinnamic acid, 1,8,9-anthracenetriol (dithranol),
and DD-(þ)-fucose were obtained from Aldrich and used
without further purification. Substance P, insulin b-chain, bovine insulin and horse heart cytochrome C were
purchased from Sigma.
European Polymer Journal 39 (2003) 33–42
www.elsevier.com/locate/europolj
* Corresponding author. Tel.: +372-6204366; fax: +372-
6547520.
E-mail address: [email protected] (M. Lopp).
0014-3057/02/$ - see front matter � 2002 Elsevier Science Ltd. All rights reserved.
PII: S0014-3057 (02 )00188-X

2.2. Preparation and chromatographic purification of
PAMAM dendrimers
The construction of an EDA-core PAMAM dendri-
mer consist of two consecutive steps: Michael addition
of primary amine (EDA in the very first step) to methyl
acrylate followed by amidation of the formed multiester
(tetraester at the very beginning) with EDA (Fig. 2)
[1,2,8].
The first six generations (generations 0–5) of EDA-
core polyamidoamine dendrimers were synthesized in
the stepwise process described in [6]. In order to obtain
less complicated MS spectra (minimize both the intra-
molecular defects, missing repeating units, intramolec-
ular loops) and intermolecular aggregates (dimers) as
well as lower generation dendrimers, different chroma-
tographic purification procedures of the multiester
compounds G0.5–G4.5 were used. The generations )0.5,0.5 and 1.5 were purified by column chromatography on
a silica gel; G2.5, G3.5, and G4.5 by column chromato-
graphy on Sephadex LH-20. In both cases, methanol or
its mixture with dichloromethane was used as the eluent.
The generation homogeneity of the synthesized dendri-
mers was followed by capillary zone electrophoresis
(CZE) [6,7] and by 1H and 13C NMR spectroscopy.
The first full generation dendrimer (G1) was purified
using hydrophilic interaction chromatography (HILIC)
and high-pressure liquid chromatography (HPLC).
HILIC. 10� 150 mm glass column was filled with 55
mg Silasorb Diol (10 lm; Chemapol Prague, Czecho-slovakia). 1 mg G1 was dissolved in 100 ll acetonitrile/water (1:1) mixture and inserted into the column. Air
pressure (0.1 bar) was applied to the column, and the
first fraction was collected. The next fractions were
Fig. 2. Diagram of the synthesis of EDA-core PAMAM dendrimers.
Fig. 1. Schematic diagram of a polyamidoamine dendrimer. The compound is a second-generation dendrimer.
34 J. Peterson et al. / European Polymer Journal 39 (2003) 33–42

collected analogously, using 100 ll of the same eluent,2� 100 ll of distilled water, 2� 100 ll of distilled wateracidified with acetic acid to pH ¼ 3:39, and finally, with2� 100 ll of distilled water/acetic acid (pH ¼ 2:98). Theresulting fractions were lyophilized and analyzed by
MALDI-TOF MS.
HPLC. HPLC analysis was carried out on the Shi-
madzu system: LC 10AT vp HPLC pump, SPD-10A VP
UV–VIS detector and SCL-10A VP system controller.
The date was collected and analyzed on a Shimadzu
ClassVP software. Samples of G1 (40 ll, c ¼ 8 mg/ml)
were analyzed in a Symmetry C18 column (4:6� 250 nm,
5 lm), detection at 218 nm. The eluent system was (A)
0.1% trifluoroacetic acid in water, (B) acetonitrile. The
linear gradient 0–50% of B in 20 min was used (1 ml/
min). The different fractions were collected, lyophilized,
and analyzed by MALDI-TOF MS.
2.3. NMR spectrometry
The structure of lower generation dendrimers was
confirmed by 1H and 13C NMR high field (11.7 T)
spectroscopy on an AMX500 MHz Bruker instrument.
The samples were dissolved and measured in the CDCl3solution. In the case of higher generations, a small
amount of CD3OD was added to improve their solu-
bility (additional effects on the C-13 spectra do not ex-
ceed 0.2 ppm). 2D FT 1H–13C COSY correlation
diagrams were applied to resolve the overlapping of 1H
signals. The 1H and 13C NMR chemical shifts in the first
generations of EDA-core PAMAM dendrimers are
presented in Table 1. The assignments slightly differ
from those presented in [8].
2.4. MALDI-TOF mass spectrometry
A dendrimer solution was prepared by dissolving 1
mg of the purified dendrimer syrup in 1 ml of water.
Additionally, a 1:10 dilution of this solution was made.
The matrix solution was prepared by dissolving 10 mg
of matrix in 1 ml of the 1:1 mixture of the deionized
water and acetonitrile. The analytical sample was
prepared by mixing the dendrimer solution (1 ll) withthe matrix solution (1 ll) on a stainless steel probe tip,
and this mixture was allowed to dry at room temper-
ature.
The MALDI mass spectra were recorded on two dif-
ferent time-of-flight MALDI mass spectrometers (both
original equipment built at the National Institute of
Chemical Physics and Biophysics, Estonia). In the case
of lower dendrimer generations, the instrument with a
reflectron mode and with a delayed extraction was used.
Table 113C and 1H NMR chemical shifts in the first generations of EDA-core PAMAM dendrimers in the CDCl3 solution
Group No.
of C
13C
G0.5
1H 13C
G0
1H 13C
G0.5
1H 13C
G1
1H 13C
G1.5
1H 13C
G2
1H 13C
G2.5
–C�H2N< 2 52.17 2.47 51.89 2.42 51.15 2.55 51.03 2.46 50.84 2.55 50.84 2.47 50.44
NCH�2 4 49.68 2.74 50.49 2.67 50.03 2.77 49.84 2.67 49.84 2.76 49.84 2.68 49.60
C�H2CO 4 32.54 2.42 34.27 2.36 33.69 2.36 33.53 2.26 33.37 2.36 33.38 2.35 33.39
C�OO 4 172.89 – – – – – – – – – – – –
COOC�H3 4 51.46 3.65 – – – – – – – – – – –
C�ONH� 4 173.11 7.69 172.18 7.19 172.55 8.1 172.16 7.78 172.37 7.80 172.20
NHC�H2 4 42.26 3.27 37.05 3.28 37.63 3.16 37.23 3.27 37.36 3.23 37.03
C�H2N< 4 41.48 2.80 52.82 2.55 52.64 2.47 52.18 2.59 52.21 2,48 51.81
>NC�H2 8 49.15 2.77 50.37 2.69 49.62 2.81 49.84 2.69 49.50
C�H2CO 8 32.54 2.44 34.09 2.3 33.51 2.37 33.67 2.30 33.39
C�OO 8 172.87 – – – – – – – –
COOC�H3 8 51.49 3.72 – – – – – – –
C�ONH� 8 172.90 7.89 172.05 7.05 172.42 7.98 171.88
NHC�H2 8 42.11 3.22 36.91 3.28 37.44 3.23 36.94
C�H2N< 8 41.37 2.75 52.63 2.55 52.53 2.46 51.92
>NC�H2 16 48.97 2.76 50.16 2.67 49.32
C�H2CO 16 32.4 2.44 33.91 2.29 33.26
C�OO 16 172.76 – – – –
COOC�H3 16 51.35 3.67 – – -
C�ONH� 16 172.82 7.89 171.80
NHC�H2 16 42.01 3.22 36.65
C�H2N< 16 41.25 2.75 52.35
>NC�H2 32 48.72
C�H2CO 32 32.14
C�OO 32 172.45
COOC�H3 32 51.04
J. Peterson et al. / European Polymer Journal 39 (2003) 33–42 35

For a higher dendrimer generations, the instrument with
linear delayed extraction MALDI technique was used.
In the reflectron mode, a 2.6 kV pulsed extraction and
a 14.6 kV total acceleration voltage were applied. The
delay was optimized separately for different mass ranges.
A double multichannel plate detector with a conversion
dynode was used for ion detection and a Tektronics
TDS 520 digitizing oscilloscope, for data accumulation.
An excimer laser pumped dye laser working at 340 nm
was used for desorption/ionization.
The other mass spectrometer that was used in linear
mode, was equipped with an ETP AF850H electron
multiplier with a conversion dynode as the detector and
an XeF excimer laser at the wavelength of 351 nm for
desorption. For mass calibration in different mass ran-
ges, standard compounds such as substance P, insulin b-chain, bovine insulin and horse heart cytochrome C,
were used.
Different standard MALDI matrixes such as 2,5-
dihydroxybenzoic acid, 4-hydroxy-3-methoxycinnamic
acid, a-cyano-4-hydroxycinnamic acid, dithranol and
DHB/fucose (1:1 mixture) were used.
3. Results and discussion
3.1. MALDI-TOF MS analysis of the synthetic fractions
Of all mass spectrometric methods MALDI-TOF MS
is most tolerant to impurities. It produces predomi-
nantly single charged ions, allowing for the determina-
tion of the direct mass number of oligomers, which can
produce true molecular weight distributions for the
narrow-distributed polymers. However, in polymers
with wide mass distributions or blends of polymers,
different mass dependent or oligomer-specific discrimi-
nation effects appear, and quantitative conclusions can
be drawn only by involving other analytical methods as
well [12].
Up to generation G1.5, the spectra near MALDI
threshold consist of sharp lines corresponding to ideally
branched and defective protonated dendrimers, their
fragmentation products, and weak lines corresponding
to Na and K adducts. Starting from G2.5, unresolved
background signals emerge. Already for G4.5, the spec-
tra line structure was lost. Still, the mean molecular
weight distribution was readily observed.
The full generations of PAMAM dendrimers have
numerous amino groups with good proton accepting
ability in the outer shell and can readily be ionized by
proton addition. In higher generations, the spectral lines
became weak and, as a result, excessive laser power was
needed. The best spectra for both a half and full gen-
erations signal were obtained when a 1:1 DHB/fucose
mixture, a well-known ‘‘cold’’ matrix, was used [13,14].
However, it also caused a background to emerge be-
ginning from G2, probably due to the trapping of the
sugar molecules inside the dendrimer framework.
MALDI mass spectra for all half and full generations
of the dendrimer up to G5 in the linear mode and up to
G2.5 in the reflectron mode gave direct information
about the possible ‘‘structural errors’’. The full isotopic
resolution and superior mass accuracy of the reflectron
mode was used to confirm our assignments of the de-
fective dendrimer structures and prompt decay products.
For generations G4 and G5, we did not obtain a line
structure in the MS spectra (Fig. 3). Still, a general
molecular weight distribution was well observed. Un-
Fig. 3. MALDI-TOF MS spectra for the first, third and fifth
PAMAM generations.
36 J. Peterson et al. / European Polymer Journal 39 (2003) 33–42

fortunately, the MALDI-TOF method does not provide
for the straightforward quantification of the sample
investigated. Therefore we did not obtain the ‘‘real’’
generation distribution. However, discrimination is gen-
erally against the higher mass, so it can lead only to
overestimation of the lower mass impurities. Despite the
above limitations we have matched all lines in the
spectra with the corresponding structures of structural
errors (Fig. 4).
Mass numbers exceeding the mass of an ideally
branched dendrimer by þ22 and þ38 are the corre-
sponding Na and K salts (ionization by Na and K are
due to random Na and K impurities in the samples). The
calculated mass numbers of the structural errors are in
very good agreement with those derived from the spectra
(Table 2).
The fragmentation of an analytical sample can lower
the intensity, causing sharp lines to emerger due to a
prompt decay inside the ion source. These secondary
lines may interfere with the interpretation of the parent
lines from the primary structural error lines of dendri-
mers. These secondary lines can be excluded through
matrix and laser intensity dependencies and from the
possible mass numbers of the non-fragmented molecular
ions. To elucidate the fragmentation of PAMAM den-
drimers during the MALDI analysis in the linear mode
and to differentiate those from the parent lines of the
primary lines, the laser intensity was varied up to two-
fold from threshold for G1, G1.5 and G2 using differ-
ent matrixes. As a rule, with higher laser intensity
the lines were widened up to the loss of line structure
and a weakly structured background emerged. The
Fig. 4. PAMAM dendrimer structures detected through MALDI-TOF MS.
J. Peterson et al. / European Polymer Journal 39 (2003) 33–42 37

DHB/fucose matrix again provided the best signal and
caused the least fragmentation of the dendrimer. Our ex-
periments also proved a-cyano-4-hydroxycinnamic acidto be a ‘‘hot’’ matrix, causing most of the fragmentation,
similar to the case of peptides and proteins [15,16]. DHB
and ferulic acid lie between these two in this respect.
In all spectra from G0.5 to G2 (Fig. 3), we observed a
line exactly at half the dendrimer mass visible even at the
threshold intensity. The isotope structure of this line
indicates that it corresponds to a single charged ion (the
appearance of multiply charged ions in MALDI MS is
strongly suppressed; also, no ions at mass (Mþ2H)/2appear). As no protonated ion with such mass can exist,
we identified the line as a dendrimer fragmentation
product, where the central C–C bond in the EDA-core is
broken. The negatively charged part of the molecule is
neutralized by a proton, leaving a positive ion with half
the dendrimer mass (Fig. 5). The corresponding frag-
mentation of ethylenediamine derivatives is known also
from the MS spectra [17]. The half-mass line could be
Fig. 4 (continued)
38 J. Peterson et al. / European Polymer Journal 39 (2003) 33–42
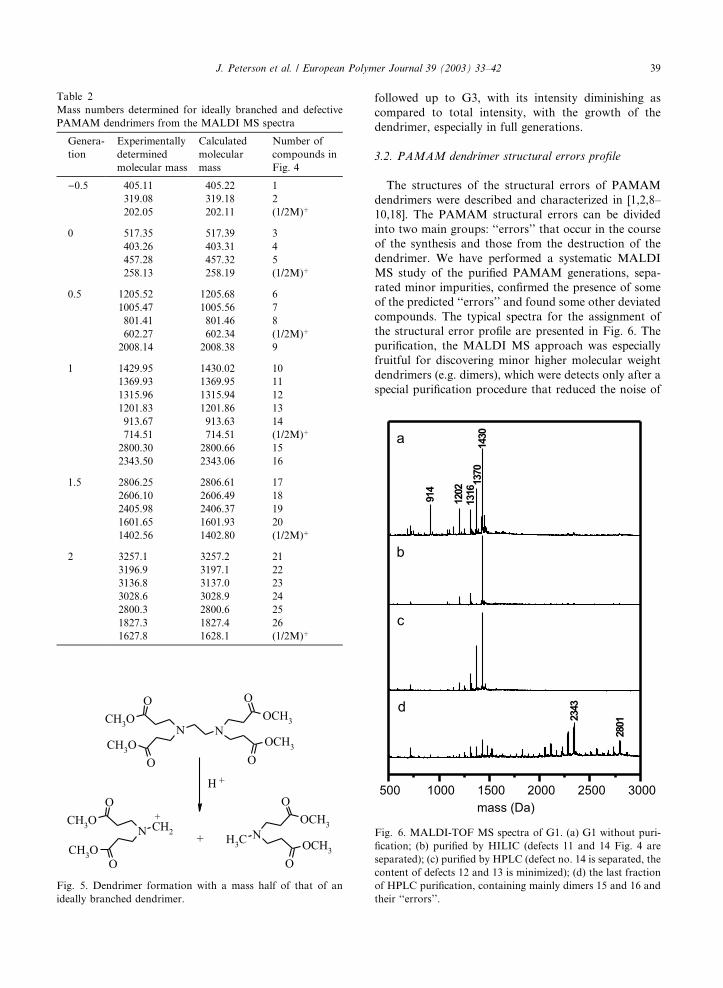
followed up to G3, with its intensity diminishing as
compared to total intensity, with the growth of the
dendrimer, especially in full generations.
3.2. PAMAM dendrimer structural errors profile
The structures of the structural errors of PAMAM
dendrimers were described and characterized in [1,2,8–
10,18]. The PAMAM structural errors can be divided
into two main groups: ‘‘errors’’ that occur in the course
of the synthesis and those from the destruction of the
dendrimer. We have performed a systematic MALDI
MS study of the purified PAMAM generations, sepa-
rated minor impurities, confirmed the presence of some
of the predicted ‘‘errors’’ and found some other deviated
compounds. The typical spectra for the assignment of
the structural error profile are presented in Fig. 6. The
purification, the MALDI MS approach was especially
fruitful for discovering minor higher molecular weight
dendrimers (e.g. dimers), which were detects only after a
special purification procedure that reduced the noise of
Fig. 5. Dendrimer formation with a mass half of that of an
ideally branched dendrimer.
Table 2
Mass numbers determined for ideally branched and defective
PAMAM dendrimers from the MALDI MS spectra
Genera-
tion
Experimentally
determined
molecular mass
Calculated
molecular
mass
Number of
compounds in
Fig. 4
)0.5 405.11 405.22 1
319.08 319.18 2
202.05 202.11 (1/2M)þ
0 517.35 517.39 3
403.26 403.31 4
457.28 457.32 5
258.13 258.19 (1/2M)þ
0.5 1205.52 1205.68 6
1005.47 1005.56 7
801.41 801.46 8
602.27 602.34 (1/2M)þ
2008.14 2008.38 9
1 1429.95 1430.02 10
1369.93 1369.95 11
1315.96 1315.94 12
1201.83 1201.86 13
913.67 913.63 14
714.51 714.51 (1/2M)þ
2800.30 2800.66 15
2343.50 2343.06 16
1.5 2806.25 2806.61 17
2606.10 2606.49 18
2405.98 2406.37 19
1601.65 1601.93 20
1402.56 1402.80 (1/2M)þ
2 3257.1 3257.2 21
3196.9 3197.1 22
3136.8 3137.0 23
3028.6 3028.9 24
2800.3 2800.6 25
1827.3 1827.4 26
1627.8 1628.1 (1/2M)þ
Fig. 6. MALDI-TOF MS spectra of G1. (a) G1 without puri-
fication; (b) purified by HILIC (defects 11 and 14 Fig. 4 are
separated); (c) purified by HPLC (defect no. 14 is separated, the
content of defects 12 and 13 is minimized); (d) the last fraction
of HPLC purification, containing mainly dimers 15 and 16 and
their ‘‘errors’’.
J. Peterson et al. / European Polymer Journal 39 (2003) 33–42 39

other structural units (Fig. 6d, Fig. 7, path c). The
amount of separated structural errors––rich fractions
was not sufficient for the NMR assignment of their
structure.
HILIC separation that depends on the number of
amino groups in the outer layer of the dendrimer al-
lowed for the separation of the defects caused by in-
tramolecular cyclization from the mixture of the first
generation defective dendrimers (Fig. 4, compounds 11
and 14, Fig. 6a, lines 1370 and 914). The HPLC method
was suitable for the separation of some defects accord-
ing to their molar mass. The lowest molar mass defect in
the first generation is compound no. 14 (Fig. 4, Fig. 6a,
line 914), which could be completely separated from the
mixture. By using the HPLC, the content of ‘‘errors’’
(Fig. 4, compounds 12 and 13, Fig. 6a, lines 1316 and
1202) also decreased markedly. Defective dendrimer no.
11 (Fig. 4, Fig. 6a, line 1370), having mass very close to
that of G1 itself, could not be separated by this chro-
matographic method. The HPLC method also allowed
the separation of the dendrimer ‘‘dimers’’ (Fig. 4, com-
pounds 15 and 16, Fig. 6d, lines 2801 and 2343), which
could not be clearly identified by MALDI MS before
chromatographic purification. The spectra in Fig. 6
convincingly prove that the defective dendrimers ob-
served in the mass spectra of various generations of
PAMAM dendrimers were formed in the course of the
side reactions during the synthesis rather than during the
fragmentation of an ideally branched dendrimer during
the analysis. In the silica gel purified fractions (G0.5),
Fig. 7. Concurrent reactions in PAMAM dendrimer synthesis.
Fig. 8. Dimer formation during the synthesis of the half generation.
40 J. Peterson et al. / European Polymer Journal 39 (2003) 33–42

lines corresponding to the dimeric structure (Fig. 4,
compound 9) exist. This structure may form compounds
G0.5 and ‘‘error’’ 8 (according to Fig. 8). This type of
lines are also appears in higher generations. The quan-
tity of the ‘‘ordinary’’ dimers (according to Fig. 7, path
c) is quite small and the corresponding line is nearly on
the level of noise. This kind of dimer (Fig. 4, compound
15) can only be formed in the synthesis of a full gener-
ation.
The primary side reactions in the Starburst PAMAM
dendrimer synthesis are those of the incomplete Michael
addition, resulting in unsymmetrical dendrimeric struc-
tures (Fig. 7, path a). These products are clearly seen in
the MALDI MS spectra of the PAMAM dendrimer
early generations (Fig. 4, compounds 2, 4, 7, 12, 13, 18,
19, 24, 25).
Additionally, the structural errors can form via in-
tramolecular cyclization during the formation of a the
full generation of the dendrimer (Fig. 7, path b; Fig. 4,
compounds 5, 8, 11, 14, 20, 22, 23, 26 detected by
MALDI MS). The presence of many identical ester
groups in the outer shell provides different cyclization
possibilities. As a result, a wide variety of different types
of cyclizized products is formed (e.g., Fig. 4, compounds
5 vs 11; compounds 22 vs 23, etc.).
One source of the structural errors is the retro-
Michael reaction (Fig. 7, path d). We have recently shown
that the Michael reaction is in equilibrium with its
‘‘retro’’ version [19]. This equilibrium depends strongly
on temperature and is significant already in determining
the structural deviations at room temperature. The de-
tected compounds 2, 4, 12, 13, 24, 25 (Fig. 4) may arise
from both––the incomplete Michael reaction or the
retro-Michael reaction, which allows us to complement
the PAMAM dendrimer error formation scheme [18].
The results obtained from the MALDI-TOF spectra
together with the data published about the CZE analysis
of PAMAM dendrimers [5–7] and GC fragmentation
data of the early generations of these dendrimers [19] are
in good accordance with the chemical consideration of
the formation of structural errors of the PAMAM
dendrimer. A general conclusion, however, is that when
choosing ‘‘cold’’ matrixes and working close to the
threshold intensities, the MALDI method conveys im-
portant structural information for the PAMAM den-
drimer lower generations and offers a tool for estimating
the mass distribution for higher generations of the
dendrimer.
Acknowledgement
The authors are grateful to the Estonian Science
Foundation for the financial support (grants 5133, 3781,
4226).
References
[1] Smith PB, Martin SJ, Hall MJ, Tomalia DA. A charac-
terization of the structure and synthetic reactions of
polyamidoamine Starburst polymers. In: Mitchell Jr J,
editor. Applied polymer analysis and characterization.
M€uunchen: Hanser; 1987. p. 357–85.[2] Tomalia DA, Naylor AM, Goddard III WA. Starburst
dendrimers: molecular-level control of size, shape surface
chemistry, topology, and flexibility from atoms to mac-
roscopic matter. Angew Chem Int Ed Engl 1990;29:
138–75.
[3] Tomalia DA, Baker H, Dewald J, Hall M, Kallos G,
Martin S, et al. Dendritic macromolecules: synthesis of
starburst dendrimers. Macromolecules 1986;19(9):2466–8.
[4] Meltzer AD, Tirrell DA, Jones AA, Inglefield PT. Chain
dynamics in poly(amidoamine) dendrimers. A study of 13C
NMR relaxation parameters. Macromolecules 1992;25(18):
4541–8.
[5] Brothers II HM, Piehler LT, Tomalia DA. Slab-gel and
capillary electrophoresis characterization of polyamido-
amine dendrimers. J Chromatogr A 1998;814:233–46.
[6] Peterson J, Ebber A, Allikmaa V, Lopp M. Synthesis and
CZE analysis of PAMAM dendrimers with an ethylenedi-
amine core. Proc Estonian Acad Sci Chem 2001;50(3):156–
66.
[7] Ebber A, Vaher M, Peterson J, Lopp M. Application of
capillary zone electrophoresis to the separation and char-
acterization of poly(amidoamine) dendrimers with an
ethylenediamine core. J Chromatogr A 2002;949:351–8.
[8] Tomalia DA, Baker H, Dewald JR, Hall M, Kallos G,
Martin S, et al. A new class of polymers: starburst-
dendritic macromolecules. Polym J 1985;17:117–32.
[9] Kallos GJ, Tomalia DA, Hedstrand DM, Lewis S, Zhou J.
Molecular weight determination of a polyamidoamine
starburst polymer by electrospray ionization mass spect-
rometry. Rapid Commun Mass Spectrom 1991;5:383–6.
[10] Zhou L, Russell DH, Zhao M, Crooks RM. Character-
ization of poly(amidoamine) dendrimers and their com-
plexes with Cu2þ by matrix-assisted laser desorption
ionization mass spectrometry. Macromolecules 2001;34:
3567–73.
[11] Meltzer AD, Tirrell DA, Jones AA, Inglefield PT. Chain
dynamics in poly(amidoamine) dendrimers. A study of 2H
NMR relaxation parameters. Macromolecules 1992;25(18):
4549–52.
[12] Nielen MWF. Maldi time-of-flight mass spectrometry of
synthetic polymers. Mass Spectrom Rev 1999;18:309–44.
[13] Billeci TM, Stults JT. Tryptic mapping of recombinant
proteins by matrix-assisted laser desorption/ionization
mass spectrometry. Anal Chem 1993;65:1709–16.
[14] Gusev AI, Wilkinson WR, Proctor A, Hercules DM.
Improvement of signal reproducibility and matrix/coma-
trix effects in MALDI analysis. Anal Chem 1995;67(6):
1034–41.
[15] Karas M, Bahr U, Strupat K, Hillenkamp F, Tsrbopoulos
A, Pramanik BN. Matrix dependence of metastable
fragmentation of glycoproteins in MALDI TOF mass
spectrometry. Anal Chem 1995;67(3):675–9.
[16] Kaufmann R, Chaurand P, Kirsch D, Spengler B. Post-
source decay and delayed extraction in matrix-assisted
J. Peterson et al. / European Polymer Journal 39 (2003) 33–42 41
laser desorption/ionization-reflectron time-of-flight mass
spectrometry. Are there trade-offs. Rapid Commun Mass
Spectrom 1996;10:1199–208.
[17] Eight peak index of mass spectra. 2nd ed. vol 1. Alder-
maston, England: Mass Spectrometry Data Centre; 1974.
[18] Toli�cc LP, Anderson GA, Smith RD, Brothers II HM,
Spindler R, Tomalia DA. Electrospray ionization Fourier
transform ion cyclotron resonance mass spectrometric
characterization of high molecular mass Starburste den-
drimers. Int J Mass Spectrom Ion Process 1997;165/
166(II):405–18.
[19] Peterson J, Allikmaa V, Pehk T, Lopp M. Fragmentation
of PAMAM dendrimers in methanol. Proc Estonian Acad
Sci Chem 2001;50(3):167–72.
42 J. Peterson et al. / European Polymer Journal 39 (2003) 33–42