structural basis for functional cooperation between tandem helicase
TRANSCRIPT
Santos et al., Supplemental Data
S1
Supporting Information Structural basis for functional cooperation between tandem helicase cassettes in Brr2-mediated remodeling of the spliceosome
Karine F. Santosa,1, Sina Mozaffari Jovinb,1, Gert Webera, Vladimir Penab, Reinhard
Lührmannb,2, Markus C. Wahla,2
a Freie Universität Berlin, Fachbereich Biologie/Chemie/Pharmazie, Abteilung
Strukturbiochemie, Takustraße 6, D-14195 Berlin, Germany.
b Max-Planck-Institut für Biophysikalische Chemie, Abteilung Zelluläre Biochemie, Am Faßberg
11, D-37077 Göttingen, Germany.
1 These authors contributed equally to this work.
2 To whom correspondence should be addressed. E-mail: reinhard.luehrmann@mpi-
bpc.mpg.de, [email protected].
Santos et al., Supplemental Data
S2
SI Methods
Cloning and Mutagenesis. A synthetic gene encoding hBrr2 was cloned into a modified pFL
vector under control of the very late polyhedrin promoter (1) in frame with an N-terminal His6-
tag. The coding regions of hBrr2HR (residues 395-2129) and of the individual cassette constructs
(N-terminal cassette: residues 395-1324; C-terminal cassette: residues 1282-2136) were
inserted into the same vector in frame with a TEV-cleavable N-terminal His10-tag. The
expression constructs were individually integrated via Tn7 transposition into a baculovirus
genome (EMBacY) maintained as a bacterial artificial chromosome (BAC) in E. coli (2). The Tn7
transposition site was embedded in a lacZα gene allowing the selection of positive EMBacY
recombinants by blue/white screening. Recombinant BACs were isolated from the bacterial
hosts and used to transfect Sf9 cells. Site-directed mutagenesis was performed using the
QuikChange II XL Site-Directed Mutagenesis Kit (Stratagene). All constructs were verified by
sequencing.
Protein Production. All proteins were produced in insect cells. For initial virus (V0) production,
the isolated recombinant baculoviral DNA was transfected into adhesive Sf9 cells (Invitrogen) in
6-well plates. The efficiency of transfection was monitored by eYFP fluorescence. The initial
virus was harvested 60 h post-transfection and used to infect a 25 ml suspension culture of Sf21
cells (Invitrogen) for further virus amplification (V1). The amplified virus was harvested 60 h after
cell proliferation arrest. For large scale expression of proteins, 400 ml of High Five cells
(Invitrogen) kept in suspension at 0.5 x 10⁶ cells/ml were infected with 1 ml of V1 virus. Samples
of 106 cells were taken from the infected culture every 12 h for cell counting, size determination,
eYFP fluorescence measurements and monitoring of protein production by SDS-PAGE. The
infected cells were harvested when the eYFP signal reached a plateau and before the cell
viability dropped below 85 %.
Santos et al., Supplemental Data
S3
Protein Purification. If not mentioned otherwise, the same purification protocol was used for all
hBrr2 constructs. The High Five cell pellet was resuspended in 50 mM HEPES, pH 7.5, 600 mM
NaCl, 2 mM β-mercaptoethanol, 0.05 % NP40, 10 % glycerol, 10 mM imidazole, supplemented
with protease inhibitors (Roche) and lyzed by sonication using a Sonopuls Ultrasonic
Homogenizer HD 3100 (Bandelin). The target was captured from the cleared lysate on a 5 ml
HisTrap FF column (GE Healthcare) and eluted with a linear gradient from 10 to 250 mM
imidazole. The His-tag was cleaved with TEV protease during overnight dialysis at 4 ºC against
50 mM HEPES, pH 7.5, 600 mM NaCl, 2 mM β-mercaptoethanol, 10 % glycerol, 15 mM
imidazole. The cleaved protein was again loaded on a 5 ml HisTrap FF column to remove the
His-tagged protease, uncut protein and cleaved His-tag. The flow-through was diluted to a final
concentration of 80 mM sodium chloride and loaded on a Mono Q 10/100 GL column (GE
Healthcare) equilibrated with 25 mM Tris-HCl, pH 8.0, 50 mM NaCl, 2 mM β-mercaptoethanol.
The protein was eluted with a linear 50 to 600 mM sodium chloride gradient and further purified
by gel filtration on a 26/60 Superdex 200 gel filtration column (GE Healthcare) in 10 mM Tris-
HCl, pH 7.5, 200 mM NaCl, 2 mM DTT. For the purification of hBrr2NC and hBrr2HR mutants, all
solutions used were buffered at pH 8.0. All proteins produced for activity assays retained an N-
terminal His-tag since the TEV cleavage and HisTrap FF recycling steps were omitted.
Limited Proteolysis. For limited proteolysis of full-length hBrr2, 9 µg of protein were incubated
with increasing amounts (0.004, 0.04 and 0.4 µg) of protease at 20 ºC for 30 minutes in buffer
containing 10 mM Tris-HCl, pH 7.5, 150 mM NaCl, 2 mM DTT. The reactions were stopped by
addition of 2 µl PMSF (saturated solution in isopropanol) and 10 µl SDS-PAGE loading buffer.
Half of each sample was separated by SDS-PAGE and bands were analyzed by tryptic mass
spectrometric fingerprinting (Facility for Mass Spectrometry, Max-Planck-Institute for Biophysical
Santos et al., Supplemental Data
S4
Chemistry, Göttingen, Germany). The remainder of the sample was separated by SDS-PAGE,
blotted on a PVDF membrane, stained with Ponceau S and stable fragments were subjected to
N-terminal sequencing (Microchemistry Core Facility, Max-Planck-Institute for Biochemistry,
Martinsried, Germany).
RNA Production. As in previous reports (3), we used yeast U4/U6 di-snRNA to measure
stimulated ATPase activities and as a substrate in most helicase assays. Yeast U4/U6 di-
snRNA is closely related to the corresponding human duplex but exhibits higher thermal
stability. Both U4 and U6 snRNAs were generated by in vitro transcription with T7 RNA
polymerase. After dephosphorylation of U4 snRNA with calf intestinal alkaline phosphatase
(New England Biolabs), the RNA was 5’-end labeled with [γ-32P] ATP (Perkin-Elmer) using T4
polynucleotide kinase (New England Biolabs). Radiolabeled U4 snRNA was annealed to a 5-
fold molar excess of U6 snRNA, and U4/U6 di-snRNA was purified by 5 % non-denaturing
PAGE.
For some helicase and comparative RNA binding assays, a linear 12-base pair (bp) RNA
duplex with a 31-nucleotide 3’-single stranded overhang was used. The 12-nucleotide RNA
strand (5’-CGGCUCGCGGCC-3’) was purchased from IBA GmbH (for binding studies labeled
at the 3’-end with fluorescein) and the complementary RNA oligonucleotide (5’-
GGCCGCGAGCCGGAAATTTAATTATAAACCAGACCGTCTCCTC-3’) was produced by in vitro
transcription with T7 RNA polymerase. For helicase assays, the 12-mer oligonucleotide was 5’-
end labeled with [γ-32P] ATP, annealed to a 2-fold molar excess of unlabeled complementary
oligonucleotide and the RNA duplex was further purified by 12 % non-denaturing PAGE. For
binding studies, equimolar amounts of the complementary strands were annealed.
Santos et al., Supplemental Data
S5
ATPase Assays. Steady-state ATPase assays were carried out with purified, recombinant
proteins in 40 mM Tris-HCl, pH 7.5, 50 mM NaCl, 8 % glycerol, 0.5 mM MgCl2, 100 ng/µl
acetylated BSA, 1.5 mM DTT. To measure RNA-stimulated ATPase activities, 0.5 µM U4/U6 di-
snRNA was added. After pre-incubation of 25 or 40 nM protein for 5 min at 20 °C, reactions
were initiated by addition of 0.5 mM ATP/MgCl2 and incubated for an additional 20 min. The
amount of liberated inorganic phosphate was monitored using a malachite dye-based kit
(PiColorLock™ Gold, Innova Biosciences) in 96-well plates. The ATPase activities were
calculated as the number of ATP molecules hydrolyzed per protein molecule per second (ATP
turnover rate).
RNA Unwinding Assays. Helicase assays were performed at 20 °C with 100 nM purified,
recombinant proteins and 0.5 nM RNA substrate in a buffer containing 40 mM Tris-HCl, pH 7.5,
50 mM NaCl, 8 % glycerol, 0.5 mM MgCl2, 100 ng/µl acetylated BSA, 1 U/µl RNasin, 1.5 mM
DTT. After 5 min pre-incubation, reactions were initiated by adding 1 mM ATP/MgCl2. Aliquots
were withdrawn at the indicated time points and quenched with two volumes of stop buffer (40
mM Tris-HCl, pH 7.4, 50 mM NaCl, 25 mM EDTA, 1 % SDS, 10 % glycerol, 0.05 % xylene
cyanol, 0.05 % bromophenol blue). The samples were separated by non-denaturing PAGE,
RNA bands visualized using a phosphoimager (Molecular Dynamics) and quantified by Quantity
One software (Bio-Rad). The fraction of displaced RNA in each sample was calculated as Iss/(Iss
+ Idx), in which Iss is the intensity of the band corresponding to single-stranded RNA and Idx the
intensity of the band corresponding to duplex RNA. All data were standardized and fit to a first-
order kinetics equation (Fraction unwound = A{1-exp(-ku t)}; A - amplitude of the reaction; ku -
apparent rate constant of unwinding; t - time) using Graphpad Prism (Graphpad Software, Inc.).
Santos et al., Supplemental Data
S6
RNA Binding Assays. 1-2 nM of labeled RNA duplex were titrated with increasing
concentrations of proteins in 40 µl binding buffer (40 mM Tris-HCl, pH 7.5, 50 mM NaCl, 8 %
glycerol, 0.5 mM MgCl2, 100 ng/µl acetylated BSA, 1.5 mM DTT). Binding was measured by
fluorescence polarization in a 384-well microtiter plate (black OptiPlate-384, Perkin-Elmer) using
a Victor plate reader (Perkin-Elmer). Change in the calculated anisotropy was plotted against
protein concentration and fit to a single-ligand binding model using Graphpad Prism. The
apparent equilibrium dissociation constant (Kd) was determined using the equation AI =
Bmax*[S]/(Kd + [S]), in which AI is the calculated value of anisotropy, Bmax is the maximum binding
and [S] is the concentration of the protein.
Crystallization and Diffraction Data Collection. Crystallizations of Brr2HR and hBrr2HR,S1087L
were carried out at 20 ºC using the sitting drop vapor diffusion method. Crystals were obtained
by mixing 1 µl of protein solution at 10 mg/ml with 1 µl of reservoir solution (0.1 M sodium
acetate or sodium citrate, pH 4.6 or pH 5.0, 1.2 M sodium malonate) and optimized by micro-
seeding and addition of a cocktail of additives (Silver Bullets condition 12; Hampton Research).
The crystals were cryo-protected by transfer into a solution containing 0.1 M sodium acetate or
sodium citrate, pH 4.6 or pH 5.0, 3.0 M sodium malonate and 0.1 M sodium chloride and flash-
cooled in liquid nitrogen.
Co-crystallization with nucleotides failed due to the high salt concentration required for
hBrr2HR crystallization. To soak nucleotides into the crystals, hBrr2HR crystals were stabilized by
cross-linking (4) and transferred for 30 min at 20 ºC into a fresh 2 µl drop containing a low salt
soaking buffer (0.1 M sodium acetate or sodium citrate, pH 4.6 or pH 5.0, 0.1 M sodium
malonate, 10 mM MgCl2, 25 mM nucleotide). The soaked crystals were cryo-protected by
transfer into soaking buffer plus 30 % glycerol or ethylene glycol and flash-cooled in liquid
nitrogen. Diffraction data were collected at beamline 14.2 of BESSY II (HZB, Berlin, Germany),
Santos et al., Supplemental Data
S7
beamline PXII of SLS (Paul Scherrer Institute, Villigen, Switzerland) and beamline P14 of
PETRA III (DESY, Hamburg, Germany) and processed with XDS (5) and HKL2000 (6) (SI
Appendix, Table S1).
Structure Solution, Model Building and Refinement. We solved the structure of hBrr2HR,S1087L
by multiple isomorphous replacement with anomalous scattering (MIRAS). Samarium and
tantalum derivatives were prepared by soaking crystals in mother liquor containing 0.3 mM
samarium chloride (Hampton Research) or 5 mM tantalum bromide (Jena Bioscicence) for 12 h
at 20 ºC. Derivatized crystals were cryo-protected by transfer into a solution containing 0.1 M
sodium acetate or sodium citrate, pH 4.6 or pH 5.0, 3.0 M sodium malonate, 0.1 M sodium
chloride, and flash-cooled in liquid nitrogen. A bromide derivative was prepared by soaking a
crystal for one minute in cryo-buffer supplemented with 1 M sodium bromide and flash-cooling in
liquid nitrogen.
Samarium sites were located and initial phases were calculated using the SHELX program
suite (7). Initial phases were used to locate tantalum and bromide sites by difference Fourier
analyses. MIRAS phases were calculated and refined using SHARP (8) and improved by
solvent flattening with DM (9). Model building was done using COOT (10) and the model was
refined using REFMAC5 (11) (Table S1). To verify the chain tracing, a highly redundant data set
was collected from a native crystal at 2.071 Å X-ray wavelength (Table S1) and used with
combined model and experimental phases to calculate an anomalous difference Fourier map,
which revealed the position of sulfur atoms in cysteine and methionine side chains. The
structure of hBrr2HR and nucleotide-bound structures were solved with Molrep (12) using the
coordinates of the hBrr2HR,S1087L structure as a search model and refined using REFMAC5 with
manual model building in COOT (Table S1).
Santos et al., Supplemental Data
S8
Modeling of a hBrr2HR-RNA Complex. For targeted mutational analyses aimed at elucidating
which hBrr2 elements are important for RNA binding, we modeled RNA at the active N-terminal
cassette of hBrr2HR. Modeling was guided by the nucleic acid-bound structures of the related
SF2 DNA helicase Hel308 (13) and the SF2 RNA helicase Mtr4 (14). We superimposed the
Hel308-DNA structure (PDB ID 2P6R) onto the N-terminal cassette of Brr2HR, converted DNA to
RNA and manually adjusted the nucleic acid in COOT to reduce clashes with the protein. The
protein structure was left unchanged.
SI Results and Discussion
Experimental Definition, Production, Crystallization and Structural Analysis of hBrr2HR.
We produced full-length hBrr2 in insect cell culture and purified it to near homogeneity. The
protein was active in ATP-dependent U4/U6 duplex unwinding but failed to crystallize. In order
to remove putatively flexible regions that may hinder crystallization, we treated hBrr2 with
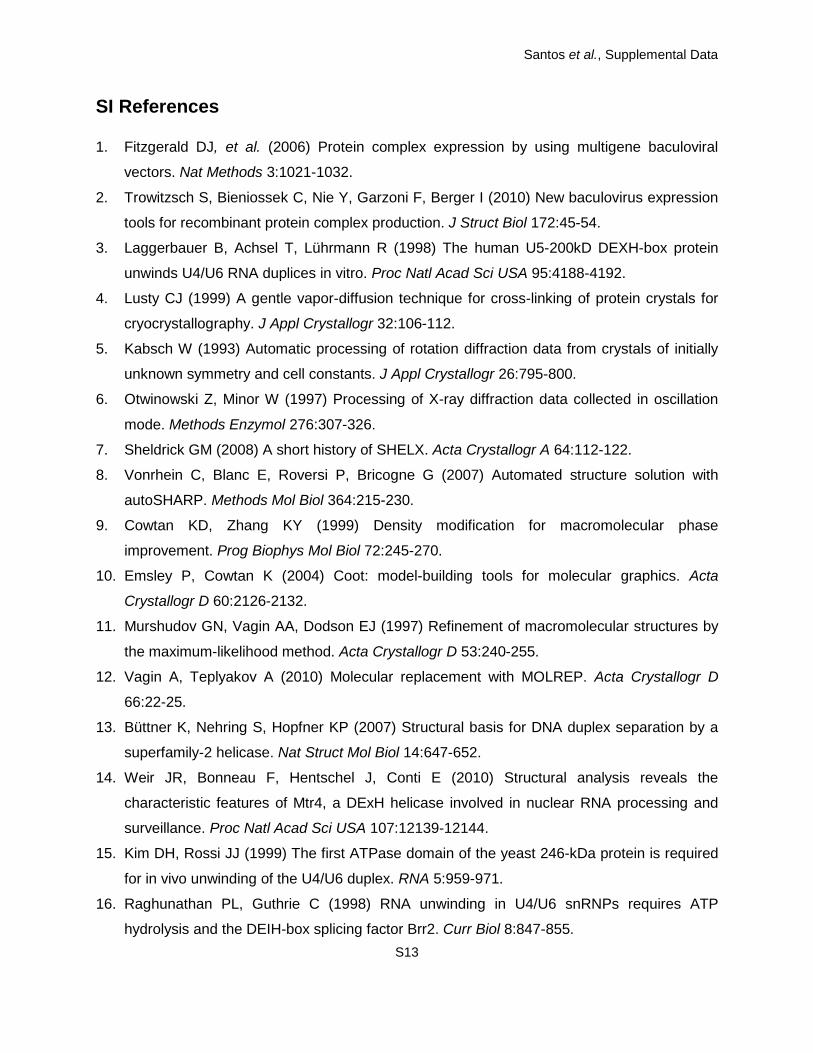
proteases, several of which gave rise to a stable ca. 200 kDa fragment (SI Appendix, Fig. S1A).
Mass spectrometric fingerprinting and N-terminal micro-sequencing showed that chymotrypsin
yielded a fragment whose N-terminus coincided with the predicted start of the first RecA domain
(residue 458), while subtilisin left about 60 additional N-terminal residues (start residue 395).
The region encompassing the two helicase cassettes remained intact even upon prolonged
protease treatment.
We produced and purified four truncated proteins corresponding to the protease-resistant
portions of hBrr2 (residues 395-2136; 395-2129; 458-2136 and 458-2129) with and without a
short C-terminal peptide that lacked electron density in the crystal structure of the hBrr2 Sec63
unit (PDB ID 2Q0Z). While removal of the last seven residues had no effect on the helicase
activity, deletion of the ca. 60 residues preceding the first RecA domain led to a severe drop in
duplex unwinding (SI Appendix, Fig. S1B). Further work, therefore, focused on hBrr395-2129
Santos et al., Supplemental Data
S9
(hBrr2HR). hBrr2HR exhibited low intrinsic ATPase activity, stimulated more than tenfold by
addition of U4/U6 di-snRNA, and efficiently unwound the U4/U6 duplex in an ATP-dependent
fashion (Fig. 2B-D).
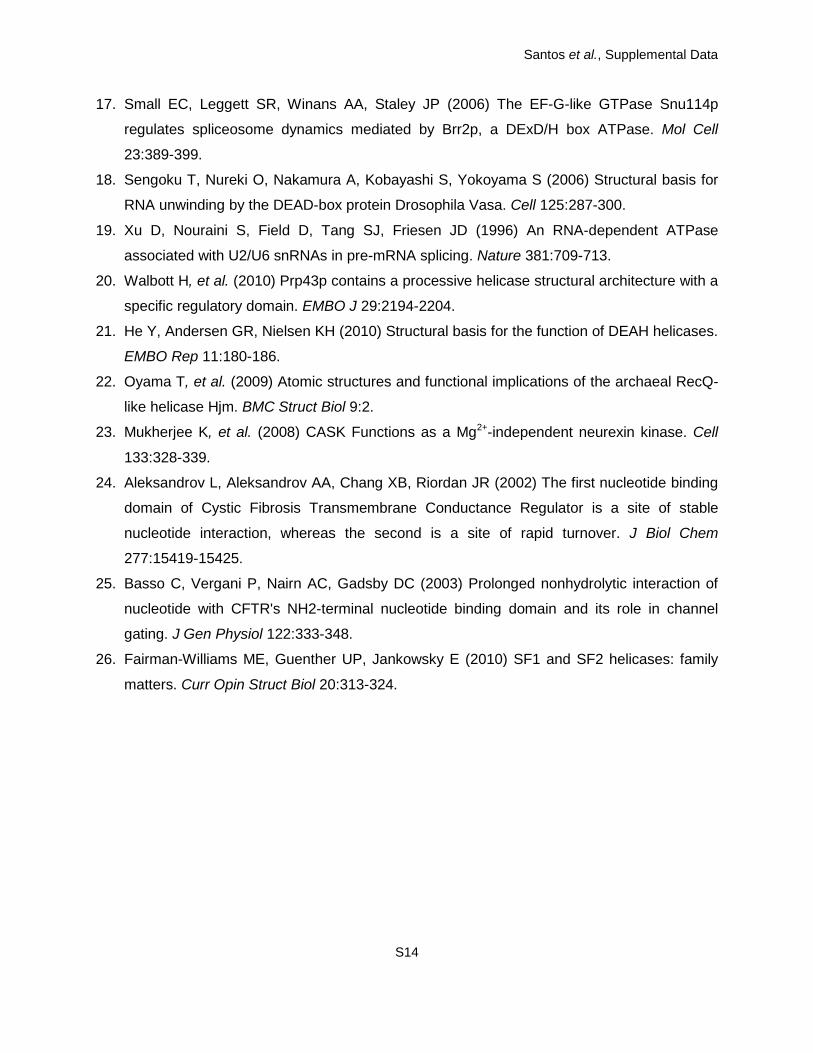
hBrr2HR structures were refined to low Rwork/Rfree values with good stereochemistry (SI
Appendix, Table S1). Residues 403-2125 of hBrr2HR could be fully traced with only a few
exposed loop regions exhibiting weaker than average electron density. Chain tracing was
verified using the anomalous scattering of sulfur atoms, which revealed the positions of the vast
majority of cysteine and methionine side chains (SI Appendix, Fig. S2A and B).
Production and Characterization of Mutant Proteins. All proteins could be efficiently
expressed and purified. In thermofluor-based thermal melting analyses, all variants exhibited
cooperative transitions with comparable melting temperatures. Furthermore, equilibrium CD
spectra were indicative of a high content of regular secondary structure in all hBrr2 variants.
These data indicate that all Brr2 variants tested herein were well folded and that mutant
phenotypes were not simply a result of a loss of stable tertiary structure.
In order to study the activities of the isolated cassettes of hBrr2, we systematically screened
breakpoints along the inter-cassette linker to generate soluble fragments encompassing the N-
or C-terminal cassette alone. Among 26 different constructs tested (13 encompassing the N-
terminal cassette and 13 encompassing the C-terminal cassette), only fragments 395-1324
(hBrr2NC, comprising the N-terminal extension, N-terminal cassette and the inter-cassette linker)
and 1282-2136 (hBrr2CC, comprising the inter-cassette linker and the C-terminal cassette) could
be produced in soluble form and purified. In gel filtration analysis, no stable complex was
formed between the separately produced and mixed cassette constructs, possibly due to the
overlap in the linker element.
Santos et al., Supplemental Data
S10
hBrr2HR, hBrr2NC and hBrr2CC were based on the wt hBrr2 sequence. All other variants
investigated herein additionally carried the S1087L mutation. The effects of this latter mutation
on Brr2HR structure, RNA binding, ATPase and helicase activities are rather mild (SI Appendix,
Fig. S7). Additional mutations are expected to show the same trend in hBrr2HR as in
hBrr2HR,S1087L. We reasoned that the primary S1087L mutation would “sensitize” the protein,
rendering the phenotypes of other mutations more easily experimentally accessible.
Structural Basis for the Dysfunction of Previously Studied Brr2 Variants. Our structure
helps to explain the mechanisms for the dysfunction of Brr2 mutants that have been
investigated in the past. yBrr2 variants with mutations in helicase motifs I (G526D/K527N) and II
(D634G) in the N-terminal cassette did not support yeast viability, U4/U6 di-snRNA unwinding or
yBrr2 ATPase activity (15). The equivalent residues in other helicases are known to be involved
in nucleotide binding and hydrolysis. As expected, the corresponding residues in hBrr2 (G508,
K509 and D615) line the ATP pocket of the N-terminal cassette and contact the nucleotide
phosphates (G508, K509) or are expected to coordinate a metal ion (D615) upon productive
accommodation of ATP (Fig. 3A).
The yeast brr2-1 allele directs the exchange of E610 in yBrr2 for a glycine leading to
impeded U4/U6 di-snRNA unwinding (16) and failure to release the excised intron and to
dissociate snRNAs during spliceosome disassembly (17). The equivalent E591 of hBrr2 lies at
the center of motif Ic (SI Appendix, Fig. S8A), which has been seen to interact with nucleic acids
in other SF2 helicases (13-14, 18). Consistently, in the present structure E591 is exposed on
the inner surface of the presumed RNA-binding tunnel across from the ratchet helix (SI
Appendix, Fig. S8A). It also interacts with the neighboring R624, thus positioning this residue for
RNA binding and contributing to the stability of the first RecA domain (SI Appendix, Fig. S8A).
Santos et al., Supplemental Data
S11
The E909K exchange in yBrr2 led to a block of pre-mRNA splicing before the first catalytic
step (19). The affected glutamate (E890 in hBrr2) is positioned in a peptide linking the RecA-2
and WH domains of the N-terminal cassette and stabilizes the domain arrangement by
interacting concomitantly with the side chains of N657 (second RecA domain), R928 and Y936
(WH domain; SI Appendix, Fig. S8B).
Nucleotide Binding and Structural Basis for the Lack of ATPase Activity in the C-
Terminal Cassette. In addition to a non-hydrolyzable analog (Mg2+-AMPPNP), we soaked
hBrr2HR and hBrr2HR,S1087L crystals with Mg2+-ATP or transition state analogs (ADP-AlFx, ADP-
BeFx). All experiments yielded similar results (Fig. 3). At the N-terminal cassette, an ADP
moiety could be fitted to clear difference electron density between the two RecA domains (Fig.
3A). Unlike in spliceosomal DEAH helicases (20-21), Q485 (Q loop) interacts with the N6 and
N7 positions of the adenine, explaining the ATP/CTP specificity of hBrr2 (3). The nucleotide was
bound almost exclusively by motifs from the first RecA domain and lacked interactions with
RecA-2 required for hydrolysis (Fig. 3A). Very similar non-hydrolytic binding modes were
recently seen in Mtr4 (14) and Hjm (22), suggesting that RNA binding is additionally required to
elicit an active ATPase conformation in Ski2-like helicases and explaining the low intrinsic
ATPase activity of hBrr2HR.
Strikingly, we found that a Mg2+-ATP complex, again selected through a Q loop (Q1332),
bound at the C-terminal cassette (Fig. 3B). Presence of a single divalent metal ion coordinated
by the ß and γ -phosphates, D1454 (motif II) and a water molecule was verified by anomalous
difference density in a long-wavelength data set collected on a crystal soaked with Mn2+-ATP
(Fig. 3B). Contacts of the RecA-2 domain to the bound nucleotide were completely lacking. In
addition to previously noted non-canonical residues, a complex interplay among the motifs
renders the C-terminal cassette incapable of hydrolyzing bound ATP. H1690 (motif VI), which is
Santos et al., Supplemental Data
S12
an arginine in canonical SF2 helicases, is too short to contact the ATP phosphates. The
following residue, N1692, is a glycine or alanine in active helicases (e.g. G857 in the N-terminal
cassette). N1692 engages in a hydrogen bond with the backbone carbonyl of G1353 (motif I)
from the first RecA domain and thereby locks both H1690 and R1693 (motif VI) in orientations
pointing away from the ATP phosphates, hindering the C-terminal cassette to adopt a
conformation conducive to hydrolysis. As a further consequence, N1655 (motif V) in the second
RecA domain is pushed away from the nucleotide sugar, which it contacts in active SF2
helicases.
We note that similar regulatory principles as in Brr2 may also be at work in other proteins
from diverse cellular contexts, which are composed of active and inactive nucleotide
binding/hydrolyzing domains, such as the membrane associated guanylate kinase CASK (23) or
the cystic fibrosis transmembrane conductance regulator (24-25).
Santos et al., Supplemental Data
S13
SI References
1. Fitzgerald DJ, et al. (2006) Protein complex expression by using multigene baculoviral
vectors. Nat Methods 3:1021-1032.
2. Trowitzsch S, Bieniossek C, Nie Y, Garzoni F, Berger I (2010) New baculovirus expression
tools for recombinant protein complex production. J Struct Biol 172:45-54.
3. Laggerbauer B, Achsel T, Lührmann R (1998) The human U5-200kD DEXH-box protein
unwinds U4/U6 RNA duplices in vitro. Proc Natl Acad Sci USA 95:4188-4192.
4. Lusty CJ (1999) A gentle vapor-diffusion technique for cross-linking of protein crystals for
cryocrystallography. J Appl Crystallogr 32:106-112.
5. Kabsch W (1993) Automatic processing of rotation diffraction data from crystals of initially
unknown symmetry and cell constants. J Appl Crystallogr 26:795-800.
6. Otwinowski Z, Minor W (1997) Processing of X-ray diffraction data collected in oscillation
mode. Methods Enzymol 276:307-326.
7. Sheldrick GM (2008) A short history of SHELX. Acta Crystallogr A 64:112-122.
8. Vonrhein C, Blanc E, Roversi P, Bricogne G (2007) Automated structure solution with
autoSHARP. Methods Mol Biol 364:215-230.
9. Cowtan KD, Zhang KY (1999) Density modification for macromolecular phase
improvement. Prog Biophys Mol Biol 72:245-270.
10. Emsley P, Cowtan K (2004) Coot: model-building tools for molecular graphics. Acta
Crystallogr D 60:2126-2132.
11. Murshudov GN, Vagin AA, Dodson EJ (1997) Refinement of macromolecular structures by
the maximum-likelihood method. Acta Crystallogr D 53:240-255.
12. Vagin A, Teplyakov A (2010) Molecular replacement with MOLREP. Acta Crystallogr D
66:22-25.
13. Büttner K, Nehring S, Hopfner KP (2007) Structural basis for DNA duplex separation by a
superfamily-2 helicase. Nat Struct Mol Biol 14:647-652.
14. Weir JR, Bonneau F, Hentschel J, Conti E (2010) Structural analysis reveals the
characteristic features of Mtr4, a DExH helicase involved in nuclear RNA processing and
surveillance. Proc Natl Acad Sci USA 107:12139-12144.
15. Kim DH, Rossi JJ (1999) The first ATPase domain of the yeast 246-kDa protein is required
for in vivo unwinding of the U4/U6 duplex. RNA 5:959-971.
16. Raghunathan PL, Guthrie C (1998) RNA unwinding in U4/U6 snRNPs requires ATP
hydrolysis and the DEIH-box splicing factor Brr2. Curr Biol 8:847-855.
Santos et al., Supplemental Data
S14
17. Small EC, Leggett SR, Winans AA, Staley JP (2006) The EF-G-like GTPase Snu114p
regulates spliceosome dynamics mediated by Brr2p, a DExD/H box ATPase. Mol Cell
23:389-399.
18. Sengoku T, Nureki O, Nakamura A, Kobayashi S, Yokoyama S (2006) Structural basis for
RNA unwinding by the DEAD-box protein Drosophila Vasa. Cell 125:287-300.
19. Xu D, Nouraini S, Field D, Tang SJ, Friesen JD (1996) An RNA-dependent ATPase
associated with U2/U6 snRNAs in pre-mRNA splicing. Nature 381:709-713.
20. Walbott H, et al. (2010) Prp43p contains a processive helicase structural architecture with a
specific regulatory domain. EMBO J 29:2194-2204.
21. He Y, Andersen GR, Nielsen KH (2010) Structural basis for the function of DEAH helicases.
EMBO Rep 11:180-186.
22. Oyama T, et al. (2009) Atomic structures and functional implications of the archaeal RecQ-
like helicase Hjm. BMC Struct Biol 9:2.
23. Mukherjee K, et al. (2008) CASK Functions as a Mg2+-independent neurexin kinase. Cell
133:328-339.
24. Aleksandrov L, Aleksandrov AA, Chang XB, Riordan JR (2002) The first nucleotide binding
domain of Cystic Fibrosis Transmembrane Conductance Regulator is a site of stable
nucleotide interaction, whereas the second is a site of rapid turnover. J Biol Chem
277:15419-15425.
25. Basso C, Vergani P, Nairn AC, Gadsby DC (2003) Prolonged nonhydrolytic interaction of
nucleotide with CFTR's NH2-terminal nucleotide binding domain and its role in channel
gating. J Gen Physiol 122:333-348.
26. Fairman-Williams ME, Guenther UP, Jankowsky E (2010) SF1 and SF2 helicases: family
matters. Curr Opin Struct Biol 20:313-324.
Santos et al., Supplemental Data
S15
SI Figures
Fig. S1. Definition of hBrr2HR. (A) Limited proteolysis of full-length hBrr2. Stable, ca. 200 kDa
fragments obtained with subtilisin and chymotrypsin are boxed. (B) Helicase activity of hBrr2
fragments. Borders of the fragments analyzed are shown above the gel. Running positions of
the U4/U6 duplex (U4* – U4 labeled) and U4 snRNA are indicated.
Santos et al., Supplemental Data
S16
Santos et al., Supplemental Data
S17
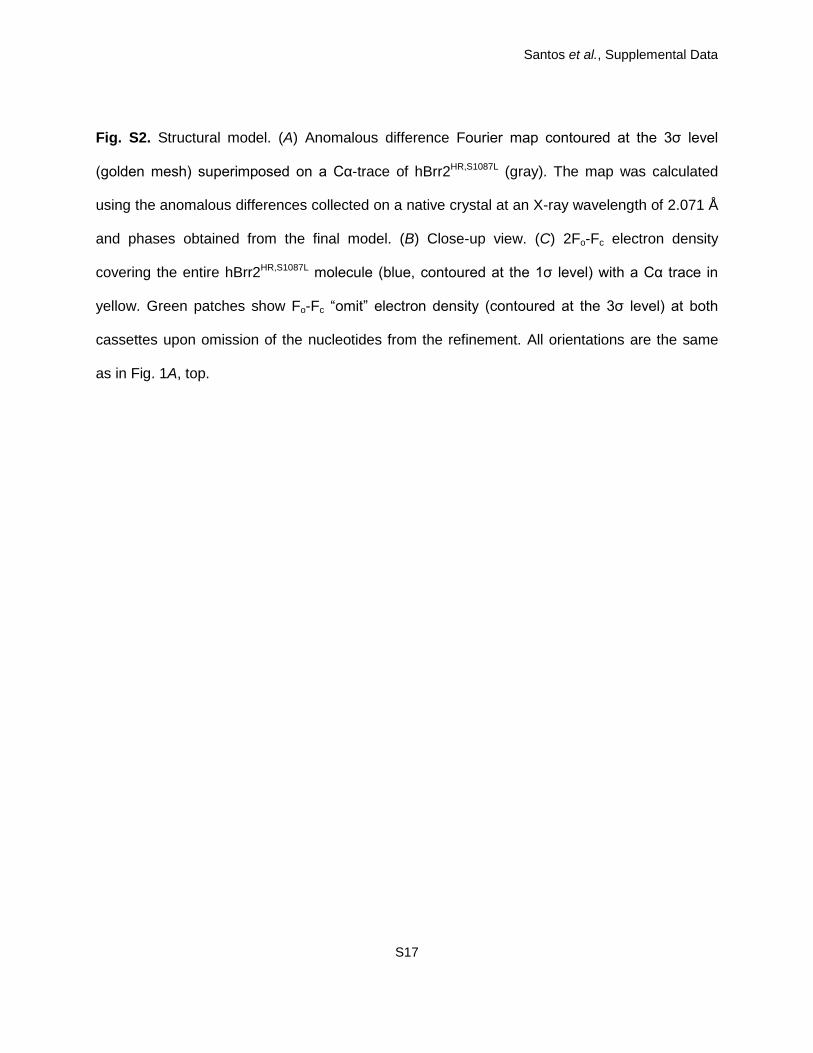
Fig. S2. Structural model. (A) Anomalous difference Fourier map contoured at the 3σ level
(golden mesh) superimposed on a Cα-trace of hBrr2HR,S1087L (gray). The map was calculated
using the anomalous differences collected on a native crystal at an X-ray wavelength of 2.071 Å
and phases obtained from the final model. (B) Close-up view. (C) 2Fo-Fc electron density
covering the entire hBrr2HR,S1087L molecule (blue, contoured at the 1σ level) with a Cα trace in
yellow. Green patches show Fo-Fc “omit” electron density (contoured at the 3σ level) at both
cassettes upon omission of the nucleotides from the refinement. All orientations are the same
as in Fig. 1A, top.
Santos et al., Supplemental Data
S18
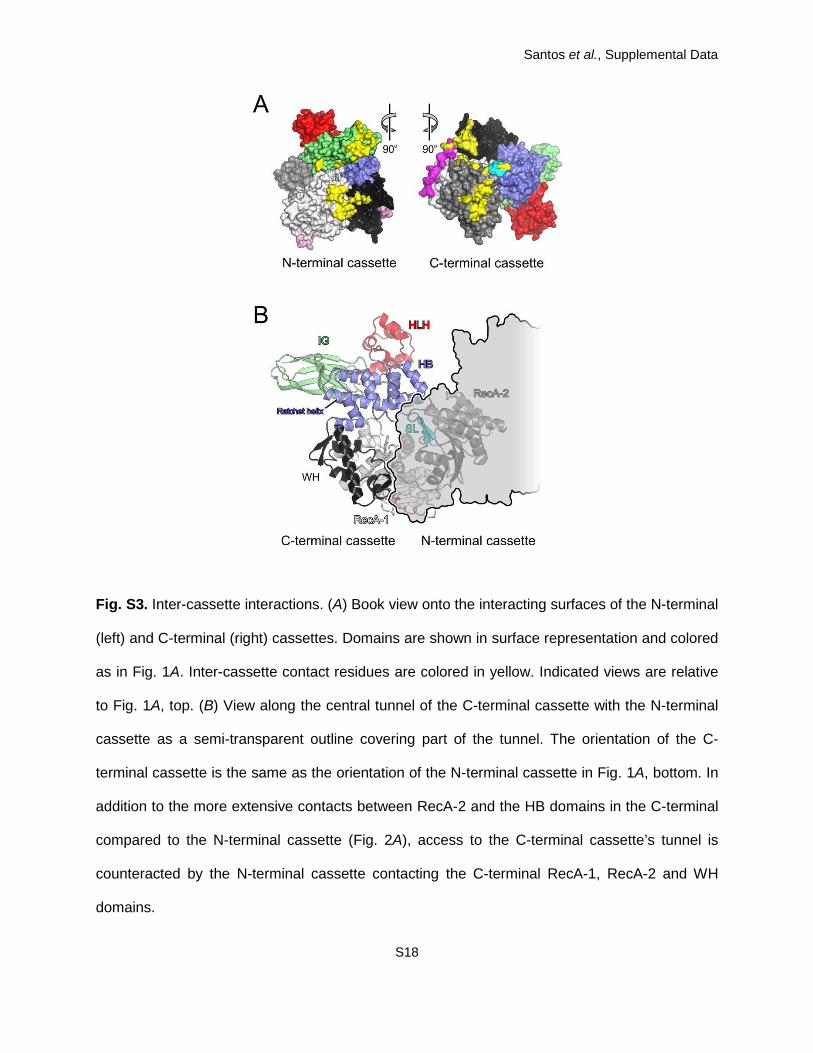
Fig. S3. Inter-cassette interactions. (A) Book view onto the interacting surfaces of the N-terminal
(left) and C-terminal (right) cassettes. Domains are shown in surface representation and colored
as in Fig. 1A. Inter-cassette contact residues are colored in yellow. Indicated views are relative
to Fig. 1A, top. (B) View along the central tunnel of the C-terminal cassette with the N-terminal
cassette as a semi-transparent outline covering part of the tunnel. The orientation of the C-
terminal cassette is the same as the orientation of the N-terminal cassette in Fig. 1A, bottom. In
addition to the more extensive contacts between RecA-2 and the HB domains in the C-terminal
compared to the N-terminal cassette (Fig. 2A), access to the C-terminal cassette’s tunnel is
counteracted by the N-terminal cassette contacting the C-terminal RecA-1, RecA-2 and WH
domains.
Santos et al., Supplemental Data
S19
Santos et al., Supplemental Data
S20
Santos et al., Supplemental Data
S21
Santos et al., Supplemental Data
S22
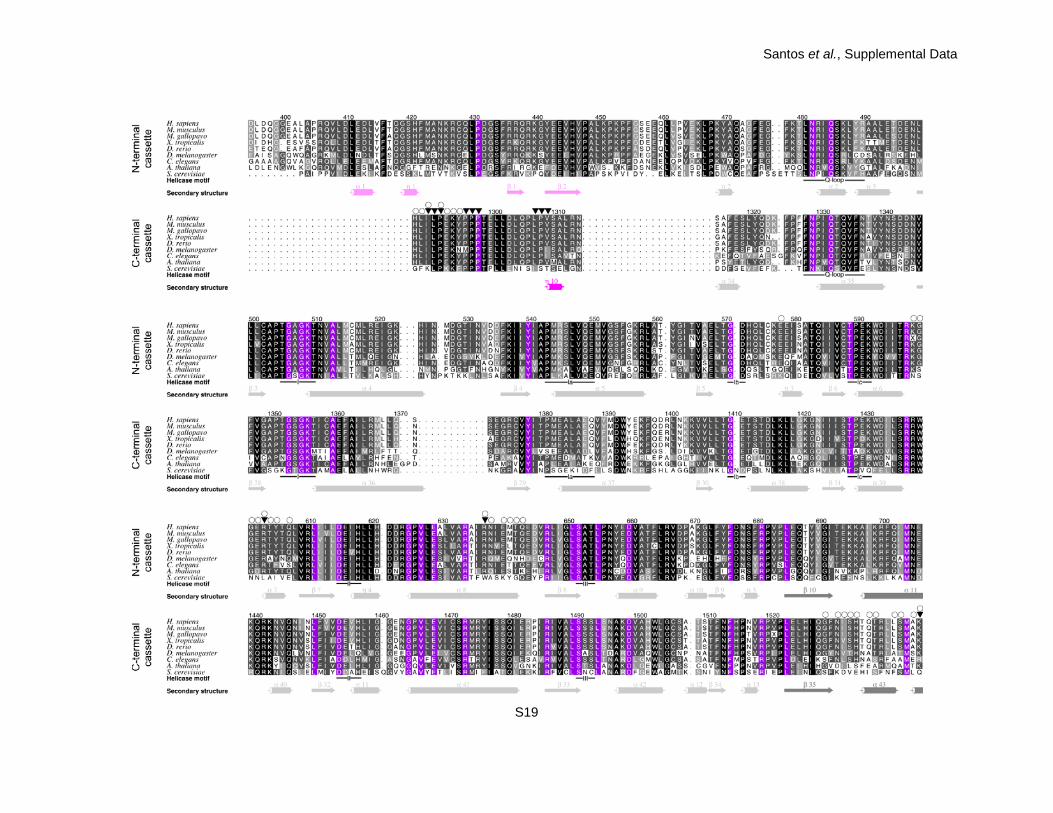
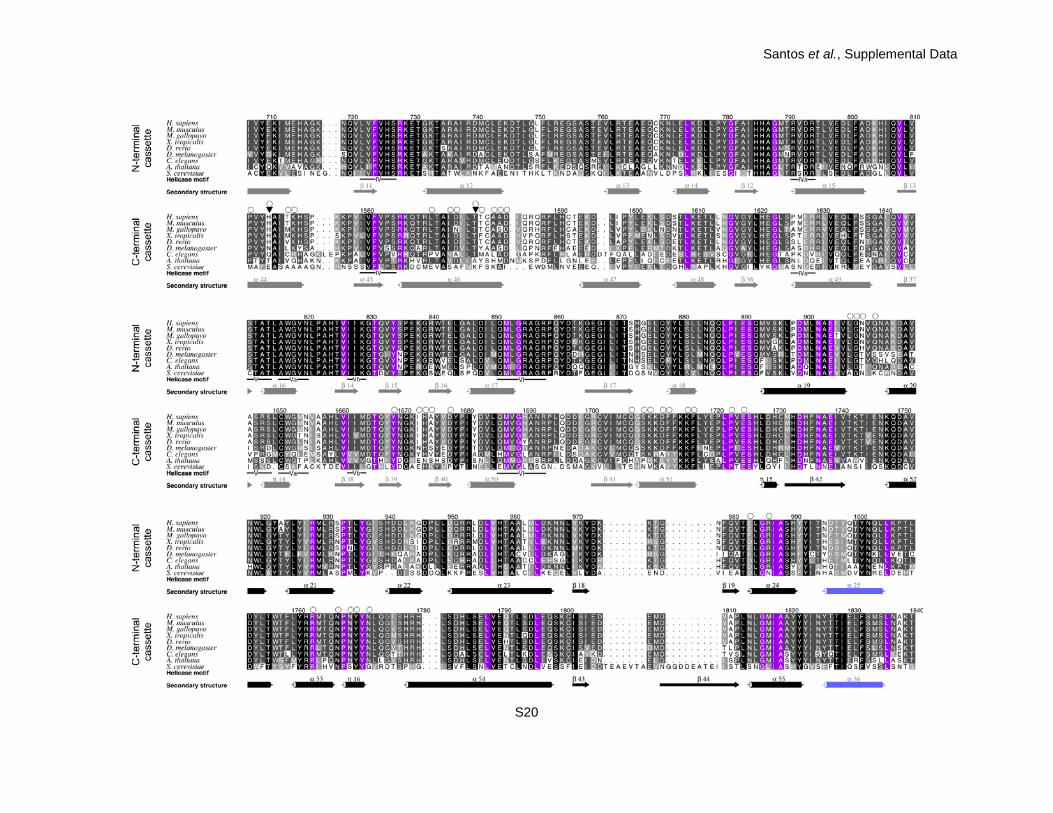
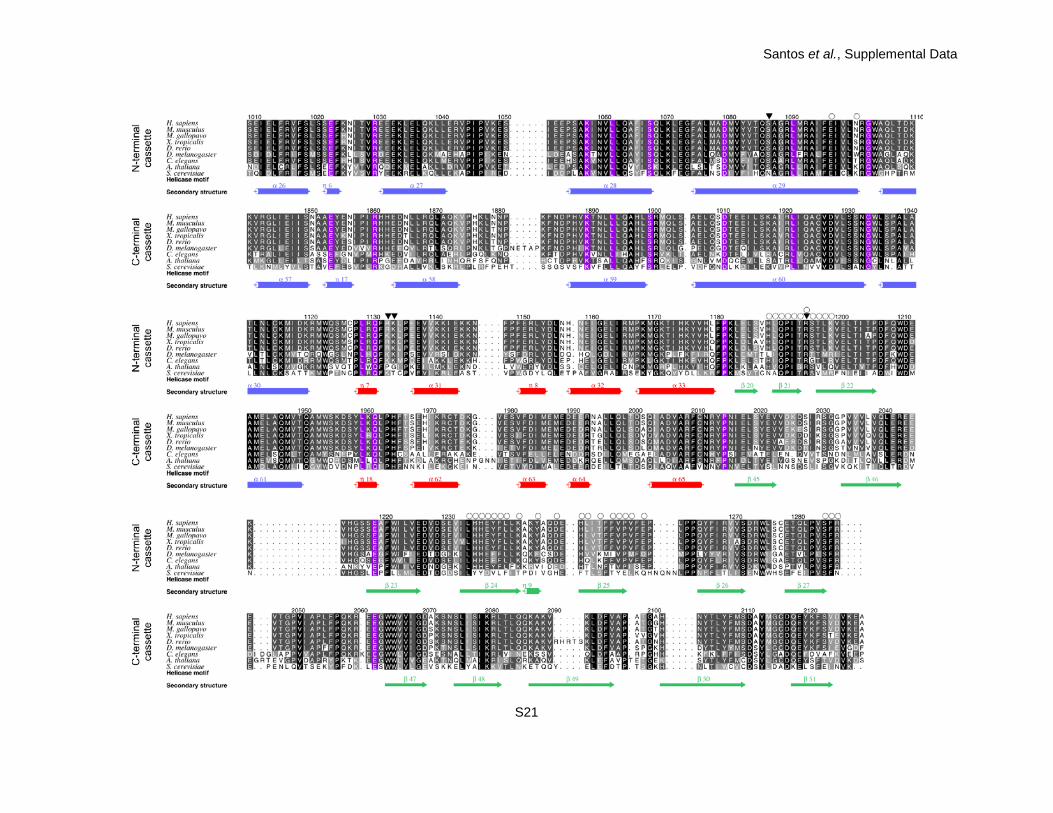
Fig. S4. Multiple sequence alignment of Brr2 orthologs. First block of sequences – N-terminal cassette, second block of sequences –
C-terminal cassette. Residue numbers refer to the human Brr2 sequence. The cassettes have been aligned within each block and
with respect to each other. The background coloring of the residues is according to the conservation within each cassette, darker
background corresponding to a higher degree of conservation. Residues that are invariant across both cassettes are shown with a
purple background. Secondary structure elements are indicated by icons and colored according to their domains (N-terminal
extension – pink; RecA-1 – light gray, RecA-2 – dark gray, WH – black, HB – blue, HLH – red, IG – green, inter-cassette linker –
magenta). ATPase/helicase motifs (Q and Roman numerals) are indicated below each block by a black line (26). Open circles denote
residues involved in inter-cassette contacts. Filled triangles denote point mutations investigated herein. Organisms: Homo sapiens,
Mus musculus, Meleagris gallopavo, Xenopus tropicalis, Danio rerio, Drosophila melanogaster, Caenorhabditis elegans, Arabidopsis
thaliana, Saccharomyces cerevisiae.
Santos et al., Supplemental Data
S23
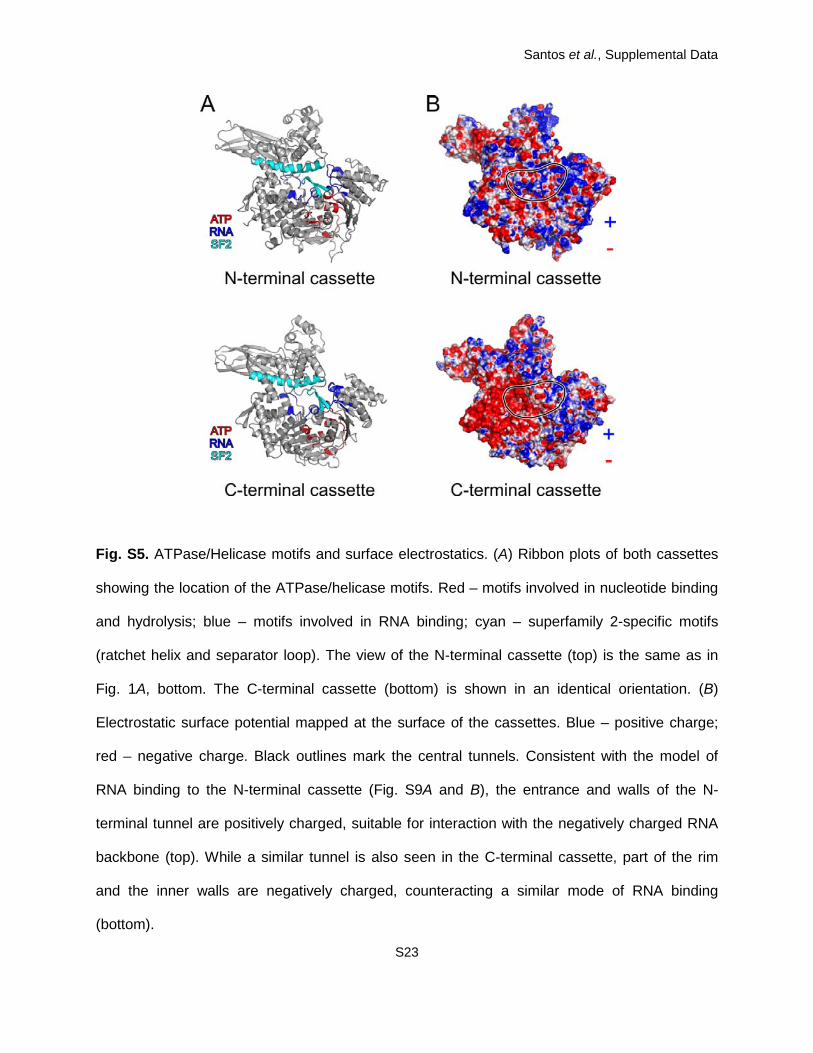
Fig. S5. ATPase/Helicase motifs and surface electrostatics. (A) Ribbon plots of both cassettes
showing the location of the ATPase/helicase motifs. Red – motifs involved in nucleotide binding
and hydrolysis; blue – motifs involved in RNA binding; cyan – superfamily 2-specific motifs
(ratchet helix and separator loop). The view of the N-terminal cassette (top) is the same as in
Fig. 1A, bottom. The C-terminal cassette (bottom) is shown in an identical orientation. (B)
Electrostatic surface potential mapped at the surface of the cassettes. Blue – positive charge;
red – negative charge. Black outlines mark the central tunnels. Consistent with the model of
RNA binding to the N-terminal cassette (Fig. S9A and B), the entrance and walls of the N-
terminal tunnel are positively charged, suitable for interaction with the negatively charged RNA
backbone (top). While a similar tunnel is also seen in the C-terminal cassette, part of the rim
and the inner walls are negatively charged, counteracting a similar mode of RNA binding
(bottom).
Santos et al., Supplemental Data
S24
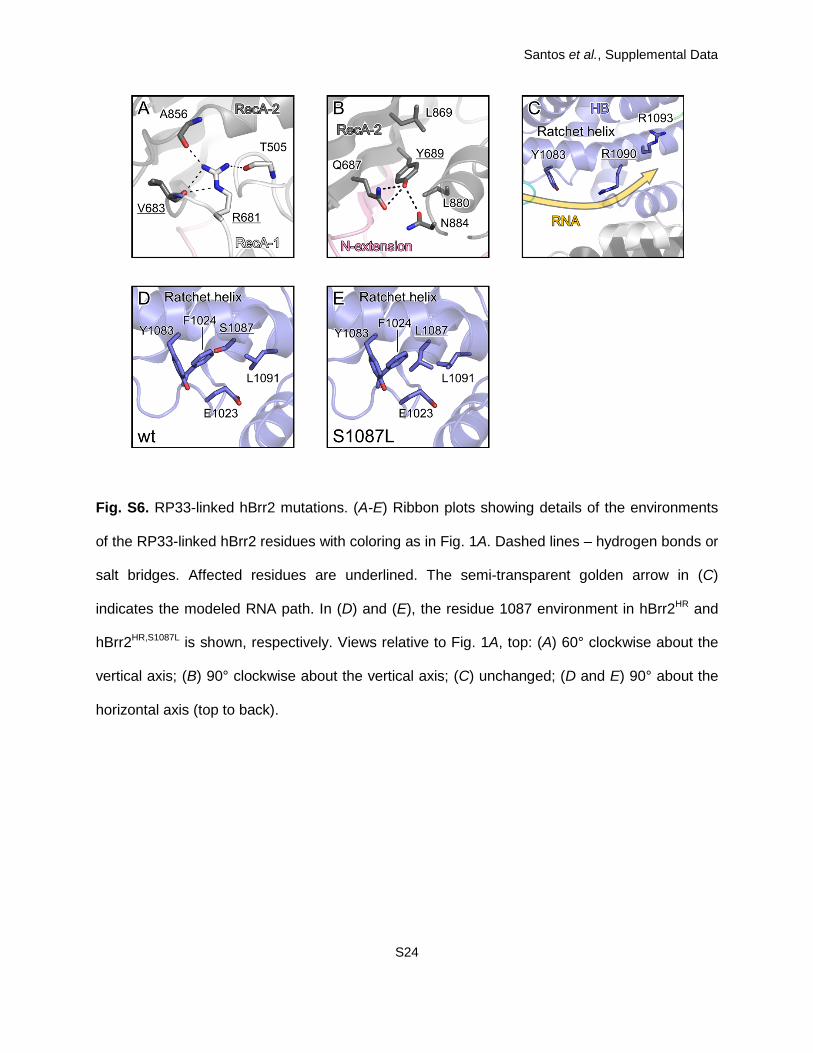
Fig. S6. RP33-linked hBrr2 mutations. (A-E) Ribbon plots showing details of the environments
of the RP33-linked hBrr2 residues with coloring as in Fig. 1A. Dashed lines – hydrogen bonds or
salt bridges. Affected residues are underlined. The semi-transparent golden arrow in (C)
indicates the modeled RNA path. In (D) and (E), the residue 1087 environment in hBrr2HR and
hBrr2HR,S1087L is shown, respectively. Views relative to Fig. 1A, top: (A) 60° clockwise about the
vertical axis; (B) 90° clockwise about the vertical axis; (C) unchanged; (D and E) 90° about the
horizontal axis (top to back).
Santos et al., Supplemental Data
S25
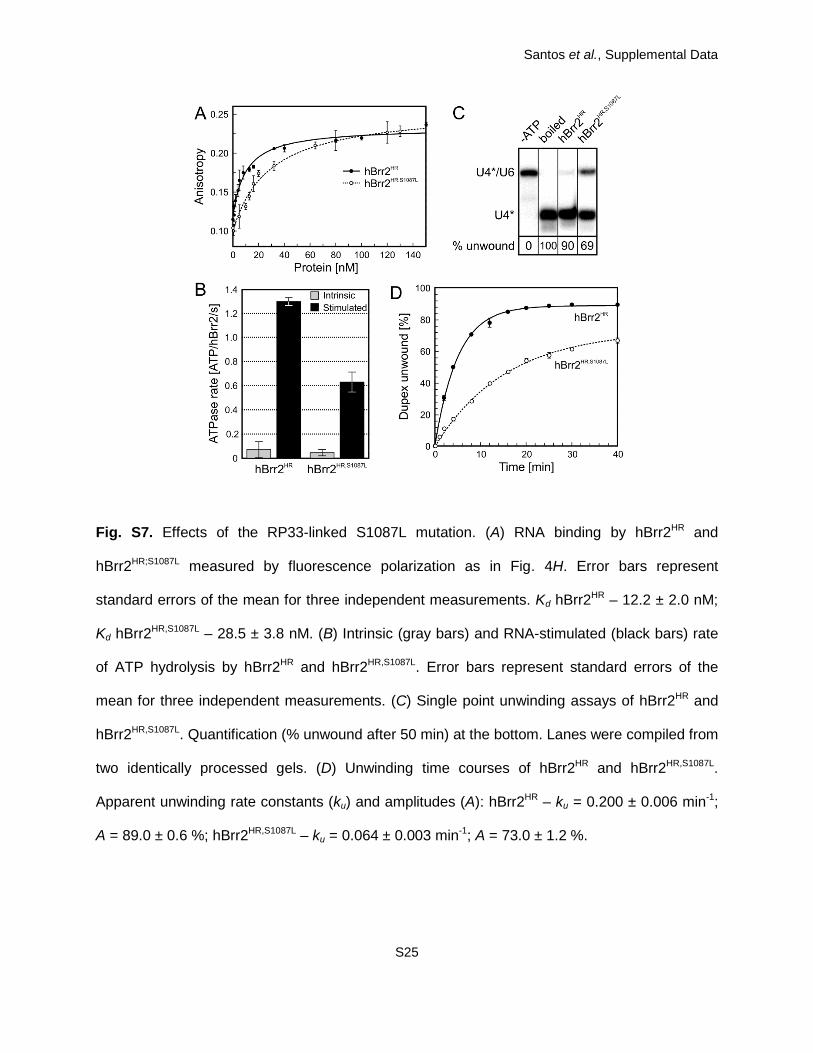
Fig. S7. Effects of the RP33-linked S1087L mutation. (A) RNA binding by hBrr2HR and
hBrr2HR;S1087L measured by fluorescence polarization as in Fig. 4H. Error bars represent
standard errors of the mean for three independent measurements. Kd hBrr2HR – 12.2 ± 2.0 nM;
Kd hBrr2HR,S1087L – 28.5 ± 3.8 nM. (B) Intrinsic (gray bars) and RNA-stimulated (black bars) rate
of ATP hydrolysis by hBrr2HR and hBrr2HR,S1087L. Error bars represent standard errors of the
mean for three independent measurements. (C) Single point unwinding assays of hBrr2HR and
hBrr2HR,S1087L. Quantification (% unwound after 50 min) at the bottom. Lanes were compiled from
two identically processed gels. (D) Unwinding time courses of hBrr2HR and hBrr2HR,S1087L.
Apparent unwinding rate constants (ku) and amplitudes (A): hBrr2HR – ku = 0.200 ± 0.006 min-1;
A = 89.0 ± 0.6 %; hBrr2HR,S1087L – ku = 0.064 ± 0.003 min-1; A = 73.0 ± 1.2 %.
Santos et al., Supplemental Data
S26
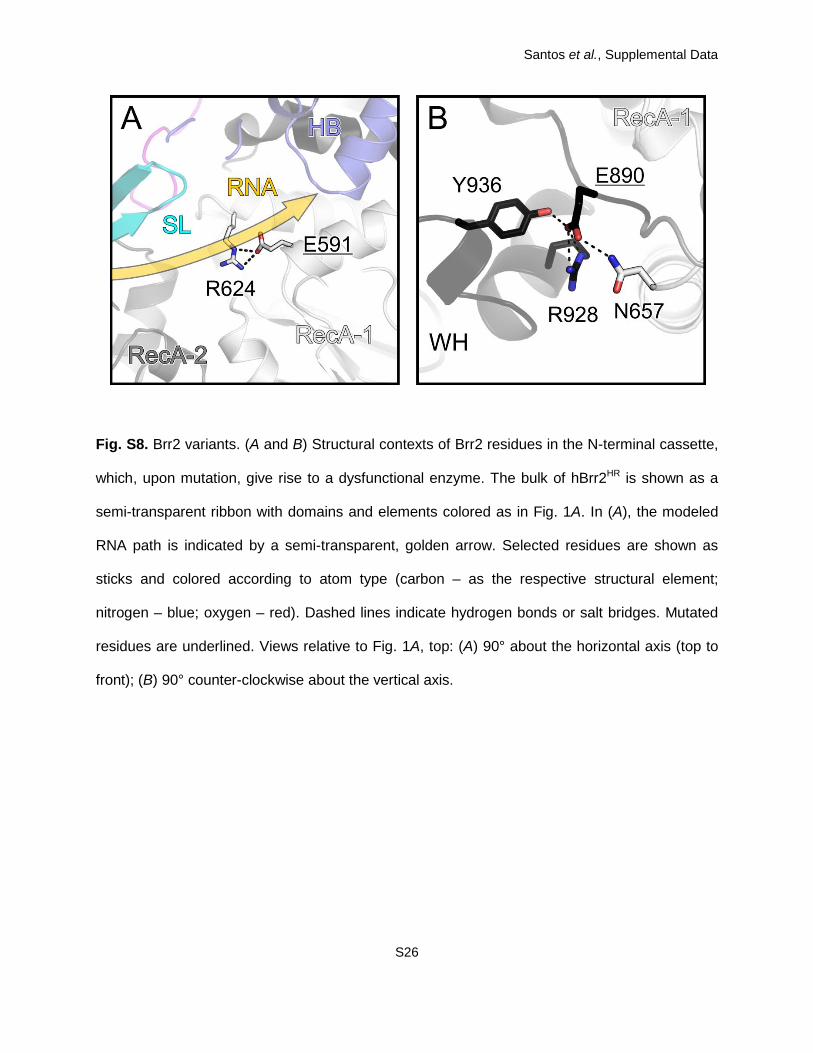
Fig. S8. Brr2 variants. (A and B) Structural contexts of Brr2 residues in the N-terminal cassette,
which, upon mutation, give rise to a dysfunctional enzyme. The bulk of hBrr2HR is shown as a
semi-transparent ribbon with domains and elements colored as in Fig. 1A. In (A), the modeled
RNA path is indicated by a semi-transparent, golden arrow. Selected residues are shown as
sticks and colored according to atom type (carbon – as the respective structural element;
nitrogen – blue; oxygen – red). Dashed lines indicate hydrogen bonds or salt bridges. Mutated
residues are underlined. Views relative to Fig. 1A, top: (A) 90° about the horizontal axis (top to
front); (B) 90° counter-clockwise about the vertical axis.
Santos et al., Supplemental Data
S27
Santos et al., Supplemental Data
S28
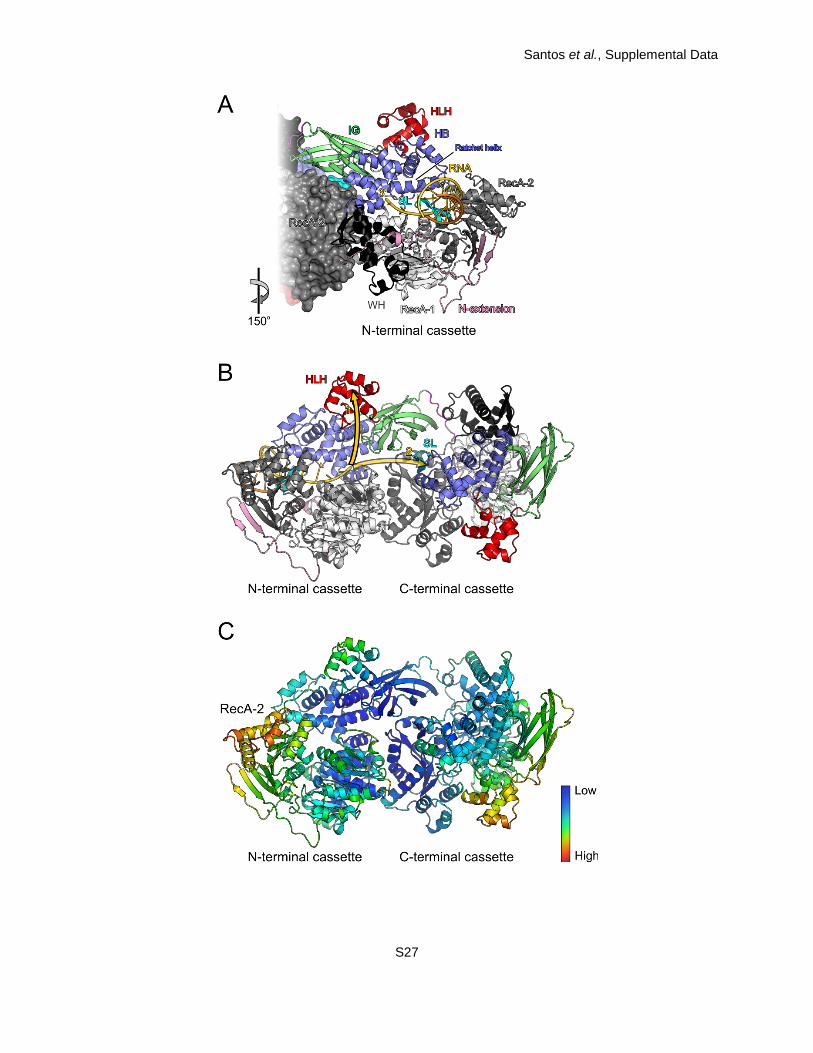
Fig. S9. Model for RNA binding and loading. (A) View along the central tunnel of the N-terminal
cassette with a modeled RNA ligand (threaded strand – gold; complementary strand – orange).
Domains and elements are colored as in Fig. 1A. Same view as in Fig. 1A, bottom. (B) Ribbon
plot of the same model viewed as in Fig. 1A, top. The golden arrows indicate two possible paths
of the RNA strand exiting the N-terminal cassette. Mutational analyses suggest that RNA is
guided across the N-terminal HLH domain (solid arrow; path 1) rather than continuing towards
the C-terminal separator loop (semitransparent arrow; path 2). (C) Ribbon plot of hBrr2HR,S1087L
colored according to the crystallographic temperature factors of the Cα atoms. Red – high
mobility/flexibility; blue – low mobility/flexibility. Same orientation as in Fig. 1A, top.
Santos et al., Supplemental Data
S29
SI Tables
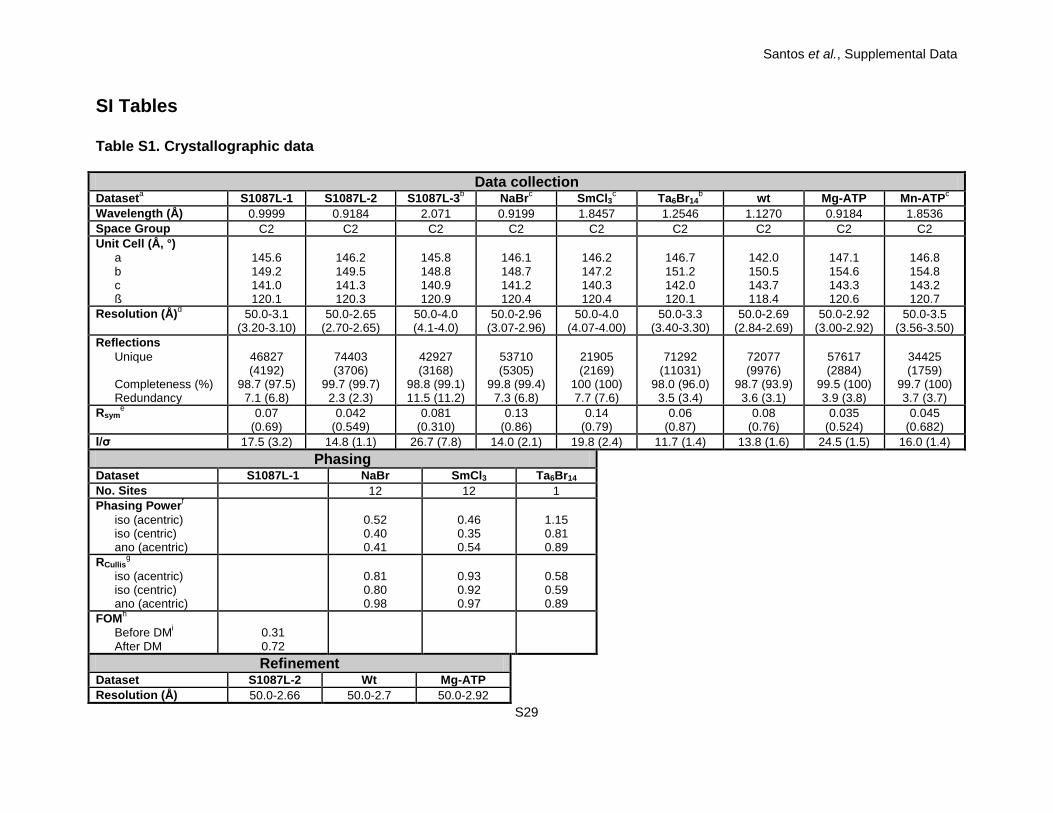
Table S1. Crystallographic data
Data collection Dataseta S1087L-1 S1087L-2 S1087L-3b NaBrc SmCl3c Ta6Br14
b wt Mg-ATP Mn-ATPc Wavelength (Å) 0.9999 0.9184 2.071 0.9199 1.8457 1.2546 1.1270 0.9184 1.8536 Space Group C2 C2 C2 C2 C2 C2 C2 C2 C2 Unit Cell (Å, °)
a b c ß
145.6 149.2 141.0 120.1
146.2 149.5 141.3 120.3
145.8 148.8 140.9 120.9
146.1 148.7 141.2 120.4
146.2 147.2 140.3 120.4
146.7 151.2 142.0 120.1
142.0 150.5 143.7 118.4
147.1 154.6 143.3 120.6
146.8 154.8 143.2 120.7
Resolution (Å)d 50.0-3.1 (3.20-3.10)
50.0-2.65 (2.70-2.65)
50.0-4.0 (4.1-4.0)
50.0-2.96 (3.07-2.96)
50.0-4.0 (4.07-4.00)
50.0-3.3 (3.40-3.30)
50.0-2.69 (2.84-2.69)
50.0-2.92 (3.00-2.92)
50.0-3.5 (3.56-3.50)
Reflections Unique Completeness (%) Redundancy
46827 (4192)
98.7 (97.5) 7.1 (6.8)
74403 (3706)
99.7 (99.7) 2.3 (2.3)
42927 (3168)
98.8 (99.1) 11.5 (11.2)
53710 (5305)
99.8 (99.4) 7.3 (6.8)
21905 (2169)
100 (100) 7.7 (7.6)
71292
(11031) 98.0 (96.0)
3.5 (3.4)
72077 (9976)
98.7 (93.9) 3.6 (3.1)
57617 (2884)
99.5 (100) 3.9 (3.8)
34425 (1759)
99.7 (100) 3.7 (3.7)
Rsyme 0.07
(0.69) 0.042
(0.549) 0.081
(0.310) 0.13
(0.86) 0.14
(0.79) 0.06
(0.87) 0.08
(0.76) 0.035
(0.524) 0.045
(0.682) I/σ 17.5 (3.2) 14.8 (1.1) 26.7 (7.8) 14.0 (2.1) 19.8 (2.4) 11.7 (1.4) 13.8 (1.6) 24.5 (1.5) 16.0 (1.4)
Phasing Dataset S1087L-1 NaBr SmCl3 Ta6Br14 No. Sites 12 12 1 Phasing Powerf
iso (acentric) iso (centric) ano (acentric)
0.52 0.40 0.41
0.46 0.35 0.54
1.15 0.81 0.89
RCullisg
iso (acentric) iso (centric) ano (acentric)
0.81 0.80 0.98
0.93 0.92 0.97
0.58 0.59 0.89
FOMh Before DMi After DM
0.31 0.72
Refinement Dataset S1087L-2 Wt Mg-ATP Resolution (Å) 50.0-2.66 50.0-2.7 50.0-2.92
Santos et al., Supplemental Data
S30
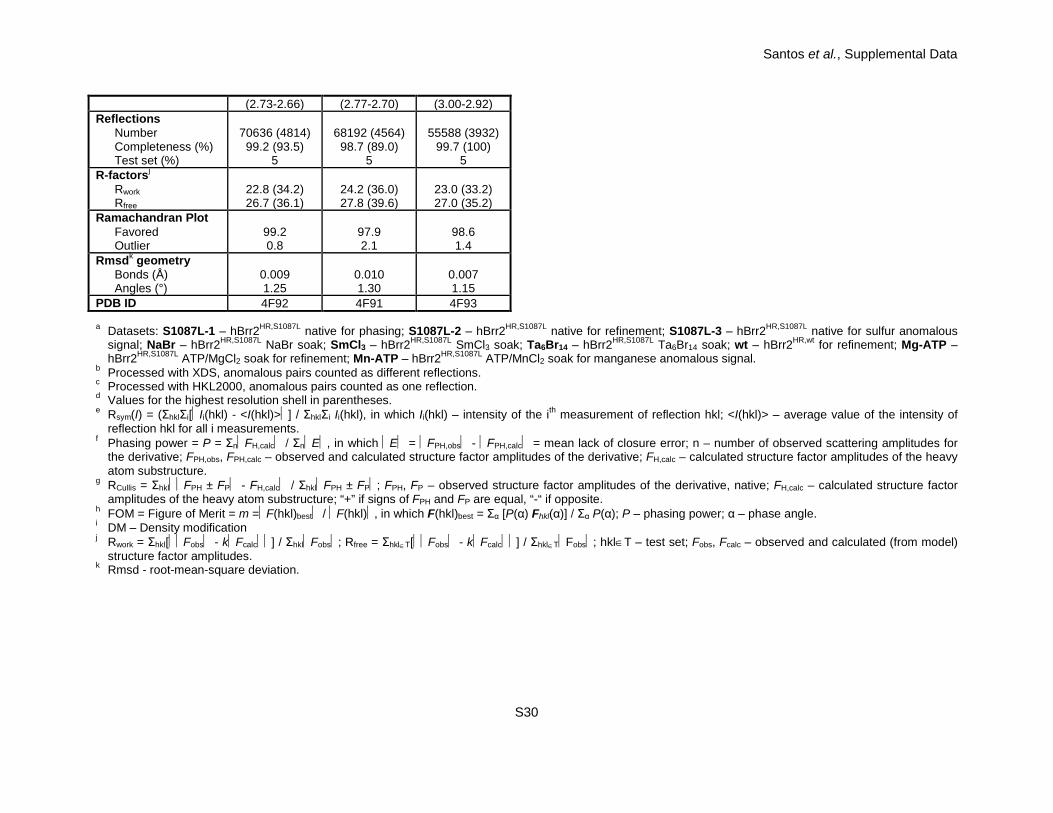
(2.73-2.66) (2.77-2.70) (3.00-2.92) Reflections
Number Completeness (%) Test set (%)
70636 (4814) 99.2 (93.5)
5
68192 (4564)
98.7 (89.0) 5
55588 (3932)
99.7 (100) 5
R-factorsj Rwork Rfree
22.8 (34.2) 26.7 (36.1)
24.2 (36.0) 27.8 (39.6)
23.0 (33.2) 27.0 (35.2)
Ramachandran Plot Favored Outlier
99.2 0.8
97.9 2.1
98.6 1.4
Rmsdk geometry Bonds (Å) Angles (°)
0.009 1.25
0.010 1.30
0.007 1.15
PDB ID 4F92 4F91 4F93 a Datasets: S1087L-1 – hBrr2HR,S1087L native for phasing; S1087L-2 – hBrr2HR,S1087L native for refinement; S1087L-3 – hBrr2HR,S1087L native for sulfur anomalous
signal; NaBr – hBrr2HR,S1087L NaBr soak; SmCl3 – hBrr2HR,S1087L SmCl3 soak; Ta6Br14 – hBrr2HR,S1087L Ta6Br14 soak; wt – hBrr2HR,wt for refinement; Mg-ATP – hBrr2HR,S1087L ATP/MgCl2 soak for refinement; Mn-ATP – hBrr2HR,S1087L ATP/MnCl2 soak for manganese anomalous signal.
b Processed with XDS, anomalous pairs counted as different reflections. c Processed with HKL2000, anomalous pairs counted as one reflection. d Values for the highest resolution shell in parentheses. e Rsym(I) = (ΣhklΣi[Ii(hkl) - <I(hkl)>] / ΣhklΣi Ii(hkl), in which Ii(hkl) – intensity of the ith measurement of reflection hkl; <I(hkl)> – average value of the intensity of
reflection hkl for all i measurements. f Phasing power = P = ΣnFH,calc / ΣnE, in which E = FPH,obs - FPH,calc = mean lack of closure error; n – number of observed scattering amplitudes for
the derivative; FPH,obs, FPH,calc – observed and calculated structure factor amplitudes of the derivative; FH,calc – calculated structure factor amplitudes of the heavy atom substructure.
g RCullis = ΣhklFPH ± FP - FH,calc / ΣhklFPH ± FP; FPH, FP – observed structure factor amplitudes of the derivative, native; FH,calc – calculated structure factor amplitudes of the heavy atom substructure; “+” if signs of FPH and FP are equal, “-“ if opposite.
h FOM = Figure of Merit = m =F(hkl)best / F(hkl), in which F(hkl)best = Σα [P(α) Fhkl(α)] / Σα P(α); P – phasing power; α – phase angle. i DM – Density modification j Rwork = Σhkl[Fobs - kFcalc] / ΣhklFobs; Rfree = Σhkl∈T[Fobs - kFcalc] / Σhkl∈TFobs; hkl∈T – test set; Fobs, Fcalc – observed and calculated (from model)
structure factor amplitudes. k Rmsd - root-mean-square deviation.