structural and vibrational properties of diglyme and longer glymes
TRANSCRIPT
Structural and Vibrational Properties of Diglyme and Longer Glymes
Patrik Johansson,*,† Joseph Grondin,‡ and Jean-Claude Lassegues‡
Applied Physics, Chalmers UniVersity of Technology, SE-412 96 Goteborg, Sweden, and Institut des SciencesMoleculaires (UMR 5255), CNRS, UniVersite Bordeaux I, 351 Cours de la Liberation, 33405 Talence, France
ReceiVed: June 14, 2010; ReVised Manuscript ReceiVed: August 20, 2010
The conformational states of diglyme in both the solid and liquid states have been determined by an integrateduse of both IR and Raman spectroscopy together with ab initio/density functional theory (DFT) calculations.Using knowledge from diglyme also made possible the study of the conformational state of longer glymes,including a quantitative study of the D-LAM mode. We hereby unambiguously can assign the (tgt)n
conformational state to all glymes and PEO in the solid state.
1. Introduction
Many theoretical and experimental studies have been devotedto the properties in various physical states of the “diglyme”molecule CH3(OCH2CH2)2OCH3, di(ethylene glycol) dimethylether, also abbreviated as G2.1-16 Some specific interest in thesematerials is due to the possible use of glymes and their polymerrelative poly(ethylene oxide), PEO, as solvents in lithium ionand polymer battery electrolytes, respectively.10-14,17 However,some fundamental knowledge of different properties affectingsolvent performance of the diglyme molecule is still lacking.For example, the liquid structure is largely unknown, despitethe many studies directed on conformational and vibrationalproperties of either pure polyethers or polyethers doped bylithium salts.1-19 Ab initio calculations do predict a large numberof diglyme conformers having very similar energies, with theall-trans one, ttt.ttt, generally being found to be the moststable.8-13,15,16 According to the usual nomenclature, t and gdenote dihedral angles close to 180° (trans) and (60° (gauche),respectively, the notation g+ and g- implying two gaucheconformations with opposite rotation angles.
As far as we know, crystal structures have been determinedonly for PEO20 and for the shortest oligomer CH3OCH2CH2-OCH3 (G1 or monoglyme),21 both with helical conformationsof the (tgt)n type. An inelastic neutron scattering (INS) studyof the G2 solid phase at 190 K favors tg+t.tg+t or tg+t.g-g+tconformations, rather than sequences with two or more consecu-tive trans linkages such as ttt.ttt, ttt.tgt, or ttg.tgt, however,without being able to distinguish between the first two.16 Thereis thus a discrepancy between the preferred G2 conformationobtained from ab initio gas-phase computations and fromdiffraction data on solids. In addition, infrared (IR) and Ramanspectroscopies have traditionally been used to analyze confor-mational states in the solid and liquid phases. Detailed vibra-tional analyses of the diglyme molecule were performed byMiyazawa’s group as early as 40 years ago1,2 and more recentlyby Matsuura’s group3-7 (including also G36,7), and otherauthors.9 These complementary spectroscopic and computationalstudies tend to show that all (OCH2CH2)n oligomers preferablyadopt a helical conformation (tgt)n for any value of n. Theadvantage of more recent ab initio methods is the ability to, by
a most reasonable computational effort, predict not only therelative energies of the possible conformers and their vibrationalfrequencies but also, furthermore, relative IR and Ramanintensities with acceptable accuracy. This has already beenillustrated for G1 by several authors.22-24
In this work we intend to show that our present levels of abinitio calculations together with experimental spectra can be usedto improve our knowledge of the G2 conformational state inthe solid state and furthermore also in the liquid state. Themethod and conclusions reached for diglyme can then betransferred to longer glymes and even to PEO.
2. Experimental Section
2.1. Materials and Spectroscopy. Di(ethylene glycol) di-methyl ether (G2) and the other glymes (G1, G3, and G4) wereAldrich products whereas deuterated diglyme (G2-d) waspurchased from Polymer Source, Canada. We have also usedpoly(ethylene glycol) dimethyl ether of average Mn ) 400 g/mol,hereafter noted as G8 (Fluka), and long-chain poly(ethyleneoxide), PEO, Mw ) 900 000 (Aldrich).
The samples were contained in sealed glass tubes for theRaman experiments. The Raman spectra were recorded with aLabram HR (Jobin-Yvon) spectrometer equipped with an argonlaser (514.5 nm), an air-cooled CCD detector, and an 1800grooves/mm grating, giving a spectral resolution of 4 cm-1. Theconfocal aperture was adjusted to 700 µm and a 50× objectiveof 0.55 numerical aperture and 8.1 mm working distance wasused. The solid state spectra were systematically recorded at120 K using a Dilor cryostat flushed with a stream of gaseousnitrogen.18 Midinfrared spectra were recorded at room temper-ature with a Nicolet 740 FTIR spectrometer using the GoldenGate accessory (Specac) for attenuated total reflection (ATR).Additional infrared transmission spectra were recorded with aNicolet 20F spectrometer. The spectral resolution was 4 cm-1.For the transmission infrared experiments, liquid films wereplaced between cesium iodide windows. To study the IRspectrum of solid glymes, a cryostat equipped with a cesiumiodide window cell cooled to 30 K under secondary vacuumwas used. The as-deposited solid is amorphous and metastableand corresponds to the gas-phase conformational equilibriumtrapped on the cold window. Once annealed up to 195 K andcooled again to 30 K, the deposit becomes crystalline withnarrow bands and crystal field splitting effects.
2.2. Calculations. As mentioned in the Introduction, it hasalready been shown that there is a large number of stable G2
* Corresponding author. Tel.: +46 31 7723178. Fax: +46 31 7722090.E-mail address: [email protected].
† Chalmers University of Technology.‡ Universite Bordeaux I.
J. Phys. Chem. A 2010, 114, 10700–1070510700
10.1021/jp105437d 2010 American Chemical SocietyPublished on Web 09/09/2010
conformers in a narrow energy range with the all-transconformer (ttt.ttt) being the most stable in the gas phase,followed by different combinations of trans and gauche. In thepresent work, G2 has been modeled using seven basic conform-ers: ttt.ttt, ttt.tg+t, tg+t.tg+t, tg+t.tg-t, tg+t.g-g+t, g+tt.g-g+t, andtg+t-g+g+t. The geometry, energy, and degeneracy of theseconformers in the gas phase are reported in Table 1.
All structures were fully relaxed and the energy minimastructures were verified by computing second derivatives of theenergies with respect to nuclei displacements, giving us normalmodes of vibration and corresponding frequencies. Due to thenumerical procedure imaginary frequencies (maximum 15 cm-1)were obtained for a few cases. The IR and Raman intensitieswere obtained by partial second and third derivatives, respec-tively. In addition, all models have been fully deuterated andthe resulting changes in the spectra calculated. All calculationswere performed at the B3LYP/6-311+G* level25-27 using theGaussian03 program.28
Additional calculations were made to assess the relativestability of G2 conformers in the condensed phase. The totalfree energies in solution were obtained using a dielectric constantε ) 10.36 and empirical cavitation and dispersion terms tomimic dichloroethane as solvent using the conductor polarizablecontinuum method (CPCM) as implemented in Gaussian03.29,30
The boundary surface was defined using the vdW-radii sug-gested by Klamt by using the Cosmo keyword.
3. Results and Discussion
The experimental Raman and IR spectra of solid and liquidG2 are compared in Figures 1-3 to calculated spectra for thevarious conformations described in Table 1. The crystalline state,in which the G2 molecule adopts in principle a unique and well-defined conformation, is first considered before analyzing themore complex liquid state spectra.
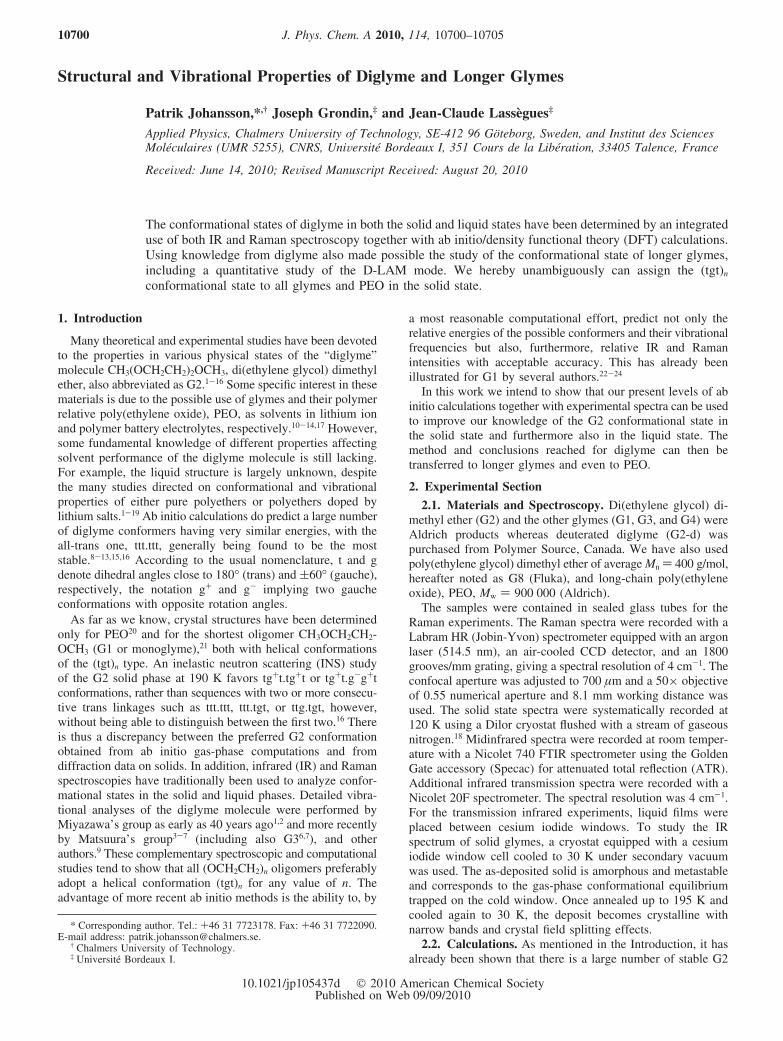
3.1. Conformational State of Solid Diglyme. The Ramanspectrum of crystalline G2 in the 600-200 cm-1 region contains
a very characteristic narrow and intense line at 326 cm-1 dueto the so-called disordered longitudinal acoustic mode (D-LAM)(Figure 1a). Only two conformers, tg+t.tg+t and tg+t.tg-t, givea good agreement with the overall spectrum and in particularwith the observed D-LAM. The 1350-750 cm-1 region (Figure1b) also contains features that are very sensitive to the glymeconformational state.22,31,32 Coupled C-O stretching and CH2
rocking modes produce characteristic lines at 840, 851, and 860cm-1, whereas twisting and wagging of the methylene groupsgive two intense lines near 1240 and 1290 cm-1, respectively.The tg+t.tg+t conformer reproduces these features the best, inparticular, the two lines near 1240 and 1290 cm-1. The ttt.tg+tconformer also reproduces these features but has a strongcontribution at ∼980 cm-1 that cannot be accounted for. Thedoublet at about 1030 cm-1, clearly observed in the calculatedspectrum for the tg+t.tg-t conformer, is present as two overlap-ping bands for the tg+t.tg+t conformer, and a similar observationcan be made at ca. ∼850 cm-1.
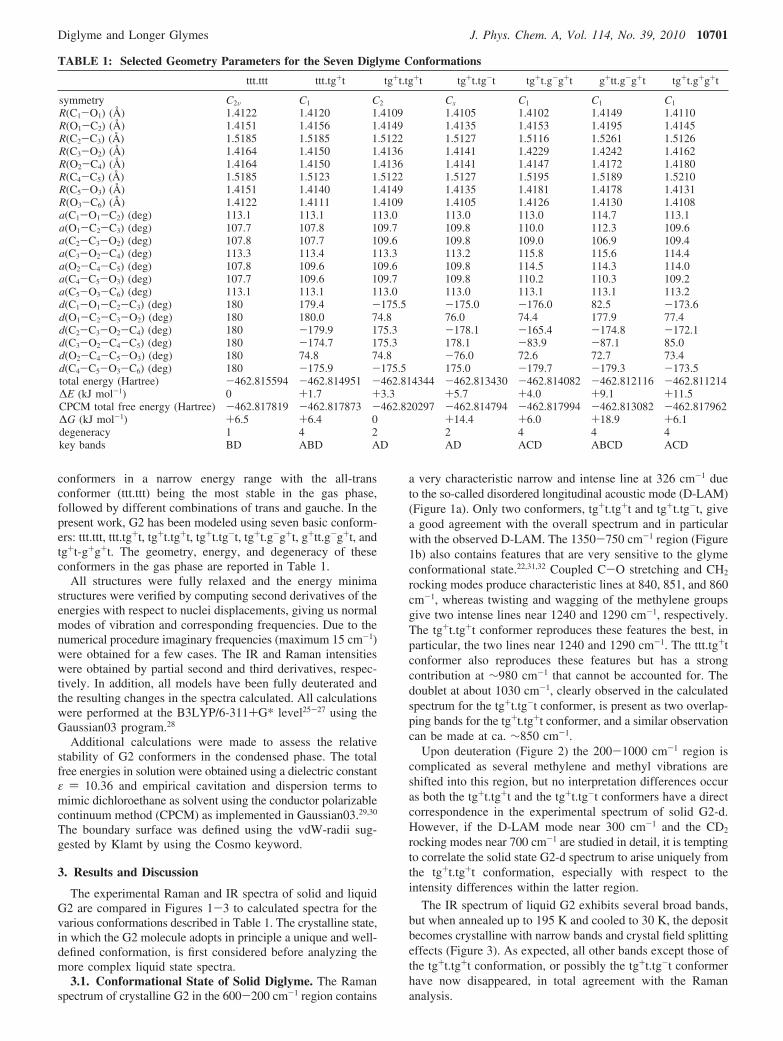
Upon deuteration (Figure 2) the 200-1000 cm-1 region iscomplicated as several methylene and methyl vibrations areshifted into this region, but no interpretation differences occuras both the tg+t.tg+t and the tg+t.tg-t conformers have a directcorrespondence in the experimental spectrum of solid G2-d.However, if the D-LAM mode near 300 cm-1 and the CD2
rocking modes near 700 cm-1 are studied in detail, it is temptingto correlate the solid state G2-d spectrum to arise uniquely fromthe tg+t.tg+t conformation, especially with respect to theintensity differences within the latter region.
The IR spectrum of liquid G2 exhibits several broad bands,but when annealed up to 195 K and cooled to 30 K, the depositbecomes crystalline with narrow bands and crystal field splittingeffects (Figure 3). As expected, all other bands except those ofthe tg+t.tg+t conformation, or possibly the tg+t.tg-t conformerhave now disappeared, in total agreement with the Ramananalysis.
TABLE 1: Selected Geometry Parameters for the Seven Diglyme Conformations
ttt.ttt ttt.tg+t tg+t.tg+t tg+t.tg-t tg+t.g-g+t g+tt.g-g+t tg+t.g+g+t
symmetry C2V C1 C2 Cs C1 C1 C1
R(C1-O1) (Å) 1.4122 1.4120 1.4109 1.4105 1.4102 1.4149 1.4110R(O1-C2) (Å) 1.4151 1.4156 1.4149 1.4135 1.4153 1.4195 1.4145R(C2-C3) (Å) 1.5185 1.5185 1.5122 1.5127 1.5116 1.5261 1.5126R(C3-O2) (Å) 1.4164 1.4150 1.4136 1.4141 1.4229 1.4242 1.4162R(O2-C4) (Å) 1.4164 1.4150 1.4136 1.4141 1.4147 1.4172 1.4180R(C4-C5) (Å) 1.5185 1.5123 1.5122 1.5127 1.5195 1.5189 1.5210R(C5-O3) (Å) 1.4151 1.4140 1.4149 1.4135 1.4181 1.4178 1.4131R(O3-C6) (Å) 1.4122 1.4111 1.4109 1.4105 1.4126 1.4130 1.4108a(C1-O1-C2) (deg) 113.1 113.1 113.0 113.0 113.0 114.7 113.1a(O1-C2-C3) (deg) 107.7 107.8 109.7 109.8 110.0 112.3 109.6a(C2-C3-O2) (deg) 107.8 107.7 109.6 109.8 109.0 106.9 109.4a(C3-O2-C4) (deg) 113.3 113.4 113.3 113.2 115.8 115.6 114.4a(O2-C4-C5) (deg) 107.8 109.6 109.6 109.8 114.5 114.3 114.0a(C4-C5-O3) (deg) 107.7 109.6 109.7 109.8 110.2 110.3 109.2a(C5-O3-C6) (deg) 113.1 113.1 113.0 113.0 113.1 113.1 113.2d(C1-O1-C2-C3) (deg) 180 179.4 -175.5 -175.0 -176.0 82.5 -173.6d(O1-C2-C3-O2) (deg) 180 180.0 74.8 76.0 74.4 177.9 77.4d(C2-C3-O2-C4) (deg) 180 -179.9 175.3 -178.1 -165.4 -174.8 -172.1d(C3-O2-C4-C5) (deg) 180 -174.7 175.3 178.1 -83.9 -87.1 85.0d(O2-C4-C5-O3) (deg) 180 74.8 74.8 -76.0 72.6 72.7 73.4d(C4-C5-O3-C6) (deg) 180 -175.9 -175.5 175.0 -179.7 -179.3 -173.5total energy (Hartree) -462.815594 -462.814951 -462.814344 -462.813430 -462.814082 -462.812116 -462.811214∆E (kJ mol-1) 0 +1.7 +3.3 +5.7 +4.0 +9.1 +11.5CPCM total free energy (Hartree) -462.817819 -462.817873 -462.820297 -462.814794 -462.817994 -462.813082 -462.817962∆G (kJ mol-1) +6.5 +6.4 0 +14.4 +6.0 +18.9 +6.1degeneracy 1 4 2 2 4 4 4key bands BD ABD AD AD ACD ABCD ACD
Diglyme and Longer Glymes J. Phys. Chem. A, Vol. 114, No. 39, 2010 10701
From an energy point of view obtained from the ab initiocalculations made on molecules in the gas phase, the calculatedconformer of lowest energy is the all-trans (ttt.ttt) in accordancewith the literature (Table 1). However, as stated above, bothRaman and IR spectroscopy strongly indicate that either thetg+t.tg+t or the tg+t.tg-t conformers are adopted in the solidstate but cannot unambiguously distinguish between these.Fortunately, the free energy data from the CPCM calculations,intended to mimic the solid state, indeed change the order ofstability in clear favor of the tg+t.tg+t conformer to even be themost stable one out of all seven conformers, and the tg+t.tg-tconformer to be much less likely. From a structural perspective
the tg+t.tg+t conformer directs all the ether oxygen lone pairsinto the center of a helix shape, without overlapping, whichallows more efficient packing of the diglyme molecules as theintermolecular repulsion is minimized.
Thus, the selectivity of both IR and Raman spectroscopytogether with the ab initio calculations, with necessary inclusion
Figure 1. (a) Raman spectra of solid G2 at 120 K and liquid G2 at 300 K (bottom) compared to calculated spectra of the indicated conformations.Each line has been convoluted by a Gaussian function of 4 cm-1 full-width at half-maximum (FWHM). The spectra are arbitrarily shifted along theordinate scale for convenience. (b) Same as Figure 1a, but in a different spectral range and with the calculated wavenumbers multiplied by a scalingfactor of 0.9852.
Figure 2. Same as Figure 1a, but for G2-d.
Figure 3. IR spectra of liquid G2 at 300 K as deposited and annealedsolid at 30 K (bottom) compared to the calculated spectra of theindicated conformations. The wavenumbers of the latter are multipliedby 0.9732, and each line has been convoluted by a Gaussian functionof 8.4 cm-1 full-width at half-maximum (FWHM). The spectra arearbitrarily shifted along the ordinate scale for convenience.
10702 J. Phys. Chem. A, Vol. 114, No. 39, 2010 Johansson et al.

of a continuum approach, becomes a solid combination oftechniques to interpret the conformational state.
3.2. Conformations in Liquid Diglyme. The experimentalRaman spectra of liquid G2 at room temperature are shown inFigure 1a,b. In the case of G1, Yang et al. reported that theliquid state spectrum may be built by a combination of thespectra of several conformations in equilibrium.22 It is out ofthe scope of the present work to calculate the spectra of all lowenergy G2 conformations; we limit ourselves to the sevenrepresentative conformers. Let us also recall that the all-transconformation is nondegenerate whereas the degeneracy is 2 forboth tg+t.tg+t and tg+t.tg-t (tg+t.tg+t, tg-t.tg-t and tg+t.tg-t,tg-t.tg+t, respectively), and 4 for all conformers of C1 symmetryincluding the ttt.tg+t conformer. Thus, the exact same energiesfor the above series of conformers would produce populationsand line intensities in the ratio 1/2/2/4/4/4/4, respectively, bythe simple effect of the multiplicities. Of course, it is alsonecessary to take into account the relative energies for eachconformer as well as the IR absorbance and Raman scatteringcross sections of each vibration for each conformer.
With all these precautions in mind, a distinct feature is thecomponent above 800 cm-1 in the experimental spectrum ofthe liquid, not found for solid G2 (Figure 1b). This componentcannot be due to either the ttt.ttt or tg+t.tg+t conformations.Matsuura et al. have extensively used the 750-900 cm-1 Ramanspectral range to analyze the conformational state of glymes inthe liquid state and in various solutions.2-7,23,24 On the basis ofnormal coordinate analysis these authors use “key bands” atabout 850 and 805 cm-1 for the gauche and trans conformationsof the C-C bond, respectively. These two key bands areassigned to coupled ν(C-O)/r(CH2) and coupled r(CH2)/tw(CH2) modes, respectively. In light of Matsuura’s assignmentwhere the band at ∼805 cm-1 is assigned to a C-C bond in atrans conformation and that the all-trans has no such contribu-tion, we now turn to the ttt.tg+t and g+tt.g-g+t conformers.However, we find that none of these conformers produce afeature at this shift, while the tg+t.g-g+t conformer indeed hasa peak at approximately the right position - surprising as thisconformer has no trans C-C bond.
However, a small population of all-trans conformation, ttt.ttt,or possibly the ttt.tg+t conformer, can be argued for due to twoweak bands at ∼930 and ∼970 cm-1 in the experimentalspectrum, corresponding to computationally intense and well-separated lines of these two conformers at these positions. Theg+tt.g-g+t conformer could possibly contribute with both thesefeatures but is, on the basis of the CPCM energies, a much lesslikely alternative.
A similar analysis is made for the fully deuteratedderivative G2-d (Figure 2), and the liquid state spectrum canonly be stated to be built up by contributions from severalconformations in equilibrium. Conformational changes in-duced by the deuteration itself are believed to be infinitesimal.The band situated at ∼770 cm-1 can possibly furtherdisqualify the g+tt.g-g+t conformer.
Similar observations can also be made from the IR spectra.In Figure 3, we have selected the 1200-1400 cm-1 spectralrange where several IR “key bands” have again been used byMatsuura et al. for the conformational analysis of triglyme.6
Liquid diglyme has a spectral profile very similar to that oftriglyme for the bands noted A and B, claimed by Matsuura etal. to be characteristic of gauche and trans conformations ofthe C-C bond, respectively, and for the bands C and D, claimedto be characteristic of gauche and trans conformations of theC-O bond, respectively. Bands A and B correspond to
methylene wagging motions and bands C and D to methylenetwisting motions. The seven conformers should according tothe “key band assignment” have 2-4 different key bandcontributions (Table 1), and this is rather well reproduced inFigure 3 for all conformers, though with large variations in bandintensities for the four bands among the conformers.
Overall, the liquid G2 spectra are still difficult to unambigu-ously interpret. The thermal energy and the larger free volumeavailable combined allow the ether oxygen lone pairs, lockedin space in the solid state, to be distributed in space. However,by combining the deuteration data and experiments and calcula-tions, we can clearly narrow down the conformers possibly beingpresent in liquid diglyme. One clear observation is that thetg+t.g-g+t conformer is present in the liquid. From an energeticpoint of view using the CPCM methodology it is one of themore favored conformers (Table 1). To summarize, out of theseven conformers the tg+t.tg+t, ttt.ttt, ttt.tg+t, and tg+t.g-g+tconformers are likely contributors, and the tg+t.tg-t andg+tt.g-g+t conformers most likely less contributing. It isreassuring that the latter two also are those with the highestenergies using the CPCM approach. There are no signs of thetg+t.g+g+t conformation, but also no features for it to beexcluded, including an average relative CPCM energy.
3.3. Application to Longer Glymes and to PEO. G1 isknown to adopt the tgt conformation in the solid phase and ithas been established above by ab initio calculations andspectroscopy that crystalline G2 most likely adopts the (tgt)2
conformation. Therefore, we have limited our calculations onthe longer glymes; G3, G4, and G8, to the (tgt)n conformation.
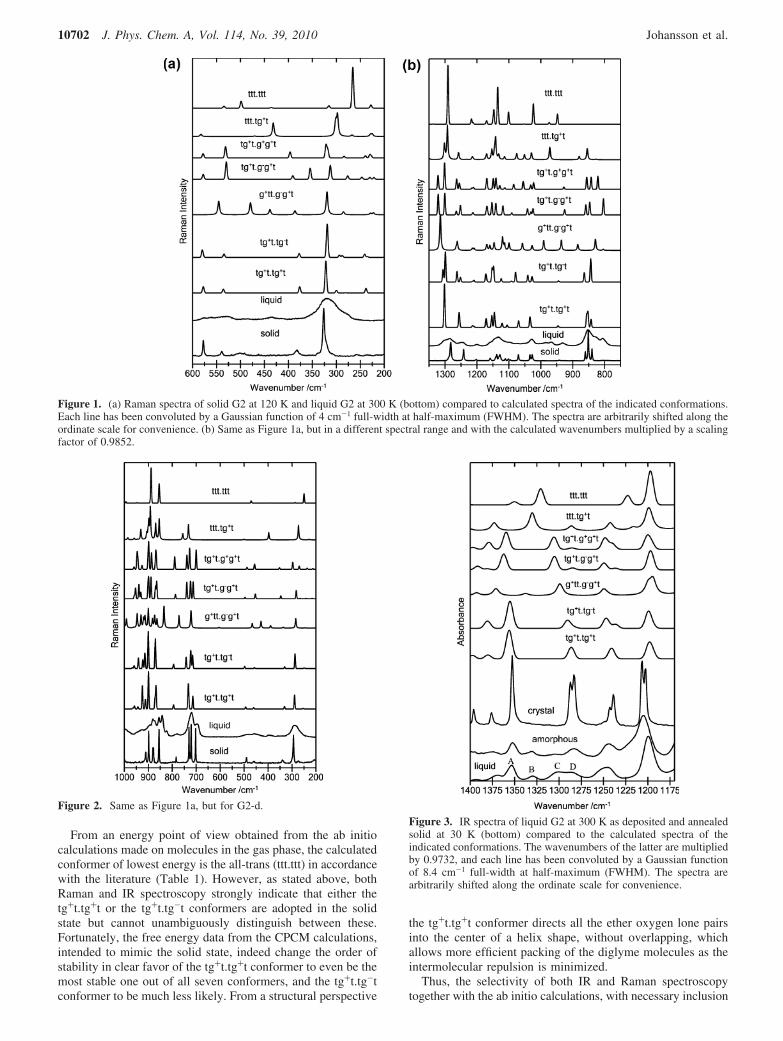
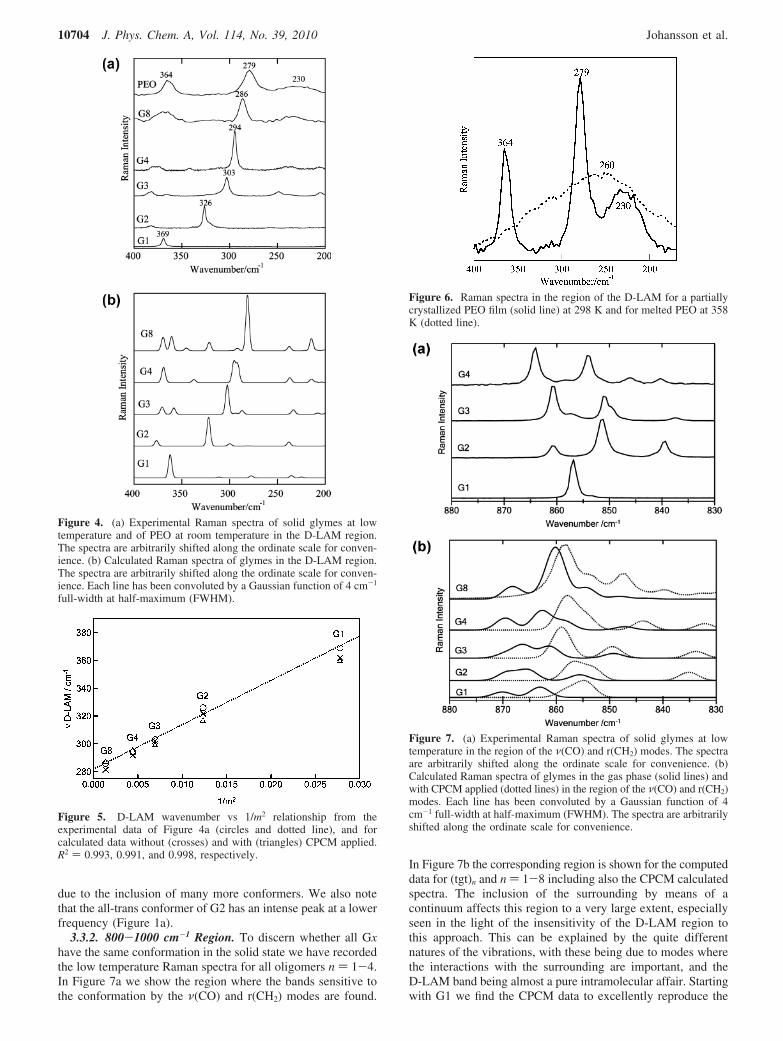
3.3.1. D-LAM Region. In the literature, the frequency andbandwidth of the D-LAM mode have been used to characterizethe long-range conformational disorder of chains.33 In particular,for a given number of skeletal atoms the polarized RamanD-LAM band shifts to higher frequencies with increasing degreeof disorder and its width increases when the distribution ofconformational states becomes broader. Actually, the D-LAMband is a nonhomogeneous overlapping of sub-bands and itsprofile is often asymmetric.33
In (CH2)n polymers, all-trans planar structures are favored inthe solid state and the LAM vibration is not significantly affectedby the lateral interactions as the atomic displacements areparallel to the chain axis. The presence of ether linkages in(OCH2CH2)n polymers increases the flexibility of the chain andthe probability of gauche conformations, favoring a helicalstructure, here (tgt)n, with significant radial components to theLAM vibrations. Experimental and computed low frequencyRaman spectra in the D-LAM region are shown in Figure 4a,b,respectively, with the move in wavenumbers of the D-LAMclearly visible. Shashkov et al.32 used FT-Raman spectroscopyand found the D-LAM maximum position, νD-LAM, to varylinearly with 1/m2, where m is related to n by m ) 3n + 3. InFigure 5 the present data, both experimental and computed, areshown to be in excellent agreement with a 1/m2 linear relation-ship. Note that the inclusion of a continuum via CPCM doesnot affect the position of the D-LAM significantly. However,at room temperature much more pronounced effects of the chainlength and physical state are observed, especially on the full-width at half-maximum (FWHM) of the D-LAM band, due toincreasing the amount of conformers present. In Figure 6 weshow this behavior for solid PEO, which is semicrystalline andtherefore has two additional peaks at 230 and 364 cm-1 in thisregion in addition to the D-LAM at 279 cm-1, together with amelted PEO sample (358 K) having a very broad featurecentered at ∼260 cm-1. This shift of ∼20 cm-1 is most probably
Diglyme and Longer Glymes J. Phys. Chem. A, Vol. 114, No. 39, 2010 10703
due to the inclusion of many more conformers. We also notethat the all-trans conformer of G2 has an intense peak at a lowerfrequency (Figure 1a).
3.3.2. 800-1000 cm-1 Region. To discern whether all Gxhave the same conformation in the solid state we have recordedthe low temperature Raman spectra for all oligomers n ) 1-4.In Figure 7a we show the region where the bands sensitive tothe conformation by the ν(CO) and r(CH2) modes are found.
In Figure 7b the corresponding region is shown for the computeddata for (tgt)n and n ) 1-8 including also the CPCM calculatedspectra. The inclusion of the surrounding by means of acontinuum affects this region to a very large extent, especiallyseen in the light of the insensitivity of the D-LAM region tothis approach. This can be explained by the quite differentnatures of the vibrations, with these being due to modes wherethe interactions with the surrounding are important, and theD-LAM band being almost a pure intramolecular affair. Startingwith G1 we find the CPCM data to excellently reproduce the
Figure 4. (a) Experimental Raman spectra of solid glymes at lowtemperature and of PEO at room temperature in the D-LAM region.The spectra are arbitrarily shifted along the ordinate scale for conven-ience. (b) Calculated Raman spectra of glymes in the D-LAM region.The spectra are arbitrarily shifted along the ordinate scale for conven-ience. Each line has been convoluted by a Gaussian function of 4 cm-1
full-width at half-maximum (FWHM).
Figure 5. D-LAM wavenumber vs 1/m2 relationship from theexperimental data of Figure 4a (circles and dotted line), and forcalculated data without (crosses) and with (triangles) CPCM applied.R2 ) 0.993, 0.991, and 0.998, respectively.
Figure 6. Raman spectra in the region of the D-LAM for a partiallycrystallized PEO film (solid line) at 298 K and for melted PEO at 358K (dotted line).
Figure 7. (a) Experimental Raman spectra of solid glymes at lowtemperature in the region of the ν(CO) and r(CH2) modes. The spectraare arbitrarily shifted along the ordinate scale for convenience. (b)Calculated Raman spectra of glymes in the gas phase (solid lines) andwith CPCM applied (dotted lines) in the region of the ν(CO) and r(CH2)modes. Each line has been convoluted by a Gaussian function of 4cm-1 full-width at half-maximum (FWHM). The spectra are arbitrarilyshifted along the ordinate scale for convenience.
10704 J. Phys. Chem. A, Vol. 114, No. 39, 2010 Johansson et al.
single peak found experimentally at ∼857 cm-1 by a broad peakcomposed of two components at 855 and 858 cm-1. Thecorresponding gas-phase calculation gives two peaks of slightlyhigher frequency and with a larger separation (863 and 870cm-1). Continuing with G2 we find the triplet mentioned insection 3.1 and also here the CPCM performs better than thegas phase with respect to the low frequency band at 840 cm-1
(computed at 835 (CPCM) and 855 cm-1 (gas phase)). TheCPCM, however, gives a much worse separation of peaks withrespect to experimental values of 11 and 9 cm-1 (computed:18 and 4 cm-1 (CPCM) vs 9 and 4 cm-1 (gas phase). For G3we find two intense peaks at 851 and 861 cm-1 with one lowerfrequency shoulder for each and a very weak feature at ∼837cm-1. The increased separation between the two main peaks inG3 is reproduced computationally, and it is also true for G4.For G8 we find the merging into a broad band for both gas-phase and CPCM calculations difficult to resolve. Combiningthe data, we suggest that in the range n ) 1-4 we never samplemore than one conformation in the experimental spectrum andthat this conformation is (tgt)n. Also, as noted in section 3.1,for the CPCM approach we also find tg+t.tg+t to be theenergetically preferred conformer (Table 1).
4. Conclusions
For solid G2, and similarly for longer glymes, there is nowvery little doubt that the only present conformation is tg+t.tg+t,(tgt)n. This conclusion is obtained by using both computedspectra together with the IR and Raman spectroscopies, includ-ing studies of deuterated G2, and relative energies, primarilywith the CPCM approach.
For liquid G2 the situation is more complex, but the numberof conformers needed to explain the experimental observationshas been narrowed down significantly, and some conformershave definitively been excluded.
From a methodology perspective, we note that the CPCMmethod is crucial for the relative energies of the conformers,but also to correctly model those vibrational modes having largeinteraction with the surrounding, while, on the other hand, hardlyaffecting the modeling of the intramolecular D-LAM at all.
References and Notes(1) Machida, K.; Miyazawa, T. Spectrochim. Acta 1964, 20, 1865.(2) Matsuura, H.; Miyazawa, T. Spectrochim. Acta 1967, 23A, 2433.
(3) Matsuura, H.; Miyazawa, T.; Machida, K. Spectrochim. Acta 1973,29A, 771.
(4) Matsuura, H.; Fukuhara, K. J. Polym. Sci. B: Polym. Phys. 1986,24, 1383.
(5) Matsuura, H.; Fukuhara, K.; Tamaoki, H. J. Mol. Struct. 1987, 156,293.
(6) Wahab, S. A.; Matsuura, H. Phys. Chem. Chem. Phys. 2001, 3,4689.
(7) Wahab, S. A.; Matsuura, H. J. Mol. Struct. 2002, 606, 35.(8) Gejji, S. P.; Tegenfeldt, J.; Lindgren, J. Chem. Phys. Lett. 1994,
226, 427.(9) Huang, W.; Frech, R.; Johansson, P.; Lindgren, J. Electrochim. Acta
1995, 40, 2147.(10) Gejji, S. P.; Johansson, P.; Tegenfeldt, J.; Lindgren, J. Comput.
Polym. Sci. 1995, 5, 99.(11) Johansson, P.; Tegenfeldt, J.; Lindgren, J. Polymer 1999, 40, 4399.(12) Baboul, A. G.; Redfern, P. C.; Sutjianto, A.; Curtiss, L. A. J. Am.
Chem. Soc. 1999, 121, 7220.(13) Dhumal, N. R.; Gejji, S. P. J. Mol. Struct. 2008, 859, 86.(14) Kashtanov, S.; Zhuang, G. V.; Augustsson, A.; Nordgren, J.; Luo,
Y.; Ross, P. N.; Guo, J. J. Phys. Chem. B 2007, 111, 11658.(15) Gejji, S. P.; Gadre, S. R.; Barge, V. J. Chem. Phys. Lett. 2001,
344, 527.(16) Kearley, G. J.; Johansson, P.; Delaplane, R. G.; Lindgren, J. Solid
State Ionics 2002, 147, 237.(17) Tamura, T.; Hachida, T.; Yoshida, K.; Tachikawa, N.; Dokko, K.;
Watanabe, M. J. Power Sources 2010, 195, 6095.(18) Grondin, J.; Talaga, D.; Lassegues, J. C.; Henderson, W. Phys.
Chem. Chem. Phys. 2004, 6, 938.(19) Lassegues, J. C.; Grondin, J. J. Phys. Chem. B 2005, 109, 18209.(20) Tadokoro, H.; Chatani, Y.; Yoshihara, T.; Tahara, S.; Murahashi,
S. Makromol. Chem 1964, 73, 109.(21) Yokoyama, Y.; Uekusa, H.; Ohasi, Y. Chem. Lett. 1996, 6, 443.(22) Yang, X.; Su, Z.; Wu, D.; Hsu, S. L.; Stidham, H. D. Macromol-
ecules 1997, 30, 3796.(23) Yoshida, H.; Matsuura, H. J. Phys. Chem. A 1998, 102, 2691.(24) Goutev, N.; Ohno, K.; Matsuura, H. J. Phys. Chem. A 2000, 104,
9226.(25) Becke, A. D. J. Chem. Phys. 1993, 98, 5648.(26) Lee, C.; Yang, W.; Parr, R. G. Phys. ReV. B 1988, 37, 785.(27) Vosko, S. H.; Wilks, L.; Nusair, M. Can. J. Phys. 1980, 58, 1200.(28) Frisch, M. J. Gaussian 03, Revision C.02; Gaussian, Inc., Pittsburgh,
PA, 2003.(29) Barone, V.; Cossi, M. J. Phys. Chem. A 1998, 102, 1995.(30) Cossi, M.; Rega, N.; Scalmani, G.; Barone, V. J. Comput. Chem.
2003, 24, 669.(31) Sandner, B.; Tubke, J.; Wartewig, S.; Shashkov, S. Solid State Ionics
1996, 83, 87.(32) Shashkov, S.; Wartewig, S.; Sandner, B.; Tubke, J. Solid State Ionics
1996, 90, 261.(33) Snyder, R. G. J. Chem. Phys. 1982, 76, 3921.
JP105437D
Diglyme and Longer Glymes J. Phys. Chem. A, Vol. 114, No. 39, 2010 10705