structural and climatic controls on sedimentation in the ...schlisch/a40_2004_ewrfieldtrip2.pdf ·...
TRANSCRIPT

Structural and Climatic Controls onSedimentation in the Newark Rift BasinField Guide to Classic Outcrops Along and Near theDelaware River, NJ and PA
Field Guide compiled by Roy W. SchlischeDepartment of Geological Sciences, Rutgers University, 610 Taylor Road, Piscataway, NJ 08854-8066, USA, [email protected]
Field Trip Leader: Amber GrangerDepartment of Geological Sciences, Rutgers University, 610 Taylor Road, Piscataway, NJ 08854-8066, USA, [email protected]
Geology of the Newark BasinThe Newark basin of New York, New Jersey and Pennsylvania is part of the Triassic-
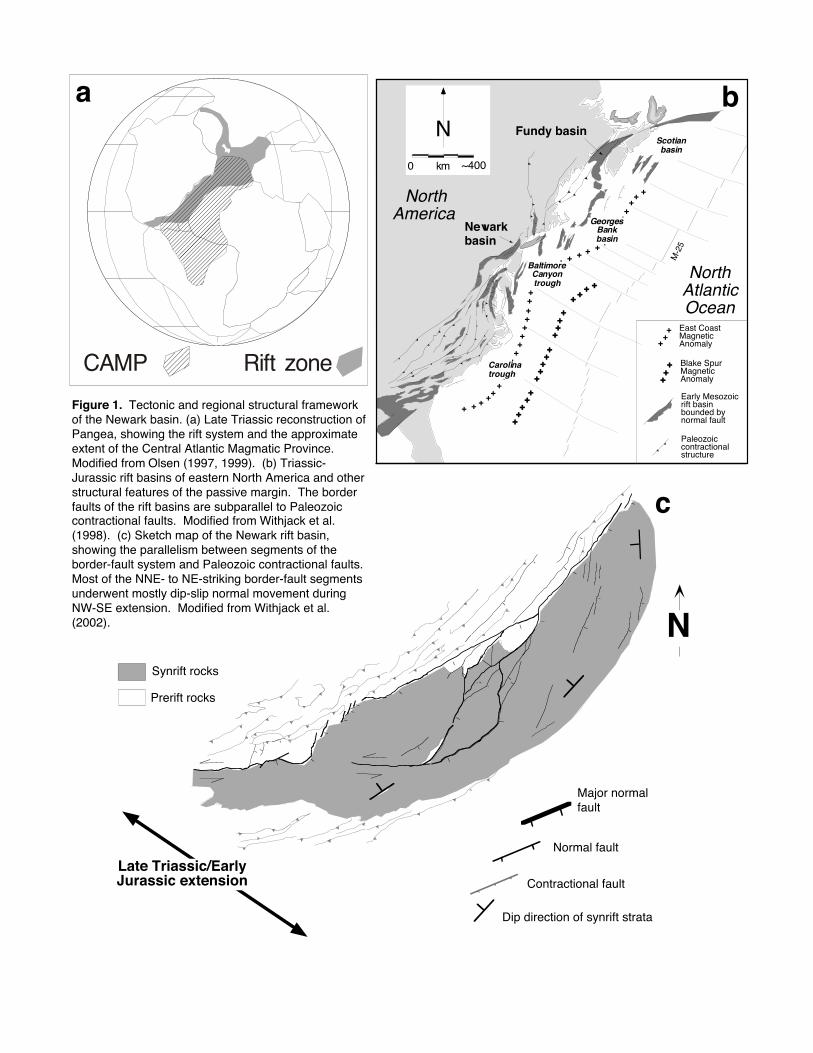
Jurassic rift system in eastern North America (Fig. 1b); this rift system formed during theearly stages of the breakup of Pangea (Fig. 1a) (e.g., Olsen, 1997). The Newark basin (Fig.1c) is an elongate half graben bounded on its northwestern margin by a predominantlysoutheast-dipping border-fault system (BFS) comprised of a number of fault segments. Thedip of the BFS segments generally decreases from the northeastern terminus of the basintoward the southwest, a trend mimicked by adjacent Paleozoic thrust faults (Ratcliffe andBurton, 1985; Ratcliffe et al., 1986). Strata generally dip to the northwest, and are cut bythree large intrabasinal faults: the Hopewell, Flemington and Chalfont faults (Figs. 1c, 2, 3).Adjacent to the predominantly normal-slip faults, strata are warped into a series of anticlinesand synclines whose axes are oriented normal to the associated normal faults (e.g., Schlische,1992, 1995); these structures are likely fault-displacement folds. Because the basin fillgenerally dips toward the major normal faults, strata in the hanging wall of the faults becomeyounger toward the faults (Fig. 3). Outcrop, core, and seismic-reflection data indicate thatstrata thicken toward the BFS, indicating that the faults were syndepositionally active(Schlische, 1992). Strata also thicken toward the hinges of some synclines and thin towardthe hinges of some anticlines, suggesting that these folds formed syndepositionally(Schlische, 1992, 1995).
Formations within the Newark basin are, from oldest to youngest: Stockton Formation,Lockatong Formation, Passaic Formation, Orange Mountain Basalt, Feltville Formation,Preakness Basalt, Towaco Formation, Hook Mountain Basalt, and Boonton Formation(Olsen, 1980). Table 1 provides generalized lithologic descriptions, and Figure 4 shows acomposite stratigraphic section based on the Newark Basin Coring Project (NBCP) (Olsen etal., 1996a). Based on palynostratigraphy, the preserved strata in the Newark basin range inage from the Carnian of the Late Triassic to the Hettangian of the Early Jurassic (Cornet andOlsen, 1985). The Triassic-Jurassic boundary is located within the uppermost PassaicFormation, 10-30 m below the Orange Mountain Basalt; this boundary is associated with amass-extinction event and an iridium spike (Olsen et al., 1987; Olsen et al., 2002). Basinstrata are intruded by a number of diabase sheets and dikes. Diabase dikes generally strikenorth-northeasterly, but a few northwest-striking dikes are also present. The absolute age of

the igneous rocks in the Newark basin is ~200 Ma, based on isotopic dating of the lava flows(Hames et al., 2000) and the Palisades intrusive sheet (Sutter, 1988; Dunning and Hodych,1990), which is physically connected to one of the flows at Ladentown, NY (Ratcliffe, 1988).Cyclostratigraphy (see below) constrains the duration of the igneous episode (base of oldestlava flow to top of youngest flow) to <600,000 years (Olsen et al., 1996b; Olsen et al., 2003).The ~200 Ma igneous rocks in the Newark basin are part of the Central Atlantic MagmaticProvince (Fig. 1a), possibly the areally largest LIP (large-igneous province) (e.g., McHone,1996; Marzolli et al., 1999; Olsen, 1999; Hames et al., 2003).
As indicated in Table 1, most strata in the Newark basin accumulated in a lacustrinesetting and exhibit a pervasive cyclicity in sediment fabrics, color, and total organic carbon(from microlaminated black shale to extensively mudcracked and bioturbated red mudstone)(e.g., Olsen, 1986). The basic cycles, named Van Houten cycles, represent the deepeningand a shoaling of a lake (Fig. 5). Van Houten cycles are grouped into compound cycles, inwhich, for example, the deepest lake facies in succeeding Van Houten cycles first becomesdeeper and then shallower (Fig. 5). Olsen (1986) quantitatively analyzed the cycles’periodicity by depth-ranking stratigraphic successions (i.e., assigning a relative water depthrank to each facies on the basis of color, sedimentary structures, and type and preservation offossils), subjecting the depth-rank curves to Fourier analysis to determine periodicities inthickness, and converting the thickness periodicities to time using varve-calibratedsedimentation rates. Van Houten cycles have periods of ~21 kyr; compound cycles haveperiods of ~100 and ~400 kyr (Olsen, 1986; Olsen et al., 1989; Olsen and Kent, 1996, 1999).The ratio of Van Houten to compound cycle thickness for a given section always yields thetypical Milankovitch ratio (1:5:20, equivalent to 20,000:100,000:400,000), even though thethicknesses of cycles commonly vary significantly from section to section. Thus, althoughcycle thickness can vary, the amount of time represented by the cycle is nearly constant. Wecan determine absolute ages by counting cycles backward and forward from the isotopicallydated lava flows (Fig. 4) (Olsen and Kent, 1996, 1999).
Variations in the thickness of time-correlative lacustrine cycles with position in the basinprimarily reflect variations in basin subsidence, which are presumably tectonically controlled(e.g., syndepositional faulting and folding). For example, Figure 5b presents a basin-widecorrelation of the Perkasie Member of the Passaic Formation based on outcrop and core dataThickening occurs from the longitudinal edge toward the center of the basin as well as fromthe hinged margin toward the BFS; lacustrine facies generally deepen in the same directions.The variations in thickness and facies suggest that the basin resembles a plunging syncline inlongitudinal section; this is consistent with BFS displacement being highest near its centerand decreasing toward its lateral ends (Schlische, 1992, 2003). These interpretations are alsosupported by the marked increase in outcrop width (and therefore thickness) of theLockatong Formation toward the center of the basin (Fig. 2).
FIELD TRIPThis field-trip guide is based principally on P.E. Olsen, R.W. Schlische, and P.J.W. Gore
(1989), Tectonic, Depositional, and Paleoecological History of Early Mesozoic Rift Basins,Eastern North America: IGC Field Trip T-351, American Geophysical Union, 174 p., whichcontains a road log. The locations of the stops described below are shown in Figures 2 and 6.

TA
BL
E 1
: S
TR
AT
IGR
AP
HY
OF
TH
E N
EW
AR
K B
AS
INU
nit
Thi
ckne
ss(m
)*A
geG
ener
al D
escr
iptio
n
Boo
nton
Form
atio
n50
0H
etta
ngia
n-Si
nem
uria
nM
ostly
red
, som
e gr
ay a
nd b
lack
(ra
rely
dee
p-w
ater
), c
yclic
al la
cust
rine
cla
stic
and
carb
onat
e ro
cks;
min
or r
ed f
luvi
al s
ands
tone
and
allu
vial
fan
con
glom
erat
eH
ook
Mou
ntai
nB
asal
t11
0H
etta
ngia
nQ
uart
z-no
rmat
ive
thol
eiiti
c ba
salt
flow
s
Tow
aco
Form
atio
n34
0H
etta
ngia
nM
ostly
red
, som
e gr
ay a
nd b
lack
(co
mm
only
dee
p-w
ater
), c
yclic
al la
cust
rine
clas
tic a
nd c
arbo
nate
roc
ks; m
inor
red
flu
vial
san
dsto
ne a
nd a
lluvi
al f
anco
nglo
mer
ate
Prea
knes
sB
asal
250
Het
tang
ian
Qua
rtz-
norm
ativ
e th
olei
itic
basa
lt fl
ows
and
min
or in
terb
edde
d st
rata
Feltv
ille
Form
atio
n17
0H
etta
ngia
nM
ostly
red
, som
e gr
ay a
nd b
lack
(co
mm
only
dee
p-w
ater
), c
yclic
al la
cust
rine
clas
tic a
nd c
arbo
nate
roc
ks; m
inor
red
flu
vial
san
dsto
ne a
nd a
lluvi
al f
anco
nglo
mer
ate
Ora
nge
Mou
ntai
nB
asal
t15
0H
etta
ngia
nQ
uart
z-no
rmat
ive
thol
eiiti
c ba
salt
flow
s an
d ve
ry m
inor
inte
rbed
ded
stra
ta
Pass
aic
Form
atio
n33
00L
. Car
nian
-H
etta
ngia
nM
ostly
red
, sha
llow
-wat
er, c
yclic
al la
cust
rine
cla
stic
roc
ks; s
ome
gray
and
bla
ckcy
clic
al la
cust
rine
cla
stic
roc
ks w
ith m
inor
lim
esto
ne, p
artic
ular
ly in
low
er p
art;
min
or r
ed f
luvi
al s
ands
tone
and
allu
vial
fan
con
glom
erat
eL
ocka
tong
Form
atio
n11
00L
. Car
nian
Mos
tly g
ray
and
blac
k (c
omm
only
dee
p-w
ater
), f
ine-
grai
ned,
cyc
lical
lacu
stri
neca
rbon
ate
and
clas
tic r
ocks
; som
e re
d, f
ine-
grai
ned
lacu
stri
ne a
nd v
ery
min
orfl
uvia
l cla
stic
roc
ksSt
ockt
onFo
rmat
ion
1800
M.-
L. C
arni
anM
ostly
coa
rse
brow
n, f
ine
red,
and
ver
y m
inor
gra
y fl
uvia
l cla
stic
roc
ks
*Est
imat
ed m
axim
um fr
om o
utcr
op w
idth
and
dip
mag
nitu
de.
Mod
ified
from
Ols
en e
t al.
(198
9)
.
+++
++
0 ~400km
N Fundy basin
Newarkbasin
Paleozoiccontractionalstructure
Early Mesozoicrift basinbounded bynormal fault
NorthAmerica
NorthAtlanticOcean
Blake SpurMagneticAnomaly
East CoastMagneticAnomaly
Scotianbasin
+
+ + + +
++
++
+
++++++++++ + + + + + + +
++++
++ +
+++
+++++
++
+
+ + + +
+
+++
BaltimoreCanyontrough
Carolinatrough
GeorgesBankbasin
M-2
5
Late Triassic/EarlyJurassic extension
N
Prerift rocks
Synrift rocks
Major normalfault
Normal fault
Contractional fault
Dip direction of synrift strata
Figure 1. Tectonic and regional structural frameworkof the Newark basin. (a) Late Triassic reconstruction ofPangea, showing the rift system and the approximateextent of the Central Atlantic Magmatic Province.Modified from Olsen (1997, 1999). (b) Triassic-Jurassic rift basins of eastern North America and otherstructural features of the passive margin. The borderfaults of the rift basins are subparallel to Paleozoiccontractional faults. Modified from Withjack et al.(1998). (c) Sketch map of the Newark rift basin,showing the parallelism between segments of theborder-fault system and Paleozoic contractional faults.Most of the NNE- to NE-striking border-fault segmentsunderwent mostly dip-slip normal movement duringNW-SE extension. Modified from Withjack et al.(2002).
a
CAMP Rift zone
b
c

.
025
km
Dela
ware
Rive
r New
Jers
ey
Penn
sylva
nia
New
Jers
eyNew
York
Stoc
kton
For
mat
ion
Boon
ton
Form
atio
nHo
ok M
ount
ain
Basa
ltTo
waco
For
mat
ion
Prea
knes
s Ba
salt
Feltv
ille F
orm
atio
nO
rang
e M
ount
ain
Basa
ltPa
ssai
c Fo
rmat
ion
Lock
aton
g Fo
rmat
ion
Diab
ase
Gra
y pa
rt of
400
kyr
la
cust
rine
cycle
Form
line
of b
eddi
ng
Cong
lom
erat
e
Norm
al fa
ult
Strik
e-sli
p fa
ult
Sync
line
NYC
N
Antic
line
Ram
apo
faul
t
A
A'B
B'
Maj
or d
rill h
ole
NB-1
sei
smic
line
ffhf
cf
cf=C
halfo
nt fa
ult
ff=Fl
emin
gton
faul
thf
=Hop
ewel
l fau
lt
Figu
re 2
. G
eolo
gic
map
of t
he N
ewar
k ba
sin s
howi
ng th
e ar
eal d
istrib
utio
n of
form
atio
ns a
nd d
iaba
se in
trusio
ns, t
he lo
catio
ns o
f the
cro
ss s
ectio
ns a
ndse
ismic-
refle
ctio
n pr
ofile
in F
ig. 3
, the
loca
tions
of m
ajor
dril
l and
cor
e ho
les,
and
fiel
d-tri
p st
ops
(circ
les)
. M
odifie
d fro
m S
chlis
che
(199
2).
Late TriassicEarly Jurassic

10Ra
map
ofa
ult
AA'
0 2 4 6 8
NWSE
km
SENW 0 2 4 6 8 10B
B'
Bord
erfa
ult
NWSE
Cabo
tpr
oj.2
.3km
1 2 3 4Un
expo
sed
stra
talw
edge
Bord
erfa
ultFlem
ingt
onfa
ult
V.E.
=1at
5.5
km/s
TWTT
(sec
.)
km Figu
re3.
Newa
rkba
sincr
oss
sect
ions
and
NB-1
seism
ic-re
flect
ion
prof
ile(s
eeFi
g.2
forl
ocat
ions
).No
teth
atst
rata
gene
rally
dip
toth
eNW
and
mos
tfau
ltsdi
pto
the
SE.
Units
gene
rally
thick
ento
ward
the
bord
er-fa
ults
yste
m.
Mod
ified
from
Schl
ische
(199
2)an
dW
ithja
cket
al.(
2002
).

..
CompositeStratigraphy
0
1
2
3
4
5
6
7
8
16
18
19
20
21
22
9
10
11
12
13
14
15
17
Exeter Pine RidgeTT
SSRRQQPPOONNMMLL KK
FlemingtonII
UkrainianCedar Grove
FFEEDDCC
BB AAZ
YMetlarsLivingston
KilmerU
TS
RQ
NeshanicPerkasie
L & MK
IGraters
E & FWarford
CWalls Island
Tumble FallsSmith Corner
Pralls IslandTohicken
Skunk HollowByramEwing CreekNurseryPrincetonScudders FallsWilburtha
LOCK
ATO
NGFO
RMAT
ION
STO
CKTO
NFO
RMAT
ION
mud fs ms cs cg
PREAKNESS BST.FELTVILLE FM.
ORANGE MTN. BST.
Red massive mudstoneor sandstonePurple mudstoneGray mudstone or sandstoneBlack mudstone
PASS
AIC
FORM
ATIO
NCum
ulat
ive
Core
Dep
th (x
1000
ft)
Cores
Mar
tinsv
ille
Wes
ton
Som
erse
t
Rutg
ers
Titu
svill
e
Nurs
ery
Prin
ceto
n
Age(Ma)
??
JURA
SSIC
Hetta
ngia
n
T R
I A
S S
I C
N O
R I
A N
C A
R N
I A
N
200
202
204
206
208
210
212
214
216
218
220
222
Figure 4. Composite stratigraphic section of the Newark basin based on the seven cores of the Newark Basin Coring Project. Formal andinformal members of the Lockatong and Passaic formations correspond to 400 kyr Milankovitch cycles. Based on Olsen et al. (1996a).

.
20,000 yr precession cycle(Van Houten Cycle)
06
06
06
Dept
h Ra
nkDe
pth
Rank
Dept
h Ra
nk
109,000 yr eccentricity cycle
413,000 yr eccentricity cycle
Red
mas
sive
mud
ston
eG
ray
mud
crac
ked
mud
ston
e
Gra
y la
min
ated
silts
tone
Blac
k m
icrol
amin
ated
cla
ysto
ne
m s
g cm
s g c
m s
g cm
s g c
Rutg
ers
no. 1
(2)
New
Brun
swick
,NJ
(1)
Titu
sville
no. 2
(3)
m s
g cm
s g c
Milfo
rd,
NJ (5
)
Holla
ndTw
p., N
J (6
)
Otts
ville
,Pa
(4)
m s
g c
m s
g c
Tyle
rspo
rt,Pa
(7)
Sana
toga
,Pa
(8)
8
2
13
74 PA
NJ
25 k
m
56
100
30fe
etm
eter
s
00
Blac
kG
ray
Purp
leRe
d
Perkasie Mbr. (N-O) member L-M
Titusville no. 2 coreoutcrop
Figu
re 5
a. H
iera
rchy
of l
ake-
leve
l cyc
les
pres
ent i
n la
cust
rine
stra
ta o
f the
Newa
rk b
asin
. Th
e co
mpo
und
cycle
s (e
ccen
tricit
y cy
cles)
mod
ulat
e th
eVa
n Ho
uten
cyc
les
(pre
cess
ion
cycle
s).
Dept
h ra
nk is
a re
lativ
e m
easu
reof
wat
er d
epth
bas
ed o
n se
dim
ent f
abric
s, c
olor
, and
foss
ils.
Mod
ified
from
Olse
n et
al.
(199
6b).
Figu
re 5
b.Ba
sinwi
deco
rrela
tion
ofth
e Pe
rkas
ieM
embe
r of t
hePa
ssai
cFo
rmat
ion,
show
ing
varia
tions
inth
ickne
ss a
ndfa
cies.
Ins
etm
ap s
hows
loca
tions
of
sect
ions
and
thick
enin
gtre
nds.
Mod
ified
from
Olse
n et
al.
(199
6a).
N

Stop 5: Pebble Bluff
Flemington fault
Dilts Corner fault
Stop 1: Dilts Corner
Hopewell fault
N
Furlong fault
Stop 2: Skeuse Quarry
Stop 3: Byram
Stop 6: HaycockMountain
Border fault
DelawareRiver
Solebury dike
Stop 4: Devil’s Tea Table
Figure 6. Geologic map of the Newark basin adjacent to the Delaware River, showing locations of field-trip stops.Modified from Olsen et al. (1989).

Stop 1: Lower-middle Passaic Formation at Dilts Corner, NJ[modified from Olsen & Schlische in Olsen et al., 1989]
Four separate outcrops of the Passaic Formation stratigraphically near the PerkasieMember occur along US 202 between the Dilts Corner and NJ 29 exits. The latter threeoutcrops are located in proximity to diabase intrusions, and the ordinarily red mudstones ofthis part of the Passaic Formation have been hornfelsed to a deep purple. These outcropsalso occur in the hanging wall of the Flemington and Dilts Corner faults. This is manifestedin abundant jointing and small-scale faulting. Most of the faults and joints strike NNE,parallel to the Flemington-Dilts Corner fault system, and dip steeply to the northwest orsoutheast; slickenlines rake steeply, indicating mostly dip-slip faulting (Fig. 7C; Hozik,1985). A second joint set is orthogonal to the NNE-striking set. The high density of thejoints may also be related to elevated fluid pressures associated with diabase intrusion(Schlische and Olsen, 1988). Kink bands locally deform the joints. All brittle structuresindicate a subvertical maximum principal stress and a subhorizontal, southeast-trendingminimum principal stress.
The first set of outcrops (least faulted and least hornfelsed) exposes ~65 m of section.Fourier analysis indicates that Van Houten (precession) cycles (20,000 year cycles) are ~4.5m thick and that the 100,000-year eccentricity cycles are ~21.3 m thick.
A sketch of the second outcrop appears in Figure 7a. Note the repetition of black shaleunits s2 and s3 by faulting. Fourier analysis of the measured section for this outcrop inFigure 7b indicates that the Van Houten cycles are ~5.5 m thick and that the 100,000-yeareccentricity cycles are 25.6 m thick.
Numerous faults and joints are also present in the third and fourth outcrops. These exhibitthe highest degree of thermal metamorphism of the outcrops along US 202.
Stop 2: Prallsville Member, Stockton Formation, Skeuse Quarry, Stockton, NJ[modified from Olsen & Schlische in Olsen et al. (1989) and Olsen & Kent (1992)]
The Skeuse quarry in the upper part of the Prallsville Member of the Stockton Formationexposes about 50 m of section (Fig. 8a) and begins ~760 m above the base of the formation.On this trip, we will examine 18 m of that section exposed in the most recently active part ofthe quarry.
Thick (~15 m) fining-upward cycles are obvious at these outcrops and consist of, fromthe bottom up: (1) pebbly trough cross-bedded sandstone passing upward into sandycompound cross-bed sets (units tend to be kaolinized and have small to large siltstone rip-upclasts); (2) thick interval of well-sorted sandstone with climbing ripple cross lamination andplanar lamination, with bioturbation and siltstone partings increasing up-section; and (3)climbing ripple to massive siltstone with slickensided dish structures as well as intensebioturbation by Scoyenia and roots. Other items of note include: (1) Na-feldspar to K-feldspar ratio is 2:1 and (2) microplacers of specular hematite (after magnetite) grains locallyoutline thin bedding (Van Houten, 1980).
Two orthogonal joint sets are present at this stop (Fig. 8b). The northeast-striking set isperpendicular to the regional extension direction. The northwest-striking set is perpendicularto the BFS, parallel to fold axes, and parallel to some diabase dikes (e.g., the Solebury dikeof Fig. 6). This local extension direction may be related to bending associated with theregional synclinal downwarping of the basin due to along-strike variations in faultdisplacment.

meters 0 1 2 3 4Section Depth Rank
10
0
20
30
s1
s2
s3
d
red-purple siltstone
gray siltstone
black laminated siltstone
Figure 7. (a) Sketch of second outcrop along northbound side ofUS 202, Stop 1. Symbols are: s1-s3, gray and black shales; d,doublet of thin gray siltstones. Note repetition of units by faults (F1to F4). (b) Measured section of the Passaic Formation exposed atStop 1. (c) Equal area contoured data from Hozik (1985) (contourintervals 2, 5, and 10%; n=112) of (1) poles to slickensides and (2)slickenlines. Modified from Olsen et al. (1989).
a
b
c
1 2

Localextensiondirection
Regionalextensiondirection
Dike
N=57
Red mudstone
Red and purple sandstone and silt-stone with inclined surfaces
Trough cross-bedded to planar-bedded buff to purple sandstone
Trough cross-bedded gray and brownconglomerate
Figure 8. (a) Stratigraphic section of the fluvial Prallsville Member of the Stockton Formationexposed at Stop 2. From Olsen et al. (1989) and Olsen and Kent (1992). (b) Equal-area stereo-graphic projection of poles to orthogonal joint sets measured in quarry, the trend of the Soleburydike, and inferred regional and local extension directions. From Schlische and Olsen (1988).
mud silt f m c conglsand
a
b

Stop 3: Byram Sill and Middle Lockatong Formation, Byram, NJ[modified from Olsen in Olsen et al. (1989)]
The Byram sill, containing a quartz-normative tholeiitic diabase, intrudes and thermallymetamorphoses gray and black mudstones of the middle Lockatong Formation. The northerncontact of the sill and hornfels is irregular and, in part, faulted. South of this contact, the sillincludes a xenolith in which the Lockatong hornfels contains nepheline, cancrinite, calcite,pyroxene, amphibole, biotite, and albite. The diabase itself is extensively jointed and appearsto display compositional layering, but the apparent layering is due to concentrations of jointmineral (Van Houten, 1980).
North of the sill, more than 400 m of middle Lockatong Formation (Fig. 9) are exposedalong the east side of NJ 29. About 99% of this section consists of fine calcareous mudstoneand claystone with the remaining 1% consisting of very fine sandstone. Fourier analysis ofthis depth-ranked section (Fig. 9) indicates that the Van Houten cycles average 5.9 m inthickness and that the 100 kyr and 400 kyr eccentricity cycles average 28 m and 96 m inthickness, respectively. In order to illustrate the wide range of variation exhibited by these cycles, we comparetwo end-members of the range of sequences of sedimentary fabrics present in this section(Fig. 10). These two end-members correspond, in part, to Van Houten’s (1962, 1964, 1969)detrital (A) and chemical (B) short cycles, and represent very wet (A) and very dry (B) partsof the 400 kyr cycle.
Figure 10 shows a single Van Houten cycle (A in Fig. 9) in the lower part of the SkunkHollow Member. Division 1 is a thin sandstone overlain by thin-bedded mudstone with anupward increase in total organic carbon (T.O.C.). This represents the beginning of laketransgression over the mostly dry playa flat of the preceding cycle. This is followed bydeposition under increasing water depth. The transition into division 2 is abrupt and ismarked by the development of microlaminated calcareous claystone consisting of carbonate-rich and carbonate-poor couplets an average of 0.24 mm thick. The basal few couplets ofthis interval contain articulated skeletons of the aquatic reptile Tanytrachelos, infrequentclam shrimp, and articulated fossil fish (Turseodus and ?Synorichthys). Abundantconchostracans occur in the middle portions of the unit. In its upper part, the microlaminaeare very discontinuous, perhaps due to microbioturbation. No longer microlaminated, thesucceeding portions of division 2 become less organic carbon-rich and less calcareousupward; there is also an upward increase in pinch-and-swell lamination. Deep, widelyspaced, sinuous desiccation cracks propagate down from the overlying unit. The averageT.O.C. of division 2 (83 cm thick) is 2.5%, a rather common value for black siltstones andlimestones of the Lockatong Formation. Studies of similar microlaminated units in otherparts of the Lockatong Formation suggest deposition in water in excess of 100 m deep, belowwave base, and in perennially anoxic water (Olsen, 1984).
Division 3 is characterized by an overall upward increase in the frequency and density ofdesiccation-cracked beds and a decrease in thin bedding. Reptile footprints (?Apatopus) arepresent near the middle of the sequence. T.O.C. decreases through division 3 and is low(1.3%-0.5%). This interval shows the greatest evidence of subaerial exposure in the cycleand represents the low-stand of the lake. However, as evidenced by the relative rarity ofdesiccation-cracked intervals and the generally wide spacing of the cracks themselves,submergence was much more frequent than emergence during deposition.

Figure 10B shows a Van Houten cycle (B in Fig. 9) about 55 m above the cycle shown inFigure 10A. This cycle contrasts dramatically with the Upper Skunk Hollow Fish Bed inconsisting of 75% red massive mudstone and completely lacking a black organic carbon-richdivision 2. Division 3 of the underlying cycle (also mostly red) consists of red, massive,almost homogeneous-appearing mudstone with a faint but highly vesicular crumb fabric,which, according to Smoot and Olsen (1985), formed by repeated desiccation of slowlyaggrading mud in a playa lake, with the vesicular fabric representing air bubbles trapped insediments during floods and hardened by desiccation. The vesicles do not seem to be relatedto an evaporitic texture. The overlying massive mudstone of division 1 is gray and contains abetter-developed crumb fabric. This unit was probably deposited under much the sameconditions as the unit underlying it. Its iron was reduced, however, by the interstitial watersfrom the lake which deposited the overlying gray unit. The transition from an aggradingplaya to a short-lived perennial lake is marked by an upward increase in lamination, adisappearance of the crumb fabric and a decrease in the density of desiccation cracks.
Division 2 of this cycle consists of red and green laminated to thin-bedded claystonelacking desiccation cracks. This is the lake’s high stand deposit of this cycle and is mostcomparable to the fabric seen in the lower part of division 3 of the cycle shown in Figure10A. Division 3 consists of massive mudstone (argillite) sequences consisting of a basalgreen-gray mudstone grading into a very well-developed breccia fabric (Smoot and Olsen,1985) and then upwards into a well-developed crumb fabric. Breccia fabrics consist ofclosely spaced anastomosing cracks separating non-rotated lumps of mudstone showing someremnant internal lamination. They are very common in the Lockatong Formation and aredirectly comparable to fabrics produced by short periods of aggradation separated by longerperiods of desiccation and non-deposition (Smoot and Katz, 1982). The breccia fabric passesupward into a well-developed vesicular crumb fabric. Clearly, this particular Van Houtencycle represents the transgression and regression of a lake which never became as deep as thecycle shown in Figure 10A and when lake level dropped, the lake desiccated for longerintervals.
The change from the predominantly fluvial Stockton Formation (as at Stop 2) to the deep-water lacustrine Lockatong Formation reflects a change in the balance amongaccommodation space (basin capacity) sediment supply, and water supply (Fig. 11a)(Schlische and Olsen, 1990; Schlische, 1991). Sediment supply exceeded capacity duringdeposition of fluvial strata; accommodation space exceeded sediment supply duringdeposition of lacustrine strata. Possible explanations for this major stratigraphic transitioninclude a decrease in sediment supply or an increase in accommodation space due to thegrowth of the basin in length, width and depth through time (Fig. 11B). The fluvial-lacustrine transition seen in outcrop and core is gradual, so it is unlikely that it resulted fromabrupt tectonic deepening of the basin.

..
DEPTH RANK0 1 2 3 4 5 6
SECTION
5.9
m
28 m
/ 10
9 ky
r
96 m
/ 41
3 ky
r
Gray massive to fissile mudstone
Red massive mudstone(very shallow lake)
(shallow lake)Black laminated to microlaminated
Gray fine sandstone(shallow water delta)
Lithologic Key
siltstone(deep lake)
North
Wal
es M
brBy
ram
Mem
ber
Skun
k Ho
llow
Mbr
Tohi
cken
Mem
ber
0
20
40
60
80
100
120
140
160
180
200
220
240
260
280
300
320
340
360
380
400
meters
21 k
yr
850
620
530
452
345
300
100
3010
Outcropnumbers
96.0 m, 348 kyr (400 kyr*)
32.0 m, 116.0 kyr (133 kyr*)
24.0 m, 86.9 kyr (100 kyr*)
6.1 m, 22.1 kyr (25.5 kyr*)
5.5 m, 19.9 kyr (22.8 kyr*)
Rela
tive
Powe
r
Frequency (cycles/kyr)3.2
0 0.08
21.8
(* varve calibrated)
A
B
Figure 9. Measured section, depth rank, andFourier analysis of the middle LockatongFormation exposed along NJ 29 in Byram, NJ(Stop 3). A & B indicate locations of sectionsshown in Figure 10. Modified from Olsen (1986).

Figure 10. Two end member types of Van Houten cycles. (A) corresponds to Van Houten's (1964) detrital cycle, and isfound in the wettest part of the 400 kyr compound cycle (see Figure 9). (B) corresponds to Van Houten's chemicalcycle, and is found in the driest part of the 400 kyr compound cycle. From Olsen et al. (1989).
Section B
Section A

Stop 4: Member C of Passaic Formation at Devil’s Tea Table, NJ[based in part on Olsen & Kent (1992)]
The transition from the Lockatong Formation to the Passaic Formation is marked by anincrease in the proportion of red massive mudstones over gray (see Fig. 4). The cyclicalpattern remains intact through the transition and through the entire Passaic Formation;however, the frequency with which deep lakes appeared did wane. The section hereillustrates the facies typical of much of the shallow-lake phase of the Newark basin section.
Figure 12 shows 250 ft. of section of the lower part of Member C. [Members in thePassaic Formation consist of clusters of Van Houten cycles containing gray/black and/orpurple beds as well as the overlying exclusively red beds. These members correspond to the400 kyr cycles.] In the predominantly gray and black interval (from 60' to 135'), thedominant lithology in the gray beds is massive mudcracked mudstone (breccia fabric)deposited in a playa. However, gray and black, more fissile mudstones deposited inperennial lakes occur about every 5-7 m, outlining the same kind of cyclicity seen in theunderlying Lockatong Formation. The thick sequence of red mudstones higher in Member Cstill follows this pattern, although the gray and black units are replaced by fissile red orpurple siltstones.
The outcrop section along NJ 29 at the Devil’s Tea Table is remarkably similar to thatencountered in the Titusville drill hole (Fig. 12), located 24 km to the southeast and in adifferent fault block. The outcrop section is generally thicker (about 11%) than the coredsection, reflecting higher subsidence rates closer to the BFS (Schlische, 1992).
The change from Lockatong Formation (containing numerous deep-water lacustrineintervals) to the Passaic Formation (containing mostly shallow-water lacustrine intervals) isanother important stratigraphic transition resulting from the interplay among accommodationspace, sediment supply, and water supply (Fig. 11a). This transition may have resulted from1) decrease in basin capacity, leaving less room for water; 2) an increase in sediment supply,also leaving less room for water; 3) a decrease in water supply; or 4) an increase in basincapacity, causing water to be spread out over a larger area, resulting in shallower lake depths(Fig. 11b). The Lockatong-Passaic transition does not, however, reflect the progressiveinfilling of the deep Lockatong basin: during relatively rare orbitally controlled wetterclimatic phases within the Passaic Formation, the lakes were as deep as those in theLockatong Formation (Schlische and Olsen, 1990).

.
100
200
2490 ft
2250 ft
ftDevil's Tea Table
(NJ 29)Titusville
Core
0
2
0
1
3
4
5
6
7
8
9
10
11
12
13
14
15
16
17
18
Section
meters
Red poorly-sorted beds ofconglomerate andsandstone with nodularconcretions [debris andmudflows with soil formation(caliche)]
Red well-sorted and partlygraded red gravel andconglomerate [shoreline]
Gray well-sorted sandstoneand gravel [shoreline]
Black to gray siltstone andclaystone [perennial lake]
Red sandstone andconglomerate makingup tilted surfaces [beach anddelta]
Red well-sorted conglomerate[stream]
Red well-sorted conglomerate
Black and gray laminatedclaystone and siltstone [lake]
Gray well-sorted sandstonewith tilted surfaces [shoreline]
Red poorly-sortedconglomerate [debris flow]
Gray well-sorted sandstoneand gravel [shoreline]
Lithology &DepositionalEnvironment
Red poorly-sortedconglomerate [debris flow]
Red well-sorted sandstonewith carbonate nodules[stream with wave reworkingand soil formation]
Van
Hout
en c
ycle
Figure 12. Comparison of Member C ofPassaic Formation at Devil’s Tea Table (Stop 4)and in Titusville core. Courtesy of P.E. Olsen.
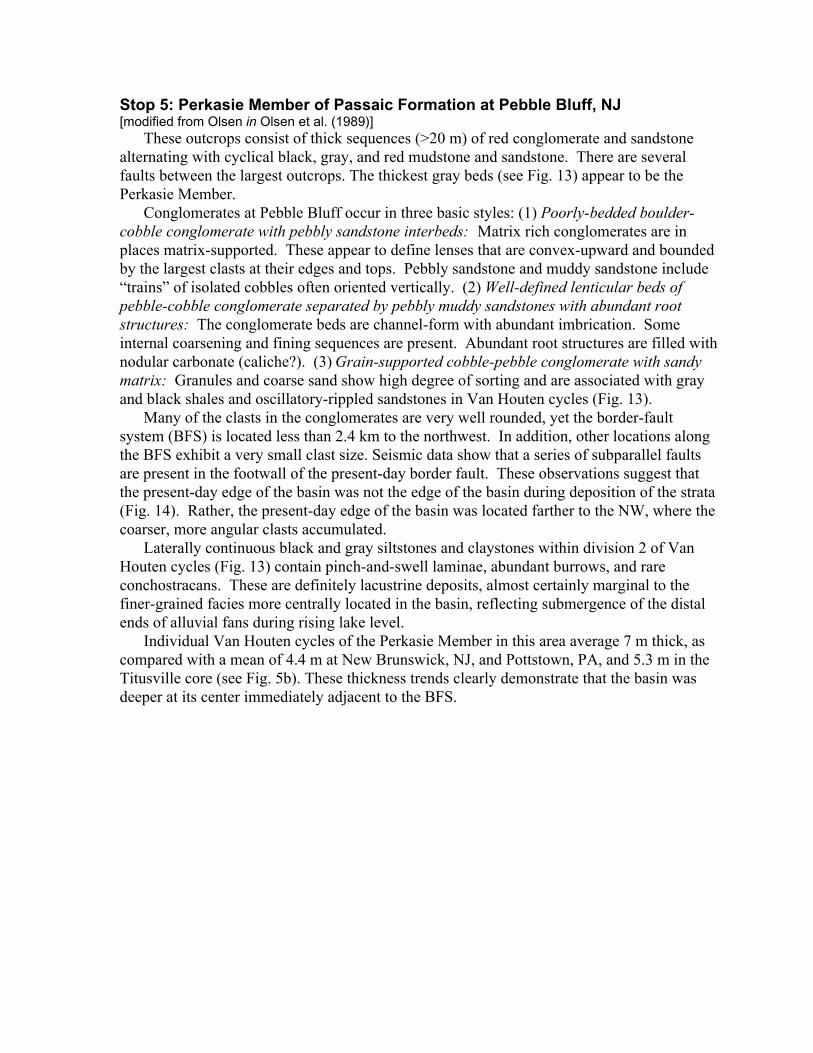
Figure 13. Stratigraphic section of the Perkasie Member of thePassaic Formation at Pebble Bluff, Stop 5. Modified fromOlsen et al. (1989).
Stop 5: Perkasie Member of Passaic Formation at Pebble Bluff, NJ[modified from Olsen in Olsen et al. (1989)]
These outcrops consist of thick sequences (>20 m) of red conglomerate and sandstonealternating with cyclical black, gray, and red mudstone and sandstone. There are severalfaults between the largest outcrops. The thickest gray beds (see Fig. 13) appear to be thePerkasie Member.
Conglomerates at Pebble Bluff occur in three basic styles: (1) Poorly-bedded boulder-cobble conglomerate with pebbly sandstone interbeds: Matrix rich conglomerates are inplaces matrix-supported. These appear to define lenses that are convex-upward and boundedby the largest clasts at their edges and tops. Pebbly sandstone and muddy sandstone include“trains” of isolated cobbles often oriented vertically. (2) Well-defined lenticular beds ofpebble-cobble conglomerate separated by pebbly muddy sandstones with abundant rootstructures: The conglomerate beds are channel-form with abundant imbrication. Someinternal coarsening and fining sequences are present. Abundant root structures are filled withnodular carbonate (caliche?). (3) Grain-supported cobble-pebble conglomerate with sandymatrix: Granules and coarse sand show high degree of sorting and are associated with grayand black shales and oscillatory-rippled sandstones in Van Houten cycles (Fig. 13).
Many of the clasts in the conglomerates are very well rounded, yet the border-faultsystem (BFS) is located less than 2.4 km to the northwest. In addition, other locations alongthe BFS exhibit a very small clast size. Seismic data show that a series of subparallel faultsare present in the footwall of the present-day border fault. These observations suggest thatthe present-day edge of the basin was not the edge of the basin during deposition of the strata(Fig. 14). Rather, the present-day edge of the basin was located farther to the NW, where thecoarser, more angular clasts accumulated.
Laterally continuous black and gray siltstones and claystones within division 2 of VanHouten cycles (Fig. 13) contain pinch-and-swell laminae, abundant burrows, and rareconchostracans. These are definitely lacustrine deposits, almost certainly marginal to thefiner-grained facies more centrally located in the basin, reflecting submergence of the distalends of alluvial fans during rising lake level.
Individual Van Houten cycles of the Perkasie Member in this area average 7 m thick, ascompared with a mean of 4.4 m at New Brunswick, NJ, and Pottstown, PA, and 5.3 m in theTitusville core (see Fig. 5b). These thickness trends clearly demonstrate that the basin wasdeeper at its center immediately adjacent to the BFS.

Eventualerosionlevel
Eventualerosionlevel
Figure 14. Schematic cross sections showing border-fault development during deposition. (a) Model withmultiple active faults. Coarse-grained sediments preferentially accumulate in hanging walls of outer border fault.Later erosion removed these sedimentary rocks. (b) Model with basinward migration of border faults. During theearly stages of rifting, the outer border fault was active, and coarse-grained sediments accumulated in itshanging wall. During the later stages of rifting, the inner border fault became active, and coarse-grainedsediments accumulated in its hanging wall. Later erosion removed the coarse-grained sedimentary rocks. FromWithjack and Olsen (1999).
a
b

Stop 6: Small Normal Faults in Passaic Formation at Haycock Mountain, PA[modified from Withjack & Olsen (1999)]
Mudstone red beds typical of the middle Passaic Formation are cut by a series of normalfaults (Fig. 15). Although less than 4 km from the boundary fault, the section is fine grained.This reflects the relative insignificance of sediment sources from the footwall side of thebasin compared to axial and hanging-wall sources during Triassic sedimentation as well asthe likelihood that the present-day edge of the basin was not the edge during deposition ofthese units (Fig. 14).
The 15-meter exposure spans about 50 kyr of the dry phase of a 400 kyr climatic cycle(upper part of member K). The wet phase of the next 400 kyr cycle (lower part of memberL-M) begins just above this outcrop. Deposition was predominantly in playas withmodification by roots and burrows. A prominent bed contains vugs that were once filledwith evaporite minerals. A vague cyclical pattern is evident in the degree of preservation ofsilt bands. These silt bands are of use in determining the amount of stratigraphic offset onthe normal faults and probably represent slightly deeper or more permanent shallow lakes.Although black, organic-rich units are present cyclically throughout the Passaic Formation(in the wettest phases of the 20, 100, and 400 kyr cycles), red beds similar to these accountfor more than 80% of the Passaic Formation.
The normal faults strike NE and generally dip to the SE (Fig. 15). Slickenlines aresteeply raking, indicating predominantly dip-slip movement. Fault 2 has the smallestdisplacement and narrowest zone of breccia and gouge; fault 4 has the highest displacementand widest zone of breccia and gouge. Thus, these faults obey an approximately linearscaling relationship between fault width and fault displacement (e.g., Hull, 1988; Knott,1994). The sequence going from fault 2 to 3 to 1 to 4 likely reflects stages in the evolution ofnormal faults with increasing displacement.

Figure 15. Sketch of normal-faulted Passaic Formation at Stop 6 (left) and inferred evo-lution of faults (right) based on geometries at Stop 6. From Withjack and Olsen (1999).

ReferencesCornet, B., and Olsen, P. E., 1985, A summary of the biostratigraphy of the Newark Supergroup of eastern
North America, with comments on early Mesozoic provinciality: in Weber, R., ed., III CongressoLatinoamericano de Paleontologia. Mexico., Simposio Sobre Floras del Triasico Tardio, su Fitografia yPaleoecologia., Memoria., p. 67-81.
Dunning, G.R., and Hodych, J.D., 1990, U-Pb zircon and baddeleyite age for the Palisade and Gettysburg sillsof northeast United States: Implications for the age of the Triassic-Jurassic boundary: Geology, v. 18, p.795-798.
Hames, W.E., Renne, P.R., and Ruppel, C., 2000, New evidence for geologically instantaneous emplacement ofearliest Jurassic Central Atlantic magmatic province basalts on the North American margin: Geology, v. 28,p. 859-862.
Hames, W.E., McHone, G.C., Renne, P.R., and Ruppel, C.R., eds., 2003, The Central Atlantic MagmaticProvince: Insights from Fragments of Pangea: American Geophysical Union Monograph 136.
Hozik, M.J., 1985, Evidence for dominance of normal dip-slip motion on segment of Flemington fault inNewark Basin of New Jersey: American Association of Petroleum Geologists Bulletin, v. 69, p. 1438.
Hull, J., 1988, Thickness-displacement relationships for deformation zones: Journal of Structural Geology, v.10, p. 431-435.
Knott, S.D., 1994, Fault zone thickness versus displacement in the Permo-Triassic sandstones of NW England:Journal of the Geological Society, London, v. 151, p. 17-25.
Marzolli, A., P.R. Renne, E.M. Piccirillo, M. Ernesto, G. Bellieni, and A. De Min, 1999, Extensive 200-million-year-old continental flood basalts of the Central Atlantic Magmatic Province: Science, v. 284, p. 616-618.
McHone, J.G., 1996, Broad-terrane Jurassic flood basalts across northeastern North America: Geology, v. 24, p.319-322.
Olsen, P.E., 1980, Triassic and Jurassic formations of the Newark Basin, in Manspeizer, W., ed., Field studiesof New Jersey geology and guide to field trips: 52nd Annual Meeting of the New York State GeologicalAssociation, Newark College of Arts and Sciences, Newark, Rutgers University, p. 2-39.
Olsen, P.E., 1984: Comparative paleolimnology of the Newark Supergroup: A study of ecosystem evolution[Ph.D. Thesis]: New Haven, Yale University, 726 p.
Olsen, P.E., 1986, A 40-million-year lake record of early Mesozoic climatic forcing: Science, v. 234, p. 842-848.
Olsen, P.E., 1997, Stratigraphic record of the early Mesozoic breakup of Pangea in the Laurasia-Gondwana riftsystem: Annual Review of Earth Planetary Science, v. 25, p. 337-401.
Olsen, P.E., 1999, Giant lava flows, mass extinctions, and mantle plumes: Science, v. 284, p. 604-605.Olsen, P.E., and Kent, D.V., 1992, Field trip to the south central Newark basin for the meeting of DOSECC,
March 7, 1992.Olsen, P.E., and Kent, D.V., 1996, Milankovitch climate forcing in the tropics of Pangaea during the Late
Triassic: Palaeogeography, Palaeoclimatology, Palaeoecology, v. 122., p. 1-26.Olsen, P.E., and Kent, D.V., 1999, Long-period Milankovitch cycles from the Late Triassic and Early Jurassic
of eastern North America and their implications for the calibration of the Early Mesozoic time scale and thelong-term behaviour of the planets: Philosophical Transactions, Royal Society of London, Series A, v. 357,p. 1761-1786.
Olsen, P.E., Kent, D.V., Cornet, B., Witte, W.K., and Schlische, R.W., 1996a, High-resolution stratigraphy ofthe Newark rift basin (early Mesozoic, eastern North America): Geological Society of America Bulletin, v.108, p. 40-77.
Olsen, P.E., Kent, D.V., Et-Touhami, M., and Puffer, J., 2003, Cyclo-, magneto-, and bio-stratigraphicconstraints on the duration of the CAMP event and its relationship to the Triassic-Jurassic boundary, inHames, W.E., McHone, G.C., Renne, P.R., and Ruppel, C.R., eds., The Central Atlantic MagmaticProvince: Insights from Fragments of Pangea: American Geophysical Union Monograph 136, p. 7-32.
Olsen, P.E., Kent, D.V., Sues, H.-D., Koeberl, C., Huber, H., Montanari. A., Rainforth, E., Fowell, S.J., Szajna,M.J., and Hartline, B.W., 2002, Ascent of dinosaurs linked to an iridium anomaly at the Triassic-Jurassicboundary: Science, v. 296, p. 1305-1307.
Olsen, P.E., Schlische, R.W., and Fedosh, M.S., 1996b, 580 kyr duration of the Early Jurassic flood basalt eventin eastern North America estimated using Milankovitch cyclostratigraphy, in Morales, M., ed., TheContinental Jurassic: Museum of Northern Arizona Bulletin 60, p. 11-22.
Olsen, P.E., Schlische, R.W., and Gore, P.J.W., eds., 1989, Tectonic, Depositional, and Paleoecological Historyof Early Mesozoic Rift Basins of Eastern North America: International Geological Congress Feild Trip T-351, American Geophysical Union, Washington, D.C., 174 p.
Olsen, P.E., N.H. Shubin, and M.H. Anders, 1987, New Early Jurassic tetrapod assemblages constrain Triassic-Jurassic event: Science, v. 237, p. 1025-1029.
Ratcliffe, N.M., and Burton, W.C., 1985, Fault reactivation models for the origin of the Newark basin andstudies related to U.S. eastern seismicity: USGS Circular 946, 36-45.Ratcliffe, N.M., Burton, W.C.,D'Angelo, R.M., and Costain, J.K., 1986, Low-angle extensional faulting, reactivated mylonites, andseismic reflection geometry of the Newark Basin margin in eastern Pennsylvania: Geology, v. 14, p. 766-770.

Ratcliffe, N.M., 1988, Reinterpretation of the relationships of the western extension of the Palisades sill to thelava flows at Ladentown, New York, based on new core data, in Froelich, A.J., and Robinson, G.R., Jr.,eds., Studies of the Early Mesozoic Basins of the Eastern United States: U.S. Geological Survey Bulletin1776, p. 113-135.
Schlische, R.W., 1991, Half-graben basin filling models: New constraints on continental extensional basinevolution: Basin Research, v. 3, p. 123-141.
Schlische, R.W., 1992, Structural and stratigraphic development of the Newark extensional basin, eastern NorthAmerica -- implications for the growth of the basin and its bounding structures: Geological Society ofAmerica Bulletin, v. 104, p. 1246-1263.
Schlische, R.W., 1995, Geometry and origin of fault-related folds in extensional settings: American Associationof Petroleum Geologists Bulletin, v. 79, p. 1661-1678.
Schlische, R.W., 2003, Progress in understanding the structural geology, basin evolution, and tectonic history ofthe eastern North American rift system, in LeTourneau, P.M., and Olsen, P.E., eds., The Great Rift Valleysof Pangea in Eastern North America--Volume 1--Tectonics, Structure, and Volcanism: New York,Columbia University Press, p. 21-64.
Schlische, R.W., and Anders, M.H., 1996, Stratigraphic effects and tectonic implications of the growth ofnormal faults and extensional basins, in Beratan, K.K., ed., Reconstructing the Structural History of Basinand Range Extension Using Sedimentology and Stratigraphy: Geological Society of America, SpecialPaper 303, p. 183-203.
Schlische, R.W., and Olsen, P.E., 1988, Structural evolution of the Newark basin, in Husch, J.M., and Hozik,M.J., eds., Geology of the Central Newark Basin: Fifth Annual Meeting of the Geological Association ofNew Jersey, Proceedings and Field Guide, p. 43-65.
Schlische, R.W., and Olsen, P.E., 1990, Quantitative filling model for continental extensional basins withapplications to early Mesozoic rifts of eastern North America: Journal of Geology, v. 98, p. 135-155.
Smoot, J.P., and Katz, S.B., 1982, Comparison of modern playa mudflat fabrics to cycles in the TriassicLockatong Formation of New Jersey: Geological Society of America Abstracts with Programs, v. 14, p. 83.
Smoot, J.P., and Olsen, P.E., 1985, Massive mudstones in basin analysis and paleoclimatic interpretation of theNewark Supergroup, in Robinson, G.R., Jr., and Froelich, A.J., eds., Proceedings of the Second U.S.Geological Survey Workshop on the Early Mesozoic Basins of the Eastern United States: U.S. GeologicalSurvey Circular 946, p. 29-33.
Sutter, J.F., 1988, Innovative approaches to the dating of igneous events in the early Mesozoic basins of theEastern United States in Studies of the Early Mesozoic Basins of the Eastern United States, edited by A.J.Froelich and G.R. Robinson, Jr.: U.S. Geological Survey Bulletin, v. 1776, p. 194-200.
Van Houten, F. B., 1980, Late Triassic part of the Newark Supergroup, Delaware River section, west-centralNew Jersey, in Manspeizer, W., ed., Field studies of New Jersey geology and guide to field trips: 52ndAnnual Meeting New York State Geological Association, Newark College of Arts and Sciences, Newark,Rutgers University, p. 264-276.
Van Houten, F.B., 1962, Cyclic sedimentation and the origin of analcime-rich Upper Triassic LockatongFormation, west-central New Jersey and adjacent Pennyslvania: American Journal of Science, v. 260, p. 561-576.
Van Houten, F.B., 1964, Cyclic lacustrine sedimentation, Upper Triassic Lockatong Formation, central NewJersey and adjacent Pennsylvania: Kansas Geological Survey Bulletin, v. 169, p. 497-531.
Van Houten, F.B., 1969, Late Triassic Newark Group, north central New Jersey, and adjacent Pennsylvania andNew York, in Subitzky, S.S., ed., Geology of Selected Areas in New Jersey and Eastern Pennsylvania: NewBrunswick, Rutgers University Press, p. 314-347.
Withjack, M.O., and Olsen, P.E., 1999, Rift Basins and Passive Margins Tectonics Seminar, Mobil TechnologyCompany, July 14-24, 1999.
Withjack, M.O., Schlische, R.W., and Olsen, P.E., 1998, Diachronous rifting, drifting, and inversion on thepassive margin of central eastern North America -- an analog for other passive margins: AmericanAssociation of Petroleum Geologists Bulletin, v. 82, p. 817-835.
Withjack, M.O., Schlische, R.W., and Olsen, P.E., 2002, Rift-basin structure and its influence on sedimentarysystems, in Renaut, R., and Ashley, G.M., eds., Sedimentation in Continental Rifts: SEPM SpecialPublication 73, p. 57-81.